Attached files
UNITED STATES
SECURITIES AND EXCHANGE COMMISSION
Washington, D.C. 20549
______________________________________________________
FORM 10-K
______________________________________________________
(Mark One)
x | ANNUAL REPORT PURSUANT TO SECTION 13 OR 15(d) OF THE SECURITIES EXCHANGE ACT OF 1934 |
For the fiscal year ended December 31, 2016
OR
¨ | TRANSITION REPORT PURSUANT TO SECTION 13 OR 15(d) OF THE SECURITIES EXCHANGE ACT OF 1934 |
For the transition period from to
Commission file number 000-52606
______________________________________________________
KBS REAL ESTATE INVESTMENT TRUST, INC.
(Exact Name of Registrant as Specified in Its Charter)
______________________________________________________
Maryland | 20-2985918 | |
(State or Other Jurisdiction of Incorporation or Organization) | (I.R.S. Employer Identification No.) | |
800 Newport Center Drive, Suite 700 Newport Beach, California | 92660 | |
(Address of Principal Executive Offices) | (Zip Code) | |
(949) 417-6500
(Registrant’s Telephone Number, Including Area Code)
______________________________________________________
Securities registered pursuant to Section 12(b) of the Act:
Title of Each Class | Name of Each Exchange on Which Registered | |
None | None | |
Securities registered pursuant to Section 12(g) of the Act:
Common Stock, $0.01 par value per share
______________________________________________________
Indicate by check mark if the Registrant is a well-known seasoned issuer, as defined in Rule 405 of the Securities Act. Yes o No x
Indicate by check mark if the Registrant is not required to file reports pursuant to Section 13 or Section 15(d) of the Act. Yes o No x
Indicate by check mark whether the registrant: (1) has filed all reports required to be filed by Section 13 or 15(d) of the Securities Exchange Act of 1934 during the preceding 12 months (or for such shorter period that the registrant was required to file such reports), and (2) has been subject to such filing requirements for the past 90 days. Yes x No o
Indicate by check mark whether the registrant has submitted electronically and posted on its corporate website, if any, every Interactive Data File required to be submitted and posted pursuant to Rule 405 of Regulation S-T (§232.405 of this chapter) during the preceding 12 months (or for such shorter period that the registrant was required to submit and post such files). Yes x No o
Indicate by check mark if disclosure of delinquent filers pursuant to Item 405 of Regulation S-K is not contained herein, and will not be contained, to the best of Registrant’s knowledge, in definitive proxy or information statements incorporated by reference in Part III of the Form 10-K or any amendment of this Form 10-K. x
Indicate by check mark whether the registrant is a large accelerated filer, an accelerated filer, a non-accelerated filer or a smaller reporting company. See the definitions of “large accelerated filer,” “accelerated filer” and “smaller reporting company” in Rule 12b-2 of the Exchange Act. (Check one):
Large Accelerated Filer | ¨ | Accelerated Filer | ¨ | |||
Non-Accelerated Filer | x (Do not check if a smaller reporting company) | Smaller reporting company | ¨ | |||
Indicate by check mark whether the registrant is a shell company (as defined in Rule 12b-2 of the Exchange Act). Yes o No x
There is no established market for the Registrant’s shares of common stock. On December 8, 2015, the board of directors of the Registrant approved an estimated value per share of the Registrant’s common stock of $3.94 (unaudited) based on the estimated value of the Registrant’s assets less the estimated value of the Registrant’s liabilities, or net asset value, divided by the number of shares outstanding, all as of September 30, 2015, with the exception of an adjustment to the Registrant’s net asset value to give effect to the December 7, 2015 payment of a special distribution of $0.25 per share on the outstanding shares of common stock of the Registrant to the stockholders of record as of the close of business on December 1, 2015. For a full description of the methodologies used to value the Registrant’s assets and liabilities in connection with the calculation of the estimated value per share as of December 8, 2015, see Part II, Item 5, “Market for Registrant’s Common Equity, Related Stockholder Matters and Issuer Purchases of Equity Securities - Market Information” of the Registrant’s Annual Report on Form 10-K for the year ended December 31, 2015. On October 5, 2016, the board of directors of the Registrant approved an estimated value per share of the Registrant’s common stock of $3.65 (unaudited) based on the estimated value of the Registrant’s assets less the estimated value of the Registrant’s liabilities, or net asset value, divided by the number of shares outstanding, all as of June 30, 2016, except for certain items discussed in Part II, Item 5, “Market for Registrant’s Common Equity, Related Stockholder Matters and Issuer Purchases of Equity Securities - Market Information” of this Annual Report of Form 10-K for which estimated values were adjusted subsequent to June 30, 2016. For a full description of the methodologies used to value the Registrant’s assets and liabilities in connection with the calculation of the estimated value per share as of October 5, 2016, see Part II, Item 5, “Market for Registrant’s Common Equity, Related Stockholder Matters and Issuer Purchases of Equity Securities - Market Information” of this Annual Report on Form 10-K.
There were approximately 185,535,297 shares of common stock held by non-affiliates as of June 30, 2016, the last business day of the Registrant’s most recently completed second fiscal quarter.
As of March 24, 2017, there were 184,803,034 outstanding shares of common stock of the Registrant.
TABLE OF CONTENTS
ITEM 1. | |||
ITEM 1A. | |||
ITEM 1B. | |||
ITEM 2. | |||
ITEM 3. | |||
ITEM 4. | |||
ITEM 5. | |||
ITEM 6. | |||
ITEM 7. | |||
ITEM 7A. | |||
ITEM 8. | |||
ITEM 9. | |||
ITEM 9A. | |||
ITEM 9B. | |||
ITEM 10. | |||
ITEM 11. | |||
ITEM 12. | |||
ITEM 13. | |||
ITEM14. | |||
ITEM 15. | |||
1
FORWARD-LOOKING STATEMENTS
Certain statements included in this Annual Report on Form 10-K are forward-looking statements. Those statements include statements regarding the intent, belief or current expectations of KBS Real Estate Investment Trust, Inc. and members of our management team, as well as the assumptions on which such statements are based, and generally are identified by the use of words such as “may,” “will,” “seeks,” “anticipates,” “believes,” “estimates,” “expects,” “plans,” “intends,” “should” or similar expressions. Actual results may differ materially from those contemplated by such forward-looking statements. Further, forward-looking statements speak only as of the date they are made, and we undertake no obligation to update or revise forward-looking statements to reflect changed assumptions, the occurrence of unanticipated events or changes to future operating results over time, unless required by law.
The following are some of the risks and uncertainties, although not all of the risks and uncertainties, that could cause our actual results to differ materially from those presented in our forward-looking statements:
• | We can give no assurance that we will be able to successfully implement the Plan of Liquidation (defined below) and sell our assets, pay our debts and distribute the net proceeds from liquidation to our stockholders as we expect. |
• | We may face unanticipated difficulties, delays or expenditures relating to our implementation of the Plan of Liquidation, which may reduce or delay our payment of liquidating distributions. |
• | We can give no assurance regarding the timing of asset dispositions in connection with the implementation of the Plan of Liquidation, the sale prices we will receive for our assets and the amount and timing of liquidating distributions to be received by our stockholders. |
• | We may face risks associated with legal proceedings, including stockholder litigation, that may be instituted against us related to the Plan of Liquidation. |
• | Disruptions in the financial markets and uncertain economic conditions could adversely affect the implementation of our Plan of Liquidation. |
• | We are the first publicly offered investment program sponsored by the affiliates of our external advisor, KBS Capital Advisors LLC ( “KBS Capital Advisors”), which makes our future performance difficult to predict. Our stockholders should not assume that our performance will be similar to the past performance of other real estate investment programs sponsored by affiliates of our advisor. |
• | All of our executive officers and some of our directors and other key real estate and debt finance professionals are also officers, directors, managers, key professionals and/or holders of a direct or indirect controlling interest in our advisor, the entity that acted as our dealer manager and/or other KBS-affiliated entities. As a result, they face conflicts of interest, including significant conflicts created by our advisor’s compensation arrangements with us and other KBS-sponsored programs and KBS-advised investors and conflicts in allocating time among us and these other programs and investors. These conflicts could result in unanticipated actions. |
• | We pay substantial fees to and expenses of our advisor and its affiliates. These payments increase the risk that our stockholders will not earn a profit on their investment in us and increase the risk of loss to our stockholders. |
• | We depend on tenants for the revenue generated by our real estate investments and, accordingly, the revenue generated by our real estate investments is dependent upon the success and economic viability of our tenants. Revenues from our properties could decrease due to a reduction in occupancy (caused by factors including, but not limited to, tenant defaults, tenant insolvency, early termination of tenant leases and non-renewal of existing tenant leases) and/or lower rental rates, reducing our stockholders’ returns and the amount of liquidating distributions they receive. |
• | Our investments in real estate and real estate loans may be affected by unfavorable real estate market and general economic conditions. Revenues from our real property investments could decrease. Revenues from the properties and other assets directly or indirectly securing our loan investments could decrease, making it more difficult for the borrowers under those loans to meet their payment obligations to us. In addition, decreases in revenues from the properties directly or indirectly securing our loan investments could result in decreased valuations for those properties, which could make it difficult for our borrowers to repay or refinance their obligations to us. These factors could decrease the value of those assets and reduce the investment return to our stockholders and the amount and timing of liquidating distributions they receive. |
2
• | Our share redemption program provides only for redemptions sought upon a stockholder’s death, “qualifying disability” or “determination of incompetence” (each as defined in the share redemption program and, together with redemptions in connection with a stockholder’s death, “Special Redemptions”). The dollar amounts available for such redemptions are determined by our board of directors and may be reviewed and adjusted from time to time. Additionally, redemptions are further subject to limitations described in our share redemption program. We currently do not expect to have funds available for ordinary redemptions in the future. |
• | We may not be able to successfully operate and/or sell the GKK Properties (defined below) given the concentration of the GKK Properties in the financial services sector and our advisor’s limited experience operating, managing and selling bank branch properties. Moreover, we depend upon GKK Realty Advisors LLC (“GKKRA”) and GPT Realty Management LP (“GPT” and, together with GKKRA, the “Property Manager”), each an affiliate of Gramercy (defined below), to manage and conduct the operations of the GKK Properties and any adverse changes in or the termination of our relationship with the Property Manager prior to the sale of substantially all of the GKK Properties could hinder the performance of the GKK Properties and the return on our stockholders’ investment in us. |
• | As a result of the transfer of the GKK Properties to us, a significant portion of our properties are leased to financial institutions, making us more economically vulnerable in the event of a downturn in the banking industry. |
• | During the year ended December 31, 2015, we disposed of 34 properties (of which 31 were GKK Properties) and terminated our leasehold interest in three GKK Properties. During the year ended December 31, 2016, we disposed of 273 properties (269 of which were GKK Properties) and terminated our leasehold interest in two GKK Properties. As a result of our disposition activity, our general and administrative expenses, which are not directly related to the size of our portfolio, have increased significantly as a percentage of our cash flow from operations and will continue to increase to the extent we sell additional assets. |
All forward-looking statements should be read in light of the risks identified in Part I, Item 1A of this Annual Report on Form 10-K.
3
PART I
ITEM 1. | BUSINESS |
Overview
KBS Real Estate Investment Trust, Inc. is a Maryland corporation that was formed on June 13, 2005 to invest in a diverse portfolio of real estate properties and real estate-related investments. We elected to be taxed as a real estate investment trust (“REIT”) beginning with the taxable year ended December 31, 2006 and we intend to continue to operate in such a manner. As used herein, the terms “we,” “our” and “us” refer to the Company and as required by context, KBS Limited Partnership, a Delaware limited partnership, which we refer to as our “Operating Partnership,” and to their subsidiaries. We own substantially all of our assets and conduct our operations through our Operating Partnership, of which we are the sole general partner. Subject to certain restrictions and limitations, our business is managed by KBS Capital Advisors pursuant to an advisory agreement. Our advisor owns 20,000 shares of our common stock. We have no paid employees.
On January 27, 2006, we launched our initial public offering of up to 200,000,000 shares of common stock in our primary offering and 80,000,000 shares of common stock under our dividend reinvestment plan. We ceased offering shares of common stock in our primary offering on May 30, 2008. We terminated our dividend reinvestment plan effective April 10, 2012. We sold 171,109,494 shares in our primary offering for gross offering proceeds of $1.7 billion and 28,306,086 shares under our dividend reinvestment plan for gross offering proceeds of $233.7 million. Also as of December 31, 2016, we had redeemed 14,450,298 of the shares sold in our offering for $97.4 million.
As of December 31, 2016, we owned or, with respect to a limited number of properties, held a leasehold interest in, 90 real estate properties (of which 30 GKK Properties were held for sale). In addition, as of December 31, 2016, we owned three real estate loans receivable and a participation interest with respect to a real estate joint venture.
On September 1, 2011, we, through indirect wholly owned subsidiaries (collectively, “KBS”), entered into a Collateral Transfer and Settlement Agreement (the “Settlement Agreement”) with, among other parties, GKK Stars Acquisition LLC (“GKK Stars”), the wholly owned subsidiary of Gramercy Property Trust, Inc. (“Gramercy”) that indirectly owned the Gramercy real estate portfolio, to effect the orderly transfer of certain assets and liabilities of the Gramercy real estate portfolio to KBS in satisfaction of certain debt obligations under a mezzanine loan owed by wholly owned subsidiaries of Gramercy to KBS (the “GKK Mezzanine Loan”). The Settlement Agreement resulted in the transfer of the equity interests in certain subsidiaries of Gramercy (the “Equity Interests”) that indirectly owned or, with respect to a limited number of properties, held a leasehold interest in, 867 properties (the “GKK Properties”), consisting of 576 bank branch properties and 291 office buildings, operations centers and other properties. For a further discussion of the Settlement Agreement, the transfers of the GKK Properties and the debt related to these properties, see our Annual Report on Form 10-K for the year ended December 31, 2011 filed with the SEC.
Plan of Liquidation
On January 27, 2016, our board of directors formed a special committee (the “Special Committee”) composed of all of our independent directors to explore the availability of strategic alternatives involving us. As part of the process of exploring strategic alternatives, on February 23, 2016, the Special Committee engaged Evercore Group L.L.C. (“Evercore”) to act as our financial advisor and to assist the Special Committee with this process. Under the terms of the engagement, Evercore provided various financial advisory services, as requested by the Special Committee, as customary for an engagement in connection with exploring strategic alternatives. On October 5, 2016, in connection with a review of potential strategic alternatives available to us, the Special Committee and our board of directors unanimously approved the sale of all of our assets and our dissolution pursuant to the terms of our plan of complete liquidation and dissolution (the “Plan of Liquidation”). The principal purpose of the Plan of Liquidation is to maximize stockholder value by selling our assets, paying our debts and distributing the net proceeds from liquidation to our stockholders. On January 27, 2017, our stockholders approved the Plan of Liquidation. For more information, see the Plan of Liquidation, which is included as an exhibit to this Annual Report on Form 10-K.
4
In accordance with the Plan of Liquidation, our objectives for 2017 are to (i) pursue an orderly liquidation of our company pursuant to the Plan of Liquidation; and (ii) maximize stockholder value by selling all of our remaining assets, paying our debts, providing for the payment of unknown or contingent liabilities, distributing the net proceeds from liquidation to our stockholders and winding up our operations and dissolving our company. While pursuing our liquidation pursuant to the Plan of Liquidation, we intend to continue to manage our portfolio of assets with the goal of maximizing stockholder value. We expect to distribute all of the net proceeds from liquidation to our stockholders within 24 months from January 27, 2017. We expect to pay multiple liquidating distribution payments to our stockholders during the liquidation process. However, if we cannot sell our assets and pay our debts within 24 months from January 27, 2017, or if the board of directors and the Special Committee determine that it is otherwise advisable to do so, pursuant to the Plan of Liquidation, we may transfer and assign our remaining assets to a liquidating trust. Upon such transfer and assignment, our stockholders will receive beneficial interests in the liquidating trust. We can give no assurance regarding the timing of asset dispositions in connection with the implementation of the Plan of Liquidation, the sale prices we will receive for our assets, and the amount or timing of liquidating distributions to be received by our stockholders.
Pursuant to the Plan of Liquidation, on March 10, 2017, our board of directors authorized an initial liquidating distribution in the amount of $1.00 per share of common stock to our stockholders of record as of the close of business on March 21, 2017. The initial liquidating distribution was paid on March 24, 2017 and was funded from proceeds from asset sales. Since it is a liquidating distribution pursuant to the Plan of Liquidation, the initial liquidating distribution reduced our stockholders’ remaining investment in us and reduced the estimated range of future liquidating distributions per share to be received by our stockholders by $1.00 per share.
Investment Portfolio
Real Estate Properties
We made investments in core office and industrial properties, which are generally lower risk, existing properties with at least 80% occupancy and minimal near-term lease rollover. We also own other types of properties, including bank branches, transferred to us pursuant to the Settlement Agreement and properties transferred to us through foreclosures or deeds-in-lieu of foreclosures. These properties had originally secured certain of our investments in real estate loans receivable. All of our properties are located in the United States. As of December 31, 2016, we owned 60 real estate properties held for investment. We also owned 30 GKK Properties that were held for sale. The 60 real estate properties held for investment totaled 3.0 million rentable square feet and included the following:
• | Six office buildings, two corporate research buildings and one retail property; and |
• | GKK Properties consisting of 47 bank branch properties and four office buildings, operations centers and other properties. |
The following chart illustrates the composition of our real estate portfolio (excluding the 30 GKK Properties that were held for sale) as of December 31, 2016 based on the carrying value of the investments:
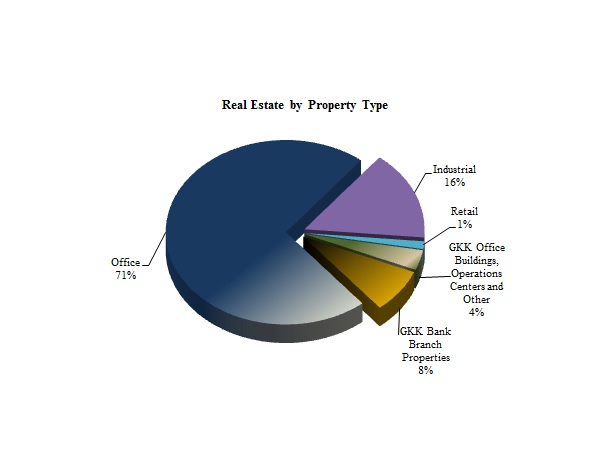
5
As noted above, our real estate property investments (excluding the 30 GKK Properties that were held for sale) are diversified by geographic location with properties in 18 states as shown in the charts below:
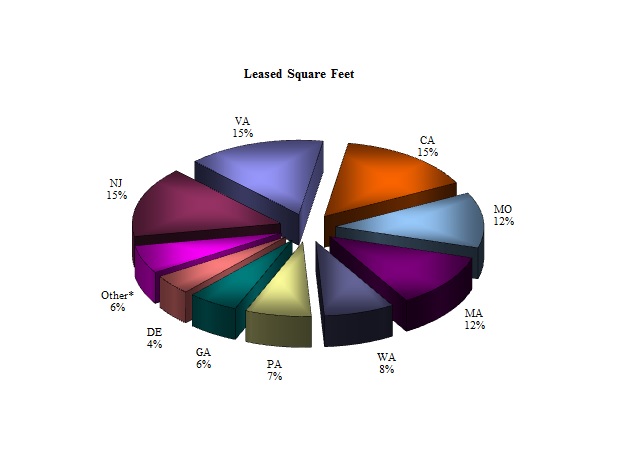
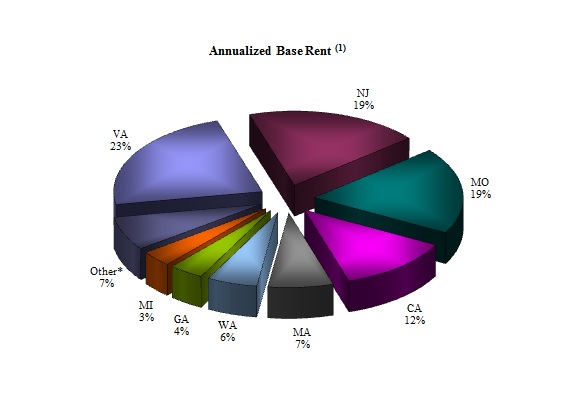
_____________________
*Other includes any state less than 3% of the total.
(1) Annualized base rent represents annualized contractual base rental income as of December 31, 2016, adjusted to straight-line any contractual tenant concessions (including free rent), rent increases and rent decreases from the lease’s inception through the balance of the lease term.
6
As of December 31, 2016, we had a concentration of credit risk related to Husch Blackwell, a tenant in the Plaza in Clayton, which represented approximately 12% of our annualized base rent. Annualized base rent represents annualized contractual base rental income as of December 31, 2016, adjusted to straight-line any contractual tenant concessions (including free rent), rent increases and rent decreases from the lease’s inception through the balance of the lease term. Also, as of December 31, 2016, we had a concentration of credit risk related to the finance and legal industries, which represented approximately 24.4% and 15.2% of our annualized base rent, respectively. The finance industry concentration is due to the concentration in the GKK Properties. As of December 31, 2016, our real estate portfolio was 88% occupied (excluding the 30 GKK Properties that were held for sale). The chart below illustrates the diversity of tenant industries in our portfolio (excluding the 30 GKK Properties that were held for sale) based on total annualized base rent as of December 31, 2016:
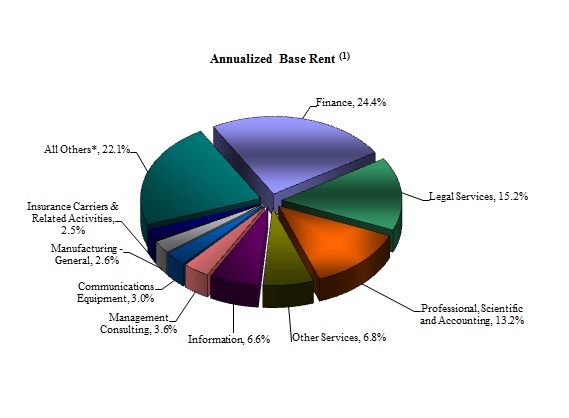
_____________________
* All others includes any industry less than 2% of the total.
(1) Annualized base rent represents annualized contractual base rental income as of December 31, 2016, adjusted to straight-line any contractual tenant concessions (including free rent), rent increases and rent decreases from the lease’s inception through the balance of the lease term.
The carrying value of our real estate portfolio as of December 31, 2016 was $0.4 billion (including the 30 GKK Properties that were held for sale).
Real Estate-Related Investments
As of December 31, 2016, we owned one mezzanine loan and two B-Notes. The book value (net of asset specific reserves) of our real estate-related investments as of December 31, 2016 was $22.9 million. As of December 31, 2016, our real estate-related investments consisted of three fixed rate real estate loans receivable with a weighted average annualized effective interest rate of 11.4%. All these loans receivable are scheduled to mature in 2017. The Sandmar Mezzanine Loan has a book value of zero after asset-specific loan loss reserves.
Market Outlook – Real Estate and Real Estate Finance Markets
The following discussion is based on management’s beliefs, observations and expectations with respect to the real estate and real estate finance markets.
Conditions in the global capital markets remain volatile as of the first quarter of 2017. Current economic data and financial market developments suggest that the global economy is improving, although at a slow and uneven pace. European economic growth has recently picked up, whereas the U.K. and China remain areas of concern. Against this backdrop, the central banks of the world’s major industrialized economies are beginning to back away from their strong monetary accommodation. Quantitative easing in Japan and Europe is slowing, but the liquidity generated from these programs continues to impact the global capital markets.
7
At a duration of 91 months (as of year-end 2016), the current business cycle, which commenced in June 2009, is the fourth longest in U.S. history, including the post-World War II cycle, which lasted 58 months. In December 2016, the U.S. Federal Reserve (the “FED”) increased interest rates for the second time since the 2008-2009 financial crisis. Expectations are for the rate increases to continue in the wake of ongoing economic growth and some acceleration in inflationary pressures, with the goal of the FED to normalize the level of interest rates. Little in the U.S. macroeconomic data suggests that the economy is growing too rapidly, the primary symptom of trouble ahead for a business cycle. Real gross domestic product (“GDP”) growth has averaged approximately 2% per year over the past two years, and job growth has averaged about 1.7%. Personal income growth has started to pick up and unemployment statistics indicate that labor force conditions are finally showing real improvements.
The U.S. commercial real estate market continues to benefit from inflows of foreign capital, particularly from China. With a backdrop of global political conflict, and stabilizing international economic conditions, the U.S. dollar has remained a safe haven currency. The volume of available capital that is seeking “core” properties has helped to push the pricing of some assets past prior peaks, making some markets look expensive. Reduced leverage ratios have shifted more risk toward the equity investor. Traditional sources of capital are favoring a “risk-off” approach, where investors’ appetite for risk falls, when valuing investments. Investors acquiring properties are extremely selective, with cap rate compression having spread into secondary markets over the last two years. Commercial real estate returns are increasingly being driven by property income (yield), as opposed to price appreciation through cap rate compression.
Lenders with long memories remain disciplined in their underwriting of investments. For balance sheet lenders, such as banks and insurance companies, underwriting standards for commercial real estate have been tightened. This has resulted in lower loan-to-value and higher debt coverage ratios. CMBS originations also have been limited as lenders are attempting to adjust to new securitization rules which require issuers to maintain an ongoing equity stake in pooled transactions. These trends have led to increased uncertainty in the level and cost of debt for commercial properties, and in turn has injected some volatility into commercial real estate markets.
A major factor contributing to the strength of the real estate cycle is the difficulty of securing construction financing. Lack of construction financing is effectively keeping an oversupply of commercial real estate, which is typical late in a real estate cycle, from emerging. Bank regulators and new risk-based capital guidelines have enforced discipline in lending, which has helped reduce new construction.
Impact on Our Real Estate Investments
The volatility in the global financial markets continues to cause a level of uncertainty in our outlook for the performance of the U.S. commercial real estate markets. Both the investing and leasing environments are highly competitive. While foreign capital continues to flow into U.S. real estate markets, the uncertainty regarding the political, regulatory and economic environments has introduced uncertainty into the markets. Possible future declines in rental rates, slower or potentially negative net absorption of leased space and expectations of future rental concessions, including free rent to renew tenants early, to retain tenants who are up for renewal or to attract new tenants, may result in decreases in cash flows. The FED increased interest rates in the fourth quarter of 2015 and again in December 2016. The real estate and finance markets anticipate further rate increases as long as the economy remains strong.
Impact on Our Real Estate-Related Investments
All of our real estate-related investments are directly or indirectly secured by commercial real estate. As a result, our real estate-related investments, in general, have been and likely will continue to be impacted by the same factors impacting our real estate properties. The higher yields and the improving credit position of many U.S. tenants and borrowers have attracted global capital. However, the real estate and capital markets are fluid, and the positive trends can reverse quickly. Economic conditions remain relatively volatile and can have a negative impact on the performance of collateral securing our loan investments, and therefore may impact the ability of some of the borrowers under our loans to make contractual interest payments to us.
As of December 31, 2016, we had three fixed rate real estate-related loan investments with a total book value (excluding asset-specific loan loss reserves) of $28.0 million. As of December 31, 2016, the Sandmar Mezzanine Loan, which has a book value of zero after asset specific loan loss reserves, the San Diego Office Portfolio B-Note, which has a book value of $19.2 million, and the 4929 Wilshire B-Note, which has a book value of $3.7 million, were scheduled to mature within one year from December 31, 2016. As of December 31, 2016, we had recorded $5.1 million of reserves for loan losses related to the Sandmar Mezzanine Loan.
8
Economic Dependency
We are dependent on our advisor for certain services that are essential to us, including the management of the daily operations of our real estate and real estate-related investment portfolio; the disposition of real estate and real estate-related investments; the execution of the Plan of Liquidation; and other general and administrative responsibilities. In the event that KBS Capital Advisors is unable to provide any of these services, we will be required to obtain such services from other sources. We also will be dependent on the Property Manager for the services under the GKK Agreements (defined below), as amended, including the operations, leasing and eventual dispositions of the GKK Properties, until we have sold substantially all of the GKK Properties.
Competitive Market Factors
The U.S. commercial real estate leasing markets remain competitive. We face competition from various entities for prospective tenants and to retain our current tenants, including other REITs, pension funds, insurance companies, investment funds and companies, partnerships and developers. Many of these entities have substantially greater financial resources than we do and may be able to accept more risk than we can prudently manage, including risks with respect to the creditworthiness of a tenant. As a result of their greater resources, those entities may have more flexibility than we do in their ability to offer rental concessions to attract and retain tenants. This could put pressure on our ability to maintain or raise rents and could adversely affect our ability to attract or retain tenants. As a result, our financial condition, results of operations, cash flow and ability to successfully implement our Plan of Liquidation may be adversely affected.
We also face competition from many of the types of entities referenced above regarding the disposition of properties. These entities may possess properties in similar locations and/or of the same property types as ours and may be attempting to dispose of these properties at the same time we are attempting to dispose of some of our properties, providing potential purchasers with a larger number of properties from which to choose and potentially decreasing the sales price for such properties. Additionally, these entities may be willing to accept a lower return on their individual investments, which could further reduce the sales price of such properties. This competition could decrease the sales proceeds we receive for properties that we sell, assuming we are able to sell such properties, which could adversely affect our cash flows, the overall return for our stockholders and the amount and timing of liquidating distributions our stockholders receive.
Compliance with Federal, State and Local Environmental Law
Under various federal, state and local environmental laws, ordinances and regulations, a current or previous real property owner or operator may be liable for the cost of removing or remediating hazardous or toxic substances on, under or in such property. These costs could be substantial. Such laws often impose liability whether or not the owner or operator knew of, or was responsible for, the presence of such hazardous or toxic substances. Environmental laws also may impose liens on properties or restrictions on the manner in which properties may be used or businesses may be operated, and these restrictions may require substantial expenditures or prevent us from entering into leases with prospective tenants that may be impacted by such laws. Environmental laws provide for sanctions for noncompliance and may be enforced by governmental agencies or, in certain circumstances, by private parties. Certain environmental laws and common law principles could be used to impose liability for the release of and exposure to hazardous substances, including asbestos-containing materials and lead-based paint. Third parties may seek recovery from real property owners or operators for personal injury or property damage associated with exposure to released hazardous substances and governments may seek recovery for natural resource damage. The cost of defending against claims of environmental liability, of complying with environmental regulatory requirements, of remediating any contaminated property, or of paying personal injury, property damage or natural resource damage claims could reduce the amounts available for distribution to our stockholders.
Except for the GKK Properties and other properties to which we took title to through foreclosure or deed-in-lieu of foreclosure, all of our direct real estate investments were subject to Phase I environmental assessments prior to the time they were acquired. Some of our properties are subject to potential environmental liabilities arising primarily from historic activities at or in the vicinity of the properties. Based on our environmental diligence and assessments of our properties and our purchase of pollution and remediation legal liability insurance with respect to some of our properties, we do not believe that environmental conditions at our properties are likely to have a material adverse effect on our operations.
Some of the properties in our portfolio had or have underground storage tanks either for space heating of the buildings, fueling motor vehicles, or industrial processes. Many of the underground storage tanks at the premises have been replaced over time. Given changing standards regarding closure of underground storage tanks and associated contamination, many of the tanks may not have been closed in compliance with current standards. Some of these properties likely have some residual petroleum or chemical contamination. Properties exhibiting these risks include 129 Concord Road, Billerica, Massachusetts (Rivertech).
9
Under the Settlement Agreement, we indirectly took title to or, with respect to a limited number of the GKK Properties, indirectly took a leasehold interest in, the GKK Properties on an “as is” basis. As such, we were not able to inspect the GKK Properties or conduct standard due diligence on certain of the GKK Properties before the transfers. Additionally, we did not receive representations, warranties and indemnities relating to the GKK Properties from Gramercy and/or its affiliates. Thus, the value of the GKK Properties may decline if we subsequently discover environmental problems with the GKK Properties.
Industry Segments
We operate in three business segments. Our segments are based on our method of internal reporting which classifies our operations by investment type: (i) real estate, (ii) real estate-related and (iii) commercial properties primarily leased to financial institutions received under the Settlement Agreement, or the GKK Properties. For financial data by segment, see Note 11, “Segment Information” in the notes to our consolidated financial statements filed herewith.
Employees
We have no paid employees. The employees of our advisor and its affiliates provide management, disposition, advisory and certain administrative services for us.
Principal Executive Office
Our principal executive offices are located at 800 Newport Center Drive, Suite 700, Newport Beach, California 92660. Our telephone number, general facsimile number and website address are (949) 417-6500, (949) 417-6501 and www.kbsreit.com, respectively.
Available Information
Access to copies of our annual reports on Form 10-K, quarterly reports on Form 10-Q, current reports on Form 8-K, proxy statements and other filings with the SEC, including amendments to such filings, may be obtained free of charge from the following website, www.kbsreit.com, or through the SEC’s website, www.sec.gov. These filings are available promptly after we file them with, or furnish them to, the SEC.
ITEM 1A. | RISK FACTORS |
The following are some of the risks and uncertainties that could cause our actual results, including those related to our implementation of the Plan of Liquidation, to differ materially from those presented in our forward-looking statements. The risks and uncertainties described below are not the only ones we face but do represent those risks and uncertainties that we believe are material to us. Additional risks and uncertainties not presently known to us or that we currently deem immaterial may also harm our business.
Risks Related to the Plan of Liquidation
We may not be able to pay liquidating distributions to our stockholders at the times and in the amounts we currently expect.
We currently estimate that if we are able to successfully implement the Plan of Liquidation, our net proceeds from liquidation and, therefore, the amount of cash that our stockholders would receive for each share of our common stock that they then hold, could range between approximately $3.27 and $3.68 per share. We anticipate paying our liquidating distributions from such net proceeds from liquidation within 24 months from January 27, 2017, the day our stockholders approved Plan of Liquidation. However, our expectations about the amount of liquidating distributions that we will pay and when we will pay them are based on many estimates and assumptions, one or more of which may prove to be incorrect. As a result, the actual amount of liquidating distributions we pay to our stockholders may be more or less than we estimate and the liquidating distributions may be paid later than we predict.
Pursuant to the Plan of Liquidation, on March 10, 2017, our board of directors authorized an initial liquidating distribution in the amount of $1.00 per share of common stock to our stockholders of record as of the close of business on March 21, 2017. The initial liquidating distribution was paid on March 24, 2017 and was funded from proceeds from asset sales. Since it is a liquidating distribution pursuant to the Plan of Liquidation, the initial liquidating distribution reduced our stockholders’ remaining investment in us and reduced the estimated range of future liquidating distributions per share to be received by our stockholders by $1.00 per share. We are in the process of liquidating our remaining assets and expect to make one or more additional liquidating distributions pursuant to the Plan of Liquidation. There can be no assurances as to the timing or amount of any additional liquidating distributions.
10
If any of the parties to our existing or future sale agreements default thereunder, or if these sales do not otherwise close, our liquidating distributions may be delayed or reduced.
As part of our implementation of the Plan of Liquidation, we will seek to enter into binding sale agreements for each of our properties. The consummation of the potential sales for which we have entered into sale agreements or will enter into sale agreements in the future will be subject to satisfaction of closing conditions. If any of the transactions contemplated by these future sale agreements do not close because of a buyer default, failure of a closing condition or for any other reason, we will need to locate a new buyer for the properties, which we may be unable to do promptly or at prices or on terms that are as favorable as the original sale agreement. We will also incur additional costs involved in locating a new buyer and negotiating a new sale agreement for these properties. These additional costs are not included in our projections. In the event that we incur these additional costs, our liquidating distributions paid to our stockholders would be delayed or reduced.
If we are unable to find buyers for some or all of our assets at our expected sales prices, our liquidating distributions may be delayed or reduced.
We have targeted disposition plans and timeframe estimates for each of our remaining assets. Some of these assets are already in the process of being sold and we will continue to market others for sale over the coming months. As of March 27, 2017, we had entered into agreements to sell 14 of our remaining properties. For more information on our properties, see Part IV, Item 15 “Exhibits, Financial Statement Schedules — Notes 3 ‘Real Estate Held for Investment’ and 6 ‘Real Estate Held for Sale and Discontinued Operations’.” There can be no assurance that each of the dispositions will close on the projected closing date or at all, or that the properties will sell for the projected sales prices. The anticipated net proceeds from these sales are included in the range of estimated net proceeds from liquidation discussed herein.
In calculating the range of estimated net proceeds from liquidation, we assumed that we will be able to find buyers for all of our properties at amounts based on our estimated range of market values for each property. However, we may have overestimated the sales prices that we will ultimately be able to obtain for these assets. For example, in order to find buyers in a timely manner, we may be required to lower our asking price below the low end of our current estimate of the property’s market value. If we are not able to find buyers for these assets in a timely manner or if we have overestimated the sales prices we will receive, our liquidating distributions paid to our stockholders would be delayed or reduced. Furthermore, the range of estimated net proceeds from liquidation is based upon our estimates and assumptions as of October 5, 2016, but real estate market values are constantly changing and fluctuate with changes in interest rates, supply and demand dynamics, occupancy rates, rental rates, the availability of suitable buyers, the perceived quality and dependability of cash flows from properties and a number of other factors, both local and national. In addition, higher than anticipated transactional fees and expenses, environmental liabilities of which we are unaware or other unknown liabilities, if any, may adversely impact the net liquidation proceeds from those assets. For more information relating to the calculation of our range of estimated net proceeds from liquidation, see Part II, Item 5, “Market for Registrant’s Common Equity, Related Stockholder Matters and Issuer Purchases of Equity Securities - Market Information.”
If we experience significant lease terminations and/or tenant defaults during the liquidation process or if our cash flow during the liquidation process is otherwise less than we expect, our liquidating distributions may be delayed or reduced.
In calculating our range of estimated net proceeds from liquidation, we assumed that we would not experience significant lease terminations not currently known to us and that we would not experience any significant unknown tenant defaults during the liquidation process that were not subsequently cured. Any currently known lease expirations and non-renewals of tenant leases were considered in calculating our range of estimated net proceeds from liquidation. Significant unknown lease terminations and/or tenant defaults during the liquidation process would adversely affect the resale value of the properties. We may also decide in the event of a tenant default to restructure the lease, which could require us to substantially reduce the rent payable to us under the lease, or make other modifications that are unfavorable to us. To the extent that we receive less rental income than we expect during the liquidation process, our liquidating distributions will be reduced.
If our liquidation costs or unpaid liabilities are greater than we expect, our liquidating distributions may be delayed or reduced.
Before paying the final liquidating distribution, we will need to pay or arrange for the payment of all of our transaction costs in the liquidation, all other costs and all valid claims of our creditors. Our board of directors may also decide to acquire one or more insurance policies covering unknown or contingent claims against us, for which we would pay a premium that has not yet been determined. Our board of directors may also decide to establish a reserve fund to pay these contingent claims. The amounts of the various transaction costs in the liquidation are not yet final, so we have used estimates of these costs in calculating the amounts of our range of estimated net proceeds from liquidation. To the extent that we have underestimated these costs in calculating our projections, our actual net proceeds from liquidation per share may be lower than the low end of our range of estimated net proceeds from liquidation per share. In addition, if the claims of our creditors are greater than we have anticipated or we decide to acquire one or more insurance policies covering unknown or contingent claims against us, or if we establish a reserve fund, payment of liquidating distributions to our stockholders may be delayed or reduced.
11
Our estimated range of liquidating distributions is based on our estimated value per share minus estimated costs and expenses related to our liquidation and dissolution. Our estimated range of liquidating distributions may not reflect the value that stockholders will receive for their investment upon our liquidation pursuant to the Plan of Liquidation. Our estimated value per share and estimated range of liquidating distributions do not take into account how developments subsequent to the valuation date related to individual assets, the financial or real estate markets or other events may have increased or decreased the value of our portfolio.
On October 5, 2016, our board of directors approved an estimated value per share of our common stock of $3.65 (unaudited) based on the estimated value of our assets less the estimated value of our liabilities, or net asset value, divided by the number of shares outstanding, all as of June 30, 2016, except for certain items discussed in Part II, Item 5, “Market for Registrant’s Common Equity, Related Stockholder Matters and Issuer Purchases of Equity Securities - Market Information” for which estimated values were adjusted subsequent to June 30, 2016. We provided this estimated value per share to (i) assist us in calculating the range of estimated net proceeds from our Plan of Liquidation as discussed in our definitive proxy statement filed with the SEC on November 10, 2016, which Plan of Liquidation was approved by our stockholders on January 27, 2017, and (ii) assist broker-dealers that participated in our initial public offering in meeting their customer account statement reporting obligations under National Association of Securities Dealers (“NASD”) Conduct Rule 2340 as required by the Financial Industry Regulatory Authority (“FINRA”). This valuation was performed in accordance with the provisions of and also to comply with Practice Guideline 2013-01, Valuations of Publicly Registered, Non-Listed REITs, issued by the Investment Program Association (“IPA”) in April 2013 (the “IPA Valuation Guidelines”). The estimated value per share was based on the recommendation and valuation performed by our advisor. We engaged Duff & Phelps, LLC (“Duff & Phelps”), an independent, third-party real estate valuation firm, to provide appraisals for the majority of our real estate properties. We also engaged Duff & Phelps to provide a calculation of the range in estimated value per share of our common stock as of October 5, 2016. Duff & Phelps based this range in estimated value per share upon (i) its appraisals for the majority of our real estate properties or the contractual sales prices less actual or estimated disposition costs and fees in the case of properties that were under contract to sell as of August 31, 2016 or properties sold or disposed of subsequent to June 30, 2016 and prior to October 5, 2016 and (ii) valuations performed by our advisor of our real estate-related investments, cash, other assets, mortgage debt and other liabilities.
As with any valuation methodology, the methodologies used are based upon a number of estimates and assumptions that may not be accurate or complete. Different parties using different assumptions and estimates could derive a different estimated value per share of our common stock, and this difference could be significant. The estimated value per share is not audited and does not represent the fair value of our assets less the fair value of our liabilities according to U.S. generally accepted accounting principles (“GAAP”), nor does it represent a liquidation value of our assets and liabilities or the price at which our shares of common stock would trade on a national securities exchange. The estimated value per share does not reflect a discount for the fact that we are externally managed, nor does it reflect a real estate portfolio premium/discount versus the sum of the individual property values. We have generally incurred disposition costs and fees related to the sale of our historical real estate properties since inception of 1.7% to 5.7% of the gross sales price less concessions and credits, with a weighted average of 2.7% as of June 30, 2016. We have generally incurred disposition costs and fees related to the sale of the GKK Properties since December 15, 2011 (the date of the completion of the transfer of the GKK Properties to us pursuant to the Settlement Agreement) of 1.5% to 8.5% of the gross sales price less concessions and credits, with a weighted average of 2.6% as of June 30, 2016.
Accordingly, with respect to the estimated value per share, we can give no assurance that:
• | a stockholder would be able to resell his or her shares at this estimated value; |
• | our shares of common stock would trade at the estimated value per share on a national securities exchange; |
• | another independent third-party appraiser or third-party valuation firm would agree with our estimated value per share; or |
• | the methodology used to calculate our estimated value per share would be acceptable to FINRA or for compliance with ERISA reporting requirements. |
12
Moreover, as discussed above, the October 5, 2016 estimated value per share does not represent a liquidation value of our assets and liabilities. If we are able to successfully implement the Plan of Liquidation, we estimate that our net proceeds from liquidation and, therefore, the amount of cash our stockholders would receive for each share of our common stock they then hold, could range between approximately $3.27 and $3.68 per share. The difference between the estimated value per share and the range of estimated net proceeds from liquidation reflects the fact that the estimated value per share does not take into consideration: (i) expected closing costs and fees related to dispositions of real estate and real estate-related investments, with the exception of one historical real estate property and 50 GKK Properties that were under contract to sale as of August 31, 2016 or sold or disposed of subsequent to June 30, 2016 and prior to October 5, 2016, and (ii) corporate transaction costs and other expenses of the liquidation and dissolution of the company not covered from our cash flow from operations. However, our expectations about the amount of liquidating distributions that we will pay and when we will pay them are based on many estimates and assumptions, one or more of which may prove to be incorrect. As a result, the actual amount of liquidating distributions we pay to our stockholders may be more or less than we estimate and the liquidating distributions may be paid later than we predict.
For a full description of the methodologies and assumptions used to value our assets and liabilities in connection with the calculation of the estimated value per share, see Part II, Item 5, “Market for Registrant’s Common Equity, Related Stockholder Matters and Issuer Purchases of Equity Securities — Market Information.”
In addition, the value of our shares will fluctuate over time in response to developments related to individual assets in our portfolio and the management of those assets, in response to fluctuations in the real estate and finance markets and due to other factors. As such, the estimated value per share does not take into account developments in our portfolio since October 5, 2016, including:
• | asset sales and potential future asset sales at values different from those used in the determination of the estimated value per share as well as any impairment charges related to these or other assets as a result of changes in the expected hold period, or the estimated cash flows for or future expenses related to these assets; |
• | any impairments we may recognize with respect to certain of our real estate-related investments; |
• | any increases or decreases in value of any of our real estate or real estate-related investments; |
• | any disruptions in the real estate and financial markets or general economic conditions; |
• | any unforeseen capital expenditure requirements; |
• | any inability to successfully operate and/or sell the GKK Properties or a downturn in the banking industry, resulting from disruptions in economic conditions and the concentration of the GKK Properties in the financial services sector; or |
• | any inability to meet our existing debt service obligations, or to repay or refinance such obligations on attractive terms or at all at or prior to maturity. |
Pursuant to the Plan of Liquidation, on March 10, 2017, our board of directors authorized an initial liquidating distribution in the amount of $1.00 per share of common stock to our stockholders of record as of the close of business on March 21, 2017. The initial liquidating distribution was paid on March 24, 2017 and was funded from proceeds from asset sales. Since it is a liquidating distribution pursuant to the Plan of Liquidation, the initial liquidating distribution reduced our stockholders’ remaining investment in us and reduced the estimated range of future liquidating distributions per share to be received by our stockholders by $1.00 per share. We are in the process of liquidating our remaining assets and expect to make one or more additional liquidating distributions pursuant to the Plan of Liquidation. There can be no assurances as to the timing or amount of any additional liquidating distributions.
In addition, on March 27, 2017, our board of directors approved an estimated value per share of our common stock of $2.475 (unaudited), effective March 21, 2017 (the “March 2017 EVPS”). The March 2017 EVPS is equal to the midpoint of the estimated range of liquidating distributions of $3.27 and $3.68 per share (which midpoint is $3.475), reduced for the impact of the payment of the initial liquidating distribution to our stockholders. Thus, the March 2017 EVPS reflects the resulting reduction of our stockholders’ remaining investment in us. This valuation was performed in accordance with the provisions of and also to comply with the IPA Valuation Guidelines, reduced for the impact of liquidation fees and selling costs. For more information relating to the calculation of the March 2017 EVPS, see our Current Report on Form 8-K, filed with the SEC on March 28, 2017.
13
Pursuing the Plan of Liquidation may cause us to fail to qualify as a REIT, which would dramatically lower the amount of our liquidating distributions.
For so long as we qualify as a REIT and distribute all of our REIT taxable income, we generally are not subject to federal income tax. Although our board of directors does not presently intend to terminate our REIT status prior to the final distribution of the net proceeds from liquidation and our dissolution, our board of directors may take actions pursuant to the Plan of Liquidation that would result in such a loss of REIT status. Upon the final distribution of our net proceeds from liquidation and our dissolution, our existence and our REIT status will terminate. However, there is a risk that our actions during the liquidation process may cause us to fail to meet one or more of the requirements that must be met in order to qualify as a REIT prior to completion of the Plan of Liquidation. For example, to qualify as a REIT, generally at least 75% of our gross income in each taxable year must come from real estate sources and generally at least 95% of our gross income in each taxable year must come from real estate sources and certain other sources that are itemized in the REIT tax laws, mainly interest and dividends. We may encounter difficulties satisfying these requirements during the liquidation process. In addition, in connection with that process, we may recognize ordinary income in excess of the cash received.
The REIT rules require us to pay out a large portion of our ordinary income in the form of a dividend to our stockholders. However, to the extent that we recognize ordinary income without any cash available for distribution, and if we were unable to borrow to fund the required dividend or find another way to meet the REIT distribution requirements, we may cease to qualify as a REIT. While we expect to comply with the requirements necessary to qualify as a REIT in any taxable year, if we are unable to do so, we will, among other things (unless entitled to relief under certain statutory provisions):
• | not be allowed a deduction for dividends paid to stockholders in computing our taxable income; |
• | be subject to federal income tax, including any applicable alternative minimum tax, on our taxable income, |
• | including recognized gains, at regular corporate rates; |
• | be subject to increased state and local taxes; and |
• | be disqualified from treatment as a REIT for the taxable year in which we lose our qualification and for the four following taxable years. |
As a result of these consequences, our failure to qualify as a REIT could substantially reduce the amount of liquidating distributions we pay to our stockholders.
Pursuing the Plan of Liquidation may cause us to be subject to federal income tax, which would reduce the amount of our liquidating distributions.
We generally are not subject to federal income tax to the extent that we distribute to our stockholders during each taxable year (or, under certain circumstances, during the subsequent taxable year) dividends equal to our taxable income for the year. However, we are subject to federal income tax to the extent that our taxable income exceeds the amount of dividends paid to our stockholders for the taxable year. In addition, we are subject to a 4% nondeductible excise tax on the amount, if any, by which certain distributions paid by us with respect to any calendar year are less than the sum of 85% of our ordinary income for that year, plus 95% of our capital gain net income for that year, plus 100% of our undistributed taxable income from prior years. While we intend to pay distributions to our stockholders sufficient to avoid the imposition of any federal income tax on our taxable income and the imposition of the excise tax, differences in timing between the actual receipt of income and actual payment of deductible expenses, and the inclusion of such income and deduction of such expenses in arriving at our taxable income, could cause us to have to either borrow funds on a short-term basis to meet the REIT distribution requirements, find another alternative for meeting the REIT distribution requirements, or pay federal income and excise taxes. The cost of borrowing or the payment of federal income and excise taxes would reduce the amount of liquidating distributions we pay to our stockholders.
So long as we continue to qualify as a REIT, any net gain from “prohibited transactions” will be subject to a 100% tax. “Prohibited transactions” are sales of property held primarily for sale to customers in the ordinary course of a trade or business. The prohibited transactions tax is intended to prevent a REIT from retaining any profit from the sales of properties held primarily for sale to customers in the ordinary course of business. The Internal Revenue Code provides for a “safe harbor” which, if all its conditions are met, would protect a REIT’s property sales from being considered prohibited transactions. Whether a real estate asset is property held primarily for sale to customers in the ordinary course of a trade or business is a highly factual determination. We believe that all of our properties are held for investment and the production of rental income, and that none of the sales of our properties will constitute a prohibited transaction. We do not believe that the sales of our properties pursuant to the Plan of Liquidation should be subject to the prohibited transactions tax. However, due to the anticipated sales volume and other factors, the contemplated sales may not qualify for the protective safe harbor. There can, however, be no assurances that the U.S. Internal Revenue Service (the “IRS”) will not successfully challenge the characterization of properties we hold for purposes of applying the prohibited transaction tax.
14
The U.S. federal income tax treatment of distributions to stockholders may vary based on whether such distributions are made (1) prior to the Plan of Liquidation or (2) under the Plan of Liquidation.
Prior to the adoption of the Plan of Liquidation to the extent distributions in excess of current and accumulated earnings and profits (i) do not exceed a stockholder’s adjusted basis in our stock, such distributions will not be taxable to a stockholder, but rather a stockholder’s adjusted basis in our stock will be reduced; and, (ii) exceed a stockholder’s adjusted basis in our stock, such distributions will be included in income as long-term capital gain if the stockholder has held its shares for more than one year and otherwise as short-term capital gain.
In general, upon approval of the Plan of Liquidation, distributions to stockholders under the Plan of Liquidation, including a stockholder’s pro rata share of the fair market value of any assets that are transferred to a liquidating trust, should not be taxable for U.S. federal income tax purposes until the aggregate amount of liquidating distributions to a stockholder exceeds such stockholder’s adjusted tax basis in our stock, and then should be taxable to such stockholder as capital gain (assuming such stockholder held our stock as a capital asset). To the extent the aggregate amount of liquidating distributions to a stockholder is less than such stockholder’s adjusted tax basis in our stock, such stockholder should recognize a capital loss (assuming such stockholder held our stock as a capital asset) in the year the final distribution is received. The transfer of our assets to a liquidating trust is a taxable event to our stockholders notwithstanding that the stockholders may not currently receive a distribution of cash or any other assets with which to satisfy the resulting tax liability.
Our expectations about the amount of liquidating distributions that we will pay and when we will pay them are based on many estimates and assumptions, one or more of which may prove to be incorrect.
Our organizational documents permit us, to the extent permitted by Maryland law, to pay distributions from any source. We have paid distributions with proceeds from asset sales, loan repayments, financings, a loan from our advisor (which our advisor forgave without repayment) and our cash flow from operations. Our focus in 2017 is to (i) pursue an orderly liquidation of our company pursuant to the Plan of Liquidation; and (ii) maximize stockholder value by selling all of our remaining assets, providing for the payment of unknown or contingent liabilities, distributing the net proceeds from liquidation to our stockholders and winding up our operations and dissolving our company. We expect to pay multiple liquidating distribution payments to our stockholders during the liquidation process and to pay the final liquidating distribution after we sell all of our assets, pay all of our known liabilities and provide for unknown liabilities.
We expect to complete these activities within 24 months from January 27, 2017, the day our stockholders approved the Plan of Liquidation. However, our expectations about the amount of liquidating distributions that we will pay and when we will pay them are based on many estimates and assumptions, one or more of which may prove to be incorrect. As a result, the actual amount of liquidating distributions we pay to our stockholders may be more or less than we estimate and the liquidating distributions may be paid later than we predict. We do not expect to pay regular quarterly distributions during the liquidation process. We intend to maintain adequate cash reserves for liquidity, capital expenditures, debt repayments, future Special Redemptions under our share redemption program and other future capital needs.
Pursuant to the Plan of Liquidation, on March 10, 2017, our board of directors authorized an initial liquidating distribution in the amount of $1.00 per share of common stock to our stockholders of record as of the close of business on March 21, 2017. The initial liquidating distribution was paid on March 24, 2017 and was funded from proceeds from asset sales. Since it is a liquidating distribution pursuant to the Plan of Liquidation, the initial liquidating distribution reduced our stockholders’ remaining investment in us and reduced the estimated range of future liquidating distributions per share to be received by our stockholders by $1.00 per share.
We can give no assurance regarding the timing or amount of future liquidating distributions. We intend to maintain adequate cash reserves for liquidity, capital expenditures, debt repayments, future Special Redemptions under our share redemption program and other future capital needs.
15
Distributing beneficial interests in a liquidating trust may trigger tax consequences to our stockholders.
The REIT provisions of the Internal Revenue Code generally require that each year we distribute as a dividend to our stockholders 90% of our REIT taxable income (determined without regard to the dividends paid deduction and excluding net capital gain). Liquidating distributions we pay pursuant to the Plan of Liquidation will qualify for the dividends paid deduction, provided that they are paid within 24 months of January 27, 2017, the date our stockholders approved the Plan of Liquidation. Conditions may arise which cause us not to be able to liquidate within such 24-month period. For instance, it may not be possible to sell our assets at acceptable prices during such period. In such event, rather than retain our assets and risk losing our status as a REIT, we may elect to transfer our remaining assets and liabilities to a liquidating trust in order to meet the 24-month requirement. We may also elect to transfer our remaining assets and liabilities to a liquidating trust within such 24-month period and seek relief from the SEC from certain reporting requirements under the Securities Exchange Act of 1934, as amended (the “Exchange Act”), to avoid the costs of operating as a public company, or if our board of directors and Special Committee determine that it is otherwise advantageous or appropriate to do so. Such a transfer would be treated as a distribution of our remaining assets to our stockholders, followed by a contribution of the assets to the liquidating trust. As a result, a stockholder would recognize gain to the extent such stockholder’s share of the cash and the fair market value of any assets received by the liquidating trust was greater than the stockholder’s basis in the stock, notwithstanding that the stockholder would not contemporaneously receive a distribution of cash or any other assets with which to satisfy the resulting tax liability. To the extent such stockholder’s share of the cash and the fair market value of any assets received by the liquidating trust is less than the stockholder’s basis in the stock, such loss is expected to be recognizable at the time of the transfer to the liquidating trust, but not before such time. In addition, it is possible that the fair market value of the assets received by the liquidating trust, as estimated for purposes of determining the extent of the stockholder’s gain at the time the beneficial interests in the liquidating trust are distributed to the stockholders, will exceed the cash or fair market value of property received by the liquidating trust on a sale of the assets. In this case, the stockholder would recognize a loss in a taxable year subsequent to the taxable year in which the gain was recognized, which loss may be limited under the Internal Revenue Code.
Our entity value may be adversely affected by adoption of the Plan of Liquidation.
Subject to our ability to abandon the Plan of Liquidation, notwithstanding stockholder approval, to the extent permitted by the Maryland General Corporation Law (the “MGCL”), we are committed to winding-up our operations. This may adversely affect the value that a potential acquirer might place on us. It may also preclude other possible courses of action not yet identified by our board of directors.
There can be no assurance that a planned liquidation pursuant to the Plan of Liquidation will maximize stockholder value to a greater extent at this time than would otherwise occur through other alternatives considered by our board of directors and the Special Committee.
Our stockholders will no longer participate in any future earnings or benefit from any increases in the value of our assets once such assets are sold. While our board of directors and the Special Committee each believes that a planned liquidation pursuant to the Plan of Liquidation is more likely to maximize stockholder value at this time than otherwise would occur through the other alternatives considered by our board of directors and the Special Committee, such belief relies on certain assumptions and judgments concerning future events. Therefore, it is possible that continuing with the status quo or pursuing one or more of the other alternatives would maximize stockholder value to a greater extent at this time.
Our board of directors may abandon or delay implementation of the Plan of Liquidation.
Our board of directors may terminate the Plan of Liquidation for any reason. This power of termination may be exercised despite the approval of the Plan of Liquidation Proposal by our stockholders, up to the time that our articles of dissolution have been accepted of record by the State Department of Assessments and Taxation of Maryland. Notwithstanding approval of the Plan of Liquidation by our stockholders, our board of directors may modify or amend the Plan of Liquidation without further action by our stockholders to the extent permitted under then current law. Although our board of directors has no present intention to pursue any alternative to the Plan of Liquidation, our board of directors may conclude either that its duties under applicable law require it to pursue business opportunities that present themselves or that abandoning the Plan of Liquidation is otherwise in the best interest of us and our stockholders. If our board of directors elects to pursue any alternative to the Plan of Liquidation, our stockholders may not receive any of the consideration currently estimated to be available for distribution to our stockholders pursuant to the Plan of Liquidation.
Our board of directors has the authority to sell our assets under terms less favorable than those assumed for the purpose of estimating our net liquidation value range.
Our board of directors has the authority to sell any and all of our assets on such terms and to such parties as our board of directors determines in its sole discretion. Notably, our stockholders will have no subsequent opportunity to vote on such matters and will, therefore, have no right to approve or disapprove the terms of such sales.
16
Our stockholders could, in some circumstances, be held liable for amounts they received from us in connection with our dissolution.
If we fail to create an adequate contingency reserve for payment of our expenses and liabilities, or if we transfer our assets to a liquidating trust and the contingency reserve and the assets held by the liquidating trust are less than the amount ultimately found payable in respect of expenses and liabilities, each of our stockholders could be held liable for the payment to our creditors of such stockholder’s pro rata portion of the excess, limited to the amounts previously received by the stockholder in distributions from us or the liquidating trust, as applicable. If a court holds at any time that we failed to make adequate provision for our expenses and liabilities or if the amount ultimately required to be paid in respect of such liabilities exceeds the amount available from the contingency reserve and the assets of the liquidating trust, our creditors could seek an injunction to prevent us from paying liquidating distributions under the Plan of Liquidation on the grounds that the amounts to be distributed are needed to provide for the payment of such expenses and liabilities. Any such action could delay or substantially diminish the amount of liquidating distributions to be paid to our stockholders and/or holders of beneficial interests of any liquidating trust.
We will continue to incur the expenses of complying with public company reporting requirements.
Until our liquidation and dissolution is complete, we have an obligation to continue to comply with the applicable reporting requirements of the Exchange Act, even if compliance with these reporting requirements is economically burdensome. Moreover, though our stockholders approved certain amendments to our charter and thus our charter no longer requires us to provide audited financial statements to our stockholders, any decision by us to cease providing audited financial statements to our stockholders would need to be approved by our board of directors or, if a liquidating trust is established, the trustees of the liquidating trust, and would require that the SEC grant us relief from certain reporting requirements under the Exchange Act. In order to curtail expenses, we intend, after filing articles of dissolution, to seek relief from the SEC from certain reporting requirements under the Exchange Act. We anticipate that, if such relief is granted, we would continue to file current reports on Form 8-K to disclose material events relating to our liquidation and dissolution, along with any other reports that the SEC might require, but would discontinue filing annual and quarterly reports on Forms 10-K and 10-Q. However, the SEC may not grant any such relief. To the extent that we delay filing the articles of dissolution or if the SEC does not grant such relief, we would be obligated to continue complying with the applicable reporting requirements of the Exchange Act. The expenses we incur in complying with the applicable reporting requirements would reduce the amount of liquidating distributions we pay to our stockholders.
Approval of the Plan of Liquidation may lead to stockholder litigation, which could result in substantial costs and distract our management.
Extraordinary corporate actions by a company, such as our Plan of Liquidation, sometimes lead to lawsuits being filed against that company. We may become involved in this type of litigation in connection with the Plan of Liquidation. As of March 24, 2017, no such lawsuits relative to the Plan of Liquidation were pending or, to our knowledge, threatened. However, if such a lawsuit is filed against us, the litigation is likely to be expensive and, even if we ultimately prevail, the process may divert management’s attention from implementing the Plan of Liquidation. If we were not to prevail in such a lawsuit, we may be liable for damages. We cannot predict the amount of any such damages; however, if applicable, they may be significant and may reduce the amount of liquidating distributions we pay to our stockholders.
17
Our directors and officers and our advisor and its affiliates have conflicts of interest that may influence their actions during the implementation of the Plan of Liquidation and may cause them to manage our liquidation in a manner not solely in the best interest of our stockholders.
Some of our directors and officers and our advisor and its affiliates have interests in the liquidation that are different from your interests as a stockholder. Some of the conflicts of interest presented by the liquidation are summarized below. For information relating to other conflicts of interest, see Part I, Item 1A “ — Conflicts of Interest.”
• | All of our executive officers, including Peter M. Bren, Keith D. Hall, Peter McMillan III, and Charles J. Schreiber, Jr., are officers of our advisor and/or one or more of our advisor’s affiliates and are compensated by those entities, in part, for their service rendered to us. We currently do not pay any direct compensation to our executive officers. |
• | Messrs. Schreiber, McMillan, Bren and Hall, indirectly own and control our advisor. Pursuant to the terms of the advisory agreement, our advisor may be entitled to disposition fees in connection with the sale of our assets. These disposition fees are estimated to be between approximately $18.8 million and $21.3 million, depending upon and correlated to the price we receive for the sale of our assets pursuant to the Plan of Liquidation. |
• | Our advisor earns asset management fees from us and receives reimbursement of certain of its operating costs. If the Plan of Liquidation takes up to two years to effect, our advisor will earn fees and receive reimbursements for a longer period of time than if we were to quickly sell our assets through a merger or portfolio or whole-entity sale. Based on assets we owned as of March 27, 2017 and projected disposition dates for these assets, we project that we may pay our advisor an aggregate of approximately $2.2 million in 2017 and 2018 during the liquidation process, although this estimate may vary significantly based on the timing of asset sales. |
• | Our advisor owns a total of 20,000 shares of our common stock, for which we estimate it will receive liquidating distributions of between approximately $65,400 and $73,600 in connection with our liquidation. These amounts do not include the amount of any regular quarterly distributions, if any, we may pay during the liquidation process. We do not expect to pay regular quarterly distributions during the liquidation process. |
• | Not including the 20,000 shares owned by our advisor referenced above, our executive officers and directors own an aggregate of 23,373 shares of our common stock, for which we estimate they will receive aggregate liquidating distributions of between approximately $76,400 and $86,000 in connection with our liquidation. These amounts do not include the amount of any regular quarterly distributions, if any, we may pay during the liquidation process. |
Because of the above conflicts of interest, our directors and officers and our advisor may be incentivized to make decisions or take actions based on factors other than the best interest of our stockholders throughout the liquidation process.
Our advisor and some of our directors and officers face conflicts of interest and competing demands on their time which may cause them to manage our liquidation in a manner not solely in the best interest of our stockholders.
As of March 24, 2017, three additional KBS-sponsored non-traded REITs, KBS Real Estate Investment Trust II, Inc. (“KBS REIT II”), KBS Legacy Partners Apartment REIT, Inc. (“KBS Legacy Partners Apartment REIT”) and KBS Strategic Opportunity REIT, Inc. (“KBS Strategic Opportunity REIT”), had announced that they are exploring strategic alternatives. Our advisor acts as the advisor for KBS KBS REIT II, KBS Legacy Partners Apartment REIT and KBS Strategic Opportunity REIT and all of our directors are also directors of KBS KBS REIT II and KBS Real Estate Investment Trust III, Inc. (“KBS REIT III”). Thus, during the liquidation process, the key real estate professionals at our advisor, including Messrs. Bren, Hall, McMillan and Schreiber, on whom we will depend to carry out the Plan of Liquidation, may be required to perform similar duties relating to strategic alternatives for KBS REIT II, KBS Legacy Partners Apartment REIT and KBS Strategic Opportunity REIT. KBS REIT II owns office properties that are similar to certain of our properties. If our advisor directs potential purchasers to properties owned by KBS REIT II or another KBS-sponsored program or KBS-advised investor when it could direct such purchasers to our properties, we may be unable to sell some or all of our properties at the time or at the price we otherwise would, which could reduce or delay the liquidating distributions we pay to our stockholders.
18
Risks Related to an Investment in Us
Because no public trading market for our shares currently exists and because our share redemption program limits redemptions to Special Redemptions, our stockholders may not realize the cash value of their shares until we complete our liquidation pursuant to the Plan of Liquidation.
There is no public market for our shares and as such, our stockholders may not sell their shares unless the buyer meets the applicable suitability and minimum purchase standards. Any sale must also comply with applicable state and federal securities laws. In addition, our charter prohibits the ownership of more than 9.8% of our stock by any person, unless exempted by our board of directors, which may inhibit large investors from purchasing our shares. Our share redemption program only provides for Special Redemptions. Such special redemptions are subject to an annual dollar limitation, which was $10.0 million in the aggregate for the calendar year 2016, and further subject to the limitations described in the share redemption program document. On January 27, 2017, our board of directors approved the same annual dollar limitation of $10.0 million in the aggregate for the calendar year 2017 (subject to review and adjustment during the year by our board of directors), and further subject to the limitations described in the share redemption program document. Based on historical redemption activity, we believe the $10.0 million redemption limitation for the calendar year 2017 will be sufficient for these Special Redemptions. During each calendar year, the annual dollar limitation for the share redemption program will be reviewed and adjusted from time to time. We currently do not expect to have funds available to resume ordinary redemptions in the future. Therefore, until further notice, and except with respect to Special Redemptions, stockholders will not be able to sell any of their shares back to us pursuant to our share redemption program. In its sole discretion, our board of directors may amend, suspend or terminate our share redemption program upon 10 days’ notice. Therefore, it will be difficult for our stockholders to sell their shares promptly or at all. If a stockholder is able to sell his or her shares, it would likely be at a substantial discount to the price at which we sold the shares in our public offering or our estimated range of liquidating distributions. It is also likely that our shares would not be accepted as the primary collateral for a loan.
Disruptions in the financial markets and uncertain economic conditions could adversely affect market rental rates.
A volatile and challenging global macro-economic environment may interfere with the implementation of the Plan of Liquidation and reduce the amount of net proceeds from liquidation and therefore, reduce the amount of liquidating distributions our stockholders receive.
Disruptions in the financial markets and uncertain economic conditions could adversely affect the values of our investments. Any disruption to the debt and capital markets could result in fewer buyers seeking to acquire commercial properties and possible increases in capitalization rates and lower property values. Furthermore, any decline in economic conditions could negatively impact commercial real estate fundamentals and result in lower occupancy, lower rental rates and declining values in our real estate portfolio and in the collateral securing our loan investments, which could have the following negative effects on us:
• | the values of our investments in commercial properties could decrease below the amounts paid for such investments; |
• | the value of collateral securing our loan investments could decrease below the outstanding principal amounts of such loans; |
• | revenues from our properties could decrease due to fewer tenants and/or lower rental rates, decreasing the value of our properties; and/or |
• | revenues generated by the properties and other assets underlying our loan investments could decrease, making it more difficult for the borrowers to meet their payment obligations to us, decreasing the value of those investments. |
All of these factors could reduce the amount of liquidating distributions our stockholders receive and their overall return on investment.
Our stockholders should not assume that our performance will be similar to the performance of other real estate programs sponsored by affiliates of our advisor, which makes our future performance difficult to predict.
We are the first publicly offered investment program sponsored by the affiliates of our advisor, KBS Capital Advisors. Our stockholders should not assume that our performance will be similar to the past performance of other real estate investment programs sponsored by affiliates of our advisor. The private KBS-sponsored programs were not subject to the up-front commissions, fees and expenses associated with our initial public offering nor all of the laws and regulations that apply to us. For these reasons, our stockholders should be especially cautious when drawing conclusions about our future performance and our stockholders should not assume that it will be similar to the prior performance of other KBS-sponsored programs. The differences between us and the private KBS-sponsored programs significantly increase the risk and uncertainty our stockholders face.
19
Because we depend upon our advisor and its affiliates to conduct our operations, any adverse changes in the financial health of our advisor or its affiliates or our relationship with them could hinder our operating performance and the return on our stockholders’ investment.
We depend on our advisor to manage our operations and our portfolio of real estate and real estate-related assets and to implement the Plan of Liquidation. Our advisor depends upon the fees and other compensation that it receives from us and the other public KBS-sponsored programs in connection with the purchase, management and sale of assets to conduct its operations. Any adverse changes in the financial condition of KBS Capital Advisors or our relationship with KBS Capital Advisors and its affiliates could hinder their ability to successfully manage our operations and our portfolio of investments and to implement the Plan of Liquidation.
KBS Capital Advisors has limited experience operating, overseeing and selling bank branch properties, which could cause inefficiencies in the operation and sale of these properties, thereby reducing the value of our stockholders’ investment in us.
Our advisor has limited experience operating, overseeing and selling bank branch properties, which properties make up the majority of the GKK Properties. As such, and while we believe we have retained appropriate asset management by hiring the Property Manager to manage and provide certain other services related to the GKK Properties prior to our sale of substantially all of such properties, we may not be able to operate, lease and/or sell these GKK Properties efficiently and effectively. Additionally, some of these bank branches are located outside of our target markets and our advisor has limited experience in these markets. For these reasons, there may be inefficiencies in the operation and sale of these GKK Properties, which may reduce the amount of net proceeds from liquidation we receive from the GKK Properties and may reduce the amount of liquidating distributions our stockholders receive and their overall return on investment.
Because of the Property Manager’s experience with managing the bank branch and bank-related properties that make up the majority of the GKK Properties, we depend upon the Property Manager to manage and conduct the operations of the GKK Properties and any adverse changes in or termination of our relationship with the Property Manager could reduce the amount of net proceeds from liquidation we receive from the GKK Properties and reduce the amount of liquidating distributions our stockholders receive and their overall return on investment.
Prior to the transfers of the GKK Properties to us under the Settlement Agreement, GKK Stars and its affiliates indirectly owned and managed the GKK Properties and thus have developed experience and expertise in the management and operations of bank branch and bank-related properties. As of the effective date of the Settlement Agreement, GKK Stars agreed to provide standard asset management services relating to the GKK Properties. On December 19, 2013, we, through an indirect wholly owned subsidiary (“KBS Acquisition Sub”), entered into an amended and restated asset management services agreement (the “Amended Services Agreement”) with GKKRA with respect to the GKK Properties. The effective date of the Amended Services Agreement was December 1, 2013. Pursuant to the Amended Services Agreement, GKKRA agreed to provide, among other services: standard asset management services, assistance related to dispositions, accounting services and budgeting and business plans for the GKK Properties (the “Services”). As compensation for the Services, we agreed to pay GKKRA: (i) an annual fee of $7.5 million plus all GKK Property-related expenses incurred by GKKRA, (ii) subject to certain terms and conditions in the Amended Services Agreement, a profit participation interest based on a percentage (ranging from 10% to 30%) of the amount by which the gross fair market value or gross sales price of certain identified portfolios of GKK Properties exceeds the sum of (a) an agreed-upon baseline value for such GKK Property portfolios plus (b) new capital expended to increase the value of GKK Properties within the portfolios and expenditures made to pay for tenant improvements and leasing commissions related to these GKK Properties as of the measurement date, and (iii) a monthly construction oversight fee equal to a percentage of construction costs for certain construction projects at the GKK Properties overseen by GKKRA.
On June 29, 2016, KBS Acquisition Sub entered into two agreements, a second amended and restated asset management services agreement (the “Second Amended Services Agreement”) and an accounting/construction services agreement (the “Accounting/Construction Services Agreement” and, together with the Second Amended Services Agreement, the “GKK Agreements”), with GKKRA. The effective date of the GKK Agreements was June 1, 2016. Combined, the Services and the key terms and compensation for the Services under the GKK Agreements are the same as those of the prior Amended Services Agreement; the GKK Agreements allocate the Services and the compensation between asset management services and accounting/construction services. On June 29, 2016, GKKRA assigned the Second Amended Services Agreement to an affiliate, GPT. Neither the Property Manager nor Gramercy is affiliated with us or KBS Acquisition Sub.
20
On November 17, 2016, KBS Acquisition Sub entered into an amendment to the Second Amended Services Agreement with GPT (the “First Amendment to Second Amended Services Agreement”) and an amendment to the Accounting/Construction Services Agreement with GKKRA (the “First Amendment to Accounting/Construction Services Agreement”) to, among other changes, (i) extend the termination date of the GKK Agreements from December 31, 2016 to March 31, 2017, at which point we do not anticipate that GKK Properties will make up a significant percentage of our assets and (ii) reduce the base management fee for the Services from $625,000 per month to $550,000 per month plus GKK Property-related expenses incurred by GPT for the period commencing on January 1, 2017 through March 31, 2017. In addition, we agreed to pay GPT an amount equal to $1.0 million upon termination of a leasehold interest of a property located in downtown St. Petersburg, Florida.
We depend on the Property Manager to efficiently conduct the management and operations of the GKK Properties. If the GKK Agreements are terminated prior to the sale of substantially all of the GKK Properties, we would be required to obtain such management services for the GKK Properties from other sources, which sources may not have the experience or capabilities of the Property Manager or its affiliates. Additionally, as our advisor has limited experience operating bank branch properties, should the Property Manager or an affiliate cease managing the GKK Properties, our ability to efficiently and effectively manage the GKK Properties would be affected, the amount of net proceeds from liquidation we receive from the GKK Properties could be reduced, and result in a reduction in the amount of liquidating distributions our stockholders receive and their overall return on investment.
We may not generate sufficient operating cash flow on a quarterly basis to fund our operations or for future capital needs.
Our portfolio has experienced declines in cash flow from a number of our investments. A general decline in the occupancy of our portfolio has resulted in lower current cash flow. Tenant-specific issues, including bankruptcy and downsizing, resulted in decreases in our operating cash flow because these tenants have terminated their leases early, not renewed their leases or have not paid their contractual rent to us. Possible future declines in rental rates, slower or potentially negative net absorption of leased space and expectations of increases in future rental concessions, including three or more months of free rent to retain tenants who are up for renewal or to sign new tenants, may result in additional decreases in cash flow. In addition, we experienced a decline in cash flow from our real estate-related investments, as some borrowers under our loans have been unable to make contractual interest payments to us. In particular, our investments in mezzanine and mortgage loans were impacted as the operating performance and values of buildings directly or indirectly securing our investment positions decreased from the date of our acquisition or origination of these investments. In such instances, some of the borrowers have not been able to refinance their debt owed to us or sell the collateral at a price sufficient to repay our note balances in full when they become due. Asset sales from 2012 through 2016 have resulted in, and expected future asset sales related to the Plan of Liquidation will result in, further decreases in operating cash flow.
Due to these factors, we may not generate sufficient operating cash flow on a quarterly basis to fund our operations. Our projected cash flow from operations may not be sufficient to cover our capital expenditures. If our cash flow from operations deteriorates, we will be more dependent on asset sales to fund our operations and for our liquidity needs, including for future capital needs. When tenants do not renew their leases or otherwise vacate their space, we will often need to expend substantial funds for improvements to the vacated space in order to attract replacement tenants. Even when tenants do renew their leases we may agree to make improvements to their space as part of our negotiations. If we need additional capital in the future to improve or maintain our properties or for any other reason, we may have to obtain funding from sources other than our cash flow from operations, such as asset sales. If we are unable to meet future funding commitments or fund required capital expenditures, our tenants may take legal action against us. This, in turn, could reduce the amount of net proceeds from liquidation we receive and therefore reduce the amount of liquidating distributions our stockholders receive and their overall return on investment.
Under our charter, we are required to limit our total operating expenses to the greater of 2% of our average invested assets or 25% of our net income for the four most recently completed fiscal quarters, as these terms are defined in our charter, unless the conflicts committee has determined that such excess expenses were justified based on unusual and non-recurring factors. Operating expenses for the four fiscal quarters ended December 31, 2016 exceeded the charter-imposed limitation and the conflicts committee of our board of directors determined that these expenses were justified given the professional fees and expenses we incurred related to our exploration of the availability of strategic alternatives and the fees and expenses related to preparation and solicitation of proxies in connection with our stockholders’ approval of the Plan of Liquidation. As a result of pursuing the Plan of Liquidation we anticipate that we will continue to exceed this limitation each quarter throughout the liquidation process as we sell our assets and incur liquidation costs along with certain general and administrative costs that are somewhat fixed in nature and not entirely based on the size of the company. We considered these costs and expenses in determining the estimated range of net proceeds from liquidation, and as of March 28, 2017, we do not expect these costs and expenses to change the estimated range of net proceeds per share from the liquidation.
21
The loss of or the inability to retain or obtain key real estate and debt finance professionals at our advisor could delay or hinder implementation of our investment management strategy and the Plan of Liquidation, which could reduce the amount of liquidating distributions our stockholders receive and their overall return on investment.
Our success depends to a significant degree upon the contributions of Messrs. Bren, Hall, McMillan and Schreiber, each of whom would be difficult to replace. Neither we nor our advisor nor its affiliates have employment agreements with these individuals and they may not remain associated with us, our advisor or its affiliates. If any of these persons were to cease their association with us, our advisor or its affiliates, we may be unable to find suitable replacements and our operating results could suffer as a result. We do not intend to maintain key person life insurance on any person. We believe that our future success depends, in large part, upon our advisor’s and its affiliates’ ability to attract and retain highly skilled managerial, operational and marketing professionals. Competition for such professionals is intense, and our advisor and its affiliates may be unsuccessful in attracting and retaining such skilled individuals. Further, we have established strategic relationships with firms that have special expertise in certain services or detailed knowledge regarding real properties in certain geographic regions. Maintaining such relationships will be important for us to effectively compete with other investors for tenants and in the disposition of our assets in such regions. We may be unsuccessful in maintaining such relationships. If we lose or are unable to obtain the services of highly skilled professionals or do not establish or maintain appropriate strategic relationships, our ability to implement our investment management strategy and the Plan of Liquidation could be delayed or hindered, reducing the amount of liquidating distributions our stockholders receive and their overall return on investment.
Our stockholders may be adversely affected by the Indemnification Amendment.
Although we believe that the changes contained in one of the amendments to our charter approved by our stockholders on January 27, 2017 (the “Indemnification Amendment”) will improve our ability to retain and attract qualified directors and officers and will further incentivize our advisor to continue to provide services to us under the advisory agreement throughout the liquidation process, the Indemnification Amendment does increase the risk that we and our stockholders will not be able to recover monetary damages from our directors if they fail to meet the statutory standard of conduct or from our officers if they fail to satisfy their duties under Maryland law. The Indemnification Amendment provides for (i) the expansion of our exculpation and indemnification of our present and former directors and officers to the maximum extent permitted by Maryland law; (ii) the expansion of our obligation to advance defense expenses to a present or former director or officer to the maximum extent permitted by Maryland law; and (iii) the elimination of conditions and limits on our ability to exculpate and indemnify our advisor and its affiliates or advance defense expenses to our advisor and its affiliates. The reduced ability to recover from our present and former directors and officers and our advisor and its affiliates and the increased right to indemnification is true not only for their future acts or omissions but also for acts or omissions that occurred prior to the date of the amendment to our charter reflected in the Indemnification Amendment. The Indemnification Amendment also increases the risk that we will incur significant defense costs that would otherwise have to be borne by our present and former directors or officers or our advisor or its affiliates.
We face risks associated with security breaches through cyber-attacks, cyber intrusions or otherwise, as well as other significant disruptions of our information technology (IT) networks and related systems.
We face risks associated with security breaches, whether through cyber-attacks or cyber intrusions over the Internet, malware, computer viruses, attachments to e-mails, persons inside our organization or persons with access to systems inside our organization, and other significant disruptions of our IT networks and related systems. The risk of a security breach or disruption, particularly through cyber-attack or cyber intrusion, including by computer hackers, foreign governments and cyber terrorists, has generally increased as the number, intensity and sophistication of attempted attacks and intrusions from around the world have increased. Our IT networks and related systems are essential to the operation of our business and our ability to perform day-to-day operations. Although we make efforts to maintain the security and integrity of these types of IT networks and related systems, and we have implemented various measures to manage the risk of a security breach or disruption, there can be no assurance that our security efforts and measures will be effective or that attempted security breaches or disruptions would not be successful or damaging. Even the most well protected information, networks, systems and facilities remain potentially vulnerable because the techniques used in such attempted security breaches evolve and generally are not recognized until launched against a target, and in some cases are designed not to be detected and, in fact, may not be detected. Accordingly, we may be unable to anticipate these techniques or to implement adequate security barriers or other preventative measures, and thus it is impossible for us to entirely mitigate this risk.
22
A security breach or other significant disruption involving our IT networks and related systems could:
• | disrupt the proper functioning of our networks and systems and therefore our operations; |
• | result in misstated financial reports, violations of loan covenants and/or missed reporting deadlines; |
• | result in our inability to properly monitor our compliance with the rules and regulations regarding our qualification as a REIT; |
• | result in the unauthorized access to, and destruction, loss, theft, misappropriation or release of, proprietary, confidential, sensitive or otherwise valuable information of ours or others, which others could use to compete against us or which could expose us to damage claims by third-parties for disruptive, destructive or otherwise harmful purposes and outcomes; |
• | require significant management attention and resources to remedy any damages that result; |
• | subject us to claims for breach of contract, damages, credits, penalties or termination of leases or other agreements; or |
• | damage our reputation among our stockholders. |
Any or all of the foregoing could have a material adverse effect on our results of operations, financial condition and cash flows.
Risks Related to Conflicts of Interest
KBS Capital Advisors and its affiliates, including all of our executive officers and some of our directors and other key real estate and debt finance professionals, face conflicts of interest caused by their compensation arrangements with us and with other KBS-sponsored programs, which could result in actions that are not in the best interests of our stockholders.
All of our executive officers and some of our directors and other key real estate and debt finance professionals are also officers, directors, managers, key professionals and/or holders of a direct or indirect controlling interest in our advisor, KBS Capital Markets Group LLC, the entity that acted as our dealer manager, and/or other KBS-affiliated entities. KBS Capital Advisors and its affiliates receive substantial fees from us. These fees could influence our advisor’s advice to us as well as the judgment of its affiliates. Among other matters, these compensation arrangements could affect their judgment with respect to:
• | the continuation, renewal or enforcement of our agreements with KBS Capital Advisors and its affiliates, including the advisory agreement; and |
• | sales of properties and other investments, which may entitle KBS Capital Advisors to disposition fees. |
In addition, the fees our advisor receives in connection with the management of our assets are based on the cost of the investment, and not based on the quality of the investment or the quality of the services rendered to us.
KBS Capital Advisors faces conflicts of interest relating to the leasing and disposition of properties and such conflicts may not be resolved in our favor, which could reduce the amount of liquidating distributions our stockholders receive and their overall return on investment.
We and other KBS-sponsored programs and KBS-advised investors rely on our sponsors and other key real estate professionals at our advisor, including Messrs. Bren, Hall, McMillan and Schreiber, to supervise the property management and leasing of properties. If the KBS team of real estate professionals directs creditworthy prospective tenants to properties owned by another KBS-sponsored program or KBS-advised investor when they could direct such tenants to our properties, our tenant base may have more inherent risk and our properties’ occupancy may be lower than might otherwise be the case.
In addition, we and other KBS-sponsored programs and KBS-advised investors rely on our sponsors and other key real estate professionals at our advisor to sell our properties. These KBS-sponsored programs and KBS-advised investors may possess properties in similar locations and/or of the same property types as ours and may be attempting to sell these properties at the same time we are attempting to sell some of our properties. If our advisor directs potential purchasers to properties owned by another KBS-sponsored program or KBS-advised investor when it could direct such purchasers to our properties, we may be unable to sell some or all of our properties at the time or at the price we otherwise would, which could reduce the amount of liquidating distributions our stockholders receive and their overall return on investment.
23
Our sponsors, our officers, our advisor and the real estate, debt finance, management and accounting professionals assembled by our advisor face competing demands on their time and this may cause our operations to suffer and delay the implementation of the Plan of Liquidation.
We rely on our sponsors, our officers, our advisor and the real estate, debt finance, management and accounting professionals that our advisor retains, including Messrs. Bren, Hall, McMillan, Schreiber and Jeffrey K. Waldvogel and Stacie K. Yamane, to provide services to us for the day-to-day operation of our business. KBS REIT II, KBS Strategic Opportunity REIT, KBS Legacy Partners Apartment REIT, KBS REIT III, KBS Strategic Opportunity REIT II, Inc. (“KBS Strategic Opportunity REIT II”) and KBS Growth & Income REIT, Inc. (“KBS Growth & Income REIT”) are also advised by KBS Capital Advisors and rely on our sponsors and many of the same real estate, debt finance, management and accounting professionals, as will future KBS-sponsored programs and KBS-advised investors. Further, our officers and directors are also officers and/or directors of some or all of the other public KBS-sponsored programs. Messrs. Bren, Hall, Schreiber and Waldvogel and Ms. Yamane are also executive officers of KBS REIT II, KBS REIT III and KBS Growth & Income REIT and Mr. McMillan is also an executive officer of KBS REIT II and KBS REIT III. Messrs. Hall, McMillan and Waldvogel and Ms. Yamane are executive officers of KBS Strategic Opportunity REIT and KBS Strategic Opportunity REIT II, and Messrs. Bren, McMillan and Waldvogel and Ms. Yamane are executive officers of KBS Legacy Partners Apartment REIT. In addition, Messrs. Bren and Schreiber and Ms. Yamane are executive officers of KBS Realty Advisors and its affiliates, the advisors of private KBS-sponsored programs and the investment advisors to KBS-advised investors. As a result of their interests in other KBS-sponsored programs, their obligations to KBS-advised investors and the fact that they engage in and will continue to engage in other business activities, on behalf of themselves and others, Messrs. Bren, Hall, McMillan, Schreiber and Waldvogel and Ms. Yamane face conflicts of interest in allocating their time among us, KBS REIT II, KBS REIT III, KBS Strategic Opportunity REIT, KBS Legacy Partners Apartment REIT, KBS Strategic Opportunity REIT II, KBS Growth & Income REIT, KBS Capital Advisors, other KBS-sponsored programs and KBS-advised investors, as well as other business activities in which they are involved. In addition, our advisor and KBS Realty Advisors and their affiliates share many of the same key real estate, management and accounting professionals. During times of intense activity in other programs and ventures, these individuals may devote less time and fewer resources to our business than are necessary or appropriate to manage our business or to implement the Plan of Liquidation. Furthermore, some or all of these individuals may become employees of another KBS-sponsored program in an internalization transaction or, if we internalize our advisor, may not become our employees as a result of their relationship with other KBS-sponsored programs. If these events occur, the amount of liquidating distributions our stockholders receive and their overall return on investment may decline. For additional information relating to demands on the time on our advisor’s real estate, debt finance, management and accounting professionals relating to our liquidation and strategic alternatives being pursued by certain other KBS-sponsored REITs, see “ - Risks Relating to the Plan of Liquidation.”
All of our executive officers, some of our directors and the key real estate and debt finance professionals assembled by our advisor face conflicts of interest related to their positions and/or interests in KBS Capital Advisors and its affiliates, which could hinder our ability to implement our business strategy and the Plan of Liquidation.
All of our executive officers and some of our directors and the key real estate and debt finance professionals assembled by our advisor are also executive officers, directors, managers, key professionals and/or holders of a direct or indirect controlling interest in our advisor and other KBS-affiliated entities. Through KBS-affiliated entities, some of these persons also serve as the investment advisors to KBS-advised investors and, through KBS Capital Advisors and KBS Realty Advisors, these persons serve as the advisor to KBS REIT II, KBS Strategic Opportunity REIT, KBS Legacy Partners Apartment REIT, KBS REIT III, KBS Strategic Opportunity REIT II, KBS Growth & Income REIT and other KBS-sponsored programs. As a result, they owe fiduciary duties to each of these entities, their members and limited partners and their investors, which fiduciary duties may from time to time conflict with the fiduciary duties that they owe to us and our stockholders. Their loyalties to these other entities and investors could result in action or inaction that is detrimental to our business, which could harm the implementation of our business strategy and our leasing opportunities. Further, Messrs. Bren, Hall, McMillan and Schreiber and existing and future KBS-sponsored programs and KBS-advised investors generally are not and will not be prohibited from engaging, directly or indirectly, in any business or from possessing interests in any other business venture or ventures, including businesses and ventures involved in the acquisition, development, ownership, leasing or sale of real estate investments. If we do not successfully implement our business strategy or the Plan of Liquidation, the amount of liquidating distributions our stockholders receive and their overall return on investment may be reduced.
24
Our board of directors’ loyalties to KBS REIT II, KBS REIT III, KBS Strategic Opportunity REIT, KBS Strategic Opportunity REIT II, KBS Growth & Income REIT and possibly to future KBS-sponsored programs could influence its judgment, resulting in actions that may not be in our stockholders’ best interest or that result in a disproportionate benefit to another KBS-sponsored program at our expense.
All of our directors are also directors of KBS REIT II and KBS REIT III and one of our directors is also a director of KBS Growth & Income REIT. One of our directors is also a director of KBS Strategic Opportunity REIT and KBS Strategic Opportunity REIT II. The loyalties of our directors serving on the boards of directors of KBS REIT II, KBS REIT III, KBS Strategic Opportunity REIT, KBS Strategic Opportunity REIT II, KBS Growth & Income REIT, or possibly on the boards of directors of future KBS-sponsored programs, may influence the judgment of our board of directors when considering issues for us that also may affect other KBS-sponsored programs. A decision of our board or the conflicts committee regarding the timing of property sales could be influenced by concerns that the sales would compete with those of other KBS-sponsored programs. We could enter into transactions with other KBS-sponsored programs, such as property sales or financing arrangements. Such transactions might entitle our advisor or its affiliates to fees and other compensation from both parties to the transaction. For example, property sales to other KBS-sponsored programs might entitle our advisor or its affiliates to acquisition fees in connection with its services to the purchaser in addition to disposition and other fees that we might pay to our advisor in connection with such transaction. Decisions of our board or the conflicts committee regarding the terms of those transactions may be influenced by our board’s or the conflicts committee’s loyalties to such other KBS-sponsored programs.
Because our independent directors are also independent directors of KBS REIT II and KBS REIT III, they receive compensation for service on the board of directors of KBS REIT II and KBS REIT III. Like us, KBS REIT II and KBS REIT III each pays each independent director an annual retainer of $40,000 as well as compensation for attending meetings as follows: (i) $2,500 for each board meeting attended, (ii) $2,500 for each conflicts or audit committee meeting attended (except that the committee chairman is paid $3,000 for each conflicts or audit committee meeting attended), (iii) $2,000 for each teleconference board meeting attended, and (iv) $2,000 for each teleconference conflicts or audit committee meeting attended (except that the committee chairman is paid $3,000 for each teleconference conflicts or audit committee meeting attended). Like us, KBS REIT II also pays each independent director compensation for attending special committee meetings as follows: (i) $2,000 for each special committee meeting attended (except that the meeting chairman is paid $3,000 for each special committee meeting attended), and (ii) $2,000 for each teleconference special committee meeting attended (except that the meeting chairman is paid $3,000 for each teleconference special committee meeting attended). In addition, like us, KBS REIT II and KBS REIT III each reimburses directors for reasonable out-of-pocket expenses incurred in connection with attendance at meetings of their boards of directors.
Risks Related to Our Corporate Structure
Ownership limitations may restrict change of control or business combination opportunities in which our stockholders might receive a premium for their shares.
In order for us to qualify as a REIT for each taxable year, no more than 50% in value of our outstanding capital stock may be owned, directly or indirectly, by five or fewer individuals during the last half of any calendar year. “Individuals” for this purpose include natural persons, and some entities such as private foundations. To preserve our REIT qualification, our charter generally prohibits any person from directly or indirectly owning more than 9.8% in value of our capital stock. This ownership limitation could have the effect of delaying, deferring or preventing a takeover or other transaction including an extraordinary transaction (such as a merger, tender offer or sale of all or substantially all of our assets), in which our stockholders might receive a premium for their shares over our estimated range of liquidating distributions or which stockholders might believe to be otherwise in their best interests.
Our charter permits our board of directors to issue stock with terms that may subordinate the rights of our common stockholders or discourage a third party from acquiring us in a manner that could result in a premium price to our stockholders.
Our board of directors may classify or reclassify any unissued common stock or preferred stock and establish the preferences, conversion or other rights, voting powers, restrictions, limitations as to dividends and other distributions, qualifications and terms or conditions of redemption of any such stock. Thus, our board of directors could authorize the issuance of preferred stock with priority as to distributions and amounts payable upon liquidation over the rights of the holders of our common stock. Such preferred stock could also have the effect of delaying, deferring or preventing a change in control of us, including an extraordinary transaction (such as a merger, tender offer or sale of all or substantially all of our assets) that might provide a premium price to our stockholders.
25
Our stockholders’ overall investment return may be reduced if we are required to register as an investment company under the Investment Company Act; if we or our subsidiaries become an unregistered investment company, we could not continue our business.
Neither we nor any of our subsidiaries intend to register as an investment company under the Investment Company Act. If we or any of our subsidiaries were obligated to register as an investment company, we would have to comply with a variety of substantive requirements under the Investment Company Act that impose, among other things:
• | limitations on capital structure; |
• | restrictions on specified investments; |
• | prohibitions on transactions with affiliates; and |
• | compliance with reporting, record keeping, voting, proxy disclosure and other rules and regulations that would significantly increase our operating expenses. |
Under the relevant provisions of Section 3(a)(1) of the Investment Company Act, an investment company is any issuer that:
• | pursuant to Section 3(a)(1)(A), is or holds itself out as being engaged primarily, or proposes to engage primarily, in the business of investing, reinvesting or trading in securities (the “primarily engaged test”); or |
• | pursuant to Section 3(a)(1)(C), is engaged or proposes to engage in the business of investing, reinvesting, owning, holding or trading in securities and owns or proposes to acquire “investment securities” having a value exceeding 40% of the value of such issuer’s total assets (exclusive of U.S. government securities and cash items) on an unconsolidated basis (the “40% test”). “Investment securities” excludes U.S. government securities and securities of majority-owned subsidiaries that are not themselves investment companies and are not relying on the exception from the definition of investment company under Section 3(c)(1) or Section 3(c)(7) (relating to private investment companies). |
We believe that neither we nor our Operating Partnership will be required to register as an investment company based on the following analysis. With respect to the 40% test, most of the entities through which we and our Operating Partnership own our assets are majority owned subsidiaries that are not themselves investment companies and are not relying on the exceptions from the definition of investment company under Section 3(c)(1) or Section 3(c)(7).
With respect to the primarily engaged test, we and our Operating Partnership are holding companies and do not intend to invest or trade in securities ourselves. Rather, through the majority-owned subsidiaries of our Operating Partnership, we and our Operating Partnership are primarily engaged in the non-investment company businesses of these subsidiaries, namely the business of purchasing or otherwise acquiring real estate and real estate-related assets.
If any of the subsidiaries of our Operating Partnership fail to meet the 40% test, we believe they will usually, if not always, be able to rely on Section 3(c)(5)(C) of the Investment Company Act for an exception from the definition of an investment company. (Otherwise, they should be able to rely on the exceptions for private investment companies pursuant to Section 3(c)(1) and Section 3(c)(7) of the Investment Company Act.) As reflected in no-action letters, the SEC staff’s position on Section 3(c)(5)(C) generally requires that an issuer maintain at least 55% of its assets in “mortgages and other liens on and interests in real estate,” or qualifying assets; at least 80% of its assets in qualifying assets plus real estate-related assets; and no more than 20% of the value of its assets in other than qualifying assets and real estate-related assets, which we refer to as miscellaneous assets. To constitute a qualifying asset under this 55% requirement, a real estate interest must meet various criteria based on no-action letters. We expect that each of the subsidiaries of our Operating Partnership relying on Section 3(c)(5)(C) will invest at least 55% of its assets in qualifying assets, and approximately an additional 25% of its assets in other types of real estate-related assets. If any subsidiary relies on Section 3(c)(5)(C), we expect to rely on guidance published by the SEC staff or on our analyses of guidance published with respect to types of assets to determine which assets are qualifying real estate assets and real estate-related assets.
26
Rapid changes in the values of our assets may make it more difficult for us to maintain our qualification as a REIT or our exception from the definition of an investment company under the Investment Company Act.
If the market value or income potential of our qualifying real estate assets changes as compared to the market value or income potential of our non-qualifying assets, or if the market value or income potential of our assets that are considered “real estate-related assets” under the Investment Company Act or REIT qualification tests changes as compared to the market value or income potential of our assets that are not considered “real estate-related assets” under the Investment Company Act or REIT qualification tests, whether as a result of increased interest rates, prepayment rates or other factors, we may need to modify our investment portfolio in order to maintain our REIT qualification or exception from the definition of an investment company. If the decline in asset values or income occurs quickly, this may be especially difficult, if not impossible, to accomplish. This difficulty may be exacerbated by the illiquid nature of many of the assets that we may own. We may have to make business decisions that we otherwise would not make absent REIT and Investment Company Act considerations.
Our stockholders will have limited control over changes in our policies and operations and the Plan of Liquidation, which increases the uncertainty and risks our stockholders face.
Our board of directors determines our major policies, including our policies regarding financing, debt capitalization, REIT qualification, distribution, and liquidation pursuant to the Plan of Liquidation. Our board of directors may amend or revise these and other policies and the Plan of Liquidation without a vote of the stockholders. Under MGCL and our charter, our stockholders have a right to vote only on limited matters. Our board’s broad discretion in setting policies and our stockholders’ inability to exert control over those policies increases the uncertainty and risks our stockholders face.
We have not had funds available for ordinary redemptions under our share redemption program since the April 2009 redemption date, and our share redemption program provides only for Special Redemptions. We currently do not expect to have funds available to resume ordinary redemptions in the future.
We have not had funds available for ordinary redemptions since the April 2009 redemption date, and our share redemption program provides only for Special Redemptions. Such redemptions are subject to an annual dollar limitation, which was $10.0 million in the aggregate for the calendar year 2016, and further subject to the limitations described in the share redemption program document. On January 27, 2017, our board of directors approved the same annual dollar limitation of $10.0 million in the aggregate for the calendar year 2017 (subject to review and adjustment during the year by our board of directors), and further subject to the limitations described in the share redemption program document. Based on historical redemption activity, we believe the $10.0 million redemption limitation for our calendar year 2017 will be sufficient for these Special Redemptions. During each calendar year, the annual dollar limitation for the share redemption program will be reviewed and adjusted from time to time. We currently do not expect to have funds available to resume ordinary redemptions in the future. Therefore, until further notice, and except with respect to Special Redemptions, stockholders will not be able to sell any of their shares back to us pursuant to our share redemption program. Our share redemption program includes numerous other restrictions that limit a stockholder’s ability to sell his or her shares. Further, we have no obligation to redeem shares if the redemption would violate the restrictions on distributions under Maryland law, which prohibits distributions that would cause a corporation to fail to meet statutory tests of solvency.
In connection with the approval by our stockholders of the Plan of Liquidation, on January 27, 2017, our board of directors approved the amendment and restatement of our share redemption program (the “Amended Share Redemption Program”). The Amended Share Redemption Program became effective on February 27, 2017. Prior to effectiveness of the Amended Share Redemption Program on February 27, 2017, the redemption price for all stockholders whose shares were eligible for redemption was equal to the most recent estimated value per share of our common stock as of the redemption date. The Amended Share Redemption Program changes the redemption price per share of our common stock eligible for redemption to take into account the estimated range of liquidating distributions as disclosed in our Definitive Proxy Statement, filed with the SEC on November 10, 2016 and any liquidating distributions declared by our board of directors. The Amended Share Redemption Program sets the redemption price per share of our common stock eligible for redemption at (a) $3.475 (which represents the mid-point of the estimated range of liquidating distributions of $3.27 to $3.68 per share) less (b) the amount of any liquidating distributions on such share declared by our board of directors that have a record date prior to the redemption date for such share. Pursuant to the Plan of Liquidation, on March 10, 2017, our board of directors authorized an initial liquidating distribution in the amount of $1.00 per share of common stock to our stockholders of record as of the close of business on March 21, 2017. The initial liquidating distribution was paid on March 24, 2017 and was funded from proceeds from asset sales. Therefore, effective commencing with the March 31, 2017 redemption date, the redemption price for all shares eligible for redemption will be equal to $2.475. We will report the redemption price in a Current Report on Form 8-K or in our annual or quarterly reports, all publicly filed with the SEC. Also pursuant to the Amended Share Redemption Program, our board of directors may amend, suspend or terminate our share redemption program on 10 days’ notice.
If stockholders are able to sell their shares under our share redemption program, they may not recover the amount of their investment in us.
27
Payment of fees to KBS Capital Advisors and its affiliates reduces the amount of liquidating distributions our stockholders receive and their overall return on investment.
KBS Capital Advisors and its affiliates performed services for us in connection with the selection and acquisition or origination of our investments and continue to perform services for us in connection with the management, leasing and disposition of our assets and perform services pursuant to the Plan of Liquidation. We pay them substantial fees for these services, which results in immediate dilution of the value of our stockholders’ investment in us.
Disposition fees and asset management fees reduce the amount of liquidating distributions our stockholders receive and their overall return on investment. For information relating to fees potentially payable to our affiliates in connection with the implementation of the Plan of Liquidation, see “ - Risks Relating to the Plan of Liquidation.”
Our stockholders may be more likely to sustain a loss on their investment because our sponsors do not have as strong an economic incentive to avoid losses as do sponsors who have made significant equity investments in their companies.
Our sponsors have only invested $200,000 in us through the purchase of 20,000 shares of our common stock at $10.00 per share. Our sponsors have little exposure to loss in the value of our shares. With this limited exposure, our stockholders may be at a greater risk of loss because our sponsors do not have as much to lose from a decrease in the value of our shares as do those sponsors who make more significant equity investments in their companies.
General Risks Related to Investments in Real Estate
Economic, market and regulatory changes that impact the real estate market generally may decrease the value of our investments, weaken our operating results and reduce the amount of liquidating distributions our stockholders receive and their overall return on investment.
Our operating results and the performance of our properties are subject to the risks typically associated with real estate, any of which could decrease the value of our investments and could weaken our operating results, including:
• | downturns in national, regional and local economic conditions; |
• | competition from other office, industrial and bank branch buildings; |
• | adverse local conditions, such as oversupply or reduction in demand for office, industrial and bank branch buildings and changes in real estate zoning laws that may reduce the desirability of real estate in an area; |
• | vacancies, changes in market rental rates and the need to periodically repair, renovate and re-let space; |
• | changes in interest rates and the availability of permanent mortgage financing, which may render the sale of a property or loan difficult or unattractive; |
• | changes in tax (including real and personal property tax), real estate, environmental and zoning laws; |
• | natural disasters such as hurricanes, earthquakes and floods; |
• | acts of war or terrorism, including the consequences of terrorist attacks, such as those that occurred on September 11, 2001; |
• | the potential for uninsured or underinsured property losses; and |
• | periods of high interest rates and tight money supply. |
Any of the above factors, or a combination thereof, could result in a decrease in our cash flow from operations and a decrease in the value of our investments, which would have an adverse effect on our operations and reduce the amount of liquidating distributions our stockholders receive and their overall return on investment.
28
Since the acquisition of our real estate and real estate-related investments, downturns in national, regional and local economic conditions impacted our properties’ operating performance and the operating performance of properties securing our real estate-related investments, which will reduce the amount of liquidating distributions our stockholders receive and their overall return on investment.
Our portfolio experienced declines in cash flow from a number of our investments. A general decline in the occupancy of our portfolio, an important element to the continued growth of the value of our portfolio, resulted in lower current cash flow. Tenant-specific issues, including bankruptcy and downsizing, resulted in decreases in our operating cash flow because these tenants terminated their leases early, did not renew their leases or did not pay their contractual rent to us. Possible future declines in rental rates, slower or potentially negative net absorption of leased space and expectations of increases in future rental concessions, including three or more months of free rent to retain tenants who are up for renewal or to sign new tenants, may result in additional decreases in cash flow. In addition, we experienced a decline in cash flow from our real estate-related investments, as some borrowers under our loans have been unable to make contractual interest payments to us. In particular, our investments in mezzanine and mortgage loans were impacted as the operating performance and values of buildings directly or indirectly securing our loan investments decreased from the date of our acquisition or origination of these investments. In such instances, some of the borrowers have not been able to refinance their debt owed to us or sell the collateral at a price sufficient to repay our note balances in full when they become due.
Because of the concentration of a significant portion of our assets in Virginia and Missouri, any adverse economic, real estate or business conditions in Virginia or Missouri could adversely affect our operating results and reduce the amount of liquidating distributions our stockholders receive and their overall return on investment.
As of December 31, 2016, our real estate investments in Virginia and Missouri, excluding properties held for sale, represented 18.6% and 10.5% of our total assets, respectively. As a result, the geographic concentration of our portfolio makes it particularly susceptible to adverse economic developments in the Virginia and Missouri real estate markets. Any adverse economic or real estate developments in these markets, such as business layoffs or downsizing, industry slowdowns, relocations of businesses, changing demographics and other factors, or any decrease in demand for office or bank space resulting from the local business climate, could adversely affect our operating results and reduce the amount of liquidating distributions our stockholders receive and their overall return on investment.
Properties that have significant vacancies could be difficult to sell, which could diminish the return on these properties and adversely affect our cash flows and our stockholders’ overall return.
A property may incur vacancies either by the expiration and non-renewal of tenant leases or the continued default of tenants under their leases. If vacancies continue for a long period of time, we may suffer reduced revenues, which would adversely affect our cash flows. In addition, the resale value of the property could be diminished because the market value of a particular property depends principally upon the value of the cash flow generated by the leases associated with that property. Such a reduction in the resale value of a property could also reduce the value of our stockholders’ investment. As of December 31, 2016, our portfolio (excluding properties that were held for sale) consisted of approximately 3.0 million rentable square feet and was 88% occupied, and our bad debt reserve for our properties was less than 1% of annualized base rent.
We depend on tenants for our revenue generated by our real estate investments and, accordingly, our stockholders’ overall return is partially dependent upon the success and economic viability of our tenants and our ability to retain and attract tenants. Non-renewals, terminations or lease defaults could reduce our net income and reduce our stockholders’ overall return.
The success of our real estate investments materially depends upon the financial stability of the tenants leasing the properties we own. The inability of a single major tenant or a significant number of smaller tenants to meet their rental obligations would lower our net income. A non-renewal after the expiration of a lease term, termination or default by a tenant on its lease payments to us would cause us to lose the revenue associated with such lease and require us to find an alternative source of revenue to meet mortgage payments and prevent a foreclosure if the property is subject to a mortgage. In the event of a tenant default or bankruptcy, we may experience delays in enforcing our rights as landlord of a property and may incur substantial costs in re-leasing the property. Tenants may have the right to terminate their leases upon the occurrence of certain customary events of default and, in other circumstances, may not renew their leases or, because of market conditions, may only be able to renew their leases on terms that are less favorable to us than the terms of their initial leases. When tenants exercise early termination rights, our cash flow and earnings will be adversely affected to the extent that we are unable to generate an equivalent amount of net rental income by leasing the vacated space to new third party tenants.
29
Further, some of our properties may be outfitted to suit the particular needs of the tenants. We may have difficulty replacing the tenants of these properties if the outfitted space limits the types of businesses that could lease that space without major renovation. If a tenant does not renew a lease, or terminates or defaults on a lease, we may be unable to lease the property for the rent previously received or sell the property without incurring a loss as described above. See also “ — General Risks Related to Investments in Real Estate — Bank branches are specialty-use properties and therefore may be more difficult to lease or sell to non-banks.”
We may be required to reimburse tenants for overpayments of estimated operating expenses.
Under certain of our leases, tenants reimburse us for their proportionate share of the costs we incur to manage, operate and maintain the buildings and properties where they rent space. These leases often limit the types and amounts of expenses we can pass through to our tenants and allow the tenants to audit and contest our determination of the operating expenses they are required to pay. Given the complexity of certain operating expense reimbursement calculations, tenant audit rights under large portfolio leases can remain unresolved for several years. For example, Bank of America, a tenant that leases a significant amount of space in our real estate portfolio, is still auditing certain categories of operating expenses for the 2007 and subsequent lease years. If, as a result of a tenant audit, it is determined that we have been reimbursed more than we were permitted to collect under a lease, we must refund the excess amount back to the tenant and, sometimes, also reimburse the tenant for its audit costs. Additionally, because we acquired the GKK Properties pursuant to the Settlement Agreement, we were not able to perform standard diligence on the properties and as such, we may not be aware of possible excess reimbursements made to the prior owners. As of December 31, 2016, we had recorded liabilities of approximately $2.0 million related to certain claimed amounts relating to tenant reimbursement audits. Any unexpected refund payments could materially adversely affect our financial condition and results of operations and reduce the amount of liquidating distributions our stockholders receive and their overall return on investment.
The bankruptcy or insolvency of our tenants or delays by our tenants in making rental payments could seriously harm our operating results and could reduce the amount of liquidating distributions our stockholders receive and their overall return on investment.
Any bankruptcy filing by or relating to a tenant could bar us from collecting pre-bankruptcy debts from that tenant, unless we receive an order permitting us to do so from the bankruptcy court. A tenant bankruptcy could delay our efforts to collect past due balances under the relevant leases, and could ultimately preclude full collection of these sums. If a lease is rejected by a tenant in bankruptcy, we would have only a general unsecured claim for damages. Any unsecured claim we hold against a bankrupt entity may be paid only to the extent that funds are available and only in the same percentage as is paid to all other holders of unsecured claims. We may recover substantially less than the full value of any unsecured claims, which would harm our financial condition.
Many tenants in the GKK Properties are banks that are not eligible to be debtors under the federal bankruptcy code, but would be subject to the liquidation and insolvency provisions of applicable banking laws and regulations. If the FDIC were appointed as receiver of a banking tenant because of that tenant’s insolvency, we would become an unsecured creditor of the tenant and only be entitled to share with the other unsecured non-depositor creditors in the tenant’s assets on an equal basis after payment to the depositors of their claims. The FDIC has broad powers to reject any contract (including a lease) of a failed depository institution that the FDIC deems burdensome if the FDIC determines that such rejection is necessary to promise the orderly administration of the institution’s affairs. By federal statute, a landlord under a lease rejected by the FDIC is not entitled to claim any damages with respect to the disaffirmation, other than rent through the effective date of the disaffirmation. The amount paid on claims with respect to the lease would depend on, among other factors, the amount of assets of the insolvent tenant available for unsecured claims. We may recover substantially less than the full value of any unsecured claims, which could have a material adverse effect on our operating results, and could reduce the amount of liquidating distributions our stockholders receive and their overall return on investment.
The terms of the Settlement Agreement required us to take ownership of certain leasehold interests in various GKK Properties under which the amount of rent we pay to the property owner may exceed the rental income we receive from tenants.
Under the Settlement Agreement, we were required to assume leasehold interests that we otherwise likely would not have elected to assume. Such leasehold interests relate to properties we do not own, but under which we lease space from the property owner and then sub-lease this space to various tenants. In certain cases the rent that we are required to pay to the owner of the property exceeds the rental income that we receive from the various tenants. Such negative cash flow may continue throughout the life of the lease.
30
Our inability to sell a property at the time and on the terms we want could reduce the amount of liquidating distributions our stockholders receive and their overall return on investment.
Many factors that are beyond our control affect the real estate market and could affect our ability to sell properties for the price, on the terms or within the time frame that we desire. These factors include general economic conditions, the availability of financing, interest rates and other factors, including supply and demand. Further, before we can sell a property on the terms we want, it may be necessary to expend funds to correct defects or to make improvements. However, we can give no assurance that we will have the funds available to correct such defects or to make such improvements. We may be unable to sell our properties at a profit. Our inability to sell properties at the time and on the terms we want could reduce the amount of liquidating distributions our stockholders receive and their overall return on investment.
As a result of the transfers of the GKK Properties, a significant portion of our properties are leased to financial institutions, making us more economically vulnerable in the event of a downturn in the banking industry.
Because of the transfers of the GKK Properties, a significant portion of our revenue is derived from leases to financial institutions and as such, our portfolio has become less diversified. As of December 31, 2016, 24.4% of our annualized base rent was generated by leases to financial institutions. Individual banks, as well as the banking industry in general, may be adversely affected by negative economic and market conditions throughout the United States or in the local economies in which regional or community banks operate. Acquisitions of regional or community banks by larger financial institutions could lead to the closure of some of the bank branches formerly occupied by these regional or community banks. In addition, changes in trade, monetary and fiscal policies and laws, including interest rate policies of the Board of Governors of the Federal Reserve System, may have an adverse impact on banks’ loan portfolios and allowances for loan losses. As a result, we may experience higher rates of lease default or terminations in the event of a downturn in the banking industry than we would if our tenant base were more diversified.
Husch Blackwell, a tenant in the Plaza in Clayton, represents a significant portion of the revenue generated by our real estate portfolio and the failure of this tenant to perform its obligations to us or to renew its leases upon expiration may adversely affect our cash flow and the returns to our stockholders.
As of December 31, 2016, Husch Blackwell, a tenant in the Plaza in Clayton, represented approximately 12.0% of our real estate portfolio’s base rental income and occupied approximately 7.4% of our total rentable square feet. The default, financial distress or insolvency of Husch Blackwell, or its failure to renew its lease with us upon expiration, could cause interruptions in the receipt of lease revenue from this tenant and the property that it occupies and/or result in vacancy, which would reduce our revenue and increase operating costs until the affected property is leased, and could decrease the ultimate value of the affected property upon sale. We may be unable to lease the vacant property at a comparable lease rate or at all, which could affect our operating results and financial condition as well as the returns to our stockholders. See Note 3, “Real Estate Held for Investment — Operating Leases” in the notes to our consolidated financial statements filed herewith.
Should GKK Stars or any of its affiliates declare bankruptcy or otherwise become the subject of an involuntary bankruptcy proceeding, our ability to indirectly retain title to or, with respect to a limited number of GKK Properties, indirectly retain a leasehold interest in, the GKK Properties would be threatened.
Any voluntary or involuntary bankruptcy filing by GKK Stars or any of its affiliates could have an adverse effect on our ability to indirectly retain title to or, with respect to a limited number of GKK Properties, indirectly retain a leasehold interest in, the GKK Properties, including the following:
• | Any transfers to us of equity interests in the entities owning the GKK Properties made within up to six years prior to a filing under some state bankruptcy codes potentially could be voided by a bankruptcy court as fraudulent transfers. If any such transfers are voided, it is possible that our liens on the GKK Properties subject to those transfers may not reattach with their existing priority. |
• | A bankruptcy court could reject the Settlement Agreement, which could release GKK Stars from having to satisfy any of its remaining obligations under the Settlement Agreement. |
• | The automatic stay imposed in certain bankruptcy actions would limit our, among other parties to the Settlement Agreement, ability to enforce the terms of the Settlement Agreement against parties with respect to whom there has been a bankruptcy filing, including preventing the exercise of remedies under the Settlement Agreement without prior bankruptcy court approval following notice and a hearing. |
31
Costs imposed pursuant to laws and governmental regulations may reduce the amount of liquidating distributions our stockholders receive and their overall return on investment.
Real property and the operations conducted on real property are subject to federal, state and local laws and regulations relating to protection of the environment and human health. We could be subject to liability in the form of fines, penalties or damages for noncompliance with these laws and regulations. These laws and regulations generally govern wastewater discharges, air emissions, the operation and removal of underground and above-ground storage tanks, the use, storage, treatment, transportation and disposal of solid and hazardous materials, the remediation of contamination associated with the release or disposal of solid and hazardous materials, the presence of toxic building materials, and other health and safety-related concerns.
Some of these laws and regulations may impose joint and several liability on the tenants, owners or operators of real property for the costs to investigate or remediate contaminated properties, regardless of fault, whether the contamination occurred prior to purchase, or whether the acts causing the contamination were legal. Our tenants’ operations, the condition of properties at the time we buy them, operations in the vicinity of our properties, such as the presence of underground storage tanks, or activities of unrelated third parties may affect our properties.
The presence of hazardous substances, or the failure to properly manage or remediate these substances, may hinder our ability to sell, rent or pledge such property as collateral for future borrowings. Any material expenditures, fines, penalties, or damages we must pay will reduce the amount of liquidating distributions our stockholders receive and their overall return on investment.
The cost of defending against claims of environmental liability, of complying with environmental regulatory requirements, of remediating any contaminated property, or of paying personal injury or other damage claims could reduce the amount of liquidating distributions our stockholders receive and their overall return on investment.
Under various federal, state and local environmental laws, ordinances and regulations, a current or previous real property owner or operator may be liable for the cost of removing or remediating hazardous or toxic substances on, under or in such property. These costs could be substantial. Such laws often impose liability whether or not the owner or operator knew of, or was responsible for, the presence of such hazardous or toxic substances. Environmental laws also may impose liens on property or restrictions on the manner in which property may be used or businesses may be operated, and these restrictions may require substantial expenditures or prevent us from entering into leases with prospective tenants that may be impacted by such laws. Environmental laws provide for sanctions for noncompliance and may be enforced by governmental agencies or, in certain circumstances, by private parties. Certain environmental laws and common law principles could be used to impose liability for the release of and exposure to hazardous substances, including asbestos-containing materials and lead-based paint. Third parties may seek recovery from real property owners or operators for personal injury or property damage associated with exposure to released hazardous substances and governments may seek recovery for natural resource damage. The cost of defending against claims of environmental liability, of complying with environmental regulatory requirements, of remediating any contaminated property, or of paying personal injury claims could reduce the amounts available for distribution to our stockholders.
Except for GKK Properties and other properties to which we took title to through foreclosure or deed-in-lieu of foreclosure, all of our direct real estate investments were subject to Phase I environmental assessments at the time they were acquired. Some of the properties we have acquired are subject to potential environmental liabilities arising primarily from historic activities at or in the vicinity of the properties.
Some of the properties in our portfolio had or have underground storage tanks either for space heating of the buildings, fueling motor vehicles, or industrial processes. Many of the underground storage tanks at the premises have been replaced over time. Given changing standards regarding closure of underground storage tanks and associated contamination, many of the tanks may not have been closed in compliance with current standards. Some of these properties likely have some residual petroleum or chemical contamination. Properties exhibiting these risks include 129 Concord Road, Billerica, Massachusetts (Rivertech).
Under the Settlement Agreement, we indirectly took title to or, with respect to a limited number of the GKK Properties, indirectly took a leasehold interest in, the GKK Properties on an “as is” basis. As such, we were not able to inspect the GKK Properties or conduct standard due diligence on certain of the GKK Properties before the transfers. Additionally, we did not receive representations, warranties and indemnities relating to the GKK Properties from Gramercy and/or its affiliates. Thus, the amount of net proceeds from liquidation we receive from the GKK Properties may be reduced if we subsequently discover environmental problems with the GKK Properties.
32
Costs associated with complying with the Americans with Disabilities Act may decrease the amount of liquidating distributions our stockholders receive and their overall return on investment.
Our properties may be subject to the Americans with Disabilities Act of 1990, as amended (the “Disabilities Act”). Under the Disabilities Act, all places of public accommodation are required to comply with federal requirements related to access and use by disabled persons. The Disabilities Act has separate compliance requirements for “public accommodations” and “commercial facilities” that generally require that buildings and services be made accessible and available to people with disabilities. The Disabilities Act’s requirements could require removal of access barriers and could result in the imposition of injunctive relief, monetary penalties or, in some cases, an award of damages. Any funds used for Disabilities Act compliance will reduce the amount of liquidating distributions our stockholders receive and their overall return on investment.
Uninsured losses relating to real property or excessively expensive premiums for insurance coverage could reduce our cash flows and the amount of liquidating distributions our stockholders receive and their overall return on investment.
There are types of losses, generally catastrophic in nature, such as losses due to wars, acts of terrorism, earthquakes, floods, hurricanes, pollution or environmental matters, that are uninsurable or not economically insurable, or may be insured subject to limitations, such as large deductibles or co-payments. Terrorist attacks or armed conflicts may directly impact the value of our properties through damage, destruction, loss or increased security costs. We have invested in major metropolitan markets. We may not be able to obtain insurance against the risk of terrorism because it may not be available or may not be available on terms that are economically feasible. The terrorism insurance that we obtain may not be sufficient to cover loss for damage to our properties as a result of terrorist attacks. Insurance risks associated with potential acts of terrorism could sharply increase the premiums we pay for coverage against property and casualty claims. We may be required to provide other financial support, either through financial assurances or self-insurance, to cover potential losses. We may not have adequate coverage for such losses. If any of our properties incurs a casualty loss that is not fully insured, the value of our assets will be reduced by any such uninsured loss, which will reduce the value of our stockholders’ investment. In addition, other than any working capital reserve or other reserves we may establish, we have extremely limited sources of funding to repair or reconstruct any uninsured property. Also, to the extent we must pay unexpectedly large amounts for insurance, we could suffer reduced earnings that would result in a reduction in the amount of liquidating distributions our stockholders receive and their overall return on investment.
Risks Related to Real Estate-Related Investments
Our real estate-related investments are subject to the risks typically associated with real estate.
Our investments in mezzanine loans and B-Notes are directly or indirectly secured by a lien on real property (or the equity interests in an entity that owns real property) that, upon the occurrence of a default on the loan, could result in our taking ownership of the property. The values of these properties may change after we acquire or originate the loans. If the values of the underlying properties drop, our risk will increase because of the lower value of the security associated with such loans. In this manner, real estate values could impact the values of our loan investments. Therefore, our real estate-related investments are subject to the risks typically associated with real estate, which are described above under the heading “— General Risks Related to Investments in Real Estate.”
Our investments in real estate-related loans are subject to interest rate fluctuations that affect our returns as compared to market interest rates; accordingly, a portion of our stockholders’ overall return is subject to fluctuations in interest rates.
With respect to our fixed rate loans receivable, if interest rates rise, the loans could yield a return that is lower than then-current market rates. If interest rates decrease, we will be adversely affected to the extent that loans are prepaid because we would no longer receive the revenue generated by those loans. For this reason, our returns on these loans and our stockholders’ overall return are subject to fluctuations in interest rates.
33
Our mezzanine loan and B-Note investments are subject to delinquency, foreclosure and loss, which could result in losses to us.
Commercial real estate loans generally are secured by commercial real estate properties and are subject to risks of delinquency and foreclosure. The ability of a borrower to repay a loan secured by an income-producing property typically is dependent primarily upon the successful operation of such property rather than upon the existence of independent income or assets of the borrower. If the net operating income of the property is reduced, the borrower’s ability to repay the loan may be impaired. Net operating income of an income-producing property can be affected by, among other things: tenant mix, success of tenant businesses, occupancy rates, property management decisions, property location and condition, competition from comparable types of properties, changes in laws that increase operating expenses or limit rents that may be charged, any need to address environmental contamination at the property, the occurrence of any uninsured casualty at the property, changes in national, regional or local economic conditions and/or specific industry segments, declines in regional or local real estate values, declines in regional or local rental or occupancy rates, increases in interest rates, real estate tax rates and other operating expenses, changes in governmental rules, regulations and fiscal policies (including environmental legislation), natural disasters, terrorism, social unrest and civil disturbances.
In the event of any default under a real estate-related loan held by us, we will bear a risk of loss of principal and accrued interest to the extent of any deficiency between the value of the collateral and the principal and accrued interest of the real estate-related loan, which could have a material adverse effect on our cash flow from operations. Foreclosure on a property securing a real estate-related loan can be an expensive and lengthy process that could have a substantial negative effect on our anticipated return on the investment.
Our mezzanine loan investment involves greater risks of loss than senior loans secured by the same properties.
Our mezzanine loan investment takes the form of a subordinated loan secured by a pledge of the ownership interests of the entity owning (directly or indirectly) the real property. These types of investments may involve a higher degree of risk than long-term senior mortgage lending secured by income-producing real property because the investment may become unsecured as a result of foreclosure by the senior lender. In the event of a bankruptcy of the entity providing the pledge of its ownership interests as security, we may not have full recourse to the assets of such entity, or the assets of the entity may not be sufficient to satisfy our mezzanine loan. Subsequent to December 31, 2016, the borrower under the Sandmar Mezzanine Loan defaulted and as a result, we will not recover all of our investment in that loan. In addition, mezzanine loans may have higher loan-to-value ratios than conventional mortgage loans, resulting in less equity in the real property and increasing the risk of loss of principal.
Our investments in B-Notes may be subject to additional risks relating to the privately negotiated structure and terms of the transaction, which may result in losses to us.
We own two B-Notes. A B-Note is a mortgage loan typically (i) secured by a first mortgage on a single large commercial property or group of related properties and (ii) subordinated to an A-Note secured by the same first mortgage on the same collateral. As a result, if a borrower defaults, there may not be sufficient funds remaining for B-Note holders after payment to the A-Note holders. Since each transaction is privately negotiated, B-Notes can vary in their structural characteristics and risks including, for example, the rights of holders of B-Notes to control the process following a borrower default may be limited.
Our investments in subordinated loans may be subject to losses.
We have invested in subordinated loans, such as mezzanine loans and B-Notes. In the event a borrower defaults on a subordinated loan and lacks sufficient assets to satisfy our loan, we may suffer a loss of principal or interest. In the event a borrower declares bankruptcy, we may not have full recourse to the assets of the borrower, or the assets of the borrower may not be sufficient to satisfy the loan. If a borrower defaults on our loan or on debt senior to our loan, or in the event of a borrower bankruptcy, our loan will be satisfied only after the senior debt is paid in full. Where debt senior to our loan exists, the presence of intercreditor arrangements may limit our ability to amend our loan documents, assign our loans, accept prepayments, exercise our remedies (through “standstill periods”), and control decisions made in bankruptcy proceedings relating to borrowers. In addition, the mezzanine loan we own is particularly illiquid due to its short life, its unsuitability for securitization and the greater difficulty of recoupment in the event of the borrower’s default.
We depend on borrowers for the revenue generated by our real estate-related investments and, accordingly, such revenue and the returns to our stockholders are partially dependent upon the success and economic viability of such borrowers.
The revenues generated by our real estate-related investments materially depends on the financial stability of the borrowers under such investments. The inability of a single major borrower or a number of smaller borrowers to meet their payment obligations could result in reduced revenue or losses for us. In the event of default or bankruptcy, we may experience delays in enforcing our rights as a creditor, and such rights may be subordinated to the rights of other creditors. Subsequent to December 31, 2016, the borrower under the Sandmar Mezzanine Loan defaulted.
34
Our loan loss reserve may not be sufficient to cover losses on loans.
Our asset-specific loan loss reserve relates to reserves for losses on loans considered impaired. We consider a loan to be impaired when, based upon current information and events, we believe that it is probable that we will be unable to collect all amounts due under the contractual terms of the loan documents. We also consider a loan to be impaired if we grant the borrower a concession through a modification of the loan terms or if we expect to receive assets (including equity interests in the borrower) in partial satisfaction of the loan. A reserve is established when the present value of payments expected to be received, observable market prices, the estimated fair value of the collateral (for loans that are dependent on the collateral for repayment) or amounts expected to be received in partial satisfaction of an impaired loan are lower than the carrying value of that loan. A portfolio-based loan loss reserve is a reserve against all of the loans in our portfolio that are not specifically reserved. It is based on estimated probabilities of both term and maturity default and estimated loss severities for the portfolio. Our provision for loan losses of $5.1 million, all of which related to asset-specific loan loss reserves as of December 31, 2016, may not be sufficient to cover losses on our loan investments.
Federal Income Tax Risks
In addition to the following risk factors, please see “ — Risks Related to the Plan of Liquidation” for information relating to tax risks associated with the Plan of Liquidation.
Failure to qualify as a REIT would reduce our net earnings available for distribution.
Our qualification as a REIT will depend upon our ability to meet requirements regarding our organization and ownership, distributions of our income, the nature and diversification of our income and assets and other tests imposed by the Internal Revenue Code. If we fail to qualify as a REIT for any taxable year after electing REIT status, we will be subject to federal income tax on our taxable income at corporate rates. In addition, we would generally be disqualified from treatment as a REIT for the four taxable years following the year in which we lost our REIT status. Losing our REIT status would reduce our net earnings available for distribution to stockholders because of the additional tax liability. In addition, distributions to stockholders would no longer qualify for the dividends-paid deduction and we would no longer be required to pay distributions. If this occurs, we might be required to borrow funds or liquidate some investments in order to pay the applicable tax.
Failure to qualify as a REIT would subject us to federal income tax, which would reduce the cash available for distribution to our stockholders.
We believe that we have operated and will continue to operate in a manner that will allow us to continue to qualify as a REIT for federal income tax purposes commencing with the taxable year ended December 31, 2006. However, the federal income tax laws governing REITs are extremely complex, and interpretations of the federal income tax laws governing qualification as a REIT are limited. Qualifying as a REIT requires us to meet various tests regarding the nature of our assets and our income, the ownership of our outstanding stock, and the amount of our distributions on an ongoing basis. Accordingly, we cannot be certain that we will be successful in operating so we can remain qualified as a REIT. While we intend to continue to operate so that we will qualify as a REIT, given the highly complex nature of the rules governing REITs, the ongoing importance of factual determinations, including the tax treatment of certain investments we may make, and the possibility of future changes in our circumstances, no assurance can be given that we will so qualify for any particular year. If we fail to qualify as a REIT in any calendar year and we do not qualify for certain statutory relief provisions, we would be required to pay federal income tax on our taxable income. We might need to borrow money or sell assets to pay that tax. Our payment of income tax would decrease the amount of our income available for distribution to our stockholders. Furthermore, if we fail to maintain our qualification as a REIT and we do not qualify for certain statutory relief provisions, we no longer would be required to distribute substantially all of our REIT taxable income to our stockholders. Unless our failure to qualify as a REIT were excused under federal tax laws, we would be disqualified from taxation as a REIT for the four taxable years following the year during which qualification was lost.
35
Even if we qualify as a REIT for federal income tax purposes, we may be subject to federal, state, local or other tax liabilities that reduce our cash flow and our ability to make distributions to our stockholders.
Even if we qualify as a REIT for federal income tax purposes, we may be subject to some federal, state and local taxes on our income or property. For example:
• | In order to qualify as a REIT, we must distribute annually at least 90% of our REIT taxable income to our stockholders (which is determined without regard to the dividends-paid deduction or net capital gain). To the extent that we satisfy the distribution requirement but distribute less than 100% of our REIT taxable income, we will be subject to federal corporate income tax on the undistributed income. |
• | We will be subject to a 4% nondeductible excise tax on the amount, if any, by which distributions we pay in any calendar year are less than the sum of 85% of our ordinary income, 95% of our capital gain net income and 100% of our undistributed income from prior years. |
• | If we have net income from the sale of foreclosure property that we hold primarily for sale to customers in the ordinary course of business or other non-qualifying income from foreclosure property, we must pay a tax on that income at the highest corporate income tax rate. We elected foreclosure property status for the GKK Properties but do not believe such GKK Properties will be disposed of in a manner that results in this tax. |
• | If we sell an asset, other than foreclosure property, that we hold primarily for sale to customers in the ordinary course of business, our gain would be subject to the 100% “prohibited transaction” tax unless such sale were made by one of our taxable REIT subsidiaries. |
REIT distribution requirements could adversely affect our ability to execute our business plan.
We generally must distribute annually at least 90% of our REIT taxable income, subject to certain adjustments and excluding any net capital gain, in order for federal corporate income tax not to apply to earnings that we distribute. To the extent that we satisfy this distribution requirement, but distribute less than 100% of our REIT taxable income, we will be subject to federal corporate income tax on our undistributed REIT taxable income. In addition, we will be subject to a 4% nondeductible excise tax if the actual amount that we pay out to our stockholders in a calendar year is less than a minimum amount specified under federal tax laws. We intend to make distributions to our stockholders to comply with the REIT requirements of the Internal Revenue Code.
From time to time, we may generate taxable income greater than our income for financial reporting purposes, or our taxable income may be greater than our cash flow available for distribution to stockholders (for example, where a borrower defers the payment of interest in cash pursuant to a contractual right or otherwise). If we do not have other funds available in these situations we could be required to borrow funds, sell investments at disadvantageous prices or find another alternative source of funds to make distributions sufficient to enable us to pay out enough of our taxable income to satisfy the REIT distribution requirements and to avoid corporate income tax and the 4% excise tax in a particular year. These alternatives could increase our costs or reduce our equity. Thus, compliance with the REIT requirements may hinder our ability to operate solely on the basis of maximizing profits.
To maintain our REIT status, we may be forced to forego otherwise attractive opportunities, which may delay or hinder our ability to meet our investment objectives and reduce the amount of liquidating distributions our stockholders receive and their overall return on investment.
To qualify as a REIT, we must satisfy certain tests on an ongoing basis concerning, among other things, the sources of our income, nature of our assets and the amounts we distribute to our stockholders. We may be required to make distributions to stockholders at times when it would be more advantageous to reinvest cash in our business or when we do not have funds readily available for distribution. Compliance with the REIT requirements may hinder our ability to operate solely on the basis of maximizing profits and reduce the amount of liquidating distributions our stockholders receive and their overall return on investment.
If our operating partnership fails to maintain its status as a partnership for federal income tax purposes, its income would be subject to taxation and our REIT status would be terminated.
We intend to maintain the status of our operating partnership as a partnership for federal income tax purposes. However, if the IRS were to successfully challenge the status of our operating partnership as a partnership, it would be taxable as a corporation. In such event, this would reduce the amount of distributions that our operating partnership could make to us. This would also result in our losing REIT status and becoming subject to a corporate level tax on our own income. This would substantially reduce our cash available to pay distributions and the return on your investment. In addition, if any of the entities through which our operating partnership owns its properties, in whole or in part, loses its characterization as a partnership for federal income tax purposes, the underlying entity would become subject to taxation as a corporation, thereby reducing distributions to our operating partnership and jeopardizing our ability to maintain REIT status.
36
Potential characterization of distributions or gain on sale may be treated as unrelated business taxable income to tax-exempt investors.
If (i) all or a portion of our assets are subject to the rules relating to taxable mortgage pools, (ii) we are a “pension-held REIT,” (iii) a tax-exempt stockholder has incurred debt to purchase or hold our common stock, or (iv) the residual Real Estate Mortgage Investment Conduit interests, or REMICs, we buy (if any) generate “excess inclusion income,” then a portion of the distributions to and, in the case of a stockholder described in clause (iii), gains realized on the sale of common stock by such tax-exempt stockholder may be subject to federal income tax as unrelated business taxable income under the Internal Revenue Code.
The tax on prohibited transactions will limit our ability to engage in transactions that would be treated as sales for federal income tax purposes.
A REIT’s net income from prohibited transactions is subject to a 100% tax. In general, prohibited transactions are sales or other dispositions of assets, other than foreclosure property, deemed held primarily for sale to customers in the ordinary course of business. We might be subject to this tax if we were to dispose of loans in a manner that was treated as a sale of the loans for federal income tax purposes. Therefore, in order to avoid the prohibited transactions tax, we may choose not to engage in certain sales of loans at the REIT level, even though the sales might otherwise be beneficial to us.
It may be possible to reduce the impact of the prohibited transaction tax by conducting certain activities through taxable REIT subsidiaries. However, to the extent that we engage in such activities through taxable REIT subsidiaries, the income associated with such activities may be subject to full corporate income tax.
Complying with REIT requirements may force us to liquidate otherwise attractive investments.
To qualify as a REIT, we must ensure that at the end of each calendar quarter, at least 75% of the value of our assets consists of cash, cash items, government securities and qualified REIT real estate assets, including certain mortgage loans and residential and commercial mortgage-backed securities. The remainder of our investment in securities (other than government securities and qualified real estate assets) generally cannot include more than 10% of the outstanding voting securities of any one issuer or more than 10% of the total value of the outstanding securities of any one issuer. In addition, in general, no more than 5% of the value of our assets (other than government securities and qualified real estate assets) can consist of the securities of any one issuer, and no more than 25% (20% for taxable years after 2017) of the value of our total assets can be represented by securities of one or more taxable REIT subsidiaries. If we fail to comply with these requirements at the end of any calendar quarter, we must correct the failure within 30 days after the end of the calendar quarter or qualify for certain statutory relief provisions to avoid losing our REIT qualification and suffering adverse tax consequences. As a result, we may be required to liquidate from our portfolio otherwise attractive investments. These actions could have the effect of reducing our income and the amount of liquidating distributions our stockholders receive and their overall return on investment.
The ability of our board of directors to revoke our REIT qualification without stockholder approval may subject us to U.S. federal income tax and reduce the amount of liquidating distributions our stockholders receive and their overall return on investment.
Our charter provides that our board of directors may revoke or otherwise terminate our REIT election, without the approval of our stockholders, if it determines that it is no longer in our best interest to continue to qualify as a REIT. While we intend to elect and qualify to be taxed as a REIT, we may not elect to be treated as a REIT or may terminate our REIT election if we determine that qualifying as a REIT is no longer in our best interests. If we cease to be a REIT, we would become subject to U.S. federal income tax on our taxable income and would no longer be required to distribute most of our taxable income to our stockholders, which may have adverse consequences on the amount of liquidating distributions our stockholders receive and their overall return on investment.
We may be subject to adverse legislative or regulatory tax changes.
At any time, the federal income tax laws or regulations governing REITs or the administrative interpretations of those laws or regulations may be amended. We cannot predict when or if any new federal income tax law, regulation or administrative interpretation, or any amendment to any existing federal income tax law, regulation or administrative interpretation, will be adopted, promulgated or become effective and any such law, regulation or interpretation may take effect retroactively. We and our stockholders could be adversely affected by any such change in, or any new, federal income tax law, regulation or administrative interpretation. You are urged to consult with your tax advisor with respect to the impact of recent legislation on your investment in our shares and the status of legislative, regulatory or administrative developments and proposals and their potential effect on an investment in our shares.
37
Although REITs generally receive better tax treatment than entities taxed as regular corporations, it is possible that future legislation would result in a REIT having fewer tax advantages, and it could become more advantageous for a company that invests in real estate to elect to be treated for U.S. federal income tax purposes as a corporation. As a result, our charter provides our board of directors with the power, under certain circumstances, to revoke or otherwise terminate our REIT election and cause us to be taxed as a regular corporation, without the vote of our stockholders. Our board of directors has fiduciary duties to us and our stockholders and could only cause such changes in our tax treatment if it determines in good faith that such changes are in the best interest of our stockholders.
Dividends payable by REITs do not qualify for the reduced tax rates.
In general, the maximum tax rate for dividends payable to domestic stockholders that are individuals, trusts and estates is 20%. Dividends payable by REITs, however, are generally not eligible for this reduced rate. While this tax treatment does not adversely affect the taxation of REITs or dividends paid by REITs, the more favorable rates applicable to regular corporate dividends could cause investors who are individuals, trusts or estates to perceive investments in REITs to be relatively less attractive than investments in stock of non‑REIT corporations that pay dividends, which could adversely affect the value of the stock of REITs, including our common stock.
Qualifying as a REIT involves highly technical and complex provisions of the Internal Revenue Code.
Qualification as a REIT involves the application of highly technical and complex Internal Revenue Code provisions for which only limited judicial and administrative authorities exist. Even a technical or inadvertent violation could jeopardize our REIT qualification. Our continued qualification as a REIT will depend on our satisfaction of certain asset, income, organizational, distribution, stockholder ownership and other requirements on a continuing basis. In addition, our ability to satisfy the requirements to qualify as a REIT depends in part on the actions of third parties over which we have no control or only limited influence, including in cases where we own an equity interest in an entity that is classified as a partnership for U.S. federal income tax purposes.
The failure of a mezzanine loan to qualify as a real estate asset could adversely affect our ability to qualify as a REIT.
The IRS has issued Revenue Procedure 2003-65, which provides a safe harbor pursuant to which a mezzanine loan that is secured by interests in a pass-through entity will be treated by the IRS as a real estate asset for purposes of the REIT tests, and interest derived from such loan will be treated as qualifying mortgage interest for purposes of the REIT 75% income test. Although the Revenue Procedure provides a safe harbor on which taxpayers may rely, it does not prescribe rules of substantive tax law. We made investments in loans secured by interests in pass-through entities in a manner than complies with the various requirements applicable to our qualification as a REIT. To the extent, however, that any such loans do not satisfy all of the requirements for reliance on the safe harbor set forth in the Revenue Procedure, there can be no assurance that the IRS will not challenge the tax treatment of such loans, which could jeopardize our ability to qualify as a REIT.
Retirement Plan Risks
If the fiduciary of an employee benefit plan subject to ERISA (such as a profit sharing, Section 401(k) or pension plan) or an owner of a retirement arrangement subject to Section 4975 of the Internal Revenue Code (such as an individual retirement account (“IRA”)) fails to meet the fiduciary and other standards under ERISA or the Internal Revenue Code as a result of an investment in our stock, the fiduciary could be subject to penalties and other sanctions.
There are special considerations that apply to employee benefit plans subject to the Employee Retirement Income Security Act (“ERISA”) (such as profit sharing, Section 401(k) or pension plans) and other retirement plans or accounts subject to Section 4975 of the Internal Revenue Code (such as an IRA) that invest in our shares. Fiduciaries and IRA owners that invest the assets of such a plan or account in our common stock should satisfy themselves that:
• | the investment is consistent with their fiduciary and other obligations under ERISA and the Internal Revenue Code; |
• | the investment is made in accordance with the documents and instruments governing the plan or IRA, including the plan’s or account’s investment policy; |
• | the investment satisfies the prudence and diversification requirements of Sections 404(a)(1)(B) and 404(a)(1)(C) of ERISA and other applicable provisions of ERISA and the Internal Revenue Code; |
• | the investment in our shares, for which no public market currently exists, is consistent with the liquidity needs of the plan or IRA; |
• | the investment will not produce an unacceptable amount of “unrelated business taxable income” for the plan or IRA; |
• | our stockholders will be able to comply with the requirements under ERISA and the Internal Revenue Code to value the assets of the plan or IRA annually; and |
• | the investment will not constitute a prohibited transaction under Section 406 of ERISA or Section 4975 of the Internal Revenue Code. |
38
With respect to the annual valuation requirements described above, we will provide an estimated value for our common stock annually. We can make no claim whether such estimated value will or will not satisfy the applicable annual valuation requirements under ERISA and the Internal Revenue Code. The Department of Labor or the Internal Revenue Service may determine that a plan fiduciary or an IRA custodian is required to take further steps to determine the value of our common stock. In the absence of an appropriate determination of value, a plan fiduciary or an IRA custodian may be subject to damages, penalties or other sanctions. For information regarding our estimated value per share, see Part II, Item 5, “Market for Registrant’s Common Equity, Related Stockholder Matters, and Issuer Purchases of Equity Securities - Market Information” of this Annual Report on Form 10-K.
Failure to satisfy the fiduciary standards of conduct and other applicable requirements of ERISA and the Internal Revenue Code may result in the imposition of civil and criminal penalties and could subject the fiduciary to claims for damages or for equitable remedies, including liability for investment losses. In addition, if an investment in our shares constitutes a prohibited transaction under ERISA or the Internal Revenue Code, the fiduciary or IRA owner who authorized or directed the investment may be subject to the imposition of excise taxes with respect to the amount invested. In addition, the investment transaction must be undone. In the case of a prohibited transaction involving an IRA owner, the IRA may be disqualified as a tax-exempt account and all of the assets of the IRA may be deemed distributed and subjected to tax. ERISA plan fiduciaries and IRA owners should consult with counsel before making an investment in our common stock.
If our assets are deemed to be plan assets, we and our advisor may be exposed to liabilities under Title I of ERISA and the Internal Revenue Code.
In some circumstances where an ERISA plan holds an interest in an entity, the assets of the entity are deemed to be ERISA plan assets unless an exception applies. This is known as the “look-through rule.” Under those circumstances, the obligations and other responsibilities of plan sponsors, plan fiduciaries and plan administrators, and of parties in interest and disqualified persons, under Title I of ERISA or Section 4975 of the Internal Revenue Code, may be applicable, and there may be liability under these and other provisions of ERISA and the Internal Revenue Code. We believe that our assets should not be treated as plan assets because the shares should qualify as “publicly-offered securities” that are exempt from the look-through rules under applicable Treasury Regulations. We note, however, that because certain limitations are imposed upon the transferability of shares so that we may qualify as a REIT, and perhaps for other reasons, it is possible that this exemption may not apply. If that is the case, and if we or our advisor are exposed to liability under ERISA or the Internal Revenue Code, our performance and results of operations could be adversely affected. Stockholders should consult with their legal and other advisors concerning the impact of ERISA and the Internal Revenue Code on their investment and our performance.
ITEM 1B. | UNRESOLVED STAFF COMMENTS |
We have no unresolved staff comments.
ITEM 2. | PROPERTIES |
Real Estate Investments
As of December 31, 2016, our real estate portfolio consisted of 90 properties, including 30 properties that were held for sale. Our 60 properties held for investment encompassed approximately 3.0 million rentable square feet. The properties held for investment are located in 18 states and include office, industrial and bank branch properties. As of December 31, 2016, our portfolio held for investment was 88% occupied and the average annualized base rent per square foot of our real estate portfolio held for investment was $20.81 per square foot. The weighted-average remaining lease term of our real estate portfolio held for investment was 3.9 years as of December 31, 2016. For a discussion of our real estate portfolio, see Part I, Item 1, “Business” of this Annual Report on Form 10-K.
Pursuant to the Plan of Liquidation, our objectives for 2017 are to (i) pursue an orderly liquidation of our company; and (ii) maximize stockholder value by selling all of our remaining assets, paying our debts and providing for the payment of unknown or contingent liabilities, distributing the net proceeds from liquidation to our stockholders and winding up our operations and dissolving our company. We expect to pay multiple liquidating distribution payments to our stockholders during the liquidation process and to pay the final liquidating distribution after we sell all of our assets, pay all of our known liabilities and provide for unknown liabilities. We expect to complete these activities within 24 months from January 27, 2017, the day our stockholders approved Plan of Liquidation. However, if we cannot sell our assets and pay our debts within 24 months, or if the board of directors and the Special Committee determine that it is otherwise advisable to do so, pursuant to the Plan of Liquidation, we may transfer and assign our remaining assets to a liquidating trust. Upon such transfer and assignment, our stockholders will receive beneficial interests in the liquidating trust.
39
Portfolio Lease Expirations
The following table reflects lease expirations of our 60 properties held for investment as of December 31, 2016:
Year of Expiration | Number of Leases Expiring | Annualized Base Rent (in thousands) (1) | % of Portfolio Annualized Base Rent Expiring | Leased Rentable Square Feet Expiring | % of Portfolio Leased Rentable Square Feet Expiring | |||||||||||
Month-to-Month | 6 | $ | 427 | 0.8 | % | 20,849 | 0.8 | % | ||||||||
2017 | 63 | 16,267 | 29.3 | % | 775,125 | 29.0 | % | |||||||||
2018 | 32 | 3,720 | 6.7 | % | 154,970 | 5.8 | % | |||||||||
2019 | 16 | 4,132 | 7.4 | % | 334,159 | 12.5 | % | |||||||||
2020 | 28 | 5,382 | 9.7 | % | 243,358 | 9.1 | % | |||||||||
2021 | 22 | 2,628 | 4.7 | % | 135,528 | 5.1 | % | |||||||||
2022 | 17 | 11,850 | 21.3 | % | 451,845 | 16.9 | % | |||||||||
2023 | 7 | 1,902 | 3.4 | % | 102,708 | 3.8 | % | |||||||||
2024 | 4 | 1,336 | 2.4 | % | 47,441 | 1.8 | % | |||||||||
2025 | 4 | 1,448 | 2.6 | % | 64,276 | 2.4 | % | |||||||||
2026 | 4 | 3,997 | 7.2 | % | 266,141 | 10.0 | % | |||||||||
Thereafter (2) | 5 | 2,442 | 4.5 | % | 72,092 | 2.8 | % | |||||||||
Total | 208 | $ | 55,531 | 100.0 | % | 2,668,492 | 100.0 | % | ||||||||
_____________________
(1) Annualized base rent represents annualized contractual base rental income as of December 31, 2016, adjusted to straight-line any contractual tenant concessions (including free rent), rent increases and rent decreases from the lease’s inception through the balance of the lease term.
(2) Represents leases expiring at various dates from 2027 through 2030.
Concentration of Credit Risks
As of December 31, 2016, our highest tenant industry concentration (greater than 10% of our annualized base rent), of our 60 properties held for investment, was as follows:
Industry | Number of Tenants | Annualized Base Rent (1) (in thousands) | Percentage of Annualized Base Rent | |||||||
Finance | 30 | $ | 13,533 | 24.4 | % | |||||
Legal | 12 | 8,454 | 15.2 | % | ||||||
_____________________
(1) Annualized base rent represents annualized contractual base rental income as of December 31, 2016, adjusted to straight-line any contractual tenant concessions (including free rent), rent increases and rent decreases from the lease’s inception through the balance of the lease term.
As of December 31, 2016, no other tenant industries accounted for more than 10% of our annualized base rent.
As of December 31, 2016, we had a concentration of credit risk related to a lease with the following tenant that represented more than 10% of our annualized base rent:
Annualized Base Rent Statistics | ||||||||||||||||||||||
Tenant | Property | Tenant Industry | Rentable Square Feet | % of Portfolio Rentable Sq. Ft. Leased | Annualized Base Rent (1) (in thousands) | % of Portfolio Annualized Base Rent | Annualized Base Rent per Square Foot | Lease Expiration | ||||||||||||||
Husch Blackwell | Plaza in Clayton | Legal | 198,218 | 7.4 | % | $ | 6,636 | 12.0 | % | $ | 33.48 | 03/31/2022 | ||||||||||
_____________________
(1) Annualized base rent represents annualized contractual base rental income as of December 31, 2016, adjusted to straight-line any contractual tenant concessions (including free rent), rent increases and rent decreases from the lease’s inception through the balance of the lease term.
40
ITEM 3. | LEGAL PROCEEDINGS |
From time to time, we are party to legal proceedings that arise in the ordinary course of our business. Management is not aware of any legal proceedings of which the outcome is reasonably likely to have a material adverse effect on our results of operations or financial condition. Nor are we aware of any such legal proceedings contemplated by government authorities.
ITEM 4. | MINE SAFETY DISCLOSURES |
Not applicable.
41
PART II
ITEM 5. | MARKET FOR REGISTRANT’S COMMON EQUITY, RELATED STOCKHOLDER MATTERS AND ISSUER PURCHASES OF EQUITY SECURITIES |
Stockholder Information
As of March 24, 2017, we had approximately 184.8 million shares of common stock outstanding held by a total of approximately 40,500 stockholders. The number of stockholders is based on the records of DST Systems, Inc., which serves as our transfer agent.
Market Information
No public market currently exists for our shares of common stock. In addition, our stockholders may not sell their shares unless the buyer meets the applicable suitability and minimum purchase requirements and our charter prohibits the ownership of more than 9.8% of our stock by a single person, unless exempted by our board of directors. Consequently, there is the risk that our stockholders may not be able to sell their shares at a time or price acceptable to them.
As described above, on January 27, 2017, our stockholders approved the Plan of Liquidation. Pursuant to the Plan of Liquidation, on March 10, 2017, our board of directors authorized an initial liquidating distribution in the amount of $1.00 per share of common stock to our stockholders of record as of the close of business on March 21, 2017. The initial liquidating distribution was paid on March 24, 2017 and was funded from proceeds from asset sales. For risks relating to the Plan of Liquidation, see Part I, Item 1A “Risk Factors - Risks Relating to the Plan of Liquidation.” Neither the estimated range in liquidating distributions nor the December 31, 2016 estimated value per share (both discussed below) takes into account the initial liquidating distribution. The payment of the initial liquidating distribution reduces our estimated range of future liquidating distributions by the amount of the initial liquidating distribution.
For the purpose of assisting broker-dealers that participated in our initial public offering in meeting their customer account statement reporting obligations under NASD Conduct Rule 2340 as required by FINRA, we estimated the value of the shares of our common stock as $3.65 (unaudited) per share as of December 31, 2016. We also provided this estimated value per share to assist us in calculating the range of estimated net proceeds from liquidation pursuant to the Plan of Liquidation. This valuation was performed in accordance with the provisions of and also to comply with the IPA Valuation Guidelines. This estimated value per share is based on our board of directors’ approval on October 5, 2016 of an estimated value per share of our common stock of $3.65 (unaudited), based on the estimated value of our assets less the estimated value of our liabilities, or net asset value, divided by the number of shares outstanding, all as of June 30, 2016, except for certain items discussed herein for which estimated values were adjusted subsequent to June 30, 2016. There were no other material changes between June 30, 2016 and October 7, 2016 that impacted the overall estimated value per share.
In addition, on March 27, 2017, our board of directors approved the March EVPS of $2.475 (unaudited), effective March 21, 2017. We provided the March 2017 EVPS for the purpose of assisting broker-dealers that participated in our initial public offering in meeting their customer account statement reporting obligations under NASD Conduct Rule 2340 as required by FINRA. The March 2017 EVPS is equal to the midpoint of the estimated range of liquidating distributions of $3.27 and $3.68 per share (which midpoint is $3.475), reduced for the impact of the payment of the initial liquidating distribution of $1.00 per share of common stock to our stockholders. Thus, the March 2017 EVPS reflects the resulting reduction of our stockholders’ remaining investment in us. This valuation was performed in accordance with the provisions of and also to comply with the IPA Valuation Guidelines, reduced for the impact of liquidation fees and selling costs. For more information relating to the calculation of the March 2017 EVPS, see our Current Report on Form 8-K, filed with the SEC on March 28, 2017.
42
The conflicts committee of our board of directors, composed solely of all of our independent directors, is responsible for the oversight of the valuation process used to determine the estimated value per share of our common stock, including the review and approval of the valuation and appraisal processes and methodologies used to determine our estimated value per share, the consistency of the valuation and appraisal methodologies with real estate industry standards and practices and the reasonableness of the assumptions used in the valuations and appraisals. With the approval of the conflicts committee, we engaged Duff & Phelps, LLC (“Duff & Phelps”), an independent third-party real estate valuation firm, to provide appraisals for 11 of our 12 historical real estate properties. In addition, we engaged Duff & Phelps to perform appraisals for all but 50 of the 220 GKK Properties. Our 11 appraised historical real estate properties and the 170 GKK Properties appraised by Duff & Phelps are referred to herein collectively as the “Appraised Properties.” Duff & Phelps prepared appraisal reports summarizing key inputs and assumptions of its appraisals. The one historical real estate property and 50 GKK Properties not valued by Duff & Phelps either were under contract to sell as of August 31, 2016 or were sold or disposed of subsequent to June 30, 2016 and prior to October 5, 2016. We also engaged Duff & Phelps to provide a calculation of the range in estimated value per share of our common stock as of October 5, 2016. Duff & Phelps based this range in estimated value per share upon (i) its appraisals of the Appraised Properties or the contractual sales prices less actual or estimated disposition costs and fees in the case of properties that were under contract to sell as of August 31, 2016 or properties sold or disposed of subsequent to June 30, 2016 and prior to October 5, 2016 and (ii) valuations performed by our advisor, of our real estate-related investments, cash, other assets, mortgage debt and other liabilities, which are disclosed in our Quarterly Report on Form 10-Q for the period ended June 30, 2016, with the exception of the valuation of one real estate loan receivable discussed under “Real Estate Loans Receivable”. The methodologies and assumptions used to determine the estimated value of our assets and the estimated value of our liabilities are described further below.
The conflicts committee (i) received and reviewed Duff & Phelps’ valuation report, which included an appraised value for each of the Appraised Properties and a summary of the estimated value of each of our other assets and our liabilities as determined by our advisor and reviewed by Duff & Phelps, and (ii) reviewed the reasonableness of the range in estimated value per share resulting from Duff & Phelps’ valuation process. Based upon these and other factors considered by the conflicts committee and the conflicts committee’s own extensive knowledge of our assets and liabilities, the conflicts committee: (i) concluded that the range in estimated value per share of $3.40 to $3.82 as indicated in Duff & Phelps’ valuation report, with an approximate mid-range value recommended by our advisor of $3.65 per share (unaudited), was reasonable, and (ii) recommended to our board of directors that it adopt $3.65 (unaudited) as the estimated value per share of our common stock, as recommended by our advisor. For information with respect to the specific factors relied upon by the conflicts committee to determine the estimated value per share within the range in estimated value per share, see “Real Estate Loans Receivable.” Our board of directors unanimously agreed to accept the recommendation of the conflicts committee and approved $3.65 (unaudited) as the estimated value per share of our common stock as of October 5, 2016, which determination is ultimately and solely the responsibility of our board of directors.
43
The table below sets forth the calculation of our estimated value per share as of October 5, 2016 as well as the calculation of our prior estimated value per share as of December 8, 2015:
October 5, 2016 Estimated Value per Share | December 8, 2015 Estimated Value per Share (1) | Change in Estimated Value per Share | ||||||||||
Real estate properties - historical (2) | $ | 2.74 | $ | 2.95 | $ | (0.21 | ) | |||||
Real estate - GKK Properties (3) | 1.32 | 3.42 | (2.10 | ) | ||||||||
Real estate loans receivable | 0.11 | 0.13 | (0.02 | ) | ||||||||
Cash and restricted cash | 1.07 | 0.83 | 0.24 | |||||||||
Other assets | 0.07 | 0.08 | (0.01 | ) | ||||||||
Mortgage and other debt obligations (4) | (1.40 | ) | (2.93 | ) | 1.53 | |||||||
Other liabilities | (0.26 | ) | (0.29 | ) | 0.03 | |||||||
Special Distribution paid on December 7, 2015 | — | (0.25 | ) | 0.25 | ||||||||
Estimated value per share | $ | 3.65 | $ | 3.94 | $ | (0.29 | ) | |||||
Estimated enterprise value premium | None assumed | None assumed | None assumed | |||||||||
Total estimated value per share | $ | 3.65 | $ | 3.94 | $ | (0.29 | ) | |||||
_____________________
(1) The December 8, 2015 estimated value per share was based upon the recommendation and valuation of our advisor. Our advisor’s recommendation and valuation of our real estate properties was based on either (i) appraisals of certain of our real estate properties performed by Duff & Phelps or (ii) the contractual sales prices less actual or estimated closing costs in the case of properties that were under contract to sell as of December 10, 2015 or properties sold subsequent to September 30, 2015 and prior to December 10, 2015. Our advisor performed valuations of our real estate-related investments, cash, other assets, mortgage debt and other liabilities. For more information relating to the December 8, 2015 estimated value per share and the assumptions and methodologies applied by our advisor and Duff & Phelps, see our Current Report on Form 8-K filed with the SEC on December 10, 2015.
(2) The decrease in the estimated value of real estate properties per share was primarily due to real estate sales and a decrease in the appraised value of the real estate properties.
(3) The decrease in the estimated value of GKK Properties per share was primarily due to real estate property sales.
(4) The decrease in the estimated value of mortgage and other debt obligations per share was primarily due to the repayment of principal related to asset sales and ongoing principal amortization payments.
The decrease in our estimated value per share from the previous estimate was primarily due to the items noted in the table below, which reflect the significant contributors to the decrease in the estimated value per share from $3.94 (unaudited) to $3.65 (unaudited). The changes are not equal to the change in values of each asset and liability group presented in the table above due to asset sales, debt repayments and extinguishment of debt and other factors, which caused the value of certain asset or liability groups to change with no impact to our fair value of equity or the overall estimated value per share.
Change in Estimated Value per Share | |||||
December 8, 2015 estimated value per share | $ | 3.94 | |||
Changes to estimated value per share | |||||
Real Estate | |||||
Properties held as of June 30, 2016 | (0.14 | ) | |||
Properties sold through June 30, 2016 | 0.16 | ||||
Capital expenditures on real estate | (0.17 | ) | |||
Total changes related to real estate | (0.15 | ) | |||
Closing costs/disposition fees | (0.10 | ) | |||
Total changes related to real estate after closing costs/disposition fees | (0.25 | ) | |||
Mortgage debt | (0.06 | ) | (1) | ||
Undistributed operating cash flows | 0.06 | (2) | |||
Other changes, net | (0.04 | ) | |||
Total change in estimated value per share | $ | (0.29 | ) | (3) | |
October 5, 2016 estimated value per share | $ | 3.65 | |||
_____________________
(1) The change in value of the notes payable is primarily due to defeasance costs and debt prepayment penalties paid in connection with the repayment of certain loans and a decrease in market interest rates assumed in valuing the notes payable as compared to the December 8, 2015 estimated value per share, resulting in the notes payable being valued at less of a discount or more of a premium than in the December 8, 2015 estimated value per share.
(2) Amount includes operating cash flows through June 30, 2016 from real estate properties that were under contract to sell as of October 5, 2016 or were sold subsequent to June 30, 2016 and prior to October 5, 2016, which will not provide future operating cash flows.
(3) The reconciliation of total change in estimated value per share does not reflect $5.1 million used to fulfill redemption requests in accordance with our share redemption program, as such redemptions resulted in no change to the estimated value per share because, while our net asset value was reduced by the $5.1 million of redemptions, it also resulted in a corresponding decrease in the number of shares outstanding.
44
As with any valuation methodology, the methodologies used are based upon a number of estimates and assumptions that may not be accurate or complete. Different parties using different assumptions and estimates could derive a different estimated value per share of our common stock, and this difference could be significant. The estimated value per share is not audited and does not represent the fair value of our assets less the fair value of our liabilities according to GAAP, nor does it represent a liquidation value of our assets and liabilities (as discussed below) or the price at which our shares of common stock would trade on a national securities exchange. The estimated value per share does not reflect a discount for the fact that we are externally managed, nor does it reflect a real estate portfolio premium/discount versus the sum of the individual property values.
Our estimated value per share takes into consideration any potential liability related to a subordinated participation in cash flows our advisor is entitled to upon meeting certain stockholder return thresholds in accordance with the advisory agreement. For purposes of determining the estimated value per share, our advisor calculated the potential liability related to this incentive fee based on a hypothetical liquidation of the assets and liabilities at their estimated fair values, after considering the impact of any potential closing costs and fees related to the disposition of real estate properties, and determined that there would be no liability related to the subordinated participation in cash flows. As of October 5, 2016, we had no potentially dilutive securities outstanding that would impact the estimated value per share of our common stock.
The October 5, 2016 estimated value per share was based upon a calculation of the range in estimated value per share of our common stock as of June 30, 2016 provided by Duff & Phelps. This range does not represent a range in liquidation value of our assets and liabilities. As discussed in our definitive proxy statement filed on November 10, 2016 with the SEC, in connection with a review of potential strategic alternatives available to us, our board of directors determined that it is in our and our stockholders’ best interest to sell all of our properties and assets and liquidate and dissolve our company pursuant to the Plan of Liquidation. The Plan of Liquidation was approved by our stockholders on January 27, 2016.
We estimate that our net proceeds from liquidation and, therefore, the amount of cash our stockholders would receive for each share of our common stock they then hold, could range between approximately $3.27 and $3.68 per share. The difference between the estimated value per share and the range of estimated net proceeds from liquidation reflects the fact that the estimated value per share does not take into consideration: (i) expected closing costs and fees related to future dispositions of real estate and real estate-related investments, with the exception of one historical real estate property and 50 GKK Properties that were under contract to sale as of August 31, 2016 or sold or disposed of subsequent to June 30, 2016 and prior to October 5, 2016, and (ii) corporate transaction costs and other expenses of the liquidation and dissolution of the company not covered from our cash flow from operations.
We have generally incurred disposition costs and fees related to the sale of our historical real estate properties since inception of 1.7% to 5.7% of the gross sales price less concessions and credits, with a weighted average of 2.7% as of June 30, 2016. We have generally incurred disposition costs and fees related to the sale of the GKK Properties since December 15, 2011 (the date of the completion of the transfer of the GKK Properties to us pursuant to the Settlement Agreement) of 1.5% to 8.5% of the gross sales price less concessions and credits, with a weighted average of 2.6% as of June 30, 2016.
Based on the estimated value per share as of October 5, 2016 and the estimated costs and expenses of liquidating and dissolving our company, we estimate the range in net proceeds from liquidation to be follows:
Range in estimated value per share | $3.40 to $3.82 | |
Estimated disposition costs and fees per share | $(0.10) to $(0.11) | |
Estimated other dissolution costs per share | $(0.03) | |
Range in estimated net proceeds from liquidation per share | $3.27 to $3.68 | |
There are many factors that may affect the actual net proceeds from liquidation per share, including, among other things, the ultimate sale price of each asset, changes in market demand for office, industrial and bank branch properties during the liquidation process, the amount of taxes, transaction fees and expenses relating to the liquidation and dissolution, and unanticipated or contingent liabilities arising subsequent to November 10, 2016. No assurance can be given as to the amount of liquidating distributions we will ultimately pay to our stockholders. If we have underestimated our existing obligations and liabilities or if unanticipated or contingent liabilities arise, the amount of liquidating distributions ultimately distributed to our stockholders could be less than that set forth above. These estimates are based upon market, economic, financial and other circumstances and conditions existing as of November 10, 2016, and any changes in such circumstances and conditions during the liquidation process could have a material effect on the ultimate amount of liquidating distributions we pay to our stockholders.
45
Methodology
Our goal for the valuation was to arrive at a reasonable and supportable estimated value per share, using a process that was designed to be in compliance with the IPA Valuation Guidelines and using what we and our advisor deemed to be appropriate valuation methodologies and assumptions. The following is a summary of the valuation and appraisal methodologies, assumptions and estimates used to value our assets and liabilities:
Real Estate
Independent Valuation Firm
Duff & Phelps(1) was engaged by us and approved by our conflicts committee and board of directors to appraise each of the Appraised Properties and to provide a calculation of the range in estimated value per share of our common stock as of October 5, 2016. Duff & Phelps is engaged in the business of appraising commercial real estate properties and is not affiliated with us or our advisor. The compensation we paid to Duff & Phelps was based on the scope of work and not on the appraised values of the Appraised Properties. The appraisals were performed in accordance with the Code of Ethics and the Uniform Standards of Professional Appraisal Practice, or USPAP, the real estate appraisal industry standards created by The Appraisal Foundation, as well as the requirements of the state where each real property is located. Each appraisal was reviewed, approved and signed by an individual with the professional designation of MAI (Member of the Appraisal Institute). The use of the reports is subject to the requirements of the Appraisal Institute relating to review by its duly authorized representatives.
Duff & Phelps collected all reasonably available material information that it deemed relevant in appraising the Appraised Properties. Duff & Phelps obtained property-level information from our advisor, including (i) property historical and projected operating revenues and expenses; (ii) property lease agreements; and (iii) information regarding recent or planned capital expenditures. Duff & Phelps reviewed and relied in part on the property-level information provided by our advisor and considered this information in light of its knowledge of each property’s specific market conditions.
In conducting its investigation and analyses, Duff & Phelps took into account customary and accepted financial and commercial procedures and considerations as it deemed relevant. Although Duff & Phelps reviewed information supplied or otherwise made available by us or our advisor for reasonableness, it assumed and relied upon the accuracy and completeness of all such information and of all information supplied or otherwise made available to it by any other party and did not independently verify any such information. With respect to operating or financial forecasts and other information and data provided to or otherwise reviewed by or discussed with Duff & Phelps, Duff & Phelps assumed that such forecasts and other information and data were reasonably prepared in good faith on bases reflecting the best currently available estimates and judgments of our management and/or our advisor. Duff & Phelps relied on us to advise it promptly if any information previously provided became inaccurate or was required to be updated during the period of its review.
In performing its analyses, Duff & Phelps made numerous other assumptions as of various points in time with respect to industry performance, general business, economic and regulatory conditions and other matters, many of which are beyond its and our control, as well as certain factual matters. For example, unless specifically informed to the contrary, Duff & Phelps assumed that we had clear and marketable title to each of the Appraised Properties, that no title defects existed, that any improvements were made in accordance with law, that no hazardous materials were present or had been present previously, that no deed restrictions existed, and that no changes to zoning ordinances or regulations governing use, density or shape were pending or being considered. Furthermore, Duff & Phelps’ analyses, opinions and conclusions were necessarily based upon market, economic, financial and other circumstances and conditions existing as of or prior to the date of the appraisals, and any material change in such circumstances and conditions may affect Duff & Phelps’ analyses and conclusions. Duff & Phelps’ appraisal reports contain other assumptions, qualifications and limitations that qualify the analyses, opinions and conclusions set forth therein. Furthermore, the prices at which the Appraised Properties may actually be sold could differ from their appraised values.
_____________________
(1) Duff & Phelps is actively engaged in the business of appraising commercial real estate properties similar to those we owned in connection with public securities offerings, private placements, business combinations and similar transactions. We engaged Duff & Phelps to prepare appraisal reports for each of the Appraised Properties and to provide a calculation of the range in estimated value per share of our common stock. Duff & Phelps received fees upon the delivery of such reports and the calculation of the range in estimated value per share of our common stock. In addition, we agreed to indemnify Duff & Phelps against certain liabilities arising out of this engagement. In the three years prior to October 7, 2016, Duff & Phelps and its affiliates have provided a number of commercial real estate, appraisal, valuation and financial advisory services for us and our affiliates and have received fees in connection with such services. In connection with prior valuations of our shares, we engaged Duff & Phelps to provide valuations of certain of our properties and to provide a review, based on a limited set of procedures, of the methodologies and assumptions used by our advisor in valuing certain properties. Duff & Phelps and its affiliates may from time to time in the future perform other commercial real estate, appraisal, valuation and financial advisory services for us and our affiliates in transactions related to the properties that are the subjects of the appraisals, so long as such other services do not adversely affect the independence of the applicable Duff & Phelps appraiser as certified in the applicable appraisal reports.
46
Although Duff & Phelps considered any comments received from us or our advisor to its appraisal reports, the appraised values of the Appraised Properties were determined by Duff & Phelps. The appraisal reports for the Appraised Properties are addressed solely to us and Duff & Phelps used the reports in its calculation of the range in estimated value per share of our common stock. The appraisal reports are not addressed to the public and may not be relied upon by any other person to establish an estimated value per share of our common stock and do not constitute a recommendation to any person to purchase or sell any shares of our common stock. In preparing its appraisal reports, Duff & Phelps did not solicit third-party indications of interest for the Appraised Properties. In preparing its appraisal reports and in calculating the range in estimated value per share of our common stock, Duff & Phelps did not, and was not requested to, solicit third-party indications of interest for our common stock in connection with possible purchases thereof or the acquisition of all or any part of us.
The foregoing is a summary of the standard assumptions, qualifications and limitations that generally apply to Duff & Phelps’ appraisal reports. All of the Duff & Phelps appraisal reports, including the analyses, opinions and conclusions set forth in such reports, are qualified by the assumptions, qualifications and limitations set forth in the respective appraisal reports.
Historical Real Estate Properties
As of June 30, 2016, we owned 12 historical real estate properties (excluding the GKK Properties). We engaged Duff & Phelps to provide appraisals for 11 of the 12 historical real estate properties. Duff & Phelps appraised these historical real estate properties, using various methodologies including the direct capitalization approach, 10-year discounted cash flow analyses and sales comparison approach and relied primarily on 10-year discounted cash flow analyses for the final appraisals of 11 of the 12 historical real estate properties. Duff & Phelps calculated the discounted cash flow value of these 11 historical real estate properties using property-level cash flow estimates, terminal capitalization rates and discount rates that fall within ranges it believes would be used by similar investors to value the properties we own based on recent comparable market transactions, adjusted for unique property and market-specific factors.
The total appraised value of our 11 historical real estate properties using the appraisal methodologies described above was $436.3 million. With respect to the one historical real estate property that was sold subsequent to June 30, 2016 and prior to October 5, 2016, the estimated value of $71.5 million was based on the contractual sales price, net of selling costs. Based on the appraisal and valuation methodologies described above, the estimated value of our historical properties was $507.8 million as of June 30, 2016, compared to a total cost basis, including acquisition fees and expenses, capital expenditures and leasing commissions through June 30, 2016, of $804.0 million.
The following table summarizes the key assumptions that Duff & Phelps used in the 10-year discounted cash flow models to appraise these 11 historical real estate properties:
Range in Values | Weighted-Average Basis | ||
Terminal capitalization rate | 6.75% to 10.50% | 7.57% | |
Discount rate | 7.25% to 13.50% | 8.35% | |
Net operating income compounded annual growth rate (1) | 0.83% to 12.37% | 6.15% | |
_____________________
(1) The net operating income compounded annual growth rates (the “CAGRs”) reflect both the contractual and market rents and reimbursements (in cases where the contractual lease period is less than the hold period of the property) net of expenses over the holding period. The range of CAGRs shown is the constant annual rate at which the net operating income is projected to grow to reach the net operating income in the final year of the hold period for each of the properties.
While we believe that Duff & Phelps’ assumptions and inputs are reasonable, a change in these assumptions and inputs would significantly impact the appraised value of these 11 historical real estate properties and thus, our estimated value per share. The table below illustrates the impact on the estimated value per share if the terminal capitalization rates or discount rates were adjusted by 25 basis points, assuming all other factors remain unchanged, with respect to the 11 historical real estate properties referenced above. Additionally, the table below illustrates the impact on our estimated value per share if the terminal capitalization rates or discount rates were adjusted by 5% in accordance with the IPA Valuation Guidelines, assuming all other factors remain unchanged.
Increase (Decrease) on the Estimated Value per Share due to | ||||||||||||||||
Decrease of 25 basis points | Increase of 25 basis points | Decrease of 5% | Increase of 5% | |||||||||||||
Terminal capitalization rates | $ | 0.05 | $ | (0.05 | ) | $ | 0.07 | $ | (0.07 | ) | ||||||
Discount rates | 0.04 | (0.04 | ) | 0.08 | (0.07 | ) | ||||||||||
47
GKK Properties
As of June 30, 2016, the GKK Properties consisted of 220 bank branch properties, office buildings, operations centers and other properties. We engaged Duff & Phelps to provide appraisals for 170 of the GKK Properties. The aggregate appraised value for these 170 GKK Properties was $170.0 million. With respect to the 50 GKK Properties that were under contract to sell as of August 31, 2016 or were sold or disposed of subsequent to June 30, 2016 and prior to October 5, 2016, the estimated value was based on contractual sale prices, net of actual or expected selling costs. The estimated value for these 50 GKK Properties was $74.8 million. Based on the appraisal and valuation methodologies described in this section, the total estimated value of the GKK Properties was $244.8 million as of June 30, 2016, compared to a total cost basis, including capital expenditures and leasing commissions through June 30, 2016, of $258.4 million.
Duff & Phelps appraised 151 of the GKK Properties using the direct capitalization method, which applies a current market capitalization rate to the property’s net operating income. In cases where a property was not stabilized, the estimated value was based on a stabilized property reduced for capital costs that would be incurred to lease up the property. The following summarizes the key assumption that was used to appraise these 151 GKK Properties:
Range in Direct Capitalization Rate | Weighted-Average Direct Capitalization Rate | |
5.25% to 11.00% | 7.61% | |
While we believe that Duff & Phelps’ assumptions and inputs are reasonable, a change in these assumptions and inputs would significantly impact the appraised value of the 151 GKK Properties that Duff & Phelps appraised using the direct capitalization method and thus, our estimated value per share. The table below illustrates the impact on the estimated value per share if the direct capitalization rates were adjusted by 25 basis points, assuming all other factors remain unchanged, with respect to the 151 GKK Properties appraised by Duff & Phelps using the direct capitalization method. Additionally, the table below illustrates the impact on the estimated value per share if the capitalization rates were adjusted by 5% in accordance with the IPA Valuation Guidelines, assuming all other factors remain unchanged.
Increase (Decrease) on the Estimated Value per Share due to | ||||||||||||||||
Decrease of 25 basis points | Increase of 25 basis points | Decrease of 5% | Increase of 5% | |||||||||||||
Capitalization rates | $ | 0.03 | $ | (0.03 | ) | $ | 0.05 | $ | (0.05 | ) | ||||||
Duff & Phelps appraised 14 of the GKK Properties by performing 10-year discounted cash flow analyses. The following table summarizes the key assumptions that were used by Duff & Phelps in the discounted cash flow models to appraise these 14 GKK Properties:
Range in Values | Weighted-Average Basis | ||
Terminal capitalization rate | 8.00% to 8.00% | 8.00% | |
Discount rate | 10.50% to 10.50% | 10.50% | |
Net operating income CAGR (1) | 4.41% to 36.27% | 16.44% | |
_____________________
(1) The net operating income CAGRs reflect both the contractual and market rents and reimbursements (in cases where the contractual lease period is less than the hold period of the property) net of expenses over the holding period. The range of CAGRs shown is the constant annual rate at which the net operating income is projected to grow to reach the net operating income in the final year of the hold period for each of the properties. The CAGRs of certain of the properties are higher due to the appraisal of the respective property reflecting low occupancy and net operating income in year one, and subsequent lease up of the property and increase in occupancy such that the net operating income is significantly higher in year ten.
While we believe that Duff & Phelps’ assumptions and inputs are reasonable, a change in these assumptions and inputs would change the appraised value of these 14 GKK Properties and thus, our estimated value per share. Assuming all other factors remain unchanged, a decrease or increase in the terminal capitalization rates or discount rates of 25 basis points with respect to the 14 GKK Properties valued by Duff & Phelps using the discounted cash flow analysis would have no impact on our estimated value per share. Additionally, assuming all other factors remain unchanged, a 5% decrease or increase in terminal capitalization rates or discount rates, in accordance with the IPA Valuation Guidelines, would have no impact on our estimated value per share.
The remaining 5 GKK Properties were appraised by Duff & Phelps using a present value cash flow analysis as we do not have a fee ownership interest in these GKK Properties (with the exception of one vacant building with a long-term ground lease), but instead hold leasehold interests in the properties.
48
Finally, a 1% increase in the appraised or estimated value of our real estate properties, including both historical properties and GKK Properties, would result in a $0.04 increase in our estimated value per share and a 1% decrease in the appraised or estimated value of our real estate properties, including both historical properties and GKK Properties, would result in a $0.04 decrease in our estimated value per share, assuming all other factors remain unchanged.
Real Estate Loans Receivable
Our advisor’s estimated values for our real estate loans receivable are equal to the GAAP fair values disclosed in our Quarterly Report on Form 10-Q for the period ended June 30, 2016, but do not equal the book value of the loans in accordance with GAAP. Our advisor estimated the values of the real estate loans receivable by applying a discounted cash flow analysis over the remaining expected lives of the investments, excluding any potential transaction costs. The cash flow estimates used in the analysis during the term of the investments were based on the investments’ contractual cash flows, which we anticipate we will receive. The expected cash flows for the loans were discounted at rates that we expect a market participant would require for instruments with similar characteristics, including remaining loan term, loan-to-value ratios, type of collateral, current performance, credit enhancements and other factors.
As of June 30, 2016, we owned three real estate loans receivable, consisting of a mezzanine loan and two B-notes. The cost of our real estate loans receivable, including origination fees and costs and principal repayments, was $22.3 million. As of June 30, 2016, the GAAP fair value of our investments in real estate loans receivable was $20.6 million and the outstanding principal balance was approximately $28.9 million. The weighted-average discount rate applied to the cash flows from the real estate loans receivable, which have a weighted-average remaining term of 1.2 years, was approximately 18.3%. Similar to the valuation for real estate, a change in the assumptions and inputs could change the fair value of our real estate loans receivable and thus, our estimated value per share. Assuming all other factors remain unchanged, a decrease or increase in the discount rates of 25 basis points would have no impact on the estimated value per share and, additionally, a 5% decrease or increase in the discount rates would have no impact on the estimated value per share.
When determining the estimated value per share within the range of estimated value per share calculated by Duff & Phelps, the conflicts committee and our board of directors considered that the range provided by Duff & Phelps did not value one of our loans at GAAP fair value. Based on the GAAP fair value of this loan as of June 30, 2016 (which our advisor believes is the approximate GAAP fair value of the loan as of October 5, 2016) and the recommendation of our advisor, and the conflicts committee’s and board of directors’ own review of the valuation of this loan, the conflicts committee and board of directors approved an estimated value per share that was $0.04 per share above the midpoint of the range provided by Duff & Phelps to reflect the difference between Duff & Phelps’ valuation of the loan and our advisor’s valuation of the loan.
Notes Payable
The estimated values of our notes payable are equal to the GAAP fair values disclosed in our Quarterly Report on Form 10-Q for the six months ended June 30, 2016. The estimated value of our notes payable does not equal the book value of the loans in accordance with GAAP. Our advisor estimated the GAAP fair values of our notes payable using a discounted cash flow analysis. The discounted cash flow analysis was based on projected cash flow over the remaining loan terms, including extensions we expect to exercise, and on management’s estimates of current market interest rates for instruments with similar characteristics, including remaining loan term, loan-to-value ratio and type of collateral.
As of June 30, 2016, the GAAP fair value and carrying value of our notes payable were $258.9 million and $251.2 million, respectively. The weighted-average discount rate applied to the future estimated debt payments was approximately 2.66%. Our notes payable have a weighted-average remaining term of 1.17 years. Similar to the valuation for real estate, a change in the assumptions and inputs could change the fair value of our notes payable and thus, our estimated value per share. Assuming all other factors remain unchanged, a decrease or increase in the discount rates of 25 basis points would have no impact on the estimated value per share and, additionally, a 5% decrease or increase in discount rates would have no impact on the estimated value per share.
Other Assets and Liabilities
The carrying values of a majority of our other assets and liabilities are considered to equal their fair values due to their short maturities or liquid nature. Our advisor eliminated certain balances, such as straight-line rent receivables, lease intangible assets and liabilities, capital expenditures payable, deferred financing costs, unamortized lease commissions and unamortized lease incentives, for the purpose of the valuation due to the fact that the value of those balances was already considered in the valuation of the related asset or liability. Our advisor has also excluded redeemable common stock, as temporary equity does not represent a true liability to us and the shares that this amount represents are included in our total outstanding shares of common stock for purposes of calculating the estimated value per share of our common stock.
49
In addition to other assets and liabilities outstanding as of June 30, 2016, our net asset value was reduced for disposition fees with respect to previous sales of GKK Properties for which disposition fees had not yet been paid and for the potential impact of an ongoing tenant audit related to billed tenant reimbursements. On August 9, 2016, we and our advisor entered into an amendment (“Amendment No. 1”) to the advisory agreement between the parties to amend certain terms related to the disposition fee payable to our advisor by us. Pursuant to Amendment No. 1, with respect to sales of GKK Properties for which a disposition fee had not yet been paid, based on the proceeds received from the entire investment related to the GKK Mezzanine Loan and the GKK Properties to date and expected proceeds from future sales, the conflicts committee determined that our advisor had provided a substantial amount of services in connection with the sale of the 160 GKK Properties named therein and approved the payment to our advisor of a disposition fee equal to 1.0% of the aggregate contract sales prices of such GKK Properties. The aggregate disposition fee was $2.0 million or $0.01 per share. The aggregate contract sales price of such 160 GKK Properties was $214.1 million.
Limitations of the Estimated Value Per Share
As mentioned above, we provided this estimated value per share (i) to assist us in calculating the range of estimated net proceeds from our Plan of Liquidation as discussed in our definitive proxy statement filed with the SEC on November 10, 2016, which Plan of Liquidation was approved by our stockholders on January 27, 2017, and (ii) to assist broker dealers that participated in our initial public offering in meeting their customer account statement reporting obligations. This valuation was performed in accordance with the provisions of and also to comply with the IPA Valuation Guidelines. The estimated value per share set forth above first appeared on the October 31, 2016 customer account statements that were mailed in November 2016. As with any valuation methodology, the methodologies used are based upon a number of estimates and assumptions that may not be accurate or complete. Different parties with different assumptions and estimates could derive a different estimated value per share, and this difference could be significant. The estimated value per share is not audited and does not represent the fair value of our assets less the fair value of our liabilities according to GAAP.
Accordingly, with respect to the estimated value per share, we can give no assurance that:
• | a stockholder would be able to resell his or her shares at this estimated value per share; |
• | our shares of common stock would trade at the estimated value per share on a national securities exchange; |
• | another independent third-party appraiser or third-party valuation firm would agree with our estimated value per share; or |
• | the methodology used to calculate our estimated value per share would be acceptable to FINRA or for compliance with ERISA reporting requirements. |
Moreover, as discussed above, the October 5, 2016 estimated value per share does not represent a liquidation value of our assets and liabilities. If we are able to successfully implement the Plan of Liquidation, we estimate that our net proceeds from liquidation and, therefore, the amount of cash our stockholders would receive for each share of our common stock they then hold, could range between approximately $3.27 and $3.68 per share.
Further, the estimated value per share as of October 5, 2016 is based on the estimated value of our assets less the estimated value of our liabilities divided by the number of shares outstanding, all as of June 30, 2016, except for certain items discussed herein for which estimated values were adjusted subsequent to June 30, 2016. The value of our shares will fluctuate over time in response to developments related to individual assets in our portfolio and the management of those assets, in response to the real estate and finance markets and due to other factors. The estimated value per share does not reflect a discount for the fact that we are externally managed, nor does it reflect a real estate portfolio premium/discount versus the sum of the individual property values.
Historical Estimated Values per Share
The historical reported estimated values per share of our common stock approved by our board of directors are set forth below:
Estimated Value per Share | Effective Date of Valuation | Filing with the Securities and Exchange Commission | ||
$3.94 | December 8, 2015 | Current Report on Form 8-K, filed December 10, 2015 | ||
$4.52 | December 9, 2014 | Current Report on Form 8-K, filed December 11, 2014 | ||
$4.45 | December 18, 2013 | Current Report on Form 8-K, filed December 19, 2013 | ||
$5.18 | December 18, 2012 | Current Report on Form 8-K, filed December 19, 2012 | ||
$5.16 | March 22, 2012 | Current Report on Form 8-K, filed March 26, 2012 | ||
$7.32 | December 2, 2010 | Current Report on Form 8-K, filed December 10, 2010 | ||
$7.17 | November 20, 2009 | Current Report on Form 8-K, filed November 23, 2009 | ||
50
Distribution Information
We elected to be taxed as a REIT under the Internal Revenue Code and have operated as such beginning with our taxable year ended December 31, 2006. To maintain our qualification as a REIT, we must meet certain organizational and operational requirements, including a requirement to distribute at least 90% of our REIT taxable income (computed without regard to the dividends-paid deduction or net capital gain and which does not necessarily equal net income as calculated in accordance with GAAP). Our board of directors may authorize distributions in excess of those required for us to maintain REIT status depending on our financial condition and such other factors as our board of directors deems relevant.
Distributions declared per share of common stock were $0.100 in the aggregate for the year ended December 31, 2016. Distributions per share of common stock were based on a quarterly record date for each quarter during 2016.
Distributions declared per share of common stock were $0.350 in the aggregate for the year ended December 31, 2015. Distributions per share of common stock were based on a quarterly record date for each quarter during 2015. Additionally, our board of directors declared a special distribution in the amount of $0.25 per share on the outstanding shares of our common stock on November 30, 2015 to stockholders of record as of the close of business on December 1, 2015.
Distributions declared during 2016 and 2015, aggregated by quarter, are as follows (dollars in thousands, except per share amounts):
2016 | ||||||||||||||||||||
1st Quarter | 2nd Quarter | 3rd Quarter | 4th Quarter | Total | ||||||||||||||||
Total Distributions Declared | $ | 4,655 | $ | 4,645 | $ | 4,634 | $ | 4,627 | $ | 18,561 | ||||||||||
Total Per Share Distribution | $ | 0.025 | $ | 0.025 | $ | 0.025 | $ | 0.025 | $ | 0.100 | ||||||||||
2015 | ||||||||||||||||||||
1st Quarter | 2nd Quarter | 3rd Quarter | 4th Quarter | Total | ||||||||||||||||
Total Distributions Declared | $ | 4,690 | $ | 4,682 | $ | 4,674 | $ | 51,316 | $ | 65,362 | ||||||||||
Total Per Share Distribution | $ | 0.025 | $ | 0.025 | $ | 0.025 | $ | 0.275 | $ | 0.350 | ||||||||||
The tax composition of our distributions declared for the years ended December 31, 2016 and 2015 was as follows:
2016 | 2015 | |||||
Ordinary Income | — | % | 8 | % | ||
Capital Gain | — | % | 35 | % | ||
Return of Capital | 100 | % | 57 | % | ||
Total | 100 | % | 100 | % | ||
For more information with respect to our distributions paid, see Part II, Item 7, “Management’s Discussion and Analysis of Financial Condition and Results of Operations — Distributions.”
In accordance with the Plan of Liquidation, our objectives for 2017 are to (i) pursue an orderly liquidation of our company pursuant to the Plan of Liquidation; and (ii) maximize stockholder value by selling all of our remaining assets, paying our debts and providing for the payment of unknown or contingent liabilities, distributing the net proceeds from liquidation to our stockholders and winding up our operations and dissolving our company.
We expect to pay multiple liquidating distribution payments to our stockholders during the liquidation process and to pay the final liquidating distribution after we sell all of our assets, pay all of our known liabilities and provide for unknown liabilities. We expect to complete these activities within 24 months from January 27, 2017, the day our stockholders approved Plan of Liquidation. However, our expectations about the amount of liquidating distributions that we will pay and when we will pay them are based on many estimates and assumptions, one or more of which may prove to be incorrect. As a result, the actual amount of liquidating distributions we pay to our stockholders may be more or less than we estimate and the liquidating distributions may be paid later than we predict. We do not expect to pay regular quarterly distributions during the liquidation process. We intend to maintain adequate cash reserves for liquidity, capital expenditures, debt repayments, future Special Redemptions under our share redemption program and other future capital needs.
51
Pursuant to the Plan of Liquidation, on March 10, 2017, our board of directors authorized an initial liquidating distribution in the amount of $1.00 per share of common stock to our stockholders of record as of the close of business on March 21, 2017. The initial liquidating distribution was paid on March 24, 2017 and was funded from proceeds from asset sales. Since it is a liquidating distribution pursuant to the Plan of Liquidation, the initial liquidating distribution reduced our stockholders’ remaining investment in us and reduced the estimated range of future liquidating distributions per share to be received by our stockholders by $1.00 per share.
During the implementation of the Plan of Liquidation, asset dispositions will cause the size of our portfolio and, therefore, operating cash flows produced by our portfolio, to be reduced. Asset sales over the past five years resulted in decreases in operating cash flow. In addition, our portfolio experienced declines in cash flow from a number of our investments. A general decline in the occupancy of our portfolio resulted in lower current cash flow. Tenant-specific issues, including bankruptcy and downsizing, resulted in decreases in our operating cash flow because these tenants terminated their leases early, did not renew their leases or did not pay their contractual rent to us. Possible future declines in rental rates, slower or potentially negative net absorption of leased space and expectations of increases in future rental concessions, including three or more months of free rent to retain tenants who are up for renewal or to sign new tenants, may result in additional decreases in cash flow. In addition, we experienced a decline in cash flow from our real estate-related investments. Some borrowers under our loan investments were unable to make contractual interest payments to us. In particular, our investments in mezzanine and mortgage loans were impacted as the operating performance and values of buildings directly or indirectly securing these investments decreased from the date of our acquisition or origination of these investments. In such instances, some of the borrowers were not been able to refinance their debt to us or sell the collateral at a price sufficient to repay our note balances in full when they became due.
Due to these factors, we may not generate sufficient operating cash flow on a quarterly basis to fund our operations. If our cash flow from operations deteriorates, we will be more dependent on asset sales to fund our operations and for our liquidity needs. These factors could also reduce the amount of liquidating distributions our stockholders receive and their overall return on investment.
For factors that may affect the implementation of the Plan of Liquidation, see Part I, Item A “Risk Factors — Risks Related to the Plan of Liquidation.”
Unregistered Sales of Equity Securities
During the year ended December 31, 2016, we did not sell any equity securities that were not registered under the Securities Act of 1933.
Share Redemption Program
We have a share redemption program pursuant to which stockholders may only sell their shares to us in connection with a stockholder’s death, “qualifying disability” or “determination of incompetence” (each as defined in the share redemption program and, together with redemptions sought in connection with a stockholder’s death, “Special Redemptions”). Such redemptions are subject to an annual dollar limitation and are further subject to the other limitations described in our share redemption program, including:
• | During each calendar year, redemptions sought in connection with Special Redemptions are limited to an annual amount determined by our board of directors. The annual dollar limitation for our share redemption program may be reviewed and adjusted from time to time during the year. The dollar limitation for calendar year 2016 was $10.0 million in the aggregate. On January 27, 2017, our board of directors approved an annual dollar limitation of $10.0 million in the aggregate for the calendar year 2017 (subject to review and adjustment during the year by our board of directors), and further subject to the limitations described in our share redemption program. |
• | During any calendar year, we may redeem no more than 5% of the weighted-average number of shares outstanding during the prior calendar year. |
• | We have no obligation to redeem shares if the redemption would violate the restrictions on distributions under Maryland law, which prohibits distributions that would cause a corporation to fail to meet statutory tests of solvency. |
We do not currently expect to have funds available for ordinary redemptions in the future.
If we cannot repurchase all shares presented for redemption in any month because of the limitations on redemptions set forth in our share redemption program, then we will honor redemption requests on a pro rata basis, except that if a pro rata redemption would result in a stockholder owning less than the minimum purchase requirement described in our most recently effective registration statement, as such registration statement has been amended or supplemented, then we would redeem all of such stockholder’s shares.
52
Upon a transfer of shares, any pending redemption requests with respect to such transferred shares will be canceled as of the date we accept the transfer. Stockholders wishing us to continue to consider a redemption request related to any transferred shares must resubmit their redemption request.
The only redemptions we made under our share redemption program in 2016 were those that qualified as, and met the requirements for, Special Redemptions under our share redemption program. In 2016, we fulfilled all redemption requests that qualified as Special Redemptions under our share redemption program with a combination of cash flow from operations and proceeds from the sale of properties in 2015 and 2016.
In connection with the approval by our stockholders of the Plan of Liquidation, on January 27, 2017, our board of directors approved the amendment and restatement of our share redemption program (the “Amended Share Redemption Program”). The Amended Share Redemption Program became effective on February 27, 2017.
Prior to effectiveness of the Amended Share Redemption Program on February 27, 2017, the redemption price for all stockholders whose shares were eligible for redemption was equal to the most recent estimated value per share of our common stock as of the redemption date.
On December 8, 2015, our board of directors approved an estimated value per share of our common stock of $3.94 per share (unaudited), based on the estimated value of our assets less the estimated value of our liabilities, divided by the number of shares outstanding, all as of September 30, 2015, with the exception of an adjustment to our net asset value to give effect to the December 7, 2015 payment of a special distribution of $0.25 per share on the outstanding shares of our common stock to the stockholders of record as of the close of business on December 1, 2015. For a full description of the methodologies and assumptions used to value our assets and liabilities in connection with the calculation of the December 2015 estimated value per share, see our Annual Report on Form 10-K for the year ended December 31, 2015 at Part II, Item 5, “Market for Registrant’s Common Equity, Related Stockholder Matters and Issuer Purchases of Equity Securities — Market Information.” Effective for redemption dates from December 2015 through September 2016, the redemption price for all stockholders whose shares were eligible for redemption was $3.94 per share.
On October 5, 2016, our board of directors approved an estimated value per share of our common stock of $3.65 per share (unaudited), based on the estimated value of our assets less the estimated value of our liabilities, divided by the number of shares outstanding, all as of June 30, 2016, except for certain items discussed in Part II, Item 5, “Market for Registrant’s Common Equity, Related Stockholder Matters and Issuer Purchases of Equity Securities — Market Information” for which estimated values were adjusted subsequent to June 30, 2016. The redemption price for all shares eligible for redemption was $3.65 per share for redemption dates from October 2016 through December 2016. For a full description of the methodologies and assumptions used to value our assets and liabilities in connection with the calculation of the October 2016 estimated value per share, see Part II, Item 5, “Market for Registrant’s Common Equity, Related Stockholder Matters and Issuer Purchases of Equity Securities — Market Information.”
The Amended Share Redemption Program changes the redemption price per share of our common stock eligible for redemption to take into account the estimated range of liquidating distributions as disclosed in our Definitive Proxy Statement, filed with the SEC on November 10, 2016 and any liquidating distributions declared by our board of directors. The Amended Share Redemption Program sets the redemption price per share of our common stock eligible for redemption at (a) $3.475 (which represents the mid-point of the estimated range of liquidating distributions of $3.27 to $3.68 per share) less (b) the amount of any liquidating distributions on such share declared by our board of directors that have a record date prior to the redemption date for such share. Therefore, effective for the February 28, 2017 redemption date, the redemption price for all shares eligible for redemption was equal to $3.475. Pursuant to the Plan of Liquidation, on March 10, 2017, our board of directors authorized an initial liquidating distribution on the outstanding shares of our common stock to our stockholders of record as of the close of business on March 21, 2017, with the amount per share of the initial liquidating distribution to be $1.00. The initial liquidating distribution was paid on March 24, 2017 and was funded from proceeds from asset sales. Therefore, effective commencing with the March 31, 2017 redemption date, the redemption price for all shares eligible for redemption will be equal to $2.475.
We will report the redemption price in a Current Report on Form 8-K or in our annual or quarterly reports, all publicly filed with the SEC.
The Amended Share Redemption Program also changed the notice period for amending, suspending or terminating the program. The Amended Share Redemption Program provides that we may amend, suspend or terminate the program for any reason upon 10 (ten) days’ notice to our stockholders.
The complete Amended Share Redemption Program is filed as an exhibit to our Current Report on Form 8-K filed with the SEC January 27, 2017 and is available at the SEC’s website at www.sec.gov.
53
During the year ended December 31, 2016 we redeemed shares pursuant to our share redemption program as follows:
Month | Total Number of Shares Redeemed (1) | Average Price Paid Per Share | Approximate Dollar Value of Shares Available That May Yet Be Redeemed Under the Program | ||||||
January 2016 | 110,866 | $ | 3.94 | (2) | (3) | ||||
February 2016 | 111,902 | $ | 3.94 | (2) | (3) | ||||
March 2016 | 93,851 | $ | 3.94 | (2) | (3) | ||||
April 2016 | 218,998 | $ | 3.94 | (2) | (3) | ||||
May 2016 | 111,156 | $ | 3.94 | (2) | (3) | ||||
June 2016 | 188,704 | $ | 3.94 | (2) | (3) | ||||
July 2016 | 79,807 | $ | 3.94 | (2) | (3) | ||||
August 2016 | 148,610 | $ | 3.94 | (2) | (3) | ||||
September 2016 | 135,816 | $ | 3.94 | (2) | (3) | ||||
October 2016 | 63,962 | $ | 3.65 | (2) | (3) | ||||
November 2016 | 69,149 | $ | 3.65 | (2) | (3) | ||||
December 2016 | 96,044 | $ | 3.65 | (2) | (3) | ||||
Total | 1,428,865 | ||||||||
(1) We announced commencement of our share redemption program on April 6, 2006 and amendments to the program on August 16, 2006 (which amendment became effective on December 14, 2006), August 1, 2007 (which amendment became effective on September 13, 2007), August 14, 2008 (which amendment became effective on September 13, 2008), March 26, 2009 (which amendment became effective on April 26, 2009), May 13, 2009 (which amendment became effective on June 12, 2009), March 26, 2012 (which amendment became effective on April 25, 2012), March 13, 2013 (which amendment became effective on April 12, 2013) and January 27, 2017 (which amendment became effective on February 27, 2017).
(2) We describe the determination of the redemption price above.
(3) We limit the dollar value of shares that may be redeemed under our share redemption program as described above. During the year ended December 31, 2016, we redeemed $5.6 million of shares of common stock. The only redemptions we made under our share redemption program during the year ended December 31, 2016 were those that qualified as, and met the requirements for, Special Redemptions under our share redemption program. For the year ended December 31, 2016, we fulfilled all redemption requests that qualified as Special Redemptions under our share redemption program. On January 27, 2017, our board of directors approved an annual dollar limitation for redemptions of $10.0 million in the aggregate for the calendar year 2017.
54
ITEM 6. | SELECTED FINANCIAL DATA |
The following selected financial data as of and for the years ended December 31, 2016, 2015, 2014, 2013 and 2012 should be read in conjunction with the accompanying consolidated financial statements and related notes thereto and Part II, Item 7, “Management’s Discussion and Analysis of Financial Condition and Results of Operations” below (in thousands, except share and per share amounts):
As of December 31, | ||||||||||||||||||||
2016 | 2015 | 2014 | 2013 | 2012 | ||||||||||||||||
Balance sheet data | ||||||||||||||||||||
Total real estate and real estate-related investments, net | $ | 406,181 | $ | 888,161 | $ | 1,159,478 | $ | 1,335,604 | $ | 1,820,366 | ||||||||||
Total assets | 641,927 | 1,054,865 | 1,374,138 | 1,742,541 | 2,301,425 | |||||||||||||||
Total notes payable, net | — | 428,222 | 656,069 | 959,926 | 1,318,403 | |||||||||||||||
Total liabilities | 45,495 | 525,202 | 761,365 | 1,086,648 | 1,520,010 | |||||||||||||||
Redeemable common stock | — | 10,000 | 10,000 | 10,000 | 10,000 | |||||||||||||||
Total KBS Real Estate Investment Trust, Inc. stockholders’ equity | 596,432 | 519,663 | 602,773 | 645,893 | 771,415 | |||||||||||||||
For the Years Ended December 31, | ||||||||||||||||||||
2016 | 2015 | 2014 | 2013 | 2012 | ||||||||||||||||
Operating data | ||||||||||||||||||||
Total revenues | $ | 129,334 | $ | 188,220 | $ | 212,465 | $ | 218,304 | $ | 218,093 | ||||||||||
Gain (loss) from continuing operations (1) | 90,811 | (11,775 | ) | (27,389 | ) | (88,240 | ) | (78,367 | ) | |||||||||||
Gain (loss) from continuing operations per common share - basic and diluted (1) | $ | 0.49 | $ | (0.06 | ) | $ | (0.14 | ) | $ | (0.46 | ) | $ | (0.41 | ) | ||||||
Net income (loss) attributable to common stockholders | 90,893 | (11,387 | ) | (21,266 | ) | (46,495 | ) | (43,142 | ) | |||||||||||
Net income (loss) per common share, basic and diluted | $ | 0.49 | $ | (0.06 | ) | $ | (0.11 | ) | $ | (0.24 | ) | $ | (0.23 | ) | ||||||
Other data | ||||||||||||||||||||
Cash flows (used in) provided by operating activities | $ | (13,861 | ) | $ | 19,431 | $ | 3,265 | $ | 5,329 | $ | 31,629 | |||||||||
Cash flows provided by investing activities | 591,394 | 275,611 | 82,777 | 180,862 | 886,120 | |||||||||||||||
Cash flows used in financing activities | (479,240 | ) | (329,993 | ) | (277,072 | ) | (241,225 | ) | (714,119 | ) | ||||||||||
Distributions declared | $ | 18,561 | $ | 65,362 | $ | 9,412 | $ | 75,015 | $ | 16,227 | ||||||||||
Distributions declared per common share (2) | 0.100 | 0.350 | 0.050 | 0.395 | 0.085 | |||||||||||||||
Weighted-average number of common shares outstanding, basic and diluted | 185,704,854 | 187,219,590 | 188,891,977 | 190,454,153 | 191,547,385 | |||||||||||||||
_____________________
(1) Amounts include certain properties in continuing operations that were held for sale or sold as of December 31, 2014, 2015 and 2016 in accordance with ASU No. 2014-08, Presentation of Financial Statements (Topic 205) and Property, Plant and Equipment (Topic 360). See Note 6 “Real Estate Held for Sale and Discontinued Operations” for more information on the Company’s real estate held for sale and discontinued operations as of December 31, 2014, 2015 and 2016.
(2) For information related to distributions declared per common share for the years ended December 31, 2016 and 2015, see Part II, Item 5, “Market for Registrant’s Common Equity, Related Stockholder Matters and Issuer Purchases of Equity Securities — Distribution Information.”
55
ITEM 7. | MANAGEMENT’S DISCUSSION AND ANALYSIS OF FINANCIAL CONDITION AND RESULTS OF OPERATIONS |
The following discussion and analysis should be read in conjunction with the “Selected Financial Data” above and our accompanying consolidated financial statements and the notes thereto. Also see “Forward-Looking Statements” preceding Part I, Item 1, “Business” and Part I, Item 1A, “Risk Factors.”
Overview
We are a Maryland corporation that was formed on June 13, 2005 to invest in a diverse portfolio of real estate properties and real estate-related investments. We elected to be taxed as a real estate investment trust (“REIT”) beginning with the taxable year ended December 31, 2006 and we intend to continue to operate in such a manner. We own substantially all of our assets and conduct our operations through our Operating Partnership, of which we are the sole general partner. Subject to certain restrictions and limitations, our business is managed by KBS Capital Advisors LLC (“KBS Capital Advisors”), our external advisor, pursuant to an advisory agreement. Our advisor owns 20,000 shares of our common stock. We have no paid employees.
On January 27, 2006, we launched our initial public offering of up to 200,000,000 shares of common stock in our primary offering and 80,000,000 shares of common stock under our dividend reinvestment plan. We ceased offering shares of common stock in our primary offering on May 30, 2008. We terminated our dividend reinvestment plan effective April 10, 2012. We sold 171,109,494 shares in our primary offering for gross offering proceeds of $1.7 billion and 28,306,086 shares under our dividend reinvestment plan for gross offering proceeds of $233.7 million.
As of December 31, 2016, we owned or, with respect to a limited number of properties, held a leasehold interest in, 90 real estate properties (of which 30 GKK Properties were held for sale). In addition, as of December 31, 2016, we owned three real estate loans receivable and a participation interest with respect to a real estate joint venture.
On September 1, 2011, we, through indirect wholly owned subsidiaries (collectively, “KBS”), entered into a Collateral Transfer and Settlement Agreement (the “Settlement Agreement”) with, among other parties, GKK Stars Acquisition LLC (“GKK Stars”), the wholly owned subsidiary of Gramercy Property Trust, Inc. (“Gramercy”) that indirectly owned the Gramercy real estate portfolio, to effect the orderly transfer of certain assets and liabilities of the Gramercy real estate portfolio to KBS in satisfaction of certain debt obligations under a mezzanine loan owed by wholly owned subsidiaries of Gramercy to KBS (the “GKK Mezzanine Loan”). The Settlement Agreement resulted in the transfer of the equity interests in certain subsidiaries of Gramercy (the “Equity Interests”) that indirectly owned or, with respect to a limited number of properties, held a leasehold interest in, 867 properties (the “GKK Properties”), consisting of 576 bank branch properties and 291 office buildings, operations centers and other properties. For a further discussion of the Settlement Agreement, the transfers of the GKK Properties and the debt related to these properties, see our Annual Report on Form 10-K for the year ended December 31, 2011 filed with the SEC.
Plan of Liquidation
On January 27, 2016, our board of directors formed the Special Committee composed of all of our independent directors to explore the availability of strategic alternatives involving us. As part of the process of exploring strategic alternatives, on February 23, 2016, the Special Committee engaged Evercore to act as our financial advisor and to assist the Special Committee with this process. Under the terms of the engagement, Evercore provided various financial advisory services, as requested by the Special Committee, as customary for an engagement in connection with exploring strategic alternatives. On October 5, 2016, in connection with a review of potential strategic alternatives available to us, the Special Committee and our board of directors unanimously approved the sale of all of our assets and our dissolution pursuant to the terms of the Plan of Liquidation. The principal purpose of the Plan of Liquidation is to maximize stockholder value by selling our assets, paying our debts and distributing the net proceeds from liquidation to our stockholders. On January 27, 2017, our stockholders approved the Plan of Liquidation. For more information, see the Plan of Liquidation, which is included as an exhibit to this Annual Report on Form 10-K.
56
In accordance with the Plan of Liquidation, our objectives for 2017 are to (i) pursue an orderly liquidation of our company pursuant to the Plan of Liquidation; and (ii) maximize stockholder value by selling all of our remaining assets, paying our debts, providing for the payment of unknown or contingent liabilities, distributing the net proceeds from liquidation to our stockholders and winding up our operations and dissolving our company. While pursuing our liquidation pursuant to the Plan of Liquidation, we intend to continue to manage our portfolio of assets with the goal of maximizing stockholder value. We expect to pay multiple liquidating distribution payments to our stockholders during the liquidation process. We expect to distribute all of the net proceeds from liquidation to our stockholders within 24 months from January 27, 2017. However, if we cannot sell our assets and pay our debts within 24 months, or if the board of directors and the Special Committee determine that it is otherwise advisable to do so, pursuant to the Plan of Liquidation, we may transfer and assign our remaining assets to a liquidating trust. Upon such transfer and assignment, our stockholders will receive beneficial interests in the liquidating trust. We can give no assurance regarding the timing of asset dispositions in connection with the implementation of the Plan of Liquidation, the sale prices we will receive for our assets, and the amount or timing of liquidating distributions to be received by our stockholders.
Pursuant to the Plan of Liquidation, on March 10, 2017, our board of directors authorized an initial liquidating distribution in the amount of $1.00 per share of common stock to our stockholders of record as of the close of business on March 21, 2017. The initial liquidating distribution was paid on March 24, 2017 and was funded from proceeds from asset sales. Since it is a liquidating distribution pursuant to the Plan of Liquidation, the initial liquidating distribution reduced our stockholders’ remaining investment in us and reduced the estimated range of future liquidating distributions per share to be received by our stockholders by $1.00 per share.
Market Outlook – Real Estate and Real Estate Finance Markets
The following discussion is based on management’s beliefs, observations and expectations with respect to the real estate and real estate finance markets.
Conditions in the global capital markets remain volatile as of the first quarter of 2017. Current economic data and financial market developments suggest that the global economy is improving, although at a slow and uneven pace. European economic growth has recently picked up, whereas the U.K. and China remain areas of concern. Against this backdrop, the central banks of the world’s major industrialized economies are beginning to back away from their strong monetary accommodation. Quantitative easing in Japan and Europe is slowing, but the liquidity generated from these programs continues to impact the global capital markets. For further discussion of current market conditions, see Part I, Item 1, “Business ─ Market Outlook ─ Real Estate and Real Estate Finance Markets.”
Impact on Our Real Estate Investments
The volatility in the global financial markets continues to cause a level of uncertainty in our outlook for the performance of the U.S. commercial real estate markets. Both the investing and leasing environments are highly competitive. While foreign capital continues to flow into U.S. real estate markets, the uncertainty regarding the political, regulatory and economic environments has introduced uncertainty into the markets. Possible future declines in rental rates, slower or potentially negative net absorption of leased space and expectations of future rental concessions, including free rent to renew tenants early, to retain tenants who are up for renewal or to attract new tenants, may result in decreases in cash flows. The FED increased interest rates in the fourth quarter of 2015 and again in December 2016. The real estate and finance markets anticipate further rate increases as long as the economy remains strong.
Impact on Our Real Estate-Related Investments
All of our real estate-related investments are directly or indirectly secured by commercial real estate. As a result, our real estate-related investments, in general, have been and likely will continue to be impacted by the same factors impacting our real estate properties. The higher yields and the improving credit position of many U.S. tenants and borrowers have attracted global capital. However, the real estate and capital markets are fluid, and the positive trends can reverse quickly. Economic conditions remain relatively volatile and can have a negative impact on the performance of collateral securing our loan investments, and therefore may impact the ability of some of the borrowers under our loans to make contractual interest payments to us.
As of December 31, 2016, we had three fixed rate real estate-related loan investments with a total book value (excluding asset-specific loan loss reserves) of $28.0 million. As of December 31, 2016, the Sandmar Mezzanine Loan, which has a book value of zero after asset specific loan loss reserves, the San Diego Office Portfolio B-Note, which has a book value of $19.2 million, and the 4929 Wilshire B-Note, which has a book value of $3.7 million, were scheduled to mature within one year from December 31, 2016. As of December 31, 2016, we had recorded $5.1 million of reserves for loan losses related to the Sandmar Mezzanine Loan. Subsequent to December 31, 2016, the borrower under the Sandmar Mezzanine Loan defaulted.
57
Liquidity and Capital Resources
As described above under “ — Overview — Plan of Liquidation,” on January 27, 2017, our stockholders approved the sale of all of our assets and our dissolution pursuant to the terms of the Plan of Liquidation. We expect to sell all of our assets, pay all of our known liabilities, provide for unknown liabilities and distribute the net proceeds from liquidation to our stockholders. There can be no assurances regarding the amounts of any liquidating distributions or the timing thereof.
Our principal demands for funds during the short- and long-term are and will be for: the payment of operating expenses, capital expenditures and general and administrative expenses, including expenses in connection with the Plan of Liquidation; Special Redemptions of common stock pursuant to our share redemption program; and the payment of liquidating distributions to our stockholders pursuant to the Plan of Liquidation.
We intend to use our cash on hand, proceeds from asset sales and principal repayments on our real estate loans receivable as our primary sources of liquidity. To the extent available, we also intend to use cash flow generated by our real estate and real estate-related investments, however, we have suffered declines in cash flows from these sources and asset sales will further reduce cash flows from these sources.
Our share redemption program provides only for Special Redemptions. Such redemptions are subject to an annual dollar limitation. On December 8, 2015, our board of directors approved an annual dollar limitation for redemptions of $10.0 million in the aggregate for the calendar year 2016 (subject to review and adjustment during the year by our board of directors), and further subject to the limitations described in the share redemption program document. On January 27, 2017, our board of directors approved an annual dollar limitation for redemptions of $10.0 million in the aggregate for the calendar year 2017 (subject to review and adjustment during the year by our board of directors), and further subject to the limitations described in the share redemption program document. Based on historical redemption activity, we believe the $10.0 million redemption limitation for the calendar year 2017 will be sufficient for these Special Redemptions. During each calendar year, the annual dollar limitation for our share redemption program will be reviewed and adjusted from time to time, if necessary. We currently do not expect to have funds available for ordinary redemptions in the future.
During the year ended December 31, 2016, our board of directors declared quarterly distributions in the amount of $0.025 per share of common stock to stockholders of record as of the respective quarterly record date. We funded these distributions with cash flow from operations from the current period, prior period cash flow from operations in excess of distributions paid and proceeds from the sales of our properties. We do not expect to pay regular quarterly distributions during the liquidation process. We intend to maintain adequate cash reserves for liquidity, capital expenditures, future Special Redemptions and other future capital needs.
Our investments in real estate generate cash flow in the form of rental revenues and tenant reimbursements, which are reduced by operating expenditures, the payment of asset management fees and corporate general and administrative expenses. Cash flow from operations from our real estate investments is primarily dependent upon the occupancy level of our portfolio, the net effective rental rates on our leases, the collectibility of rent and operating recoveries from our tenants and how well we manage our expenditures. As of December 31, 2016, our real estate held for investment was 88% occupied.
Our real estate-related investments generate cash flow in the form of interest income, which is reduced by the payment of asset management fees and corporate general and administrative expenses. Cash flow from operations from our real estate-related investments is primarily dependent on the operating performance of the underlying collateral and the borrowers’ ability to make debt service payments. As of December 31, 2016, the borrower under the Sandmar Mezzanine Loan was delinquent. On May 13, 2016, we received a deed-in-lieu of foreclosure in satisfaction of all amounts due to us under our investment in the Lawrence Village Plaza Loan Origination and received title to the collateral that secured the loan.
As of December 31, 2016, the Sandmar Mezzanine Loan, which has a book value of zero after asset specific loan loss reserves, the San Diego Office Portfolio B-Note, which has a book value of $19.2 million, and the 4929 Wilshire B-Note, which has a book value of $3.7 million, were scheduled to mature within one year from December 31, 2016. As of December 31, 2016, we had recorded $5.1 million of reserves for loan losses related to the Sandmar Mezzanine Loan.
As a result of the factors described above and asset sales pursuant to the Plan of Liquidation, we may experience declines in future cash flow from our real estate and real estate-related investments and we expect an increased need for capital to cover leasing costs and capital improvements needed to improve the performance of our real estate assets and prepare these assets for sale.
For the year ended December 31, 2016, we met our cash needs for leasing costs, capital expenditures and the payment of debt obligations with cash on hand and proceeds from asset sales. We met our operating cash needs during the same period through cash flow generated by our real estate and real estate-related investments. We believe that potential proceeds from the sale of real estate, cash flow from operations, potential proceeds from the sale or payoff of real estate loans receivable and cash on hand will be sufficient to meet our liquidity needs for 2017.
58
Under our charter, we are required to limit our total operating expenses to the greater of 2% of our average invested assets or 25% of our net income for the four most recently completed fiscal quarters, as these terms are defined in our charter, unless the conflicts committee has determined that such excess expenses were justified based on unusual and non-recurring factors. Operating expenses for the four fiscal quarters ended December 31, 2016 exceeded the charter-imposed limitation and the conflicts committee of our board of directors determined that these expenses were justified given the professional fees and expenses we incurred related to our exploration of the availability of strategic alternatives and the fees and expenses related to preparation and solicitation of proxies in connection with our stockholders’ approval of the Plan of Liquidation. As a result of pursuing the Plan of Liquidation we anticipate that we will continue to exceed this limitation each quarter throughout the liquidation process as we sell our assets and incur liquidation costs along with certain general and administrative costs that are somewhat fixed in nature and not entirely based on the size of the company. We considered these costs and expenses in determining the estimated range of net proceeds from liquidation, and as of March 28, 2017, we do not expect these costs and expenses to change the estimated range of net proceeds per share from the liquidation.
Cash Flows from Operating Activities
As of December 31, 2016, we owned or, with respect to a limited number of properties, held a leasehold interest in 90 real estate properties (of which 30 GKK Properties were held for sale). In addition, as of December 31, 2016, we owned three real estate loans receivable and a participation interest with respect to a real estate joint venture.
During the year ended December 31, 2016, net cash used in operating activities was $13.9 million, compared to $19.4 million of net cash provided by operating activities during the year ended December 31, 2015. Net cash from operations decreased in 2016 primarily due to asset sales and the timing of payments of prepaid expenditures, offset by a decrease in interest paid as a result of debt refinancing and restructuring and debt payoffs, which resulted in an overall decrease in effective interest rates and a decrease in principal outstanding. We anticipate cash flows from operating activities will decrease due to anticipated asset sales.
Cash Flows from Investing Activities
Net cash provided by investing activities was $591.4 million for the year ended December 31, 2016. The significant sources and uses of net cash provided by investing activities were as follows:
• | $617.4 million of cash provided from the sale of real estate; |
• | $27.0 million of cash used for improvements to real estate; and |
• | $1.0 million of insurance proceeds received for property damage. |
Cash Flows from Financing Activities
Net cash used in financing activities was $479.2 million for the year ended December 31, 2016. The significant sources and uses of cash for financing activities were as follows:
• | $263.8 million of principal payments on notes payable; |
• | $184.8 million of cash used to purchase treasury securities in connection with the defeasance of notes payable; |
• | $18.6 million of cash used for distributions; |
• | $6.4 million of cash used for prepayment premium on the repayment of debt; and |
• | $5.6 million of cash used for redemptions of common stock. |
In addition to using our capital resources for leasing costs, for capital expenditures, for operating costs, to fund Special Redemptions pursuant to our share redemption program and to pay distributions to our stockholders, we use our capital resources to make certain payments to our advisor. We also reimburse our advisor and dealer manager for certain costs they incur on our behalf. We pay our advisor fees in connection with the management and disposition of our assets.
Among the fees payable to our advisor is an asset management fee. With respect to investments in real estate, we pay our advisor a monthly asset management fee equal to one-twelfth of 0.75% of the amount actually paid or allocated to acquire the investment, plus the cost of any subsequent development, construction or improvements to the property. This amount includes any portion of the investment that was debt financed and is inclusive of acquisition fees and expenses related thereto. In the case of investments made through joint ventures, the asset management fee is determined based on our proportionate share of the underlying investment.
59
With respect to investments in loans and any investments other than real estate, we pay our advisor a monthly asset management fee calculated, each month, as one-twelfth of 0.75% of the lesser of (i) the amount actually paid or allocated to acquire or fund the loan or other investment (which amount includes any portion of the investment that was debt financed and is inclusive of acquisition or origination fees and expenses related thereto) and (ii) the outstanding principal amount of such loan or other investment, plus the acquisition or origination fees and expenses related to the acquisition or funding of such investment, as of the time of calculation.
With respect to an investment that has suffered an impairment in value, reduction in cash flow or other negative circumstances, such investment may either be excluded from the calculation of the asset management fee described above or included in such calculation at a reduced value that is recommended by our advisor and our management and then approved by a majority of our independent directors, and this change in the fee shall be applicable to an investment upon the earlier to occur of the date on which (i) such investment is sold, (ii) such investment is surrendered to a person other than the company, our direct or indirect wholly owned subsidiary or a joint venture or partnership in which we have an interest, (iii) our advisor determines that it will no longer pursue collection or other remedies related to such investment, or (iv) our advisor recommends a revised fee arrangement with respect to such investment. As of December 31, 2016, we excluded our interest in an unconsolidated joint venture from the calculation of asset management fees. Through March 31, 2016, we calculated the asset management fee for the GKK Properties based on the original cost of our investment in the GKK Mezzanine Loan, rather than on the gross value of the GKK Properties we own or in which we hold a leasehold interest. Beginning in April 2016, the gross value of the GKK Properties fell below the original cost of our investment in the GKK Mezzanine Loan and for the period from April 1, 2016 through December 31, 2016, we calculated the asset management fee for these properties based on the gross value of the GKK Properties. As of December 31, 2016, we had not determined to calculate the asset management fee at an adjusted value for any other investments or to exclude any other investments from the calculation of the asset management fee.
On November 8, 2016, we renewed the advisory agreement with our advisor, which renewed advisory agreement included the provisions of Amendment No. 1 related to the payment of disposition fees.
As of December 31, 2016, we had $184.8 million of cash, cash equivalents and restricted cash.
As of December 31, 2016, we had no mortgage debt outstanding.
Contractual Commitments and Contingencies
The following is a summary of our contractual obligations as of December 31, 2016 (in thousands):
Payments Due During the Years Ending December 31, | ||||||||||||||||||||
Contractual Obligations | Total | 2017 | 2018-2019 | 2020-2021 | Thereafter | |||||||||||||||
Operating leases(1) | $ | 40,261 | $ | 11,026 | $ | 1,792 | $ | 1,414 | $ | 26,029 | ||||||||||
(1) Amounts relate to future minimum lease payments under non-cancelable building and ground leases. Included in these amounts are total lease obligations of $29.6 million related to a property located in downtown St. Petersburg, Florida. On January 20, 2017, we terminated the ground lease at downtown St. Petersburg and paid an aggregate of $10.0 million to settle the remaining obligations under the ground lease. In connection with the leasehold termination, we wrote-off $9.3 million of above-market lease liability.
Asset Management Services Agreement Related to the GKK Properties
On December 19, 2013, we, through KBS Acquisition Sub, entered into the Amended Services Agreement with GKKRA with respect to the GKK Properties. The effective date of the Amended Services Agreement was December 1, 2013. Pursuant to the Amended Services Agreement, GKKRA agreed to provide the Services relating to the GKK Properties. As compensation for the Services, we agreed to pay GKKRA: (i) an annual fee of $7.5 million plus all GKK Property-related expenses incurred by GKKRA, (ii) subject to certain terms and conditions in the Amended Services Agreement, a profit participation interest based on a percentage (ranging from 10% to 30%) of the amount by which the gross fair market value or gross sales price of certain identified portfolios of GKK Properties exceeds the sum of (a) an agreed-upon baseline value for such GKK Property portfolios plus (b) new capital expended to increase the value of GKK Properties within the portfolios and expenditures made to pay for tenant improvements and leasing commissions related to these GKK Properties as of the measurement date, and (iii) a monthly construction oversight fee equal to a percentage of construction costs for certain construction projects at the GKK Properties overseen by GKKRA.
60
On June 29, 2016, KBS Acquisition Sub entered into the Second Amended Services Agreement and the Accounting/Construction Services Agreement, with GKKRA. The effective date of both the Second Amended Services Agreement and the Accounting/Construction Services Agreement was June 1, 2016. Combined, the Services and the key terms and compensation for the Services under the Second Amended Services Agreement and the Accounting/Construction Services Agreement are the same as those of the prior Amended Services Agreement; the two agreements allocate the Services and the compensation between asset management services and accounting/construction services. On June 29, 2016, GKKRA assigned the Second Amended Services Agreement to GPT. Neither the Property Manager nor Gramercy Property Trust is affiliated with us or KBS Acquisition Sub.
On November 17, 2016, KBS Acquisition Sub entered into the First Amendment to Second Amended Services Agreement and the First Amendment to Accounting/Construction Services Agreement to, among other changes, (i) extend the termination date of both agreements from December 31, 2016 to March 31, 2017, at which point we do not anticipate that GKK Properties will make up a significant percentage of our assets and (ii) reduce the base management fee for the Services from $625,000 per month to $550,000 per month plus GKK Property-related expenses incurred by GPT for the period commencing on January 1, 2017 through March 31, 2017. In addition, we agreed to pay GPT an amount equal to $1.0 million upon termination of a leasehold interest of a property located in downtown St. Petersburg, Florida.
As of December 31, 2016, we accrued $12.8 million of estimated profit participation interest related to the GKK Properties under the Second Amended Services Agreement, as amended by the First Amendment to the Second Amended Services Agreement.
Results of Operations
Overview
As of December 31, 2015, we owned or, with respect to a limited number of properties, held a leasehold interest in, 364 real estate properties (of which eight properties were held for sale), four real estate loans receivable (two of which were impaired) and a participation interest with respect to a real estate joint venture. Subsequent to December 31, 2015, we sold four historical real estate properties and 269 GKK Properties, terminated the lease of two GKK Properties in which we held a leasehold interest and received title to a retail property in connection with a deed-in-lieu of foreclosure in satisfaction of all amounts due under our investment in the Lawrence Village Plaza Loan Origination. As a result, as of December 31, 2016, we owned or, with respect to a limited number of properties, held a leasehold interest in, 90 real estate properties (of which 30 GKK Properties were held for sale), three real estate loans receivable (one of which was impaired) and a participation interest with respect to a real estate joint venture.
In accordance with ASU No. 2014-08, Presentation of Financial Statements (Topic 205) and Property, Plant, and Equipment (Topic 360): Reporting Discontinued Operations and Disclosures of Disposals of Components of an Entity (“ASU No. 2014-08”), operating results of properties that are classified as held for sale in the ordinary course of business on or subsequent to January 1, 2014 would generally be included in continuing operations on our consolidated statements of operations. Operating results of properties that were classified as held for sale in financial statements issued for the reporting periods prior to reporting periods beginning January 1, 2014 will remain in discontinued operations on our consolidated statement of operations. During the year ended December 31, 2016, we sold four historical real estate properties and 269 GKK Properties, which properties were not classified as held for sale in financial statements issued for the reporting periods prior to January 1, 2014. As of December 31, 2016, we had classified 30 properties as held for sale, all of which were GKK Properties. During the year ended December 31, 2015, we sold three historical real estate properties and 30 GKK Properties, which properties were not classified as held for sale in financial statements issued for the reporting periods prior to January 1, 2014. In accordance with ASU No. 2014-08, the operations of these properties are included in continuing operations on our consolidated statements of operations.
Our results of operations for the year ended December 31, 2016 are not indicative of those expected in future periods due to asset sales and anticipated asset sales. Pursuant to the Plan of Liquidation, we will undertake an orderly liquidation by selling all of our assets, paying our debts, providing for known and unknown liabilities and distributing the net proceeds from liquidation to our stockholders. There can be no assurances regarding the amounts of any liquidating distributions or the timing thereof. In general, we expect that our revenues and expenses related to our portfolio will decrease in future periods due to anticipated disposition activity.
61
Comparison of the year ended December 31, 2016 versus the year ended December 31, 2015
The following table provides summary information about our results of operations for the year ended December 31, 2016 and 2015 (dollar amounts in thousands):
Years Ended December 31, | Increase (Decrease) | Percentage Change | $ Change Due to Dispositions (1) | $ Change Due to Properties or Loans Held Throughout Both Periods (2) | ||||||||||||||||||
2016 | 2015 | |||||||||||||||||||||
Rental income | $ | 97,383 | $ | 135,117 | $ | (37,734 | ) | (28 | )% | $ | (41,452 | ) | $ | 3,718 | ||||||||
Tenant reimbursements | 26,977 | 47,217 | (20,240 | ) | (43 | )% | (20,558 | ) | 318 | |||||||||||||
Interest income from real estate loans receivable | 2,845 | 3,089 | (244 | ) | (8 | )% | N/A | N/A | ||||||||||||||
Parking revenues and other operating income | 2,129 | 2,797 | (668 | ) | (24 | )% | (656 | ) | (12 | ) | ||||||||||||
Operating, maintenance and management costs | 52,857 | 75,034 | (22,177 | ) | (30 | )% | (22,991 | ) | 814 | |||||||||||||
Real estate taxes, property-related taxes and insurance | 15,998 | 23,696 | (7,698 | ) | (32 | )% | (8,366 | ) | 668 | |||||||||||||
Asset management fees to affiliate | 7,553 | 9,547 | (1,994 | ) | (21 | )% | (895 | ) | (1,099 | ) | ||||||||||||
Foreclosure fees and expenses | 278 | — | 278 | 100 | % | — | 278 | |||||||||||||||
General and administrative expenses | 15,971 | 32,619 | (16,648 | ) | (51 | )% | N/A | N/A | ||||||||||||||
Depreciation and amortization expense | 35,961 | 59,145 | (23,184 | ) | (39 | )% | (24,562 | ) | 1,378 | |||||||||||||
Interest expense | 10,536 | 29,517 | (18,981 | ) | (64 | )% | (16,192 | ) | (2,789 | ) | ||||||||||||
Impairment charge on real estate | 33,419 | 49,306 | (15,887 | ) | (32 | )% | (18,209 | ) | 2,322 | |||||||||||||
Provision for loan losses | — | 2,504 | (2,504 | ) | (100 | )% | N/A | N/A | ||||||||||||||
Gain on sales of real estate, net | 159,464 | 99,988 | 59,476 | 59 | % | 59,476 | — | |||||||||||||||
Gain on sales of foreclosed real estate held for sale | — | 2,509 | (2,509 | ) | (100 | )% | N/A | N/A | ||||||||||||||
Loss from extinguishment of debt | (26,343 | ) | (22,518 | ) | (3,825 | ) | 17 | % | (3,825 | ) | — | |||||||||||
Gain on sales of real estate, net (discontinued operations) | — | 124 | (124 | ) | (100 | )% | (124 | ) | — | |||||||||||||
Income from discontinued operations | 82 | 264 | (182 | ) | (69 | )% | (182 | ) | — | |||||||||||||
_____________________
(1) Represents the dollar amount increase (decrease) for the year ended December 31, 2016 compared to the year ended December 31, 2015 related to real estate and real estate-related investments disposed of on or after January 1, 2015.
(2) Represents the dollar amount increase (decrease) for the year ended December 31, 2016 compared to the year ended December 31, 2015 related to real estate and real estate-related investments owned by us throughout both periods presented.
Rental income from our real estate properties decreased by $37.7 million primarily due to properties sold, the results of which are included in income from continuing operations, partially offset by an increase in rental income due to an increase in occupancy at certain properties and our receipt of title to a retail property in connection with a deed-in-lieu of foreclosure in satisfaction of all amounts due under our investment in the Lawrence Village Plaza Loan Origination. Overall, we expect rental income to decrease in future periods due to anticipated real estate property sales. Our rental income in future periods will also vary based on the occupancy rates and rental rates of the properties in our portfolio.
Tenant reimbursements from our real estate properties decreased by $20.2 million primarily due to properties sold, the results of which are included in income from continuing operations. Our tenant reimbursements in future periods will vary based on several factors, including the occupancy rates of the properties in our portfolio, changes in base year terms, and changes in reimbursable operating expenses. Generally, as new leases are negotiated, the base year resets to operating expenses incurred in the year the lease is signed and the tenant generally only reimburses operating expenses to the extent and by the amount that its allocable share of the building’s operating expenses in future years increases from its base year. As a result, as new leases are executed, tenant reimbursements would generally decrease. Rental income may or may not change by amounts corresponding to changes in tenant reimbursements due to new leases. Overall, we expect tenant reimbursements to decrease in future periods due to anticipated real estate property sales.
62
Interest income from real estate loans receivable decreased by $0.2 million. In general, we expect interest income in future periods to remain fairly constant, but to decrease to the extent that we receive principal repayments on or make dispositions of real estate loans receivable. All three of our loans receivable are scheduled to mature in 2017. On September 1, 2015, the Lawrence Village Plaza Loan Origination matured without repayment. Subsequently, we received interest payments from the borrower under the Lawrence Village Plaza Loan Origination and recognized the interest income on a cash basis. On May 13, 2016, we received a deed-in-lieu of foreclosure in satisfaction of all amounts due to us under our investment in the Lawrence Village Plaza Loan Origination and received title to the collateral that secured the loan. Interest income from real estate loans receivable in future periods may also be affected by potential loan impairments as a result of current or future market conditions. As of December 31, 2016, the borrower under the Sandmar Mezzanine Loan was delinquent. The Sandmar Mezzanine Loan has a book value of zero after asset-specific loan loss reserves. Subsequent to December 31, 2016, the borrower under the Sandmar Mezzanine Loan defaulted.
If any of the borrowers under our real estate loans receivable are unable to repay their loans at maturity or default on their loan, the impact to future interest income and loan recoveries may be significant and will depend on several factors unique to each individual loan. In general, if we own a mezzanine loan or a B-Note and the borrower is unable to repay its loan at maturity, we may have more restrictions and fewer options regarding the resolution of our investment than if we had a first priority lien. In certain circumstances, the senior lenders, in conjunction with us, may be willing to grant the borrower extensions or may grant extensions in exchange for more favorable terms (such as higher interest rates, a partial payoff, or the entitlement to a portion of a junior lender’s interest income, etc.). If the senior lenders will not grant the borrower an extension, we, as the mezzanine lender, may foreclose on the ownership interests of the borrower and indirectly take legal title to the property subject to the existing senior loans or we may negotiate a discounted repayment. We could attempt to negotiate an extension or modification with the senior lenders as the new borrower; however, if the senior lenders were not willing to extend or modify the loans and we were not able to repay the senior loans, we would most likely relinquish our interests or rights in the investment to the holders of the senior loans. Actual outcomes may differ significantly from the above based on factors specific to individual loans and situations.
Property operating, maintenance and management costs from our real estate properties decreased by $22.2 million primarily related to properties sold, the results of which are included in income from continuing operations, and a decrease in snow removal expenses related to our real estate properties located in the midwestern and northeastern regions of the United States due to record snow fall during the first quarter 2015. The decrease in property operating, maintenance and management costs was partially offset by an increase of $1.4 million in maintenance costs related to a GKK Property held throughout both periods. Overall, we expect property operating, maintenance and management costs to decrease in future periods due to anticipated real estate property sales.
Real estate taxes, property-related taxes and insurance from our real estate properties decreased from $23.7 million during the year ended December 31, 2015 to $16.0 million during the year ended December 31, 2016 primarily due to properties sold, the results of which are included in income from continuing operations, partially offset by an increase in real estate taxes and property-related taxes related to properties held throughout both periods. Overall, we expect real estate taxes, property-related taxes and insurance to decrease in future periods due to anticipated real estate property sales.
Asset management fees decreased from $9.5 million for the year ended December 31, 2015 to $7.6 million for the year ended December 31, 2016 due to properties sold, the results of which are included in income from continuing operations, and a decrease in asset management fees for the GKK Properties. Beginning in April 2016, the gross value of the GKK Properties fell below the original cost of our investment in the GKK Mezzanine Loan and for the period from April 1, 2016 through December 31, 2016, we calculated the asset management fee related to the GKK Properties based on the gross value of the GKK Properties. See the discussion of asset management fees under “Liquidity and Capital Resources” above. Overall, we expect asset management fees to decrease in future periods due to anticipated asset sales or payoffs.
Foreclosure fees and expenses were $0.3 million for the year ended December 31, 2016 and related to our receipt of title to a retail property in connection with a deed-in-lieu of foreclosure in satisfaction of all amounts due under our investment in the Lawrence Village Plaza Loan Origination. We did not incur any foreclosure fees and expenses during the year ended December 31, 2015. We do not expect to incur significant amounts of foreclosure fees and expenses in future periods as we do not currently anticipate foreclosing on more real estate or real estate-related assets.
63
General and administrative expenses decreased by $16.6 million primarily due to a decrease of $19.8 million in the estimated profit participation interest related to the GKK Properties under the Second Amended Services Agreement, as amended, partially offset by an increase of $2.0 million of estimated settlement on audit fees related to a GKK Property and $0.8 million of other professional fees related to the engagement of Evercore by the Special Committee. See “— Contractual Commitments and Contingencies — Asset Management Services Agreement Related to the GKK Properties” for more information. General and administrative expenses consist primarily of management fees related to the Second Amended Services Agreement, as amended, legal fees, audit fees, transfer agent fees, state and local income taxes and other professional fees.
Depreciation and amortization expense from our real estate properties decreased by $23.2 million primarily due to real estate property sales, partially offset by an increase in depreciation and amortization expense due to additions in building improvements related to properties held throughout both periods. Upon classifying a property as held for sale, we cease depreciation and amortization expense for that property. Overall, we expect depreciation and amortization expense to decrease in future periods due to anticipated real estate property sales.
Interest expense from the financing of our portfolio decreased by $19.0 million, primarily due to a decrease in the average loan balance as a result of principal repayments and debt extinguishments subsequent to December 31, 2015. Included in interest expense is the amortization of deferred financing costs of $0.3 million and $1.9 million for the years ended December 31, 2016 and 2015, respectively. As of December 31, 2016, we had no debt outstanding and do not expect to incur additional interest expense.
During the year ended December 31, 2016, we recorded a non-cash impairment charge of $33.4 million, of which $19.5 million related to 25 properties (including 22 GKK Properties) classified as real estate held for investment, to write-down the carrying values of these real estate investments to their estimated fair values and $13.9 million with respect to 43 GKK Properties that were held for sale or sold to write-down the carrying values of these real estate investments to their estimated sales price less estimated costs to sell. The facts and circumstances leading to the impairments on our real estate held for investment during the year ended December 31, 2016 are as follows:
• | City Gate Plaza: We recognized an impairment charge during the year ended December 31, 2016 of $3.3 million to reduce the carrying value of our investment in City Gate Plaza, an office property located in Sacramento, California, to its estimated fair value. We revised our cash flow projections to account for higher projected leasing costs to stabilize the property. The continued lack of demand in the Sacramento office rental market also resulted in higher capitalization rates. |
• | University Park Buildings: We recognized an impairment charge during the year ended December 31, 2016 of $3.2 million to reduce the carrying value of our investment in the University Park Buildings, an office property located in Sacramento, California, to its estimated fair value. We revised our cash flow projections primarily to account for higher projected capital costs for general building upgrades and to address certain maintenance issues. The continued lack of demand in the Sacramento office rental market also resulted in higher capitalization rates. |
• | Lawrence Village Plaza: We recognized an impairment charge during the year ended December 31, 2016 of $2.0 million to reduce the carrying value of Lawrence Village Plaza, a retail property located in New Castle, Pennsylvania, to its estimated fair value. We revised our cash flow projections due to perceived credit concerns for the property's anchor tenant, an increase in projected vacancy related to the termination of multiple tenant leases and the continued lack of demand for retail space in the submarket, thus decreasing projected cash flows. |
• | GKK Properties: |
◦ | Citizens Bank Portfolio: We recognized an impairment charge during the year ended December 31, 2016 of $10.6 million relating to 19 properties in the Citizens Bank Portfolio due to a decrease in cash flow projections primarily due to an increase in projected vacancy, thus decreasing the projected cash flows the properties would generate. |
◦ | Pitney Bowes - Bank of America Portfolio: We recognized an impairment charge during the year ended December 31, 2016 of $0.4 million relating to three properties in the Pitney Bowes - Bank of America Portfolio due to a decrease in cash flow projections primarily due to an increase in projected vacancy, thus decreasing the projected cash flows the properties would generate. |
64
During the year ended December 31, 2015, we recorded a non-cash impairment charge of $49.3 million. The impairment charge for the year ended December 31, 2015 included $48.4 million of impairments with respect to ten properties classified as real estate held for investment (including six GKK Properties) to write-down the carrying values of certain of our real estate investments to their estimated fair values and $0.9 million with respect to eight properties classified as held for sale and sold, all of which were GKK Properties, to write-down the carrying values of certain of our real estate investments to their estimated sales price less estimated costs to sell. Please see “— Comparison of the year ended December 31, 2015 versus the year ended December 31, 2014” below for a discussion of impairment charges recorded during the year ended December 31, 2015.
We recorded a provision for loan loss reserves of $2.5 million related to the Sandmar Mezzanine Loan and the Lawrence Village Plaza Origination Loan during the year ended December 31, 2015. During the year ended December 31, 2016, we did not record provision for loan loss reserves.
We recognized a gain on sales of real estate of $159.5 million related to the disposition of four historical real estate properties and 269 GKK Properties during the year ended December 31, 2016 that were included in income from continuing operations. We recognized a gain on sales of real estate of $100.0 million related to the disposition of three historical industrial properties and 30 GKK Properties during the year ended December 31, 2015 that were included in income from continuing operations.
During the year ended December 31, 2015, we sold the remaining two condominium units of the Tribeca Building and recognized a gain of $2.5 million on the sales of foreclosed real estate held for sale.
During the year ended December 31, 2016, we recognized a loss on extinguishment of debt of $26.3 million related to the following:
• | Defeasance of the FSI 6000 Mortgage Loans: In connection with the disposition of the FSI 6000 Properties on April 11, 2016, we entered into a defeasance agreement with each of the lenders under the FSI 6000 Mortgage Loans to defease the entire aggregate outstanding principal balance of $102.3 million under the FSI 6000 Mortgage Loans, releasing the FSI 6000 Properties, which had secured the FSI 6000 Mortgage Loans. The defeasance costs and write-off of an unamortized discount resulted in an aggregate loss on extinguishment of debt of approximately $6.6 million. |
• | Defeasance of the Bank of America - BBD2 Mortgage Loan: On April 15, 2016, we, through an indirect wholly owned subsidiary, entered into a defeasance agreement with the lender under the Bank of America - BBD2 Mortgage Loan to defease the remaining outstanding principal balance of $65.1 million, releasing all the properties that secured the Bank of America - BBD2 Mortgage Loan. The defeasance costs and write-off of an unamortized discount and unamortized deferred financing costs resulted in a loss on extinguishment of debt of approximately $12.7 million. |
• | Early pay-off of the Pitney Bowes - Bank of America Mortgage Loan: On September 1, 2016, we repaid the entire $36.2 million principal balance and all other sums due on the Pitney Bowes - Bank of America Mortgage Loan and paid a prepayment premium of $6.5 million. The prepayment premium and write-off of an unamortized discount resulted in an aggregate loss on extinguishment of debt of approximately $7.0 million. |
During the year ended December 31, 2015, we recognized a loss on extinguishment of debt of $22.5 million. Please see “— Comparison of the year ended December 31, 2015 versus the year ended December 31, 2014” below for a discussion of of loss on extinguishment of debt recorded during the year ended December 31, 2015.
We recognized a gain on sale of real estate of $0.1 million that was included in discontinued operations related to the disposition of one GKK Property during the year ended December 31, 2015. We did not recognize a gain on sale of real estate during the year ended December 31, 2016.
65
Comparison of the year ended December 31, 2015 versus the year ended December 31, 2014
The following table provides summary information about our results of operations for the year ended December 31, 2015 and 2014 (dollar amounts in thousands):
Years Ended December 31, | Increase (Decrease) | Percentage Change | $ Change Due to Dispositions (1) | $ Change Due to Properties or Loans Held Throughout Both Periods (2) | ||||||||||||||||||
2015 | 2014 | |||||||||||||||||||||
Rental income | $ | 135,117 | $ | 151,351 | $ | (16,234 | ) | (11 | )% | $ | (19,775 | ) | $ | 3,541 | ||||||||
Tenant reimbursements | 47,217 | 54,366 | (7,149 | ) | (13 | )% | (5,621 | ) | (1,528 | ) | ||||||||||||
Interest income from real estate loans receivable | 3,089 | 3,077 | 12 | — | % | N/A | N/A | |||||||||||||||
Parking revenues and other operating income | 2,797 | 3,671 | (874 | ) | (24 | )% | (968 | ) | 94 | |||||||||||||
Operating, maintenance, and management costs | 75,034 | 84,288 | (9,254 | ) | (11 | )% | (8,491 | ) | (763 | ) | ||||||||||||
Real estate taxes, property-related taxes and insurance | 23,696 | 27,243 | (3,547 | ) | (13 | )% | (3,112 | ) | (435 | ) | ||||||||||||
Asset management fees to affiliate | 9,547 | 9,975 | (428 | ) | (4 | )% | (496 | ) | 68 | |||||||||||||
General and administrative expenses | 32,619 | 18,788 | 13,831 | 74 | % | N/A | N/A | |||||||||||||||
Depreciation and amortization expense | 59,145 | 71,613 | (12,468 | ) | (17 | )% | (11,669 | ) | (799 | ) | ||||||||||||
Interest expense | 29,517 | 45,923 | (16,406 | ) | (36 | )% | (10,714 | ) | (5,692 | ) | ||||||||||||
Impairment charge on real estate | 49,306 | 10,117 | 39,189 | 387 | % | (1,666 | ) | 40,855 | ||||||||||||||
Provision for loan losses | 2,504 | 1,973 | 531 | 27 | % | N/A | N/A | |||||||||||||||
Gain on sales of real estate securities | — | 4,410 | (4,410 | ) | (100 | )% | (4,410 | ) | — | |||||||||||||
Gain on sales of real estate, net | 99,988 | 2,282 | 97,706 | 4,282 | % | 97,706 | — | |||||||||||||||
Gain on sales of foreclosed real estate held for sale | 2,509 | 1,108 | 1,401 | 126 | % | N/A | N/A | |||||||||||||||
Loss (gain) from extinguishment of debt | (22,518 | ) | 21,328 | (43,846 | ) | (206 | )% | (24,970 | ) | (18,876 | ) | |||||||||||
Gain on sales of real estate, net (discontinued operations) | 124 | 4,797 | (4,673 | ) | (97 | )% | (4,673 | ) | — | |||||||||||||
Income from discontinued operations | 264 | 1,583 | (1,319 | ) | (83 | )% | (1,319 | ) | — | |||||||||||||
Impairment charge on discontinued operations | — | (257 | ) | 257 | (100 | )% | 257 | — | ||||||||||||||
(1) Represents the dollar amount increase (decrease) for the year ended December 31, 2015 compared to the year ended December 31, 2014 related to investments disposed of on or after January 1, 2014.
(2) Represents the dollar amount increase (decrease) for the year ended December 31, 2015 compared to the year ended December 31, 2014 related to real estate and real estate-related investments owned by us throughout both periods presented.
Rental income from our real estate properties decreased by $16.2 million primarily due to properties sold or disposed of other than by sale, the results of which are included in income from continuing operations, offset by an increase of $1.9 million due to higher occupancy (as a result of tenants signing new leases) at certain properties and a $1.6 million increase in termination fees from a property held for sale.
Tenant reimbursements from our real estate properties decreased by $7.1 million primarily due to properties sold or disposed of other than by sale, the results of which are included in income from continuing operations, and a net decrease in property tax recoveries related to the GKK Properties held throughout both periods due to prior year CAM reconciliation adjustments in 2015 being lower than 2014.
Interest income from real estate loans receivable remained constant at approximately $3.1 million during the years ended December 31, 2015 and 2014. As of December 31, 2015, the borrower under the Sandmar Mezzanine Loan was delinquent. On September 1, 2015, the Lawrence Village Plaza Loan Origination matured without repayment. Subsequently, we received interest payments from the borrower under the Lawrence Village Plaza Loan Origination and recognized the interest income on a cash basis. Please see “— Comparison of the year ended December 31, 2016 versus the year ended December 31, 2015” for more information regarding our loans receivable.
Property operating, maintenance and management costs from our real estate properties decreased by $9.3 million primarily due to properties sold or disposed of other than by sale, the results of which are included in income from continuing operations, and a decrease in utility expenses and bad debt write-offs related to properties held throughout both periods, partially offset by an increase in snow removal expenses related to our real estate properties located in the midwestern and northeastern regions of the United States due to record snow fall during the first quarter 2015.
66
Real estate taxes, property-related taxes and insurance from our real estate properties decreased from $27.2 million during the year ended December 31, 2014 to $23.7 million during the year ended December 31, 2015 primarily due to properties sold or disposed of other than by sale, the results of which are included in income from continuing operations, and property tax refunds received related to the GKK Properties, partially offset by an increase in consulting fees for property taxes.
Asset management fees decreased from $10.0 million for the year ended December 31, 2014 to $9.5 million for the year ended December 31, 2015 primarily due to properties sold, the results of which are included in income from continuing operations.
General and administrative expenses increased by $13.8 million primarily due to an increase of $14.7 million in the estimated profit participation interest related to the GKK Properties under the Amended Services Agreement, partially offset by a decrease of $0.9 million related to lower legal fees, accounting fees, transfer agent fees and other professional fees. See “— Contractual Commitments and Contingencies — Asset Management Services Agreement Related to the GKK Properties” for more information. General and administrative expenses consist primarily of management fees related to the Amended Services Agreement, legal fees, audit fees, transfer agent fees, state and local income taxes and other professional fees.
Depreciation and amortization expense from our real estate properties decreased by $12.5 million primarily due to real estate property sales or dispositions other than by sale and decreased amortization of tenant origination and absorption costs resulting from lease expirations related to properties held throughout both periods. Upon classifying a property as held for sale, we cease depreciation and amortization expense for that property.
Interest expense from the financing of our portfolio decreased by $16.4 million, primarily due to a decrease in the average loan balance as a result of principal repayments and debt extinguishments subsequent to December 31, 2014. Included in interest expense is the amortization of deferred financing costs of $1.9 million and $1.5 million for the years ended December 31, 2015 and 2014, respectively.
During the year ended December 31, 2015, we recorded a non-cash impairment charge of $49.3 million. The impairment charge for the year ended December 31, 2015 included $48.4 million of impairments with respect to ten properties classified as real estate held for investment (including six GKK Properties) to write-down the carrying values of certain of our real estate investments to their estimated fair values and $0.9 million with respect to eight properties classified as held for sale and sold, all of which were GKK Properties, to write-down the carrying values of certain of our real estate investments to their estimated sales price less estimated costs to sell. The facts and circumstances leading to the impairments on our real estate held for investment during the year ended December 31, 2015 are as follows:
• | Woodfield Preserve Office Center: We recognized an impairment charge during the year ended December 31, 2015 of $24.8 million to reduce the carrying value of our investment in Woodfield Preserve Office Center, an office property located in Schaumburg, Illinois, due to a decrease in cash flow projections. The decrease in cash flow projections was primarily due to (i) an increase in projected vacancy related to a tenant occupying 51,616 rentable square feet, or approximately 8% of the Woodfield Preserve Office Center and (ii) the challenging Schaumburg office rental market. The tenant’s lease was to expire in November 2016 and it was no longer expected to renew since it was recently acquired and can relocate to excess space leased by the acquiring company. As a result, we revised our cash flow projections for longer lease up periods and additional tenant improvement costs and leasing concessions required to attract new tenants. Chicago’s northwest suburb office rental market was heavily affected by the 2008-2009 recession; however, the outlook was optimistic that the market would recover to levels seen prior to the recession. Although the general market has seen positive net absorption, rental rates have remained low while lease concessions remain high resulting in lower projected revenue growth and cash flow projections. The market conditions in Schaumburg, Illinois have also resulted in a lack of interest from investors. We sold the Woodfield Preserve Office Center in 2016. |
• | Tysons Dulles Plaza: We recognized an impairment charge during the year ended December 31, 2015 of $15.7 million to reduce the carrying value of Tysons Dulles Plaza, an office property located in McLean, Virginia, to its estimated fair value. We revised our cash flow projections primarily for longer estimated lease up periods as a result of the continued lack of demand in the McLean office rental market. While the market has seen slight increases in rental rates, lease concessions have not declined as previously expected. We also revised our cash flow projections to account for higher projected capital costs for tenant improvements, general building upgrades, and deferred maintenance costs needed to position the property competitively with other properties in the area, to address certain maintenance issues and to attract additional tenants. The lack of sales activity in McLean, Virginia has also resulted in higher capitalization rates. |
67
• | University Park Buildings: We recognized an impairment charge during the year ended December 31, 2015 of $3.4 million related to our investment in the University Park Buildings, an office property located in Sacramento, California, due to a decrease in cash flow projections primarily due to an increase in projected vacancy related to a tenant occupying 36,377 rental square feet, or approximately 28% of the University Park Buildings. The tenant’s lease expires in June 2017 and it is no longer expected to renew. As a result, we revised our cash flow projections for longer lease up periods and additional tenant improvement costs and leasing concessions required to attract new tenants. |
• | 69 State Street: We recognized an impairment charge during the year ended December 31, 2015 of $2.0 million to reduce the carrying value of 69 State Street, an office property located in Albany, New York, to its estimated fair value based on its selling price at auction subsequent to December 31, 2015. |
• | Las Vegas Ops Center: We recognized an impairment charge during the year ended December 31, 2015 of $2.0 million to reduce the carrying value of Las Vegas Ops Center, an operations center located in Las Vegas, Nevada, to its estimated fair value based on its selling price at auction subsequent to December 31, 2015. |
• | Other Properties: We recognized impairment charges during the year ended December 31, 2015 of $0.5 million related to five other properties held for investment, including four GKK Properties. No impairment charge related to any individual property was greater than $250,000. These impairments generally resulted from changes in the projected hold periods or changes in leasing projections including longer estimated lease-up periods and lower projected rental rates, thus decreasing the projected cash flows the properties would generate. |
During the year ended December 31, 2014, we recorded a non-cash impairment charge of $10.1 million to write-down the carrying values of six properties (including two GKK Properties) to their estimated fair values. Included in our impairment charge during the year ended December 31, 2014 was a $7.2 million impairment charge to reduce the carrying value of our investment in Tysons Dulles Plaza, an office property located in McLean, Virginia, to its estimated fair value due to a change in cash flow projections. We revised our cash flow projections for Tysons Dulles Plaza primarily because of a continued lag in demand in the Washington D.C. office rental market, resulting in ongoing leasing challenges and lower projected revenue growth. We also revised our cash flow projections to account for higher projected capital costs for tenant improvements and general building upgrades needed to attract additional tenants. In addition to the impairment on Tysons Dulles Plaza, we recognized impairment charges during the year ended December 31, 2014 of $2.9 million related to five other properties held for investment. No impairment charge related to any individual property was greater than $1.3 million. These impairments generally resulted from changes in leasing projections including longer estimated lease-up periods and lower projected rental rates, thus decreasing the projected cash flows the properties would generate.
We recorded a provision for loan loss reserves of $2.5 million related to the Sandmar Mezzanine Loan and the Lawrence Village Plaza Loan Origination during the year ended December 31, 2015. During the year ended December 31, 2014, we recorded a provision for loan loss reserves of $2.0 million related to the Sandmar Mezzanine Loan.
During the year ended December 31, 2014, we sold 1,386,602 shares of common stock of Gramercy and recognized a gain on the sale of real estate securities of $4.4 million. We did not own or sell any shares of common stock of Gramercy during the year ended December 31, 2015.
We recognized a gain on sales of real estate of $100.0 million related to the disposition of three historical industrial properties and 30 GKK Properties during the year ended December 31, 2015 that were included in income from continuing operations. We recognized a gain on sales of real estate of $2.3 million related to the disposition of four historical industrial properties and two GKK Properties during the year ended December 31, 2014 that were included in income from continuing operations.
During the year ended December 31, 2015, we sold the remaining two condominium units of the Tribeca Building and recognized a gain of $2.5 million on the sales of foreclosed real estate held for sale. During the year ended December 31, 2014, we sold one condominium unit of Tribeca Building and recognized a gain of $1.1 million.
68
During the year ended December 31, 2015, we recognized a loss on extinguishment of debt of $22.5 million related to the following:
• | Early pay-off of the Pitney Bowes - Wachovia A Mortgage Loan: On September 16, 2015, we repaid the entire $14.0 million principal balance and all other sums due on the Pitney Bowes - Wachovia A Mortgage Loan and a prepayment premium of $2.2 million. |
• | Early pay-off of the 101 Independence Mortgage Loan: On May 1, 2015, in connection with the disposition of 101 Independence, we repaid the entire $65.3 million principal balance and all other sums due on the 101 Independence Mortgage Loan, including a prepayment premium of $4.4 million, and we wrote-off an unamortized discount on note payable of $2.0 million. |
• | Defeasance of the Sterling Bank Mortgage Loan: On October 9, 2015, we, through an indirect wholly owned subsidiary, entered into a defeasance with the lender under the Sterling Bank Mortgage Loan to defease the entire outstanding principal balance of $19.6 million, releasing all the properties which had secured the Sterling Bank Mortgage Loan. The defeasance costs and write-off of an unamortized discount resulted in a loss on extinguishment of debt of approximately $1.2 million. |
• | Defeasance of the Bank of America - BBD2 Mortgage Loan: On October 1, 2015, in connection with the disposition of Waltham Main, we, through an indirect wholly owned subsidiary, entered into a partial defeasance with the lender under the Bank of America - BBD2 Mortgage Loan to defease $40.8 million of the outstanding principal balance, releasing Waltham Main and 21 other properties which had secured the Bank of America - BBD2 Mortgage Loan. The defeasance costs and write-offs of unamortized deferred financing costs and an unamortized discount resulted in a loss on extinguishment of debt of approximately $8.0 million. On December 15, 2015, we, through an indirect wholly owned subsidiary, entered into a second partial defeasance with the lender under the Bank of America - BBD2 Mortgage Loan to defease $27.0 million of outstanding principal, releasing 16 properties which had secured the Bank of America - BBD2 Mortgage Loan. The defeasance costs and write-offs of unamortized deferred financing costs and unamortized discount resulted in a loss on extinguishment of debt of approximately $4.7 million. |
During the year ended December 31, 2014, we recognized a gain on extinguishment of debt of $21.3 million. The gain on extinguishment of debt consisted of (i) a $1.8 million gain related to a deed-in-lieu of foreclosure agreement with respect to the BOA Windsor Mortgage Portfolio Loan, (ii) a $3.3 million gain related to the discounted payoff of the Bridgeway Technology Center Mortgage Loan, (iii) a $12.6 million gain related to the 801 Market Street Mortgage Loan foreclosure and (iv) a $3.6 million gain related to the Jenkins Court Mortgage Loan foreclosure.
We recognized a gain on sale of real estate of $0.1 million that was included in discontinued operations related to the disposition of one GKK Property during the year ended December 31, 2015. During the year ended December 31, 2014, we recognized a gain on sale of real estate of $4.8 million that was included in discontinued operations related to the disposition of one historical office property and nine GKK Properties.
Income from discontinued operations for the years ended December 31, 2015 and December 31, 2014 was $0.3 million and $1.6 million, respectively. Income from discontinued operations is composed of the results of operations from properties sold and properties designated as held for sale prior to January 1, 2014. Total revenues and other income from discontinued operations decreased from $2.5 million during the year ended December 31, 2014 to $0.1 million during the year ended December 31, 2015. Total expenses from discontinued operations decreased from $0.9 million during the year ended December 31, 2014 to $(0.2) million during the year ended December 31, 2015.
During the year ended December 31, 2014, we recognized an impairment charge on real estate from discontinued operations of $0.3 million with respect to two GKK Properties held for sale. The impairment charge was primarily a result of a reduction in the estimated sales prices of the two GKK Properties held for sale. We did not recognize an impairment charge on real estate from discontinued operations during the year ended December 31, 2015.
69
Distributions
Distributions declared, distributions paid and cash flow from operations were as follows during 2016 (in thousands, except per share amounts):
Period | Distributions Declared (1) | Distributions Declared Per Share (1) (2) | Cash Flow From Operations | |||||||||||||
Distributions Paid (1) (2) | ||||||||||||||||
First Quarter 2016 | $ | 4,655 | $ | 0.025 | $ | 4,655 | $ | 2,878 | ||||||||
Second Quarter 2016 | 4,645 | 0.025 | 4,645 | (1,053 | ) | |||||||||||
Third Quarter 2016 | 4,634 | 0.025 | 4,634 | (8,912 | ) | |||||||||||
Fourth Quarter 2016 | 4,627 | 0.025 | 4,627 | (6,774 | ) | |||||||||||
$ | 18,561 | $ | 0.100 | $ | 18,561 | $ | (13,861 | ) | ||||||||
(1) Distributions consist of the following, as applicable:
• | On March 11, 2016, our board of directors declared a distribution in the amount of $0.025 per share of common stock to stockholders of record as of the close of business on March 21, 2016. This distribution totaled approximately $4.7 million and was paid on March 28, 2016. |
• | On May 6, 2016, our board of directors declared a distribution in the amount of $0.025 per share of common stock to stockholders of record as of the close of business on June 22, 2016. This distribution totaled approximately $4.6 million and was paid on June 28, 2016. |
• | On August 9, 2016, our board of directors declared a distribution in the amount of $0.025 per share of common stock to stockholders of record as of the close of business on September 22, 2016. This distribution totaled approximately $4.6 million and was paid on September 29, 2016. |
• | On November 7, 2016, our board of directors declared a distribution in the amount of $0.025 per share of common stock to stockholders of record as of the close of business on December 22, 2016. This distribution totaled approximately $4.6 million and was paid on December 29, 2016. |
(2) Assumes share was issued and outstanding each day that was a record date for distributions during the period presented.
For the year ended December 31, 2016, we paid aggregate cash distributions of $18.6 million. Cash flow from operations for the year ended December 31, 2016 was $(13.9) million. We funded our total distributions paid with current period cash flow from operations, prior period cash flow from operations in excess of distributions paid and proceeds from the sales of our properties. For purposes of determining the source of our distributions paid, we assume first that we use cash flow from operations from the relevant periods to fund distribution payments. On January 27, 2017, our stockholders approved the sale of all of our assets and our dissolution pursuant to the terms of the Plan of Liquidation. We do not expect to pay regular quarterly distributions during the liquidation process.
Pursuant to the Plan of Liquidation, on March 10, 2017, our board of directors authorized an initial liquidating distribution in the amount of $1.00 per share of common stock to our stockholders of record as of the close of business on March 21, 2017. The initial liquidating distribution was paid on March 24, 2017 and was funded from proceeds from asset sales. Since it is a liquidating distribution pursuant to the Plan of Liquidation, the initial liquidating distribution reduced our stockholders’ remaining investment in us and reduced the estimated range of future liquidating distributions per share to be received by our stockholders by $1.00 per share. We are in the process of liquidating our remaining assets and pursuant to the Plan of Liquidation, we expect to pay multiple liquidating distribution payments to our stockholders during the liquidation process and to pay the final liquidating distribution after we sell all of our assets, pay all of our known liabilities and provide for unknown liabilities. We expect to complete these activities within 24 months after January 27, 2017; however, there can be no assurances regarding the amounts of any liquidating distributions or the timing thereof. Our expectations about the amount of liquidating distributions that we will pay and when we will pay them are based on many estimates and assumptions, one or more of which may prove to be incorrect. As a result, the actual amount of liquidating distributions we pay to our stockholders may be more or less than we estimate and the liquidating distributions may be paid later than we predict. For more information, see “—Overview — Plan of Liquidation” and “—Liquidity and Capital Resources.”
Our performance and ability to pay liquidating distributions at the times and in the amounts we expect cannot be accurately predicted and may deteriorate in the future due to numerous factors, including those discussed under “Forward—Looking Statements,” Part I, Item 1, “Business — Market Outlook — Real Estate and Real Estate Finance Markets,” Part I, Item 1A, “Risk Factors” and Part II, Item 7, “Management’s Discussion and Analysis of Financial Condition and Results of Operations.”
70
Critical Accounting Policies
Below is a discussion of the accounting policies that management considers critical in that they involve significant management judgments and assumptions, require estimates about matters that are inherently uncertain and because they are important for understanding and evaluating our reported financial results. These judgments affect the reported amounts of assets and liabilities and our disclosure of contingent assets and liabilities as of the dates of the financial statements and the reported amounts of revenue and expenses during the reporting periods. With different estimates or assumptions, materially different amounts could be reported in our financial statements. Additionally, other companies may utilize different estimates that may impact the comparability of our results of operations to those of companies in similar businesses.
Revenue Recognition
Real Estate
We recognize minimum rent, including rental abatements, lease incentives and contractual fixed increases attributable to operating leases, on a straight-line basis over the term of the related leases when collectibility is reasonably assured and record amounts expected to be received in later years as deferred rent receivable. If the lease provides for tenant improvements, we determine whether the tenant improvements, for accounting purposes, are owned by the tenant or by us. When we are the owner of the tenant improvements, the tenant is not considered to have taken physical possession or have control of the physical use of the leased asset until the tenant improvements are substantially completed. When the tenant is the owner of the tenant improvements, any tenant improvement allowance (including amounts that the tenant can take in the form of cash or a credit against its rent) that is funded is treated as a lease incentive and amortized as a reduction of revenue over the lease term. Tenant improvement ownership is determined based on various factors including, but not limited to:
• | whether the lease stipulates how a tenant improvement allowance may be spent; |
• | whether the amount of a tenant improvement allowance is in excess of market rates; |
• | whether the tenant or landlord retains legal title to the improvements at the end of the lease term; |
• | whether the tenant improvements are unique to the tenant or general-purpose in nature; and |
• | whether the tenant improvements are expected to have any residual value at the end of the lease. |
We record property operating expense reimbursements due from tenants for common area maintenance, real estate taxes, and other recoverable costs in the period the related expenses are incurred.
We make estimates of the collectibility of our tenant receivables related to base rents, including deferred rent receivable, expense reimbursements and other revenue or income. Management specifically analyzes accounts receivable, deferred rent receivable, historical bad debts, customer creditworthiness, current economic trends and changes in customer payment terms when evaluating the adequacy of the allowance for doubtful accounts. In addition, with respect to tenants in bankruptcy, management makes estimates of the expected recovery of pre-petition and post-petition claims in assessing the estimated collectibility of the related receivable. In some cases, the ultimate resolution of these claims can exceed one year. When a tenant is in bankruptcy, we will record a bad debt reserve for the tenant’s receivable balance and generally will not recognize subsequent rental revenue until cash is received or until the tenant is no longer in bankruptcy and has the ability to make rental payments.
We recognize a gain on sale of real estate upon the closing of a transaction with the purchaser. Gain on real estate sold are recognized using the full accrual method when collectibility of the sales price is reasonably assured, we are not obligated to perform additional activities that may be considered significant, the initial investment from the buyer is sufficient and other profit recognition criteria have been satisfied. A gain on sale of real estate may be deferred in whole or in part until the requirements for gain recognition have been met.
Real Estate Loans Receivable
Interest income on our real estate loans receivable is recognized on an accrual basis over the life of the investment using the interest method. Direct loan origination fees and origination or acquisition costs, as well as acquisition premiums or discounts, are amortized over the term of the loan as an adjustment to interest income. We place loans on nonaccrual status when any portion of principal or interest is 90 days past due, or earlier when concern exists as to the ultimate collection of principal or interest. When a loan is placed on nonaccrual status, we reserve for any unpaid accrued interest and generally do not recognize subsequent interest income until cash is received, or the loan returns to accrual status. We will resume the accrual of interest if we determine the collection of interest, according to the contractual terms of the loan, is probable.
We generally recognize income on impaired loans on either a cash basis, where interest income is only recorded when received in cash, or on a cost-recovery basis, where all cash receipts are applied against the carrying value of the loan. We consider the collectibility of the loan’s principal balance in determining whether to recognize income on impaired loans on a cash basis or a cost-recovery basis.
71
Real Estate
Depreciation and Amortization
Real estate costs related to the acquisition and improvement of properties are capitalized and amortized over the expected useful life of the asset on a straight-line basis. Repair and maintenance costs are charged to expense as incurred and significant replacements and betterments are capitalized. Repair and maintenance costs include all costs that do not extend the useful life of the real estate asset. We consider the period of future benefit of an asset to determine its appropriate useful life. Expenditures for tenant improvements are capitalized and amortized over the shorter of the tenant’s lease term or expected useful life. We anticipate the estimated useful lives of our assets by class to be generally as follows:
Buildings | 15 - 40 years |
Building improvements | 10 - 25 years |
Tenant improvements | Shorter of lease term or expected useful life |
Tenant origination and absorption costs | Remaining term of related leases, including below-market renewal periods |
Real Estate Acquisition Valuation
We record the acquisition of income-producing real estate or real estate that will be used for the production of income as a business combination. All assets acquired and liabilities assumed in a business combination are measured at their acquisition-date fair values. Acquisition costs are expensed as incurred and restructuring costs that do not meet the definition of a liability at the acquisition date are expensed in periods subsequent to the acquisition date.
We assess the acquisition date fair values of all tangible assets, identifiable intangibles and assumed liabilities using methods similar to those used by independent appraisers, generally utilizing a discounted cash flow analysis that applies appropriate discount and/or capitalization rates and available market information. Estimates of future cash flows are based on a number of factors, including historical operating results, known and anticipated trends, and market and economic conditions. The fair value of tangible assets of an acquired property considers the value of the property as if it were vacant.
We record above-market and below-market in-place lease values for acquired properties based on the present value (using a discount rate that reflects the risks associated with the leases acquired) of the difference between (i) the contractual amounts to be paid pursuant to the in-place leases and (ii) management’s estimate of fair market lease rates for the corresponding in-place leases, measured over a period equal to the remaining non-cancelable term of above-market in-place leases and for the initial term plus any extended term for any leases with below-market renewal options. We amortize any recorded above-market or below-market lease values as a reduction or increase, respectively, to rental income over the remaining non-cancelable terms of the respective lease, including any below-market renewal periods.
We estimate the value of tenant origination and absorption costs by considering the estimated carrying costs during hypothetical expected lease up periods, considering current market conditions. In estimating carrying costs, we include real estate taxes, insurance and other operating expenses and estimates of lost rentals at market rates during the expected lease up periods.
We amortize the value of tenant origination and absorption costs to depreciation and amortization expense over the remaining non-cancelable term of the leases.
Estimates of the fair values of the tangible assets, identifiable intangibles and assumed liabilities require us to make significant assumptions to estimate market lease rates, property-operating expenses, carrying costs during lease-up periods, discount rates, market absorption periods, and the number of years the property will be held for investment. The use of inappropriate assumptions would result in an incorrect valuation of our acquired tangible assets, identifiable intangibles and assumed liabilities, which would impact the amount of our net income.
Impairment of Real Estate and Related Intangible Assets and Liabilities
We continually monitor events and changes in circumstances that could indicate that the carrying amounts of our real estate and related intangible assets and liabilities may not be recoverable or realized. When indicators of potential impairment suggest that the carrying value of real estate and related intangible assets and liabilities may not be recoverable, we assess the recoverability by estimating whether we will recover the carrying value of the real estate and related intangible assets and liabilities through its undiscounted future cash flows and its eventual disposition. If, based on this analysis, we do not believe that we will be able to recover the carrying value of the real estate and related intangible assets and liabilities, we would record an impairment loss to the extent that the carrying value exceeds the estimated fair value of the real estate and related intangible assets and liabilities.
72
Projecting future cash flows involves estimating expected future operating income and expenses related to the real estate and its related intangible assets and liabilities as well as market and other trends. Using inappropriate assumptions to estimate cash flows could result in incorrect fair values of the real estate and its related intangible assets and liabilities and could result in the overstatement of the carrying values of our real estate and related intangible assets and liabilities and an overstatement of our net income.
Real Estate Held for Sale and Discontinued Operations
We generally consider non-foreclosed real estate to be “held for sale” when the following criteria are met: (i) management commits to a plan to sell the property, (ii) the property is available for sale immediately, (iii) the property is actively being marketed for sale at a price that is reasonable in relation to its current fair value, (iv) the sale of the property within one year is considered probable and (v) significant changes to the plan to sell are not expected. Real estate that is held for sale and its related assets are classified as “real estate held for sale” and “assets related to real estate held for sale,” respectively, for all periods presented in the accompanying consolidated financial statements. Notes payable and other liabilities related to real estate held for sale are classified as “notes payable related to real estate held for sale” and “liabilities related to real estate held for sale,” respectively, for all periods presented in the accompanying consolidated financial statements. Real estate classified as held for sale is no longer depreciated and is reported at the lower of its carrying value or its estimated fair value less estimated costs to sell. Additionally, with respect to properties that were classified as held for sale in financial statements prior to January 1, 2014, we record the operating results and gains on sale as discontinued operations for all periods presented if the operations have been or are expected to be eliminated and we will not have any significant continuing involvement in the operations of the property following the sale. Operating results related to properties and gains on sale that were disposed of or classified as held for sale in the ordinary course of business during the years ended December 31, 2016, 2015 and 2014 that had not been classified as held for sale in financial statements prior to January 1, 2014 are included in continuing operations on our consolidated statements of operations.
Change in a Plan to Sell
When real estate is initially considered “held for sale” it is measured at the lower of its depreciated book value, or estimated fair value less estimated costs to sell. Changes in the market may compel us to decide to reclassify a property that was designated as held for sale to held for investment. A property that is reclassified from held for sale to held for investment or non-sale disposition is measured and recorded individually at the lower of (i) its carrying amount before the property was classified as held for sale, adjusted for any depreciation and amortization expense that would have been recognized had the property been continuously classified as held and used, or (ii) its fair value at the date of the subsequent decision not to sell. Any adjustment to the carrying amount of the property as a result of the reclassification is included in income from continuing operations as an impairment charge on real estate held for investment.
Real Estate Held for Non-Sale Disposition
We consider real estate assets that do not meet the criteria to be classified as held for sale but are expected to be disposed of other than by sale as real estate held for non-sale disposition. The assets and liabilities related to real estate held for non-sale disposition are included in our consolidated balance sheets and the results of operations are presented as part of continuing operations in our consolidated statements of operations for all periods presented. With respect to properties that were disposed of other than by sale prior to January 1, 2014, we recorded the operating results as discontinued operations for all periods presented. Operating results of properties that were disposed of other than by sale during the year ended December 31, 2014 are included in continuing operations on our consolidated statements of operations. We did not dispose of any properties other than by sale during the year ended December 31, 2016 and 2015.
Real Estate Loans Receivable
Our real estate loans receivable are recorded at amortized cost, net of loan loss reserves, and evaluated for impairment at each balance sheet date. The amortized cost of a real estate loan receivable is the outstanding unpaid principal balance, net of unamortized acquisition premiums or discounts and unamortized costs and fees directly associated with the origination or acquisition of the loan.
The reserve for loan losses is a valuation allowance that reflects our estimate of loan losses inherent in the loan portfolio as of the balance sheet date. The reserve is adjusted through “Provision for loan losses” in our consolidated statements of operations and is decreased by charge-offs to specific loans when losses are confirmed. The reserve for loan losses includes a portfolio-based component and an asset-specific component.
73
An asset-specific reserve relates to reserves for losses on loans considered impaired. We consider a loan to be impaired when, based upon current information and events, we believe that it is probable that we will be unable to collect all amounts due under the contractual terms of the loan agreement. We also consider a loan to be impaired if we grant the borrower a concession through a modification of the loan terms or if we expect to receive assets (including equity interests in the borrower) with fair values that are less than the carrying value of our loan in satisfaction of the loan. A reserve is established when the present value of payments expected to be received, observable market prices, the estimated fair value of the collateral (for loans that are dependent on the collateral for repayment) or amounts expected to be received in satisfaction of a loan are lower than the carrying value of that loan.
A portfolio-based reserve covers the pool of loans that do not have asset-specific reserves. A provision for loan losses is recorded when available information as of each balance sheet date indicates that it is probable that a loss occurred in the pool of loans and the amount of the loss can be reasonably estimated, but we do not know which specific loans within the pool will ultimately result in losses. Required reserve balances for this pool of loans are derived from estimated probabilities of default and estimated loss severities assuming a default occurs. On a quarterly basis, we assign estimated probabilities of default and loss severities to each loan in the portfolio based on factors such as the debt service coverage of the underlying collateral, the estimated fair value of the collateral, the significance of the borrower’s investment in the collateral, the financial condition of the borrower and/or its sponsors, the likelihood that the borrower and/or its sponsors would allow the loan to default, our willingness and ability to step in as owner in the event of default, and other pertinent factors.
Failure to recognize impairments would result in the overstatement of earnings and the carrying value of our real estate loans receivable. Actual losses, if any, could differ significantly from estimated amounts.
Fair Value Measurements
Under GAAP, we are required to measure certain financial instruments at fair value on a recurring basis. In addition, we are required to measure other non-financial and financial assets at fair value on a non-recurring basis (e.g., carrying value of impaired real estate loans receivable and long-lived assets). Fair value is defined as the price that would be received upon the sale of an asset or paid to transfer a liability in an orderly transaction between market participants at the measurement date. The GAAP fair value framework uses a three-tiered approach. Fair value measurements are classified and disclosed in one of the following three categories:
• | Level 1: unadjusted quoted prices in active markets that are accessible at the measurement date for identical assets or liabilities; |
• | Level 2: quoted prices for similar instruments in active markets, quoted prices for identical or similar instruments in markets that are not active, and model-derived valuations in which significant inputs and significant value drivers are observable in active markets; and |
• | Level 3: prices or valuation techniques where little or no market data is available that requires inputs that are both significant to the fair value measurement and unobservable. |
When available, we utilize quoted market prices from independent third-party sources to determine fair value and classify such items in Level 1 or Level 2. In instances where the market for a financial instrument is not active, regardless of the availability of a nonbinding quoted market price, observable inputs might not be relevant and could require us to make a significant adjustment to derive a fair value measurement. Additionally, in an inactive market, a market price quoted from an independent third party may rely more on models with inputs based on information available only to that independent third party. When we determine the market for a financial instrument owned by us to be illiquid or when market transactions for similar instruments do not appear orderly, we use several valuation sources (including internal valuations, discounted cash flow analysis and quoted market prices) and establish a fair value by assigning weights to the various valuation sources. Additionally, when determining the fair value of a liability in circumstances in which a quoted price in an active market for an identical liability is not available, we measure fair value using (i) a valuation technique that uses the quoted price of the identical liability when traded as an asset or quoted prices for similar liabilities when traded as assets or (ii) another valuation technique that is consistent with the principles of fair value measurement, such as the income approach or the market approach.
Changes in assumptions or estimation methodologies can have a material effect on these estimated fair values. In this regard, the derived fair value estimates cannot be substantiated by comparison to independent markets and, in many cases, may not be realized in an immediate settlement of the instrument.
74
We consider the following factors to be indicators of an inactive market: (i) there are few recent transactions, (ii) price quotations are not based on current information, (iii) price quotations vary substantially either over time or among market makers (for example, some brokered markets), (iv) indexes that previously were highly correlated with the fair values of the asset or liability are demonstrably uncorrelated with recent indications of fair value for that asset or liability, (v) there is a significant increase in implied liquidity risk premiums, yields, or performance indicators (such as delinquency rates or loss severities) for observed transactions or quoted prices when compared with our estimate of expected cash flows, considering all available market data about credit and other nonperformance risk for the asset or liability, (vi) there is a wide bid-ask spread or significant increase in the bid-ask spread, (vii) there is a significant decline or absence of a market for new issuances (that is, a primary market) for the asset or liability or similar assets or liabilities, and (viii) little information is released publicly (for example, a principal-to-principal market).
We consider the following factors to be indicators of non-orderly transactions: (i) there was not adequate exposure to the market for a period before the measurement date to allow for marketing activities that are usual and customary for transactions involving such assets or liabilities under current market conditions, (ii) there was a usual and customary marketing period, but the seller marketed the asset or liability to a single market participant, (iii) the seller is in or near bankruptcy or receivership (that is, distressed), or the seller was required to sell to meet regulatory or legal requirements (that is, forced), and (iv) the transaction price is an outlier when compared with other recent transactions for the same or similar assets or liabilities.
Income Taxes
We have elected to be taxed as a REIT under the Internal Revenue Code. To continue to qualify as a REIT, we must meet certain organizational and operational requirements, including a requirement to distribute at least 90% of our annual REIT taxable income to stockholders (which is computed without regard to the dividends-paid deduction or net capital gain and which does not necessarily equal net income as calculated in accordance with GAAP). As a REIT, we generally will not be subject to federal income tax on income that we distribute as dividends to our stockholders. If we fail to qualify as a REIT in any taxable year, we will be subject to federal income tax on our taxable income at regular corporate income tax rates and generally will not be permitted to qualify for treatment as a REIT for federal income tax purposes for the four taxable years following the year during which qualification is lost, unless the Internal Revenue Service grants us relief under certain statutory provisions. Such an event could materially and adversely affect our net income and net cash available for distribution to stockholders. However, we believe that we are organized and operate in such a manner as to qualify for treatment as a REIT.
Subsequent Events
We evaluate subsequent events up until the date the consolidated financial statements are issued.
Plan of Liquidation
On January 27, 2017, our stockholders approved the Plan of Liquidation. The principal purpose of the Plan of Liquidation is to maximize stockholder value by selling our assets, paying our debts and distributing the net proceeds from liquidation to our stockholders. For more information, see the Plan of Liquidation, which is attached as an exhibit to this Annual Report on Form 10-K.
Articles of Amendment
On January 27, 2017, our stockholders approved three amendments to our charter, which amendments are contained in the Articles of Amendment. The Articles of Amendment were filed with the State Department of Assessments and Taxation of Maryland on January 31, 2017 and were effective as of that date. The Articles of Amendment:
(a) | eliminate (i) conditions and limitations on our exculpation and indemnification of our present or former directors and our advisor and its affiliates and (ii) limitations on our ability to reimburse our present or former directors and our advisor or its affiliates for reasonable legal expenses and other costs. The Articles of Amendment provide that we shall exculpate and indemnify our present and former directors and officers to the maximum extent permitted by Maryland law and provide us the ability to exculpate and indemnify our advisor and its affiliates pursuant to the terms of the advisory agreement between us and our advisor; |
(b) | eliminate the charter requirement to distribute a specific report with audited financial statements, related party and other information to our stockholders each year. Although, pursuant to the Articles of Amendment, our charter no longer requires that we provide audited financial statements to our stockholders, any decision to cease providing audited financial statements to our stockholders would need to be approved by our board of directors and would require that the SEC grant us relief from certain reporting requirements under the Exchange Act; and |
(c) | exclude the distribution of interests in a liquidating trust from the definition of a “roll-up transaction.” |
For more information, see the Articles of Amendment, which are attached as exhibit 99.1 to our Current Report on Form 8-K filed with the SEC on January 31, 2017.
75
Initial Liquidating Distribution
Pursuant to the Plan of Liquidation, on March 10, 2017, our board of directors authorized an initial liquidating distribution in the amount of $1.00 per share of common stock to our stockholders of record as of the close of business on March 21, 2017. The initial liquidating distribution was paid on March 24, 2017 and was funded from proceeds from asset sales.
March 2017 EVPS
On March 27, 2017, our board of directors approved the March EVPS of $2.475 (unaudited), effective March 21, 2017. We provided the March 2017 EVPS for the purpose of assisting broker-dealers that participated in our initial public offering in meeting their customer account statement reporting obligations under NASD Conduct Rule 2340 as required by FINRA. The March 2017 EVPS is equal to the midpoint of the estimated range of liquidating distributions of $3.27 and $3.68 per share (which midpoint is $3.475), reduced for the impact of the payment of the initial liquidating distribution of $1.00 per share of common stock to our stockholders. Thus, the March 2017 EVPS reflects the resulting reduction of our stockholders’ remaining investment in us. This valuation was performed in accordance with the provisions of and also to comply with the IPA Valuation Guidelines, reduced for the impact of liquidation fees and selling costs. For more information relating to the calculation of the March 2017 EVPS, see our Current Report on Form 8-K, filed with the SEC on March 28, 2017.
Disposition of GKK Properties Subsequent to December 31, 2016
Subsequent to December 31, 2016 and through March 27, 2017, we sold 59 GKK Properties (of which 28 GKK Properties were classified as held for sale as of December 31, 2016), which had a net book value of $38.5 million as of the date of sale, to buyers unaffiliated with us or our advisor, for an aggregate sales price, net of closing credits, of $59.1 million, excluding closing costs.
ITEM 7A. | QUANTITATIVE AND QUALITATIVE DISCLOSURES ABOUT MARKET RISK |
We are exposed to the effects of changes in interest rates as a result of our investments in real estate loans receivable. Our profitability and the value of our investment portfolio may be adversely affected during any period as a result of interest rate changes. Our interest rate risk management objectives are to limit the impact of interest rate changes on earnings and cash flows.
The table below summarizes the book values, the weighted-average annual effective interest rates and fair values of our real estate loans receivable as of December 31, 2016 based on the maturity dates as of December 31, 2016 (dollars in thousands):
Maturity Date | Total Value (1) | |||||||||||||||||||||||||||||||
2016 | 2017 | 2018 | 2019 | 2020 | Thereafter | Fair Value | ||||||||||||||||||||||||||
Assets | ||||||||||||||||||||||||||||||||
Loans receivable, book value | ||||||||||||||||||||||||||||||||
Mezzanine loans - fixed rate (2) | $ | — | $ | — | $ | — | $ | — | $ | — | $ | — | $ | — | $ | — | ||||||||||||||||
Weighted-average annual effective interest rate | — | — | — | — | — | — | — | % | ||||||||||||||||||||||||
B-notes - fixed rate | $ | — | $ | 22,864 | $ | — | $ | — | $ | — | $ | — | $ | 22,864 | $ | 21,779 | ||||||||||||||||
Weighted-average annual effective interest rate (3) | — | 11.4 | % | — | — | — | — | 11.4 | % | |||||||||||||||||||||||
(1) Book value of loans receivable is presented net of asset-specific reserves.
(2) As of December 31, 2016, the borrower under the Sandmar Mezzanine Loan was delinquent and we will recognize income on this loan on a cash basis. The book value, which is net of asset-specific reserves, of the Sandmar Mezzanine Loan was $0 at December 31, 2016.
(3) The weighted-average annual effective interest rate is calculated based on actual interest income recognized in 2016, using the interest method, divided by the average amortized cost basis of the investment during 2016. The weighted-average effective interest rates presented are as of December 31, 2016.
Interest rate fluctuations will generally not affect our future earnings or cash flows on our fixed rate real estate loans receivable unless such instruments mature or are otherwise terminated. However, interest rate changes will affect the fair value of our fixed rate instruments. As of December 31, 2016, the fair value and book value of our fixed rate real estate loans receivable were $21.8 million and $22.9 million, respectively. The fair value estimate of our real estate loans receivable is calculated using an internal valuation model that considers the expected cash flows for the loans, underlying collateral values (for collateral-dependent loans) and the estimated yield requirements of institutional investors for loans with similar characteristics, including remaining loan term, loan-to-value, type of collateral and other credit enhancements.
76
The weighted-average annual effective interest rate of our fixed rate real estate loans receivable as of December 31, 2016 was 11.4%. The weighted-average annual effective interest rate represents the effective interest rate as of December 31, 2016, using the interest method, which we use to recognize interest income on our real estate loans receivable.
As of December 31, 2016, we had no mortgage debt outstanding.
ITEM 8. | FINANCIAL STATEMENTS AND SUPPLEMENTARY DATA |
See the Index to Financial Statements at page F-1 of this report.
ITEM 9. | CHANGES IN AND DISAGREEMENTS WITH ACCOUNTANTS ON ACCOUNTING AND FINANCIAL DISCLOSURE |
None.
ITEM 9A. | CONTROLS AND PROCEDURES |
Disclosure Controls and Procedures
As of the end of the period covered by this report, management, including our principal executive officer and principal financial officer, evaluated the effectiveness of the design and operation of our disclosure controls and procedures. Based upon, and as of the date of, the evaluation, our principal executive officer and principal financial officer concluded that the disclosure controls and procedures were effective as of the end of the period covered by this report to ensure that information required to be disclosed in the reports we file and submit under the Exchange Act is recorded, processed, summarized and reported as and when required. Disclosure controls and procedures include, without limitation, controls and procedures designed to ensure that information required to be disclosed by us in the reports we file and submit under the Exchange Act is accumulated and communicated to our management, including our principal executive officer and our principal financial officer, as appropriate to allow timely decisions regarding required disclosure.
Management’s Report on Internal Control Over Financial Reporting
Our management is responsible for establishing and maintaining adequate internal control over financial reporting, as such term is defined in Rule 13a-15(f) or 15d-15(f) promulgated under the Securities Exchange Act of 1934, as amended.
In connection with the preparation of our Form 10-K, our management assessed the effectiveness of our internal control over financial reporting as of December 31, 2016. In making that assessment, management used the criteria set forth by the Committee of Sponsoring Organizations of the Treadway Commission (COSO) in Internal Control-Integrated Framework (2013).
Based on its assessment, our management believes that, as of December 31, 2016, our internal control over financial reporting was effective based on those criteria. There have been no changes in our internal control over financial reporting that occurred during the quarter ended December 31, 2016 that have materially affected, or are reasonably likely to materially affect, our internal control over financial reporting.
ITEM 9B. | OTHER INFORMATION |
Departure of Director
On March 27, 2017, Hank Adler notified our board of directors of his decision to resign as a member of our board of directors effective as of March 29, 2017. Mr. Adler, together with all of the members of our board of directors, approved this Annual Report on Form 10-K prior to Mr. Adler notifying the board of directors of his resignation. Mr. Adler’s decision to resign as a member of the Board was not the result of any disagreement with our company on any matter relating to our operations, policies or practices.
77
PART III
ITEM 10. | DIRECTORS, EXECUTIVE OFFICERS AND CORPORATE GOVERNANCE |
Directors and Executive Officers
We have provided below certain information about our directors and executive officers.
Name | Position(s) | Age * | ||
Peter M. Bren | President | 83 | ||
Charles J. Schreiber, Jr. | Chairman of the Board, Chief Executive Officer and Director | 65 | ||
Peter McMillan III | Executive Vice President, Treasurer, Secretary and Director | 59 | ||
Keith D. Hall | Executive Vice President | 58 | ||
Jeffrey K. Waldvogel | Chief Financial Officer | 39 | ||
Stacie K. Yamane | Chief Accounting Officer | 52 | ||
Hank Adler (1) | Independent Director | 70 | ||
Barbara R. Cambon | Independent Director | 63 | ||
Stuart A. Gabriel, Ph.D. | Independent Director | 63 | ||
_____________________
* As of March 1, 2017.
(1) See Item 9B., “Other Information — Departure of Director.”
Peter M. Bren is our President, a position he has held since June 2005. He is also Chairman of the Board and President of our advisor, President of KBS REIT II, President of KBS REIT III and President of KBS Growth & Income REIT, positions he has held for these entities since October 2004, August 2007, January 2010 and January 2015, respectively. Mr. Bren is President and a director of KBS Legacy Partners Apartment REIT, positions he has held since August 2009 and July 2009, respectively. In addition, Mr. Bren is a sponsor of our company and is a sponsor of KBS REIT II, KBS REIT III, KBS Strategic Opportunity REIT, KBS Legacy Partners Apartment REIT, KBS Strategic Opportunity REIT II and KBS Growth & Income REIT, which were formed in 2005, 2007, 2009, 2008, 2009, 2013 and 2015, respectively. Other than de minimis amounts owned by family members or family trusts, Mr. Bren indirectly owns and controls a 33 1/3% interest in KBS Holdings LLC, which is the sole owner of our advisor and the entity that acted as our dealer manager. All four of our sponsors, Messrs. Bren, Hall, McMillan and Schreiber, actively participate in the management and operations of our advisor.
Mr. Bren is Chairman of the Board and President of KBS Realty Advisors LLC and is a principal of Koll Bren Schreiber Realty Advisors, Inc., each an active and nationally recognized real estate investment advisor. These entities are registered as investment advisers with the SEC. The first investment advisor affiliated with Messrs. Bren and Schreiber was formed in 1992. As of December 31, 2016, KBS Realty Advisors, together with KBS affiliates, including KBS Capital Advisors, had been involved in the investment in or management of approximately $23 billion of real estate investments on behalf of institutional investors, including public and private pension plans, endowments and foundations, institutional and sovereign wealth funds, and the investors in us, KBS REIT II, KBS REIT III, KBS Strategic Opportunity REIT, KBS Legacy Partners Apartment REIT, KBS Strategic Opportunity REIT II and KBS Growth & Income REIT.
Mr. Bren oversees all aspects of KBS Capital Advisors’ and KBS Realty Advisors’ operations, including the acquisition, management and disposition of individual investments and portfolios of investments for KBS-sponsored programs and KBS-advised investors. He also directs all facets of KBS Capital Advisors’ and KBS Realty Advisors’ business activities and is responsible for investor relationships.
Mr. Bren has been involved in real estate development, management, acquisition, disposition and financing for more than 40 years and with the acquisition, origination, management, disposition and financing of real estate-related debt investments for more than 30 years. Prior to taking his current positions as Chairman of the Board and President of KBS Capital Advisors and KBS Realty Advisors, he served as the President of The Bren Company, was a Senior Partner of Lincoln Property Company and was President of Lincoln Property Company, Europe. Mr. Bren is also a founding member of the Richard S. Ziman Center for Real Estate at the UCLA Anderson School of Management. He is also a member of the Real Estate Roundtable in Washington, D.C.
78
Charles J. Schreiber, Jr. is our Chairman of the Board, our Chief Executive Officer and one of our directors, positions he has held since June 2005. He is also the Chief Executive Officer of our advisor and Chairman of the Board, Chief Executive Officer and a director of KBS Growth & Income REIT, positions he has held for these entities since October 2004 and January 2015, respectively. Mr. Schreiber is Chairman of the Board, Chief Executive Officer and a director of KBS REIT II, positions he has held since August 2007, August 2007 and July 2007, respectively, and he is Chairman of the Board, Chief Executive Officer and a director of KBS REIT III, positions he has held since January 2010, January 2010 and December 2009, respectively. In addition, Mr. Schreiber is a sponsor of our company and is a sponsor of KBS REIT II, KBS REIT III, KBS Strategic Opportunity REIT, KBS Legacy Partners Apartment REIT, KBS Strategic Opportunity REIT II and KBS Growth & Income REIT, which were formed in 2005, 2007, 2009, 2008, 2009, 2013 and 2015, respectively. Other than de minimis amounts owned by family members or family trusts, Mr. Schreiber indirectly owns and controls a 33 1/3% interest in KBS Holdings LLC, which is the sole owner of our advisor and the entity that acted as our dealer manager. All four of our sponsors, Messrs. Bren, Hall, McMillan and Schreiber, actively participate in the management and operations of our advisor.
Mr. Schreiber is the Chief Executive Officer of KBS Realty Advisors LLC and is a principal of Koll Bren Schreiber Realty Advisors, Inc., each an active and nationally recognized real estate investment advisor. These entities are registered as investment advisers with the SEC. The first investment advisor affiliated with Messrs. Bren and Schreiber was formed in 1992. As of December 31, 2016, KBS Realty Advisors, together with KBS affiliates, including KBS Capital Advisors, had been involved in the investment in or management of approximately $23 billion of real estate investments on behalf of institutional investors, including public and private pension plans, endowments and foundations, institutional and sovereign wealth funds, and the investors in us, KBS REIT II, KBS REIT III, KBS Strategic Opportunity REIT, KBS Legacy Partners Apartment REIT, KBS Strategic Opportunity REIT II and KBS Growth & Income REIT.
Mr. Schreiber oversees all aspects of KBS Capital Advisors’ and KBS Realty Advisors’ operations, including the acquisition, management and disposition of individual investments and portfolios of investments for KBS-sponsored programs and KBS-advised investors. He also directs all facets of KBS Capital Advisors’ and KBS Realty Advisors’ business activities and is responsible for investor relationships.
Mr. Schreiber has been involved in real estate development, management, acquisition, disposition and financing for more than 40 years and with the acquisition, origination, management, disposition and financing of real estate-related debt investments for more than 30 years. Prior to teaming with Mr. Bren in 1992, he served as the Executive Vice President of Koll Investment Management Services and Executive Vice President of Acquisitions/Dispositions for The Koll Company. During the mid-1970s through the 1980s, he was Founder and President of Pacific Development Company and was previously Senior Vice President/Southern California Regional Manager of Ashwill-Burke Commercial Brokerage.
Mr. Schreiber graduated from the University of Southern California with a Bachelor’s Degree in Finance with an emphasis in Real Estate. During his four years at USC, he did graduate work in the then newly-formed Real Estate Department in the USC Graduate School of Business. He is currently an Executive Board Member for the USC Lusk Center for Real Estate at the University of Southern California Marshall School of Business/School of Policy, Planning and Development. Mr. Schreiber also serves as a member of the Executive Committee for the Public Non-Listed REIT Council for the National Association of Real Estate Investment Trusts. Mr. Schreiber has served as a member of the board of directors and executive committee of The Irvine Company since August 2016, and since December 2016, Mr. Schreiber has served on the Board of Trustees of The Irvine Company.
The board of directors has concluded that Mr. Schreiber is qualified to serve as a director, Chairman of the Board and as our Chief Executive Officer for reasons including his extensive industry and leadership experience. Since the formation of the first investment advisor affiliated with Messrs. Bren and Schreiber in 1992, and through December 31, 2016, Mr. Schreiber had been involved in the investment in or management of over $23 billion of real estate investments through KBS affiliates. With more than 40 years of experience in real estate development, management, acquisition and disposition and more than 30 years of experience with the acquisition, origination, management, disposition and financing of real estate-related debt investments, he has the depth and breadth of experience to implement our business strategy. He gained his understanding of the real estate and real estate-finance markets through hands-on experience with acquisitions, asset and portfolio management, asset repositioning and dispositions. As our Chief Executive Officer and a principal of our external advisor, Mr. Schreiber is best-positioned to provide the board of directors with insights and perspectives on the execution of our business strategy, our operations and other internal matters. Further, as a principal of KBS-affiliated investment advisors and as Chief Executive Officer, Chairman of the Board and a director of KBS REIT II, KBS REIT III and KBS Growth & Income REIT, and as a director and trustee of The Irvine Company, Mr. Schreiber brings to the board of directors demonstrated management and leadership ability.
79
Peter McMillan III is one of our Executive Vice Presidents, our Treasurer and Secretary, and one of our directors, positions he has held since June 2005. He is also an Executive Vice President, the Treasurer and Secretary and a director of KBS REIT II and KBS REIT III, positions he has held for these entities since August 2007 and January 2010, respectively. From January 2015 through February 2017, Mr. McMillan was an Executive Vice President, the Treasurer and Secretary and a director of KBS Growth & Income REIT. He is President, Chairman of the Board and a director of KBS Strategic Opportunity REIT and KBS Strategic Opportunity REIT II, positions he has held for these entities since December 2008 and February 2013, respectively. He is also an Executive Vice President of KBS Legacy Partners Apartment REIT, which position he has held since August 2009. In addition, Mr. McMillan is a sponsor of our company and is a sponsor of KBS REIT II, KBS REIT III, KBS Strategic Opportunity REIT, KBS Legacy Partners Apartment REIT, KBS Strategic Opportunity REIT II and KBS Growth & Income REIT, which were formed in 2005, 2007, 2009, 2008, 2009, 2013 and 2015, respectively. Mr. McMillan owns and controls a 50% interest in GKP Holding LLC. GKP Holding owns a 33 1/3% interest in KBS Holdings LLC, which is the sole owner of our advisor and the entity that acted as our dealer manager. All four of our sponsors, Messrs. Bren, Hall, McMillan and Schreiber, actively participate in the management and operations of our advisor.
Mr. McMillan is a Partner and co-owner of Temescal Canyon Partners LP, an investment advisor formed in 2013 to manage a multi-strategy hedge fund on behalf of investors. Mr. McMillan is also a co-founder and the Managing Partner of Willowbrook Capital Group, LLC, an asset management company. Prior to forming Willowbrook in 2000, Mr. McMillan served as an Executive Vice President and Chief Investment Officer of SunAmerica Investments, Inc., which was later acquired by AIG. As Chief Investment Officer, he was responsible for over $75.0 billion in assets, including residential and commercial mortgage-backed securities, public and private investment grade and non-investment grade corporate bonds and commercial mortgage loans and real estate investments. Before joining SunAmerica in 1989, he served as Assistant Vice President for Aetna Life Insurance and Annuity Company with responsibility for the company’s $6.0 billion fixed income portfolios. Mr. McMillan received his Master of Business Administration in Finance from the Wharton Graduate School of Business at the University of Pennsylvania and his Bachelor of Arts Degree with honors in Economics from Clark University. Mr. McMillan is a member of the Board of Trustees of Metropolitan West Funds, TCW Mutual Funds and TCW Alternative Funds and is a former director of Steinway Musical Instruments, Inc.
The board of directors has concluded that Mr. McMillan is qualified to serve as one of our directors for reasons including his expertise in real estate finance and with real estate-related investments. With over 30 years of experience investing in and managing real estate-related debt investments, Mr. McMillan offers insights and perspective with respect to our real estate-related investment portfolio as well as our real estate portfolio. As one of our executive officers and a principal of our advisor, Mr. McMillan is also able to direct the board of directors to the critical issues facing our company. Further, his experiences as a director of KBS REIT II, KBS REIT III, KBS Strategic Opportunity REIT and KBS Strategic Opportunity REIT II, as a member of the Board of Trustees of Metropolitan West Funds, TCW Mutual Funds and TCW Alternative Funds, and as a former director of KBS Growth & Income REIT and Steinway Musical Instruments, Inc., provide him with an understanding of the requirements of serving on a public company board.
Keith D. Hall is one of our Executive Vice Presidents, a position he has held since June 2005. He is an Executive Vice President of KBS REIT II, KBS REIT III and KBS Growth & Income REIT, positions he has held for these entities since August 2007, January 2010 and January 2015, respectively. He is also the Chief Executive Officer and a director of KBS Strategic Opportunity REIT, positions he has held since December 2008 and October 2008, respectively, and is the Chief Executive Officer and a director of KBS Strategic Opportunity REIT II, positions he has held since February 2013. In addition, Mr. Hall is a sponsor of our company and is a sponsor of KBS REIT II, KBS REIT III, KBS Strategic Opportunity REIT, KBS Legacy Partners Apartment REIT, KBS Strategic Opportunity REIT II and KBS Growth & Income REIT, which were formed in 2005, 2007, 2009, 2008, 2009, 2013 and 2015, respectively. Mr. Hall owns and controls a 50% interest in GKP Holding LLC. GKP Holding owns a 33 1/3% interest in KBS Holdings LLC, which is the sole owner of our advisor and our dealer manager. All four of our sponsors, Messrs. Bren, Hall, McMillan and Schreiber, actively participate in the management and operations of our advisor.
Mr. Hall is a co-founder of Willowbrook Capital Group, LLC, an asset management company. Prior to forming Willowbrook in 2000, Mr. Hall was a Managing Director at CS First Boston, where he managed the distribution strategy and business development for the Principal Transaction Group’s $18.0 billion real estate securities portfolio. Mr. Hall’s two primary business unit responsibilities were Mezzanine Lending and Commercial Real Estate Development. Before joining CS First Boston in 1996, he served as a Director in the Real Estate Products Group at Nomura Securities, with responsibility for the company’s $6.0 billion annual pipeline of fixed-income, commercial mortgage-backed securities. During the 1980s, Mr. Hall was a Senior Vice President in the High Yield Department of Drexel Burnham Lambert’s Beverly Hills office, where he was responsible for distribution of the group’s high-yield real estate securities. Mr. Hall received a Bachelor of Arts Degree with honors in Finance from California State University, Sacramento.
80
Jeffrey K. Waldvogel is our Chief Financial Officer and Assistant Secretary, positions he has held since June 2015. He is also the Chief Financial Officer of our advisor, and Chief Financial Officer and Assistant Secretary of KBS REIT II, KBS REIT III and KBS Growth & Income REIT, positions he has held for each of these entities since June 2015. He is also the Chief Financial Officer, Treasurer and Secretary of KBS Strategic Opportunity REIT, KBS Legacy Partners Apartment REIT and KBS Strategic Opportunity REIT II, positions he has held for these entities since June 2015.
Mr. Waldvogel has been employed by an affiliate of our advisor since November 2010. With respect to the KBS-sponsored REITs advised by our advisor, he served as the Director of Finance and Reporting from July 2012 to June 2015 and as the VP Controller Technical Accounting from November 2010 to July 2012. In these roles Mr. Waldvogel was responsible for overseeing internal and external financial reporting, valuation analysis, financial analysis, REIT compliance, debt compliance and reporting, and technical accounting.
Prior to joining an affiliate of our advisor in 2010, Mr. Waldvogel was an audit senior manager at Ernst & Young LLP. During his eight years at Ernst & Young LLP, where he worked from October 2002 to October 2010, Mr. Waldvogel performed or supervised various auditing engagements, including the audit of financial statements presented in accordance with GAAP, as well as financial statements prepared on a tax basis. These auditing engagements were for clients in a variety of industries, with a significant focus on clients in the real estate industry.
In April 2002, Mr. Waldvogel received a Master of Accountancy Degree and Bachelor of Science from Brigham Young University in Provo, Utah. Mr. Waldvogel is a Certified Public Accountant (California).
Stacie K. Yamane is our Chief Accounting Officer, a position she has held since October 2008. From June 2005 to December 2008, Ms. Yamane served as our Chief Financial Officer and from June 2005 to October 2008, she served as our Controller. Ms. Yamane is also the Chief Accounting Officer, Portfolio Accounting of our advisor and Chief Accounting Officer of KBS REIT II, KBS REIT III, KBS Strategic Opportunity REIT, KBS Legacy Partners Apartment REIT, KBS Strategic Opportunity REIT II and KBS Growth & Income REIT, positions she has held for these entities since October 2008, October 2008, January 2010, August 2009, August 2009, February 2013 and January 2015, respectively. From October 2004 to October 2008, Ms. Yamane served as Fund Controller of our advisor. From July 2007 to December 2008, Ms. Yamane served as the Chief Financial Officer of KBS REIT II and from July 2007 to October 2008, she served as Controller of KBS REIT II.
Ms. Yamane also serves as Senior Vice President/Controller, Portfolio Accounting for KBS Realty Advisors LLC, a position she has held since 2004. She served as a Vice President/Portfolio Accounting with KBS-affiliated investment advisors from 1995 to 2004. At KBS Realty Advisors, from 2004 through 2016, Ms. Yamane was responsible for client accounting/reporting for two real estate portfolios. These portfolios consisted of industrial, office and retail properties as well as land parcels. Ms. Yamane worked closely with portfolio managers, asset managers, property managers and clients to ensure the completion of timely and accurate accounting, budgeting and financial reporting. In addition, she assisted in the supervision and management of KBS Realty Advisors’ accounting department.
Prior to joining an affiliate of KBS Realty Advisors in 1995, Ms. Yamane was an audit manager at Kenneth Leventhal & Company, a CPA firm specializing in real estate. During her eight years at Kenneth Leventhal & Company, Ms. Yamane performed or supervised a variety of auditing, accounting and consulting engagements including the audit of financial statements presented in accordance with GAAP, as well as financial statements presented on a cash and tax basis, the valuation of asset portfolios and the review and analysis of internal control systems. Her experiences with various KBS-affiliated entities and Kenneth Leventhal & Company give her almost 30 years of real estate experience.
Ms. Yamane received a Bachelor of Arts Degree in Business Administration with a dual concentration in Accounting and Management Information Systems from California State University, Fullerton. She is a Certified Public Accountant (inactive California).
Hank Adler is one of our independent directors and is the chair of the audit committee, positions he has held since June 2005. See Item 9B., “Other Information — Departure of Director.” Professor Adler is also an independent director and chair of the audit committee of KBS REIT II and KBS REIT III, positions he has held for these entities since March 2008 and September 2010, respectively. He is currently an Assistant Professor of Accounting at Chapman University. Prior to his retirement from Deloitte & Touche, LLP in 2003, Professor Adler was a partner with that firm where he had been employed for over 30 years. He specialized in tax accounting and served as client service and tax partner for a variety of public and private companies. He received a Bachelor of Science in Accounting and a Master of Business Administration from the University of California, Los Angeles. From 2004 to 2016, Professor Adler served on the board of directors and as chairman of the audit committee of Corinthian Colleges, Inc., and he formerly served on the board of directors and on the finance committee of Healthy Smiles for Kids of Orange County, a California non-profit entity. From 1998 to 2007, he also chaired the Toshiba Senior Classic charity event, a PGA Senior Tour championship event. From 1994 to 2006, he served on the board of directors of Hoag Memorial Hospital Presbyterian. In the 1990s, he served on the board of trustees and as President of the Irvine Unified School District. Professor Adler is a Certified Public Accountant (California).
81
The board of directors has concluded that Professor Adler is qualified to serve as an independent director and as the chair of the audit committee for reasons including his extensive experience in public accounting. With over 30 years at one of the big four accounting firms, Professor Adler brings to the board of directors critical insights into and an understanding of the accounting principles and financial reporting rules and regulations affecting our company. His expertise in evaluating the financial and operational results of public companies and overseeing the financial reporting process makes him a valuable director and chair of the audit committee. In addition, as a director and chair of the audit committee of KBS REIT II and KBS REIT III and as a former director of Corinthian Colleges, Inc., of Hoag Memorial Hospital Presbyterian and of Healthy Smiles for Kids of Orange County, Professor Adler is well aware of the corporate governance and regulatory issues facing public and other companies.
Barbara R. Cambon is one of our independent directors, the chair of the conflicts committee and the chair of the Special Committee, positions she has held since June 2005, June 2005 and January 2016, respectively. Ms. Cambon is also an independent director, chair of the conflicts committee and chair of the special committee of KBS REIT II, positions she has held for this entity since March 2008, March 2008 and January 2016, respectively, and she is an independent director and chair of the conflicts committee of KBS REIT III, positions she has held for this entity since September 2010. From April 2009 to December 2010, she served as Chief Operating Officer of Premium One Asset Management LLC, a company whose business focuses on providing investment management services to investors. From October 2003 to October 2009, she also served as a Managing Member of Snowcreek Management LLC, a real estate asset management company whose business activities focus on residential development projects for institutional investors. As Managing Member, Ms. Cambon provided asset management services to an institutional partnership investment in residential real estate development. She has been involved in the real estate investment business for over 30 years, principally working with institutional capital sources and investment programs. From November 1999 until October 2002, she served as a Principal of Los Angeles-based Colony Capital, LLC, a private real estate investment firm, and from April 2000 until October 2002, she also served as its Chief Operating Officer. Prior to joining Colony Capital in 1999, Ms. Cambon was President and founder of Institutional Property Consultants, Inc., a real estate consulting company. She is a past director and chairman of the board of the Pension Real Estate Association and past director of the National Council of Real Estate Investment Fiduciaries. Ms. Cambon serves on the Policy Advisory Board of the University of San Diego Burnham-Moores Center for Real Estate. Ms. Cambon previously served on the board of directors of Neighborhood National Bancorp, Amstar Advisers and BioMed Realty Trust, Inc. Ms. Cambon received a Master of Business Administration from Southern Methodist University and a Bachelor of Science Degree in Education from the University of Delaware.
The board of directors has concluded that Ms. Cambon is qualified to serve as an independent director and as the chair of the conflicts committee for reasons including her expertise in real estate investment and management. Ms. Cambon’s over 30 years of experience investing in, managing and disposing of real estate on behalf of investors give her a wealth of knowledge and experiences from which to draw in advising our company. As former Managing Member of her own real estate asset management company, Ms. Cambon is acutely aware of the operational challenges facing companies such as ours. Further, her service as a director and chair of the conflicts committee of KBS REIT II and KBS REIT III, both public REITs, and as a former director of Neighborhood National Bancorp, Amstar Advisers and BioMed Realty Trust, Inc., gives her additional perspective and insight into large public companies such as ours.
Stuart A. Gabriel, Ph.D. is one of our independent directors, a position he has held since June 2005. Professor Gabriel is also an independent director of KBS REIT II and KBS REIT III, positions he has held for these entities since June 2005 and September 2010, respectively. Since June 2007, Professor Gabriel has served as Director of the Richard S. Ziman Center for Real Estate and Professor of Finance and Arden Realty Chair at the UCLA Anderson School of Management. Prior to joining UCLA he was Director and Lusk Chair in Real Estate at the USC Lusk Center for Real Estate, a position he held from 1999 to 2007. Professor Gabriel also served as Professor of Finance and Business Economics in the Marshall School of Business at the University of Southern California, a position he held from 1990 to 2007. He received a number of awards at UCLA and USC for outstanding graduate teaching. In 2004, he was elected President of the American Real Estate and Urban Economics Association. Professor Gabriel serves on the editorial boards of seven academic journals. He is also a Fellow of the Homer Hoyt Institute for Advanced Real Estate Studies. Since March 2016, Professor Gabriel has served on the board of directors of KB Home and is a member of its audit committee. Professor Gabriel has published extensively on the topics of real estate finance and urban and regional economics. His teaching and academic research experience include analysis of real estate and real estate capital markets performance as well as structured finance products, including credit default swaps, commercial mortgage-backed securities and collateralized debt obligations. Professor Gabriel serves as a consultant to numerous corporate and governmental entities. From 1986 through 1990, Professor Gabriel served on the economics staff of the Federal Reserve Board in Washington, D.C. He also has been a Visiting Scholar at the Federal Reserve Bank of San Francisco. Professor Gabriel holds a Ph.D. in Economics from the University of California, Berkeley.
82
The board of directors has concluded that Professor Gabriel is qualified to serve as an independent director for reasons including his extensive knowledge and understanding of the real estate and finance markets and real estate finance products. As a professor of real estate finance and economics, Professor Gabriel brings unique perspective to the board of directors. His years of research and analysis of the real estate and finance markets make Professor Gabriel well-positioned to advise us with respect to our investment and financing strategy. This expertise also makes him an invaluable resource for assessing and managing risks facing our company. Through his experience as a director of KBS REIT II, KBS REIT III and KB Home, he also has an understanding of the requirements of serving on a public company board.
Corporate Governance
The Audit Committee
The board of directors has established an audit committee. The audit committee’s function is to assist the board of directors in fulfilling its responsibilities by overseeing (i) our accounting and financial reporting processes, (ii) the integrity of our financial statements, (iii) our independent auditors’ qualifications, performance and independence, and (iv) the performance of our internal audit function. The audit committee fulfills these responsibilities primarily by carrying out the activities enumerated in the audit committee charter. The audit committee updated and revised the audit committee charter in August 2016. The audit committee charter is available on our website at www.kbsreit.com.
The members of the audit committee are Hank Adler (chair), Barbara R. Cambon and Stuart A. Gabriel, Ph.D. All of the members of the audit committee are “independent” as defined by the New York Stock Exchange. All members of the audit committee have significant financial and/or accounting experience, and the board of directors has determined that Professor Adler satisfies the SEC’s requirements for an “audit committee financial expert.” See Item 9B., “Other Information — Departure of Director.”
Code of Conduct and Ethics
We have adopted a Code of Conduct and Ethics that applies to all of our executive officers and directors, including but not limited to, our principal executive officer, principal financial officer and principal accounting officer. Our Code of Conduct and Ethics can be found at www.kbsreit.com.
ITEM 11. | EXECUTIVE COMPENSATION |
Compensation of Executive Officers
Our conflicts committee, which is composed of all of our independent directors, discharges the board of directors’ responsibilities relating to the compensation of our executives. However, because we do not have any paid employees and our executive officers do not receive any compensation directly from us for services rendered to us, these responsibilities were limited to administering our Employee and Independent Director Incentive Stock Plan. As of the date of its termination, October 31, 2015, no awards had been granted under the plan, as the board of directors had adopted a policy that prohibited the granting of any awards of shares of common stock to any person under our now-terminated Employee and Independent Director Stock Plan. Our executive officers have no role in determining the amount or form of executive compensation.
Our executive officers are officers and/or employees of, or hold an indirect ownership interest in, our advisor, and/or its affiliates and our executive officers are compensated by these entities, in part, for their services to us. See Part III, Item 13, “Certain Relationships and Related Transactions, and Director Independence — Certain Transactions with Related Persons” for a discussion of the fees paid to our advisor and its affiliates.
Compensation of Directors
If a director is also one of our executive officers, we do not pay any compensation to that person for services rendered as a director. The amount and form of compensation payable to our independent directors for their service to us is determined by the conflicts committee, based upon recommendations from our advisor. Four of our executive officers, Messrs. Bren, Hall, McMillan and Schreiber, manage and control our advisor, and through our advisor, they are involved in recommending and setting the compensation to be paid to our independent directors.
83
We have provided below certain information regarding compensation earned by or paid to our directors during fiscal year 2016.
Name | Fees Earned or Paid in Cash in 2016 (1) | All Other Compensation | Total | |||||||||
Hank Adler | $ | 147,109 | (2) | $ | — | $ | 147,109 | |||||
Barbara R. Cambon | 171,830 | — | 171,830 | |||||||||
Stuart A. Gabriel, Ph.D. | 144,330 | — | 144,330 | |||||||||
Peter McMillan III (3) | — | — | — | |||||||||
Charles J. Schreiber, Jr. (3) | — | — | — | |||||||||
_____________________
(1) Fees Earned or Paid in Cash in 2016 include meeting fees earned in: (i) 2015 but paid or reimbursed in the first quarter of 2016 as follows: Professor Adler $13,333, Ms. Cambon $13,000, and Professor Gabriel $12,000; and (ii) 2016 but paid or to be paid in 2017 as follows: Professor Adler $3,333, Ms. Cambon $3,333, and Professor Gabriel $3,333.
(2) Mr. Adler was paid an additional $1,780 ($400 per hour) for service as chair of the audit committee in connection with a committee oversight matter. This amount is included in the $147,109 above.
(3) Directors who are also our executive officers do not receive compensation for services rendered as a director.
Cash Compensation
We compensate each of our independent directors with an annual retainer of $40,000. In addition, we pay our independent directors for attending board and audit, conflicts or Special Committee meetings as follows:
• | $2,500 for each board meeting attended; |
• | $2,500 for each audit or conflicts committee meeting attended (except that the committee chairman is paid $3,000 for each audit or conflicts committee meeting attended); |
• | $2,000 for each Special Committee meeting attended (except that the committee chairman is paid $3,000 for each Special Committee meeting attended); |
• | $2,000 for each teleconference board meeting attended; |
• | $2,000 for each teleconference audit or conflicts committee meeting attended (except that the committee chairman is paid $3,000 for each teleconference audit or conflicts committee meeting attended); and |
• | $2,000 for each teleconference Special Committee meeting attended (except that the committee chairman is paid $3,000 for each teleconference Special Committee meeting attended). |
All directors receive reimbursement of reasonable out-of-pocket expenses incurred in connection with attendance at board of directors meetings and committee meetings, and in connection with certain oversight matters.
84
ITEM 12. | SECURITY OWNERSHIP OF CERTAIN BENEFICIAL OWNERS AND MANAGEMENT AND RELATED STOCKHOLDER MATTERS |
Stock Ownership
The following table shows, as of March 1, 2017, the amount of our common stock beneficially owned (unless otherwise indicated) by (1) any person who is known by us to be the beneficial owner of more than 5% of the outstanding shares of our common stock, (2) our directors, (3) our executive officers, and (4) all of our directors and executive officers as a group.
Name and Address of Beneficial Owner (1) | Amount and Nature of Beneficial Ownership (2) | Percentage of all Outstanding Shares | ||
KBS Capital Advisors LLC | 20,000 (3) | * | ||
Peter M. Bren, President | 20,000 (3) | * | ||
Keith D. Hall, Executive Vice President | 20,000 (3) | * | ||
Peter McMillan III, Executive Vice President, Treasurer, Secretary and Director | 20,000 (3) | * | ||
Charles J. Schreiber, Jr., Chairman of the Board, Chief Executive Officer and Director | 21,064 (3) (4) | * | ||
Jeffrey K. Waldvogel, Chief Financial Officer | — | — | ||
Stacie K. Yamane, Chief Accounting Officer | — | — | ||
Hank Adler, Independent Director | 15,438 | — | ||
Barbara R. Cambon, Independent Director | 6,871 | — | ||
Stuart A. Gabriel, Ph.D., Independent Director | — | — | ||
All officers and directors as a group | 43,373 (3) | * | ||
_____________________
*Less than 1% of the outstanding common stock
(1) The address of each named beneficial owner is 800 Newport Center Drive, Suite 700, Newport Beach, California 92660.
(2) None of the shares is pledged as security.
(3) Includes 20,000 shares owned by KBS Capital Advisors, which is indirectly owned and controlled by Peter M. Bren, Keith D. Hall, Peter McMillan III and Charles J. Schreiber, Jr.
(4) Includes 1,064 shares held by the Schreiber Family Trust DTD 6/3/75, of which Mr. Schreiber is a trustee.
ITEM 13. | CERTAIN RELATIONSHIPS AND RELATED TRANSACTIONS AND DIRECTOR INDEPENDENCE |
Director Independence
Although our shares are not listed for trading on any national securities exchange, a majority of the directors, and all of the members of the audit committee, the conflicts committee and the Special Committee, are “independent” as defined by the New York Stock Exchange. The board of directors has affirmatively determined that Hank Adler, Barbara R. Cambon and Stuart A. Gabriel, Ph.D. each satisfies the New York Stock Exchange independence standards. In determining that Professor Gabriel is independent under the New York Stock Exchange independence standards, the board of directors considered that Mr. Bren, one of our executive officers and sponsors, is a founding member of the Richard S. Ziman Center for Real Estate at the UCLA Anderson School of Management, that Professor Gabriel is a Director of the Richard S. Ziman Center for Real Estate and Professor of Finance and Arden Realty Chair at the UCLA Anderson School of Management and that in March 2012, Mr. Bren pledged a gift of $1.25 million to the Richard S. Ziman Center for Real Estate at the UCLA Anderson School of Management. The contribution by Mr. Bren would be made over five years in the amount of $250,000 per year. Because this contribution is to a tax exempt entity and the contribution will not exceed $250,000 in any year, the board of directors determined that this contribution was not material and Professor Gabriel met the New York Stock Exchange independence standards.
85
Certain Transactions with Related Persons
Our charter requires the conflicts committee to review and approve all transactions between us and our advisor, any of our officers or directors or any of their affiliates. Prior to entering into a transaction with a related party, a majority of the conflicts committee must conclude that the transaction is fair and reasonable to us and on terms and conditions not less favorable to us than those available from unaffiliated third parties. In addition, our Code of Conduct and Ethics lists examples of types of transactions with related parties that would create prohibited conflicts of interest and requires our directors and officers to be conscientious of actual and potential conflicts of interest with respect to our interests and to seek to avoid such conflicts or handle such conflicts in an ethical manner at all times consistent with applicable law. Our executive officers and directors are required to report potential and actual conflicts to the Compliance Officer, currently our advisor’s Chief Audit Executive, via the Ethics Hotline, or directly to the audit committee chair, as appropriate.
As described further below, we have entered into agreements with certain affiliates pursuant to which they provide services to us. Messrs. Schreiber, McMillan, Bren and Hall control and indirectly own our advisor, and the entity that acted as our dealer manager, KBS Capital Markets Group. We refer to these individuals as our sponsors. They are also some of our executive officers. All four of our sponsors actively participate in the management and operations of our advisor. Our advisor has three managers: an entity owned and controlled by Mr. Bren; an entity owned and controlled by Messrs. Hall and McMillan; and an entity owned and controlled by Mr. Schreiber.
Our Relationship with KBS Capital Advisors. Since our inception, our advisor has provided day-to-day management of our business. Among the services that are provided or have been provided by our advisor under the terms of the advisory agreement are the following:
• | finding, presenting and recommending to us real estate and real estate-related investment opportunities consistent with our investment policies and objectives; |
• | structuring the terms and conditions of our investments, sales and joint ventures; |
• | acquiring properties and other investments on our behalf in compliance with our investment objectives and policies; |
• | sourcing and structuring our loan originations and acquisitions; |
• | arranging for financing and refinancing of our properties and our other investments; |
• | entering into leases and service contracts for our properties; |
• | supervising and evaluating each property manager’s performance; |
• | reviewing and analyzing the properties’ operating and capital budgets; |
• | assisting us in obtaining insurance; |
• | generating an annual budget for us; |
• | reviewing and analyzing financial information for each of our assets and our overall portfolio; |
• | formulating and overseeing the implementation of strategies for the administration, promotion, management, operation, maintenance, improvement, financing and refinancing, marketing, leasing and disposition of our properties and other investments; |
• | performing investor-relations services; |
• | maintaining our accounting and other records and assisting us in filing all reports required to be filed with the SEC, the IRS and other regulatory agencies; |
• | engaging in and supervising the performance of our agents, including our registrar and transfer agent; and |
• | performing any other services reasonably requested by us. |
Our advisor is subject to the supervision of the board of directors and only has such authority as we may delegate to it as our agent. The advisory agreement has a one-year term expiring November 8, 2017, subject to an unlimited number of successive one-year renewals upon the mutual consent of the parties. From January 1, 2016 through the most recent date practicable, which was January 31, 2017, we compensated our advisor as set forth below.
With respect to investments in real estate, we pay our advisor a monthly asset management fee equal to one-twelfth of 0.75% of the amount actually paid or allocated to acquire the investment, plus the cost of any subsequent development, construction or improvements to the property. This amount includes any portion of the investment that was debt financed and is inclusive of acquisition fees and expenses related thereto. In the case of investments made through joint ventures, the asset management fee is determined based on our proportionate share of the underlying investment.
86
With respect to investments in loans and any investments other than real estate, we pay our advisor a monthly asset management fee calculated, each month, as one-twelfth of 0.75% of the lesser of (i) the amount actually paid or allocated to acquire or fund the loan or other investment (which amount includes any portion of the investment that was debt financed and is inclusive of acquisition or origination fees and expenses related thereto) and (ii) the outstanding principal amount of such loan or other investment, plus the acquisition or origination fees and expenses related to the acquisition or funding of such investment, as of the time of calculation.
With respect to an investment that has suffered an impairment in value, reduction in cash flow or other negative circumstances, such investment may either be excluded from the calculation of the asset management fee described above or included in such calculation at a reduced value that is recommended by our advisor and our management and then approved by a majority of our independent directors, and this change in the fee shall be applicable to an investment upon the earlier to occur of the date on which (i) such investment is sold, (ii) such investment is surrendered to a person other than our company, our direct or indirect wholly owned subsidiary or a joint venture or partnership in which we have an interest, (iii) our advisor determines that it will no longer pursue collection or other remedies related to such investment, or (iv) our advisor recommends a revised fee arrangement with respect to such investment. As of January 31, 2017, we excluded our interest in an unconsolidated joint venture from the calculation of asset management fees. Through March 31, 2016, we calculated the asset management fee for the GKK Properties based on the original cost of our investment in the GKK Mezzanine Loan, rather than on the gross value of the GKK Properties we own or in which we hold a leasehold interest. In April 2016, the gross value of the GKK Properties fell below the original cost of our investment in the GKK Mezzanine Loan and for the period from April 1, 2016 through January 31, 2017, we calculated the asset management fee for these properties based on their gross value. Commencing January 1, 2017, we excluded our investment in the Sandmar Mezzanine Loan from the calculation of asset management fees. As of January 31, 2017, we had not determined to calculate the asset management fee at an adjusted value for any other investments or to exclude any other investments from the calculation of the asset management fee.
From January 1, 2016 through January 31, 2017, our asset management fees totaled $8.0 million. As of January 31, 2017, $0.5 million of asset management fees were payable. For information relating to the asset management fees potentially payable to our advisor during the liquidation process, see Part I, Item 1A, “Risk Factors — Risks Related to the Plan of Liquidation.”
Under the advisory agreement, our advisor has the right to seek reimbursement from us for all costs and expenses it incurs in connection with the provision of services to us, including our allocable share of our advisor’s overhead, such as rent, employee costs, utilities, accounting software and cybersecurity costs. Commencing July 1, 2010, we have reimbursed our advisor for our allocable portion of the salaries, benefits and overhead of internal audit department personnel providing services to us. In the future, our advisor may seek reimbursement for additional employee costs. We will not reimburse our advisor for employee costs in connection with services for which our advisor earns acquisition, origination or disposition fees (other than reimbursement of travel and communication expenses) or for the salaries and benefits our advisor or its affiliates may pay to our executive officers. From January 1, 2016 through January 31, 2017, we reimbursed our advisor for $356,000 of operating expenses, $302,000 of which was employee costs.
Under our charter, we are required to limit our total operating expenses to the greater of 2% of our average invested assets or 25% of our net income for the four most recently completed fiscal quarters, as these terms are defined in our charter, unless the conflicts committee has determined that such excess expenses were justified based on unusual and non-recurring factors. Operating expenses for the four fiscal quarters ended December 31, 2016 exceeded the charter-imposed limitation and the conflicts committee of our board of directors determined that these expenses were justified given the professional fees and expenses we incurred related to our exploration of the availability of strategic alternatives and the fees and expenses related to preparation and solicitation of proxies in connection with our stockholders’ approval of the Plan of Liquidation. As a result of pursuing the Plan of Liquidation we anticipate that we will continue to exceed this limitation each quarter throughout the liquidation process as we sell our assets and incur liquidation costs along with certain general and administrative costs that are somewhat fixed in nature and not entirely based on the size of the company. We considered these costs and expenses in determining the estimated range of net proceeds from liquidation, and as of March 28, 2017, we do not expect these costs and expenses to change the estimated range of net proceeds per share from the liquidation.
For substantial assistance in connection with the sale of properties or other investments, we pay our advisor or its affiliates a disposition fee of 1% of the contract sales price of the properties, loans or other investments sold. However, in no event may total commissions (including the disposition fee) paid to our advisor, its affiliates and unaffiliated third parties exceed 6% of the contract sales price of the properties, loans or other investments sold or exceed a competitive real estate commission.
Prior to August 9, 2016, notwithstanding the foregoing, in January 2015, the disposition fee related to the sales of GKK Properties was modified to provide that the conflicts committee would determine in its sole discretion the amount of the disposition fee related to the sale of GKK Properties upon the terms set forth below, which disposition fee may be an amount not to exceed 1% of the contract sales price, which maximum amount is consistent with the fixed percentage applicable to the sales of other properties, loans and other investments.
87
With respect to sales of the GKK Properties, and provided that the conflicts committee determined that our advisor had provided a substantial amount of services in connection with the sale of each GKK Property for which the payment of a disposition fee was requested by our advisor, then:
(a) | With respect to portfolio or single asset sales of GKK Properties designated by the conflicts committee in its sole discretion at or about the time of the sale, we would pay our advisor a fee in an amount not to exceed 1% of the contract sales price and subject to other limitations and conditions set forth in the advisory agreement, as determined by the conflicts committee in its sole discretion, which fee would be payable upon the respective closing; and |
(b) | With respect to sales of all other GKK Properties for which a disposition fee had not yet been paid, if, upon the sale of the final GKK Property, the conflicts committee determined in its sole discretion that we had recovered our entire investment related to the GKK Mezzanine Loan and the GKK Properties subsequent to the Settlement Agreement, after taking into consideration the net cash flow received by us from the investment, whether in the form of (i) net proceeds from the sales or other dispositions or transfers of the GKK Properties, (ii) the net cash flow related to the GKK Mezzanine Loan, (iii) the net cash flow related to the GKK Properties subsequent to the Settlement Agreement and/or (iv) other proceeds related to the assets and liabilities received under the Settlement Agreement, then we would pay our advisor a fee in an amount not to exceed 1% of the contract sales price and subject to other conditions set forth in the advisory agreement, as determined by the conflicts committee in its sole discretion, which fee would be payable promptly upon such determination by the conflicts committee. |
On August 9, 2016, we entered into an amendment to the advisory agreement with our advisor to amend certain terms related to the disposition fee payable to our advisor by us. Pursuant to the amendment, with respect to sales of GKK Properties for which a disposition fee had not yet been paid as of August 9, 2016, based on the proceeds received from the entire investment related to the GKK Mezzanine Loan and the GKK Properties through August 9, 2016 and expected proceeds from future sales, the conflicts committee determined that our advisor had provided a substantial amount of services in connection with the sale of each of the 160 GKK Properties named therein and approved the payment to our advisor of a disposition fee equal to 1.0% of the aggregate contract sales prices of such GKK Properties, which aggregate disposition fee was $2.0 million. The aggregate contract sales price of such 160 GKK Properties was $214.1 million. The $2.0 million disposition fee was paid in August 2016.
Also pursuant to the amendment, for substantial assistance in connection with the sale of all GKK Properties that had not been sold as of August 9, 2016 (as determined by the conflicts committee of our board of directors), we will pay our advisor or its affiliates a disposition fee of 1.0% of the contract sales price of such GKK Properties sold. However, in no event may the total commissions (including such disposition fees) paid to our advisor, its affiliates and unaffiliated third parties exceed 6% of the contract sales price of the property or other investment sold or exceed a competitive real estate commission.
From January 1, 2016 through January 31, 2017, we incurred $8.6 million of disposition fees, including disposition fees payable in connection with the disposition of GKK Properties. As of January 31, 2017, $0.2 million of disposition fees was payable. For information relating to disposition fees potentially payable to our advisor during the liquidation process, see Part I, Item 1A, “Risk Factors — Risks Related to the Plan of Liquidation.”
On January 6, 2014, we, together with KBS REIT II, KBS REIT III, KBS Strategic Opportunity REIT, KBS Legacy Partners Apartment REIT, KBS Strategic Opportunity REIT II, our dealer manager, our advisor and other KBS-affiliated entities, entered into an errors and omissions and directors and officers liability insurance program where the lower tiers of such insurance coverage are shared. The cost of these lower tiers is allocated by our advisor and its insurance broker among each of the various entities covered by the program, and is billed directly to each entity. The allocation of these shared coverage costs is proportionate to the pricing by the insurance marketplace for the first tiers of directors and officers liability coverage purchased individually by each REIT. Our advisor’s and our dealer manager’s portion of the shared lower tiers’ cost is proportionate to the respective entities’ prior cost for the errors and omissions insurance. In June 2015, KBS Growth & Income REIT was added to the insurance program at terms similar to those described above. We have renewed our participation in the program, and the program is effective through June 30, 2017.
From January 1, 2016 through January 31, 2017, our advisor reimbursed us $36,000 for a property insurance rebate and our advisor and/or our dealer manager reimbursed us $69,000 for legal and professional fees and travel reimbursements.
Our Relationship with KBS Capital Markets Group. We have entered into a fee reimbursement agreement (the “AIP Reimbursement Agreement”) with KBS Capital Markets Group pursuant to which we agreed to reimburse KBS Capital Markets Group for certain fees and expenses it incurs for administering our participation in the DTCC Alternative Investment Product Platform with respect to certain accounts of our stockholders serviced through the platform. From January 1, 2016 through January 31, 2017, we incurred and paid $50,000 of costs and expenses related to the AIP Reimbursement Agreement.
88
Other Transactions. On May 18, 2012, KBS Strategic Opportunity REIT made an $8.0 million investment in a joint venture in which we indirectly own a participation interest through another joint venture investment. The conflicts committee, composed of all of our independent directors, approved the transaction. For more information, see our Annual Report on Form 10-K for the year ended December 31, 2012, filed with the SEC.
ITEM 14. | PRINCIPAL ACCOUNTING FEES AND SERVICES |
Independent Registered Public Accounting Firm
During the year ended December 31, 2016, Ernst & Young LLP served as our independent registered public accounting firm and provided certain tax and other services. Ernst & Young has served as our independent registered public accounting firm since our formation.
Pre-Approval Policies
In order to ensure that the provision of such services does not impair the auditors’ independence, the audit committee charter imposes a duty on the audit committee to pre-approve all auditing services performed for us by our independent auditors, as well as all permitted non-audit services. In determining whether or not to pre-approve services, the audit committee considers whether the service is a permissible service under the rules and regulations promulgated by the SEC. The audit committee may, in its discretion, delegate to one or more of its members the authority to pre-approve any audit or non-audit services to be performed by our independent auditors, provided any such approval is presented to and approved by the full audit committee at its next scheduled meeting.
For the years ended December 31, 2016 and 2015, all services rendered by Ernst & Young were pre-approved in accordance with the policies and procedures described above.
Principal Independent Registered Public Accounting Firm Fees
The audit committee reviewed the audit and non-audit services performed by Ernst & Young, as well as the fees charged by Ernst & Young for such services. In its review of the non-audit service fees, the audit committee considered whether the provision of such services is compatible with maintaining the independence of Ernst & Young. The aggregate fees billed to us for professional accounting services, including the audit of our annual financial statements by Ernst & Young for the years ended December 31, 2016 and 2015, are set forth in the table below.
2016 | 2015 | ||||||
Audit fees | $ | 859,035 | $ | 820,369 | |||
Audit-related fees | — | 79,000 | |||||
Tax fees | 408,231 | 381,727 | |||||
All other fees | 285 | 333 | |||||
Total | $ | 1,267,551 | $ | 1,281,429 | |||
For purposes of the preceding table, Ernst & Young’s professional fees are classified as follows:
• | Audit fees - These are fees for professional services performed for the audit of our annual financial statements and the required review of quarterly financial statements and other procedures performed by Ernst & Young in order for them to be able to form an opinion on our consolidated financial statements. These fees also cover services that are normally provided by independent auditors in connection with statutory and regulatory filings or engagements. |
• | Audit-related fees - These are fees for assurance and related services that traditionally are performed by independent auditors that are reasonably related to the performance of the audit or review of our financial statements, such as due diligence related to acquisitions and dispositions, attestation services that are not required by statute or regulation, internal control reviews and consultation concerning financial accounting and reporting standards. |
• | Tax fees - These are fees for all professional services performed by professional staff in our independent auditor’s tax division, except those services related to the audit of our financial statements. These include fees for tax compliance, tax planning and tax advice, including federal, state and local issues. Services may also include assistance with tax audits and appeals before the IRS and similar state and local agencies, as well as federal, state and local tax issues related to due diligence. |
• | All other fees - These are fees for any services not included in the above-described categories. |
89
PART IV
ITEM 15. | EXHIBITS, FINANCIAL STATEMENT SCHEDULES |
(a) | Financial Statement Schedules |
See the Index to Financial Statements at page F-1 of this report.
The following financial statement schedules are included herein at pages F-47 through F-52 of this report:
Schedule II - Valuation and Qualifying Accounts
Schedule III - Real Estate Assets and Accumulated Depreciation and Amortization
(b) | Exhibits |
Ex. | Description | ||
2.1 | Plan of Complete Liquidation and Dissolution of the Company dated as of January 27, 2017 | ||
3.1 | Articles of Amendment and Restatement of the Company, incorporated by reference to Exhibit 3.1 to the Company’s Quarterly Report on Form 10-Q for the period ended March 31, 2006, filed May 4, 2006 | ||
3.2 | Second Amended and Restated Bylaws of the Company, incorporated by reference to Exhibit 3.3 to the Company’s Annual Report on Form 10-K for the year ended December 31, 2015, filed March 16, 2016 | ||
3.3 | Third Amended and Restated Bylaws of the Company, incorporated by reference to Exhibit 3.1 to the Company’s Current Report on Form 8-K, filed September 22, 2016 | ||
3.4 | Articles of Amendment of the Company, incorporated by reference to Exhibit 99.1 to the Company's Current Report on Form 8-K, filed January 31, 2017 | ||
4.1 | Statement regarding restrictions on transferability of shares of common stock (to appear on stock certificate or to be sent upon request and without charge to stockholders issued shares without certificates), incorporated by reference to Exhibit 4.2 to the Company’s Registration Statement on Form S-11, Commission File No. 333-126087, filed June 23, 2005 | ||
10.1 | Purchase and Sale Agreement, by and among First States Investors 6000A, L.P., First States Investors 6000B, L.P., First States Investors 6000C, L.P. and First States Investors 6000D, L.P. and Pontus Net Lease Advisors, LLC, dated October 19, 2015, incorporated by reference to Exhibit 10.1 to the Company’s Quarterly Report on Form 10-Q for the period ended June 30, 2016, filed August 10, 2016 | ||
10.2 | Amended and Restated Purchase and Sale Agreement, by and among First States Investors 6000A, L.P., First States Investors 6000B, L.P., First States Investors 6000C, L.P. and First States Investors 6000D, L.P. and Pontus Net Lease Advisors, LLC, dated October 21, 2015, incorporated by reference to Exhibit 10.2 to the Company’s Quarterly Report on Form 10-Q for the period ended June 30, 2016, filed August 10, 2016 | ||
10.3 | First Amendment to Amended and Restated Purchase and Sale Agreement, by and among First States Investors 6000A, L.P., First States Investors 6000B, L.P., First States Investors 6000C, L.P. and First States Investors 6000D, L.P. and Pontus Net Lease Advisors, LLC, dated December 4, 2015, incorporated by reference to Exhibit 10.3 to the Company’s Quarterly Report on Form 10-Q for the period ended June 30, 2016, filed August 10, 2016 | ||
10.4 | Second Amendment to Amended and Restated Purchase and Sale Agreement, by and among First States Investors 6000A, L.P., First States Investors 6000B, L.P., First States Investors 6000C, L.P. and First States Investors 6000D, L.P. and Pontus Net Lease Advisors, LLC, dated January 8, 2016, incorporated by reference to Exhibit 10.4 to the Company’s Quarterly Report on Form 10-Q for the period ended June 30, 2016, filed August 10, 2016 | ||
10.5 | Third Amendment to Amended and Restated Purchase and Sale Agreement, by and among First States Investors 6000A, L.P., First States Investors 6000B, L.P., First States Investors 6000C, L.P. and First States Investors 6000D, L.P. and Pontus Net Lease Advisors, LLC, dated February 19, 2016, incorporated by reference to Exhibit 10.5 to the Company’s Quarterly Report on Form 10-Q for the period ended June 30, 2016, filed August 10, 2016 | ||
10.6 | Fourth Amendment to Amended and Restated Purchase and Sale Agreement, by and among First States Investors 6000A, L.P., First States Investors 6000B, L.P., First States Investors 6000C, L.P. and First States Investors 6000D, L.P. and Pontus Vault Portfolio, LLC, dated March 7, 2016, incorporated by reference to Exhibit 10.6 to the Company’s Quarterly Report on Form 10-Q for the period ended June 30, 2016, filed August 10, 2016 | ||
90
Ex. | Description | ||
10.7 | Fifth Amendment to Amended and Restated Purchase and Sale Agreement, by and among First States Investors 6000A, L.P., First States Investors 6000B, L.P., First States Investors 6000C, L.P. and First States Investors 6000D, L.P. and Pontus Vault Portfolio, LLC, dated March 10, 2016, incorporated by reference to Exhibit 10.7 to the Company’s Quarterly Report on Form 10-Q for the period ended June 30, 2016, filed August 10, 2016 | ||
10.8 | Sixth Amendment to Amended and Restated Purchase and Sale Agreement, by and among First States Investors 6000A, L.P., First States Investors 6000B, L.P., First States Investors 6000C, L.P. and First States Investors 6000D, L.P. and Pontus Vault Portfolio, LLC, dated March 17, 2016, incorporated by reference to Exhibit 10.8 to the Company’s Quarterly Report on Form 10-Q for the period ended June 30, 2016, filed August 10, 2016 | ||
10.9 | Seventh Amendment to Amended and Restated Purchase and Sale Agreement, by and among First States Investors 6000A, L.P., First States Investors 6000B, L.P., First States Investors 6000C, L.P. and First States Investors 6000D, L.P. and Pontus Vault Portfolio, LLC, dated March 18, 2016, incorporated by reference to Exhibit 10.9 to the Company’s Quarterly Report on Form 10-Q for the period ended June 30, 2016, filed August 10, 2016 | ||
10.10 | Second Amended and Restated Asset Management Services Agreement, by and between KBS Acquisition Sub, LLC and GKK Realty Advisors LLC, effective as of June 1, 2016, incorporated by reference to Exhibit 10.10 to the Company’s Quarterly Report on Form 10-Q for the period ended June 30, 2016, filed August 10, 2016 | ||
10.11 | Accounting/Construction Services Agreement, by and between KBS Acquisition Sub, LLC and GKK Realty Advisors LLC, effective as of June 1, 2016, incorporated by reference to Exhibit 10.11 to the Company’s Quarterly Report on Form 10-Q for the period ended June 30, 2016, filed August 10, 2016 | ||
10.12 | Amendment No. 1 to the Advisory Agreement, by and between the Company and KBS Capital Advisors LLC, dated August 9, 2016, incorporated by reference to Exhibit 10.12 to the Company’s Quarterly Report on Form 10-Q for the period ended June 30, 2016, filed August 10, 2016 | ||
10.13 | Advisory Agreement, by and between the Company and KBS Capital Advisors LLC, dated as of November 8, 2016 | ||
10.14 | First Amendment to Second Amended and Restated Asset Management Services Agreement, by and between KBS Acquisition Sub, LLC and GPT Realty Management LP, dated as of November 17, 2016 | ||
10.15 | First Amendment to Accounting and Construction Services Agreement, by and between KBS Acquisition Sub, LLC and GKK Realty Advisors LLC, dated as of November 17, 2016 | ||
21.1 | Subsidiaries of the Company | ||
31.1 | Certification of Chief Executive Officer pursuant to Section 302 of the Sarbanes-Oxley Act of 2002 | ||
31.2 | Certification of Chief Financial Officer pursuant to Section 302 of the Sarbanes-Oxley Act of 2002 | ||
32.1 | Certification of Chief Executive Officer pursuant to 18 U.S.C. 1350, as created by Section 906 of the Sarbanes-Oxley Act of 2002 | ||
32.2 | Certification of Chief Financial Officer pursuant to 18 U.S.C. 1350, as created by Section 906 of the Sarbanes-Oxley Act of 2002 | ||
99.1 | Amended and Restated Share Redemption Program, dated March 6, 2013, incorporated by reference to Exhibit 99.2 to the Company’s Annual Report on Form 10-K for the year ended December 31, 2012, filed March 13, 2013 | ||
99.2 | Amended and Restated Share Redemption Program, dated January 27, 2017, incorporated by reference to Exhibit 99.1 to the Company's Current Report on Form 8-K filed January 27, 2017 | ||
101.INS | XBRL Instance Document | ||
101.SCH | XBRL Taxonomy Extension Schema | ||
101.CAL | XBRL Taxonomy Extension Calculation Linkbase | ||
101.DEF | XBRL Taxonomy Extension Definition Linkbase | ||
101.LAB | XBRL Taxonomy Extension Label Linkbase | ||
101.PRE | XBRL Taxonomy Extension Presentation Linkbase | ||
91
INDEX TO CONSOLIDATED FINANCIAL STATEMENTS
Consolidated Financial Statements | |
Financial Statement Schedules | |
All other schedules are omitted because they are not applicable or the required information is shown in the financial statements or notes thereto.
F-1
REPORT OF INDEPENDENT REGISTERED PUBLIC ACCOUNTING FIRM
The Board of Directors and Stockholders of
KBS Real Estate Investment Trust, Inc.
We have audited the accompanying consolidated balance sheets of KBS Real Estate Investment Trust, Inc. (the “Company”) as of December 31, 2016 and 2015, and the related consolidated statements of operations, comprehensive income (loss), stockholders’ equity, and cash flows for each of the three years in the period ended December 31, 2016. Our audits also included the financial statement schedules listed in Item 15(a). These financial statements and schedules are the responsibility of the Company’s management. Our responsibility is to express an opinion on these financial statements and schedules based on our audits.
We conducted our audits in accordance with the standards of the Public Company Accounting Oversight Board (United States). Those standards require that we plan and perform the audit to obtain reasonable assurance about whether the financial statements are free of material misstatement. We were not engaged to perform an audit of the Company’s internal control over financial reporting. Our audits included consideration of internal control over financial reporting as a basis for designing audit procedures that are appropriate in the circumstances, but not for the purpose of expressing an opinion on the effectiveness of the Company’s internal control over financial reporting. Accordingly, we express no such opinion. An audit also includes examining, on a test basis, evidence supporting the amounts and disclosures in the financial statements, assessing the accounting principles used and significant estimates made by management, and evaluating the overall financial statement presentation. We believe that our audits provide a reasonable basis for our opinion.
In our opinion, the financial statements referred to above present fairly, in all material respects, the consolidated financial position of KBS Real Estate Investment Trust, Inc. at December 31, 2016 and 2015, and the consolidated results of its operations and its cash flows for each of the three years in the period ended December 31, 2016, in conformity with U.S. generally accepted accounting principles. Also, in our opinion, the financial statement schedules referred to above, when considered in relation to the basic financial statements taken as a whole, present fairly, in all material respects, the information set forth therein.
As discussed in Note 2 to the consolidated financial statements, the Company changed its presentation of restricted cash activities within the statement of cash flows as a result of the adoption of the amendments to the FASB Accounting Standards Codification resulting from Accounting Standards Update No. 2016-18, “Statement of Cash Flows (Topic 230): Restricted Cash,” effective December 31, 2016.
/s/ Ernst & Young LLP
Irvine, California
March 28, 2017
F-2
KBS REAL ESTATE INVESTMENT TRUST, INC.
CONSOLIDATED BALANCE SHEETS
(in thousands, except share and per share amounts)
December 31, 2016 | December 31, 2015 | ||||||
Assets | |||||||
Real estate held for investment: | |||||||
Land | $ | 72,985 | $ | 75,583 | |||
Buildings and improvements | 344,941 | 349,575 | |||||
Tenant origination and absorption costs | 6,625 | 8,957 | |||||
Total real estate held for investment, at cost and net of impairment charges | 424,551 | 434,115 | |||||
Less accumulated depreciation and amortization | (62,932 | ) | (56,952 | ) | |||
Total real estate held for investment, net | 361,619 | 377,163 | |||||
Real estate held for sale, net | 21,698 | 483,717 | |||||
Total real estate, net | 383,317 | 860,880 | |||||
Real estate loans receivable, net | 22,864 | 27,281 | |||||
Total real estate and real estate-related investments, net | 406,181 | 888,161 | |||||
Cash and cash equivalents | 173,437 | 46,605 | |||||
Restricted cash | 11,335 | 39,874 | |||||
Rents and other receivables, net | 21,917 | 22,730 | |||||
Above-market leases, net | 455 | 891 | |||||
Assets related to real estate held for sale | 675 | 38,937 | |||||
Prepaid expenses and other assets, net | 27,927 | 17,667 | |||||
Total assets | $ | 641,927 | $ | 1,054,865 | |||
Liabilities and equity | |||||||
Notes payable: | |||||||
Notes payable, net | $ | — | $ | 169,289 | |||
Notes payable related to real estate held for sale, net | — | 258,933 | |||||
Total notes payable, net | — | 428,222 | |||||
Accounts payable and accrued liabilities | 7,574 | 19,152 | |||||
Due to affiliates | 188 | 68 | |||||
Below-market leases, net | 3,937 | 8,342 | |||||
Liabilities related to real estate held for sale | 1,909 | 19,843 | |||||
Other liabilities | 31,887 | 49,575 | |||||
Total liabilities | 45,495 | 525,202 | |||||
Commitments and contingencies (Note 13) | |||||||
Redeemable common stock | — | 10,000 | |||||
Stockholders’ equity | |||||||
Preferred stock, $.01 par value; 10,000,000 shares authorized, no shares issued and outstanding | — | — | |||||
Common stock, $.01 par value; 1,000,000,000 shares authorized, 184,985,282 and 186,414,147 shares issued and outstanding as of December 31, 2016 and 2015, respectively | 1,850 | 1,864 | |||||
Additional paid-in capital | 1,660,588 | 1,656,137 | |||||
Cumulative distributions and net losses | (1,066,006 | ) | (1,138,338 | ) | |||
Total stockholders’ equity | 596,432 | 519,663 | |||||
Total liabilities and stockholders’ equity | $ | 641,927 | $ | 1,054,865 | |||
See accompanying notes to consolidated financial statements.
F-3
KBS REAL ESTATE INVESTMENT TRUST, INC.
CONSOLIDATED STATEMENTS OF OPERATIONS
(in thousands, except share and per share amounts)
Years Ended December 31, | |||||||||||
2016 | 2015 | 2014 | |||||||||
Revenues: | |||||||||||
Rental income | $ | 97,383 | $ | 135,117 | $ | 151,351 | |||||
Tenant reimbursements | 26,977 | 47,217 | 54,366 | ||||||||
Interest income from real estate loans receivable | 2,845 | 3,089 | 3,077 | ||||||||
Parking revenues and other operating income | 2,129 | 2,797 | 3,671 | ||||||||
Total revenues | 129,334 | 188,220 | 212,465 | ||||||||
Expenses: | |||||||||||
Operating, maintenance, and management | 52,857 | 75,034 | 84,288 | ||||||||
Real estate taxes, property-related taxes, and insurance | 15,998 | 23,696 | 27,243 | ||||||||
Asset management fees to affiliate | 7,553 | 9,547 | 9,975 | ||||||||
Foreclosure fees and expenses | 278 | — | — | ||||||||
General and administrative expenses | 15,971 | 32,619 | 18,788 | ||||||||
Depreciation and amortization | 35,961 | 59,145 | 71,613 | ||||||||
Interest expense | 10,536 | 29,517 | 45,923 | ||||||||
Impairment charges on real estate | 33,419 | 49,306 | 10,117 | ||||||||
Provision for loan losses | — | 2,504 | 1,973 | ||||||||
Total expenses | 172,573 | 281,368 | 269,920 | ||||||||
Other income | |||||||||||
Gain on sales of real estate securities (includes $4.5 million of unrealized gains reclassified from accumulated other comprehensive income during the year ended December 31, 2014) | — | — | 4,410 | ||||||||
Gain on sales of real estate, net | 159,464 | 99,988 | 2,282 | ||||||||
Gain on sales of foreclosed real estate held for sale | — | 2,509 | 1,108 | ||||||||
(Loss) gain from extinguishment of debt | (26,343 | ) | (22,518 | ) | 21,328 | ||||||
Other interest income | 746 | 605 | 535 | ||||||||
Other income | 183 | 789 | 403 | ||||||||
Total other income | 134,050 | 81,373 | 30,066 | ||||||||
Income (loss) from continuing operations | 90,811 | (11,775 | ) | (27,389 | ) | ||||||
Discontinued operations: | |||||||||||
Gain on sales of real estate, net | — | 124 | 4,797 | ||||||||
Income from discontinued operations | 82 | 264 | 1,583 | ||||||||
Impairment charges on discontinued operations | — | — | (257 | ) | |||||||
Total income from discontinued operations | 82 | 388 | 6,123 | ||||||||
Net income (loss) | $ | 90,893 | $ | (11,387 | ) | $ | (21,266 | ) | |||
Basic and diluted income (loss) per common share: | |||||||||||
Continuing operations | $ | 0.49 | $ | (0.06 | ) | $ | (0.14 | ) | |||
Discontinued operations | — | — | 0.03 | ||||||||
Net income (loss) per common share | $ | 0.49 | $ | (0.06 | ) | $ | (0.11 | ) | |||
Weighted-average number of common shares outstanding, basic and diluted | 185,704,854 | 187,219,590 | 188,891,977 | ||||||||
See accompanying notes to consolidated financial statements.
F-4
KBS REAL ESTATE INVESTMENT TRUST, INC.
CONSOLIDATED STATEMENTS OF COMPREHENSIVE INCOME (LOSS)
(in thousands)
Years Ended December 31, | ||||||||||||
2016 | 2015 | 2014 | ||||||||||
Net income (loss) | $ | 90,893 | $ | (11,387 | ) | $ | (21,266 | ) | ||||
Other comprehensive loss | ||||||||||||
Unrealized change in market value of real estate securities | — | — | (100 | ) | ||||||||
Reclassification of realized gain on real estate securities | — | — | (4,452 | ) | ||||||||
Total other comprehensive loss | — | — | (4,552 | ) | ||||||||
Total comprehensive income (loss) | $ | 90,893 | $ | (11,387 | ) | $ | (25,818 | ) | ||||
See accompanying notes to consolidated financial statements.
F-5
KBS REAL ESTATE INVESTMENT TRUST, INC.
CONSOLIDATED STATEMENTS OF STOCKHOLDERS’ EQUITY
(dollars in thousands)
Common Stock | Additional Paid-in Capital | Cumulative Distributions and Net Income (Loss) | Accumulated Other Comprehensive Income (Loss) | Total Stockholders’ Equity | ||||||||||||||||||
Shares | Amounts | |||||||||||||||||||||
Balance, December 31, 2013 | 189,616,701 | $ | 1,896 | $ | 1,670,356 | $ | (1,030,911 | ) | $ | 4,552 | $ | 645,893 | ||||||||||
Net loss | — | — | — | (21,266 | ) | — | (21,266 | ) | ||||||||||||||
Other comprehensive loss | — | — | — | — | (4,552 | ) | (4,552 | ) | ||||||||||||||
Redemptions of common stock | (1,771,186 | ) | (17 | ) | (7,873 | ) | — | — | (7,890 | ) | ||||||||||||
Distributions declared | — | — | — | (9,412 | ) | — | (9,412 | ) | ||||||||||||||
Balance, December 31, 2014 | 187,845,515 | $ | 1,879 | $ | 1,662,483 | $ | (1,061,589 | ) | $ | — | $ | 602,773 | ||||||||||
Net loss | — | — | — | (11,387 | ) | — | (11,387 | ) | ||||||||||||||
Redemptions of common stock | (1,431,368 | ) | (15 | ) | (6,346 | ) | — | — | (6,361 | ) | ||||||||||||
Distributions declared | — | — | — | (65,362 | ) | — | (65,362 | ) | ||||||||||||||
Balance, December 31, 2015 | 186,414,147 | $ | 1,864 | $ | 1,656,137 | $ | (1,138,338 | ) | $ | — | $ | 519,663 | ||||||||||
Net income | — | — | — | 90,893 | — | 90,893 | ||||||||||||||||
Redemptions of common stock | (1,428,865 | ) | (14 | ) | (5,549 | ) | — | — | (5,563 | ) | ||||||||||||
Transfers from redeemable common stock | — | — | 10,000 | — | — | 10,000 | ||||||||||||||||
Distributions declared | — | — | — | (18,561 | ) | — | (18,561 | ) | ||||||||||||||
Balance, December 31, 2016 | 184,985,282 | $ | 1,850 | $ | 1,660,588 | $ | (1,066,006 | ) | $ | — | $ | 596,432 | ||||||||||
See accompanying notes to consolidated financial statements.
F-6
KBS REAL ESTATE INVESTMENT TRUST, INC.
CONSOLIDATED STATEMENTS OF CASH FLOWS
(in thousands)
Years Ended December 31, | |||||||||||
2016 | 2015 | 2014 | |||||||||
Cash Flows from Operating Activities: | |||||||||||
Net income (loss) | $ | 90,893 | $ | (11,387 | ) | $ | (21,266 | ) | |||
Adjustments to reconcile net income (loss) to net cash provided by (used in) operating activities: | |||||||||||
Depreciation and amortization | 35,961 | 59,145 | 71,613 | ||||||||
Impairment charges on real estate - continuing operations | 33,419 | 49,306 | 10,117 | ||||||||
Impairment charges on real estate - discontinued operations | — | — | 257 | ||||||||
Loss due to property damages | 1,033 | — | — | ||||||||
Noncash interest income on real estate-related investments | (1,139 | ) | (1,016 | ) | (975 | ) | |||||
Change in provision for loan losses | — | 2,504 | 1,973 | ||||||||
Deferred rent | (1,814 | ) | (2,539 | ) | (3,351 | ) | |||||
Bad debt expense (recovery) | 309 | (320 | ) | 683 | |||||||
Amortization of deferred financing costs | 324 | 1,873 | 1,581 | ||||||||
Deferred interest payable | — | — | 637 | ||||||||
Amortization of above- and below-market leases, net | (5,345 | ) | (7,192 | ) | (9,040 | ) | |||||
Gain on sales of foreclosed real estate held for sale | — | (2,509 | ) | (1,108 | ) | ||||||
Gain on sales of real estate, net | (159,464 | ) | (100,112 | ) | (7,079 | ) | |||||
Gain on sales of real estate securities | — | — | (4,410 | ) | |||||||
Loss (gain) on extinguishment of debt | 26,343 | 22,518 | (21,328 | ) | |||||||
Amortization of discounts and premiums on notes payable, net | 227 | 1,333 | 3,371 | ||||||||
Changes in operating assets and liabilities: | |||||||||||
Rents and other receivables | 1,751 | 298 | (4,876 | ) | |||||||
Prepaid expenses and other assets | (13,819 | ) | (6,651 | ) | (7,241 | ) | |||||
Accounts payable and accrued liabilities | (4,966 | ) | (1,326 | ) | (8,508 | ) | |||||
Due to affiliates | 120 | 23 | 45 | ||||||||
Other liabilities | (17,694 | ) | 15,483 | 2,170 | |||||||
Net cash (used in) provided by operating activities | (13,861 | ) | 19,431 | 3,265 | |||||||
Cash Flows from Investing Activities: | |||||||||||
Acquisition of real estate | — | (2,297 | ) | — | |||||||
Improvements to real estate | (27,029 | ) | (38,233 | ) | (27,377 | ) | |||||
Proceeds from sales of real estate, net | 617,319 | 301,833 | 93,335 | ||||||||
Proceeds from sales of foreclosed real estate held for sale | — | 14,155 | 8,861 | ||||||||
Insurance proceeds received for property damage | 1,028 | — | — | ||||||||
Principal repayments on real estate loans receivable | 76 | 153 | 127 | ||||||||
Proceeds from sale of real estate securities | — | — | 7,831 | ||||||||
Net cash provided by investing activities | 591,394 | 275,611 | 82,777 | ||||||||
Cash Flows from Financing Activities: | |||||||||||
Proceeds from notes payable | — | — | 42,500 | ||||||||
Principal payments on notes payable | (263,810 | ) | (146,094 | ) | (305,238 | ) | |||||
Prepayment premium on the repayment of debt | (6,534 | ) | (6,643 | ) | — | ||||||
Payments of deferred financing costs | — | (294 | ) | (1,731 | ) | ||||||
Purchase of treasury securities in connection with defeasance of notes payable | (184,772 | ) | (100,540 | ) | — | ||||||
Payments to redeem common stock | (5,563 | ) | (6,361 | ) | (7,890 | ) | |||||
Distributions paid to common stockholders | (18,561 | ) | (70,061 | ) | (4,713 | ) | |||||
Net cash used in financing activities | (479,240 | ) | (329,993 | ) | (277,072 | ) | |||||
Net increase (decrease) in cash, cash equivalents and restricted cash | 98,293 | (34,951 | ) | (191,030 | ) | ||||||
Cash, cash equivalents and restricted cash, beginning of period | 86,479 | 121,430 | 312,460 | ||||||||
Cash, cash equivalents, and restricted cash, end of period | $ | 184,772 | $ | 86,479 | $ | 121,430 | |||||
See accompanying notes to consolidated financial statements.
F-7
KBS REAL ESTATE INVESTMENT TRUST, INC.
NOTES TO CONSOLIDATED FINANCIAL STATEMENTS
December 31, 2016
1. | ORGANIZATION |
KBS Real Estate Investment Trust, Inc. (the “Company”) was formed on June 13, 2005 as a Maryland corporation and has elected to be taxed as a real estate investment trust (“REIT”). Substantially all of the Company’s assets are held by, and the Company conducts substantially all of its operations through, KBS Limited Partnership, a Delaware limited partnership (the “Operating Partnership”), and its subsidiaries. The Company is the sole general partner of and directly owns a 99% partnership interest in the Operating Partnership. The Company’s wholly owned subsidiary, KBS REIT Holdings LLC, a Delaware limited liability company (“KBS REIT Holdings”), owns the remaining 1% partnership interest in the Operating Partnership and is its sole limited partner.
As of December 31, 2016, the Company owned or, with respect to a limited number of properties, held a leasehold interest in, 90 real estate properties (of which 30 GKK Properties (defined below) were held for sale). In addition, as of December 31, 2016, the Company owned three real estate loans receivable and a participation interest with respect to a real estate joint venture.
On September 1, 2011, the Company, through indirect wholly owned subsidiaries (collectively, “KBS”), entered into a Collateral Transfer and Settlement Agreement (the “Settlement Agreement”) with, among other parties, GKK Stars Acquisition LLC (“GKK Stars”), the wholly owned subsidiary of Gramercy Property Trust, Inc. (“Gramercy”) that indirectly owned the Gramercy real estate portfolio, to effect the orderly transfer of certain assets and liabilities of the Gramercy real estate portfolio to KBS in satisfaction of certain debt obligations under a mezzanine loan owed by wholly owned subsidiaries of Gramercy to KBS (the “GKK Mezzanine Loan”). The Settlement Agreement resulted in the transfer of the equity interests in certain subsidiaries of Gramercy (the “Equity Interests”) that indirectly owned or, with respect to a limited number of properties, held a leasehold interest in, 867 properties (the “GKK Properties”), consisting of 576 bank branch properties and 291 office buildings, operations centers and other properties. As of December 15, 2011, GKK Stars had transferred all of the Equity Interests to the Company, giving the Company title to or, with respect to a limited number of GKK Properties, a leasehold interest in, 867 GKK Properties as of that date.
Subject to certain restrictions and limitations, the business of the Company is managed by KBS Capital Advisors LLC (the “Advisor”), an affiliate of the Company, pursuant to an advisory agreement with the Company (the “Advisory Agreement”) in effect through November 8, 2017. The Advisory Agreement may be renewed for an unlimited number of one-year periods upon the mutual consent of the Advisor and the Company. Either party may terminate the Advisory Agreement upon 60 days written notice. The Advisor owns 20,000 shares of the Company’s common stock.
Upon commencing its initial public offering (the “Offering”), the Company retained KBS Capital Markets Group LLC (the “Dealer Manager”), an affiliate of the Advisor, to serve as the dealer manager of the Offering pursuant to a dealer manager agreement dated January 27, 2006 (the “Dealer Manager Agreement”). The Company ceased offering shares of common stock in its primary offering on May 30, 2008. The Company terminated its dividend reinvestment plan effective April 10, 2012.
The Company sold 171,109,494 shares of common stock in its primary offering for gross offering proceeds of $1.7 billion. The Company sold 28,306,086 shares of common stock under its dividend reinvestment plan for gross offering proceeds of $233.7 million. As of December 31, 2016, the Company had redeemed 14,450,298 of the shares sold in the Offering for $97.4 million.
On January 27, 2016, the Company’s board of directors formed a special committee (the “Special Committee”) composed of all of its independent directors to explore the availability of strategic alternatives involving the Company. On October 5, 2016, in connection with a review of potential strategic alternatives available to the Company, the Special Committee and the board of directors unanimously approved the sale of all of the Company’s assets and the Company’s dissolution pursuant to the terms of the Company’s plan of complete liquidation and dissolution (the “Plan of Liquidation”). The principal purpose of the Plan of Liquidation is to maximize stockholder value by selling the Company’s assets, paying the Company’s debts and distributing the net proceeds from liquidation to the Company’s stockholders. On January 27, 2017, the Company’s stockholders approved the Plan of Liquidation. For more information, see the Plan of Liquidation, which is included as an exhibit to this Annual Report on Form 10-K.
F-8
KBS REAL ESTATE INVESTMENT TRUST, INC.
NOTES TO CONSOLIDATED FINANCIAL STATEMENTS (CONTINUED)
December 31, 2016
Asset Management Services Agreement Related to the GKK Properties
On December 19, 2013, the Company, through an indirect wholly owned subsidiary (“KBS Acquisition Sub”), entered into an amended and restated asset management services agreement (the “Amended Services Agreement”) with GKK Realty Advisors LLC (“GKKRA”), an affiliate of Gramercy, with respect to the GKK Properties. The effective date of the Amended Services Agreement was December 1, 2013. Pursuant to the Amended Services Agreement, GKKRA agreed to provide, among other services: standard asset management services, assistance related to dispositions, accounting services and budgeting and business plans for the GKK Properties (the “Services”). As compensation for the Services, the Company agreed to pay GKKRA: (i) an annual fee of $7.5 million plus all GKK Property-related expenses incurred by GKKRA, (ii) subject to certain terms and conditions in the Amended Services Agreement, a profit participation interest based on a percentage (ranging from 10% to 30%) of the amount by which the gross fair market value or gross sales price of certain identified portfolios of GKK Properties exceeds the sum of (a) an agreed-upon baseline value for such GKK Property portfolios plus (b) new capital expended to increase the value of GKK Properties within the portfolios and expenditures made to pay for tenant improvements and leasing commissions related to these GKK Properties as of the measurement date, and (iii) a monthly construction oversight fee equal to a percentage of construction costs for certain construction projects at the GKK Properties overseen by GKKRA.
On June 29, 2016, KBS Acquisition Sub entered into two agreements, a second amended and restated asset management services agreement (the “Second Amended Services Agreement”) and an accounting/construction services agreement (the “Accounting/Construction Services Agreement” and, together with the Second Amended Services Agreement, the “GKK Agreements”), with GKKRA. The effective date of both the GKK Agreements was June 1, 2016. Combined, the Services and the key terms and compensation for the Services under the GKK Agreements are the same as those of the prior Amended Services Agreement; the two agreements allocate the Services and the compensation between asset management services and accounting/construction services. On June 29, 2016, GKKRA assigned the Second Amended Services Agreement to an affiliate, GPT Realty Management LP (“GPT” and, together with GKKRA, the “Property Manager”), an entity controlled by Gramercy. Neither the Property Manager nor Gramercy is affiliated with the Company or KBS Acquisition Sub.
On November 17, 2016, KBS Acquisition Sub entered into an amendment to the Second Amended Services Agreement with GPT (the “First Amendment to Second Amended Services Agreement”) and an amendment to the Accounting/Construction Services Agreement with GKKRA (the “First Amendment to Accounting/Construction Services Agreement”) to, among other changes, (i) extend the termination date of the GKK Agreements from December 31, 2016 to March 31, 2017, at which point the Company does not anticipate that GKK Properties will make up a significant percentage of its assets and (ii) reduce the base management fee for the Services from $625,000 per month to $550,000 per month plus GKK Property-related expenses incurred by GPT for the period commencing on January 1, 2017 through March 31, 2017. In addition, the Company agreed to pay GPT an amount equal to $1.0 million upon termination of a leasehold interest of a property located in downtown St. Petersburg, Florida.
As of December 31, 2016, the Company had accrued $12.8 million of estimated profit participation interest related to the GKK Properties under the GKK Agreements, as amended.
F-9
KBS REAL ESTATE INVESTMENT TRUST, INC.
NOTES TO CONSOLIDATED FINANCIAL STATEMENTS (CONTINUED)
December 31, 2016
2. | SUMMARY OF SIGNIFICANT ACCOUNTING POLICIES |
Principles of Consolidation and Basis of Presentation
The consolidated financial statements include the accounts of the Company, KBS REIT Holdings, the Operating Partnership and their direct and indirect wholly owned subsidiaries. All significant intercompany balances and transactions are eliminated in consolidation.
The consolidated financial statements are prepared in accordance with U.S. generally accepted accounting principles (“GAAP”) as contained within the Financial Accounting Standards Board (“FASB”) Accounting Standards Codification (“ASC”) and the rules and regulations of the Securities and Exchange Commission (“SEC”).
The consolidated financial statements have been prepared on a going concern basis. Pursuant to the Company’s stockholders approval of the Plan of Liquidation on January 27, 2017, the Company expects to adopt the liquidation basis of accounting commencing with its March 31, 2017 interim period to present information about its expected resources in liquidation by measuring and presenting assets at the amount of the expected cash proceeds from liquidation.
Use of Estimates
The preparation of the consolidated financial statements and the accompanying notes thereto in conformity with GAAP requires management to make estimates and assumptions that affect the amounts reported in the consolidated financial statements and accompanying notes. Actual results could materially differ from those estimates.
Reclassifications
Certain amounts in the Company’s prior period consolidated financial statements have been reclassified to conform to the current period presentation. These reclassifications have not changed the results of operations of prior periods. During the year ended December 31, 2016, the Company sold 273 properties (269 of which were GKK Properties). As of December 31, 2016, the Company had classified 30 properties as held for sale, all of which were GKK Properties. As a result, certain assets and liabilities were reclassified to held for sale on the consolidated balance sheets for all periods presented.
Revenue Recognition
Real Estate
The Company recognizes minimum rent, including rental abatements, lease incentives and contractual fixed increases attributable to operating leases, on a straight-line basis over the term of the related leases when collectibility is reasonably assured and records amounts expected to be received in later years as deferred rent receivable. If the lease provides for tenant improvements, the Company determines whether the tenant improvements, for accounting purposes, are owned by the tenant or the Company. When the Company is the owner of the tenant improvements, the tenant is not considered to have taken physical possession or have control of the physical use of the leased asset until the tenant improvements are substantially completed. When the tenant is the owner of the tenant improvements, any tenant improvement allowance (including amounts that the tenant can take in the form of cash or a credit against its rent) that is funded is treated as a lease incentive and amortized as a reduction of revenue over the lease term. Tenant improvement ownership is determined based on various factors including, but not limited to:
• | whether the lease stipulates how a tenant improvement allowance may be spent; |
• | whether the amount of a tenant improvement allowance is in excess of market rates; |
• | whether the tenant or landlord retains legal title to the improvements at the end of the lease term; |
• | whether the tenant improvements are unique to the tenant or general-purpose in nature; and |
• | whether the tenant improvements are expected to have any residual value at the end of the lease. |
The Company records property operating expense reimbursements due from tenants for common area maintenance, real estate taxes, and other recoverable costs in the period the related expenses are incurred.
F-10
KBS REAL ESTATE INVESTMENT TRUST, INC.
NOTES TO CONSOLIDATED FINANCIAL STATEMENTS (CONTINUED)
December 31, 2016
The Company makes estimates of the collectibility of its tenant receivables related to base rents, including deferred rent receivable, expense reimbursements and other revenue or income. Management specifically analyzes accounts receivable, deferred rent receivable, historical bad debts, customer creditworthiness, current economic trends and changes in customer payment terms when evaluating the adequacy of the allowance for doubtful accounts. In addition, with respect to tenants in bankruptcy, management makes estimates of the expected recovery of pre-petition and post-petition claims in assessing the estimated collectibility of the related receivable. In some cases, the ultimate resolution of these claims can exceed one year. When a tenant is in bankruptcy, the Company will record a bad debt reserve for the tenant’s receivable balance and generally will not recognize subsequent rental revenue until cash is received or until the tenant is no longer in bankruptcy and has the ability to make rental payments.
The Company recognizes a gain on sale of real estate upon the closing of a transaction with the purchaser. Gain on real estate sold are recognized using the full accrual method when collectibility of the sales price is reasonably assured, the Company is not obligated to perform additional activities that may be considered significant, the initial investment from the buyer is sufficient and other profit recognition criteria have been satisfied. A gain on sale of real estate may be deferred in whole or in part until the requirements for gain recognition have been met.
Real Estate Loans Receivable
Interest income on the Company’s real estate loans receivable is recognized on an accrual basis over the life of the investment using the interest method. Direct loan origination fees and origination or acquisition costs, as well as acquisition premiums or discounts, are amortized over the term of the loan as an adjustment to interest income. The Company places loans on nonaccrual status when any portion of principal or interest is 90 days past due, or earlier when concern exists as to the ultimate collection of principal or interest. When a loan is placed on nonaccrual status, the Company reserves for any unpaid accrued interest and generally does not recognize subsequent interest income until cash is received, or the loan returns to accrual status. The Company will resume the accrual of interest if it determines the collection of interest, according to the contractual terms of the loan, is probable.
The Company generally recognizes income on impaired loans on either a cash basis, where interest income is only recorded when received in cash, or on a cost-recovery basis, where all cash receipts are applied against the carrying value of the loan. The Company considers the collectibility of the loan’s principal balance in determining whether to recognize income on impaired loans on a cash basis or a cost-recovery basis.
Cash and Cash Equivalents
The Company recognizes interest income on its cash and cash equivalents as it is earned and classifies such amounts as other interest income.
Real Estate
Depreciation and Amortization
Real estate costs related to the acquisition and improvement of properties are capitalized and amortized over the expected useful life of the asset on a straight-line basis. Repair and maintenance costs are charged to expense as incurred and significant replacements and betterments are capitalized. Repair and maintenance costs include all costs that do not extend the useful life of the real estate asset. The Company considers the period of future benefit of an asset to determine its appropriate useful life. Expenditures for tenant improvements are capitalized and amortized over the shorter of the tenant’s lease term or expected useful life. The Company anticipates the estimated useful lives of its assets by class to be generally as follows:
Buildings | 15 - 40 years |
Building improvements | 10 - 25 years |
Tenant improvements | Shorter of lease term or expected useful life |
Tenant origination and absorption costs | Remaining term of related leases, including below-market renewal periods |
F-11
KBS REAL ESTATE INVESTMENT TRUST, INC.
NOTES TO CONSOLIDATED FINANCIAL STATEMENTS (CONTINUED)
December 31, 2016
Real Estate Acquisition Valuation
The Company records the acquisition of income-producing real estate or real estate that will be used for the production of income as a business combination. All assets acquired and liabilities assumed in a business combination are measured at their acquisition-date fair values. Acquisition costs are expensed as incurred and restructuring costs that do not meet the definition of a liability at the acquisition date are expensed in periods subsequent to the acquisition date.
The Company assesses the acquisition date fair values of all tangible assets, identifiable intangibles and assumed liabilities using methods similar to those used by independent appraisers, generally utilizing a discounted cash flow analysis that applies appropriate discount and/or capitalization rates and available market information. Estimates of future cash flows are based on a number of factors, including historical operating results, known and anticipated trends, and market and economic conditions. The fair value of tangible assets of an acquired property considers the value of the property as if it were vacant.
The Company records above-market and below-market in-place lease values for acquired properties based on the present value (using a discount rate that reflects the risks associated with the leases acquired) of the difference between (i) the contractual amounts to be paid pursuant to the in-place leases and (ii) management’s estimate of fair market lease rates for the corresponding in-place leases, measured over a period equal to the remaining non-cancelable term of above-market in-place leases and for the initial term plus any extended term for any leases with below-market renewal options. The Company amortizes any recorded above-market or below-market lease values as a reduction or increase, respectively, to rental income over the remaining non-cancelable terms of the respective lease, including any below-market renewal periods.
The Company estimates the value of tenant origination and absorption costs by considering the estimated carrying costs during hypothetical expected lease up periods, considering current market conditions. In estimating carrying costs, the Company includes real estate taxes, insurance and other operating expenses and estimates of lost rentals at market rates during the expected lease up periods.
The Company amortizes the value of tenant origination and absorption costs to depreciation and amortization expense over the remaining non-cancelable term of the leases.
Estimates of the fair values of the tangible assets, identifiable intangibles and assumed liabilities require the Company to make significant assumptions to estimate market lease rates, property-operating expenses, carrying costs during lease-up periods, discount rates, market absorption periods, and the number of years the property will be held for investment. The use of inappropriate assumptions would result in an incorrect valuation of the Company’s acquired tangible assets, identifiable intangibles and assumed liabilities, which would impact the amount of the Company’s net income.
Impairment of Real Estate and Related Intangible Assets and Liabilities
The Company continually monitors events and changes in circumstances that could indicate that the carrying amounts of its real estate and related intangible assets and liabilities may not be recoverable or realized. When indicators of potential impairment suggest that the carrying value of real estate and related intangible assets and liabilities may not be recoverable, the Company assesses the recoverability by estimating whether the Company will recover the carrying value of the real estate and related intangible assets and liabilities through its undiscounted future cash flows and its eventual disposition. If, based on this analysis, the Company does not believe that it will be able to recover the carrying value of the real estate and related intangible assets and liabilities, the Company would record an impairment loss to the extent that the carrying value exceeds the estimated fair value of the real estate and related intangible assets and liabilities.
F-12
KBS REAL ESTATE INVESTMENT TRUST, INC.
NOTES TO CONSOLIDATED FINANCIAL STATEMENTS (CONTINUED)
December 31, 2016
Real Estate Held for Sale and Discontinued Operations
The Company generally considers non-foreclosed real estate to be “held for sale” when the following criteria are met: (i) management commits to a plan to sell the property, (ii) the property is available for sale immediately, (iii) the property is actively being marketed for sale at a price that is reasonable in relation to its current fair value, (iv) the sale of the property within one year is considered probable and (v) significant changes to the plan to sell are not expected. Real estate that is held for sale and its related assets are classified as “real estate held for sale” and “assets related to real estate held for sale,” respectively, for all periods presented in the accompanying consolidated financial statements. Notes payable and other liabilities related to real estate held for sale are classified as “notes payable related to real estate held for sale” and “liabilities related to real estate held for sale,” respectively, for all periods presented in the accompanying consolidated financial statements. Real estate classified as held for sale is no longer depreciated and is reported at the lower of its carrying value or its estimated fair value less estimated costs to sell. Additionally, with respect to properties that were classified as held for sale in financial statements prior to January 1, 2014, the Company records the operating results and gains on sale as discontinued operations for all periods presented if the operations have been or are expected to be eliminated and the Company will not have any significant continuing involvement in the operations of the property following the sale. Operating results related to properties and gains on sale that were disposed of or classified as held for sale in the ordinary course of business during the years ended December 31, 2016, 2015 and 2014 that had not been classified as held for sale in financial statements prior to January 1, 2014 are included in continuing operations on the Company’s consolidated statements of operations.
Change in a Plan to Sell
When real estate is initially considered “held for sale” it is measured at the lower of its depreciated book value, or estimated fair value less estimated costs to sell. Changes in the market may compel the Company to decide to reclassify a property that was designated as held for sale to held for investment. A property that is reclassified from held for sale to held for investment or non-sale disposition is measured and recorded individually at the lower of (i) its carrying amount before the property was classified as held for sale, adjusted for any depreciation and amortization expense that would have been recognized had the property been continuously classified as held and used, or (ii) its fair value at the date of the subsequent decision not to sell. Any adjustment to the carrying amount of the property as a result of the reclassification is included in income from continuing operations as an impairment charge on real estate held for investment.
Real Estate Held for Non-Sale Disposition
The Company considers real estate assets that do not meet the criteria to be classified as held for sale but are expected to be disposed of other than by sale as real estate held for non-sale disposition. The assets and liabilities related to real estate held for non-sale disposition are included in the Company’s consolidated balance sheets and the results of operations are presented as part of continuing operations in the Company’s consolidated statements of operations for all periods presented. With respect to properties that were disposed of other than by sale prior to January 1, 2014, the Company records the operating results as discontinued operations for all periods presented. Operating results of properties that were disposed of other than by sale during the year ended December 31, 2014 are included in continuing operations on the Company’s consolidated statements of operations. The Company did not dispose of any properties other than by sale during the year ended December 31, 2016 and 2015.
Real Estate Loans Receivable
The Company’s real estate loans receivable are recorded at amortized cost, net of loan loss reserves, and evaluated for impairment at each balance sheet date. The amortized cost of a real estate loan receivable is the outstanding unpaid principal balance, net of unamortized acquisition premiums or discounts and unamortized costs and fees directly associated with the origination or acquisition of the loan.
The reserve for loan losses is a valuation allowance that reflects management’s estimate of loan losses inherent in the loan portfolio as of the balance sheet date. The reserve is adjusted through “Provision for loan losses” on the Company’s consolidated statements of operations and is decreased by charge-offs to specific loans when losses are confirmed. The reserve for loan losses includes a portfolio-based component and an asset-specific component.
F-13
KBS REAL ESTATE INVESTMENT TRUST, INC.
NOTES TO CONSOLIDATED FINANCIAL STATEMENTS (CONTINUED)
December 31, 2016
An asset-specific reserve relates to reserves for losses on loans considered impaired. The Company considers a loan to be impaired when, based upon current information and events, it believes that it is probable that the Company will be unable to collect all amounts due under the contractual terms of the loan agreement. The Company also considers a loan to be impaired if it grants the borrower a concession through a modification of the loan terms or if it expects to receive assets (including equity interests in the borrower) with fair values that are less than the carrying value of the loan in satisfaction of the loan. A reserve is established when the present value of payments expected to be received, observable market prices, the estimated fair value of the collateral (for loans that are dependent on the collateral for repayment) or amounts expected to be received in satisfaction of a loan are lower than the carrying value of that loan.
A portfolio-based reserve covers the pool of loans that do not have asset-specific reserves. A provision for loan losses is recorded when available information as of each balance sheet date indicates that it is probable that a loss occurred in the pool of loans and the amount of the loss can be reasonably estimated, but the Company does not know which specific loans within the pool will ultimately result in losses. Required reserve balances for this pool of loans are derived from estimated probabilities of default and estimated loss severities assuming a default occurs. On a quarterly basis, the Company’s management assigns estimated probabilities of default and loss severities to each loan in the portfolio based on factors such as the debt service coverage of the underlying collateral, the estimated fair value of the collateral, the significance of the borrower’s investment in the collateral, the financial condition of the borrower and/or its sponsors, the likelihood that the borrower and/or its sponsors would allow the loan to default, the Company’s willingness and ability to step in as owner in the event of default, and other pertinent factors.
Failure to recognize impairments would result in the overstatement of earnings and the carrying value of the Company’s real estate loans receivable. Actual losses, if any, could differ significantly from estimated amounts.
Participation Interest in an Unconsolidated Joint Venture
The Company holds a participation interest with respect to a real estate joint venture. The carrying value of this participation interest as of December 31, 2016 and 2015 was $0 and the Company did not record any income or losses with respect to this participation interest during the years ended December 31, 2016, 2015 and 2014.
Cash and Cash Equivalents
The Company considers all short-term (with an original maturity of three months or less), highly-liquid investments utilized as part of the Company’s cash-management activities to be cash equivalents. Cash equivalents may include cash and short-term investments. Short-term investments are stated at cost, which approximates fair value.
The Company’s cash and cash equivalents balance exceeded federally insurable limits as of December 31, 2016. The Company monitors the cash balances in its operating accounts and adjusts the cash balances as appropriate; however, these cash balances could be impacted if the underlying financial institutions fail or are subject to other adverse conditions in the financial markets. To date, the Company has experienced no loss or lack of access to cash in its operating accounts.
Restricted Cash
Restricted cash is comprised of lender impound reserve accounts on the Company’s borrowings for security deposits, property taxes, insurance, rent from master lease, letters of credit, debt service obligations and capital improvements and replacements.
Rents and Other Receivables
The Company periodically evaluates the collectibility of amounts due from tenants and maintains an allowance for doubtful accounts for estimated losses resulting from the inability of tenants to make required payments under lease agreements. In addition, the Company maintains an allowance for deferred rent receivable that arises from the straight-lining of rents. The Company exercises judgment in establishing these allowances and considers payment history and current credit status of its tenants in developing these estimates.
F-14
KBS REAL ESTATE INVESTMENT TRUST, INC.
NOTES TO CONSOLIDATED FINANCIAL STATEMENTS (CONTINUED)
December 31, 2016
Deferred Financing Costs
Deferred financing costs represent commitment fees, loan fees, legal fees and other third-party costs associated with obtaining financing and are presented on the balance sheet as a direct deduction from the carrying value of the associated debt liabilities. These costs are amortized over the terms of the respective financing agreements using the interest method. Unamortized deferred financing costs are generally expensed when the associated debt is refinanced or repaid before maturity unless specific rules are met that would allow for the carryover of such costs to the refinanced debt. Deferred financing costs incurred before an associated debt liability is recognized are included in prepaid and other assets on the balance sheet. Costs incurred in seeking financing transactions that do not close are expensed in the period in which it is determined that the financing will not close.
Fair Value Measurements
Under GAAP, the Company is required to measure certain financial instruments at fair value on a recurring basis. In addition, the Company is required to measure other non-financial and financial assets at fair value on a non-recurring basis (e.g., carrying value of impaired real estate loans receivable and long-lived assets). Fair value is defined as the price that would be received upon the sale of an asset or paid to transfer a liability in an orderly transaction between market participants at the measurement date. The GAAP fair value framework uses a three-tiered approach. Fair value measurements are classified and disclosed in one of the following three categories:
• | Level 1: unadjusted quoted prices in active markets that are accessible at the measurement date for identical assets or liabilities; |
• | Level 2: quoted prices for similar instruments in active markets, quoted prices for identical or similar instruments in markets that are not active, and model-derived valuations in which significant inputs and significant value drivers are observable in active markets; and |
• | Level 3: prices or valuation techniques where little or no market data is available that requires inputs that are both significant to the fair value measurement and unobservable. |
When available, the Company utilizes quoted market prices from independent third-party sources to determine fair value and classifies such items in Level 1 or Level 2. In instances where the market for a financial instrument is not active, regardless of the availability of a nonbinding quoted market price, observable inputs might not be relevant and could require the Company to make a significant adjustment to derive a fair value measurement. Additionally, in an inactive market, a market price quoted from an independent third party may rely more on models with inputs based on information available only to that independent third party. When the Company determines the market for a financial instrument owned by the Company to be illiquid or when market transactions for similar instruments do not appear orderly, the Company uses several valuation sources (including internal valuations, discounted cash flow analysis and quoted market prices) and establishes a fair value by assigning weights to the various valuation sources. Additionally, when determining the fair value of a liability in circumstances in which a quoted price in an active market for an identical liability is not available, the Company measures fair value using (i) a valuation technique that uses the quoted price of the identical liability when traded as an asset or quoted prices for similar liabilities when traded as assets or (ii) another valuation technique that is consistent with the principles of fair value measurement, such as the income approach or the market approach.
Changes in assumptions or estimation methodologies can have a material effect on these estimated fair values. In this regard, the derived fair value estimates cannot be substantiated by comparison to independent markets and, in many cases, may not be realized in an immediate settlement of the instrument.
F-15
KBS REAL ESTATE INVESTMENT TRUST, INC.
NOTES TO CONSOLIDATED FINANCIAL STATEMENTS (CONTINUED)
December 31, 2016
The Company considers the following factors to be indicators of an inactive market: (i) there are few recent transactions, (ii) price quotations are not based on current information, (iii) price quotations vary substantially either over time or among market makers (for example, some brokered markets), (iv) indexes that previously were highly correlated with the fair values of the asset or liability are demonstrably uncorrelated with recent indications of fair value for that asset or liability, (v) there is a significant increase in implied liquidity risk premiums, yields, or performance indicators (such as delinquency rates or loss severities) for observed transactions or quoted prices when compared with the Company’s estimate of expected cash flows, considering all available market data about credit and other nonperformance risk for the asset or liability, (vi) there is a wide bid-ask spread or significant increase in the bid-ask spread, (vii) there is a significant decline or absence of a market for new issuances (that is, a primary market) for the asset or liability or similar assets or liabilities, and (viii) little information is released publicly (for example, a principal-to-principal market).
The Company considers the following factors to be indicators of non-orderly transactions: (i) there was not adequate exposure to the market for a period before the measurement date to allow for marketing activities that are usual and customary for transactions involving such assets or liabilities under current market conditions, (ii) there was a usual and customary marketing period, but the seller marketed the asset or liability to a single market participant, (iii) the seller is in or near bankruptcy or receivership (that is, distressed), or the seller was required to sell to meet regulatory or legal requirements (that is, forced), and (iv) the transaction price is an outlier when compared with other recent transactions for the same or similar assets or liabilities.
Share Redemption Program
The Company has a share redemption program pursuant to which stockholders may sell their shares to the Company only in connection with a stockholder’s death, “qualifying disability” or “determination of incompetence” (each as defined in the share redemption program and together with redemptions sought in connection with a stockholder’s death, “Special Redemptions”). Such redemptions are subject to an annual dollar limitation and are further subject to the other limitations described in the share redemption program, including:
• | During each calendar year, Special Redemptions are limited to an annual amount determined by the board of directors. The annual dollar limitation for the Company’s share redemption program may be reviewed and adjusted from time to time during the year. The dollar limitation for calendar year 2016 was $10.0 million in the aggregate. On January 27, 2017, the Company’s board of directors approved an annual dollar limitation of $10.0 million in the aggregate for the calendar year 2017 (subject to review and adjustment during the year by the board of directors), and further subject to the limitations described in the share redemption program. |
• | During any calendar year, the Company may redeem no more than 5% of the weighted-average number of shares outstanding during the prior calendar year. |
• | The Company has no obligation to redeem shares if the redemption would violate the restrictions on distributions under Maryland law, which prohibits distributions that would cause a corporation to fail to meet statutory tests of solvency. |
The Company currently does not expect to have funds available for ordinary redemptions in the future.
If the Company cannot repurchase all shares presented for redemption in any month because of the limitations on redemptions set forth in the share redemption program, then the Company will honor redemption requests on a pro rata basis, except that if a pro rata redemption would result in a stockholder owning less than the minimum purchase requirement described in the Company’s most recently effective registration statement, as such registration statement has been amended or supplemented, then the Company would redeem all of such stockholder’s shares.
In connection with the approval by its stockholders of the Plan of Liquidation, on January 27, 2017, the Company’s board of directors approved the amendment and restatement of the Company’s share redemption program (the “Amended Share Redemption Program”). The Amended Share Redemption Program became effective on February 27, 2017.
Prior to effectiveness of the Amended Share Redemption Program on February 27, 2017, the redemption price for all stockholders whose shares were eligible for redemption was equal to the most recent estimated value per share of the Company’s common stock as of the redemption date.
F-16
KBS REAL ESTATE INVESTMENT TRUST, INC.
NOTES TO CONSOLIDATED FINANCIAL STATEMENTS (CONTINUED)
December 31, 2016
On December 8, 2015, the Company’s board of directors approved an estimated value per share of the Company’s common stock of $3.94 (unaudited), based on the estimated value of the Company’s assets less the estimated value of the Company’s liabilities, divided by the number of shares outstanding, all as of September 30, 2015, with the exception of an adjustment to the Company’s net asset value to give effect to the December 7, 2015 payment of a special distribution of $0.25 per share on the outstanding shares of the Company’s common stock to the stockholders of record as of the close of business on December 1, 2015. For a full description of the methodologies and assumptions used to value the Company’s assets and liabilities in connection with the calculation of the December 2015 estimated value per share, see the Company’s Annual Report on Form 10-K for the year ended December 31, 2015 at Part II, Item 5, “Market for Registrant’s Common Equity, Related Stockholder Matters and Issuer Purchases of Equity Securities — Market Information.” Effective for redemption dates from December 2015 through September 2016, the redemption price for all stockholders whose shares were eligible for redemption was $3.94 per share.
On October 5, 2016, the Company’s board of directors approved an estimated value per share of the Company’s common stock of $3.65 per share (unaudited), based on the estimated value of the Company’s assets less the estimated value of the Company’s liabilities, divided by the number of shares outstanding, all as of June 30, 2016, except for certain items discussed herein in Part II, Item 5, “Market for Registrant’s Common Equity, Related Stockholder Matters and Issuer Purchases of Equity Securities - Market Information,” for which estimated values were adjusted subsequent to June 30, 2016. The redemption price for all shares eligible for redemption was $3.65 per share for redemption dates from October 2016 through December 2016. For a full description of the methodologies and assumptions used to value the Company’s assets and liabilities in connection with the calculation of the October 2016 estimated value per share, see Part II, Item 5, “Market for Registrant’s Common Equity, Related Stockholder Matters and Issuer Purchases of Equity Securities — Market Information.”
The Amended Share Redemption Program changes the redemption price per share of the Company’s common stock eligible for redemption to take into account the estimated range of liquidating distributions as disclosed in the Company’s Definitive Proxy Statement, filed with the SEC on November 10, 2016, and any liquidating distributions declared by the Company’s board of directors. The Amended Share Redemption Program sets the redemption price per share of the Company’s common stock eligible for redemption at (a) $3.475 (which represents the mid-point of the estimated range of liquidating distributions of $3.27 to $3.68 per share) less (b) the amount of any liquidating distributions on such share declared by the Company’s board of directors that have a record date prior to the redemption date for such share. Therefore, the redemption price for all shares eligible for redemption on the February 28, 2017 redemption date was equal to $3.475. Pursuant to the Plan of Liquidation, on March 10, 2017, the Company’s board of directors authorized an initial liquidating distribution in the amount of $1.00 per share of common stock to the Company’s stockholders of record as of the close of business on March 21, 2017. The initial liquidating distribution was paid on March 24, 2017 and was funded from proceeds from asset sales. Therefore, effective commencing with the March 31, 2017 redemption date, the redemption price for all shares eligible for redemption will be equal to $2.475.
Prior to effectiveness of the Amended Share Redemption Program, the Company’s board of directors could amend, suspend or terminate the share redemption program upon 30 days’ notice to its stockholders. The Amended Share Redemption Program changed the notice period for amending, suspending or terminating the program. The Amended Share Redemption Program provides that the Company may amend, suspend or terminate the program for any reason upon 10 (ten) days’ notice to the Company’s stockholders. The Company may provide this notice by including such information in a Current Report on Form 8-K or in the Company’s annual or quarterly reports, all publicly filed with the SEC, or by a separate mailing to its stockholders.
The Company records amounts that are redeemable under the share redemption program as redeemable common stock in the accompanying consolidated balance sheets because the shares are mandatorily redeemable at the option of the holder pursuant to a Special Redemption and therefore their redemption is outside the control of the Company. Pursuant to the share redemption program, beginning in 2012, the maximum amount redeemable under the Company’s share redemption program is limited to an annual dollar amount determined by the Company’s board of directors, as described above. However, because the amounts that can be redeemed in future periods are determinable and only contingent on an event that is likely to occur (e.g., the passage of time), the Company presents the amounts available for redemptions in future periods as redeemable common stock in the accompanying balance sheets.
F-17
KBS REAL ESTATE INVESTMENT TRUST, INC.
NOTES TO CONSOLIDATED FINANCIAL STATEMENTS (CONTINUED)
December 31, 2016
The Company classifies financial instruments that represent a mandatory obligation of the Company to redeem shares as liabilities. The Company’s redeemable common shares are contingently redeemable at the option of the holder pursuant to a Special Redemption. When shares are tendered for redemption and the Company determines that it has a mandatory obligation to redeem shares under the share redemption program, it will reclassify such obligations from temporary equity to a liability based upon their respective settlement values.
The Company limits the dollar value of shares that may be redeemed under the share redemption program as described above. During the year ended December 31, 2016, the Company redeemed $5.6 million of common stock. The only redemptions the Company made under the share redemption program in 2016 were those that qualified as, and met the requirements for, Special Redemptions. In 2016, the Company fulfilled all redemption requests that qualified as Special Redemptions under the Company’s share redemption program.
Related Party Transactions
The Company has entered into the Advisory Agreement. This agreement entitles the Advisor to specified fees upon the provision of certain services with regard the management of the Company’s investments, among other services, and the disposition of investments, as well as reimbursement of certain costs incurred by the Advisor in providing services to the Company. In addition, the Advisor is entitled to certain other fees, including an incentive fee upon achieving certain performance goals, as detailed in the Advisory Agreement. The Company has entered into a fee reimbursement agreement (the “AIP Reimbursement Agreement”) with the Dealer Manager pursuant to which the Company agreed to reimburse the Dealer Manager for certain fees and expenses it incurs for administering the Company’s participation in the DTCC Alternative Investment Product Platform (“AIP Platform”) with respect to certain accounts of the Company’s investors serviced through the platform. The Advisor also serves, and Dealer Manager also serves or served, as the advisor and dealer manager, respectively, for KBS Real Estate Investment Trust II, Inc., KBS Real Estate Investment Trust III, Inc., KBS Strategic Opportunity REIT, Inc., KBS Legacy Partners Apartment REIT, Inc., KBS Strategic Opportunity REIT II, Inc. and KBS Growth & Income REIT, Inc.
The Company records all related party fees as incurred, subject to any limitations described in the Advisory Agreement. The Company has granted no stock-based compensation awards to the Advisor or its affiliates and it did not incur any subordinated participation in net cash flows or subordinated incentive listing fees during the year ended December 31, 2016 or any previous periods.
Operating Expenses
Under the Advisory Agreement, the Advisor has the right to seek reimbursement from the Company for all costs and expenses it incurs in connection with the provision of services to the Company, including the Company’s allocable share of the Advisor’s overhead, such as rent, employee costs, utilities, accounting software and cybersecurity costs. Commencing July 1, 2010, the Company has reimbursed the Advisor for the Company’s allocable portion of the salaries, benefits and overhead of internal audit department personnel providing services to the Company. In the future, the Advisor may seek reimbursement for additional employee costs. The Company will not reimburse the Advisor for employee costs in connection with services for which the Advisor earns acquisition, origination or disposition fees (other than reimbursement of travel and communication expenses) or for the salaries and benefits the Advisor or its affiliates may pay to the Company’s executive officers.
Asset Management Fee
With respect to investments in real estate, the Company pays the Advisor a monthly asset management fee equal to one-twelfth of 0.75% of the amount actually paid or allocated to acquire the investment, plus the cost of any subsequent development, construction or improvements to the property. This amount includes any portion of the investment that was debt financed and is inclusive of acquisition fees and expenses related thereto. In the case of investments made through joint ventures, the asset management fee will be determined based on the Company’s proportionate share of the underlying investment.
F-18
KBS REAL ESTATE INVESTMENT TRUST, INC.
NOTES TO CONSOLIDATED FINANCIAL STATEMENTS (CONTINUED)
December 31, 2016
With respect to investments in loans and any investments other than real estate, the Company pays the Advisor a monthly fee calculated, each month, as one-twelfth of 0.75% of the lesser of (i) the amount paid or allocated to acquire or fund the loan or other investment (which amount includes any portion of the investment that was debt financed and is inclusive of acquisition or origination fees and expenses related thereto) and (ii) the outstanding principal amount of such loan or other investment, plus the acquisition or origination fees and expenses related to the acquisition or funding of such investment, as of the time of calculation.
With respect to an investment that has suffered an impairment in value, reduction in cash flow or other negative circumstances, such investment may either be excluded from the calculation of the asset management fee described above or included in such calculation at a reduced value that is recommended by the Advisor and the Company’s management and then approved by a majority of the Company’s independent directors, and this change in the fee shall be applicable to an investment upon the earlier to occur of the date on which (i) such investment is sold, (ii) such investment is surrendered to a person other than the Company, the Company’s direct or indirect wholly owned subsidiary or a joint venture or partnership in which the Company has an interest, (iii) the Advisor determines that it will no longer pursue collection or other remedies related to such investment, or (iv) the Advisor recommends a revised fee arrangement with respect to such investment. As of December 31, 2016, the Company excluded its interest in an unconsolidated joint venture from the calculation of asset management fees. Through March 31, 2016, the Company calculated the asset management fee for the GKK Properties based on the original cost of its investment in the GKK Mezzanine Loan, rather than on the gross value of the GKK Properties the Company owns or in which the Company holds a leasehold interest. Beginning in April 2016, the gross value of the GKK Properties fell below the original cost of the Company’s investment in the GKK Mezzanine Loan and for the period from April 1, 2016 through December 31, 2016, the Company calculated the asset management fee for these properties based on the gross value of the GKK Properties. As of December 31, 2016, the Company had not determined to calculate the asset management fee at an adjusted value for any other investments or to exclude any other investments from the calculation of the asset management fee.
Disposition Fees
In accordance with the Advisory Agreement, for substantial assistance in connection with the sale of properties, loans or other investments as determined by the conflicts committee of the Company’s board of directors, the Company pays the Advisor or its affiliates a disposition fee of 1% of the contract sales price of the properties, loans or other investments sold. However, in no event may the total commissions (including such disposition fees) paid to the Advisor, its affiliates and unaffiliated third parties exceed 6% of the contract sales price of the property, loan or other investment sold or exceed a competitive real estate commission.
Prior to August 9, 2016, notwithstanding the foregoing, in January 2015, the disposition fee related to the sales of GKK Properties was modified to provide that the conflicts committee would determine in its sole discretion the amount of the disposition fee related to the sale of GKK Properties upon the terms set forth below, which disposition fee may be an amount not to exceed 1% of the contract sales price, which maximum amount is consistent with the fixed percentage applicable to the sales of other properties, loans and other investments.
F-19
KBS REAL ESTATE INVESTMENT TRUST, INC.
NOTES TO CONSOLIDATED FINANCIAL STATEMENTS (CONTINUED)
December 31, 2016
With respect to sales of the GKK Properties, and provided that the conflicts committee determined that the Advisor had provided a substantial amount of services in connection with the sale of each GKK Property for which the payment of a disposition fee was requested by the Advisor, then:
(a) | With respect to portfolio or single asset sales of GKK Properties designated by the conflicts committee in its sole discretion at or about the time of the sale, the Company would pay the Advisor a fee in an amount not to exceed 1% of the contract sales price and subject to other limitations and conditions set forth in the Advisory Agreement, as determined by the conflicts committee in its sole discretion, which fee would be payable upon the respective closing; and |
(b) | With respect to sales of all other GKK Properties for which a disposition fee had not yet been paid, if, upon the sale of the final GKK Property, the conflicts committee determined in its sole discretion that the Company had recovered its entire investment related to the GKK Mezzanine Loan and the GKK Properties subsequent to the Settlement Agreement, after taking into consideration the net cash flow received by the Company from the investment, whether in the form of (i) net proceeds from the sales or other dispositions or transfers of the GKK Properties, (ii) the net cash flow related to the GKK Mezzanine Loan, (iii) the net cash flow related to the GKK Properties subsequent to the Settlement Agreement and/or (iv) other proceeds related to the assets and liabilities received under the Settlement Agreement, then the Company would pay the Advisor a fee in an amount not to exceed 1% of the contract sales price and subject to other conditions set forth in the Advisory Agreement, as determined by the conflicts committee in its sole discretion, which fee would be payable promptly upon such determination by the conflicts committee. |
On August 9, 2016, the Company and the Advisor entered into an amendment (“Amendment No. 1”) to the Advisory Agreement to amend certain terms related to the disposition fee payable to the Advisor by the Company. Pursuant to Amendment No. 1, with respect to sales of GKK Properties for which a disposition fee had not yet been paid as of August 9, 2016, based on the proceeds received from the entire investment related to the GKK Mezzanine Loan and the GKK Properties through August 9, 2016 and expected proceeds from future sales, the conflicts committee determined that the Advisor had provided a substantial amount of services in connection with the sale of each of the 160 GKK Properties named therein and approved the payment to the Advisor of a disposition fee equal to 1.0% of the aggregate contract sales prices of such GKK Properties, of which the aggregate disposition fee was $2.0 million. The aggregate contract sales price of such 160 GKK Properties was $214.1 million. The $2.0 million disposition fee was paid in August 2016 and was included in the gain on sales of real estate, net in the accompanying consolidated statements of operations for the year ended December 31, 2016.
Also pursuant to Amendment No. 1, for substantial assistance in connection with the sale of all GKK Properties that had not been sold as of August 9, 2016 (as determined by the conflicts committee of the Company’s board of directors), the Company will pay the Advisor or its affiliates a disposition fee of 1.0% of the contract sales price of such GKK Properties sold. However, in no event may the total commissions (including such disposition fees) paid to the Advisor, its affiliates and unaffiliated third parties exceed 6% of the contract sales price of the property or other investment sold or exceed a competitive real estate commission.
The terms of Amendment No. 1 were included in the Advisory Agreement renewed on November 8, 2016.
Income Taxes
The Company has elected to be taxed as a REIT under the Internal Revenue Code of 1986, as amended (the “Internal Revenue Code”). To continue to qualify as a REIT, the Company must meet certain organizational and operational requirements, including a requirement to distribute at least 90% of the Company’s annual REIT taxable income to stockholders (which is computed without regard to the dividends-paid deduction or net capital gain and which does not necessarily equal net income as calculated in accordance with GAAP). As a REIT, the Company generally will not be subject to federal income tax on income that it distributes as dividends to its stockholders. If the Company fails to qualify as a REIT in any taxable year, it will be subject to federal income tax on its taxable income at regular corporate income tax rates and generally will not be permitted to qualify for treatment as a REIT for federal income tax purposes for the four taxable years following the year during which qualification is lost, unless the Internal Revenue Service grants the Company relief under certain statutory provisions. Such an event could materially and adversely affect the Company’s net income and net cash available for distribution to stockholders. However, the Company believes that it is organized and operates in such a manner as to continue to qualify for treatment as a REIT.
F-20
KBS REAL ESTATE INVESTMENT TRUST, INC.
NOTES TO CONSOLIDATED FINANCIAL STATEMENTS (CONTINUED)
December 31, 2016
The Company has concluded that there are no significant uncertain tax positions requiring recognition in its financial statements. Neither the Company nor its subsidiaries have been assessed interest or penalties by any major tax jurisdictions. The Company’s evaluations were performed for all open tax years through December 31, 2016. As of December 31, 2016, returns for the calendar years 2012 through 2015 remain subject to examination by major tax jurisdictions.
Per Share Data
Basic net income (loss) per share of common stock is calculated by dividing net income (loss) by the weighted-average number of shares of common stock issued and outstanding during such period. Diluted net income (loss) per share of common stock equals basic net income (loss) per share of common stock, as there were no potentially dilutive securities outstanding during the years ended December 31, 2016, 2015 and 2014, respectively.
Distributions declared per share of common stock were $0.100 and $0.350 for the years ended December 31, 2016 and 2015, respectively. Distributions per share of common stock were based on a quarterly record date for each quarter during 2015 and 2016. Additionally, the Company’s board of directors declared a special distribution in the amount of $0.25 per share on the outstanding shares of the Company’s common stock on November 30, 2015 to stockholders of record as of the close of business on December 1, 2015.
Distributions declared per share of common stock were $0.050 for the year ended December 31, 2014. On September 30, 2014, the Company’s board of directions declared a distribution in the amount of $0.025 per share of common stock to stockholders of record as of the close of business on September 30, 2014. On December 9, 2014, the Company’s board of directors declared a distribution in the amount of $0.025 per share of common stock to stockholders of record as of the close of business on December 29, 2014.
Segments
The Company’s segments are based on the Company’s method of internal reporting, which classifies its operations by investment type: (i) real estate, (ii) real estate-related and (iii) commercial properties primarily leased to financial institutions received under the Settlement Agreement, the GKK Properties. For financial data by segment, see Note 11, “Segment Information.”
Square Footage, Occupancy and Other Measures
Square footage, occupancy, number of tenants and other measures, or amounts derived from such measures, including annualized base rent and annualized base rent per square foot, used to describe real estate and real estate-related investments included in these Notes to Consolidated Financial Statements are presented on an unaudited basis.
Recently Issued Accounting Standards Update
In May 2014, the FASB issued ASU No. 2014-09, Revenue from Contracts with Customers (Topic 606) (“ASU No. 2014-09”). ASU No. 2014-09 requires an entity to recognize the revenue to depict the transfer of promised goods or services to customers in an amount that reflects the consideration to which the entity expects to be entitled in exchange for those goods and services. ASU No. 2014-09 supersedes the revenue requirements in Revenue Recognition (Topic 605) and most industry-specific guidance throughout the Industry Topics of the Codification. ASU No. 2014-09 does not apply to lease contracts within the scope of Leases (Topic 840). ASU No. 2014-09 was to be effective for fiscal years, and interim periods within those years, beginning after December 15, 2016, and is to be applied retrospectively, with early application not permitted. In August 2015, the FASB issued ASU No. 2015-14, Revenue from Contracts with Customers (Topic 606): Deferral of the Effective Date (“ASU No. 2015-14”), which defers the effective date of ASU No. 2014-09 by one year. As the primary source of revenue for the Company is generated through leasing arrangements, which are scoped out of this standard, the Company does not expect the adoption of ASU No. 2014-09 to have a significant impact on its financial statements.
F-21
KBS REAL ESTATE INVESTMENT TRUST, INC.
NOTES TO CONSOLIDATED FINANCIAL STATEMENTS (CONTINUED)
December 31, 2016
In August 2014, the FASB issued ASU No. 2014-15, Presentation of Financial Statements (Subtopic 205-40), Disclosure of Uncertainties about an Entity’s Ability to Continue as a Going Concern (“ASU No. 2014-15”). The amendments in ASU No. 2014-15 require management to evaluate, for each annual and interim reporting period, whether there are conditions or events, considered in the aggregate, that raise substantial doubt about an entity’s ability to continue as a going concern within one year after the date that the financial statements are issued (or are available to be issued when applicable) and, if so, provide related disclosures. ASU No. 2014-15 is effective for annual periods ending after December 15, 2016, and interim periods within annual periods beginning after December 15, 2016. The adoption of ASU No. 2014-15 did not have a significant impact on the Company’s financial statements, although it could require additional disclosures in future periods if conditions or events exist that raise substantial doubt about the Company’s ability to continue as a going concern.
In January 2016, the FASB issued ASU No. 2016-01, Financial Instruments - Overall (Subtopic 825-10): Recognition and Measurement of Financial Assets and Financial Liabilities (“ASU No. 2016-01”). The amendments in ASU No. 2016-01 address certain aspects of recognition, measurement, presentation and disclosure of financial instruments. ASU No. 2016-01 primarily affects accounting for equity investments and financial liabilities where the fair value option has been elected. ASU No. 2016-01 also requires entities to present financial assets and financial liabilities separately, grouped by measurement category and form of financial asset in the balance sheet or in the accompanying notes to the financial statements. ASU No. 2016-01 is effective for annual periods beginning after December 15, 2017, including interim periods within those fiscal years. Early application is permitted for financial statements that have not been previously issued. The Company does not expect the adoption of ASU No. 2016-01 to have a significant impact on its financial statements.
In February 2016, the FASB issued ASU No. 2016-02, Leases (Topic 842) (“ASU No. 2016-02”). The amendments in ASU No. 2016-02 change the existing accounting standards for lease accounting, including requiring lessees to recognize most leases on their balance sheets and making targeted changes to lessor accounting. ASU No. 2016-02 is effective for annual periods beginning after December 15, 2018, including interim periods within those fiscal years. Early adoption of ASU No. 2016-02 as of its issuance is permitted. The new leases standard requires a modified retrospective transition approach for all leases existing at, or entered into after, the date of initial application, with an option to use certain transition relief. The Company is currently evaluating the impact of adopting the new leases standard on its consolidated financial statements.
In June 2016, the FASB issued ASU No. 2016-13, Financial Instruments - Credit Losses (Topic 326): Measurement of Credit Losses of Financial Instruments (“ASU No. 2016-13”). ASU No. 2016-13 affects entities holding financial assets and net investments in leases that are not accounted for at fair value through net income. The amendments in ASU No. 2016-13 require a financial asset (or a group of financial assets) measured at amortized cost basis to be presented at the net amount expected to be collected. The allowance for credit losses is a valuation account that is deducted from the amortized cost basis of the financial asset(s) to present the net carrying value at the amount expected to be collected on the financial asset. ASU No. 2016-13 also amends the impairment model for available-for-sale securities. An entity will recognize an allowance for credit losses on available-for-sale debt securities as a contra-account to the amortized cost basis rather than as a direct reduction of the amortized cost basis of the investment, as is currently required. ASU No. 2016-13 also requires new disclosures. For financial assets measured at amortized cost, an entity will be required to disclose information about how it developed its allowance for credit losses, including changes in the factors that influenced management’s estimate of expected credit losses and the reasons for those changes. For financing receivables and net investments in leases measured at amortized cost, an entity will be required to further disaggregate the information it currently discloses about the credit quality of these assets by year of the asset’s origination for as many as five annual periods. For available for sale securities, an entity will be required to provide a roll-forward of the allowance for credit losses and an aging analysis for securities that are past due. ASU No. 2016-13 is effective for annual periods beginning after December 15, 2019, including interim periods within those fiscal years. Early adoption is permitted for fiscal years beginning after December 15, 2018, including interim periods within those fiscal years. The Company is still evaluating the impact of adopting ASU No. 2016-13 on its financial statements, but does not expect the adoption of ASU No. 2016-13 to have a material impact on its financial statements.
F-22
KBS REAL ESTATE INVESTMENT TRUST, INC.
NOTES TO CONSOLIDATED FINANCIAL STATEMENTS (CONTINUED)
December 31, 2016
In August 2016, the FASB issued ASU No. 2016-15, Statement of Cash Flows (Topic 230): Classification of Certain Cash Receipts and Cash Payments (“ASU No. 2016-15”). ASU No. 2016-15 is intended to reduce diversity in practice in how certain transactions are classified in the statement of cash flows. The amendments in ASU No. 2016-15 provide guidance on eight specific cash flow issues, including the following that are or may be relevant to the Company: (a) Cash payments for debt prepayment or debt extinguishment costs should be classified as cash outflows for financing activities; (b) Cash payments relating to contingent consideration made soon after an acquisition’s consummation date (i.e., approximately three months or less) should be classified as cash outflows for investing activities. Payments made thereafter should be classified as cash outflows for financing activities up to the amount of the original contingent consideration liability. Payments made in excess of the amount of the original contingent consideration liability should be classified as cash outflows for operating activities; (c) Cash payments received from the settlement of insurance claims should be classified on the basis of the nature of the loss (or each component loss, if an entity receives a lump-sum settlement); (d) In the absence of specific guidance, an entity should classify each separately identifiable cash source and use on the basis of the nature of the underlying cash flows. For cash flows with aspects of more than one class that cannot be separated, the classification should be based on the activity that is likely to be the predominant source or use of cash flow. ASU No. 2016-15 is effective for fiscal years beginning after December 15, 2017, and interim periods within those fiscal years. Early adoption is permitted, including adoption in an interim period. The Company is still evaluating the impact of adopting ASU No. 2016-15 on its financial statements, but does not expect the adoption of ASU No. 2016-15 to have a material impact on its financial statements.
In November 2016, the FASB issued ASU No. 2016-18, Statement of Cash Flows (Topic 230): Restricted Cash (“ASU No. 2016-18”). ASU No. 2016-18 requires that a statement of cash flows explain the change during the period in the total of cash, cash equivalents, restricted cash and restricted cash equivalents. Therefore, amounts generally described as restricted cash should be included with cash and cash equivalents when reconciling the beginning of period and end of period total amounts shown on the statement of cash flows. ASU No. 2016-18 is effective for annual periods beginning after December 15, 2017, including interim periods within those fiscal years. The Company elected to early adopt ASU No. 2016-18 for the reporting period ended December 31, 2016 and it was applied retrospectively. As a result of the adoption of ASU No. 2016-18, the Company no longer presents the changes within restricted cash in the consolidated statements of cash flows.
In January 2017, the FASB issued ASU No. 2017-01, Business Combinations (Topic 805): Clarifying the Definition of a Business (“ASU No. 2017-01”) to add guidance to assist entities with evaluating whether transactions should be accounted for as acquisitions (or disposals) of assets or businesses. ASU No. 2017-01 provides a screen to determine when an integrated set of assets and activities (collectively referred to as a “set”) is not a business. The screen requires that when substantially all of the fair value of the gross assets acquired (or disposed of) is concentrated in a single identifiable asset or a group of similar identifiable assets, the set is not a business. If the screen is not met, ASU No. 2017-01 (1) requires that to be considered a business, a set must include, at a minimum, an input and a substantive process that together significantly contribute to the ability to create output and (2) removes the evaluation of whether a market participant could replace missing elements. ASU No. 2017-01 provides a framework to assist entities in evaluating whether both an input and a substantive process are present. The framework includes two sets of criteria to consider that depend on whether a set has outputs. Although outputs are not required for a set to be a business, outputs generally are a key element of a business; therefore, the FASB has developed more stringent criteria for sets without outputs. ASU No. 2017-01 is effective for annual periods beginning after December 15, 2017, including interim periods within those fiscal years. Early adoption is permitted. The amendments can be applied to transactions occurring before the guidance was issued (January 5, 2017) as long as the applicable financial statements have not been issued. The Company elected to early adopt ASU No. 2017-01 for the reporting period beginning January 1, 2017. As a result of the adoption of ASU No. 2017-01, the Company’s acquisitions of investment properties beginning January 1, 2017 could qualify as an asset acquisition (as opposed to a business combination). Therefore, transaction costs associated with asset acquisitions will be capitalized, while these costs associated with business combinations will continue to be expensed as incurred.
F-23
KBS REAL ESTATE INVESTMENT TRUST, INC.
NOTES TO CONSOLIDATED FINANCIAL STATEMENTS (CONTINUED)
December 31, 2016
3. | REAL ESTATE HELD FOR INVESTMENT |
As of December 31, 2016, the Company’s portfolio of real estate held for investment, including the GKK Properties, was composed of approximately 3.0 million rentable square feet and was 88% occupied. These properties are located in 18 states and include office properties, industrial properties, bank branch properties and a retail property. Included in the Company’s portfolio of real estate held for investment was 0.9 million rentable square feet related to the GKK Properties held for investment, which were 85% occupied as of December 31, 2016.
The following table summarizes the Company’s real estate held for investment as of December 31, 2016 and 2015 (in thousands):
Land | Buildings and Improvements | Tenant Origination and Absorption Costs | Total Real Estate Held for Investment | |||||||||||||
As of December 31, 2016: | ||||||||||||||||
Office | $ | 48,437 | $ | 251,326 | $ | 300 | $ | 300,063 | ||||||||
Industrial | 10,975 | 57,672 | 1,835 | 70,482 | ||||||||||||
Retail (1) | 964 | 1,653 | 350 | 2,967 | ||||||||||||
GKK Properties | 12,609 | 34,290 | 4,140 | 51,039 | ||||||||||||
Real estate held for investment, at cost and net of impairment charges | $ | 72,985 | $ | 344,941 | $ | 6,625 | $ | 424,551 | ||||||||
Accumulated depreciation and amortization | — | (58,120 | ) | (4,812 | ) | (62,932 | ) | |||||||||
Real estate held for investment, net | $ | 72,985 | $ | 286,821 | $ | 1,813 | $ | 361,619 | ||||||||
As of December 31, 2015: | ||||||||||||||||
Office | $ | 49,595 | $ | 245,406 | $ | 525 | $ | 295,526 | ||||||||
Industrial | 10,974 | 56,451 | 1,835 | 69,260 | ||||||||||||
GKK Properties | 15,014 | 47,718 | 6,597 | 69,329 | ||||||||||||
Real estate held for investment, at cost and net of impairment charges | $ | 75,583 | $ | 349,575 | $ | 8,957 | $ | 434,115 | ||||||||
Accumulated depreciation and amortization | — | (50,947 | ) | (6,005 | ) | (56,952 | ) | |||||||||
Real estate held for investment, net | $ | 75,583 | $ | 298,628 | $ | 2,952 | $ | 377,163 | ||||||||
(1) On May 13, 2016, the Company received a deed-in-lieu of foreclosure in satisfaction of all amounts due to it under its investment in the Lawrence Village Plaza Loan Origination and received title to the collateral that secured the loan. See Note 5, “Real Estate Loans Receivable.”
Operating Leases
The Company’s real estate assets are leased to tenants under operating leases for which the terms and expirations vary. As of December 31, 2016, the Company’s leases, including those related to the GKK Properties, related to properties held for investment and excluding options to extend, had remaining terms of up to 13.5 years with a weighted-average remaining term of 3.9 years. As of December 31, 2016, leases related to the GKK Properties held for investment, excluding options to extend, had remaining terms of up to 9.8 years with a weighted-average remaining term of 1.9 years. Some of the Company’s leases have provisions to extend the term of the leases, options for early termination for all or a part of the leased premises after paying a specified penalty, rights of first refusal to purchase the property at competitive market rates, and other terms and conditions as negotiated. The Company retains substantially all of the risks and benefits of ownership of the real estate assets leased to tenants. Generally, upon the execution of a lease, the Company requires a security deposit from the tenant in the form of a cash deposit and/or a letter of credit. The amount required as a security deposit varies depending upon the terms of the respective lease and the creditworthiness of the tenant, but generally is not a significant amount. Therefore, exposure to credit risk exists to the extent that a receivable from a tenant exceeds the amount of its security deposit. Security deposits received in cash related to tenant leases are included in other liabilities in the accompanying consolidated balance sheets and totaled $2.4 million and $3.2 million as of December 31, 2016 and 2015, respectively.
F-24
KBS REAL ESTATE INVESTMENT TRUST, INC.
NOTES TO CONSOLIDATED FINANCIAL STATEMENTS (CONTINUED)
December 31, 2016
During the years ended December 31, 2016, 2015 and 2014, the Company recognized deferred rent from tenants of $1.8 million, $2.5 million and $3.4 million, respectively. These amounts for the years ended December 31, 2016, 2015 and 2014 were net of $1.2 million, $1.4 million and $1.4 million of lease incentive amortization, respectively. As of December 31, 2016 and 2015, the cumulative deferred rent balance was $19.0 million and $16.3 million, respectively, and is included in rents and other receivables on the accompanying balance sheets. The cumulative deferred rent balance included $4.6 million and $4.2 million of unamortized lease incentives as of December 31, 2016 and 2015, respectively. The Company records property operating expense reimbursements due from tenants for common area maintenance, real estate taxes and other recoverable costs in the period the related expenses are incurred.
The future minimum rental income from the Company’s properties held for investment under non-cancelable operating leases, including leases subject to shedding rights and excluding options to extend, as of December 31, 2016 for the years ending December 31 is as follows (in thousands):
2017 | $ | 51,172 | |
2018 | 44,353 | ||
2019 | 41,764 | ||
2020 | 37,399 | ||
2021 | 33,532 | ||
Thereafter | 79,141 | ||
$ | 287,361 | ||
Under certain of the Company’s leases, tenants reimburse the Company for their proportionate share of the costs the Company incurs to manage, operate and maintain the buildings and properties where they rent space. These leases often limit the types and amounts of expenses the Company can pass through to its tenants and allow the tenants to audit and contest the determination of the operating expenses they are required to pay. As of December 31, 2016, the Company had recorded liabilities of approximately $2.0 million as a result of tenant reimbursement audits.
As of December 31, 2016, the Company’s highest tenant industry concentrations (greater than 10% of annualized base rent) were as follows:
Industry | Number of Tenants | Annualized Base Rent (1) (in thousands) | Percentage of Annualized Base Rent | ||||||
Finance | 30 | $ | 13,533 | 24.4 | % | ||||
Legal | 12 | 8,454 | 15.2 | % | |||||
_____________________
(1) Annualized base rent represents annualized contractual base rental income as of December 31, 2016, adjusted to straight-line any contractual tenant concessions (including free rent), rent increases and rent decreases from the lease’s inception through the balance of the lease term.
As of December 31, 2016, no other tenant industries accounted for more than 10% of the Company’s annualized base rent. The Company currently has over 160 tenants over a diverse range of industries and geographical regions. As of December 31, 2016 and 2015, the Company had a bad debt expense reserve of $0.5 million and $0.5 million, respectively. During the years ended December 31, 2016, 2015 and 2014, the Company recorded bad debt expense (recovery) related to its tenant receivables of $0.3 million, $(0.1) million and $0.5 million, respectively.
F-25
KBS REAL ESTATE INVESTMENT TRUST, INC.
NOTES TO CONSOLIDATED FINANCIAL STATEMENTS (CONTINUED)
December 31, 2016
As of December 31, 2016, the Company had a concentration of credit risk related to a lease with the following tenant that represented more than 10% of the Company’s annualized base rent:
Annualized Base Rent Statistics | ||||||||||||||||||||||
Tenant | Property | Tenant Industry | Rentable Square Feet | % of Portfolio Rentable Sq. Ft. Leased(1) | Annualized Base Rent (1) (in thousands) | % of Portfolio Annualized Base Rent | Annualized Base Rent per Square Foot | Lease Expiration | ||||||||||||||
Husch Blackwell | Plaza in Clayton | Legal | 198,218 | 7.4 | % | $ | 6,636 | 12.0 | % | $ | 33.48 | 03/31/2022 | ||||||||||
_____________________
(1) Annualized base rent represents annualized contractual base rental income as of December 31, 2016, adjusted to straight-line any contractual tenant concessions (including free rent), rent increases and rent decreases from the lease’s inception through the balance of the lease term.
No other tenant represented more than 10% of the Company’s annualized base rent.
Geographic Concentration Risk
As of December 31, 2016, the Company’s net investments in real estate in Virginia and Missouri represented 18.6% and 10.5% of the Company’s total assets, respectively. As a result, the geographic concentration of the Company’s portfolio makes it particularly susceptible to adverse economic developments in the Virginia and Missouri real estate markets. Any adverse economic or real estate developments in these markets, such as business layoffs or downsizing, industry slowdowns, relocations of businesses, changing demographics and other factors, or any decrease in demand for office or bank branch space resulting from the local business climate, could adversely affect the Company’s operating results.
Impairment of Real Estate
During the year ended December 31, 2016, the Company recorded non-cash impairment charges of $33.4 million, of which $19.5 million related to 25 properties classified as real estate held for investment (including 22 GKK Properties), to write-down the carrying values of these real estate investments to their estimated fair values and $13.9 million with respect to 43 GKK Properties that were held for sale or sold to write-down the carrying values of these real estate investments to their estimated sales price less estimated costs to sell. See Note 6, “Real Estate Held for Sale and Discontinued Operations,” for information regarding impairments of assets related to real estate held for sale or sold. The facts and circumstances leading to the impairments on the Company’s real estate held for investment are as follows:
City Gate Plaza
The Company recognized an impairment charge during the year ended December 31, 2016 of $3.3 million to reduce the carrying value of the Company’s investment in City Gate Plaza, an office property located in Sacramento, California, to its estimated fair value. The Company revised its cash flow projections to account for higher projected leasing costs to stabilize the property. The continued lack of demand in the Sacramento office rental market also resulted in higher capitalization rates.
University Park Buildings
The Company recognized an impairment charge during the year ended December 31, 2016 of $3.2 million to reduce the carrying value of the Company’s investment in the University Park Buildings, an office property located in Sacramento, California, to its estimated fair value. The Company revised its cash flow projections primarily to account for higher projected capital costs for general building upgrades and to address certain maintenance issues. The continued lack of demand in the Sacramento office rental market also resulted in higher capitalization rates.
Lawrence Village Plaza
The Company recognized an impairment charge during the year ended December 31, 2016 of $2.0 million to reduce the carrying value of Lawrence Village Plaza, a retail property located in New Castle, Pennsylvania, to its estimated fair value. The Company revised its cash flow projections due to perceived credit concerns for the property's anchor tenant, an increase in projected vacancy related to the termination of multiple tenant leases and the continued lack of demand for retail space in the submarket, thus decreasing the projected cash flows.
F-26
KBS REAL ESTATE INVESTMENT TRUST, INC.
NOTES TO CONSOLIDATED FINANCIAL STATEMENTS (CONTINUED)
December 31, 2016
GKK Properties
Citizens Bank Portfolio
The Company recognized an impairment charge during the year ended December 31, 2016 of $10.6 million relating to 19 properties in the Citizens Bank Portfolio due to a decrease in cash flow projections primarily due to an increase in projected vacancy, thus decreasing the projected cash flows the properties would generate.
Pitney Bowes - Bank of America Portfolio
The Company recognized an impairment charge during the year ended December 31, 2016 of $0.4 million relating to three properties in the Pitney Bowes - Bank of America Portfolio due to a decrease in cash flow projections primarily due to an increase in projected vacancy, thus decreasing the projected cash flows the properties would generate.
Prior Period Impairments
During the year ended December 31, 2015, the Company recorded non-cash impairment charges of $49.3 million. The impairment charges for the year ended December 31, 2015 included $48.4 million of impairments with respect to ten properties classified as real estate held for investment (including six GKK Properties) to write-down the carrying values of these real estate investments to their estimated fair values. See Note 6, “Real Estate Held for Sale and Discontinued Operations,” for information regarding impairments of assets related to real estate held for sale. The facts and circumstances leading to the impairments on the Company’s real estate held for investment are as follows:
Woodfield Preserve Office Center
The Company recognized an impairment charge during the year ended December 31, 2015 of $24.8 million to reduce the carrying value of the Company’s investment in Woodfield Preserve Office Center, an office property located in Schaumburg, Illinois, due to a decrease in projected cash flow projections. The decrease in cash flow projections was primarily due to (i) an increase in projected vacancy related to a tenant occupying 51,616 rentable square feet, or approximately 8% of the Woodfield Preserve Office Center and (ii) the challenging Schaumburg office rental market. The tenant’s lease was to expire in November 2016 and it was no longer expected to renew since it was recently acquired and can relocate to excess space leased by the acquiring company. As a result, the Company revised its cash flow projections for longer lease up periods and additional tenant improvement costs and leasing concessions required to attract new tenants. Chicago’s northwest suburb office rental market was heavily affected by the 2008-2009 recession; however, the outlook was optimistic that the market would recover to levels seen prior to the recession. Although the general market has seen positive net absorption, rental rates have remained low while lease concessions remain high resulting in lower projected revenue growth and cash flow projections. The market conditions in Schaumburg, Illinois have also resulted in a lack of interest from investors. The Company sold the Woodfield Preserve Office Center in 2016.
Tysons Dulles Plaza
The Company recognized an impairment charge during the year ended December 31, 2015 of $15.7 million to reduce the carrying value of Tysons Dulles Plaza, an office property located in McLean, Virginia, to its estimated fair value. The Company revised its cash flow projections primarily for longer estimated lease up periods as a result of the continued lack of demand in the McLean office rental market. While the market has seen slight increases in rental rates, lease concessions have not declined as previously expected. The Company also revised its cash flow projections to account for higher projected capital costs for tenant improvements, general building upgrades, and deferred maintenance costs needed to position the property competitively with other properties in the area, to address certain maintenance issues and to attract additional tenants. The lack of sales activity in McLean, Virginia has also resulted in higher capitalization rates.
University Park Buildings
The Company recognized an impairment charge during the year ended December 31, 2015 of $3.4 million related to the Company’s investment in the University Park Buildings, an office property located in Sacramento, California, due to a decrease in cash flow projections primarily due to an increase in projected vacancy related to a tenant occupying 36,377 rental square feet, or approximately 28% of the University Park Buildings. The tenant’s lease expires in June 2017 and it is no longer expected to renew. As a result, the Company revised its cash flow projections for longer lease up periods and additional tenant improvement costs and leasing concessions required to attract new tenants.
F-27
KBS REAL ESTATE INVESTMENT TRUST, INC.
NOTES TO CONSOLIDATED FINANCIAL STATEMENTS (CONTINUED)
December 31, 2016
69 State Street
The Company recognized an impairment charge during the year ended December 31, 2015 of $2.0 million to reduce the carrying value of 69 State Street, an office property located in Albany, New York, to its estimated fair value based on its selling price at auction subsequent to December 31, 2015.
Las Vegas Ops Center
The Company recognized an impairment charge during the year ended December 31, 2015 of $2.0 million to reduce the carrying value of Las Vegas Ops Center, an operations center located in Las Vegas, Nevada, to its estimated fair value based on its selling price at auction subsequent to December 31, 2015.
Other Properties
The Company recognized impairment charges during the year ended December 31, 2015 of $0.5 million related to five other properties held for investment, including four GKK Properties. No impairment charge related to any individual property was greater than $250,000. These impairments generally resulted from changes in the projected hold periods or changes in leasing projections including longer estimated lease-up periods and lower projected rental rates, thus decreasing the projected cash flows the properties would generate.
4. | TENANT ORIGINATION AND ABSORPTION COSTS, ABOVE-MARKET LEASE ASSETS AND BELOW-MARKET LEASE LIABILITIES |
As of December 31, 2016 and 2015, the Company’s tenant origination and absorption costs, above-market lease assets, and below-market lease liabilities (excluding fully amortized assets and liabilities and accumulated amortization) were as follows (in thousands):
Tenant Origination and Absorption Costs | Above-Market Lease Assets | Below-Market Lease Liabilities | |||||||||||||||||||||
December 31, 2016 | December 31, 2015 | December 31, 2016 | December 31, 2015 | December 31, 2016 | December 31, 2015 | ||||||||||||||||||
Cost, net of impairments | $ | 6,625 | $ | 8,957 | $ | 2,500 | $ | 3,223 | $ | (28,183 | ) | $ | (28,464 | ) | |||||||||
Accumulated amortization | (4,812 | ) | (6,005 | ) | (2,045 | ) | (2,332 | ) | 24,246 | 20,122 | |||||||||||||
Net amount | $ | 1,813 | $ | 2,952 | $ | 455 | $ | 891 | $ | (3,937 | ) | $ | (8,342 | ) | |||||||||
Increases (decreases) in net income as a result of amortization of the Company’s tenant origination and absorption costs, above-market lease assets and below-market lease liabilities for the years ended December 31, 2016, 2015 and 2014 were as follows (in thousands):
Tenant Origination and Absorption Costs | Above-Market Lease Assets | Below-Market Lease Liabilities | |||||||||||||||||||||||||||||||||
For the Years Ended December 31, | For the Years Ended December 31, | For the Years Ended December 31, | |||||||||||||||||||||||||||||||||
2016 | 2015 | 2014 | 2016 | 2015 | 2014 | 2016 | 2015 | 2014 | |||||||||||||||||||||||||||
Amortization | $ | (4,420 | ) | $ | (11,902 | ) | $ | (16,345 | ) | $ | (1,850 | ) | $ | (3,840 | ) | $ | (3,790 | ) | $ | 7,195 | $ | 11,032 | $ | 12,531 | |||||||||||
F-28
KBS REAL ESTATE INVESTMENT TRUST, INC.
NOTES TO CONSOLIDATED FINANCIAL STATEMENTS (CONTINUED)
December 31, 2016
The remaining unamortized balance for these outstanding intangible assets and liabilities as of December 31, 2016 is expected to be amortized for the years ending December 31 as follows (in thousands):
Tenant Origination and Absorption Costs | Above-Market Lease Assets | Below-Market Lease Liabilities | |||||||||
2017 | $ | (941 | ) | $ | (345 | ) | $ | 3,369 | |||
2018 | (538 | ) | (102 | ) | 382 | ||||||
2019 | (232 | ) | (8 | ) | 181 | ||||||
2020 | (50 | ) | — | 5 | |||||||
2021 | (18 | ) | — | — | |||||||
Thereafter | (34 | ) | — | — | |||||||
$ | (1,813 | ) | $ | (455 | ) | $ | 3,937 | ||||
Weighted-Average Remaining Amortization Period | 2.5 years | 1.4 years | 1.2 years | ||||||||
5. | REAL ESTATE LOANS RECEIVABLE |
As of December 31, 2016 and 2015, the Company, through indirect wholly owned subsidiaries, had invested in or originated real estate loans receivable as follows (dollars in thousands):
Loan Name Location of Related Property or Collateral | Date Acquired/ Originated | Property Type | Loan Type | Outstanding Principal Balance as of December 31, 2016 (1) | Book Value as of December 31, 2016 (2) | Book Value as of December 31, 2015 (2) | Contractual Interest Rate (3) | Annualized Effective Interest Rate (3) | Maturity Date | ||||||||||||||||
Sandmar Mezzanine Loan Southeast U.S. (4) | 01/09/2007 | Retail | Mezzanine | $ | 5,074 | $ | 5,096 | $ | 5,096 | 5.4% | — | % | 01/01/2017 | ||||||||||||
Lawrence Village Plaza Loan Origination New Castle, Pennsylvania (5) | 08/06/2007 | Retail | Mortgage | — | — | 6,903 | (5) | (5) | (5) | ||||||||||||||||
San Diego Office Portfolio B-Note San Diego, California (6) | 10/26/2007 | Office | B-Note | 20,000 | 19,205 | 18,277 | 5.8% | 11.2 | % | 10/11/2017 | |||||||||||||||
4929 Wilshire B-Note Los Angeles, California | 11/19/2007 | Office | B-Note | 3,779 | 3,659 | 3,503 | 6.1% | 12.4 | % | 07/11/2017 | |||||||||||||||
$ | 28,853 | $ | 27,960 | $ | 33,779 | ||||||||||||||||||||
Reserve for Loan Losses (7) | — | (5,096 | ) | (6,498 | ) | ||||||||||||||||||||
$ | 28,853 | $ | 22,864 | $ | 27,281 | ||||||||||||||||||||
(1) Outstanding principal balance as of December 31, 2016 represents original principal balance outstanding under the loan, increased for any subsequent fundings and reduced for any principal paydowns.
(2) Book value represents outstanding principal balance, adjusted for unamortized acquisition discounts, origination fees and direct origination and acquisition costs. Loan balances are presented gross of any asset-specific reserves.
(3) Contractual interest rate is the stated interest rate on the face of the loan. Annualized effective interest rate is calculated as the actual interest income recognized in 2016, using the interest method, annualized and divided by the average amortized cost basis of the investment during 2016. The contractual interest rates and annualized effective interest rates presented are as of December 31, 2016.
(4) The Company had recorded an asset-specific loan loss reserve against this investment as of December 31, 2016. See “—Reserve for Loan Losses.” Subsequent to December 31, 2016, the borrower defaulted on the Sandmar Mezzanine Loan.
(5) On September 1, 2015, the Lawrence Village Plaza Loan Origination matured without repayment. On May 13, 2016, the Company received a deed-in-lieu of foreclosure in satisfaction of all amounts due to it under its investment in the Lawrence Village Plaza Loan Origination and received title to the collateral that secured the loan.
(6) The borrower under this note is a wholly owned subsidiary of The Irvine Company. Donald Bren, who is the brother of Peter Bren (one of the Company’s executive officers and sponsors), is the chairman of The Irvine Company. In addition, Charles J. Schreiber, Jr. (the Company’s Chief Executive Officer, one of the Company’s directors and one of the Company’s sponsors) has served as a member of the board of directors and executive committee of The Irvine Company since August 2016, and since December 2016, Mr. Schreiber has served on the Board of Trustees of The Irvine Company. During the year ended December 31, 2016, the Company recognized $2.1 million of interest income related to its investment in this loan.
(7) See “—Reserve for Loan Losses.”
F-29
KBS REAL ESTATE INVESTMENT TRUST, INC.
NOTES TO CONSOLIDATED FINANCIAL STATEMENTS (CONTINUED)
December 31, 2016
As of December 31, 2016 and 2015, interest receivable from real estate loans receivable was $0.1 million and $0.1 million, respectively, and is included in rents and other receivables.
The following summarizes the activity related to real estate loans receivable for the year ended December 31, 2016 (in thousands):
Real estate loans receivable, net - December 31, 2015 | $ | 27,281 | |
Principal repayments received on real estate loans receivable | (76 | ) | |
Accretion of discounts on purchased real estate loans receivable | 1,175 | ||
Amortization of origination fees and costs on purchased and originated real estate loans receivable | (36 | ) | |
Deed-in-lieu foreclosure of real estate loan receivable | (5,480 | ) | |
Real estate loans receivable, net - December 31, 2016 | $ | 22,864 | |
The following summarizes the Company’s investments in real estate loans receivable as of December 31, 2016 (in thousands):
Outstanding principal balance | $ | 28,853 | |
Discounts on real estate loans receivable | (8,060 | ) | |
Accumulated accretion of discounts on purchases of real estate loans receivable | 7,117 | ||
Origination fees and costs on purchases and originations of real estate loans receivable | 348 | ||
Accumulated amortization of origination fees and costs, net | (298 | ) | |
Reserve for loan losses | (5,096 | ) | |
Real estate loans receivable, net - December 31, 2016 | $ | 22,864 | |
For the years ended December 31, 2016, 2015 and 2014, interest income from real estate loans receivable consisted of the following (in thousands):
Years Ended December 31, | |||||||||||
2016 | 2015 | 2014 | |||||||||
Contractual interest income | $ | 1,706 | $ | 2,073 | $ | 2,102 | |||||
Interest accretion | 1,175 | 1,048 | 1,007 | ||||||||
Amortization of origination fees and costs and acquisition costs, net | (36 | ) | (32 | ) | (32 | ) | |||||
Interest income from real estate loans receivable | $ | 2,845 | $ | 3,089 | $ | 3,077 | |||||
The Company generally recognizes income on impaired loans on either a cash basis, where interest income is only recorded when received in cash, or on a cost-recovery basis, where all cash receipts are applied against the carrying value of the loan. The Company will resume the accrual of interest if it determines the collection of interest according to the contractual terms of the loan is probable. The Company considers the collectibility of the loan’s principal balance in determining whether to recognize income on impaired loans on a cash basis or a cost-recovery basis.
As of December 31, 2016, the borrower under the Sandmar Mezzanine Loan was delinquent. Subsequent to December 31, 2016, the borrower defaulted on the Sandmar Mezzanine Loan. Beginning in July 2014, interest income received on the Sandmar Mezzanine Loan was recorded on a cost-recovery basis. As of September 30, 2015, the book value, which is net of the loan loss reserve for the Sandmar Mezzanine Loan, was $0. Subsequent to September 30, 2015, the Company began recognizing cash receipts related to the Sandmar Mezzanine Loan as interest income. During the years ended December 31, 2016, 2015 and 2014, the Company recognized interest income of $0.1 million, $0.1 million and $0.2 million related to the Sandmar Mezzanine Loan, respectively.
F-30
KBS REAL ESTATE INVESTMENT TRUST, INC.
NOTES TO CONSOLIDATED FINANCIAL STATEMENTS (CONTINUED)
December 31, 2016
On September 1, 2015, the Lawrence Village Plaza Loan Origination matured without repayment and the Company began recognizing interest income on a cash basis. On May 13, 2016, the Company received a deed-in-lieu of foreclosure in satisfaction of all amounts due to it under its investment in the Lawrence Village Plaza Loan Origination and received title to the collateral that secured the loan. During the years ended December 31, 2016, 2015 and 2014, the Company recognized interest income of $0.2 million, $0.6 million and $0.6 million on the Lawrence Village Plaza Loan Origination, respectively.
Reserve for Loan Losses
As of December 31, 2016, the total reserve for loan losses consisted of $5.1 million of asset-specific reserves related to the Sandmar Mezzanine Loan, which had an amortized cost basis of $5.1 million.
The Company did not record additional loan loss reserves during year ended December 31, 2016.
6. | REAL ESTATE HELD FOR SALE AND DISCONTINUED OPERATIONS |
In accordance with ASU No. 2014-08, Presentation of Financial Statements (Topic 205) and Property, Plant, and Equipment (Topic 360): Reporting Discontinued Operations and Disclosures of Disposals of Components of an Entity (“ASU No. 2014-08”), operating results of properties that are classified as held for sale in the ordinary course of business on or subsequent to January 1, 2014 would generally be included in continuing operations on the Company’s consolidated statements of operations. Operating results of properties that were classified as held for sale in financial statements issued for the reporting periods prior to January 1, 2014 will remain in discontinued operations on the Company’s consolidated statement of operations. Prior to the adoption of ASU No. 2014-08, the operating results of properties held for sale or to be disposed of and the aggregate net gains recognized upon their disposition were presented as discontinued operations in the accompanying consolidated statements of operations for all periods presented. During the year ended December 31, 2015, the Company disposed of 34 properties (of which 31 were GKK Properties) and terminated its leasehold interest in three GKK Properties. During the year ended December 31, 2016, the Company disposed of 273 properties (of which 269 were GKK Properties) and terminated its leasehold interest in two GKK Properties. As of December 31, 2016, the Company had classified 30 properties as held for sale, all of which were GKK Properties.
The following summary presents the major components of assets and liabilities related to real estate held for sale as of December 31, 2016 and 2015 (in thousands):
December 31, | |||||||
2016 | 2015 | ||||||
Assets related to real estate held for sale | |||||||
Total real estate, at cost and net of impairment charges | $ | 28,985 | $ | 589,848 | |||
Accumulated depreciation and amortization | (7,287 | ) | (106,131 | ) | |||
Real estate held for sale, net | 21,698 | 483,717 | |||||
Other assets | 675 | 38,937 | |||||
Total assets related to real estate held for sale | $ | 22,373 | $ | 522,654 | |||
Liabilities related to real estate held for sale | |||||||
Notes payable, net | — | 258,933 | |||||
Other liabilities | 1,909 | 19,843 | |||||
Total liabilities related to real estate held for sale | $ | 1,909 | $ | 278,776 | |||
F-31
KBS REAL ESTATE INVESTMENT TRUST, INC.
NOTES TO CONSOLIDATED FINANCIAL STATEMENTS (CONTINUED)
December 31, 2016
During the year ended December 31, 2016, the Company sold four historical real estate properties and 269 GKK Properties, which properties were not classified as held for sale in financial statements issued for the reporting periods prior to January 1, 2014. During the year ended December 31, 2015, the Company sold three historical real estate properties and 30 GKK Properties, which properties were not classified as held for sale in financial statements issued for the reporting periods prior to January 1, 2014. During the year ended December 31, 2014, the Company sold four historical real estate properties and two GKK Properties, disposed of a portfolio of five properties in connection with a deed-in-lieu of foreclosure, and transferred two GKK Properties to the lenders in connection with foreclosure proceedings, which properties were not classified as held for sale in financial statements issued for the reporting periods prior to January 1, 2014. As of December 31, 2016, the Company had classified 30 properties as held for sale, all of which were GKK Properties. In accordance with ASU No. 2014-08, the operations of these properties are included in continuing operations on the Company’s consolidated statements of operations. The following table summarizes certain revenues and expenses related to all of these properties, which were included in continuing operations (in thousands):
Years Ended December 31, | |||||||||||
2016 | 2015 | 2014 | |||||||||
Revenues | |||||||||||
Rental income | $ | 38,710 | $ | 79,325 | $ | 97,420 | |||||
Tenant reimbursements and other operating income | 20,535 | 41,702 | 50,354 | ||||||||
Total revenues | 59,245 | 121,027 | 147,774 | ||||||||
Expenses | |||||||||||
Operating, maintenance, and management | 21,081 | 44,304 | 54,097 | ||||||||
Real estate taxes and insurance | 8,495 | 16,815 | 20,373 | ||||||||
Asset management fees to affiliate | 1,173 | 2,068 | 2,518 | ||||||||
General and administrative expenses | — | 48 | 85 | ||||||||
Depreciation and amortization | 15,882 | 40,313 | 52,921 | ||||||||
Interest expense | 4,380 | 21,284 | 34,444 | ||||||||
Impairment of real estate | 13,931 | 29,774 | 2,424 | ||||||||
Total expenses | 64,942 | 154,606 | 166,862 | ||||||||
Discontinued Operations
The following table summarizes operating income from discontinued operations for the years ended December 31, 2016, 2015 and 2014 (in thousands):
Years Ended December 31, | |||||||||||
2016 | 2015 | 2014 | |||||||||
Total revenues and other income | $ | 6 | $ | 110 | $ | 2,505 | |||||
Total expenses | (76 | ) | (154 | ) | 922 | ||||||
Income from discontinued operations before gain on sales of real estate, net, and impairment charge | 82 | 264 | 1,583 | ||||||||
Gain on sales of real estate, net | — | 124 | 4,797 | ||||||||
Impairment charge | — | — | (257 | ) | |||||||
Income from discontinued operations | $ | 82 | $ | 388 | $ | 6,123 | |||||
F-32
KBS REAL ESTATE INVESTMENT TRUST, INC.
NOTES TO CONSOLIDATED FINANCIAL STATEMENTS (CONTINUED)
December 31, 2016
Foreclosed Real Estate Held for Sale
During the year ended December 31, 2015, the Company sold the remaining two condominium units of the Tribeca Building and recognized a gain on sale of $2.5 million (which gain on sale has been reduced by disposition fees to the Advisor of $0.2 million related to these two units) and recorded expenses of $0.3 million related to foreclosed real estate held for sale. During the year ended December 31, 2014, the Company sold one unit of the Tribeca Building and recognized a gain on sale of $1.1 million (which gain on sale has been reduced by disposition fees to the Advisor of $0.4 million related to 26 residential units of the Tribeca Building, two retail units and the parking space units sold as of December 31, 2014) and recorded expenses of $1.2 million related to foreclosed real estate held for sale.
Disposition of the FSI 6000 Properties
On April 11, 2016, the Company sold 61 bank branch properties, containing an aggregate of 245,843 rentable square feet (the “FSI 6000 Properties”), to a buyer unaffiliated with the Company or the Advisor (the “FSI 6000 Buyer”), for an aggregate sales price, net of closing credits, of $139.6 million (which includes a payment of $6.6 million by the FSI 6000 Buyer to the Company to compensate the Company for costs and expenses the Company incurred in connection with the defeasance of the FSI 6000 Mortgage Loans, as defined below), excluding closing costs.
7. | NOTES PAYABLE |
As of December 31, 2016 and 2015, the Company’s notes payable, including notes payable related to real estate held for sale, consisted of the following (dollars in thousands):
Book Value as of December 31, 2016 | Book Value as of December 31, 2015 | Contractual Interest Rates as of December 31, 2016 | Effective Interest Rates as of December 31, 2016 | Payment Type | Maturity Date | |||||||||||
Notes Payable | ||||||||||||||||
Plaza in Clayton Mortgage Loan (1) | $ | — | $ | 62,200 | (1) | (1) | (1) | (1) | ||||||||
Portfolio Loan (2) | — | 164,131 | (2) | (2) | (2) | (2) | ||||||||||
— | 226,331 | |||||||||||||||
GKK Properties Notes Payable | ||||||||||||||||
Bank of America - BBD2 Mortgage Loan (3) | — | 65,712 | (3) | (3) | (3) | (3) | ||||||||||
Pitney Bowes - Bank of America Mortgage Loan (4) | — | 36,160 | (4) | (4) | (4) | (4) | ||||||||||
FSI 6000D Mortgage Loan (5) | — | 28,934 | (5) | (5) | (5) | (5) | ||||||||||
FSI 6000B Mortgage Loan (5) | — | 27,763 | (5) | (5) | (5) | (5) | ||||||||||
FSI 6000A Mortgage Loan (5) | — | 24,271 | (5) | (5) | (5) | (5) | ||||||||||
FSI 6000C Mortgage Loan (5) | — | 21,967 | (5) | (5) | (5) | (5) | ||||||||||
— | 204,807 | |||||||||||||||
Total notes payable principal outstanding | — | 431,138 | ||||||||||||||
Discount on notes payable, net (6) | — | (2,487 | ) | |||||||||||||
Deferred financing costs, net | — | (429 | ) | |||||||||||||
Total notes payable, net | $ | — | $ | 428,222 | ||||||||||||
(1) On October 6, 2016, the Company repaid the entire outstanding principal balance due and all other sums due under the Plaza in Clayton Mortgage Loan.
(2) On December 1, 2016, the Company repaid the entire outstanding principal balance due and all other sums due under the Portfolio Loan.
(3) On April 15, 2016, the Company, through an indirect wholly owned subsidiary, entered into a defeasance agreement with the lenders under the Bank of America - BBD2 Mortgage Loan. See “Significant Financing Transactions - Defeasance of the Bank of America - BBD2 Mortgage Loan” below.
(4) On September 1, 2016, the Company repaid the entire outstanding principal balance due and all other sums due under the Pitney Bowes - Bank of America Mortgage Loan. See “Significant Financing Transactions - Early Pay-off of the Pitney Bowes - Bank of America Mortgage Loan” below.
(5) On April 11, 2016, the Company, through indirect wholly owned subsidiaries, entered into a defeasance agreement with each of the lenders under these loans. See “Significant Financing Transactions - Defeasance of the FSI 6000 Mortgage Loans” below.
(6) Represents the unamortized discount and premium on notes payable due to the above- and below-market interest rates when the loans were assumed. The discount and premium are amortized over the remaining life of the respective loan.
F-33
KBS REAL ESTATE INVESTMENT TRUST, INC.
NOTES TO CONSOLIDATED FINANCIAL STATEMENTS (CONTINUED)
December 31, 2016
During the years ended December 31, 2016, 2015 and 2014, the Company incurred interest expense of $10.5 million, $29.5 million and $45.9 million, respectively. Included in interest expense were: (i) the amortization of deferred financing costs of $0.3 million, $1.9 million and $1.5 million for the years ended December 31, 2016, 2015 and 2014, respectively, and (ii) the amortization of discounts and premiums on notes payable, which increased interest expense by $0.2 million, $1.3 million and $3.4 million for the years ended December 31, 2016, 2015 and 2014. As of December 31, 2015, $1.7 million of interest was payable.
The following summarizes the activity related to notes payable for the year ended December 31, 2016 (in thousands):
Total notes payable, net - December 31, 2015 | $ | 428,222 | |
Principal repayments | (263,810 | ) | |
Defeasance of notes payable | (167,328 | ) | |
Write-off of discount on notes payable related to sale | 2,260 | ||
Write-off of deferred financing costs | 105 | ||
Amortization of deferred financing costs | 324 | ||
Amortization of discounts and premiums on notes payable, net | 227 | ||
Total notes payable, net - December 31, 2016 | $ | — | |
Significant Financing Transactions
Defeasance of the FSI 6000 Mortgage Loans
On April 11, 2016, in connection with the disposition of the FSI 6000 Properties, the Company entered into a defeasance agreement with each of the lenders under the FSI 6000A Mortgage Loan, FSI 6000B Mortgage Loan, FSI 6000C Mortgage Loan and FSI 6000D Mortgage Loan (collectively, the “FSI 6000 Mortgage Loans”) to defease the entire aggregate outstanding principal balance of $102.3 million under the FSI 6000 Mortgage Loans, releasing the FSI 6000 Properties, which had secured the FSI 6000 Mortgage Loans. The defeasance costs and write-off of an unamortized discount resulted in an aggregate loss on extinguishment of debt of approximately $6.6 million.
Defeasance of the Bank of America - BBD2 Mortgage Loan
On April 15, 2016, the Company, through an indirect wholly owned subsidiary, entered into a defeasance agreement with the lender under the Bank of America - BBD2 Mortgage Loan to defease the remaining outstanding principal balance of $65.1 million, releasing all the properties that secured the Bank of America - BBD2 Mortgage Loan. The defeasance costs and write-off of an unamortized discount and unamortized deferred financing costs resulted in a loss on extinguishment of debt of approximately $12.7 million.
Early Pay-off of the Pitney Bowes - Bank of America Mortgage Loan
On September 1, 2016, the Company repaid the entire $36.2 million principal balance and all other sums due on the Pitney Bowes - Bank of America Mortgage Loan and paid a prepayment premium of $6.5 million. The prepayment premium and write-off of an unamortized discount resulted in an aggregate loss on extinguishment of debt of approximately $7.0 million.
F-34
KBS REAL ESTATE INVESTMENT TRUST, INC.
NOTES TO CONSOLIDATED FINANCIAL STATEMENTS (CONTINUED)
December 31, 2016
8. | FAIR VALUE DISCLOSURES |
Under GAAP, the Company is required to measure certain financial instruments at fair value on a recurring basis. In addition, the Company is required to measure other non-financial and financial assets at fair value on a non-recurring basis (e.g., carrying value of impaired real estate loans receivable and long-lived assets). Fair value is defined as the price that would be received upon the sale of an asset or paid to transfer a liability in an orderly transaction between market participants at the measurement date. The GAAP fair value framework uses a three-tiered approach. Fair value measurements are classified and disclosed in one of the following three categories:
• | Level 1: unadjusted quoted prices in active markets that are accessible at the measurement date for identical assets or liabilities; |
• | Level 2: quoted prices for similar instruments in active markets, quoted prices for identical or similar instruments in markets that are not active, and model-derived valuations in which significant inputs and significant value drivers are observable in active markets; and |
• | Level 3: prices or valuation techniques where little or no market data is available that requires inputs that are both significant to the fair value measurement and unobservable. |
The fair value for certain financial instruments is derived using a combination of market quotes, pricing models and other valuation techniques that involve significant management judgment. The price transparency of financial instruments is a key determinant of the degree of judgment involved in determining the fair value of the Company’s financial instruments. Financial instruments for which actively quoted prices or pricing parameters are available and for which markets contain orderly transactions will generally have a higher degree of price transparency than financial instruments for which markets are inactive or consist of non-orderly trades. The Company evaluates several factors when determining if a market is inactive or when market transactions are not orderly. The following is a summary of the methods and assumptions used by management in estimating the fair value of each class of assets and liabilities for which it is practicable to estimate the fair value:
Cash and cash equivalents, restricted cash, rent and other receivables, and accounts payable and accrued liabilities: These balances approximate their fair values due to the short maturities of these items.
Real estate loans receivable: These instruments are presented in the accompanying consolidated balance sheets at their amortized cost net of recorded loan loss reserves and not at fair value. The fair values of real estate loans receivable were estimated using an internal valuation model that considered the expected cash flows for the loans, underlying collateral values (for collateral-dependent loans) and estimated yield requirements of institutional investors for loans with similar characteristics, including remaining loan term, loan-to-value, type of collateral and other credit enhancements. The Company classifies these inputs as Level 3 inputs.
Notes payable: The fair values of the Company’s notes payable are estimated using a discounted cash flow analysis based on management’s estimates of current market interest rates for instruments with similar characteristics, including remaining loan term, loan-to-value ratio, type of collateral and other credit enhancements. Additionally, when determining the fair value of a liability in circumstances in which a quoted price in an active market for an identical liability is not available, the Company measures fair value using (i) a valuation technique that uses the quoted price of the identical liability when traded as an asset or quoted prices for similar liabilities when traded as assets or (ii) another valuation technique that is consistent with the principles of fair value measurement, such as the income approach or the market approach. The Company classifies these inputs as Level 3 inputs.
F-35
KBS REAL ESTATE INVESTMENT TRUST, INC.
NOTES TO CONSOLIDATED FINANCIAL STATEMENTS (CONTINUED)
December 31, 2016
The following were the face values, carrying amounts and fair values of the Company’s real estate loans receivable and notes payable as of December 31, 2016 and 2015, which carrying amounts generally do not approximate the fair values (in thousands):
December 31, 2016 | December 31, 2015 | ||||||||||||||||||||||
Face Value | Carrying Amount | Fair Value | Face Value | Carrying Amount | Fair Value | ||||||||||||||||||
Financial assets: | |||||||||||||||||||||||
Real estate loans receivable (1) | $ | 28,853 | $ | 22,864 | $ | 21,779 | $ | 35,811 | $ | 27,281 | $ | 25,218 | |||||||||||
Financial liabilities: | |||||||||||||||||||||||
Notes payable | $ | — | $ | — | $ | — | $ | 431,138 | $ | 428,222 | $ | 448,351 | |||||||||||
(1) Carrying amount of real estate loans receivable includes loan loss reserves.
Disclosure of the fair values of financial instruments is based on pertinent information available to the Company as of the period end and requires a significant amount of judgment. Low levels of transaction volume for certain financial instruments have made the estimation of fair values difficult and, therefore, both the actual results and the Company’s estimate of value at a future date could be materially different.
Assets Recorded at Fair Value
During the year ended December 31, 2016, the Company measured the following assets at fair value on a nonrecurring basis (in thousands):
Fair Value Measurements Using | |||||||||||||||
Total | Quoted Prices in Active Markets for Identical Assets (Level 1) | Significant Other Observable Inputs (Level 2) | Significant Unobservable Inputs (Level 3) | ||||||||||||
Nonrecurring Basis (1): | |||||||||||||||
Impaired real estate held for investment | $ | 38,406 | $ | — | $ | — | $ | 38,406 | |||||||
Impaired real estate held for sale | 5,799 | — | — | 5,799 | |||||||||||
Impaired real estate sold | 59,293 | — | — | 59,293 | |||||||||||
(1) Amounts represent the aggregate fair value for real estate assets impacted by impairment charges during the year ended December 31, 2016, as of the date that the fair value measurements were made. The carrying value for these real estate assets may have subsequently increased or decreased from the fair value reflected due to activity that has occurred since the measurement date.
As of December 31, 2016, certain of the Company’s real estate properties held for investment were measured at estimated fair value as these properties were impaired and the carrying values of these properties were adjusted to estimated fair values. The Company estimated the fair value for the impaired real estate properties held for investment by performing a 10-year discounted cash flow analysis. The range of the terminal capitalization rates used to estimate the fair values for these properties was 8.50% to 12.00%. See Note 3, “Real Estate Held for Investment — Impairment of Real Estate,” for information regarding impairments related to real estate held for investment. As of December 31, 2016, certain of the Company’s real estate properties held for sale and sold were measured at estimated fair value as these properties were impaired and the carrying values of these properties were adjusted to estimated fair value. The Company estimated the fair value for these impaired real estate properties held for sale and sold based on an estimated sales price, less estimated costs to sell.
F-36
KBS REAL ESTATE INVESTMENT TRUST, INC.
NOTES TO CONSOLIDATED FINANCIAL STATEMENTS (CONTINUED)
December 31, 2016
9. | RELATED PARTY TRANSACTIONS |
The Company has entered into an Advisory Agreement with the Advisor, which entitles the Advisor to specified fees for the management and disposition of investments, among other services, as well as to reimbursement for certain costs incurred by the Advisor in providing services to the Company. In addition, the Advisor is entitled to certain other fees, including an incentive fee upon achieving certain performance goals, as detailed in the Advisory Agreement. The Company has also entered into a fee reimbursement agreement (the “AIP Reimbursement Agreement”) with the Dealer Manager pursuant to which the Company agreed to reimburse the Dealer Manager for certain fees and expenses it incurs for administering the Company’s participation in the DTCC Alternative Investment Product Platform with respect to certain accounts of the Company’s investors serviced through the platform. The Advisor also serves, and the Dealer Manager also serves or served, as the advisor and dealer manager, respectively, for KBS Real Estate Investment Trust II, Inc., KBS Real Estate Investment Trust III, Inc., KBS Strategic Opportunity REIT, Inc., KBS Legacy Partners Apartment REIT, Inc., KBS Strategic Opportunity REIT II, Inc. and KBS Growth & Income REIT, Inc.
On January 6, 2014, the Company, together with KBS Real Estate Investment Trust II, Inc., KBS Real Estate Investment Trust III, Inc., KBS Strategic Opportunity REIT, Inc., KBS Legacy Partners Apartment REIT, Inc., KBS Strategic Opportunity REIT II, Inc., the Dealer Manager, the Advisor and other KBS-affiliated entities, entered into an errors and omissions and directors and officers liability insurance program where the lower tiers of such insurance coverage are shared. The cost of these lower tiers is allocated by the Advisor and its insurance broker among each of the various entities covered by the program, and is billed directly to each entity. The allocation of these shared coverage costs is proportionate to the pricing by the insurance marketplace for the first tiers of directors and officers liability coverage purchased individually by each REIT. The Advisor’s and the Dealer Manager’s portion of the shared lower tiers’ cost is proportionate to the respective entities’ prior cost for the errors and omissions insurance. In June 2015, KBS Growth & Income REIT, Inc. was added to the insurance program at terms similar to those described above. The Company has reviewed its participation in the program and the program is effective through June 30, 2017.
During the years ended December 31, 2016, 2015 and 2014, no other transactions occurred between the Company and the other KBS-sponsored programs. On May 18, 2012, KBS Strategic Opportunity REIT, Inc. made an $8.0 million investment in a joint venture in which the Company indirectly owns a participation interest through another joint venture investment.
F-37
KBS REAL ESTATE INVESTMENT TRUST, INC.
NOTES TO CONSOLIDATED FINANCIAL STATEMENTS (CONTINUED)
December 31, 2016
Pursuant to the terms of the Advisory Agreement and the AIP Reimbursement Agreement, summarized below are the related-party costs incurred by the Company for the years ended December 31, 2016, 2015 and 2014, respectively, and any related amounts payable as of December 31, 2016 and 2015 (in thousands):
Incurred | Payable as of | ||||||||||||||||||
Year Ended December 31, | December 31, | ||||||||||||||||||
2016 | 2015 | 2014 | 2016 | 2015 | |||||||||||||||
Expensed | |||||||||||||||||||
Asset management fees (1) | $ | 7,553 | $ | 9,547 | $ | 9,992 | $ | — | $ | — | |||||||||
Reimbursement of operating expenses (2) | 337 | 269 | 261 | 188 | 68 | ||||||||||||||
Disposition fees (3) | 8,381 | 3,244 | 1,174 | — | — | ||||||||||||||
$ | 16,271 | $ | 13,060 | $ | 11,427 | $ | 188 | $ | 68 | ||||||||||
_____________________
(1) See “Asset Management Fee for GKK Properties” below.
(2) Reimbursable operating expenses primarily consists of internal audit personnel costs, accounting software and cybersecurity related expenses incurred by the Advisor under the Advisory Agreement. The Company reimburses the Advisor for the Company’s allocable portion of the salaries, benefits and overhead of internal audit department personnel providing services to the Company. These amounts totaled $0.3 million, $0.2 million and $0.2 million for the years ended December 31, 2016, 2015 and 2014, respectively. These were the only types of employee costs reimbursed under the Advisory Agreement for the years ended December 31, 2016, 2015 and 2014. The Company will not reimburse for employee costs in connection with services for which the Advisor earns disposition fees (other than reimbursement of travel and communication expenses) or for the salaries or benefits the Advisor or its affiliates may pay to the Company’s executive officers. In addition to the amounts above, the Company reimburses the Advisor for certain of the Company’s direct costs incurred from third parties that were initially paid by the Advisor on behalf of the Company. Under the Company’s charter, the Company is required to limit its total operating expenses to the greater of 2% of its average invested assets or 25% of its net income for the four most recently completed fiscal quarters, as these terms are defined in the Company’s charter, unless the conflicts committee of the Company’s board of directors has determined that such excess expenses were justified based on unusual and non-recurring factors. Operating expenses for the four fiscal quarters ended December 31, 2016 exceeded the charter-imposed limitation and the conflicts committee of the Company’s board of directors determined that these expenses were justified given the professional fees and expenses the Company incurred related to its exploration of the availability of strategic alternatives and the fees and expenses related to preparation and solicitation of proxies in connection with the Company’s stockholders’ approval of the Plan of Liquidation.
(3) Disposition fees with respect to real estate sold are included in the gain (loss) on sales of real estate in the accompanying consolidated statements of operations. See also “ —Modification of Disposition Fee Related to GKK Properties” below.
During the year ended December 31, 2016, the Advisor reimbursed the Company $36,000 for a property insurance rebate and the Advisor and/or the Dealer Manager reimbursed the Company $69,000 for legal and professional fees and travel reimbursements.
Asset Management Fee for GKK Properties
Among the fees payable to the Advisor is an asset management fee. With respect to investments in real estate, the Company pays the Advisor a monthly asset management fee equal to one-twelfth of 0.75% of the amount actually paid or allocated to acquire the investment, plus the cost of any subsequent development, construction or improvements to the property. This amount includes any portion of the investment that was debt financed and is inclusive of acquisition fees and expenses related thereto. In the case of investments made through joint ventures, the asset management fee is determined based on the Company’s proportionate share of the underlying investment.
With respect to investments in loans and any investments other than real estate, the Company pays the Advisor a monthly asset management fee calculated, each month, as one-twelfth of 0.75% of the lesser of (i) the amount actually paid or allocated to acquire or fund the loan or other investment (which amount includes any portion of the investment that was debt financed and is inclusive of acquisition or origination fees and expenses related thereto) and (ii) the outstanding principal amount of such loan or other investment, plus the acquisition or origination fees and expenses related to the acquisition or funding of such investment, as of the time of calculation.
F-38
KBS REAL ESTATE INVESTMENT TRUST, INC.
NOTES TO CONSOLIDATED FINANCIAL STATEMENTS (CONTINUED)
December 31, 2016
With respect to an investment that has suffered an impairment in value, reduction in cash flow or other negative circumstances, such investment may either be excluded from the calculation of the asset management fee described above or included in such calculation at a reduced value that is recommended by the Advisor and Company’s management and then approved by a majority of its independent directors, and this change in the fee shall be applicable to an investment upon the earlier to occur of the date on which (i) such investment is sold, (ii) such investment is surrendered to a person other than the Company, its direct or indirect wholly owned subsidiary or a joint venture or partnership in which it has an interest, (iii) the Advisor determines that it will no longer pursue collection or other remedies related to such investment, or (iv) the Advisor recommends a revised fee arrangement with respect to such investment. As of December 31, 2016, the Company excluded its interest in an unconsolidated joint venture from the calculation of asset management fees. Through March 31, 2016, the Company calculated the asset management fee for the GKK Properties based on the original cost of its investment in the GKK Mezzanine Loan, rather than on the gross value of the GKK Properties it owns or in which it holds a leasehold interest. Beginning in April 2016, the gross value of the GKK Properties fell below the original cost of the Company’s investment in the GKK Mezzanine Loan and for the period from April 1, 2016 through December 31, 2016, the Company calculated the asset management fee for these properties based on the gross value of the GKK Properties. As of December 31, 2016, the Company had not determined to calculate the asset management fee at an adjusted value for any other investments or to exclude any other investments from the calculation of the asset management fee.
Modification of Disposition Fee Related to GKK Properties
In accordance with the Advisory Agreement, for substantial assistance in connection with the sale of properties, loans or other investments as determined by the conflicts committee of the Company’s board of directors, the Company pays the Advisor or its affiliates a disposition fee of 1% of the contract sales price of the properties, loans or other investments sold. However, in no event may the total commissions (including such disposition fees) paid to the Advisor, its affiliates and unaffiliated third parties exceed 6% of the contract sales price of the property, loan or other investment sold or exceed a competitive real estate commission.
Prior to August 9, 2016, notwithstanding the foregoing, in January 2015, the disposition fee related to the sales of GKK Properties was modified to provide that the conflicts committee would determine in its sole discretion the amount of the disposition fee related to the sale of GKK Properties upon the terms set forth below, which disposition fee may be an amount not to exceed 1% of the contract sales price, which maximum amount is consistent with the fixed percentage applicable to the sales of other properties, loans and other investments.
With respect to sales of the GKK Properties, and provided that the conflicts committee determined that the Advisor had provided a substantial amount of services in connection with the sale of each GKK Property for which the payment of a disposition fee was requested by the Advisor, then:
(a) | With respect to portfolio or single asset sales of GKK Properties designated by the conflicts committee in its sole discretion at or about the time of the sale, the Company would pay the Advisor a fee in an amount not to exceed 1% of the contract sales price and subject to other limitations and conditions set forth in the Advisory Agreement, as determined by the conflicts committee in its sole discretion, which fee would be payable upon the respective closing; and |
(b) | With respect to sales of all other GKK Properties for which a disposition fee had not yet been paid, if, upon the sale of the final GKK Property, the conflicts committee determined in its sole discretion that the Company had recovered its entire investment related to the GKK Mezzanine Loan and the GKK Properties subsequent to the Settlement Agreement, after taking into consideration the net cash flow received by the Company from the investment, whether in the form of (i) net proceeds from the sales or other dispositions or transfers of the GKK Properties, (ii) the net cash flow related to the GKK Mezzanine Loan, (iii) the net cash flow related to the GKK Properties subsequent to the Settlement Agreement and/or (iv) other proceeds related to the assets and liabilities received under the Settlement Agreement, then the Company would pay the Advisor a fee in an amount not to exceed 1% of the contract sales price and subject to other conditions set forth in the Advisory Agreement, as determined by the conflicts committee in its sole discretion, which fee would be payable promptly upon such determination by the conflicts committee. |
F-39
KBS REAL ESTATE INVESTMENT TRUST, INC.
NOTES TO CONSOLIDATED FINANCIAL STATEMENTS (CONTINUED)
December 31, 2016
On August 9, 2016, the Company and the Advisor entered into an amendment (“Amendment No. 1”) to the Advisory Agreement to amend certain terms related to the disposition fee payable to the Advisor by the Company. Pursuant to Amendment No. 1, with respect to sales of GKK Properties for which a disposition fee had not yet been paid as of August 9, 2016, based on the proceeds received from the entire investment related to the GKK Mezzanine Loan and the GKK Properties through August 9, 2016 and expected proceeds from future sales, the conflicts committee determined that the Advisor had provided a substantial amount of services in connection with the sale of each of the 160 GKK Properties named therein and approved the payment to the Advisor of a disposition fee equal to 1.0% of the aggregate contract sales prices of such GKK Properties, of which the aggregate disposition fee was $2.0 million. The aggregate contract sales price of such 160 GKK Properties was $214.1 million. The $2.0 million disposition fee was paid in August 2016 and was included in the gain on sales of real estate, net in the accompanying consolidated statements of operations for the year ended December 31, 2016.
Also pursuant to Amendment No. 1, for substantial assistance in connection with the sale of all GKK Properties that had not been sold as of August 9, 2016 (as determined by the conflicts committee of the Company’s board of directors), the Company will pay the Advisor or its affiliates a disposition fee of 1.0% of the contract sales price of such GKK Properties sold. However, in no event may the total commissions (including such disposition fees) paid to the Advisor, its affiliates and unaffiliated third parties exceed 6% of the contract sales price of the property or other investment sold or exceed a competitive real estate commission.
The terms of Amendment No. 1 are included in the November 8, 2016 renewal of the Advisory Agreement.
10. | SUPPLEMENTAL CASH FLOW AND SIGNIFICANT NONCASH TRANSACTION DISCLOSURES |
Supplemental cash flow and significant noncash transaction disclosures were as follows (in thousands):
For the Years Ended December 31, | |||||||||||
2016 | 2015 | 2014 | |||||||||
Supplemental Disclosure of Cash Flow Information: | |||||||||||
Interest paid | $ | 11,670 | $ | 26,541 | $ | 47,095 | |||||
Supplemental Disclosure of Significant Noncash Investing and Financing Activities: | |||||||||||
Treasury securities transferred in connection with defeasance of notes payable | $ | (184,256 | ) | $ | 100,229 | $ | — | ||||
Defeasance of notes payable | $ | 167,328 | $ | (87,396 | ) | $ | — | ||||
Investment in a real estate property through deed-in-lieu of foreclosure | $ | 5,480 | $ | — | $ | — | |||||
Mortgage loans extinguished in connection with foreclosures and deed in lieu of foreclosure | $ | — | $ | — | $ | 54,028 | |||||
Increase in distributions payable | $ | — | $ | — | $ | 4,699 | |||||
Increase in capital expenses payable | $ | — | $ | — | $ | 6,004 | |||||
F-40
KBS REAL ESTATE INVESTMENT TRUST, INC.
NOTES TO CONSOLIDATED FINANCIAL STATEMENTS (CONTINUED)
December 31, 2016
11. | SEGMENT INFORMATION |
The Company presently operates in three business segments based on its investment types: real estate, real estate-related and commercial properties primarily leased to financial institutions received under the Settlement Agreement, or the GKK Properties. Under the real estate segment, the Company has invested primarily in office and industrial properties located throughout the United States and received a title to a retail property through a deed-in-lieu of foreclosure. The real estate segment excludes all real estate properties that were classified as discontinued operations. Under the real estate-related segment, the Company has invested in or originated mortgage loans, mezzanine loans and other real estate-related assets, including real estate securities. The GKK Properties segment consists of primarily office properties, bank branch properties, operations centers and other properties located in 16 states but excludes GKK Properties that were classified as discontinued operations. All revenues earned from the Company’s three reporting segments were from external customers and there were no intersegment sales or transfers. The Company does not allocate corporate-level accounts to its reporting segments. Corporate-level accounts include corporate general and administrative expenses, asset management fees, non-operating interest income and other corporate-level expenses. The accounting policies of the reporting segments are consistent with those described in Note 2, “Summary of Significant Accounting Policies.”
The Company evaluates the performance of its segments based upon net operating income from continuing operations (“NOI”), which is a non-GAAP supplemental financial measure. The Company defines NOI for its real estate segment and the GKK Properties segment as operating revenues (rental income, tenant reimbursements and other operating income) less property and related expenses (property operating expenses, real estate taxes, insurance and provision for bad debt) less interest expense (if applicable). The Company defines NOI for its real estate-related segment as interest income and income from its unconsolidated joint venture investment less loan servicing costs (if applicable) and interest expense (if applicable). NOI excludes certain items that are not considered to be controllable in connection with the management of an asset such as non-property income and expenses, depreciation and amortization, asset management fees and corporate general and administrative expenses. The Company uses NOI to evaluate the operating performance of the Company’s real estate investments, real estate-related investments and the GKK Properties and to make decisions about resource allocations. The Company believes that net income is the GAAP measure that is most directly comparable to NOI; however, NOI should not be considered as an alternative to net income as the primary indicator of operating performance as it excludes the items described above. Additionally, NOI as defined above may not be comparable to other REITs or companies as their definitions of NOI may differ from the Company’s definition. During the year ended December 31, 2014, the Company revised its definition of NOI to exclude asset management fees, which the Company does not consider to be controllable in connection with the management of each property or real estate-related asset and is viewed by the chief operating decision makers as a corporate-level administrative expense. NOI for all prior periods presented has been adjusted to conform to the current period definition.
F-41
KBS REAL ESTATE INVESTMENT TRUST, INC.
NOTES TO CONSOLIDATED FINANCIAL STATEMENTS (CONTINUED)
December 31, 2016
The following tables summarize total revenues, interest expense and NOI for each reportable segment for the years ended December 31, 2016, 2015 and 2014, and total assets and total liabilities for each reportable segment as of December 31, 2016 and 2015 (in thousands):
Years Ended December 31, | |||||||||||
2016 | 2015 | 2014 | |||||||||
Revenues: | |||||||||||
Real estate segment (1) | $ | 61,268 | $ | 67,536 | $ | 71,965 | |||||
Real estate-related segment | 2,845 | 3,089 | 3,077 | ||||||||
GKK Properties segment (1) | 65,221 | 117,595 | 137,423 | ||||||||
Total revenues | $ | 129,334 | $ | 188,220 | $ | 212,465 | |||||
Interest expense: | |||||||||||
Real estate segment (1) | $ | 6,169 | $ | 8,391 | $ | 9,613 | |||||
GKK Properties segment (1) | 4,367 | 21,126 | 36,310 | ||||||||
Total interest expense | $ | 10,536 | $ | 29,517 | $ | 45,923 | |||||
NOI: | |||||||||||
Real estate segment (1) | $ | 29,493 | $ | 26,882 | $ | 29,437 | |||||
Real estate-related segment | 2,843 | 3,087 | 2,940 | ||||||||
GKK Properties segment (1) | 17,607 | 30,004 | 22,634 | ||||||||
Total NOI | $ | 49,943 | $ | 59,973 | $ | 55,011 | |||||
December 31, | |||||||||||
2016 | 2015 | ||||||||||
Assets: | |||||||||||
Real estate segment | $ | 353,983 | $ | 355,221 | |||||||
Real estate-related segment | 23,295 | 27,899 | |||||||||
GKK Properties segment | 80,053 | 137,921 | |||||||||
Total segment assets | 457,331 | 521,041 | |||||||||
Real estate held for sale | 22,373 | 522,654 | |||||||||
Corporate-level (2) | 162,223 | 11,170 | |||||||||
Total assets | $ | 641,927 | $ | 1,054,865 | |||||||
Liabilities: | |||||||||||
Real estate segment | $ | 8,798 | $ | 178,911 | |||||||
Real estate-related segment | 8 | 3 | |||||||||
GKK Properties segment | 33,396 | 66,208 | |||||||||
Total segment liabilities | 42,202 | 245,122 | |||||||||
Real estate held for sale | 1,909 | 278,776 | |||||||||
Corporate-level (3) | 1,384 | 1,304 | |||||||||
Total liabilities | $ | 45,495 | $ | 525,202 | |||||||
_____________________
(1) Amounts include certain properties in continuing operations that were sold or held for sale as of December 31, 2016. See Note 6, “Real Estate Held for Sale and Discontinued Operations” for more information.
(2) Total corporate-level assets consisted primarily of cash and cash equivalents of approximately $161.6 million and $10.6 million as of December 31, 2016 and 2015, respectively.
(3) As of December 31, 2016 and 2015, corporate-level liabilities consisted primarily of accounts payable and accrued liabilities for general and administrative expenses.
F-42
KBS REAL ESTATE INVESTMENT TRUST, INC.
NOTES TO CONSOLIDATED FINANCIAL STATEMENTS (CONTINUED)
December 31, 2016
The following table reconciles the Company’s net income (loss) to its NOI for the years ended December 31, 2016, 2015 and 2014 (amounts in thousands):
Years Ended December 31, | |||||||||||
2016 | 2015 | 2014 | |||||||||
Net income (loss) | $ | 90,893 | $ | (11,387 | ) | $ | (21,266 | ) | |||
Gain on sales of real estate | (159,464 | ) | (99,988 | ) | (2,282 | ) | |||||
Gain on sales of real estate securities | — | — | (4,410 | ) | |||||||
Loss (gain) from extinguishment of debt | 26,343 | 22,518 | (21,328 | ) | |||||||
Gain on sales of foreclosed real estate held for sale | — | (2,509 | ) | (1,108 | ) | ||||||
Other income and interest income | (929 | ) | (1,394 | ) | (938 | ) | |||||
Asset management fees to affiliate | 7,553 | 9,547 | 9,975 | ||||||||
Foreclosure fees and expenses | 278 | — | — | ||||||||
General and administrative expenses | 15,971 | 32,619 | 18,788 | ||||||||
Depreciation and amortization | 35,961 | 59,145 | 71,613 | ||||||||
Impairment charges on real estate | 33,419 | 49,306 | 10,117 | ||||||||
Provision for loan losses | — | 2,504 | 1,973 | ||||||||
Total income from discontinued operations | (82 | ) | (388 | ) | (6,123 | ) | |||||
NOI (1) | $ | 49,943 | $ | 59,973 | $ | 55,011 | |||||
_____________________
(1) Amounts include certain properties in continuing operations that were sold or held for sale as of December 31, 2016. See Note 6, “Real Estate Held for Sale and Discontinued Operations” for more information.
12. | SELECTED QUARTERLY FINANCIAL DATA (UNAUDITED) |
Presented below is a summary of the unaudited quarterly financial information for the years ended December 31, 2016 and 2015 (in thousands, except per share amounts):
2016 | ||||||||||||||||
First Quarter | Second Quarter | Third Quarter | Fourth Quarter | |||||||||||||
Revenues | $ | 41,125 | $ | 34,784 | $ | 27,290 | $ | 26,135 | ||||||||
Total (loss) income from discontinued operations | $ | (5 | ) | $ | 83 | $ | — | $ | 4 | |||||||
Net income (loss) attributable to common stockholders | $ | 10,819 | $ | 61,182 | $ | (9,294 | ) | $ | 28,186 | |||||||
Income (loss) per common share, basic and diluted | $ | 0.06 | $ | 0.33 | $ | (0.05 | ) | $ | 0.15 | |||||||
Distributions declared per common share (1) | $ | 0.025 | $ | 0.025 | $ | 0.025 | $ | 0.025 | ||||||||
2015 | ||||||||||||||||
First Quarter | Second Quarter | Third Quarter | Fourth Quarter | |||||||||||||
Revenues | $ | 49,577 | $ | 44,966 | $ | 44,844 | $ | 48,833 | ||||||||
Total income (loss) from discontinued operations | $ | 168 | $ | (7 | ) | $ | 305 | $ | (78 | ) | ||||||
Net income (loss) attributable to common stockholders | $ | 8,589 | $ | 19,751 | $ | (47,411 | ) | $ | 7,684 | |||||||
Income (loss) per common share, basic and diluted | $ | 0.05 | $ | 0.11 | $ | (0.25 | ) | $ | 0.03 | |||||||
Distributions declared per common share (1) | $ | 0.025 | $ | 0.025 | $ | 0.025 | $ | 0.275 | ||||||||
____________________
(1) See Note 2, “Summary of Significant Accounting Policies — Per Share Data” for more information on distributions declared per common share.
F-43
KBS REAL ESTATE INVESTMENT TRUST, INC.
NOTES TO CONSOLIDATED FINANCIAL STATEMENTS (CONTINUED)
December 31, 2016
13. | COMMITMENTS AND CONTINGENCIES |
Lease Obligations
Pursuant to the Settlement Agreement, the Company indirectly received leasehold interests in certain commercial properties, pursuant to leases between the owner of the property, as landlord, and the Company, as tenant. The ground leases have expiration dates from 2019 through 2058 and the building leases have expiration dates from 2017 through 2085. These lease obligations generally contain rent increases and renewal options. In certain instances, the rent owed by the Company to the owner of the property under the lease is greater than the revenue received by the Company from the tenants occupying the property.
Future minimum lease payments owed by the Company under non-cancelable operating building and ground leases as of December 31, 2016 were as follows (in thousands):
2017 | $ | 11,026 | ||
2018 | 923 | |||
2019 | 869 | |||
2020 | 707 | |||
2021 | 707 | |||
Thereafter | 26,029 | |||
$ | 40,261 | (1) | ||
_____________________
(1) Included in this amount is a total lease obligation of $29.6 million related to a property located in downtown St. Petersburg, Florida. On January 20, 2017, the Company terminated the ground lease at downtown St. Petersburg and paid an aggregate of $10.0 million to settle the remaining obligations under the ground lease. In connection with the leasehold termination, the Company wrote-off the remaining $9.3 million of above-market lease liability balance associated with this lease.
If the Company was to dispose of an asset that is subject to a ground lease, the Company may incur additional losses to settle obligations related to the ground lease.
Economic Dependency
The Company is dependent on the Advisor for certain services that are essential to the Company, including the management of the Company’s real estate and real estate-related investment portfolio; the disposition of real estate and real estate-related investments; the execution of the Plan of Liquidation; and other general and administrative responsibilities. In the event that the Advisor is unable to provide any of these services, the Company will be required to obtain such services from other sources. The Company also will be dependent on the Property Manager for the Services under the GKK Agreements, as amended, including the operations, leasing and eventual dispositions of the GKK Properties, prior to the sale of substantially all of such properties.
Environmental
As an owner of real estate, the Company is subject to various environmental laws of federal, state and local governments. Although there can be no assurance, the Company is not aware of any environmental liability that could have a material adverse effect on its financial condition or results of operations. However, changes in applicable environmental laws and regulations, the uses and conditions of properties in the vicinity of the Company’s properties, the activities of its tenants and other environmental conditions of which the Company is unaware with respect to the properties could result in future environmental liabilities.
Under the Settlement Agreement, the Company indirectly took title to or, with respect to a limited number of the GKK Properties, indirectly took a leasehold interest in, the GKK Properties on an “as is” basis. As such, the Company was not able to inspect the GKK Properties or conduct standard due diligence on certain of the GKK Properties before the transfers of the properties. Additionally, the Company did not receive representations, warranties and indemnities relating to the GKK Properties from Gramercy and/or its affiliates. Thus, the value of the GKK Properties may decline if the Company subsequently discovers environmental problems with the GKK Properties.
F-44
KBS REAL ESTATE INVESTMENT TRUST, INC.
NOTES TO CONSOLIDATED FINANCIAL STATEMENTS (CONTINUED)
December 31, 2016
Legal Matters
From time to time, the Company is party to legal proceedings that arise in the ordinary course of its business. Management is not aware of any legal proceedings the outcome of which is probable or reasonably possible to have a material adverse effect on the Company’s results of operations or financial condition, which would require accrual or disclosure of the contingency and possible range of loss. Additionally, the Company has not recorded any loss contingencies related to legal proceedings in which the potential loss is deemed to be remote.
14. | SUBSEQUENT EVENTS |
The Company evaluates subsequent events up until the date the consolidated financial statements are issued.
Plan of Liquidation
On January 27, 2017, the Company’s stockholders approved the Plan of Liquidation. The principal purpose of the Plan of Liquidation is to maximize stockholder value by selling the Company’s assets, paying its debts and distributing the net proceeds from liquidation to the Company’s stockholders. For more information, see the Plan of Liquidation, which is attached as an exhibit to this Annual Report on Form 10-K.
Articles of Amendment
On January 27, 2017, the Company’s stockholders approved three amendments to the Company’s charter, which amendments are contained in the Articles of Amendment. The Articles of Amendment were filed with the State Department of Assessments and Taxation of Maryland on January 31, 2017 and were effective as of that date. The Articles of Amendment:
(a) | eliminate (i) conditions and limitations on the Company’s exculpation and indemnification of its present or former directors and the Advisor and its affiliates and (ii) limitations on the Company’s ability to reimburse its present or former directors and the Advisor or its affiliates for reasonable legal expenses and other costs. The Articles of Amendment provide that the Company shall exculpate and indemnify its present and former directors and officers to the maximum extent permitted by Maryland law and provide the Company the ability to exculpate and indemnify the Advisor and its affiliates pursuant to the terms of the Advisory Agreement between the Company and the Advisor; |
(b) | eliminate the charter requirement to distribute a specific report with audited financial statements, related party and other information to stockholders each year. Although, pursuant to the Articles of Amendment, the Company’s charter no longer requires that its provide audited financial statements to its stockholders, any decision to cease providing audited financial statements to the Company’s stockholders would need to be approved by the board of directors and would require that the SEC grant the Company relief from certain reporting requirements under the Exchange Act; and |
(c) | exclude the distribution of interests in a liquidating trust from the definition of a “roll-up transaction” under the Charter. |
For more information, see the Articles of Amendment, which are attached as exhibit 99.1 to the Company’s Current Report on Form 8-K filed with the SEC on January 31, 2017.
Initial Liquidating Distribution
Pursuant to the Plan of Liquidation, on March 10, 2017, the Company’s board of directors authorized an initial liquidating distribution in the amount of $1.00 per share of common stock to the Company’s stockholders of record as of the close of business on March 21, 2017. The initial liquidating distribution was paid on March 24, 2017 and was funded from proceeds from asset sales.
F-45
KBS REAL ESTATE INVESTMENT TRUST, INC.
NOTES TO CONSOLIDATED FINANCIAL STATEMENTS (CONTINUED)
December 31, 2016
March 2017 EVPS
On March 27, 2017, the Company’s board of directors approved an estimated value per share of the Company’s common stock of $2.475 (unaudited), effective March 21, 2017 (the “March 2017 EVPS”). The Company provided the March 2017 EVPS for the purpose of assisting broker-dealers that participated in its initial public offering in meeting their customer account statement reporting obligations under National Association of Securities Dealers Conduct Rule 2340 as required by the Financial Industry Regulatory Authority. The March 2017 EVPS is equal to the midpoint of the estimated range of liquidating distributions of $3.27 and $3.68 per share (which midpoint is $3.475), reduced for the impact of the payment of the initial liquidating distribution of $1.00 per share of common stock to our stockholders. Thus, the March 2017 EVPS reflects the resulting reduction of the Company’s stockholders’ remaining investment in the Company. This valuation was performed in accordance with the provisions of and also to comply with Practice Guideline 2013-01, Valuations of Publicly Registered, Non-Listed REITs, issued by the Investment Program Association in April 2013, reduced for the impact of liquidation fees and selling costs. For more information relating to the calculation of the March 2017 EVPS, see the Company’s Current Report on Form 8-K, filed with the SEC on March 28, 2017.
Disposition of GKK Properties Subsequent to December 31, 2016
Subsequent to December 31, 2016 and through March 27, 2017, the Company sold 59 GKK Properties (of which 28 GKK Properties were classified as held for sale as of December 31, 2016), which had a net book value of $38.5 million as of the date of sale, to buyers unaffiliated with the Company or the Advisor, for an aggregate sales price, net of closing credits, of $59.1 million, excluding closing costs.
F-46
KBS REAL ESTATE INVESTMENT TRUST, INC.
SCHEDULE II
VALUATION AND QUALIFYING ACCOUNTS
(in thousands)
Description | Balance at Beginning of Year | Additions Charged Against Operations | Uncollectible Accounts Written-off | Balance at End of Year | ||||||||||||
Year Ended December 31, 2016 | ||||||||||||||||
Allowance for doubtful accounts | $ | 473 | $ | 309 | $ | (301 | ) | $ | 481 | |||||||
Reserve for loan losses | 6,498 | — | (1,402 | ) | 5,096 | |||||||||||
Year Ended December 31, 2015 | ||||||||||||||||
Allowance for doubtful accounts | $ | 1,051 | $ | (320 | ) | $ | (258 | ) | $ | 473 | ||||||
Reserve for loan losses | 3,994 | 2,504 | — | 6,498 | ||||||||||||
Year Ended December 31, 2014 | ||||||||||||||||
Allowance for doubtful accounts | $ | 6,385 | $ | 683 | $ | (6,017 | ) | $ | 1,051 | |||||||
Reserve for loan losses | 2,090 | 1,973 | (69 | ) | 3,994 | |||||||||||
F-47
KBS REAL ESTATE INVESTMENT TRUST, INC.
SCHEDULE III
REAL ESTATE ASSETS AND ACCUMULATED DEPRECIATION AND AMORTIZATION
December 31, 2016
(dollar amounts in thousands)
Initial Cost to Company | Gross Amount at which Carried at Close of Period | ||||||||||||||||||||||||||||||||||||||||||||
Description | Location | Ownership Percent | Encumbrances | Land | Building and Improvements(1) | Total | Cost Capitalized Subsequent to Acquisition(2) | Land | Building and Improvements(1) | Total (3) | Accumulated Depreciation and Amortization | Original Date of Construction | Date Acquired | ||||||||||||||||||||||||||||||||
Properties Held for Investment | |||||||||||||||||||||||||||||||||||||||||||||
Plaza in Clayton | Saint Louis, MO | 100 | % | $ | — | $ | 2,793 | $ | 91,162 | $ | 93,955 | $ | (1,742 | ) | $ | 2,793 | $ | 89,420 | $ | 92,213 | $ | (25,095 | ) | 2001 | 09/27/2006 | ||||||||||||||||||||
Bridgeway Technology Center | Newark, CA | 100 | % | — | 11,299 | 34,705 | 46,004 | (17,413 | ) | 7,044 | 21,547 | 28,591 | (2,372 | ) | 1996 | 06/27/2007 | |||||||||||||||||||||||||||||
Rivertech I and II | Billerica, MA | 100 | % | — | 3,931 | 42,111 | 46,042 | (4,151 | ) | 3,931 | 37,960 | 41,891 | (10,943 | ) | 1983/2001,2007 | 02/20/2008 | |||||||||||||||||||||||||||||
Tysons Dulles Plaza | McLean, VA | 100 | % | — | 38,839 | 121,210 | 160,049 | (34,775 | ) | 27,989 | 97,285 | 125,274 | (5,609 | ) | 1986-1990 | 06/06/2008 | |||||||||||||||||||||||||||||
Great Oaks Center | Alpharetta, GA | 100 | % | — | 7,743 | 28,330 | 36,073 | (17,561 | ) | 3,349 | 15,163 | 18,512 | (1,716 | ) | 1999 | 07/18/2008 | |||||||||||||||||||||||||||||
University Park Buildings | Sacramento, CA | 100 | % | — | 4,520 | 22,029 | 26,549 | (15,056 | ) | 2,403 | 9,090 | 11,493 | (244 | ) | 1981 | 07/31/2008 | |||||||||||||||||||||||||||||
North Creek Parkway Center | Bothell, WA | 100 | % | — | 11,200 | 30,755 | 41,955 | (3,904 | ) | 9,941 | 28,110 | 38,051 | (5,357 | ) | 1986-1987 | 08/28/2008 | |||||||||||||||||||||||||||||
City Gate Plaza | Sacramento, CA | 100 | % | — | 2,880 | 18,895 | 21,775 | (7,255 | ) | 1,962 | 12,558 | 14,520 | (342 | ) | 1988-1990 | 11/25/2008 | |||||||||||||||||||||||||||||
Lawrence Village Plaza (4) | New Castle, PA | 100 | % | — | 1,608 | 3,771 | 5,379 | (2,412 | ) | 965 | 2,002 | 2,967 | — | 1960's / 1970's / 1995 / 2000 | 05/13/2016 | ||||||||||||||||||||||||||||||
Pleasanton | Pleasanton, CA | 100 | % | — | 944 | 448 | 1,392 | 58 | 944 | 506 | 1,450 | (205 | ) | 1981 | 09/01/2011 | ||||||||||||||||||||||||||||||
North Wakefield Drive | Newark, DE | 100 | % | — | 1,662 | 10,166 | 11,828 | — | 1,662 | 10,166 | 11,828 | (3,812 | ) | 1996 | 09/01/2011 | ||||||||||||||||||||||||||||||
Bridgewater | Bridgewater, NJ | 100 | % | — | 1,493 | 2,530 | 4,023 | 1,760 | 1,493 | 4,290 | 5,783 | (927 | ) | 1974 / 1980 | 09/01/2011 | ||||||||||||||||||||||||||||||
Dallas | Dallas, NC | 100 | % | — | 110 | 379 | 489 | (264 | ) | 78 | 147 | 225 | — | 1972 | 09/01/2011 | ||||||||||||||||||||||||||||||
Farmville | Farmville, NC | 100 | % | — | 112 | 892 | 1,004 | (429 | ) | 101 | 474 | 575 | — | 1965 | 09/01/2011 | ||||||||||||||||||||||||||||||
Tryon Main Office | Tryon, NC | 100 | % | — | 87 | 1,067 | 1,154 | (604 | ) | 64 | 486 | 550 | — | 1966 | 09/01/2011 | ||||||||||||||||||||||||||||||
Harborside | Jersey City, NJ | 100 | % | — | — | — | — | — | — | — | — | — | 2002 | 09/01/2011 | |||||||||||||||||||||||||||||||
Downtown St. Petersburg | St. Petersburg, FL | 100 | % | — | — | — | — | — | — | — | — | — | 1912 / 1981 | 09/01/2011 | |||||||||||||||||||||||||||||||
Citizens - Clinton East Main | Clinton, CT | 100 | % | — | 172 | 641 | 813 | — | 172 | 641 | 813 | (270 | ) | 1972 | 10/24/2011 | ||||||||||||||||||||||||||||||
Citizens - Railroad Avenue | Plainfield, CT | 100 | % | — | 232 | 426 | 658 | (116 | ) | 232 | 310 | 542 | (80 | ) | 1980 | 10/24/2011 | |||||||||||||||||||||||||||||
Citizens - Shunpike Road | Cromwell, CT | 100 | % | — | 281 | 484 | 765 | (49 | ) | 281 | 435 | 716 | (156 | ) | 1976 | 10/24/2011 | |||||||||||||||||||||||||||||
Citizens - Columbia Road | Dorchester, MA | 100 | % | — | 370 | 1,433 | 1,803 | (788 | ) | 309 | 706 | 1,015 | (51 | ) | 1930 | 10/24/2011 | |||||||||||||||||||||||||||||
Citizens - East Boston Square | East Boston, MA | 100 | % | — | 192 | 785 | 977 | — | 192 | 785 | 977 | (335 | ) | 1928 | 10/24/2011 | ||||||||||||||||||||||||||||||
Citizens - Rogers Road | Gloucester, MA | 100 | % | — | 251 | 1,174 | 1,425 | (904 | ) | 132 | 389 | 521 | (38 | ) | 1950 | 10/24/2011 | |||||||||||||||||||||||||||||
Citizens - Union Sq - Somerville | Somerville, MA | 100 | % | — | 647 | 952 | 1,599 | (13 | ) | 647 | 939 | 1,586 | (394 | ) | 1970 | 10/24/2011 | |||||||||||||||||||||||||||||
Citizens - 18 Mile Road | Sterling Height, MI | 100 | % | — | 207 | 835 | 1,042 | — | 207 | 835 | 1,042 | (329 | ) | 1977 | 10/24/2011 | ||||||||||||||||||||||||||||||
Citizens - Allen Road - Southgate | Southgate, MI | 100 | % | — | 422 | 2,949 | 3,371 | (2,954 | ) | 75 | 342 | 417 | (9 | ) | 1973 | 10/24/2011 | |||||||||||||||||||||||||||||
Citizens - Ford Road Heights | Dearborn Heights, MI | 100 | % | — | 494 | 1,130 | 1,624 | (1,092 | ) | 210 | 322 | 532 | (11 | ) | 1981 | 10/24/2011 | |||||||||||||||||||||||||||||
Citizens - Grand River | Detroit, MI | 100 | % | — | 52 | 611 | 663 | (149 | ) | 52 | 462 | 514 | (159 | ) | 1920 | 10/24/2011 | |||||||||||||||||||||||||||||
Citizens - Greater Mack | St. Clair Shores, MI | 100 | % | — | 626 | 1,150 | 1,776 | (159 | ) | 626 | 991 | 1,617 | (355 | ) | 1980 | 10/24/2011 | |||||||||||||||||||||||||||||
Citizens - Grosse Pointe Woods | Grosse Pointe Woods, MI | 100 | % | — | 249 | 572 | 821 | (440 | ) | 161 | 220 | 381 | (17 | ) | 1955 | 10/24/2011 | |||||||||||||||||||||||||||||
Citizens - Joy Road | Detroit, MI | 100 | % | — | 66 | 591 | 657 | (561 | ) | 16 | 80 | 96 | (6 | ) | 1957 | 10/24/2011 | |||||||||||||||||||||||||||||
Citizens - Main Street - Belleville | Belleville, MI | 100 | % | — | 181 | 1,228 | 1,409 | (1,176 | ) | 37 | 196 | 233 | (9 | ) | 1998 | 10/24/2011 | |||||||||||||||||||||||||||||
F-48
KBS REAL ESTATE INVESTMENT TRUST, INC.
SCHEDULE III
REAL ESTATE ASSETS AND ACCUMULATED DEPRECIATION AND AMORTIZATION (CONTINUED)
December 31, 2016
(dollar amounts in thousands)
Initial Cost to Company | Gross Amount at which Carried at Close of Period | |||||||||||||||||||||||||||||||||||||||||||
Description | Location | Ownership Percent | Encumbrances | Land | Building and Improvements(1) | Total | Cost Capitalized Subsequent to Acquisition(2) | Land | Building and Improvements(1) | Total (3) | Accumulated Depreciation and Amortization | Original Date of Construction | Date Acquired | |||||||||||||||||||||||||||||||
Citizens - North Adams | Rochester, MI | 100 | % | — | $ | 227 | $ | 1,417 | $ | 1,644 | $ | — | $ | 227 | $ | 1,417 | $ | 1,644 | $ | (502 | ) | 1976 | 10/24/2011 | |||||||||||||||||||||
Citizens - Plymouth Road - Detroit | Detroit, MI | 100 | % | — | 66 | 539 | 605 | (480 | ) | 25 | 100 | 125 | — | Early 1960’s | 10/24/2011 | |||||||||||||||||||||||||||||
Citizens - Roseville | Roseville, MI | 100 | % | — | 347 | 906 | 1,253 | (611 | ) | 251 | 391 | 642 | — | 1981 | 10/24/2011 | |||||||||||||||||||||||||||||
Citizens - Schoenherr | Warren, MI | 100 | % | — | 145 | 1,088 | 1,233 | (881 | ) | 59 | 293 | 352 | (25 | ) | 1979 | 10/24/2011 | ||||||||||||||||||||||||||||
Citizens - West Fort Street | Southgate, MI | 100 | % | — | 122 | 1,315 | 1,437 | (622 | ) | 92 | 723 | 815 | — | 1984 | 10/24/2011 | |||||||||||||||||||||||||||||
Citizens - West Maple | Bloomfield Hills, MI | 100 | % | — | 317 | 1,675 | 1,992 | — | 317 | 1,675 | 1,992 | (727 | ) | 1962 | 10/24/2011 | |||||||||||||||||||||||||||||
Citizens - Barrington | Barrington, NH | 100 | % | — | 176 | 335 | 511 | (139 | ) | 176 | 196 | 372 | (34 | ) | 1985 | 10/24/2011 | ||||||||||||||||||||||||||||
Citizens - Coliseum Avenue | Nashua, NH | 100 | % | — | 206 | 655 | 861 | (91 | ) | 206 | 564 | 770 | (166 | ) | 1981 | 10/24/2011 | ||||||||||||||||||||||||||||
Citizens - One Constitution Way | Somersworth, NH | 100 | % | — | 135 | 1,013 | 1,148 | (32 | ) | 135 | 981 | 1,116 | (266 | ) | 1985 | 10/24/2011 | ||||||||||||||||||||||||||||
Citizens - Endicott | Endicott, NY | 100 | % | — | 117 | 2,001 | 2,118 | (1,967 | ) | 14 | 137 | 151 | (7 | ) | 1927 | 10/24/2011 | ||||||||||||||||||||||||||||
Citizens - Glens Falls | Glens Falls, NY | 100 | % | — | 167 | 1,234 | 1,401 | (870 | ) | 95 | 436 | 531 | (44 | ) | 1956 | 10/24/2011 | ||||||||||||||||||||||||||||
Citizens - Meadow Avenue | Newburgh, NY | 100 | % | — | 364 | 1,232 | 1,596 | (133 | ) | 364 | 1,099 | 1,463 | (375 | ) | 1972 | 10/24/2011 | ||||||||||||||||||||||||||||
Citizens - Dover Center Road | Bay Village, OH | 100 | % | — | 196 | 484 | 680 | (42 | ) | 196 | 442 | 638 | (196 | ) | 1967 | 10/24/2011 | ||||||||||||||||||||||||||||
Citizens - East Street - Euclid | Euclid, OH | 100 | % | — | 86 | 708 | 794 | — | 86 | 708 | 794 | (259 | ) | 1975 | 10/24/2011 | |||||||||||||||||||||||||||||
Citizens - Fairview Park | Fairview Park, OH | 100 | % | — | 289 | 374 | 663 | (43 | ) | 289 | 331 | 620 | (155 | ) | 1966 | 10/24/2011 | ||||||||||||||||||||||||||||
Citizens - Girard | Girard, OH | 100 | % | — | 88 | 1,091 | 1,179 | (1,094 | ) | 9 | 76 | 85 | (2 | ) | 1977 / 1983 | 10/24/2011 | ||||||||||||||||||||||||||||
Citizens - Lake Shore Boulevard | Euclid, OH | 100 | % | — | 234 | 622 | 856 | (177 | ) | 234 | 445 | 679 | (153 | ) | 1971 | 10/24/2011 | ||||||||||||||||||||||||||||
Citizens - Lorain Road | North Olmsted, OH | 100 | % | — | 254 | 599 | 853 | — | 254 | 599 | 853 | (195 | ) | 1981 | 10/24/2011 | |||||||||||||||||||||||||||||
Citizens - Mentor Avenue | Mentor, OH | 100 | % | — | 690 | 1,283 | 1,973 | (1,667 | ) | 155 | 151 | 306 | — | 1958 | 10/24/2011 | |||||||||||||||||||||||||||||
Citizens - Navarre Avenue | Oregon, OH | 100 | % | — | 107 | 1,015 | 1,122 | — | 107 | 1,015 | 1,122 | (398 | ) | 1980 | 10/24/2011 | |||||||||||||||||||||||||||||
Citizens - Richmond Heights | Richmond Heights, OH | 100 | % | — | 353 | 683 | 1,036 | (324 | ) | 325 | 387 | 712 | — | 2002 | 10/24/2011 | |||||||||||||||||||||||||||||
Citizens - Toledo Main | Toledo, OH | 100 | % | — | 83 | 664 | 747 | (136 | ) | 83 | 528 | 611 | (182 | ) | 1952 | 10/24/2011 | ||||||||||||||||||||||||||||
Citizens - University Heights | University Heights, OH | 100 | % | — | 426 | 505 | 931 | (408 | ) | 288 | 235 | 523 | (8 | ) | 1989 / 2002 | 10/24/2011 | ||||||||||||||||||||||||||||
Citizens - Westlake | Westlake, OH | 100 | % | — | 283 | 596 | 879 | (156 | ) | 283 | 440 | 723 | (76 | ) | 1981 | 10/24/2011 | ||||||||||||||||||||||||||||
Citizens - Burgettstown | Burgettstown, PA | 100 | % | — | 68 | 1,165 | 1,233 | (1,035 | ) | 18 | 180 | 198 | — | 1921 | 10/24/2011 | |||||||||||||||||||||||||||||
Citizens - Zelienople | Zelienople, PA | 100 | % | — | 26 | 1,054 | 1,080 | (745 | ) | 13 | 322 | 335 | (20 | ) | 1920 / 1971 | 10/24/2011 | ||||||||||||||||||||||||||||
Citizens - Portsmouth East Main | Portsmouth, RI | 100 | % | — | 446 | 518 | 964 | (68 | ) | 446 | 450 | 896 | (183 | ) | 1979 | 10/24/2011 | ||||||||||||||||||||||||||||
Citizens - Pearl St - Essex Junction | Essex Junction, VT | 100 | % | — | 170 | 415 | 585 | (27 | ) | 170 | 388 | 558 | (118 | ) | 1986 | 10/24/2011 | ||||||||||||||||||||||||||||
Total Properties Held for Investment | $ | 99,851 | $ | 448,597 | $ | 548,448 | $ | (123,897 | ) | $ | 72,985 | $ | 351,566 | $ | 424,551 | $ | (62,932 | ) | ||||||||||||||||||||||||||
F-49
KBS REAL ESTATE INVESTMENT TRUST, INC.
SCHEDULE III
REAL ESTATE ASSETS AND ACCUMULATED DEPRECIATION AND AMORTIZATION (CONTINUED)
December 31, 2016
(dollar amounts in thousands)
Initial Cost to Company | Gross Amount at which Carried at Close of Period | |||||||||||||||||||||||||||||||||||||||||||
Description | Location | Ownership Percent | Encumbrances | Land | Building and Improvements(1) | Total | Cost Capitalized Subsequent to Acquisition(2) | Land | Building and Improvements(1) | Total (3) | Accumulated Depreciation and Amortization | Original Date of Construction | Date Acquired | |||||||||||||||||||||||||||||||
Properties Held for Sale | ||||||||||||||||||||||||||||||||||||||||||||
Santa Fe-Metro Bank - Main Bldg | Santa Fe, NM | 100 | % | — | — | 1,646 | 1,646 | (115 | ) | — | 1,531 | 1,531 | (534 | ) | 1972 / 1985 | 09/01/2011 | ||||||||||||||||||||||||||||
Park Avenue | Wantagh, NY | 100 | % | — | 213 | 360 | 573 | (42 | ) | 213 | 318 | 531 | (144 | ) | 1953 | 09/01/2011 | ||||||||||||||||||||||||||||
Citizens - Main Street - Beacon | Beacon, NY | 100 | % | — | 440 | 1,247 | 1,687 | (639 | ) | 394 | 654 | 1,048 | (30 | ) | 1955 | 10/24/2011 | ||||||||||||||||||||||||||||
Bay - Fair | San Leandro, CA | 100 | % | — | 913 | 594 | 1,507 | (90 | ) | 913 | 504 | 1,417 | (249 | ) | 1981 | 09/01/2011 | ||||||||||||||||||||||||||||
Bayshore - Main Building | Bradentown, FL | 100 | % | — | 391 | 445 | 836 | 89 | 391 | 534 | 925 | (230 | ) | 1971 | 09/01/2011 | |||||||||||||||||||||||||||||
Crystal River - Main Building | Crystal River, FL | 100 | % | — | 119 | 329 | 448 | 10 | 119 | 339 | 458 | (153 | ) | 1970 | 09/01/2011 | |||||||||||||||||||||||||||||
Midway - Main Building | Miami, FL | 100 | % | — | 1,401 | 826 | 2,227 | (492 | ) | 1,351 | 384 | 1,735 | (31 | ) | 1974 | 09/01/2011 | ||||||||||||||||||||||||||||
West Sunrise - Main Building | Plantation, FL | 100 | % | — | 1,060 | 1,146 | 2,206 | (1,474 | ) | 525 | 207 | 732 | (16 | ) | 1976 | 09/01/2011 | ||||||||||||||||||||||||||||
Bergenline Avenue | Union City, NJ | 100 | % | — | 179 | 370 | 549 | (179 | ) | 179 | 191 | 370 | (132 | ) | 1970 | 09/01/2011 | ||||||||||||||||||||||||||||
Pennsauken | Pennsauken, NJ | 100 | % | — | 750 | 794 | 1,544 | (138 | ) | 750 | 656 | 1,406 | (365 | ) | 1966 | 09/01/2011 | ||||||||||||||||||||||||||||
Jamaica | Jamaica, NY | 100 | % | — | 185 | 953 | 1,138 | (5 | ) | 185 | 948 | 1,133 | (260 | ) | 1960 / 2001 | 09/01/2011 | ||||||||||||||||||||||||||||
Gresham - Main Building | Gresham, OR | 100 | % | — | 374 | 668 | 1,042 | (252 | ) | 374 | 416 | 790 | (235 | ) | 1978 | 09/01/2011 | ||||||||||||||||||||||||||||
Blair Mill Road | Horsham, PA | 100 | % | — | 1,171 | 1,794 | 2,965 | 3,155 | 1,171 | 4,949 | 6,120 | (2,126 | ) | 1985 | 09/01/2011 | |||||||||||||||||||||||||||||
Camas - Main Building | Camas, WA | 100 | % | — | 386 | 243 | 629 | (39 | ) | 386 | 204 | 590 | (106 | ) | 1951 | 09/01/2011 | ||||||||||||||||||||||||||||
Edmonds - Main Building | Edmonds, WA | 100 | % | — | 367 | 348 | 715 | 27 | 367 | 375 | 742 | (219 | ) | 1956 | 09/01/2011 | |||||||||||||||||||||||||||||
Greenwood - Main Building | Seattle, WA | 100 | % | — | 104 | 221 | 325 | 12 | 104 | 233 | 337 | (132 | ) | 1948 | 09/01/2011 | |||||||||||||||||||||||||||||
Daytona Beach Spdwy - Main Bldg | Daytona Beach, FL | 100 | % | — | 1,060 | 638 | 1,698 | (53 | ) | 1,060 | 585 | 1,645 | (341 | ) | 1974 | 09/01/2011 | ||||||||||||||||||||||||||||
Redmond - Main Building | Redmond, OR | 100 | % | — | 50 | 206 | 256 | (8 | ) | 50 | 198 | 248 | (90 | ) | 1925 / 1982 | 09/01/2011 | ||||||||||||||||||||||||||||
Burlington Main Office | Burlington, NC | 100 | % | — | 213 | 1,220 | 1,433 | (1,000 | ) | 175 | 258 | 433 | (5 | ) | 1982 | 09/01/2011 | ||||||||||||||||||||||||||||
Carolina Beach | Carolina Beach, NC | 100 | % | — | 194 | 1,045 | 1,239 | 1 | 195 | 1,045 | 1,240 | (415 | ) | 1971 | 09/01/2011 | |||||||||||||||||||||||||||||
Elizabethtown Main | Elizabethtown, NC | 100 | % | — | 71 | 592 | 663 | (32 | ) | 71 | 560 | 631 | (210 | ) | 1962 | 09/01/2011 | ||||||||||||||||||||||||||||
Fayetteville Dwntown | Fayetteville, NC | 100 | % | — | 216 | 452 | 668 | (407 | ) | 146 | 115 | 261 | (3 | ) | 1980 | 09/01/2011 | ||||||||||||||||||||||||||||
Kenansville | Kenansville, NC | 100 | % | — | 90 | 463 | 553 | (48 | ) | 90 | 415 | 505 | (156 | ) | 1970 | 09/01/2011 | ||||||||||||||||||||||||||||
Kinston Main Office | Kinston, NC | 100 | % | — | 136 | 1,121 | 1,257 | (42 | ) | 136 | 1,079 | 1,215 | (338 | ) | 1982 | 09/01/2011 | ||||||||||||||||||||||||||||
Marion Main Office | Marion, NC | 100 | % | — | 232 | 1,341 | 1,573 | — | 232 | 1,341 | 1,573 | (429 | ) | 1982 | 09/01/2011 | |||||||||||||||||||||||||||||
Mt Olive Main Office | Mount Olive, NC | 100 | % | — | 119 | 404 | 523 | (77 | ) | 119 | 327 | 446 | (126 | ) | 1962 | 09/01/2011 | ||||||||||||||||||||||||||||
North Asheville | Asheville, NC | 100 | % | — | 73 | 430 | 503 | — | 73 | 430 | 503 | (178 | ) | 1973 | 09/01/2011 | |||||||||||||||||||||||||||||
Pleasant Garden | Pleasant Garden, NC | 100 | % | — | 97 | 235 | 332 | (147 | ) | 97 | 88 | 185 | (31 | ) | 1935 | 09/01/2011 | ||||||||||||||||||||||||||||
Reidsville Main Office | Reidsville, NC | 100 | % | — | 160 | 349 | 509 | (348 | ) | 123 | 38 | 161 | — | 1900 | 09/01/2011 | |||||||||||||||||||||||||||||
Spruce Pine Main | Spruce Pine, NC | 100 | % | — | 172 | 953 | 1,125 | (1,051 | ) | 83 | (9 | ) | 74 | (3 | ) | 1930 | 09/01/2011 | |||||||||||||||||||||||||||
Total Properties Held for Sale | $ | 10,936 | $ | 21,433 | $ | 32,369 | $ | (3,384 | ) | $ | 10,072 | $ | 18,913 | $ | 28,985 | $ | (7,287 | ) | ||||||||||||||||||||||||||
TOTAL | $ | 110,787 | $ | 470,030 | $ | 580,817 | $ | (127,281 | ) | $ | 83,057 | $ | 370,479 | $ | 453,536 | $ | (70,219 | ) | ||||||||||||||||||||||||||
F-50
KBS REAL ESTATE INVESTMENT TRUST, INC.
SCHEDULE III
REAL ESTATE ASSETS AND ACCUMULATED DEPRECIATION AND AMORTIZATION (CONTINUED)
December 31, 2016
(dollar amounts in thousands)
____________________
(1) Building and improvements include tenant origination and absorption costs.
(2) Costs capitalized subsequent to acquisition is net of impairments and write-offs of fully depreciated/amortized assets.
(3) The aggregate cost of real estate for federal income tax purposes was approximately $652.3 million (unaudited) as of December 31, 2016.
(4) On May 13, 2016, the Company received a deed-in-lieu of foreclosure in satisfaction of all amounts due to it under its investment in the Lawrence Village Plaza Loan Origination and received title to the collateral that secured the loan. See Note 5, “Real Estate Loans Receivable.”
F-51
KBS REAL ESTATE INVESTMENT TRUST, INC.
SCHEDULE III
REAL ESTATE ASSETS AND ACCUMULATED DEPRECIATION AND AMORTIZATION (CONTINUED)
December 31, 2016
(dollar amounts in thousands)
2016 | 2015 | 2014 | ||||||||||
Real Estate (1) | ||||||||||||
Balance at the beginning of the year | $ | 1,023,963 | $ | 1,311,919 | $ | 1,460,838 | ||||||
Acquisition | — | 2,297 | — | |||||||||
Improvements | 20,735 | 36,816 | 33,046 | |||||||||
Write-off of fully depreciated and fully amortized assets | (7,374 | ) | (18,169 | ) | (31,954 | ) | ||||||
Loss due to property damages | (1,033 | ) | — | — | ||||||||
Impairments | (60,276 | ) | (85,255 | ) | (18,902 | ) | ||||||
Sales | (527,856 | ) | (223,645 | ) | (94,562 | ) | ||||||
Foreclosures | 5,377 | — | (36,547 | ) | ||||||||
Balance at the end of the year | $ | 453,536 | $ | 1,023,963 | $ | 1,311,919 | ||||||
Accumulated depreciation and amortization (1) | ||||||||||||
Balance at the beginning of the year | $ | 163,083 | $ | 193,408 | $ | 182,039 | ||||||
Depreciation and amortization expense | 33,099 | 55,995 | 67,848 | |||||||||
Write-off of fully depreciated and fully amortized assets | (7,374 | ) | (18,169 | ) | (31,954 | ) | ||||||
Impairment | (27,380 | ) | (38,916 | ) | (8,885 | ) | ||||||
Sales | (91,209 | ) | (29,235 | ) | (10,973 | ) | ||||||
Foreclosures | — | — | (4,667 | ) | ||||||||
Balance at the end of the year | $ | 70,219 | $ | 163,083 | $ | 193,408 | ||||||
____________________
(1) Amounts include properties held for sale.
F-52
SIGNATURES
Pursuant to the requirements of Section 13 or 15(d) of the Securities Exchange Act of 1934, the registrant has duly caused this report to be signed on its behalf by the undersigned, thereunto duly authorized, in the City of Newport Beach, State of California, on March 28, 2017.
KBS REAL ESTATE INVESTMENT TRUST, INC. | |||
By: | /s/ Charles J. Schreiber, Jr. | ||
Charles J. Schreiber, Jr. | |||
Chairman of the Board, Chief Executive Officer and Director | |||
(principal executive officer) | |||
Pursuant to the requirements of the Securities Exchange Act of 1934, this report has been signed below by the following persons on behalf of the registrant and in the capacities and on the dates indicated:
Name | Title | Date | ||
/s/ CHARLES J. SCHREIBER, JR. | Chairman of the Board, Chief Executive Officer and Director (principal executive officer) | March 28, 2017 | ||
Charles J. Schreiber, Jr. | ||||
/s/ JEFFREY K. WALDVOGEL | Chief Financial Officer (principal financial officer) | March 28, 2017 | ||
Jeffrey K. Waldvogel | ||||
/s/ PETER MCMILLAN III | Executive Vice President, Treasurer, Secretary and Director | March 28, 2017 | ||
Peter McMillan III | ||||
/s/ STACIE K. YAMANE | Chief Accounting Officer (principal accounting officer) | March 28, 2017 | ||
Stacie K. Yamane | ||||
/s/ HANK ADLER | Director | March 28, 2017 | ||
Hank Adler | ||||
/s/ BARBARA R. CAMBON | Director | March 28, 2017 | ||
Barbara R. Cambon | ||||
/s/ STUART A. GABRIEL, PH.D. | Director | March 28, 2017 | ||
Stuart A. Gabriel, Ph.D. | ||||