Attached files
Table of Contents
UNITED STATES
SECURITIES AND EXCHANGE COMMISSION
Washington, D. C. 20549
FORM 10-K
(Mark One)
| x | ANNUAL REPORT PURSUANT TO SECTION 13 OR 15(d) OF THE SECURITIES EXCHANGE ACT OF 1934 |
For the fiscal year ended December 31, 2009
OR
| ¨ | TRANSITION REPORT PURSUANT TO SECTION 13 OR 15(d) OF THE SECURITIES EXCHANGE ACT OF 1934 |
For the transition period from to
Commission file number 000-52606
KBS REAL ESTATE INVESTMENT TRUST, INC.
(Exact Name of Registrant as Specified in Its Charter)
| Maryland | 20-2985918 | |
| (State or Other Jurisdiction of Incorporation or Organization) |
(I.R.S. Employer Identification No.) |
| 620 Newport Center Drive, Suite 1300 | ||
| Newport Beach, California | 92660 | |
| (Address of Principal Executive Offices) | (Zip Code) |
(949) 417-6500
(Registrant’s Telephone Number, Including Area Code)
Securities registered pursuant to Section 12(b) of the Act:
| Title of Each Class |
Name of Each Exchange on Which Registered | |
| None | None |
Securities registered pursuant to Section 12(g) of the Act:
Common Stock, $0.01 par value per share
Indicate by check mark if the Registrant is a well-known seasoned issuer, as defined in Rule 405 of the Securities Act. Yes ¨ No þ
Indicate by check mark if the Registrant is not required to file reports pursuant to Section 13 of Section 15(d) of the Act. Yes ¨ No þ
Table of Contents
Indicate by check mark whether the Registrant (1) has filed all reports required to be filed by Section 13 or 15(d) of the Securities Exchange Act of 1934 during the preceding 12 months (or for such shorter period that the registrant was required to file such reports) and (2) has been subject to such filing requirements for the past 90 days. Yes þ No ¨
Indicate by check mark whether the registrant has submitted electronically and posted on its corporate website, if any, every Interactive Data File required to be submitted and posted pursuant to Rule 405 of Regulation S-T (§232.405 of this chapter) during the preceding 12 months (or for such shorter period that the registrant was required to submit and post such files). Yes ¨ No ¨
Indicate by check mark if disclosure of delinquent filers pursuant to Item 405 of Regulation S-K is not contained herein, and will not be contained, to the best of Registrant’s knowledge, in definitive proxy or information statements incorporated by reference in Part III of the Form 10-K or any amendment of this Form 10-K. þ
Indicate by check mark whether the Registrant is a large accelerated filer, an accelerated filer, a non-accelerated filer or a smaller reporting company. See definitions of “large accelerated filer”, “accelerated filer” and “smaller reporting company” in Rule 12b-2 of the Exchange Act. (Check one):
| Large Accelerated Filer | ¨ | Accelerated Filer | ¨ | |||
| Non-Accelerated Filer | þ (Do not check if a smaller reporting company) | Smaller reporting company | ¨ | |||
Indicate by check mark whether the Registrant is a shell company (as defined in rule 12b-2 of the Securities Exchange Act). Yes ¨ No þ
While there is no established market for the Registrant’s shares of common stock, the Registrant has made an initial public offering of its shares of common stock pursuant to a Registration Statement on Form S-11. The Registrant ceased offering shares of common stock in its primary offering on May 30, 2008. The last price paid to acquire a share in the Registrant’s primary public offering was $10.00. On November 20, 2009, the board of directors of the Registrant approved an estimated value per share of the Company’s common stock of $7.17 derived from the estimated value of the Company’s assets less the estimated value of the Company’s liabilities divided by the number of shares outstanding, all as of September 30, 2009.
There were approximately 177,763,018 shares of common stock held by non-affiliates at June 30, 2009, the last business day of the Registrant’s most recently completed second fiscal quarter.
As of March 19, 2010, there were 180,943,686 outstanding shares of common stock of the Registrant.
Documents Incorporated by Reference:
Registrant incorporates by reference in Part III (Items 10, 11, 12, 13 and 14) of this Form 10-K portions of its Definitive Proxy Statement for the 2010 Annual Meeting of Stockholders.
Table of Contents
1
Table of Contents
FORWARD-LOOKING STATEMENTS
Certain statements included in this annual report on Form 10-K are forward-looking statements. Those statements include statements regarding the intent, belief or current expectations of KBS Real Estate Investment Trust, Inc. and members of our management team, as well as the assumptions on which such statements are based, and generally are identified by the use of words such as “may,” “will,” “seeks,” “anticipates,” “believes,” “estimates,” “expects,” “plans,” “intends,” “should” or similar expressions. Actual results may differ materially from those contemplated by such forward-looking statements. Further, forward-looking statements speak only as of the date they are made, and we undertake no obligation to update or revise forward-looking statements to reflect changed assumptions, the occurrence of unanticipated events or changes to future operating results over time, unless required by law.
The following are some of the risks and uncertainties, although not all risks and uncertainties, that could cause our actual results to differ materially from those presented in our forward-looking statements:
| • | Both we and our advisor have limited operating histories. This inexperience makes our future performance difficult to predict. |
| • | All of our executive officers, some of our directors and other key real estate and debt finance professionals are also officers, directors, managers, key professionals and/or holders of a direct or indirect controlling interest in our advisor, our dealer manager and other KBS-affiliated entities. As a result, they face conflicts of interest, including significant conflicts created by our advisor’s compensation arrangements with us and other KBS-advised programs and investors and conflicts in allocating time among us and these other programs and investors. These conflicts could result in unanticipated actions. |
| • | Because investment opportunities that are suitable for us may also be suitable for other KBS-advised programs or investors, our advisor and its affiliates face conflicts of interest relating to the purchase of properties and other investments and such conflicts may not be resolved in our favor, meaning that we could invest in less attractive assets, which could reduce the investment return to our stockholders. |
| • | We depend on tenants for our revenue and, accordingly, our revenue is dependent upon the success and economic viability of our tenants. Revenues from our properties could decrease due to a reduction in tenants (caused by factors including, but not limited to, tenant defaults, tenant insolvency, early termination of tenant leases and non-renewal of existing tenant leases) and/or lower rental rates, making it more difficult for us to meet our debt service obligations and limiting our ability to pay distributions to our stockholders. |
| • | Ongoing credit market disruptions have caused the spreads on prospective debt financing to increase. This could cause the costs and terms of new financings to be less attractive than the terms of our current indebtedness and increase the cost of our variable rate debt. In addition, we may not be able to refinance our existing indebtedness or to obtain additional debt financing on attractive terms. If we are not able to refinance existing indebtedness on attractive terms at its maturity, we may be forced to dispose of some of our assets. |
| • | Our investments in real estate and mortgage, mezzanine, bridge and other loans as well as investments in real estate securities may be affected by unfavorable real estate market and general economic conditions, which could decrease the value of those assets and reduce the investment return to our stockholders. Revenues from the properties and other assets directly securing our loan investments and underlying our investments in real estate securities could decrease, making it more difficult for the borrower to meet its payment obligations to us. In addition, decreases in revenues from the properties directly securing our loan investments and underlying our investments in real estate securities could result in decreased valuations for those properties, which could make it difficult for our borrowers to repay or refinance their obligations to us. These factors could make it more difficult for us to meet our debt service obligations and limit our ability to pay distributions to our stockholders. |
| • | Continued disruptions in the financial markets and deteriorating economic conditions could adversely affect the value of our investments. |
| • | Certain of our debt obligations have variable interest rates with interest and related payments that vary with the movement of LIBOR or other indexes. Increases in the indexes could increase the amount of our debt payments and limit our ability to pay distributions to our stockholders. |
2
Table of Contents
| • | Additionally certain of our loan receivable investments are also variable rate with interest rate and related payments that vary with the movement of LIBOR. Decreases in these indexes could decrease the interest income payments received and limit our ability to pay distributions to our stockholders. |
| • | We cannot predict with any certainty how much, if any, of our dividend reinvestment plan proceeds will be available for general corporate purposes, including, but not limited to, the redemption of shares under our share redemption program, the funding of capital expenditures on our real estate investments, the funding of outstanding loan commitments on our real estate loans receivable, or the repayment of debt. If such funds are not available from the dividend reinvestment plan offering, then we may have to use a greater proportion of our cash flow from operations to meet these cash requirements, which would reduce cash available for distributions, and we would continue to be limited in our ability to redeem any shares under our share redemption program. |
All forward-looking statements should be read in light of the risks identified in Part I, Item 1A of this annual report on Form 10-K.
3
Table of Contents
| ITEM 1. | BUSINESS |
Overview
KBS Real Estate Investment Trust, Inc. (the “Company”) is a Maryland corporation that was formed on June 13, 2005 to invest in a diverse portfolio of real estate properties and real estate-related investments. The Company has elected to be taxed as a real estate investment trust (“REIT”) beginning with the taxable year ended December 31, 2006 and it intends to operate in such a manner. As used herein, the terms “we,” “our” and “us” refer to the Company and as required by context, KBS Limited Partnership, a Delaware limited partnership, which we refer to as our “Operating Partnership,” and to their subsidiaries. We own substantially all of our assets and conduct our operations through our Operating Partnership, of which we are the sole general partner. Subject to certain restrictions and limitations, our business is managed by KBS Capital Advisors LLC (“KBS Capital Advisors”), our external advisor, pursuant to an advisory agreement. Our advisor owns 20,000 shares of our common stock. We have no paid employees.
On January 27, 2006, we launched our initial public offering of up to 200,000,000 shares of common stock in our primary offering and 80,000,000 shares of common stock under our dividend reinvestment plan. We ceased offering shares of common stock in our primary offering on May 30, 2008. We continue to issue shares of common stock under our dividend reinvestment plan. We had sold 171,109,494 shares in our primary offering for gross offering proceeds of $1.7 billion and, as of December 31, 2009, we had sold 13,760,275 shares under our dividend reinvestment plan for gross offering proceeds of $129.5 million.
As of December 31, 2009, we owned 65 real estate properties, one master lease, 17 real estate loans receivable, two investments in securities directly or indirectly backed by commercial mortgage loans, and a preferred membership interest in a real estate joint venture.
Objectives and Strategies
Our primary investment objectives are:
| • | to provide our stockholders with attractive and stable cash distributions; and |
| • | to preserve and return our stockholders’ capital contributions. |
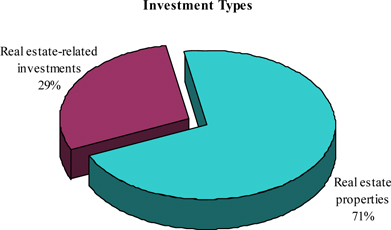
We have sought to achieve these objectives by investing in and managing a diverse portfolio of real estate and real estate-related investments and by acquiring these investments through a combination of equity raised in our initial public offering, debt financing and joint ventures. We have diversified our portfolio by investment type, geographic region, and tenant/borrower base. The following chart illustrates the diversification of our investment portfolio as of December 31, 2009, across investment types based on the gross acquisition price of the investments (including acquisition costs and fees):
4
Table of Contents
Now that we have fully invested the proceeds of our initial public offering, our primary business objectives are: (i) to maintain and, if possible, improve the quality and income-producing ability of our investments; (ii) to position our investments to maximize their value; and (iii) to manage our portfolio to remain compliant with REIT requirements under the Internal Revenue Code of 1986, as amended (the “Code”). We intend to meet these objectives by utilizing the expertise of our advisor to diligently increase the occupancy of our real estate properties while structuring leases that enhance our ability to provide a stable return to our stockholders. We will also, through our advisor, seek to maximize the cash flows from our real estate-related investments, through continuing debt service, restructuring of terms and, if necessary, foreclosure on collateral. All of our business activities are conducted with the intention of remaining compliant with REIT requirements; if we qualify for taxation as a REIT, we will generally not be subject to federal corporate income taxes on our taxable income that is currently distributed to stockholders. This treatment substantially eliminates the “double taxation” at the corporate and stockholder levels that usually results from investment in the stock of a corporation.
Real Estate Portfolio
Real Estate Properties
We have made investments in core properties, which are generally lower risk, existing properties with at least 80% occupancy and minimal near-term lease rollover. To date we have invested in:
| • | office properties — including low-rise, mid-rise and high-rise office buildings and office parks in urban and suburban locations, especially those that are in or near central business districts or have access to transportation; and |
| • | industrial properties — including warehouse and distribution facilities, office/warehouse flex properties, research and development properties and light industrial properties. |
With the exception of one investment in a master lease, we hold fee title in the properties we have acquired, some of which we acquired through a consolidated joint venture. All of our properties are located in the United States.
We generally intend to hold our core properties for four to seven years, which we believe is the optimal period to enable us to capitalize on the potential for increased income and capital appreciation of properties. However, economic and market conditions may influence us to hold our investments for different periods of time.
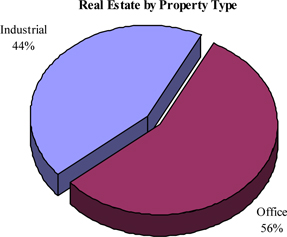
As of December 31, 2009, we owned 65 real estate properties and a master lease with respect to another property. The 65 real estate properties total 21.0 million rentable square feet including 23 office buildings, one light industrial property, three corporate research buildings, two distribution facilities, one industrial portfolio consisting of nine distribution and office/warehouse properties, one office/flex portfolio consisting of four properties and a portfolio of 23 institutional quality industrial properties. We hold these 23 industrial properties and the master lease through a consolidated joint venture. The following chart illustrates the composition of our real estate portfolio as of December 31, 2009 based on gross acquisition price of the investments (including acquisition costs and fees):
5
Table of Contents
As noted above, our real estate property investments are diversified by geographic location with properties in 23 states as shown in the charts below:
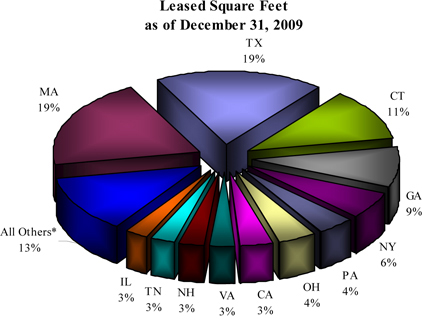
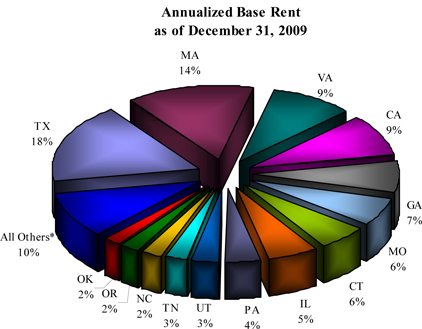
* All others include any state less than 2% of total.
6
Table of Contents
We have a stable and well diversified tenant base and we intend to maintain this diversity and develop long-term relationships with our tenants to limit our exposure to any one tenant or industry. As of December 31, 2009, none of our tenants represent more than 10% of annualized base rent and our top ten tenants represent approximately 25% of our total annualized base rent. The chart below illustrates the diversity of tenant industries in our portfolio based on total annualized base rent:
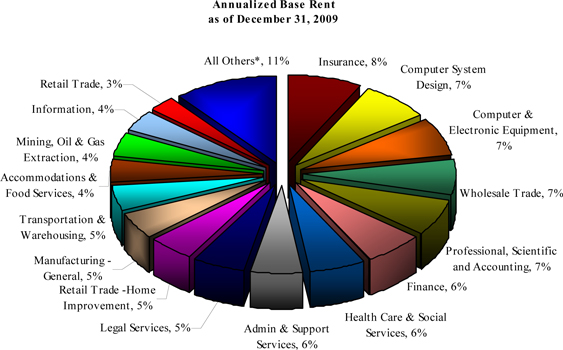
* All others include any industry less than 3% of total.
The total cost of our real estate portfolio as of December 31, 2009 was $2.1 billion. Our real estate portfolio accounted for 79%, 72% and 84% of total revenues for the years ended December 31, 2009, 2008 and 2007, respectively.
7
Table of Contents
Real Estate-Related Investments
We have also invested in real estate-related investments including: (i) mortgage loans; (ii) mezzanine loans; (iii) participations in mortgage and mezzanine loans; and (iv) real estate-related debt securities, such as commercial mortgage-backed securities. We generally intend to hold our real estate-related investments until maturity. However, economic and market conditions may influence the length of time that we hold these investments.
As of December 31, 2009, we owned seven mezzanine real estate loans, two B-Notes, a partial ownership interest in a mezzanine real estate loan, a partial ownership interest in a senior mortgage loan, two loans representing senior subordinated debt of a private REIT and four mortgage loans. We also own two investments in real estate securities directly or indirectly backed by commercial mortgage loans and a preferred membership in a real estate joint venture. The following chart illustrates the composition of our real estate-related investments based on carrying value as of December 31, 2009:
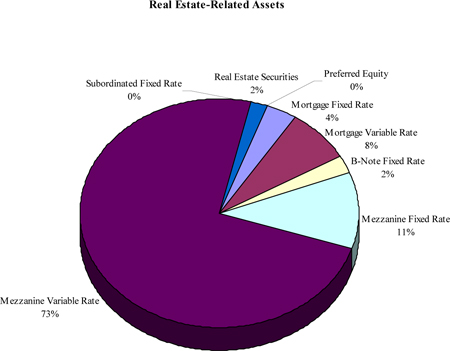
The total cost and book value of our real estate-related investments as of December 31, 2009 were $834.4 million and $678.7 million, respectively, excluding investments that we have foreclosed on and an investment for which we received preferred equity interests in the property owner. Our real estate-related investments accounted for 21%, 28% and 16% of total revenues for the years ended December 31, 2009, 2008 and 2007, respectively. As of December 31, 2009, we had invested in fixed and variable rate loans receivable with book values (net of asset-specific reserves) of $116.7 million and $573.1 million, respectively, and the weighted average annualized effective interest rates on the fixed and variable rate loans receivable were 7.0% and 5.7%, respectively.
Our real estate-related investment portfolio has a concentration in mezzanine loans, which comprise 84% of the carrying value of our real estate-related investment portfolio as of December 31, 2009. At December 31, 2009, we had a concentration of credit risk related to our investment in the GKK Mezzanine Loan, which comprised of 18% of our total assets and 71% of our total investments in loans receivable, after loan loss reserves. During the year ended December 31, 2009, the GKK Mezzanine Loan provided 10% of total revenues and 49% of total interest income from loans receivable.
8
Table of Contents
The GKK Mezzanine Loan was used to finance a portion of Gramercy Capital Corp.’s (“Gramercy”) acquisition of American Financial Realty Trust (“AFR”) that closed on April 1, 2008. The borrowers under the GKK Mezzanine Loan are (i) the wholly owned subsidiary of Gramercy formed to own 100% of the equity interests in AFR (“AFR Owner”), (ii) AFR and (iii) certain subsidiaries of AFR that directly or indirectly own equity interests in the entities that own the AFR portfolio of properties (collectively, AFR Owner, AFR and these subsidiaries are the “Borrower”). On March 9, 2010, the Borrower exercised its option to extend the maturity of this loan to March 2011. On March 15, 2010, Gramercy issued a press release stating that the Gramercy Realty portfolio, which is the division of Gramercy that contains the Borrower, will experience significant rollover, rent step-downs and capital requirements during the next 12 months. As a result, the Gramercy Realty portfolio is expected to generate negative cash flow during the extended term of the GKK Mezzanine Loan. In addition, Gramercy noted in the press release that it has retained EdgeRock Realty Advisors, LLC, an FTI Company, to assist in evaluating strategic alternatives and the potential restructuring of Gramercy Realty’s mortgage and mezzanine debt. We will continue to monitor the performance of the Gramercy Realty portfolio and the performance of the Borrower under the terms of the GKK Mezzanine Loan. While we believe it is unlikely that we will be repaid our principal upon maturity of this loan, we expect to extend the maturity of the loan for a period of time sufficient for Gramercy Realty to stabilize its portfolio. The GKK Mezzanine Loan is subject to repurchase agreements totaling $280.6 million as of December 31, 2009. These repurchase agreements mature on March 9, 2011. KBS Real Estate Investment Trust, Inc. is a guarantor of these repurchase agreements.
Financing Objectives
We financed the majority of our real estate acquisitions with a combination of the proceeds we received from our initial public offering and debt. In addition, we purchased certain real estate-related investments with a combination of the proceeds we received from our initial public offering and repurchase financing. Debt financing was used to increase the amounts available for investment and to increase overall investment yields to us and our stockholders. As of December 31, 2009, the weighted-average interest rate on our debt was 3.62%.
We borrow funds at a combination of fixed and variable rates; at December 31, 2009, we had approximately $534.5 million and $970.2 million of fixed and variable rate debt outstanding, respectively. Of the variable rate debt outstanding, approximately $205.7 million was effectively fixed through the use of interest rate swap agreements. In addition, we have variable rate loans receivable with total aggregate outstanding principal balances of $581.3 million that, when interest rate indices such as LIBOR increase, provide income to offset increases in interest expense on variable rate debt. The weighted-average interest rates of our fixed rate debt and variable rate debt at December 31, 2009 were 5.74% and 2.45%, respectively.
We have spread the maturity dates of our debt, including notes payable and repurchase agreements, to minimize maturity and refinance risk in our portfolio. In addition, a majority of our debt allows us to extend the maturity dates, subject to certain conditions. Although we believe we will satisfy the conditions to extend the maturity of our debt obligations, we can give no assurance in this regard. The following table shows the contractual and fully extended maturities of our debt as of December 31, 2009:
| Current Maturity | Fully Extended Maturity | |||||||||||||||||
| Notes Payable | Repurchase Agreements | Total | Notes Payable | Repurchase Agreements | Total | |||||||||||||
| 2010 |
$ | 478,478 | $ | — | $ | 478,478 | $ | 41,000 | $ | — | $ | 41,000 | ||||||
| 2011 |
142,217 | 280,583 | 422,800 | 39,718 | 280,583 | 320,301 | ||||||||||||
| 2012 |
267,408 | — | 267,408 | 602,969 | — | 602,969 | ||||||||||||
| 2013 |
103,142 | 6,691 | 109,833 | 148,842 | — | 148,842 | ||||||||||||
| 2014 |
146,001 | — | 146,001 | 304,717 | 6,691 | 311,408 | ||||||||||||
| Thereafter |
80,200 | — | 80,200 | 80,200 | — | 80,200 | ||||||||||||
| $ | 1,217,446 | $ | 287,274 | $ | 1,504,720 | $ | 1,217,446 | $ | 287,274 | $ | 1,504,720 | |||||||
Our charter limits our borrowings to 75% of the cost (before deducting depreciation or other noncash reserves) of all of our tangible assets; however, we may exceed that limit if the majority of the conflicts committee approves each borrowing in excess of our charter limitation and we disclose such borrowings to our stockholders in our next quarterly report with an explanation from the conflicts committee of the justification for the excess borrowing. We did not exceed our charter limitation on borrowings during any quarter of 2009. Our target leverage is approximately 50% of the cost of our tangible assets (before deducting depreciation or other noncash reserves). As of December 31, 2009, our borrowings were approximately 52% and 55% of the cost (before depreciation or other noncash reserves) and book value (before depreciation) of our tangible assets, respectively.
9
Table of Contents
Market Outlook – Real Estate and Real Estate Finance Markets
During 2008 and 2009, significant and widespread concerns about credit risk and access to capital have been present in the global financial markets. Economies throughout the world have experienced substantially increased unemployment, sagging consumer confidence and a downturn in economic activity. In addition, the failure (and near failure) of several large financial institutions and the failures and expectations of additional failures of smaller financial institutions has led to increased levels of uncertainty and volatility in the financial markets and a continued skepticism in the general business climate.
As a result of the decline in general economic conditions, the U.S. commercial real estate industry has been experiencing deteriorating fundamentals across all major property types and in most geographic markets. In general, tenant defaults are on the rise, rental rates are falling, and demand for commercial real estate space in most markets is still contracting. These trends have created a highly competitive leasing environment that has resulted in downward pressure on both occupancy and rental rates, resulting in leasing incentives becoming more common. Mortgage delinquencies and defaults have trended upward, with many industry analysts predicting significant credit defaults, foreclosures and capital losses still to come.
Currently, benchmark interest rates, such as LIBOR, are near historic lows, allowing some borrowers with variable rate real estate loans to continue making debt service payments even as the properties securing these loans experience decreased occupancy and lower rental rates. These low rates have benefitted borrowers with floating rate debt who have experienced lower revenues due to decreased occupancy or lower rental rates. Low short-term rates have allowed them to meet their debt obligations but the borrowers would not meet the current underwriting requirements needed to refinance this debt today. As these loans near maturity, borrowers will find it increasingly difficult to refinance these loans in the current underwriting environment.
Additionally, overall transaction volume for real estate acquisitions has declined dramatically across all property types. Lack of available credit and poor investor confidence have translated into generally declining real estate values and a corresponding rise in required investment returns and capitalization rates. Although many owners of real estate prefer not to be sellers in a declining market, the tight credit conditions and increased refinancing risk may force an increasing number of real property owners into distressed sales, or to otherwise consider liquidating their holdings in an effort to enhance liquidity on their own balance sheet. Following a prolonged period of inactivity, transaction activity has slowly increased and some measure of liquidity has began to make its way into the market; however, the volume is well below that seen just 18 months ago.
From a financing perspective, severe dislocations and liquidity disruptions in the credit markets in late 2008 and early 2009 impacted both the cost and availability of commercial real estate debt. The commercial mortgage backed securities (“CMBS”) market, formerly a significant source of liquidity and debt capital, was inactive for over a year and left a void in the market for long-term, affordable, fixed rate debt. This void has been partially filled by portfolio lenders such as insurance companies, but at very different terms than were available in the past five years. These remaining lenders have generally increased credit spreads, lowered the amount of available proceeds, required recourse security and credit enhancements, and otherwise tightened underwriting standards, while simultaneously limiting lending to existing relationships with borrowers that invest in high quality assets in top tier markets. In addition, lenders have limited the amount of financing available to existing relationships in an effort to manage capital allocations and credit risk.
Recently, new CMBS issuances and increased trading of legacy CMBS, both of which were spurred to varying degrees by the government’s Term Asset-Backed Securities Loan Facility program (“TALF”), coupled with the increased volume and relatively low cost of debt issuances over the past 12 months by public REITs has led many to believe that commercial real estate lending will be revived as the market’s appetite for risk slowly returns. Leasing activity in some markets has shown gradual improvement and the CMBS market has had success in issuing new transactions with attractive financing terms, creating a tempered optimism in the commercial real estate market. It is important to remember that these trends have only recently begun and an improvement in one aspect of the market does not provide an indication of a general market recovery or provide any indication of the duration of the existing downturn, or the speed of any expected recovery.
10
Table of Contents
Despite certain recent positive economic indicators such as an improved stock market performance, and improved access to capital for some companies, the aforementioned economic conditions have sustained the ongoing global recession. Global government interventions in the banking system and the persistence of a highly expansionary monetary policy by the U.S. Treasury have introduced additional complexity and uncertainty to the markets. The U.S. government is currently assessing a regulatory overhaul of the financial markets, including the banking, insurance and brokerage sectors. Increased disclosure requirements and changes to accounting principles involving the valuation of investments have also been a source of uncertainty. These conditions are expected to continue, and combined with a challenging macro-economic environment, may interfere with the implementation of our business strategy and/or force us to modify it.
Impact on Our Real Estate Investments
These market conditions have and will likely continue to have a significant impact on our real estate investments. In addition, these market conditions have impacted our tenants’ businesses, which makes it more difficult for them to meet their current lease obligations and places pressure on them to negotiate favorable lease terms upon renewal in order for their businesses to remain viable. Increases in rental concessions given to retain tenants and maintain our occupancy level, which is vital to the continued success of our portfolio, has resulted in lower current cash flow. Projected future declines in rental rates, slower or potentially negative net absorption of leased space and expectations of future rental concessions, including free rent to renew tenants early, to retain tenants who are up for renewal or to sign new tenants, are expected to result in additional decreases in cash flows. Historically low interest rates have helped offset some of the impact of these decreases in operating cash flow for properties financed with variable rate mortgages; however, interest rates may not remain at these historically low levels for the remaining life of many of our investments.
Impact on Our Real Estate-Related Investments
Nearly all of our real estate-related investments are either directly secured by commercial real estate (e.g., first trust deeds or mortgages) or secured by ownership interests in entities that directly or indirectly own and operate real estate (e.g., mezzanine loans). As a result, our real estate-related investments have been impacted to some degree by the same factors impacting our real estate investments. Our investments in mezzanine loans and B-Notes have been significantly impacted as current valuations for buildings directly or indirectly securing our investment positions have generally decreased from the date of our acquisition or origination of these investments. In these instances, the borrowers may not be able to refinance their debt to us or sell the collateral at a price sufficient to repay our note balances in full when they come due. For the year ended December 31, 2009, we recorded a provision for loan losses of $178.8 million which was comprised of $208.8 million calculated on an asset-specific basis, offset by a reduction of $30.0 million to our portfolio-based reserve.
Assuming our real estate-related loans are fully extended under the terms of the respective loan agreements and excluding our loan investments with asset-specific loan loss reserves and loans under which we have foreclosed or otherwise taken title to the property subsequent to December 31, 2009, we have investments with book values totaling $14.5 million maturing within the next 12 months. We have variable rate real estate-related investments with book values (excluding asset-specific loan loss reserves) of $579.1 million and fixed rate real estate-related investments with book values (excluding asset-specific loan loss reserves) of $197.2 million.
Impact on Our Financing Activities
In light of the risks associated with declining operating cash flows on our properties and the properties underlying the collateral for our repurchase agreements, and the current underwriting environment for commercial real estate mortgages, we may have difficulty refinancing some of our mortgage notes and repurchase agreements at maturity or may not be able to refinance our obligations at terms as favorable as the terms on our existing indebtedness. Although we believe that we will meet the terms for extension of our current loan agreements, we can give no assurance that we will meet the terms for extension of these loans. Assuming our notes payable and repurchase agreements are fully extended under the terms of the respective loan agreements, we have $41.0 million of debt obligations maturing during the 12 months ending December 31, 2010. We have a total of $534.5 million of fixed rate notes payable and $970.2 million of variable rate notes payable and repurchase agreements; of the $970.2 million of variable rate notes payable and repurchase agreements, $205.7 million are effectively fixed through interest rate swaps and $437.5 million are subject to interest rate caps.
11
Table of Contents
Economic Dependency
We are dependent on our advisor for certain services that are essential to us, including the negotiation and disposition of properties and other investments; management of the daily operations of our real estate portfolio; and other general and administrative responsibilities. In the event that KBS Capital Advisors is unable to provide the respective services, we will be required to obtain such services from other sources.
Competitive Market Factors
The United States commercial real estate leasing markets remain competitive. We face competition from various entities for prospective tenants and retaining our current tenants, including other REITs, pension funds, insurance companies, investment funds and companies, partnerships, and developers. Many of these entities have substantially greater financial resources than we do and may be able to accept more risk than we can prudently manage, including risks with respect to the creditworthiness of a tenant or the geographic location of its investments. As a result of their greater resources, those entities may have more flexibility than we do in their ability to offer rental concessions to attract tenants. This could put pressure on our ability to maintain or raise rents and could adversely affect our ability to attract or retain tenants. As a result, our financial condition, results of operations, cash flow, ability to satisfy our debt service obligations and ability to pay distributions to our stockholders may be adversely affected.
Compliance with Federal, State and Local Environmental Law
Under various federal, state and local environmental laws, ordinances and regulations, a current or previous real property owner or operator may be liable for the cost of removing or remediating hazardous or toxic substances on, under or in such property. These costs could be substantial. Such laws often impose liability whether or not the owner or operator knew of, or was responsible for, the presence of such hazardous or toxic substances. Environmental laws also may impose restrictions on the manner in which a property may be used or businesses may be operated, and these restrictions may require substantial expenditures or prevent us from entering into leases with prospective tenants that may be impacted by such laws. Environmental laws provide for sanctions for noncompliance and may be enforced by governmental agencies or, in certain circumstances, by private parties. Certain environmental laws and common law principles could be used to impose liability for the release of and exposure to hazardous substances, including asbestos-containing materials. Third parties may seek recovery from real property owners or operators for personal injury or property damage associated with exposure to released hazardous substances. The cost of defending against claims of liability, of complying with environmental regulatory requirements, of remediating any contaminated property, or of paying personal injury claims could reduce the amounts available for distribution to our stockholders.
All of our properties have been subject to Phase I environmental assessments at the time they were acquired. Some of the properties we have acquired are subject to potential environmental liabilities arising primarily from historic activities at or in the vicinity of the properties. Based on our environmental diligence and assessments of our properties and our purchase of pollution and remediation legal liability insurance with respect to some of our properties, we do not believe that environmental conditions at our properties are likely to have a material adverse effect on our operations.
Four properties acquired as part of the National Industrial Portfolio are located on or near former military bases that have been designated as either National Priority List sites or defense clean-up sites under the Comprehensive Environmental Response Compensation and Liability Act (“CERCLA”). These include 1045 Sheridan, Chicopee, MA; 15 Independence Drive, Devens, MA; and 50 Independence Drive, Devens, MA. Another property that is part of the portfolio, 9410 Heinz Way, Commerce City, CO, is a former defense armaments manufacturing site that is near the Rocky Mountain Arsenal National Priority List site. Additionally, some of the properties identified below in connection with activity use limitations and underground storage tanks have residual hazardous substance contamination from former operations. CERCLA imposes joint and several liability for clean-up costs on current owners of properties with hazardous substance contamination. Purchasers of contaminated properties may mitigate the risk of being held liable for costs of clean-up and related responsibilities by conducting “all appropriate inquiry” prior to the purchase of the property and compliance with the steps necessary to obtain and maintain “bona fide purchaser” status. We believe that we have taken the steps to obtain and maintain bona fide purchaser status, but we can give no assurance that a court would agree with us if someone were to seek to hold us liable. Because identified responsible parties, including the United States Government and large defense contractors, have taken responsibility for remedial actions relative to these properties and the existing tenants at these properties are generally large companies, we do not believe that we will face material liability with respect to any of these properties. The National Industrial Portfolio is owned by the New Leaf – KBS JV, LLC, a joint venture in which we own an 80% membership interest.
12
Table of Contents
In addition, we own several properties that are subject to activity use limitations (“AULs”) whereby the government has placed limitations on redevelopment of the properties for certain uses, particularly residential uses. AULs are typically imposed on property that has environmental contamination in exchange for less stringent environmental clean-up standards. In view of the locations of the affected properties, the environmental characteristics of the contaminants and the characteristics of the neighborhoods, we do not believe that these AULs have a material impact on our portfolio valuation, but they could in individual cases result in a depression of the value of a property, should we resell the property for uses different from its existing uses. Properties subject to AULs include 495-515 Woburn, Tewksbury, MA; 15 Independence Drive, Devens, MA; 100 Simplex Drive, Westminster, MA; 57-59 Daniel Webster Highway, Merrimack, NH and ADP Plaza, Portland, OR.
Some of the properties in our portfolio, particularly the warehouse and light industrial properties, had or have underground storage tanks either for space heating of the buildings, fueling motor vehicles, or industrial processes. Many of the underground storage tanks at the premises have been replaced over time. Given changing standards regarding closure of underground storage tanks and associated contamination, many of the tanks may not have been closed in compliance with current standards. Some of these properties likely have some residual petroleum or chemical contamination. Properties exhibiting these risks include 555 Taylor Road, Enfield, CT; 85 Moosup Pond Road, Plainfield, CT; 129 Concord Road, Billerica, MA (Rivertech); 111 Adams Road, Clinton, MA; 133 Jackson Avenue, Ellicott, NY; 1200 State Fair Boulevard, Geddes, NY; 3407 Walters Road, Van Buren, NY; ADP Plaza, Portland, OR; Shaffer Road and Route 255, DuBois, PA; 9700 West Gulf Bank Road, Houston, TX; and 2200 South Business 45, Corsicana, TX.
New Leaf – KBS JV, LLC purchased an environmental insurance policy from Indian Harbor Insurance Company that provides 10 years of coverage for pollution legal liability and remediation legal liability, among other coverage for the National Industrial Portfolio. We believe the scope and limits of the policy are appropriate for the risks presented by our properties.
Employees
We have no paid employees. The employees of our advisor and its affiliates provide management, disposition, advisory and certain administrative services for us.
Industry Segments
We acquire and operate commercial properties and invest in real estate-related investments, including real estate loans, and as a result, we operate in two business segments. For financial data by segment, see Note 13 “Segment Information” in the notes to our consolidated financial statements filed herewith.
Available Information
Access to copies of our annual reports on Form 10-K, quarterly reports on Form 10-Q, current reports on Form 8-K, proxy statements and other filings with the SEC, including amendments to such filings, may be obtained free of charge from the following Web site, http://www.kbsreit.com, through a link to the SEC’s Web site, http://www.sec.gov. These filings are available promptly after we file them with, or furnish them to, the SEC.
13
Table of Contents
| ITEM 1A. | RISK FACTORS |
The following are some of the risks and uncertainties that could cause our actual results to differ materially from those presented in our forward-looking statements. The risks and uncertainties described below are not the only ones we face but do represent those risks and uncertainties that we believe are material to us. Additional risks and uncertainties not presently known to us or that we currently deem immaterial may also harm our business.
Risks Related to an Investment in Us
Because no public trading market for our shares currently exists and because it is increasingly likely that we will delay the liquidation or the listing of our shares of common stock on a national securities exchange beyond 2012, investors should purchase shares in our dividend reinvestment plan only if they will not need to realize the cash value of their investment for an extended period.
There is no public market for our shares and we currently have no plans to list our shares on a national securities exchange. Until our shares are listed, if ever, stockholders may not sell their shares unless the buyer meets the applicable suitability and minimum purchase standards. In addition, our charter prohibits the ownership of more than 9.8% of our stock, unless exempted by our board of directors, which may inhibit large investors from purchasing our shares. In its sole discretion, our board of directors may amend, suspend or terminate our share redemption program upon 30 days’ notice. Based on our 2010 budgeted expenditures, and except with respect to redemptions sought upon a stockholder’s death, “qualifying disability” or “determination of incompetence,” we have announced that we do not expect to have funds available for the share redemption program in 2010. Further, the share redemption program includes numerous restrictions that would limit a stockholder’s ability to sell his or her shares. Therefore, it will be difficult for our stockholders to sell their shares promptly or at all. If a stockholder is able to sell his or her shares, it would likely be at a discount to the public offering price. It is also likely that our shares would not be accepted as the primary collateral for a loan.
If our shares of common stock are not listed on a national securities exchange by November 2012, our charter requires that we seek stockholder approval of our liquidation unless a majority of our independent directors determines that liquidation is not then in the best interest of our stockholders and postpones the decision of whether to liquidate. Due to the continuing impact of the disruptions in the financial markets on the values of our investments, it is increasingly likely that we will postpone such a liquidity event in order to improve the prospects for investors to have their capital returned and to realize a profit on their investment, likely through sales of individual or pooled assets. Therefore, investors should purchase our shares only as a long-term investment and be prepared to hold them for an extended period.
Continued disruptions in the financial markets and uncertain economic conditions could adversely affect our ability to service our existing indebtedness, our ability to refinance or secure additional debt financing on attractive terms and the values of our investments.
Despite certain recent positive economic indicators such as an improved stock market performance and improved access to capital for some companies, the capital and credit markets continue to be affected by the extreme volatility and disruption during 2008 and 2009. Liquidity in the global credit market is severely contracted by these market disruptions, making it costly to obtain new lines of credit or refinance existing debt. We rely on debt financing to finance our properties. As a result of the ongoing credit market turmoil, we may not be able to refinance our existing indebtedness or to obtain additional debt financing on attractive terms. If we are not able to refinance existing indebtedness on attractive terms at its maturity, we may be forced to dispose of some of our assets.
14
Table of Contents
The continued disruptions in the financial markets and uncertain economic conditions could adversely affect the values of our investments. Turmoil in the capital markets has constrained equity and debt capital available for investment in commercial real estate, resulting in fewer buyers seeking to acquire commercial properties and possible increases in capitalization rates and lower property values. Furthermore, declining economic conditions could negatively impact commercial real estate fundamentals and result in lower occupancy, lower rental rates and declining values in our real estate portfolio and in the collateral securing our loan investments. These could have the following negative effects on us:
| • | the values of our investments in commercial properties could decrease below the amounts paid for such investments; |
| • | the value of collateral securing our loan investments could decrease below the outstanding principal amounts of such loans; |
| • | revenues from our properties could decrease due to fewer tenants and/or lower rental rates, making it more difficult for us to pay dividends or meet our debt service obligations on debt financing; and/ or |
| • | revenues on the properties and other assets underlying our loan investments could decrease, making it more difficult for the borrower to meet its payment obligations to us, which could in turn make it more difficult for us to pay dividends or meet our debt service obligations on debt financing. |
The current capital market and general economic conditions also heighten risks with respect to our borrowings under repurchase agreements. If the value of the collateral underlying a repurchase agreement decreases, we may be required to provide additional collateral or make cash payments to maintain the loan to collateral value ratio. In addition, and unlike traditional secured financings, should a counterparty under a repurchase agreement file for bankruptcy, we may have to spend time and money asserting claims to the assets serving as the collateral under the repurchase agreement.
All of these factors could impair our ability to make distributions to our investors and decrease the value of an investment in us.
We and our advisor have limited operating histories, which makes our future performance difficult to predict.
We and our advisor have limited operating histories. We were incorporated in the State of Maryland on June 13, 2005, and our advisor was formed on October 18, 2004. Our stockholders should not assume that our performance will be similar to the past performance of other real estate investment programs sponsored by affiliates of our advisor. We are the first publicly offered investment program sponsored by the affiliates of our advisor. The private KBS-sponsored programs were not subject to the up-front commissions, fees and expenses associated with our initial public offering nor all of the laws and regulations that apply to us. For all of these reasons, our stockholders should be especially cautious when drawing conclusions about our future performance and our stockholders should not assume that it will be similar to the prior performance of other KBS-sponsored programs. Our limited operating history and our advisor’s limited operating history and the differences between us and the private KBS-sponsored programs significantly increase the risk and uncertainty our stockholders face in making an investment in our shares.
Because we are dependent upon our advisor and its affiliates to conduct our operations, any adverse changes in the financial health of our advisor or its affiliates or our relationship with them could hinder our operating performance and the return on our stockholders’ investment.
We are dependent on KBS Capital Advisors to manage our operations and our portfolio of real estate and real estate-related assets. Our advisor has a limited operating history and it depends upon the fees and other compensation that it receives from us and the other public KBS-sponsored programs in connection with the purchase, management and sale of assets to conduct its operations. Any adverse changes in the financial condition of KBS Capital Advisors or our relationship with KBS Capital Advisors could hinder its ability to successfully manage our operations and our portfolio of investments.
15
Table of Contents
The amount of cash available for distributions in future periods will be decreased by the repayment of the advance from our advisor and the payment of our advisor’s unpaid performance fees.
Our advisor has advanced $1.6 million to us for cash distributions and expenses in excess of revenues through March 19, 2010, all of which is outstanding. Of the $1.6 million advanced from our advisor to cover distributions and expenses in excess of revenues as of March 19, 2010, no amount has been advanced since January 2007. Pursuant to the advisory agreement, we are obligated to reimburse our advisor on demand for the $1.6 million advance if and to the extent that our cumulative Funds from Operations (as defined below) for the period commencing January 1, 2006 through the date of any such reimbursement exceed the lesser of (i) the cumulative amount of any distributions declared and payable to our stockholders as of the date of such reimbursement or (ii) an amount that is equal to a 7.0% cumulative, non-compounded, annual return on invested capital for our stockholders for the period from July 18, 2006 through the date of such reimbursement. No interest will accrue on the advance being made by our advisor. The advisory agreement defines Funds from Operations as funds from operations as defined by the National Association of Real Estate Investment Trusts plus (i) any acquisition expenses and acquisition fees expensed by us and that are related to any property, loan or other investment acquired or expected to be acquired by us and (ii) any non-operating noncash charges incurred by us, such as impairments of property or loans, any other-than-temporary impairments of marketable securities, or other similar charges.
In addition to the advance by our advisor, at December 31, 2009, we have incurred but unpaid performance fees totaling $4.9 million related to our joint venture investment in the National Industrial Portfolio. The performance fee is earned by our advisor only upon our meeting certain Funds from Operations thresholds and makes our advisor’s cumulative asset management fees related to our investment in the National Industrial Portfolio joint venture equal to 0.75% of the cost of the joint venture investment on an annualized basis from the date of our investment in the joint venture through the date of calculation. As of December 31, 2009, our operations were sufficient to meet the Funds from Operations condition in the advisory agreement. Although these performance fees have been incurred as of December 31, 2009, the advisory agreement further provides that the payment of the performance fee shall only be made after the repayment of advances from our advisor discussed above. The amount of cash available for distributions in future periods will be decreased by the repayment of the advance from our advisor and the payment of our advisor’s performance fees.
From July 2006 through September 2007, our advisor deferred payment of approximately $3.2 million of asset management fees. As of December 31, 2008, we had paid our advisor for these accrued but deferred fees. If necessary in future periods, our advisor intends to defer payment of its asset management fee if the cumulative amount of our Funds from Operations (as defined above) for the period commencing January 1, 2006 plus the amount of the advance from our advisor is less than the cumulative amount of distributions declared and currently payable to our stockholders.
If we pay distributions from sources other than our cash flow from operations, the overall return to our stockholders may be reduced.
Our organizational documents permit us, to the extent permitted by Maryland law, to pay distributions from any source. If we fund distributions from financings or sources other than cash flow from operations, the overall return to our stockholders may be reduced. Because we may receive income from interest or rents at various times during our fiscal year and because we may need cash flow from operations during a particular period to fund capital expenditures and other expenses, we expect that from time to time during our operational stage, we will declare distributions in anticipation of cash flow that we expect to receive during a later period and we will pay these distributions in advance of our actual receipt of these funds. If necessary in future periods, our advisor intends to defer payment of its asset management fee if the cumulative amount of our Funds from Operations (as defined above) for the period commencing January 1, 2006 plus the amount of the advance from our advisor is less than the cumulative amount of distributions declared and currently payable to our stockholders. We may also look to third-party borrowings to fund our distributions or use proceeds from the sale of real estate and receipt of principal payments from our real estate-related investments. We may also fund such distributions from advances from our advisor or sponsors. To the extent distributions exceed cash flow from operations, a stockholder’s basis in our stock will be reduced and, to the extent distributions exceed a stockholder’s basis, the stockholder may recognize capital gain.
16
Table of Contents
If funds are not available from the dividend reinvestment plan offering for general corporate purposes, then we may have to use a greater proportion of our cash flow from operations to meet our general cash requirements, which would reduce cash available for distributions and greatly limit our ability to redeem any shares under the share redemption program.
We depend on the proceeds from our dividend reinvestment plan for general corporate purposes, including capital expenditures on our real estate investments, tenant improvement costs and leasing costs related to our investments in real estate properties; reserves required by financings of our investments in real estate properties; funding obligations under our real estate loans receivable; the repayment of debt; and the repurchase of shares under our share redemption program. During the second half of 2009, the participation in our dividend reinvestment plan decreased in comparison to 2008. In addition, the decrease in the amount of our distributions beginning in July 2009 also resulted in a significant reduction in the amount of proceeds from our dividend reinvestment plan. We cannot predict with any certainty how much, if any, dividend reinvestment plan proceeds will be available for general corporate purposes. If such funds are not available from the dividend reinvestment plan offering, then we may have to use a greater proportion of our cash flow from operations to meet our general cash requirements, which would reduce cash available for distributions and greatly limit our ability to redeem any shares under the share redemption program. Based on our 2010 budgeted expenditures, and except with respect to redemptions sought upon a stockholder’s death, “qualifying disability” or “determination of incompetence,” we have announced that we do not expect to have funds available for the share redemption program in 2010.
We may not have sufficient liquidity, whether from our operations or our dividend reinvestment plan, to fund our future capital needs. If our cash flow is insufficient to meet our capital needs, we will not be able to maintain our current dividend rate.
Declining economic conditions have had and will likely continue to have a significant impact on our real estate and real estate-related investments. In addition, these market conditions have impacted the businesses of our tenants as well as the tenants in buildings securing our real estate-related investments. As a result of a decline in cash flows and projected future declines, in July 2009 our board of directors reduced the amount of our distributions from $0.70 per share on an annualized basis to $0.525 per share on an annualized basis. Projected future declines in rental rates, slower or potentially negative net absorption of leased space and expectations of future rental concessions, including free rent to renew tenants early, to retain tenants who are up for renewal or to sign new tenants, are expected to result in additional decreases in cash flows from our properties. As a result of these same factors, the borrowers under our real estate-related investments have experienced a reduction in cash flows which has made it difficult for them to pay us debt service in some instances. Additionally, these reduced and potentially decreasing cash flows have had a negative impact on the valuation of buildings directly or indirectly securing our investment positions and as a result the borrowers may not be able to refinance their debt to us or sell the collateral at a price sufficient to repay our note balances in full when they come due.
We depend on the proceeds from our dividend reinvestment plan to cover, among other things, capital expenditures on our real estate investments, tenant improvement costs and leasing costs related to our investments in real estate properties; reserves required by financings of our investments in real estate properties; funding obligations under our real estate loans receivable; and the repayment of debt. During the second half of 2009, the participation in our dividend reinvestment plan decreased in comparison to 2008. In addition, the decrease in the amount of our distributions beginning in July 2009 also resulted in a significant reduction in the amount of proceeds from our dividend reinvestment plan. Further reductions in the amount of proceeds from the dividend reinvestment plan, whether due to a decline in participation under the dividend reinvestment plan or a decrease in the amount of our monthly distributions could adversely impact our ability to meet our capital needs.
All of these factors could limit our liquidity and impact our ability to properly maintain or make improvements to our real estate investments. This, in turn, could result in reductions in the value of our investments and therefore a reduction in the value of an investment in us. These factors could also limit our ability to make distributions to our investors.
17
Table of Contents
The loss of or the inability to obtain key real estate and debt finance professionals at our advisor could delay or hinder implementation of our investment strategies, which could limit our ability to make distributions and decrease the value of an investment in our shares.
Our success depends to a significant degree upon the contributions of Peter M. Bren, Keith D. Hall, Peter McMillan III, and Charles J. Schreiber, Jr., each of whom would be difficult to replace. Neither we nor our affiliates have employment agreements with Messrs. Bren, Hall, McMillan, or Schreiber. Messrs. Bren, Hall, McMillan, and Schreiber may not remain associated with us. If any of these persons were to cease their association with us, our operating results could suffer. We do not intend to maintain key person life insurance on any person. We believe that our future success depends, in large part, upon our advisor’s and its affiliates’ ability to attract and retain highly skilled managerial, operational and marketing professionals. Competition for such professionals is intense, and our advisor and its affiliates may be unsuccessful in attracting and retaining such skilled individuals. Further, we intend to establish strategic relationships with firms that have special expertise in certain services or detailed knowledge regarding real properties in certain geographic regions. Maintaining such relationships will be important for us to effectively compete with other investors for properties and tenants in such regions. We may be unsuccessful in establishing and retaining such relationships. If we lose or are unable to obtain the services of highly skilled professionals or do not establish or maintain appropriate strategic relationships, our ability to implement our investment strategies could be delayed or hindered, and the value of our stockholders’ investments may decline.
Our rights and the rights of our stockholders to recover claims against our independent directors are limited, which could reduce our stockholders’ and our recovery against them if they negligently cause us to incur losses.
Maryland law provides that a director has no liability in that capacity if he performs his duties in good faith, in a manner he reasonably believes to be in our best interests and with the care that an ordinarily prudent person in a like position would use under similar circumstances. Our charter provides that no independent director shall be liable to us or our stockholders for monetary damages and that we will generally indemnify them for losses unless they are grossly negligent or engage in willful misconduct. As a result, our stockholders and we may have more limited rights against our independent directors than might otherwise exist under common law, which could reduce our stockholders’ and our recovery from these persons if they act in a negligent manner. In addition, we may be obligated to fund the defense costs incurred by our independent directors (as well as by our other directors, officers, employees (if we ever have employees) and agents) in some cases, which would decrease the cash otherwise available for distribution to our stockholders.
18
Table of Contents
Risks Related to Conflicts of Interest
KBS Capital Advisors and its affiliates, including all of our executive officers, some of our directors and other key real estate and debt finance professionals, face conflicts of interest caused by their compensation arrangements with us, which could result in actions that are not in the long-term best interests of our stockholders.
All of our executive officers, some of our directors and other key real estate and debt finance professionals are also officers, directors, managers, key professionals and/or holders of a direct or indirect controlling interest in our advisor, our dealer manager and other affiliated KBS entities. KBS Capital Advisors and its affiliates receive substantial fees from us. These fees could influence our advisor’s advice to us as well as the judgment of affiliates of KBS Capital Advisors. Among other matters, these compensation arrangements could affect their judgment with respect to:
| • | the continuation, renewal or enforcement of our agreements with KBS Capital Advisors and its affiliates, including the advisory agreement; |
| • | public offerings of equity by us, which would entitle KBS Capital Markets Group to dealer-manager fees and would likely entitle KBS Capital Advisors to increased acquisition and asset-management fees; |
| • | sales of properties and other investments, which entitle KBS Capital Advisors to disposition fees and possible subordinated incentive fees; |
| • | acquisitions of properties and other investments and originations of loans, which entitle KBS Capital Advisors to acquisition fees and asset-management fees, and, in the case of acquisitions of investments from other KBS-sponsored programs, might entitle affiliates of KBS Capital Advisors to disposition fees and possible subordinated incentive fees in connection with its services for the seller; |
| • | borrowings to acquire properties and other investments and to originate loans, which borrowings will increase the acquisition and asset-management fees payable to KBS Capital Advisors; |
| • | whether and when we seek to list our common stock on a national securities exchange, which listing could entitle KBS Capital Advisors to a subordinated incentive listing fee; |
| • | whether we seek stockholder approval to internalize our management, which may entail acquiring assets (such as office space, furnishings and technology costs) and negotiating compensation for real estate, debt finance, management and accounting professionals at our advisor and its affiliates that may result in such individuals receiving more compensation from us than they currently receive from our advisor; and |
| • | whether and when we seek to sell the company or its assets, which sale could entitle KBS Capital Advisors to a subordinated incentive fee. |
The fees our advisor receives in connection with the acquisition and management of assets are based on the cost of the investment, and not based on the quality of the investment or the quality of the services rendered to us. This may influence our advisor to recommend riskier transactions to us.
KBS Capital Advisors faces conflicts of interest relating to the leasing of properties and such conflicts may not be resolved in our favor, meaning that we obtain less creditworthy tenants, which could limit our ability to make distributions and reduce our stockholders’ overall investment return.
We and other KBS-sponsored programs and KBS-advised investors rely on the same group of key real estate professionals at our advisor to supervise the property management and leasing of properties. If the KBS team of real estate professionals direct creditworthy prospective tenants to properties owned by another KBS-sponsored program or KBS-advised investor when they could direct such tenants to our properties, our tenant base may have more inherent risk and our properties’ occupancy may be lower than might otherwise be the case.
19
Table of Contents
KBS Capital Advisors, the real estate and debt finance professionals assembled by our advisor, their affiliates and our officers will face competing demands relating to their time and this may cause our operations and our stockholders’ investment to suffer.
We rely on KBS Capital Advisors and the real estate and debt finance professionals our advisor has assembled, including Messrs. Bren, Hall, McMillan, Schreiber and Snyder and Ms. Yamane for the day-to-day operation of our business. KBS Real Estate Investment Trust II, Inc. (“KBS REIT II”), KBS Strategic Opportunity REIT, Inc. (“KBS SOR”), KBS Legacy Partners Apartment REIT, Inc. (“KBS Legacy Partners Apartment REIT”) and KBS Real Estate Investment Trust III, Inc. (“KBS REIT III”) are also advised by KBS Capital Advisors and rely or will rely on our sponsors and many of the same real estate, debt finance, management and accounting professionals as will future public KBS-sponsored programs. Further, our officers and directors are also officers and/or directors of some or all of the other public KBS-sponsored programs. In addition, Messrs. Bren and Schreiber are executive officers of KBS Realty Advisors and its affiliates, the advisors of the private KBS-sponsored programs and the investment advisors to institutional investors in real estate and real estate-related assets. As a result of their interests in other KBS programs, their obligations to other investors and the fact that they engage in and they will continue to engage in other business activities, on behalf of themselves and others, Messrs. Bren, Hall, McMillan, Schreiber and Snyder and Ms. Yamane will face conflicts of interest in allocating their time among us, KBS REIT II, KBS SOR, KBS Legacy Partners Apartment REIT, KBS REIT III, KBS Capital Advisors and other KBS-sponsored programs and other business activities in which they are involved. In addition, KBS Capital Advisors and KBS Realty Advisors and its affiliates share many of the same real estate, management and accounting professionals. During times of intense activity in other programs and ventures, these individuals may devote less time and fewer resources to our business than are necessary or appropriate to manage our business. Furthermore, some or all of these individuals may become employees of another KBS-sponsored program in an internalization transaction or, if we internalize our advisor, may not become our employees as a result of their relationship with other KBS-sponsored programs. If this occurs, the returns on our investments, and the value of our stockholders’ investment, may decline.
All of our executive officers, some of our directors and the key real estate and debt finance professionals assembled by our advisor face conflicts of interest related to their positions and/or interests in KBS Capital Advisors and its affiliates, which could hinder our ability to implement our business strategy and to generate returns to our stockholders.
All of our executive officers, some of our directors and the key real estate and debt finance professionals assembled by our advisor are also executive officers, directors, managers, key professionals and/or holders of a direct or indirect controlling interest in our advisor and other affiliated KBS entities. Through KBS-affiliated entities, some of these persons also serve as the investment advisors to institutional investors in real estate and real estate-related assets and through KBS Capital Advisors and KBS Realty Advisors these persons serve as the advisor to other KBS programs, including KBS REIT II, KBS SOR, KBS Legacy Partners Apartment REIT and KBS REIT III. As a result, they owe fiduciary duties to each of these entities, their members and limited partners and these investors, which fiduciary duties may from time to time conflict with the fiduciary duties that they owe to us and our stockholders. Their loyalties to these other entities and investors could result in action or inaction that is detrimental to our business, which could harm the implementation of our business strategy and our investment and leasing opportunities. Further, Messrs. Bren, Hall, McMillan and Schreiber and existing and future KBS-sponsored programs and KBS-advised investors are not prohibited from engaging, directly or indirectly, in any business or from possessing interests in any other business venture or ventures, including businesses and ventures involved in the acquisition, development, ownership, leasing or sale of real estate investments. If we do not successfully implement our business strategy, we may be unable to generate the cash needed to make distributions to our stockholders and to maintain or increase the value of our assets.
20
Table of Contents
Our board’s loyalties to KBS REIT II and possibly to future KBS-sponsored programs could influence its judgment, resulting in actions that may not be in our stockholders’ best interest or that result in a disproportionate benefit to another KBS-sponsored program at our expense.
All of our directors are also directors of KBS REIT II, another public, non-traded REIT sponsored by Messrs. Bren, Hall, McMillan and Schreiber. The loyalties of our directors serving on the board of KBS REIT II and possibly on the board of future KBS-sponsored programs may influence the judgment of our board when considering issues for us that also may affect other KBS-sponsored programs, such as the following:
| • | We could enter into transactions with other KBS-sponsored programs, such as property sales, acquisitions or financing arrangements. Decisions of the board or the conflicts committee regarding the terms of those transactions may be influenced by the board’s or committee’s loyalties to such other KBS-sponsored programs. |
| • | A decision of the board or the conflicts committee regarding the timing of a debt or equity offering could be influenced by concerns that the offering would compete with an offering of other KBS-sponsored programs. |
| • | A decision of the board or the conflicts committee regarding the timing of property sales could be influenced by concerns that the sales would compete with those of other KBS-sponsored programs. |
Because our independent directors are also independent directors of KBS REIT II, they receive compensation for service on the board of KBS REIT II. Like us, KBS REIT II pays each independent director an annual retainer of $40,000 as well as compensation for attending meetings as follows: (i) $2,500 for each board meeting attended, (ii) $2,500 for each committee meeting attended (except that the committee chairman is paid $3,000 for each meeting attended), (iii) $2,000 for each teleconference board meeting attended, and (iv) $2,000 for each teleconference committee meeting attended (except that the committee chairman is paid $3,000 for each teleconference committee meeting attended). In addition, KBS REIT II reimburses directors for reasonable out-of-pocket expenses incurred in connection with attendance at meetings of the board of directors.
For the year ended December 31, 2009, the independent directors of KBS REIT II earned compensation as follows:
| Independent Director |
Compensation Earned in 2009 | Compensation Paid in 2009(1) | |||||
| Hank Adler |
$ | 95,500 | (2) | $ | 95,997 | ||
| Barbara Cambon |
$ | 90,000 | (3) | $ | 93,997 | ||
| Stuart A. Gabriel, Ph.D |
$ | 93,000 | (4) | $ | 93,497 | ||
(1) Compensation Paid in 2009 includes meeting fees earned during 2008 but paid or reimbursed in 2009 as follows: Mr. Adler $5,833; Ms. Cambon $10,333; and Mr. Gabriel $5,833.
(2) This amount includes (i) fees earned for attendance at nine board meetings, eight conflicts committee meetings and five audit committee meetings, (ii) the annual retainer and (iii) costs reimbursements for reasonable out-of-pocket expenses incurred in connection with attendance at meetings.
(3) This amount includes (i) fees earned for attendance at eight board meetings, seven conflicts committee meetings and four audit committee meetings, (ii) the annual retainer and (iii) costs reimbursements for reasonable out-of-pocket expenses incurred in connection with attendance at meetings.
(4) This amount includes (i) fees earned for attendance at nine board meetings, eight conflicts committee meetings and five audit committee meetings, (ii) the annual retainer and (iii) costs reimbursements for reasonable out-of-pocket expenses incurred in connection with attendance at meetings.
21
Table of Contents
Risks Related to Our Corporate Structure
Our charter limits the number of shares a person may own, which may discourage a takeover that could otherwise result in a premium price to our stockholders.
Our charter, with certain exceptions, authorizes our directors to take such actions as are necessary and desirable to preserve our qualification as a REIT. To help us comply with the REIT ownership requirements of the Code, our charter prohibits a person from directly or constructively owning more than 9.8% of our outstanding shares, unless exempted by our board of directors. This restriction may have the effect of delaying, deferring or preventing a change in control of us, including an extraordinary transaction (such as a merger, tender offer or sale of all or substantially all of our assets) that might provide a premium price for holders of our common stock.
Our charter permits our board of directors to issue stock with terms that may subordinate the rights of our common stockholders or discourage a third party from acquiring us in a manner that could result in a premium price to our stockholders.
Our board of directors may classify or reclassify any unissued common stock or preferred stock and establish the preferences, conversion or other rights, voting powers, restrictions, limitations as to dividends and other distributions, qualifications and terms or conditions of redemption of any such stock. Thus, our board of directors could authorize the issuance of preferred stock with priority as to distributions and amounts payable upon liquidation over the rights of the holders of our common stock. Such preferred stock could also have the effect of delaying, deferring or preventing a change in control of us, including an extraordinary transaction (such as a merger, tender offer or sale of all or substantially all of our assets) that might provide a premium price to holders of our common stock.
Our stockholders’ investment return may be reduced if we are required to register as an investment company under the Investment Company Act; if we or our subsidiaries become an unregistered investment company, we could not continue our business.
Neither we nor any of our subsidiaries intend to register as investment companies under the Investment Company Act. If we or our subsidiaries were obligated to register as investment companies, we would have to comply with a variety of substantive requirements under the Investment Company Act that impose, among other things:
| • | limitations on capital structure; |
| • | restrictions on specified investments; |
| • | prohibitions on transactions with affiliates; and |
| • | compliance with reporting, record keeping, voting, proxy disclosure and other rules and regulations that would significantly increase our operating expenses. |
Under the relevant provisions of Section 3(a)(1) of the Investment Company Act, we will not be deemed to be an “investment company” if:
| • | we are not engaged primarily, nor hold ourselves out as being engaged primarily, nor propose to engage primarily, in the business of investing, reinvesting or trading in securities (the “Primarily Engaged Test”); and |
| • | we are not engaged and do not propose to engage in the business of investing, reinvesting, owning, holding or trading in securities and do not own or propose to acquire “investment securities” having a value exceeding 40% of the value of our total assets on an unconsolidated basis (the “40% Test”). “Investment securities” excludes U.S. government securities and securities of majority-owned subsidiaries that are not themselves investment companies and are not relying on the exception from the definition of investment company under Section 3(c)(1) or Section 3(c)(7) (relating to private investment companies). |
We believe that we and our Operating Partnership satisfy both tests above. With respect to the 40% Test, most of the entities through which we and our Operating Partnership own our assets are majority-owned subsidiaries that are not themselves investment companies and are not relying on the exceptions from the definition of investment company under Section 3(c)(1) or Section 3(c)(7).
With respect to the Primarily Engaged Test, we and our Operating Partnership are holding companies. Through the majority-owned subsidiaries of our Operating Partnership, we and our Operating Partnership are primarily engaged in the non-investment company businesses of these subsidiaries.
22
Table of Contents
We believe that most of the subsidiaries of our Operating Partnership may rely on Section 3(c)(5)(C) of the Investment Company Act for an exception from the definition of an investment company. (Any other subsidiaries of our Operating Partnership should be able to rely on the exceptions for private investment companies pursuant to Section 3(c)(1) and Section 3(c)(7) of the Investment Company Act.) The SEC staff’s position on Section 3(c)(5)(C) generally requires that an issuer maintain at least 55% of its assets in “mortgages and other liens on and interests in real estate” (“Qualifying Assets”); at least 80% of its assets in Qualifying Assets plus real estate-related assets (“Real Estate-Related Assets”); and no more than 20% of the value of its assets in other than Qualifying Assets and Real Estate-Related Assets (“Miscellaneous Assets”). To constitute a Qualifying Asset under this 55% requirement, a real estate interest must meet various criteria; therefore, certain of our subsidiaries are limited with respect to the value and nature of the assets that they may own at any given time.
If, however, the value of the subsidiaries of our Operating Partnership that must rely on Section 3(c)(1) or Section 3(c)(7) is greater than 40% of the value of the assets of our Operating Partnership, then we and our Operating Partnership may seek to rely on the exception from registration under Section 3(c)(6) if we and our Operating Partnership are “primarily engaged,” through majority-owned subsidiaries, in the business of purchasing or otherwise acquiring mortgages and other interests in real estate. Although the SEC staff has issued little interpretive guidance with respect to Section 3(c)(6), we believe that we and our Operating Partnership may rely on Section 3(c)(6) if 55% of the assets of our Operating Partnership consist of, and at least 55% of the income of our Operating Partnership is derived from, majority-owned subsidiaries that rely on Section 3(c)(5)(C).
To maintain compliance with the Investment Company Act, our subsidiaries may be unable to sell assets we would otherwise want them to sell and may need to sell assets we would otherwise wish them to retain. In addition, our subsidiaries may have to acquire additional assets that they might not otherwise have acquired or may have to forego opportunities to make investments that we would otherwise want them to make and would be important to our investment strategy. Moreover, SEC staff interpretations with respect to various types of assets are subject to change, which increases the risk of non-compliance and the risk that we may be forced to make adverse changes to our portfolio.
If we were required to register as an investment company but failed to do so, we would be prohibited from engaging in our business and criminal and civil actions could be brought against us. In addition, our contracts would be unenforceable unless a court required enforcement and a court could appoint a receiver to take control of us and liquidate our business.
Rapid changes in the values of our assets may make it more difficult for us to maintain our qualification as a REIT or our exception from the definition of an investment company under the Investment Company Act.
If the market value or income potential of our qualifying real estate assets changes as compared to the market value or income potential of our non-qualifying assets, or if the market value or income potential of our assets that are considered “real estate-related assets” under the Investment Company Act or REIT qualification tests changes as compared to the market value or income potential of our assets that are not considered “real estate-related assets” under the Investment Company Act or REIT qualification tests, whether as a result of increased interest rates, prepayment rates or other factors, we may need to modify our investment portfolio in order to maintain our REIT qualification or exception from the definition of an investment company. If the decline in asset values or income occurs quickly, this may be especially difficult, if not impossible, to accomplish. This difficulty may be exacerbated by the illiquid nature of many of the assets that we may own. We may have to make investment decisions that we otherwise would not make absent REIT and Investment Company Act considerations.
Our stockholders will have limited control over changes in our policies and operations, which increases the uncertainty and risks our stockholders face.
Our board of directors determines our major policies, including our policies regarding financing, growth, debt capitalization, REIT qualification and distributions. Our board of directors may amend or revise these and other policies without a vote of the stockholders. Under Maryland General Corporation Law and our charter, our stockholders have a right to vote only on limited matters. Our board’s broad discretion in setting policies and our stockholders’ inability to exert control over those policies increases the uncertainty and risks our stockholders face.
23
Table of Contents
Our stockholders may not be able to sell their shares under our share redemption program and, if our stockholders are able to sell their shares under the program, they may not be able to recover the amount of their investment in our shares.
Our share redemption program includes numerous restrictions that limit our stockholders’ ability to sell their shares. Our stockholders must hold their shares for at least one year in order to participate in the share redemption program, except for redemptions sought upon a stockholder’s death, qualifying disability (as defined in the plan) or determination of incompetence (as defined in the plan). We limit the number of shares we may redeem pursuant to the share redemption program as follows: (1) during any calendar year, we may redeem no more than 5% of the weighted-average number of shares outstanding during the prior calendar year and (2) during each calendar year, redemptions will be limited to the amount of net proceeds from the sale of shares under our dividend reinvestment plan from the prior calendar year less amounts we deem necessary from such proceeds to fund current and future: capital expenditures, tenant improvement costs and leasing costs related to our investments in real estate properties; reserves required by financings of our investments in real estate properties; and funding obligations under our real estate loans receivable, as each may be adjusted from time to time by management, provided that if the shares are submitted for redemption in connection with a stockholder’s death, “qualifying disability” or “determination of incompetence,” we will honor such redemptions to the extent that all redemptions for the calendar year are less than the amount of the net proceeds from the sale of shares under the dividend reinvestment plan during the prior calendar year. Further, we have no obligation to redeem shares if the redemption would violate the restrictions on distributions under Maryland law, which prohibits distributions that would cause a corporation to fail to meet statutory tests of solvency. These limits may prevent us from accommodating all redemption requests made in any year. Based on 2010 budgeted expenditures, and except with respect to redemptions sought upon a stockholder’s death, “qualifying disability” or “determination of incompetence,” we do not expect to have funds available for redemption in 2010. Our board may amend, suspend or terminate the share redemption program upon 30 days’ notice.
Pursuant to the share redemption program, once we have established an estimated value per share of our common stock, the redemption price for all stockholders is equal to the estimated value per share. On November 20, 2009, our board of directors approved an estimated value per share of our common stock of $7.17 based on the estimated value of our assets less the estimated value of our liabilities divided by the number of shares outstanding, all as of September 30, 2009. Therefore, effective commencing with the November 30, 2009 redemption date, the redemption price for all stockholders is $7.17 per share. We currently expect to update our estimated value per share within 12 to 18 months of September 30, 2009 at which time the redemption price per share would also change. Because of the restrictions of our share redemption program, our stockholders may not be able to sell their shares under the program, and if stockholders are able to sell their shares, they may not recover the amount of their investment in us.
The estimated value per share of our common stock may not reflect the value that stockholders will receive for their investment.
When we commenced our initial public offering in January 2006, we expected to conduct the first valuation of our shares three years after the completion of our offering stage, which would have been January 2012. In February 2009, the Financial Industry Regulatory Authority (“FINRA”) released Regulatory Notice 09-09 to broker dealers that sell shares of non-traded REITs. This notice confirms that the National Association of Securities Dealers (“NASD”) Rule 2340(c)(2) prohibits broker-dealers that are required to report an estimated value per share for non-traded REITs from using a per share estimated value developed from data that is more than 18 months old. This meant that broker-dealers that participated in our initial public offering could not use the last price paid to acquire a share in our public offering as the estimated value per share of our common stock beginning 18 months after May 30, 2008, the date we ceased offering shares in our initial public offering. Accordingly, to meet FINRA guidelines, on November 20, 2009, our board of directors approved an estimated value per share of our common stock of $7.17 based on the estimated value of our assets less the estimated value of our liabilities divided by the number of shares outstanding, all as of September 30, 2009. We provided this estimated value per share (i) to assist broker-dealers that participated in our initial public offering in meeting their customer account statement reporting obligations under NASD Rule 2340 (c)(2) as required by FINRA and (ii) to assist fiduciaries of retirement plans subject to the annual reporting requirements of ERISA in the preparation of their reports.
24
Table of Contents
The estimated value per share was based upon the recommendation and valuation of our advisor. FINRA rules provide no guidance on the methodology an issuer must use to determine its estimated value per share. As with any valuation methodology, our advisor’s methodology is based upon a number of estimates and assumptions that may not be accurate or complete. Different parties with different assumptions and estimates could derive a different estimated value per share, and these differences could be significant. The estimated value per share is not audited and does not represent the fair value of our assets or liabilities according to generally accepted accounting principles (“GAAP”). Accordingly, with respect to the estimated value per share, the we can give no assurance that:
| • | a stockholder would be able to resell his or her shares at this estimated value; |
| • | a stockholder would ultimately realize distributions per share equal to our estimated value per share upon liquidation of our assets and settlement of our liabilities or a sale of the company; |
| • | our shares of common stock would trade at the estimated value per share on a national securities exchange; |
| • | an independent third-party appraiser or other third-party valuation firm would agree with our estimated value per share; or |
| • | the methodology used to estimate our value per share would be acceptable to FINRA or for compliance with ERISA reporting requirements. |
Further, the estimated value per share is based on the estimated value of our assets less the estimated value of our liabilities divided by the number of shares outstanding, all as of September 30, 2009. The value of our shares will fluctuate over time in response to developments related to individual assets in the portfolio and the management of those assets and in response to the real estate and finance markets. We expect to engage our advisor or an independent valuation firm to update the estimated value per share within 12 to 18 months of September 30, 2009.
For a full description of the methodologies used to value our assets and liabilities in connection with the calculation of the estimated value per share, see our Form 8-K filed with the SEC on November 23, 2009.
Our investors’ interest in us will be diluted if we issue additional shares, which could reduce the overall value of their investment.
Our common stockholders do not have preemptive rights to any shares we issue in the future. Our charter authorizes us to issue 1,010,000,000 shares of capital stock, of which 1,000,000,000 shares are designated as common stock and 10,000,000 shares are designated as preferred stock. Our board of directors may increase the number of authorized shares of capital stock without stockholder approval. After our investors purchase shares in our public offering, our board may elect to (1) sell additional shares in future public offerings, (2) issue equity interests in private offerings, (3) issue shares to our advisor, or its successors or assigns, in payment of an outstanding obligation or (4) issue shares of our common stock to sellers of properties or assets we acquire in connection with an exchange of limited partnership interests of the Operating Partnership. To the extent we issue additional equity interests after our investors purchase shares in our initial public offering, their percentage ownership interest in us will be diluted. In addition, depending upon the terms and pricing of any additional offerings and the value of our real estate investments, our investors may also experience dilution in the book value and fair value of their shares.
Payment of fees to KBS Capital Advisors and its affiliates reduces cash available for distribution and increases the risk that our stockholders will not be able to recover the amount of their investment in our shares.
KBS Capital Advisors and its affiliates performed services for us in connection with the selection and acquisition or origination of our investments and continue to perform services for us in connection with the management and leasing of our properties and the administration of our other investments. We pay them substantial fees for these services, which results in immediate dilution to the value of our stockholders’ investment and reduces the amount of cash available for investment or distribution to stockholders.
We may also pay significant fees during our listing/liquidation stage. Although most of the fees payable during our listing/liquidation stage are contingent on our investors first receiving agreed-upon investment returns, affiliates of KBS Capital Advisors could also receive significant payments even without our reaching the investment-return thresholds should we seek to become self-managed. Due to the apparent preference of the public markets for self-managed companies, a decision to list our shares on a national securities exchange might be preceded by a decision to become self-managed. Given our advisor’s familiarity with our assets and operations, we might prefer to become self-managed by acquiring entities affiliated with our advisor. Such an internalization transaction could result in significant payments to affiliates of our advisor irrespective of whether our stockholders enjoyed the returns on which we have conditioned other incentive compensation.
25
Table of Contents
Therefore, these fees increase the risk that the amount available for distribution to common stockholders upon a liquidation of our portfolio would be less than stockholders paid for our shares. These substantial fees and other payments also increase the risk that our stockholders will not be able to resell their shares at a profit, even if our shares are listed on a national securities exchange.
If we are unable to obtain funding for future capital needs, cash distributions to our stockholders and the value of our investments could decline.
When tenants do not renew their leases or otherwise vacate their space, we will often need to expend substantial funds for improvements to the vacated space in order to attract replacement tenants. Even when tenants do renew their leases we may agree to make improvements to their space as part of our negotiation. If we need additional capital in the future to improve or maintain our properties or for any other reason, we may have to obtain funding from sources other than our cash flow from operations, such as borrowings or future equity offerings. These sources of funding may not be available on attractive terms or at all. If we cannot procure additional funding for capital improvements, our investments may generate lower cash flows or decline in value, or both, which would limit our ability to make distributions to our stockholders and could reduce the value of our stockholders’ investment.
Our stockholders may be more likely to sustain a loss on their investment because our sponsors do not have as strong an economic incentive to avoid losses as do sponsors who have made significant equity investments in their companies.
Our sponsors have only invested $200,000 in us through the purchase of 20,000 shares of our common stock at $10 per share. Therefore, if we are successful in generating funds from operations sufficient to repay our advisor for advances made to us to pay cash distributions and expenses in excess of revenues, our sponsors will have little exposure to loss in the value of our shares. Without this exposure, our investors may be at a greater risk of loss because our sponsors do not have as much to lose from a decrease in the value of our shares as do those sponsors who make more significant equity investments in their companies.
General Risks Related to Investments in Real Estate
Economic and regulatory changes that impact the real estate market generally may decrease the value of our investments and weaken our operating results.
Our properties and their performance are subject to the risks typically associated with real estate, including:
| • | downturns in national, regional and local economic conditions; |
| • | competition from other office and industrial buildings; |
| • | adverse local conditions, such as oversupply or reduction in demand for office and industrial buildings and changes in real estate zoning laws that may reduce the desirability of real estate in an area; |
| • | vacancies, changes in market rental rates and the need to periodically repair, renovate and re-let space; |
| • | changes in the supply of or the demand for similar or competing properties in an area; |
| • | changes in interest rates and availability of permanent mortgage financing, which may render the sale of a property or loan difficult or unattractive; |
| • | changes in tax (including real and property tax laws), real estate, environmental and zoning laws; and |
| • | periods of high interest rates and tight money supply. |
Any of the above factors, or a combination thereof, could result in a decrease in the value of our investments, which would have an adverse effect on our operations, on our ability to pay distributions to our stockholders and on the value of our stockholders’ investment.
26
Table of Contents
If our acquisitions fail to perform as expected, cash distributions to our stockholders may decline.
Since breaking escrow in July 2006, we have made acquisitions of properties and other real estate-related assets. If these assets do not perform as expected we may have less cash flow from operations available to fund distributions and investor returns may be reduced.
Properties that have significant vacancies could be difficult to sell, which could diminish the return on these properties.
A property may incur vacancies either by the expiration of tenant leases or the continued default of tenants under their leases. If vacancies continue for a long period of time, we may suffer reduced revenues resulting in less cash available to distribute to stockholders. In addition, the resale value of the property could be diminished because the market value of a particular property depends principally upon the value of the cash flow generated by the leases associated with that property. Such a reduction on the resale value of a property could also reduce the value of our stockholders’ investment. As of December 31, 2009, we owned six buildings containing 2.6 million rentable square feet that were less than 70% occupied.
We depend on tenants for our revenue, and, accordingly, our revenue and our ability to make distributions to our stockholders is dependent upon the success and economic viability of our tenants.
The success of our investments materially depends upon the financial stability of the tenants leasing the properties we own. The inability of a single major tenant or a number of smaller tenants to meet their rental obligations would lower our net income. A default by a tenant on its lease payments would cause us to lose the revenue associated with such lease and require us to find an alternative source of revenue to meet mortgage payments and prevent a foreclosure if the property is subject to a mortgage. In the event of a tenant default or bankruptcy, we may experience delays in enforcing our rights as landlord of a property and may incur substantial costs in protecting our investment and re-letting the property. Tenants may have the right to terminate their leases upon the occurrence of certain customary events of default and, in other circumstances, may not renew their leases or, because of market conditions, may be able to renew their leases on terms that are less favorable to us than the terms of their initial leases. Further, some of the properties in which we invest may be outfitted to suit the particular needs of the tenants. We may have difficulty replacing the tenants of these properties if the outfitted space limits the types of businesses that could lease that space without major renovation. Because the market value of a property depends principally upon the value of the leases associated with such property, we may incur a loss upon the sale of a property with significant vacant space. These events could cause us to reduce the amount of distributions to stockholders. During 2009, one significant tenant leasing a combined 1.7 million square feet declared bankruptcy. During the year ended December 31, 2009, rental income from this tenant accounted for 1.6% of our total rental income.
Our inability to sell a property when we want could limit our ability to pay cash distributions to our stockholders.
Many factors that are beyond our control affect the real estate market and could affect our ability to sell properties for the price, on the terms or within the time frame that we desire. These factors include general economic conditions, the availability of financing, interest rates and other factors, including supply and demand. Because real estate investments are relatively illiquid, we have a limited ability to vary our portfolio in response to changes in economic or other conditions. Further, before we can sell a property on the terms we want, it may be necessary to expend funds to correct defects or to make improvements. However, we can give no assurance that we will have the funds available to correct such defects or to make such improvements. We may be unable to sell our properties at a profit. Our inability to sell properties at the time and on the terms we want could reduce our cash flow and limit our ability to make distributions to our stockholders and could reduce the value of our stockholders’ investment.
If we sell a property by providing financing to the purchaser, we will bear the risk of default by the purchaser, which could delay or reduce the distributions available to our stockholders.
If we decide to sell any of our properties, we intend to use our best efforts to sell them for cash; however, in some instances, we may sell our properties by providing financing to purchasers. When we provide financing to a purchaser, we will bear the risk that the purchaser may default, which could reduce our cash distributions to stockholders. Even in the absence of a purchaser default, the distribution of the proceeds of the sale to our stockholders, or the reinvestment of the proceeds in other assets, will be delayed until the promissory notes or other property we may accept upon a sale are actually paid, sold, refinanced or otherwise disposed.
27
Table of Contents
Our joint venture partners could take actions that decrease the value of an investment to us and lower our stockholders’ overall return.
We may enter into joint ventures with third parties to acquire properties and other assets. We may also purchase and develop properties in joint ventures or in partnerships, co-tenancies or other co-ownership arrangements. Such investments may involve risks not otherwise present with other methods of investment, including, for example, the following risks:
| • | that our co-venturer, co-tenant or partner in an investment could become insolvent or bankrupt; |
| • | that such co-venturer, co-tenant or partner may at any time have economic or business interests or goals that are or that become inconsistent with our business interests or goals; or |
| • | that such co-venturer, co-tenant or partner may be in a position to take action contrary to our instructions or requests or contrary to our policies or objectives. |
Any of the above might subject a property to liabilities in excess of those contemplated and thus reduce our returns on that investment and the value of our stockholders’ investment.
Costs imposed pursuant to governmental laws and regulations may reduce our net income and the cash available for distributions to our stockholders.
Real property and the operations conducted on real property are subject to federal, state and local laws and regulations relating to protection of the environment and human health. We could be subject to liability in the form of fines, penalties or damages for noncompliance with these laws and regulations. These laws and regulations generally govern wastewater discharges, air emissions, the operation and removal of underground and above-ground storage tanks, the use, storage, treatment, transportation and disposal of solid and hazardous materials, the remediation of contamination associated with the release or disposal of solid and hazardous materials, the presence of toxic building materials, and other health and safety-related concerns.
Some of these laws and regulations may impose joint and several liability on the tenants, owners or operators of real property for the costs to investigate or remediate contaminated properties, regardless of fault, whether the contamination occurred prior to purchase, or whether the acts causing the contamination were legal. Our tenants’ operations, the condition of properties at the time we buy them, operations in the vicinity of our properties, such as the presence of underground storage tanks, or activities of unrelated third parties may affect our properties.
The presence of hazardous substances, or the failure to properly manage or remediate these substances, may hinder our ability to sell, rent or pledge such property as collateral for future borrowings. Any material expenditures, fines, penalties, or damages we must pay will reduce our ability to make distributions and may reduce the value of our stockholders’ investment.
The costs of defending against claims of environmental liability, of complying with environmental regulatory requirements, of remediating any contaminated property, or of paying personal injury claims could reduce the amounts available for distribution to our stockholders.
Under various federal, state and local environmental laws, ordinances and regulations, a current or previous real property owner or operator may be liable for the cost of removing or remediating hazardous or toxic substances on, under or in such property. These costs could be substantial. Such laws often impose liability whether or not the owner or operator knew of, or was responsible for, the presence of such hazardous or toxic substances. Environmental laws also may impose liens on property or restrictions on the manner in which property may be used or businesses may be operated, and these restrictions may require substantial expenditures or prevent us from entering into leases with prospective tenants that may be impacted by such laws. Environmental laws provide for sanctions for noncompliance and may be enforced by governmental agencies or, in certain circumstances, by private parties. Certain environmental laws and common law principles could be used to impose liability for the release of and exposure to hazardous substances, including asbestos-containing materials and lead-based paint. Third parties may seek recovery from real property owners or operators for personal injury or property damage associated with exposure to released hazardous substances. The costs of defending against claims of environmental liability, of complying with environmental regulatory requirements, of remediating any contaminated property, or of paying personal injury claims could reduce the amounts available for distribution to our stockholders.
All of our properties have been subject to Phase I environmental assessments at the time they were acquired. Some of the properties we have acquired are subject to potential environmental liabilities arising primarily from historic activities at or in the vicinity of the properties.
28
Table of Contents
Four properties acquired as part of the National Industrial Portfolio are located on or near former military bases that have been designated as either National Priority List sites or defense clean-up sites under the Comprehensive Environmental Response Compensation and Liability Act (“CERCLA”). These include 1045 Sheridan, Chicopee, MA; 15 Independence Drive, Devens, MA; and 50 Independence Drive, Devens, MA. Another property that is part of the portfolio, 9410 Heinz Way, Commerce City, CO, is a former defense armaments manufacturing site that is near the Rocky Mountain Arsenal National Priority List site. Additionally, some of the properties identified below in connection with activity use limitations and underground storage tanks have residual hazardous substance contamination from former operations. CERCLA imposes joint and several liability for clean-up costs on current owners of properties with hazardous substance contamination. Purchasers of contaminated properties may mitigate the risk of being held liable for costs of clean-up and related responsibilities by conducting “all appropriate inquiry” prior to the purchase of the property and compliance with the steps necessary to obtain and maintain “bona fide purchaser” status. We believe that we have taken the steps to obtain and maintain bona fide purchaser status, but we can give no assurance that a court would agree with us if someone were to seek to hold us liable. Because identified responsible parties, including the United States Government and large defense contractors, have taken responsibility for remedial actions relative to these properties and the existing tenants at these properties are generally large companies, we do not believe that we will face material liability with respect to any of these properties. The National Industrial Portfolio is owned by the New Leaf – KBS JV, LLC, a joint venture in which we own an 80% membership interest.
In addition, we own several properties that are subject to activity use limitations (“AULs”) whereby the government has placed limitations on redevelopment of the properties for certain uses, particularly residential uses. AULs are typically imposed on property that has environmental contamination in exchange for less stringent environmental clean-up standards. In view of the locations of the affected properties, the environmental characteristics of the contaminants and the characteristics of the neighborhoods, we do not believe that these AULs have a material impact on our portfolio valuation, but they could in individual cases result in a depression of the value of a property, should we resell the property for uses different from its existing uses. Properties subject to AULs include 495-515 Woburn, Tewksbury, MA; 15 Independence Drive, Devens, MA; 100 Simplex Drive, Westminster, MA; 57-59 Daniel Webster Highway, Merrimack, NH; and ADP Plaza, Portland, OR.
Some of the properties in our portfolio, particularly the warehouse and light industrial properties, had or have underground storage tanks either for space heating of the buildings, fueling motor vehicles, or industrial processes. Many of the underground storage tanks at the premises have been replaced over time. Given changing standards regarding closure of underground storage tanks and associated contamination, many of the tanks may not have been closed in compliance with current standards. Some of these properties likely have some residual petroleum or chemical contamination. Properties exhibiting these risks include 555 Taylor Road, Enfield, CT; 85 Moosup Pond Road, Plainfield, CT; 129 Concord Road, Billerica, MA (Rivertech); 111 Adams Road, Clinton, MA; 133 Jackson Avenue, Ellicott, NY; 1200 State Fair Boulevard, Geddes, NY; 3407 Walters Road, Van Buren, NY; ADP Plaza, Portland, OR; Shaffer Road and Route 255, DuBois, PA; 9700 West Gulf Bank Road, Houston, TX; and 2200 South Business 45, Corsicana, TX.
New Leaf – KBS JV, LLC purchased an environmental insurance policy from Indian Harbor Insurance Company that provides ten years of coverage for pollution legal liability and remediation legal liability, among other coverage for the National Industrial Portfolio. We believe the scope and limits of the policy are appropriate for the risks presented by our properties.
Costs associated with complying with the Americans with Disabilities Act may decrease cash available for distributions.
Our properties may be subject to the Americans with Disabilities Act of 1990, as amended. Under the Disabilities Act, all places of public accommodation are required to comply with federal requirements related to access and use by disabled persons. The Disabilities Act has separate compliance requirements for “public accommodations” and “commercial facilities” that generally require that buildings and services be made accessible and available to people with disabilities. The Disabilities Act’s requirements could require removal of access barriers and could result in the imposition of injunctive relief, monetary penalties or, in some cases, an award of damages. Any funds used for Disabilities Act compliance will reduce our net income and the amount of cash available for distributions to our stockholders.
29
Table of Contents
Uninsured losses relating to real property or excessively expensive premiums for insurance coverage could reduce our cash flows and the return on our stockholders’ investment.
There are types of losses, generally catastrophic in nature, such as losses due to wars, acts of terrorism, earthquakes, floods, hurricanes, pollution or environmental matters that are uninsurable or not economically insurable, or may be insured subject to limitations, such as large deductibles or co-payments. Insurance risks associated with potential acts of terrorism could sharply increase the premiums we pay for coverage against property and casualty claims. Additionally, mortgage lenders in some cases have begun to insist that commercial property owners purchase coverage against terrorism as a condition for providing mortgage loans. Such insurance policies may not be available at reasonable costs, if at all, which could inhibit our ability to finance or refinance our properties. In such instances, we may be required to provide other financial support, either through financial assurances or self-insurance, to cover potential losses. We may not have adequate coverage for such losses. If any of our properties incurs a casualty loss that is not fully insured, the value of our assets will be reduced by any such uninsured loss, which may reduce the value of our stockholders’ investment. In addition, other than any working capital reserve or other reserves we may establish, we have no source of funding to repair or reconstruct any uninsured property. Also, to the extent we must pay unexpectedly large amounts for insurance, we could suffer reduced earnings that would result in lower distributions to stockholders.
Terrorist attacks and other acts of violence or war may affect the markets in which we plan to operate, which could delay or hinder our ability to meet our investment objectives and reduce our stockholders’ overall return.
Terrorist attacks or armed conflicts may directly impact the value of our properties through damage, destruction, loss or increased security costs. Many of our investments are in major metropolitan areas. Insurance risks associated with potential acts of terrorism against office and other properties in major metropolitan areas could sharply increase the premiums we pay for coverage against property and casualty claims. Additionally, mortgage lenders in some cases have begun to insist that specific coverage against terrorism be purchased by commercial owners as a condition for providing loans. We may not be able to obtain insurance against the risk of terrorism because it may not be available or may not be available on terms that are economically feasible. The terrorism insurance that we obtain may not be sufficient to cover loss for damages to our properties as a result of terrorist attacks. In addition, certain losses resulting from these types of events are uninsurable and others may not be covered by our terrorism insurance. The costs of obtaining terrorism insurance and any uninsured losses we may suffer as a result of terrorist attacks could reduce the returns on our investments and limit our ability to make distributions to our stockholders.
Risks Related to Real Estate-Related Investments
Our investments in real estate-related investments are subject to the risks typically associated with real estate.
Our investments in mortgage, mezzanine or other real estate loans are generally directly or indirectly secured by a lien on real property (or the equity interests in an entity that owns real property) that, upon the occurrence of a default on the loan, could result in our taking ownership of the property. The values of the properties ultimately securing our loans may change after we acquire or originate those loans. If the values of the underlying properties drop, our risk will increase because of the lower value of the security associated with such loans. In this manner, real estate values could impact the values of our loan investments. Our investments in mortgage-backed securities, collateralized debt obligations and other real estate-related investments are similarly affected by real estate property values. Therefore, our real estate-related investments are subject to the risks typically associated with real estate, which are described above under the heading “—General Risks Related to Investments in Real Estate.”
Our investments in mortgage, mezzanine, bridge and other real estate loans are subject to interest rate fluctuations that affect our returns as compared to market interest rates; accordingly, the value of our stockholders’ investment in us is subject to fluctuations in interest rates.
With respect to our fixed rate, long-term loans, if interest rates rise, the loans could yield a return that is lower than then-current market rates. If interest rates decrease, we will be adversely affected to the extent that loans are prepaid because we may not be able to make new loans at the higher interest rate. With respect to our variable rate loans, if interest rates decrease, our revenues will also decrease. For these reasons, our returns on these loans and the value of our stockholders’ investment in us is subject to fluctuations in interest rates.
30
Table of Contents
The mortgage loans we invest in and the mortgage loans underlying the mortgage securities we invest in are subject to delinquency, foreclosure and loss, which could result in losses to us.
Commercial real estate loans are secured by multifamily or commercial property and are subject to risks of delinquency and foreclosure. The ability of a borrower to repay a loan secured by an income-producing property typically is dependent primarily upon the successful operation of such property rather than upon the existence of independent income or assets of the borrower. If the net operating income of the property is reduced, the borrower’s ability to repay the loan may be impaired. Net operating income of an income-producing property can be affected by, among other things: tenant mix, success of tenant businesses, property management decisions, property location and condition, competition from comparable types of properties, changes in laws that increase operating expenses or limit rents that may be charged, any need to address environmental contamination at the property, the occurrence of any uninsured casualty at the property, changes in national, regional or local economic conditions and/or specific industry segments, declines in regional or local real estate values, declines in regional or local rental or occupancy rates, increases in interest rates, real estate tax rates and other operating expenses, changes in governmental rules, regulations and fiscal policies, including environmental legislation, natural disasters, terrorism, social unrest and civil disturbances.
In the event of any default under a mortgage loan held directly by us, we will bear a risk of loss of principal to the extent of any deficiency between the value of the collateral and the principal and accrued interest of the mortgage loan, which could have a material adverse effect on our cash flow from operations. Foreclosure of a mortgage loan can be an expensive and lengthy process that could have a substantial negative effect on our anticipated return on the foreclosed mortgage loan. In the event of the bankruptcy of a mortgage loan borrower, the mortgage loan to such borrower will be deemed to be secured only to the extent of the value of the underlying collateral at the time of bankruptcy (as determined by the bankruptcy court), and the lien securing the mortgage loan will be subject to the avoidance powers of the bankruptcy trustee or debtor-in-possession to the extent the lien is unenforceable under state law.
Delays in liquidating defaulted mortgage loans could reduce our investment returns.
If there are defaults under our mortgage loan investments, we may not be able to repossess and sell the underlying properties quickly. The resulting time delay could reduce the value of our investment in the defaulted mortgage loans. An action to foreclose on a property securing a mortgage loan is regulated by state statutes and regulations and is subject to many of the delays and expenses of other lawsuits if the defendant raises defenses or counterclaims. In the event of default by a mortgagor, these restrictions, among other things, may impede our ability to foreclose on or sell the mortgaged property or to obtain proceeds sufficient to repay all amounts due to us on the mortgage loan.
The mezzanine loans in which we invest involve greater risks of loss than senior loans secured by the same properties.
We invest in mezzanine loans that take the form of subordinated loans secured by a pledge of the ownership interests of either the entity owning (directly or indirectly) the real property or the entity that owns the interest in the entity owning the real property. These types of investments may involve a higher degree of risk than long-term senior mortgage lending secured by income-producing real property because the investment may become unsecured as a result of foreclosure by the senior lender. In the event of a bankruptcy of the entity providing the pledge of its ownership interests as security, we may not have full recourse to the assets of such entity, or the assets of the entity may not be sufficient to satisfy our mezzanine loan. If a borrower defaults on our mezzanine loan or debt senior to our loan, or in the event of a borrower bankruptcy, our mezzanine loan will be satisfied only after the senior debt. As a result, we may not recover some or all of our investment. In addition, mezzanine loans may have higher loan-to-value ratios than conventional mortgage loans, resulting in less equity in the real property and increasing the risk of loss of principal.
The B-Notes in which we invest may be subject to additional risks relating to the privately negotiated structure and terms of the transaction, which may result in losses to us.
We invest in B-Notes. A B-Note is a mortgage loan typically (i) secured by a first mortgage on a single large commercial property or group of related properties and (ii) subordinated to an A-Note secured by the same first mortgage on the same collateral. As a result, if a borrower defaults, there may not be sufficient funds remaining for B-Note holders after payment to the A-Note holders. Since each transaction is privately negotiated, B-Notes can vary in their structural characteristics and risks. For example, the rights of holders of B-Notes to control the process following a borrower default may be limited.
31
Table of Contents
Our investments in subordinated loans and subordinated mortgage-backed securities may be subject to losses.
We have invested in subordinated loans and subordinated mortgage-backed securities. In the event a borrower defaults on a subordinated loan and lacks sufficient assets to satisfy our loan, we may suffer a loss of principal or interest. In the event a borrower declares bankruptcy, we may not have full recourse to the assets of the borrower, or the assets of the borrower may not be sufficient to satisfy the loan. If a borrower defaults on our loan or on debt senior to our loan, or in the event of a borrower bankruptcy, our loan will be satisfied only after the senior debt is paid in full. Where debt senior to our loan exists, the presence of intercreditor arrangements may limit our ability to amend our loan documents, assign our loans, accept prepayments, exercise our remedies (through “standstill periods”), and control decisions made in bankruptcy proceedings relating to borrowers.
In general, losses on a mortgage loan included in a securitization will be borne first by the equity holder of the property, then by a cash reserve fund or letter of credit, if any, and then by the “first loss” subordinated security holder. In the event of default and the exhaustion of any equity support, reserve fund, letter of credit and any classes of securities junior to those in which we invest, we may not be able to recover all of our investment in the securities we purchase. In addition, if the underlying mortgage portfolio has been overvalued by the originator, or if the values subsequently decline and, as a result, less collateral is available to satisfy interest and principal payments due on the related mortgage-backed securities, the securities in which we invest may effectively become the “first loss” position behind the more senior securities, which may result in significant losses to us.
Risks of cost overruns and non-completion of the construction or renovation of the properties underlying loans we make or acquire may materially adversely affect our investment.
The renovation, refurbishment or expansion by a borrower under a mortgaged or leveraged property involves risks of cost overruns and non-completion. Costs of construction or improvements to bring a property up to standards established for the market position intended for that property may exceed original estimates, possibly making a project uneconomical. Other risks may include: environmental risks and construction, rehabilitation and subsequent leasing of the property not being completed on schedule. If such construction or renovation is not completed in a timely manner, or if it costs more than expected, the borrower may experience a prolonged impairment of net operating income and may not be able to make payments on our investment and we may not recover some or all of our investment.
The CMBS in which we invest are subject to all of the risks of the underlying mortgage loans and the risks of the securitization process.
CMBS, or commercial mortgage-backed securities, are securities that evidence interests in, or are secured by, a single commercial mortgage loan or a pool of commercial mortgage loans. Accordingly, these securities are subject to all of the risks of the underlying mortgage loans.
In a rising interest rate environment, the value of CMBS may be adversely affected when payments on underlying mortgages do not occur as anticipated, resulting in the extension of the security’s effective maturity and the related increase in interest rate sensitivity of a longer-term instrument. The value of CMBS may also change due to shifts in the market’s perception of issuers and regulatory or tax changes adversely affecting the mortgage securities market as a whole. In addition, CMBS are subject to the credit risk associated with the performance of the underlying mortgage properties. In certain instances, third-party guarantees or other forms of credit support can reduce the credit risk.
CMBS are also subject to several risks created through the securitization process. Subordinate CMBS are paid interest only to the extent that there are funds available to make payments. To the extent the collateral pool includes delinquent loans, there is a risk that interest payments on subordinate CMBS will not be fully paid. Subordinate CMBS are also subject to greater credit risk than those CMBS that are more highly rated.
To the extent that we make investments in real estate-related securities and loans, a portion of those investments may be illiquid and we may not be able to adjust our portfolio in response to changes in economic and other conditions.
Certain of the real estate-related securities that we own are not registered under the relevant securities laws, resulting in a prohibition against their transfer, sale, pledge or other disposition except in a transaction that is exempt from the registration requirements of, or is otherwise in accordance with, those laws. As a result, our ability to vary our portfolio in response to changes in economic and other conditions may be relatively limited. The mezzanine and bridge loans we own are particularly illiquid investments due to their short life, their unsuitability for securitization and the greater difficulty of recoupment in the event of a borrower’s default.
32
Table of Contents
Delays in restructuring or liquidating non-performing real estate securities could reduce the return on our stockholders’ investment.
Real estate securities may become non-performing after acquisition for a wide variety of reasons. Such non-performing real estate investments may require a substantial amount of workout negotiations and/or restructuring, which may entail, among other things, a substantial reduction in the interest rate and a substantial write-down of such loan or asset. However, even if a restructuring is successfully accomplished, upon maturity of such real estate security, replacement “takeout” financing may not be available. We may find it necessary or desirable to foreclose on some of the collateral securing one or more of our investments. Intercreditor provisions may substantially interfere with our ability to do so. Even if foreclosure is an option, the foreclosure process can be lengthy and expensive. Borrowers often resist foreclosure actions by asserting numerous claims, counterclaims and defenses, including, without limitation, lender liability claims and defenses, in an effort to prolong the foreclosure action. In some states, foreclosure actions can take up to several years or more to litigate. At any time during the foreclosure proceedings, the borrower may file for bankruptcy, which would have the effect of staying the foreclosure action and further delaying the foreclosure process. Foreclosure litigation tends to create a negative public image of the collateral property and may result in disrupting ongoing leasing and management of the property. Foreclosure actions by senior lenders may substantially affect the amount that we may earn or recover from an investment.
We depend on debtors for our revenue, and, accordingly, our revenue and our ability to make distributions to our stockholders is dependent upon the success and economic viability of such debtors.
The success of our real estate-related investments such as loans and debt and derivative securities will materially depend on the financial stability of the debtors underlying such investments. The inability of a single major debtor or a number of smaller debtors to meet their payment obligations could result in reduced revenue or losses. In the event of a debtor default or bankruptcy, we may experience delays in enforcing our rights as a creditor, and such rights may be subordinated to the rights of other creditors. These events could negatively affect the cash available for distribution to our stockholders and the value of our stockholders’ investment.
Prepayments can adversely affect the yields on our investments.
The yields on our debt investments may be affected by the rate of prepayments differing from our projections. Prepayments on debt instruments, where permitted under the debt documents, are influenced by changes in current interest rates and a variety of economic, geographic and other factors beyond our control, and consequently, such prepayment rates cannot be predicted with certainty. If we are unable to invest the proceeds of such prepayments received, the yield on our portfolio will decline. In addition, we may acquire assets at a discount or premium and if the asset does not repay when expected, our anticipated yield may be impacted. Under certain interest rate and prepayment scenarios we may fail to recoup fully our cost of acquisition of certain investments.
Hedging against interest rate exposure may adversely affect our earnings, limit our gains or result in losses, which could adversely affect cash available for distribution to our stockholders.
We have entered and in the future may enter into interest rate swap agreements or pursue other interest rate hedging strategies. Our hedging activity will vary in scope based on the level of interest rates, the type of portfolio investments held, and other changing market conditions. Interest rate hedging may fail to protect or could adversely affect us because, among other things:
| • | interest rate hedging can be expensive, particularly during periods of rising and volatile interest rates; |
| • | available interest rate hedging may not correspond directly with the interest rate risk for which protection is sought; |
| • | the duration of the hedge may not match the duration of the related liability or asset; |
| • | the amount of income that a REIT may earn from hedging transactions to offset interest rate losses is limited by federal tax provisions governing REITs; |
| • | the credit quality of the party owing money on the hedge may be downgraded to such an extent that it impairs our ability to sell or assign our side of the hedging transaction; |
| • | the party owing money in the hedging transaction may default on its obligation to pay; and |
| • | we may purchase a hedge that turns out not to be necessary, i.e., a hedge that is out of the money. |
33
Table of Contents
Any hedging activity we engage in may adversely affect our earnings, which could adversely affect cash available for distribution to our stockholders. Therefore, while we may enter into such transactions to seek to reduce interest rate risks, unanticipated changes in interest rates may result in poorer overall investment performance than if we had not engaged in any such hedging transactions. In addition, the degree of correlation between price movements of the instruments used in a hedging strategy and price movements in the portfolio positions being hedged or liabilities being hedged may vary materially. Moreover, for a variety of reasons, we may not seek to establish a perfect correlation between such hedging instruments and the portfolio holdings being hedged. Any such imperfect correlation may prevent us from achieving the intended accounting treatment and may expose us to risk of loss.
Hedging instruments often are not traded on regulated exchanges, guaranteed by an exchange or its clearing house, or regulated by any U.S. or foreign governmental authorities and involve risks and costs.
The cost of using hedging instruments increases as the period covered by the instrument increases and during periods of rising and volatile interest rates. We may increase our hedging activity and thus increase our hedging costs during periods when interest rates are volatile or rising and hedging costs have increased. In addition, hedging instruments involve risk since they often are not traded on regulated exchanges, guaranteed by an exchange or its clearing house, or regulated by any U.S. or foreign governmental authorities. Consequently, there are no requirements with respect to record keeping, financial responsibility or segregation of customer funds and positions. Furthermore, the enforceability of agreements underlying derivative transactions may depend on compliance with applicable statutory, commodity and other regulatory requirements and, depending on the identity of the counterparty, applicable international requirements. The business failure of a hedging counterparty with whom we enter into a hedging transaction will most likely result in a default. Default by a party with whom we enter into a hedging transaction may result in the loss of unrealized profits and force us to cover our resale commitments, if any, at the then current market price. Although generally we will seek to reserve the right to terminate our hedging positions, it may not always be possible to dispose of or close out a hedging position without the consent of the hedging counterparty, and we may not be able to enter into an offsetting contract in order to cover our risk. We cannot be certain that a liquid secondary market will exist for hedging instruments purchased or sold, and we may be required to maintain a position until exercise or expiration, which could result in losses.
Declines in the market values of our investments may adversely affect periodic reported results of operations and credit availability, which may reduce earnings and, in turn, cash available for distribution to our stockholders.
A portion of our assets may be classified for accounting purposes as “available-for-sale.” These investments are carried at estimated fair value and temporary changes in the market values of those assets will be directly charged or credited to stockholders’ equity without impacting net income on the income statement. Moreover, if we determine that a decline in the estimated fair value of an available-for-sale security below its amortized value is other-than-temporary, we will recognize a loss on that security on the income statement, which will reduce our earnings in the period recognized.
A decline in the market value of our assets may adversely affect us particularly in instances where we have borrowed money based on the market value of those assets. If the market value of those assets declines, the lender may require us to post additional collateral to support the loan. If we were unable to post the additional collateral, we may have to sell assets at a time when we might not otherwise choose to do so. A reduction in credit available may reduce our earnings and, in turn, cash available for distribution to stockholders.
Further, credit facility providers may require us to maintain a certain amount of cash reserves or to set aside unlevered assets sufficient to maintain a specified liquidity position, which would allow us to satisfy our collateral obligations. As a result, we may not be able to leverage our assets as fully as we would choose, which could reduce our return on equity. In the event that we are unable to meet these contractual obligations, our financial condition could deteriorate rapidly.
Market values of our investments may decline for a number of reasons, such as changes in prevailing market rates, increases in defaults, increases in voluntary prepayments for those investments that we have that are subject to prepayment risk, widening of credit spreads and downgrades of ratings of the securities by ratings agencies.
34
Table of Contents
Some of our portfolio investments will be carried at estimated fair value as determined by us and, as a result, there may be uncertainty as to the value of these investments.
Some of our portfolio investments will be in the form of securities that are recorded at fair value but that have limited liquidity or are not publicly traded. The fair value of securities and other investments that have limited liquidity or are not publicly traded may not be readily determinable. We estimate the fair value of these investments on a quarterly basis. Because such valuations are inherently uncertain, may fluctuate over short periods of time and may be based on numerous estimates, our determinations of fair value may differ materially from the values that would have been used if a ready market for these securities existed. The value of our common stock could be adversely affected if our determinations regarding the fair value of these investments are materially higher than the values that we ultimately realize upon their disposal.
If our investments in the Tribeca Building, GKK Mezzanine Loan and/or the HSC Partners Joint Venture, which owns the Arden Portfolio, do not perform, we could suffer significant losses, which could cause us to lower our dividend rate and could reduce the return on our stockholders’ investment.
Tribeca Loans
In 2006 and 2007, we made three investments related to the conversion of an eight-story loft building into a 10-story condominium building with 62 units (the “Tribeca Building”) located at 415 Greenwich Street in New York, New York. The project was capitalized in part by a senior mortgage loan (the “Tribeca Senior Mortgage Loan”), a senior mezzanine loan (the “Senior Tribeca Mezzanine Loan”), and two junior mezzanine loans (the “First Tribeca Mezzanine Loan” and the “Second Tribeca Mezzanine Loan”, collectively, the “Tribeca Junior Mezzanine Loans”). As of December 31, 2009, our outstanding investments consisted of (i) a 25% interest in the Tribeca Senior Mortgage Loan (the “Tribeca Senior Mortgage Loan Participation”) and (ii) the Tribeca Junior Mezzanine Loans (collectively with the Tribeca Senior Mortgage Loan Participation, the “Tribeca Loans”). The unpaid principal balances under the Tribeca Senior Mortgage Loan Participation, the First Tribeca Mezzanine Loan, and the Second Tribeca Mezzanine Loan were $8.1 million, $15.9 million and $33.1 million, respectively, as of December 31, 2009.
The Tribeca Junior Mezzanine Loans are subordinate to the $32.3 million Tribeca Senior Mortgage Loan and a $16.2 million Senior Tribeca Mezzanine Loan. We did not own the Senior Tribeca Mezzanine Loan as of December 31, 2009.
On January 5, 2009, we entered into a letter agreement with the holder of the Senior Tribeca Mezzanine Loan consenting to pay to the holder of the Senior Tribeca Mezzanine Loan 56% of the aggregate amount of interest due to us under the Second Tribeca Mezzanine Loan effective as of December 1, 2008. In addition, we will pay the holder of the Senior Tribeca Mezzanine Loan 63.3% of the interest due on any protective advances otherwise payable to us as holder of the Tribeca Junior Mezzanine Loans. The allocated interest payment will be applied to the outstanding principal balance of the Senior Tribeca Mezzanine Loan.
On September 26, 2008, the general contractor for the Tribeca Building filed a mechanics’ lien on the property for approximately $12.0 million. On October 23, 2008, the bonding company filed a mechanics’ lien on the property for approximately $3.3 million. On January 5, 2009, the Company entered into an agreement with the borrower, the bonding company and the general contractor, among others, which, among other things, sets forth a process by which the liens may be released to permit the sale of condominium units and provides that a portion of net sales proceeds from the sale of condominium units will be deposited into an escrow account as collateral against the lien.
On August 13, 2009, we entered into a modification to the Tribeca Junior Mezzanine Loans with the holder of the 75% interest in the Tribeca Senior Mortgage Loan and the holder of the Senior Tribeca Mezzanine Loan consenting to divert 100% of the interest due to us under the Tribeca Junior Mezzanine Loans to the Senior Tribeca Mezzanine Loan to be applied as principal repayments, and should that loan be retired during the term of the extension, 100% of the interest due to us under the Tribeca Junior Mezzanine Loans would be diverted to pay down the Tribeca Senior Mortgage Loan until that loan is paid down in full. We would be entitled to recoup all of the interest previously diverted to the senior lenders from the borrower after the Senior Tribeca Mezzanine Loan and the Tribeca Senior Mortgage Loan are paid off. The modification extended the maturity date of all the Tribeca Loans to February 1, 2010 and provided for an additional extension to April 1, 2010, subject to certain terms and restrictions.
35
Table of Contents
Subsequent to December 31, 2009, the borrower under these loans defaulted and we foreclosed on this project by exercising our right to accept 100% of the ownership interest of the borrower under the Second Tribeca Mezzanine Loan pursuant to the Second Tribeca Mezzanine Loan documents. As a result of the assignment in lieu of foreclosure, as of December 31, 2009, we valued our investments in the Tribeca Loans at their aggregate fair values of $38.1 million. We expect the fair values of the Tribeca Loans as of December 31, 2009 will be equal to our consolidated investment in the Tribeca Building at the time of foreclosure. We paid approximately $3.3 million in transfer taxes as a result of the foreclosure. In order to protect our existing investment in the Tribeca Building, subsequent to foreclosing, our board of directors authorized the purchase of the Senior Tribeca Mezzanine Loan for $15.0 million.
As of December 31, 2009, based on total number of units available for sale, approximately 56% of the condominium units in the Tribeca Building had been sold. Further delays in the sale of condominiums and/or adverse changes to the market price for these condominiums will significantly impact the performance of our investment in the Tribeca Building. As a result of our ownership interest in this building as well as our obligation to continue paying debt service and operating expenditures, we could incur significant losses on this investment, which could cause us to lower our dividend rate and could reduce the return on our stockholders’ investment.
GKK Mezzanine Loan
On August 22, 2008, we, through wholly owned subsidiaries (collectively, “KBS GKK”), acquired a senior mezzanine loan with a face amount of $500,000,000 (the “GKK Mezzanine Loan”), which was used to fund a portion of Gramercy Capital Corp.’s (“Gramercy”) acquisition of American Financial Realty Trust (“AFR”) that closed on April 1, 2008. The purchase price of the GKK Mezzanine Loan was approximately $496.0 million plus closing costs. The borrowers under the GKK Mezzanine Loan are (i) the wholly owned subsidiary of Gramercy formed to own 100% of the equity interests in AFR (“AFR Owner”), (ii) AFR and (iii) certain subsidiaries of AFR that directly or indirectly own equity interests in the entities that own the AFR portfolio of properties (collectively, AFR Owner, AFR and these subsidiaries are the “Borrower”).
The GKK Mezzanine Loan represents a significant investment to us. As of December 31, 2009, it comprised 18% of our total assets and 71% of our total investments in loans receivable, after loan loss reserves. During the year ended December 31, 2009, the GKK Mezzanine Loan provided 10% of the Company’s revenues and 49% of the Company’s interest income. Although the borrower has been meeting its debt service obligations, there is no guarantee that it will continue to do so in the future. On March 9, 2010, the Borrower exercised its option to extend the maturity of this loan to March 2011. On March 15, 2010, Gramercy issued a press release stating that the Gramercy Realty portfolio, which is the division of Gramercy that contains the Borrower, will experience significant rollover, rent step-downs and capital requirements during the next 12 months. As a result, the Gramercy Realty portfolio is expected to generate negative cash flow during the extended term of the GKK Mezzanine Loan. In addition, Gramercy noted in the press release that it has retained EdgeRock Realty Advisors, LLC, an FTI Company, to assist in evaluating strategic alternatives and the potential restructuring of Gramercy Realty’s mortgage and mezzanine debt. We will continue to monitor the performance of the Gramercy Realty portfolio and the performance of the Borrower under the terms of the GKK Mezzanine Loan. While we believe it is unlikely that we will be repaid our principal upon maturity of this loan, we expect to extend the maturity of the loan for a period of time sufficient for Gramercy Realty to stabilize its portfolio. The GKK Mezzanine Loan is subordinate to secured senior loans in the aggregate principal amount of $1.8 billion at December 31, 2009.
The GKK Mezzanine Loan is security for two repurchase agreements totaling $280.6 million as of December 31, 2009. These repurchase agreements mature on March 9, 2011. KBS Real Estate Investment Trust, Inc. is a guarantor of these repurchase agreements. Upon maturity of the repurchase agreements, KBS GKK would be required to repay these amounts, refinance the balance or renegotiate the terms of the repurchase agreements. While we expect to extend the terms of the GKK Mezzanine Loan at maturity, there is no guarantee that KBS GKK will be able to repay or refinance the amounts outstanding under the repurchase agreements or renegotiate the terms of the repurchase agreements. KBS GKK may be required to cure any default under the repurchase agreements by repaying the amounts outstanding under the repurchase agreements and/or relinquishing to the lenders under the repurchase agreements any of the assets securing the repurchase agreements. In addition, KBS GKK may be required to pledge or cause us, as guarantor, to pledge additional collateral for the repurchase agreements. Should KBS GKK default under the repurchase agreements, we, as guarantor of the repurchase agreements, would be obligated to cure such default. Under the terms of the guaranty, the guarantor’s liability is primary and the guarantor would be required to cure any such default by repaying the amounts outstanding under the repurchase agreements.
36
Table of Contents
HSC Partners Joint Venture-Arden Portfolio
In July 2007, the Arden Portfolio Mezzanine Loans (defined below), along with $860.0 million of mortgage loans and $475.0 million of additional mezzanine loans, were used to fund the acquisition of 33 multi-tenant office properties totaling 4.6 million square feet of rentable area in 60 buildings, located throughout Southern California (the “Arden Portfolio”). All of the mortgage and mezzanine loans related to the Arden Portfolio had an initial maturity of August 9, 2009. These loans provided three one-year extension options to the borrowers, subject to certain conditions.
On January 30, 2008, we purchased, through indirect wholly owned subsidiaries, participation interests in the M2-(B) and M3-(A) mezzanine loans (collectively, the “Arden Portfolio Mezzanine Loans”) for approximately $144.0 million plus closing costs. The original borrowers under the Arden Portfolio Mezzanine Loans were entities affiliated with Cabi Developers (“Cabi”) and are not affiliated with us or KBS Capital Advisors. On November 25, 2008, Hines Interests Limited Partnership (Hines Interests Limited Partnership and its affiliates are collectively referred to herein as “Hines”) delivered notice to all Arden Portfolio lenders that it had acquired all right, title and interest in and to the borrower under the M4 Mezzanine Loan, and had thereby acquired ownership of the Arden Portfolio. On July 8, 2009, we entered into a joint venture (the “HSC Partners Joint Venture”) with Hines and certain other Arden Portfolio mezzanine lenders. The HSC Partners Joint Venture indirectly owns the Arden Portfolio. We received preferred membership interests in the HSC Partners Joint Venture. In connection with the formation of the joint venture, the mezzanine borrowers were released from liability under the Arden Portfolio Mezzanine Loans.
The distribution structure of the joint venture’s operating agreement is designed to substantially reflect the priority of the former lenders that entered the joint venture and the payments the former lenders would have received under the prior mezzanine loans. During the year ended December 31, 2009, we earned $10.9 million between our investment in the Arden Portfolio Mezzanine Loans and our investment in the HSC Partners Joint Venture. We may continue receiving payments under our new investment in the form of preferred distributions that should reflect the interest we would have received as a lender; however, there can be no assurance that we will continue to receive payments in the future and our recourse is limited should we not receive our preferred distributions. In addition, due to existing economic conditions that have adversely impacted the value of commercial real estate, the HSC Partners Joint Venture may not be able to refinance its senior mortgage loans at maturity. As a result, there may not be value in our investment upon maturity of these senior mortgage loans. The senior mortgage loans mature on August 9, 2010 but have two one-year extension options, subject to certain conditions.
Provision for Loan Losses
Our asset-specific loan loss reserve relates to reserves for losses on loans considered impaired. We consider a loan to be impaired when, based upon current information and events, we believe that it is probable that we will be unable to collect all amounts due under the contractual terms of the loan agreement. We also consider a loan to be impaired if we grant the borrower a concession through a modification of the loan terms or if we expect to receive assets (including equity interests in the borrower) in partial satisfaction of the loan. A reserve is established when the present value of payments expected to be received, observable market prices, the estimated fair value of the collateral (for loans that are dependent on the collateral for repayment) or amounts expected to be received in partial satisfaction of an impaired loan are lower than the carrying value of that loan. Our portfolio-based loan loss reserve is a reserve against all of the loans in our portfolio that are not specifically reserved. It is based on estimated probabilities of both term and maturity default and estimated loss severities for the portfolio. Our $86.5 million of asset-specific loan loss reserves and $24.0 million of portfolio-based loan loss reserves as of December 31, 2009 may not be sufficient to cover losses under these loans.
If our investments in the Tribeca Building, GKK Mezzanine Loan and/or the HSC Partners Joint Venture, which owns the Arden Portfolio, do not perform, we could suffer significant losses. Such losses could cause us to lower our dividend rate and could reduce the return on our stockholders’ investment.
37
Table of Contents
Risks Associated with Debt Financing
We incur mortgage indebtedness and other borrowings, which increases our risk of loss due to potential foreclosure.
We may obtain lines of credit and long-term financing that may be secured by our properties and other assets. We have acquired many of our real properties by financing a portion of the price of the properties and mortgaging or pledging some or all of the properties purchased as security for that debt. We may incur additional mortgage debt on properties that we already own. In addition, we may borrow as necessary or advisable to ensure that we maintain our qualification as a REIT for federal income tax purposes, including borrowings to satisfy the REIT requirement that we distribute at least 90% of our annual REIT taxable income to our stockholders (computed without regard to the dividends-paid deduction and excluding net capital gain). We, however, can give our stockholders no assurance that we will be able to obtain such borrowings on satisfactory terms.
If we mortgage a property and there is a shortfall between the cash flow from that property and the cash flow needed to service mortgage debt on that property, then the amount of cash available for distributions to stockholders may be reduced. In addition, incurring mortgage debt increases the risk of loss of a property since defaults on indebtedness secured by a property may result in lenders initiating foreclosure actions. In that case, we could lose the property securing the loan that is in default, reducing the value of our stockholders’ investment. For tax purposes, a foreclosure of any of our properties would be treated as a sale of the property for a purchase price equal to the outstanding balance of the debt secured by the mortgage. If the outstanding balance of the debt secured by the mortgage exceeds our tax basis in the property, we would recognize taxable income on foreclosure even though we would not necessarily receive any cash proceeds. We may give full or partial guaranties to lenders of mortgage debt on behalf of the entities that own our properties. When we give a guaranty on behalf of an entity that owns one of our properties, we will be responsible to the lender for satisfaction of the debt if it is not paid by such entity. If any mortgages contain cross-collateralization or cross-default provisions, a default on a single property could affect multiple properties.
We utilize repurchase agreements as a component of our financing strategy. Repurchase agreements economically resemble short-term, variable rate financing and usually require the maintenance of specific loan-to-collateral value ratios. If the market value of the assets subject to a repurchase agreement decline, we may be required to provide additional collateral or make cash payments to maintain the loan-to-collateral value ratios.
We may also obtain recourse debt to finance our acquisitions and meet our REIT distribution requirements. If we have insufficient income to service our recourse debt obligations, our lenders could institute proceedings against us to foreclose upon our assets. If a lender successfully forecloses upon any of our assets, our ability to pay cash distributions to our stockholders will be limited and our stockholders could lose all or part of their investment.
High mortgage rates or changes in underwriting standards may make it difficult for us to refinance properties, which could reduce our cash flows from operations and the amount of cash distributions we can make.
If mortgage debt is unavailable at reasonable rates, we run the risk of being unable to refinance part or all of the property when the debt becomes due or of being unable to refinance on favorable terms. If interest rates are higher when we refinance properties, our income could be reduced. We may be unable to refinance or may only be able to partly refinance properties if underwriting standards, including loan to value ratios and yield requirements, among other requirements, are more strict than when we originally financed the properties. If any of these events occurs, our cash flow could be reduced and/or we might have to pay down existing mortgages. This, in turn, would reduce cash available for distribution to our stockholders, could cause us to require additional capital and may hinder our ability to raise capital by issuing more stock or by borrowing more money.
Lenders may require us to enter into restrictive covenants relating to our operations, which could limit our ability to make distributions to our stockholders.
When providing financing, a lender may impose restrictions on us that affect our distribution and operating policies and our ability to incur additional debt. Loan agreements we enter may contain covenants that limit our ability to further mortgage a property or that prohibit us from discontinuing insurance coverage or replacing KBS Capital Advisors as our advisor. These or other limitations would decrease our operating flexibility and our ability to achieve our operating objectives.
38
Table of Contents
Increases in interest rates could increase the amount of our debt payments and limit our ability to pay distributions to our stockholders.
We expect that we will incur additional debt in the future and increases in interest rates will increase the cost of that debt, which could reduce the cash we have available for distributions. Additionally, if we incur variable rate debt, increases in interest rates would increase our interest costs, which would reduce our cash flows and our ability to pay distributions to our stockholders. In addition, if we need to repay existing debt during periods of rising interest rates, we could be required to liquidate one or more of our investments at times that may not permit realization of the maximum return on such investments.
We have broad authority to incur debt and high debt levels could hinder our ability to make distributions and decrease the value of our stockholders’ investment.
Our policies do not limit us from incurring debt until our borrowings would exceed 75% of the cost (before deducting depreciation or other noncash reserves) of our tangible assets, and we may exceed this limit with the approval of the conflicts committee of our board of directors. As of December 31, 2009, our borrowings were approximately 52% and 55% of the cost (before depreciation or other noncash reserves) and book value (before depreciation) of our tangible assets, respectively. High debt levels would cause us to incur higher interest charges and higher debt service payments and may also be accompanied by restrictive covenants. These factors could limit the amount of cash we have available to distribute and could result in a decline in the value of our stockholders’ investment.
Federal Income Tax Risks
Failure to qualify as a REIT would reduce our net earnings available for investment or distribution.
Our qualification as a REIT will depend upon our ability to meet requirements regarding our organization and ownership, distributions of our income, the nature and diversification of our income and assets and other tests imposed by the Code. If we fail to qualify as a REIT for any taxable year after electing REIT status, we will be subject to federal income tax on our taxable income at corporate rates. In addition, we would generally be disqualified from treatment as a REIT for the four taxable years following the year of losing our REIT status. Losing our REIT status would reduce our net earnings available for investment or distribution to stockholders because of the additional tax liability. In addition, distributions to stockholders would no longer qualify for the dividends-paid deduction and we would no longer be required to make distributions. If this occurs, we might be required to borrow funds or liquidate some investments in order to pay the applicable tax.
Our stockholders may have current tax liability on distributions they elect to reinvest in our common stock.
If our stockholders participate in our dividend reinvestment plan, they will be deemed to have received, and for income tax purposes will be taxed on, the amount reinvested in shares of our common stock to the extent the amount reinvested was not a tax-free return of capital. In addition, our stockholders will be treated for tax purposes as having received an additional distribution to the extent the shares are purchased at a discount to fair market value. As a result, unless our stockholders are a tax-exempt entity, they may have to use funds from other sources to pay their tax liability on the value of the shares of common stock received.
39
Table of Contents
Even if we qualify as a REIT for federal income tax purposes, we may be subject to other tax liabilities that reduce our cash flow and our ability to make distributions to our stockholders.
Even if we qualify as a REIT for federal income tax purposes, we may be subject to some federal, state and local taxes on our income or property. For example:
| • | In order to qualify as a REIT, we must distribute annually at least 90% of our REIT taxable income to our stockholders (which is determined without regard to the dividends-paid deduction or net capital gain). To the extent that we satisfy the distribution requirement but distribute less than 100% of our REIT taxable income, we will be subject to federal corporate income tax on the undistributed income. |
| • | We will be subject to a 4% nondeductible excise tax on the amount, if any, by which distributions we pay in any calendar year are less than the sum of 85% of our ordinary income, 95% of our capital gain net income and 100% of our undistributed income from prior years. |
| • | If we have net income from the sale of foreclosure property that we hold primarily for sale to customers in the ordinary course of business or other non-qualifying income from foreclosure property, we must pay a tax on that income at the highest corporate income tax rate. |
| • | If we sell an asset, other than foreclosure property, that we hold primarily for sale to customers in the ordinary course of business, our gain would be subject to the 100% “prohibited transaction” tax unless such sale were made by one of our taxable REIT subsidiaries. |
We intend to make distributions to our stockholders to comply with the REIT requirements of the Code.
REIT distribution requirements could adversely affect our ability to execute our business plan.
From time to time, we may generate taxable income greater than our income for financial reporting purposes, or our taxable income may be greater than our cash flow available for distribution to stockholders (for example, where a borrower defers the payment of interest in cash pursuant to a contractual right or otherwise). If we do not have other funds available in these situations we could be required to borrow funds, sell investments at disadvantageous prices or find another alternative source of funds to make distributions sufficient to enable us to pay out enough of our taxable income to satisfy the REIT distribution requirement and to avoid corporate income tax and the 4% excise tax in a particular year. These alternatives could increase our costs or reduce our equity. Thus, compliance with the REIT requirements may hinder our ability to operate solely on the basis of maximizing profits.
To maintain our REIT status, we may be forced to forego otherwise attractive opportunities, which may delay or hinder our ability to meet our investment objectives and reduce our stockholders’ overall return.
To qualify as a REIT, we must satisfy certain tests on an ongoing basis concerning, among other things, the sources of our income, nature of our assets and the amounts we distribute to our stockholders. We may be required to make distributions to stockholders at times when it would be more advantageous to reinvest cash in our business or when we do not have funds readily available for distribution. Compliance with the REIT requirements may hinder our ability to operate solely on the basis of maximizing profits and the value of our stockholders’ investment.
The IRS may challenge our characterization of certain income from offshore taxable REIT subsidiaries.
We may form offshore corporate entities treated as taxable REIT subsidiaries. If we form such subsidiaries, we may receive certain “income inclusions” with respect to our equity investments in these entities. We intend to treat such income inclusions, to the extent matched by repatriations of cash in the same taxable year, as qualifying income for purposes of the 95% gross income test but not the 75% gross income test. Because there is no clear precedent with respect to the qualification of such income inclusions for purposes of the REIT gross income tests, no assurance can be given that the IRS will not assert a contrary position. If such income does not qualify for the 95% gross income test, we could be subject to a penalty tax or we could fail to qualify as a REIT, in both events only if such inclusions (along with certain other non-qualifying income) exceed 5% of our gross income.
40
Table of Contents
We may be subject to adverse legislative or regulatory tax changes.
At any time, the federal income tax laws or regulations governing REITs or the administrative interpretations of those laws or regulations may be amended. We cannot predict when or if any new federal income tax law, regulation or administrative interpretation, or any amendment to any existing federal income tax law, regulation or administrative interpretation, will be adopted, promulgated or become effective and any such law, regulation or interpretation may take effect retroactively. We and our stockholders could be adversely affected by any such change in, or any new, federal income tax law, regulation or administrative interpretation.
Retirement Plan Risks
If the fiduciary of an employee pension benefit plan subject to ERISA (such as profit sharing, Section 401(k) or pension plan) or any other retirement plan or account fails to meet the fiduciary and other standards under ERISA or the Internal Revenue Code as a result of an investment in our stock, the fiduciary could be subject to criminal and civil penalties.
There are special considerations that apply to employee benefit plans subject to the Employee Retirement Income Security Act (“ERISA”) (such as profit sharing, Section 401(k) or pension plans) and other retirement plans or accounts subject to Section 4975 of the Internal Revenue Code (such as an IRA) that are investing in our shares. Fiduciaries investing the assets of such a plan or account in our common stock should satisfy themselves that:
| • | the investment is consistent with their fiduciary and other obligations under ERISA and the Internal Revenue Code; |
| • | the investment is made in accordance with the documents and instruments governing the plan or IRA, including the plan’s or account’s investment policy; |
| • | the investment satisfies the prudence and diversification requirements of Sections 404(a)(1)(B) and 404(a)(1)(C) of ERISA and other applicable provisions of ERISA and the Internal Revenue Code; |
| • | the investment in our shares, for which no public market currently exists, is consistent with the liquidity needs of the plan or IRA; |
| • | the investment will not produce “unrelated business taxable income” for the plan or IRA; |
| • | our stockholders will be able to comply with the requirements under ERISA and the Internal Revenue Code to value the assets of the plan or IRA annually; and |
| • | the investment will not constitute a prohibited transaction under Section 406 of ERISA or Section 4975 of the Internal Revenue Code. |
With respect to the annual valuation requirements described above, we will provide an estimated value for our shares annually. For information regarding our estimated value per share, see Part II, Item 5, “Market for Registrant’s Common Equity, Related Stockholder Matters, and Issuer Purchases of Equity Securities – Market Information” of this annual report on Form 10-K. We can give no assurances that such estimated value will satisfy the applicable annual valuation requirements under ERISA and the Internal Revenue Code. The Department of Labor or the Internal Revenue Service may determine that a plan fiduciary or an IRA custodian is required to take further steps to determine the value of our common shares. In the absence of an appropriate determination of value, a plan fiduciary or an IRA custodian may be subject to damages, penalties or other sanctions.
Failure to satisfy the fiduciary standards of conduct and other applicable requirements of ERISA and the Internal Revenue Code may result in the imposition of civil and criminal penalties and could subject the fiduciary to claims for damages or for equitable remedies. In addition, if an investment in our shares constitutes a prohibited transaction under ERISA or the Internal Revenue Code, the fiduciary or IRA owner who authorized or directed the investment may be subject to the imposition of excise taxes with respect to the amount invested. In the case of a prohibited transaction involving an IRA owner, the IRA may be disqualified and all of the assets of the IRA may be deemed distributed and subjected to tax. ERISA plan fiduciaries and IRA custodians should consult with counsel before making an investment in our common shares.
41
Table of Contents
| ITEM 1B. | UNRESOLVED STAFF COMMENTS |
We have no unresolved staff comments.
| ITEM 2. | PROPERTIES |
Real Estate Investments
At December 31, 2009, our portfolio consisted of 65 properties in 23 states totaling 21.0 million rentable square feet including properties held through a consolidated joint venture. The total cost of our real estate portfolio was $2.1 billion. Based on the total cost of real estate purchased, the portfolio consisted of 56% commercial office properties and 44% industrial properties. At December 31, 2009, our portfolio was approximately 90% leased and the average annualized base rent per square foot of our real estate portfolio is $8.66. The weighted-average remaining lease term of our real estate portfolio is 4.1 years. For a discussion of our real estate portfolio, see Part I, Item 1, “Business” of this annual report on Form 10-K.
Portfolio Lease Expirations
The following table reflects lease expirations of our owned properties (including properties held through our consolidated joint venture) as of December 31, 2009:
| Year of Expiration |
Number of Leases Expiring |
Annualized Base Rent (in thousands) (1) |
% of Portfolio Annualized Base Rent Expiring |
Leased Rentable Square Feet Expiring (2) |
% of Portfolio Rentable Square Feet Expiring |
||||||||
| Month-to-Month (3) |
12 | $ | 5,125 | 3 | % | 991,387 | 5 | % | |||||
| 2010 |
83 | 18,381 | 11 | % | 1,925,000 | 10 | % | ||||||
| 2011 |
89 | 30,918 | 19 | % | 3,342,938 | 17 | % | ||||||
| 2012 |
88 | 21,982 | 13 | % | 3,972,330 | 21 | % | ||||||
| 2013 |
49 | 16,254 | 10 | % | 1,140,774 | 6 | % | ||||||
| 2014 |
62 | 20,341 | 12 | % | 1,425,406 | 7 | % | ||||||
| 2015 |
30 | 10,654 | 6 | % | 1,480,679 | 8 | % | ||||||
| 2016 |
17 | 10,690 | 6 | % | 652,990 | 3 | % | ||||||
| 2017 |
13 | 9,290 | 6 | % | 730,809 | 4 | % | ||||||
| 2018 |
10 | 5,703 | 3 | % | 877,238 | 5 | % | ||||||
| 2019 |
9 | 6,501 | 4 | % | 447,570 | 2 | % | ||||||
| Thereafter (4) |
10 | 11,880 | 7 | % | 2,377,692 | 12 | % | ||||||
| Total |
472 | $ | 167,719 | 100 | % | 19,364,813 | 100 | % | |||||
(1) Annualized base rent represents annualized contractual base rental income as of December 31, 2009, adjusted to straight-line any future contractual rent increases from the time of our acquisition through the balance of the lease term.
(2) Includes leases related to our 459,455 square foot master lease.
(3) Represents leases expiring from 2020 through 2022.
Our principal executive offices are located at 620 Newport Center Drive, Suite 1300, Newport Beach, California 92660. Our telephone number, general facsimile number and web address are (949) 417-6500, (949) 417-6520 and http://www.kbsreit.com, respectively.
| ITEM 3. | LEGAL PROCEEDINGS |
From time to time, we are party to legal proceedings that arise in the ordinary course of our business. Management is not aware of any legal proceedings of which the outcome is reasonably likely to have a material adverse effect on our results of operations or financial condition. Nor are we aware of any such legal proceedings contemplated by government agencies.
| ITEM 4. | (REMOVED AND RESERVED) |
42
Table of Contents
| ITEM 5. | MARKET FOR REGISTRANT’S COMMON EQUITY, RELATED STOCKHOLDER MATTERS AND ISSUER PURCHASES OF EQUITY SECURITIES |
Stockholder Information
As of March 19, 2010, we had approximately 180.9 million shares of common stock outstanding held by a total of approximately 42,000 stockholders. The number of stockholders is based on the records of DST Systems, Inc., who serves as our transfer agent.
Market Information
No public market currently exists for our shares of common stock, and we currently have no plans to list our shares on a national securities exchange. Until our shares are listed, if ever, our stockholders may not sell their shares unless the buyer meets the applicable suitability and minimum purchase requirements. In addition, our charter prohibits the ownership of more than 9.8% of our stock, unless exempted by our board of directors. Consequently, there is the risk that our stockholders may not be able to sell their shares at a time or price acceptable to them.
To assist the Financial Industry Regulatory Authority (“FINRA”) members and their associated persons that participated in our public offering of common stock, pursuant to FINRA Conduct Rule 5110, we disclose in each annual report distributed to stockholders a per share estimated value of the shares, the method by which it was developed, and the date of the data used to develop the estimated value. In addition, KBS Capital Advisors, our advisor, will prepare annual statements of estimated share values to assist fiduciaries of retirement plans subject to the annual reporting requirements of ERISA in the preparation of their reports relating to an investment in our shares. For these purposes, we estimate the value of our common shares as $7.17 per share as of December 31, 2009. This estimated value per share is based solely on our board of directors’ approval on November 20, 2009 of an estimated value per share of our common stock of $7.17 based on the estimated value of our assets less the estimated value of our liabilities divided by the number of shares outstanding, all as of September 30, 2009.
The estimated value per share was based upon the recommendation and valuation of our advisor. FINRA rules provide no guidance on the methodology an issuer must use to determine its estimated value per share. As with any valuation methodology, our advisor’s methodology is based upon a number of estimates and assumptions that may not be accurate or complete. Different parties with different assumptions and estimates could derive a different estimated value per share, and these differences could be significant. The estimated value per share is not audited and does not represent the fair value of our assets or liabilities according to generally accepted accounting principles (“GAAP”). Accordingly, with respect to the estimated value per share, we can give no assurance that:
| • | a stockholder would be able to resell his or her shares at this estimated value; |
| • | stockholder would ultimately realize distributions per share equal to our estimated value per share upon liquidation of our assets and settlement of our liabilities or a sale of the company; |
| • | our shares of common stock would trade at the estimated value per share on a national securities exchange; |
| • | an independent third-party appraiser or other third-party valuation firm would agree with our estimated value per share; or |
| • | the methodology used to estimate our value per share would be acceptable to FINRA or for compliance with ERISA reporting requirements. |
Further, the estimated value per share is based on the estimated value of our assets less the estimated value of our liabilities divided by the number of shares outstanding, all as of September 30, 2009. The value of our shares will fluctuate over time in response to developments related to individual assets in the portfolio and the management of those assets and in response to the real estate and finance markets. We expect to engage our advisor or an independent valuation firm to update the estimated value per share within 12 to 18 months of September 30, 2009.
For a full description of the methodologies used to value our assets and liabilities in connection with the calculation of the estimated value per share, see our Form 8-K filed with the SEC on November 23, 2009.
43
Table of Contents
Distribution Information
We intend to authorize and declare distributions based on daily record dates that will be paid on a monthly basis. We have elected to be taxed as a REIT under the Code and have operated as such beginning with our taxable year ending December 31, 2006. To qualify and maintain our qualification as a REIT, we must meet certain organizational and operational requirements, including a requirement to distribute at least 90% of our REIT taxable income (computed without regard to the dividends-paid deduction or net capital gain and which does not necessarily equal net income as calculated in accordance with GAAP). Our board of directors may authorize distributions in excess of those required for us to maintain REIT status depending on our financial condition and such other factors as our board of directors deems relevant.
During 2008 and 2009, we declared distributions based on daily record dates for each day during the period commencing January 1, 2008 through December 31, 2009. Distributions for all record dates of a given month are paid approximately 15 days after month-end. Distributions declared during 2008 and 2009, aggregated by quarter, are as follows (dollars in thousands, except per share amounts):
| 2009 | ||||||||||||||||||||
| 1st Quarter | 2nd Quarter | 3rd Quarter | 4th Quarter | Total | ||||||||||||||||
| Total Distributions Declared |
$ | 30,625 | $ | 30,904 | $ | 23,609 | $ | 23,673 | $ | 108,811 | ||||||||||
| Total Per Share Distribution |
$ | 0.172 | $ | 0.175 | $ | 0.132 | $ | 0.133 | $ | 0.612 | ||||||||||
| Annualized Rate Based on |
||||||||||||||||||||
| Purchase Price of $10.00 Per Share |
7.00 | % | 7.00 | % | 5.25 | % | 5.25 | % | 6.13 | % | ||||||||||
| 2008 | ||||||||||||||||||||
| 1st Quarter | 2nd Quarter | 3rd Quarter | 4th Quarter | Total | ||||||||||||||||
| Total Distributions Declared |
$ | 17,065 | $ | 25,162 | $ | 30,831 | $ | 31,206 | $ | 104,264 | ||||||||||
| Total Per Share Distribution |
$ | 0.175 | $ | 0.175 | $ | 0.176 | $ | 0.176 | $ | 0.702 | ||||||||||
| Annualized Rate Based on |
||||||||||||||||||||
| Purchase Price of $10.00 Per Share |
7.00 | % | 7.00 | % | 7.00 | % | 7.00 | % | 7.00 | % | ||||||||||
The tax composition of our distributions declared for the years ended December 31, 2009 and 2008 was as follows:
| 2009 | 2008 | |||||||||
| Ordinary Income |
53 | % | 63 | % | ||||||
| Return of Capital |
47 | % | 37 | % | ||||||
| Total |
100 | % | 100 | % | ||||||
Generally, our policy is to pay distributions from our cash flow from operations. In order that our stockholders could begin earning cash distributions, our advisor, KBS Capital Advisors, agreed to advance funds to us equal to the amount by which the cumulative amount of distributions declared by our board of directors from January 1, 2006 through the period ending May 31, 2010 exceeded the amount of our Funds from Operations (as defined in our advisory agreement) for the same period. We are only obligated to reimburse our advisor for these expenses if and to the extent that our cumulative Funds from Operations for the period commencing January 1, 2006 through the date of any such reimbursement exceed the lesser of (i) the cumulative amount of any distributions declared and payable to our stockholders as of the date of such reimbursement or (ii) an amount that is equal to a 7.0% cumulative, non-compounded, annual return on invested capital for our stockholders for the period from July 18, 2006 through the date of such reimbursement. No interest will accrue on the advance being made by our advisor. The advisory agreement defines Funds from Operations as funds from operations as defined by the National Association of Real Estate Investment Trusts plus (i) any acquisition expenses and acquisition fees expensed by us and that are related to any property, loan or other investment acquired or expected to be acquired by us and (ii) any non-operating noncash charges incurred by us, such as impairments of property or loans, any other-than-temporary impairments of marketable securities, or other similar charges. Through March 19, 2010, our advisor had advanced an aggregate of $1.6 million to us for cash distributions and expenses in excess of revenues, all of which is outstanding. No amount has been advanced since January 2007.
44
Table of Contents
In addition to the advance from our advisor, at December 31, 2009, we have incurred but unpaid performance fees totaling $4.9 million related to our joint venture investment in the National Industrial Portfolio. The performance fee is earned by our advisor upon our meeting certain Funds from Operations thresholds and makes our advisor’s cumulative asset management fees related to our investment in the National Industrial Portfolio joint venture equal to 0.75% of the cost of the joint venture investment on an annualized basis from the date of our investment in the joint venture through the date of calculation. As of December 31, 2009, our operations were sufficient to meet the Funds from Operations condition in the advisory agreement. Although these performance fees have been incurred as of December 31, 2009, the advisory agreement further provides that the payment of the performance fee shall only be made after the repayment of advances from our advisor discussed above. The amount of cash available for distributions in future periods will be decreased by the repayment of the advance from our advisor and the payment of our advisor’s performance fees.
If necessary in future periods, our advisor intends to defer payment of its asset management fee if the cumulative amount of our Funds from Operations (as defined in our advisory agreement) for the period commencing January 1, 2006 plus the amount of the advance from our advisor is less than the cumulative amount of distributions declared and currently payable to our stockholders. The amount of cash available for distributions in future periods will be decreased by the repayment of the advance from our advisor and the payment of our advisor’s performance fee.
Our board of directors declared distributions based on daily record dates for the period from January 1, 2010 through January 31, 2010, which we paid on February 12, 2010, and declared distributions based on daily record dates for the period from February 1, 2010 through February 28, 2010, which we paid on March 15, 2010. Our board of directors has also declared distributions based on daily record dates for the period from March 1, 2010 through March 31, 2010, which we expect to pay in April 2010; distributions based on daily record dates for the period from April 1, 2010 through April 30, 2010, which we expect to pay in May 2010; and distributions based on daily record dates for the period from May 1, 2010 through May 31, 2010, which we expect to pay in June 2010. Investors may choose to receive cash distributions or purchase additional shares through our dividend reinvestment plan. Distributions for these periods are calculated based on stockholders of record each day during these periods at a rate of $0.00143836 per share per day and equal a daily amount that, if paid each day for a 365-day period, would equal a 5.25% annualized rate based on a purchase price of $10.00 per share or a 7.32% annualized rate based on shares purchased under our dividend reinvestment plan at the current estimated value per share of $7.17.
Equity Compensation Plan
We have adopted an Employee and Independent Director Incentive Stock Plan to (i) furnish incentives to individuals chosen to receive share-based awards because we consider them capable of improving our operations and increasing our profits; (ii) encourage selected persons to accept or continue employment with our advisor; and (iii) increase the interest of our independent directors in our welfare through their participation in the growth in the value of our shares of common stock. The total number of shares of common stock we have reserved for issuance under the Employee and Independent Director Incentive Stock Plan is equal to 5% of our outstanding shares at any time, but not to exceed 10,000,000 shares. No awards have been granted under the plan as of March 19, 2010. We have no timetable for the grant of any awards under the Employee and Independent Director Incentive Stock Plan, and our board of directors has adopted a policy that prohibits grants of any awards of shares of common stock to any person under the Employee and Independent Director Stock Plan. Our Employee and Independent Director Incentive Stock Plan was approved prior to the commencement of our public offering by our board of directors and initial stockholder, KBS Capital Advisors, our advisor.
Unregistered Sales of Equity Securities
During the year ended December 31, 2009, we did not sell any equity securities that were not registered under the Securities Act of 1933.
45
Table of Contents
Share Redemption Program
We have adopted a share redemption program that may enable stockholders to sell their shares to us in limited circumstances.
Pursuant to the share redemption program, as amended to date, there are several limitations on our ability to redeem shares:
| • | Unless the shares are being redeemed in connection with a stockholder’s death, “qualifying disability” (as defined under the share redemption program) or “determination of incompetence” (as defined under the share redemption program), we may not redeem shares until the stockholder has held his or her shares for one year. |
| • | During each calendar year, redemptions are limited to the amount of net proceeds from the issuance of shares under the dividend reinvestment plan during the prior calendar year less amounts we deem necessary from such proceeds to fund current and future: capital expenditures, tenant improvement costs and leasing costs related to our investments in real estate properties; reserves required by financings of our investments in real estate properties; and funding obligations under our real estate loans receivable, as each may be adjusted from time to time by management, provided that if the shares are submitted for redemption in connection with a stockholder’s death, “qualifying disability” or “determination of incompetence”, we will honor such redemptions to the extent that all redemptions for the calendar year are less than the amount of the net proceeds from the sale of shares under the dividend reinvestment plan during the prior calendar year. |
| • | During any calendar year, we may redeem no more than 5% of the weighted-average number of shares outstanding during the prior calendar year. |
| • | We have no obligation to redeem shares if the redemption would violate the restrictions on distributions under Maryland law, which prohibits distributions that would cause a corporation to fail to meet statutory tests of solvency. |
Based on our budgeted expenditures, and except with respect to redemptions sought upon a stockholder’s death, “qualifying disability” and “determination of incompetence”, we do not currently expect to have funds available for the redemption of shares in 2010. Our board of directors will revisit its determination if circumstances change during the year.
In accordance with our share redemption program, once we establish an estimated value per share, the redemption price for all stockholders will be equal to the estimated value per share. On November 20, 2009, our board of directors approved an estimated value per share of our common stock of $7.17 based on the estimated value of our assets less the estimated value of our liabilities divided by the number of shares outstanding, all as of September 30, 2009. Effective for the November 30, 2009 redemption date and until the estimated value per share is updated, the redemption price for all stockholders will be $7.17 per share. In addition, shares issued under the dividend reinvestment plan subsequent to November 20, 2009, were issued at a value of $7.17 per share. We currently expect to update our estimated value per share within 12 to 18 months of September 30, 2009.
46
Table of Contents
During the year ended December 31, 2009, we redeemed shares pursuant to our share redemption program as follows:
| Month |
Total Number of Shares Redeemed (1) |
Average Price Paid Per Share |
Approximate Dollar Value of Shares Available That May Yet Be Redeemed Under the Program |
||||||
| January 2009 |
385,758 | $ | 9.31 | (2) | (4 | ) | |||
| February 2009 |
651,887 | $ | 9.35 | (2) | (4 | ) | |||
| March 2009 |
1,512,183 | $ | 9.34 | (2) | (4 | ) | |||
| April 2009 |
64,143 | $ | 9.99 | (2) | (4 | ) | |||
| May 2009 |
86,345 | $ | 9.98 | (2) | (4 | ) | |||
| June 2009 |
69,956 | $ | 9.99 | (2) | (4 | ) | |||
| July 2009 |
111,324 | $ | 9.98 | (2) | (4 | ) | |||
| August 2009 |
190,630 | $ | 9.96 | (2) | (4 | ) | |||
| September 2009 |
470,303 | $ | 9.55 | (2) | (4 | ) | |||
| October 2009 |
129,800 | $ | 9.95 | (2) | (4 | ) | |||
| November 2009 |
115,446 | $ | 7.17 | (3) | (4 | ) | |||
| December 2009 |
33,412 | $ | 7.17 | (3) | (4 | ) | |||
| Total |
3,821,187 | ||||||||
(1) We announced commencement of the program on April 6, 2006 and amendments to the program on August 16, 2006 (which amendment became effective on December 14, 2006), August 1, 2007 (which amendment became effective on September 13, 2007), August 14, 2008 (which amendment became effective on September 13, 2008), March 26, 2009 (which amendment became effective on April 26, 2009) and May 13, 2009 (which amendment became effective on June 12, 2009).
(2) Pursuant to the program, as amended, and to the extent shares were eligible for redemption, until we established an estimated value per share, we redeemed shares as follows:
| • | The lower of $9.25 or 92.5% of the price paid to acquire the shares from us for stockholders who had held their shares for at least one year; |
| • | The lower of $9.50 or 95.0% of the price paid to acquire the shares from us for stockholders who had held their shares for at least two years; |
| • | The lower of $9.75 or 97.5% of the price paid to acquire the shares from us for stockholders who had held their shares for at least three years; and |
| • | The lower of $10.00 or 100% of the price paid to acquire the shares from us for stockholders who had held their shares for at least four years. |
Notwithstanding the above, until we established an estimated value per share, upon the death, “qualifying disability” or “determination of incompetence” of a stockholder, the redemption price was the amount paid to acquire the shares from us.
(3) Beginning with the November 30, 2009 redemption date and until the estimated value per share is updated, the redemption price for all stockholders whose shares are eligible for redemption is $7.17 per share.
(4) We limit the dollar value of shares that may be redeemed under the program as described above.
We may amend, suspend or terminate the program upon 30 days’ notice to our stockholders. We may provide this notice by including such information in a Current Report on Form 8-K or in our annual or quarterly reports, all publicly filed with the SEC, or by a separate mailing to our stockholders.
In addition to the redemptions under the share redemption program described above, as of December 31, 2009, we repurchased 6,331 shares of our common stock at $10.00 per share for an aggregate price of $63,316.
47
Table of Contents
| ITEM 6. | SELECTED FINANCIAL DATA |
The following selected financial data as of December 31, 2009, 2008, 2007, 2006 and 2005 and for the years ended December 31, 2009, 2008, 2007 and 2006 should be read in conjunction with the accompanying consolidated financial statements and related notes thereto and Item 7, “Management’s Discussion and Analysis of Financial Condition and Results of Operations” below (in thousands, except share and per share amounts):
| As of December 31, | |||||||||||||||||||
| 2009 | 2008 | 2007 | 2006 | 2005 | |||||||||||||||
| Balance sheet data |
|||||||||||||||||||
| Total real estate and real estate-related investments, net |
$ | 2,507,327 | $ | 2,807,768 | $ | 1,680,777 | $ | 228,019 | $ | — | |||||||||
| Total assets |
2,640,011 | 2,928,550 | 1,816,494 | 283,152 | 200 | ||||||||||||||
| Notes payable |
1,504,720 | 1,499,806 | 1,008,564 | 179,750 | — | ||||||||||||||
| Total liabilities |
1,590,650 | 1,605,451 | 1,077,179 | 189,127 | — | ||||||||||||||
| Redeemable common stock |
56,741 | 55,907 | 14,645 | 369 | — | ||||||||||||||
| Total KBS Real Estate |
|||||||||||||||||||
| Investment Trust, Inc. stockholders’ equity |
987,833 | 1,255,141 | 706,440 | 93,656 | 200 | ||||||||||||||
| For the Years Ended December 31, | |||||||||||||||||||
| 2009 | 2008 | 2007 | 2006 | ||||||||||||||||
| Operating data |
|||||||||||||||||||
| Total revenues |
$ | 280,831 | $ | 278,306 | $ | 96,307 | $ | 5,918 | |||||||||||
| Net loss attributable to common stockholders |
(182,966 | ) | (120,627 | ) | (7,198 | ) | (2,571 | ) | |||||||||||
| Net loss per common share - basic and diluted |
$ | (1.03 | ) | $ | (0.81 | ) | $ | (0.15 | ) | $ | (1.37 | ) | |||||||
| Other data |
|||||||||||||||||||
| Cash flows provided by operations |
$ | 99,738 | $ | 115,178 | $ | 43,982 | $ | 326 | |||||||||||
| Cash flows provided by (used in) investing activities |
1,358 | (1,340,848 | ) | (1,498,999 | ) | (228,418 | ) | ||||||||||||
| Cash flows (used in) provided by financing activities |
(91,306 | ) | 1,203,972 | 1,473,600 | 276,646 | ||||||||||||||
| Distributions declared |
108,811 | 104,264 | 32,862 | 1,286 | |||||||||||||||
| Distributions declared per common share (1) |
0.612 | 0.702 | 0.700 | 0.320 | |||||||||||||||
| Weighted-average number of common shares outstanding, basic and diluted |
177,959,297 | 148,539,558 | 46,973,602 | 1,876,583 | |||||||||||||||
| Reconciliation of funds from operations (2) |
|||||||||||||||||||
| Net loss attributable to common stockholders |
$ | (182,966 | ) | $ | (120,627 | ) | $ | (7,198 | ) | $ | (2,571 | ) | |||||||
| Depreciation of real estate assets |
41,705 | 33,605 | 14,035 | 1,441 | |||||||||||||||
| Amortization of lease-related costs |
78,606 | 63,416 | 28,881 | 1,097 | |||||||||||||||
| Noncontrolling interest - consolidated entity (3) |
(8,183 | ) | (6,711 | ) | (3,231 | ) | — | ||||||||||||
| FFO |
$ | (70,838 | ) | $ | (30,317 | ) | $ | 32,487 | $ | (33 | ) | ||||||||
(1) Distributions declared per common share assumes each share was issued and outstanding each day from July 18, 2006 through the last day of the period presented. Distributions for the period from July 18, 2006 through June 30, 2009 are based on daily record dates and calculated at a rate of $0.0019178 per share per day. Distributions for the period from July 1, 2009 through December 31, 2009 are based on daily record dates and calculated at a rate of $0.00143836 per share per day.
(2) We believe that funds from operations (“FFO”) is a beneficial indicator of the performance of an equity REIT. Because FFO calculations exclude such items as depreciation and amortization of real estate assets and gains and losses from sales of operating real estate assets (which can vary among owners of identical assets in similar conditions based on historical cost accounting and useful-life estimates), they facilitate comparisons of operating performance between periods and among other REITs. Our management believes that historical cost accounting for real estate assets in accordance with GAAP implicitly assumes that the value of real estate assets diminishes predictably over time. Since real estate values have historically risen or fallen with market conditions, many industry investors and analysts have considered the presentation of operating results for real estate companies that use historical cost accounting to be insufficient by themselves. As a result, we believe that the use of FFO, together with the required GAAP presentations, provides a more complete understanding of our performance relative to our competitors and a more informed and appropriate basis on which to make decisions involving operating, financing, and investing activities. We compute FFO in accordance with the current National Association of Real Estate Investment Trusts’ (“NAREIT”) definition. Our computation of FFO may not be comparable to other REITs that do not define FFO in accordance with the current NAREIT definition or that interpret the current NAREIT definition differently than we do.
(3) Relates to our consolidated joint venture. The noncontrolling interest holder’s share of our consolidated venture’s real estate depreciation was $2.0 million, $2.0 million and $0.7 million, respectively, in 2009, 2008 and 2007. Its share of amortization of lease-related costs was $6.2 million, $4.7 million and $2.5 million, respectively, in 2009, 2008 and 2007.
48
Table of Contents
| ITEM 7. | MANAGEMENT’S DISCUSSION AND ANALYSIS OF FINANCIAL CONDITION AND RESULTS OF OPERATIONS |
The following discussion and analysis should be read in conjunction with the “Selected Financial Data” above and our accompanying consolidated financial statements and the notes thereto. Also see “Forward-Looking Statements” preceding Part I.
Overview
We are a Maryland corporation that was formed on June 13, 2005 to invest in a diverse portfolio of real estate properties and real estate-related investments. We have elected to be taxed as a real estate investment trust (“REIT”) beginning with the taxable year ended December 31, 2006 and we intend to operate in such a manner. We own substantially all of our assets and conduct our operations through our Operating Partnership, of which we are the sole general partner. Subject to certain restrictions and limitations, our business is managed by KBS Capital Advisors LLC (“KBS Capital Advisors”), our external advisor, pursuant to an advisory agreement. Our advisor owns 20,000 shares of our common stock. We have no paid employees.
On January 27, 2006, we launched our initial public offering of up to 200,000,000 shares of common stock in our primary offering and 80,000,000 shares of common stock under our dividend reinvestment plan. We ceased offering shares of common stock in our primary offering on May 30, 2008. We continue to issue shares of common stock under our dividend reinvestment plan. We sold 171,109,494 shares in our primary offering for gross offering proceeds of $1.7 billion and, as of December 31, 2009, we had sold 13,760,275 shares under our dividend reinvestment plan for gross offering proceeds of $129.5 million.
As of December 31, 2009, we owned 65 real estate properties, one master lease, 17 real estate loans receivable, two investments in securities directly or indirectly backed by commercial mortgage loans, and a preferred membership interest in a real estate joint venture.
Now that we have invested the net proceeds from our primary public offering, our focus in 2010 is to manage our existing portfolio. We do not anticipate making a significant number of investments in the future. To the extent we receive proceeds from the repayment of real estate-related investments or the sale of a property in 2010, we expect to retain these funds for liquidity purposes, but may use a portion of the funds to make additional investments or to pay distributions to our stockholders.
Market Outlook – Real Estate and Real Estate Finance Markets
During 2008 and 2009, significant and widespread concerns about credit risk and access to capital have been present in the global financial markets. Economies throughout the world have experienced substantially increased unemployment, sagging consumer confidence and a downturn in economic activity. As a result of the decline in general economic conditions, the U.S. commercial real estate industry has been experiencing deteriorating fundamentals, including rental rates, tenant defaults, tenant demands and overall occupancy, across all major property types and in most geographic markets. This has created a highly competitive leasing environment which impacts our investments in real estate properties as well as the collateral securing a majority of our real estate-related investments. If these challenging economic conditions continue, our liquidity and financial condition (as well as the liquidity and financial condition of our tenants and borrowers) may be adversely affected. For further discussion of current market conditions, see Part I, Item 1, “Business — Market Outlook — Real Estate and Real Estate Finance Markets.”
Impact on Our Real Estate Investments
These market conditions have and will likely continue to have a significant impact on our real estate investments. In addition, these market conditions have impacted our tenants’ businesses, which makes it more difficult for them to meet current lease obligations and places pressure on them to negotiate favorable lease terms upon renewal in order for their businesses to remain viable. Increases in rental concessions given to retain tenants and maintain our occupancy level, which is vital to the continued success of our portfolio, has resulted in lower current cash flow. Projected future declines in rental rates, slower or potentially negative net absorption of leased space and expectations of future rental concessions, including free rent to retain tenants who are up for renewal or to sign new tenants, are expected to result in additional decreases in cash flows. Historically low interest rates have helped offset some of the impact of these decreases in operating cash flow for properties financed with variable rate mortgages; however, interest rates may not remain at these historically low levels for the remaining life of many of our investments.
49
Table of Contents
Impact on Our Real Estate-Related Investments
Nearly all of our real estate-related investments are either directly secured by commercial real estate (e.g., first trust deeds or mortgages) or secured by ownership interests in entities that directly or indirectly own and operate real estate (e.g., mezzanine loans). As a result, our real estate-related investments in general have been impacted to some degree by the same factors impacting our real estate investments. In particular, our investments in mezzanine loans and B-Notes have been impacted to a greater degree as current valuations for buildings directly or indirectly securing our investment positions have likely decreased from the date of our acquisition or origination of these investments. In such instances, the borrowers may not be able to refinance their debt to us or sell the collateral at a price sufficient to repay our note balances in full when they become due. In addition, current economic conditions have impacted the performance of collateral directly or indirectly securing our loan investments, and therefore, have impacted the ability of some borrowers under our loans to make contractual interest payments to us. For the year ended December 31, 2009, we recorded a provision for loan losses of $178.8 million which was comprised of $208.8 million calculated on an asset-specific basis, offset by a reduction of $30.0 million to our portfolio-based reserve.
Assuming our real estate-related loans are fully extended under the terms of the respective loan agreements, and excluding our loan investments with asset-specific loan loss reserves and loans under which we have foreclosed or otherwise taken title to the property subsequent to December 31, 2009, we have investments with book values totaling $14.5 million maturing within the next 12 months. We have variable rate real estate-related investments with book values (excluding asset-specific loan loss reserves) of $579.1 million and fixed rate real estate-related investments with book values (excluding asset-specific loan loss reserves) of $197.2 million.
Impact on Our Financing Activities
In light of the risks associated with declining operating cash flows on our properties and the properties underlying the collateral for our repurchase agreements, and the current underwriting environment for commercial real estate mortgages, we may have difficulty refinancing some of our mortgage notes and repurchase agreements at maturity or may not be able to refinance our obligations at terms as favorable as the terms of our existing indebtedness. Although we believe that we will meet the terms for extension of our current loan agreements, we can give no assurance that we will meet the terms for extension of these loans. Assuming our notes payable and repurchase agreements are fully extended under the terms of the respective loan agreements, we have $41.0 million of debt obligations maturing during the 12 months ending December 31, 2010. We have a total of $534.5 million of fixed rate notes payable and $970.2 million of variable rate notes payable and repurchase agreements; of the $970.2 million of variable rate notes payable and repurchase agreements, $205.7 million are effectively fixed through interest rate swaps and $437.5 million are subject to interest rate caps.
Liquidity and Capital Resources
Our principal demands for funds during the short and long-term are for the payment of operating expenses, capital expenditures, general and administrative expenses, payments under debt obligations and distributions to stockholders. To date, we have had five primary sources of capital for meeting our cash requirements:
| • | Proceeds from our initial public offering which closed in 2008; |
| • | Proceeds from common stock issued under our dividend reinvestment plan; |
| • | Debt financings, including mortgage loans and repurchase agreements; |
| • | Cash flow generated by our real estate operations and real estate-related investments; and |
| • | Principal repayments on our real estate loans receivable. |
We ceased offering shares of common stock in our primary offering on May 30, 2008 and continue to issue shares under our dividend reinvestment plan. To date, we have invested the majority of the proceeds from our initial public offering and do not anticipate making a significant number of investments in the future. We intend to use our cash on hand, cash flow generated by our real estate operations and real estate-related investments, proceeds from our dividend reinvestment plan and principal repayments on our real estate loans receivable as our primary sources of immediate and long-term liquidity. In addition, subsequent to December 31, 2009, we entered into a $29.5 million secured, revolving credit facility that will further enhance our liquidity.
50
Table of Contents
We expect to use a significant portion of our cash flows from operations and principal repayments on our real estate loans receivable and/or proceeds from asset sales to pay dividends. Our investments in real estate generate cash flow in the form of rental revenues and tenant reimbursements, which are reduced by operating expenditures, debt service payments and corporate general and administrative expenses. Cash flows from operations from real estate investments is primarily dependent upon the occupancy level of our portfolio, the net effective rental rates on our leases, the collectibility of rent and operating recoveries from our tenants and how well we manage our expenditures. As of December 31, 2009, our real estate portfolio was 90% leased and our bad debt reserve was less than 2% of annualized base rent. As of December 31, 2009, we had 11 tenants with rent balances outstanding for over 90 days. Our real estate-related investments generate cash flow in the form of interest income, which is reduced by loan servicing fees. Cash flows from operations from our real estate-related investments is primarily dependent on the operating performance of the underlying collateral and the borrowers’ ability to make their debt service payments. As of December 31, 2009, five of the 14 borrowers under our real estate loans receivable were delinquent. As a result of these factors and the factors discussed in Part I, Item 1, “Business — Market Outlook — Real Estate and Real Estate Finance Markets,” we may experience declines in future cash flows from real estate and real estate-related investments and we expect an increased need for capital to cover leasing costs and capital improvements needed to maximize the performance of our assets. Therefore, beginning with daily record dates for the month of July 2009, our board of directors declared distributions at an annualized distribution rate of 5.25% (annualized rate based on a purchase price of $10.00 per share or a 7.32% annualized rate based on shares purchased under our dividend reinvestment plan at the current estimated value per share of $7.17) to preserve capital necessary to maintain our investment portfolio. Prior to July 2009, our annualized distribution rate was 7.0% based on a purchase price of $10.00 per share in our primary offering.
We depend on the proceeds from our dividend reinvestment plan for general corporate purposes, including capital expenditures on our real estate investments, tenant improvement costs and leasing costs related to our investments in real estate properties; reserves required by financings of our investments in real estate properties; funding obligations under our real estate loans receivable; the repayment of debt; and the repurchase of shares under our share redemption program. During the second half of 2009, the participation in our dividend reinvestment plan decreased in comparison to 2008. Further reductions in participation under the dividend reinvestment plan could adversely impact our ability to meet our capital needs. Based on our 2010 budgeted expenditures, and except with respect to redemptions sought upon a stockholder’s death, “qualifying disability” or “determination of incompetence,” we have announced that we do not expect to have funds available for the share redemption program in 2010.
For the year ended December 31, 2009, we met our operating cash needs with cash flow generated by our real estate and real estate-related investments. We believe that our cash flow from operations, expected proceeds from our dividend reinvestment plan, principal repayments on our real estate loans receivable, potential proceeds from the sale of assets and availability under the revolving credit facility we entered into on February 11, 2010 will be sufficient to meet our liquidity needs for the upcoming year.
Cash Flows from Operating Activities
As of December 31, 2009, we owned 65 real estate properties, one master lease, 17 real estate loans receivable, two investments in securities directly or indirectly backed by commercial mortgage loans, and a preferred membership interest in a real estate joint venture. During the year ended December 31, 2009, net cash provided by operating activities was $99.7 million, compared to $115.2 million of net cash provided by operating activities during the year ended December 31, 2008. Net cash from operations decreased in 2009 primarily as a result of a $20.3 million decrease in contractual interest income from our non-performing real estate loans receivable, partially offset by an increase in interest income from owning performing real estate loans receivable purchased in 2008 for the entire year of 2009.
Cash Flows from Investing Activities
Net cash provided by investing activities was $1.4 million for the year ended December 31, 2009. The significant sources of cash from investing activities were as follows:
| • | $27.5 million of cash provided by principal repayments on real estate loans receivable; |
| • | $4.0 million of cash provided by cash collateral received on 18301 Von Karman Loans; |
| • | $5.9 million of cash used for advances on our real estate loans receivable; and |
| • | $23.8 million of cash used for additions to real estate. |
51
Table of Contents
Cash Flows from Financing Activities
Net cash used in financing activities was $91.3 million for the year ended December 31, 2009. The significant uses of cash for financing activities were as follows:
| • | $53.1 million of net distributions, after giving effect to dividends reinvested by stockholders of $58.2 million; |
| • | $37.4 million of cash used for redemptions of common stock of $35.9 million and for payments of commissions on stock sales of $1.5 million; |
| • | $3.9 million of net cash used related to the noncontrolling interest in our joint venture investment in the National Industrial Portfolio consisting of distributions to our joint venture partner of $4.3 million, partially offset by contributions from our joint venture partner of $0.4 million; and |
| • | $4.5 million of net cash provided by debt and other financings as a result of proceeds from notes payable of $48.0 million, partially offset by $43.1 million of principal payments on notes payable and repurchase agreements and the purchase of an interest rate cap for $0.4 million. |
Contractual Commitments and Contingencies
In order to execute our investment strategy, we utilized mortgage, mezzanine and repurchase financings to finance a portion of our investment portfolio. Management remains vigilant in monitoring the risks inherent with the use of debt in our portfolio and is taking actions to ensure that these risks, including refinance and interest rate risk, are properly balanced with the benefits of maintaining such leverage. Assuming our notes payable and repurchase agreements are fully extended under the terms of the respective loan agreements, we have $41.0 million of debt maturing during the year ending December 31, 2010. Although we believe that we will meet the terms for extension of our current loan agreements, we can give no assurance that we will meet the terms for extension of these loans. We have a total of $534.5 million of fixed rate notes payable and $970.2 million of variable rate notes payable; of the $970.2 million of variable rate notes payable, $205.7 million of these notes were effectively fixed through interest rate swaps and $437.5 million of these notes were subject to interest rate caps. In addition, we have variable rate loans receivable with total aggregate outstanding principal balances of $581.3 million that, when interest rate indices such as LIBOR increase, provide income to offset increases in interest expense on variable rate debt. As discussed above, in 2008 and through early 2009, the global capital markets have experienced significant dislocations and liquidity disruptions that have caused the credit spreads of debt to fluctuate considerably and caused significant volatility in interest rates, including LIBOR. We have a total of $764.5 million of unhedged variable rate notes payable that are impacted by fluctuations in interest rates. While LIBOR currently stands at historically low levels, future volatility in LIBOR may result in the use of increased capital resources to meet our debt obligations.
In addition to using our capital resources to meet our debt service obligations, for capital expenditures and for operating costs, we use our capital resources to make certain payments to our advisor and the dealer manager. We pay our advisor fees in connection with the management of our assets and for certain costs incurred by our advisor in providing services to us. We may also pay the dealer manager selling commissions of up to 3% of gross offering proceeds in connection with eligible sales under the dividend reinvestment plan and to the extent permitted under state securities laws. We will also continue to reimburse our advisor and the dealer manager for certain offering costs related to our dividend reinvestment plan.
As of December 31, 2009, our borrowings were approximately 52% and 55% of the cost (before depreciation or other noncash reserves) and book value (before depreciation) of our tangible assets, respectively.
52
Table of Contents
The following is a summary of our contractual obligations as of December 31, 2009 (in thousands):
| Payments Due During the Years Ending December 31, | |||||||||||||||||||
| Contractual Obligations |
Total | 2010 | 2011-2012 | 2013-2014 | Thereafter | ||||||||||||||
| Outstanding debt obligations (1) |
$ | 1,504,720 | $ | 478,478 | $ | 690,208 | $ | 255,834 | $ | 80,200 | |||||||||
| Interest payments on outstanding debt obligations (2) |
$ | 148,586 | $ | 51,429 | $ | 64,522 | $ | 24,189 | $ | 8,446 | |||||||||
| Outstanding funding obligations under real estate loans receivable |
$ | 11,154 | $ | 11,154 | $ | — | $ | — | $ | — | |||||||||
| Other obligations (3) |
$ | 6,481 | (3 | ) | (3 | ) | (3 | ) | (3 | ) | |||||||||
(1) Amounts include principal payments under notes payable and repurchase agreements based on maturity dates of debt obligations as of December 31, 2009.
(2) Projected interest payments are based on the outstanding principal amounts and weighted-average interest rates at December 31, 2009, adjusted for the impact of interest rate caps and swap agreements. We incurred interest expense of $56.0 million, excluding amortization of deferred financing costs totaling $4.9 million, during the year ended December 31, 2009.
(3) Represents the $1.6 million of outstanding advances from our advisor and $4.9 million of incurred but unpaid performance fees as of December 31, 2009. These amounts do not have a fixed payment date, but they may be repaid in any future year depending on our financial condition.
Other Obligations
We have contingent liability with respect to advances to us from our advisor in the amount of $1.6 million for the payment of distributions and to cover expenses, excluding depreciation and amortization, in excess of our revenues. Pursuant to the advisory agreement with KBS Capital Advisors, we are only obligated to reimburse our advisor for these advances if and to the extent that our cumulative Funds from Operations (as defined below) for the period commencing January 1, 2006 through the date of any such reimbursement exceed the lesser of (i) the cumulative amount of any distributions declared and payable to our stockholders as of the date of such reimbursement or (ii) an amount that is equal to a 7.0% cumulative, non-compounded, annual return on invested capital for our stockholders for the period from July 18, 2006 through the date of such reimbursement. No interest will accrue on the advance made by our advisor. The advisory agreement defines Funds from Operations as funds from operations as defined by the National Association of Real Estate Investment Trusts plus (i) any acquisition expenses and acquisition fees expensed by us and that are related to any property, loan or other investment acquired or expected to be acquired by us and (ii) any non-operating noncash charges incurred by us, such as impairments of property or loans, any other-than-temporary impairments of real estate securities, or other similar charges.
In addition to the advances to us from our advisor in the amount of $1.6 million, at December 31, 2009, we have incurred but unpaid performance fees totaling $4.9 million related to our joint venture investment in the National Industrial Portfolio. The performance fee is earned by our advisor upon our meeting certain Funds from Operations thresholds and makes our advisor’s cumulative asset management fees related to our investment in the National Industrial Portfolio joint venture equal to 0.75% of the cost of the joint venture investment on an annualized basis from the date of our investment in the joint venture through the date of calculation. As of December 31, 2009, our operations were sufficient to meet the Funds from Operations condition as defined in the advisory agreement. Although these performance fees have been incurred as of December 31, 2009, the advisory agreement further provides that the payment of the performance fee shall only be made after the repayment of advances from our advisor discussed above. The amount of cash available for distributions in future periods will be decreased by the repayment of the advance from our advisor and the payment of our advisor’s unpaid performance fees.
53
Table of Contents
Results of Operations
Overview
The results of operations presented for the years ended December 31, 2009 and 2008 are not directly comparable because we were still investing the proceeds of our initial public offering during 2008.
Comparison of the year ended December 31, 2009 versus year ended December 31, 2008
The following table provides summary information about our results of operations for the years ended December 31, 2009 and 2008 (dollar amounts in thousands):
| For the Year Ended December 31, |
Increase (Decrease) |
Percentage Change |
Increase (Decrease) Due to Acquisitions/ Originations (1) |
Increase (Decrease) From Properties Held Throughout Both Periods (2) |
|||||||||||||||||
| 2009 | 2008 | ||||||||||||||||||||
| Rental income |
$ | 180,782 | $ | 159,587 | $ | 21,195 | 13 | % | $ | 27,054 | $ | (5,859 | ) | ||||||||
| Tenant reimbursements |
37,195 | 37,555 | (360 | ) | (1 | %) | 3,454 | (3,814 | ) | ||||||||||||
| Interest income from real estate loans receivable |
56,161 | 73,933 | (17,772 | ) | (24 | %) | (1,921 | ) | (15,851 | ) | |||||||||||
| Interest income from real estate securities |
3,507 | 4,623 | (1,116 | ) | (24 | %) | 131 | (1,247 | ) | ||||||||||||
| Property operating, maintenance, and management costs |
47,962 | 37,658 | 10,304 | 27 | % | 7,229 | 3,075 | ||||||||||||||
| Real estate taxes, property-related taxes, and insurance |
28,168 | 26,033 | 2,135 | 8 | % | 3,345 | (1,210 | ) | |||||||||||||
| Asset management fees to affiliate |
22,108 | 17,508 | 4,600 | 26 | % | 4,806 | (206 | ) | |||||||||||||
| General and administrative expenses |
8,044 | 5,568 | 2,476 | 44 | % | n/a | n/a | ||||||||||||||
| Depreciation and amortization |
120,311 | 97,021 | 23,290 | 24 | % | 14,761 | 8,529 | ||||||||||||||
| Interest expense |
60,931 | 68,303 | (7,372 | ) | (11 | %) | 5,867 | (13,239 | ) | ||||||||||||
| Provision for loan losses |
178,813 | 104,000 | 74,813 | 72 | % | n/a | n/a | ||||||||||||||
| Other-than-temporary impairment of real estate securities |
5,067 | 50,079 | (45,012 | ) | (90 | %) | n/a | n/a | |||||||||||||
| Income from unconsolidated joint venture |
4,038 | — | 4,038 | 100 | % | 4,038 | — | ||||||||||||||
(1) Represents the dollar amount increase for the year ended December 31, 2009 compared to the year ended December 31, 2008 as a result of properties and other real estate-related assets acquired on or after January 1, 2008.
(2) Represents dollar amount increase (decrease) for the year ended December 31, 2009 compared to the year ended December 31, 2008 with respect to properties and other real estate-related investments owned by us as of January 1, 2008.
The $21.2 million net increase in rental income was primarily due to an increase of $27.1 million from properties acquired after January 1, 2008, partially offset by a decrease of $5.9 million from properties owned for the entirety of both periods. The $5.9 million decrease primarily relates to lower occupancy and a decrease in net amortization of below-market in-place leases. Our rental income will vary in large part based on the occupancy rates and rental rates at the buildings in our portfolio. While we would generally expect rental income to increase over time, the current deteriorating economic conditions could result in lower occupancy and/or rental rates and a corresponding decrease in rental income.
The $0.4 million net decrease in tenant reimbursements was primarily due to a $3.9 million decrease relating to properties owned for the entirety of both periods offset by an increase of $3.5 million from properties acquired after January 1, 2008. The decrease of $3.9 million is due primarily to lower recovery of operating expenses caused by both the reset of tenant base years (as a result of tenant rollover and lease renewals) and lower recoverable property tax expenses (as a result of 2008 property tax reassessments). Our tenant reimbursements vary based on several factors, including the occupancy rate of the buildings, changes in base year terms, and changes in reimbursable operating expenses. While we generally expect tenant reimbursements to increase over time, the current deteriorating economic conditions could result in lower occupancy rates and increased tenant turnover and lease renewals resulting in lower tenant reimbursements. Generally, as new leases are negotiated, the base year resets to operating expenses incurred in the year the lease is signed and the tenant generally only reimburses operating expenses to the extent and by the amount that their allocable share of the building’s operating expenses in future years increases from their base year. As a result, as new leases are executed due to tenant rollover, tenant reimbursements generally decrease. Rental income may or may not change by amounts corresponding to changes in tenant reimbursements due to new leases.
54
Table of Contents
The $17.8 million net decrease in interest income from loans receivable was primarily due to a $15.9 million decrease relating to loans receivable held for the entirety of both periods and a decrease of $1.9 million from real estate loans receivable acquired or originated after January 1, 2008. The $15.9 million decrease is primarily due to the following: a decrease of $4.8 million related to the Petra Subordinated Loans, which became delinquent in November 2008 and were determined to be impaired as of December 31, 2008; a decrease of $0.6 million related to 200 Professional Drive Mortgage, which was determined to be impaired as of March 31, 2009; a decrease of $9.3 million related to the Tribeca Mezzanine Loans which were determined to be impaired as of June 30, 2009; and a $0.8 million decrease related to Artisan Multifamily Portfolio Mezzanine Loans, which is primarily related to a decrease of loan discount accretion. The $1.9 million decrease is comprised primarily of an $18.5 million decrease related to our investment in the Arden Portfolio Mezzanine Loans and a $1.0 million decrease related to our investment in the 18301 Von Karman Loans, partially offset by an increase of $17.8 million as a result of holding our investments in the GKK Mezzanine Loan, 55 East Monroe Mezzanine Loan Origination and San Antonio Business Park Mortgage Loan for the entirety of 2009. The $18.5 million decrease related to the Arden Portfolio Mezzanine Loans is a result of the expiration of interest rate floors on these variable rate loans, decreases in LIBOR and the recharacterization of income beginning in July 2009 due to the fact that we released the borrowers under this investment from liability and received preferred membership interests in a joint venture that indirectly owns the properties that had served as collateral for the loans. The $1.0 million decrease related to the 18301 Von Karman Loans was due to the fact that we ceased accreting the purchase discount on these loans to interest income during the three months ended June 30, 2009 and stopped earning interest income as a result of receiving a deed-in-lieu of foreclosure and gaining control over the property on October 6, 2009.
Interest income from real estate loans receivable in future periods compared to historical periods will be impacted by fluctuations in LIBOR to the extent we have variable rate loans and the ability of borrowers under the real estate loans receivable scheduled to mature during the next year to repay or refinance the amounts due to us. Interest income may also be affected by the potential impact of loans that may experience impairment issues in the future as a result of current or future market conditions. Assuming our real estate-related loans are fully extended under the terms of the respective loan agreements, and excluding our loan investments with asset-specific loan loss reserves and loans under which we have foreclosed or otherwise taken title to the property subsequent to December 31, 2009, we have investments with book values totaling $14.5 million maturing within the next year.
During the year ended December 31, 2009, we recognized $12.7 million of interest income related to our impaired loans. The following is a summary of our impaired loans and our expectation of future collections relating to these loans:
| • | Two subordinated debt loans in Petra Fund REIT Corp (“Petra”) totaling $50.0 million were fully reserved as of December 31, 2008 based on the value of Petra’s assets and its access to capital. We did not receive or recognize interest income from Petra during the year ended December 31, 2009 and do not expect to receive further interest income or principal repayment in the future. |
| • | The borrower on the 200 Professional Drive Mortgage, which has a total face value of $9.3 million and was scheduled to mature on July 31, 2009, has failed to make its debt service payments since March 2009 and is not expected to make any future debt service payments. As a result, we placed this loan on non-accrual status and determined it was impaired as of March 31, 2009. The 200 Professional Drive Mortgage is secured by a 60,528 square foot office property in Gaithersburg, Maryland. We have begun the process of foreclosing on the office property and an auction to sell the collateral was scheduled for June 30, 2009. However, the borrower declared bankruptcy on June 29, 2009 resulting in a delay of the foreclosure process. Should we successfully foreclose on the collateral under this loan, we intend to operate it, which may result in an increase in rental income in future periods after stabilization is achieved. However, we cannot predict if we will be successful in foreclosing on the collateral and we cannot predict if the operations of the collateral will be profitable. |
| • | On July 8, 2009, we received preferred membership interests in a joint venture that indirectly owns the properties that served as the collateral for the Arden Portfolio Mezzanine Loans. In connection with the formation of the joint venture, the mezzanine borrowers were released from liability under the loans, but the holders did not release the guarantors from their obligations related to the loans. The distribution structure of the joint venture’s operating agreement is designed to substantially reflect the priority of the former lenders that entered the joint venture and the payments the former lenders would have received under the prior mezzanine loans. During the year ended December 31, 2009, we received $4.0 million in income from the joint venture. We expect to continue receiving payments under our new investment in the form of preferred distributions that should reflect the interest we would have received as a lender; however, there can be no assurance that we will continue to receive payments in the future and our recourse is limited should we not receive our preferred distributions. |
55
Table of Contents
| • | On August 13, 2009, we entered into a modification to the Tribeca Mezzanine Loans with the holder of the 75% interest in the Tribeca Senior Mortgage Loan and the holder of the Senior Tribeca Mezzanine Loan consenting to divert 100% of the interest due to us under the Tribeca Mezzanine Loans to the Senior Tribeca Mezzanine Loan to be applied as principal repayments, and should that loan be retired during the term of the extension, 100% of the interest due to us under the Tribeca Mezzanine Loans would be diverted to pay down the Tribeca Senior Mortgage Loan until that loan is paid down in full. We would be entitled to recoup all of the interest previously diverted to the senior lenders from the borrower after the Senior Tribeca Mezzanine Loan and the Tribeca Senior Mortgage Loan are paid off. The modification extended the maturity date of all the Tribeca Loans to February 1, 2010 and provided for an additional extension to April 1, 2010, subject to certain terms and restrictions. Subsequent to December 31, 2009, the borrower under these loans defaulted and we foreclosed on this project by exercising our right to accept 100% of the ownership interest of the borrower under the Second Tribeca Mezzanine Loan pursuant to the Second Tribeca Mezzanine Loan documents. As a result of the assignment in lieu of foreclosure, as of December 31, 2009 we valued our investments in the Tribeca Loans at their aggregate fair values of $38.1 million. We expect the fair values of the Tribeca Loans as of December 31, 2009 will be equal to our consolidated investment in the Tribeca Building at the time of foreclosure. |
| • | Due to difficulty leasing up the property, the borrower under the 18301 Von Karman Loans failed to make its debt service payment due July 1, 2009, and the borrower does not have sufficient debt service or capital reserves to meet its future debt service obligations. Based on this, we determined this loan was impaired as of June 30, 2009 and recorded a loan loss provision to reduce our investment to the estimated fair value of the collateral. On October 6, 2009, we received a deed-in-lieu of foreclosure on the collateral under this loan. We will seek to lease the property and operate it as part of our commercial real estate portfolio, which may result in an increase in our rental income in future periods after stabilization is achieved. |
| • | Due to difficulty leasing the property, the borrower under the 2600 Michelson Mezzanine Loan missed its debt service payment due August 11, 2009 and indicated that it did not intend to make any future debt service payments under the loan. Consequently, we do not expect to receive further interest income or principal repayment in the future. Based on this, we determined this loan was impaired as of June 30, 2009 and recorded a loan loss provision to reduce our investment to $0, which is the estimated fair value of the collateral. |
| • | Due to difficulty leasing the property, the borrower under the Sandmar Mezzanine Loan approached us to modify the terms of the loan, and we reached an agreement with the borrower to modify the terms of the loan on January 4, 2010. We agreed to forgive $0.1 million in unpaid debt service and to reduce the contractual interest rate from 12.0% to 5.4% in exchange for the partial prepayment of principal from the borrower of $3.0 million. In addition, we agreed that for every $1 of principal paid by the borrower we would reduce the amount due to us by $1.67. Because we do not expect to collect all amounts due under the contractual terms of the loan agreement, we recorded an impairment charge related to this loan as of September 30, 2009. We may continue receiving payments under the modified agreement; however, there can be no assurance that we will continue to receive payments in the future. |
If any of the borrowers under our loans receivable are unable to repay a loan at maturity or default on their loan, the impact to future interest income may be significant and will depend on several factors unique to each individual loan. In general, if we have a first priority lien on the collateral securing a loan, we may agree to extend the loan at similar terms, modify the terms of the loan, or foreclose on the collateral. If we foreclose on the collateral, we may either operate the property, resulting in our receipt of any cash flows generated by the property or our payment of any cash shortfalls related to the property, or sell the property for whatever amount we are able to obtain, which may or may not be equal to the loan balance prior to foreclosure. In general, if we own a mezzanine loan or a B-Note and the borrower is unable to repay its loan at maturity, we may have more restrictions and fewer options regarding the resolution of our investment. In certain circumstances, the senior lenders, in conjunction with us, may be willing to grant the borrower extensions or may grant extensions in exchange for more favorable terms (such as higher interest rates, a partial payoff, or the entitlement to a portion of a junior lender’s interest income, etc.). If the senior lenders will not grant the borrower an extension, we, as the mezzanine lender, may foreclose on the ownership interests of the borrower and take legal title to the property subject to the existing senior loans. We could attempt to negotiate an extension or modification with the senior lenders as the new borrower; however, if the senior lenders were not willing to extend or modify the loans and we were not able to repay the senior loans, we would most likely relinquish our interests or rights in the investment to the holders of the senior loans. Actual outcomes may differ significantly from the above based on factors specific to individual loans and situations.
56
Table of Contents
The $1.1 million net decrease in interest income from real estate securities was primarily due to a decrease of $1.2 million related to interest income received or recognized from our floating rate CMBS, which was owned in both periods, partially offset by a $0.1 million increase in interest income from our fixed rate securities, which was purchased in June 2008. We recognized an impairment of the full amount of the floating rate CMBS during the year ended December 31, 2008. We do not expect to receive any significant amounts of interest income on the floating rate CMBS in the future and no longer expect to recover any of the principal balance. Although we do expect to continue to receive interest income from our fixed rate securities, from which we received $3.7 million in 2009, the ultimate realization of interest income, our book value, or the face amount of the fixed rate securities is dependent on the performance of the underlying loans.
The $10.3 million increase in property operating, maintenance and management costs was primarily due to an increase of $7.2 million as a result of the growth in our real estate portfolio during 2008 and an increase of $3.1 million due to an increase of repairs and maintenance, bad debt expense, and other operating expenses related to properties owned for the entirety of both periods. Property operating, maintenance and management costs may continue to increase in future periods, as compared to historical periods, as a result of inflation.
The $2.1 million increase in real estate and other property-related taxes and insurance was primarily due to an increase of $3.3 million from properties acquired after January 1, 2008, partially offset by a decrease of $1.2 million relating to properties owned for the entirety of both periods (as a result of property tax reassessments).
The $4.6 million increase in asset management fees for the year ended December 31, 2009 was primarily due to the growth in our investment portfolio during 2008.
The $2.5 million increase in general and administrative expenses is primarily due to increased costs related to the general growth of our company and growth of our investment portfolio. These general and administrative expenses consisted primarily of legal fees, audit fees, state and local income taxes and other professional fees.
The $23.3 million increase in depreciation and amortization is primarily due to an increase of $14.8 million from properties acquired after January 1, 2008 and an increase of $8.5 million from properties owned for the entirety of both periods due to accelerated depreciation and amortization for early lease terminations or renewals. Depreciation and amortization may decrease in future periods as compared to historical periods as leases expire and the tenant origination and absorption costs related to the leases are fully amortized; however, this may be offset, or there may never be a decrease, to the extent we experience additional early termination of tenant leases in the future due to the impact of the current economic conditions.
The $7.4 million decrease in interest expense is primarily due to a decrease in interest expense under floating rate notes payable and repurchase agreements as a result of decreases in LIBOR. The decrease consists of $13.2 million in interest expense on debt obligations outstanding during both periods, partially offset by an increase of $5.8 million from debt obligations entered into after January 1, 2008. The $13.2 million decrease is primarily due to a decrease in interest expense of $12.4 million on the National Industrial Portfolio mortgage and mezzanine loans. The National Industrial Portfolio mortgage and mezzanine loans are variable rate loans based on one-month LIBOR. One-month LIBOR averaged 2.67% during the year ended December 31, 2008 and averaged 0.33% during the year ended December 31, 2009. Interest expense in future periods will vary based on fluctuations in one-month LIBOR, our level of future borrowings and our ability to refinance existing indebtedness at similar rates. We do not currently plan to acquire or originate more real estate or real estate-related assets, and therefore, do not plan to enter into any purchase financing in the future. However, we will need to refinance our existing indebtedness in the future.
The provision for loan losses for the year ended December 31, 2009 increased by $74.8 million from the year ended December 31, 2008 primarily due to the determination that the 200 Professional Drive Mortgage was impaired as of March 31, 2009; the determination that the Tribeca Mezzanine Loans, 18301 Von Karman Loans, Arden Portfolio Mezzanine Loans and 2600 Michelson Mezzanine Loan were impaired as of June 30, 2009; and the determination that the Sandmar Mezzanine Loan was impaired as of September 30, 2009.
We recognized an other-than-temporary impairment related to real estate securities of $5.1 million for the year ended December 31, 2009 compared to a $50.1 million impairment for the year ended December 31, 2008. Of the $50.1 million impairment recognized in 2008, $18.2 million related to the full impairment of our floating rate securities and $31.9 million related to our fixed rate securities. The impairment recognized in 2009 related solely to our fixed rate securities, which were acquired in June 2008. Continued stress in the economy in general and the CMBS market in particular have impacted CMBS prices resulting in a lower valuation for our securities and could result in other-than-temporary impairments on our fixed rate securities in the future.
57
Table of Contents
On July 8, 2009, we released the borrowers under the Arden Portfolio Mezzanine Loans and received preferred membership interests in an unconsolidated joint venture that indirectly owns the properties that served as the collateral for these loans. We recognized $4.0 million of income from the unconsolidated joint venture and $6.9 million of interest income from the Arden Portfolio Mezzanine Loans during the year ended December 31, 2009. Although there was no income from the unconsolidated joint venture during the year ended December 31, 2008, we recognized $25.4 million of interest income from the real estate loans receivable relating to the Arden Portfolio Mezzanine Loans during the year ended December 31, 2008. See the discussion of the Arden Portfolio Mezzanine Loans under interest income from real estate loans receivable above.
Comparison of the year ended December 31, 2008 versus year ended December 31, 2007
During 2008, we invested in 10 real estate properties, three mezzanine real estate loans, two first mortgage loans, partial ownership interests in two mezzanine real estate loans, and one investment in real estate securities. During 2007, we invested in 13 real estate properties, one industrial portfolio consisting of nine distribution and office/warehouse properties, one office/flex portfolio consisting of four properties and an 80% membership interest in a joint venture that owns a portfolio totaling approximately 11.4 million rentable square feet and consists of 23 institutional quality industrial properties and holds a master lease with respect to another industrial property. In addition in 2007, we also originated three secured loans, made an investment in CMBS, acquired three mezzanine real estate loans, two B-Notes, a partial ownership interest in one mezzanine real estate loan, a partial ownership interest in a senior mortgage loan and two loans representing senior subordinated debt of a private REIT. Accordingly, the results of operations presented for the years ended December 31, 2008 and 2007 are not directly comparable.
The following table provides summary information about our results of operations for the years ended December 31, 2008 and 2007 (dollar amounts in thousands):
| For the Year Ended December 31, |
Increase (Decrease) |
Percentage Change |
Increase Due to Acquisitions/ Originations (1) |
Increase (Decrease) Due to Properties Held Throughout Both Periods (2) |
|||||||||||||||
| 2008 | 2007 | ||||||||||||||||||
| Rental income |
$ | 159,587 | $ | 65,833 | $ | 93,754 | 142 | % | $ | 93,669 | $ | 85 | |||||||
| Tenant reimbursements |
37,555 | 13,299 | 24,256 | 182 | % | 23,710 | 546 | ||||||||||||
| Interest income from real estate loans receivable |
73,933 | 14,374 | 59,559 | 414 | % | 59,698 | (139 | ) | |||||||||||
| Interest income from real estate securities |
4,623 | 1,046 | 3,577 | 342 | % | 3,577 | — | ||||||||||||
| Property operating, maintenance, and management costs |
37,658 | 13,725 | 23,933 | 174 | % | 23,608 | 325 | ||||||||||||
| Real estate taxes, property-related taxes, and insurance |
26,033 | 9,519 | 16,514 | 173 | % | 16,589 | (75 | ) | |||||||||||
| Asset management fees to affiliate |
17,508 | 5,095 | 12,413 | 244 | % | 12,758 | (345 | ) | |||||||||||
| General and administrative expenses |
5,568 | 4,126 | 1,442 | 35 | % | n/a | n/a | ||||||||||||
| Depreciation and amortization expense |
97,021 | 42,916 | 54,105 | 126 | % | 54,538 | (433 | ) | |||||||||||
| Interest expense |
68,303 | 33,368 | 34,935 | 105 | % | 35,426 | (491 | ) | |||||||||||
| Provision for loan losses |
104,000 | — | 104,000 | 100 | % | n/a | n/a | ||||||||||||
| Other-than-temporary impairment of real estate securities |
50,079 | — | 50,079 | 100 | % | n/a | n/a | ||||||||||||
(1) Represents the dollar amount increase for the year ended December 31, 2008 compared to the year ended December 31, 2007 as a result of properties and other real estate-related assets acquired on or after January 1, 2007.
(2) Represents dollar amount increase (decrease) for the year ended December 31, 2008 compared to the year ended December 31, 2007 with respect to properties and other real estate-related investments owned by us as of January 1, 2007.
Rental income increased from $65.8 million for the year ended December 31, 2007 to $159.6 million for the year ended December 31, 2008. Of the $93.8 million increase, $24.8 million was due to new properties acquired in 2008 and the remaining $69.0 million was due to owning properties acquired in 2007 for an entire year.
Tenant reimbursements increased from $13.3 million for the year ended December 31, 2007 to $37.6 million for the year ended December 31, 2008, primarily as a result of the growth in the real property investment portfolio during 2008 and owning the properties acquired in 2007 for an entire year.
58
Table of Contents
Interest income from real estate loans receivable increased from $14.4 million for the year ended December 31, 2007 to $73.9 million for the year ended December 31, 2008, primarily as a result of the growth in the real estate loans receivable portfolio during 2008 and owning the real estate loans receivable acquired in 2007 for an entire year. Interest income for 2008 was composed of $57.0 million of contractual interest and $16.9 million of accretion of purchase price discounts, net of amortization of loan origination fees, and costs on purchases and originations of real estate loans receivable. The purchase price discounts and loan acquisition costs are accreted or amortized into interest income using the interest method over the expected life of the loans.
Interest income from real estate securities increased from $1.0 million for the year ended December 31, 2007 to $4.6 million for the year ended December 31, 2008. Of the $3.6 million increase, $0.4 million of the increase is a result of interest accretion of real estate securities recorded subsequent to the recognition of an other-than-temporary impairment of the floating rate CMBS acquired on April 19, 2007 and $3.2 million of the increase is a result of the acquisition of the fixed rate securities on June 13, 2008, which consisted of interest income of $2.0 million and accretion of the discount of the purchase price of $1.2 million. Our floating rate CMBS contributed $1.4 million, or 31%, of interest income from real estate securities for the year ended December 31, 2008. We recognized an impairment of the full amount of the floating rate CMBS at the end of 2008. For the year ended December 31, 2008, our fixed rate securities contributed $3.2 million, or 69%, of interest income from real estate securities.
Property operating, maintenance and management costs increased from $13.7 million for the year ended December 31, 2007 to $37.7 million for the year ended December 31, 2008, primarily as a result of the growth in our real estate portfolio during 2008 and owning the properties acquired in 2007 for an entire year.
Real estate and other property-related taxes increased from $9.5 million for the year ended December 31, 2007 to $26.0 million for the year ended December 31, 2008, primarily as a result of the growth in our real estate portfolio during 2008 and owning the properties acquired in 2007 for an entire year.
Asset management fees incurred with respect to real estate investments increased from $5.1 million for the year ended December 31, 2007 to $17.5 million for the year ended December 31, 2008. This increase is due to the growth in the portfolio during 2008, owning the assets acquired in 2007 for an entire year and the recognition of incurred but unpaid performance fees totaling $2.8 million related to our joint venture investment in the National Industrial Portfolio.
General and administrative expenses increased from $4.1 million for the year ended December 31, 2007 to $5.6 million for the year ended December 31, 2008 due primarily to increased costs related to the general growth of our company and the number of investments. These general and administrative costs consisted primarily of legal, audit, state and local income taxes and other professional fees.
Interest expense (including amortization of deferred financing costs) increased from $33.4 million for the year ended December 31, 2007 to $68.3 million for the year ended December 31, 2008, primarily as a result of our use of debt in acquiring real property investments during 2007 and 2008.
Depreciation and amortization increased from $42.9 million for the year ended December 31, 2007 to $97.0 million for the year ended December 31, 2008. This increase was primarily caused by the growth in the real property investment portfolio during 2008 and owning the properties acquired in 2007 for an entire year.
During the year ended December 31, 2008, we recognized other-than-temporary impairments of marketable real estate securities totaling approximately $50.1 million related to our floating rate CMBS and fixed rate securities. We recognized an other-than-temporary impairment of $18.2 million on our floating rate CMBS investment, including $0.4 million of accretion of other-than-temporary impairments, due to a prolonged decrease of the market value of the securities below our cost basis, a downgrade in the credit rating of these securities in July 2008 and defaults in the collateral pool. We do not currently expect to recover any of our principal on this investment. We recognized an other-than-temporary impairment of $31.9 million on our fixed rate securities due to the size of the market value decline and the length of time the fair value both has been and is expected to be below our cost. The market value of these securities was adversely affected by market perceptions that defaults on the underlying mortgage loans will increase.
During the year ended December 31, 2008, we recorded an impairment charge for the full amount of our $50.0 million subordinated debt investment in Petra and a provision for portfolio-based loan losses of $54.0 million related to our investment in the remaining real estate loans receivable.
59
Table of Contents
Organization and Offering Costs
Our organization and offering costs (other than selling commissions and dealer manager fees) were paid in part by our advisor, the dealer manager and their affiliates on our behalf and our advisor, dealer manager or their affiliates may continue to pay these costs of the dividend reinvestment plan offering on our behalf. Other offering costs include all expenses incurred by us in connection with our public offering, including but not limited to (i) legal, accounting, printing, mailing, and filing fees; (ii) charges of the escrow holder and expenses of our advisor for administrative services related to the issuance of shares; (iii) reimbursement of the dealer manager for amounts it may pay to reimburse the bona fide diligence expenses of broker-dealers; (iv) reimbursement to our advisor for the salaries of its employees and other costs in connection with preparing supplemental sales materials; (v) the cost of educational conferences held by us (including the travel, meal, and lodging costs of registered representatives of broker-dealers); and (vi) reimbursement to the dealer manager for travel, meals, lodging, and attendance fees incurred by employees of the dealer manager to attend retail seminars conducted by broker-dealers.
Pursuant to the advisory agreement and the dealer manager agreement, we are obligated to reimburse our advisor, the dealer manager or their affiliates, as applicable, for organization and offering costs paid by them on our behalf, provided that our advisor is obligated to reimburse us to the extent selling commissions, dealer manager fees, and organization and other offering costs incurred by us in the offering exceed 15% of our gross offering proceeds. Our advisor and its affiliates have incurred organization and offering costs (excluding selling commissions and dealer manager fees) on our behalf of approximately $11.1 million through December 31, 2009; all such amounts have been reimbursed as of December 31, 2009. Such costs are only a liability to us to the extent selling commissions, dealer manager fees and organization and other offering costs do not exceed 15% of the gross proceeds of the offering. From commencement of our initial public offering through December 31, 2009, including shares sold through our dividend reinvestment plan, we had issued 184,869,769 shares for gross offering proceeds of $1.8 billion and recorded organization and other offering costs of $16.7 million and selling commissions and dealer manager fees of $157.8 million for a total of $174.5 million, or 10% of our gross offering proceeds.
Funds from Operations
We believe that funds from operations (“FFO”) is a beneficial indicator of the performance of an equity REIT. Because FFO calculations exclude such items as depreciation and amortization of real estate assets and gains and losses from sales of operating real estate assets (which can vary among owners of identical assets in similar conditions based on historical cost accounting and useful-life estimates), they facilitate comparisons of operating performance between periods and among other REITs. Our management believes that historical cost accounting for real estate assets in accordance with U.S. generally accepted accounting principles (“GAAP”) implicitly assumes that the value of real estate assets diminishes predictably over time. Since real estate values have historically risen or fallen with market conditions, many industry investors and analysts have considered the presentation of operating results for real estate companies that use historical cost accounting to be insufficient by themselves. As a result, we believe that the use of FFO, together with the required GAAP presentations, provides a more complete understanding of our performance relative to our competitors and a more informed and appropriate basis on which to make decisions involving operating, financing, and investing activities. We compute FFO in accordance with the current NAREIT definition. Our computation of FFO may not be comparable to other REITs that do not define FFO in accordance with the current NAREIT definition or that interpret the current NAREIT definition differently than we do.
FFO is a non-GAAP financial measure and does not represent net income as defined by GAAP. Net income as defined by GAAP is the most relevant measure in determining our operating performance because FFO includes adjustments that investors may deem subjective, such as adding back expenses such as depreciation and amortization. Accordingly, FFO should not be considered as an alternative to net income as an indicator of our operating performance.
60
Table of Contents
Our calculation of FFO, which we believe is consistent with the calculation of FFO as defined by NAREIT, is presented in the following table for the years ended December 31, 2009, 2008 and 2007, respectively (in thousands):
| For the Years Ended December 31, | ||||||||||||
| 2009 | 2008 | 2007 | ||||||||||
| Net loss |
$ | (182,966 | ) | $ | (120,627 | ) | $ | (7,198 | ) | |||
| Add: |
||||||||||||
| Depreciation of real estate assets |
41,705 | 33,605 | 14,035 | |||||||||
| Amortization of lease-related costs |
78,606 | 63,416 | 28,881 | |||||||||
| Deduct: |
||||||||||||
| Adjustments for noncontrolling interest - consolidated entity (1) |
(8,183 | ) | (6,711 | ) | (3,231 | ) | ||||||
| FFO |
$ | (70,838 | ) | $ | (30,317 | ) | $ | 32,487 | ||||
(1) Relates to our consolidated joint venture. The noncontrolling interest holder’s share of our consolidated venture’s real estate depreciation was $2.0 million, $2.0 million and $0.7 million, respectively, in 2009, 2008 and 2007. Its share of amortization of lease-related costs was $6.2 million, $4.7 million and $2.5 million, respectively, in 2009, 2008 and 2007.
Set forth below is additional information related to certain noncash items included in our net loss above, which may be helpful in assessing our operating results. Please see the accompanying consolidated statements of cash flows for details of our operating, investing, and financing cash activities.
Significant Noncash Items Included in Net Loss:
| • | Provision for loan losses related to our real estate loans receivable represented an increase of $178.6 million and $104.0 million for our loan loss reserves for the years ended December 31, 2009 and 2008, respectively; |
| • | Revenues in excess of actual cash received of approximately $5.2 million (net of adjustment for minority interest of $0.8 million) for the year ended December 31, 2009; $5.7 million (net of adjustment for minority interest of $1.0 million) for the year ended December 31, 2008; $3.5 million (net of adjustment for minority interest of $0.5 million) for the year ended December 31, 2007, as a result of amortization of above-market/below-market in-place leases; |
| • | Other-than-temporary impairments related to our real estate securities of $5.1 million and $50.1 million were recognized for the years ended December 31, 2009 and 2008, respectively; |
| • | Amortization of deferred financing costs related to notes payable of approximately $4.2 million (net of adjustment for minority interest of $0.6 million) for the year ended December 31, 2009; $6.9 million (net of adjustment for minority interest of $1.0 million) for the year ended December 31, 2008; $2.5 million (net of adjustment for minority interest of $0.4 million) for the year ended December 31, 2007, were recognized as interest expense; |
| • | Revenues in excess of actual cash received of $4.1 million (net of adjustment for minority interest of $49,000) for the year ended December 31, 2009; of $4.9 million (net of adjustment for minority interest of $0.3 million) for the year ended December 31, 2008; and $2.2 million (net of adjustment for minority interest of $0.1 million) for the year ended December 31, 2007, as a result of straight-line rent and amortization of lease incentives; |
| • | Accretion of discounts and origination fees on real estate loans receivable and real estate securities to interest income, net of amortization of closing costs, of $2.9 million, $18.1 million and $(0.2) million were recognized for the years ended December 31, 2009, 2008 and 2007, respectively; and |
| • | Amortization of interest rate floors of $1.8 million and $2.7 million were recognized for the years ended December 31, 2009 and 2008, respectively. |
Operating cash flow and FFO may be used to fund all or a portion of certain capitalizable items that are excluded from FFO, such as tenant improvements, building improvements, and deferred leasing costs. Tenant improvements and capital expenditures totaled $23.8 million, $13.4 million and $3.6 million and leasing commissions totaled $10.3 million, $5.8 million and $0.6 million for the years ended December 31, 2009, 2008 and 2007, respectively.
61
Table of Contents
Distributions
Distributions declared, distributions paid and cash flows from operations were as follows during 2009 (in thousands, except per share amounts):
| Distributions Declared (1) |
Distributions Declared Per Share (1) (2) |
Distributions Paid (3) | Cash Flows From Operations | |||||||||||||||
| Period |
Cash | Reinvested | Total | |||||||||||||||
| First Quarter 2009 |
$ | 30,625 | $ | 0.172 | $ | 13,644 | $ | 16,975 | $ | 30,619 | $ | 17,780 | ||||||
| Second Quarter 2009 |
30,904 | 0.175 | 14,454 | 16,785 | 31,239 | 33,833 | ||||||||||||
| Third Quarter 2009 |
23,609 | 0.132 | 12,927 | 13,189 | 26,116 | 24,550 | ||||||||||||
| Fourth Quarter 2009 |
23,673 | 0.133 | 12,105 | 11,286 | 23,391 | 23,575 | ||||||||||||
| $ | 108,811 | $ | 0.612 | $ | 53,130 | $ | 58,235 | $ | 111,365 | $ | 99,738 | |||||||
(1) Distributions for the period from January 1, 2009 through June 30, 2009 are based on daily record dates and calculated at a rate of $0.0019178 per share per day. Distributions for the period from July 1, 2009 through December 31, 2009 are based on daily record dates and calculated at a rate of $0.00143836 per share per day.
(2) Assumes share was issued and outstanding each day during the periods presented.
(3) Distributions are paid on a monthly basis. Distributions for all record dates of a given month are paid approximately 15 days following month-end.
For the year ended December 31, 2009, we paid aggregate distributions of $111.4 million, including $53.1 million of distributions paid in cash and $58.2 million of distributions reinvested through our dividend reinvestment plan. We funded the net cash distributions from net cash flow from operations of $99.7 million for the year ended December 31, 2009. FFO for the year ended December 31, 2009 was $(70.8) million. Please see the reconciliation of FFO to net loss above.
During the past 12 months, our portfolio has experienced increasing pressure from declines in cash flow from a number of our investments. There have been several significant factors responsible for the changes in cash flow. Increases in rental concessions given to retain tenants, which is important to the continued success of our portfolio, has resulted in lower current cash flow. Projected future declines in rental rates, slower or potentially negative net absorption of leased space and expectations of future rental concessions, including three or more months of free rent to retain tenants who are up for renewal or to sign new tenants, are expected to result in additional decreases in cash flow. Historically low LIBOR, which is used to calculate the interest due to us on certain of our debt investments, has resulted in a reduction in interest income we earn on those investments. LIBOR has fallen from a high of approximately 5.8% during 2007 to 0.2% as of December 31, 2009. The decrease in interest earned on our variable rate debt investments is offset by the decrease in interest expense incurred on our variable rate notes payable and repurchase agreements. In addition, financial difficulties of borrowers under loans we own, lower rental and occupancy rates at the properties securing loans, the expiration of interest rate floor agreements related to certain debt investments and slower sales and lower prices for condo units securing certain loans have caused cash flows to decline and/or may result in additional declines. As a result of these factors, our board of directors declared distributions at an annualized distribution rate of 5.25% (annualized rate based on a purchase price of $10.00 per share or a 7.32% annualized rate based on shares purchased under our dividend reinvestment plan at the current estimated value per share of $7.17) beginning with daily record dates for July 2009 to preserve capital necessary to maintain our investment portfolio. In addition, these factors could result in further decreases to distributions in future periods.
Our operating performance cannot be accurately predicted and may deteriorate in the future due to numerous factors, including those discussed under “Forward-Looking Statements,” Part I, Item 1, “Business — Market Outlook — Real Estate and Real Estate Finance Markets,” Part I, Item 1A, “Risk Factors” and Part II, Item 7, “Management’s Discussion and Analysis of Financial Condition and Results of Operations — Results of Operations.” Those factors include: the future operating performance of our investments in the existing real estate and financial environment; the success and economic viability of our tenants; the ability of our borrowers and their sponsors to continue to make their debt service payments and/or to repay their loans upon maturity; our ability to refinance existing indebtedness at comparable terms; changes in interest rates on our variable rate debt obligations or loans receivable; and the level of participation in our dividend reinvestment plan. In the event our FFO and/or cash flow from operations decrease in the future, the level of our distributions may also decrease. In addition, future distributions declared and paid may exceed FFO and/or cash flow from operations.
62
Table of Contents
Critical Accounting Policies
Below is a discussion of the accounting policies that management considers critical in that they involve significant management judgments and assumptions, require estimates about matters that are inherently uncertain and because they are important for understanding and evaluating our reported financial results. These judgments affect the reported amounts of assets and liabilities and our disclosure of contingent assets and liabilities at the dates of the financial statements and the reported amounts of revenue and expenses during the reporting periods. With different estimates or assumptions, materially different amounts could be reported in our financial statements. Additionally, other companies may utilize different estimates that may impact the comparability of our results of operations to those of companies in similar businesses.
Revenue Recognition
We recognize minimum rent, including rental abatements, lease incentives and contractual fixed increases attributable to operating leases, on a straight-line basis over the term of the related leases when collectibility is reasonably assured and record amounts expected to be received in later years as deferred rent. If the lease provides for tenant improvements, we determine whether the tenant improvements, for accounting purposes, are owned by the tenant or by us. When we are the owner of the tenant improvements, the tenant is not considered to have taken physical possession or have control of the physical use of the leased asset until the tenant improvements are substantially completed. When the tenant is the owner of the tenant improvements, any tenant improvement allowance that is funded is treated as a lease incentive and amortized as a reduction of revenue over the lease term. Tenant improvement ownership is determined based on various factors including, but not limited to:
| • | whether the lease stipulates how a tenant improvement allowance may be spent; |
| • | whether the amount of a tenant improvement allowance is in excess of market rates; |
| • | whether the tenant or landlord retains legal title to the improvements at the end of the lease term; |
| • | whether the tenant improvements are unique to the tenant or general-purpose in nature; and |
| • | whether the tenant improvements are expected to have any residual value at the end of the lease. |
During the years ended December 31, 2009, 2008 and 2007, we recognized deferred rent from tenants of $4.0 million, $5.2 million and $2.3 million, respectively. These excess amounts for the years ended December 31, 2009 and 2008 are net of $0.6 million and $0.1 million, respectively, of lease incentive amortization; there was no amortization of lease incentives for the year ended December 31, 2007. As of December 31, 2009 and 2008, the cumulative deferred rent balance was $18.8 million and $9.4 million, respectively, and is included in rents and other receivables on the accompanying balance sheets. The cumulative deferred rent balance included $6.5 million and $1.7 million of unamortized lease incentives as of December 31, 2009 and 2008, respectively. We record property operating expense reimbursements due from tenants for common area maintenance, real estate taxes, and other recoverable costs in the period the related expenses are incurred.
We make estimates of the collectibility of our tenant receivables related to base rents, including straight-line rent, expense reimbursements and other revenue or income. Management specifically analyzes accounts receivable and historical bad debts, customer creditworthiness, current economic trends and changes in customer payment terms when evaluating the adequacy of the allowance for doubtful accounts. In addition, with respect to tenants in bankruptcy, management makes estimates of the expected recovery of pre-petition and post-petition claims in assessing the estimated collectibility of the related receivable. In some cases, the ultimate resolution of these claims can exceed one year. When a tenant is in bankruptcy, we will record a bad debt reserve for the tenant’s receivable balance and generally will not recognize subsequent rental revenue until cash is received or until the tenant is no longer in bankruptcy and has the ability to make rental payments. During the years ended December 31, 2009, 2008 and 2007, we recorded bad debt expense related to our tenant receivables of $2.2 million, $0.5 million and $0.2 million, respectively. During the year ended December 31, 2009, we wrote off, as a reduction to rental revenue, $1.3 million related to deferred rent receivables, primarily related to tenants in bankruptcy. We did not record a provision for bad debt expense related to our deferred rent receivables at December 31, 2009, 2008 and 2007, respectively.
Interest income on our real estate loans receivable is recognized on an accrual basis over the life of the investment using the interest method. Direct loan origination fees and origination or acquisition costs, as well as acquisition premiums or discounts, are amortized over the term of the loan as an adjustment to interest income. We place loans on nonaccrual status when any portion of principal or interest is 90 days past due, or earlier when concern exists as to the ultimate collection of principal or interest. When a loan is placed on nonaccrual status, we reverse the accrual for unpaid interest and generally do not recognize subsequent interest income until the cash is received, or the loan returns to accrual status.
63
Table of Contents
We recognize interest income on real estate securities that are beneficial interests in securitized financial assets and are rated “AA” and above on an accrual basis according to the contractual terms of the securities. Discounts or premiums are amortized to interest income over the life of the investment using the interest method.
We recognize interest income on real estate securities that are beneficial interests in securitized financial assets that are rated below “AA” using the effective yield method, which requires us to periodically project estimated cash flows related to these securities and recognize interest income at an interest rate equivalent to the estimated yield on the security, as calculated using the security’s estimated cash flows and amortized cost basis, or reference amount. Changes in the estimated cash flows are recognized through an adjustment to the yield on the security on a prospective basis. Projecting cash flows for these types of securities requires significant judgment, which may have a significant impact on the timing of revenue recognized on these investments.
We recognize interest income on our cash and cash equivalents as it is earned and record such amounts as other interest income.
Real Estate
Depreciation and Amortization
Real estate costs related to the acquisition and improvement of properties are capitalized and amortized over the expected useful life of the asset on a straight-line basis. Repair and maintenance costs are charged to expense as incurred and significant replacements and betterments are capitalized. Repair and maintenance costs include all costs that do not extend the useful life of the real estate asset. We consider the period of future benefit of an asset to determine its appropriate useful life. Expenditures for tenant improvements are capitalized and amortized over the shorter of the tenant’s lease term or expected useful life. We anticipate the estimated useful lives of our assets by class to be generally as follows:
| Buildings | 25-40 years | |
| Building improvements | 10-25 years | |
| Tenant improvements | Shorter of lease term or expected useful life | |
| Tenant origination and absorption costs | Remaining term of related lease |
These assessments have a direct impact on our net income, because, if we were to shorten the expected useful lives of our investments in real estate, we would depreciate these investments over fewer years, resulting in more depreciation expense and lower net income on an annual basis throughout the expected useful lives of these investments.
Real Estate Acquisition Valuation
We record the acquisition of income-producing real estate or real estate that will be used for the production of income as a business combination. Prior to January 1, 2009, real estate acquired in a business combination, consisting of land, buildings and improvements, was recorded at cost. We allocated the cost of tangible assets, identifiable intangibles and assumed liabilities (consisting of above and below-market leases and tenant origination and absorption costs) acquired in a business combination based on their estimated fair values. Beginning January 1, 2009, all assets acquired and liabilities assumed in a business combination are measured at their acquisition-date fair values, acquisition costs are expensed as incurred and restructuring costs that do not meet the definition of a liability at the acquisition date are expensed in periods subsequent to the acquisition date. In addition, changes in accounting for deferred tax asset valuation allowances and acquired income tax uncertainties after the measurement period are recorded to income tax expense. During the year ended December 31, 2009, we received a deed-in-lieu of foreclosure in satisfaction of the amounts due under our investment in the 18301 Von Karman Loans. We gained control of the collateral securing these loans, an office building located at 18301 Von Karman Avenue, Irvine, California, on October 6, 2009 and recorded the transaction as a business combination.
Estimates of the fair values of the tangible assets, identifiable intangibles and assumed liabilities require us to make significant assumptions to estimate market lease rates, property-operating expenses, carrying costs during lease-up periods, discount rates, market absorption periods, and the number of years the property will be held for investment. The use of inappropriate assumptions would result in an incorrect valuation of our acquired tangible assets, identifiable intangibles and assumed liabilities, which would impact the amount of our net income.
64
Table of Contents
Impairment of Real Estate and Related Intangible Assets and Liabilities
We continually monitor events and changes in circumstances that could indicate that the carrying amounts of our real estate and related intangible assets and liabilities may not be recoverable or realized. When indicators of potential impairment suggest that the carrying value of real estate and related intangible assets and liabilities may not be recoverable, we assess the recoverability by estimating whether we will recover the carrying value of the real estate and related intangible assets and liabilities through its undiscounted future cash flows and its eventual disposition. If, based on this analysis, we do not believe that we will be able to recover the carrying value of the real estate and related intangible assets and liabilities, we would record an impairment loss to the extent that the carrying value exceeds the estimated fair value of the real estate and related intangible assets and liabilities. We did not record any impairment loss on our real estate and related intangible assets and liabilities during the years ended December 31, 2009, 2008 and 2007.
Projecting future cash flows involves estimating expected future operating income and expenses related to the real estate and its related intangible assets and liabilities as well as market and other trends. Using inappropriate assumptions to estimate cash flows could result in incorrect fair values of the real estate and its related intangible assets and liabilities and could result in the overstatement of the carrying values of our real estate and related intangible assets and liabilities and an overstatement of our net income.
Real Estate Loans Receivable
Our real estate loans receivable are recorded at amortized cost, net of loan loss reserves, and evaluated for impairment at each balance sheet date. The amortized cost of a real estate loan receivable is the outstanding unpaid principal balance, net of unamortized acquisition premiums or discounts and unamortized costs and fees directly associated with the origination or acquisition of the loan.
The reserve for loan losses is a valuation allowance that reflects our estimate of loan losses inherent in the loan portfolio as of the balance sheet date. The reserve is adjusted through “Provision for loan losses” in our consolidated statements of operations and is decreased by charge-offs to specific loans when losses are confirmed. The reserve for loan losses includes a portfolio-based component and an asset-specific component.
The asset-specific reserve component relates to reserves for losses on loans considered impaired. We consider a loan to be impaired when, based upon current information and events, we believe that it is probable that we will be unable to collect all amounts due under the contractual terms of the loan agreement. We also consider a loan to be impaired if we grant the borrower a concession through a modification of the loan terms or if we expect to receive assets (including equity interests in the borrower) with fair values that are less than the carrying value of our loan in satisfaction of the loan. A reserve is established when the present value of payments expected to be received, observable market prices, the estimated fair value of the collateral (for loans that are dependent on the collateral for repayment) or amounts expected to be received in satisfaction of an impaired loan are lower than the carrying value of that loan.
The portfolio-based reserve component covers the pool of loans that do not have asset-specific reserves. A provision for loan losses is recorded when available information as of each balance sheet date indicates that it is probable that the pool of loans will incur a loss and the amount of the loss can be reasonably estimated. Required reserve balances for this pool of loans are derived from estimated probabilities of default and estimated loss severities assuming a default occurs. On a quarterly basis, we assign estimated probabilities of default and loss severities to each loan in the portfolio based on factors such as the debt service coverage of the underlying collateral, the estimated fair value of the collateral, the significance of the borrower’s investment in the collateral, the financial condition of the borrower and/or its sponsors, the likelihood that the borrower and/or its sponsors would allow the loan to default, our willingness and ability to step in as owner in the event of default, and other pertinent factors.
During the years ended December 31, 2009 and 2008, we recorded a loan loss reserve of $178.8 million and $104.0 million, respectively. For the year ended December 31, 2009, the change in loan loss reserve was comprised of $208.8 million calculated on an asset-specific basis, partially offset by a reduction of $30.0 million to our portfolio-based reserve. For the year ended December 31, 2008, the loan loss reserve was comprised of $50.0 million calculated on an asset-specific basis and $54.0 million from our portfolio-based reserve. We did not recognize any asset-specific or portfolio-based loan losses during the year ended December 31, 2007.
Failure to recognize impairments would result in the overstatement of earnings and the carrying value of our real estate loans held for investment. Actual losses, if any, could differ significantly from estimated amounts.
65
Table of Contents
Investment in Unconsolidated Joint Venture
On July 8, 2009, we released the borrowers under two investments in mezzanine loans from liability and received preferred membership interests in a joint venture that indirectly owns the properties that had served as collateral for the loans. The interests were initially recorded by us at a fair value of $0 based on the estimated fair value of the collateral at the time of receipt of the preferred membership interests. We account for our preferred membership interests in the real estate joint venture under the equity method of accounting since we are not the primary beneficiary of the joint venture, but do have more than a minor interest. Since we will most likely only receive preferred distributions equivalent to the interest income we would have earned on our mezzanine loan investments, our application of the equity method of accounting to these preferred interests results in us recording all distributions received as income. We do not record our share of the changes in the book value of the joint venture as we are not required to absorb losses and do not expect increases in the book value of the joint venture to have any material impact on the cash flows we will receive over the course of the investment. During the year ended December 31, 2009, we recognized $4.0 million of preferred distributions as income from unconsolidated joint venture.
Real Estate Securities
We classify our investments in real estate securities as available-for-sale, since we may sell them prior to their maturity but do not hold them principally for the purpose of making frequent investments and sales with the objective of generating profits on short-term differences in price. These investments are carried at estimated fair value, with unrealized gains and losses reported in accumulated other comprehensive income (loss). Estimated fair values are generally based on quoted market prices, when available, or on estimates provided by independent pricing sources or dealers who make markets in such securities. In certain circumstances, such as when the market for the securities becomes inactive, we may determine it is appropriate to perform an internal valuation of the securities. Upon the sale of a security, the previously recognized unrealized gain (loss) would be reversed and the actual realized gain (loss) recognized.
On a quarterly basis, we evaluate our real estate securities for impairment. We review the projected future cash flows from these securities for changes in assumptions due to prepayments, credit loss experience and other factors. If, based on our quarterly estimate of cash flows, there has been an adverse change in the estimated cash flows from the cash flows previously estimated, the present value of the revised cash flows is less than the present value previously estimated, and the fair value of the securities is less than our amortized cost basis, an other-than-temporary impairment is deemed to have occurred.
Prior to April 1, 2009, when a security was deemed to be other-than-temporarily impaired, the security was written down to its fair value (with the reduction in fair value recorded as a charge to earnings) and a new cost basis was established. We would calculate a revised yield based on the new cost basis of the investment (including any other-than-temporary impairments recognized to date) and estimate future cash flows expected to be realized, which was applied prospectively to recognize interest income.
Beginning April 1, 2009, as a result of adopting a new accounting principle, we are required to distinguish between other-than-temporary impairments related to credit and other-than-temporary impairments related to other factors (e.g., market fluctuations) on our real estate securities that we do not intend to sell and where it is not likely that we will be required to sell the security prior to the anticipated recovery of our amortized cost basis. We calculate the credit component of the other-than-temporary impairment as the difference between the amortized cost basis of the security and the present value of its estimated cash flows discounted at the yield used to recognize interest income. The credit component will be charged to earnings and the component related to other factors will be recorded to other comprehensive income (loss).
On April 1, 2009, we recognized a cumulative transition adjustment of $14.8 million as an adjustment to the opening balance of retained earnings with a corresponding adjustment to accumulated other comprehensive income (loss) and to the amortized cost basis of our real estate securities. The transition adjustment was calculated as the difference between the present value of our estimated cash flows for our real estate securities as of April 1, 2009 discounted at the yield used to recognize income prior to the recognition of any other-than-temporary impairments and the April 1, 2009 amortized cost basis of the securities, which reflects the cumulative other-than-temporary impairment losses that have been recorded on our real estate securities that are not related to credit. Although we increased our amortized cost basis in the securities as a result of this transition adjustment, the securities are ultimately presented at fair value in the accompanying consolidated balance sheets with differences between fair value and amortized cost basis presented as unrealized gains or losses in accumulated other comprehensive income (loss) within the equity section of the accompanying consolidated balance sheets.
66
Table of Contents
During the year ended December 31, 2009, we recognized other-than-temporary impairments on our real estate securities of $5.1 million, all of which were recognized prior to April 1, 2009. On April 1, 2009, through our cumulative transition adjustment, we effectively reversed $14.8 million of cumulative non-credit related other-than-temporary impairment charges from retained earnings and recorded the amounts as unrealized losses within accumulated other comprehensive loss in the consolidated balance sheets. During the year ended December 31, 2008 we recognized other-than-temporary impairments on our real estate securities of $50.1 million. It is difficult to predict the timing or magnitude of these other-than-temporary impairments and significant judgments are required in determining impairments, including, but not limited to, assumptions regarding estimated prepayments, loss assumptions, and assumptions with respect to changes in interest rates. As a result, actual impairment losses could materially differ from these estimates.
Fair Value Measurements
Under GAAP, we are required to measure certain financial instruments at fair value on a recurring basis. In addition, we are required to measure other financial instruments and balances at fair value on a non-recurring basis (e.g., carrying value of impaired real estate loans receivable and long-lived assets). Fair value is defined as the price that would be received upon the sale of an asset or paid to transfer a liability in an orderly transaction between market participants at the measurement date. The GAAP fair value framework uses a three-tiered approach. Fair value measurements are classified and disclosed in one of the following three categories:
| • | Level 1: unadjusted quoted prices in active markets that are accessible at the measurement date for identical assets or liabilities; |
| • | Level 2: quoted prices for similar instruments in active markets, quoted prices for identical or similar instruments in markets that are not active, and model-derived valuations in which significant inputs and significant value drivers are observable in active markets; and |
| • | Level 3: prices or valuation techniques where little or no market data is available that requires inputs that are both significant to the fair value measurement and unobservable. |
When available, we utilize quoted market prices from an independent third-party source to determine fair value and classify such items in Level 1 or Level 2. In instances where the market for a financial instrument is not active, regardless of the availability of a nonbinding quoted market price, observable inputs might not be relevant and could require us to make a significant adjustment to derive a fair value measurement. Additionally, in an inactive market, a market price quoted from an independent third party may rely more on models with inputs based on information available only to that independent third party. When we determine the market for a financial instrument owned by us to be illiquid or when market transactions for similar instruments do not appear orderly, we use several valuation sources (including internal valuations, discounted cash flow analysis and quoted market prices) and establish a fair value by assigning weights to the various valuation sources. Additionally, when determining the fair value of liabilities in circumstances in which a quoted price in an active market for an identical liability is not available, we measure fair value using (i) a valuation technique that uses the quoted price of the identical liability when traded as an asset or quoted prices for similar liabilities or similar liabilities when traded as assets or (ii) another valuation technique that is consistent with the principles of fair value measurement, such as the income approach or the market approach.
Changes in assumptions or estimation methodologies can have a material effect on these estimated fair values. In this regard, the derived fair value estimates cannot be substantiated by comparison to independent markets and, in many cases, may not be realized in an immediate settlement of the instrument.
We consider the following factors to be indicators of an inactive market: (i) there are few recent transactions, (ii) price quotations are not based on current information, (iii) price quotations vary substantially either over time or among market makers (for example, some brokered markets), (iv) indexes that previously were highly correlated with the fair values of the asset or liability are demonstrably uncorrelated with recent indications of fair value for that asset or liability, (v) there is a significant increase in implied liquidity risk premiums, yields, or performance indicators (such as delinquency rates or loss severities) for observed transactions or quoted prices when compared with our estimate of expected cash flows, considering all available market data about credit and other nonperformance risk for the asset or liability, (vi) there is a wide bid-ask spread or significant increase in the bid-ask spread, (vii) there is a significant decline or absence of a market for new issuances (that is, a primary market) for the asset or liability or similar assets or liabilities, and (viii) little information is released publicly (for example, a principal-to-principal market).
67
Table of Contents
We consider the following factors to be indicators of non-orderly transactions: (i) there was not adequate exposure to the market for a period before the measurement date to allow for marketing activities that are usual and customary for transactions involving such assets or liabilities under current market conditions, (ii) there was a usual and customary marketing period, but the seller marketed the asset or liability to a single market participant, (iii) the seller is in or near bankruptcy or receivership (that is, distressed), or the seller was required to sell to meet regulatory or legal requirements (that is, forced), and (iv) the transaction price is an outlier when compared with other recent transactions for the same or similar assets or liabilities.
Income Taxes
We have elected to be taxed as a REIT under the Internal Revenue Code of 1986, as amended (the “Code”). To qualify as a REIT, we must meet certain organizational and operational requirements, including a requirement to distribute at least 90% of our annual REIT taxable income to stockholders (which is computed without regard to the dividends-paid deduction or net capital gain and which does not necessarily equal net income as calculated in accordance with GAAP). As a REIT, we generally will not be subject to federal income tax on income we distribute as dividends to our stockholders. If we fail to qualify as a REIT in any taxable year, we will be subject to federal income tax on our taxable income at regular corporate income tax rates and generally will not be permitted to qualify for treatment as a REIT for federal income tax purposes for the four taxable years following the year during which qualification is lost, unless the Internal Revenue Service grants us relief under certain statutory provisions. Such an event could materially and adversely affect our net income and net cash available for distribution to stockholders. However, we believe that we are organized and operate in such a manner as to qualify for treatment as a REIT.
We have concluded that there are no significant uncertain tax positions requiring recognition in our financial statements. Neither we nor our subsidiaries have been assessed interest or penalties by any major tax jurisdictions. Our evaluations were performed for the tax years ending December 31, 2009, 2008 and 2007. As of December 31, 2009, returns for the calendar years 2006 through 2008 remain subject to examination by major tax jurisdictions.
Subsequent Events
We evaluate subsequent events up until the date the consolidated financial statements are issued.
Distributions Paid
On January 15, 2010, we paid distributions of $8.0 million, which related to distributions declared for each day in the period from December 1, 2009 through December 31, 2009. On February 12, 2010, we paid distributions of $8.0 million, which related to distributions declared for each day in the period from January 1, 2010 through January 31, 2010, and on March 15, 2010, we paid distributions of $7.3 million, which related to distributions declared for each day in the period from February 1, 2010 through February 28, 2010.
Distributions Declared
On January 15, 2010, our board of directors declared distributions based on daily record dates for the period from February 1, 2010 through February 28, 2010, which we paid on March 15, 2010, and distributions based on daily record dates for the period from March 1, 2010 through March 31, 2010, which we expect to pay in April 2010. On March 19, 2010, our board of directors declared distributions based on daily record dates for the period from April 1, 2010 through April 30, 2010, which we expect to pay in May 2010, and distributions based on daily record dates for the period from May 1, 2010 through May 31, 2010, which we expect to pay in June 2010. Investors may choose to receive cash distributions or purchase additional shares through our dividend reinvestment plan.
Distributions for these periods will be calculated based on stockholders of record each day during these periods at a rate of $0.00143836 per share per day and equal a daily amount that, if paid each day for a 365-day period, would equal a 5.25% annualized rate based on a purchase price of $10.00 per share or a 7.32% annualized rate based on shares purchased under our dividend reinvestment plan at the current estimated value per share of $7.17. KBS Capital Advisors has agreed to advance funds to us equal to the amount by which the cumulative amount of distributions declared by us from January 1, 2006 through the period ending May 31, 2010 exceeds the amount of our funds from operations (as defined by the advisory agreement) from January 1, 2006 through May 31, 2010.
Millennium I Building Revolving Loan
On February 12, 2010, we, through an indirect wholly owned subsidiary, completed the secured financing of the Millennium I Building. We obtained a three-year revolving loan from a financial institution in the amount of $29.5 million at a floating interest rate equal to 375 basis points over one-month LIBOR. The loan matures on March 1, 2013.
68
Table of Contents
| ITEM 7A. | QUANTITATIVE AND QUALITATIVE DISCLOSURES ABOUT MARKET RISK |
We are exposed to the effects of interest rate changes as a result of borrowings used to maintain liquidity and to fund the acquisition, expansion and refinancing of our real estate investment portfolio and operations. We are also exposed to the effects of changes in interest rates as a result of the acquisition and origination of mortgage, mezzanine, bridge and other loans and the acquisition of real estate securities. Our profitability and the value of our investment portfolio may be adversely affected during any period as a result of interest rate changes. Our interest rate risk management objectives are to limit the impact of interest rate changes on earnings, prepayment penalties and cash flows and to lower overall borrowing costs. We have managed and will continue to manage interest rate risk by maintaining a ratio of fixed rate, long-term debt such that floating rate exposure is kept at an acceptable level. In addition, we utilize a variety of financial instruments, including interest rate caps, floors, and swap agreements, in order to limit the effects of changes in interest rates on our operations. When we use these types of derivatives to hedge the risk of interest-earning assets or interest-bearing liabilities, we may be subject to certain risks, including the risk that losses on a hedge position will reduce the funds available for payments to holders of our common stock and that the losses may exceed the amount we invested in the instruments.
69
Table of Contents
The table below summarizes the book values or notional amounts and the weighted-average interest rates of our real estate loans receivable, notes payable and derivative instruments for each category as of December 31, 2009 based on the maturity dates (dollars in thousands):
| Maturity Date | ||||||||||||||||||||||||||||||||
| 2010 | 2011 | 2012 | 2013 | 2014 | Thereafter | Total Book Value or Notional Amounts (1) |
Fair Value | |||||||||||||||||||||||||
| (dollars in thousands) | ||||||||||||||||||||||||||||||||
| Assets |
||||||||||||||||||||||||||||||||
| Loans receivable |
||||||||||||||||||||||||||||||||
| Mortgage loans - fixed rate |
$ | — | $ | — | $ | — | $ | — | $ | — | $ | 42,057 | $ | 42,057 | $ | 47,612 | ||||||||||||||||
| Average effective interest rate (2) |
— | — | — | — | — | 10.6 | % | 10.6 | % | |||||||||||||||||||||||
| Mortgage loans - variable rate |
$ | 59,015 | $ | — | $ | — | $ | — | $ | — | $ | — | $ | 59,015 | $ | 51,452 | ||||||||||||||||
| Average effective interest rate (2) |
5.5 | % | — | — | — | — | — | 5.5 | % | |||||||||||||||||||||||
| Mezzanine loans - fixed rate |
$ | 88,115 | $ | — | $ | — | $ | — | $ | — | $ | 16,980 | $ | 105,095 | $ | 72,720 | ||||||||||||||||
| Average effective interest rate (2) |
8.9 | % | — | — | — | — | 9.0 | % | 8.9 | % | ||||||||||||||||||||||
| Mezzanine loans - variable rate |
$ | 520,087 | $ | — | $ | — | $ | — | $ | — | $ | — | $ | 520,087 | $ | 441,557 | ||||||||||||||||
| Average effective interest rate (2) |
5.7 | % | — | — | — | — | — | 5.7 | % | |||||||||||||||||||||||
| Unsecured loans - fixed rate |
$ | 50,000 | $ | — | $ | — | $ | — | $ | — | $ | — | $ | 50,000 | $ | — | ||||||||||||||||
| Average effective interest rate (2) |
0.0 | % | — | — | — | — | — | 0.0 | % | |||||||||||||||||||||||
| Real estate securities |
||||||||||||||||||||||||||||||||
| Fixed rate |
$ | — | $ | — | $ | — | $ | — | $ | — | $ | 12,948 | $ | 12,948 | $ | 12,948 | ||||||||||||||||
| Average interest rate (3) (4) |
— | — | — | — | — | 6.6 | % | 6.6 | % | |||||||||||||||||||||||
| Variable rate |
$ | — | $ | — | $ | — | $ | — | $ | — | $ | — | $ | — | $ | — | ||||||||||||||||
| Average interest rate (3) (5) |
— | 2.6 | % | — | — | — | — | 2.6 | % | |||||||||||||||||||||||
| Derivative instruments |
||||||||||||||||||||||||||||||||
| Interest rate caps, notional amount |
$ | 405,000 | $ | 46,000 | $ | — | $ | — | $ | — | $ | — | $ | 451,000 | $ | — | ||||||||||||||||
| Average interest rate |
5.8 | % | 2.5 | % | — | — | — | — | 5.5 | % | ||||||||||||||||||||||
| Liabilities |
||||||||||||||||||||||||||||||||
| Notes payable |
||||||||||||||||||||||||||||||||
| Fixed rate |
$ | — | $ | 142,217 | $ | 62,991 | $ | 103,142 | $ | 146,001 | $ | 80,200 | $ | 534,551 | $ | 498,656 | ||||||||||||||||
| Average interest rate (6) |
— | 5.4 | % | 5.8 | % | 5.9 | % | 5.8 | % | 5.8 | % | 5.7 | % | |||||||||||||||||||
| Variable rate |
$ | 478,478 | $ | 280,583 | $ | 204,417 | $ | 6,691 | $ | — | $ | — | $ | 970,169 | $ | 828,955 | ||||||||||||||||
| Average interest rate (6) |
1.8 | % | 1.7 | % | 5.1 | % | 1.2 | % | — | — | 2.5 | % | ||||||||||||||||||||
| Derivative instruments |
||||||||||||||||||||||||||||||||
| Interest rate swaps, notional amount |
$ | 41,000 | $ | — | $ | 119,037 | $ | 45,700 | $ | — | $ | — | $ | 205,737 | $ | (6,614 | ) | |||||||||||||||
| Average pay rate (7) |
2.3 | % | — | 3.8 | % | 2.3 | % | — | — | 3.2 | % | |||||||||||||||||||||
| Average receive rate (8) |
0.2 | % | — | 0.2 | % | 0.2 | % | — | — | 0.2 | % | |||||||||||||||||||||
(1) Book value of loans receivable is presented gross of portfolio-based reserve and asset-specific reserves.
(2) The average effective interest rate is calculated based on actual interest income recognized in 2009, including interest income recognized through accretion of discounts, calculated using the interest method divided by the average cost basis of the investment less the unamortized discount. The annual effective interest rate and maturity dates presented are as of December 31, 2009.
(3) Average interest rate is the weighted-average interest rate. The average interest rate and maturity dates presented are as of December 31, 2009.
(4) We recognized other-than-temporary impairment charges of $22.2 million on this investment as of December 31, 2009.
(5) We recognized other-than-temporary impairment charges of $18.2 million on this investment as of December 31, 2009.
(6) Average interest rate is the weighted-average interest rate. The average interest rate and maturity dates presented are as of December 31, 2009, including interest income recognized through accretion of discounts over the life of their respective loans using the interest method.
(7) Average pay rate is the interest rate swap fixed rate.
(8) Average receive rate is the 30-day LIBOR rate at December 31, 2009.
70
Table of Contents
We borrow funds and make investments at a combination of fixed and variable rates. Interest rate fluctuations will generally not affect our future earnings or cash flows on our fixed rate debt or fixed rate real estate loans receivable unless such instruments mature or are otherwise terminated. However, interest rate changes will affect the fair value of our fixed rate instruments. At December 31, 2009, the fair value and carrying value of our fixed rate real estate loans receivable were $120.3 million and $197.2 million, respectively. The fair value estimate of our real estate loans receivable is estimated using an internal valuation model that considers the expected cash flows for the loans, underlying collateral values (for collateral-dependent loans) and the estimated yield requirements of institutional investors for loans with similar characteristics, including remaining loan term, loan-to-value, type of collateral and other credit enhancements. At December 31, 2009, the fair value of our fixed rate debt was $498.7 million and the carrying value of our fixed rate debt was $534.5 million. The fair value estimate of our fixed rate debt was estimated using a discounted cash flow analysis utilizing rates we would expect to pay for debt of a similar type and remaining maturity if the loans were originated at December 31, 2009. As we expect to hold our fixed rate instruments to maturity and the amounts due under such instruments would be limited to the outstanding principal balance and any accrued and unpaid interest, we do not expect that fluctuations in interest rates, and the resulting changes in fair value of our fixed rate instruments, would have a significant impact on our operations.
Conversely, movements in interest rates on variable rate debt and loans receivable, as well as our investment in preferred membership interests in an unconsolidated joint venture, would change our future earnings and cash flows, but would not significantly affect the fair value of those instruments. However, changes in required risk premiums would result in changes in the fair value of floating rate instruments. At December 31, 2009, we were exposed to market risks related to fluctuations in interest rates on $764.5 million of our $970.2 million of variable rate debt outstanding, after giving consideration to the impact of interest swap agreements on approximately $205.7 million of our variable rate debt. Based on interest rates as of December 31, 2009, if interest rates were 100 basis points higher during the 12 months ending December 31, 2010, interest expense on our variable rate debt outstanding would increase by approximately $7.6 million and if interest rates were 100 basis points lower during the 12 months ending December 31, 2010, interest expense on our variable rate debt outstanding would decrease by $1.8 million. Excluding real estate loans receivable with asset-specific loan loss reserves, at December 31, 2009 we were exposed to market risks related to fluctuations in interest rates on $553.9 million of variable rate loans receivable, of which $41.6 million are subject to interest rate floors. Based on interest rates as of December 31, 2009, if interest rates were 100 basis points higher or lower during the 12 months ending December 31, 2010, interest income would be increased or decreased by approximately $5.3 million. At December 31, 2009, we were exposed to market risks related to fluctuations in interest rates with respect to our investment in preferred membership interests in an unconsolidated joint venture. Based on interest rates as of December 31, 2009, if interest rates were 100 basis points higher or lower during the 12 months ending December 31, 2010, income from the preferred membership interests in the unconsolidated joint venture would be increased or decreased by $1.7 million.
The weighted-average annual effective interest rates of our fixed rate real estate loans receivable and variable rate real estate loans receivable at December 31, 2009 were 7.0% and 5.7%, respectively. The weighted-average annual effective interest rate represents the effective interest rate at December 31, 2009, using the interest method, that we use to recognize interest income on our real estate loans receivable without asset-specific loan loss reserves. The weighted-average interest rates of our fixed rate debt and variable rate debt at December 31, 2009 were 5.7% and 2.5%, respectively. The weighted-average interest rate represents the actual interest rate in effect at December 31, 2009 (consisting of the contractual interest rate and the effect of interest rate caps, floors and swaps), using interest rate indices as of December 31, 2009, where applicable.
For a discussion of the interest rate risks related to the current capital and credit markets, see Part I, Item 1, “Business — Market Outlook” and Part I, Item 1A, “Risk Factors.”
| ITEM 8. | FINANCIAL STATEMENTS AND SUPPLEMENTARY DATA |
See the Index to Financial Statements at page F-1 of this report.
| ITEM 9. | CHANGES IN AND DISAGREEMENTS WITH ACCOUNTANTS ON ACCOUNTING AND FINANCIAL DISCLOSURE |
None.
71
Table of Contents
| ITEM 9A. | CONTROLS AND PROCEDURES |
Disclosure Controls and Procedures
As of the end of the period covered by this report, management, including our chief executive officer and chief financial officer, evaluated the effectiveness of the design and operation of our disclosure controls and procedures. Based upon, and as of the date of, the evaluation, our chief executive officer and chief financial officer concluded that the disclosure controls and procedures were effective as of the end of the period covered by this report to ensure that information required to be disclosed in the reports we file and submit under the Exchange Act is recorded, processed, summarized and reported as and when required. Disclosure controls and procedures include, without limitation, controls and procedures designed to ensure that information required to be disclosed by us in the reports we file and submit under the Exchange Act is accumulated and communicated to our management, including our chief executive officer and our chief financial officer, as appropriate to allow timely decisions regarding required disclosure.
Internal Control Over Financial Reporting
Our management is responsible for establishing and maintaining adequate internal control over financial reporting, as such term is defined in Rule 13a-15(f) or 15d-15(f) promulgated under the Securities Exchange Act of 1934, as amended.
In connection with the preparation of our Form 10-K, our management assessed the effectiveness of our internal control over financial reporting as of December 31, 2009. In making that assessment, management used the criteria set forth by the Committee of Sponsoring Organizations of the Treadway Commission (COSO) in Internal Control-Integrated Framework.
Based on its assessment, our management believes that, as of December 31, 2009, our internal control over financial reporting was effective based on those criteria. There have been no changes in our internal control over financial reporting that occurred during the quarter ended December 31, 2009 that have materially affected, or are reasonably likely to materially affect, our internal control over financial reporting. This annual report does not include an attestation report of our registered public accounting firm regarding internal control over financial reporting. Management’s report was not subject to attestation by our registered public accounting firm pursuant to temporary rules of the Securities and Exchange Commission that permit us to provide only management’s report in this annual report.
| ITEM 9B. | OTHER INFORMATION |
As of the quarter ended December 31, 2009, all items required to be disclosed under Form 8-K were reported under Form 8-K.
72
Table of Contents
We will file a definitive Proxy Statement for our 2010 Annual Meeting of Stockholders (the “2010 Proxy Statement”) with the SEC, pursuant to Regulation 14A, not later than 120 days after the end of our fiscal year. Accordingly, certain information required by Part III has been omitted under General Instruction G(3) to Form 10-K. Only those sections of the 2010 Proxy Statement that specifically address the items required to be set forth herein are incorporated by reference.
| ITEM 10. | DIRECTORS, EXECUTIVE OFFICERS AND CORPORATE GOVERNANCE |
We have adopted a Code of Conduct and Ethics that applies to all of our executive officers and directors, including but not limited to, our principal executive officer and principal financial officer. Our Code of Conduct and Ethics can be found at http://www.kbsreit.com.
The other information required by this Item is incorporated by reference from our 2010 Proxy Statement.
| ITEM 11. | EXECUTIVE COMPENSATION |
The information required by this Item is incorporated by reference from our 2010 Proxy Statement.
| ITEM 12. | SECURITY OWNERSHIP OF CERTAIN BENEFICIAL OWNERS AND MANAGEMENT AND RELATED STOCKHOLDER MATTERS |
The information required by this Item is incorporated by reference from our 2010 Proxy Statement.
| ITEM 13. | CERTAIN RELATIONSHIPS AND RELATED TRANSACTIONS AND DIRECTOR INDEPENDENCE |
The information required by this Item is incorporated by reference from our 2010 Proxy Statement.
| ITEM 14. | PRINCIPAL ACCOUNTING FEES AND SERVICES |
The information required by this Item is incorporated by reference from our 2010 Proxy Statement.
73
Table of Contents
| ITEM 15. | EXHIBITS, FINANCIAL STATEMENT SCHEDULES |
| (a) | Financial Statement Schedules |
See the Index to Financial Statements at page F-1 of this report.
The following financial statement schedules are included herein at pages F-52 through F-54 of this report:
Schedule II – Valuation and Qualifying Accounts
Schedule III – Real Estate Assets and Accumulated Depreciation and Amortization
| (b) | Exhibits |
74
Table of Contents
EXHIBIT LIST
| Ex. |
Description | |
| 3.1 | Amended and Restated Charter of the Company, incorporated by reference to Exhibit 3.1 to the Company’s Quarterly Report on Form 10-Q for the period ended March 31, 2006 | |
| 3.2 | Amended and Restated Bylaws of the Company, incorporated by reference to Exhibit 3.2 to the Company’s Quarterly Report on Form 10-Q for the period ended March 31, 2006 | |
| 4.1 | Statement regarding restrictions on transferability of shares of common stock (to appear on stock certificate or to be sent upon request and without charge to stockholders issued shares without certificates), incorporated by reference to Exhibit 4.2 to the Company’s Registration Statement on Form S-11, Commission File No. 333-126087 | |
| 4.2 | Third Amended and Restated Dividend Reinvestment Plan, incorporated by reference to Exhibit 4.1 to the Company’s Current Report on Form 8-K filed October 28, 2009 | |
| 4.3 | Amended and Restated Share Redemption Program, incorporated by reference to Exhibit 4.3 to the Company’s Quarterly Report on Form 10-Q for the period ended March 31, 2009 | |
| 10.1 | First Amendment to Operating Agreement of New Leaf-KBS JV, LLC (related to the acquisition of the National Industrial Portfolio) between New Leaf Industrial Partners Fund, L.P. and KBS REIT Acquisition XXIII, LLC, dated as of April 15, 2009, incorporated by reference to Exhibit 10.4 to the Company’s Quarterly Report on Form 10-Q for the period ended March 31, 2009 | |
| 10.2 | Advisory Agreement between the Company and KBS Capital Advisors, dated November 8, 2009 incorporated by reference to Exhibit 10.3 to the Company’s Quarterly Report on Form 10-Q for the period ended September 30, 2009 | |
| 10.3 | Amendment no. 1 to the Advisory Agreement between the Company and KBS Capital Advisors, dated as of November 13, 2009 | |
| 10.4 | Amendment no. 2 to the Advisory Agreement between the Company and KBS Capital Advisors, dated as of January 15, 2010 | |
| 10.5 | Amendment no. 3 to the Advisory Agreement between the Company and KBS Capital Advisors, dated as of March 19, 2010 | |
| 10.6 | Amendment to Amended and Restated Senior Mezzanine Loan Agreement (related to the GKK Mezzanine Loan) by and among KBS Debt Holdings, LLC, as lender, and American Financial Realty Trust, GKK Stars Acquisition LLC, First States Group, L.P., First States Group, LLC, and certain subsidiaries of Gramercy Capital Corp., as borrower, dated as of March 9, 2010. | |
75
Table of Contents
| Ex. |
Description | |
| 21.1 | Subsidiaries of the Company | |
| 23.1 | Consent of Ernst & Young LLP | |
| 31.1 | Certification of Chief Executive Officer pursuant to Section 302 of the Sarbanes-Oxley Act of 2002 | |
| 31.2 | Certification of Chief Financial Officer pursuant to Section 302 of the Sarbanes-Oxley Act of 2002 | |
| 32.1 | Certification of Chief Executive Officer pursuant to 18 U.S.C. 1350, as created by Section 906 of the Sarbanes-Oxley Act of 2002 | |
| 32.2 | Certification of Chief Financial Officer pursuant to 18 U.S.C. 1350, as created by Section 906 of the Sarbanes-Oxley Act of 2002 | |
76
Table of Contents
INDEX TO CONSOLIDATED FINANCIAL STATEMENTS
| Consolidated Financial Statements | ||
| F-2 | ||
| Consolidated Balance Sheets as of December 31, 2009 and 2008 |
F-3 | |
| Consolidated Statements of Operations for the Years Ended December 31, 2009, 2008 and 2007 |
F-4 | |
| Consolidated Statements of Equity for the Years Ended December 31, 2009, 2008 and 2007 |
F-5 | |
| Consolidated Statements of Cash Flows for the Years Ended December 31, 2009, 2008 and 2007 |
F-6 | |
| F-7 | ||
| Financial Statement Schedules | ||
| F-52 | ||
| Schedule III — Real Estate Assets and Accumulated Depreciation and Amortization |
F-53 | |
All other schedules are omitted because they are not applicable or the required information is shown in the financial statements or notes thereto.
F-1
Table of Contents
REPORT OF INDEPENDENT REGISTERED PUBLIC ACCOUNTING FIRM
The Board of Directors and Stockholders
KBS Real Estate Investment Trust, Inc.
We have audited the accompanying consolidated balance sheets of KBS Real Estate Investment Trust, Inc. as of December 31, 2009 and 2008, and the related consolidated statements of operations, equity, and cash flows for each of the three years in the period ended December 31, 2009. Our audits also included the financial statement schedules in Item 15(a), Schedule II-Valuation and Qualifying Accounts and Schedule III-Real Estate Assets and Accumulated Depreciation and Amortization. These financial statements and schedules are the responsibility of the Company’s management. Our responsibility is to express an opinion on these financial statements and schedules based on our audits.
We conducted our audits in accordance with the standards of the Public Company Accounting Oversight Board (United States). Those standards require that we plan and perform the audit to obtain reasonable assurance about whether the financial statements are free of material misstatement. We were not engaged to perform an audit of the Company’s internal control over financial reporting. Our audits included consideration of internal control over financial reporting as a basis for designing audit procedures that are appropriate in the circumstances, but not for the purpose of expressing an opinion on the effectiveness of the Company’s internal control over financial reporting. Accordingly, we express no such opinion. An audit includes examining, on a test basis, evidence supporting the amounts and disclosures in the financial statements. An audit also includes assessing the accounting principles used and significant estimates made by management, as well as evaluating the overall financial statement presentation. We believe that our audits provide a reasonable basis for our opinion.
In our opinion, the financial statements referred to above present fairly, in all material respects, the consolidated financial position of KBS Real Estate Investment Trust, Inc. at December 31, 2009 and 2008, and the consolidated results of its operations and its cash flows for each of the three years in the period ended December 31, 2009, in conformity with U.S. generally accepted accounting principles. Also, in our opinion, the financial statement schedules referred to above, when considered in relation to the basic financial statements taken as a whole, present fairly, in all material respects, the information set forth therein.
As discussed in Note 2 to the consolidated financial statements, on January 1, 2009 the Company adopted Financial Accounting Standards Statement No. 160, later codified in ASC 810-10, Noncontrolling Interests in Consolidated Financial Statements, an amendment of ARB 51. All years and periods presented have been reclassified to conform to the adopted accounting standards.
/s/ Ernst & Young LLP
Irvine, California
March 23, 2010
F-2
Table of Contents
KBS REAL ESTATE INVESTMENT TRUST, INC.
CONSOLIDATED BALANCE SHEETS
(in thousands, except share and per share amounts)
| December 31, | ||||||||
| 2009 | 2008 | |||||||
| Assets |
||||||||
| Real estate: |
||||||||
| Land |
$ | 277,020 | $ | 273,506 | ||||
| Buildings and improvements |
1,602,694 | 1,562,015 | ||||||
| Tenant origination and absorption costs |
125,210 | 172,055 | ||||||
| Total real estate, at cost |
2,004,924 | 2,007,576 | ||||||
| Less accumulated depreciation and amortization |
(176,321 | ) | (120,685 | ) | ||||
| Total real estate, net |
1,828,603 | 1,886,891 | ||||||
| Real estate loans receivable, net |
665,776 | 907,457 | ||||||
| Real estate securities |
12,948 | 13,420 | ||||||
| Total real estate and real estate-related investments, net |
2,507,327 | 2,807,768 | ||||||
| Cash and cash equivalents |
55,429 | 45,639 | ||||||
| Restricted cash |
6,484 | 5,471 | ||||||
| Rents and other receivables, net |
23,800 | 17,223 | ||||||
| Above-market leases, net |
13,086 | 19,491 | ||||||
| Deferred financing costs, prepaid expenses and other assets |
33,885 | 32,958 | ||||||
| Total assets |
$ | 2,640,011 | $ | 2,928,550 | ||||
| Liabilities and equity |
||||||||
| Notes payable |
$ | 1,217,446 | $ | 1,197,646 | ||||
| Repurchase agreements |
287,274 | 302,160 | ||||||
| Accounts payable and accrued liabilities |
24,704 | 24,731 | ||||||
| Due to affiliates |
6,481 | 4,444 | ||||||
| Distributions payable |
7,991 | 10,545 | ||||||
| Below-market leases, net |
26,705 | 43,573 | ||||||
| Other liabilities |
20,049 | 22,352 | ||||||
| Total liabilities |
1,590,650 | 1,605,451 | ||||||
| Commitments and contingencies (Note 15) |
||||||||
| Redeemable common stock |
56,741 | 55,907 | ||||||
| Equity |
||||||||
| KBS Real Estate Investment Trust, Inc. stockholders’ equity: |
||||||||
| Preferred stock, $.01 par value; 10,000,000 shares authorized, no shares issued and outstanding |
— | — | ||||||
| Common stock, $.01 par value; 1,000,000,000 shares authorized, 179,431,593 and 177,002,778 shares issued and outstanding as of December 31, 2009 and December 31, 2008, respectively |
1,794 | 1,770 | ||||||
| Additional paid-in capital |
1,548,512 | 1,528,718 | ||||||
| Cumulative distributions and net losses |
(545,805 | ) | (268,808 | ) | ||||
| Accumulated other comprehensive loss |
(16,668 | ) | (6,539 | ) | ||||
| Total KBS Real Estate Investment Trust, Inc. stockholders’ equity |
987,833 | 1,255,141 | ||||||
| Noncontrolling interest |
4,787 | 12,051 | ||||||
| Total equity |
992,620 | 1,267,192 | ||||||
| Total liabilities and equity |
$ | 2,640,011 | $ | 2,928,550 | ||||
See accompanying notes.
F-3
Table of Contents
KBS REAL ESTATE INVESTMENT TRUST, INC.
CONSOLIDATED STATEMENTS OF OPERATIONS
(in thousands, except share and per share amounts)
| Years Ended December 31, | ||||||||||||
| 2009 | 2008 | 2007 | ||||||||||
| Revenues: |
||||||||||||
| Rental income |
$ | 180,782 | $ | 159,587 | $ | 65,833 | ||||||
| Tenant reimbursements |
37,195 | 37,555 | 13,299 | |||||||||
| Interest income from real estate loans receivable |
56,161 | 73,933 | 14,374 | |||||||||
| Interest income from real estate securities |
3,507 | 4,623 | 1,046 | |||||||||
| Parking revenues and other operating income |
3,186 | 2,608 | 1,755 | |||||||||
| Total revenues |
280,831 | 278,306 | 96,307 | |||||||||
| Expenses: |
||||||||||||
| Operating, maintenance, and management |
47,962 | 37,658 | 13,725 | |||||||||
| Real estate taxes, property-related taxes, and insurance |
28,168 | 26,033 | 9,519 | |||||||||
| Asset management fees to affiliate |
22,108 | 17,508 | 5,095 | |||||||||
| General and administrative expenses |
8,044 | 5,568 | 4,126 | |||||||||
| Depreciation and amortization |
120,311 | 97,021 | 42,916 | |||||||||
| Interest expense |
60,931 | 68,303 | 33,368 | |||||||||
| Provision for loan losses |
178,813 | 104,000 | — | |||||||||
| Other-than-temporary impairments of real estate securities |
5,067 | 50,079 | — | |||||||||
| Total expenses |
471,404 | 406,170 | 108,749 | |||||||||
| Other income (expense) |
||||||||||||
| Income from unconsolidated joint venture |
4,038 | — | — | |||||||||
| Other interest income |
208 | 4,335 | 3,995 | |||||||||
| Loss on derivative instruments |
(8 | ) | (303 | ) | (1,524 | ) | ||||||
| Total other income |
4,238 | 4,032 | 2,471 | |||||||||
| Net loss |
(186,335 | ) | (123,832 | ) | (9,971 | ) | ||||||
| Net loss attributable to noncontrolling interest |
3,369 | 3,205 | 2,773 | |||||||||
| Net loss attributable to common stockholders |
$ | (182,966 | ) | $ | (120,627 | ) | $ | (7,198 | ) | |||
| Net loss per common share, basic and diluted |
$ | (1.03 | ) | $ | (0.81 | ) | $ | (0.15 | ) | |||
| Weighted-average number of common shares outstanding, basic and diluted |
177,959,297 | 148,539,558 | 46,973,602 | |||||||||
| Distributions declared per common share |
$ | 0.612 | $ | 0.702 | $ | 0.700 | ||||||
See accompanying notes.
F-4
Table of Contents
KBS REAL ESTATE INVESTMENT TRUST, INC.
CONSOLIDATED STATEMENTS OF EQUITY
(dollar amounts in thousands)
| Common Stock | Additional Paid-in |
Cumulative Distributions and |
Accumulated Other Comprehensive |
Total Stockholders’ |
Noncontrolling | Total | |||||||||||||||||||||||||
| Shares | Amounts | Capital | Net Income (Losses) | Income (Loss) | Equity | Interest | Equity | ||||||||||||||||||||||||
| Balance, December 31, 2006 |
11,309,222 | $ | 113 | $ | 97,400 | $ | (3,857 | ) | $ | — | $ | 93,656 | — | 93,656 | |||||||||||||||||
| Comprehensive loss: |
|||||||||||||||||||||||||||||||
| Net loss |
— | — | — | (7,198 | ) | — | (7,198 | ) | (2,773 | ) | (9,971 | ) | |||||||||||||||||||
| Unrealized loss on marketable real estate securities |
— | — | — | — | (2,085 | ) | (2,085 | ) | — | (2,085 | ) | ||||||||||||||||||||
| Total comprehensive loss |
(9,283 | ) | (2,773 | ) | (12,056 | ) | |||||||||||||||||||||||||
| Noncontrolling interest contribution |
— | — | — | — | — | — | 21,374 | 21,374 | |||||||||||||||||||||||
| Distributions to noncontrolling interest |
— | — | — | — | — | — | (371 | ) | (371 | ) | |||||||||||||||||||||
| Issuance of common stock |
74,838,013 | 748 | 743,884 | — | — | 744,632 | — | 744,632 | |||||||||||||||||||||||
| Redemptions of common stock |
(95,260 | ) | (1 | ) | (951 | ) | — | — | (952 | ) | — | (952 | ) | ||||||||||||||||||
| Additions to redeemable common stock |
— | — | (14,276 | ) | — | — | (14,276 | ) | — | (14,276 | ) | ||||||||||||||||||||
| Distributions declared |
— | — | — | (32,862 | ) | — | (32,862 | ) | — | (32,862 | ) | ||||||||||||||||||||
| Commissions on stock sales and related dealer manager fees |
— | — | (66,961 | ) | — | — | (66,961 | ) | — | (66,961 | ) | ||||||||||||||||||||
| Other offering costs |
— | — | (7,514 | ) | — | — | (7,514 | ) | — | (7,514 | ) | ||||||||||||||||||||
| Balance, December 31, 2007 |
86,051,975 | 860 | 751,582 | (43,917 | ) | (2,085 | ) | 706,440 | 18,230 | 724,670 | |||||||||||||||||||||
| Comprehensive loss: |
|||||||||||||||||||||||||||||||
| Net loss |
— | — | — | (120,627 | ) | — | (120,627 | ) | (3,205 | ) | (123,832 | ) | |||||||||||||||||||
| Reclassifications of unrealized losses on real estate securities to income |
— | — | — | — | 2,085 | 2,085 | — | 2,085 | |||||||||||||||||||||||
| Unrealized losses on derivative instruments |
— | — | — | — | (6,539 | ) | (6,539 | ) | (24 | ) | (6,563 | ) | |||||||||||||||||||
| Total comprehensive loss |
(125,081 | ) | (3,229 | ) | (128,310 | ) | |||||||||||||||||||||||||
| Noncontrolling interest contribution |
— | — | — | — | — | — | 80 | 80 | |||||||||||||||||||||||
| Distributions to noncontrolling interest |
— | — | — | — | — | — | (3,030 | ) | (3,030 | ) | |||||||||||||||||||||
| Issuance of common stock |
92,486,201 | 925 | 916,398 | — | — | 917,323 | — | 917,323 | |||||||||||||||||||||||
| Redemptions of common stock |
(1,535,398 | ) | (15 | ) | (14,413 | ) | — | — | (14,428 | ) | — | (14,428 | ) | ||||||||||||||||||
| Transfers to redeemable common stock |
— | — | (41,263 | ) | — | — | (41,263 | ) | — | (41,263 | ) | ||||||||||||||||||||
| Distributions declared |
— | — | — | (104,264 | ) | — | (104,264 | ) | — | (104,264 | ) | ||||||||||||||||||||
| Commissions on stock issuances and related dealer manager fees |
— | — | (79,079 | ) | — | — | (79,079 | ) | — | (79,079 | ) | ||||||||||||||||||||
| Other offering costs |
— | — | (4,507 | ) | — | — | (4,507 | ) | — | (4,507 | ) | ||||||||||||||||||||
| Balance, December 31, 2008 |
177,002,778 | 1,770 | 1,528,718 | (268,808 | ) | (6,539 | ) | 1,255,141 | 12,051 | 1,267,192 | |||||||||||||||||||||
| Comprehensive loss: |
|||||||||||||||||||||||||||||||
| Net loss |
— | — | — | (182,966 | ) | — | (182,966 | ) | (3,369 | ) | (186,335 | ) | |||||||||||||||||||
| Unrealized change in market value on real estate securities |
— | — | — | — | 4,973 | 4,973 | — | 4,973 | |||||||||||||||||||||||
| Unrealized losses on derivative instruments |
— | — | — | — | (322 | ) | (322 | ) | (38 | ) | (360 | ) | |||||||||||||||||||
| Total comprehensive loss |
(178,315 | ) | (3,407 | ) | (181,722 | ) | |||||||||||||||||||||||||
| Cumulative transition adjustment to real estate securities (see Note 6) |
— | — | — | 14,780 | (14,780 | ) | — | — | — | ||||||||||||||||||||||
| Noncontrolling interest contribution |
— | — | — | — | — | — | 427 | 427 | |||||||||||||||||||||||
| Distributions to noncontrolling interest |
— | — | — | — | — | — | (4,284 | ) | (4,284 | ) | |||||||||||||||||||||
| Issuance of common stock |
6,256,333 | 62 | 58,173 | — | — | 58,235 | — | 58,235 | |||||||||||||||||||||||
| Redemptions of common stock |
(3,827,518 | ) | (38 | ) | (35,898 | ) | — | — | (35,936 | ) | — | (35,936 | ) | ||||||||||||||||||
| Transfers to redeemable common stock |
— | — | (833 | ) | — | — | (833 | ) | — | (833 | ) | ||||||||||||||||||||
| Distributions declared |
— | — | — | (108,811 | ) | — | (108,811 | ) | — | (108,811 | ) | ||||||||||||||||||||
| Commissions on stock issuances |
— | — | (1,494 | ) | — | — | (1,494 | ) | — | (1,494 | ) | ||||||||||||||||||||
| Other offering costs |
— | — | (154 | ) | — | — | (154 | ) | — | (154 | ) | ||||||||||||||||||||
| Balance, December 31, 2009 |
179,431,593 | $ | 1,794 | $ | 1,548,512 | $ | (545,805 | ) | $ | (16,668 | ) | $ | 987,833 | $ | 4,787 | $ | 992,620 | ||||||||||||||
See accompanying notes.
F-5
Table of Contents
KBS REAL ESTATE INVESTMENT TRUST, INC.
CONSOLIDATED STATEMENTS OF CASH FLOWS
(in thousands)
| Years Ended December 31, | ||||||||||||
| 2009 | 2008 | 2007 | ||||||||||
| Cash Flows from Operating Activities: |
||||||||||||
| Net loss |
$ | (186,335 | ) | $ | (123,832 | ) | $ | (9,971 | ) | |||
| Adjustments to reconcile net loss to net cash provided by operating activities: |
||||||||||||
| Income from unconsolidated joint venture |
(4,038 | ) | — | — | ||||||||
| Distribution of earnings from unconsolidated joint venture |
3,552 | — | — | |||||||||
| Depreciation and amortization |
120,311 | 97,021 | 42,916 | |||||||||
| Amortization of investment in master lease |
858 | 858 | 321 | |||||||||
| Noncash interest income on real estate-related investments |
(2,938 | ) | (18,517 | ) | 167 | |||||||
| Provision for loan losses |
178,634 | 104,000 | — | |||||||||
| Other-than-temporary impairments of real estate securities |
5,067 | 50,079 | — | |||||||||
| Deferred rent |
(4,024 | ) | (5,191 | ) | (2,336 | ) | ||||||
| Bad debt expense |
2,430 | 531 | 220 | |||||||||
| Amortization of deferred financing costs |
4,857 | 7,863 | 2,934 | |||||||||
| Amortization of above- and below-market leases, net |
(6,018 | ) | (6,704 | ) | (3,998 | ) | ||||||
| Amortization of cost of derivative instruments |
1,773 | 2,919 | — | |||||||||
| Unrealized loss on derivative instruments |
8 | 303 | 1,524 | |||||||||
| Changes in operating assets and liabilities: |
||||||||||||
| Restricted cash for operational expenditures |
(549 | ) | 753 | (5,591 | ) | |||||||
| Rents and other receivables |
(1,069 | ) | (4,608 | ) | (4,059 | ) | ||||||
| Prepaid expenses and other assets |
(5,549 | ) | (5,129 | ) | (2,283 | ) | ||||||
| Accounts payable and accrued liabilities |
(5,225 | ) | 7,134 | 14,730 | ||||||||
| Due to affiliates |
2,037 | 629 | 1,846 | |||||||||
| Other liabilities |
(4,044 | ) | 7,069 | 7,562 | ||||||||
| Net cash provided by operating activities |
99,738 | 115,178 | 43,982 | |||||||||
| Cash Flows from Investing Activities: |
||||||||||||
| Acquisitions of real estate |
— | (504,100 | ) | (1,259,088 | ) | |||||||
| Additions to real estate |
(23,794 | ) | (13,410 | ) | (3,593 | ) | ||||||
| Investments in master lease |
— | — | (13,196 | ) | ||||||||
| Investments in real estate loans receivable |
— | (794,815 | ) | (218,020 | ) | |||||||
| Advances on real estate loans receivable |
(5,859 | ) | (9,835 | ) | (6,434 | ) | ||||||
| Principal repayments on real estate loans receivable |
27,483 | 24,190 | 21,000 | |||||||||
| Cash collateral received on impaired real estate loans receivable |
3,992 | — | — | |||||||||
| Purchase of real estate securities |
— | (44,228 | ) | (17,685 | ) | |||||||
| (Decrease) increase in restricted cash for capital expenditures |
(464 | ) | 1,350 | (1,983 | ) | |||||||
| Net cash provided by (used in) investing activities |
1,358 | (1,340,848 | ) | (1,498,999 | ) | |||||||
| Cash Flows from Financing Activities: |
||||||||||||
| Proceeds from notes payable |
48,028 | 523,762 | 942,153 | |||||||||
| Principal payments on notes payable |
(28,228 | ) | (321,420 | ) | (126,600 | ) | ||||||
| Proceeds from repurchase agreements |
— | 406,287 | 13,261 | |||||||||
| Principal payments on repurchase agreements |
(14,886 | ) | (117,387 | ) | — | |||||||
| Purchase of derivative instruments |
(420 | ) | (2,889 | ) | (1,834 | ) | ||||||
| Advances from affiliates |
— | — | 700 | |||||||||
| Payments of deferred financing costs |
(1,229 | ) | (5,047 | ) | (12,683 | ) | ||||||
| Proceeds from issuance of common stock |
— | 865,336 | 740,928 | |||||||||
| Payments to redeem common stock |
(35,936 | ) | (14,428 | ) | (952 | ) | ||||||
| Payments of commissions on stock issuances and related dealer manager fees |
(1,494 | ) | (79,648 | ) | (66,392 | ) | ||||||
| Payments of other offering costs |
(154 | ) | (4,663 | ) | (7,493 | ) | ||||||
| Distributions paid to common stockholders |
(53,130 | ) | (42,981 | ) | (28,491 | ) | ||||||
| Noncontrolling interest contributions |
427 | 80 | 21,374 | |||||||||
| Distributions paid to noncontrolling interest |
(4,284 | ) | (3,030 | ) | (371 | ) | ||||||
| Net cash (used in) provided by financing activities |
(91,306 | ) | 1,203,972 | 1,473,600 | ||||||||
| Net increase (decrease) in cash and cash equivalents |
9,790 | (21,698 | ) | 18,583 | ||||||||
| Cash and cash equivalents, beginning of period |
45,639 | 67,337 | 48,754 | |||||||||
| Cash and cash equivalents, end of period |
$ | 55,429 | $ | 45,639 | $ | 67,337 | ||||||
See accompanying notes.
F-6
Table of Contents
KBS REAL ESTATE INVESTMENT TRUST, INC.
NOTES TO CONSOLIDATED FINANCIAL STATEMENTS
December 31, 2009
| 1. | ORGANIZATION |
KBS Real Estate Investment Trust, Inc. (the “Company”) was formed on June 13, 2005 as a Maryland corporation that has elected to be taxed as a real estate investment trust (“REIT”) beginning with the taxable year that ended December 31, 2006. Substantially all of the Company’s assets are held by, and the Company conducts substantially all of its operations through, KBS Limited Partnership, a Delaware limited partnership (the “Operating Partnership”), and its subsidiaries. The Company is the sole general partner of and directly owns a 99% partnership interest in the Operating Partnership. The Company’s wholly owned subsidiary, KBS REIT Holdings LLC, a Delaware limited liability company (“KBS REIT Holdings”), owns the remaining 1% partnership interest in the Operating Partnership and is its sole limited partner.
The Company owns a diverse portfolio of real estate and real estate-related investments. As of December 31, 2009, the Company owned 65 real estate properties, one master lease, 17 real estate loans receivable, two investments in securities directly or indirectly backed by commercial mortgage loans, and a preferred membership interest in a real estate joint venture.
Subject to certain restrictions and limitations, the business of the Company is managed by KBS Capital Advisors LLC (the “Advisor”), an affiliate of the Company, pursuant to an advisory agreement with the Company (as amended, the “Advisory Agreement”) in effect through November 8, 2010. The Advisory Agreement may be renewed for an unlimited number of one-year periods upon the mutual consent of the Advisor and the Company. Either party may terminate the Advisory Agreement upon 60 days written notice. The Advisor owns 20,000 shares of the Company’s common stock.
Upon commencing its initial public offering (the “Offering”), the Company retained KBS Capital Markets Group LLC (the “Dealer Manager”), an affiliate of the Advisor, to serve as the dealer manager of the Offering pursuant to a dealer manager agreement dated January 27, 2006 (the “Dealer Manager Agreement”). The Company ceased offering shares of common stock in its primary offering on May 30, 2008 and continues to issue shares of common stock under its dividend reinvestment plan.
The Company sold 171,109,494 shares of common stock in its primary offering for gross offering proceeds of $1.7 billion. As of December 31, 2009, the Company had sold 13,760,275 shares of common stock under the dividend reinvestment plan for gross offering proceeds of $129.5 million. Also as of December 31, 2009, the Company had redeemed 5,458,176 of the shares sold in the Offering for $51.3 million.
| 2. | SUMMARY OF SIGNIFICANT ACCOUNTING POLICIES |
Principles of Consolidation and Basis of Presentation
The consolidated financial statements include the accounts of the Company, KBS REIT Holdings, the Operating Partnership, their direct and indirect wholly owned subsidiaries, and joint ventures the Company controls or for which it is the primary beneficiary, as well as the related amounts of noncontrolling interests.
Effective January 1, 2009, the Company adopted new accounting provisions with respect to noncontrolling interests. The Company identifies its noncontrolling interests as a separate component of equity in the Company’s consolidated balance sheets. Net income (loss) attributable to noncontrolling interests are allocated based on their relative ownership percentage and are excluded from net income (loss) attributable to common stockholders. All significant intercompany balances and transactions are eliminated in consolidation. The Company evaluates the need to consolidate joint ventures and consolidates joint ventures that it determines to be variable interest entities for which it is the primary beneficiary. The Company also consolidates joint ventures that are not determined to be variable interest entities, but for which it exercises control over major operating decisions through substantive participation rights, such as approval of budgets, selection of property managers, asset management, investment activity and changes in financing.
The consolidated financial statements are prepared in accordance with U.S. generally accepted accounting principles (“GAAP”).
F-7
Table of Contents
KBS REAL ESTATE INVESTMENT TRUST, INC.
NOTES TO CONSOLIDATED FINANCIAL STATEMENTS (CONTINUED)
December 31, 2009
Effective September 15, 2009, the Accounting Standards Codification (“ASC”) was established as the single source of authoritative nongovernmental GAAP. Prior to the issuance of the ASC, all GAAP pronouncements were issued in separate topical pronouncements in the form of statements, staff positions or Emerging Issues Task Force Abstracts, and were referred to as such. While the ASC does not change GAAP, it introduces a new structure and supersedes all previously issued non-SEC accounting and reporting standards. In addition to the ASC, the Company is still required to follow SEC rules and regulations relating to the preparation of financial statements. The Company’s accounting policies are consistent with the guidance set forth in the ASC.
Use of Estimates
The preparation of the consolidated financial statements in conformity with GAAP requires management to make estimates and assumptions that affect the amounts reported in the consolidated financial statements and accompanying notes. Actual results could materially differ from those estimates.
Reclassifications
Certain amounts in the Company’s prior period consolidated financial statements have been reclassified to conform to the current period presentation and as a result of the adoption of the authoritative accounting guidance related to noncontrolling interests. These reclassifications have not changed the results of operations of prior periods.
Revenue Recognition
The Company recognizes minimum rent, including rental abatements, lease incentives and contractual fixed increases attributable to operating leases, on a straight-line basis over the term of the related leases when collectibility is reasonably assured and records amounts expected to be received in later years as deferred rent. If the lease provides for tenant improvements, the Company determines whether the tenant improvements, for accounting purposes, are owned by the tenant or the Company. When the Company is the owner of the tenant improvements, the tenant is not considered to have taken physical possession or have control of the physical use of the leased asset until the tenant improvements are substantially completed. When the tenant is the owner of the tenant improvements, any tenant improvement allowance that is funded is treated as a lease incentive and amortized as a reduction of revenue over the lease term. Tenant improvement ownership is determined based on various factors including, but not limited to:
| • | whether the lease stipulates how a tenant improvement allowance may be spent; |
| • | whether the amount of a tenant improvement allowance is in excess of market rates; |
| • | whether the tenant or landlord retains legal title to the improvements at the end of the lease term; |
| • | whether the tenant improvements are unique to the tenant or general-purpose in nature; and |
| • | whether the tenant improvements are expected to have any residual value at the end of the lease. |
During the years ended December 31, 2009, 2008 and 2007, the Company recognized deferred rent from tenants of $4.0 million, $5.2 million and $2.3 million, respectively. These excess amounts for the years ended December 31, 2009 and 2008 are net of $0.6 million and $0.1 million, respectively, of lease incentive amortization; there was no amortization of lease incentives for the year ended December 31, 2007. As of December 31, 2009 and 2008, the cumulative deferred rent balance was $18.8 million and $9.4 million, respectively, and is included in rents and other receivables on the accompanying balance sheets. The cumulative deferred rent balance included $6.5 million and $1.7 million of unamortized lease incentives as of December 31, 2009 and 2008, respectively. The Company records property operating expense reimbursements due from tenants for common area maintenance, real estate taxes, and other recoverable costs in the period the related expenses are incurred.
F-8
Table of Contents
KBS REAL ESTATE INVESTMENT TRUST, INC.
NOTES TO CONSOLIDATED FINANCIAL STATEMENTS (CONTINUED)
December 31, 2009
The Company makes estimates of the collectibility of its tenant receivables related to base rents, including straight-line rent, expense reimbursements and other revenue or income. Management specifically analyzes accounts receivable and historical bad debts, customer creditworthiness, current economic trends and changes in customer payment terms when evaluating the adequacy of the allowance for doubtful accounts. In addition, with respect to tenants in bankruptcy, management makes estimates of the expected recovery of pre-petition and post-petition claims in assessing the estimated collectibility of the related receivable. In some cases, the ultimate resolution of these claims can exceed one year. When a tenant is in bankruptcy, the Company will record a bad debt reserve for the tenant’s receivable balance and generally will not recognize subsequent rental revenue until cash is received or until the tenant is no longer in bankruptcy and has the ability to make rental payments. During the years ended December 31, 2009, 2008 and 2007, the Company recorded bad debt expense related to its tenant receivables of $2.2 million, $0.5 million and $0.2 million, respectively. During the year ended December 31, 2009, the Company wrote off, as a reduction to rental revenue, $1.3 million related to deferred rent receivables, primarily related to tenants in bankruptcy. The Company did not record a provision for bad debt expense related to its deferred rent receivables at December 31, 2009, 2008 and 2007, respectively.
Interest income on the Company’s real estate loans receivable is recognized on an accrual basis over the life of the investment using the interest method. Direct loan origination fees and origination or acquisition costs, as well as acquisition premiums or discounts, are amortized over the term of the loan as an adjustment to interest income. The Company places loans on nonaccrual status when any portion of principal or interest is 90 days past due, or earlier when concern exists as to the ultimate collection of principal or interest. When a loan is placed on nonaccrual status, the Company reverses the accrual for unpaid interest and generally does not recognize subsequent interest income until cash is received, or the loan returns to accrual status.
The Company recognizes interest income on real estate securities that are beneficial interests in securitized financial assets and are rated “AA” and above on an accrual basis according to the contractual terms of the securities. Discounts or premiums are amortized to interest income over the life of the investment using the interest method.
The Company recognizes interest income on real estate securities that are beneficial interests in securitized financial assets that are rated below “AA” using the effective yield method, which requires the Company to periodically project estimated cash flows related to these securities and recognize interest income at an interest rate equivalent to the estimated yield on the security, as calculated using the security’s estimated cash flows and amortized cost basis, or reference amount. Changes in the estimated cash flows are recognized through an adjustment to the yield on the security on a prospective basis. Projecting cash flows for these types of securities requires significant judgment, which may have a significant impact on the timing of revenue recognized on these investments.
The Company recognizes interest income on its cash and cash equivalents as it is earned and classifies such amounts as other interest income.
Real Estate
Depreciation and Amortization
Real estate costs related to the acquisition and improvement of properties are capitalized and amortized over the expected useful life of the asset on a straight-line basis. Repair and maintenance costs are charged to expense as incurred and significant replacements and betterments are capitalized. Repair and maintenance costs include all costs that do not extend the useful life of the real estate asset. The Company considers the period of future benefit of an asset to determine its appropriate useful life. Expenditures for tenant improvements are capitalized and amortized over the shorter of the tenant’s lease term or expected useful life. The Company anticipates the estimated useful lives of its assets by class to be generally as follows:
| Buildings | 25-40 years | |
| Building improvements | 10-25 years | |
| Tenant improvements | Shorter of lease term or expected useful life | |
| Tenant origination and absorption costs | Remaining term of related lease |
F-9
Table of Contents
KBS REAL ESTATE INVESTMENT TRUST, INC.
NOTES TO CONSOLIDATED FINANCIAL STATEMENTS (CONTINUED)
December 31, 2009
Real Estate Acquisition Valuation
The Company records the acquisition of income-producing real estate or real estate that will be used for the production of income as a business combination. Prior to January 1, 2009, real estate acquired in a business combination, consisting of land, buildings and improvements, was recorded at cost. The Company allocated the cost of tangible assets, identifiable intangibles and assumed liabilities (consisting of above and below-market leases and tenant origination and absorption costs) acquired in a business combination based on their estimated fair values. Beginning January 1, 2009, all assets acquired and liabilities assumed in a business combination are measured at their acquisition-date fair values, acquisition costs are expensed as incurred and restructuring costs that do not meet the definition of a liability at the acquisition date are expensed in periods subsequent to the acquisition date. In addition, changes in accounting for deferred tax asset valuation allowances and acquired income tax uncertainties after the measurement period are recorded to income tax expense. During the year ended December 31, 2009, the Company received a deed-in-lieu of foreclosure in satisfaction of the amounts due under its investment in the 18301 Von Karman Loans. The Company gained control of the collateral securing these loans, an office building located at 18301 Von Karman Avenue, Irvine, California, on October 6, 2009 and recorded the transaction as a business combination.
Estimates of the fair values of the tangible assets, identifiable intangibles and assumed liabilities require the Company to make significant assumptions to estimate market lease rates, property-operating expenses, carrying costs during lease-up periods, discount rates, market absorption periods, and the number of years the property will be held for investment. The use of inappropriate assumptions would result in an incorrect valuation of the Company’s acquired tangible assets, identifiable intangibles and assumed liabilities, which would impact the amount of the Company’s net income.
Impairment of Real Estate and Related Intangible Assets and Liabilities
The Company continually monitors events and changes in circumstances that could indicate that the carrying amounts of its real estate and related intangible assets and liabilities may not be recoverable or realized. When indicators of potential impairment suggest that the carrying value of real estate and related intangible assets and liabilities may not be recoverable, the Company assesses the recoverability by estimating whether the Company will recover the carrying value of the real estate and related intangible assets and liabilities through its undiscounted future cash flows and its eventual disposition. If, based on this analysis, the Company does not believe that it will be able to recover the carrying value of the real estate and related intangible assets and liabilities, the Company would record an impairment loss to the extent that the carrying value exceeds the estimated fair value of the real estate and related intangible assets and liabilities. The Company did not record any impairment loss on its real estate and related intangible assets and liabilities during the years ended December 31, 2009, 2008 and 2007.
Real Estate Loans Receivable
The Company’s real estate loans receivable are recorded at amortized cost, net of loan loss reserves, and evaluated for impairment at each balance sheet date. The amortized cost of a real estate loan receivable is the outstanding unpaid principal balance, net of unamortized acquisition premiums or discounts and unamortized costs and fees directly associated with the origination or acquisition of the loan.
The reserve for loan losses is a valuation allowance that reflects management’s estimate of loan losses inherent in the loan portfolio as of the balance sheet date. The reserve is adjusted through “Provision for loan losses” on the Company’s consolidated statements of operations and is decreased by charge-offs to specific loans when losses are confirmed. The reserve for loan losses includes a portfolio-based component and an asset-specific component.
The asset-specific reserve component relates to reserves for losses on loans considered impaired. The Company considers a loan to be impaired when, based upon current information and events, it believes that it is probable that the Company will be unable to collect all amounts due under the contractual terms of the loan agreement. The Company also considers a loan to be impaired if it grants the borrower a concession through a modification of the loan terms or if it expects to receive assets (including equity interests in the borrower) with fair values that are less than the carrying value of the loan in satisfaction of the loan. A reserve is established when the present value of payments expected to be received, observable market prices, the estimated fair value of the collateral (for loans that are dependent on the collateral for repayment) or amounts expected to be received in satisfaction of an impaired loan are lower than the carrying value of that loan.
F-10
Table of Contents
KBS REAL ESTATE INVESTMENT TRUST, INC.
NOTES TO CONSOLIDATED FINANCIAL STATEMENTS (CONTINUED)
December 31, 2009
The portfolio-based reserve component covers the pool of loans that do not have asset-specific reserves. A provision for loan losses is recorded when available information as of each balance sheet date indicates that it is probable that the pool of loans will incur a loss and the amount of the loss can be reasonably estimated. Required reserve balances for this pool of loans are derived from estimated probabilities of default and estimated loss severities assuming a default occurs. On a quarterly basis, the Company’s management assigns estimated probabilities of default and loss severities to each loan in the portfolio based on factors such as the debt service coverage of the underlying collateral, the estimated fair value of the collateral, the significance of the borrower’s investment in the collateral, the financial condition of the borrower and/or its sponsors, the likelihood that the borrower and/or its sponsors would allow the loan to default, the Company’s willingness and ability to step in as owner in the event of default, and other pertinent factors.
During the years ended December 31, 2009 and 2008, the Company recorded a loan loss reserve of $178.8 million and $104.0 million, respectively. For the year ended December 31, 2009, the change in loan loss reserve was comprised of $208.8 million calculated on an asset-specific basis, partially offset by a reduction of $30.0 million to the portfolio-based reserve. For the year ended December 31, 2008, the loan loss reserve was comprised of $50.0 million calculated on an asset-specific basis and $54.0 million from the portfolio-based reserve. The Company did not recognize any asset-specific or portfolio-based loan losses during the year ended December 31, 2007.
Failure to recognize impairments would result in the overstatement of earnings and the carrying value of the Company’s real estate loans held for investment. Actual losses, if any, could differ significantly from estimated amounts.
Investment in Unconsolidated Joint Venture
On July 8, 2009, the Company released the borrowers under two investments in mezzanine loans from liability and received preferred membership interests in a joint venture that indirectly owns the properties that had served as collateral for the loans. The interests were initially recorded by the Company at a fair value of $0 based on the estimated fair value of the collateral at the time of receipt of the preferred membership interests. The Company accounts for its preferred membership interests in the real estate joint venture under the equity method of accounting since the Company is not the primary beneficiary of the joint venture, but does have more than a minor interest. Since the Company will most likely only receive preferred distributions equivalent to the interest income it would have earned on its mezzanine loan investments, the Company’s application of the equity method of accounting to these preferred interests results in the Company recording all distributions received as income. The Company does not record its share of the changes in the book value of the joint venture as it is not required to absorb losses and does not expect increases in the book value of the joint venture to have any material impact on the cash flows it will receive over the course of the investment. During the year ended December 31, 2009, the Company recognized $4.0 million of preferred distributions as income from unconsolidated joint venture.
Real Estate Securities
The Company classifies its investments in real estate securities as available-for-sale, since the Company may sell them prior to their maturity but does not hold them principally for the purpose of making frequent investments and sales with the objective of generating profits on short-term differences in price. These investments are carried at estimated fair value, with unrealized gains and losses reported in accumulated other comprehensive income (loss). Estimated fair values are generally based on quoted market prices, when available, or on estimates provided by independent pricing sources or dealers who make markets in such securities. In certain circumstances, such as when the market for the securities becomes inactive, the Company may determine it is appropriate to perform an internal valuation of the securities. Upon the sale of a security, the previously recognized unrealized gain (loss) would be reversed and the actual realized gain (loss) recognized.
On a quarterly basis, the Company evaluates its real estate securities for impairment. The Company reviews the projected future cash flows from these securities for changes in assumptions due to prepayments, credit loss experience and other factors. If, based on the Company’s quarterly estimate of cash flows, there has been an adverse change in the estimated cash flows from the cash flows previously estimated, the present value of the revised cash flows is less than the present value previously estimated, and the fair value of the securities is less than its amortized cost basis, an other-than-temporary impairment is deemed to have occurred.
F-11
Table of Contents
KBS REAL ESTATE INVESTMENT TRUST, INC.
NOTES TO CONSOLIDATED FINANCIAL STATEMENTS (CONTINUED)
December 31, 2009
Prior to April 1, 2009, when a security was deemed to be other-than-temporarily impaired, the security was written down to its fair value (with the reduction in fair value recorded as a charge to earnings) and a new cost basis was established. The Company would calculate a revised yield based on the new cost basis of the investment (including any other-than-temporary impairments recognized to date) and estimate future cash flows expected to be realized, which was applied prospectively to recognize interest income.
Beginning April 1, 2009, as a result of adopting a new accounting principle, the Company is required to distinguish between other-than-temporary impairments related to credit and other-than-temporary impairments related to other factors (e.g., market fluctuations) on its real estate securities that it does not intend to sell and where it is not likely that the Company will be required to sell the security prior to the anticipated recovery of its amortized cost basis. The Company calculates the credit component of the other-than-temporary impairment as the difference between the amortized cost basis of the security and the present value of its estimated cash flows discounted at the yield used to recognize interest income. The credit component will be charged to earnings and the component related to other factors will be recorded to other comprehensive income (loss).
On April 1, 2009, the Company recognized a cumulative transition adjustment of $14.8 million as an adjustment to the opening balance of retained earnings with a corresponding adjustment to accumulated other comprehensive income (loss) and to the amortized cost basis of its real estate securities. The transition adjustment was calculated as the difference between the present value of the Company’s estimated cash flows for its real estate securities as of April 1, 2009 discounted at the yield used to recognize income prior to the recognition of any other-than-temporary impairments and the April 1, 2009 amortized cost basis of the securities, which reflects the cumulative other-than-temporary impairment losses that have been recorded on the Company’s real estate securities that are not related to credit. Although the Company increased its amortized cost basis in the securities as a result of this transition adjustment, the securities are ultimately presented at fair value in the accompanying consolidated balance sheets with differences between fair value and amortized cost basis presented as unrealized gains or losses in accumulated other comprehensive income (loss) within the equity section of the accompanying consolidated balance sheets.
During the year ended December 31, 2009, the Company recognized other-than-temporary impairments on its real estate securities of $5.1 million, all of which were recognized prior to April 1, 2009. On April 1, 2009, through its cumulative transition adjustment, the Company effectively reversed $14.8 million of cumulative non-credit related other-than-temporary impairment charges from retained earnings and recorded the amounts as unrealized losses within accumulated other comprehensive loss in the consolidated balance sheets. During the year ended December 31, 2008, the Company recognized other-than-temporary impairments on its real estate securities of $50.1 million. It is difficult to predict the timing or magnitude of these other-than-temporary impairments and significant judgments are required in determining impairments, including, but not limited to, assumptions regarding estimated prepayments, loss assumptions, and assumptions with respect to changes in interest rates. As a result, actual realized losses could materially differ from these estimates.
Cash and Cash Equivalents
The Company considers all short-term (with an original maturity of three months or less), highly-liquid investments utilized as part of the Company’s cash-management activities to be cash equivalents. Cash equivalents may include cash and short-term investments. Short-term investments are stated at cost, which approximates fair value.
The Company’s cash and cash equivalents balance exceeds federally insurable limits as of December 31, 2009. The Company monitors the cash balances in its operating accounts and adjusts the cash balances as appropriate; however, these cash balances could be impacted if the underlying financial institutions fail or are subject to other adverse conditions in the financial markets. To date, the Company has experienced no loss or lack of access to cash in its operating accounts. The Company has a corporate banking relationship with Wells Fargo Bank, N.A. in which it deposits the majority of its funds.
Restricted Cash
Restricted cash is comprised of lender impound reserve accounts on the Company’s borrowings for security deposits, property taxes, insurance, rent from master lease, and capital improvements and replacements.
F-12
Table of Contents
KBS REAL ESTATE INVESTMENT TRUST, INC.
NOTES TO CONSOLIDATED FINANCIAL STATEMENTS (CONTINUED)
December 31, 2009
Derivative Instruments
The Company enters into derivative instruments for risk management purposes to hedge its exposure to cash flow variability caused by changing interest rates on its variable rate real estate loans receivable and notes payable. The Company records these derivative instruments at fair value on the accompanying consolidated balance sheets. Derivative instruments designated and qualifying as a hedge of the exposure to variability in expected future cash flows or other types of forecasted transactions are considered cash flow hedges. The change in fair value of the effective portion of a derivative instrument that is designated as a cash flow hedge is recorded as other comprehensive income (loss) in the accompanying consolidated statements of equity. The changes in fair value for derivative instruments that are not designated as a hedge or that do not meet the hedge accounting criteria are recorded as gain or loss on derivative instruments in the accompanying consolidated statements of operations.
In addition to recording any changes in fair value for interest rate caps and floors, the purchase price of an interest rate cap or floor is amortized over the contractual life of the instrument. Interest rate caps (floors) are viewed as a series of call (put) options or caplets (floorlets) and as the caplets (floorlets) expire, the related cost of the expiring caplet (floorlet) is amortized to interest expense (income) and the remaining caplets and floorlets are carried at fair value.
The Company formally documents all relationships between hedging instruments and hedged items, as well as its risk-management objectives and strategy for undertaking various hedge transactions. This process includes designating all derivative instruments that are part of a hedging relationship to specific forecasted transactions or recognized obligations on the consolidated balance sheets. The Company also assesses and documents, both at the hedging instrument’s inception and on a quarterly basis thereafter, whether the derivative instruments that are used in hedging transactions are highly effective in offsetting changes in cash flows associated with the respective hedged items. When it is determined that a derivative instrument ceases to be highly effective as a hedge, or that it is probable the underlying forecasted transaction will not occur, the Company discontinues hedge accounting prospectively and reclassifies amounts recorded to accumulated other comprehensive income (loss) to earnings.
For further information regarding the Company’s derivative instruments, see Note 8, “Derivative Instruments.”
Deferred Financing Costs
Deferred financing costs represent commitment fees, loan fees, legal fees and other third-party costs associated with obtaining financing. These costs are amortized over the terms of the respective financing agreements using the interest method. Unamortized deferred financing costs are expensed when the associated debt is refinanced or repaid before maturity. Costs incurred in seeking financings that do not close are expensed in the period in which it is determined that the financing will not close. As of December 31, 2009 and 2008, the Company’s deferred financing costs were $4.3 million and $7.9 million, respectively, net of amortization.
Fair Value Measurements
Under GAAP, the Company is required to measure certain financial instruments at fair value on a recurring basis. In addition, the Company is required to measure other financial instruments and balances at fair value on a non-recurring basis (e.g., carrying value of impaired real estate loans receivable and long-lived assets). Fair value is defined as the price that would be received upon the sale of an asset or paid to transfer a liability in an orderly transaction between market participants at the measurement date. The GAAP fair value framework uses a three-tiered approach. Fair value measurements are classified and disclosed in one of the following three categories:
| • | Level 1: unadjusted quoted prices in active markets that are accessible at the measurement date for identical assets or liabilities; |
| • | Level 2: quoted prices for similar instruments in active markets, quoted prices for identical or similar instruments in markets that are not active, and model-derived valuations in which significant inputs and significant value drivers are observable in active markets; and |
| • | Level 3: prices or valuation techniques where little or no market data is available that requires inputs that are both significant to the fair value measurement and unobservable. |
F-13
Table of Contents
KBS REAL ESTATE INVESTMENT TRUST, INC.
NOTES TO CONSOLIDATED FINANCIAL STATEMENTS (CONTINUED)
December 31, 2009
When available, the Company utilizes quoted market prices from independent third-party sources to determine fair value and classifies such items in Level 1 or Level 2. In instances where the market for a financial instrument is not active, regardless of the availability of a nonbinding quoted market price, observable inputs might not be relevant and could require the Company to make a significant adjustment to derive a fair value measurement. Additionally, in an inactive market, a market price quoted from an independent third party may rely more on models with inputs based on information available only to that independent third party. When the Company determines the market for a financial instrument owned by the Company to be illiquid or when market transactions for similar instruments do not appear orderly, the Company uses several valuation sources (including internal valuations, discounted cash flow analysis and quoted market prices) and establishes a fair value by assigning weights to the various valuation sources. Additionally, when determining the fair value of liabilities in circumstances in which a quoted price in an active market for an identical liability is not available, the Company measures fair value using (i) a valuation technique that uses the quoted price of the identical liability when traded as an asset or quoted prices for similar liabilities or similar liabilities when traded as assets or (ii) another valuation technique that is consistent with the principles of fair value measurement, such as the income approach or the market approach.
Changes in assumptions or estimation methodologies can have a material effect on these estimated fair values. In this regard, the derived fair value estimates cannot be substantiated by comparison to independent markets and, in many cases, may not be realized in an immediate settlement of the instrument.
The Company considers the following factors to be indicators of an inactive market: (i) there are few recent transactions, (ii) price quotations are not based on current information, (iii) price quotations vary substantially either over time or among market makers (for example, some brokered markets), (iv) indexes that previously were highly correlated with the fair values of the asset or liability are demonstrably uncorrelated with recent indications of fair value for that asset or liability, (v) there is a significant increase in implied liquidity risk premiums, yields, or performance indicators (such as delinquency rates or loss severities) for observed transactions or quoted prices when compared with the Company’s estimate of expected cash flows, considering all available market data about credit and other nonperformance risk for the asset or liability, (vi) there is a wide bid-ask spread or significant increase in the bid-ask spread, (vii) there is a significant decline or absence of a market for new issuances (that is, a primary market) for the asset or liability or similar assets or liabilities, and (viii) little information is released publicly (for example, a principal-to-principal market).
The Company considers the following factors to be indicators of non-orderly transactions: (i) there was not adequate exposure to the market for a period before the measurement date to allow for marketing activities that are usual and customary for transactions involving such assets or liabilities under current market conditions, (ii) there was a usual and customary marketing period, but the seller marketed the asset or liability to a single market participant, (iii) the seller is in or near bankruptcy or receivership (that is, distressed), or the seller was required to sell to meet regulatory or legal requirements (that is, forced), and (iv) the transaction price is an outlier when compared with other recent transactions for the same or similar assets or liabilities.
F-14
Table of Contents
KBS REAL ESTATE INVESTMENT TRUST, INC.
NOTES TO CONSOLIDATED FINANCIAL STATEMENTS (CONTINUED)
December 31, 2009
Redeemable Common Stock
The Company has adopted a share redemption program that may enable stockholders to sell their shares to the Company in limited circumstances.
There are several limitations on the Company’s ability to redeem shares under the share redemption program:
| • | Unless the shares are being redeemed in connection with a stockholder’s death, “qualifying disability” (as defined under the share redemption program) or “determination of incompetence” (as defined under the share redemption program), the Company may not redeem shares until the stockholder has held his or her shares for one year. |
| • | During each calendar year, redemptions are limited to the amount of net proceeds from the sale of shares under the dividend reinvestment plan during the prior calendar year less amounts the Company deems necessary from such proceeds to fund current and future: capital expenditures, tenant improvement costs and leasing costs related to the Company’s investments in real estate properties; reserves required by financings of the Company’s investments in real estate properties; and funding obligations under the Company’s real estate loans receivable, as each may be adjusted from time to time by management, provided that if the shares are submitted for redemption in connection with the stockholder’s death, “qualifying disability” or “determination of incompetence”, the Company will honor such redemptions to the extent that all redemptions for the calendar year are less than the amount of the net proceeds from the sale of shares under the dividend reinvestment plan during the prior calendar year. |
| • | During any calendar year, the Company may redeem no more than 5% of the weighted-average number of shares outstanding during the prior calendar year. |
| • | The Company has no obligation to redeem shares if the redemption would violate the restrictions on distributions under Maryland law, which prohibits distributions that would cause a corporation to fail to meet statutory tests of solvency. |
Pursuant to the program, as amended, and to the extent shares were eligible for redemption, until the Company established an estimated value per share, the Company redeemed shares as follows:
| • | The lower of $9.25 or 92.5% of the price paid to acquire the shares from the Company for stockholders who had held their shares for at least one year; |
| • | The lower of $9.50 or 95.0% of the price paid to acquire the shares from the Company for stockholders who had held their shares for at least two years; |
| • | The lower of $9.75 or 97.5% of the price paid to acquire the shares from the Company for stockholders who had held their shares for at least three years; |
| • | The lower of $10.00 or 100% of the price paid to acquire the shares from the Company for stockholders who had held their shares for at least four years; and |
| • | Notwithstanding the above, until the Company established an estimated value per share, the redemption price for shares being redeemed upon a stockholder’s death, “qualifying disability” or “determination of incompetence” was the amount paid to acquire the shares from the Company. |
On November 20, 2009, the Company’s board of directors approved an estimated value per share of the Company’s common stock of $7.17 based on the estimated value of the Company’s assets less the estimated value of the Company’s liabilities divided by the number of shares outstanding, all as of September 30, 2009. Effective for the November 30, 2009 redemption date and until the estimated value per share is updated, the redemption price for all stockholders whose shares are eligible for redemption is $7.17 per share. In addition, shares issued under the dividend reinvestment plan subsequent to November 20, 2009, were issued at a value of $7.17 per share.
F-15
Table of Contents
KBS REAL ESTATE INVESTMENT TRUST, INC.
NOTES TO CONSOLIDATED FINANCIAL STATEMENTS (CONTINUED)
December 31, 2009
The estimated value per share was based upon the recommendation and valuation of the Advisor. The Financial Industry Regulatory Authority rules, which prompted the valuation, provide no guidance on the methodology an issuer must use to determine its estimated value per share. As with any valuation methodology, the Advisor’s methodology is based upon a number of estimates and assumptions that may not be accurate or complete. Different parties with different assumptions and estimates could derive a different estimated value per share, and these differences could be significant. The estimated value per share is not audited and does not represent the fair value of the Company’s assets or liabilities according to GAAP.
The estimated value per share is based on the estimated value of the Company’s assets less the estimated value of the Company’s liabilities divided by the number of shares outstanding, all as of September 30, 2009. The value of the Company’s shares will fluctuate over time in response to developments related to individual assets in the portfolio and the management of those assets and in response to the real estate and finance markets. The Company expects to engage the Advisor or an independent valuation firm to update the estimated value per share within 12 to 18 months of September 30, 2009.
The Company’s board of directors may amend, suspend or terminate the share redemption program with 30 days’ notice to its stockholders. The Company may provide this notice by including such information in a Current Report on Form 8-K or in the Company’s annual or quarterly reports, all publicly filed with the SEC, or by a separate mailing to its stockholders.
The Company records amounts that are redeemable under the share redemption program as redeemable common stock in the accompanying consolidated balance sheets since the shares could become mandatorily redeemable at the option of the holder upon the stockholder’s death, “qualifying disability” or “determination of incompetence” and therefore their redemption is outside the control of the Company. The maximum amount redeemable under the Company’s share redemption program is limited to the number of shares the Company could redeem with the amount of the net proceeds from the sale of shares under the dividend reinvestment plan during the prior calendar year. However, since the amounts that can be redeemed in future periods are determinable and only contingent on an event that is likely to occur (e.g., the passage of time), the Company presents the net proceeds from the current year dividend reinvestment plan as redeemable common stock in the accompanying consolidated balance sheets.
The Company classifies financial instruments that represent a mandatory obligation of the Company to redeem shares as liabilities. The Company’s redeemable common shares are mandatorily redeemable at the option of the holder upon the stockholder’s death, “qualifying disability” or “determination of incompetence.” When the Company determines it has a mandatory obligation to redeem shares under the share redemption program, it classifies such obligations from temporary equity to a liability based upon their respective settlement values. On March 25, 2009, the Company adopted an amended and restated share redemption program (which became effective on April 26, 2009) that changed the Company’s mandatory obligation to redeem shares under the program. Prior to the effectiveness of the amended and restated share redemption program, a stockholder could redeem a share at his or her own option to the extent of the amount of net proceeds from the issuance of shares under the dividend reinvestment plan during the prior calendar year. Upon effectiveness of the amended and restated share redemption program, and except with respect to redemptions sought upon a stockholder’s death, “qualifying disability” or “determination of incompetence,” the Company’s obligation to redeem shares is limited to the amount of net proceeds from the issuance of shares under the dividend reinvestment plan during the prior calendar year in excess of amounts the Company determines are necessary to fund current and future funding obligations of the Company, as defined by the amended and restated share redemption program. When shares are tendered for redemption and the Company determines that it has a redemption obligation under the amended and restated share redemption program, it will reclassify such obligations from temporary equity to a liability based upon their respective settlement values.
The Company limits the dollar value of shares that may be redeemed under the program as described above. During the year ended December 31, 2009, the Company redeemed $35.9 million of shares of common stock. However, based on 2010 budgeted expenditures, and except with respect to redemptions sought upon a stockholder’s death, “qualifying disability” or “determination of incompetence,” the Company does not expect to have funds available for the redemption program in 2010.
F-16
Table of Contents
KBS REAL ESTATE INVESTMENT TRUST, INC.
NOTES TO CONSOLIDATED FINANCIAL STATEMENTS (CONTINUED)
December 31, 2009
Related Party Transactions
Pursuant to the Advisory Agreement, the Company is obligated to pay the Advisor specified fees upon the provision of certain services, including the investment of funds in real estate and real estate-related investments, management of the Company’s investments and other services (including, but not limited to, the disposition of investments). The Company also reimburses the Advisor for offering costs related to the dividend reinvestment plan, acquisition and origination expenses, and certain operating expenses incurred by the Advisor on behalf of the Company or incurred in connection with providing services to the Company. As detailed in the Advisory Agreement, the Advisor is also entitled to certain other fees, including an incentive fee, upon achieving certain performance goals, and the Advisor and its affiliates may receive compensation in the form of stock-based awards.
Also, under the Dealer Manager Agreement, and to the extent permitted under state securities laws, if the Company paid selling commissions in connection with the issuance of shares to an investor in the primary offering, the Company may pay the Dealer Manager selling commissions up to 3.0% of gross offering proceeds from the issuance of shares to that investor under the dividend reinvestment plan. The Dealer Manager reallows all such selling commissions to the broker-dealer associated with such account. The Company also reimburses the Dealer Manager for certain expenses related to the dividend reinvestment plan offering.
The Company records all related party fees as incurred, subject to any limitations described in the Advisory Agreement. The Company has granted no stock-based compensation awards to the Advisor or its affiliates and it has not incurred any disposition fees, subordinated participation in net cash flows, or subordinated incentive listing fees during the year ended December 31, 2009 or any previous periods.
Organization, Offering, and Related Costs
Organization and offering costs (other than selling commissions and dealer manager fees) of the Company were paid in part by the Advisor, the Dealer Manager and their affiliates on behalf of the Company, and the Advisor, the Dealer Manager and their affiliates may continue to pay some of these costs of the dividend reinvestment plan offering on behalf of the Company. Other offering costs include all expenses incurred by the Company in connection with the Offering, including but not limited to (i) legal, accounting, printing, mailing, and filing fees; (ii) charges of the escrow holder and expenses of the Advisor for administrative services related to the issuance of shares in the Offering; (iii) reimbursement of the Dealer Manager for amounts it may pay to reimburse the bona fide diligence expenses of broker-dealers; (iv) reimbursement to the Advisor for the salaries of its employees and other costs in connection with preparing supplemental sales materials; (v) the cost of educational conferences held by the Company (including the travel, meal, and lodging costs of registered representatives of broker-dealers); and (vi) reimbursement to the Dealer Manager for travel, meals, lodging and attendance fees incurred by employees of the Dealer Manager to attend retail seminars conducted by broker-dealers.
Pursuant to the Advisory Agreement and the Dealer Manager Agreement, the Company is obligated to reimburse the Advisor, the Dealer Manager or their affiliates, as applicable, for organization and offering costs paid by them on behalf of the Company, provided that the Advisor is obligated to reimburse the Company to the extent selling commissions, dealer manager fees and organization and other offering costs incurred by the Company in the Offering exceed 15% of gross offering proceeds. As a result, these costs are only a liability of the Company to the extent selling commissions, dealer manager fees and organization and other offering costs incurred by the Company do not exceed 15% of the gross proceeds of the Offering. Through December 31, 2009, including shares issued through the Company’s dividend reinvestment plan, the Company had issued 184,869,769 shares for gross offering proceeds of approximately $1.8 billion and recorded selling commissions and dealer manager fees of $157.8 million and organization and other offering costs of $16.7 million. Organization costs are expensed as incurred, and offering costs, which include selling commissions and dealer manager fees, are charged as incurred as a reduction to equity.
The Company ceased offering shares in its primary offering of up to 200,000,000 shares on May 30, 2008. Subscriptions from nonqualified accounts had to be postmarked as of May 30, 2008. For investments by qualified accounts, subscription agreements must have been dated on or before May 30, 2008 with all documents and funds received by the Company by the end of business on September 1, 2008. The Company has now terminated the primary offering upon the completion of review of subscriptions submitted in accordance with its processing procedures. The Company continues to issue shares under its dividend reinvestment plan.
F-17
Table of Contents
KBS REAL ESTATE INVESTMENT TRUST, INC.
NOTES TO CONSOLIDATED FINANCIAL STATEMENTS (CONTINUED)
December 31, 2009
Asset Management Fee
With respect to investments in real estate, the Company pays the Advisor a monthly asset management fee equal to one-twelfth of 0.75% of the amount paid or allocated to acquire the investment, inclusive of acquisition fees and expenses related thereto and the amount of any debt associated with or used to acquire such investment. In the case of investments made through joint ventures, the asset management fee will be determined based on the Company’s proportionate share of the underlying investment.
With respect to investments in loans and any investments other than real estate, the Company pays the Advisor a monthly fee calculated, each month, as one-twelfth of 0.75% of the lesser of (i) the amount actually paid or allocated to acquire or fund the loan or other investment, inclusive of acquisition or origination fees and expenses related thereto and the amount of any debt associated with or used to acquire or fund such investment and (ii) the outstanding principal amount of such loan or other investment, plus the acquisition or origination fees and expenses related to the acquisition or funding of such investment, as of the time of calculation.
Notwithstanding the above, with respect to the Company’s investment in a consolidated joint venture (the “National Industrial Portfolio”) with New Leaf Industrial Partners Fund, L.P. (“New Leaf”), the asset management fee is calculated as a monthly fee equal to one-twelfth of 0.27% of the cost of the joint venture investment (inclusive of acquisition fees and expenses related thereto and the amount of debt associated with the Company’s investment), as defined in the Advisory Agreement. The Advisor may also earn a performance fee related to the Company’s investment in this joint venture that would in effect make the Advisor’s cumulative fees related to the investment equal to 0.75% of the cost of the joint venture investment (inclusive of acquisition fees and expenses related thereto and the amount of debt associated with the Company’s investment), as defined, on an annualized basis from the date of the Company’s investment in the joint venture through the date of calculation. This fee is conditioned upon the Company achieving certain performance thresholds and may only be paid after the repayment of advances from the Advisor.
Asset management fees to affiliate totaled $22.1 million, $17.5 million and $5.1 million for the years ended December 31, 2009, 2008 and 2007, respectively.
With respect to an investment that has suffered an impairment in value, reduction in cash flow or other negative circumstances, such investment shall either be excluded from the calculation of the asset management fee described above or included in such calculation at a reduced value that is recommended by the Advisor and the Company’s management and then approved by a majority of the Company’s independent directors, and this change in the fee shall be applicable to an investment upon the earlier to occur of the date on which (i) such investment is sold, (ii) such investment is surrendered to a person other than the Company, its direct or indirect wholly owned subsidiary or a joint venture or partnership in which the Company has an interest, (iii) the Advisor determines that it will no longer pursue collection or other remedies related to such investment, or (iv) the Advisor recommends a revised fee arrangement with respect to such investment. During the fourth quarter of 2009, the Company excluded its investments in the Petra Fund REIT Corp. subordinated debt and the 2600 Michelson Mezzanine Loan from the calculation of asset management fees and will do so in future periods. As of December 31, 2009, the Company has not determined to calculate the asset management fee at an adjusted value for any other investments or to exclude any other investments from the calculation of the asset management fee.
Income Taxes
The Company has elected to be taxed as a REIT under the Internal Revenue Code of 1986, as amended (the “Code”). To qualify as a REIT, the Company must meet certain organizational and operational requirements, including a requirement to distribute at least 90% of the Company’s annual REIT taxable income to stockholders (which is computed without regard to the dividends-paid deduction or net capital gain and which does not necessarily equal net income as calculated in accordance with GAAP). As a REIT, the Company generally will not be subject to federal income tax on income that it distributes as dividends to its stockholders. If the Company fails to qualify as a REIT in any taxable year, it will be subject to federal income tax on its taxable income at regular corporate income tax rates and generally will not be permitted to qualify for treatment as a REIT for federal income tax purposes for the four taxable years following the year during which qualification is lost, unless the Internal Revenue Service grants the Company relief under certain statutory provisions. Such an event could materially and adversely affect the Company’s net income and net cash available for distribution to stockholders. However, the Company believes that it is organized and operates in such a manner as to qualify for treatment as a REIT.
F-18
Table of Contents
KBS REAL ESTATE INVESTMENT TRUST, INC.
NOTES TO CONSOLIDATED FINANCIAL STATEMENTS (CONTINUED)
December 31, 2009
The Company has concluded that there are no significant uncertain tax positions requiring recognition in its financial statements. Neither the Company nor its subsidiaries have been assessed interest or penalties by any major tax jurisdictions. The Company’s evaluations were performed for the tax years ending December 31, 2009, 2008 and 2007. As of December 31, 2009, returns for the calendar years 2006 through 2008 remain subject to examination by major tax jurisdictions.
Per Share Data
Basic net loss per share of common stock is calculated by dividing net loss attributable to common stockholders by the weighted-average number of shares of common stock issued and outstanding during such period. Diluted net loss per share of common stock equals basic net loss per share of common stock as there were no potentially dilutive securities outstanding during the years ended December 31, 2009, 2008 and 2007, respectively.
Distributions declared per common share assumes each share was issued and outstanding each day during the years ended December 31, 2009, 2008 and 2007, and was based on daily record dates for distributions from January 1, 2007 through June 30, 2009 of $0.0019178 per share per day and from July 1, 2009 through December 31, 2009 of $0.00143836 per share per day. Each day during the periods from January 1, 2007 through December 31, 2009 was a record date for distributions.
Industry Segments
The Company’s segments are based on the Company’s method of internal reporting which classifies its operations by investment type: real estate and real estate-related. For financial data by segment, see Note 13, “Segment Information.”
Square Footage, Occupancy and Other Measures
Square footage, occupancy and other measures used to describe real estate and real estate-related investments included in the Notes to Consolidated Financial Statements are presented on an unaudited basis.
Recently Issued Accounting Standards Updates
In May 2009, the Financial Accounting Standards Board (“FASB”) issued ASC Topic 855, Subsequent Events (“ASC 855”). ASC 855 establishes general standards of accounting for and disclosure of events that occur after the balance sheet date but before financial statements are issued or are available to be issued. ASC 855 requires the disclosure of the date through which an entity has evaluated subsequent events and the basis for that date. This ASC also requires public entities to evaluate subsequent events through the date that the financial statements are issued. ASC 855 is effective for interim periods and fiscal years ending after June 15, 2009. In February 2010, the FASB issued Accounting Standards Update (“ASU”) No. 2010-09. ASU No. 2010-09 amends ASC 855 and eliminates the requirement to disclose the date through which subsequent events have been evaluated for SEC filers. ASU No. 2010-09 is effective upon issuance. The adoption of ASC 855 and ASU No. 2010-09 did not have a material impact on the Company’s consolidated financial statements.
In June 2009, the FASB updated ASC Topic 810, Consolidation (“ASC 810”), to amend existing consolidation guidance for variable interest entities (“VIE”), require ongoing reassessment to determine whether a VIE must be consolidated, and require additional disclosures regarding involvement with VIEs and any significant changes in risk exposure due to that involvement. These amendments to ASC 810 will be effective for fiscal years beginning on or after November 15, 2009. Management anticipates the adoption of ASC 810 will not have a material impact on the Company’s consolidated financial statements.
F-19
Table of Contents
KBS REAL ESTATE INVESTMENT TRUST, INC.
NOTES TO CONSOLIDATED FINANCIAL STATEMENTS (CONTINUED)
December 31, 2009
| 3. | REAL ESTATE |
As of December 31, 2009, the Company’s real estate portfolio (including properties held through a consolidated joint venture) was composed of approximately 21.0 million rentable square feet and was 90% leased. The properties are located in 23 states and include office and industrial properties. The following table provides summary information regarding the properties owned by the Company as of December 31, 2009 (in thousands):
| Asset Name |
Acquisition Date |
City | State | Total Real Estate at Cost |
Accumulated Depreciation and Amortization |
Total Real Estate, Net | ||||||||||
| Properties Held Through Wholly Owned Subsidiaries |
||||||||||||||||
| Office |
||||||||||||||||
| Sabal Pavilion Building |
07/07/2006 | Tampa | FL | $ | 22,557 | $ | (1,730 | ) | $ | 20,827 | ||||||
| Plaza in Clayton |
09/27/2006 | Saint Louis | MO | 94,267 | (10,593 | ) | 83,674 | |||||||||
| Crescent Green Buildings |
01/31/2007 | Cary | NC | 47,807 | (5,569 | ) | 42,238 | |||||||||
| 625 Second Street Building |
01/31/2007 | San Francisco | CA | 49,372 | (3,027 | ) | 46,345 | |||||||||
| Sabal VI Building |
03/05/2007 | Tampa | FL | 17,629 | (1,724 | ) | 15,905 | |||||||||
| The Offices at Kensington |
03/29/2007 | Sugar Land | TX | 29,207 | (2,799 | ) | 26,408 | |||||||||
| Royal Ridge Building |
06/21/2007 | Alpharetta | GA | 33,818 | (3,814 | ) | 30,004 | |||||||||
| 9815 Goethe Road Building |
06/26/2007 | Sacramento | CA | 17,242 | (1,912 | ) | 15,330 | |||||||||
| Plano Corporate Center I & II |
08/28/2007 | Plano | TX | 52,652 | (5,570 | ) | 47,082 | |||||||||
| 2200 West Loop South Building |
09/05/2007 | Houston | TX | 39,818 | (3,525 | ) | 36,293 | |||||||||
| ADP Plaza |
11/07/2007 | Portland | OR | 32,470 | (2,218 | ) | 30,252 | |||||||||
| Woodfield Preserve Office Center |
11/13/2007 | Schaumburg | IL | 124,350 | (13,062 | ) | 111,288 | |||||||||
| Patrick Henry Corporate Center |
11/29/2007 | Newport News | VA | 18,674 | (1,318 | ) | 17,356 | |||||||||
| South Towne Corporate Center I and II |
11/30/2007 | Sandy | UT | 50,332 | (3,632 | ) | 46,700 | |||||||||
| Millennium I Building |
06/05/2008 | Addison | TX | 76,710 | (7,129 | ) | 69,581 | |||||||||
| Tysons Dulles Plaza |
06/06/2008 | McLean | VA | 161,037 | (10,187 | ) | 150,850 | |||||||||
| Great Oaks Center |
07/18/2008 | Alpharetta | GA | 35,903 | (1,909 | ) | 33,994 | |||||||||
| University Park Buildings |
07/31/2008 | Sacramento | CA | 26,866 | (1,934 | ) | 24,932 | |||||||||
| Meridian Tower |
08/18/2008 | Tulsa | OK | 19,036 | (1,804 | ) | 17,232 | |||||||||
| North Creek Parkway Center |
08/28/2008 | Bothell | WA | 42,152 | (3,061 | ) | 39,091 | |||||||||
| Five Tower Bridge Building |
10/14/2008 | West Conshohocken | PA | 76,900 | (4,203 | ) | 72,697 | |||||||||
| City Gate Plaza |
11/25/2008 | Sacramento | CA | 21,266 | (1,108 | ) | 20,158 | |||||||||
| 18301 Von Karman Building (1) |
10/06/2009 | Irvine | CA | 39,035 | (443 | ) | 38,592 | |||||||||
| 1,129,100 | (92,271 | ) | 1,036,829 | |||||||||||||
| Industrial |
||||||||||||||||
| Southpark Commerce Center II Buildings |
11/21/2006 | Austin | TX | 29,135 | (3,447 | ) | 25,688 | |||||||||
| 825 University Avenue Building |
12/05/2006 | Norwood | MA | 31,268 | (3,998 | ) | 27,270 | |||||||||
| Midland Industrial Buildings |
12/22/2006 | McDonough | GA | 35,618 | (3,278 | ) | 32,340 | |||||||||
| Bridgeway Technology Center |
06/27/2007 | Newark | CA | 45,796 | (4,923 | ) | 40,873 | |||||||||
| Cardinal Health |
07/25/2007 | Champlin | MN | 13,307 | (954 | ) | 12,353 | |||||||||
| Cedar Bluffs Business Center |
07/25/2007 | Eagan | MN | 6,627 | (661 | ) | 5,966 | |||||||||
| Crystal Park II-Buildings D & E |
07/25/2007 | Round Rock | TX | 19,500 | (1,127 | ) | 18,373 | |||||||||
| Corporate Express |
07/25/2007 | Arlington | TX | 9,325 | (733 | ) | 8,592 | |||||||||
| Park 75-Dell |
07/25/2007 | West Chester | OH | 18,729 | (1,502 | ) | 17,227 | |||||||||
| Plainfield Business Center |
07/25/2007 | Plainfield | IN | 17,359 | (1,912 | ) | 15,447 | |||||||||
| Hartman Business Center One |
07/25/2007 | Austell | GA | 16,829 | (1,372 | ) | 15,457 | |||||||||
| Rickenbacker IV-Medline |
07/25/2007 | Groveport | OH | 16,909 | (1,817 | ) | 15,092 | |||||||||
| Advo-Valassis Building |
07/25/2007 | Van Buren | MI | 9,025 | (681 | ) | 8,344 | |||||||||
| Royal Parkway Center I & II |
11/15/2007 | Nashville | TN | 12,558 | (1,002 | ) | 11,556 | |||||||||
| Greenbriar Business Park |
11/15/2007 | Nashville | TN | 16,887 | (1,450 | ) | 15,437 | |||||||||
| Cumberland Business Center |
11/15/2007 | Nashville | TN | 11,138 | (1,394 | ) | 9,744 | |||||||||
| Riverview Business Center I & II |
11/15/2007 | Nashville | TN | 13,032 | (968 | ) | 12,064 | |||||||||
| Rivertech I and II |
02/20/2008 | Billerica | MA | 46,061 | (3,809 | ) | 42,252 | |||||||||
| Suwanee Pointe |
05/22/2008 | Suwanee | GA | 18,215 | (1,244 | ) | 16,971 | |||||||||
| 387,318 | (36,272 | ) | 351,046 | |||||||||||||
| Total Properties Held Through Wholly Owned Subsidiaries |
1,516,418 | (128,543 | ) | 1,387,875 | ||||||||||||
F-20
Table of Contents
KBS REAL ESTATE INVESTMENT TRUST, INC.
NOTES TO CONSOLIDATED FINANCIAL STATEMENTS (CONTINUED)
December 31, 2009
| Asset Name |
Acquisition Date |
City | State | Total Real Estate at Cost |
Accumulated Depreciation and Amortization |
Total Real Estate, Net | ||||||||||
| Properties Held Through Consolidated Joint Venture |
||||||||||||||||
| National Industrial Portfolio - Industrial |
||||||||||||||||
| 9410 Heinz Way |
08/08/2007 | Commerce City | CO | 10,681 | (921 | ) | 9,760 | |||||||||
| 74 Griffin Street South |
08/08/2007 | Bloomfield | CT | 19,665 | (1,018 | ) | 18,647 | |||||||||
| 85 Moosup Pond Road |
08/08/2007 | Plainfield | CT | 26,359 | (3,938 | ) | 22,421 | |||||||||
| 555 Taylor Road |
08/08/2007 | Enfield | CT | 73,427 | (4,198 | ) | 69,229 | |||||||||
| 15 & 30 Independence Drive |
08/08/2007 | Devens | MA | 32,590 | (2,217 | ) | 30,373 | |||||||||
| 50 Independence Drive |
08/08/2007 | Devens | MA | 13,875 | (802 | ) | 13,073 | |||||||||
| 1040 Sheridan |
08/08/2007 | Chicopee | MA | 4,139 | (603 | ) | 3,536 | |||||||||
| 1045 Sheridan |
08/08/2007 | Chicopee | MA | 3,354 | (173 | ) | 3,181 | |||||||||
| 151 Suffolk Lane |
08/08/2007 | Gardner | MA | 3,159 | (134 | ) | 3,025 | |||||||||
| 1111 Southampton Road |
08/08/2007 | Westfield | MA | 28,846 | (3,332 | ) | 25,514 | |||||||||
| 100 & 111 Adams Road |
08/08/2007 | Clinton | MA | 37,163 | (2,878 | ) | 34,285 | |||||||||
| 100 Simplex Drive |
08/08/2007 | Westminster | MA | 22,889 | (1,384 | ) | 21,505 | |||||||||
| 495-515 Woburn |
08/08/2007 | Tewksbury | MA | 69,189 | (8,257 | ) | 60,932 | |||||||||
| 480 Sprague Street |
08/08/2007 | Dedham | MA | 13,682 | (650 | ) | 13,032 | |||||||||
| 625 University Avenue(2) |
08/08/2007 | Norwood | MA | 1,460 | (1,045 | ) | 415 | |||||||||
| 57-59 Daniel Webster Highway |
08/08/2007 | Merrimack | NH | 24,267 | (2,510 | ) | 21,757 | |||||||||
| 133 Jackson Avenue |
08/08/2007 | Ellicott | NY | 7,478 | (379 | ) | 7,099 | |||||||||
| 1200 State Fair Boulevard |
08/08/2007 | Geddes | NY | 13,282 | (566 | ) | 12,716 | |||||||||
| 3407 Walters Road |
08/08/2007 | Van Buren | NY | 7,011 | (299 | ) | 6,712 | |||||||||
| 851 Beaver Drive |
08/08/2007 | Du Bois | PA | 5,321 | (179 | ) | 5,142 | |||||||||
| Shaffer Road and Route 255 |
08/08/2007 | Du Bois | PA | 8,115 | (385 | ) | 7,730 | |||||||||
| 9700 West Gulf Bank Road |
08/08/2007 | Houston | TX | 10,812 | (547 | ) | 10,265 | |||||||||
| 1000 East I-20 |
08/08/2007 | Abilene | TX | 11,075 | (887 | ) | 10,188 | |||||||||
| 2200 South Business 45 |
08/08/2007 | Corsicana | TX | 40,667 | (10,476 | ) | 30,191 | |||||||||
| Total Properties Held Through Consolidated Joint Venture |
488,506 | (47,778 | ) | 440,728 | ||||||||||||
| Total Real Estate |
$ | 2,004,924 | $ | (176,321 | ) | $ | 1,828,603 | |||||||||
(1) On October 6, 2009, the Company received a deed-in-lieu of foreclosure on the property securing the 18301 Von Karman Loans and gained control of the property. On June 12, 2008, the Company, through an indirect wholly owned subsidiary, had made an investment in a first mortgage loan and a mezzanine loan secured by this property. See Note 5, “Real Estate Loans Receivable – Impairments of Real Estate Loans Receivable – 18301 Von Karman Loans.”
(2) The joint venture purchased the rights to a master lease with a remaining term of 13.25 years with respect to this property as part of the National Industrial Portfolio acquisition.
F-21
Table of Contents
KBS REAL ESTATE INVESTMENT TRUST, INC.
NOTES TO CONSOLIDATED FINANCIAL STATEMENTS (CONTINUED)
December 31, 2009
Operating Leases
The Company’s real estate assets are leased to tenants under operating leases for which the terms and expirations vary. As of December 31, 2009, the leases have remaining terms of up to 12.26 years with a weighted-average remaining term of 4.14 years. The leases may have provisions to extend the lease agreements, options for early termination after paying a specified penalty, rights of first refusal to purchase the property at competitive market rates, and other terms and conditions as negotiated. The Company retains substantially all of the risks and benefits of ownership of the real estate assets leased to tenants. Generally, upon the execution of a lease, the Company requires security deposits from tenants in the form of a cash deposit and/or a letter of credit. Amounts required as security deposits vary depending upon the terms of the respective leases and the creditworthiness of the tenant, but generally are not significant amounts. Therefore, exposure to credit risk exists to the extent that a receivable from a tenant exceeds the amount of its security deposit. Security deposits received in cash related to tenant leases are included in other liabilities in the accompanying consolidated balance sheets and totaled $5.2 million as of December 31, 2009 and 2008.
The future minimum rental income from the Company’s properties under non-cancelable operating leases as of December 31, 2009 for the years ending December 31 is as follows (in thousands):
| 2010 |
$ | 151,555 | |
| 2011 |
131,924 | ||
| 2012 |
107,613 | ||
| 2013 |
88,116 | ||
| 2014 |
71,201 | ||
| Thereafter |
185,365 | ||
| $ | 735,774 | ||
For the year ended December 31, 2009, no tenant represented over 6% and no industry represented over 8% of the Company’s rental income. The Company currently has approximately 400 tenants over a diverse range of industries and geographical regions. As of December 31, 2009, the Company had a bad debt reserve of $2.6 million, which represents less than 2% of annualized base rent. As of December 31, 2009, the Company has 11 tenants with rent balances outstanding for over 90 days, all of which are included in this reserve.
| 4. | TENANT ORIGINATION AND ABSORPTION COSTS, ABOVE-MARKET LEASE ASSETS AND BELOW-MARKET LEASE LIABILITIES |
As of December 31, 2009 and 2008, the Company’s tenant origination and absorption costs, above-market lease assets, and below-market lease liabilities (excluding fully amortized assets and liabilities and accumulated amortization) were as follows (in thousands):
| Tenant Origination and Absorption Costs |
Above-Market Lease Assets |
Below-Market Lease Liabilities |
||||||||||||||||||||||
| 2009 | 2008 | 2009 | 2008 | 2009 | 2008 | |||||||||||||||||||
| Cost (1) |
$ | 125,210 | $ | 172,055 | $ | 23,983 | $ | 27,408 | $ | 43,532 | $ | 58,722 | ||||||||||||
| Accumulated Amortization (1) |
(61,142 | ) | (53,353 | ) | (10,897 | ) | (7,917 | ) | (16,827 | ) | (15,149 | ) | ||||||||||||
| Net Amount |
$ | 64,068 | $ | 118,702 | $ | 13,086 | $ | 19,491 | $ | 26,705 | $ | 43,573 | ||||||||||||
(1) In 2009 and 2008, the Company wrote off fully amortized tenant origination and absorption costs of $48.7 million and $18.7 million, above-market lease assets of $4.9 million and $0.2 million, and below-market lease liabilities of $12.3 million and $3.9 million, respectively.
F-22
Table of Contents
KBS REAL ESTATE INVESTMENT TRUST, INC.
NOTES TO CONSOLIDATED FINANCIAL STATEMENTS (CONTINUED)
December 31, 2009
Increases (decreases) in net income as a result of amortization of the Company’s tenant origination and absorption costs, above-market lease assets and below-market lease liabilities for the years ended December 31, 2009, 2008 and 2007 were as follows (in thousands):
| Tenant Origination and Absorption Costs |
Above-Market Lease Assets |
Below-Market Lease Liabilities | |||||||||||||||||||||||||||||||
| For the Year Ended December 31, |
For the Year Ended December 31, |
For the Year Ended December 31, | |||||||||||||||||||||||||||||||
| 2009 | 2008 | 2007 | 2009 | 2008 | 2007 | 2009 | 2008 | 2007 | |||||||||||||||||||||||||
| Amortization |
$ | (56,482 | ) | $ | (48,002 | ) | $ | (22,928 | ) | $ | (7,921 | ) | $ | (6,069 | ) | $ | (1,977 | ) | $ | 13,939 | $ | 12,773 | $ | 5,975 | |||||||||
The remaining unamortized balance for these outstanding intangible assets and liabilities as of December 31, 2009 is expected to be amortized for the years ending December 31 (in thousands) as follows:
| Tenant Origination and Absorption Costs |
Above-Market Lease Assets |
Below-Market Lease Liabilities | |||||||||
| 2010 |
$ | (23,096 | ) | $ | (5,015 | ) | $ | 7,273 | |||
| 2011 |
(14,243 | ) | (3,314 | ) | 5,395 | ||||||
| 2012 |
(9,854 | ) | (2,449 | ) | 4,087 | ||||||
| 2013 |
(6,727 | ) | (1,370 | ) | 3,465 | ||||||
| 2014 |
(4,180 | ) | (499 | ) | 2,743 | ||||||
| Thereafter |
(5,968 | ) | (439 | ) | 3,742 | ||||||
| $ | (64,068 | ) | $ | (13,086 | ) | $ | 26,705 | ||||
| Weighted-Average Remaining Amortization Period |
4.30 years | 3.51 years | 5.29 years | ||||||||
F-23
Table of Contents
KBS REAL ESTATE INVESTMENT TRUST, INC.
NOTES TO CONSOLIDATED FINANCIAL STATEMENTS (CONTINUED)
December 31, 2009
| 5. | REAL ESTATE LOANS RECEIVABLE |
As of December 31, 2009 and 2008, the Company, through wholly owned subsidiaries, had invested in real estate loans receivable as follows (dollars in thousands):
| Loan Name Location of Related Property or Collateral |
Date Acquired/ Originated |
Property Type |
Loan Type |
Outstanding Principal Balance as of December 31, 2009 (1) |
Book Value as of December 31, 2009 (2) |
Book Value as of December 31, 2008 (2) |
Contractual Interest Rate (3) |
Annualized Effective Interest Rate (3) |
Maturity Date (3) | ||||||||||||||
| First Tribeca Mezzanine Loan |
07/18/2006 | Multi Family Residential |
Mezzanine | $ | 15,896 | $ | 15,896 | $ | 15,896 | One-month LIBOR + 8.50 |
% |
3.00 | % | 02/01/2010 | |||||||||
| Second Tribeca Mezzanine Loan |
05/03/2007 | Multi Family Residential |
Mezzanine | 33,070 | 33,070 | 31,967 | 25.00 | % | 3.63 | % | 02/01/2010 | ||||||||||||
| Tribeca Senior Mortgage Participation |
06/28/2007 | Multi Family Residential |
Mortgage | 8,067 | 8,067 | 14,192 | One-month LIBOR + 2.70 |
% |
3.14 | % | 02/01/2010 | ||||||||||||
| Sandmar Mezzanine Loan |
01/09/2007 | Retail | Mezzanine | 8,000 | 8,085 | 8,092 | 12.00 | % | 9.92 | % | 01/01/2017 | ||||||||||||
| Park Central Mezzanine Loan |
03/23/2007 | Hotel | Mezzanine | 15,000 | 15,000 | 15,000 | One-month LIBOR + 4.48 |
% |
4.90 | % | 11/09/2010 | ||||||||||||
| 200 Professional Drive Loan Origination |
07/31/2007 | Office | Mortgage | 9,306 | 9,308 | 9,073 | One-month LIBOR + 3.00 |
% |
1.28 | % | 07/31/2009 | ||||||||||||
| Lawrence Village Plaza Loan Origination |
08/06/2007 | Retail | Mortgage | 6,465 | 6,469 | 6,322 | One-month LIBOR + 2.50 |
% |
7.48 | % | 09/01/2010 | ||||||||||||
| 11 South LaSalle Loan Origination |
08/08/2007 | Office | Mortgage | 35,195 | 35,171 | 30,771 | One-month LIBOR + 2.95 |
% |
6.71 | % | 09/01/2010 | ||||||||||||
| San Diego Office Portfolio B-Note |
10/26/2007 | Office | B-Note | 20,000 | 14,452 | 14,029 | 5.78 | % | 11.19 | % | 10/11/2017 | ||||||||||||
| Petra Subordinated Debt Tranche A (5) |
10/26/2007 | Unsecured | Subordinated | 25,000 | 25,000 | 25,000 | 11.50 | % | (5 | ) | 04/27/2009 | ||||||||||||
| Petra Subordinated Debt Tranche B (5) |
10/26/2007 | Unsecured | Subordinated | 25,000 | 25,000 | 25,000 | 11.50 | % | (5 | ) | 10/26/2009 | ||||||||||||
| 4929 Wilshire B-Note |
11/19/2007 | Office | B-Note | 4,000 | 2,782 | 2,690 | 6.05 | % | 12.33 | % | 07/11/2017 | ||||||||||||
| Artisan Multifamily Portfolio Mezzanine Loan |
12/11/2007 | Multi Family Residential |
Mezzanine | 20,000 | 17,869 | 17,212 | One-month LIBOR + 2.50 |
% |
8.00 | % | 08/09/2010 | ||||||||||||
| Arden Portfolio M3-(A) Mezzanine Loan |
01/30/2008 | Office | Mezzanine | — | — | 64,378 | (9 | ) | (9 | ) | (9) | ||||||||||||
| Arden Portfolio M2-(B) Mezzanine Loan |
01/30/2008 | Office | Mezzanine | — | — | 87,834 | (9 | ) | (9 | ) | (9) | ||||||||||||
| San Antonio Business Park Mortgage Loan |
03/28/2008 | Office | Mortgage | 30,600 | 24,823 | 24,366 | 6.54 | % | 10.11 | % | 11/11/2017 | ||||||||||||
| 2600 Michelson Mezzanine Loan |
06/02/2008 | Office | Mezzanine | 15,000 | 8,895 | 8,813 | 8.00 | % | 8.09 | % | 05/11/2017 | ||||||||||||
| 18301 Von Karman Loans |
06/12/2008 | Office | Mortgage & Mezzanine |
— | — | 63,313 | 5.73 | % | 5.41 | % | 05/11/2017 | ||||||||||||
F-24
Table of Contents
KBS REAL ESTATE INVESTMENT TRUST, INC.
NOTES TO CONSOLIDATED FINANCIAL STATEMENTS (CONTINUED)
December 31, 2009
| Loan Name Location of Related Property or Collateral |
Date Acquired/ Originated |
Property Type |
Loan Type |
Outstanding Principal Balance as of December 31, 2009 (1) |
Book Value as of December 31, 2009 (2) |
Book Value as of December 31, 2008 (2) |
Contractual Interest Rate (3) |
Annualized Effective Interest Rate (3) |
Maturity Date (3) | ||||||||||||||||
| GKK Mezzanine Loan |
08/22/2008 | Office/ Bank Branch |
Mezzanine | 471,373 | 471,322 | 492,404 | One-month LIBOR + 5.20 |
% |
5.72 | % | 03/11/2010 | ||||||||||||||
| 55 East Monroe Mezzanine Loan Origination |
08/27/2008 | Office | Mezzanine | 55,000 | 55,045 | 55,105 | 12.00 | % | 12.04 | % | 09/01/2010 | ||||||||||||||
| $ | 796,972 | $ | 776,254 | $ | 1,011,457 | ||||||||||||||||||||
| Reserve for Loan Losses (15) |
— | (110,478 | ) | (104,000 | ) | ||||||||||||||||||||
| $ | 796,972 | $ | 665,776 | $ | 907,457 | ||||||||||||||||||||
(1) Outstanding principal balance as of December 31, 2009 represents original principal balance outstanding under the loan, increased for any subsequent fundings and reduced for any principal repayments.
(2) Book value of real estate loans receivable represents outstanding principal balance adjusted for unamortized acquisition discounts, origination fees, and direct origination and acquisition costs. Loan balances are presented gross of any asset-specific reserves.
(3) Contractual interest rates are the stated interest rates on the face of the loans. Annualized effective interest rates are calculated as the actual interest income recognized in 2009, using the interest method, divided by the average amortized cost basis of the investment during 2009. The annualized effective interest rates and contractual interest rates presented are for the year ended December 31, 2009. Maturity dates are as of December 31, 2009.
(4) See “—Tribeca Loans” for information on the status of these loans. The First Tribeca Mezzanine Loan has a current interest rate cap of 13.25%.
(5) The Company has recorded an asset-specific loan loss reserve against these investments. See “—Impairments of Real Estate Loans Receivable” with respect to the Arden Mezzanine Loans, the Tribeca Loans, the 200 Professional Drive Mortgage, the 18301 Von Karman Loans, the 2600 Michelson Mezzanine Loan and the Sandmar Mezzanine Loan.
(6) As of December 31, 2009, the Company may be obligated to fund additional amounts under this loan, subject to satisfaction of certain conditions by the borrower.
(7) The borrower exercised its second extension option on this loan, extending the maturity date from November 9, 2009 to November 9, 2010. The borrower has a remaining one-year extension option on this loan.
(8) The borrower under this loan has a one-year extension option, subject to certain terms and conditions.
(9) On July 8, 2009, the Company released the borrowers from obligation under these loans and received preferred membership interests in an unconsolidated joint venture that indirectly owns the properties that had served as collateral for the loans. See “—Impairments of Real Estate Loans Receivable — Arden Mezzanine Loans.”
(10) The interest rates under these loans are subject to interest rate floors.
(11) The borrower exercised the first of its three one-year extension options under this loan on June 23, 2009.
(12) The Company received a deed in lieu of foreclosure and gained control of the property securing the loans on October 6, 2009.
( 13) Subsequent to December 31, 2009, the borrower exercised its extension option under this loan and extended the maturity date of the loan to March 11, 2011.
(14) The borrower under this loan has three one-year extension options, subject to certain terms and conditions.
(15) See “—Reserve for Loan Losses.”
The following summarizes the activity related to real estate loans receivable for the year ended December 31, 2009 (in thousands):
| Real estate loans receivable, net - December 31, 2008 |
$ | 907,457 | ||
| Principal repayments received on real estate loans receivable |
(27,483 | ) | ||
| Advances on real estate loans receivable |
5,859 | |||
| Accretion of discounts on purchased real estate loans receivable |
5,764 | |||
| Amortization of origination fees and costs on purchased and originated real estate loans receivable |
(2,445 | ) | ||
| Change in loan loss reserve |
(6,478 | ) | ||
| Receipt of Arden preferred membership interests in HSC Partners joint venture |
(153,178 | ) | ||
| Receipt of Von Karman property in satisfaction of loan |
(63,720 | ) | ||
| Real estate loans receivable, net - December 31, 2009 |
$ | 665,776 | ||
F-25
Table of Contents
KBS REAL ESTATE INVESTMENT TRUST, INC.
NOTES TO CONSOLIDATED FINANCIAL STATEMENTS (CONTINUED)
December 31, 2009
The following summarizes the Company’s investments in real estate loans receivable as of December 31, 2009 (in thousands):
| Outstanding principal balance |
$ | 796,972 | ||
| Discounts on real estate loans receivable |
(29,497 | ) | ||
| Accumulated accretion of discounts on purchases of real estate loans receivable |
7,570 | |||
| Origination fees and costs on purchases and originations of real estate loans receivable |
5,003 | |||
| Accumulated amortization of origination fees and costs on purchases and originations of real estate loans receivable |
(3,794 | ) | ||
| Reserve for loan losses |
(110,478 | ) | ||
| Real estate loans receivable, net - December 31, 2009 |
$ | 665,776 | ||
For the years ended December 31, 2009, 2008 and 2007, interest income from real estate loans receivable consisted of the following (in thousands):
| Years Ended December 31, | ||||||||||||
| 2009 | 2008 | 2007 | ||||||||||
| Contractual interest income |
$ | 50,466 | $ | 56,914 | $ | 14,543 | ||||||
| Interest income from derivative instruments |
3,951 | 2,791 | — | |||||||||
| Accretion of purchase discounts |
5,764 | 18,729 | 68 | |||||||||
| Amortization of origination fees and costs and acquisition costs |
(2,445 | ) | (1,826 | ) | (237 | ) | ||||||
| Amortization of cost of derivative instruments |
(1,575 | ) | (2,675 | ) | — | |||||||
| Interest income from real estate loans receivable |
$ | 56,161 | $ | 73,933 | $ | 14,374 | ||||||
As of December 31, 2009 the Company has outstanding funding commitments of $11.2 million on its loans receivable, subject to satisfaction of certain conditions by the borrowers.
As of December 31, 2009 and 2008, interest receivable from real estate loans receivable was $1.6 million and $4.5 million, respectively, and is included in rents and other receivables.
The following is a schedule of maturities for all real estate loans receivable outstanding as of December 31, 2009 (in thousands):
| Current Maturity | Fully Extended Maturity | |||||||||||
| Face Value (Funded) (1) |
Book Value before Reserve for Loan Loss |
Face Value (Funded) (1) |
Book Value before Reserve for Loan Loss | |||||||||
| 2010 |
$ | 719,372 | $ | 717,217 | $ | 122,803 | $ | 122,810 | ||||
| 2011 |
— | — | 521,569 | 521,493 | ||||||||
| 2012 |
— | — | 20,000 | 17,869 | ||||||||
| 2013 |
— | — | 55,000 | 55,045 | ||||||||
| 2014 |
— | — | — | — | ||||||||
| Thereafter |
77,600 | 59,037 | 77,600 | 59,037 | ||||||||
| $ | 796,972 | $ | 776,254 | $ | 796,972 | $ | 776,254 | |||||
(1) The schedule of maturities above represents the contractual maturity dates and outstanding balances as of December 31, 2009. Certain of the real estate loans receivable have extension options available to the borrowers.
F-26
Table of Contents
KBS REAL ESTATE INVESTMENT TRUST, INC.
NOTES TO CONSOLIDATED FINANCIAL STATEMENTS (CONTINUED)
December 31, 2009
Impairments of Real Estate Loans Receivable
Included below is a summary of the significant facts and circumstances regarding the loans the Company determined to be impaired during the year ended December 31, 2009.
Arden Mezzanine Loans
In July 2007, the Arden Portfolio Mezzanine Loans (defined below), along with $860.0 million of mortgage loans and $475.0 million of additional mezzanine loans, were used to fund the acquisition of 33 multi-tenant office properties totaling 4.6 million square feet of rentable area in 60 buildings, located throughout Southern California (the “Arden Portfolio”). All of the mortgage and mezzanine loans related to the Arden Portfolio had an initial maturity of August 9, 2009. These loans provided three one-year extension options to the borrowers, subject to certain conditions.
On January 30, 2008, the Company purchased, through indirect wholly owned subsidiaries, participation interests in the M2-(B) and M3-(A) mezzanine loans (collectively, the “Arden Portfolio Mezzanine Loans”) for approximately $144.0 million plus closing costs. The original borrowers under the Arden Portfolio Mezzanine Loans were entities affiliated with Cabi Developers (“Cabi”) and are not affiliated with the Company or its Advisor. On November 25, 2008, Hines Interests Limited Partnership (Hines Interests Limited Partnership and its affiliates are collectively referred to herein as “Hines”) delivered notice to all Arden Portfolio lenders that it had acquired all right, title and interest in and to the borrower under the M4 Mezzanine Loan, and had thereby acquired ownership of the Arden Portfolio. On July 8, 2009, the Company entered into a joint venture (the “HSC Partners Joint Venture”) with Hines and certain other Arden Portfolio mezzanine lenders. The HSC Partners Joint Venture indirectly owns the Arden Portfolio. The Company received preferred membership interests in the HSC Partners Joint Venture. In connection with the formation of the joint venture, the mezzanine borrowers were released from liability under the Arden Portfolio Mezzanine Loans.
On July 8, 2009, there were three mezzanine loans on the Arden Portfolio with original principal amounts totaling $550.0 million in the aggregate (in order of the seniority of their interests in the Arden Portfolio):
| M1-(A) Mezzanine Loan |
$ | 50.0 million | |
| M1-(B1) Mezzanine Loan |
75.0 million | ||
| M1-(B2) Mezzanine Loan |
75.0 million | ||
| M2-(A) Mezzanine Loan |
100.0 million | ||
| M2-(B) Mezzanine Loan |
100.0 million | ||
| M3-(A) Mezzanine Loan |
75.0 million | ||
| M3-(B) Mezzanine Loan |
75.0 million | ||
| $ | 550.0 million | ||
On July 8, 2009, Hines and the holders of the M1-(B2), M2-(A), M2-(B), M3-(A) and M3-(B) Mezzanine Loans entered the operating agreement for the HSC Partners Joint Venture. The mezzanine borrowers related to these loans were released from liability. The holders of the M1-(B2), M2-(A), M2-(B), M3-(A) and M3-(B) loans (the “Preferred Members”) received preferred membership interests in the HSC Partners Joint Venture. Hines received common membership interests in the HSC Partners Joint Venture in exchange for its indirect ownership interests in the Arden Portfolio. Hines will be the managing member of the HSC Partners Joint Venture. After the above transactions, the mortgage loans and the M1-(A) and M1-(B1) mezzanine loans remain outstanding. The distribution structure of the operating agreement is designed to substantially reflect the priority of the former lenders and the payments the former lenders would have received under the prior mezzanine loans.
Hines has the power to manage the day-to-day business and affairs of the HSC Partners Joint Venture, subject to the right of the Preferred Members to approve certain major decisions set forth in the operating agreement. Without the approval of all the Preferred Members, among other things, Hines may not require members to make additional capital contributions, acquire additional assets, amend the operating agreement, cause the HSC Partners Joint Venture to dissolve or file for bankruptcy, or incur or modify any debt.
F-27
Table of Contents
KBS REAL ESTATE INVESTMENT TRUST, INC.
NOTES TO CONSOLIDATED FINANCIAL STATEMENTS (CONTINUED)
December 31, 2009
The Company accounted for the receipt of the preferred membership interests in the HSC Partners Joint Venture as a troubled debt restructuring during the year ended December 31, 2009 and recorded the preferred membership interests received at fair value. The Company determined the fair value of the preferred membership interests received to be $0. The Company had recorded an impairment charge to reduce the carrying cost of its loan receivable related to the Arden Portfolio Mezzanine Loans to $0 as of June 30, 2009. Upon receipt of the preferred membership interests in the HSC Partners Joint Venture on July 8, 2009, the Company reclassified the balance of its loan receivable to an investment in an unconsolidated joint venture as the Company does not exercise control over the major operating decisions of the joint venture.
Tribeca Loans
In 2006 and 2007, the Company made three investments related to the conversion of an eight-story loft building into a 10-story condominium building with 62 units (the “Tribeca Building”) located at 415 Greenwich Street in New York, New York. The project was capitalized in part by a senior mortgage loan (the “Tribeca Senior Mortgage Loan”), a senior mezzanine loan (the “Senior Tribeca Mezzanine Loan”), and two junior mezzanine loans (the “First Tribeca Mezzanine Loan” and the “Second Tribeca Mezzanine Loan”, collectively, the “Tribeca Junior Mezzanine Loans”). As of December 31, 2009, the Company’s outstanding investments consisted of (i) a 25% interest in the Tribeca Senior Mortgage Loan (the “Tribeca Senior Mortgage Loan Participation”) and (ii) the Tribeca Junior Mezzanine Loans (collectively with the Tribeca Senior Mortgage Loan Participation, the “Tribeca Loans”). The unpaid principal balances under the Tribeca Senior Mortgage Loan Participation, the First Tribeca Mezzanine Loan, and the Second Tribeca Mezzanine Loan were $8.1 million, $15.9 million and $33.1 million, respectively, as of December 31, 2009.
The Tribeca Junior Mezzanine Loans are subordinate to the $32.3 million Tribeca Senior Mortgage Loan and a $16.2 million Senior Tribeca Mezzanine Loan. The Company did not own the Senior Tribeca Mezzanine Loan as of December 31, 2009.
On August 13, 2009, the Company entered into a modification to the Tribeca Junior Mezzanine Loans with the holder of the 75% interest in the Tribeca Senior Mortgage Loan and the holder of the Senior Tribeca Mezzanine Loan consenting to divert 100% of the interest due to the Company under the Tribeca Junior Mezzanine Loans to the Senior Tribeca Mezzanine Loan to be applied as principal repayments, and should that loan be retired during the term of the extension, 100% of the interest due to the Company under the Tribeca Junior Mezzanine Loans would be diverted to pay down the Tribeca Senior Mortgage Loan until that loan is paid down in full. The Company would be entitled to recoup all of the interest previously diverted to the senior lenders from the borrower after the Senior Tribeca Mezzanine Loan and the Tribeca Senior Mortgage Loan are paid off. The modification extended the maturity date of all the Tribeca Loans to February 1, 2010 and provided for an additional extension to April 1, 2010, subject to certain terms and restrictions. The Company accounted for the modification of the Tribeca Junior Mezzanine Loans as a troubled debt restructuring during the year ended December 31, 2009 and recorded an impairment charge during the three months ended June 30, 2009 in anticipation of the troubled debt restructuring to reduce the value of the Tribeca Junior Mezzanine Loans to the present value of the expected future cash flows.
Subsequent to December 31, 2009, the borrower under these loans defaulted and the Company foreclosed on this project by exercising its right to accept 100% of the ownership interest of the borrower under the Second Tribeca Mezzanine Loan pursuant to the Second Tribeca Mezzanine Loan documents. As a result of the assignment in lieu of foreclosure, as of December 31, 2009, the Company valued its investments in the Tribeca Loans at their aggregate fair values of $38.1 million. The Company expects the fair values of the Tribeca Loans as of December 31, 2009 will be equal to its consolidated investment in the Tribeca Building at the time of foreclosure. The Company paid approximately $3.3 million in transfer taxes as a result of the foreclosure. In order to protect its investment in the Tribeca Building, subsequent to foreclosing, the Company’s board of directors authorized the purchase of the Senior Tribeca Mezzanine Loan for $15.0 million.
F-28
Table of Contents
KBS REAL ESTATE INVESTMENT TRUST, INC.
NOTES TO CONSOLIDATED FINANCIAL STATEMENTS (CONTINUED)
December 31, 2009
200 Professional Drive Mortgage
On July 31, 2007, the Company, through an indirect wholly owned subsidiary, made an investment in a senior mortgage loan on an office property located at 200 Professional Drive in Gaithersburg, Maryland (“200 Professional Drive Mortgage”). The Company provided a $10.5 million bridge loan to the borrower to refinance existing debt and to provide funding for renovation and lease-up of the property. The unpaid principal balance as of December 31, 2009 was $9.3 million. Due to renovation delays and difficulty leasing up the property, the borrower has not made its debt service payments since March 2009 and the Company believes that the borrower does not have sufficient debt service or capital reserves to meet its debt service obligations. The Company has begun the process of foreclosing on the security under the 200 Professional Drive Mortgage, and an auction to sell the collateral was scheduled for June 30, 2009; however, the borrower declared bankruptcy on June 29, 2009 resulting in a delay of the foreclosure process. Since the collateral value of the property is estimated to be less than the Company’s carrying value in the loan, the Company determined that it would not recover all amounts due under this loan and deemed this loan to be impaired as of March 31, 2009. As of December 31, 2009, the Company is still pursuing foreclosure of the security under this loan.
18301 Von Karman Loans
On June 12, 2008, the Company, through an indirect wholly owned subsidiary, made an investment in a first mortgage loan and a mezzanine loan on an office property located at 18301 Von Karman Avenue in Irvine, California (“Von Karman Loans”). Due to difficulty leasing up the property, the borrower failed to make its monthly debt service payments starting July 1, 2009 and the borrower did not have sufficient debt service reserves to meet its future debt service obligations. Since the collateral value of the property was estimated to be less than the Company’s carrying value of the loan, the Company determined that it would not recover all amounts due under this loan and recorded an impairment (based on the estimated value of the collateral) as of June 30, 2009. The Company received a deed in lieu of foreclosure and gained control of the property on October 6, 2009. Accordingly, this investment is now reported as a real estate asset. See Note 3, “Real Estate.”
2600 Michelson Mezzanine Loan
On June 2, 2008, the Company, through an indirect wholly owned subsidiary, made an investment in a mezzanine loan on an office property located at 2600 Michelson Avenue in Irvine, California. As of December 31, 2009, the outstanding principal balance on the loan was $15.0 million and the carrying value of the loan was $8.9 million before asset-specific impairments. Due to difficulty leasing the property, the borrower failed to make its debt service payment due August 11, 2009 and indicated that it did not intend to make any future debt service payments under the loan. Consequently, the Company does not expect to receive further interest income or principal repayments on this investment in the future. As a result, the Company determined that it would not recover all amounts due under this loan and recorded a loan loss reserve to reduce the Company’s investment to $0, which is the estimated fair value of the collateral.
Sandmar Mezzanine Loan
On January 9, 2007, the Company, through an indirect wholly owned subsidiary, made an investment in a mezzanine loan to partially fund the acquisition of six grocery-anchored, small neighborhood and single tenant retail centers located in North Carolina, Florida, and Tennessee. As of December 31, 2009, the carrying value of the loan was $8.1 million, which includes $8.0 million of outstanding principal and $0.1 million of unamortized origination fees and costs, before asset-specific reserves. Due to deteriorating operating results of the portfolio, the borrower under the Sandmar Mezzanine Loan approached the Company to modify the terms of the loan. The Company executed a modification agreement with the borrower on January 4, 2010. The Company agreed to forgive $0.1 million in unpaid debt service and to reduce the contractual interest rate from 12.0% to 5.4% in exchange for the partial prepayment of principal from the borrower of $3.0 million. In addition, the Company agreed that for every $1 of principal paid by the borrower the Company would reduce the amounts due to the Company by $1.67. Because the Company did not expect to collect all amounts due under the contractual terms of the loan agreement as of September 30, 2009, the Company deemed this loan to be impaired.
F-29
Table of Contents
KBS REAL ESTATE INVESTMENT TRUST, INC.
NOTES TO CONSOLIDATED FINANCIAL STATEMENTS (CONTINUED)
December 31, 2009
Reserve for Loan Losses
Changes in the Company’s reserve for loan losses for the year ended December 31, 2009 were as follows (in thousands):
| Reserve for loan losses, December 31, 2008 |
$ | 104,000 | ||
| Provision for loan losses |
178,634 | |||
| Charge-offs to reserve for loan losses |
(172,156 | ) | ||
| Reserve for loan losses, December 31, 2009 |
$ | 110,478 | ||
As of December 31, 2009, the total reserve for loan losses of $110.5 million consisted of $86.5 million of asset-specific reserves on impaired real estate loans receivable with an amortized cost basis of $125.3 million and $24.0 million of portfolio-based reserves on non-impaired real estate loans receivable with an amortized cost basis of $651.0 million. As of December 31, 2009, real estate loans receivable with an amortized cost basis of $152.3 million are on nonaccrual status. The asset-specific reserves relate to the following impaired loans: the Tribeca Mezzanine Loans, the 200 Professional Drive Mortgage, the 2600 Michelson Mezzanine Loan, the Sandmar Mezzanine Loan, and the subordinated debt investment in Petra Fund REIT Corp. The Company increased its loan loss reserve by $178.8 million and $104.0 million during the years ended December 31, 2009 and 2008, respectively. The portfolio-based loan loss reserve provides for probable losses estimated to have occurred on the pool of loans that do not have asset-specific reserves. Although the Company does not know which specific loans within the pool will ultimately result in losses, the Company believes it is probable that it will realize losses on the pool. For the year ended December 31, 2009, the change in loan loss reserves was comprised of $208.8 million, calculated on an asset-specific basis, partially offset by a reduction of $30.0 million to the portfolio-based reserve. During the year ended December 31, 2009, the Company also charged-off $172.2 million of reserves for loan losses related to the Arden Mezzanine Loans and the 18301 Von Karman Loans. For the year ended December 31, 2008, the change in loan loss reserve was comprised of $50.0 million, calculated on an asset-specific basis, and $54.0 million of portfolio-based reserves. The Company did not recognize any asset-specific or portfolio-based loan losses during the year ended December 31, 2007.
The Company generally recognizes income on impaired loans on either a cash basis, where interest income is only recorded when received in cash, or on a cost-recovery basis, where all cash receipts are applied against the carrying value of the loan. The Company considers the collectibility of the loan’s principal balance in determining whether to recognize income on impaired loans on a cash basis or a cost-recovery basis. During the year ended December 31, 2009, the Company recognized $12.7 million of interest income related to impaired loans. In addition, the Company recognized $4.0 million of income from an unconsolidated joint venture during the year ended December 31, 2009 related to its preferred membership interest in the HSC Partners Joint Venture, which now owns the Arden Portfolio. The Company accrued $23,000 of interest income related to the Sandmar Mezzanine Loan as of December 31, 2009.
F-30
Table of Contents
KBS REAL ESTATE INVESTMENT TRUST, INC.
NOTES TO CONSOLIDATED FINANCIAL STATEMENTS (CONTINUED)
December 31, 2009
Concentration of Credit Risks
The Company’s investment in the GKK Mezzanine Loan represents a significant investment to the Company that as of December 31, 2009 comprised 18% of the Company’s total assets and 71% of the Company’s total investments in loans receivable, after loan loss reserves. During the year ended December 31, 2009, the GKK Mezzanine Loan provided 10% of the Company’s revenues and 49% of the Company’s interest income from loans receivable.
The GKK Mezzanine Loan was used to finance a portion of Gramercy Capital Corp.’s (“Gramercy”) acquisition of American Financial Realty Trust (“AFR”) that closed on April 1, 2008. The borrowers under the GKK Mezzanine Loan are (i) the wholly owned subsidiary of Gramercy formed to own 100% of the equity interests in AFR (“AFR Owner”), (ii) AFR and (iii) certain subsidiaries of AFR that directly or indirectly own equity interests in the entities that own the AFR portfolio of properties (collectively, AFR Owner, AFR and these subsidiaries are the “Borrower”). As of December 31, 2009, AFR and its subsidiaries own over 950 office and bank branch properties located in 36 states and Washington, D.C. and partial ownership interests in 54 bank branch properties (a 99% interest in 52 properties and a 1% interest in 2 properties) occupied primarily by Citizens Bank. The GKK Mezzanine Loan is subordinate to secured senior loans (“senior loans”) in the aggregate principal amount of approximately $1.8 billion at December 31, 2009 and bears interest at a variable rate of one-month LIBOR plus 520 basis points. The GKK Mezzanine Loan has an extended maturity date of March 11, 2011. Prior to maturity, the Borrower under the GKK Mezzanine Loan is required to make interest-only payments to the Company (although certain cash flow relating to a portfolio of 15 properties comprised of 3.7 million square feet primarily leased to Bank of America is required to be applied to pay down the GKK Mezzanine Loan), with the outstanding principal balance being due at maturity. The Borrower is also permitted to sell certain properties subject to meeting specified conditions, including the payment of a release price to the Company.
F-31
Table of Contents
KBS REAL ESTATE INVESTMENT TRUST, INC.
NOTES TO CONSOLIDATED FINANCIAL STATEMENTS (CONTINUED)
December 31, 2009
Below is summary financial information of the collateral securing the GKK Mezzanine Loan. For periods prior to Gramercy’s acquisition of AFR on April 1, 2008, AFR’s historical summary financial information is presented. For the periods subsequent to Gramercy’s acquisition of AFR, the summary consolidated financial information of the Borrower is presented. The Company is providing the consolidated financial information of the Borrower of the GKK Mezzanine Loan for the periods after April 1, 2008 because the only assets of the Borrower are ownership interests in AFR and subsidiaries of AFR and the GKK Mezzanine Loan is secured by pledges of 100% of the equity interests in AFR and 100% or less of the equity interests in certain subsidiaries of AFR. The consolidated financial information of the Borrower is not directly comparable to historical financial information of AFR due to closing adjustments associated with Gramercy’s acquisition of AFR.
The summarized unaudited financial information is as follows (in thousands):
| AFR Pre-Acquisition (1) |
Borrower Post-Acquisition (2) | ||||||||
| Balance Sheet | As of December 31, 2007 |
As of December 31, 2008 |
As of December 31, 2009 | ||||||
| Real estate investments, net |
$ | 2,108,532 | $ | 3,178,527 | $ | 3,147,249 | |||
| Cash and cash equivalents |
124,848 | 91,240 | 33,544 | ||||||
| Other assets |
997,998 | 893,419 | 702,486 | ||||||
| Total assets |
$ | 3,231,378 | $ | 4,163,186 | $ | 3,883,279 | |||
| Mortgage notes payable |
$ | 1,436,248 | $ | 2,469,993 | $ | 2,337,758 | |||
| Other liabilities |
1,181,333 | 1,052,138 | 1,012,294 | ||||||
| Total liabilities |
2,617,581 | 3,522,131 | 3,350,052 | ||||||
| Total AFR or the Borrower’s stockholders’ equity |
606,417 | 638,343 | 532,032 | ||||||
| Noncontrolling interest |
7,380 | 2,712 | 1,195 | ||||||
| Total equity |
613,797 | 641,055 | 533,227 | ||||||
| Total liabilities and equity |
$ | 3,231,378 | $ | 4,163,186 | $ | 3,883,279 | |||
| AFR Pre-Acquisition (1) |
Borrower Post-Acquisition (2) |
Combined Borrower and AFR (3) |
Borrower Post-Acquisition (2) |
|||||||||||||||||
| Income Statement | Year Ended 12/31/2007 |
Three Months Ended March 31, 2008 |
Nine Months Ended December 31, 2008 |
Year Ended December 31, 2008 |
Year Ended December 31, 2009 |
|||||||||||||||
| Total revenues |
$ | 372,900 | $ | 94,399 | $ | 325,364 | $ | 419,763 | $ | 439,045 | ||||||||||
| Total operating expenses |
(217,629 | ) | (56,311 | ) | (141,595 | ) | (197,906 | ) | (215,178 | ) | ||||||||||
| Interest and other income |
11,728 | 2,272 | 3,250 | 5,522 | 3,521 | |||||||||||||||
| Depreciation and amortization |
(119,556 | ) | (30,189 | ) | (69,062 | ) | (99,251 | ) | (110,648 | ) | ||||||||||
| Interest expense |
(128,423 | ) | (30,353 | ) | (119,954 | ) | (150,307 | ) | (126,671 | ) | ||||||||||
| Gain on sale of properties |
782 | — | — | — | — | |||||||||||||||
| Equity in loss from joint venture |
(2,878 | ) | (542 | ) | (2,092 | ) | (2,634 | ) | (2,637 | ) | ||||||||||
| Discontinued operations |
32,391 | 10,024 | (73 | ) | 9,951 | (2,657 | ) | |||||||||||||
| Net loss |
(50,685 | ) | (10,700 | ) | (4,162 | ) | (14,862 | ) | (15,225 | ) | ||||||||||
| Less: Net loss (income) attributable to the noncontrolling interest |
1,174 | 1,220 | (382 | ) | 838 | (287 | ) | |||||||||||||
| Net (loss) income attributable to AFR or the Borrower |
$ | (49,511 | ) | $ | (9,480 | ) | (4,544 | ) | $ | (14,024 | ) | $ | (15,512 | ) | ||||||
(1) Represents the historical summary financial information of AFR.
(2) Represents the summarized consolidated financial information of the Borrower.
(3) Represents the combined summarized financial information of AFR and the Borrower and is presented for informational purposes only. The combined summarized financial information is not directly comparable to financial information of the Borrower as the AFR financial information does not include closing adjustments associated with Gramercy’s acquisition of AFR. The combined summarized financial information is not necessarily indicative of the actual results that would have been achieved had Gramercy acquired AFR prior to January 1, 2008.
F-32
Table of Contents
KBS REAL ESTATE INVESTMENT TRUST, INC.
NOTES TO CONSOLIDATED FINANCIAL STATEMENTS (CONTINUED)
December 31, 2009
On March 9, 2010, the Borrower exercised its option to extend the maturity of this loan to March 2011. On March 15, 2010, Gramercy issued a press release stating that the Gramercy Realty portfolio, which is the division of Gramercy that contains the Borrower, will experience significant rollover, rent step-downs and capital requirements during the next 12 months. As a result, the Gramercy Realty portfolio is expected to generate negative cash flow during the extended term of the GKK Mezzanine Loan. In addition, Gramercy noted in the press release that it has retained EdgeRock Realty Advisors, LLC, an FTI Company, to assist in evaluating strategic alternatives and the potential restructuring of Gramercy Realty’s mortgage and mezzanine debt. The Company will continue to monitor the performance of the Gramercy Realty portfolio and the performance of the Borrower under the terms of the GKK Mezzanine Loan. While the Company believes it is unlikely that it will be repaid its principal upon maturity of this loan, the Company expects to extend the maturity of the loan for a period of time sufficient for Gramercy Realty to stabilize its portfolio.
| 6. | REAL ESTATE SECURITIES |
At December 31, 2009, the Company held two investments in real estate securities classified as available-for-sale: commercial mortgage-backed securities (“CMBS”) that accrued interest at a coupon rate of one-month LIBOR plus 2.30% with a contractual maturity of November 2011 and an original purchase price of $17.7 million (“Floating Rate CMBS”) and securities backed by CMBS that accrue interest at a coupon rate of 4.5% with a contractual maturity of December 2017 and an original purchase price of $44.2 million (“Fixed Rate Securities”). The Company’s investments in real estate securities are held at fair value and reviewed for impairment on a quarterly basis. See Note 2, “Summary of Significant Accounting Policies.”
From acquisition through March 31, 2009, the Company had recognized through earnings other-than-temporary impairments of $18.2 million and $37.0 million on the Floating Rate CMBS and Fixed Rate Securities, respectively.
Beginning April 1, 2009, the Company is required to distinguish between other-than-temporary impairments related to credit and other-than-temporary impairments related to other factors (e.g., market fluctuations) on its real estate securities that it does not intend to sell and where it is not more likely than not that the Company will be required to sell the security prior to the anticipated recovery of its amortized cost basis. On April 1, 2009, the Company determined the portion of the previously recorded other-than-temporary impairments that were not due to credit losses to be $14.8 million and recorded this amount as an adjustment to retained earnings, accumulated other comprehensive income and the amortized cost basis of the securities as of April 1, 2009. The entire adjustment of $14.8 million related to the Company’s investment in the Fixed Rate Securities; the Company determined that the entire other-than-temporary impairment previously recorded for the Floating Rate CMBS was credit-related.
As of December 31, 2009, the Company determined the fair value of the Fixed Rate Securities to be $12.9 million, resulting in unrealized losses of $9.8 million for the year ended December 31, 2009. The unrealized loss on the Fixed Rate Securities as of December 31, 2009 was not determined to be other-than-temporary because the Company did not experience an adverse change to its cash flow estimates for the securities and the Company believes it has the intent and ability to hold the securities for a period of time sufficient to allow for recovery of the amortized cost basis. As of December 31, 2009, the Company’s Floating Rate CMBS had a fair value of $0. The fair value of the Floating Rate CMBS is consistent with its December 31, 2008 value, resulting in no unrealized gain or loss for the year ended December 31, 2009.
During the year ended December 31, 2009, the Company recognized other-than-temporary impairments on its real estate securities of $5.1 million, all of which were recognized prior to April 1, 2009. As discussed above, on April 1, 2009, through its cumulative transition adjustment related to the adoption of a new accounting principle, the Company effectively reversed $14.8 million of cumulative non-credit related other-than-temporary impairment charges from retained earnings and recorded the amounts as unrealized losses within accumulated other comprehensive loss in the consolidated balance sheet. It is difficult to predict the timing or magnitude of these other-than-temporary impairments and significant judgments are required in determining impairments, including, but not limited to, assumptions regarding estimated prepayments, losses and changes in interest rates. As a result, actual realized losses could materially differ from these estimates.
F-33
Table of Contents
KBS REAL ESTATE INVESTMENT TRUST, INC.
NOTES TO CONSOLIDATED FINANCIAL STATEMENTS (CONTINUED)
December 31, 2009
The following summarizes the activity related to real estate securities for the year ended December 31, 2009 (in thousands):
| Amortized Cost Basis |
Unrealized Loss |
Total | ||||||||||
| Real estate securities - December 31, 2008 |
$ | 13,420 | $ | — | $ | 13,420 | ||||||
| Recognition of other-than-temporary impairment |
(5,067 | ) | — | (5,067 | ) | |||||||
| Cumulative transition adjustment from adoption of new accounting principle |
14,780 | — | 14,780 | |||||||||
| Change in unrealized loss |
— | (9,807 | ) | (9,807 | ) | |||||||
| Interest accretion on real estate securities |
(378 | ) | — | (378 | ) | |||||||
| Real estate securities - December 31, 2009 |
$ | 22,755 | $ | (9,807 | ) | $ | 12,948 | |||||
The following table presents the fair value and unrealized gains (losses) of the Company’s investments in real estate securities at December 31, 2009:
| Holding Period of Unrealized Gains (Losses) of Investments in Real Estate Securities (in thousands) |
||||||||||||||||||||
| Less than 12 Months | 12 Months or More | Total | ||||||||||||||||||
| Investment |
Fair Value |
Unrealized Gains (Losses) |
Fair Value |
Unrealized Gains (Losses) |
Fair Value |
Unrealized Gains (Losses) |
||||||||||||||
| Floating Rate CMBS |
$ | — | $ | — | $ | — | $ | — | $ | — | $ | — | ||||||||
| Fixed Rate Securities |
12,948 | (9,807 | ) | — | — | 12,948 | (9,807 | ) | ||||||||||||
| $ | 12,948 | $ | (9,807 | ) | $ | — | $ | — | $ | 12,948 | $ | (9,807 | ) | |||||||
F-34
Table of Contents
KBS REAL ESTATE INVESTMENT TRUST, INC.
NOTES TO CONSOLIDATED FINANCIAL STATEMENTS (CONTINUED)
December 31, 2009
| 7. | NOTES PAYABLE AND REPURCHASE AGREEMENTS |
As of December 31, 2009 and 2008, the Company’s notes payable, all of which are interest-only loans during the terms of the loans with principal payable upon maturity, consisted of the following (dollars in thousands):
| Principal as of December 31, 2009 |
Principal as of December 31, 2008 |
Contractual Interest Rate as of December 31, 2009 (1) |
Interest Rate as of December 31, 2009 (1) |
Maturity Date (2) | ||||||||
| Wholly Owned |
||||||||||||
| Sabal Pavilion Building - Mortgage Loan |
$ | 14,700 | $ | 14,700 | 6.38% | 6.38% | 08/01/2013 | |||||
| Plaza in Clayton - Mortgage Loan |
62,200 | 62,200 | 5.90% | 5.90% | 10/06/2016 | |||||||
| Crescent Green Building - Mortgage Loan |
32,400 | 32,400 | 5.68% | 5.68% | 02/01/2012 | |||||||
| 625 Second Street Building - Mortgage Loan |
33,700 | 33,700 | 5.85% | 5.85% | 02/01/2014 | |||||||
| Sabal VI Building - Mortgage Loan |
11,040 | 11,040 | 5.84% | 5.84% | 10/01/2011 | |||||||
| The Offices at Kensington - Mortgage Loan |
18,500 | 18,500 | 5.52% | 5.52% | 04/01/2014 | |||||||
| Royal Ridge Building - Mortgage Loan |
21,718 | 21,718 | 5.96% | 5.96% | 09/01/2013 | |||||||
| Plano Corporate Center I & II - Mortgage Loan |
30,591 | 30,591 | 5.90% | 5.90% | 09/01/2012 | |||||||
| 2200 West Loop South Building - Mortgage Loan |
17,426 | 17,426 | 5.89% | 5.89% | 10/01/2014 | |||||||
| ADP Plaza - Mortgage Loan |
20,900 | 20,900 | 5.56% | 5.56% | 10/01/2013 | |||||||
| Millennium I Building - Mortgage Loan (3) |
— | 28,228 | (3) | (3) | (3) | |||||||
| Tysons Dulles Plaza - Mortgage Loan |
76,375 | 76,375 | 5.90% | 5.90% | 03/10/2014 | |||||||
| Five Tower Bridge - Mortgage Loan (4) |
41,000 | 41,000 | One-month LIBOR + 2.40% | 4.69% | 10/14/2010 | |||||||
| Southpark Commerce Center II Buildings - Mortgage Loan |
18,000 | 18,000 | 5.67% | 5.67% | 12/06/2016 | |||||||
| 825 University Avenue Building - Mortgage Loan |
19,000 | 19,000 | 5.59% | 5.59% | 12/06/2013 | |||||||
| Midland Industrial Buildings - Mortgage Loan |
24,050 | 24,050 | 5.86% | 5.86% | 01/06/2011 | |||||||
| Bridgeway Technology Center - Mortgage Loan |
26,824 | 26,824 | 6.07% | 6.07% | 08/01/2013 | |||||||
| Cedar Bluffs - Mortgage Loan |
4,627 | 4,627 | 5.86% | 5.86% | 07/01/2011 | |||||||
| Portfolio Mortgage Loan #1 (5) |
102,500 | 102,500 | 5.30% | 5.30% | 05/01/2011 | |||||||
| Portfolio Mortgage Loan #2 (4) (5) |
158,717 | 158,717 | One-month LIBOR + 2.20% | 5.12% | 07/09/2012 | |||||||
| Portfolio Mortgage Loan #3 (4) (5) (6) |
45,700 | — | One-month LIBOR + 2.75% | 5.01% | 03/01/2012 | |||||||
| 779,968 | 762,496 | |||||||||||
| National Industrial Portfolio Joint Venture |
||||||||||||
| National Industrial Portfolio - Mortgage Loan (4) (7) |
300,000 | 300,000 | One-month LIBOR + 0.84% | 1.08% | 08/09/2010 | |||||||
| National Industrial Portfolio - Mezzanine Loan A (4) (7) |
40,200 | 40,200 | One-month LIBOR + 1.71% | 1.94% | 08/09/2010 | |||||||
| National Industrial Portfolio - Mezzanine Loan B (4) (7) |
32,300 | 32,300 | One-month LIBOR + 2.01% | 2.24% | 08/09/2010 | |||||||
| National Industrial Portfolio - Mezzanine Loan C (4) (7) |
32,300 | 32,300 | One-month LIBOR + 2.26% | 2.49% | 08/09/2010 | |||||||
| National Industrial Portfolio - Mezzanine Loan D (4) (7) |
26,200 | 26,200 | One-month LIBOR + 3.01% | 3.24% | 08/09/2010 | |||||||
| National Industrial Portfolio - Mezzanine Loan E (4) (7) |
6,478 | 4,150 | One-month LIBOR + 1.25% | 1.48% | 08/09/2010 | |||||||
| 437,478 | 435,150 | |||||||||||
| Total Notes Payable |
$ | 1,217,446 | $ | 1,197,646 | ||||||||
F-35
Table of Contents
KBS REAL ESTATE INVESTMENT TRUST, INC.
NOTES TO CONSOLIDATED FINANCIAL STATEMENTS (CONTINUED)
December 31, 2009
| Principal as of December 31, 2009 |
Principal as of December 31, 2008 |
Contractual Interest Rate as of December 31, 2009 (1) |
Interest Rate as of December 31, 2009 (1) |
Maturity Date (2) | ||||||||
| Repurchase Agreements |
||||||||||||
| GKK I - Mezzanine Loan - Repurchase Agreement (8) |
$ | 157,828 | $ | 164,979 | One-month LIBOR + 1.50% | 1.73% | 03/09/2011 | |||||
| GKK II - Mezzanine Loan - Repurchase Agreement (8) |
122,755 | 128,317 | One-month LIBOR + 1.50% | 1.73% | 03/09/2011 | |||||||
| Fixed Rate Securities - Repurchase Agreement (8) |
6,691 | 8,864 | One-week LIBOR + 1.00% | 1.22% | 08/14/2013 | |||||||
| Total Repurchase Agreements |
$ | 287,274 | $ | 302,160 | ||||||||
| Total Notes Payable and Repurchase Agreements |
$ | 1,504,720 | $ | 1,499,806 | ||||||||
(1) Contractual interest rate as of December 31, 2009 represents the interest rate in effect under the loan as of December 31, 2009. Interest rate as of December 31, 2009 is calculated as the actual interest rate in effect at December 31, 2009 (consisting of the contractual interest rate and the effect of contractual floor rates and interest rate caps, floors and swaps), using interest rate indices at December 31, 2009 where applicable.
(2) Represents the initial maturity date or the maturity date as extended as of December 31, 2009; subject to certain conditions, the maturity dates of certain loans may be extended beyond the date shown.
(3) On February 5, 2009, the Company repaid the principal and interest outstanding under this loan.
(4) The Company has entered into separate interest rate cap or swap agreements related to these loans. See Note 8, “Derivative Instruments.”
(5) Represents a single mortgage loan consisting of several co-borrowers. The individual deeds of trust and mortgages on the respective properties securing the loan are cross-defaulted and this in effect creates cross-collateralization of the properties.
(6) On February 5, 2009, the Company entered into a $54.0 million mortgage loan facility relating to four properties. As of December 31, 2009, $45.7 million had been disbursed to the Company.
(7) These loans are held through a consolidated joint venture. In the aggregate, the weighted-average interest rate of the mortgage and mezzanine loans is 125 basis points over one-month LIBOR. The terms of the loan agreements provide for the right to extend the loans for two additional successive one-year periods upon satisfaction of certain terms and conditions, including minimum debt service coverage requirements. The Company expects to fully utilize all extension options available to it under these loan agreements. Under the mortgage loan agreement, all of the properties in the National Industrial Portfolio create a single collateral pool. The individual deeds of trust and mortgages on the properties securing the loan are cross-defaulted and this in effect creates a cross-collateralization of the properties.
(8) See “—Repurchase Agreements.”
F-36
Table of Contents
KBS REAL ESTATE INVESTMENT TRUST, INC.
NOTES TO CONSOLIDATED FINANCIAL STATEMENTS (CONTINUED)
December 31, 2009
During the years ended December 31, 2009, 2008 and 2007, the Company incurred interest expense of $60.9 million, $68.3 million and $33.4 million, respectively. Of this amount, $4.0 million and $3.7 million were payable at December 31, 2009 and 2008, respectively. Included in interest expense was the amortization of deferred financing costs of $4.9 million, $7.9 million and $2.9 million for the years ended December 31, 2009, 2008 and 2007, respectively, and interest expense incurred as a result of the Company’s interest rate swap agreements of $5.9 million and $0.9 million for the years ended December 31, 2009 and 2008, respectively.
The following is a schedule of maturities for all notes payable and repurchase agreements outstanding as of December 31, 2009 (in thousands):
| Current Maturity | Fully Extended Maturity (1) | |||||||||||||||||
| Notes Payable | Repurchase Agreements | Total | Notes Payable | Repurchase Agreements | Total | |||||||||||||
| 2010 |
$ | 478,478 | $ | — | $ | 478,478 | $ | 41,000 | $ | — | $ | 41,000 | ||||||
| 2011 |
142,217 | 280,583 | 422,800 | 39,718 | 280,583 | 320,301 | ||||||||||||
| 2012 |
267,408 | — | 267,408 | 602,969 | — | 602,969 | ||||||||||||
| 2013 |
103,142 | 6,691 | 109,833 | 148,842 | — | 148,842 | ||||||||||||
| 2014 |
146,001 | — | 146,001 | 304,717 | 6,691 | 311,408 | ||||||||||||
| Thereafter |
80,200 | — | 80,200 | 80,200 | — | 80,200 | ||||||||||||
| $ | 1,217,446 | $ | 287,274 | $ | 1,504,720 | $ | 1,217,446 | $ | 287,274 | $ | 1,504,720 | |||||||
(1) Represents the maturities of all notes payable outstanding as of December 31, 2009 assuming the Company exercises all extension options available per the terms of the loan agreements. The Company can give no assurance that it will be able to satisfy the conditions to extend the terms of the loan agreements.
Repurchase Agreements
The repurchase agreement carrying values, the book value of the underlying collateral and the repurchase agreement counterparties as of December 31, 2009 are as follows (dollars in thousands):
| Collateral |
Balance Sheet Classification of Collateral |
Carrying Value of Repurchase Agreement |
Book Value of Underlying Collateral |
Maturity Date of Collateral |
Repurchase Agreement Counterparties | ||||||||
| GKK I - Mezzanine Loan |
Real estate loans receivable, net | $ | 157,828 | $ | 265,119 | 03/11/2010 | (1) | Goldman Sachs Mortgage Company | |||||
| GKK II - Mezzanine Loan |
Real estate loans receivable, net | 122,755 | 206,203 | 03/11/2010 | (1) | Citigroup Financial Products, Inc. | |||||||
| Fixed Rate Securities |
Real estate securities | 6,691 | 12,948 | 12/31/2017 | Deutsche Bank Securities, Inc. | ||||||||
| $ | 287,274 | $ | 484,270 | ||||||||||
(1) The Company is a guarantor of these repurchase agreements. Subsequent to December 31, 2009, the borrower under the Company’s investment in the GKK Mezzanine Loan exercised its extension option and extended the maturity date of the loan to March 2011. See Note 5, “Real Estate Loans Receivable – Concentration of Credit Risks” for more information on the Company’s investment in the GKK Mezzanine Loan.
F-37
Table of Contents
KBS REAL ESTATE INVESTMENT TRUST, INC.
NOTES TO CONSOLIDATED FINANCIAL STATEMENTS (CONTINUED)
December 31, 2009
| 8. | DERIVATIVE INSTRUMENTS |
The Company enters into derivative instruments for risk management purposes to hedge its exposure to cash flow variability caused by changing interest rates on its variable rate real estate loans receivable and notes payable. The primary goal of the Company’s risk management practices related to interest rate risk is to prevent changes in interest rates from adversely impacting the Company’s ability to achieve its investment return objectives. When the Company purchases or originates a variable rate debt instrument for investment, or obtains variable rate financing, it considers several factors in determining whether or not to use a derivative instrument to hedge the related interest rate risk. These factors include the Company’s return objectives, the expected life of the investment, the expected life of the financing instrument, interest rates, costs to purchase hedging instruments, the terms of the debt investment, the terms of the financing instrument, the overall interest rate risk exposure of the Company, and other factors.
The Company enters into interest rate caps to mitigate its exposure to rising interest rates on its variable rate notes payable. The Company also enters into interest rate floors to mitigate its exposure to decreasing interest rates on its variable rate loans receivable. The values of interest rate caps and floors are primarily impacted by interest rates, market expectations about interest rates, and the remaining life of the instrument. In general, increases in interest rates, or anticipated increases in interest rates, will increase the value of interest rate caps; conversely, decreases in interest rates, or anticipated decreases in interest rates, will generally increase the value of interest rate floors. As the remaining life of an interest rate cap or floor decreases, the value of the instrument will generally decrease towards zero.
The Company enters into interest rate swaps as a fixed rate payer to mitigate its exposure to rising interest rates on its variable rate notes payable. The value of interest rate swaps is primarily impacted by interest rates, market expectations about interest rates, and the remaining life of the instrument. In general, increases in interest rates, or anticipated increases in interest rates, will increase the value of the fixed rate payer position and decrease the value of the variable rate payer position. As the remaining life of the interest rate swap decreases, the value of both positions will generally move towards zero. All of the Company’s interest rate swaps are designated as cash flow hedges.
As of December 31, 2009, the Company holds five derivative instruments hedging notes payable with notional amounts totaling $656.7 million. As of December 31, 2009, the Company has a balance of $5.4 million of accumulated other comprehensive loss related to net unrealized losses on derivative instruments designated as cash flow hedges that it estimates it will reclassify to earnings during the next 12 months as the related hedged transactions occur.
The Company’s accounting policies for derivative instruments are also discussed above in Note 2, “Summary of Significant Accounting Policies — Derivative Instruments.”
F-38
Table of Contents
KBS REAL ESTATE INVESTMENT TRUST, INC.
NOTES TO CONSOLIDATED FINANCIAL STATEMENTS (CONTINUED)
December 31, 2009
The following table summarizes the notional and fair value of the Company’s derivative financial instruments as of December 31, 2009 and 2008. The notional value is an indication of the extent of the Company’s involvement in each instrument at that time, but does not represent exposure to credit, interest rate or market risks (dollars in thousands):
| Fair Value of Asset (Liability) |
|||||||||||||||||
| Notional Value |
Reference Rate |
Effective Date |
Maturity Date |
December 31, 2009 |
December 31, 2008 |
||||||||||||
| Derivatives designated as hedging instruments |
|||||||||||||||||
| Interest Rate Floor |
|||||||||||||||||
| Arden Portfolio M2-(B) Mezzanine Loan |
$ | 83,721 | One-month LIBOR at 4.50% |
01/30/2008 | 08/09/2009 | $ | — | $ | 1,925 | ||||||||
| Arden Portfolio M3-(A) Mezzanine Loan |
60,279 | One-month LIBOR at 4.50% |
01/30/2008 | 08/09/2009 | — | 1,386 | |||||||||||
| Artisan Multifamily Portfolio |
15,850 | One-month LIBOR at 4.50% |
03/09/2008 | 08/09/2009 | — | 368 | |||||||||||
| Interest Rate Swap |
|||||||||||||||||
| Portfolio Mortgage Loan #2 |
119,037 | One-month LIBOR/ Fixed at 3.82% |
07/11/2008 | 07/11/2012 | (5,580 | ) | (7,511 | ) | |||||||||
| Five Tower Bridge - Mortgage Loan |
41,000 | One-month LIBOR/ Fixed at 2.29% |
11/05/2008 | 10/14/2010 | (590 | ) | (843 | ) | |||||||||
| Portfolio Mortgage Loan #3 |
45,700 | One-month LIBOR/ Fixed at 2.26% |
02/05/2009 | 03/01/2013 | (444 | ) | — | ||||||||||
| Interest Rate Cap |
|||||||||||||||||
| National Industrial Portfolio #3 |
46,000 | One-month LIBOR at 2.50% |
08/15/2009 | 08/15/2011 | 105 | — | |||||||||||
| Total derivatives designated as hedging instruments |
$ | 411,587 | $ | (6,509 | ) | $ | (4,675 | ) | |||||||||
| Derivatives not designated as hedging instruments |
|||||||||||||||||
| Interest Rate Cap |
|||||||||||||||||
| National Industrial Portfolio #1 |
$ | 405,000 | One-month LIBOR at 5.75% |
08/08/2007 | 08/15/2010 | $ | — | $ | 8 | ||||||||
| National Industrial Portfolio #2 |
46,000 | One-month LIBOR at 6.00% |
08/08/2007 | 08/15/2009 | — | — | |||||||||||
| Total derivatives not designated as hedging instruments |
$ | 451,000 | $ | — | $ | 8 | |||||||||||
F-39
Table of Contents
KBS REAL ESTATE INVESTMENT TRUST, INC.
NOTES TO CONSOLIDATED FINANCIAL STATEMENTS (CONTINUED)
December 31, 2009
The following table summarizes the location of the Company’s derivative financial instruments in the accompanying consolidated balance sheets as of December 31, 2009 and 2008 (in thousands):
| Asset Derivatives |
Liability Derivatives |
|||||||||||||||||
| December 31, 2009 | December 31, 2008 | December 31, 2009 | December 31, 2008 | |||||||||||||||
| Balance Sheet Location |
Fair Value |
Fair Value |
Balance Sheet |
Fair Value |
Fair Value |
|||||||||||||
| Derivatives designated as hedging instruments |
||||||||||||||||||
| Interest rate floors |
Deferred financing costs, prepaid expenses and other assets | $ | — | $ | 3,679 | Other liabilities | $ | — | $ | — | ||||||||
| Interest rate swaps |
Deferred financing costs, prepaid expenses and other assets | — | — | Other liabilities | (6,614 | ) | (8,354 | ) | ||||||||||
| Interest rate caps |
Deferred financing costs, prepaid expenses and other assets | 105 | — | Other liabilities | — | — | ||||||||||||
| Total derivatives designated as hedging instruments |
$ | 105 | $ | 3,679 | $ | (6,614 | ) | $ | (8,354 | ) | ||||||||
| Derivatives not designated as hedging instruments |
||||||||||||||||||
| Interest rate caps |
Deferred financing costs, prepaid expenses and other assets | $ | — | $ | 8 | Other liabilities | $ | — | $ | — | ||||||||
| Total derivatives not designated as hedging instruments |
$ | — | $ | 8 | $ | — | $ | — | ||||||||||
The following tables summarize the location of the Company’s gains (losses) related to derivative financial instruments in the accompanying consolidated financial statements for the years ended December 31, 2009 and 2008 (in thousands):
| Derivatives in Cash Flow Hedging Relationships |
Amount of Gain (Loss) Recognized in Other Comprehensive Income on Derivatives (Effective Portion) |
Location of Gain (Loss) Comprehensive Income to Income (Effective Portion) |
Amount of Gain (Loss) Reclassified from Accumulated Other Comprehensive Income to Income (Effective Portion) |
Location of Gain (Loss) Portion and Amount Excluded from Effectiveness Testing) |
Gain (Loss) Recognized in Income on Derivatives (Ineffective Portion and Amount Excluded from Effectiveness Testing) | ||||||||||||||||||||
| Year Ended | Year Ended | Year Ended | |||||||||||||||||||||||
| December 31, | December 31, | December 31, | |||||||||||||||||||||||
| 2009 | 2008 | 2009 | 2008 | 2009 | 2008 | ||||||||||||||||||||
| Interest rate cap |
$ | (190 | ) | $ | (120 | ) | Interest expense | $ | (119 | ) | — | Gain (loss) on derivative instruments | $ | (6 | ) | — | |||||||||
| Interest rate floors |
(1,911 | ) | 1,911 | Interest income | 1,767 | 2,675 | Gain (loss) on derivative instruments | — | — | ||||||||||||||||
| Interest rate swaps |
1,741 | (8,354 | ) | Interest expense | (5,479 | ) | — | Gain (loss) on derivative instruments | — | — | |||||||||||||||
| Total |
$ | (360 | ) | $ | (6,563 | ) | $ | (3,831 | ) | $ | 2,675 | $ | (6 | ) | — | ||||||||||
| Amount of Loss Recognized in Income on Derivatives |
||||||||||||||
| Derivatives Not Designated as Hedging Instruments |
Location of Loss Recognized in Income on Derivatives |
Year Ended | ||||||||||||
| December 31, | ||||||||||||||
| 2009 | 2008 | 2007 | ||||||||||||
| Interest rate caps |
Loss on derivative instruments | $ | (8 | ) | $ | (303 | ) | $ | (1,524 | ) | ||||
| Total |
$ | (8 | ) | $ | (303 | ) | $ | (1,524 | ) | |||||
F-40
Table of Contents
KBS REAL ESTATE INVESTMENT TRUST, INC.
NOTES TO CONSOLIDATED FINANCIAL STATEMENTS (CONTINUED)
December 31, 2009
| 9. | FAIR VALUE OF FINANCIAL INSTRUMENTS |
The fair value for certain financial instruments is derived using a combination of market quotes, pricing models and valuation techniques that involve significant management judgment. The price transparency of financial instruments is a key determinant of the degree of judgment involved in determining the fair value of the Company’s financial instruments. Financial instruments for which actively quoted prices or pricing parameters are available and whose markets contain orderly transactions will generally have a higher degree of price transparency than financial instruments whose markets are inactive or consist of non-orderly trades. The Company evaluates several factors when determining if a market is inactive or when market transactions are not orderly. See Note 2, “Summary of Significant Accounting Policies.” The following is a summary of the methods and assumptions used by management in estimating the fair value of each class of financial instruments for which it is practicable to estimate the fair value:
Cash and cash equivalents, rent and other receivables, and accounts payable and accrued liabilities: These balances reasonably approximate their fair values due to the short maturities of these items.
Real estate loans receivable: These instruments are presented in the accompanying consolidated balance sheets at their amortized cost net of recorded loan loss reserves and not at fair value. The fair values of real estate loans receivable were estimated using an internal valuation model that considered the expected cash flows for the loans, underlying collateral values (for collateral-dependent loans) and estimated yield requirements of institutional investors for loans with similar characteristics, including remaining loan term, loan-to-value, type of collateral and other credit enhancements.
Investment in unconsolidated joint venture: This investment is presented in the accompanying consolidated balance sheets at acquisition-date fair value and not at current fair value. The fair value of the investment in the unconsolidated joint venture was estimated using an internal valuation model that considered the Company’s expected cash flows from the joint venture and estimated yield requirements of institutional investors for equity investments in real estate joint ventures with similar characteristics, including the capitalization of the joint venture, the operating performance of the joint venture’s real estate and the liquidation priority of the Company’s investment.
Real estate securities: These investments are classified as available-for-sale and are presented at fair value. As of December 31, 2009, the Company based its fair value measurements for the Fixed Rate Securities on quotes provided by the dealer of these securities. Since the market for these securities was determined to be inactive, the Company deemed the use of the dealer quotes as its point estimate of fair value to be appropriate by establishing a range of estimated fair values using various internal valuation techniques and concluding that the dealer quotes were within a reasonable range of fair values. The dealer utilizes a proprietary valuation model that contains unobservable inputs. The Company based its fair value measurements of the Floating Rate CMBS on an internal valuation model that considered expected cash flows from the underlying loans and yields required by market participants. As such, the Company classifies these inputs as Level 3 inputs.
Derivative instruments: These instruments are presented at fair value on the accompanying consolidated balance sheets. The valuation of these instruments is determined by a third-party expert using a proprietary model that utilizes observable inputs. As such, the Company classifies these inputs as Level 2 inputs. The proprietary model uses the contractual terms of the derivatives, including the period to maturity, as well as observable market-based inputs, including interest rate curves and volatility. The fair values of interest rate swaps, caps and floors are estimated using the market standard methodology of netting the discounted fixed cash payments and the discounted expected variable cash payments (receipts). The variable cash payments (receipts) are based on an expectation of interest rates (forward curves) derived from observable market interest rate curves. In addition, credit valuation adjustments, which consider the impact of any credit enhancements to the contracts, are incorporated in the fair values to account for potential nonperformance risk. The fair value of interest rate caps (floors) are determined using the market standard methodology of discounting the future expected cash payments (receipts) which would occur if variable interest rates rise above (below) the strike rate of the caps (floors). The variable interest rates used in the calculation of projected payments (receipts) on the cap (floor) are based on an expectation of future interest rates derived from observed market interest rate curves and volatilities.
F-41
Table of Contents
KBS REAL ESTATE INVESTMENT TRUST, INC.
NOTES TO CONSOLIDATED FINANCIAL STATEMENTS (CONTINUED)
December 31, 2009
Notes payable and repurchase agreements: The fair value of the Company’s notes payable and repurchase agreements is estimated using a discounted cash flow analysis based on management’s estimates of current market interest rates for instruments with similar characteristics, including remaining loan term, loan-to-value ratio, type of collateral and other credit enhancements.
The following are the carrying amounts and fair values of the Company’s financial instruments as of December 31, 2009 and 2008, whose carrying amounts do not approximate their fair value:
| December 31, 2009 (amounts in thousands) |
December 31, 2008 (amounts in thousands) | |||||||||||||||||
| Face Value |
Carrying Amount |
Fair Value |
Face Value |
Carrying Amount |
Fair Value | |||||||||||||
| Financial assets: |
||||||||||||||||||
| Real estate loans receivable (1) |
$ | 796,972 | $ | 665,776 | $ | 613,341 | $ | 1,073,295 | $ | 907,457 | $ | 861,407 | ||||||
| Investment in unconsolidated joint venture |
— | — | 23,214 | — | — | — | ||||||||||||
| Financial liabilities: |
||||||||||||||||||
| Notes payable and repurchase agreements |
$ | 1,504,720 | $ | 1,504,720 | $ | 1,327,611 | $ | 1,499,806 | $ | 1,499,806 | $ | 1,424,437 | ||||||
(1) Face value of real estate loans receivable is net of unfunded commitments. Carrying amount of real estate loans receivable includes loan loss reserves.
Disclosure of the fair value of financial instruments is based on pertinent information available to the Company at December 31, 2009 and requires a significant amount of judgment. Despite increased capital market and credit market activity, transaction volume for certain financial instruments remains relatively low. This has made the estimation of fair values difficult and, therefore, actual results could be materially different from the Company’s estimate of value.
At December 31, 2009, the Company held the following financial instruments measured at fair value (in thousands):
| Fair Value Measurements Using | ||||||||||||||
| Total | Quoted Prices in Active Markets for Identical Assets (Level 1) |
Significant Other Observable Inputs (Level 2) |
Significant Unobservable Inputs (Level 3) | |||||||||||
| Recurring Basis: |
||||||||||||||
| Real estate securities |
$ | 12,948 | $ | — | $ | — | $ | 12,948 | ||||||
| Asset derivatives |
105 | — | 105 | — | ||||||||||
| Nonrecurring Basis: |
||||||||||||||
| Investment in unconsolidated joint venture (1) |
— | — | — | — | ||||||||||
| Investment in real estate acquired through foreclosure |
40,750 | — | — | 40,750 | ||||||||||
| Impaired real estate loans receivable |
17,360 | — | — | 17,360 | ||||||||||
| Total Assets |
$ | 71,163 | $ | — | $ | 105 | $ | 71,058 | ||||||
| Recurring Basis: |
||||||||||||||
| Liability derivatives |
$ | (6,614 | ) | $ | — | $ | (6,614 | ) | $ | — | ||||
| Total Liabilities |
$ | (6,614 | ) | $ | — | $ | (6,614 | ) | $ | — | ||||
( 1) This investment was measured at fair value of $0 using significant unobservable inputs, and as a result, the fair value measurement is considered Level 3.
F-42
Table of Contents
KBS REAL ESTATE INVESTMENT TRUST, INC.
NOTES TO CONSOLIDATED FINANCIAL STATEMENTS (CONTINUED)
December 31, 2009
When the Company has a collateral-dependent loan that is identified as being impaired, it is evaluated for impairment by comparing the estimated fair value of the underlying collateral, less costs to sell, to the carrying value of the loan. Due to the nature of the properties collateralizing the Company’s impaired collateral-dependent loans as of December 31, 2009, the Company estimated the fair value of the collateral by using an internally developed valuation model that utilizes the income approach to valuing real estate. This approach requires the Company to make significant judgments with respect to capitalization rates, market rental rates, occupancy rates, and operating expenses that are considered Level 3 inputs.
When the Company has a loan that is identified as being impaired in connection with a troubled debt restructuring resulting from a concession being granted by the Company to the borrower through a modification of the loan terms, the loan is evaluated for impairment by comparing the carrying value of the loan to the present value of the modified cash flow stream discounted at the rate used to recognize interest income. This rate may not be indicative of a market rate and, therefore, the resulting present value may not be considered to be a fair value. Thus, such financial assets involved in troubled debt restructuring are not considered to be carried at fair value.
The table below presents a reconciliation of the beginning and ending balances of financial instruments of the Company having recurring fair value measurements based on significant unobservable inputs (Level 3) for the 12 months ended December 31, 2009 (in thousands):
| For the Year Ended December 31, 2009 |
||||
| Balance, December 31, 2008 |
$ | 13,420 | ||
| Other-than-temporary impairment |
(5,067 | ) | ||
| Cumulative transition adjustment (See Note 2) |
14,780 | |||
| Unrealized losses on real estate securities |
(9,807 | ) | ||
| Interest accretion real estate securities |
(378 | ) | ||
| Purchases, issuances and settlements |
— | |||
| Transfers in and/or (out) of Level 3 |
— | |||
| Balance, December 31, 2009 |
$ | 12,948 | ||
| Unrealized loss included in other comprehensive income (loss) |
$ | (9,807 | ) | |
| 10. | RELATED PARTY TRANSACTIONS |
The Company has entered into an Advisory Agreement with the Advisor that is in effect through November 8, 2010 and a Dealer Manager Agreement with the Dealer Manager. These agreements entitle the Advisor and the Dealer Manager to specified fees upon the provision of certain services with regard to the Offering, the investment of funds in real estate and real estate-related investments and the management of those investments, among other services, as well as reimbursement of organization and offering costs incurred by the Advisor, the Dealer Manager, and their affiliates on behalf of the Company (as discussed in Note 2, “Summary of Significant Accounting Policies”) and certain costs incurred by the Advisor in providing services to the Company. The Advisor and Dealer Manager also serve as the advisor and dealer manager, respectively, for KBS Real Estate Investment Trust II, Inc., KBS Real Estate Investment Trust III, Inc., KBS Strategic Opportunity REIT, Inc. and KBS Legacy Partners Apartment REIT, Inc. During the years ended December 31, 2009 and 2008, no transactions occurred between the Company and these other entities.
F-43
Table of Contents
KBS REAL ESTATE INVESTMENT TRUST, INC.
NOTES TO CONSOLIDATED FINANCIAL STATEMENTS (CONTINUED)
December 31, 2009
Pursuant to the terms of the Advisory Agreement and Dealer Management Agreement, summarized below are the related-party costs incurred by the Company for the years ended December 31, 2009, 2008 and 2007, respectively, and any related amounts payable as of December 31, 2009 and 2008 (in thousands):
| Incurred | Payable | ||||||||||||||
| 2009 | 2008 | 2007 | 2009 | 2008 | |||||||||||
| Expensed |
|||||||||||||||
| Asset management fees (1) |
$ | 22,108 | $ | 17,508 | $ | 5,095 | $ | 4,881 | $ | 2,844 | |||||
| Reimbursement of operating expenses |
292 | — | — | — | — | ||||||||||
| Additional Paid-in Capital |
|||||||||||||||
| Selling commissions |
1,494 | 48,979 | 41,434 | — | — | ||||||||||
| Dealer manager fees |
— | 30,100 | 25,527 | — | — | ||||||||||
| Reimbursable other offering costs |
79 | 2,918 | 4,338 | — | — | ||||||||||
| Capitalized |
|||||||||||||||
| Acquisition fees |
— | 9,686 | 10,318 | — | — | ||||||||||
| Advances from Advisor |
— | — | 700 | 1,600 | 1,600 | ||||||||||
| $ | 23,973 | $ | 109,191 | $ | 87,412 | $ | 6,481 | $ | 4,444 | ||||||
(1) See Note 2, “Summary of Significant Accounting Polices – Related Party Transactions – Asset Management Fee.”
Advances from Advisor and Joint Venture Performance Fees
Pursuant to the Advisory Agreement, the Advisor has agreed to advance funds to the Company equal to the amount by which the cumulative amount of distributions declared by the Company from January 1, 2006 through the period ending May 31, 2010 exceeds the amount of the Company’s Funds from Operations (as defined below) from January 1, 2006 through May 31, 2010. The Advisor agreed that the Company will only be obligated to reimburse the Advisor for these expenses if and to the extent that the Company’s cumulative Funds from Operations for the period commencing January 1, 2006 through the date of any such reimbursement exceed the lesser of (i) the cumulative amount of any distributions declared and payable to the Company’s stockholders as of the date of such reimbursement or (ii) an amount that is equal to a 7.0% cumulative, non-compounded, annual return on invested capital for the Company’s stockholders for the period from July 18, 2006 through the date of such reimbursement. No interest will accrue on the advance being made by the Advisor. No amounts have been advanced since January 2007. The Advisory Agreement defines Funds from Operations as funds from operations as defined by the National Association of Real Estate Investment Trusts plus (i) any acquisition expenses and acquisition fees expensed by the Company and that are related to any property, loan or other investment acquired or expected to be acquired by the Company and (ii) any non-operating noncash charges incurred by the Company, such as impairments of property or loans, any other than temporary impairments of real estate securities, or other similar charges.
F-44
Table of Contents
KBS REAL ESTATE INVESTMENT TRUST, INC.
NOTES TO CONSOLIDATED FINANCIAL STATEMENTS (CONTINUED)
December 31, 2009
Pursuant to the Advisory Agreement, the Advisor may also earn a performance fee related to the Company’s investment in the National Industrial Portfolio that would in effect make the Advisor’s cumulative fees related to the investment equal to 0.75% of the cost of the joint venture investment on an annualized basis from the date of the Company’s investment in the joint venture through the date of calculation. This fee is conditioned upon the amount of the Company’s Funds from Operations (as defined in the Advisory Agreement). As of December 31, 2009, the Company’s operations were sufficient to meet the Funds from Operations condition per the Advisory Agreement. As a result, as of December 31, 2009, the Company had accrued for incurred but unpaid performance fees of $4.9 million. Although these performance fees have been incurred as of December 31, 2009, the Advisory Agreement further provides that the payment of these fees shall only be made after the repayment of advances from the Advisor. As of December 31, 2009, $1.6 million of advances from the Advisor remain unpaid.
| 11. | CONSOLIDATED JOINT VENTURE AND NONCONTROLLING INTEREST |
The Company holds an 80% membership interest in a joint venture with New Leaf. The joint venture, referred to as the National Industrial Portfolio, owns 23 industrial properties and holds a master lease with a remaining term of 13.25 years with respect to another industrial property. Under the terms of the operating agreement for the joint venture, the Company and New Leaf may be required to make additional capital contributions to the joint venture to fund operating reserves or expenses approved in the budget or business plan. Generally, net income and distributions are allocated in proportion to the respective membership interests, subject to certain terms.
New Leaf is the manager of the joint venture; however, its authority is limited. It may not cause the joint venture to undertake activities or incur expenses with respect to the National Industrial Portfolio properties not authorized by the operating agreement, the approved budget or the approved business plan, except certain limited expenditures. New Leaf also may not cause the joint venture to make certain decisions without the Company’s consent, including any action that would reasonably be expected to have a substantial or material effect upon the joint venture, any of its subsidiaries or the National Industrial Portfolio properties.
The Company concluded that the joint venture meets the definition of a variable interest entity and it is the primary beneficiary of the joint venture. Therefore, the Company consolidates the joint venture in its financial statements and records the portion of the joint venture not owned by the Company as noncontrolling interest.
| 12. | SUPPLEMENTAL CASH FLOW DISCLOSURES |
Supplemental cash disclosures were as follows (in thousands):
| For the Year Ended December 31, | ||||||||||
| 2009 | 2008 | 2007 | ||||||||
| Supplemental Disclosure of Cash Flow Information: |
||||||||||
| Interest paid |
$ | 55,779 | $ | 60,760 | $ | 27,068 | ||||
| Supplemental Disclosure of Significant Noncash Transactions: |
||||||||||
| Investment in of real estate acquired through foreclosure |
$ | 40,750 | $ | — | $ | — | ||||
| (Decrease) increase in distributions payable |
$ | (2,554 | ) | $ | 5,592 | $ | 4,953 | |||
| Distributions paid to common stockholders through common stock issuances pursuant to the dividend reinvestment plan |
$ | 58,235 | $ | 55,691 | $ | 15,228 | ||||
F-45
Table of Contents
KBS REAL ESTATE INVESTMENT TRUST, INC.
NOTES TO CONSOLIDATED FINANCIAL STATEMENTS (CONTINUED)
December 31, 2009
| 13. | SEGMENT INFORMATION |
The Company presently operates in two business segments based on its investment types: real estate and real estate-related. Under the real estate segment, the Company has invested primarily in office and industrial properties located throughout the United States. Under the real estate-related segment, the Company has invested in and originated mortgage loans, mezzanine loans and other real estate-related assets, including mortgage-backed securities and preferred membership interest investments. All revenues earned from the Company’s two operating segments were from external customers and there were no intersegment sales or transfers. The Company does not allocate corporate-level accounts to its operating segments. Corporate-level accounts include corporate general and administrative expenses, non-operating interest income and other corporate-level expenses. The accounting policies of the segments are consistent with those described in Note 2, “Summary of Significant Accounting Policies.”
The Company evaluates the performance of its segments based upon net operating income (“NOI”), which is a non-GAAP supplemental financial measure. The Company defines NOI for its real estate segment as operating revenues (rental income, tenant reimbursements and other operating income) less property and related expenses (property operating expenses, real estate taxes, insurance, asset management fees and provision for bad debt) less interest expense. The Company defines NOI for its real estate-related segment as interest income and income from unconsolidated joint venture less loan servicing costs, asset management fees and interest expense. NOI excludes certain items that are not considered to be controllable in connection with the management of an asset such as non-property income and expenses, depreciation and amortization, and corporate general and administrative expenses. The Company uses NOI to evaluate the operating performance of the Company’s real estate and real estate-related investments and to make decisions about resource allocations. The Company believes that net income is the GAAP measure that is most directly comparable to NOI; however, NOI should not be considered as an alternative to net income as the primary indicator of operating performance as it excludes the items described above. Additionally, NOI as defined above may not be comparable to other REITs or companies as their definitions of NOI may differ from the Company’s definition.
F-46
Table of Contents
KBS REAL ESTATE INVESTMENT TRUST, INC.
NOTES TO CONSOLIDATED FINANCIAL STATEMENTS (CONTINUED)
December 31, 2009
The following tables summarize total revenues and NOI for each reportable segment for the years ended December 31, 2009, 2008 and 2007, and total assets and total liabilities for each reportable segment as of December 31, 2009 and 2008 (in thousands):
| Years Ended December 31, | |||||||||
| 2009 | 2008 | 2007 | |||||||
| Revenues: |
|||||||||
| Real estate segment |
$ | 221,163 | $ | 199,700 | $ | 80,885 | |||
| Real estate-related segment |
59,668 | 78,556 | 15,420 | ||||||
| Total segment revenues |
280,831 | 278,256 | 96,305 | ||||||
| Corporate-level |
— | 50 | 2 | ||||||
| Total Revenues |
$ | 280,831 | $ | 278,306 | $ | 96,307 | |||
| Interest Expense: |
|||||||||
| Real estate segment |
$ | 55,389 | $ | 62,838 | $ | 32,992 | |||
| Real estate-related segment |
5,542 | 5,465 | 376 | ||||||
| Total interest expense |
$ | 60,931 | $ | 68,303 | $ | 33,368 | |||
| NOI: |
|||||||||
| Real estate segment |
$ | 75,333 | $ | 60,262 | $ | 21,747 | |||
| Real estate-related segment |
50,367 | 68,542 | 12,853 | ||||||
| Total NOI |
$ | 125,700 | $ | 128,804 | $ | 34,600 | |||
| December 31, | |||||||||
| 2009 | 2008 | ||||||||
| Assets: (1) |
|||||||||
| Real estate segment |
$ | 1,920,947 | $ | 1,981,705 | |||||
| Real estate-related segment |
682,048 | 937,815 | |||||||
| Total segment assets |
2,602,995 | 2,919,520 | |||||||
| Corporate-level (2) |
37,016 | 9,030 | |||||||
| Total assets |
$ | 2,640,011 | $ | 2,928,550 | |||||
| Liabilities: |
|||||||||
| Real estate segment |
$ | 1,292,721 | $ | 1,289,732 | |||||
| Real estate-related segment |
287,758 | 302,610 | |||||||
| Total segment liabilities |
1,580,479 | 1,592,342 | |||||||
| Corporate-level (3) |
10,171 | 13,109 | |||||||
| Total liabilities |
$ | 1,590,650 | $ | 1,605,451 | |||||
(1) The Company had $24.3 million and $13.7 million in additions to long-lived assets in the real estate segment during the years ended December 31, 2009 and 2008, respectively. There are no long-lived assets in the real estate-related segment.
(2) Total corporate-level assets consisted primarily of cash and cash equivalents of approximately $36.9 million and $8.7 million as of December 31, 2009 and 2008, respectively.
(3) As of December 31, 2009 and 2008, corporate-level liabilities consisted primarily of amounts due to affiliates, accruals for legal and accounting fees and distributions payable.
F-47
Table of Contents
KBS REAL ESTATE INVESTMENT TRUST, INC.
NOTES TO CONSOLIDATED FINANCIAL STATEMENTS (CONTINUED)
December 31, 2009
The following table reconciles the Company’s net loss to its NOI for the years ended December 31, 2009, 2008 and 2007 (amounts in thousands):
| Years ended December 31, | ||||||||||||
| 2009 | 2008 | 2007 | ||||||||||
| Net loss |
$ | (186,335 | ) | $ | (123,832 | ) | $ | (9,971 | ) | |||
| Other interest income |
(208 | ) | (4,335 | ) | (3,995 | ) | ||||||
| Gain (loss) on derivative instruments |
8 | 303 | 1,524 | |||||||||
| General and administrative expenses |
8,044 | 5,568 | 4,126 | |||||||||
| Depreciation and amortization |
120,311 | 97,021 | 42,916 | |||||||||
| Provision for loan losses |
178,813 | 104,000 | — | |||||||||
| Other-than-temporary impairments of real estate securities |
5,067 | 50,079 | — | |||||||||
| NOI |
$ | 125,700 | $ | 128,804 | $ | 34,600 | ||||||
| 14. | QUARTERLY RESULTS (UNAUDITED) |
Presented below is a summary of the unaudited quarterly financial information for the years ended December 31, 2009 and 2008 (in thousands, except per share amounts):
| 2009 | |||||||||||||||
| First Quarter | Second Quarter | Third Quarter | Fourth Quarter | ||||||||||||
| Revenues |
$ | 79,872 | $ | 72,245 | $ | 66,635 | $ | 62,079 | |||||||
| Net income (loss) attributable to common stockholders |
$ | (1,851 | ) | $ | (170,770 | ) | $ | 3,595 | $ | (13,940 | ) | ||||
| Income (loss) per common share, basic and diluted |
$ | (0.01 | ) | $ | (0.96 | ) | $ | 0.02 | $ | (0.08 | ) | ||||
| Distributions declared per common share (1) |
$ | 0.172 | $ | 0.175 | $ | 0.132 | $ | 0.133 | |||||||
| 2008 | |||||||||||||||
| First Quarter | Second Quarter | Third Quarter | Fourth Quarter | ||||||||||||
| Revenues |
$ | 57,015 | $ | 62,651 | $ | 78,609 | $ | 80,031 | |||||||
| Net income (loss) attributable to common stockholders |
$ | 2,188 | $ | 1,774 | $ | 13,788 | $ | (138,377 | ) | ||||||
| Income (loss) per common share, basic and diluted |
$ | 0.02 | $ | 0.01 | $ | 0.08 | $ | (0.78 | ) | ||||||
| Distributions declared per common share (1) |
$ | 0.175 | $ | 0.175 | $ | 0.176 | $ | 0.176 | |||||||
(1) Distributions declared per common share assumes the share was issued and outstanding each day during the respective quarterly period from January 1, 2008 through December 31, 2009. Each day during the period from January 1, 2008 through December 31, 2009 was a record date for distributions. Distributions were calculated at a rate of $0.0019178 per share per day from January 1, 2008 through June 30, 2009 and at a rate of $0.00143836 per share per day from July 1, 2009 through December 31, 2009.
F-48
Table of Contents
KBS REAL ESTATE INVESTMENT TRUST, INC.
NOTES TO CONSOLIDATED FINANCIAL STATEMENTS (CONTINUED)
December 31, 2009
| 15. | COMMITMENTS AND CONTINGENCIES |
Economic Dependency
The Company is dependent on the Advisor for certain services that are essential to the Company, including the management of the Company’s real estate and real estate-related investment portfolio; the disposition of real estate and real estate-related investments; and other general and administrative responsibilities. In the event that the Advisor is unable to provide these services, the Company will be required to obtain such services from other sources.
Concentration of Credit Risk
The Company owns a significant number of mezzanine loans that as of December 31, 2009 comprised 24% of the Company’s total assets and 81% of the Company’s total investments in loans receivable, before loan loss reserves. During the year ended December 31, 2009, the Company’s investments in mezzanine loans provided 16% of the Company’s revenues and 83% of the Company’s interest income.
Mezzanine loans are secured by a pledge of the ownership interests of an entity that directly or indirectly owns real property and involve a higher degree of risk, including refinance risk and maturity risk, than a senior mortgage loan with a first priority lien. In general, if the Company has a first priority lien on the collateral securing a loan and the borrower fails to make all required payments or is unable to repay its loans at maturity, the Company may agree to extend the loan at similar terms, modify the terms of the loan, or foreclose on the collateral. If the Company forecloses on the collateral, it may either operate the property, resulting in the Company receiving any cash flows generated by the property or the Company paying any cash shortfalls related to the property, or sell the property for whatever amount it can obtain, which may or may not be equal to the loan balance prior to foreclosure. In general, if the Company owns a mezzanine loan and the borrower fails to make all required payments or is unable to repay its loan at maturity, the Company may have more restrictions and fewer options regarding the resolution of its investment. In certain circumstances, the senior lenders, in conjunction with the Company, may be willing to grant the borrower extensions or may grant extensions in exchange for more favorable terms (such as higher interest rates, a partial payoff, the entitlement to a portion of a junior lender’s interest income, etc.). In the event of a default, the Company, as the mezzanine lender, may foreclose on the ownership interests of the borrower and take legal title to the property subject to the existing senior loans. The Company could then operate the property on its own behalf. In the event that the senior loans have matured or have gone into default concurrently with the Company’s foreclosure, the Company could attempt to negotiate an extension or modification with the senior lenders as the new borrower; however, if the senior lenders were not willing to extend or modify the loans and the Company was not able to repay the senior loans, or if the property did not and was not expected to have sufficient cash flow to cover the debt service on the senior loans, the Company would most likely relinquish its interests or rights in the investment to the holders of the senior loans. In addition, losses realized by mezzanine lenders may be greater than losses realized by senior lenders as the rights of mezzanine lenders are subordinate to those of senior lenders. For example, if a property was liquidated by a group of lenders consisting of a senior lender and a mezzanine lender, the proceeds of the liquidation would be applied to the senior lender’s loan balance first with any remaining proceeds going to the mezzanine lender.
F-49
Table of Contents
KBS REAL ESTATE INVESTMENT TRUST, INC.
NOTES TO CONSOLIDATED FINANCIAL STATEMENTS (CONTINUED)
December 31, 2009
The GKK Mezzanine Loan represents a significant investment to the Company that as of December 31, 2009 comprised 18% of the Company’s total assets and 71% of the Company’s total investments in loans receivable, after loan loss reserves. During the year ended December 31, 2009, the GKK Mezzanine Loan provided 10% of the Company’s revenues and 49% of the Company’s interest income. On March 9, 2010, the Borrower exercised its option to extend the maturity of this loan to March 2011. On March 15, 2010, Gramercy issued a press release stating that the Gramercy Realty portfolio, which is the division of Gramercy that contains the Borrower, will experience significant rollover, rent step-downs and capital requirements during the next 12 months. As a result, the Gramercy Realty portfolio is expected to generate negative cash flow during the extended term of the GKK Mezzanine Loan. In addition, Gramercy noted in the press release that it has retained EdgeRock Realty Advisors, LLC, an FTI Company, to assist in evaluating strategic alternatives and the potential restructuring of Gramercy Realty’s mortgage and mezzanine debt. The Company will continue to monitor the performance of the Gramercy Realty portfolio and the performance of the Borrower under the terms of the GKK Mezzanine Loan. While the Company believes it is unlikely that it will be repaid its principal upon maturity of this loan, the Company expects to extend the maturity of the loan for a period of time sufficient for Gramercy Realty to stabilize its portfolio. The cash flows provided by the properties securing the GKK Mezzanine Loan are currently sufficient to cover the borrower’s debt service obligations; however, the interest rate under the GKK Mezzanine Loan is variable and will fluctuate based on changes in LIBOR. If the cash flows provided by the properties were to decrease to the extent that these cash flows were no longer sufficient to cover debt service obligations, the borrower might rely on its sponsors to fund any debt service shortfalls. In the event the borrower’s sponsors were unable or unwilling to do so, the borrower might default on the loan. Under such a scenario, the most junior lender could foreclose on the ownership interests of the properties and either operate the properties and pay the debt service on the remaining loans, or, if the values were sufficient, sell the properties and repay the remaining loans. If the most junior lender were to default, the Company could foreclose on the membership interests of the properties and assume the more senior loans. Under such a scenario, the Company could decide to operate the properties and pay the debt service, or, if the values were sufficient, sell the properties and repay the remaining loans. The Company may not have the ability or willingness to operate the properties or assume the liabilities related to the properties. The GKK Mezzanine Loan is subordinate to secured senior loans in the aggregate principal amount of $1.8 billion at December 31, 2009.
The GKK Mezzanine Loan is security for two repurchase agreements totaling $280.6 million as of December 31, 2009. These repurchase agreements mature on March 9, 2011. The Company is a guarantor of these repurchase agreements. Upon maturity of the repurchase agreements, the subsidiaries of the Company that are the borrowers under the repurchase agreements (collectively, “KBS GKK”) would be required to repay these amounts, refinance the balance or renegotiate the terms of the repurchase agreements. While the Company expects to extend the terms of the GKK Mezzanine Loan at maturity, there is no guarantee that KBS GKK will be able to repay or refinance the amounts outstanding under the repurchase agreements or renegotiate the terms of the repurchase agreements. KBS GKK may be required to cure any default under the repurchase agreements by repaying the amounts outstanding under the repurchase agreements and/or relinquishing to the lenders under the repurchase agreements any of the assets securing the repurchase agreements. In addition, KBS GKK may be required to pledge or cause the Company, as guarantor, to pledge additional collateral for the repurchase agreements. Should KBS GKK default under the repurchase agreements, the Company, as guarantor of the repurchase agreements, would be obligated to cure such default. Under the terms of the guaranty, the guarantor’s liability is primary and the guarantor would be required to cure any such default by repaying the amounts outstanding under the repurchase agreements.
Environmental
As an owner of real estate, the Company is subject to various environmental laws of federal, state and local governments. Compliance with existing environmental laws is not expected to have a material adverse effect on the Company’s financial condition and results of operations as of December 31, 2009.
Legal Matters
From time to time, the Company is party to legal proceedings that arise in the ordinary course of its business. Management is not aware of any legal proceedings of which the outcome is reasonably likely to have a material adverse effect on its results of operations or financial condition.
F-50
Table of Contents
KBS REAL ESTATE INVESTMENT TRUST, INC.
NOTES TO CONSOLIDATED FINANCIAL STATEMENTS (CONTINUED)
December 31, 2009
| 16. | SUBSEQUENT EVENTS |
The Company evaluates subsequent events up until the date the consolidated financial statements are issued.
Distributions Paid
On January 15, 2010, the Company paid distributions of $8.0 million, which related to distributions declared for each day in the period from December 1, 2009 through December 31, 2009. On February 12, 2010, the Company paid distributions of $8.0 million, which related to distributions declared for each day in the period from January 1, 2010 through January 31, 2010, and on March 15, 2010, the Company paid distributions of $7.3 million, which related to distributions declared for each day in the period from February 1, 2010 through February 28, 2010.
Distributions Declared
On January 15, 2010, the Company’s board of directors declared distributions based on daily record dates for the period from February 1, 2010 through February 28, 2010, which the Company paid on March 15, 2010, and distributions based on daily record dates for the period from March 1, 2010 through March 31, 2010, which the Company expects to pay in April 2010. On March 19, 2010, the Company’s board of directors declared distributions based on daily record dates for the period from April 1, 2010 through April 30, 2010, which the Company expects to pay in May 2010, and distributions based on daily record dates for the period from May 1, 2010 through May 31, 2010, which the Company expects to pay in June 2010. Investors may choose to receive cash distributions or purchase additional shares through the Company’s dividend reinvestment plan.
Distributions for these periods will be calculated based on stockholders of record each day during these periods at a rate of $0.00143836 per share per day and equal a daily amount that, if paid each day for a 365-day period, would equal a 5.25% annualized rate based on a purchase price of $10.00 per share or a 7.32% annualized rate based on shares purchased under the Company’s dividend reinvestment plan at the current estimated value per share of $7.17. The Advisor has agreed to advance funds to the Company equal to the amount by which the cumulative amount of distributions declared by the Company from January 1, 2006 through the period ending May 31, 2010 exceeds the amount of the Company’s funds from operations (as defined by the Company’s advisory agreement) from January 1, 2006 through May 31, 2010, see Note 10, “Related Party Transactions.”
Millennium I Building Revolving Loan
On February 12, 2010, the Company, through an indirect wholly owned subsidiary, completed the secured financing of the Millennium I Building. The Company obtained a three-year revolving loan from a financial institution in the amount of $29.5 million at a floating interest rate equal to 375 basis points over one-month LIBOR. The loan matures on March 1, 2013.
F-51
Table of Contents
KBS REAL ESTATE INVESTMENT TRUST, INC.
SCHEDULE II
VALUATION AND QUALIFYING ACCOUNTS
(in thousands)
| Description |
Balance at Beginning of Year |
Additions Charged Against Operations |
Uncollectible Accounts Written-off |
Balance at End of Year | |||||||||
| Year Ended December 31, 2009 |
|||||||||||||
| Allowance for doubtful accounts |
$ | 760 | $ | 2,430 | $ | (635 | ) | $ | 2,555 | ||||
| Reserve for loan losses |
104,000 | 178,634 | (172,156 | ) | 110,478 | ||||||||
| Year Ended December 31, 2008 |
|||||||||||||
| Allowance for doubtful accounts |
$ | 234 | $ | 531 | $ | (5 | ) | $ | 760 | ||||
| Reserve for loan losses |
— | 104,000 | — | 104,000 | |||||||||
| Year Ended December 31, 2007 |
|||||||||||||
| Allowance for doubtful accounts |
$ | 14 | $ | 220 | $ | — | $ | 234 | |||||
F-52
Table of Contents
KBS REAL ESTATE INVESTMENT TRUST, INC.
SCHEDULE III
REAL ESTATE ASSETS AND ACCUMULATED DEPRECIATION AND AMORTIZATION
December 31, 2009
(dollar amounts in thousands)
| Initial Cost to Company | Costs Capitalized |
Gross Amount at which Carried at Close of Period |
Accumulated Depreciation |
Original | ||||||||||||||||||||||||||||||||
| Description |
Location | Ownership Percent |
Encumbrances | Land | Building and Improvements (1) |
Total | Subsequent to Acquisition |
Land | Building and Improvements (1) |
Total (2) | and Amortization |
Date of Construction |
Date Acquired | |||||||||||||||||||||||
| Sabal Pavilion Building |
Tampa, FL | 100 | % | $ | 14,700 | $ | 3,245 | $ | 22,455 | $ | 25,700 | $ | 773 | $ | 3,245 | $ | 19,312 | $ | 22,557 | $ | 1,730 | 1998 | 07/07/2006 | |||||||||||||
| Plaza in Clayton |
Saint Louis, MO | 100 | % | 62,200 | 2,793 | 91,162 | 93,955 | 7,336 | 2,793 | 91,474 | 94,267 | 10,593 | 2001 | 09/27/2006 | ||||||||||||||||||||||
| Southpark Commerce Center II Buildings |
Austin, TX | 100 | % | 18,000 | 3,100 | 26,904 | 30,004 | 763 | 3,100 | 26,035 | 29,135 | 3,447 | 2000 | 11/21/2006 | ||||||||||||||||||||||
| 825 University Avenue Building |
Norwood, MA | 100 | % | 19,000 | 4,165 | 27,087 | 31,252 | 20 | 4,165 | 27,103 | 31,268 | 3,998 | 2004/2006 | 12/05/2006 | ||||||||||||||||||||||
| Midland Industrial Buildings |
McDonough, GA | 100 | % | 24,050 | 5,040 | 30,504 | 35,544 | — | 5,040 | 30,578 | 35,618 | 3,278 | 2000 | 12/22/2006 | ||||||||||||||||||||||
| Crescent Green Buildings |
Cary, NC | 100 | % | 32,400 | 6,200 | 42,508 | 48,708 | 268 | 6,200 | 41,607 | 47,807 | 5,569 | 1996/1997/1998 | 01/31/2007 | ||||||||||||||||||||||
| 625 Second Street Building |
San Francisco, CA | 100 | % | 33,700 | 8,400 | 43,430 | 51,830 | 1,189 | 8,400 | 40,972 | 49,372 | 3,027 | 1906/1999 | 01/31/2007 | ||||||||||||||||||||||
| Sabal VI Building |
Tampa, FL | 100 | % | 11,040 | 2,600 | 14,917 | 17,517 | 424 | 2,600 | 15,029 | 17,629 | 1,724 | 1988 | 03/05/2007 | ||||||||||||||||||||||
| The Offices at Kensington |
Sugar Land, TX | 100 | % | 18,500 | 1,575 | 27,161 | 28,736 | 1,247 | 1,575 | 27,632 | 29,207 | 2,799 | 1998 | 03/29/2007 | ||||||||||||||||||||||
| Royal Ridge Building |
Alpharetta, GA | 100 | % | 21,718 | 3,500 | 33,166 | 36,666 | 275 | 3,500 | 30,318 | 33,818 | 3,814 | 2001 | 06/21/2007 | ||||||||||||||||||||||
| 9815 Goethe Road Building |
Sacramento, CA | 100 | % | — | 2,043 | 15,180 | 17,223 | — | 2,043 | 15,199 | 17,242 | 1,912 | 1992 | 06/26/2007 | ||||||||||||||||||||||
| Bridgeway Technology Center |
Newark, CA | 100 | % | 26,824 | 11,299 | 34,705 | 46,004 | 89 | 11,299 | 34,497 | 45,796 | 4,923 | 1996 | 06/27/2007 | ||||||||||||||||||||||
| Opus National Industrial Portfolio |
Various | 100 | % | 69,277 | 18,455 | 110,149 | 128,604 | 319 | 18,455 | 109,155 | 127,610 | 10,759 | Various | 07/25/2007 | ||||||||||||||||||||||
| National Industrial Portfolio |
Various | 80 | % | 437,478 | 71,468 | 452,255 | 523,723 | 7,232 | 71,180 | 417,326 | 488,506 | 47,778 | Various | 08/08/2007 | ||||||||||||||||||||||
| Plano Corporate Center I & II |
Plano, TX | 100 | % | 30,591 | 5,344 | 45,273 | 50,617 | 2,489 | 5,344 | 47,308 | 52,652 | 5,570 | 1999/2001 | 08/28/2007 | ||||||||||||||||||||||
| 2200 West Loop South Building |
Houston, TX | 100 | % | 17,426 | 7,446 | 31,015 | 38,461 | 1,844 | 7,446 | 32,372 | 39,818 | 3,525 | 1974/2000 | 09/05/2007 | ||||||||||||||||||||||
| ADP Plaza |
Portland, OR | 100 | % | 20,900 | 5,100 | 28,755 | 33,855 | 878 | 5,100 | 27,370 | 32,470 | 2,218 | 1981 | 11/07/2007 | ||||||||||||||||||||||
| Woodfield Preserve Office Center |
Schaumburg, IL | 100 | % | 80,000 | 7,001 | 121,603 | 128,604 | 2,223 | 7,001 | 117,349 | 124,350 | 13,062 | 2001 | 11/13/2007 | ||||||||||||||||||||||
| Nashville Flex Portfolio |
Nashville, TN | 100 | % | 29,728 | 8,350 | 46,441 | 54,791 | 1,205 | 8,350 | 45,265 | 53,615 | 4,814 | Various | 11/15/2007 | ||||||||||||||||||||||
| Patrick Henry Corporate Center |
Newport News, VA | 100 | % | 10,175 | 5,050 | 13,900 | 18,950 | 863 | 5,050 | 13,624 | 18,674 | 1,318 | 1989 | 11/29/2007 | ||||||||||||||||||||||
| South Towne Corporate Center I and II |
Sandy, UT | 100 | % | 22,500 | 4,600 | 45,921 | 50,521 | 1,675 | 4,600 | 45,732 | 50,332 | 3,632 | 1999/2006 | 11/30/2007 | ||||||||||||||||||||||
| Rivertech I and II |
Billerica, MA | 100 | % | 25,025 | 3,931 | 42,111 | 46,042 | — | 3,931 | 42,130 | 46,061 | 3,809 | 1983/2001,2007 | 02/20/2008 | ||||||||||||||||||||||
| Suwanee Pointe |
Suwanee, GA | 100 | % | 9,790 | 2,030 | 16,185 | 18,215 | — | 2,030 | 16,185 | 18,215 | 1,244 | 2008 | 05/22/2008 | ||||||||||||||||||||||
| Millennium I Building |
Addison, TX | 100 | % | — | 3,350 | 71,657 | 75,007 | 2,439 | 3,350 | 73,360 | 76,710 | 7,129 | 2000 | 06/05/2008 | ||||||||||||||||||||||
| Tysons Dulles Plaza |
McLean, VA | 100 | % | 76,375 | 38,839 | 121,210 | 160,049 | 2,226 | 38,839 | 122,198 | 161,037 | 10,187 | 1986-1990 | 06/06/2008 | ||||||||||||||||||||||
| Great Oaks Center |
Alpharetta, GA | 100 | % | 19,349 | 7,743 | 28,330 | 36,073 | 20 | 7,743 | 28,160 | 35,903 | 1,909 | 1999 | 07/18/2008 | ||||||||||||||||||||||
| University Park Buildings |
Sacramento, CA | 100 | % | 10,123 | 4,520 | 22,029 | 26,549 | 428 | 4,520 | 22,346 | 26,866 | 1,934 | 1981 | 07/31/2008 | ||||||||||||||||||||||
| Meridian Tower |
Tulsa, OK | 100 | % | 7,626 | 2,050 | 16,728 | 18,778 | 890 | 2,050 | 16,986 | 19,036 | 1,804 | 1982 | 08/18/2008 | ||||||||||||||||||||||
| North Creek Parkway Center |
Bothell, WA | 100 | % | 18,634 | 11,200 | 30,755 | 41,955 | 1,246 | 11,200 | 30,952 | 42,152 | 3,061 | 1986-1987 | 08/28/2008 | ||||||||||||||||||||||
| Five Tower Bridge Building |
West Conshohocken, PA | 100 | % | 41,000 | 10,477 | 65,689 | 76,166 | 2,528 | 10,477 | 66,423 | 76,900 | 4,203 | 2001 | 10/14/2008 | ||||||||||||||||||||||
| City Gate Plaza |
Sacramento, CA | 100 | % | 9,317 | 2,880 | 18,895 | 21,775 | 6 | 2,880 | 18,386 | 21,266 | 1,108 | 1988-1990 | 11/25/2008 | ||||||||||||||||||||||
| 18301 Von Karman Building (3) |
Irvine, CA | 100 | % | — | 3,514 | 35,926 | 39,440 | 56 | 3,514 | 35,521 | 39,035 | 443 | 1989 | 10/06/2009 | ||||||||||||||||||||||
| TOTAL | $ | 1,217,446 | $ | 277,308 | $ | 1,774,006 | $ | 2,051,314 | $ | 40,951 | $ | 277,020 | $ | 1,727,904 | $ | 2,004,924 | $ | 176,321 | ||||||||||||||||||
(1) Building and improvements include tenant origination and absorption costs.
(2) The aggregate cost of real estate for federal income tax purposes was $2.1 billion.
(3) The Company received a deed in lieu of foreclosure and gained control of the property on October 6, 2009.
F-53
Table of Contents
KBS REAL ESTATE INVESTMENT TRUST, INC.
SCHEDULE III
REAL ESTATE ASSETS AND ACCUMULATED DEPRECIATION AND AMORTIZATION (CONTINUED)
December 31, 2009
(dollar amounts in thousands)
| 2009 | 2008 | 2007 | |||||||||
| Real Estate: |
|||||||||||
| Balance at the beginning of the year |
$ | 2,007,576 | $ | 1,495,007 | $ | 216,604 | |||||
| Acquisitions (1) |
39,440 | 520,609 | 1,274,810 | ||||||||
| Improvements |
21,218 | 13,410 | 3,593 | ||||||||
| Write-off of fully depreciated and fully amortized assets |
(63,310 | ) | (21,450 | ) | — | ||||||
| Sales |
— | — | — | ||||||||
| Balance at the end of the year |
$ | 2,004,924 | $ | 2,007,576 | $ | 1,495,007 | |||||
| Accumulated depreciation: |
|||||||||||
| Balance at the beginning of the year |
$ | 120,685 | $ | 45,444 | $ | 2,538 | |||||
| Depreciation expense |
118,946 | 96,691 | 42,906 | ||||||||
| Write-off of fully depreciated and fully amortized assets |
(63,310 | ) | (21,450 | ) | — | ||||||
| Sales |
— | — | — | ||||||||
| Balance at the end of the year |
$ | 176,321 | $ | 120,685 | $ | 45,444 | |||||
(1) Acquisition in 2009 relates to the 18301 Von Karman Building, which the Company received in satisfaction of its investment in the 18301 Von Karman Loans on October 6, 2009.
F-54
Table of Contents
SIGNATURES
Pursuant to the requirements of Section 13 or 15(d) of the Securities Exchange Act of 1934, the registrant has duly caused this report to be signed on its behalf by the undersigned, thereunto duly authorized, in the City of Newport Beach, State of California, on March 23, 2010.
| KBS REAL ESTATE INVESTMENT TRUST, INC. | ||
| By: | /S/ CHARLES J. SCHREIBER, JR. | |
| Charles J. Schreiber, Jr. | ||
| Chairman of the Board, Chief Executive Officer and Director | ||
Pursuant to the requirements of the Securities Exchange Act of 1934, this report has been signed below by the following persons on behalf of the registrant and in the capacities and on the dates indicated:
| Name |
Title |
Date | ||
| /S/ CHARLES J. SCHREIBER, JR. Charles J. Schreiber, Jr. |
Chairman of the Board, Chief Executive Officer and Director |
March 23, 2010 | ||
| /S/ DAVID E. SNYDER | Chief Financial Officer | March 23, 2010 | ||
| David E. Snyder | ||||
| /S/ PETER MCMILLAN III Peter McMillan III |
Executive Vice President, Treasurer, Secretary and Director |
March 23, 2010 | ||
| /S/ STACIE K. YAMANE | Chief Accounting Officer | March 23, 2010 | ||
| Stacie K. Yamane | ||||
| /S/ HANK ADLER | Director | March 23, 2010 | ||
| Hank Adler | ||||
| /S/ BARBARA R. CAMBON | Director | March 23, 2010 | ||
| Barbara R. Cambon | ||||
| /S/ STUART A. GABRIEL, PH.D. | Director | March 23, 2010 | ||
| Stuart A. Gabriel, Ph.D. | ||||