Attached files
| file | filename |
|---|---|
| EX-32.1 - EX-32.1 - Zumiez Inc | zumz-ex321_8.htm |
| EX-31.2 - EX-31.2 - Zumiez Inc | zumz-ex312_9.htm |
| EX-31.1 - EX-31.1 - Zumiez Inc | zumz-ex311_10.htm |
| EX-23.1 - EX-23.1 - Zumiez Inc | zumz-ex231_11.htm |
| EX-21.1 - EX-21.1 - Zumiez Inc | zumz-ex211_12.htm |
UNITED STATES
SECURITIES AND EXCHANGE COMMISSION
Washington, D.C. 20549
FORM 10-K
|
☒ |
ANNUAL REPORT PURSUANT TO SECTION 13 OR 15(d) OF THE SECURITIES EXCHANGE ACT OF 1934 |
For the fiscal year ended: January 28, 2017
OR
|
☐ |
TRANSITION REPORT PURSUANT TO SECTION 13 OR 15(d) OF THE SECURITIES EXCHANGE ACT OF 1934 |
Commission File Number: 000-51300
ZUMIEZ INC.
(Exact name of Registrant as specified in its charter)
|
Washington |
91-1040022 |
|
(State or other jurisdiction of |
(IRS Employer |
|
incorporation or organization) |
Identification No.) |
|
|
|
|
4001 204th Street SW |
|
|
Lynnwood, Washington |
98036 |
|
(Address of principal executive offices) |
(Zip Code) |
(425) 551-1500
(Registrant’s telephone number, including area code)
Securities registered pursuant to Section 12(b) of the Act: Common Stock
Name of each exchange on which registered: The Nasdaq Global Select Market
Securities registered pursuant to Section 12(g) of the Act: None
Indicate by check mark if the registrant is a well-known seasoned issuer, as defined in Rule 405 of the Securities Act. Yes ☐ No ☒
Indicate by check mark if the registrant is not required to file reports pursuant to Section 13 or Section 15(d) of the Act. Yes ☐ No ☒
Indicate by check mark whether the registrant (1) has filed all reports required to be filed by Section 13 or 15 (d) of the Securities Exchange Act of 1934 during the preceding 12 months (or for such shorter period that the Registrant was required to file such reports), and (2) has been subject to such filing requirements for the last 90 days. Yes ☒ No ☐
Indicate by check mark whether the registrant has submitted electronically and posted on its corporate Web site, if any, every Interactive Data File required to be submitted and posted pursuant to Rule 405 of Regulation S-T (§232.405 of this chapter) during the preceding 12 months (or for such shorter period that the Registrant was required to submit and post such files). Yes ☒ No ☐
Indicate by check mark if disclosure of delinquent filers pursuant to Item 405 of Regulation S-K (§229.405 of this chapter) is not contained herein, and will not be contained, to the best of registrant’s knowledge, in definitive proxy or information statements incorporated by reference in Part III of this Form 10-K or any amendment to this Form 10-K. ☐
Indicate by check mark whether the registrant is a large accelerated filer, an accelerated filer, a non-accelerated filer, or a smaller reporting company. See the definitions of “large accelerated filer,” “accelerated filer” and “smaller reporting company” in Rule 12b-2 of the Exchange Act.
|
Large accelerated filer |
☐ |
Accelerated filer |
☒ |
|
|
|
|
|
|
Non-accelerated filer |
☐ |
Smaller reporting company |
☐ |
Indicate by check mark if the registrant is a shell company (as defined in Rule 12b-2 of the Exchange Act). Yes ☐ No ☒
The aggregate market value of the voting and non-voting stock held by non-affiliates of the registrant as of the last business day of the second fiscal quarter, July 30, 2016, was $299,590,875. At March 7, 2017, there were 24,943,341 shares outstanding of common stock.
DOCUMENTS INCORPORATED BY REFERENCE
The information required by Part III of this report is incorporated by reference from the Registrant’s definitive proxy statement, relating to the Annual Meeting of Shareholders scheduled to be held May 31, 2017, which definitive proxy statement will be filed not later than 120 days after the end of the fiscal year to which this report relates.
FORM 10-K
TABLE OF CONTENTS
|
|
|
|
|
|
|
|
|
|
|
|
|
Item 1. |
|
|
3 |
|
|
Item 1A. |
|
|
11 |
|
|
Item 1B. |
|
|
20 |
|
|
Item 2. |
|
|
20 |
|
|
Item 3. |
|
|
20 |
|
|
Item 4. |
|
|
20 |
|
|
|
|
|
|
|
|
|
|
|
|
|
|
|
|
|
|
|
|
Item 5. |
|
|
21 |
|
|
Item 6. |
|
|
24 |
|
|
Item 7. |
|
Management’s Discussion and Analysis of Financial Condition and Results of Operations |
|
26 |
|
Item 7A. |
|
|
38 |
|
|
Item 8. |
|
|
39 |
|
|
Item 9. |
|
Changes in and Disagreements with Accountants on Accounting and Financial Disclosure |
|
39 |
|
Item 9A. |
|
|
39 |
|
|
Item 9B. |
|
|
42 |
|
|
|
|
|
|
|
|
|
|
|
|
|
|
|
|
|
|
|
|
Item 10. |
|
|
43 |
|
|
Item 11. |
|
|
43 |
|
|
Item 12. |
|
Security Ownership of Certain Beneficial Owners and Management and Related Shareholder Matters |
|
43 |
|
Item 13. |
|
Certain Relationships and Related Transactions, and Director Independence |
|
43 |
|
Item 14. |
|
|
43 |
|
|
|
|
|
|
|
|
|
|
|
|
|
|
|
|
|
|
|
|
Item 15. |
|
|
44 |
|
|
|
69 |
|||
FORM 10-K
This Form 10-K contains forward-looking statements. These statements relate to our expectations for future events and future financial performance. Generally, the words “anticipates,” “expects,” “intends,” “may,” “should,” “plans,” “believes,” “predicts,” “potential,” “continue” and similar expressions identify forward-looking statements. Forward-looking statements involve risks and uncertainties, and future events and circumstances could differ significantly from those anticipated in the forward-looking statements. These statements are only predictions. Actual events or results may differ materially. Factors which could affect our financial results are described in Item 1A below and in Item 7 of Part II of this Form 10-K. Readers are cautioned not to place undue reliance on these forward-looking statements, which speak only as of the date hereof. Although we believe that the expectations reflected in the forward-looking statements are reasonable, we cannot guarantee future results, levels of activity, performance or achievements. Moreover, neither we nor any other person assume responsibility for the accuracy and completeness of the forward-looking statements. We undertake no duty to update any of the forward-looking statements after the date of this report to conform such statements to actual results or to changes in our expectations.
We use a fiscal calendar widely used by the retail industry that results in a fiscal year consisting of a 52- or 53-week period ending on the Saturday closest to January 31. Each fiscal year consists of four 13-week quarters, with an extra week added to the fourth quarter every five or six years. Fiscal 2017 will be the 53 week period ending February 3, 2018. Fiscal 2016 was the 52 week period ending January 28, 2017. Fiscal 2015 was the 52 week period ending January 30, 2016. Fiscal 2014 was the 52-week period ending January 31, 2015. Fiscal 2013 was the 52-week period ending February 1, 2014. Fiscal 2012 was the 53-week period ending February 2, 2013.
“Zumiez,” the “Company,” “we,” “us,” “its,” “our” and similar references refer to Zumiez Inc. and its wholly-owned subsidiaries.
Zumiez Inc., including its wholly-owned subsidiaries, is a leading specialty retailer of apparel, footwear, accessories and hardgoods for young men and women who want to express their individuality through the fashion, music, art and culture of action sports, streetwear, and other unique lifestyles. Zumiez Inc. was formed in August 1978 and is a Washington State corporation.
At January 28, 2017, we operated 685 stores; 603 in the United States (“U.S.”), 48 in Canada, 29 in Europe and 5 in Australia. We operate under the names Zumiez, Blue Tomato and Fast Times. Additionally, we operate ecommerce websites at www.zumiez.com, www.blue-tomato.com and www.fasttimes.com.au.
We acquired Snowboard Dachstein Tauern GmbH and Blue Tomato Graz Handel GmbH (collectively, “Blue Tomato”) during fiscal 2012. Blue Tomato is one of the leading European specialty retailers of apparel, footwear, accessories and hardgoods. We acquired Fast Times Skateboarding (“Fast Times”) during fiscal 2016. Fast Times is an Australian specialty retailer of skateboards, hardware, apparel and footwear.
We employ a sales strategy that integrates our stores with our ecommerce platform. There is significant interaction between our store sales and our ecommerce sales channels and we believe that they are utilized in tandem to serve our customers. Our selling platforms bring the look and feel of an independent specialty shop through a distinctive store environment and high-energy sales personnel. We seek to staff our stores with store associates who are knowledgeable users of our products, which we believe provides our customers with enhanced customer service and supplements our ability to identify and react quickly to emerging trends and fashions. We design our selling platforms to appeal to teenagers and young adults and to serve as a destination for our customers. We believe that our distinctive selling platforms concepts and compelling economics will provide continued opportunities for growth in both new and existing markets.
3
We believe that our customers desire authentic merchandise and fashion that is rooted in the fashion, music, art and culture of action sports, streetwear, and other unique lifestyles to express their individuality. We strive to keep our merchandising mix fresh by continuously introducing new brands, styles and categories of product. Our focus on a diverse collection of brands allows us to quickly adjust to changing fashion trends. We believe that our strategic mix of apparel, footwear, accessories and hardgoods, including skateboards, snowboards, bindings, components and other equipment, allows us to strengthen the potential of the brands we sell and helps to affirm our credibility with our customers. In addition, we supplement our merchandise mix with a select offering of private label apparel and products as a value proposition that we believe complements our overall merchandise selection.
Over our 38-year history, we have developed a corporate culture based on a passion for action sports, streetwear and other unique lifestyles. We have increased our store count from 444 as of the end of fiscal 2011 to 685 as of the end of fiscal 2016, representing a compound annual growth rate of 9.1%; increased net sales from $555.9 million in fiscal 2011 to $836.3 million in fiscal 2016, representing a compound annual growth rate of 8.5%; and been profitable in every fiscal year of our 38-year history.
Competitive Strengths
We believe that the following competitive strengths differentiate us from our competitors and are critical to our continuing success.
Attractive Lifestyle Retailing Concept. We target a large population of young men and women, many of whom we believe are attracted to action sports, streetwear, and other unique lifestyles and desire to express their personal independence and style through the apparel, footwear and accessories they wear and the equipment they use. We believe we have developed a brand image that our customers view as consistent with their attitudes, fashion tastes and identity that should allow us to benefit and differentiates us in our market.
Differentiated Merchandising Strategy. We have created a highly differentiated retailing concept by offering an extensive selection of current and relevant lifestyle brands encompassing apparel, footwear, accessories and hardgoods. The breadth of merchandise offered through our sales channels exceeds that offered by many of our competitors and includes some brands and products that are available only at our stores within many malls or shopping areas. Many of our customers desire to update their wardrobes and equipment as fashion trends evolve or the season dictates, providing us the opportunity to shift our merchandise selection seasonally. We believe that our ability to quickly recognize changing brand and style preferences and transition our merchandise offerings allows us to continually provide a compelling offering to our customers.
Deep-rooted Culture. We believe our culture and brand image enable us to successfully attract and retain high quality employees who are passionate and knowledgeable about the products we sell. We place great emphasis on customer service and satisfaction, and we have made this a defining feature of our corporate culture. To preserve our culture, we strive to promote from within and we provide our employees with the knowledge and tools to succeed through our comprehensive training programs and the empowerment to manage their stores to meet localized customer demand.
Distinctive Customer Experience. We strive to provide a convenient shopping environment that is appealing and clearly communicates our distinct brand image. We seek to integrate our store and digital shopping experiences to serve our customers whenever, wherever, and however they choose to engage with us. We seek to attract knowledgeable sale associates who identify with our brand and are able to offer superior customer service, advice and product expertise. We believe that our distinctive shopping experience enhances our image as a leading source for apparel and equipment for action sports, streetwear, and other unique lifestyles.
4
Disciplined Operating Philosophy. We have an experienced senior management team. Our management team has built a strong operating foundation based on sound retail principles that underlie our unique culture. Our philosophy emphasizes an integrated combination of results measurement, training and incentive programs, all designed to drive sales productivity to the individual store associate level. Our comprehensive training programs are designed to provide our employees with enhanced product knowledge, selling skills and operational expertise. We believe that our merchandising teams’ immersion in the lifestyles we represent, supplemented with feedback from our customers, store associates and omni-channel leadership, allows us to consistently identify and react to emerging fashion trends. We believe that this, combined with our inventory planning and allocation processes and systems, helps us better manage markdown and fashion risk.
High-Impact, Integrated Marketing Approach. We seek to build relationships with our customers through a multi-faceted marketing approach that is designed to integrate our brand images with the lifestyles we represent. Our marketing efforts focus on reaching our customers in their environment and feature extensive grassroots marketing events. Our marketing efforts also incorporate local sporting and music event promotions, advertising in magazines popular with our target market, interactive contest sponsorships that actively involve our customers with our brands and products and various social network channels. Events and activities such as these provide opportunities for our customers to develop a strong identity with our culture and brands. We believe that our immersion in the lifestyles we represent allows us to build credibility with our customers and gather valuable feedback on evolving customer preferences.
Growth Strategy
We intend to expand our presence as a leading specialty retailer of action sports, streetwear, and other unique lifestyles by:
Opening or Acquiring New Store Locations. We believe our brand has appeal that provides store expansion opportunities throughout the U.S., Canada, Europe and Australia. During the last three fiscal years, we have opened or acquired 146 new stores consisting of 33 stores in fiscal 2016, 57 stores in fiscal 2015 and 56 stores in fiscal 2014. We have successfully opened or acquired stores in diverse markets throughout the U.S. and internationally, which we believe demonstrates the portability and growth potential of our concepts. To take advantage of what we believe to be a compelling economic store model, we plan to open approximately 18 new stores in fiscal 2017, including stores in our existing markets and in new markets domestically and internationally. The number of anticipated store openings may increase or decrease due to market conditions and other factors.
Continuing to Generate Sales Growth through Existing Channels. We seek to maximize our comparable sales by continuing to integrate our store and on-line shopping experiences and offering our customers a broad and relevant selection of brands and products, including a unique customer experience both in store and on-line.
Enhancing our Brand Awareness through Continued Marketing and Promotion. We believe that a key component of our success is the brand exposure that we receive from our marketing events, promotions and activities that embody the unique lifestyles of our customers. These are designed to assist us in increasing brand awareness in our existing markets and expanding into new markets by strengthening our connection with our target customer base. We believe that our marketing efforts have also been successful in generating and promoting interest in our product offerings. In addition, we use our ecommerce presence to further increase our brand awareness. We plan to continue to expand our integrated marketing efforts by promoting more events and activities in our existing and new markets. We also benefit from branded vendors’ marketing.
Merchandising and Purchasing
Our goal is to be viewed by our customers as the definitive source of merchandise for their unique lifestyles across all channels in which we operate. We believe that the breadth of merchandise that we offer our customers, which includes apparel, footwear, accessories and hardgoods, exceeds that offered by many other specialty stores at a single location, and makes us a single-stop purchase destination for our target customers.
5
We seek to identify fashion trends as they develop and to respond in a timely manner with a relevant product assortment. We strive to keep our merchandising mix fresh by continuously introducing new brands or styles in response to the evolving desires of our customers. Our merchandise mix may vary by region, country, and season, reflecting the preferences and seasons in each market.
We believe that offering an extensive selection of current and relevant brands in sports, fashion, music, and art is integral to our overall success. No single third-party brand that we carry accounted for more than 7.3%, 7.2% and 6.9% of our net sales in fiscal 2016, 2015 and 2014. We believe that our strategic mix of apparel, footwear, accessories and hardgoods allows us to strengthen the potential of the brands we sell and affirms our credibility with our customers.
We believe that our ability to maintain an image consistent with the unique lifestyles of our customers is important to our key vendors. Given our scale and market position, we believe that many of our key vendors view us as an important retail partner. This position helps ensure our ability to procure a relevant product assortment and quickly respond to the changing fashion interests of our customers. Additionally, we believe we are presented with a greater variety of products and styles by some of our vendors, as well as certain specially designed items that we exclusively distribute. We supplement our merchandise assortment with a select offering of private label products across many of our product categories. Our private label products complement the branded products we sell, and some of our private label brands allow us to cater to the more value-oriented customer. For fiscal 2016, 2015 and 2014, our private label merchandise represented 20.2%, 21.0% and 19.9% of our net sales.
We have developed a disciplined approach to buying and a dynamic inventory planning and allocation process to support our merchandise strategy. We utilize a broad vendor base that allows us to shift our merchandise purchases as required to react quickly to changing consumer demands and market conditions. We manage the purchasing and allocation process by reviewing branded merchandise lines from new and existing vendors, identifying emerging fashion trends and selecting branded merchandise styles in quantities, colors and sizes to meet inventory levels established by management. We also coordinate inventory levels in connection with individual stores’ sales strength, our promotions and seasonality.
Our merchandising staff remains in tune with the fashion, music, art and culture of action sports, streetwear, and other unique lifestyles by participating in action sports, attending relevant events and concerts, watching related programming and reading relevant publications and social network channels. In order to identify evolving trends and fashion preferences, our staff spends considerable time analyzing sales data, gathering feedback from our stores and customers, shopping in key markets and soliciting input from our vendors.
We source our private label merchandise from primarily foreign manufacturers around the world. We have cultivated our private label sources with a view towards high quality merchandise, production reliability and consistency of fit. We believe that our knowledge of fabric and production costs combined with a flexible sourcing base enables us to source high-quality private label goods at favorable costs.
6
Store Locations. At January 28, 2017, we operated 685 stores in the following locations:
|
United States and Puerto Rico - 603 Stores |
||||||||||
|
Alabama |
4 |
|
Indiana |
10 |
|
Nebraska |
2 |
|
Rhode Island |
2 |
|
Alaska |
3 |
|
Iowa |
4 |
|
New Hampshire |
6 |
|
South Carolina |
4 |
|
Arizona |
13 |
|
Kansas |
3 |
|
New Jersey |
20 |
|
South Dakota |
2 |
|
Arkansas |
3 |
|
Kentucky |
4 |
|
New Mexico |
5 |
|
Tennessee |
9 |
|
California |
91 |
|
Louisiana |
6 |
|
New York |
33 |
|
Texas |
51 |
|
Colorado |
19 |
|
Maine |
3 |
|
Nevada |
9 |
|
Utah |
14 |
|
Connecticut |
9 |
|
Maryland |
11 |
|
North Carolina |
13 |
|
Vermont |
1 |
|
Delaware |
4 |
|
Massachusetts |
11 |
|
North Dakota |
3 |
|
Virginia |
15 |
|
Florida |
34 |
|
Michigan |
13 |
|
Ohio |
13 |
|
Washington |
25 |
|
Georgia |
12 |
|
Minnesota |
11 |
|
Oklahoma |
6 |
|
West Virginia |
2 |
|
Hawaii |
7 |
|
Mississippi |
2 |
|
Oregon |
13 |
|
Wisconsin |
14 |
|
Idaho |
6 |
|
Missouri |
7 |
|
Pennsylvania |
22 |
|
Wyoming |
2 |
|
Illinois |
18 |
|
Montana |
5 |
|
Puerto Rico |
4 |
|
|
|
|
|
|
|
|
|
|
|
|
|
|
|
|
Canada - 48 Stores |
||||||||||
|
Alberta |
7 |
|
New Brunswick |
1 |
|
Saskatoon |
2 |
|
|
|
|
British Columbia |
11 |
|
Nova Scotia |
2 |
|
|
|
|
|
|
|
Manitoba |
2 |
|
Ontario |
23 |
|
|
|
|
|
|
|
|
|
|
|
|
|
|
|
|
|
|
|
Europe - 29 Stores |
||||||||||
|
Austria |
12 |
|
|
|
|
|
|
|
|
|
|
Germany |
16 |
|
|
|
|
|
|
|
|
|
|
Switzerland |
1 |
|
|
|
|
|
|
|
|
|
|
|
|
|
|
|
|
|
|
|
|
|
|
Australia - 5 Stores |
||||||||||
|
Victoria |
5 |
|
|
|
|
|
|
|
|
|
The following table shows the number of stores (excluding temporary stores that we operate from time to time for special or seasonal events) opened, acquired and closed in each of our last three fiscal years:
|
Fiscal Year |
|
Stores Opened |
|
Stores Acquired |
|
Stores Closed |
|
Total Number of Stores End of Year |
|
2016 |
|
28 |
|
5 |
|
6 |
|
685 |
|
2015 |
|
57 |
|
— |
|
2 |
|
658 |
|
2014 |
|
56 |
|
— |
|
4 |
|
603 |
Store Design and Environment. We design our stores to create a distinctive and engaging shopping environment that we believe resonates with our customers. Our stores feature an industrial look, dense merchandise displays, lifestyle focused posters and signage and popular music, all of which are consistent with the look and feel of an independent specialty shop. Our stores are designed to encourage our customers to shop for longer periods of time, to interact with each other and our store associates and to visit our stores more frequently. Our stores are constructed and finished to allow us to efficiently shift merchandise displays throughout the year as the season dictates. At January 28, 2017, our stores averaged approximately 2,932 square feet. All references in this Annual Report on Form 10-K to square footage of our stores refers to gross square footage, including retail selling, storage and back-office space.
7
Expansion Opportunities and Site Selection. In selecting a location for a new store, we target high-traffic locations with suitable demographics and favorable lease terms. For mall locations, we seek locations near busy areas of the mall such as food courts, movie theaters, game stores and other popular teen and young adult retailers. We generally locate our stores in malls in which other teen and young adult-oriented retailers have performed well. We also focus on evaluating the market and mall-specific competitive environment for potential new store locations. We seek to diversify our store locations regionally and by caliber of mall.
Store Management, Operations and Training. We believe that our success is dependent in part on our ability to attract, train, retain and motivate qualified employees at all levels of our organization. We have developed a corporate culture that we believe empowers the individual store managers to make store-level business decisions and consistently rewards their success. We are committed to improving the skills and careers of our workforce and providing advancement opportunities for employees.
We believe we provide our managers with the knowledge and tools to succeed through our comprehensive training programs and the flexibility to manage their stores to meet customer demands. While general guidelines for our merchandise assortments, store layouts and in-store visuals are provided by our home offices, we give our managers substantial discretion to tailor their stores to the individual market and empower them to make store-level business decisions. We design group training programs for our managers to improve both operational expertise and supervisory skills.
Our store associates generally have an interest in the fashion, music, art and culture of the action sports lifestyle and are knowledgeable about our products. Through our training, evaluation and incentive programs, we seek to enhance the productivity of our store associates. These programs are designed to promote a competitive, yet fun, culture that is consistent with the unique lifestyles we seek to promote.
Marketing and Advertising
We seek to reach our target customer audience through a multi-faceted marketing approach that is designed to integrate our brand image with the lifestyles we represent. Our marketing efforts focus on reaching our customers in their environment, and feature extensive grassroots marketing events, which give our customers an opportunity to experience and participate in the lifestyles we offer. Our grassroots marketing events are built around the demographics of our customer base and offer an opportunity for our customers to develop a strong identity with our brands and culture.
We have a customer loyalty program, the Zumiez STASH, which allows members to earn points for purchases or performance of certain activities. The points can be redeemed for a broad range of rewards, including product and experiential rewards. Our marketing efforts also incorporate local sporting and music event promotions, advertising in magazines popular with our target market, interactive contest sponsorships that actively involve our customers with our brands and products, the Zumiez STASH, catalogs and various social network channels. We believe that our immersion in action sports, streetwear, and other unique lifestyles allows us to build credibility with our target audience and gather valuable feedback on evolving customer preferences.
Distribution and Fulfillment
Timely and efficient distribution of merchandise to our stores is an important component of our overall business strategy. Domestically, our distribution center is located in Corona, California. At this facility, merchandise is inspected, allocated to stores and distributed to our stores and customers. Each store is typically shipped merchandise five times a week, providing our stores with a steady flow of new merchandise. We utilize a localized fulfillment strategy in which we use our domestic store network to provide fulfillment services for the vast majority of customer purchases.
Internationally, we operate combined distribution and ecommerce fulfillment centers located in Graz, Austria and Melbourne, Australia respectively, that support our Blue Tomato ecommerce and store operations in Europe and our Fast Times ecommerce and store operations in Australia. We operate a distribution center located in Delta, British Columbia, Canada to distribute merchandise to our Canadian stores.
8
Management Information Systems
Our management information systems provide integration of store, on-line, merchandising, distribution, financial and human resources functions. The systems include applications related to point-of-sale, inventory management, supply chain, planning, sourcing, merchandising and financial reporting. We continue to invest in technology to align these systems with our business requirements and to support our continuing growth.
Competition
The teenage and young adult retail apparel, hardgoods, footwear and accessories industry is highly competitive. We compete with other retailers for vendors, customers, suitable store locations and qualified store associates, management personnel, on-line marketing content, social media engagement and ecommerce traffic. In the softgoods market, which includes apparel, footwear and accessories, we currently compete with other teenage and young adult focused retailers. In addition, in the softgoods market we compete with independent specialty shops, department stores, vendors that sell their products directly to the retail market, non-mall retailers and ecommerce retailers. In the hardgoods market, which includes skateboards, snowboards, bindings, components and other equipment, we compete directly or indirectly with the following categories of companies: other specialty retailers, such as local snowboard and skate shops; large-format sporting goods stores and chains, vendors who sell their products directly to the retail market and ecommerce retailers.
Competition in our sector is based on, among other things, merchandise offerings, store location, price and the ability to identify with the customer. We believe that our ability to compete favorably with many of our competitors is due to our differentiated merchandising strategy, compelling store environment and deep-rooted culture.
Seasonality
Historically, our operations have been seasonal, with the largest portion of net sales and net income occurring in the third and fourth fiscal quarters, reflecting increased demand during the back-to-school and winter holiday selling seasons. During fiscal 2016, approximately 58% of our net sales and all of our net income occurred in the third and fourth quarters combined. As a result of this seasonality, any factors negatively affecting us during the last half of the year, including unfavorable economic conditions, adverse weather or our ability to acquire seasonal merchandise inventory, could have a material adverse effect on our financial condition and results of operations for the entire year. Our quarterly results of operations may also fluctuate based upon such factors as the timing of certain holiday seasons, the popularity of seasonal merchandise offered, the timing and amount of markdowns, competitive influences and the number and timing of new store openings, remodels and closings.
Trademarks
The “Zumiez”, “Blue Tomato” and “Fast Times” trademarks and certain other trademarks, have been registered, or are the subject of pending trademark applications, with the U.S. Patent and Trademark Office and with the registries of certain foreign countries. We regard our trademarks as valuable and intend to maintain such marks and any related registrations and vigorously protect our trademarks. We also own numerous domain names, which have been registered with the Corporation for Assigned Names and Numbers.
Employees
At January 28, 2017, we employed approximately 2,400 full-time and approximately 4,900 part-time employees globally. However, the number of part-time employees fluctuates depending on our seasonal needs and generally increases during peak selling seasons, particularly the back-to-school and the winter holiday seasons. None of our employees are represented by a labor union and we believe that our relationship with our employees is positive.
9
Financial Information about Segments
See Note 16, “Segment Reporting,” in the Notes to Consolidated Financial Statements found in Part IV Item 15 of this Form 10-K, for information regarding our segments, product categories and certain geographical information.
Available Information
Our principal website address is www.zumiez.com. We make available, free of charge, our proxy statement, annual report to shareholders, annual report on Form 10-K, quarterly reports on Form 10-Q, current reports on Form 8-K and all amendments to those reports as soon as reasonably practicable after such material is electronically filed with or furnished to the Securities and Exchange Commission (“SEC”) at http://ir.zumiez.com. Information available on our website is not incorporated by reference in, and is not deemed a part of, this Form 10-K. The SEC maintains a website that contains electronic filings by Zumiez and other issuers at www.sec.gov. In addition, the public may read and copy any materials Zumiez files with the SEC at the SEC’s Public Reference Room at 100 F Street, N.E., Washington, D.C. 20549. The public may obtain information on the operation of the Public Reference Room by calling the SEC at 1-800-SEC-0330.
10
Investing in our securities involves a high degree of risk. The following risk factors, issues and uncertainties should be considered in evaluating our future prospects. In particular, keep these risk factors in mind when you read “forward-looking” statements elsewhere in this report. Forward-looking statements relate to our expectations for future events and time periods. Generally, the words “anticipates,” “expects,” “intends,” “may,” “should,” “plans,” “believes,” “predicts,” “potential,” “continue” and similar expressions identify forward-looking statements. Forward-looking statements involve risks and uncertainties, and future events and circumstances could differ significantly from those anticipated in the forward-looking statements. Any of the following risks could harm our business, operating results or financial condition and could result in a complete loss of your investment. Additional risks and uncertainties that are not yet identified or that we currently think are immaterial may also harm our business and financial condition in the future.
Failure to anticipate, identify and respond to changing fashion trends, customer preferences and other fashion-related factors could have a material adverse effect on us.
Customer tastes and fashion trends in our market are volatile and tend to change rapidly. Our success depends on our ability to effectively anticipate, identify and respond to changing fashion tastes and consumer preferences, and to translate market trends into appropriate, saleable product offerings in a timely manner. If we are unable to successfully anticipate, identify or respond to changing styles or trends and misjudge the market for our products or any new product lines, including adequately anticipating the correct mix and trends of our private label merchandise, our sales may be lower than predicted and we may be faced with a substantial amount of unsold inventory or missed opportunities. In response to such a situation, we may be forced to rely on markdowns or promotional sales to dispose of excess or slow-moving inventory, which could have a material adverse effect on our results of operations.
We may be unable to compete favorably in the highly competitive retail industry, and if we lose customers to our competitors, our sales could decrease.
The teenage and young adult retail apparel, footwear, accessories and hardgoods industry is highly competitive. We compete with other retailers for vendors, teenage and young adult customers, suitable store locations, qualified store associates, management personnel, on-line marketing content, social media engagement and ecommerce traffic. Some of our competitors are larger than we are and have substantially greater financial and marketing resources, including advanced ecommerce market capabilities. Additionally, some of our competitors may offer more options for free and/or expedited shipping for ecommerce sales. Direct competition with these and other retailers may increase significantly in the future, which could require us, among other things, to lower our prices and could result in the loss of our customers. Current and increased competition could have a material adverse effect on our business, results of operations and financial condition.
U.S. and global economic and political uncertainty, coupled with cyclical economic trends in retailing, could have a material adverse effect on our results of operations.
Our retail market historically has been subject to substantial cyclicality. As the U.S. and global economic and political conditions change, the trends in discretionary consumer spending become unpredictable and discretionary consumer spending could be reduced due to uncertainties about the future. When disposable income decreases or discretionary consumer spending is reduced due to a decline in consumer confidence, purchases of apparel and related products may decline. The current uncertainty in the U.S. and global economies and political environment could have a material adverse impact on our results of operations and financial position.
In response to a decline in disposable income and consumer confidence, we believe the “value” message has become more important to consumers. As a retailer that sells approximately 80% branded merchandise, this trend may negatively affect our business, as we generally will have to charge more than vertically integrated private label retailers or we may be forced to rely on promotional sales to compete in our market which could have a material adverse effect on our financial position.
11
A decrease in consumer traffic could cause our sales to be less than expected.
We depend heavily on generating customer traffic to our stores and websites. This includes locating many of our stores in prominent locations within successful shopping malls. Sales at these stores are derived, in part, from the volume of traffic in those malls. Our stores benefit from the ability of a mall’s other tenants to generate consumer traffic in the vicinity of our stores and the continuing popularity of malls as shopping destinations. Furthermore, we depend on generating increased traffic to our websites and converting that traffic into sales. This requires us to achieve expected results from our marketing and social media campaigns, accuracy of data analytics, reliability of our website, network, and transaction processing and a high-quality on-line customer experience. Our sales volume and customer traffic in our stores and on our websites generally could be adversely affected by, among other things, economic downturns, competition from other ecommerce retailers, non-mall retailers and other malls, increases in gasoline prices, fluctuations in exchange rates in border or tourism-oriented locations and the closing or decline in popularity of other stores in the malls in which we are located. An uncertain economic outlook could curtail new shopping mall development, decrease shopping mall and ecommerce traffic, reduce the number of hours that shopping mall operators keep their shopping malls open or force them to cease operations entirely. A reduction in consumer traffic to our stores or websites could have a material adverse effect on our business, results of operations and financial condition.
Our growth strategy depends on our ability to grow customer engagement in our current markets and expand into new markets, which could strain our resources and cause the performance of our existing business to suffer.
Our growth largely depends on our ability to optimize our customer engagement in our current trade areas and operate successfully in new geographic markets. However, our ability to open stores in new geographic markets in the U.S. and international locations is subject to a variety of risks and uncertainties, and we may be unable to open new stores as planned or have access to desirable lease space, and any failure to successfully open and operate in new markets could have a material adverse effect on our results of operations. We intend to continue to open new stores in future years, while remodeling a portion of our existing store base such that we have the optimum number of stores in any given trade area. The expansion into new markets may present competitive, merchandising, hiring and distribution challenges that are different from those currently encountered in our existing markets. In addition, our proposed expansion will place increased demands on our operational, managerial and administrative resources. These increased demands could cause us to operate our business less effectively, which in turn could cause deterioration in the financial performance of our individual stores and our overall business. In addition, successful execution of our growth strategy may require that we obtain additional financing, and we may not be able to obtain that financing on acceptable terms or at all.
Failure to successfully integrate any businesses that we acquire could have an adverse impact on our results of operations and financial performance.
We may, from time to time, acquire businesses, such as our acquisition of Blue Tomato, which operates primarily in the European market, and Fast Times, which operates primarily in the Australian market. We may experience difficulties in integrating any businesses we may acquire, including their stores, websites, facilities, personnel, financial systems, distribution, operations and general operating procedures, and any such acquisitions may also result in the diversion of our capital and our management’s attention from other business issues and opportunities. If we experience difficulties in integrating acquisitions or if such acquisitions do not provide the benefits that we expect to receive, we could experience increased costs and other operating inefficiencies, which could have an adverse effect on our results of operations and overall financial performance.
12
Our plans for international expansion include risks that could have a negative impact on our results of operations.
We plan to continue to open new stores in the Canadian, European, and Australian markets. We may continue to expand internationally in other markets, either organically, or through additional acquisitions. International markets may have different competitive conditions, consumer tastes and discretionary spending patterns than our existing U.S. market. As a result, operations in international markets may be less successful than our operations in the U.S. Additionally, consumers in international markets may not be familiar with us or the brands we sell, and we may need to build brand awareness in the markets. Furthermore, we have limited experience with the legal and regulatory environments and market practices in new international markets and cannot guarantee that we will be able to penetrate or successfully operate in these new international markets. We also expect to incur additional costs in complying with applicable foreign laws and regulations as they pertain to both our products and our operations. Accordingly, for the reasons noted above, our plans for international expansion include risks that could have a negative impact on our results of operations.
Our sales and inventory levels fluctuate on a seasonal basis. Accordingly, our quarterly results of operations are volatile and may fluctuate significantly.
Our quarterly results of operations have fluctuated significantly in the past and can be expected to continue to fluctuate significantly in the future. Our sales and profitability are typically disproportionately higher in the third and fourth fiscal quarters of each fiscal year due to increased sales during the back-to-school and winter holiday shopping seasons. Sales during these periods cannot be used as an accurate indicator of annual results. As a result of this seasonality, any factors negatively affecting us during the last half of the year, including unfavorable economic conditions, adverse weather or our ability to acquire seasonal merchandise inventory, could have a material adverse effect on our financial condition and results of operations for the entire year. In addition, in order to prepare for the back-to-school and winter holiday shopping seasons, we must order and keep in stock significantly more merchandise than we carry during other times of the year. Any unanticipated decrease in demand for our products during these peak shopping seasons could require us to sell excess inventory at a substantial markdown, which could have a material adverse effect on our business, results of operations and financial condition.
Our quarterly results of operations are affected by a variety of other factors, including:
|
|
• |
the timing of new store openings and the relative proportion of our new stores to mature stores; |
|
|
• |
whether we are able to successfully integrate any new stores that we acquire and the presence of any unanticipated liabilities in connection therewith; |
|
|
• |
fashion trends and changes in consumer preferences; |
|
|
• |
calendar shifts of holiday or seasonal periods; |
|
|
• |
changes in our merchandise mix; |
|
|
• |
timing of promotional events; |
|
|
• |
general economic conditions and, in particular, the retail sales environment; |
|
|
• |
actions by competitors or mall anchor tenants; |
|
|
• |
weather conditions; |
|
|
• |
the level of pre-opening expenses associated with our new stores; and |
|
|
• |
inventory shrinkage beyond our historical average rates. |
13
Significant fluctuations and volatility in the cost of raw materials, global labor, shipping and other costs related to the production of our merchandise may have a material adverse effect on our business, results of operations and financial conditions.
Increases in the cost of raw materials, global labor costs, freight costs and other shipping costs in the production and transportation of our merchandise can result in higher costs for this merchandise. The costs for these products are affected by weather, consumer demand, government regulation, speculation on the commodities market and other factors that are generally unpredictable and beyond our control. Our gross profit and results of operations could be adversely affected to the extent that the selling prices of our products do not increase proportionately with the increases in the costs of raw materials. Increasing labor costs and oil-related product costs, such as manufacturing and transportation costs, could also adversely impact gross profit. Additionally, significant changes in the relationship between carrier capacity and shipper demand could increase transportation costs, which could also adversely impact gross profit.
Most of our merchandise is produced by foreign manufacturers; therefore, the availability, quality and costs of our merchandise may be negatively affected by risks associated with international trade and other international conditions.
Most of our merchandise is produced by manufacturers around the world. Some of these facilities are located in regions that may be affected by natural disasters, political instability or other conditions that could cause a disruption in trade. Trade restrictions such as increased tariffs or quotas, or both, could also increase the cost and reduce the supply of merchandise available to us. Any reduction in merchandise available to us or any increase in its cost due to tariffs, quotas or local issues that disrupt trade could have a material adverse effect on our results of operations. This includes costs to comply with regulatory developments regarding the use of “conflict minerals,” certain minerals originating from the Democratic Republic of Congo and adjoining countries, which may affect the sourcing and availability of raw materials used by manufacturers and subject us to increased costs associated with our products, processes or sources of our inputs. Our business could be adversely affected by disruptions in the supply chain, such as strikes, work stoppages, or port closures.
Fluctuations in foreign currency exchange rates could impact our financial condition and results of operations.
We are exposed to foreign currency exchange rate risk with respect to our sales, profits, assets and liabilities denominated in currencies other than the U.S. dollar. As a result, the fluctuation in the value of the U.S. dollar against other currencies could have a material adverse effect on our results of operations, financial condition and cash flows. Upon translation, operating results may differ materially from expectations. As we continue to expand our international operations, our exposure to exchange rate fluctuations will increase. Tourism spending may be affected by changes in currency exchange rates, and as a result, sales at stores with higher tourism traffic may be adversely impacted by fluctuations in currency exchange rates. Further, although the prices charged by vendors for the merchandise we purchase are primarily denominated in U.S. dollars, a decline in the relative value of the U.S. dollar to foreign currencies could lead to increased merchandise costs, which could negatively affect our competitive position and our results of operations.
Our business could be adversely affected by increased labor costs, including costs related to an increase in minimum wage and health care.
Labor is one of the primary components in the cost of operating our business. Increased labor costs, whether due to competition, unionization, increased minimum wage, state unemployment rates, health care, or other employee benefits costs may adversely impact our operating expenses. A considerable amount of our store team members are paid at rates related to the federal or state minimum wage and any changes to the minimum wage rate may increase our operating expenses. Furthermore, inconsistent increases in state and or city minimum wage requirements limit our ability to increase prices across all markets and channels. Additionally, we are self-insured with respect to our health care coverage in the U.S. and do not purchase third party insurance for the health insurance benefits provided to employees with the exception of pre-defined stop loss coverage, which helps limit the cost of large claims. There is no assurance that future health care legislation will not adversely impact our results or operations.
14
Our business could suffer if a manufacturer fails to use acceptable labor and environmental practices.
We do not control our vendors or the manufacturers that produce the products we buy from them, nor do we control the labor and environmental practices of our vendors and these manufacturers. The violation of labor, safety, environmental and/or other laws and standards by any of our vendors or these manufacturers, or the divergence of the labor and environmental practices followed by any of our vendors or these manufacturers from those generally accepted as ethical in the U.S., could interrupt, or otherwise disrupt, the shipment of finished products to us or damage our reputation. Any of these, in turn, could have a material adverse effect on our reputation, financial condition and results of operations. In that regard, most of the products we sell are manufactured overseas, primarily in Asia, Mexico and Central America, which may increase the risk that the labor and environmental practices followed by the manufacturers of these products may differ from those considered acceptable in the U.S.
Additionally, our products are subject to regulation of and regulatory standards set by various governmental authorities with respect to quality and safety. These regulations and standards may change from time to time. Our inability to comply on a timely basis with regulatory requirements could result in significant fines or penalties, which could adversely affect our reputation and sales. Issues with the quality and safety of merchandise we sell, regardless of our culpability, or customer concerns about such issues, could result in damage to our reputation, lost sales, uninsured product liability claims or losses, merchandise recalls and increased costs.
If we fail to develop and maintain good relationships with vendors or if a vendor is otherwise unable or unwilling to supply us with adequate quantities of their products at acceptable prices, our business and financial performance could suffer.
Our business is dependent on developing and maintaining good relationships with a large number of vendors to provide our customers with an extensive selection of current and relevant brands. In addition to maintaining our large number of current vendor relationships, this includes identifying, attracting and launching new vendors every year to provide a diverse and unique product assortment. We believe that we generally are able to obtain attractive pricing and terms from vendors because we are perceived as a desirable customer, and deterioration in our relationship with our vendors could have a material adverse effect on our business.
However, there can be no assurance that our current vendors or new vendors will provide us with an adequate supply or quality of products or acceptable pricing. Our vendors could discontinue selling to us, raise the prices they charge, sell through direct channels or allow their merchandise to be discounted by other retailers. There can be no assurance that we will be able to acquire desired merchandise in sufficient quantities on terms acceptable to us in the future. In addition, certain of our vendors sell their products directly to the retail market and therefore compete with us directly and other vendors may decide to do so in the future. There can be no assurance that such vendors will not decide to discontinue supplying their products to us, supply us only less popular or lower quality items, raise the prices they charge us or focus on selling their products directly.
In addition, a number of our vendors are smaller, less capitalized companies and are more likely to be impacted by unfavorable general economic and market conditions than larger and better capitalized companies. These smaller vendors may not have sufficient liquidity during economic downturns to properly fund their businesses and their ability to supply their products to us could be negatively impacted. Any inability to acquire suitable merchandise at acceptable prices, or the loss of one or more key vendors, could have a material adverse effect on our business, results of operations and financial condition.
Our business is susceptible to weather conditions that are out of our control, including the potential risks of unpredictable weather patterns and any weather patterns associated with naturally occurring global climate change, and the resultant unseasonable weather could have a negative impact on our results of operations.
Our business is susceptible to unseasonable weather conditions. For example, extended periods of unseasonably warm temperatures during the winter season or cool weather during the summer season (including any weather patterns associated with global warming and cooling) could render a portion of our inventory incompatible with those unseasonable conditions. These prolonged unseasonable weather conditions could have a material adverse effect on our business and results of operations.
15
Our omni-channel strategy may not have the return we anticipate, which could have an adverse effect on our results of operations.
We are executing an omni-channel strategy to enable our customers to shop wherever, whenever and however they choose to engage with us. Our omni-channel strategy may not deliver the results we anticipate or may not adequately anticipate changing consumer trends, preferences and expectations. We will continue to develop additional ways to execute our superior omni-channel experience and interact with our customers, which requires significant investments in IT systems and changes in operational strategy, including localization, on-line and in-store point of sale systems, order management system, and transportation management system. If we fail to effectively integrate our store and ecommerce shopping experiences, effectively scale our IT structure or we do not realize the return on our investments that we anticipate our operating results could be adversely affected. Our competitors are also investing in omni-channel initiatives. If our competitors are able to be more effective in their strategy, it could have an adverse effect on our results of operations. If we our omni-channel strategy fails to meet customer expectations related to functionality, timely delivery, or customer experience, our business and results of operations may be adversely affected. Additionally, to manage the anticipated growth of our operations and personnel, we will need to continue to improve our operational and financial systems, transaction processing, procedures and controls, and in doing so could incur substantial additional expenses that could impact our financial results.
If our information systems fail to function effectively our operations could be disrupted and our financial results could be harmed.
If our information systems do not work effectively, this could adversely impact the promptness and accuracy of our transaction processing, financial accounting and reporting and our ability to manage our business and properly forecast operating results and cash requirements. Further, we may suffer loss of critical data and interruptions or delays in our operations. Additionally, we rely on third-party service providers for certain information systems functions. If a service provider fails to provide the data quality, communications capacity, security or services we require, the failure could interrupt our services and could have a material adverse effect on our business, financial condition and results of operations.
If the security of our data is breached we may be subjected to adverse publicity, litigation and significant expenses.
Information systems are susceptible to an increasing threat of continually evolving cybersecurity risks. We maintain security systems, devices and activity monitoring to prevent unauthorized access to our network, systems and databases containing confidential, proprietary, and personally identifiable information. Nevertheless, if unauthorized parties gain access to our networks, systems or databases, they may be able to steal, publish, delete or modify confidential information. In such circumstances, we could be held liable to our customers or other parties or be subject to regulatory or other actions for breaching privacy rules and we may be exposed to reputation damage and loss of customers’ trust and business. This could result in costly investigations and litigation, civil or criminal penalties and adverse publicity that could adversely affect our financial condition, results of operations and reputation. Actual or anticipated attacks may cause us to incur increasing costs, including costs to deploy additional resources, train employees, and engage third-parties. Further, the regulatory environment surrounding information security, cybersecurity and privacy is increasingly demanding. If we are unable to comply with the new and changing security standards, we may be subject to fines, restrictions and financial exposure, which could adversely affect our retail operations.
If we lose key executives or are unable to attract and retain the talent required for our business, our financial performance could suffer.
Our performance depends largely on the efforts and abilities of our key executives. If we lose the services of one or more of our key executives, we may not be able to successfully manage our business or achieve our growth objectives. Furthermore, as our business grows, we will need to attract and retain additional qualified personnel in a timely manner and we may not be able to do so.
16
Our failure to meet our staffing needs could adversely affect our ability to implement our growth strategy and could have a material impact on our results of operations.
Our success depends in part upon our ability to attract, motivate and retain a sufficient number of qualified employees who understand and appreciate our culture and brand and are able to adequately represent this culture. Qualified individuals of the requisite caliber, skills and number needed to fill these positions may be in short supply in some areas and the employee turnover rate in the retail industry is high. Our business depends on the ability to hire and retain qualified technical and support roles for procurement, distribution, e-commerce and back office functions. Competition for qualified employees in these areas could require us to pay higher wages to attract a sufficient number of suitable employees.
If we are unable to hire and retain store managers and store associates capable of consistently providing a high level of customer service, as demonstrated by their enthusiasm for our culture and knowledge of our merchandise, our ability to open new stores may be impaired and the performance of our existing and new stores could be materially adversely affected. We are also dependent upon temporary personnel to adequately staff our operations particularly during busy periods such as the back-to-school and winter holiday seasons. There can be no assurance that we will receive adequate assistance from our temporary personnel, or that there will be sufficient sources of temporary personnel. If we are unable to hire qualified temporary personnel, our results of operations could be adversely impacted.
Although none of our employees are currently covered by collective bargaining agreements, we cannot guarantee that our employees will not elect to be represented by labor unions in the future, which could increase our labor costs and could subject us to the risk of work stoppages and strikes. Any such failure to meet our staffing needs, any material increases in employee turnover rates, any increases in labor costs or any work stoppages, interruptions or strikes could have a material adverse effect on our business or results of operations.
A decline in cash flows from operations could have a material adverse effect on our business and growth plans.
We depend on cash flow from operations to fund our current operations and our growth strategy, including the payment of our operating leases, wages, store operation costs and other cash needs. If our business does not generate sufficient cash flow from operating activities, and sufficient funds are not otherwise available to us from borrowings under our credit facility or from other sources, we may not be able to pay our operating lease expenses, grow our business, respond to competitive challenges or fund our other liquidity and capital needs, which could have a material adverse effect on our business.
The terms of our asset-based revolving credit agreement impose certain restrictions on us that may impair our ability to respond to changing business and economic conditions, which could have a significant adverse impact on our business. Additionally, our business could suffer if our ability to acquire financing is reduced or eliminated.
We maintain an asset-based revolving credit agreement with Wells Fargo Bank, N.A., which provides for a senior secured revolving credit facility (“ABL Facility”) of up to $100 million. The ABL Facility contains various representations, warranties and restrictive covenants that, among other things and subject to specified circumstances and exceptions, restrict our ability to incur indebtedness (including guarantees), grant liens, make investments, pay dividends or distributions with respect to capital stock, make prepayments on other indebtedness, engage in mergers, dispose of certain assets or change the nature of their business. In addition, excess availability equal to at least 10% of the loan cap must be maintained under the ABL Facility. The ABL Facility does not otherwise contain financial maintenance covenants. These restrictions could (1) limit our ability to plan for or react to market conditions or meet capital needs or otherwise restrict our activities or business plans; and (2) adversely affect our ability to finance our operations, strategic acquisitions, investments or other capital needs or to engage in other business activities that would be in our interest.
The ABL Facility includes customary events of default including non-payment of principal, interest or fees, violation of covenants, inaccuracy of representations or warranties, cross-default to other material indebtedness, bankruptcy and insolvency events, invalidity or impairment of guarantees or security interests, material judgments and change of control. Additionally, we cannot be assured that our borrowing relationship with our lenders will continue or that our lenders will remain able to support their commitments to us in the future. If our lenders fail to do so, then we may not be able to secure alternative financing on commercially reasonable terms, or at all.
17
Our business could suffer with the closure or disruption of our home office or our distribution centers.
Domestically, we rely on a single distribution center located in Corona, California to receive, store and distribute the vast majority of our merchandise to our domestic stores. Internationally, we operate a combined distribution and ecommerce fulfillment center located in Graz, Austria that supports our Blue Tomato ecommerce and store operations in Europe. We operate a distribution center located in Delta, British Columbia, Canada to distribute our merchandise to our Canadian stores. We operate a distribution and fulfillment center located in Melbourne, Australia to distribute our merchandise to our Australian stores. Additionally, we are headquartered in Lynnwood, Washington. As a result, a natural disaster or other catastrophic event that affects one of the regions where we operate these centers or our home office could significantly disrupt our operations and have a material adverse effect on our business, results of operations and financial condition.
The effects of war, acts of terrorism, threat of terrorism, or other types of mall violence, could adversely affect our business.
Most of our stores are located in shopping malls. Any threat of terrorist attacks or actual terrorist events, or other types of mall violence, such as shootings in malls, particularly in public areas, could lead to lower consumer traffic in shopping malls. In addition, local authorities or mall management could close shopping malls in response to security concerns. Mall closures, as well as lower consumer traffic due to security concerns, could result in decreased sales. Additionally, the threat, escalation or commencement of war or other armed conflict elsewhere, could significantly diminish consumer spending, and result in decreased sales. Decreased sales could have a material adverse effect on our business, financial condition and results of operations.
Our inability or failure to protect our intellectual property or our infringement of other’s intellectual property could have a negative impact on our operating results.
We believe that our trademarks and domain names are valuable assets that are critical to our success. The unauthorized use or other misappropriation of our trademarks or domain names could diminish the value of the Zumiez, Blue Tomato, or Fast Times brands, our store concepts, our private label brands or our goodwill and cause a decline in our net sales. Although we have secured or are in the process of securing protection for our trademarks and domain names in a number of countries outside of the U.S., there are certain countries where we do not currently have or where we do not currently intend to apply for protection for certain trademarks. Also, the efforts we have taken to protect our trademarks may not be sufficient or effective. Therefore, we may not be able to prevent other persons from using our trademarks or domain names outside of the U.S., which also could adversely affect our business. We are also subject to the risk that we may infringe on the intellectual property rights of third parties. Any infringement or other intellectual property claim made against us, whether or not it has merit, could be time-consuming, result in costly litigation, cause product delays or require us to pay royalties or license fees. As a result, any such claim could have a material adverse effect on our operating results.
Our operations expose us to the risk of litigation, which could lead to significant potential liability and costs that could harm our business, financial condition or results of operations.
We employ a substantial number of full-time and part-time employees, a majority of whom are employed at our store locations. As a result, we are subject to a large number of federal, state and foreign laws and regulations relating to employment. This creates a risk of potential claims that we have violated laws related to discrimination and harassment, health and safety, wage and hour laws, criminal activity, personal injury and other claims. We are also subject to other types of claims in the ordinary course of our business. Some or all of these claims may give rise to litigation, which could be time-consuming for our management team, costly and harmful to our business.
In addition, we are exposed to the risk of class action litigation. The costs of defense and the risk of loss in connection with class action suits are greater than in single-party litigation claims. Due to the costs of defending against such litigation, the size of judgments that may be awarded against us, and the loss of significant management time devoted to such litigation, we cannot assure you that such litigation will not disrupt our business or impact our financial results.
18
We are involved, from time to time, in litigation incidental to our business including complaints filed by investors. This litigation could result in substantial costs, and could divert management's attention and resources, which could harm our business. Risks associated with legal liability are often difficult to assess or quantify, and their existence and magnitude can remain unknown for significant periods of time.
Our failure to comply with federal, state, local or foreign laws and regulations, or changes in these laws and regulations, could have an adverse impact on our results of operations and financial performance.
Our business is subject to a wide array of laws and regulations including those related to employment, trade, consumer protection, transportation, occupancy laws, health care, wage laws, employee health and safety, taxes, privacy, health information privacy, identify theft, customs, truth-in-advertising, securities laws, unsolicited commercial communication and environmental issues. Our policies, procedures and internal controls are designed to comply with foreign and domestic laws and regulations, such as those required by the Sarbanes-Oxley Act of 2002 and the U.S. Foreign Corrupt Practices Act. Although we have policies and procedures aimed at ensuring legal and regulatory compliance, our employees or vendors could take actions that violate these laws and regulations. Any violations of such laws or regulations could have an adverse effect on our reputation, results of operations, financial condition and cash flows. Furthermore, changes in the regulations, the imposition of additional regulations, or the enactment of any new legislation, particularly in the U.S. and Europe, could adversely affect our results of operations or financial condition.
Fluctuations in our tax obligations and effective tax rate may result in volatility in our operating results.
We are subject to income taxes in many domestic and foreign jurisdictions. In addition, our products are subject to import and excise duties and/or sales, consumption or value-added taxes in many jurisdictions. We record tax expense based on our estimates of future payments, which include reserves for estimates of probable settlements of domestic and foreign tax audits. At any one time, many tax years are subject to audit by various taxing jurisdictions. There can be no assurance as to the outcome of these audits which may have an adverse effect to our business. In addition, our effective tax rate may be materially impacted by changes in tax rates and duties, the mix and level of earnings or losses by taxing jurisdictions, or by changes to existing accounting rules or regulations. Changes to foreign or domestic tax laws could have a material impact on our financial condition, results of operations or cash flows.
We may fail to meet analyst expectations, which could cause the price of our stock to decline.
Our common stock is traded publicly and various securities analysts follow our financial results and issue reports on us. These reports include information about our historical financial results as well as the analysts' estimates of our future performance. The analysts' estimates are based upon their own independent opinions and can be different from our estimates or expectations. If our operating results are below the estimates or expectations of public market analysts and investors, our stock price could decline.
The reduction of total outstanding shares through the execution of the share repurchase program of common stock may increase the risk that a group of shareholders could form a group to become a controlling shareholder.
We do not have a controlling shareholder, nor are we aware of any shareholders that have formed a “group” (defined as when two or more persons agree to act together for the purposes of acquiring, holding, voting or otherwise disposing of the equity securities of an issuer). The reduction of total outstanding shares through the execution of the share repurchase program of common stock may increase the risk that a group of shareholders could form a group to become a controlling shareholder.
A controlling shareholder would have significant influence over, and may have the ability to control, matters requiring approval by our shareholders, including the election of directors and approval of mergers, consolidations, sales of assets, recapitalizations and amendments to our articles of incorporation. Furthermore, a controlling shareholder may take actions with which other shareholders do not agree, including actions that delay, defer or prevent a change of control of the company and that could cause the price that investors are willing to pay for the company’s stock to decline.
19
None.
All of our stores are occupied under operating leases and encompassed approximately 2.0 million total square feet at January 28, 2017.
We own approximately 356,000 square feet of land in Lynnwood, Washington, and completed construction of a 63,071 square foot home office in fiscal 2012. Additionally, we lease 14,208 square feet of office space in Schladming, Austria for our European home office. This lease is set to expire in 2027.
We own a 168,450 square foot building in Corona, California that serves as our domestic warehouse and distribution center.
We lease a 95,508 square feet combined distribution and ecommerce fulfillment center in Graz, Austria that supports our Blue Tomato ecommerce and store operations in Europe. This lease is set to expire in 2019. We lease 17,168 square feet of a distribution facility in Delta, British Columbia, Canada that supports our store operations in Canada. This lease is set to expire in 2018. We lease a 2,852 square feet distribution and ecommerce fulfillment center in Melbourne, Australia that supports our Fast Times ecommerce and store operations in Australia. This lease is set to expire in 2018.
We are involved from time to time in litigation incidental to our business. We believe that the outcome of current litigation is not expected to have a material adverse effect on our results of operations or financial condition.
See Note 9, “Commitments and Contingencies,” in the Notes to Consolidated Financial Statements found in Part IV Item 15 of this Form 10-K, for additional information related to legal proceedings.
Not applicable.
20
|
Item 5. |
MARKET FOR REGISTRANT’S COMMON EQUITY, RELATED STOCKHOLDER MATTERS AND ISSUER PURCHASES OF EQUITY SECURITIES |
Market Information
Our common stock is traded on the Nasdaq Global Select Market under the symbol “ZUMZ.” At January 28, 2017, there were 24,944,782 shares of common stock outstanding. The following table sets forth the high and low sales prices for our common stock on the Nasdaq Global Select Market.
|
Fiscal 2016 |
|
High |
|
|
Low |
|
||
|
First Fiscal Quarter (January 31, 2016—April 30, 2016) |
|
$ |
22.14 |
|
|
$ |
16.33 |
|
|
Second Fiscal Quarter (May 1, 2016—July 30, 2016) |
|
$ |
17.12 |
|
|
$ |
13.50 |
|
|
Third Fiscal Quarter (July 31, 2016—October 29, 2016) |
|
$ |
23.07 |
|
|
$ |
14.42 |
|
|
Fourth Fiscal Quarter (October 30, 2016—January 28, 2017) |
|
$ |
26.55 |
|
|
$ |
18.20 |
|
|
Fiscal 2015 |
|
High |
|
|
Low |
|
||
|
First Fiscal Quarter (February 1, 2015—May 2, 2015) |
|
$ |
40.64 |
|
|
$ |
30.89 |
|
|
Second Fiscal Quarter (May 3, 2015—August 1, 2015) |
|
$ |
32.29 |
|
|
$ |
23.51 |
|
|
Third Fiscal Quarter (August 2, 2015—October 31, 2015) |
|
$ |
26.32 |
|
|
$ |
13.75 |
|
|
Fourth Fiscal Quarter (November 1, 2015—January 30, 2016) |
|
$ |
18.49 |
|
|
$ |
11.53 |
|
21
Performance Measurement Comparison
The following graph shows a comparison for total cumulative returns for Zumiez, the Nasdaq Composite Index and the Nasdaq Retail Trade Index during the period commencing on January 28, 2012 and ending on January 28, 2017. The comparison assumes $100 was invested on January 28, 2012 in each of Zumiez, the Nasdaq Composite Index and the Nasdaq Retail Trade Index, and assumes the reinvestment of all dividends, if any. The comparison in the following graph and table is required by the SEC and is not intended to be a forecast or to be indicative of future Company common stock performance.
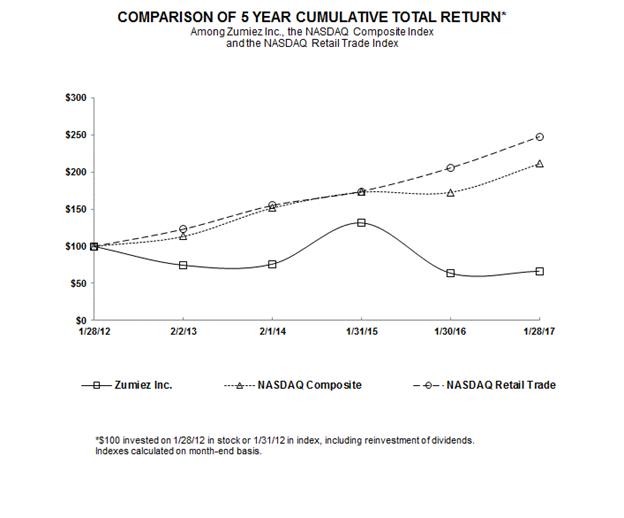
|
|
|
1/28/12 |
|
2/2/13 |
|
2/1/14 |
|
1/31/15 |
|
1/30/16 |
|
1/28/17 |
|
|
|
|
|
|
|
|
|
|
|
|
|
|
|
Zumiez |
|
100.00 |
|
74.51 |
|
75.96 |
|
131.63 |
|
63.93 |
|
66.54 |
|
NASDAQ Composite |
|
100.00 |
|
113.29 |
|
151.56 |
|
172.90 |
|
172.62 |
|
211.07 |
|
NASDAQ Retail Trade |
|
100.00 |
|
123.01 |
|
155.03 |
|
174.00 |
|
205.56 |
|
247.71 |
Holders of the Company’s Capital Stock
We had 465 shareholders of record as of February 27, 2017.
22
No cash dividends have been declared on our common stock to date nor have any decisions been made to pay a dividend in the foreseeable future. Payment of dividends is evaluated on a periodic basis.
Recent Sales of Unregistered Securities
None
Issuer Purchases of Equity Securities
The share repurchase program is conducted under authorizations made from time to time by our Board of Directors. In December 2015, our Board of Directors authorized us to repurchase up to $70.0 million of our common stock. This program was expired as of January 28, 2017. There were no issuer purchases of our common stock during the thirteen weeks ended January 28, 2017.
23
The following selected consolidated financial information has been derived from our audited Consolidated Financial Statements. The data should be read in conjunction with our Consolidated Financial Statements and the notes thereto, and Management’s Discussion and Analysis of Financial Condition and Results of Operations included elsewhere herein.
|
|
|
Fiscal 2016 |
|
|
Fiscal 2015 (1) |
|
|
Fiscal 2014 (2) |
|
|
Fiscal 2013 (3) |
|
|
Fiscal 2012 (4) |
|
|||||
|
Statement of Operations Data (in thousands, except per share data): |
|
|
|
|
|
|
|
|
|
|
|
|
|
|
|
|
|
|
|
|
|
Net sales |
|
$ |
836,268 |
|
|
$ |
804,183 |
|
|
$ |
811,551 |
|
|
$ |
724,337 |
|
|
$ |
669,393 |
|
|
Cost of goods sold |
|
|
561,266 |
|
|
|
535,559 |
|
|
|
524,468 |
|
|
|
462,577 |
|
|
|
428,109 |
|
|
Gross profit |
|
|
275,002 |
|
|
|
268,624 |
|
|
|
287,083 |
|
|
|
261,760 |
|
|
|
241,284 |
|
|
Selling, general and administrative expenses |
|
|
235,259 |
|
|
|
222,459 |
|
|
|
215,512 |
|
|
|
188,918 |
|
|
|
172,742 |
|
|
Operating profit |
|
|
39,743 |
|
|
|
46,165 |
|
|
|
71,571 |
|
|
|
72,842 |
|
|
|
68,542 |
|
|
Interest income, net |
|
|
32 |
|
|
|
529 |
|
|
|
637 |
|
|
|
711 |
|
|
|
1,410 |
|
|
Other income (expense), net |
|
|
449 |
|
|
|
(833 |
) |
|
|
(557 |
) |
|
|
(1,589 |
) |
|
|
327 |
|
|
Earnings before income taxes |
|
|
40,224 |
|
|
|
45,861 |
|
|
|
71,651 |
|
|
|
71,964 |
|
|
|
70,279 |
|
|
Provision for income taxes |
|
|
14,320 |
|
|
|
17,076 |
|
|
|
28,459 |
|
|
|
26,016 |
|
|
|
28,115 |
|
|
Net income |
|
$ |
25,904 |
|
|
$ |
28,785 |
|
|
$ |
43,192 |
|
|
$ |
45,948 |
|
|
$ |
42,164 |
|
|
Earnings per share: |
|
|
|
|
|
|
|
|
|
|
|
|
|
|
|
|
|
|
|
|
|
Basic |
|
$ |
1.05 |
|
|
$ |
1.05 |
|
|
$ |
1.50 |
|
|
$ |
1.54 |
|
|
$ |
1.37 |
|
|
Diluted |
|
$ |
1.04 |
|
|
$ |
1.04 |
|
|
$ |
1.47 |
|
|
$ |
1.52 |
|
|
$ |
1.35 |
|
|
Weighted average shares outstanding: |
|
|
|
|
|
|
|
|
|
|
|
|
|
|
|
|
|
|
|
|
|
Basic |
|
|
24,727 |
|
|
|
27,497 |
|
|
|
28,871 |
|
|
|
29,810 |
|
|
|
30,742 |
|
|
Diluted |
|
|
24,908 |
|
|
|
27,673 |
|
|
|
29,288 |
|
|
|
30,206 |
|
|
|
31,273 |
|
|
|
|
|
|
|
|
|
|
|
|
|
|
|
|
|
|
|
|
|
|
|
|
Balance Sheet Data (in thousands): |
|
|
|
|
|
|
|
|
|
|
|
|
|
|
|
|
|
|
|
|
|
Cash, cash equivalents and current marketable securities |
|
$ |
78,826 |
|
|
$ |
75,554 |
|
|
$ |
154,644 |
|
|
$ |
117,155 |
|
|
$ |
103,172 |
|
|
Working capital |
|
|
137,766 |
|
|
|
129,755 |
|
|
|
191,351 |
|
|
|
168,472 |
|
|
|
146,115 |
|
|
Total assets |
|
|
426,683 |
|
|
|
414,695 |
|
|
|
493,705 |
|
|
|
443,403 |
|
|
|
409,098 |
|
|
Total long-term liabilities |
|
|
46,035 |
|
|
|
48,596 |
|
|
|
52,734 |
|
|
|
46,375 |
|
|
|
48,478 |
|
|
Total shareholders’ equity |
|
|
307,051 |
|
|
|
296,957 |
|
|
|
359,524 |
|
|
|
335,654 |
|
|
|
303,421 |
|
|
|
|
|
|
|
|
|
|
|
|
|
|
|
|
|
|
|
|
|
|
|
|
Other Financial Data (in thousands, except gross margin and operating margin): |
|
|
|
|
|
|
|
|
|
|
|
|
|
|
|
|
|
|
|
|
|
Gross profit |
|
|
32.9 |
% |
|
|
33.4 |
% |
|
|
35.4 |
% |
|
|
36.1 |
% |
|
|
36.0 |
% |
|
Operating margin |
|
|
4.8 |
% |
|
|
5.7 |
% |
|
|
8.8 |
% |
|
|
10.1 |
% |
|
|
10.2 |
% |
|
Capital expenditures |
|
$ |
20,400 |
|
|
$ |
34,834 |
|
|
$ |
35,758 |
|
|
$ |
35,969 |
|
|
$ |
41,070 |
|
|
Depreciation, amortization and accretion |
|
$ |
27,916 |
|
|
$ |
30,410 |
|
|
$ |
29,167 |
|
|
$ |
26,596 |
|
|
$ |
22,957 |
|
|
|
|
|
|
|
|
|
|
|
|
|
|
|
|
|
|
|
|
|
|
|
|
Company Data: |
|
|
|
|
|
|
|
|
|
|
|
|
|
|
|
|
|
|
|
|
|
Number of stores open at end of period |
|
|
685 |
|
|
|
658 |
|
|
|
603 |
|
|
|
551 |
|
|
|
498 |
|
|
Comparable sales (decrease) increase (5) |
|
(0.2%) |
|
|
|
(5.3 |
%) |
|
|
4.6 |
% |
|
|
(0.3 |
%) |
|
|
5.0 |
% |
|
|
Net sales per store (6) (in thousands) |
|
$ |
1,235 |
|
|
$ |
1,256 |
|
|
$ |
1,390 |
|
|
$ |
1,366 |
|
|
$ |
1,403 |
|
|
Total store square footage (7) (in thousands) |
|
|
2,009 |
|
|
|
1,935 |
|
|
|
1,770 |
|
|
|
1,624 |
|
|
|
1,480 |
|
|
Average square footage per store (8) |
|
|
2,932 |
|
|
|
2,941 |
|
|
|
2,936 |
|
|
|
2,947 |
|
|
|
2,961 |
|
|
Net sales per square foot (9) |
|
$ |
420 |
|
|
$ |
427 |
|
|
$ |
473 |
|
|
$ |
462 |
|
|
$ |
475 |
|
|
(1) |
Included in the results for fiscal 2015 is $1.2 million for the exit costs associated with the closure of our Kansas fulfillment center, $0.6 million for the expense associated with the incentive payments in conjunction with our acquisition of Blue Tomato and an expense of $0.9 million of amortization of intangible assets. |
24
|
(3) |
Included in the results for fiscal 2013 are the following charges: a) a benefit of $2.7 million representing the correction of an error related to our calculation to account for rent expense on a straight-line basis, b) a benefit of $2.6 million for the reversal of the previously recorded expense associated with the future incentive payments in conjunction with our acquisition of Blue Tomato, c) an expense of $2.3 million for the amortization of intangible assets, d) an expense of $1.3 million for a litigation settlement and e) a benefit of $0.4 million for the release of a valuation allowance to net operating losses in foreign subsidiaries. |
|
(4) |
Fiscal 2012 consisted of 53 weeks. All other fiscal years presented consisted of 52 weeks. In fiscal 2012, we acquired Blue Tomato for cash consideration of 59.5 million Euros ($74.8 million). Additionally, included in the results for fiscal 2012 are the following charges: a) an expense of $2.3 million associated with the future incentive payments to be paid in conjunction with our acquisition of Blue Tomato, b) an expense of $2.2 million related to a step-up in inventory to estimated fair value in conjunction with our acquisition of Blue Tomato, c) an expense of $2.1 million associated with the relocation of our ecommerce fulfillment center and home office, d) an expense of $1.9 million in transaction costs incurred in conjunction with our acquisition of Blue Tomato and e) an expense of $1.3 million for the amortization of intangible assets. |
|
(5) |
See “Management’s Discussion and Analysis of Financial Condition and Results of Operations—General” for more information about how we compute comparable sales. |
|
(6) |
Net sales per store represents net sales, including ecommerce sales, for the period divided by the average number of stores open during the period. For purposes of this calculation, the average number of stores open during the period is equal to the sum of the number of stores open as of the end of each month during the fiscal year divided by the number of months in the fiscal year. |
|
(7) |
Total store square footage includes retail selling, storage and back office space at the end of the fiscal year. |
|
(8) |
Average square footage per store is calculated based on the total store square footage at the end of the fiscal year, including retail selling, storage and back office space, of all stores open at the end of the fiscal year. |
|
(9) |
Net sales per square foot represents net sales, including ecommerce sales, for the period divided by the average square footage of stores open during the period. For purposes of this calculation, the average square footage of stores open during the period is equal to the sum of the total square footage of the stores open as of the end of each month during the fiscal year divided by the number of months in the fiscal year. |
25
The following discussion and analysis of our financial condition and results of operations should be read in conjunction with our consolidated financial statements and related notes included elsewhere in this document. This discussion contains forward-looking statements that involve risks and uncertainties. Our actual results could differ materially from those anticipated in these forward-looking statements as a result of certain factors, including those discussed in “Item 1A Risk Factors.” See the cautionary note regarding forward-looking statements set forth at the beginning of Part I of the Annual Report on Form 10-K.
Fiscal 2016—A Review of This Past Year
In fiscal 2016 teen retail in general faced a continuing challenging sales environment with many mall-based teen retailers experiencing declining sales and store closures. Following a fourth quarter 2015 comparable sales decrease of 9.5%, Zumiez comparable sales remained negative through the first half of fiscal 2016. By the third quarter of fiscal 2016, driven by the strength of several new brands, Zumiez comparable sales turned positive and remained positive through the balance of the year. The full year comparable sales for fiscal 2016 decreased 0.2%. Operating margins and earnings declined from the prior year due primarily to deleveraging of fixed costs on slightly negative comparable sales. We continued to make investments in our North America store footprint focused on expanding in the United States and Canada by adding 22 new stores during fiscal 2016. We also added 6 new stores to our Blue Tomato operations in Europe and added 5 stores through the acquisition of Fast Times in Australia.
As a leading lifestyle retailer we continue to differentiate ourselves through our distinctive brand offering and diverse product selection, as well as the unique customer experience our sales associates provide. We also believe that investments made in our omni-channel platform focused on creating a seamless shopping experience for our customer between the physical and digital channels is critical for our long-term financial performance. Fiscal 2016 represented the first year of localized fulfillment of our on-line orders which drove significant improvements in speed of delivery to our customers. In store fulfillment is a key part of our omni-channel strategy that we believe will drive long term market share by leveraging the strengths of our store sales team, providing better and faster service to customers, improving product margins, and providing additional selling opportunities.
The following table shows net sales, operating profit, operating margin, and diluted earnings per share for fiscal 2016 compared to fiscal 2015. The fiscal 2015 results include $1.5 million of charges associated with the acquisition of Blue Tomato made up of $0.6 million for incentive payments related to the transaction and $0.9 million for the amortization of intangible assets and $1.2 million associated with exit charges related to our Kansas fulfillment center.
|
|
|
Fiscal 2016 |
|
|
Fiscal 2015 |
|
|
% Change |
|
|||
|
Net sales (in thousands) |
|
$ |
836,268 |
|
|
$ |
804,183 |
|
|
|
4 |
% |
|
Operating profit (in thousands) |
|
$ |
39,743 |
|
|
$ |
46,165 |
|
|
|
-14 |
% |
|
Operating margin |
|
|
4.8 |
% |
|
|
5.7 |
% |
|
|
|
|
|
Diluted earnings per share |
|
$ |
1.04 |
|
|
$ |
1.04 |
|
|
|
0 |
% |
The increase in net sales was primarily driven by the net addition of 27 stores (33 new stores offset by 6 store closures), offset by a 0.2% comparable sales decrease. The decrease in comparable sales was driven by a decrease in dollars per transaction, partially offset by an increase in transactions. Dollars per transaction decreased due to a decrease in units per transaction and a decrease in average unit retail. Operating margin was down in fiscal 2016 compared to fiscal 2015 primarily as a result of deleveraging operating costs partially offset by a decline in unique charges as discussed above.
26
Fiscal 2017—A Look At the Upcoming Year
Entering 2017 we remain cautious with our expectations. Our focus will be on continued execution of our core strategies as well as strategic investments centered on long-term quality growth. These investments will be largely focused on the roll-out of our new Customer Engagement Suite, continued store growth and continued investments in our people. As we are closer to our targeted number of stores in North America, we expect that store growth in fiscal 2017 will be less than in fiscal 2016 with an estimated 18 stores opening during the fiscal year compared with 28 stores opened and 5 stores acquired in fiscal 2016. In 2017 we will invest in the roll-out of our Customer Engagement Suite focused on integrating our on-line and in-store point of sale (POS) systems, order management system (OMS), and transportation management system (TMS) improving our efficiency and further enhancing our omni-channel capabilities.
In fiscal 2017, we expect our cost structure will grow at a higher rate than 2016, primarily tied to the investments outlined above and required statutory wage increases. We anticipate inventory levels per square foot will grow at fiscal year-end primarily due to timing related to the addition of the 53rd week. Excluding any possible share buy-backs, we expect cash, short-term investments and working capital to increase, and do not anticipate any new long-term borrowings during the year. Long-term we aim to grow sales annually and grow operating profit at a faster rate than sales by focusing on the changing consumer environment while managing our cost structure.
General
Net sales constitute gross sales, net of actual and estimated returns and deductions for promotions, and shipping revenue. Net sales include our store sales and our ecommerce sales. We record the sale of gift cards as a current liability and recognize revenue when a customer redeems a gift card. Additionally, the portion of gift cards that will not be redeemed (“gift card breakage”) is recognized in net sales after 24 months, at which time the likelihood of redemption is considered remote based on our historical redemption data.
We report “comparable sales” based on net sales beginning on the first anniversary of the first day of operation of a new store or ecommerce business. We operate a sales strategy that integrates our stores with our ecommerce platform. There is significant interaction between our store sales and our ecommerce sales channels and we believe that they are utilized in tandem to serve our customers. Therefore, our comparable sales also include our ecommerce sales. Changes in our comparable sales between two periods are based on net sales of store or ecommerce businesses which were in operation during both of the two periods being compared and, if a store or ecommerce business is included in the calculation of comparable sales for only a portion of one of the two periods being compared, then that store or ecommerce business is included in the calculation for only the comparable portion of the other period. Any change in square footage of an existing comparable store, including remodels and relocations, does not eliminate that store from inclusion in the calculation of comparable sales. Any store or ecommerce business that we acquire will be included in the calculation of comparable sales after the first anniversary of the acquisition date. Current year foreign exchange rates are applied to both current year and prior year comparable sales to achieve a consistent basis for comparison. There may be variations in the way in which some of our competitors and other apparel retailers calculate comparable sales. As a result, data herein regarding our comparable sales may not be comparable to similar data made available by our competitors or other retailers.
Cost of goods sold consists of branded merchandise costs and our private label merchandise costs including design, sourcing, importing and inbound freight costs. Our cost of goods sold also includes shrinkage, buying, occupancy, ecommerce fulfillment, distribution and warehousing costs (including associated depreciation) and freight costs for store merchandise transfers. This may not be comparable to the way in which our competitors or other retailers compute their cost of goods sold. Cash consideration received from vendors is reported as a reduction of cost of goods sold if the inventory has sold, a reduction of the carrying value of the inventory if the inventory is still on hand, or a reduction of selling, general and administrative expense if the amounts are reimbursements of specific, incremental and identifiable costs of selling the vendors’ products.
With respect to the freight component of our ecommerce sales, amounts billed to our customers are included in net sales and the related freight cost is charged to cost of goods sold.
27
Selling, general and administrative expenses consist primarily of store personnel wages and benefits, administrative staff and infrastructure expenses, freight costs for merchandise shipments from the distribution centers to the stores, store supplies, depreciation on fixed assets at our home office and stores, facility expenses, training expenses and advertising and marketing costs. Credit card fees, insurance, public company expenses, legal expenses, amortization of intangibles, and other miscellaneous operating costs are also included in selling, general and administrative expenses. This may not be comparable to the way in which our competitors or other retailers compute their selling, general and administrative expenses.
Key Performance Indicators
Our management evaluates the following items, which we consider key performance indicators, in assessing our performance:
Comparable sales. As previously described in detail under the caption “General,” comparable sales provide a measure of sales growth for stores and ecommerce businesses open at least one year over the comparable prior year period.
We consider comparable sales to be an important indicator of our current performance. Comparable sales results are important to achieve leveraging of our costs, including store payroll and store occupancy. Comparable sales also have a direct impact on our total net sales, operating profit, cash and working capital.
Gross profit. Gross profit measures whether we are optimizing the price and inventory levels of our merchandise. Gross profit is the difference between net sales and cost of goods sold. Any inability to obtain acceptable levels of initial markups or any significant increase in our use of markdowns could have an adverse effect on our gross profit and results of operations.
Operating profit. We view operating profit as a key indicator of our success. Operating profit is the difference between gross profit and selling, general and administrative expenses. The key drivers of operating profit are comparable sales, gross profit, our ability to control selling, general and administrative expenses and our level of capital expenditures affecting depreciation expense.
Results of Operations
The following table presents selected items on the consolidated statements of income as a percent of net sales:
|
|
|
Fiscal 2016 |
|
|
Fiscal 2015 |
|
|
Fiscal 2014 |
|
|||
|
Net sales |
|
|
100.0 |
% |
|
|
100.0 |
% |
|
|
100.0 |
% |
|
Cost of goods sold |
|
|
67.1 |
% |
|
|
66.6 |
% |
|
|
64.6 |
% |
|
Gross profit |
|
|
32.9 |
% |
|
|
33.4 |
% |
|
|
35.4 |
% |
|
Selling, general and administrative expenses |
|
|
28.1 |
% |
|
|
27.7 |
% |
|
|
26.6 |
% |
|
Operating profit |
|
|
4.8 |
% |
|
|
5.7 |
% |
|
|
8.8 |
% |
|
Interest and other income (expenses), net |
|
|
0.0 |
% |
|
|
0.0 |
% |
|
|
0.0 |
% |
|
Earnings before income taxes |
|
|
4.8 |
% |
|
|
5.7 |
% |
|
|
8.8 |
% |
|
Provision for income taxes |
|
|
1.7 |
% |
|
|
2.1 |
% |
|
|
3.5 |
% |
|
Net income |
|
|
3.1 |
% |
|
|
3.6 |
% |
|
|
5.3 |
% |
Fiscal 2016 Results Compared With Fiscal 2015
Net Sales
Net sales were $836.3 million for fiscal 2016 compared to $804.2 million for fiscal 2015, an increase of $32.1 million or 4.0%. The increase reflected a $34.5 million increase due to the net addition of 27 stores (made up of 22 new stores in North America, 6 new stores in Europe, and 5 stores acquired in Australia offset by 6 store closures), partially offset by decrease of $1.6 million of comparable sales in fiscal 2016. By region, North America sales increased $25.7 million or 3.5% and other international sales increased $6.4 million or 8.5% during fiscal 2016 compared to fiscal 2015.
28
The 0.2% decrease in comparable sales was primarily driven by a decrease in dollars per transaction partially offset by an increase in comparable transactions. Dollars per transaction decreased due to a decrease in units per transaction and average unit retail. Comparable sales decreases in hardware, footwear, junior’s apparel, and accessories were partially offset by a comparable sales increase in men’s apparel. For information as to how we define comparable sales, see “General” above.
Gross Profit
Gross profit was $275.0 million for fiscal 2016 compared to $268.6 million for fiscal 2015, an increase of $6.4 million, or 2.4%. As a percentage of net sales, gross profit decreased 50 basis points in fiscal 2016 to 32.9%. The decrease was primarily driven by a 40 basis point impact due to deleveraging of our store occupancy costs.
Selling, General and Administrative Expenses
Selling, general and administrative (“SG&A”) expenses were $235.3 million for fiscal 2016 compared to $222.5 million for fiscal 2015, an increase of $12.8 million, or 5.8%. SG&A expenses as a percent of net sales increased by 40 basis points in fiscal 2016 to 28.1%. The increase was primarily driven by 30 basis points from the deleveraging of store costs primarily related to wages and 30 basis point increase in corporate costs primarily related to wages partially offset by 20 basis point decrease in impairment of long-lived assets compared to fiscal 2015.
Net Income
Net income for fiscal 2016 was $25.9 million, or $1.04 per diluted share, compared with net income of $28.8 million, or $1.04 per diluted share, for fiscal 2015. Our effective income tax rate for fiscal 2016 was 35.6% compared to 37.2% for fiscal 2015. The decrease in the effective tax rate for fiscal 2016 compared to fiscal 2015 was primarily due to the tax impact of our foreign operations.
Fiscal 2015 Results Compared With Fiscal 2014
Net Sales
Net sales were $804.2 million for fiscal 2015 compared to $811.6 million for fiscal 2014, a decrease of $7.4 million or 0.9%. The decrease reflected a $42.1 million decrease due to comparable sales for fiscal 2015 and a decrease of $19.6 million due to the impact of changes in foreign exchange rates, partially offset by the net addition of 55 stores (made up of 51 new stores in North America and 6 new stores in Europe offset by 2 store closures in North America). By region, North America sales decreased $19.0 million or 2.5% and European sales increased $11.6 million or 18.0% during fiscal 2015 compared to fiscal 2014.
The 5.3% decrease in comparable sales was primarily driven by a decrease in comparable transactions partially offset by an increase in dollars per transaction. Dollars per transaction increased due to an increase in average unit retail and to a lesser extent an increase in units per transaction. Comparable sales decreases in accessories, men’s apparel, footwear, and junior’s apparel were partially offset by a comparable sales increase in hardgoods. For information as to how we define comparable sales, see “General” above.
Gross Profit
Gross profit was $268.6 million for fiscal 2015 compared to $287.1 million for fiscal 2014, a decrease of $18.5 million, or 6.4%. As a percentage of net sales, gross profit decreased 200 basis points in fiscal 2015 to 33.4%. The decrease was primarily driven by a 140 basis point impact due to deleveraging of our store occupancy costs, 30 basis points impact of the increase in ecommerce related costs including $1.2 million in exit costs associated with the closure of our Kansas fulfillment center and 20 basis point decrease in product margin.
29
Selling, General and Administrative Expenses
Selling, general and administrative (“SG&A”) expenses were $222.5 million for fiscal 2015 compared to $215.5 million for fiscal 2014, an increase of $7.0 million, or 3.2%. SG&A expenses as a percent of net sales increased by 110 basis points in fiscal 2015 to 27.7%. The increase was primarily driven by a 170 basis points due to deleveraging of store costs partially offset by 70 basis point decrease from the fiscal 2014 expense associated with the future incentive payments to be paid in conjunction with our acquisition of Blue Tomato.
Net Income
Net income for fiscal 2015 was $28.8 million, or $1.04 per diluted share, compared with net income of $43.2 million, or $1.47 per diluted share, for fiscal 2014. Our effective income tax rate for fiscal 2015 was 37.2% compared to 39.7% for fiscal 2014. The decrease in the effective tax rate for fiscal 2015 compared to fiscal 2014 was primarily due to the tax impact of foreign operations and the incentive payments in fiscal 2014.
Seasonality and Quarterly Results
As is the case with many retailers of apparel and related merchandise, our business is subject to seasonal influences. As a result, we have historically experienced, and expect to continue to experience, seasonal and quarterly fluctuations in our net sales and operating results. Our net sales and operating results are typically lower in the first and second quarters of our fiscal year, while the back-to-school and winter holiday periods in our third and fourth fiscal quarters historically have accounted for the largest percentage of our annual net sales. Quarterly results of operations may also fluctuate significantly as a result of a variety of factors, including the timing of store openings and the relative proportion of our new stores to mature stores, fashion trends and changes in consumer preferences, calendar shifts of holiday or seasonal periods, changes in merchandise mix, timing of promotional events, general economic conditions, competition and weather conditions.
The following table sets forth selected unaudited quarterly consolidated statements of income data. The unaudited quarterly information has been prepared on a basis consistent with the audited consolidated financial statements included elsewhere herein and includes all adjustments that we consider necessary for a fair presentation of the information shown. This information should be read in conjunction with our audited consolidated financial statements and the notes thereto. The operating results for any fiscal quarter are not indicative of the operating results for a full fiscal year or for any future period and there can be no assurance that any trend reflected in such results will continue in the future.
|
|
|
Fiscal 2016 |
|
|||||||||||||
|
|
|
First Quarter |
|
|
Second Quarter |
|
|
Third Quarter |
|
|
Fourth Quarter |
|
||||
|
|
|
(in thousands, except stores and per share data) |
|
|||||||||||||
|
Net sales |
|
$ |
172,970 |
|
|
$ |
178,272 |
|
|
$ |
221,391 |
|
|
$ |
263,635 |
|
|
Gross profit |
|
$ |
49,958 |
|
|
$ |
54,844 |
|
|
$ |
76,178 |
|
|
$ |
94,022 |
|
|
Operating profit |
|
$ |
(3,941 |
) |
|
$ |
(1,136 |
) |
|
$ |
16,913 |
|
|
$ |
27,907 |
|
|
Net income |
|
$ |
(2,137 |
) |
|
$ |
(838 |
) |
|
$ |
10,695 |
|
|
$ |
18,184 |
|
|
Basic earnings per share |
|
$ |
(0.08 |
) |
|
$ |
(0.03 |
) |
|
$ |
0.44 |
|
|
$ |
0.74 |
|
|
Diluted earnings per share |
|
$ |
(0.08 |
) |
|
$ |
(0.03 |
) |
|
$ |
0.43 |
|
|
$ |
0.74 |
|
|
Number of stores open at the end of the period |
|
|
663 |
|
|
|
673 |
|
|
|
688 |
|
|
|
685 |
|
|
Comparable sales increase (decrease) |
|
|
-7.5 |
% |
|
|
-4.9 |
% |
|
|
4.0 |
% |
|
|
5.1 |
% |
30
|
|
|
Fiscal 2015 |
|
|||||||||||||
|
|
|
First Quarter |
|
|
Second Quarter |
|
|
Third Quarter |
|
|
Fourth Quarter |
|
||||
|
|
|
(in thousands, except stores and per share data) |
|
|||||||||||||
|
Net sales |
|
$ |
177,610 |
|
|
$ |
179,819 |
|
|
$ |
204,320 |
|
|
$ |
242,434 |
|
|
Gross profit |
|
$ |
56,535 |
|
|
$ |
57,773 |
|
|
$ |
70,059 |
|
|
$ |
84,257 |
|
|
Operating profit |
|
$ |
4,126 |
|
|
$ |
5,312 |
|
|
$ |
15,224 |
|
|
$ |
21,503 |
|
|
Net income |
|
$ |
2,770 |
|
|
$ |
3,213 |
|
|
$ |
9,653 |
|
|
$ |
13,149 |
|
|
Basic earnings per share |
|
$ |
0.10 |
|
|
$ |
0.11 |
|
|
$ |
0.36 |
|
|
$ |
0.50 |
|
|
Diluted earnings per share |
|
$ |
0.09 |
|
|
$ |
0.11 |
|
|
$ |
0.36 |
|
|
$ |
0.50 |
|
|
Number of stores open at the end of the period |
|
616 |
|
|
640 |
|
|
653 |
|
|
658 |
|
||||
|
Comparable sales increase (decrease) |
|
|
3.0 |
% |
|
|
-4.5 |
% |
|
|
-7.3 |
% |
|
|
-9.5 |
% |
Liquidity and Capital Resources
Our primary uses of cash are for operational expenditures, inventory purchases and capital investments, including new stores, store remodels, store relocations, store fixtures and ongoing infrastructure improvements. Additionally, we may use cash for the repurchase of our common stock. Refer to Note 11, “Stockholders’ Equity” of the Notes to Consolidated Financial Statements for further discussion of the repurchase plan. Historically, our main source of liquidity has been cash flows from operations.
The significant components of our working capital are inventories and liquid assets such as cash, cash equivalents, current marketable securities and receivables, reduced by accounts payable and accrued expenses. Our working capital position benefits from the fact that we generally collect cash from sales to customers the same day or within several days of the related sale, while we typically have longer payment terms with our vendors.
At January 28, 2017 and January 30, 2016, cash, cash equivalents and current marketable securities were $78.8 million and $75.6 million. Working capital, the excess of current assets over current liabilities, was $137.8 million at the end of fiscal 2016, an increase of 6.2% from $129.8 million at the end of fiscal 2015. The increase in cash, cash equivalents and current marketable securities in fiscal 2016 was due primarily to cash provided by operating activities of $48.5 million, partially offset by $21.6 million repurchase of common stock and $20.4 million of capital expenditures primarily related to the opening of 28 new stores in fiscal 2016 and 14 remodels and relocations.
The following table summarizes our cash flows from operating, investing and financing activities (in thousands):
|
|
|
Fiscal 2016 |
|
|
Fiscal 2015 |
|
|
Fiscal 2014 |
|
|||
|
Total cash provided by (used in) |
|
|
|
|
|
|
|
|
|
|
|
|
|
Operating activities |
|
$ |
48,455 |
|
|
$ |
48,607 |
|
|
$ |
89,937 |
|
|
Investing activities |
|
|
(51,515 |
) |
|
|
64,730 |
|
|
|
(73,873 |
) |
|
Financing activities |
|
|
(20,074 |
) |
|
|
(90,758 |
) |
|
|
(13,933 |
) |
|
Effect of exchange rate changes on cash and cash equivalents |
|
|
218 |
|
|
|
(278 |
) |
|
|
(903 |
) |
|
Increase in cash and cash equivalents |
|
$ |
(22,916 |
) |
|
$ |
22,301 |
|
|
$ |
1,228 |
|
|
|
31
Net cash provided by operating activities decreased by $0.1 million in fiscal 2016 to $48.5 million from $48.6 million in fiscal 2015. Net cash provided by operating activities decreased by $41.3 million in fiscal 2015 to $48.6 million from $89.9 million in fiscal 2014. Our operating cash flows result primarily from cash received from our customers, offset by cash payments we make for inventory, employee compensation, store occupancy expenses and other operational expenditures. Cash received from our customers generally corresponds to our net sales. Because our customers primarily use credit cards or cash to buy from us, our receivables from customers settle quickly. Changes to our operating cash flows have historically been driven primarily by changes in operating income, which is impacted by changes to non-cash items such as depreciation, amortization and accretion, deferred taxes and excess tax benefit from stock-based compensation, and changes to the components of working capital.
Investing Activities
Net cash provided by investing activities was $51.5 million in fiscal 2016 related to $25.7 million in net purchases of marketable securities, $20.4 million of capital expenditures primarily for new store openings and existing store remodels or relocations and $5.4 million for the acquisition of Fast Times (net of cash acquired). Net cash provided by investing activities was $64.7 million in fiscal 2015 related to $99.6 million in net sales of marketable securities partially offset by $34.8 million of capital expenditures primarily for new store openings and existing store remodels or relocations. Net cash used in investing activities was $73.9 million in fiscal 2014 related to $35.8 million of capital expenditures primarily for new store openings and existing store remodels or relocations and $38.1 million in net purchases of marketable securities.
Financing Activities
Net cash used in financing activities in fiscal 2016 was $20.1 million, related to $21.6 million cash paid for repurchase of common stock, partially offset by $0.9 million in proceeds from stock-based compensation exercises and related tax benefits and $0.6 million of net proceeds on revolving credit facilities. Net cash used in financing activities in fiscal 2015 was $90.8 million, related to $92.2 million cash paid for repurchase of common stock, partially offset by proceeds from stock-based compensation exercises and related tax benefits of $1.6 million. Net cash used in financing activities in fiscal 2014 was $13.9 million, related to $19.6 million cash paid for repurchase of common stock and $2.1 million of net payments on revolving credit facilities, and other liabilities, partially offset by proceeds from stock-based compensation exercises and related tax benefits of $7.7 million.
Sources of Liquidity
Our most significant sources of liquidity continue to be funds generated by operating activities and available cash, cash equivalents and current marketable securities. We expect these sources of liquidity and available borrowings under our revolving credit facility will be sufficient to meet our foreseeable cash requirements for operations and planned capital expenditures for at least the next twelve months. Beyond this time frame, if cash flows from operations are not sufficient to meet our capital requirements, then we will be required to obtain additional equity or debt financing in the future. However, there can be no assurance that equity or debt financing will be available to us when we need it or, if available, that the terms will be satisfactory to us and not dilutive to our then-current shareholders.
32
As of January 28, 2017, we maintained an asset-based revolving credit agreement with Wells Fargo Bank, National Association as administrative agent, collateral agent, letter of credit issuer and lenders, which provides for a senior secured revolving credit facility of up to $100 million (“ABL Facility”), subject to a borrowing base, with a letter of credit sub-limit of $10 million. The ABL Facility is available for working capital and other general corporate purposes. The ABL Facility will mature on February 5, 2021. The ABL Facility is secured by a first-priority security interest in substantially all of the personal property (but not the real property) of the Company. Amounts borrowed under the ABL Facility bear interest, at the Company’s option, at either an adjusted LIBOR rate plus a margin of 1.25% to 1.75% per annum, or an alternate base rate plus a margin of 0.25% to 0.75% per annum. The Company is also required to pay a fee of 0.25% per annum on undrawn commitments under the ABL Facility. Customary agency fees and letter of credit fees are also payable in respect of the ABL Facility. There were no borrowings outstanding under the ABL Facility at January 28, 2017 or the replaced secured revolving credit facility at January 30, 2016. We had no open commercial letters of credit outstanding under our secured revolving credit facility at January 28, 2017 and January 30, 2016.
Additionally, we have revolving lines of credit of up to $21.9 million, the proceeds of which are used to fund certain international operations. The revolving lines of credit bears interest at 1.63%. There were no borrowings or open commercial letters of credit outstanding under these revolving lines of credit at January 28, 2017 and January 30, 2016.
Capital Expenditures
Our capital requirements include construction and fixture costs related to the opening of new stores and remodel and relocation expenditures for existing stores. Future capital requirements will depend on many factors, including the pace of new store openings, the availability of suitable locations for new stores and the nature of arrangements negotiated with landlords. In that regard, our net investment to open a new store has varied significantly in the past due to a number of factors, including the geographic location and size of the new store, and is likely to vary significantly in the future.
During fiscal 2016, we spent $20.4 million on capital expenditures, which consisted of $16.1 million of costs related to investment in 28 new stores and 14 remodeled or relocated stores, $2.3 million associated with improvements to our websites and the Customer Engagement Suite and $2.0 million in other improvements.
During fiscal 2015, we spent $34.8 million on capital expenditures, which consisted of $30.9 million of costs related to investment in 57 new stores and 19 remodeled or relocated stores, $1.9 million associated with improvements to our websites and the Customer Engagement Suite and $2.0 million in other improvements.
During fiscal 2014, we spent $35.8 million on capital expenditures, which consisted of $31.5 million of costs related to investment in 56 new stores and 19 remodeled or relocated stores, $1.7 million associated with improvements to our websites and $2.6 million in other improvements.
In fiscal 2017, we expect to spend approximately $24 million to $26 million on capital expenditures, a majority of which will relate to leasehold improvements and fixtures for the approximately 18 new stores we plan to open in fiscal 2017 and remodels or relocations of existing stores and improvements to our websites and the Customer Engagement Suite There can be no assurance that the number of stores that we actually open in fiscal 2017 will not be different from the number of stores we plan to open, or that actual fiscal 2017 capital expenditures will not differ from this expected amount.
33
Our consolidated financial statements are prepared in accordance with U.S. GAAP. In connection with the preparation of our consolidated financial statements, we are required to make assumptions and estimates about future events, and apply judgments that affect the reported amounts of assets, liabilities, revenue, expenses and the related disclosures. We base our assumptions, estimates and judgments on historical experience, current trends and other factors that we believe to be relevant at the time our consolidated financial statements are prepared. On a regular basis, we review the accounting policies, assumptions, estimates and judgments to ensure that our consolidated financial statements are presented fairly and in accordance with U.S. GAAP. However, because future events and their effects cannot be determined with certainty, actual results could differ from our assumptions and estimates, and such differences could be material.
Our significant accounting policies are discussed in Note 2, “Summary of Significant Accounting Policies,” in the Notes to Consolidated Financial Statements found in Part IV Item 15 of this Form 10-K. We believe that the following accounting estimates are the most critical to aid in fully understanding and evaluating our reported financial results, and they require our most difficult, subjective or complex judgments, resulting from the need to make estimates about the effect of matters that are inherently uncertain.
34
|
Description |
|
Judgments and Uncertainties |
|
|
Effect If Actual Results Differ |
|
|
|
|
|
|
|
|
Valuation of Merchandise Inventories |
|
|
|
|
|
|
|
|
|
|
|
|
|
We value our inventory at the lower of average cost or fair market value through the establishment of write-down and inventory loss reserves. Our write-down reserve represents the excess of the carrying value over the amount we expect to realize from the ultimate sales or other disposal of the inventory. Write-downs establish a new cost basis for our inventory. Subsequent changes in facts or circumstances do not result in the restoration of previously recorded write-downs or an increase in that newly established cost basis. Our inventory loss reserve represents anticipated physical inventory losses (“shrinkage reserve”) that have occurred since the last physical inventory. |
|
Our write-down reserve contains uncertainties because the calculation requires management to make assumptions based on the current rate of sales, the age and profitability of inventory and other factors. Our shrinkage reserve contains uncertainties because the calculation requires management to make assumptions and to apply judgment regarding a number of factors, including historical percentages that can be affected by changes in merchandise mix and changes in actual shrinkage trends. |
|
|
We have not made any material changes in the accounting methodology used to calculate our write-down and shrinkage reserves in the past three fiscal years. We do not believe there is a reasonable likelihood that there will be a material change in the future estimates we use to calculate our inventory reserves. However, if actual results are not consistent with our estimates, we may be exposed to losses or gains that could be material. A 10% decrease in the sales price of our inventory at January 28, 2017 would have decreased net income by $0.1 million in fiscal 2016. A 10% increase in actual physical inventory shrinkage rate at January 28, 2017 would have decreased net income by $0.3 million in fiscal 2016. |
|
|
|
|
|
|
|
|
Valuation of Long-Lived Assets |
|
|
|
|
|
|
|
|
|
|
|
|
|
We review the carrying value of our long-lived assets for impairment whenever events or changes in circumstances indicate that the carrying value of such asset or asset group may not be recoverable. Recoverability of assets to be held and used is determined by a comparison of the carrying amount of an asset to future undiscounted net cash flows expected to be generated by the asset. If such assets are considered impaired, the impairment recognized is measured by comparing the projected discounted cash flow of the asset to the asset carrying value. The actual economic lives of our fixed assets may be different from our estimated useful lives, thereby resulting in a different carrying value. These evaluations could result in a change in the depreciable lives of these assets and therefore our depreciation expense in future periods. |
|
Events that may result in an impairment include the decision to close a store or facility or a significant decrease in the operating performance of a long-lived asset group. Our impairment calculations contain uncertainties because they require management to make assumptions and to apply judgment to estimate future cash flows and asset fair values, including forecasting future sales, gross profit and operating expenses. In addition to historical results, current trends and initiatives, and long-term macro-economic and industry factors are qualitatively considered. Additionally management seeks input from store operations related to local economic conditions, including the impact of closures of selected co-tenants who occupy the mall. Our fixed assets accounting methodology contains uncertainties because it requires management to make estimates with respect to the useful lives of our fixed assets that we believe are reasonable. |
|
|
We do not believe there is a reasonable likelihood that there will be a material change in the estimates or assumptions we use to calculate long-lived asset impairment losses. However, if actual results are not consistent with our estimates and assumptions, our operating results could be adversely affected. Declines in projected cash flow of the assets could result in impairment. Although management believes that the current useful life estimates assigned to our fixed assets are reasonable, factors could cause us to change our estimates, thus affecting the future calculation of depreciation. |
|
|
|
|
|
|
|
35
|
Description |
|
Judgments and Uncertainties |
|
|
Effect If Actual Results Differ |
|
|
|
|
|
|
|
|
|
|
|
|
|
|
|
|
|
|
|
|
|
|
Revenue is recognized upon purchase at our retail store locations. For our ecommerce sales, revenue is recognized upon delivery to the customer. Revenue is recorded net of sales returns and deductions for promotions. Revenue is not recorded on the sale of gift cards. We record the sale of gift cards as a current liability and recognize revenue when a customer redeems a gift card. Additionally, the portion of gift cards that will not be redeemed (“gift card breakage”) is recognized in revenue after 24 months, at which time the likelihood of redemption is considered remote based on our historical redemption data. |
|
Our revenue recognition accounting methodology contains uncertainties because it requires management to make assumptions regarding future sales returns and the amount and timing of gift cards projected to be redeemed by gift card recipients. Our estimate of the amount and timing of sales returns and gift cards to be redeemed is based primarily on historical experience. |
|
|
We have not made any material changes in the accounting methodology used to measure future sales returns or recognize revenue for our gift card program in the past three fiscal years. We do not believe there is a reasonable likelihood that there will be a material change in the future estimates or assumptions we use to recognize revenue. However, if actual results are not consistent with our estimates or assumptions, we may be exposed to losses or gains that could be material. A 10% increase in our sales return reserve at January 28, 2017 would have decreased net income by $0.1 million in fiscal 2016. A 10% increase in our unredeemed gift card breakage life at January 28, 2017 would have decreased net income by $0.5 million in fiscal 2016. |
|
|
|
|
|
|
|
|
Accounting for Income Taxes |
|
|
|
|
|
|
|
|
|
|
|
|
|
As part of the process of preparing the consolidated financial statements, income taxes are estimated for each of the jurisdictions in which we operate. This process involves estimating actual current tax exposure together with assessing temporary differences resulting from differing treatment of items for tax and accounting purposes. These differences result in deferred tax assets and liabilities, which are included on the consolidated balance sheets. Valuation allowances may be established when necessary to reduce deferred tax assets to the amount expected to be realized. We regularly evaluate the likelihood of realizing the benefit for income tax positions we have taken in various federal, state and foreign filings by considering all relevant facts, circumstances and information available to us. If we believe it is more likely than not that our position will be sustained, we recognize a benefit at the largest amount that we believe is cumulatively greater than 50% likely to be realized. |
|
Significant judgment is required in evaluating our tax positions and determining our provision for income taxes. During the ordinary course of business, there are many transactions and calculations for which the ultimate tax determination is uncertain. For example, our effective tax rates could be adversely affected by earnings being lower than anticipated in jurisdictions where we have lower statutory rates and higher than anticipated in jurisdictions where we have higher statutory rates, by changes in the valuation of our deferred tax assets and liabilities or by changes in the relevant tax, accounting and other laws, regulations, principles and interpretations. Unrecognized tax benefits require significant management judgment regarding applicable statutes and their related interpretation and our particular facts and circumstances. |
|
|
Although management believes that the income tax related judgments and estimates are reasonable, actual results could differ and we may be exposed to losses or gains that could be material. Upon income tax audit, any unfavorable tax settlement generally would require use of our cash and may result in an increase in our effective income tax rate in the period of resolution. A favorable tax settlement may be recognized as a reduction in our effective income tax rate in the period of resolution. |
|
|
|
|
|
|
|
36
|
Description |
|
Judgments and Uncertainties |
|
|
Effect If Actual Results Differ |
|
|
|
|
|
|
|
|
|
|
|
|
|
|
|
|
|
|
|
|
|
|
We are subject to various claims and contingencies related to lawsuits, insurance, regulatory and other matters arising out of the normal course of business. We accrue a liability if the likelihood of an adverse outcome is probable and the amount is estimable. If the likelihood of an adverse outcome is only reasonably possible (as opposed to probable), or if an estimate is not determinable, we provide disclosure of a material claim or contingency. |
|
Significant judgment is required in evaluating our claims and contingencies, including determining the probability that a liability has been incurred and whether such liability is reasonably estimable. The estimated accruals for claims and contingencies are made based on the best information available, which can be highly subjective. |
|
|
Although management believes that the contingency related judgments and estimates are reasonable, our accrual for claims and contingencies could fluctuate as additional information becomes known, thereby creating variability in our results of operations from period to period. Additionally, actual results could differ and we may be exposed to losses or gains that could be material. |
|
|
|
|
|
|
|
|
Goodwill and Indefinite-lived Intangible Assets |
|
|
|
|
|
|
|
|
|
|
|
|
|
We assess goodwill and indefinite-lived intangible assets for impairment on an annual basis or more frequently if indicators of impairment arise. We perform this analysis at the reporting unit level.
We have an option to first perform a qualitative assessment to determine whether it is more likely than not that the fair value of a reporting unit is less than its carrying amount. If we choose not to perform the qualitative test or we determine that it is more likely than not that the fair value of the reporting unit is less than the carrying amount, we perform a quantitative two-step impairment test. The first step compares the carrying value of the reporting unit to its estimated fair value, which is based on the perspective of a market-participant. If the fair value of the reporting unit is lower than the carrying value, then a second step is performed to quantify the amount of the impairment.
We test our indefinite-lived intangible assets by comparing the carry value to the estimated fair value. An impairment loss is recorded for the amount in which the carrying value exceeds the estimated fair value. |
|
The goodwill and indefinite-lived intangible assets impairment tests require management to make assumptions and judgments.
Our quantitative goodwill analysis of fair value is determined using a combination of the income and market approaches. Key assumptions in the income approach include estimating future cash flows, long-term growth rates and weighted average cost of capital. Our ability to realize the future cash flows used in our fair value calculations is affected by factors such as changes in economic conditions, operating performance and our business strategies. Key assumptions in the market approach include identifying companies and transactions with comparable business factors, such as earnings growth, profitability, business and financial risk.
The fair value of the trade names and trademarks is determined using the relief from royalty method, which requires assumptions including forecasting future sales, discount rates and royalty rates. |
|
|
Based on the results of our annual impairment test for goodwill and indefinite-lived intangible assets, no impairment was recorded. As of October 30, 2016, the most recent impairment assessment date, the estimated fair value of our Blue Tomato reporting unit, which had $40.3 million of goodwill, exceeded the carrying value by 20%. The remaining reporting units had a fair value substantially in excess of the carrying value. If actual results are not consistent with our estimates or assumptions, or there are significant changes in any of these estimates, projections and assumptions, could have a material effect of the fair value of these assets in future measurement periods and result in an impairment, which could materially affect our results of operations.
|
37
Contractual Obligations and Commercial Commitments
There were no material changes outside the ordinary course of business in our contractual obligations during fiscal 2016. The following table summarizes the total amount of future payments due under our contractual obligations at January 28, 2017 (in thousands):
|
|
|
|
|
|
|
|
|
|
|
Fiscal 2018 and |
|
|
Fiscal 2020 and |
|
|
|
|
|
||
|
|
|
Total |
|
|
Fiscal 2017 |
|
|
Fiscal 2019 |
|
|
Fiscal 2021 |
|
|
Thereafter |
|
|||||
|
Operating lease obligations (1) |
|
$ |
411,733 |
|
|
$ |
67,790 |
|
|
$ |
119,781 |
|
|
$ |
100,045 |
|
|
$ |
124,117 |
|
|
Purchase obligations (2) |
|
|
168,841 |
|
|
|
168,841 |
|
|
|
— |
|
|
|
— |
|
|
|
— |
|
|
Total |
|
$ |
580,574 |
|
|
$ |
236,631 |
|
|
$ |
119,781 |
|
|
$ |
100,045 |
|
|
$ |
124,117 |
|
|
(1) |
Amounts do not include contingent rent and real estate taxes, insurance, common area maintenance charges and other executory costs obligations. See Note 9, “Commitments and Contingencies,” in the Notes to Consolidated Financial Statements found in Part IV Item 15 of the Form 10-K, for additional information related to our operating leases. |
|
(2) |
We have an option to cancel these commitments with no notice prior to shipment, except for certain private label and international purchase orders in which we are obligated to repay contractual amounts upon cancellation. |
Off-Balance Sheet Arrangements
At January 28, 2017, we did not have any off-balance sheet arrangements, as defined in Item 303(a)(4)(ii) of Regulation S-K.
Impact of Inflation/Deflation
We do not believe that inflation has had a material impact on our net sales or operating results for the past three fiscal years. However, substantial increases in costs, including the price of raw materials, labor, energy and other inputs used in the production of our merchandise or the potential change in regulatory environment, could have a significant impact on our business and the industry in the future. Additionally, while deflation could positively impact our merchandise costs, it could have an adverse effect on our average unit retail price, resulting in lower sales and operating results.
Recent Accounting Pronouncements
See Note 2, “Summary of Significant Accounting Policies,” in the Notes to Consolidated Financial Statements found in Part IV Item 15 of this Form 10-K.
Interest Rate Risk
Our earnings are affected by changes in market interest rates as a result of our short-term and long-term marketable securities, which are primarily invested in state and local municipal securities and variable-rate demand notes, which have long-term nominal maturity dates but feature variable interest rates that reset at short-term intervals. If our current portfolio average yield rate decreased by 10% in fiscal 2016, our net income would have decreased by $0.1 million. This amount is determined by considering the impact of the hypothetical yield rates on our cash, cash equivalents, short-term marketable securities and assumes no changes in our investment structure.
During different times of the year, due to the seasonality of our business, we may borrow under our revolving credit lines. To the extent we borrow under this revolving credit lines, we are exposed to the market risk related to changes in interest rates. At January 28, 2017, we had no borrowings outstanding under our revolving lines of credit.
38
Our international subsidiaries operate with functional currencies other than the U.S. dollar. Therefore, we must translate revenues, expenses, assets and liabilities from functional currencies into U.S. dollars at exchange rates in effect during, or at the end of, the reporting period. As a result, the fluctuation in the value of the U.S. dollar against other currencies affects the reported amounts of revenues, expenses, assets and liabilities. Assuming a 10% change in foreign exchange rates, fiscal 2016 net sales would have decreased or increased by approximately $12.5 million. As we expand our international operations, our exposure to exchange rate fluctuations will continue to increase. To date, we have not used derivatives to manage foreign currency exchange risk.
We import merchandise from foreign countries. As a result, any significant or sudden change in the financial, banking or currency policies and practices of these countries could have a material adverse impact on our financial position, results of operations and cash flows.
Information with respect to this item is set forth in “Index to the Consolidated Financial Statements,” found in Part IV Item 15 of this Form 10-K.
None.
Evaluation of Disclosure Controls and Procedures. We carried out an evaluation, under the supervision and with the participation of our management, including our Chief Executive Officer (“CEO”) and Chief Financial Officer (“CFO”), of the effectiveness of the design and operation of our disclosure controls and procedures (as defined in Securities Exchange Act Rule 13a-15(e)). Based on this evaluation, our CEO and CFO concluded that, as of January 28, 2017, our disclosure controls and procedures were effective.
Changes in Internal Control Over Financial Reporting. There has been no change in our internal control over financial reporting (as defined in Securities Exchange Act Rule 13a-15(f)) during the quarter ended January 30, 2016 that has materially affected, or is reasonably likely to materially affect, our internal control over financial reporting.
Management’s Annual Report on Internal Control over Financial Reporting. The management of the Company is responsible for establishing and maintaining adequate internal control over financial reporting, as defined in Rule 13a-15(f) of the Securities Exchange Act of 1934. The Company’s internal control over financial reporting is a process designed to provide reasonable assurance regarding the reliability of financial reporting and the preparation of financial statements for external purposes in accordance with generally accepted accounting principles.
This process includes policies and procedures that: (i) pertain to the maintenance of records that, in reasonable detail, accurately and fairly reflect the transactions of the Company; (ii) provide reasonable assurance that transactions are recorded as necessary to permit preparation of financial statements in accordance with generally accepted accounting principles, and that receipts and expenditures of the Company are being made only in accordance with authorizations of management and directors of the Company; and (iii) provide reasonable assurance regarding prevention or timely detection of unauthorized acquisition, use, or disposition of the Company’s assets that could have a material effect on the financial statements. Because of its inherent limitations, internal control over financial reporting may not prevent or detect misstatements, and can provide only reasonable, not absolute, assurance that the objectives of the control system are met. Furthermore, because of changes in conditions, the effectiveness of internal control may vary over time.
39
The Company’s management, with the participation of the Chief Executive Officer and Chief Financial Officer, assessed the effectiveness of the Company’s internal control over financial reporting as of January 28, 2017. Management’s assessment was based on criteria described in the Internal Control—Integrated Framework (2013) issued by the Committee of Sponsoring Organizations of the Treadway Commission. Based on this assessment, management concluded that the Company’s internal control over financial reporting was effective as of January 28, 2017.
The effectiveness of the Company’s internal control over financial reporting as of January 28, 2017 has been audited by Moss Adams LLP, the Company’s independent registered public accounting firm, as stated in their report, which is included below.
40
REPORT OF INDEPENDENT REGISTERED PUBLIC ACCOUNTING FIRM
The Board of Directors and Shareholders
Zumiez Inc.
We have audited Zumiez Inc.’s (the “Company”) internal control over financial reporting as of January 28, 2017, based on criteria established in Internal Control - Integrated Framework (2013) issued by the Committee of Sponsoring Organizations of the Treadway Commission. The Company’s management is responsible for maintaining effective internal control over financial reporting and for its assessment of the effectiveness of internal control over financial reporting, included in the accompanying Management’s Annual Report on Internal Control over Financial Reporting. Our responsibility is to express an opinion on the Company’s internal control over financial reporting based on our audit.
We conducted our audit in accordance with the standards of the Public Company Accounting Oversight Board (United States). Those standards require that we plan and perform the audit to obtain reasonable assurance about whether effective internal control over financial reporting was maintained in all material respects. Our audit included obtaining an understanding of internal control over financial reporting, assessing the risk that a material weakness exists, and testing and evaluating the design and operating effectiveness of internal control based on the assessed risk. Our audit also included performing such other procedures as we considered necessary in the circumstances. We believe that our audit provides a reasonable basis for our opinion.
A company’s internal control over financial reporting is a process designed to provide reasonable assurance regarding the reliability of financial reporting and the preparation of financial statements for external purposes in accordance with generally accepted accounting principles. A company’s internal control over financial reporting includes those policies and procedures that (1) pertain to the maintenance of records that, in reasonable detail, accurately and fairly reflect the transactions and dispositions of the assets of the company; (2) provide reasonable assurance that transactions are recorded as necessary to permit preparation of financial statements in accordance with generally accepted accounting principles, and that receipts and expenditures of the company are being made only in accordance with authorizations of management and directors of the company; and (3) provide reasonable assurance regarding prevention or timely detection of unauthorized acquisition, use, or disposition of the company’s assets that could have a material effect on the financial statements.
Because of its inherent limitations, internal control over financial reporting may not prevent or detect misstatements. Also, projections of any evaluation of effectiveness to future periods are subject to the risk that controls may become inadequate because of changes in conditions, or that the degree of compliance with the policies or procedures may deteriorate.
In our opinion, Zumiez Inc. maintained, in all material respects, effective internal control over financial reporting as of January 28, 2017, based on criteria established in Internal Control - Integrated Framework (2013) issued by the Committee of Sponsoring Organizations of the Treadway Commission.
We also have audited, in accordance with the standards of the Public Company Accounting Oversight Board (United States), the consolidated balance sheets of Zumiez Inc. as of January 28, 2017 and January 30, 2016, and the consolidated statements of income, comprehensive income, changes in shareholders’ equity, and cash flows for each of the three years in the period ended January 28, 2017, and our report dated March 13, 2017, expressed an unqualified opinion on those consolidated financial statements.
/s/ Moss Adams LLP
Seattle, Washington
March 13, 2017
41
None.
42
Information regarding our directors and nominees for directorship is presented under the headings “Election of Directors,” in our definitive proxy statement for use in connection with our 2016 Annual Meeting of Shareholders (the “Proxy Statement”) that will be filed within 120 days after our fiscal year ended January 28, 2017 and is incorporated herein by this reference thereto. Information concerning our executive officers is set forth under the heading “Executive Officers” in our Proxy Statement, and is incorporated herein by reference thereto. Information regarding compliance with Section 16(a) of the Exchange Act, our code of conduct and ethics and certain information related to the Company’s Audit Committee, Compensation Committee and Governance Committee is set forth under the heading “Corporate Governance” in our Proxy Statement, and is incorporated herein by reference thereto.
Information regarding the compensation of our directors and executive officers and certain information related to the Company’s Compensation Committee is set forth under the headings “Executive Compensation,” “Director Compensation,” “Compensation Discussion and Analysis,” “Report of the Compensation Committee of the Board of Directors” and “Compensation Committee Interlocks and Insider Participation” in our Proxy Statement, and is incorporated herein by this reference thereto.
|
Item 12. |
SECURITY OWNERSHIP OF CERTAIN BENEFICIAL OWNERS, AND MANAGEMENT AND RELATED SHAREHOLDER MATTERS |
Information with respect to security ownership of certain beneficial owners and management is set forth under the headings “Security Ownership of Certain Beneficial Owners and Management” and “Equity Compensation Plan Information” in our Proxy Statement, and is incorporated herein by this reference thereto.
Information regarding certain relationships and related transactions and director independence is presented under the heading “Corporate Governance” in our Proxy Statement, and is incorporated herein by this reference thereto.
Information concerning principal accounting fees and services is presented under the heading “Fees Paid to Independent Registered Public Accounting Firm for Fiscal 2016 and 2015” in our Proxy Statement, and is incorporated herein by this reference thereto.
43
|
(a) |
(1) |
Consolidated Financial Statements |
|
|
(2) |
Consolidated Financial Statement Schedules: |
All financial statement schedules are omitted because the required information is presented either in the consolidated financial statements or notes thereto, or is not applicable, required or material.
|
|
(3) |
Exhibits included or incorporated herein: |
See Exhibit Index.
44
INDEX TO CONSOLIDATED FINANCIAL STATEMENTS
|
|
46 |
|
|
|
47 |
|
|
|
48 |
|
|
|
49 |
|
|
|
50 |
|
|
|
51 |
|
|
|
52 |
45
REPORT OF INDEPENDENT REGISTERED PUBLIC ACCOUNTING FIRM
The Board of Directors and Shareholders
Zumiez Inc.
We have audited the accompanying consolidated balance sheets of Zumiez Inc. (the “Company”) as of January 28, 2017 and January 30, 2016, and the related consolidated statements of income, comprehensive income, changes in shareholders’ equity and cash flows for each of the three years in the period ended January 28, 2017. These consolidated financial statements are the responsibility of the Company’s management. Our responsibility is to express an opinion on these consolidated financial statements based on our audits.
We conducted our audits in accordance with the standards of the Public Company Accounting Oversight Board (United States). Those standards require that we plan and perform the audit to obtain reasonable assurance about whether the consolidated financial statements are free of material misstatement. An audit includes examining, on a test basis, evidence supporting the amounts and disclosures in the consolidated financial statements. An audit also includes assessing the accounting principles used and significant estimates made by management, as well as evaluating the overall consolidated financial statement presentation. We believe that our audits provide a reasonable basis for our opinion.
In our opinion, the consolidated financial statements referred to above present fairly, in all material respects, the consolidated financial position of Zumiez Inc. as of January 28, 2017 and January 30, 2016, and the consolidated results of its operations and its cash flows for each of the three years in the period ended January 28, 2017, in conformity with generally accepted accounting principles in the United States of America.
We also have audited, in accordance with the standards of the Public Company Accounting Oversight Board (United States), Zumiez Inc.’s internal control over financial reporting as of January 28, 2017, based on criteria established in Internal Control - Integrated Framework (2013) issued by the Committee of Sponsoring Organizations of the Treadway Commission and our report dated March 13, 2017 expressed an unqualified opinion thereon.
/s/ Moss Adams LLP
Seattle, Washington
March 13, 2017
46
(In thousands)
|
|
|
January 28, 2017 |
|
|
January 30, 2016 |
|
||
|
Assets |
|
|
|
|
|
|
|
|
|
Current assets |
|
|
|
|
|
|
|
|
|
Cash and cash equivalents |
|
$ |
20,247 |
|
|
$ |
43,163 |
|
|
Marketable securities |
|
|
58,579 |
|
|
|
32,391 |
|
|
Receivables |
|
|
12,538 |
|
|
|
12,840 |
|
|
Inventories |
|
|
106,924 |
|
|
|
98,299 |
|
|
Prepaid expenses and other current assets |
|
|
13,075 |
|
|
|
12,204 |
|
|
Total current assets |
|
|
211,363 |
|
|
|
198,897 |
|
|
Fixed assets, net |
|
|
129,651 |
|
|
|
137,233 |
|
|
Goodwill |
|
|
56,001 |
|
|
|
54,245 |
|
|
Intangible assets, net |
|
|
14,610 |
|
|
|
11,766 |
|
|
Deferred tax assets, net |
|
|
7,041 |
|
|
|
4,634 |
|
|
Other long-term assets |
|
|
8,017 |
|
|
|
7,920 |
|
|
Total long-term assets |
|
|
215,320 |
|
|
|
215,798 |
|
|
Total assets |
|
$ |
426,683 |
|
|
$ |
414,695 |
|
|
|
|
|
|
|
|
|
|
|
|
Liabilities and Shareholders’ Equity |
|
|
|
|
|
|
|
|
|
Current liabilities |
|
|
|
|
|
|
|
|
|
Trade accounts payable |
|
$ |
25,529 |
|
|
$ |
21,919 |
|
|
Accrued payroll and payroll taxes |
|
|
14,914 |
|
|
|
12,466 |
|
|
Income taxes payable |
|
|
1,866 |
|
|
|
4,066 |
|
|
Deferred rent and tenant allowances |
|
|
8,344 |
|
|
|
8,116 |
|
|
Other liabilities |
|
|
22,944 |
|
|
|
22,575 |
|
|
Total current liabilities |
|
|
73,597 |
|
|
|
69,142 |
|
|
Long-term deferred rent and tenant allowances |
|
|
41,066 |
|
|
|
43,779 |
|
|
Other long-term liabilities |
|
|
4,969 |
|
|
|
4,817 |
|
|
Total long-term liabilities |
|
|
46,035 |
|
|
|
48,596 |
|
|
Total liabilities |
|
|
119,632 |
|
|
|
117,738 |
|
|
Commitments and contingencies (Note 9) |
|
|
|
|
|
|
|
|
|
Shareholders’ equity |
|
|
|
|
|
|
|
|
|
Preferred stock, no par value, 20,000 shares authorized; none issued and outstanding |
|
|
— |
|
|
|
— |
|
|
Common stock, no par value, 50,000 shares authorized; 24,945 shares issued and outstanding at January 28, 2017 and 25,708 shares issued and outstanding at January 30, 2016 |
|
|
140,984 |
|
|
|
135,013 |
|
|
Accumulated other comprehensive loss |
|
|
(16,488 |
) |
|
|
(15,247 |
) |
|
Retained earnings |
|
|
182,555 |
|
|
|
177,191 |
|
|
Total shareholders’ equity |
|
|
307,051 |
|
|
|
296,957 |
|
|
Total liabilities and shareholders’ equity |
|
$ |
426,683 |
|
|
$ |
414,695 |
|
See accompanying notes to consolidated financial statements
47
CONSOLIDATED STATEMENTS OF INCOME
(In thousands, except per share amounts)
|
|
|
|
Fiscal Year Ended |
|
|||||||||
|
|
|
|
January 28, |
|
|
January 30, |
|
|
January 31, |
|
|||
|
|
|
|
2017 |
|
|
2016 |
|
|
2015 |
|
|||
|
Net sales |
|
$ |
|
836,268 |
|
|
$ |
804,183 |
|
|
$ |
811,551 |
|
|
Cost of goods sold |
|
|
|
561,266 |
|
|
|
535,559 |
|
|
|
524,468 |
|
|
Gross profit |
|
|
|
275,002 |
|
|
|
268,624 |
|
|
|
287,083 |
|
|
Selling, general and administrative expenses |
|
|
|
235,259 |
|
|
|
222,459 |
|
|
|
215,512 |
|
|
Operating profit |
|
|
|
39,743 |
|
|
|
46,165 |
|
|
|
71,571 |
|
|
Interest income, net |
|
|
|
32 |
|
|
|
529 |
|
|
|
637 |
|
|
Other income (expense), net |
|
|
|
449 |
|
|
|
(833 |
) |
|
|
(557 |
) |
|
Earnings before income taxes |
|
|
|
40,224 |
|
|
|
45,861 |
|
|
|
71,651 |
|
|
Provision for income taxes |
|
|
|
14,320 |
|
|
|
17,076 |
|
|
|
28,459 |
|
|
Net income |
|
$ |
|
25,904 |
|
|
$ |
28,785 |
|
|
$ |
43,192 |
|
|
Basic earnings per share |
|
$ |
|
1.05 |
|
|
$ |
1.05 |
|
|
$ |
1.50 |
|
|
Diluted earnings per share |
|
$ |
|
1.04 |
|
|
$ |
1.04 |
|
|
$ |
1.47 |
|
|
Weighted average shares used in computation of earnings per share: |
|
|
|
|
|
|
|
|
|
||||
|
Basic |
|
|
|
24,727 |
|
|
|
27,497 |
|
|
|
28,871 |
|
|
Diluted |
|
|
|
24,908 |
|
|
|
27,673 |
|
|
|
29,288 |
|
See accompanying notes to consolidated financial statements
48
CONSOLIDATED STATEMENTS OF COMPREHENSIVE INCOME
(In thousands)
|
|
|
Fiscal Year Ended |
|
|||||||||
|
|
|
January 28, 2017 |
|
|
January 30, 2016 |
|
|
January 31, 2015 |
|
|||
|
Net income |
|
$ |
25,904 |
|
|
$ |
28,785 |
|
|
$ |
43,192 |
|
|
Other comprehensive loss, net of tax and reclassification adjustments: |
|
|
|
|
|
|
|
|
|
|
|
|
|
Foreign currency translation |
|
|
(1,338 |
) |
|
|
(3,931 |
) |
|
|
(15,995 |
) |
|
Net change in unrealized gain (loss) on available-for-sale investments |
|
|
97 |
|
|
|
(38 |
) |
|
|
7 |
|
|
Other comprehensive loss, net |
|
|
(1,241 |
) |
|
|
(3,969 |
) |
|
|
(15,988 |
) |
|
Comprehensive income |
|
$ |
24,663 |
|
|
$ |
24,816 |
|
|
$ |
27,204 |
|
See accompanying notes to consolidated financial statements
49
CONSOLIDATED STATEMENTS OF CHANGES IN SHAREHOLDERS’ EQUITY
(In thousands)
|
|
|
|
|
|
|
|
|
|
|
Accumulated Other |
|
|
|
|
|
|
|
|
||
|
|
|
Common Stock |
|
|
Comprehensive |
|
|
Retained |
|
|
|
|
||||||||
|
|
|
Shares |
|
|
Amount |
|
|
Income (Loss) |
|
|
Earnings |
|
|
Total |
|
|||||
|
Balance at February 1, 2014 |
|
|
29,619 |
|
|
$ |
114,983 |
|
|
$ |
4,710 |
|
|
$ |
215,961 |
|
|
$ |
335,654 |
|
|
Net income |
|
|
— |
|
|
|
— |
|
|
|
— |
|
|
|
43,192 |
|
|
|
43,192 |
|
|
Other comprehensive loss, net |
|
|
— |
|
|
|
— |
|
|
|
(15,988 |
) |
|
|
— |
|
|
|
(15,988 |
) |
|
Issuance and exercise of stock-based awards, including net tax benefit of $1,355 |
|
|
557 |
|
|
|
6,591 |
|
|
|
— |
|
|
|
— |
|
|
|
6,591 |
|
|
Stock-based compensation expense |
|
|
— |
|
|
|
7,520 |
|
|
|
— |
|
|
|
— |
|
|
|
7,520 |
|
|
Repurchase of common stock |
|
|
(758 |
) |
|
|
— |
|
|
|
— |
|
|
|
(17,445 |
) |
|
|
(17,445 |
) |
|
Balance at January 31, 2015 |
|
|
29,418 |
|
|
$ |
129,094 |
|
|
$ |
(11,278 |
) |
|
$ |
241,708 |
|
|
$ |
359,524 |
|
|
Net income |
|
|
— |
|
|
|
— |
|
|
|
— |
|
|
|
28,785 |
|
|
|
28,785 |
|
|
Other comprehensive loss, net |
|
|
— |
|
|
|
— |
|
|
|
(3,969 |
) |
|
|
— |
|
|
|
(3,969 |
) |
|
Issuance and exercise of stock-based awards, including net tax benefit of $714 |
|
|
255 |
|
|
|
923 |
|
|
|
— |
|
|
|
— |
|
|
|
923 |
|
|
Stock-based compensation expense |
|
|
— |
|
|
|
4,996 |
|
|
|
— |
|
|
|
— |
|
|
|
4,996 |
|
|
Repurchase of common stock |
|
|
(3,965 |
) |
|
|
— |
|
|
|
— |
|
|
|
(93,302 |
) |
|
|
(93,302 |
) |
|
Balance at January 30, 2016 |
|
|
25,708 |
|
|
$ |
135,013 |
|
|
$ |
(15,247 |
) |
|
$ |
177,191 |
|
|
$ |
296,957 |
|
|
Net income |
|
|
— |
|
|
|
— |
|
|
|
— |
|
|
|
25,904 |
|
|
|
25,904 |
|
|
Other comprehensive loss, net |
|
|
— |
|
|
|
— |
|
|
|
(1,241 |
) |
|
|
— |
|
|
|
(1,241 |
) |
|
Issuance and exercise of stock-based awards, including net tax loss of $887 |
|
|
432 |
|
|
|
1,393 |
|
|
|
— |
|
|
|
— |
|
|
|
1,393 |
|
|
Stock-based compensation expense |
|
|
— |
|
|
|
4,578 |
|
|
|
— |
|
|
|
— |
|
|
|
4,578 |
|
|
Repurchase of common stock |
|
|
(1,195 |
) |
|
|
— |
|
|
|
— |
|
|
|
(20,540 |
) |
|
|
(20,540 |
) |
|
Balance at January 28, 2017 |
|
|
24,945 |
|
|
$ |
140,984 |
|
|
$ |
(16,488 |
) |
|
$ |
182,555 |
|
|
$ |
307,051 |
|
See accompanying notes to consolidated financial statements
50
CONSOLIDATED STATEMENTS OF CASH FLOWS
(In thousands)
|
|
|
Fiscal Year Ended |
|
|||||||||
|
|
|
January 28, 2017 |
|
|
January 30, 2016 |
|
|
January 31, 2015 |
|
|||
|
Cash flows from operating activities: |
|
|
|
|
|
|
|
|
|
|
|
|
|
Net income |
|
$ |
25,904 |
|
|
$ |
28,785 |
|
|
$ |
43,192 |
|
|
Adjustments to reconcile net income to net cash provided by operating activities: |
|
|
|
|
|
|
|
|
|
|
|
|
|
Depreciation, amortization and accretion |
|
|
27,916 |
|
|
|
30,410 |
|
|
|
29,167 |
|
|
Deferred taxes |
|
|
(2,555 |
) |
|
|
(2,698 |
) |
|
|
(610 |
) |
|
Stock-based compensation expense |
|
|
4,578 |
|
|
|
4,996 |
|
|
|
7,520 |
|
|
Excess tax benefit from stock-based compensation |
|
|
(3 |
) |
|
|
(714 |
) |
|
|
(1,355 |
) |
|
Other |
|
|
1,564 |
|
|
|
4,009 |
|
|
|
1,109 |
|
|
Changes in operating assets and liabilities: |
|
|
|
|
|
|
|
|
|
|
|
|
|
Receivables |
|
|
413 |
|
|
|
(1,184 |
) |
|
|
(2,990 |
) |
|
Inventories |
|
|
(7,984 |
) |
|
|
(5,953 |
) |
|
|
(10,850 |
) |
|
Prepaid expenses and other current assets |
|
|
(1,793 |
) |
|
|
(133 |
) |
|
|
(4,702 |
) |
|
Trade accounts payable |
|
|
3,261 |
|
|
|
(9,103 |
) |
|
|
14,744 |
|
|
Accrued payroll and payroll taxes |
|
|
2,313 |
|
|
|
(483 |
) |
|
|
2,718 |
|
|
Income taxes payable |
|
|
(3,713 |
) |
|
|
1 |
|
|
|
(23 |
) |
|
Deferred rent and tenant allowances |
|
|
(2,673 |
) |
|
|
2,613 |
|
|
|
5,937 |
|
|
Other liabilities |
|
|
1,227 |
|
|
|
(1,939 |
) |
|
|
6,080 |
|
|
Net cash provided by operating activities |
|
|
48,455 |
|
|
|
48,607 |
|
|
|
89,937 |
|
|
Cash flows from investing activities: |
|
|
|
|
|
|
|
|
|
|
|
|
|
Additions to fixed assets |
|
|
(20,400 |
) |
|
|
(34,834 |
) |
|
|
(35,758 |
) |
|
Acquisitions, net of cash acquired |
|
|
(5,395 |
) |
|
|
- |
|
|
|
- |
|
|
Purchases of marketable securities and other investments |
|
|
(86,826 |
) |
|
|
(59,286 |
) |
|
|
(125,971 |
) |
|
Sales and maturities of marketable securities and other investments |
|
|
61,106 |
|
|
|
158,850 |
|
|
|
87,856 |
|
|
Net cash (used in) provided by investing activities |
|
|
(51,515 |
) |
|
|
64,730 |
|
|
|
(73,873 |
) |
|
Cash flows from financing activities: |
|
|
|
|
|
|
|
|
|
|
|
|
|
Proceeds from revolving credit facilities |
|
|
23,079 |
|
|
|
43,173 |
|
|
|
6,943 |
|
|
Payments on revolving credit facilities |
|
|
(22,429 |
) |
|
|
(43,255 |
) |
|
|
(9,009 |
) |
|
Repurchase of common stock |
|
|
(21,607 |
) |
|
|
(92,235 |
) |
|
|
(19,557 |
) |
|
Proceeds from exercise of stock-based awards, net of withholding tax |
|
|
880 |
|
|
|
845 |
|
|
|
6,335 |
|
|
Excess tax benefit from stock-based compensation |
|
|
3 |
|
|
|
714 |
|
|
|
1,355 |
|
|
Net cash used in financing activities |
|
|
(20,074 |
) |
|
|
(90,758 |
) |
|
|
(13,933 |
) |
|
Effect of exchange rate changes on cash and cash equivalents |
|
|
218 |
|
|
|
(278 |
) |
|
|
(903 |
) |
|
Net (decrease) increase in cash and cash equivalents |
|
|
(22,916 |
) |
|
|
22,301 |
|
|
|
1,228 |
|
|
Cash and cash equivalents, beginning of period |
|
|
43,163 |
|
|
|
20,862 |
|
|
|
19,634 |
|
|
Cash and cash equivalents, end of period |
|
$ |
20,247 |
|
|
$ |
43,163 |
|
|
$ |
20,862 |
|
|
Supplemental disclosure on cash flow information: |
|
|
|
|
|
|
|
|
|
|
|
|
|
Cash paid during the period for income taxes |
|
$ |
20,462 |
|
|
$ |
19,630 |
|
|
$ |
28,770 |
|
|
Accrual for purchases of fixed assets |
|
|
1,191 |
|
|
|
1,166 |
|
|
|
2,372 |
|
|
Accrual for repurchase of common stock |
|
|
— |
|
|
|
1,067 |
|
|
|
— |
|
See accompanying notes to consolidated financial statements
51
NOTES TO CONSOLIDATED FINANCIAL STATEMENTS
1. Nature of Business and Basis of Presentation
Nature of Business—Zumiez Inc., including its wholly-owned subsidiaries, (“Zumiez”, the “Company,” “we,” “us,” “its” and “our”) is a leading specialty retailer of apparel, footwear, accessories and hardgoods for young men and women who want to express their individuality through the fashion, music, art and culture of action sports, streetwear, and other unique lifestyles. At January 28, 2017, we operated 685 stores; 603 in the United States (“U.S.”), 48 in Canada, 29 in Europe and 5 in Australia. We operate under the names Zumiez, Blue Tomato and Fast Times. Additionally, we operate ecommerce websites at www.zumiez.com, www.blue-tomato.com and www.fasttimes.com.au.
In August 2016, we acquired 100% of the outstanding stock of Fast Times Skateboarding (“Fast Times”) for $7.1 million paid in $5.7 million of cash and $1.4 million in shares of common stock. Fast Times is an Australian specialty retailer of skateboards, hardware, apparel and footwear. All assets and liabilities assumed were measured at fair value on the date of the acquisition and primarily consisted of inventory, fixed assets, intangible assets and goodwill.
Fiscal Year—We use a fiscal calendar widely used by the retail industry that results in a fiscal year consisting of a 52- or 53-week period ending on the Saturday closest to January 31. Each fiscal year consists of four 13-week quarters, with an extra week added to the fourth quarter every five or six years. The fiscal years ended January 28, 2017, January 30, 2016 and January 31, 2015 were 52-week periods.
Basis of Presentation—The accompanying consolidated financial statements have been prepared in accordance with generally accepted accounting principles in the United States of America (“U.S. GAAP”). The consolidated financial statements include the accounts of Zumiez Inc. and its wholly-owned subsidiaries. All significant intercompany transactions and balances are eliminated in consolidation.
2. Summary of Significant Accounting Policies
Use of Estimates—The preparation of financial statements in conformity with U.S. GAAP requires estimates and assumptions that affect the reported amounts of assets and liabilities and the disclosure of contingent assets and liabilities at the date of the consolidated financial statements as well as the reported amounts of revenues and expenses during the reporting period. These estimates can also affect supplemental information disclosed by us, including information about contingencies, risk and financial condition. Actual results could differ from these estimates and assumptions.
Fair Value of Financial Instruments—We disclose the estimated fair value of our financial instruments. Financial instruments are generally defined as cash, evidence of ownership interest in an entity or a contractual obligation that both conveys to one entity a right to receive cash or other financial instruments from another entity and imposes on the other entity the obligation to deliver cash or other financial instruments to the first entity. Our financial instruments, other than those presented in Note 10, “Fair Value Measurements,” include cash and cash equivalents, receivables, payables and other liabilities. The carrying amounts of cash and cash equivalents, receivables, payables and other liabilities approximate fair value because of the short-term nature of these instruments. Our policy is to present transfers into and transfers out of hierarchy levels as of the actual date of the event or change in circumstances that caused the transfer.
Cash and Cash Equivalents—We consider all highly liquid investments with original maturity of three months or less when purchased to be cash equivalents.
Concentration of Risk—We maintain our cash and cash equivalents in accounts with major financial institutions in the form of demand deposits, money market accounts and state and local municipal securities. Deposits in these financial institutions may exceed the amount of federal deposit insurance provided on such deposits.
52
Marketable Securities—Our marketable securities primarily consist of state and local municipal securities and variable-rate demand notes. Variable-rate demand notes are considered highly liquid. Although the variable-rate demand notes have long-term nominal maturity dates, the interest rates generally reset weekly. Despite the long-term nature of the underlying securities of the variable-rate demand notes, we have the ability to quickly liquidate these securities, which have an embedded put option that allows the bondholder to sell the security at par plus accrued interest.
Investments are considered to be impaired when a decline in fair value is determined to be other-than-temporary. If the cost of an investment exceeds its fair value, we evaluate information about the underlying investment that is publicly available such as analyst reports, applicable industry data and other pertinent information and assess our intent and ability to hold the security. For fixed-income securities, we also evaluate whether we have plans to sell the security or it is more likely than not we will be required to sell the security before recovery. The investment would be written down to its fair value at the time the impairment is deemed to have occurred and a new cost basis is established. Future adverse changes in market conditions, continued poor operating results of underlying investments or other factors could result in further losses that may not be reflected in an investment’s current carrying value, possibly requiring an additional impairment charge in the future.
Inventories—Merchandise inventories are valued at the lower of cost or fair market value. The cost of merchandise inventories are based upon an average cost methodology. Merchandise inventories may include items that have been written down to our best estimate of their net realizable value. Our decisions to write-down our merchandise inventories are based on their current rate of sale, the age of the inventory, the profitability of the inventory and other factors. The inventory related to this reserve is not marked up in subsequent periods. The inventory reserve includes inventory whose estimated market value is below cost and an estimate for inventory shrinkage. Shrinkage refers to a reduction in inventory due to shoplifting, employee theft and other matters. We estimate an inventory shrinkage reserve for anticipated losses for the period. We have reserved for inventory at January 28, 2017 and January 30, 2016 in the amounts of $4.8 million and $4.7 million.
Fixed Assets—Fixed assets primarily consist of leasehold improvements, fixtures, land, buildings, computer equipment, software and store equipment. Fixed assets are stated at cost less accumulated depreciation utilizing the straight-line method over the assets’ estimated useful lives. The useful lives of our major classes of fixed assets are as follows:
|
|
|
|
Leasehold improvements |
Lesser of 10 years or the term of the lease |
|
Fixtures |
3 to 7 years |
|
Buildings, land and building and land improvements |
15 to 39 years |
|
Computer equipment, software, store equipment & other |
3 to 5 years |
The cost and related accumulated depreciation of assets sold or otherwise disposed of is removed from fixed assets and the related gain or loss is recorded in selling, general and administrative expenses on the consolidated statements of income.
Asset Retirement Obligations—An asset retirement obligation (“ARO”) represents a legal obligation associated with the retirement of a tangible long-lived asset that is incurred upon the acquisition, construction, development or normal operation of that long-lived asset. Our AROs are associated with leasehold improvements that, at the end of a lease, we are contractually obligated to remove in order to comply with certain lease agreements. The ARO balance at January 28, 2017 and January 30, 2016 is $2.7 million and $2.6 million and is recorded in other liabilities and other long-term liabilities on the consolidated balance sheets and will be subsequently adjusted for changes in fair value. The associated estimated asset retirement costs are capitalized as part of the carrying amount of the long-lived asset and depreciated over its useful life.
53
Valuation of Long-Lived Assets—We review the carrying value of long-lived assets or asset groups (defined as a store, corporate facility or distribution center) for impairment when events or changes in circumstances indicate that the carrying values may not be recoverable. Recoverability of assets to be held and used is determined by a comparison of the carrying amount of an asset or asset group to future undiscounted net cash flows expected to be generated by the asset. If such assets are considered impaired, the impairment recognized is measured by comparing the fair value of the assets or asset group to the carrying values. The estimation of future cash flows from operating activities requires significant judgments of factors that include forecasting future sales, gross profit and operating expenses. In addition to historical results, current trends and initiatives, and long-term macro-economic and industry factors are qualitatively considered. Additionally management seeks input from store operations related to local economic conditions. Impairment charges are included in selling, general and administrative expenses on the consolidated statements of income.
Goodwill—Goodwill represents the excess of purchase price over the fair value of acquired tangible and identifiable intangible net assets. We test goodwill for impairment on an annual basis or more frequently if indicators of impairment are present. We perform our annual impairment measurement test on the first day of the fourth quarter. Events that may trigger an early impairment review include significant changes in the current business climate, future expectations of economic conditions, declines in our operating results of our reporting units, or an expectation that the carrying amount may not be recoverable.
We have an option to test goodwill for impairment by first performing a qualitative assessment to determine whether it is more likely than not that the fair value of the reporting unit is less than the carrying amount. If we choose not to perform the qualitative test or we determine that it is more likely than not that the fair value of the reporting unit is less than the carrying amount, we perform a quantitative two-step impairment test. The first step compares the carrying value of the reporting unit to its estimated fair value, which is based on the perspective of a market-participant. If the fair value of the reporting unit is lower than the carrying value, then a second step is performed to quantify the amount of the impairment. The second step includes estimating the fair value of the reporting unit by taking the net assets of the reporting unit as if the reporting unit had been acquired in a business combination. Then, the implied fair value of the reporting unit’s goodwill is compared to the carrying amount of that goodwill. If the carrying amount of the reporting unit’s goodwill exceeds the implied fair value of the goodwill, we recognize an impairment loss in an amount equal to the excess, not to exceed the carrying amount.
We generally determine the fair value of each of our reporting units based on a combination of the income approach and the market valuation approaches. Key assumptions in the income approach include estimating future cash flows, long-term growth rates and weighted average cost of capital. Our ability to realize the future cash flows used in our fair value calculations is affected by factors such as changes in economic conditions, operating performance and our business strategies. Key assumptions in the market approaches include identifying companies and transactions with comparable business factors, such as earnings growth, profitability, business and financial risk.
Intangible Assets—Our intangible assets consist of trade names and trademarks with indefinite lives and certain definite-lived intangible assets. We test our indefinite-lived intangible assets for impairment on an annual basis, or more frequently if indicators of impairment are present. We test our indefinite-lived assets by estimating the fair value of the asset and comparing that to the carrying value, an impairment loss is recorded for the amount that carrying value exceeds the estimated fair value. The fair value of the trade names and trademarks is determined using the relief from royalty method. This method assumes that the trade name and trademarks have value to the extent that their owner is relieved of the obligation to pay royalties for the benefits received from them. The assumptions used in this method requires management judgment and estimates in forecasting future revenue growth, discount rates, and royalty rates.
54
Definite-lived intangible assets, which consist of developed technology, customer relationships and non-complete agreements, are amortized using the straight-line method over their estimated useful lives. Additionally, we test the definite-lived intangible assets when facts and circumstances indicate that the carrying values may not be recoverable. We first assess the recoverability of our definite-lived intangible assets by comparing the undiscounted cash flows of the definite-lived asset less its carrying value. If the undiscounted cash flows are less than the carrying value, we then determine the estimated fair value of our definite-lived asset by taking the estimated future operating cash flows derived from the operation to which the asset relates over its remaining useful life, using a discounted cash flow analysis and comparing it to the carrying value. Any impairment would be measured as the difference between the carrying amount and the estimated fair value. Changes in any of these estimates, projections and assumptions could have a material effect of the fair value of these assets in future measurement periods and result in an impairment which could materially affect our results of operations.
Deferred Rent, Rent Expense and Tenant Allowances—We lease our stores and certain corporate and other operating facilities under operating leases. A majority of our leases provide for ongoing co-tenancy requirements or early cancellation clauses that would further lower rental rates, or permit lease terminations, or both, in the event that co-tenants cease to operate for specific periods or if certain sales levels are not met in specific periods. Most of the store leases require payment of a specified minimum rent and a contingent rent based on a percentage of the store’s net sales in excess of a specified threshold, as well as real estate taxes, insurance, common area maintenance charges and other executory costs. Most of the lease agreements have defined escalating rent provisions, which are straight-lined over the term of the related lease. We recognize rent expense over the term of the lease, plus the construction period prior to occupancy of the retail location. For certain locations, we receive tenant allowances and report these amounts as a liability, which is amortized as a reduction to rent expense over the term of the lease.
Claims and Contingencies—We are subject to various claims and contingencies related to lawsuits, insurance, regulatory and other matters arising out of the normal course of business. We accrue a liability if the likelihood of an adverse outcome is probable and the amount is estimable. If the likelihood of an adverse outcome is only reasonably possible (as opposed to probable), or if an estimate is not determinable, we provide disclosure of a material claim or contingency.
Revenue Recognition—Revenue is recognized upon purchase at our retail store locations. For our ecommerce sales, revenue is recognized upon delivery to the customer. Taxes collected from our customers are recorded on a net basis. We accrue for estimated sales returns by customers based on historical return experience. The allowance for sales returns at January 28, 2017 was $2.2 million and at January 30, 2016 was $2.0 million. We record the sale of gift cards as a current liability and recognize revenue when a customer redeems a gift card. Additionally, the portion of gift cards that will not be redeemed (“gift card breakage”) is recognized in net sales after 24 months, at which time the likelihood of redemption is considered remote based on our historical redemption patterns. For the fiscal years ended January 28, 2017, January 30, 2016 and January 31, 2015, we recorded net sales related to gift card breakage income of $1.1 million, $0.9 million and $0.9 million.
Loyalty Program—We have a customer loyalty program, the Zumiez STASH, which allows members to earn points for purchases or performance of certain activities. The points can be redeemed for a broad range of rewards, including product and experiential rewards. Points earned for purchases are recorded as a reduction of net sales based on the fair value of the points at the time the points are earned and the revenue is recognized upon redemption of points for rewards. Points earned for the performance of activities are recorded as marketing expense based on the estimated cost of the points. The deferred revenue related to our customer loyalty program was $4.3 million at January 28, 2017 and $3.1 million at January 30, 2016.
Cost of Goods Sold—Cost of goods sold consists of branded merchandise costs and our private label merchandise costs including design, sourcing, importing and inbound freight costs. Our cost of goods sold also includes shrinkage, buying, occupancy, ecommerce fulfillment, distribution and warehousing costs (including associated depreciation) and freight costs for store merchandise transfers. Cash consideration received from vendors is reported as a reduction of cost of goods sold if the inventory has sold, a reduction of the carrying value of the inventory if the inventory is still on hand, or a reduction of selling, general and administrative expense if the amounts are reimbursements of specific, incremental and identifiable costs of selling the vendors’ products.
55
Shipping Revenue and Costs—We include shipping revenue related to ecommerce sales in net sales and the related freight cost is charged to cost of goods sold.
Selling, General and Administrative Expense—Selling, general and administrative expenses consist primarily of store personnel wages and benefits, administrative staff and infrastructure expenses, freight costs for merchandise shipments from the distribution centers to the stores, store supplies, depreciation on fixed assets at the home office and stores, facility expenses, training expenses and advertising and marketing costs. Credit card fees, insurance, public company expenses, legal expenses, amortization of intangibles assets and other miscellaneous operating costs are also included in selling, general and administrative expenses.
Advertising—We expense advertising costs as incurred, except for catalog costs, which are expensed once the catalog is mailed. Advertising expenses are net of sponsorships and vendor reimbursements. Advertising expense was $10.0 million, $9.5 million and $9.4 million for the fiscal years ended January 28, 2017, January 30, 2016 and January 31, 2015.
Stock-Based Compensation—We account for stock-based compensation by recording the estimated fair value of stock-based awards granted as compensation expense over the vesting period, net of estimated forfeitures. Stock-based compensation expense is attributed using the straight-line method. We estimate forfeitures of stock-based awards based on historical experience and expected future activity. The fair value of restricted stock awards and units is measured based on the closing price of our common stock on the date of grant. The fair value of stock option grants is estimated on the date of grant using the Black-Scholes option pricing model.
Common Stock Share Repurchases—We may repurchase shares of our common stock under authorizations made from time to time by our Board of Directors. Under applicable Washington State law, shares repurchased are retired and not presented separately as treasury stock on the consolidated financial statements. Instead, the value of repurchased shares is deducted from retained earnings.
Income Taxes—We use the asset and liability method of accounting for income taxes. Using this method, deferred tax assets and liabilities are recorded based on the differences between the financial reporting and tax basis of assets and liabilities. The deferred tax assets and liabilities are calculated using the enacted tax rates and laws that we expect to be in effect when the differences are expected to reverse. We routinely evaluate the likelihood of realizing the benefit of our deferred tax assets and may record a valuation allowance if, based on all available evidence, it is determined that it is more likely than not that all or some portion of the deferred tax benefit will not to be realized.
We regularly evaluate the likelihood of realizing the benefit of income tax positions that we have taken in various federal, state and foreign filings by considering all relevant facts, circumstances and information available. If we believe it is more likely than not that our position will be sustained, we recognize a benefit at the largest amount that we believe is cumulatively greater than 50% likely to be realized. Interest and penalties related to income tax matters are classified as a component of income tax expense. Unrecognized tax benefits are recorded in other long-term liabilities on the consolidated balance sheets.
Our tax provision for interim periods is determined using an estimate of our annual effective rate, adjusted for discrete items, if any, that are taken into account in the relevant period. As the fiscal year progresses, we periodically refine our estimate based on actual events and earnings by jurisdiction. This ongoing estimation process can result in changes to our expected effective tax rate for the full fiscal year. When this occurs, we adjust the income tax provision during the quarter in which the change in estimate occurs so that our year-to-date provision equals our expected annual rate.
56
Earnings per Share—Basic earnings per share is based on the weighted average number of common shares outstanding during the period. Diluted earnings per share is based on the weighted average number of common shares and common share equivalents outstanding during the period. The dilutive effect of stock options and restricted stock is applicable only in periods of net income. Common share equivalents included in the computation represent shares issuable upon assumed exercise of outstanding stock options, employee stock purchase plan funds held to acquire stock and non-vested restricted stock. Potentially anti-dilutive securities not included in the calculation of diluted earnings per share are options to purchase common stock where the option exercise price is greater than the average market price of our common stock during the period reported.
Foreign Currency Translation—Assets and liabilities denominated in foreign currencies are translated into U.S. dollars, the reporting currency, at the exchange rate prevailing at the balance sheet date. Revenue and expenses denominated in foreign currencies are translated into U.S. dollars at the monthly average exchange rate for the period and the translation adjustments are reported as an element of accumulated other comprehensive loss on the consolidated balance sheets.
Segment Reporting—We identify our operating segments according to how our business activities are managed and evaluated. Our operating segments have been aggregated and are reported as one reportable segment based on the similar nature of products sold, production, merchandising and distribution processes involved, target customers and economic characteristics.
Recent Accounting Standards—In March 2016, the Financial Accounting Standards Board (“FASB”) issued an Accounting Standards Update (ASU) as part of its simplification initiative that includes multiple provisions intended to simplify various aspects of the accounting for share-based payments. Upon the adoption of the ASU, excess tax benefits and deficiencies for share-based payments are recorded as an adjustment of income taxes and reflected in operating cash flows rather than recorded in equity and reported in financing cash flows. The guidance allows for the employer to withhold up to the maximum statutory tax rates in the applicable jurisdictions without triggering liability accounting. The guidance also allows for a policy election to account for forfeitures as they occur rather than on an estimated basis. The new standard is effective for the fiscal year beginning after December 15, 2016, with early adoption permitted. We will adopt this standard beginning in the first quarter of fiscal 2017. We will continue to account for forfeitures on an estimated basis. The impact of this standard on our consolidated financial statements in future periods is dependent on our stock price at the time the awards vest and the number of awards that vest during a reporting period.
In February 2016, the FASB issued a comprehensive standard related to lease accounting to increase transparency and comparability among organizations by recognizing lease assets and lease liabilities on the balance sheet and disclosing key information about leasing arrangements. Most significantly, the new guidance requires lessees to recognize operating leases with a term of more than 12 months as lease assets and lease liabilities. The adoption will require a modified retrospective approach at the beginning of the earliest period presented. The new standard is effective for the fiscal year beginning after December 15, 2018, with early adoption permitted. We are continuing to evaluate the impact of this standard. We expect this standard to have a material impact on our consolidated financial statements.
In January 2016, the FASB issued a new standard related primarily to accounting for equity investments, financial liabilities where the fair value option has been elected, and the presentation and disclosure requirements for financial instruments. There will no longer be an available-for-sale classification and therefore, no changes in fair value will be reported in other comprehensive income for equity securities with readily determinable fair values. The new standard will be effective for the fiscal year beginning after December 15, 2017 and early adoption is permitted. We are currently evaluating the impact of this standard on our consolidated financial statements.
In July 2015, the FASB issued guidance simplifying the measurement of inventory. This standard requires entities that use inventory methods other than the last-in, first-out (LIFO) or retail inventory method to measure inventory at the lower of cost or net realizable value, which is defined as the estimated selling prices in the normal course of business, less reasonably predictable costs of completion, disposal, and transportation. We are required to adopt this guidance for the fiscal year beginning after December 31, 2016. We do not expect this standard to have a material impact on our consolidated financial statements.
57
In May 2015, the FASB issued guidance about a customer’s accounting for fees paid in a cloud computing arrangement. If a cloud computing arrangement includes a software license, then the customer should account for the software license element of the arrangement consistent with the acquisition of other software licenses. If a cloud computing arrangement does not include a software license, the customer should account for the arrangement as a service contract. The guidance is effective for the fiscal year beginning after December 15, 2015 and may be applied on either a prospective or retrospective basis. We adopted this guidance for the year ended January 28, 2017 and the adoption did not have a material impact on our consolidated financial statements.
In May 2014, the FASB issued a comprehensive new revenue recognition standard. The new standard allows for a full retrospective approach to transition or a modified retrospective approach. This guidance was effective for fiscal years and interim periods within those years beginning after December 15, 2016. In August 2015, the FASB issued updated guidance deferring the effective date for the fiscal year beginning after December 15, 2017 and will permit early adoption of the standard, but not before the original effective date of December 15, 2016. We are continuing to evaluate the impact of this standard but we do not expect the adoption of this standard to have a material impact on our consolidated financial statements. We are continuing to evaluate the method of adoption we will when transitioning to this new standard.
3. Goodwill and Intangible Assets
The following tables summarize the changes in the carrying amount of goodwill (in thousands):
|
Balance as of January 31, 2015 |
|
$ |
55,852 |
|
|
Effects of foreign currency translation |
|
|
(1,607 |
) |
|
Balance as of January 30, 2016 |
|
|
54,245 |
|
|
Goodwill acquired |
|
|
2,568 |
|
|
Effects of foreign currency translation |
|
|
(812 |
) |
|
Balance as of January 28, 2017 |
|
$ |
56,001 |
|
There was no impairment of goodwill for the fiscal years ended January 28, 2017, January 30, 2016 and January 31, 2015.
The following table summarizes the gross carrying amount, accumulated amortization and the net carrying amount of intangible assets (in thousands):
|
|
|
January 28, 2017 |
|
|||||||||
|
|
|
Gross Carrying Amount |
|
|
Accumulated Amortization |
|
|
Intangible Assets, Net |
|
|||
|
Intangible assets not subject to amortization: |
|
|
|
|
|
|
|
|
|
|
|
|
|
Trade names and trademarks |
|
$ |
14,402 |
|
|
$ |
— |
|
|
$ |
14,402 |
|
|
Intangible assets subject to amortization: |
|
|
|
|
|
|
|
|
|
|
|
|
|
Developed technology |
|
|
3,205 |
|
|
|
3,205 |
|
|
|
— |
|
|
Customer relationships |
|
|
2,375 |
|
|
|
2,375 |
|
|
|
— |
|
|
Non-compete agreements |
|
|
227 |
|
|
|
19 |
|
|
|
208 |
|
|
Total intangible assets |
|
$ |
20,209 |
|
|
$ |
5,599 |
|
|
$ |
14,610 |
|
|
|
|
January 30, 2016 |
|
|||||||||
|
|
|
Gross Carrying Amount |
|
|
Accumulated Amortization |
|
|
Intangible Assets, Net |
|
|||
|
Intangible assets not subject to amortization: |
|
|
|
|
|
|
|
|
|
|
|
|
|
Trade names and trademarks |
|
$ |
11,766 |
|
|
$ |
— |
|
|
$ |
11,766 |
|
|
Intangible assets subject to amortization: |
|
|
|
|
|
|
|
|
|
|
|
|
|
Developed technology |
|
|
3,267 |
|
|
|
3,267 |
|
|
|
— |
|
|
Customer relationships |
|
|
2,422 |
|
|
|
2,422 |
|
|
|
— |
|
|
Total intangible assets |
|
$ |
17,455 |
|
|
$ |
5,689 |
|
|
$ |
11,766 |
|
58
There was no impairment of intangible assets for the fiscal years ended January 28, 2017, January 30, 2016 and January 31, 2015.
Amortization expense of intangible assets for the fiscal years ended January 28, 2017, January 30, 2016 and January 31, 2015 was less than $0.1 million, $0.9 million and $2.3 million. Amortization expense of intangible assets is recorded in selling, general and administrative expense on the consolidated statements of income.
4. Cash, Cash Equivalents and Marketable Securities
The following tables summarize the estimated fair value of our cash, cash equivalents and marketable securities and the gross unrealized holding gains and losses (in thousands):
|
|
|
January 28, 2017 |
|
|||||||||||||
|
|
|
Amortized Cost |
|
|
Gross Unrealized Holding Gains |
|
|
Gross Unrealized Holding Losses |
|
|
Estimated Fair Value |
|
||||
|
Cash and cash equivalents: |
|
|
|
|
|
|
|
|
|
|
|
|
|
|
|
|
|
Cash |
|
$ |
19,190 |
|
|
$ |
— |
|
|
$ |
— |
|
|
$ |
19,190 |
|
|
Money market funds |
|
|
657 |
|
|
|
— |
|
|
|
— |
|
|
|
657 |
|
|
State and local government securities |
|
|
400 |
|
|
|
— |
|
|
|
— |
|
|
|
400 |
|
|
Total cash and cash equivalents |
|
|
20,247 |
|
|
|
— |
|
|
|
— |
|
|
|
20,247 |
|
|
Marketable securities: |
|
|
|
|
|
|
|
|
|
|
|
|
|
|
|
|
|
State and local government securities |
|
|
19,151 |
|
|
|
8 |
|
|
|
(30 |
) |
|
|
19,129 |
|
|
Variable-rate demand notes |
|
|
39,450 |
|
|
|
— |
|
|
|
— |
|
|
|
39,450 |
|
|
Total marketable securities |
|
$ |
58,601 |
|
|
$ |
8 |
|
|
$ |
(30 |
) |
|
$ |
58,579 |
|
|
|
|
January 30, 2016 |
|
|||||||||||||
|
|
|
Amortized Cost |
|
|
Gross Unrealized Holding Gains |
|
|
Gross Unrealized Holding Losses |
|
|
Estimated Fair Value |
|
||||
|
Cash and cash equivalents: |
|
|
|
|
|
|
|
|
|
|
|
|
|
|
|
|
|
Cash |
|
$ |
33,608 |
|
|
$ |
— |
|
|
$ |
— |
|
|
$ |
33,608 |
|
|
Money market funds |
|
|
9,555 |
|
|
|
— |
|
|
|
— |
|
|
|
9,555 |
|
|
Total cash and cash equivalents |
|
|
43,163 |
|
|
|
— |
|
|
|
— |
|
|
|
43,163 |
|
|
Marketable securities: |
|
|
|
|
|
|
|
|
|
|
|
|
|
|
|
|
|
State and local government securities |
|
|
32,754 |
|
|
|
8 |
|
|
|
(187 |
) |
|
|
32,575 |
|
|
Variable-rate demand notes |
|
|
644 |
|
|
|
— |
|
|
|
— |
|
|
|
644 |
|
|
Total marketable securities |
|
$ |
33,398 |
|
|
$ |
8 |
|
|
$ |
(187 |
) |
|
$ |
33,219 |
|
|
Less: Long-term marketable securities (1) |
|
|
|
|
|
|
|
|
|
|
|
|
|
|
(828 |
) |
|
Total current marketable securities |
|
|
|
|
|
|
|
|
|
|
|
|
|
$ |
32,391 |
|
|
(1) |
At January 30, 2016, we held one auction rate security, classified as available-for-sale marketable securities and included in other long-term assets on the consolidated balance sheet. |
All of our available-for-sale securities have an effective maturity date of two years or less and may be liquidated, at our discretion, prior to maturity.
59
The following tables summarize the gross unrealized holding losses and fair value for investments in an unrealized loss position, and the length of time that individual securities have been in a continuous loss position (in thousands):
|
|
|
January 28, 2017 |
|
|||||||||||||||||||||
|
|
|
Less Than Twelve Months |
|
|
12 Months or Greater |
|
|
Total |
|
|||||||||||||||
|
|
|
Fair Value |
|
|
Unrealized Losses |
|
|
Fair Value |
|
|
Unrealized Losses |
|
|
Fair Value |
|
|
Unrealized Losses |
|
||||||
|
Marketable securities: |
|
|
|
|
|
|
|
|
|
|
|
|
|
|
|
|
|
|
|
|
|
|
|
|
|
State and local government securities |
|
$ |
8,702 |
|
|
$ |
(30 |
) |
|
$ |
— |
|
|
$ |
— |
|
|
$ |
8,702 |
|
|
$ |
(30 |
) |
|
Total marketable securities |
|
$ |
8,702 |
|
|
$ |
(30 |
) |
|
$ |
— |
|
|
$ |
— |
|
|
$ |
8,702 |
|
|
$ |
(30 |
) |
|
|
|
January 30, 2016 |
|
|||||||||||||||||||||
|
|
|
Less Than Twelve Months |
|
|
12 Months or Greater |
|
|
Total |
|
|||||||||||||||
|
|
|
Fair Value |
|
|
Unrealized Losses |
|
|
Fair Value |
|
|
Unrealized Losses |
|
|
Fair Value |
|
|
Unrealized Losses |
|
||||||
|
Marketable securities: |
|
|
|
|
|
|
|
|
|
|
|
|
|
|
|
|
|
|
|
|
|
|
|
|
|
State and local government securities |
|
$ |
16,884 |
|
|
$ |
(15 |
) |
|
$ |
853 |
|
|
$ |
(172 |
) |
|
$ |
17,737 |
|
|
$ |
(187 |
) |
|
Total marketable securities |
|
$ |
16,884 |
|
|
$ |
(15 |
) |
|
$ |
853 |
|
|
$ |
(172 |
) |
|
$ |
17,737 |
|
|
$ |
(187 |
) |
We did not record a realized loss for other-than-temporary impairments during the fiscal years ended January 28, 2017, January 30, 2016 and January 31, 2015.
5. Receivables
Receivables consisted of the following (in thousands):
|
|
|
January 28, 2017 |
|
|
January 30, 2016 |
|
||
|
Credit cards receivable |
|
$ |
7,671 |
|
|
$ |
7,606 |
|
|
Income tax receivable |
|
|
568 |
|
|
|
86 |
|
|
Tenant allowances receivable |
|
|
268 |
|
|
|
1,201 |
|
|
Other receivables |
|
|
4,031 |
|
|
|
3,947 |
|
|
Receivables |
|
$ |
12,538 |
|
|
$ |
12,840 |
|
6. Fixed Assets
Fixed assets consisted of the following (in thousands):
|
|
|
January 28, 2017 |
|
|
January 30, 2016 |
|
||
|
Leasehold improvements |
|
$ |
173,916 |
|
|
$ |
164,930 |
|
|
Fixtures |
|
|
86,612 |
|
|
|
83,467 |
|
|
Buildings, land and building and land improvements |
|
|
28,118 |
|
|
|
28,198 |
|
|
Computer equipment, software, store equipment and other |
|
|
33,555 |
|
|
|
30,257 |
|
|
Fixed assets, at cost |
|
|
322,201 |
|
|
|
306,852 |
|
|
Less: Accumulated depreciation |
|
|
(192,550 |
) |
|
|
(169,619 |
) |
|
Fixed assets, net |
|
$ |
129,651 |
|
|
$ |
137,233 |
|
60
Depreciation expense on fixed assets is recognized on our consolidated income statement as follows (in thousands):
|
|
|
Fiscal Year Ended |
|
|||||||||
|
|
|
January 28, 2017 |
|
|
January 30, 2016 |
|
|
January 31, 2015 |
|
|||
|
Cost of goods sold |
|
$ |
1,049 |
|
|
$ |
1,238 |
|
|
$ |
1,230 |
|
|
Selling, general and administrative expenses |
|
|
25,843 |
|
|
|
26,113 |
|
|
|
23,513 |
|
|
Depreciation expense |
|
$ |
26,892 |
|
|
$ |
27,351 |
|
|
$ |
24,743 |
|
Impairment of Long-Lived Assets—We recorded $1.9 million, $3.1 million and $0.2 million of impairment of long-lived assets in selling, general and administrative expenses on the consolidated statements of income for the years ended January 28, 2017, January 30, 2016 and January 31, 2015.
7. Other Liabilities
Other liabilities consisted of the following (in thousands):
|
|
|
January 28, 2017 |
|
|
January 30, 2016 |
|
||
|
Unredeemed gift cards |
|
$ |
5,577 |
|
|
$ |
5,328 |
|
|
Accrued indirect taxes |
|
|
4,961 |
|
|
|
5,136 |
|
|
Deferred revenue |
|
|
4,902 |
|
|
|
3,726 |
|
|
Accrued payables |
|
|
4,189 |
|
|
|
4,485 |
|
|
Allowance for sales returns |
|
|
2,189 |
|
|
|
1,978 |
|
|
Accrual for repurchase of common stock |
|
|
— |
|
|
|
1,067 |
|
|
Other current liabilities |
|
|
1,126 |
|
|
|
855 |
|
|
Other liabilities |
|
$ |
22,944 |
|
|
$ |
22,575 |
|
8. Revolving Credit Facilities and Debt
On February 5, 2016, the Company entered into an asset-based revolving credit agreement with Wells Fargo Bank, National Association, which provides for a senior secured revolving credit facility of up to $100 million (“ABL Facility”), subject to a borrowing base, with a letter of credit sub-limit of $10 million. The ABL Facility is available for working capital and other general corporate purposes. The ABL Facility will mature on February 5, 2021.
The ABL Facility is secured by a first-priority security interest in substantially all of the personal property (but not the real property) of the Company. Amounts borrowed under the ABL Facility bear interest, at the Company’s option, at either an adjusted LIBOR rate plus a margin of 1.25% to 1.75% per annum, or an alternate base rate plus a margin of 0.25% to 0.75% per annum. The Company is also required to pay a fee of 0.25% per annum on undrawn commitments under the ABL Facility. Customary agency fees and letter of credit fees are also payable in respect of the ABL Facility.
There were no borrowings outstanding under the ABL Facility at January 28, 2017 or the replaced secured revolving credit facility at January 30, 2016. We had no open commercial letters of credit outstanding under our secured revolving credit facility at January 28, 2017 and January 30, 2016.
Additionally, we have revolving lines of credit of up to $21.9 million, the proceeds of which are used to fund certain international operations. The revolving lines of credit bears interest at 1.63%. There were no borrowings or open commercial letters of credit outstanding under these revolving lines of credit at January 28, 2017 and January 30, 2016.
61
9. Commitments and Contingencies
Operating Leases—Total rent expense is as follows (in thousands):
|
|
|
Fiscal Year Ended |
|
|||||||||
|
|
|
January 28, 2017 |
|
|
January 30, 2016 |
|
|
January 31, 2015 |
|
|||
|
Minimum rent expense |
|
$ |
73,888 |
|
|
$ |
68,904 |
|
|
$ |
62,336 |
|
|
Contingent rent expense |
|
|
2,618 |
|
|
|
2,196 |
|
|
|
2,219 |
|
|
Total rent expense (1) |
|
$ |
76,506 |
|
|
$ |
71,100 |
|
|
$ |
64,555 |
|
|
(1) |
Total rent expense does not include real estate taxes, insurance, common area maintenance charges and other executory costs, which were $41.3 million, $38.6 million and $35.6 million for the fiscal years ended January 28, 2017, January 30, 2016 and January 31, 2015. |
Future minimum lease payments at January 28, 2017 are as follows (in thousands):
|
Fiscal 2017 |
|
$ |
67,790 |
|
|
Fiscal 2018 |
|
|
63,241 |
|
|
Fiscal 2019 |
|
|
56,540 |
|
|
Fiscal 2020 |
|
|
52,647 |
|
|
Fiscal 2021 |
|
|
47,398 |
|
|
Thereafter |
|
|
124,117 |
|
|
Total (1) |
|
$ |
411,733 |
|
|
(1) |
Amounts in the table do not include contingent rent and real estate taxes, insurance, common area maintenance charges and other executory costs obligations. |
Purchase Commitments—At January 28, 2017 and January 30, 2016, we had outstanding purchase orders to acquire merchandise from vendors of $168.8 million and $159.7 million. We have an option to cancel these commitments with no notice prior to shipment, except for certain private label and international purchase orders in which we are obligated to repay contractual amounts upon cancellation.
Litigation—We are involved from time to time in claims, proceedings and litigation arising in the ordinary course of business. We have made accruals with respect to these matters, where appropriate, which are reflected in our consolidated financial statements. For some matters, the amount of liability is not probable or the amount cannot be reasonably estimated and therefore accruals have not been made. We may enter into discussions regarding settlement of these matters, and may enter into settlement agreements, if we believe settlement is in the best interest of our shareholders.
Insurance Reserves—We use a combination of third-party insurance and self-insurance for a number of risk management activities including workers’ compensation, general liability and employee-related health care benefits. We maintain reserves for our self-insured losses, which are estimated based on actuarial based analysis of historical claims experience. The self-insurance reserve at January 28, 2017 and January 30, 2016 was $2.3 million and $2.1 million.
10. Fair Value Measurements
We apply the following fair value hierarchy, which prioritizes the inputs used to measure fair value into three levels and bases the categorization within the hierarchy upon the lowest level of input that is available and significant to the fair value measurement:
|
|
• |
Level 1—Quoted prices in active markets for identical assets or liabilities; |
|
|
• |
Level 2—Quoted prices for similar assets or liabilities in active markets or inputs that are observable; and |
|
|
• |
Level 3—Inputs that are unobservable. |
62
The following tables summarize assets measured at fair value on a recurring basis (in thousands):
|
|
|
January 28, 2017 |
|
|||||||||
|
|
|
Level 1 |
|
|
Level 2 |
|
|
Level 3 |
|
|||
|
Cash equivalents: |
|
|
|
|
|
|
|
|
|
|
|
|
|
Money market funds |
|
$ |
657 |
|
|
$ |
— |
|
|
$ |
— |
|
|
State and local government securities |
|
|
400 |
|
|
|
— |
|
|
|
— |
|
|
Marketable securities: |
|
|
|
|
|
|
|
|
|
|
|
|
|
State and local government securities |
|
|
— |
|
|
|
19,129 |
|
|
|
— |
|
|
Variable-rate demand notes |
|
|
— |
|
|
|
39,450 |
|
|
|
— |
|
|
Long-term other assets: |
|
|
|
|
|
|
|
|
|
|
|
|
|
Money market funds |
|
|
1,557 |
|
|
|
— |
|
|
|
— |
|
|
Equity investments |
|
|
— |
|
|
|
— |
|
|
|
116 |
|
|
Total |
|
$ |
2,614 |
|
|
$ |
58,579 |
|
|
$ |
116 |
|
|
|
|
January 30, 2016 |
|
|||||||||
|
|
|
Level 1 |
|
|
Level 2 |
|
|
Level 3 |
|
|||
|
Cash equivalents: |
|
|
|
|
|
|
|
|
|
|
|
|
|
Money market funds |
|
$ |
9,555 |
|
|
$ |
— |
|
|
$ |
— |
|
|
Marketable securities: |
|
|
|
|
|
|
|
|
|
|
|
|
|
State and local government securities |
|
|
— |
|
|
|
31,747 |
|
|
|
— |
|
|
Variable-rate demand notes |
|
|
— |
|
|
|
644 |
|
|
|
— |
|
|
Long-term other assets: |
|
|
|
|
|
|
|
|
|
|
|
|
|
Money market funds |
|
|
1,510 |
|
|
|
— |
|
|
|
— |
|
|
State and local government securities |
|
|
— |
|
|
|
— |
|
|
|
828 |
|
|
Equity investments |
|
|
— |
|
|
|
— |
|
|
|
118 |
|
|
Total |
|
$ |
11,065 |
|
|
$ |
32,391 |
|
|
$ |
946 |
|
The Level 2 marketable securities primarily include state and local municipal securities and variable-rate demand notes. Fair values are based on quoted market prices for similar assets or liabilities or determined using inputs that use readily observable market data that are actively quoted and can be validated through external sources, including third-party pricing services, brokers and market transactions. We review the pricing techniques and methodologies of the independent pricing service for Level 2 investments and believe that its policies adequately consider market activity, either based on specific transactions for the security valued or based on modeling of securities with similar credit quality, duration, yield and structure that were recently traded. We monitor security-specific valuation trends and we make inquiries with the pricing service about material changes or the absence of expected changes to understand the underlying factors and inputs and to validate the reasonableness of the pricing.
Assets measured at fair value on a nonrecurring basis include items such as long-lived assets resulting from impairment, if deemed necessary. There were no material assets measured at fair value on a nonrecurring basis for the fiscal years ended January 28, 2017 and January 30, 2016.
11. Stockholders’ Equity
Share Repurchase—In December 2013, the Board of Directors authorized a stock repurchase program that provides for the repurchase of up to $30.0 million of outstanding common stock that replaced the existing stock repurchase program that was authorized in December 2012. In December 2014, our Board of Directors superseded and replaced this program with a $30.0 million share repurchase program. In June 2015, our Board of Directors superseded and replaced this program with a $50.0 million share repurchase program that was completed in August 2015. In December 2015, our Board of Directors authorized us to repurchase up to $70.0 million of our common stock. This program was expired as of January 28, 2017.
63
The following table summarizes common stock repurchase activity during the fiscal year ended January 28, 2017 (in thousands except average price per repurchased shares):
|
Number of shares repurchased |
|
|
1,195 |
|
|
Average price per share of repurchased shares (with commission) |
|
$ |
17.19 |
|
|
Total cost of shares repurchased |
|
$ |
20,540 |
|
Accumulated Other Comprehensive Income (Loss)—The component of accumulated other comprehensive income (loss) and the adjustments to other comprehensive income (loss) for amounts reclassified from accumulated other comprehensive income (loss) into net income is as follows (in thousands):
|
|
|
Foreign currency translation adjustments |
|
|
Net unrealized gains (losses) on available-for- sale investments |
|
|
Accumulated other comprehensive income (loss) |
|
|||
|
Balance at February 1, 2014 |
|
$ |
4,790 |
|
|
$ |
(80 |
) |
|
$ |
4,710 |
|
|
Other comprehensive loss, net (1) |
|
|
(15,995 |
) |
|
|
7 |
|
|
|
(15,988 |
) |
|
Balance at January 31, 2015 |
|
$ |
(11,205 |
) |
|
$ |
(73 |
) |
|
$ |
(11,278 |
) |
|
Other comprehensive loss, net (1) |
|
|
(3,931 |
) |
|
|
(38 |
) |
|
|
(3,969 |
) |
|
Balance at January 30, 2016 |
|
$ |
(15,136 |
) |
|
$ |
(111 |
) |
|
$ |
(15,247 |
) |
|
Other comprehensive loss, net (1) |
|
|
(1,338 |
) |
|
|
97 |
|
|
|
(1,241 |
) |
|
Balance at January 28, 2017 |
|
$ |
(16,474 |
) |
|
$ |
(14 |
) |
|
$ |
(16,488 |
) |
|
(1) |
Other comprehensive income (loss) before reclassifications is net of taxes of less than $0.1 million for the fiscal year ended January 28, 2017, January 30, 2016 and January 31, 2015 for both net unrealized gains (losses) on available-for-sale investments and accumulated other comprehensive income (loss). Foreign currency translation adjustments are not adjusted for income taxes as they relate to permanent investments in our international subsidiaries. |
12. Equity Awards
General—We maintain several equity incentive plans under which we may grant incentive stock options, nonqualified stock options, stock bonuses, restricted stock awards, restricted stock units and stock appreciation rights to employees (including officers), non-employee directors and consultants.
Stock-Based Compensation—Total stock-based compensation expense is recognized on our consolidated income statements as follows (in thousands):
|
|
|
Fiscal Year Ended |
|
|||||||||
|
|
|
January 28, 2017 |
|
|
January 30, 2016 |
|
|
January 31, 2015 |
|
|||
|
Cost of goods sold |
|
$ |
928 |
|
|
$ |
1,041 |
|
|
$ |
1,048 |
|
|
Selling, general and administrative expenses (1) |
|
|
3,650 |
|
|
|
3,955 |
|
|
|
6,472 |
|
|
Total stock-based compensation expense |
|
$ |
4,578 |
|
|
$ |
4,996 |
|
|
$ |
7,520 |
|
|
(1) |
Included in stock-based compensation expense recognized in selling, general and administrative expenses is $0.3 million and $3.1 million of expense associated with the incentive payments paid in shares of our common stock for the fiscal year ended January 30, 2016 and January 31, 2015. |
At January 28, 2017, there was $6.8 million of total unrecognized compensation cost related to unvested stock options and restricted stock. This cost has a weighted-average recognition period of 1.3 years.
64
Restricted Equity Awards —The following table summarizes the activity of restricted stock awards and restricted stock units, collectively defined as “restricted equity awards” (in thousands, except grant date weighted-average fair value):
|
|
|
Restricted Equity Awards |
|
|
Grant Date Weighted- Average Fair Value |
|
|
Intrinsic Value |
|
|||
|
Outstanding at February 1, 2014 |
|
|
361 |
|
|
$ |
26.91 |
|
|
|
|
|
|
Granted |
|
|
176 |
|
|
$ |
25.76 |
|
|
|
|
|
|
Vested |
|
|
(154 |
) |
|
$ |
26.31 |
|
|
|
|
|
|
Forfeited |
|
|
(40 |
) |
|
$ |
27.14 |
|
|
|
|
|
|
Outstanding at January 31, 2015 |
|
|
343 |
|
|
$ |
26.56 |
|
|
|
|
|
|
Granted |
|
|
130 |
|
|
$ |
36.10 |
|
|
|
|
|
|
Vested |
|
|
(142 |
) |
|
$ |
27.06 |
|
|
|
|
|
|
Forfeited |
|
|
(45 |
) |
|
$ |
28.64 |
|
|
|
|
|
|
Outstanding at January 30, 2016 |
|
|
286 |
|
|
$ |
30.32 |
|
|
|
|
|
|
Granted |
|
|
301 |
|
|
$ |
19.06 |
|
|
|
|
|
|
Vested |
|
|
(128 |
) |
|
$ |
29.54 |
|
|
|
|
|
|
Forfeited |
|
|
(17 |
) |
|
$ |
25.78 |
|
|
|
|
|
|
Outstanding at January 28, 2017 |
|
|
442 |
|
|
$ |
23.05 |
|
|
$ |
8,330 |
|
The following table summarizes additional information related to restricted equity awards activity (in thousands):
|
|
|
Fiscal Year Ended |
|
|||||||||
|
|
|
January 28, 2017 |
|
|
January 30, 2016 |
|
|
January 31, 2015 |
|
|||
|
Vest date fair value of restricted stock vested |
|
$ |
2,404 |
|
|
$ |
5,184 |
|
|
$ |
3,916 |
|
Stock Options—We had 0.2 million stock options outstanding at January 28, 2017 with a grant date weighted average exercise price of $25.61. We had 0.1 million stock options outstanding at January 30, 2016 with a grant date weighted average exercise price of $27.86 and 0.3 million stock options outstanding at January 31, 2015 with a grant date weighted average exercise price of $24.76.
Employee Stock Purchase Plan—We offer an Employee Stock Purchase Plan (the “ESPP”) for eligible employees to purchase our common stock at a 15% discount of the lesser of fair market value of the stock on the first business day or the last business day of the offering period, subject to maximum contribution thresholds. The number of shares issued under our ESPP was less than 0.1 million for each of the fiscal years ended January 28, 2017, January 30, 2016 and January 31, 2015.
13. Income Taxes
The components of earnings before income taxes are (in thousands):
|
|
|
Fiscal Year Ended |
|
|||||||||
|
|
|
January 28, 2017 |
|
|
January 30, 2016 |
|
|
January 31, 2015 |
|
|||
|
United States |
|
$ |
35,456 |
|
|
$ |
46,868 |
|
|
$ |
80,449 |
|
|
Foreign |
|
|
4,768 |
|
|
|
(1,007 |
) |
|
|
(8,798 |
) |
|
Total earnings before income taxes |
|
$ |
40,224 |
|
|
$ |
45,861 |
|
|
$ |
71,651 |
|
65
The components of the provision for income taxes are (in thousands):
|
|
|
Fiscal Year Ended |
|
|||||||||
|
|
|
January 28, 2017 |
|
|
January 30, 2016 |
|
|
January 31, 2015 |
|
|||
|
Current: |
|
|
|
|
|
|
|
|
|
|
|
|
|
Federal |
|
$ |
13,350 |
|
|
$ |
16,186 |
|
|
$ |
24,639 |
|
|
State and local |
|
|
2,338 |
|
|
|
2,591 |
|
|
|
3,386 |
|
|
Foreign |
|
|
1,187 |
|
|
|
972 |
|
|
|
1,044 |
|
|
Total current |
|
|
16,875 |
|
|
|
19,749 |
|
|
|
29,069 |
|
|
Deferred: |
|
|
|
|
|
|
|
|
|
|
|
|
|
Federal |
|
|
(1,855 |
) |
|
|
(585 |
) |
|
|
1,706 |
|
|
State and local |
|
|
(266 |
) |
|
|
(832 |
) |
|
|
291 |
|
|
Foreign |
|
|
(434 |
) |
|
|
(1,256 |
) |
|
|
(2,607 |
) |
|
Total deferred |
|
|
(2,555 |
) |
|
|
(2,673 |
) |
|
|
(610 |
) |
|
Provision for income taxes |
|
$ |
14,320 |
|
|
$ |
17,076 |
|
|
$ |
28,459 |
|
The reconciliation of the income tax provision at the U.S. federal statutory rate to our effective income tax rate is as follows:
|
|
|
Fiscal Year Ended |
|
|||||||||
|
|
|
January 28, 2017 |
|
|
January 30, 2016 |
|
|
January 31, 2015 |
|
|||
|
Expected U.S. federal income taxes at statutory rates |
|
|
35.0 |
% |
|
|
35.0 |
% |
|
|
35.0 |
% |
|
State and local income taxes, net of federal effect |
|
|
3.1 |
|
|
|
3.3 |
|
|
|
3.4 |
|
|
Foreign earnings, net |
|
|
(2.3 |
) |
|
|
(0.6 |
) |
|
|
0.6 |
|
|
Other |
|
|
(0.2 |
) |
|
|
(0.5 |
) |
|
|
0.7 |
|
|
Effective tax rate |
|
|
35.6 |
% |
|
|
37.2 |
% |
|
|
39.7 |
% |
The components of deferred income taxes are (in thousands):
|
|
|
January 28, 2017 |
|
|
January 30, 2016 |
|
||
|
Deferred tax assets: |
|
|
|
|
|
|
|
|
|
Deferred rent |
|
$ |
18,504 |
|
|
$ |
19,512 |
|
|
Net operating losses |
|
|
5,055 |
|
|
|
4,384 |
|
|
Employee benefits, including stock-based compensation |
|
|
2,916 |
|
|
|
3,124 |
|
|
Accrued liabilities |
|
|
2,279 |
|
|
|
2,125 |
|
|
Inventory |
|
|
1,458 |
|
|
|
1,181 |
|
|
Other |
|
|
2,026 |
|
|
|
1,516 |
|
|
Total deferred tax assets |
|
|
32,238 |
|
|
|
31,842 |
|
|
Deferred tax liabilities: |
|
|
|
|
|
|
|
|
|
Property and equipment |
|
|
(16,348 |
) |
|
|
(19,606 |
) |
|
Goodwill and other intangibles |
|
|
(7,765 |
) |
|
|
(6,901 |
) |
|
Other |
|
|
(1,084 |
) |
|
|
(701 |
) |
|
Total deferred tax liabilities |
|
|
(25,197 |
) |
|
|
(27,208 |
) |
|
Net deferred tax assets |
|
$ |
7,041 |
|
|
$ |
4,634 |
|
At January 28, 2017 and January 30, 2016, we had $20.3 million and $16.0 million of foreign net operating loss carryovers that could be utilized to reduce future years’ tax liabilities. The tax-effected foreign net operating loss carryovers were $5.1 million and $4.4 million at January 28, 2017 and January 30, 2016. The net operating loss carryovers have an indefinite carryfoward period and currently will not expire.
66
We file income tax returns in the U.S. federal jurisdiction and various state and foreign jurisdictions. Our U.S. federal income tax returns are no longer subject to examination for years before fiscal 2013 and with few exceptions, we are no longer subject to U.S. state examinations for years before fiscal 2012. We are no longer subject to examination for all foreign income tax returns before fiscal 2011.
14. Earnings per Share, Basic and Diluted
The following table sets forth the computation of basic and diluted earnings per share (in thousands, except per share amounts):
|
|
|
Fiscal Year Ended |
|
|||||||||
|
|
|
January 28, 2017 |
|
|
January 30, 2016 |
|
|
January 31, 2015 |
|
|||
|
Net income |
|
$ |
25,904 |
|
|
$ |
28,785 |
|
|
$ |
43,192 |
|
|
Weighted average common shares for basic earnings per share |
|
|
24,727 |
|
|
|
27,497 |
|
|
|
28,871 |
|
|
Dilutive effect of stock options and restricted stock |
|
|
181 |
|
|
|
176 |
|
|
|
417 |
|
|
Weighted average common shares for diluted earnings per share |
|
|
24,908 |
|
|
|
27,673 |
|
|
|
29,288 |
|
|
Basic earnings per share |
|
$ |
1.05 |
|
|
$ |
1.05 |
|
|
$ |
1.50 |
|
|
Diluted earnings per share |
|
$ |
1.04 |
|
|
$ |
1.04 |
|
|
$ |
1.47 |
|
Total anti-dilutive common stock options not included in the calculation of diluted earnings per share were 0.2 million, 0.1 million and 0.1 million for the fiscal years ended January 28, 2017, January 30, 2016 and January 31, 2015.
15. Related Party Transactions
The Zumiez Foundation is a charitable based nonprofit organization focused on meeting various needs of the under-privileged. Our Chairman of the Board is also the President of the Zumiez Foundation. We committed charitable contributions to the Zumiez Foundation of $0.7 million, $0.6 million and $0.7 million for the fiscal years ended January 28, 2017, January 30, 2016, January 31, 2015. We have accrued charitable contributions payable to the Zumiez Foundation of $0.6 million and $0.5 million at January 28,2017 and January 30, 2016.
16. Segment Reporting
Our operating segments have been aggregated and are reported as one reportable segment based on the similar nature of products sold, production, merchandising and distribution processes involved, target customers and economic characteristics.
The following table is a summary of product categories as a percentage of merchandise sales:
|
|
|
Fiscal Year Ended |
|
|||||||||
|
|
|
January 28, 2017 |
|
|
January 30, 2016 |
|
|
January 31, 2015 |
|
|||
|
Men's Apparel |
|
|
37 |
% |
|
|
34 |
% |
|
|
34 |
% |
|
Accessories |
|
|
20 |
% |
|
|
20 |
% |
|
|
20 |
% |
|
Footwear |
|
|
18 |
% |
|
|
19 |
% |
|
|
19 |
% |
|
Junior's Apparel |
|
|
13 |
% |
|
|
13 |
% |
|
|
13 |
% |
|
Hardgoods |
|
|
12 |
% |
|
|
14 |
% |
|
|
14 |
% |
|
Total |
|
|
100 |
% |
|
|
100 |
% |
|
|
100 |
% |
67
The following tables present summarized geographical information (in thousands):
|
|
|
Fiscal Year Ended |
|
|||||||||
|
|
|
January 28, 2017 |
|
|
January 30, 2016 |
|
|
January 31, 2015 |
|
|||
|
Net sales (1): |
|
|
|
|
|
|
|
|
|
|
|
|
|
United States |
|
$ |
710,976 |
|
|
$ |
689,582 |
|
|
$ |
708,279 |
|
|
Foreign |
|
|
125,292 |
|
|
|
114,601 |
|
|
|
103,272 |
|
|
Total net sales |
|
$ |
836,268 |
|
|
$ |
804,183 |
|
|
$ |
811,551 |
|
|
|
|
January 28, 2017 |
|
|
January 30, 2016 |
|
||
|
Long-lived assets: |
|
|
|
|
|
|
|
|
|
United States |
|
$ |
110,539 |
|
|
$ |
124,436 |
|
|
Foreign |
|
|
26,387 |
|
|
|
25,352 |
|
|
Total long-lived assets |
|
$ |
136,926 |
|
|
$ |
149,788 |
|
|
(1) |
Net sales are allocated based on the location in which the sale was originated for the fiscal years ended January 28, 2017 and January 30, 2016 and fulfilled for the fiscal year ended January 31, 2015. Store sales are allocated based on the location of the store and ecommerce sales are allocated to the U.S. for sales on www.zumiez.com and to foreign for sales on www.blue-tomato.com and www.fasttimes.com.au. |
68
Pursuant to the requirements of Section 13 or 15(d) of the Securities Exchange Act of 1934, the Registrant has duly caused this report to be signed on its behalf by the undersigned, thereunto duly authorized.
|
ZUMIEZ INC. |
|
|
||
|
/S/ RICHARD M. BROOKS |
|
March 13, 2017 |
||
|
Signature |
|
Date |
||
|
By: |
|
Richard M. Brooks Chief Executive Officer and Director (Principal Executive Officer) |
|
|
|
|
|
|
|
|
|
/S/ CHRISTOPHER C. WORK |
|
March 13, 2017 |
||
|
Signature |
|
Date |
||
|
By: |
|
Christopher C. Work, Chief Financial Officer (Principal Financial Officer and Principal Accounting Officer) |
|
|
Pursuant to the requirements of the Securities Exchange Act of 1934, this report has been signed by the following persons on behalf of the Registrant and in the capacities and on the dates indicated.
|
/S/ THOMAS D. CAMPION |
|
March 13, 2017 |
|
/S/ JAMES M. WEBER |
|
March 13, 2017 |
|
Signature |
|
Date |
|
Signature |
|
Date |
|
Thomas D. Campion, Chairman |
|
|
|
James M. Weber, Director |
|
|
|
|
|
|
|
|
|
|
|
/S/ MATTHEW L. HYDE |
|
March 13, 2017 |
|
/S/ SARAH G. MCCOY |
|
March 13, 2017 |
|
Signature |
|
Date |
|
Signature |
|
Date |
|
Matthew L. Hyde, Director |
|
|
|
Sarah G. McCoy, Director |
|
|
|
|
|
|
|
|
|
|
|
/S/ ERNEST R. JOHNSON |
|
March 13, 2017 |
|
/S/TRAVIS D. SMITH |
|
March 13, 2017 |
|
Signature |
|
Date |
|
Signature |
|
Date |
|
Ernest R. Johnson, Director |
|
|
|
Travis D. Smith, Director |
|
|
|
|
|
|
|
|
|
|
|
/S/ KALEN F. HOLMES |
|
March 13, 2017 |
|
/S/ SCOTT A. BAILEY |
|
March 13, 2017 |
|
Signature |
|
Date |
|
Signature |
|
Date |
|
Kalen F. Holmes, Director |
|
|
|
Scott A. Bailey, Director |
|
|
69
|
|
|
|
|
3.1 |
|
Articles of Incorporation. [Incorporated by reference to Exhibit 3.1 to the Company’s Registration Statement on Form S-1 (file No. 333-122865)] |
|
|
|
|
|
3.2 |
|
Bylaws, as amended and restated May 21, 2014 and Amendment No.1, dated as of May 21, 2015, to Bylaws of Zumiez Inc. (as previously Amended and Restated as of May 21, 2014 [Incorporated by reference to Exhibit 3.2 to the Company’s Current Report on Form 8-K filed on May 23, 2014 and Exhibit to the Company’s Form 8-K filed on May 21, 2015] |
|
|
|
|
|
4.1 |
|
Form of Common Stock Certificate of Zumiez Inc. [Incorporated by reference to Exhibit 4.1 to the Company’s Registration Statement on Form S-1 (file No. 333-122865)] |
|
|
|
|
|
10.15 |
|
Zumiez Inc. 2005 Equity Incentive Plan, as amended and restated effective May 27, 2009. [Incorporated by reference from Exhibit 10.15 to the Form 8-K filed by the Company on June 1, 2009] |
|
|
|
|
|
10.2 |
|
Zumiez Inc. 2014 Equity Incentive Plan. [Incorporated by reference to Exhibit 10.20 to the Company’s Current Report on Form 8-K filed on May 23, 2014] |
|
|
|
|
|
10.21 |
|
Form of Restricted Stock Award Agreement and Terms and Conditions. [Incorporated by reference to Exhibit 10.21 to the Company’s Current Report on Form 8-K filed on May 23, 2014] |
|
|
|
|
|
10.22 |
|
Form of Stock Option Award Agreement and Terms and Conditions. [Incorporated by reference to Exhibit 10.22 to the Company’s Current Report on Form 8-K filed on May 23, 2014] |
|
|
|
|
|
10.23 |
|
Zumiez Inc. 2014 Employee Stock Purchase Plan. [Incorporated by reference to Exhibit 10.23 to the Company’s Current Report on Form 8-K filed on May 23, 2014] |
|
|
|
|
|
10.24 |
|
Form of Indemnification Agreement. [Incorporated by reference to Exhibit 10.24 to the Company’s Current Report on Form 8-K filed on May 23, 2014] |
|
|
|
|
|
10.27 |
|
Credit Agreement dated as of February 5, 2016 among Zumiez Services Inc., as the lead borrower, for the borrowers and guarantors named therein and Wells Fargo Bank, National Association, as agent and L/C issuer and other lender parties thereto. [Incorporated by reference to Exhibit 10.27 to the Company’s Form 8-K filed on February 5, 2016] |
|
|
|
|
|
21.1 |
|
Subsidiaries of the Company. |
|
|
|
|
|
23.1 |
|
Consent of Moss Adams LLP, Independent Registered Public Accounting Firm. |
|
|
|
|
|
31.1 |
|
Certification of the Principal Executive Officer pursuant to Rule 13a-14(a)/15d-14(a) of the Securities Exchange Act of 1934, as amended, as adopted pursuant to Section 302 of the Sarbanes-Oxley Act of 2002. |
|
|
|
|
|
31.2 |
|
Certification of the Principal Financial Officer (Principal Accounting Officer) pursuant to Rule 13a-14(a)/15d-14(a) of the Securities Exchange Act of 1934, as amended, as adopted pursuant to Section 302 of the Sarbanes-Oxley Act of 2002. |
|
|
|
|
|
32.1 |
|
Certifications of the Principal Executive Officer and Principal Financial Officer (Principal Accounting Officer) pursuant to Section 906 of the Sarbanes-Oxley Act of 2002, 18 U.S.C. Section 1350. |
|
|
|
|
70
|
|
The following materials from Zumiez Inc.’s Annual Report on Form 10-K for the annual period ended January 28, 2017, formatted in XBRL (eXtensible Business Reporting Language): |
|
|
|
|
(i) Consolidated Balance Sheets at January 28, 2017 and January 30, 2016; (ii) Consolidated Statements of Income for the fiscal years ended January 28, 2017, January 30, 2016 and January 31, 2015; (iii) Consolidated Statements of Comprehensive Income for the fiscal years ended January 28, 2017, January 30, 2016 and January 31, 2015; (iv) Consolidated Statements of Changes in Shareholders’ Equity for the fiscal years ended January 28, 2017, January 30, 2016 and January 31, 2015; (v) Consolidated Statements of Cash Flows for the fiscal years ended January 28, 2017, January 30, 2016 and January 31, 2015; and (vi) Notes to Consolidated Financial Statements. |
Copies of Exhibits may be obtained upon request directed to the attention of our Executive Vice President, General Counsel and Secretary, 4001 204th Street SW, Lynnwood, Washington 98036, and are available at the SEC’s website found at www.sec.gov.
71