Attached files
| file | filename |
|---|---|
| 8-K - FORM 8-K - CAPSTEAD MORTGAGE CORP | d360768d8k.htm |
 Information as of December 31, 2016
Investor Presentation Exhibit 99.1 |
 and
individual income tax reform, federal government fiscal challenges and
Federal Reserve monetary policy, including policy regarding its holdings
of Agency and U.S. Treasury Securities; –
deterioration in credit quality and ratings of existing or future
issuances of Fannie Mae, Freddie Mac or Ginnie Mae securities;
– changes in legislation or regulation affecting Fannie Mae, Freddie Mac, Ginnie Mae and similar federal government agencies and related guarantees; – changes in legislation or regulation affecting exemptions for mortgage REITs from regulation under the Investment Company Act of 1940; – other changes in legislation or regulation affecting the mortgage and banking industries; and – increases in costs and other general competitive factors. Safe Harbor Statement - Private Securities Litigation Reform Act of 1995 Statement Concerning Forward-looking Statements This document contains “forward-looking statements” within the meaning of the Private Securities Litigation Reform Act of 1995. Forward- looking statements include, without limitation, any statement that may predict, forecast, indicate or imply future results, performance or achievements, and may contain the words “believe,” “anticipate,” “expect,” “estimate,” “intend,” “will be,” “will likely continue,” “will likely result,” or words or phrases of similar meaning. Forward-looking statements are based largely on the expectations of management and are subject to a number of risks and uncertainties including, but not limited to, the following: In addition to the above considerations, actual results and liquidity are affected by other risks and uncertainties which could cause actual results to be significantly different from those expressed or implied by any forward-looking statements included herein. It is not possible to identify all of the risks, uncertainties and other factors that may affect future results. In light of these risks and uncertainties, the forward- looking events and circumstances discussed herein may not occur and actual results could differ materially from those anticipated or implied in the forward-looking statements. Forward-looking statements speak only as of the date the statement is made and the Company undertakes no obligation to update or revise any forward-looking statements, whether as a result of new information, future events or otherwise. Accordingly, readers of this document are cautioned not to place undue reliance on any forward-looking statements included herein. – changes in general economic conditions; – fluctuations in interest rates and levels of mortgage prepayments; – the effectiveness of risk management strategies; – the impact of differing levels of leverage employed; – liquidity of secondary markets and credit markets; – the availability of financing at reasonable levels and terms to support investing on a leveraged basis; – the availability of new investment capital; – the availability of suitable qualifying investments from both an investment return and regulatory perspective; – changes in market conditions as a result of federal corporate and individual income tax reform, federal government fiscal 2 |
 Company
Summary Proven Strategy of
Efficiently Managing a Leveraged Portfolio of Short-Duration Agency-Guaranteed ARM Securities Experienced Management Team Aligned with Stockholders Overview of Capstead Mortgage Corporation • Founded in 1985, Capstead is the oldest publicly-traded residential mortgage REIT.
• Our sole focus is on managing a leveraged portfolio of short-duration* agency-guaranteed (i.e. Fannie Mae, Freddie
Mac and Ginnie Mae) residential ARM securities that is appropriately hedged and can
earn attractive risk-adjusted returns over the long term, with
little, if any, credit risk. •
At December 31, 2016, our agency-guaranteed ARM securities portfolio stood at
$13.32 billion, supported by $1.35 billion in long-term investment
capital levered 9.02 times. •
Our short-duration strategy differentiates us from our peers because the
adjustable-rate mortgages underlying our portfolio reset to more
current interest rates within a relatively short period of time:
• allowing us to benefit from future recoveries in financing spreads that typically contract during periods of
rising interest rates, and
• resulting in smaller fluctuations in portfolio values from changes in interest rates compared to portfolios
containing a significant amount of longer-duration ARM or fixed-rate mortgage
securities. •
By virtue of being internally-managed and with our sole focus on
agency-guaranteed securities, we are arguably the most efficient
mortgage REIT in the industry. •
Our top three executive officers have a combined
75 years of mortgage finance industry experience. •
We are internally-managed with low operating costs and a strong focus on
performance-based compensation. •
This structure greatly enhances the alignment of management interests with those of
our stockholders. 3
• This singular and straight-forward investment strategy, together with our use of cash flow hedge accounting allows
for easily understood, transparent financial reporting, with limited use of
non-GAAP financial measures. •
Additional transparency is evident by virtue of our internally-managed structure – our compensation-related decisions and costs are fully disclosed and subject to annual say-on-pay approvals.
• We make every effort to provide additional analysis in our earnings reports, SEC filings and analyst presentations
that tells our story in a complete and straight-forward fashion.
Straight-forward Investment Strategy and Transparent Reporting * Duration is a measure of market price sensitivity to interest rate movements. A shorter duration generally indicates less
interest rate risk. |
 Market
Snapshot (dollars in thousands, except per share amounts)
4 (a) As of December 31, 2016. Capstead’s $1.35 billion in long-term investment capital consists of $1.05 billion of our common equity trading on the
NYSE, $199 million of our 7.50% Series E perpetual preferred capital also trading on
the NYSE, and $98 million in privately-placed unsecured borrowings
maturing in 2035 and 2036. Common
7.50% Series E Preferred Long-Term Unsecured Borrowings Total Long -Term Investment Capital NYSE Stock Ticker CMO CMOPRE Shares outstanding (a) 95,989 8,234 Cost of preferred capital 7.76% 7.77% 7.76% Price as of March 6, 2017 $10.55 $24.33 Book Value per common share (a) $10.85 Price as a multiple of December 31, 2016 book value 97.2% Recorded value (a) $1,048,628 $199,059 $ 98,090 $1,345,777 Market capitalization as of March 6, 2017 $1,012,684 $200,333 $ 98,090 $1,311,107 |
 Capstead’s Economic Returns
5 (a) CMO economic returns exclude the effect of $(0.03) per share in separation of service charges associated with the July 2016 resignation of
the Company’s former chief executive officer.
Including this unusual charge, our economic returns would have been lower by 26 basis points in 2016, and by 7 and 5 basis points for the 4- and 5-year averages, respectively. (b) Excludes $(0.28) per share one-time effect of preferred capital redemption and issuance transactions on book value in 2013.
Including this unusual charge, our economic returns would
have been lower by 52 and 41 basis points for the 4- and 5-year averages, respectively. (c) Agency Peers: AGNC, AI, ANH, ARR, CYS, EARN, HTS, NLY, ORC. (d) All Peers: Agency peers plus AMTG, CIM, DX, IVR, JMI, MFA, MITT, MTGE, NYMT, OAKS, RWT, TWO, WMC.
Our agency-only, short-duration ARM strategy typically leads to outperformance
during periods of rising interest rates and/or worsening credit
conditions relative to other mortgage REITs. |
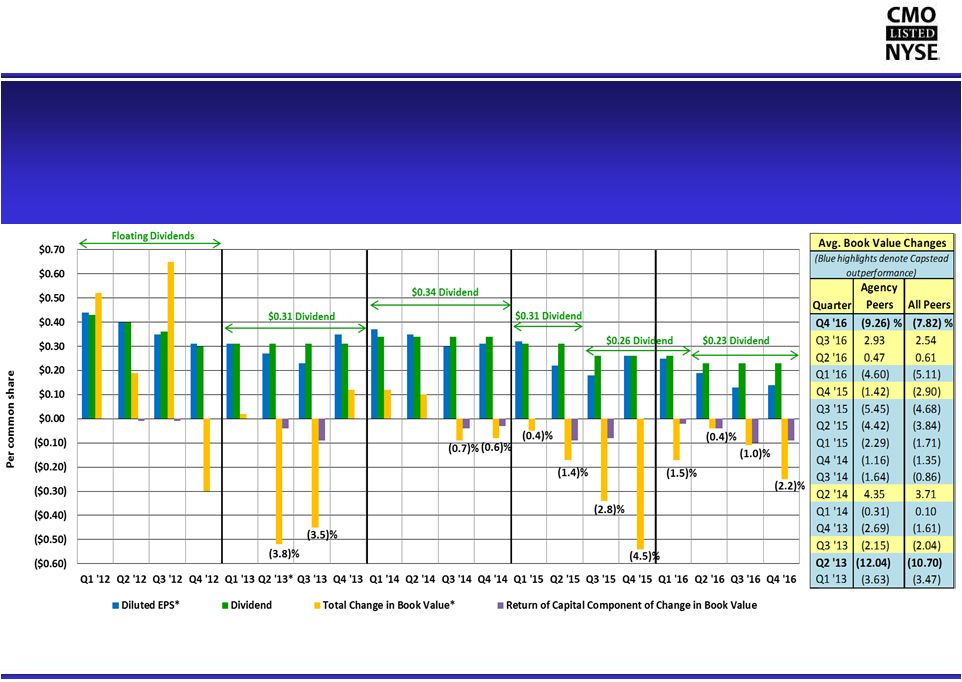 Components
of our Economic Returns Quarterly Earnings, Dividends and Changes in Book
Value 6 For presentation purposes, we adjusted our Q2 2013 diluted EPS and related change in book value to exclude certain one-time effects of
preferred capital redemption and issuance transactions totaling $(0.23)
and $(0.28), respectively. These transactions replaced higher-cost preferred equity to the benefit of future earnings. See page 19 for further information and a reconciliation of diluted EPS to this presentation. * Our quarterly earnings are affected by the impact of changes in interest rates on mortgage refinancing activity and our borrowing costs.
Quarterly earnings can also fluctuate with seasonal factors, most notably
higher mortgage prepayment levels typically experienced during the summer
house-selling season. We reassess the common dividend periodically based largely on how these factors are impacting expected future earnings. Our book value per common share is directly impacted by changes in interest rates and other market conditions as our portfolio and
our hedge instruments are marked-to-market through
stockholders’ equity. Book value has also been impacted to the extent common dividends exceeded earnings resulting in returns of capital to our stockholders. |
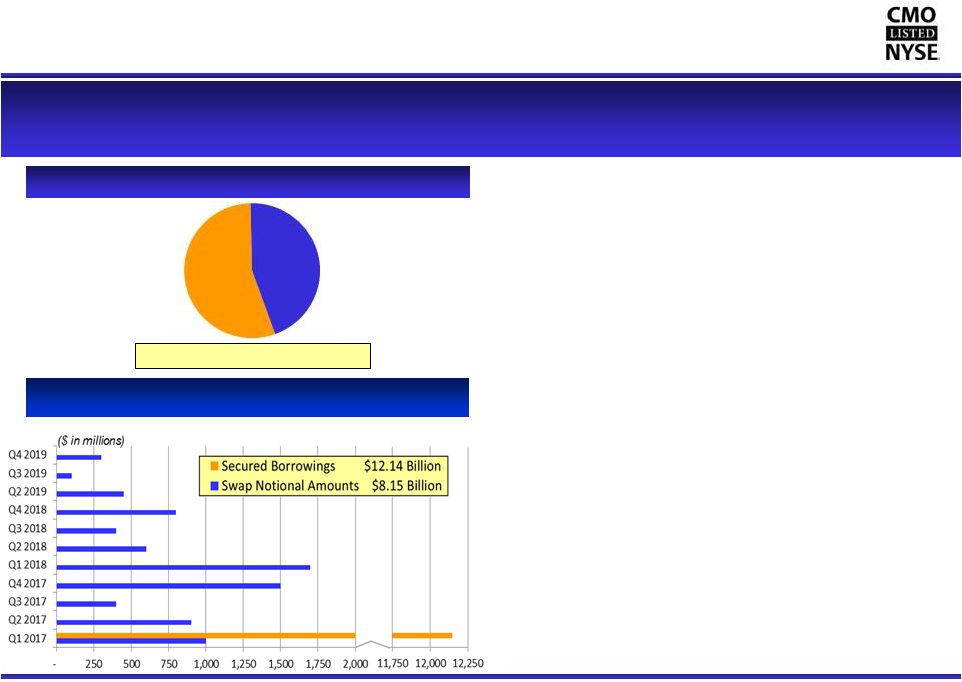 45% 55% Capstead’s Proven Short-Duration Investment Strategy 7 As of December 31, 2016 We finance our agency-guaranteed residential ARM securities primarily with 30- to 90-day repurchase arrangements augmented with relatively low-cost two- and three-year interest rate swap agreements and longer-dated secured borrowings when available at attractive levels. Residential ARM Securities Portfolio Secured Borrowings & Swap Notional Amounts (by quarter of borrowing maturities / contract expirations) Total: $13.21 Billion (cost basis) • Our portfolio of agency-guaranteed ARM securities have little, if any, credit risk and are either currently resetting to more current rates at least annually or will begin doing so in five years or less. Our Current-Reset ARMs reset in rate in less than 18 months and our Longer-to-Reset ARMs reset in less than five years. • With an asset duration* of approximately 11½ months at year- end, the value of our portfolio is naturally less exposed to changes in interest rates than portfolios containing longer duration ARM or fixed-rate securities.
This relative stability affords us more flexibility in managing through periods of market stress. • We have long-term relationships with a variety of domestic and foreign lending counterparties. At year-end we had borrowings outstanding with 21 counterparties. • We routinely borrow for 30 to 90 days and extend the duration of our borrowings using relatively low-cost two- and three-year pay- fixed interest rate swap agreements. When available at attractive levels, we may also enter into longer-dated secured borrowings. • Together with our portfolio-related swap agreements, our secured borrowings had a duration of approximately 8½ months at year-end, resulting in a net duration gap of approximately 3 months.
Longer-to-Reset
ARMs $5.92 Billion (cost basis) Current-Reset ARMs $7.29 Billion (cost basis) * Duration is a common measure of market price sensitivity to interest rate movements. A shorter duration generally indicates less interest rate risk. |
 Capstead’s Appropriate Use of Leverage
8 In our view, borrowing at current levels represents an appropriate use of leverage for a
short-duration, agency-guaranteed ARM securities portfolio in today’s
market conditions. |
 Financing
Spread Analysis As of December 31, 2016 (unaudited)
9 2016 Q4 Q3 Q2 Q1 Q4 Q3 Q2 Q1 Total financing spreads: (a) Yields on all interest-earning assets 1.49% 1.45% 1.53% 1.69% 1.62% 1.40% 1.42% 1.66% Borrowing rates on all interest-paying liabilities 0.94 0.89 0.89 0.87 0.79 0.74 0.68 0.65 Total financing spreads 0.55 0.56 0.64 0.82 0.83 0.66 0.74 1.01 Financing spreads on residential mortgage investments, a non-GAAP financial measure: Cash yields on residential
mortgage investments
(b) 2.55% 2.52% 2.50% 2.47% 2.44% 2.42% 2.41% 2.42% Investment premium amortization (b) (1.05) (1.06) (0.96) (0.75) (0.81) (0.99) (0.95) (0.72) Yields on residential mortgage investments 1.50 1.46 1.54 1.72 1.63 1.43 1.46 1.70 Unhedged secured borrowing rates (c) 0.79 0.69 0.67 0.65 0.48 0.45 0.41 0.38 Hedged secured borrowing rates (c) 0.95 0.93 0.96 0.93 0.87 0.84 0.77 0.75 Secured borrowing rates 0.89 0.84 0.84 0.82 0.73 0.69 0.62 0.59 Financing spreads on residential mortgage investments 0.61 0.62 0.70 0.90 0.90 0.74 0.84 1.11 CPR 25.59 25.80 23.19 18.23 19.62 23.21 21.98 16.66 (a) All interest-earning assets include residential mortgage investments, overnight investments and cash collateral receivable from interest rate
swap counterparties. All interest-paying liabilities include
unsecured borrowings and cash collateral payable to interest rate swap counterparties. (b) Cash yields are based on the cash component of interest income. Investment premium amortization is determined using the interest method
which incorporates actual and anticipated future mortgage
prepayments. Both are expressed as a percentage calculated on average amortized cost basis for the indicated periods. (c) Unhedged borrowing rates represent average rates on secured borrowings, before consideration of interest rate swap agreements held for portfolio
hedging purposes. Hedged borrowing rates represent the average
fixed-rate payments made on these swaps adjusted for differences between LIBOR-based variable-rate payments received and unhedged borrowing rates, as well as the effects of any hedge ineffectiveness. Average fixed-rate swap payments were 0.80%, 0.75%, 0.73% and 0.69% for the fourth, third, second
and first quarters of 2016, respectively, while average variable-rate
payment adjustments were 0.15%, 0.18%, 0.23% and 0.24% for the same periods, respectively. During 2016 and 2015, fixed-rate swap payments averaged 0.74% and 0.57% while variable-rate payment adjustments averaged 0.20% and 0.24%, respectively.
Cash yields continue to benefit from higher coupon interest rates as mortgage loans underlying our current-reset ARM securities reset to
higher rates primarily due to increases in the underlying indices
(principally 12-month LIBOR, six-month LIBOR and one-year CMT). Mortgage prepayment levels directly impact our financing spreads because purchased investment premiums are amortized to earnings as
portfolio yield adjustments. Mortgage prepayments are influenced by
housing market conditions, including prevailing mortgage interest rates, as well as seasonal factors, in particular the summer home selling season. We experienced refinancing waves in both 2016 and 2015.
Unhedged borrowing have trended higher largely because of market expectations for
higher short-term interest rates culminating with the Federal
Reserve’s December 2016 and 2015 quarter point increases in the Federal Funds
Rate. Hedged borrowing rates have generally trended higher as
older, lower-rate swaps were replaced at higher rates, although beginning in the third quarter of 2016, these rates benefited from higher variable-rate receipts due to higher LIBOR rates. 2015 |
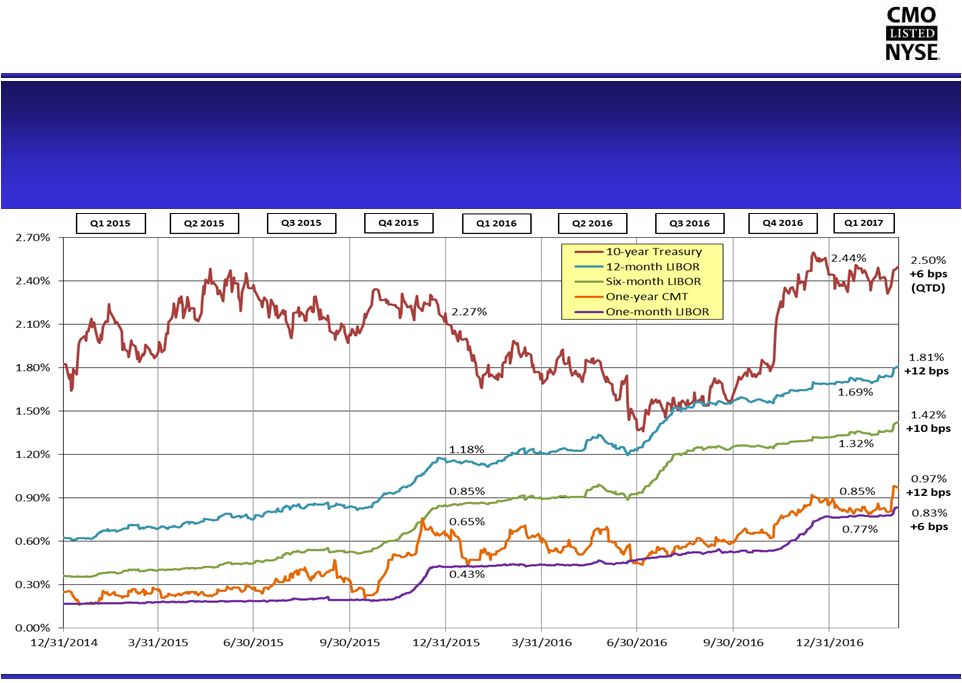 Changes
in Interest Rates Affecting Capstead’s Earnings 10
The ten-year Treasury rate can be viewed as a proxy for mortgage interest
rates. After declining this spring and summer, the ten-year rate has increased significantly, particularly post-election. One-month LIBOR also has increased due to money market reform and anticipation
of Federal Reserve actions to increase the Federal Funds
Rate. The primary indices underlying our residential ARM securities portfolio began
increasing in 2015, in large part due to market expectations for Federal
Reserve action to increase the Federal Funds Rate. Additionally, six- and 12-month LIBOR increased considerably during the latter part of 2016 in response to money market reform. All three indices have continued increasing post year-end (indices presented through March 6,
2017). |
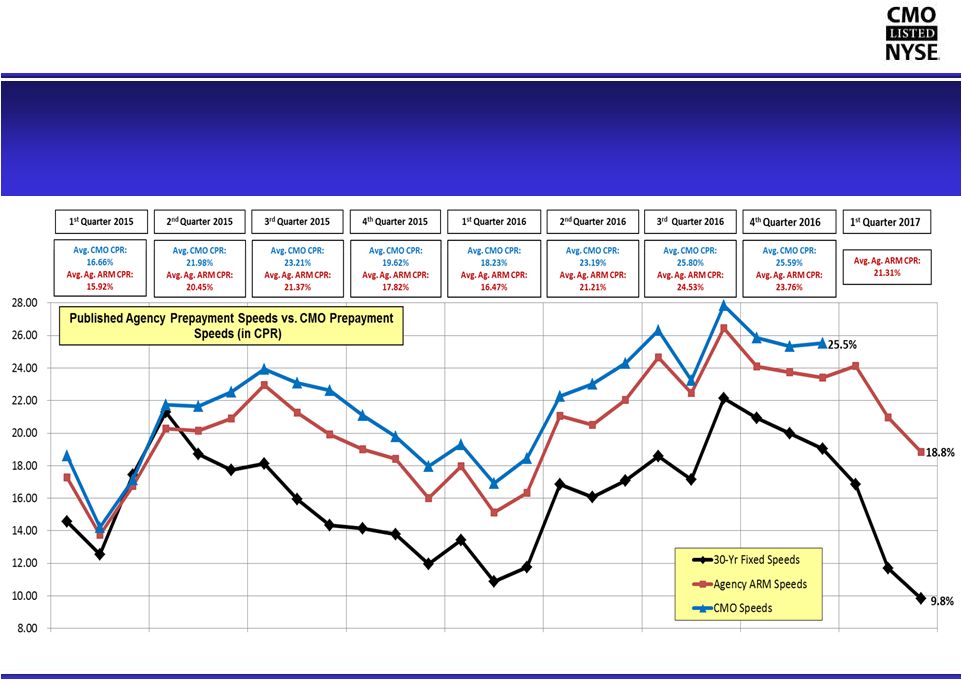 Agency
Mortgage Prepayment Speeds versus Capstead Prepayment Speeds
Similar to what occurred in 2015, Capstead
experienced high prepayment levels during the summer months of 2016 reflecting
declines in prevailing interest rates and seasonal factors. While
the 2016 refinancing wave peaked in September, declines in prepayment
rates on ARM securities lagged declines in prepayment rates on fixed-rate mortgage securities during the fourth quarter and in January 2017. However, with the sharp increase in interest rates post-election, opportunities for homeowners to refinance at
lower rates have diminished and Agency ARM prepayment rates have dropped
considerably in February and March. 11
|
 * Net WAC, or weighted average coupon, is the weighted average interest rate of the mortgage loans underlying the indicated investments, net of servicing and other fees, as of December 31, 2016. Net WAC is expressed as a percentage calculated on an annualized basis on the unpaid principal balances of the mortgage loans underlying these investments. As such it is similar to cash yield on the portfolio which is calculated using amortized cost basis. Fully indexed WAC represents the weighted average coupon upon one or more resets using interest rate indexes and net margins in effect, as of December 31, 2016. Gross WAC is the weighted average interest rate of the mortgage loans underlying the indicated investments, including servicing and other fees paid by borrowers, as of December 31, 2016. Key Elements of Capstead’s ARM Portfolio As of December 31, 2016 (dollars in thousands, unaudited) 12 NOTE: Excludes $3 million legacy portfolio of fixed-rate investments. The 2016 year-end Net WAC* on our current-reset ARMs was 25 basis points higher than at year-end 2015. These securities’
Fully- Indexed WAC* was 38 basis points higher. This is
primarily the result of increases in the underlying indices. These indices have increased further since year-end. With these higher rates, ARM loans underlying the current-reset component of our portfolio can be
expected to continue increasing in coupon in the coming
quarters. Fully-
Average Months Principal Investment Fair Market Net Indexed Net to Balance Premiums ($) % Value WAC* WAC* Margins Roll Current-reset ARMs: Fannie Mae Agency Securities $ 3,867,294 $ 114,375 $ 3,981,669 102.96 $ 4,074,538 2.77% 3.13% 1.70% 5.8 Freddie Mac Agency Securities 1,538,730 49,879 1,588,609 103.24 1,626,167 2.84 3.31 1.81 6.9 Ginnie Mae Agency Securities 1,662,262 55,573 1,717,835 103.34 1,722,965 2.25 2.38 1.51 6.6 Residential Mortgage Loans 1,839 9 1,848 100.49 1,874 3.80 3.10 2.08 4.9 (55% of total) 7,070,125 219,836 7,289,961 103.11 7,425,544 2.66 +0.33 2.99 1.68 6.2 Year-end 2015 2.41 +0.20 2.61 Longer-to-reset ARMs: Fannie Mae Agency Securities 2,594,168 84,060 2,678,228 103.24 2,667,048 2.67 3.31 1.62 42.7 Freddie Mac Agency Securities 2,057,569 66,485 2,124,054 103.23 2,115,614 2.71 3.34 1.66 43.2 Ginnie Mae Agency Securities 1,080,898 34,727 1,115,625 103.21 1,105,323 2.92 2.36 1.51 38.9 (45% of total) 5,732,635 185,272 5,917,907 103.23 5,887,985 2.73 +0.41 3.14 1.61 42.2 Year-end 2015 2.77 - 0.13 2.64 12,802,760 $ 405,108 $ 13,207,868 $ 103.16 13,313,529 $ 2.69 +0.37 3.06 1.65 22.3 Year-end 2015 2.57 +0.05 2.62 Gross WAC (rate paid by borrowers)* 3.29 Amortized Cost Basis |
 Capstead’s Stockholder Friendly Structure
13 (a) Expressed on an annualized basis as a percentage of average long-term investment capital, excluding the effects of third and fourth quarter separation of service charges of $2.7 million and $225,000, respectively, associated with the July resignation of the Company’s former chief executive officer. Capstead is a leader among our mortgage REIT peers in terms of operating cost efficiency.
We are internally-managed with low operating costs compared to our mortgage REIT
peers. Our executives’ pay structure is variable through
compensation elements that focus on “pay for performance” as opposed to fees paid to an external manager that are based solely on capital under management.
Additionally, our board of directors and our senior
executives hold a significant amount of Capstead stock.
As a result, we are incented to grow the Company by raising capital only when it is
accretive to book value and earnings rather than for the purpose of
increasing compensation or external management fees. Conversely, we are also not conflicted regarding whether or not to repurchase shares when appropriate. Quarter Year Ended Ended Dec. 31, 2016 (a) Dec. 31, 2016 (a) Compensation-related expenses: Fixed: Salaries and related savings plan matching, payroll taxes, insurance and other benefits 0.25% 0.26% Variable: Short-term incentive compensation: Performance-based cash compensation program 0.31 0.20 Dividend equivalent rights 0.03 0.04 Long-term incentive compensation, principally performance-based equity awards 0.03 0.11 Related savings plan matching and payroll taxes 0.03 0.02 0.40 0.37 0.65 0.63 Other platform expenses 0.32 0.34 0.97% 0.97% The majority of compensation-related expenses are performance-based. |
 Appendix 14 |
 Capstead’s Fourth Quarter 2016 Highlights • Generated earnings of $17.5 million or $0.14 per diluted common share • Paid common dividend of $0.23 per common share • Book value decreased by 1.4% ($0.16) due to changes in unrealized gains and losses on the portfolio and interest rate swaps held for hedging purposes, and by 0.8% ($0.09) due to capital returned to stockholders in the form of dividends in excess of reported earnings, ending the quarter at $10.85 per common share • Yields on residential mortgage investments increased four basis points to 1.50% while rates on related secured borrowings increased by five basis points to 0.89% • Total financing spreads decreased one basis point to 0.55% while financing spreads on residential mortgage investments, a non-GAAP financial measure, also decreased one basis point to 0.61% • Agency-guaranteed residential ARM portfolio and related leverage ended the quarter at $13.32 billion and 9.02 times long- term investment capital, respectively • Management remarks from our January 25, 2017 earnings press release: “Earnings for the fourth quarter were hampered by slower than anticipated declines in mortgage prepayment levels. As a result, portfolio yields did not improve as much as expected. While the 2016 refinancing wave peaked in September, declines in prepayment rates on ARM securities have lagged declines in prepayment rates on fixed-rate mortgage securities during the fourth quarter and in January 2017. However, with the sharp increase in interest rates post-election, opportunities for homeowners to refinance at lower rates have diminished considerably. This is expected to lead to lower mortgage prepayment levels in the coming months, benefiting portfolio yields and earnings. “Additionally, we expect cash yields to continue increasing in 2017 as coupon interest rates on mortgage loans underlying our portfolio reset to higher rates based on higher prevailing six- and 12-month interest rate indices. Our borrowing costs are also currently benefiting from higher variable rate swap receipts due to higher short-term LIBOR rates relative to our unhedged borrowing rates. However, future actions by the Federal Reserve to increase the level of short-term interest rates will put upward pressure on unhedged borrowing rates and fixed-rate swap payment requirements on new swap agreements. Provided the Federal Reserve does not move to increase short-term interest rates at a considerably faster pace than the financial markets currently anticipate, and longer term interest rates remain benign, we anticipate reporting improved earnings in the coming quarters. “During the fourth quarter of 2016, longer-term interest rates moved significantly higher, as illustrated by the ten-year Treasury rate increasing 85 basis points to end the year at 2.45%. As a consequence, longer duration mortgage-backed securities lost considerable value. For instance, Fannie Mae 30-year fixed 3.0% mortgage securities declined in price by approximately 4.75% during this period. In contrast, Capstead’s ARM securities portfolio performed relatively well, experiencing a decline in overall portfolio pricing of just 0.49%. “This translated into a fourth quarter book value decline of only 1.4% due to changes in unrealized gains and losses on the portfolio and interest rate swaps held for hedging purposes. As a result, our fourth quarter economic return (change in book value plus dividends) is expected to significantly outpace the performance of our mortgage REIT peers holding longer duration portfolios that will be reporting in the coming weeks. “We remain confident in our strategy of cost-effectively managing a leveraged portfolio of agency-guaranteed residential ARM securities that can produce attractive risk-adjusted returns over the long term while reducing, but not eliminating, sensitivity to changes in interest rates.” 15 |
 Capstead’s Quarterly Income Statements
(dollars in thousands, except per share amounts, unaudited)
16 December September June March December 2016 2016 2016 2016 2015 Interest income: Residential mortgage investments 50,040 $ 49,845 $ 53,309 $ 59,500 $ 57,518 $ Other 143 174 128 192 60 50,183 50,019 53,437 59,692 57,578 Interest expense: Secured borrowings (27,421) (26,636) (27,014) (26,582) (23,937) Unsecured borrowings (1,910) (1,970) (1,976) (1,977) (2,087) (29,331) (28,606) (28,990) (28,559) (26,024) 20,852 21,413 24,447 31,133 31,554 Other revenue (expense):
Compensation-related expense
(2,219) (1,299) (2,042) (3,224) (2,627) Separation of service charge
(225) (2,740)
-
-
- Other
general and administrative expense (1,117)
(1,239)
(1,157)
(1,169)
(1,170)
Miscellaneous other revenue
159 305 382 613 600 (3,402) (4,973) (2,817) (3,780) (3,197) Net income 17,450 $ 16,440 $ 21,630 $ 27,353 $ 28,357 $ Net income available to common stockholders: Net income 17,450 $ 16,440 $ 21,630 $ 27,353 $ 28,357 $ Less preferred stock dividends (3,857) (3,846) (3,843) (3,826) (3,821) 13,593 $ 12,594 $ 17,787 $ 23,527 $ 24,536 $ Net income per diluted common share $0.14 $0.13 $0.19 $0.25 $0.26 Average long-term investment capital 1,369,928 $ 1,380,006 $ 1,388,476 $ 1,398,043 $ 1,431,338 $ Average balance of mortgage assets 13,320,407 13,629,220 13,837,817 13,848,718 14,115,691 Investment premium amortization 34,945 36,076 33,052 26,011 28,732 Average constant prepayment rate, or CPR
23.19%
18.23%
19.62% Average total financing spreads
0.64
0.82
0.83 Average financing spreads on residential mortgage
investments (a)
0.70
0.90
0.90
0.62 Quarter Ended
0.61
25.59%
0.55
0.56
25.80% (a)
See page 19 for further information regarding this non-GAAP financial measure. |
 Capstead’s Annual Income Statements –
Five Years Ended 2016 (dollars in thousands, except per share amounts, unaudited) 17 December December December December December 2016 2015 2014 2013 2012 Interest income: Residential mortgage investments 212,694 $ 215,989 $ 226,749 $ 215,137 $ 255,931 $ Other 637 341 315 322 698 213,331 216,330 227,064 215,459 256,629 Interest expense: Secured borrowings (107,653) (85,521) (65,155) (66,368) (69,101) Unsecured borrowings (7,833) (8,454) (8,488) (8,736) (8,747) (115,486) (93,975) (73,643) (75,104) (77,848) 97,845 122,355 153,421 140,355 178,781 Other revenue (expense): Compensation-related expense (8,784) (10,200) (8,302) (9,341) (10,972) Separation of service charge (2,965) - - - - Other general and administrative expense
(4,682) (4,798) (4,157) (4,476) (4,271) Miscellaneous other revenue (expense)
1,459 968 (142) (300) (171) (14,972) (14,030) (12,601) (14,117) (15,414) Income before equity in earnings of unconsolidated affiliates 82,873 108,325 140,820 126,238 163,367 Equity in earnings of unconsolidated affiliates - - - 249 259 Net income 82,873 $ 108,325 $ 140,820 $ 126,487 $ 163,626 $ Net income per diluted common share $0.70 $0.97 $1.33 $0.93 $1.50 Core earnings per diluted common share
(a) $1.16 Average long-term investment capital 1,384,074 $ 1,476,953 $ 1,498,252 $ 1,545,350 $ 1,564,872 $ Average balance of mortgage assets 13,658,034 13,922,698 13,424,149 13,550,511 13,190,380 Investment premium amortization 130,084 121,190 101,872 125,872 96,677 Average constant prepayment rate, or CPR
17.28%
21.45%
17.60% Average total financing spreads
1.06
0.96
1.26 Average financing spreads on residential mortgage
investments (a)
1.17
1.07
1.38
0.89
0.64
0.81
20.37% Year Ended
0.72
23.20% (a)
See page 19 for further information regarding these non-GAAP financial measures. |
 Capstead’s Comparative Balance Sheets
(dollars in thousands, except per share amounts, unaudited)
18 December 31, December 31, December 31, December 31, December 31, 2016 2015 2014 2013 2012 Assets Residential mortgage investments 13,316,282 $ 14,154,737 $ 13,908,104 $ 13,475,874 $ 13,860,158 $ Cash collateral receivable from interest rate swap counterparties 29,660 50,193 53,139 25,502 49,972 Interest rate swap agreements at fair value 24,709 7,720 1,657 5,005 169 Cash and cash equivalents
56,732 54,185 307,526 413,356 425,445 Receivables and other assets 149,493 179,531 116,525 94,014 128,086 Investments in unconsolidated affiliates - -
- - 3,117 13,576,876 $ 14,446,366 $ 14,386,951 $ 14,013,751 $ 14,466,947 $ Liabilities Secured borrowings 12,145,346 $ 12,958,394 $ 12,806,843 $ 12,482,900 $ 12,784,238 $ Interest rate swap agreements at fair value 24,417 26,061 27,034 11,304 32,868 Unsecured borrowings 98,090 97,986 97,882 97,783 100,779 Common stock dividend payable 22,634 25,979 34,054 30,872 29,512 Accounts payable and accrued expenses 38,702 39,622 30,367 25,109 22,425 12,329,189 13,148,042 12,996,180 12,647,968 12,969,822 Stockholders' Equity Preferred stock 199,059 197,172 183,936 165,756 188,992 Common stock 942,842 965,057 979,413 980,884 1,014,223 Accumulated other comprehensive income 105,786 136,095 227,422 219,143 293,910 1,247,687 1,298,324 1,390,771 1,365,783 1,497,125 13,576,876 $ 14,446,366 $ 14,386,951 $ 14,013,751 $ 14,466,947 $ Book value per common share (based on
outstanding shares of common stock and calculated assuming
liquidation preferences for preferred stock) (unaudited)
$10.85 $11.42 $12.52 $12.47 $13.58 Long-term investment capital
(stockholders' equity and unsecured borrowings, net of investments in related unconsolidated affiliates prior their dissolution in December 2013) (unaudited) $1,345,777 $1,396,310 $1,488,653 $1,463,566 $1,594,787 Portfolio leverage (secured
borrowings divided by long-term investment capital)
(unaudited) 9.02:1
9.28:1 8.60:1 8.53:1 8.02:1 |
 2016 2015 Quarter Ended: Q4 Q3 Q2 Q1 Q4 Q3 Q2 Q1 Total financing spreads 0.55% 0.56% 0.64% 0.82% 0.83% 0.66% 0.74% 1.01% Impact of yields on other interest-earning assets 0.01 0.01 0.01 0.03 0.01 0.03 0.04 0.04 Impact of borrowing rates on other interest-paying
liabilities 0.05 0.05 0.05 0.05 0.06 0.05 0.06 0.06 Financing spreads on residential mortgage investments 0.61 0.62 0.70 0.90 0.90 0.74 0.84 1.11 Non-GAAP Financial Measures As of December 31, 2016 (unaudited) 19 Financing spreads on residential mortgage investments, a non-GAAP financial measure, differs from total financing spreads, an
all-inclusive GAAP measure, that is based on all interest-earning
assets and all interest-paying liabilities. We believe presenting financing spreads on residential mortgage investments provides useful information for evaluating the performance of the Company’s portfolio.
Core earnings per diluted common share is a non-GAAP financial measure that differs
from the related GAAP measure of net income per diluted common share by
excluding certain one-time effects of second quarter 2013 transactions to redeem then-outstanding high-cost convertible preferred capital and issue our 7.50% Series E preferred shares. We believe presenting this metric on a core earnings basis provides useful,
comparative information for evaluating the Company’s performance.
Year Ended: 2016 2015 2014 2013 2012 Total financing spreads 0.64% 0.81% 1.06% 0.96% 1.26% Impact of yields on other interest-earning assets 0.02 0.03 0.05 0.04 0.06 Impact of borrowing rates on other interest-paying
liabilities 0.06 0.05 0.06 0.07 0.06 Financing spreads on residential mortgage investments 0.72 0.89 1.17 1.07 1.38 Core earnings available to common stockholders Quarter Ended
Year Ended and core earnings per diluted common share: June 30, 2013
December 31, 2013 Net income available to common stockholders $ 4,103 $0.04 $ 89,027 $0.93 Redemption preference premiums paid 19,924 0.21 19,924 0.21 Convertible preferred dividends accruing from the Series E preferred stock issue date to the convertible preferred redemption date 1,741 0.02 1,741 0.02 Core earnings available to common stockholders $ 25,768 $0.27 $110,692 $1.16 |
 Experienced Management Team
20 Our top three executive officers have a combined 75 years of mortgage finance industry experience.
Phillip A. Reinsch – President and Chief Executive Officer, Director, Chief Financial Officer and Secretary – Appointed President, Chief Executive Officer and Director in July 2016 – Served as Chief Financial Officer since 2003, and has served in other executive positions at Capstead since 1993
– Formerly employed by Ernst & Young LLP focusing on mortgage banking and asset securitization
– A CPA and member of the NAREIT Mortgage REIT Council, the FEI Dallas Chapter Real Estate Steering Committee and the NACD
Robert R. Spears – Executive Vice President, Chief Investment Officer – Has served in asset and liability management positions at Capstead since 1994 – Formerly Vice President of secondary marketing with NationsBanc Mortgage Corporation
Roy S. Kim – Senior Vice President, Asset and Liability Management and Treasurer – Joined Capstead in April 2015 augmenting our asset and liability management capabilities with primary responsibility for liability
management – Has over 20 years experience in the mortgage finance industry, primarily in trading capacities with JP Morgan and Bank of America
|