Attached files
| file | filename |
|---|---|
| EX-32 - EXHIBIT 32 - NET 1 UEPS TECHNOLOGIES INC | exhibit32.htm |
| EX-31.2 - EXHIBIT 31.2 - NET 1 UEPS TECHNOLOGIES INC | exhibit31-2.htm |
| EX-31.1 - EXHIBIT 31.1 - NET 1 UEPS TECHNOLOGIES INC | exhibit31-1.htm |
| EX-23 - EXHIBIT 23 - NET 1 UEPS TECHNOLOGIES INC | exhibit23.htm |
| EX-21 - EXHIBIT 21 - NET 1 UEPS TECHNOLOGIES INC | exhibit21.htm |
| EX-12 - EXHIBIT 12 - NET 1 UEPS TECHNOLOGIES INC | exhibit12.htm |
| EX-10.32 - EXHIBIT 10.32 - NET 1 UEPS TECHNOLOGIES INC | exhibit10-32.htm |
UNITED STATES
SECURITIES AND EXCHANGE COMMISSION
Washington, D.C. 20549
FORM 10-K
[X] ANNUAL REPORT PURSUANT TO SECTION 13 OR 15(d) OF THE
SECURITIES EXCHANGE ACT OF 1934
For the fiscal year ended June 30, 2016
or
[ ] TRANSITION REPORT PURSUANT TO SECTION 13 OR
15(d) OF THE SECURITIES EXCHANGE ACT OF 1934
For the transition period
from
to
Commission file number: 000-31203
NET 1 UEPS TECHNOLOGIES, INC.
(Exact name of registrant as specified in its charter)
| Florida | 98-0171860 |
| (State or other jurisdiction | (I.R.S. Employer |
| of incorporation or organization) | Identification No.) |
President Place, 4th Floor, Cnr. Jan
Smuts Avenue and Bolton Road
Rosebank, Johannesburg 2196, South Africa
(Address of principal executive offices)
Registrant’s telephone number, including area code: 27-11-343-2000
Securities registered pursuant to section 12(b) of the Act:
| Title of Each Class | Name of Each Exchange on Which Registered |
| Common Stock, | |
| par value $0.001 per share | NASDAQ Global Select Market |
Securities registered pursuant to section 12(g) of the Act:
None
Indicate by check mark if the registrant is a well-known
seasoned issuer, as defined in Rule 405 of the Securities Act.
Yes
[ ] No [X]
Indicate by check mark if the registrant is not required to
file reports pursuant to Section 13 or Section 15(d) of the Act.
Yes
[ ] No [X]
Indicate by check mark whether the registrant (1) has filed all
reports required to be filed by Section 13 or 15(d) of the Securities Exchange
Act of 1934 during the preceding 12 months (or for such shorter period that the
registrant was required to file such reports), and (2) has been subject to such
filings requirements for the past 90 days.
Yes
[X] No [ ]
Indicate by check mark whether the registrant has submitted
electronically and posted on its corporate Web site, if any, every Interactive
Data File required to be submitted and posted pursuant to Rule 405 of Regulation
S-T (§232.405 of this chapter) during the preceding 12 months (or for such
shorter period that the registrant was required to submit and post such files).
Yes [X] No [ ]
Indicate by check mark if disclosure of delinquent filers pursuant to Item 405 of Regulation S-K (§229.405) is not contained herein, and will not be contained, to the best of registrant’s knowledge, in definitive proxy or information statements incorporated by reference in Part III of this Form 10-K or any amendment to this Form 10-K. [ ]
Indicate by check mark whether the registrant is a large accelerated filer, an accelerated filer, a non-accelerated filer, or a smaller reporting company. See the definitions of “large accelerated filer,” “accelerated filer,” and “smaller reporting company” in Rule 12b-2 of the Exchange Act (Check one):
| [ ] | Large accelerated filer | [X] | Accelerated filer |
| [ ] | Non-accelerated filer | [ ] | Smaller reporting company |
| (Do not check if a smaller reporting company) |
Indicate by check mark whether the registrant is a shell
company (as defined in Rule 12b-2 of the Exchange Act).
Yes [
] No [X]
The aggregate market value of the registrant’s common stock held by non-affiliates of the registrant as of December 31, 2015 (the last business day of the registrant’s most recently completed second fiscal quarter), based upon the closing price of the common stock as reported by The Nasdaq Global Select Market on such date, was $378,497,227. This calculation does not reflect a determination that persons are affiliates for any other purposes.
As of August 22, 2016, 54,135,778 shares of the registrant’s common stock, par value $0.001 per share were outstanding.
DOCUMENTS INCORPORATED BY REFERENCE
Certain portions of the definitive Proxy Statement for our 2016 Annual Meeting of Shareholders are incorporated by reference into Part III of this Form 10-K.
| NET 1 UEPS TECHNOLOGIES, INC. |
| INDEX TO ANNUAL REPORT ON FORM 10-K |
| Year Ended June 30, 2016 |
1
PART I
FORWARD LOOKING STATEMENTS
In addition to historical information, this Annual Report on Form 10-K contains forward-looking statements that involve risks and uncertainties that could cause our actual results to differ materially from those projected, anticipated or implied in the forward-looking statements. Factors that might cause or contribute to such differences include, but are not limited to, those discussed in Item 1A—“Risk Factors.” In some cases, you can identify forward-looking statements by terminology such as “may,” “will,” “should,” “could,” “would,” “expects,” “plans,” “intends,” “anticipates,” “believes,” “estimates,” “predicts,” “potential” or “continue” or the negative of such terms and other comparable terminology. You should not place undue reliance on these forward-looking statements, which reflect our opinions only as of the date of this Annual Report. We undertake no obligation to release publicly any revisions to the forward-looking statements after the date of this Annual Report. You should carefully review the risk factors described in other documents we file from time to time with the Securities and Exchange Commission, including the Quarterly Reports on Form 10-Q to be filed by us during our 2017 fiscal year, which runs from July 1, 2016 to June 30, 2017.
ITEM 1. BUSINESS
Overview
We are a leading provider of payment solutions, transaction processing services and financial technology across multiple industries and in a number of emerging and developed economies.
We have developed and market a comprehensive transaction processing solution that encompasses our smart card-based alternative payment system for the unbanked and under-banked populations of developing economies and for mobile transaction channels. Our market-leading system can enable the billions of people globally who generally have limited or no access to a bank account to enter affordably into electronic transactions with each other, government agencies, employers, merchants and other financial service providers. Our universal electronic payment system, or UEPS, and UEPS/EMV derivative discussed below, uses biometrically secure smart cards that operate in real-time but offline, unlike traditional payment systems offered by major banking institutions that require immediate access through a communications network to a centralized computer. This offline capability means that users of our system can conduct transactions at any time with other card holders in even the most remote areas so long as a smart card reader, which is often portable and battery powered, is available. Our off-line systems also offer the highest level of availability and affordability by removing any elements that are costly and are prone to outages. Our latest version of the UEPS technology has been certified by the EuroPay, MasterCard and Visa global standard, or EMV, which facilitates our traditionally proprietary UEPS system to interoperate with the global EMV standard and allows card holders to transact at any EMV-enabled point of sale terminal or automated teller machine, ATM. The UEPS/EMV technology has been deployed on an extensive scale in South Africa through the issuance of MasterCard-branded UEPS/EMV cards to our social welfare grant customers. In addition to effecting purchases, cash-backs and any form of payment, our system can be used for banking, healthcare management, international money transfers, voting and identification.
We also provide secure financial technology solutions and services, by offering transaction processing, financial and clinical risk management solutions to various industries. We have extensive expertise in secure online transaction processing, cryptography, mobile telephony, integrated circuit card (chip/smart card) technologies, and the design and provision of financial and value-added services to our cardholder base.
Our technology is widely used in South Africa today, where we distribute pension and welfare payments, using our UEPS/EMV technology, to over ten million recipient cardholders across the entire country, process debit and credit card payment transactions on behalf of a wide range of retailers through our EasyPay system, process value-added services such as bill payments and prepaid airtime and electricity for the major bill issuers and local councils in South Africa, and provide mobile telephone top-up transactions for all of the South African mobile carriers. We are the largest provider of third-party and associated payroll payments in South Africa through our FIHRST service. We provide financial inclusion services such as microloans, insurance, mobile transacting and prepaid utilities to our cardholder base.
In addition, through KSNET, we are one of the top three value-added network, or VAN, processors in South Korea, and we offer card processing, payment gateway and banking value-added services in that country. We have expanded our card issuing and acquiring capabilities through the acquisition of Transact24 in Hong Kong. Our Masterpayment subsidiary in Germany provides value added payment services to online retailers across Europe. Our XeoHealth service provides funders and providers of healthcare in United States with an on-line real-time management system for healthcare transactions.
2
Our ZAZOO business unit is responsible for the worldwide technical development and commercialization of our array of web and mobile applications and payment technologies, such as Mobile Virtual Card, or MVC, Chip and GSM licensing and Virtual Top Up, or VTU, and has deployed solutions in many countries, including South Africa, the United Kingdom, Namibia, Nigeria, Malawi, Cameroon, the Philippines, India and Colombia.
All references to “the Company,” “we,” “us,” or “our” are references to Net 1 UEPS Technologies, Inc. and its consolidated subsidiaries, collectively, and all references to “Net1” are to Net 1 UEPS Technologies, Inc. only, except as otherwise indicated or where the context indicates otherwise.
Market Opportunity
Services for the under-banked: According to the World Bank’s Global Findex Database, 54% of adults in developing economies have no bank account. As a result, two billion adults around the world remain entirely excluded from the financial system. This situation arises when banking fees are either too high relative to an individual’s income, a bank account provides little or no meaningful benefit or there is insufficient infrastructure to provide financial services economically in the individual’s geographic location. We refer to these people as the unbanked and the under-banked. These individuals typically receive wages, welfare benefits, money transfers or loans in the form of cash, and conduct commercial transactions, including the purchase of food and clothing, in cash.
The use of cash, however, presents significant risks. In the case of recipient cardholders, they generally have no secure way of protecting their cash other than by converting it immediately into goods, carrying it with them or hiding it. In cases where an individual has access to a bank account, the typical deposit, withdrawal and account fees meaningfully reduce the money available to meet basic needs. For government agencies and employers, using cash to pay welfare benefits or wages results in significant expense due to the logistics of obtaining that cash, moving it to distribution points and protecting it from theft.
Our target under-banked customer base in most emerging economies, and particularly in sub-Saharan Africa, has limited access to formal financial services and therefore relies heavily on the unregulated informal sector for such services. By leveraging our smart card and mobile technologies, we are able to offer affordable, secure and reliable financial services such as transacting accounts, loans and insurance products to these consumers and alleviate some of the challenges they face in dealing with the informal sector.
With over 30 million cards issued in more than ten developing countries around the world, our track record and scale uniquely positions us to continue further geographical penetration of our technology in additional emerging countries.
Online transaction processing services: The continued global growth of retail credit and debit card transactions is reflected in the April 2016 Nilson Report, according to which worldwide annual general purpose card purchase dollar volume increased 16.4% to $25.7 trillion in 2015, while transaction volume increased by 14.6% to 263.6 billion transactions and cards issued increased by 8.2% to 10.3 billion cards during the same period. General purpose cards include the major card network brands such as MasterCard, Visa, UnionPay and American Express. In South Africa, we operate the largest bank-independent transaction processing service through EasyPay, where we have developed a suite of value-added services such as bill payment, airtime top-up, gift card, money transfer and prepaid utility purchases that we offer as a complete solution to merchants and retailers. In South Korea, through KSNET, we are one of the top three VAN processors, and we provide card processing, banking value-added services and payment gateway functionality to more than 225,000 retailers. Transact24 and Masterpayment are established, growing processors with experienced management teams which offer a variety of value-added online transaction processing services. Our expertise in on-line transaction processing and value-added services provides us with the opportunity to participate globally in this rapidly growing market segment.
Mobile payments: The rapid growth of online commerce and the emergence of mobile devices as the preferred access channel for transacting online has created a global opportunity for the provision of secure payment services to online retailers and service providers. Our ZAZOO business unit is focused on providing secure payment solutions for all card-not-present transactions through the application of our MVC and other proprietary solutions.
Despite lacking access to formal financial services, large proportions of the under-banked customer segment own and utilize mobile phones. The World Bank’s research has confirmed the rising popularity of using mobile phones to transfer money and for banking that often does not require setting up an account at a brick-and-mortar bank. The World Bank has stated that mobile banking, which allows account holders to pay bills, make deposits or conduct other transactions via text messaging, has rapidly expanded in Sub-Saharan Africa, where traditional banking has been hampered by transportation and other infrastructure problems. The rising popularity of mobile money accounts has pushed overall account penetration from 24% in 2011 to 34% in 2014.
3
Mobile phones are therefore increasingly viewed as a channel through which this underserved population can gain access to formal financial and other services. Today, most mobile payment solutions offered by various participants in the industry largely provide access to information and basic services, such as allowing consumers to check account balances or transfer funds between existing accounts with the financial institution, but they offer limited functionality and ability to use the mobile device as an actual payments and banking instrument. Our UEPS and MVC solutions are enabled to run on the SIM cards in or as applications on mobile phones and provide our users with secure payment and banking functionality.
Healthcare: Given the lack of broad-based healthcare services in many emerging economies, governments are increasingly focused on driving initiatives to provide affordable and accessible healthcare services to their populations. Similarly, countries such as the United States are embarking on expansive overhauls of their existing healthcare systems.
Through our XeoHealth service we utilize our real-time rules engine and claims processing technology to offer governments, funders and providers of healthcare a comprehensive solution that offers a completely automated healthcare rules adjudication and payment system, reducing both cost and time.
Our Core Proprietary Technologies
UEPS and UEPS/EMV
We developed our core UEPS technology to enable the affordable delivery of financial products and services to the world’s unbanked and under-banked populations. Our native UEPS technology is designed to provide the secure delivery of these products and services in the most under-developed or rural environments, even in those that have little or no communications infrastructure. Unlike a traditional credit or debit card where the operation of the account occurs on a centralized computer, each of our smart cards effectively operates as an individual bank account for all types of transactions. All transactions that take place through our system occur between two smart cards at the point of service, or POS, as all of the relevant information necessary to perform and record transactions reside on the smart cards.
The transfer of money or other information can take place without any communication with a centralized computer since all validation, creation of audit records, encryption, decryption and authorization take place on, or are generated between, the smart cards themselves. Importantly, the cards are protected through the use of biometric fingerprint identification, which is designed to ensure the security of funds and card holder information. Transactions are generally settled by merchants and other commercial participants in the system by sending transaction data to a mainframe computer on a batch basis. Settlements can be performed online or offline. The mainframe computer provides a central database of transactions, creating a complete audit trail that enables us to replace lost smart cards while preserving the notional account balance, and to identify fraud.
Our UEPS technology includes functionality that allows the following:
| • | Transparent and automatic recovery of transactions; | |
| • | Transaction cancellation; | |
| • | Refunds; | |
| • | Multiple audit trails; | |
| • | Offline loading and spending; | |
| • | Biometric identification; | |
| • | Continuous debit; | |
| • | Multiple wallets; | |
| • | “Morphing” of other common payment systems, such as EMV; | |
| • | Automatic credit; | |
| • | Automatic debit; | |
| • | Interest calculations; and | |
| • | “Milking” / batching of large transaction volumes in an off-line environment. |
Our UEPS technology incorporates the software, smart cards, payment terminals, back-end processing infrastructure, biometric systems and transaction security to provide a complete payment and transaction processing solution.
Within industry verticals, our UEPS technology is applied to electronic commerce transactions in the fields of social security, wage distribution, banking, medical and patient management, money transfers, voting and identification systems. Market sectors include government and non-government organizations, or NGOs, healthcare, telecoms, financial institutions, retailers, petroleum distributors and utilities.
4
Our latest version of the UEPS technology is interoperable with the global EMV standard, allowing the cards to be used wherever EMV cards are accepted, while also providing all the additional functionality offered by UEPS. This UEPS/EMV functionality is especially relevant in areas where there is an established payment system and provides flexibility to our customers to be serviced at any POS, including point of sale devices and ATMs. Our UEPS/EMV solution therefore expands our addressable market to include developed economies with established payment networks. The UEPS/EMV technology removes the hurdle, often perceived in developed economies, of operating a proprietary or “closed-loop” system by providing a truly inter-operable payment solution.
Mobile Virtual Card
We developed MVC, an innovative mobile phone-based payment solution that enables secure purchases with no disruption to existing merchant infrastructures and provides significant incentives for all stakeholders.
MVC utilizes existing and traditional payment methods but enhances them by replacing or tokenizing plastic card data with one-time-use virtual card data, hence eliminating the risk of theft, phishing, skimming, spoofing, etc. The virtual card data replaces, digit-for-digit, the credit (or debit) card number, the expiration date and the card verification value with only the issuer bank identification number (first 6-digit) remaining constant.
MVC uses the mobile phone to generate virtual cards offline. The mobile phone is the most available, cost-effective, secure and portable platform for generating virtual cards for remote payments (online purchasing, money transfers, phone and catalogue orders).
Following a simple registration process, the virtual card application is activated over-the-air, enabling the phone to generate virtual card numbers completely off-line. MVCs are used like traditional plastic credit or debit cards, except that as soon as the transaction is authorized, the generated card number expires once the preset monetary amount has been utilized or after completion of the specific transaction that it was generated for. While MVC has been focused primarily on card-not-present transactions for internet payments in our initial deployments, we are constantly expanding the applicability of the software to incorporate new trends such as presentation through near field communication, or NFC, or Quick Response, or QR, Codes.
Consumers can easily generate a new card on their mobile phone to shop on the internet or to place a catalogue or telephone order. MVCs are completely secure and can also be sent in a single click to family, friends, and service providers. Once the authorization request reaches the issuing bank processor, our servers decrypt the virtual card data, authenticate the consumer and pass the transaction request to the card issuer for authorization. MVC can be offered as a prepaid solution or directly linked to a subscriber’s credit or debit card or other funding account. Subscribers can load prepaid virtual accounts with cash at participating locations, or electronically via their bank accounts, direct deposit or other electronic wallets.
The benefits of MVC include, for:
| • |
Card issuers—increased transactional revenues from existing accounts, driving more transactional revenues and elimination of fraudulent card use. | |
| • |
Mobile network operators—revenues from payments, reduced churn and opportunities for powerful co-branding schemes. | |
| • | Consumers—convenience, peace of mind, ease of use and rewards. | |
| • | Merchants—elimination of charge-backs and fraud at no extra cost. |
Our Strategy
We intend to provide the leading transacting system for the billions of unbanked and under-banked people in the world to engage in electronic transactions, to be the provider of choice for secure mobile payment and other card-not-present transactions and to provide our transaction processing, value-added services processing and healthcare processing services globally. To achieve these goals, we are pursuing the following strategies:
Build on our significant and established infrastructures—We control significant components of the payment infrastructure in South Africa, South Korea, Botswana and Namibia and we believe that we are well-positioned to leverage our existing asset base to continue to gain market share and build upon the critical mass that we have developed.
5
For example, in South Africa, we are one of the leading independent transaction processors, the national provider of social welfare payment distribution services to the country’s large unbanked and under-banked population, the largest third-party processor of retail merchant transactions and the leading processor of third-party payroll payments. We believe that our large cardholder base, specialized technology and payment infrastructure, together with our strong government and business relationships, position us at the epicenter of commerce in the country. Through our national distribution platform and relationships with a number of leading companies across multiple industries, we believe that we can provide many of the services consumed by our cardholders who would normally not have access to these services or would otherwise have to rely on the informal sector. We have already introduced several services to our cardholder and merchant base, such as low cost, high functionality bank accounts, microloans, life insurance, bill payment, prepaid mobile top-up and prepaid utility services. We have a network of mobile ATMs to provide services to our cardholders, and we have established a national fixed ATM network. We aim to increase the adoption of our existing services by expanding our cardholder base and our transacting network, and we aim to increase our service offerings by developing new products and distribution networks and by forging partnerships with industry participants who share our vision and can accelerate the implementation of our business plan. Our core focus remains the development and provision of our technological expertise. We have established significant operational assets to ensure the rapid deployment of our technology. As these deployments mature, we may share or dispose of these operational assets if we believe this will result in higher efficiencies and synergistic benefits where we are able to provide technology to an expanded base of clients and operations.
Our latest product, EasyPay Everywhere, provides our target market with an affordable all-inclusive transactional bank account with unfettered access to financial services such as microloans, life insurance, remittances, value added services such as prepaid utilities and bill payments through their mobile phones and our national network of ATMs and POS devices.
We plan to follow a similar approach in the other markets where we have an established infrastructure, taking into account the specific requirements of the local legislation, the composition of the local payment system and the specific components that we own or control. In markets where we do not have an established infrastructure, we intended to collaborate with local partners to provide a similar end-to-end solution.
Leveraging our new payment technologies to gain access to developed and developing economies—While our business has traditionally focused on marketing products and services to the world’s unbanked and under-banked population, we have developed and acquired proprietary technology, with a specific focus on mobile payments, that is particularly relevant to developed economies as well. Our MVC application for mobile telephones, for example, is designed to eliminate fraud associated with card-not-present credit card transactions effected by telephone or over the internet and are prevalent in developed economies such as the United States. We believe that mobile payments, mobile wallets and the related applications should be a critical component of a payment processor’s future strategy and we have dedicated a significant portion of our research and development and business development resources to ensure that we remain at the forefront of this rapidly evolving technological space. While some of our mobile solutions are more relevant in developed markets such as the United States, we have also experienced significant demand for our mobile payment solutions from developing economies, where mobile transacting is seen as the best solution to rapidly leapfrog the antiquated payment solutions typically available in these countries at minimal cost. We plan to expand our market share in the mobile solutions and card-not-present processing markets by pursuing partnerships or supply relationships with online merchants, virtual card issuers, payment services processors, mobile remittance providers and other online service providers.
Pursue strategic acquisition opportunities or partnerships to gain access to new markets or complementary product— We will continue to pursue acquisition opportunities and partnerships that provide us with an entry point for our existing products into a new market, or provide us with technologies or solutions complementary to our current offerings. Our recent acquisition of Transact 24 Limited, a Hong Kong based payment services provider, for example, provides us with access to the rapidly growing Chinese financial technology market and its participants, such as China UnionPay and Alipay, while our recent acquisition of Masterpayment has enabled access to the European market and to value-added products such as working capital financing for online retailers. In addition, we expect to leverage our relationship with the International Finance Corporation and certain funds management by IFC Asset Management Company, collectively, the IFC Investors, as well as utilize the proceeds received from them to pursue strategic and synergistic acquisition opportunities and partnerships in developing markets.
Our Business Units
Our company is organized into the following business units:
ZAZOO
Our ZAZOO business unit is managed from London, United Kingdom with business development support branches in South Africa, the United States and India. This business unit is responsible for the technical development and commercialization of our array of web and mobile applications and payment technologies.
6
ZAZOO offers an array of products and services that cater for the needs of the global market and comprises of the following key business lines:
| • |
MVC & Verification—Our internationally patented MVC technology is a market leading innovation which addresses the needs of the modern mobile payment market. It is the easiest, most secure and most convenient way to pay for goods and services online directly from a mobile phone. Our MVC technology provides a completely secure, off-line payment solution for card-not-present transactions, such as payments made for internet purchases. The MVC technology runs as an application on any mobile phone and utilizes our patented cryptographic card generator to secure any payment transaction. The advent of new technologies such as NFC or QR Codes also enables the utilization of our MVC technology for card present payments. | |
| • |
Third Party Payments—Through FIHRST we are the largest provider of third party and payroll associated payments in South Africa, servicing over 2,050 employee groups that represent approximately 650,000 employees. Our market leading position is due to our ability to move informed money (the movement of money and its corresponding data to third party organizations). This allows us to provide one of the most comprehensive suites of financial services, ranging from garnishee orders to payment modules and collections. We also offer the PayPlus service, providing employees with access to prepaid airtime, electricity and other value added services, or VAS. | |
| • |
Prepaid Vending —Our Prepaid Vending business line handles multichannel distribution of electronic products and services aimed at a variety of markets. Across Africa and abroad, our VTU solutions create a separate revenue stream for Mobile Network Operators, or MNOs, and other clients. The stability and scalability of our VTU offerings enables our customers to facilitate more than 100 million monthly transactions. | |
| • |
MNOs Solutions—We provide specialized solutions for MNOs that boost average revenue per user, increase subscriber activity, and collect valuable profiling data. Our solutions range from Advance Airtime and Mobile Wallet technology to SMS Mega Promotions, tailor-made for each MNO with a focus to maximize subscriber activity, brand perception and profitability. | |
| • |
Chip & SIM—Through our partnerships with MNOs as well as card and semiconductor manufacturers, we provide a strong lineup of feature rich chip and SIM solutions. All of these offerings include our wide range of GSM Masks and custom software that enables mobile telephony, transactions and on-chip VAS. We support the above chip and SIM developments with dedicated chip-card based commerce frameworks. These incorporate POS, terminal and interbank transaction switching and clearance aimed at national government, petroleum and retail industries. | |
| • |
Custom Development—The Custom Development business line produces solutions that span across Web, Mobile, Server, POS and Desktop environments. These solutions have been developed by addressing the needs of various industries and now form an integral pillar of our product and service portfolio. We develop both client-facing and background services, with coverage on every relevant platform including Mobile (Android, iOS, BlackBerry, Windows Phone 8 and J2ME) and Web (with full cross-browser compatibility). | |
| • |
Cryptography—Our Cryptography business line focuses on security-orientated products which include our range of PIN encryption devices, card acceptance modules and Hardware Security Modules. These focus on financial, retail, telecommunications, utilities and petroleum sectors. In order to constantly enhance and improve our product offerings, special attention is placed on the development of security initiatives including Triple Data Encryption Algorithm, also known as TDES, EMV and Payment Card Industry, or PCI. We are a member of the STS Association, actively participating in developing new and improved standards that address the needs of the modern cryptographic market. |
This business unit has been allocated to our South African processing, International transaction processing, and Financial inclusion and applied technologies reporting segments.
KSNET
Our KSNET business unit is based in Seoul, South Korea, and is a national payment solutions provider. KSNET has one of the broadest product offerings in the South Korean payment solutions market, a base of approximately 225,000 merchants and an extensive direct and indirect sales network. KSNET’s core operations comprise three project offerings, namely card VAN, payment gateway, or PG, and banking VAN. KSNET is able to realize significant synergies across these core operations because it is the only payment solutions provider that offers all three of these offerings in South Korea. Over 90% of KSNET’s revenue comes from the provision of payment processing services to merchants and card issuers through its card VAN.
KSNET’s core product offerings are described in more detail below:
| • |
Card VAN—KSNET’s card VAN offering manages credit and other non-cash alternative payment mechanisms for retail transaction processing for a wide range of merchants and every credit card issuer in South Korea. Non-cash alternative payment mechanisms for which KSNET provides processing services include all credit and debit cards and e-currency (K-cash and TMoney). KSNET also records cash transactions for the South Korean National Tax Service in the form of cash receipts. |
7
| • |
PG—KSNET offers PG services to the rapidly growing number of merchants that are moving online in South Korea. PG provides these merchants with a host of alternative payment solutions including the ability to accept credit and debit cards, gift and other prepaid cards, and bank account transfers. PG also provides virtual account capabilities. PG offers us an attractive growth opportunity as e-commerce transactions represent a growing component of payments, driven by increased wire-line and wireless broadband penetration, merchants moving online, and the enhanced security of online transactions driving consumer acceptance. We believe that KSNET can become the leading provider in the PG industry by leveraging its existing merchant base and entering into new markets earlier than competitors. | |
| • |
Banking VAN—KSNET’s banking VAN operations currently include account transaction processing services, payment and collections to banks, corporate firms, governmental bodies, and educational institutions. We distinguish card VAN from banking VAN because in the South Korean VAN market, banking VAN is recognized as a distinct service from card VAN. We are the only card VAN provider that also provides banking VAN services. Because the banking VAN business industry is at a nascent stage, the market is relatively small. |
This business unit has been allocated to our International transaction processing reporting segment.
Masterpayment
Our Masterpayment business unit is based in Munich, Germany, and is a specialist payment services processor. Masterpayment provides payment and acquiring services for all major European debit and credit cards; and invoicing for online retail, digital goods and content. Masterpayment currently has a client portfolio of approximately 5,000 registered merchants.
In collaboration with Bank Frick & Co. AG, Bank Frick, a Liechtenstein-based bank, Masterpayment provides its e-commerce merchants with working capital optimization by providing a flexible form of financing, which employs a trading transaction instead of traditional bank credit. Masterpayment’s “Finetrading” product enables the seamless financing of a merchant’s inventory orders, resulting in accelerated payment settlement and the elimination of the requirement for a merchant to maintain rolling reserves or cash advances.
This business unit has been allocated to our International transaction processing reporting segment.
Transact24
Our Transact24 business unit is based in Hong Kong, China, and is a payment services provider.
Transact24’s primary business activities include:
| • |
Chinese debit card acquiring—Transact24 has processing relationships with China UnionPay, Alipay and five other Chinese gateways; | |
| • |
Credit card acquiring—Transact24 has acquiring relationships with banks and processing institutions in the United Kingdom, Germany, Australia and Mauritius and has Payment Intermediary Services Licenses in Mauritius and an Electronic Money Institution License in the United Kingdom. Transact24 also offers a white-labeled credit card acquiring gateway to entities who wish to outsource the technical integration and operations of their acquiring gateways; | |
| • |
Automated clearing house, or ACH processing—Transact24 provides unsecured loan ACH processing for Tribal and State-licensed lenders in the U.S.; and | |
| • |
Prepaid card issuing and processing—Transact24 issues U.S. dollar-denominated Visa prepaid cards, South African Rand-denominated MasterCard prepaid cards and Hong Kong dollar-denominated China UnionPay prepaid cards |
This business unit has been allocated to our International transaction processing reporting segment.
Cash Paymaster Services (“CPS”)
Our CPS business unit is based in Johannesburg, South Africa, and deploys our UEPS/EMV–Social Grant Distribution technology to distribute social welfare grants on a monthly basis to over nine million recipient cardholders in South Africa. These social welfare grants are distributed on behalf of the South African Social Security Agency, or SASSA. During our 2016, 2015 and 2014 fiscal years, we derived approximately 21%, 24%, and 27% of our revenues respectively, from CPS’ social welfare grant distribution business.
CPS provides a secure and affordable transacting channel between social welfare grant recipient cardholders, beneficiaries, SASSA and formal businesses. CPS enrolls social welfare grant recipient cardholders and, as appropriate, the respective beneficiaries by issuing the recipient cardholder with a UEPS/EMV smart card that digitally stores their biometric fingerprint templates on the card, enabling them to access their social welfare grants securely at any time or place and providing them with a fully-fledged bank account.
8
The smart card is issued to the recipient cardholder on site and utilizes optical fingerprint sensor technology to identify and verify a recipient cardholder. The recipient cardholder simply inserts a smart card into the POS device and is prompted to present his fingerprint. If the fingerprint matches the one stored on the smart card, the smart card is loaded with the value created for that particular smart card.
The smart card provides the holder with access to all of the UEPS functionality, which includes the ability to have the smart card funded with pension or welfare payments, make retail purchases, enjoy the convenience of prepaid facilities and qualify for a range of affordable financial services, including insurance and short-term loans as well as standard EMV transactional capabilities to operate wherever MasterCard is accepted. The smart card also offers the card holder the ability to make debit order payments to a variety of third parties, including utility companies, schools and retail merchants, with which the holder maintains an account. The card holder can also use the same smart card as a savings account.
Our UEPS/EMV–Social Grant Distribution technology provides numerous benefits to government agencies, recipient cardholders and beneficiaries. The system offers government a reliable service at a reasonable price. For recipient cardholders and, as appropriate, the beneficiaries, our smart card offers financial inclusion, convenience, security, affordability, flexibility and accessibility. They can avoid long waiting lines at payment locations and do not have to get to payment locations on scheduled payment dates to receive cash. They do not lose money if they lose their smart cards, since a lost smart card is replaceable and the biometric fingerprint or voice identification technology helps prevent fraud. Their personal security risks are reduced since they do not have to safeguard their cash. Recipient cardholders have access to affordable financial services, can save money on their smart cards and can perform money transfers to friends and relatives living in other provinces. Finally, recipient cardholders pay no transaction fees when they use our infrastructure to load their smart cards, perform balance inquiries, purchase goods or effect monthly debit orders. For us, the system allows us to reduce our operating costs by reducing the amount of cash we have to transport.
This business unit has been allocated to our South African transaction processing and Financial inclusion and applied technologies reporting segments.
EasyPay
Our EasyPay business unit operates the largest bank-independent financial switch in South Africa and is based in Cape Town, South Africa. EasyPay focuses on the provision of high-volume, secure and convenient payment, prepayment and value-added services to the South African market. EasyPay’s infrastructure connects into all major South African banks and switches both debit and credit card EFT transactions for some of South Africa’s leading retailers and petroleum companies. It is a South African Reserve Bank, or SARB, approved third-party payment processor. In addition to its core transaction processing and switching operations, EasyPay provides a complete end-to-end reconciliation and settlement service to its customers. This service includes dynamic reconciliation as well as easy-to-use report and screen-query tools for down-to-store-level, management and control purposes.
The EasyPay suite of services includes:
| • |
EFT—EasyPay switches credit, debit and fleet card transactions for leading South African retailers and petroleum companies. | |
| • |
EasyPay bill payment—EasyPay offers consumers a point-of-sale bill payment service which is integrated into a large number of national retailers, the internet, self service kiosks and mobile handsets. EasyPay processes monthly account payment transactions for a number of bill issuers including major local authorities, telephone companies, utilities, medical service providers, traffic departments, mail order companies, banks and insurance companies. | |
| • |
EasyPay prepaid electricity—EasyPay enables local utility companies such as Eskom Holdings Limited and a growing number of local authorities on a national basis to sell prepaid electricity to their customers. | |
| • |
Prepaid airtime—EasyPay vends airtime at retail POS terminals for all the South African mobile telephone network operators. | |
| • |
Electronic gift voucher—EasyPay supports the electronic generation, issuance and redemption of paper or card-based gift vouchers. | |
| • |
EasyPay licenses—EasyPay enables the issuance of new South African Broadcasting Corporation, or SABC, television licenses and the capturing of existing license details within retail environments via a web-based user interface. | |
| • |
Third party switching and processing support—EasyPay switches transactions from retail POS systems to the relevant back-end systems. | |
| • |
Hosting services—EasyPay’s infrastructure supports the hosting of payment or back-up servers and applications on behalf of third parties, including utility companies. | |
| • |
EasyPay Kiosk—We have developed a biometrically enabled self service kiosk that allows our customers to access all the value-added services provided by EasyPay and to create and load their EasyPay virtual wallets with value. |
9
| • |
EasyPay Web and Mobile—This service enables EasyPay customers to access all the value-added services provided by EasyPay, such as bill payments and the purchase of prepaid airtime and utilities through a secure website that may be accessed through personal computers or through mobile handsets. |
EasyPay provides 24x7 monitoring and support services, reconciliation, automated clearing bureau settlement, reporting, full disaster recovery and redundancy services.
This business unit has been allocated to our South African transaction processing reporting segment.
Financial Services
We have developed a suite of financial services that is offered to customers utilizing our payment solutions. We are able to provide our UEPS/EMV cardholders with competitive transacting accounts, microfinance, life insurance and money transfer products based on our understanding of their risk profiles, demographics and lifestyle requirements. Our financial services offerings are designed on the principles of simplicity and cost-efficiency as they bring financial inclusion to our millions of cardholders who were previously unable to access any formal financial services. Our latest product, EasyPay Everywhere, provides our target market with an affordable all-inclusive transactional bank account with unfettered access to financial services such as microloans, life insurance, remittances, value added services such as prepaid utilities and bill payments through their mobile phones and our national network of ATMs and POS devices.
Our largest financial services offering is the provision of short-term microloans to our South African UEPS/EMV cardholders, where we provide the loans using our surplus cash reserves and earn revenue from the service fees charged on these loans. We believe our loans are the most affordable form of credit available to our target market as, unlike our competitors, we do not charge interest or initiation fees on our loans. Our Smart Life business unit owns a life insurance license and offers our customer base affordable insurance products applicable to this market segment, focusing on group life and funeral insurance policies.
This business unit has been allocated to our Financial inclusion and applied technologies reporting segment.
Applied Technology
Our Applied Technology business unit is managed from Johannesburg, South Africa, and is responsible for the deployment of our South African ATM and POS network and the sale of biometric and POS solutions to various South African banks, retailers and financial services providers.
Our ATM network is fully EMV-compliant and integrated into the South African national payment system. We deploy our ATMs in areas where our UEPS/EMV cardholders have limited access to the national payment system, or where the cost of accessing the national payment system through other service providers is prohibitive for our cardholders.
This business unit has been allocated to our South African transaction processing and Financial inclusion and applied technologies reporting segments.
XeoHealth
Our XeoHealth business unit operates in the U.S. from Frederick, Maryland, and offers our XeoRules real time adjudication, or RTS, solutions for the end-to-end electronic processing of medical claims information in the United States. XeoHealth has won a number of projects in the United States either as the primary contractor for the provision of our RTS solution to customers, or as a sub-contractor to parties contracted to provide an adjudication solution.
This business unit has been allocated to our International transaction processing reporting segment.
Corporate
The Corporate unit provides global support services to our business units, joint ventures and investments for the following activities:
| • |
Group executive—Responsible for the overall company management, defining our global strategy, investor relations and corporate finance activities. | |
| • |
Finance and administration—Provides company-wide support in the areas of accounting, treasury, human resources, administration, legal, secretarial, taxation, compliance and internal audit. | |
| • |
Group information technology—Defines our overall IT strategy and the overall systems architecture and is responsible for the identification and management of the group’s research and development activities. |
10
| • |
Joint ventures and investments unit—Provides governance support to our joint ventures and assists with the evaluation of new investment opportunities. |
Competition
In addition to competition that our UEPS system faces from the use of cash, checks, credit and debit cards, existing payment systems and the providers of financial services, there are a number of other products that use smart card technology in connection with a funds transfer system. While it is impossible for us to estimate the total number of competitors in the global payments marketplace, we believe that the most competitive product in this marketplace is EMV, a system that is promoted by most of the major card companies such as Visa, MasterCard, JCB and American Express. The competitive advantage of our UEPS offering is that our technology can operate real-time, but in an off-line environment, using biometric identification instead of the standard PIN methodology employed by our competitors. We have enhanced our competitive advantage through the development of our latest version of the UEPS technology that has been certified by EMV, which facilitates our traditionally proprietary UEPS system to interoperate with the global EMV standard and allows card holders to transact at any EMV-enabled point of sale terminal or ATM. The UEPS/EMV technology has been deployed on an extensive scale in South Africa through the issuance of MasterCard-branded UEPS/EMV cards to our social welfare grant recipient cardholders. We estimate that we process less than 1% of all global payment transactions in the international marketplace.
In South Africa, and specifically in the payment of salaries and wages and our affordable EasyPay Everywhere transactional account and our financial services offering, our competitors include the local banks, insurance companies, micro-lenders and other transaction processors. The South African banks and the South African Post Office, or SAPO, also offer low cost bank accounts that enable account holders to receive their salaries, wages or social grants through the formal banking payment networks.
The payment of social welfare grants in South Africa has historically been determined through a highly competitive tender process managed by SASSA. The participants in SASSA’s tender processes have historically included the local banks, other payment processors, SAPO and mobile operators. Our current SASSA contract expires at the end of March 2017 and SASSA has indicated that it intends to internalize all material aspects related to grant payment and administration, although a phased approach may have to be followed.
EasyPay’s competitors include BankservAfrica, UCS, eCentric and Transaction Junction. BankservAfrica is the largest transaction processor in South Africa which processes all transactions on behalf of the South African banks and processes more than 2.5 billion transactions valued at trillions of ZAR per annum.
In the South African ATM network market, we compete against the South African banks, ATM Solutions and Spark ATM Systems, who collectively have a market share in excess of 90%.
We have identified 13 major card VAN companies in South Korea, of which KSNET is one of the three largest. The other two large VAN companies are NICE Information & Telecommunication Inc. and Korea Information & Communications Company, Inc. Entities operating in the VAN industry in South Korea compete on pricing and customer service.
In addition to our traditional competitors, we expect that we will increasingly compete with a number of emerging entities in the mobile payments industry. While the industry is still rapidly evolving, a number of entities are establishing their presence in this space. Specifically identified entities include traditional payment networks such as Visa, MasterCard and American Express; commercial banks such as Barclays and Citigroup; established technology companies such as Apple, Google, Samsung and PayPal; mobile operators such as AT&T, Verizon, Vodafone, MTN and Bharti Airtel; as well as companies specifically focused on mobile payments such as M-Pesa and Square.
Research and Development
During fiscal 2016, 2015 and 2014, we incurred research and development expenditures of $2.3 million, $2.4 million and $2.2 million, respectively. These expenditures consist primarily of the salaries of our software engineers and developers. Our research and development activities relate primarily to the continual revision and improvement of our core UEPS and UEPS/EMV software and its functionality as well as the design and development of our MVC concept and mobile payment applications. For example, we continually improve our security protocols and algorithms as well as develop new UEPS features that we believe will enhance the attractiveness of our product and service offerings. Our research and development efforts also focus on taking advantage of improvements in hardware platforms that are not proprietary to us but form part of our system.
11
Intellectual Property
Our success depends in part on our ability to develop, maintain and protect our intellectual property. We rely on a combination of patents, copyrights, trademarks and trade secret laws, as well as non-disclosure agreements to protect our intellectual property. We seek to protect new intellectual property developed by us by filing new patents worldwide. We hold a number of trademarks in various countries.
Financial Information about Geographical Areas and Operating Segments
Note 23 to our consolidated financial statements included in this annual report contains detailed financial information about our operating segments for fiscal 2016, 2015 and 2014. Revenues based on the geographic location from which the sale originated and geographic location where long-lived assets are held for the years ended June 30, are presented in the table below:
| Revenue | Long-lived assets | ||||||||||||||||||
| 2016 | 2015 | 2014 | 2016 | 2015 (1) | 2014 (1) | ||||||||||||||
| $ | ’000 | $ | ’000 | $ | ’000 | $ | ’000 | $ | ’000 | $ | ’000 | ||||||||
| South Africa | 422,022 | 461,425 | 428,931 | 69,213 | 72,467 | 105,627 | |||||||||||||
| South Korea | 158,609 | 160,853 | 146,667 | 221,459 | 230,109 | 253,147 | |||||||||||||
| Rest of world | 10,118 | 3,701 | 6,058 | 49,105 | 20,058 | 6,593 | |||||||||||||
| Total | 590,749 | 625,979 | 581,656 | 339,777 | 322,634 | 365,367 | |||||||||||||
(1) During the year ended June 30, 2016, we identified a balance sheet misclassification between current assets and long-term assets. Long-lived assets for fiscal 2015 and 2014, have been restated, and have increased by $27.4 million and $23.3 million, respectively.
Employees
As of June 30, 2016, we had 5,701 employees. On a segmental basis, 241 employees were part of our management, 2,571 were employed in South African transaction processing, 310 were employed in International transaction processing, and 2,576 were employed in Financial inclusion and applied technologies and corporate/eliminations activities.
On a functional basis, seven of our employees were part of executive management, 156 were employed in sales and marketing, 238 were employed in finance and administration, 311 were employed in information technology and 4,989 were employed in operations.
As of June 30, 2016, approximately 65 of the 2,571 and one of the 2,576 employees we have in South Africa who were performing transaction-based and financial inclusion activities, respectively, were members of the South African Commercial Catering and Allied Workers Union and approximately 177 of the 240 employees we have in South Korea who perform international transaction-based activities were members of the KSNET Union. We believe that we have a good relationship with our employees and these unions.
Corporate history
Net1 was incorporated in Florida in May 1997. In June 2004, Net1 acquired Net1 Applied Technology Holdings Limited, or Aplitec, a public company listed on the Johannesburg Stock Exchange, or JSE. In 2005, Net1 completed an initial public offering and listed on the Nasdaq Stock Market. In October 2008, Net1 listed on the JSE in a secondary listing, which enabled the former Aplitec shareholders (as well as South African residents generally) to hold Net1 common stock directly.
Available information
We maintain a website at www.net1.com. Our annual report on Form 10-K, quarterly reports on Form 10-Q, current reports on Form 8-K, and amendments to those reports are available free of charge through the “SEC filings” portion of our website, as soon as reasonably practicable after they are filed with the Securities and Exchange Commission. The information contained on, or accessible through, our website is not incorporated into this Annual Report on Form 10-K
12
Executive Officers of the Registrant
The table below presents our executive officers, their ages and their titles:
| Name | Age | Title |
| Serge C.P. Belamant | 62 | Chief Executive Officer, Chairman and Director |
| Herman G. Kotzé | 46 | Chief Financial Officer, Treasurer, Secretary and Director |
| Philip M. Belamant | 31 | Managing Director, ZAZOO Limited |
| Philip S. Meyer | 59 | Managing Director of Transact24 Limited |
| Phil-Hyun Oh | 57 | Chief Executive Officer and President, KSNET, Inc. |
| Nanda Pillay | 47 | Managing Director: Southern Africa |
| Nitin Soma | 49 | Senior Vice President of Information Technology |
Serge C.P. Belamant is one of the founders of our company and has been our Chief Executive Officer since October 2000 and the Chairman of our board since February 2003. He was also Chief Executive Officer of Aplitec. Mr. S.C.P. Belamant spent ten years working as a computer scientist for Control Data Corporation where he won a number of international awards. Later, he was responsible for the design, development, implementation and operation of the Saswitch ATM network in South Africa that still rates as one of the largest ATM switching systems in the world. Mr. S.C.P. Belamant has patented a number of inventions, ranging from biometrics to gaming-related inventions, including our original funds transfer system patent. Mr. S.C.P. Belamant has more than 30 years of experience in the fields of operations research, security, biometrics, artificial intelligence and online and offline transaction processing systems.
Herman Kotzé has been our Chief Financial Officer, Secretary and Treasurer since June 2004. From January 2000 until June 2004, he served on the board of Aplitec as Group Financial Director. Mr. Kotzé joined Aplitec in November 1998 as a strategic financial analyst. Prior to joining Aplitec, Mr. Kotzé was a business analyst at the Industrial Development Corporation of South Africa. Mr. Kotzé has a bachelor of commerce honors degree, a post graduate diploma in treasury management, a higher diploma in taxation, completed his articles at KPMG, and is a member of the South African Institute of Chartered Accountants.
Philip M. Belamant joined us in 2012 and is the business unit head of ZAZOO. This business unit was previously known as Pbel which was founded by Mr. Belamant at the end of 2006 and subsequently acquired by us in 2012. Mr. Belamant has more than 10 years of experience in the fields of mobile development, WASP services, artificial intelligence and mobile payments. Mr. Belamant has a bachelor of science (information technology) honors degree.
Philip Meyer has been the Managing Director of Transact24 Limited since he founded the company in 2006. Mr. Meyer has worked in the payments industry for over 20 years. Prior to incorporating Transact24, he was employed by Naspers, a global media group, as its Chief Executive: Information Technology and New Media and was responsible for all existing and new technology and media for Naspers. Mr. Meyer is a qualified engineer with a masters in engineering (electronic) and has a postgraduate diploma in strategic management. Mr. Meyer is registered with the Engineering Counsel of South Africa, is a member of the South Africa Institute of Electrical Engineers and is also a member of the Digital, Information & Telecommunications Committee and Asia & Africa Committee, Hong Kong General Chamber of Commerce.
Phil-Hyun Oh has served as Chief Executive Officer and President of KSNET since 2007. He is the Chairman of the VAN Association in South Korea. Prior to that, he was the Managing Partner at Dasan Accounting Firm and was the Head of the Investment Banking Division at Daewoo Securities. Mr. Oh is responsible for the day to day operations of KSNET and as its Chief Executive Officer and President is instrumental in setting and implementing its strategy and objectives.
Nanda Pillay joined us in May 2000 and is responsible for our Southern African operations, consisting primarily of CPS, Lending, EasyPay and SmartSwitch Botswana.
Nitin Soma has served as our Senior Vice President of Information Technology since June 2004. Mr. Soma joined Aplitec in 1997. He specializes in transaction switching and interbank settlements and designed the Stratus back-end system for Aplitec. Mr. Soma has over 20 years of experience in the development and design of smart card payment systems. Mr. Soma has a bachelor of science (computer science and applied mathematics) degree.
13
ITEM 1A. RISK FACTORS
OUR OPERATIONS AND FINANCIAL RESULTS ARE SUBJECT TO VARIOUS RISKS AND UNCERTAINTIES, INCLUDING THOSE DESCRIBED BELOW, THAT COULD ADVERSELY AFFECT OUR BUSINESS, FINANCIAL CONDITION, RESULTS OF OPERATIONS, CASH FLOWS, AND THE TRADING PRICE OF OUR COMMON STOCK.
Risks Relating to Our Business
Our SASSA contract expires at the end of March 2017. SASSA has publicly stated that it will not reissue a grant payments tender and that it intends to take over the distribution of social grants when our contract expires. If this occurs, we will lose a significant portion of our revenues.
We have historically derived a substantial portion of our revenues from our contract with SASSA for the payment of social grants. Our current five-year SASSA contract, which we were awarded through a tender process in 2012, expires in March 2017. SASSA issued a tender for a new contract in mid-2015, but in late 2015, it announced that it would not award a new tender and that it intends to take over the distribution of social grants when our contract expires. If SASSA does in fact take over social grants distribution at the end of our contract, then we will lose the revenues from this contract. Unless we are able to replace most or all of these revenues from other sources, our results of operations, financial position, cash flows and future growth are likely to suffer materially.
It is possible that SASSA might request us to enter a transition agreement in order to phase out our services. The South African Constitutional Court has stated that Cash Paymaster Services, or CPS, our subsidiary which is the contracting party with SASSA, is deemed to be an “organ of state” for the purpose of the contract and that CPS has “constitutional obligations” that go beyond its contractual obligations. It is not clear what these obligations may entail in respect of the current and any potential future government contract in South Africa. We cannot predict what the financial implications may be if we are required to continue with the provision of our services without a valid contract, or during any transitional period required for the orderly transfer of our current services to SASSA.
We have increasingly focused our South African business on providing financial products and services independently of SASSA through our EasyPay Everywhere bank account and ATM infrastructure. Future increases in our revenues and operating income will depend in part on our ability to continue to expand this business.
When SASSA issued a new social grants tender in mid-2015, we decided not to participate because we believed that the terms of the tender would not allow for a contract that would be in our best interests. Instead, we began to focus our South African business on providing transactional products and services through our EasyPay Everywhere bank accounts and ATM infrastructure. We market and provide these products and services to all unbanked and under-banked persons in South Africa, not just to social grant beneficiaries. When we provide these services to social grant beneficiaries we do so independently of SASSA. While we believe that our financial services offerings are convenient and cost-effective, our continued success will depend on the extent to which South African customers adopt our financial products and services on a widespread basis. Factors which may prevent us from successfully growing our South African financial services business include, but are not limited to:
| - |
underestimation of the number of customers that will obtain an EasyPay Everywhere bank account and use our ATM infrastructure; | |
| - |
lack of adoption of our EasyPay Everywhere and related products by customers as anticipated; | |
| - |
competition in the marketplace; | |
| - |
restrictions imposed by SASSA or government on the manner in which beneficiaries may transact; | |
| - |
political interference; | |
| - |
changes in the regulatory environment; | |
| - |
dependence on existing suppliers to provide the hardware (such as ATMs, cards and POS devices) we require to execute our rollout as anticipated; | |
| - |
logistical and communications challenges; and | |
| - |
loss of key technical and operations staff, particularly during the rollout phase. |
14
SASSA has challenged our ability to conduct this business in a commercial manner through its interpretation of recently-adopted regulations under the Social Assistance Act. We are in litigation with SASSA over its interpretation of these regulations. If SASSA were to prevail in this legal proceeding, our business will suffer.
SASSA has challenged our ability to operate our business in a commercial manner by adopting an interpretation of the South African Social Assistance Act of 2004, Assistance Act, and recently-adopted regulations thereunder that would prohibit us and Grindrod Bank Limited, or Grindrod, from processing debit orders from social welfare beneficiaries’ bank accounts. We believe that SASSA’s interpretation is erroneous and on June 3, 2016, we filed for a declaratory order with the High Court of the Republic of South Africa Gauteng Division, Pretoria, to provide certainty to us, as well as other industry stakeholders, on the interpretation of the Assistance Act and regulations. On June 15, 2016, SASSA brought criminal charges against us and Grindrod Bank for failing to act in accordance with their instructions to stop processing debit orders. On June 28, 2016, the High Court issued an order scheduling arguments on the declaratory order that we are seeking on October 17 and 18, 2016 and prohibiting SASSA from taking certain actions in furtherance of the criminal charges, pending a determination of the dispute. On August 8, 2016 we were informed that the South African National Prosecuting Authority, or NPA, has reached a “no prosecution” decision on the criminal charges filed by SASSA. We cannot predict whether SASSA might attempt to bring new charges at any time or ask the NPA to revisit its decision in future. We cannot predict the outcome of the SASSA litigation
If we were not to prevail, our ability to operate our business, specifically our micro-lending and insurance activities in a commercially advantageous manner would be impaired, which would likely have a material adverse effect on our business and might harm our reputation. Regardless of the outcome, management will be required to devote significant time and resources to these legal proceedings, which may impact their ability to focus their attention on our business.
We are, and in the future may be, subject to litigation in which private parties may seek to recover, on behalf of SASSA, amounts paid to us under our SASSA contract. If such litigation were to be successful and require us to repay substantial monies to SASSA, such repayment would adversely affect our results of operations, financial position and cash flows.
In April 2015, Corruption Watch, a South African non-profit civil society organization, commenced a legal proceeding in the High Court of South Africa, seeking an order by the Court to review and set aside the decision of SASSA’s Chief Executive Officer to approve the payment to us of ZAR317 million. Corruption Watch claims that there was no lawful basis for the decision to make the payment to us, and that the decision was unreasonable and irrational and did not comply with South African legislation. We are named as a respondent in this proceeding.
As discussed in “Item 3—Legal Proceedings,” the payments being challenged by Corruption Watch represent amounts paid to us by SASSA for the costs we incurred in performing additional beneficiary registrations and gathering information beyond those that we were contractually required to perform under our SASSA contract. These amounts were paid in full settlement of the claim we submitted to SASSA for these additional costs. We believe that Corruption Watch’s claim is without merit and we are defending it vigorously. However, we cannot predict how the Court will rule on the matter.
In addition, the April 2014 Constitutional Court ruling ordering SASSA to re-run the tender process requires us to file with the Court, after completion of our SASSA contract, an audited statement of our expenses, income and net profit under the contract. It is conceivable that one or more third parties may in the future institute litigation challenging our right to retain a portion of the amounts we will have received from SASSA under our contract. We cannot predict whether any such litigation will be instituted, or if it is, whether it would be successful.
Any successful challenge to our right to receive and retain payments from SASSA that requires substantial repayments would adversely affect our results of operations, financial position and cash flows.
The DOJ is investigating whether we have violated the Foreign Corrupt Practices Act, or FCPA, and other federal criminal laws.
As we have previously reported, in November 2012, the U.S. Department of Justice commenced an investigation into whether we violated the FCPA and other U.S. federal criminal laws by engaging in a scheme to make corrupt payments to officials of the South Africa government in connection with securing our 2012 SASSA contract and whether we violated federal securities laws in connection with statements made by us in our SEC filings regarding this contract. In addition, the SEC commenced its own investigation.
15
On June 8, 2015, we received a letter from the SEC stating that it had concluded its investigation and that it did not intend to recommend an enforcement action against us. It is our understanding that the DOJ investigation remains ongoing.
These investigations have been costly for us. We incurred significant legal costs during fiscal 2013 and 2014 in responding to the U.S. government’s requests for information, management’s time has been diverted from other matters relating to our business and we have suffered harm to our business reputation. In particular, in fiscal 2013, the FSB suspended Smart Life’s insurance license. Even though the SEC has concluded its investigation and Smart Life’s license suspension has been lifted, we cannot predict when the DOJ investigation will be completed or the impact or outcome of that investigation.
On February 14, 2013, we filed an application pursuant to Section 34 of the South African Prevention of Corrupt Activities Act in South Africa with the South African Police Service to investigate the allegations of corruption that were contained in certain newspaper reports. Section 34 deals with the reporting of suspected fraud, theft, extortion and forgery. In November, 2015, we received a written notice from the Hawks, stating this case was investigated and the prosecutors assigned to the case declined to prosecute these matters. The Hawks have closed the investigations.
We have disclosed competitively sensitive information as a result of the AllPay litigation, which could adversely affect our competitive position in the future.
In connection with the litigation challenging the award of the SASSA tender to us in fiscal 2012 through fiscal 2015, we included our entire 2011 SASSA tender submission in the court record, which court record is in the public domain. Our tender submission contains competitively sensitive business information. As a result of this disclosure, our existing and future competitors have access to this information which could adversely affect our competitive position in any future similar tender submissions to the extent that such information continues to remain competitively sensitive.
In order to meet our obligations under our current SASSA contract, we are required to deposit government funds with financial institutions in South Africa before commencing the payment cycle and are exposed to counterparty risk.
In order to meet our obligations under our current SASSA contract, we are required to deposit government funds, which will ultimately be used to pay social welfare grants, with financial institutions in South Africa before commencing the payment cycle. If these financial institutions are unable to meet their commitments to us, in a timely manner or at all, we would be unable to discharge our obligations under our SASSA contract and could be subject to financial losses, penalties, loss of reputation and potentially, the cancellation of our contract. As we are unable to influence these financial institutions’ operations, including their internal information technology structures, capital structures, risk management, business continuity and disaster recovery programs, or their regulatory compliance systems, we are exposed to counterparty risk.
We may undertake acquisitions that could increase our costs or liabilities or be disruptive to our business.
Acquisitions are a significant part of our long-term growth strategy as we seek to grow our business internationally and to deploy our technologies in new markets both inside and outside South Africa. However, we may not be able to locate suitable acquisition candidates at prices that we consider appropriate. If we do identify an appropriate acquisition candidate, we may not be able to successfully negotiate the terms of an acquisition, finance the acquisition or, if the acquisition occurs, integrate the acquired business into our existing business. These transactions may require debt financing or additional equity financing, resulting in additional leverage or dilution of ownership.
Acquisitions of businesses or other material operations and the integration of these acquisitions will require significant attention from our senior management which may divert their attention from our day to day business. The difficulties of integration may be increased by the necessity of coordinating geographically dispersed organizations, integrating personnel with disparate business backgrounds and combining different corporate cultures. We also may not be able to maintain key employees or customers of an acquired business or realize cost efficiencies or synergies or other benefits that we anticipated when selecting our acquisition candidates.
In addition, we may need to record write-downs from future impairments of goodwill or other intangible assets, which could reduce our future reported earnings. Finally, acquisition candidates may have liabilities or adverse operating issues that we fail to discover through due diligence prior to the acquisition.
16
We have a significant amount of indebtedness that requires us to comply with restrictive and financial covenants. If we are unable to comply with these covenants, we could default on this debt, which would have a material adverse effect on our business and financial condition.
As of June 30, 2016, we had approximately $51.8 million of outstanding indebtedness, which we incurred to finance our acquisition of KSNET in October 2010. These loans are secured by a pledge by Net1 Korea of its entire equity interest in KSNET and a pledge by the immediate parent of Net1 Korea (also one of our subsidiaries) of its entire equity interest in Net1 Korea. The terms of the loan facility require Net1 Korea and its consolidated subsidiaries to maintain certain specified financial ratios (including a leverage ratio and a debt service coverage ratio) and restrict Net1 Korea’s ability to make certain distributions with respect to its capital stock, prepay other debt, encumber its assets, incur additional indebtedness, or engage in certain business combinations. Although these covenants only apply to our South Korean subsidiaries, these security arrangements and covenants may reduce our operating flexibility or our ability to engage in other transactions that may be beneficial to us. If we are unable to comply with these covenants, we could be in default and the indebtedness could be accelerated. If this were to occur, we might not be able to obtain waivers of default or to refinance the debt with another lender and as a result, our business and financial condition would suffer.
We face competition from the incumbent retail banks in South Africa and SAPO in the unbanked market segment, which could limit growth in our transaction-based activities segment.
Certain South African banks have also developed their own low-cost banking products targeted at the unbanked and under-banked market segment. According to the 2015 FinScope survey, which is an annual survey conducted by the FinMark Trust, a non-profit independent trust, 77% of South Africans are banked. As the competition to bank the unbanked in South Africa intensifies, we may not be successful in marketing our low-cost EasyPay Everywhere product to our target population. Moreover, as our product offerings increase, gain market acceptance and pose a competitive threat in South Africa, especially our UEPS/EMV product with biometric verification and our financial services offerings, the banks and SAPO may seek governmental or other regulatory intervention if they view us as disrupting their transactional or other businesses.
Our microlending loan book exposes us to credit risk and our allowance for doubtful finance loans receivable may not be sufficient to absorb future write-offs.
The majority of these finance loans made are for a period of six months or less. We have created an allowance for doubtful finance loans receivable related to this book. Management has considered factors including the period of the UEPS-loan outstanding, creditworthiness of the customers and the past payment history of the borrower when creating the allowance. We consider this policy to be appropriate taking into account factors such as historical bad debts, current economic trends and changes in our customer payment patterns. However, additional allowances may be required should the ability of our customers to make payments when due deteriorate in the future. A significant amount of judgment is required to assess the ultimate recoverability of these finance loan receivables, including on-going evaluation of the creditworthiness of each customer.
We may face competition from other companies that offer smart card technology, other innovative payment technologies and payment processing, which could result in loss of our existing business and adversely impact our ability to successfully market additional products and services.
Our primary competitors in the payment processing market include other independent processors, as well as financial institutions, independent sales organizations, and, potentially card networks. Many of our competitors are companies who are larger than we are and have greater financial and operational resources than we have. These factors may allow them to offer better pricing terms or incentives to customers, which could result in a loss of our potential or current customers or could force us to lower our prices as well. Either of these actions could have a significant effect on our revenues and earnings.
In addition to competition that our UEPS system faces from the use of cash, checks, credit and debit cards, existing payment systems and the providers of financial services and low cost bank accounts, there are a number of other products that use smart card technology in connection with a funds transfer system. During the past several years, smart card technology has become increasingly prevalent. We believe that the most competitive product in this marketplace is EMV, a system that is promoted by most of the major card companies such as Visa, MasterCard, JCB and American Express. Also, governments and financial institutions are, to an increasing extent, implementing general-purpose reloadable prepaid cards as a low-cost alternative to provide financial services to the unbanked population. Moreover, as the acceptance of using a mobile phone to facilitate financial services has increased exponentially, other companies have introduced such services to the marketplace successfully and customers may prefer those services to ours, based on technology, price or other factors.
17
A prolonged economic slowdown or lengthy or severe recession in South Africa or elsewhere could harm our operations.
A prolonged economic downturn or recession could materially impact our results from operations. A recessionary economic environment could have a negative impact on mobile phone operators, our cardholders and retailers and could reduce the level of transactions we process and the take-up of financial services we offer, which would, in turn, negatively impact our financial results. If financial institutions and retailers experience decreased demand for their products and services our hardware, software and related technology sales will reduce, resulting in lower revenue.
The loss of the services of Mr. Belamant or any of our other executive officers would adversely affect our business.
Our future financial and operational performance depends, in large part, on the continued contributions of our senior management, in particular, Mr. Serge Belamant, our Chief Executive Officer and Chairman and Herman Kotzé, our Chief Financial Officer. Many of our key responsibilities are performed by these two individuals, and the loss of the services of either of them could disrupt our development efforts or business relationships and our ability to continue to innovate and to meet customers’ needs, which could have a material adverse effect on our business and financial performance. We do not have employment agreements with these executive officers and they may terminate their employment at any time.
In addition, the success of our KSNET business depends heavily on the continued services of its president, Phil-Hyun Oh and the other senior members of the KSNET management team. We do not maintain any “key person” life insurance policies.
We face a highly competitive employment market and may not be successful in attracting and retaining a sufficient number of skilled employees, particularly in the technical and sales areas and senior management.
Our future success depends on our ability to continue to develop new products and to market these products to our target users. In order to succeed in our product development and marketing efforts, we need to identify, attract, motivate and retain sufficient numbers of qualified technical and sales personnel. An inability to hire and retain such technical personnel would adversely affect our ability to enhance our existing intellectual property, to introduce new generations of technology and to keep abreast of current developments in technology. Demand for personnel with the range of capabilities and experience we require is high and there is no assurance that we will be successful in attracting and retaining these employees. The risk exists that our technical skills and sales base may be depleted over time because of natural attrition. Furthermore, social and economic factors in South Africa have led, and continue to lead, to numerous qualified individuals leaving the country, thus depleting the availability of qualified personnel in South Africa. In addition, our multi-country strategy will also require us to hire and retain highly qualified managerial personnel in each of these markets. If we cannot recruit and retain people with the appropriate capabilities and experience and effectively integrate these people into our business, it could negatively affect our product development and marketing activities.
System failures, including breaches in the security of our system, could harm our business.
We may experience system failures from time to time, and any lengthy interruption in the availability of our back-end system computer could harm our revenues and profits, and could subject us to the scrutiny of our customers.
Frequent or persistent interruptions in our services could cause current or potential customers and users to believe that our systems are unreliable, leading them to avoid our technology altogether, and could permanently harm our reputation and brands. These interruptions would increase the burden on our engineering staff, which, in turn, could delay our introduction of new applications and services. Finally, because our customers may use our products for critical transactions, any system failures could result in damage to our customers’ businesses. These customers could seek significant compensation from us for their losses. Even if unsuccessful, this type of claim could be time consuming and costly for us to address.
Although our systems have been designed to reduce downtime in the event of outages or catastrophic occurrences, they remain vulnerable to damage or interruption from earthquakes, floods, fires, power loss, telecommunication failures, terrorist attacks, computer viruses, computer denial-of-service attacks and similar events. Some of our systems are not fully redundant, and our disaster recovery planning may not be sufficient for all eventualities.
18
Protection against fraud is of key importance to the purchasers and end users of our solutions. We incorporate security features, including encryption software, biometric identification and secure hardware, into our solutions to protect against fraud in electronic transactions and to provide for the privacy and integrity of card holder data. Our solutions may be vulnerable to breaches in security due to defects in the security mechanisms, the operating system and applications or the hardware platform. Security vulnerabilities could jeopardize the security of information transmitted using our solutions. If the security of our solutions is compromised, our reputation and marketplace acceptance of our solutions will be adversely affected, which would cause our business to suffer, and we may become subject to damage claims. We have not yet experienced any security breaches affecting our business.
Despite any precautions we may take, the occurrence of a natural disaster or other unanticipated problems with our system could result in lengthy interruptions in our services. Our current business interruption insurance may not be sufficient to compensate us for losses that may result from interruptions in our service as a result of system failures.
The period between our initial contact with a potential customer and the sale of our UEPS products or services to that customer tends to be long and may be subject to delays which may have an impact on our revenues.
The period between our initial contact with a potential customer and the purchase of our UEPS products and services is often long and subject to delays associated with the budgeting, approval and competitive evaluation processes that frequently accompany significant capital expenditures. A lengthy sales cycle may have an impact on the timing of our revenues, which may cause our quarterly operating results to fall below investor expectations. A customer’s decision to purchase our products and services is often discretionary, involves a significant commitment of resources, and is influenced by customer budgetary cycles. To sell our products and services successfully we generally must educate our potential customers regarding the uses and benefits of our products and services, which can require the expenditure of significant time and resources; however, there can be no assurance that this significant expenditure of time and resources will result in actual sales of our products and services.
Our proprietary rights may not adequately protect our technologies.
Our success depends in part on our obtaining and maintaining patent, trade secret, copyright and trademark protection of our technologies in the United States and other jurisdictions as well as successfully enforcing this intellectual property and defending this intellectual property against third-party challenges. We will only be able to protect our technologies from unauthorized use by third parties to the extent that valid and enforceable intellectual property protections, such as patents or trade secrets, cover them. In particular, we place considerable emphasis on obtaining patent and trade secret protection for significant new technologies, products and processes. Furthermore, the degree of future protection of our proprietary rights is uncertain because legal means afford only limited protection and may not adequately protect our rights or permit us to gain or keep our competitive advantage.
We cannot predict the breadth of claims that may be allowed or enforced in our patents. For example, we might not have been the first to make the inventions covered by each of our patents and patent applications or to file patent applications and it is possible that none of our pending patent applications will result in issued patents. It is possible that others may independently develop similar or alternative technologies. Also, our issued patents may not provide a basis for commercially viable products, or may not provide us with any competitive advantages or may be challenged, invalidated or circumvented by third parties.
We also rely on trade secrets to protect our technology, especially where we believe patent protection is not appropriate or obtainable. However, trade secrets are difficult to protect. We have confidentiality agreements with employees, and consultants to protect our trade secrets and proprietary know-how. These agreements may be breached and or may not have adequate remedies for such breach. While we use reasonable efforts to protect our trade secrets, our employees, consultants or others may unintentionally or willfully disclose our information to competitors. If we were to enforce a claim that a third party had illegally obtained and was using our trade secrets, our enforcement efforts would be expensive and time consuming, and the outcome would be unpredictable. Moreover, if our competitors independently develop equivalent knowledge, methods and know-how, it will be more difficult for us to enforce our rights and our business could be harmed. If we are not able to defend the patent or trade secret protection position of our technologies, then we will not be able to exclude competitors from developing or marketing competing technologies.
We also rely on trademarks to establish a market identity for some of our products. To maintain the value of our trademarks, we might have to file lawsuits against third parties to prevent them from using trademarks confusingly similar to or dilutive of our registered or unregistered trademarks. Also, we might not obtain registrations for our pending trademark applications, and might have to defend our registered trademark and pending trademark applications from challenge by third parties.
19
Defending our intellectual property rights or defending ourselves in infringement suits that may be brought against us is expensive and time-consuming and may not be successful.
Litigation to enforce our patents, trademarks or other intellectual property rights or to protect our trade secrets could result in substantial costs and may not be successful. Any loss of, or inability to protect, intellectual property in our technology could diminish our competitive advantage and also seriously harm our business. In addition, the laws of certain foreign countries may not protect our intellectual property rights to the same extent as do the laws in countries where we currently have patent protection. Our means of protecting our intellectual property rights in countries where we currently have patent or trademark protection, or any other country in which we operate, may not be adequate to fully protect our intellectual property rights. Similarly, if third parties claim that we infringe their intellectual property rights, we may be required to incur significant costs and devote substantial resources to the defense of such claims. We may be required to discontinue using and selling any infringing technology and services, to expend resources to develop non-infringing technology or to purchase licenses or pay royalties for other technology. In addition, if we are unsuccessful in defending any such third-party claims, we could suffer costly judgments and injunctions that could materially adversely affect our business, results of operations or financial condition.
Our strategy of partnering with companies outside South Africa may not be successful.
In order for us to expand our operations into foreign markets, it may be necessary for us to establish partnering arrangements with companies outside South Africa, such as the one we have co-established in Namibia and our non-controlling investment in Nigeria. The success of these endeavors is, however, subject to a number of factors over which we have little or no control, such as finding suitable partners with the appropriate financial, business and technical backing and continued governmental support for planned implementations. In some countries, finding suitable partners and obtaining the appropriate support from the government involved may take a number of years before we can commence implementation. Some of these partnering arrangements may take the form of joint ventures in which we receive a non-controlling interest. Non-controlling ownership carries with it numerous risks, including dependence on partners to provide knowledge of local market conditions and to facilitate the acquisition of any necessary licenses and permits, as well as the inability to control the joint venture vehicle and to direct its policies and strategies. Such a lack of control could result in the loss of all or part of our investment in such entities. In addition, our foreign partners may have different business methods and customs which may be unfamiliar to us and with which we disagree. Our joint venture partners may not be able to implement our business model in new areas as efficiently and quickly as we have been able to do in South Africa. Furthermore, limitations imposed on our South African subsidiaries by South African exchange control regulations, as well as limitations imposed on us by the Investment Company Act of 1940, may limit our ability to establish partnerships or entities in which we do not obtain a controlling interest.
We may have difficulty managing our growth.
We continue to experience growth, both in the scope of our operations and size of our organization. This growth is placing significant demands on our management. Continued growth would increase the challenges involved in implementing appropriate operational and financial systems, expanding our technical and sales and marketing infrastructure and capabilities, providing adequate training and supervision to maintain high quality standards, and preserving our culture and values. International growth, in particular, means that we must become familiar and comply with complex laws and regulations in other countries, especially laws relating to taxation.
Additionally, continued growth will place significant additional demands on our management and our financial and operational resources, and will require that we continue to develop and improve our operational, financial and other internal controls. If we cannot scale and manage our business appropriately, we will not experience our projected growth and our financial results may suffer.
We pre-fund the payment of social welfare grants through our merchant acquiring system in South Africa and pre-fund the settlement of certain customers in South Korea and a significant level of payment defaults by these merchants or customers would adversely affect us.
We pre-fund social welfare grants through the merchants who participate in our merchant acquiring system in the South African provinces where we operate as well as prefund the settlement of funds to certain customers in South Korea. These pre-funding obligations expose us to the risk of default by these merchants and customers. Although we have not experienced any material defaults by merchants or customers in the return of pre-funded amounts to us, we cannot guarantee that material defaults will not occur in the future. A material level of merchant or customer defaults could have a material adverse effect on us, our financial position and results of operations.
20
We may incur material losses in connection with our distribution of cash to recipient cardholders of social welfare grants.
Many social welfare recipient cardholders use our services to access cash using their smart cards. We use armored vehicles to deliver large amounts of cash to rural areas across South Africa to enable these welfare recipient cardholders to receive this cash. In some cases, we also store the cash that will be delivered by the armored vehicles in depots overnight or over the weekend to facilitate delivery to these rural areas. We cannot insure against certain risks of loss or theft of cash from our delivery vehicles or depots and we will therefore bear the full cost of certain uninsured losses or theft in connection with the cash handling process, and such losses could materially and adversely affect our financial condition, cash flows and results of operations. We have not incurred any material losses resulting from cash distribution in recent years, but there is no assurance that we will not incur material losses in the future.
We depend upon third-party suppliers, making us vulnerable to supply shortages and price fluctuations, which could harm our business.
We obtain our smart cards, ATM’s, POS devices and the other hardware we use in our business from a limited number of suppliers, and do not manufacture this equipment ourselves. We generally do not have long-term agreements with our manufacturers or component suppliers. If our suppliers become unwilling or unable to provide us with adequate supplies of parts or products when we need them, or if they increase their prices, we may not be able to find alternative sources in a timely manner and could be faced with a critical shortage. This could harm our ability to implement new systems and cause our revenues to decline. Even if we are able to secure alternative sources in a timely manner, our costs could increase. A supply interruption or an increase in demand beyond current suppliers’ capabilities could harm our ability to distribute our equipment and thus, to acquire a new source of customers who use our UEPS technology. Any interruption in the supply of the hardware necessary to operate our technology, or our inability to obtain substitute equipment at acceptable prices in a timely manner, could impair our ability to meet the demand of our customers, which would have an adverse effect on our business.
Shipments of our electronic payment systems may be delayed by factors outside of our control, which can harm our reputation and our relationships with our customers.
The shipment of payment systems requires us or our manufacturers, distributors or other agents to obtain customs or other government certifications and approvals and, on occasion, to submit to physical inspection of our systems in transit. Failure to satisfy these requirements, and the very process of trying to satisfy them, can lead to lengthy delays in the delivery of our solutions to our direct or indirect customers. Delays and unreliable delivery by us may harm our reputation and our relationships with our customers.
Our Smart Life business exposes us to risks typically experienced by life assurance companies.
Smart Life is a life insurance company and exposes us to risks typically experienced by life assurance companies. Some of these risks include the extent to which we are able to continue to reinsure our risks at acceptable costs, reinsurer counterparty risk, maintaining regulatory capital adequacy, solvency and liquidity requirements, our ability to price our insurance products appropriately, the risk that actual claims experience may exceed our estimates, the ability to recover policy premiums from our customers and the competitiveness of the South African insurance market. If we are unable to maintain our desired level of reinsurance at prices that we consider acceptable, we would have to either accept an increase in our exposure risk or reduce our insurance writings. If our reinsurers are unable to meet their commitments to us in a timely manner, or at all, we may be unable to discharge our obligations under our insurance contracts. As such, we are exposed to counterparty, including credit, risk of these reinsurers. Our product pricing includes long-term assumptions regarding investment returns, mortality, morbidity, persistency and operating costs and expenses of the business. Using the wrong assumptions to price our insurance products could materially and adversely affect our financial position, results of operations and cash flows.
If our actual claims experience is higher than our estimates, our financial position, results of operations and cash flows could be adversely affected. Finally, the South African insurance industry is highly competitive. Many of our competitors are well-established, represented nationally and market similar products and we may not be able to effectively penetrate the South African insurance market.
21
Risks Relating to Operating in South Africa and Other Foreign Markets
If we do not achieve applicable broad-based black economic empowerment, or BEE, objectives in our South African businesses, we risk losing our government and private contracts. In addition, it is possible that we may be required to increase black shareholding of our company in a manner that could dilute your ownership.
The legislative framework for the promotion of broad-based black economic empowerment in South Africa has been established through the Broad-Based Black Economic Empowerment Act, No. 53 of 2003, as amended in 2013, and amended BEE codes of good practice, the sector-specific codes of good practice, or Sector Codes, and sector-specific transformation charters, or Transformation Charters, published pursuant thereto. Sector Codes are a sector code of good practice that are aligned with the BEE codes of good practice and share the same status as the BEE codes of good practice which were initially published by the South African government in February 2007. Sector Codes are fully binding between and among businesses operating in an industry.
In June 2012, the South African government promulgated the Information and Communications Technology, or ICT Charter, and on November 2012 the Financial Services Charter, two of the Sector Codes, to which certain of our businesses are subject. Both of the above mentioned Sector Codes are at present still in draft to be aligned with the Amended Codes of Good Practice. Achievement of BEE objectives is measured by a scorecard which establishes a weighting for the various components of BEE. Scorecards are independently reviewed by accredited BEE scorecard verification agencies which issue a certificate that presents an entity’s BEE Recognition Levels, or BEE status.
The codes of good practice were reviewed by the South African Department of Trade and Industry, or dti, and a new set of codes of good practice were promulgated in October 2013. The new codes of good practice came into effect on May 1, 2015, and have different requirements and emphasis to the old codes of good practice. Furthermore, on May 15, 2015, the dti issued a Notice of Clarification which further extended the transitional period for the alignment of Sector Codes with the new set of codes of good practice to a date still to be announced. The dti stated in its notice that it would consider repealing any Sector Codes that are not aligned to a date yet to be announced. The Financial Services Charter as well as the ICT Charter are currently still in draft phase and some of our business will have to adhere to these amended codes as soon as they are gazetted. Compliance with either the requirements of the amended ICT Charter as well as the Financial Services Charter, if properly aligned with the new codes of good practice, may negatively affect our future BEE status.
We have taken a number of actions as a company to increase empowerment of black South Africans. However, it is possible that these actions may not be sufficient to enable us to achieve applicable BEE objectives. In that event, in order to avoid risking the loss of our government and private contracts, we may have to seek to comply through other means, including by selling or placing additional shares of Net1 or of our South African subsidiaries to black South Africans. Such sales of shares could have a dilutive impact of your ownership interest, which could cause the market price of our stock to decline.
We expect that our BEE status will be important for us to remain competitive in the South African marketplace and we continually seek ways to improve our BEE status, especially the equity component of our BEE status. For instance, in April 2014, we implemented a BEE transaction pursuant to which we issued 4.4 million shares of our common stock to our BEE partners for ZAR 60.00 per share, which represented a 25% discount to the market price of our shares at the time that we negotiated the transaction. We entered into this transaction to improve the equity component of our BEE status. We provided funding to the BEE partners in order for them to buy these shares from us. In June 2014, and in accordance with the terms of agreements, we repurchased approximately 2.4 million of these shares of our common stock in order for the BEE partners to repay the loans we provided to them. Furthermore, in August 2014, we entered into a Subscription and Sale of Shares Agreement with Business Venture Investments No 1567 Proprietary Limited (RF), or BVI, one of our BEE partners, in preparation for any new potential SASSA tender. Pursuant to the agreement, we repurchased BVI’s remaining shares of Net1 common stock and BVI subscribed for new ordinary shares of CPS, representing approximately 12.5% of CPS’ ordinary shares outstanding after the subscription.
It is possible that we may find it necessary to issue additional shares to improve our BEE status. If we enter into further BEE transactions that involve the issuance of equity, we cannot predict what the dilutive effect of such a transaction would be on your ownership or how it would affect the market price of our stock.
22
Fluctuations in the value of the South African rand have had, and will continue to have, a significant impact on our reported results of operations, which may make it difficult to evaluate our business performance between reporting periods and may also adversely affect our stock price.
The South African rand, or ZAR, is the primary operating currency for our business operations while our financial results are reported in U.S. dollars. This means that as long as the ZAR remains our primary operating currency, depreciation in the ZAR against the U.S. dollar, and to a lesser extent, the South Korean won against the U.S. dollar, would negatively impact our reported revenue and net income, while a strengthening of the ZAR and the South Korean won would have the opposite effect. Depreciation in the ZAR may negatively impact the prices at which our stock trades. The U.S. dollar/ZAR exchange rate has historically been volatile and we expect this volatility to continue. During fiscal 2016 and 2015, respectively, the ZAR was significantly weaker against the U.S. dollar than during most of the preceding several years, which adversely affected our 2016 and 2015 revenue and net income. We provide detailed information about historical exchange rates in Item 7—“Management’s Discussion and Analysis of Financial Condition and Results of Operations—Currency Exchange Rate Information.”
Due to the significant fluctuation in the value of the ZAR and its impact on our reported results, you may find it difficult to compare our results of operations between financial reporting periods even though we provide supplemental information about our results of operations determined on a ZAR basis. This difficulty may increase as we expand our business internationally and record additional revenue and expenses in the euro and other currencies. It may also have a negative impact on our stock price.
We generally do not engage in any currency hedging transactions intended to reduce the effect of fluctuations in foreign currency exchange rates on our results of operations, other than economic hedging relating to our inventory purchases which are settled in U.S. dollars or euros. We have used forward contracts in order to hedge our economic exposure to the ZAR/U.S. dollar and ZAR/euro exchange rate fluctuations from these foreign currency transactions. We cannot guarantee that we will enter into hedging transactions in the future or, if we do, that these transactions will successfully protect us against currency fluctuations.
South Africa’s high levels of poverty, unemployment and crime may increase our costs and impair our ability to maintain a qualified workforce.
While South Africa has a highly developed financial and legal infrastructure, it also has high levels of crime and unemployment and there are significant differences in the level of economic and social development among its people, with large parts of the population, particularly in the rural areas, having limited access to adequate education, healthcare, housing and other basic services, including water and electricity. In addition, South Africa has a high prevalence of HIV/AIDS and tuberculosis. Government policies aimed at alleviating and redressing the disadvantages suffered by the majority of citizens under previous governments may increase our costs and reduce our profitability, all of which could negatively affect our business. These problems may prompt emigration of skilled workers, hinder investment into South Africa and impede economic growth. As a result, we may have difficulties attracting and retaining qualified employees.
We may not be able to effectively and efficiently manage the electricity supply disruptions in South Africa which could adversely affect our results of operations, financial position, cash flows and future growth.
Our businesses in South Africa are dependent on electricity generated and supplied by the state-owned utility, Eskom, in order to operate. In recent years, Eskom has been unable to generate and supply the amount of electricity required by South Africans, and the entire country experienced significant and largely unpredictable electricity supply disruptions. Eskom has implemented a number of short- and long-term mitigation plans to correct these issues and the number of supply disruptions decreased during the calendar 2016.
As part of our business continuity programs, we have installed back-up diesel generators in order for us to continue to operate our core data processing facilities in Cape Town and Johannesburg in the event of intermittent disruptions to our electricity supply. We have to perform regular monitoring and maintenance of these generators as well as sourcing and managing diesel fuel levels. We may also be required to replace these generators on a more frequent basis due to the additional burden placed on them.
Our results of operations, financial position, cash flows and future growth could be adversely affected if Eskom is unable to commission new electricity-generating power stations in accordance with its plans, or at all, or if we are unable to effectively and efficiently test, maintain, source fuel for and replace our generators.
23
The economy of South Africa is exposed to high inflation and interest rates which could increase our operating costs and thereby reduce our profitability.
The economy of South Africa in the past has been, and in the future may continue to be, characterized by rates of inflation and interest rates that are substantially higher than those prevailing in the United States and other highly developed economies. High rates of inflation could increase our South African-based costs and decrease our operating margins. Although higher interest rates would increase the amount of income we earn on our cash balances, they would also adversely affect our ability to obtain cost-effective debt financing in South Africa.
South African exchange control regulations could hinder our ability to make foreign investments and obtain foreign-denominated financing.
South Africa’s exchange control regulations restrict the export of capital from South Africa, the Republic of Namibia and the Kingdoms of Lesotho and Swaziland, known collectively as the Common Monetary Area, without the prior approval of SARB. While the South African government has relaxed exchange controls in recent years, it is difficult to predict whether or how it will further relax or abolish exchange control measures in the foreseeable future.
Although Net1 is a U.S. corporation and is not itself subject to South African exchange control regulations, these regulations do restrict the ability of our South African subsidiaries to raise and deploy capital outside the Common Monetary Area, to borrow money in currencies other than the South African rand and to hold foreign currency. Exchange control restrictions may also affect the ability of these subsidiaries to pay dividends to Net1 unless the affected subsidiary can show that any payment of such dividend will not place it in an over-borrowed position. As of June 30, 2016, approximately 34% of our cash and cash equivalents were held by our South African subsidiaries. Exchange control regulations could make it difficult for our South African subsidiaries to: (i) export capital from South Africa; (ii) hold foreign currency or incur indebtedness denominated in foreign currencies without the approval of SARB; (iii) acquire an interest in a foreign venture without the approval of SARB and first having complied with the investment criteria of SARB; or (iv) repatriate to South Africa profits of foreign operations. These regulations could also limit our ability to utilize profits of one foreign business to finance operations of a different foreign business.
Under current exchange control regulations, SARB approval would be required for any acquisition of our company which would involve payment to our South African shareholders of any consideration other than South African rand. This restriction could limit our management in its ability to consider strategic options and thus, our shareholders may not be able to realize the premium over the current trading price of our shares.
Most of South Africa’s major industries are unionized, and the majority of employees belong to trade unions. We face the risk of disruption from labor disputes and new South African labor laws.
Trade unions have had a significant impact on the collective bargaining process as well as on social and political reform in South Africa in general. Although only approximately 1% percent of our South African workforce is unionized and we have not experienced any labor disruptions in recent years, such labor disruptions may occur in the future. In addition, developments in South African labor laws may increase our costs or alter our relationship with our employees and trade unions, which may have an adverse effect on us, our financial condition and our operations.
Operating in South Africa and other emerging markets subjects us to greater risks than those we would face if we operated in more developed markets.
Emerging markets such as South Africa, as well as some of the other markets into which we have recently begun to expand, including African countries outside South Africa, South America, South and Southeast Asia and Central and Eastern Europe, are subject to greater risks than more developed markets.
While we focus our business primarily on emerging markets because that is where we perceive to be the greatest opportunities to market our products and services successfully, the political, economic and market conditions in many of these markets present risks that could make it more difficult to operate our business successfully.
Some of these risks include:
| - | political and economic instability, including higher rates of inflation and currency fluctuations; | |
| - | high levels of corruption, including bribery of public officials; | |
| - | loss due to civil strife, acts of war or terrorism, guerrilla activities and insurrection; | |
| - |
a lack of well-developed legal systems which could make it difficult for us to enforce our intellectual property and contractual rights; | |
| - | logistical, utilities (including electricity and water supply) and communications challenges; |
24
| - |
potential adverse changes in laws and regulatory practices, including import and export license requirements and restrictions, tariffs, legal structures and tax laws; | |
| - | difficulties in staffing and managing operations and ensuring the safety of our employees; | |
| - | restrictions on the right to convert or repatriate currency or export assets; | |
| - | greater risk of uncollectible accounts and longer collection cycles; | |
| - | indigenization and empowerment programs; | |
| - | exposure to liability under the United Kingdom’s Bribery Act 2010; and | |
| - |
exposure to liability under U.S. securities and foreign trade laws, including the FCPA, and regulations established by the U.S. Department of Treasury’s Office of Foreign Assets Control, or OFAC. |
Many of these countries and regions are in various stages of developing institutions and political, legal and regulatory systems that are characteristic of democracies. However, institutions in these countries and regions may not yet be as firmly established as they are in democracies in the developed world. Many of these countries and regions are also in the process of transitioning to a market economy and, as a result, are experiencing changes in their economies and their government policies that can affect our investments in these countries and regions. Moreover, the procedural safeguards of the new legal and regulatory regimes in these countries and regions are still being developed and, therefore, existing laws and regulations may be applied inconsistently. In some circumstances, it may not be possible to obtain the legal remedies provided under those laws and regulations in a timely manner.
As the political, economic and legal environments remain subject to continuous development, investors in these countries and regions face uncertainty as to the security of their investments. Any unexpected changes in the political or economic conditions in these or neighboring countries or others in the region may have a material adverse effect on the international investments that we have made or may make in the future, which may in turn have a material adverse effect on our business, operating results, cash flows and financial condition.
Risks Relating to Government Regulation
The South African National Credit Regulator has applied to cancel the registration of our subsidiary, Moneyline Financial Services (Pty) Ltd, as a credit provider. If the registration is cancelled, we will not be able to provide UEPS-based loans to our customers, which would harm our business.
Moneyline provides microloans to our UEPS/EMV cardholders. Moneyline is a registered credit provider under the South African National Credit Act, or NCA, and is required to comply with the NCA in the operation of its lending business. In September 2014, the South African National Credit Regulator, or NCR, applied to the National Consumer Tribunal to cancel Moneyline’s registration, based on an investigation concluded by the NCR.
The NCR has alleged, among other things, that Moneyline contravened the NCA by including child support grants and foster child grants in the affordability assessments performed by Moneyline prior to granting credit to these borrowers, and that the procedures followed and documentation maintained by Moneyline are not in accordance with the NCA. We believe that Moneyline has conducted its business in compliance with NCA and we are opposing the NCR’s application. However, if the NCR’s application is successful, Moneyline would be prohibited from operating its microlending business, which could have a material adverse effect on our results of operations and cash flows.
We are required to comply with certain U.S. laws and regulations, including the FCPA as well as economic and trade sanctions, which could adversely impact our future growth.
We must comply with the FCPA, which prohibits U.S. companies or their agents and employees from providing anything of value to a foreign official for the purposes of influencing any act or decision of these individuals in their official capacity to help obtain or retain business, direct business to any person or corporate entity or obtain any unfair advantage. In addition, OFAC administers and enforces economic and trade sanctions against targeted foreign countries, entities and individuals based on U.S. foreign policy and national security goals.
Any failure by us to adopt appropriate compliance procedures and ensure that our employees, agents and business partners comply with the FCPA could subject us to substantial penalties. In addition, the requirement that we comply with the FCPA could put us at a competitive disadvantage with companies that are not required to comply with the FCPA or could otherwise harm our business. For example, in many emerging markets, there may be significant levels of official corruption, and thus, bribery of public officials may be a commonly accepted cost of doing business. Our refusal to engage in illegal behavior, such as paying bribes, may result in us not being able to obtain business that we might otherwise have been able to secure or possibly even result in unlawful, selective or arbitrary action being taken against us by foreign officials. Furthermore, the trade sanctions administered and enforced by OFAC target countries which are typically less developed countries.
25
Since less developed countries present some of the best opportunities for us to expand our business internationally, restrictions against entering into transactions with those foreign countries, as well as with certain entities and individuals in those countries, can adversely affect our ability to grow our business.
Changes in current South African government regulations relating to social welfare grants could adversely affect our revenues and cash flows.
We derive a substantial portion of our current business from the distribution of social welfare grants in South Africa and the provision of financial services to social grant recipients. Because social welfare eligibility and grant amounts are regulated by the South African government, any changes to or reinterpretations of the government regulations relating to social welfare may result in the non-renewal or reduction of grants for certain individuals, or a determination that currently eligible social welfare grant recipient cardholders are no longer eligible. If any of these changes were to occur, the number of grants we distribute could decrease which could result in a reduction of our revenue and cash flows.
We do not have a South African banking license and, therefore, we provide our social welfare grant distribution and EasyPay Everywhere solution through an arrangement with a third-party bank, which limits our control over this business and the economic benefit we derive from it. If this arrangement were to terminate, we would not be able to operate our social welfare grant distribution and EasyPay Everywhere business without alternate means of access to a banking license.
The South African retail banking market is highly regulated. Under current law and regulations, our South African social welfare grant distribution and EasyPay Everywhere business activities requires us to be registered as a bank in South Africa or to have access to an existing banking license.
We are not currently so registered, but we have entered into an agreement with Grindrod that enables us to implement our social welfare grant distribution and EasyPay Everywhere solution in compliance with the relevant laws and regulations. If the agreement were to be terminated, we would not be able to operate these services unless we were able to obtain access to a banking license through alternate means. We are also dependent on Grindrod to defend us against attacks from the other South African banks who may regard the rapid market acceptance of our UEPS/EMV product with biometric verification as disruptive to their funds transfer or other businesses and may seek governmental or other regulatory intervention. Furthermore, we have to comply with the strict anti-money laundering and customer identification regulations of the SARB when we open new bank accounts for our customers and when they transact. Failure to effectively implement and monitor these regulations may result in significant fines or prosecution of Grindrod and ourselves.
In addition, the South African Financial Advisory and Intermediary Services Act, 2002, requires persons who act as intermediaries between financial product suppliers and consumers in South Africa to register as financial service providers. Smart Life was granted an Authorized Financial Service Provider, or FSP, license on June 9, 2015. We are in the process of applying for several other FSP licenses under this Act in order to sell other financial products as a registered FSP. If our status as juristic representative were to be cancelled and if we fail to obtain our own license, we may be stopped from continuing this part of our business in South Africa.
Our payment processing businesses are subject to substantial governmental regulation and may be adversely affected by liability under, or any future inability to comply with, existing or future regulations or requirements.
Our payment processing activities are subject to extensive regulation. Compliance with the requirements under these various regulatory regimes may cause us to incur significant additional costs and failure to comply with such requirements could result in the shutdown of the non-complying facility, the imposition of liens, fines and/or civil or criminal liability.
We may be subject to regulations regarding privacy, data use and/or security which could adversely affect our business.
We are subject to regulations in a number of the countries in which we operate relating to the collection, use, retention, security and transfer of personally identifiable information about the people who use our products and services, in particular, “know your customer”, personal financial and health information. New laws in this area have been passed by several jurisdictions, and other jurisdictions are considering imposing additional restrictions. The interpretation and application of user data protection laws are in a state of flux. These laws may be interpreted and applied inconsistently from country to country and our current data protection policies and practices may not be consistent with those interpretations and applications. Complying with these varying requirements could cause us to incur substantial costs or require us to change our business practices in a manner adverse to our business.
26
Any failure, or perceived failure, by us to comply with any regulatory requirements or international privacy or consumer protection-related laws and regulations could result in proceedings or actions against us by governmental entities or others, subject us to significant penalties and negative publicity and adversely affect us. In addition, as noted above, we are subject to the possibility of security breaches, which themselves may result in a violation of these laws.
Risks Relating to our Common Stock
Our stock price has been and may continue to be volatile.
Our stock price has experienced recent significant volatility. During the 2016 fiscal year, our stock price ranged from a low of $8.44 to a high of $21.48. We expect that the trading price of our common stock may continue to be volatile as a result of a number of factors, including, but not limited to the following:
| - | any adverse developments in litigation or regulatory actions in which we are involved; | |
| - | fluctuations in currency exchange rates, particularly the U.S. dollar/ZAR exchange rate; | |
| - |
announcement of additional BEE transactions, especially one involving the issuance or potential issuance of equity securities or dilution or sale of our existing business in South Africa; | |
| - |
quarterly variations in our operating results, especially if our operating results fall below the expectations of securities analysts and investors; | |
| - | announcements of acquisitions, disposals or impairments of intangible assets; | |
| - | the timing of or delays in the commencement, implementation or completion of major projects; | |
| - | large purchases or sales of our common stock; | |
| - | general conditions in the markets in which we operate; and | |
| - | economic and financial conditions. |
The put right we have agreed to grant to the IFC Investors on the occurrence of certain triggering events may have adverse impacts on us.
In May 2016, we issued an aggregate of 9,984,311 shares of our common stock to the IFC Investors. We also entered into a policy agreement with the IFC Investors which grants the IFC Investors certain rights, including the right to require us to repurchase any shares we have sold to the IFC Investors upon the occurrence of specified triggering events, which we refer to as a “put right.” Events triggering the put right relate to (1) us being the subject of a governmental complaint alleging, a court judgment finding or an indictment alleging that we (a) engaged in specified corrupt, fraudulent, coercive, collusive or obstructive practices; (b) entered into transactions with targets of economic sanctions; or (c) failed to operate our business in compliance with anti-money laundering or anti-terrorism laws; or (2) we reject a bona fide offer to acquire all of our outstanding shares at a time when we have in place or implement a shareholder rights plan, or adopt a shareholder rights plan triggered by a beneficial ownership threshold of less than twenty percent. The put price per share will be the higher of the price per share paid to us by the IFC Investors and the volume-weighted average price per share prevailing for the 60 trading days preceding the triggering event, except that with respect a put right triggered by rejection of a bona fide offer, the put price per share will be the highest price offered by the offeror. If a put triggering event occurs, it could adversely impact our liquidity and capital resources. In addition, the existence of the put right could also affect whether or on what terms a third party might in the future offer to purchase our company. Our response to any such offer could also be complicated, delayed or otherwise influenced by the existence of the put right.
A majority of our common stock is beneficially owned by a small number of shareholders. The interests of these shareholders may conflict with those of our other shareholders.
There is a concentration of ownership of our outstanding common stock because approximately 47% of our outstanding common stock is owned by three shareholders. Based on their most recent SEC filings disclosing ownership of our shares, IFC Investors, Allan Gray Proprietary Limited, and International Value Advisers, LLC, or IVA, beneficially owned approximately 18%, 16% and 13% of our outstanding common stock, respectively.
The interests of the IFC Investors, Allan Gray and IVA, may be different from or conflict with the interests of our other shareholders. As a result of the ownership by the IFC Investors, Allan Gray and IVA, they will be able, if they act together, to significantly influence our management and affairs and all matters requiring shareholder approval, including the election of directors and approval of significant corporate transactions. This concentration of ownership may have the effect of delaying or preventing a change of control of our company, thus depriving shareholders of a premium for their shares, or facilitating a change of control that other shareholders may oppose.
27
We may seek to raise additional financing by issuing new securities with terms or rights superior to those of our shares of common stock, which could adversely affect the market price of our shares of common stock.
We may require additional financing to fund future operations, including expansion in current and new markets, programming development and acquisition, capital costs and the costs of any necessary implementation of technological innovations or alternative technologies, or to fund acquisitions. Because of the exposure to market risks associated with economies in emerging markets, we may not be able to obtain financing on favorable terms or at all.
If we raise additional funds by issuing equity securities, the percentage ownership of our current shareholders will be reduced, and the holders of the new equity securities may have rights superior to those of the holders of shares of common stock, which could adversely affect the market price and voting power of shares of common stock. If we raise additional funds by issuing debt securities, the holders of these debt securities would similarly have some rights senior to those of the holders of shares of common stock, and the terms of these debt securities could impose restrictions on operations and create a significant interest expense for us.
We may have difficulty raising necessary capital to fund operations or acquisitions as a result of market price volatility for our shares of common stock.
In recent years, the securities markets in the United States have experienced a high level of price and volume volatility, and the market price of securities of many companies have experienced wide fluctuations that have not necessarily been related to the operations, performance, underlying asset values or prospects of such companies. For these reasons, our shares of common stock can also be expected to be subject to volatility resulting from purely market forces over which we will have no control. If our business development plans are successful, we may require additional financing to continue to develop and exploit existing and new technologies, to expand into new markets and to make acquisitions, all of which may be dependent upon our ability to obtain financing through debt and equity or other means.
Issuances of significant amounts of stock in the future could potentially dilute your equity ownership and adversely affect the price of our common stock.
We believe that it is necessary to maintain a sufficient number of available authorized shares of our common stock in order to provide us with the flexibility to issue shares for business purposes that may arise from time to time. For example, we could sell additional shares to raise capital to fund our operations or to acquire other businesses, issue shares in a BEE transaction, issue additional shares under our stock incentive plan or declare a stock dividend. Our board may authorize the issuance of additional shares of common stock without notice to, or further action by, our shareholders, unless shareholder approval is required by law or the rules of the NASDAQ Stock Market. The issuance of additional shares could dilute the equity ownership of our current shareholders. In addition, additional shares that we issue would likely be freely tradable which could adversely affect the trading price of our common stock.
Failure to maintain effective internal control over financial reporting in accordance with Section 404 of the Sarbanes-Oxley Act, especially over companies that we may acquire, could have a material adverse effect on our business and stock price.
Under Section 404 of the Sarbanes-Oxley Act of 2002, or Sarbanes, we are required to furnish a management certification and auditor attestation regarding the effectiveness of our internal control over financial reporting. We are required to report, among other things, control deficiencies that constitute a “material weakness” or changes in internal control that materially affect, or are reasonably likely to materially affect, internal control over financial reporting. A “material weakness” is a deficiency, or a combination of deficiencies, in internal control over financial reporting such that there is a reasonable possibility that a material misstatement of annual or interim financial statements will not be prevented or detected on a timely basis.
The requirement to evaluate and report on our internal controls also applies to companies that we acquire. Some of these companies may not be required to comply with Sarbanes prior to the time we acquire them. The integration of these acquired companies into our internal control over financial reporting could require significant time and resources from our management and other personnel and may increase our compliance costs. If we fail to successfully integrate the operations of these acquired companies into our internal control over financial reporting, our internal control over financial reporting may not be effective.
While we continue to dedicate resources and management time to ensuring that we have effective controls over financial reporting, failure to achieve and maintain an effective internal control environment could have a material adverse effect on the market’s perception of our business and our stock price.
28
You may experience difficulties in effecting service of legal process, enforcing foreign judgments or bringing original actions based upon U.S. laws, including the federal securities laws or other foreign laws, against us or our directors and officers and experts.
While Net1 is incorporated in the state of Florida, United States, the company is headquartered in Johannesburg, South Africa and substantially all of the company’s assets are located outside the United States. In addition, all of Net1’s directors and officers reside outside of the United States and our experts, including our independent registered public accountants, are based in South Africa.
As a result, even though you could effect service of legal process upon Net1, as a Florida corporation, in the United States, you may not be able to collect any judgment obtained against Net1 in the United States, including any judgment based on the civil liability provisions of the U.S. federal securities laws, because substantially all of our assets are located outside the United States. Moreover, it may not be possible for you to effect service of legal process upon the majority of our directors and officers or upon our experts within the United States or elsewhere outside South Africa and any judgment obtained against any of our foreign directors, officers and experts in the United States, including one based on the civil liability provisions of the U.S. federal securities laws, may not be collectible in the United States and may not be enforced by a South African court.
A foreign judgment is not directly enforceable in South Africa, but constitutes a cause of action which will be enforced by South African courts provided that:
| • |
the court or arbitral body which pronounced the judgment had international jurisdiction and competence to entertain the case according to the principles recognized by South African law with reference to the jurisdiction of foreign courts; | |
| • |
the judgment is final and conclusive (that is, it cannot be altered by the court which pronounced it); | |
| • |
the judgment has not lapsed; | |
| • |
the recognition and enforcement of the judgment by South African courts would not be contrary to public policy in South Africa, including observance of the rules of natural justice which require that no award is enforceable unless the defendant was duly served with documents initiating proceedings, that he was given a fair opportunity to be heard and that he enjoyed the right to be legally represented in a free and fair trial before an impartial tribunal; | |
| • |
the judgment was not obtained by improper or fraudulent means; | |
| • |
the judgment does not involve the enforcement of a penal or foreign revenue law or any award of multiple or punitive damages; and | |
| • |
the enforcement of the judgment is not otherwise precluded by the provisions of the Protection of Business Act 99 of 1978 (as amended), of the Republic of South Africa. |
It has been the policy of South African courts to award compensation for the loss or damage actually sustained by the person to whom the compensation is awarded. South African courts have awarded compensation to shareholders who have suffered damages as a result of a diminution in the value of their shares based on various actions by the corporation and its management. Although the award of punitive damages is generally unknown to the South African legal system, that does not mean that such awards are necessarily contrary to public policy.
Whether a judgment was contrary to public policy depends on the facts of each case. Exorbitant, unconscionable, or excessive awards will generally be contrary to public policy. South African courts cannot enter into the merits of a foreign judgment and cannot act as a court of appeal or review over the foreign court. Further, if a foreign judgment is enforced by a South African court, it will be payable in South African currency. Also, under South Africa’s exchange control laws, the approval of SARB is required before a defendant resident in South Africa may pay money to a non-resident plaintiff in satisfaction of a foreign judgment enforced by a court in South Africa.
It is doubtful whether an original action based on United States federal securities laws may be brought before South African courts. A plaintiff who is not resident in South Africa may be required to provide security for costs in the event of proceedings being initiated in South Africa. Furthermore, the Rules of the High Court of South Africa require that documents executed outside South Africa must be authenticated for the purpose of use in South African courts.
In reaching the foregoing conclusions, we consulted with our South African legal counsel, Cliffe Dekker Hofmeyr Inc.
29
ITEM 1B. UNRESOLVED STAFF COMMENTS
None.
ITEM 2. PROPERTIES
We lease our corporate headquarters facility which consists of approximately 93,000 square feet in Johannesburg, South Africa. We also lease properties throughout South Africa, including a 12,088 square foot manufacturing facility in Lazer Park and 153 depot facilities. We also lease additional office space in Johannesburg, Cape Town and Durban, South Africa; Guildford and London, United Kingdom; Seoul, South Korea; Munich, Germany; Hong Kong and Zhuhai, China; Mumbai, India; Black River, Mauritius and Frederick, Maryland. These leases expire at various dates through 2020. We own land and buildings in Ahnsung, Kyung-gi, South Korea, that is used for the storage of business documents. We believe that we have adequate facilities for our current business operations.
ITEM 3. LEGAL PROCEEDINGS
Litigation Regarding Legality of Debit Orders under Social Assistance Act Regulations
On June 3, 2016, we filed for a declaratory order with the High Court of the Republic of South Africa Gauteng Division, Pretoria, to provide certainty to us, as well as other industry stakeholders, on the interpretation of the Assistance Act and recent Regulations promulgated in terms thereof (the “Regulations”). The Regulations limit direct deductions from social grants paid to beneficiaries. We interpret the meaning of the word “deductions” to be specific to the practice of deducting amounts, historically limited to life insurance premiums from grants, before the grants are paid to social welfare beneficiaries’ bank accounts, and are of the opinion that the legislature did not intend to curtail the right of beneficiaries to transact freely once the money is deposited into their bank accounts.
We brought the application for a declaratory order because SASSA seeks to lend a broader interpretation to the meaning of the term “deductions” to incorporate any debit orders, EFT debits, purchase transactions, or fund transfers that are effected after the transfer of social grants to beneficiaries’ bank accounts. If SASSA’s interpretation were to prevail, debit transactions could no longer be used as a method for beneficiaries to make regular payments for financial services such as insurance premiums, loan re-payments, cell phone contracts, money transfers or any other recurring payments. We believe that forcing beneficiaries to pay for these products or services in cash would be a major setback to the national objective of financial inclusiveness, introduce financial and security risks for beneficiaries and result in significant price increases for these products and services.
We further believe that SASSA’s interpretation of the Assistance Act and the Regulations is erroneous for a number of reasons including, but not limited to, our belief that such an interpretation violates beneficiaries’ constitutional rights by limiting their fundamental right to enter into contracts and that such interpretation impermissibly encroaches on the jurisdiction and powers of the SARB and the Payments Association of South Africa, which regulate the national payment system. SASSA's interpretation effectively prohibits the social welfare recipient community from enjoying the benefits of a convenient, low-cost, reliable and ubiquitous payment system that enables the recipients to procure financial services at highly competitive rates.
We have been joined in our application by several other industry participants, and the SARB has also filed a responding affidavit.
On June 15, 2016, SASSA brought criminal charges against us and Grindrod for contravening the Social Assistance Act, alleging that we and Grindrod failed to act in accordance with SASSA’s instructions by processing debit orders against social welfare beneficiaries’ bank accounts after the Regulations came into effect.
On June 28, 2016, the High Court scheduled a hearing on our application for a declaratory order for October 17 and 18, 2016. In its order, the High Court prohibited SASSA from making any representations to the South African Police Services and the National Prosecuting Authority regarding the criminal charges brought against us and Grindrod Bank pending the determination of the dispute, including the determination of any appeals. In addition, the order prevented SASSA from issuing further demands to us and Grindrod Bank to stop the processing of debit transactions against SASSA bank accounts pending the determination of the dispute, including the determination of any appeals.
On August 8, 2016, we were informed that the NPA had reached a “no prosecution” decision on the criminal charges filed by SASSA. We cannot predict whether SASSA might attempt to bring new charges or ask the NPA to revisit its decision in future.
We cannot predict how or when the Court will rule on our declaratory order application.
30
Challenge to Payment by SASSA of Additional Implementation Costs
In March 2015, Corruption Watch, a South African non-profit civil society organization, commenced a legal proceeding in the High Court of South Africa seeking an order by the Court to review and set aside the decision of SASSA’s Chief Executive Officer to approve the payment to us of ZAR 317 million (approximately ZAR 277 million, excluding VAT). Corruption Watch claims that there was no lawful basis for the decision to make the payment to us, and that the decision was unreasonable and irrational and did not comply with South African legislation. We are named as a respondent in this legal proceeding.
As we previously disclosed, in June 2014, we received approximately ZAR 277 million, excluding VAT, from SASSA, related to the recovery of additional implementation costs we incurred during the beneficiary re-registration process in fiscal 2012 and 2013. After we signed our SASSA contract, SASSA requested that we biometrically register all social grant beneficiaries (including child grant beneficiaries) and collect additional information for each child grant recipient, in addition to the grant recipients who were issued with the SASSA-branded UEPS/EMV smart cards. We agreed to SASSA’s request, and as a result, we performed approximately 11 million additional registrations beyond those that we were contractually required to perform in consideration for our monthly service fee. Accordingly, we claimed a cost recovery from SASSA, supported by a factual findings certificate from an independent auditing firm. SASSA agreed to pay us the ZAR 277 million as full settlement of the additional costs we incurred.
We believe that Corruption Watch’s claim is without merit, and we are defending it vigorously. However, we cannot predict how the Court will rule on the matter.
NCR application for the cancelation of Moneyline’s registration as a credit provider
In September 2014, the NCR applied to the South African National Consumer Tribunal, or Tribunal, to cancel the registration of our subsidiary, Moneyline, for breach of the NCA based on an investigation concluded by it. Pursuant to the investigation, the NCA also issued two Compliance Notices – one to CPS and one to Moneyline. The Compliance Notice issued to Moneyline accused it of “having access into the Grindrod Bank Accounts of social grant beneficiaries which enables them (sic) to see the spending patterns of beneficiaries and deposit loan amounts into such accounts.” The Compliance Notice issued to CPS accused it of providing “information about social grant beneficiaries” to Moneyline in breach of section 68(1) of the NCA. The Compliance Notices demanded that both CPS and Moneyline take the appropriate steps to address the alleged non-compliance with the NCA and to report in writing to the NCR, along with an independent audit report, that they were no longer non-compliant as alleged by the Compliance Notices.
We opposed the issuance of the Compliance Notices and the Tribunal granted our requested orders that both Compliance Notices be set aside.
Regarding the NCR’s application to cancel the registration of Moneyline, we raised a number of procedural points in defense, which, if we are successful, will be dispositive of the application. Argument on these points was heard on November 27, 2015, before three tribunal members. Two ruled against us and one upheld our points. We are appealing the majority ruling to the High Court and await a hearing date. If we are successful, it will dispose of the application. If we do not prevail, then the NCR’s application will be set down before the Consumer Tribunal for argument on the main issues raised by the NCR, as dealt with above. We cannot predict the outcome of this litigation.
There are no other material pending legal proceedings, other than ordinary routine litigation incidental to our business, to which we are a party or of which any of our property is the subject.
ITEM 4. MINE SAFETY DISCLOSURES
Not applicable.
31
PART II
ITEM 5. MARKET FOR REGISTRANT’S COMMON EQUITY, RELATED STOCKHOLDER MATTERS AND ISSUER PURCHASES OF EQUITY SECURITIES
Market information
Our common stock is listed on The Nasdaq Global Select Market, or Nasdaq, in the United States under the symbol “UEPS” and on the JSE in South Africa under the symbol “NT1.” The Nasdaq is our principal market for the trading of our common stock.
The following table sets forth, for the periods indicated, the high and low sales prices of our common stock as reported by Nasdaq.
| Period | High | Low | |||||||
| Quarter ended September 30, 2014 | $ | 14.24 | $ | 10.38 | |||||
| Quarter ended December 31, 2014 | $ | 13.27 | $ | 10.21 | |||||
| Quarter ended March 31, 2015 | $ | 14.90 | $ | 11.24 | |||||
| Quarter ended June 30, 2015 | $ | 19.70 | $ | 12.19 | |||||
| Quarter ended September 30, 2015 | $ | 21.48 | $ | 16.10 | |||||
| Quarter ended December 31, 2015 | $ | 18.37 | $ | 12.98 | |||||
| Quarter ended March 31, 2016 | $ | 13.56 | $ | 8.44 | |||||
| Quarter ended June 30, 2016 | $ | 12.35 | $ | 8.72 |
Our transfer agent in the United States is Computershare Shareowner Services LLC, 480 Washington Blvd, Jersey City, New Jersey, 07310. According to the records of our transfer agent, as of August 15, 2016, there were 14 shareholders of record of our common stock. A substantially greater number of holders of our common stock are “street name” or beneficial holders, whose shares are held of record by banks, brokers, and other financial institutions. Our transfer agent in South Africa is Link Market Services South Africa (Pty) Ltd, 13th Floor, Rennie House, 19 Ameshoff Street, Braamfontein, 2001, South Africa.
Dividends
We have not paid any dividends on our shares of common stock during our last two fiscal years and presently intend to retain future earnings to finance the expansion of the business. We do not anticipate paying any cash dividends in the foreseeable future. The future dividend policy will depend on our earnings, capital requirements, expansion plans, financial condition and other relevant factors.
Issuer purchases of equity securities
On February 3, 2016, our Board of Directors approved the replenishment of our existing share repurchase authorization to repurchase up to an aggregate of $100 million of common stock. The authorization has no expiration date. On June 29, 2016, we adopted a Rule 10b5-1 plan for the purpose of repurchasing approximately $50 million of our common stock. The plan was established in connection with the $100 million share repurchase authorization.
The table below presents our common stock purchased during fiscal 2016 per quarter:
| Average price | ||||||
| Total number | paid per | |||||
| of shares | share | |||||
| Period | purchased | (US dollars) | ||||
| First | - | - | ||||
| Second | 749,213 | 14.93 | ||||
| Third | 1,328,699 | 9.58 | ||||
| Fourth | 348,792 | 9.16 | ||||
| Total fiscal 2016 | 2,426,704 | 11.17 |
32
Share performance graph
The chart below compares the five-year cumulative return, assuming the reinvestment of dividends, where applicable, on our common stock with that of the S&P 500 Index and the NASDAQ Industrial Index. This graph assumes $100 was invested on June 30, 2011, in each of our common stock, the companies in the S&P 500 Index, and the companies in the NASDAQ Industrial Index.
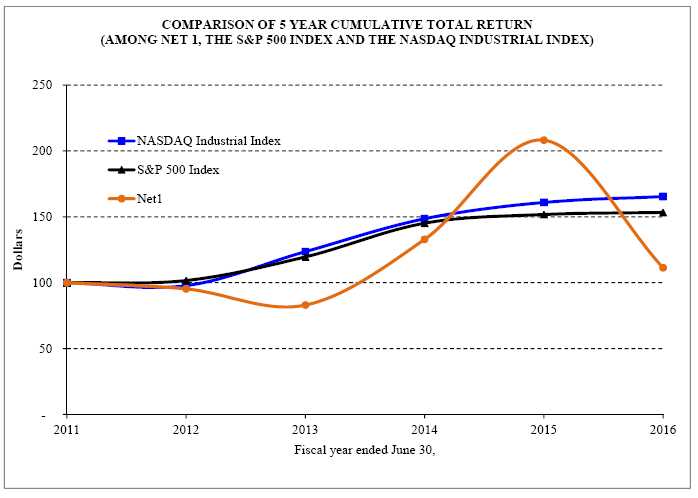
33
ITEM 6. SELECTED FINANCIAL DATA
The following selected historical consolidated financial data should be read together with Item 7—“Management’s Discussion and Analysis of Financial Condition and Results of Operations” and Item 8—“Financial Statements and Supplementary Data.” The following selected historical financial data as of June 30, 2016 and 2015, and for the three years ended June 30, 2016 have been derived from our consolidated financial statements included elsewhere in this Annual Report on Form 10-K. The selected historical consolidated financial data presented below as of June 30, 2014, 2013 and 2012 and for the years ended June 30, 2013 and 2012, have been derived from our consolidated financial statements, which are not included herein. The selected historical financial data as of each date and for each period presented have been prepared in accordance with U.S. GAAP. These historical results are not necessarily indicative of results to be expected in any future period.
Consolidated Statements of Operations Data
(in
thousands, except per share data)
| Year Ended June 30 | |||||||||||||||
| 2016 | 2015 | 2014(1) | 2013(1) | 2012(1) | |||||||||||
| Revenue | $ | 590,749 | $ | 625,979 | $ | 581,656 | $ | 452,147 | $ | 390,264 | |||||
| Cost of goods sold, IT processing, servicing and support | 290,101 | 297,856 | 260,232 | 196,834 | 141,000 | ||||||||||
| Selling, general and administrative | 145,886 | 158,919 | 168,072 | 191,552 | 137,404 | ||||||||||
| Equity instruments granted pursuant to BEE transactions (2) | - | - | 11,268 | - | 14,211 | ||||||||||
| Depreciation and amortization | 40,394 | 40,685 | 40,286 | 40,599 | 36,499 | ||||||||||
| Impairment losses | - | - | - | - | - | ||||||||||
| Operating income | 114,368 | 128,519 | 101,798 | 23,162 | 61,150 | ||||||||||
| Interest income | 15,292 | 16,355 | 14,817 | 12,083 | 8,576 | ||||||||||
| Interest expense | 3,423 | 4,456 | 7,473 | 7,966 | 9,345 | ||||||||||
| Income before income taxes | 126,237 | 140,418 | 109,142 | 27,279 | 60,381 | ||||||||||
| Income tax expense | 42,080 | 44,136 | 39,379 | 14,656 | 15,936 | ||||||||||
| Net income attributable to Net1 | 82,454 | 94,735 | 70,111 | 12,977 | 44,651 | ||||||||||
| Income from continuing operations per share: | |||||||||||||||
| Basic | $ | 1.72 | $ | 2.03 | $ | 1.51 | $ | 0.28 | $ | 0.99 | |||||
| Diluted | $ | 1.71 | $ | 2.02 | $ | 1.50 | $ | 0.28 | $ | 0.99 | |||||
(1) Includes revenue and implementation costs related to our
SASSA contract from April 2012. In addition, 2014 includes recovery of $26.6
million of implementation costs from SASSA.
(2) Includes a non-cash charge
of approximately $11.3 million in 2014 related to common stock issued in a BEE
transaction. In addition, 2012 includes a non-cash charge of approximately $14.2
million in connection with the issuance of a now-expired option to purchase
shares of our common stock in a previous BEE transaction.
Additional Operating Data:
(in thousands, except
percentages)
| Year ended June 30, | |||||||||||||||
| 2016(1) | 2015(1) | 2014(1) | 2013(1) | 2012(1) | |||||||||||
| Cash flows provided by operating activities | $ | 116,552 | $ | 135,258 | $ | 37,145 | $ | 55,917 | $ | 20,406 | |||||
| Cash flows used in investing activities(2) | $ | 5,756 | $ | 80,783 | $ | 9,237 | $ | 457,875 | $ | 247,428 | |||||
| Cash flows provided by (used in) financing activities(2) | $ | 13,645 | $ | 16,784 | $ | (25,781 | ) | $ | 399,657 | $ | 277,018 | ||||
| Operating income margin | 19% | 21% | 18% | 5% | 16% | ||||||||||
(1) Cash flows used in investing activities include movements in settlement assets and cash flows provided by (used in) financing activities include movement in settlement liabilities.
(2) Cash flows (used in) provided by investing activities and cash flows (used in) provided by financing activities for fiscal 2015, 2014, 2013 and 2012 have been restated as discussed in footnote 2 to the table below. We have:
- increased cash flows from investing activities and increased cash flows from financing activities by $21.3 million during the year ended June 30, 2015;
- decreased cash flows from investing activities and increased cash flows from financing activities by $12.4 million during the year ended June 30, 2014;
- increased cash flows from investing activities and decreased cash flows from financing activities by $10.1 million during the year ended June 30, 2013; and
- decreased cash flows from investing activities and increased cash flows from financing activities by $45.1 million during the year ended June 30, 2012.
34
Consolidated Balance Sheet Data:
in thousands)
| As of June 30, | |||||||||||||||
| 2016 | 2015 | 2014 | 2013 | 2012 | |||||||||||
| Cash and cash equivalents | $ | 223,644 | $ | 117,583 | $ | 58,672 | $ | 53,665 | $ | 39,123 | |||||
| Total current assets before settlement assets(1)(2) | 386,998 | 301,874 | 259,591 | 169,059 | 163,302 | ||||||||||
| Goodwill | 179,478 | 166,437 | 186,576 | 175,806 | 182,737 | ||||||||||
| Intangible assets | 48,556 | 47,124 | 68,514 | 77,257 | 93,930 | ||||||||||
| Total assets(1)(2) | 1,263,500 | 1,316,956 | 1,963,375 | 1,302,662 | 997,904 | ||||||||||
| Total current liabilities before settlement obligations | 65,486 | 82,198 | 81,823 | 76,859 | 73,377 | ||||||||||
| Total long-term debt | 43,134 | 50,762 | 62,388 | 66,632 | 79,760 | ||||||||||
| Total equity | $ | 603,220 | $ | 478,785 | $ | 441,748 | $ | 339,969 | $ | 346,811 | |||||
(1) During the year ended June 30, 2016, we identified a
balance sheet misclassification between current assets and long-term assets
reported as of June 30, 2015. We have restated these amounts in our consolidated
balance sheet as of June 30, 2015, and have decreased our accounts receivable,
net of allowances, which impacts total current assets before settlement assets,
and increased our other long-term assets by approximately $27.4 million, which
has no impact on total assets. The amounts presented in the table have been
adjusted for prior periods. The restated adjustments decreased our total current
assets before settlement assets, and increased our other long-term assets for
fiscal 2014, 2013 and 2012, by $23.3 million, $15.7 million and $11.9 million,
respectively. This restatement had no impact on our previously reported
consolidated income, comprehensive income or cash flows.
(2) During fiscal 2016, and in prior financial years, certain bank accounts, cash in transit and funds in preparation for immediate access by grant beneficiaries, as well as the corresponding obligation to grant beneficiaries, were not included in settlement assets and obligations, primarily due to the reservation of ownership clause in our agreement with SASSA and the assumption of total risk over the cash by the cash transfer service providers. In the course of the annual consideration of our accounting practices and in the context of the increased and more diversified payment delivery channels arising from our ATM and point of sale roll out, we have decided that our presentation would be enhanced by including these gross amounts in settlement assets and obligations. We have accordingly restated our balance sheet as of June 30, 2015, 2014, 2013 and 2012 to record an increase in settlement assets and obligations of $30.5 million, $12.4 million, $26.3 million and $42.0 million, respectively (balances translated at rates applicable as of June 30, 2015, 2014, 2013 and 2012, respectively.) The inclusion of these accounts did not impact on cash and cash equivalents reported nor did it impact on the Company’s current assets before settlement assets and current liabilities before settlement obligations.
- Remainder of this page left blank -
35
ITEM 7. MANAGEMENT’S DISCUSSION AND ANALYSIS OF FINANCIAL CONDITION AND RESULTS OF OPERATIONS
The following discussion and analysis should be read in conjunction with Item 6—“Selected Financial Data” and Item 8—“Financial Statements and Supplementary Data.” In addition to historical consolidated financial information, the following discussion and analysis contains forward-looking statements that involve risks, uncertainties and assumptions. See Item 1A— “Risk Factors” and “Forward Looking Statements.”
Overview
We are a leading provider of payment solutions, transaction processing services and financial technology across multiple industries and in a number of emerging and developed economies.
We have developed and market a comprehensive transaction processing solution that encompasses our smart card-based alternative payment system for the unbanked and under-banked populations of developing economies and for mobile transaction channels. Our market-leading system can enable the billions of people globally who generally have limited or no access to a bank account to enter affordably into electronic transactions with each other, government agencies, employers, merchants and other financial service providers. Our UEPS, and UEPS/EMV derivative discussed below, uses biometrically secure smart cards that operate in real-time but offline, unlike traditional payment systems offered by major banking institutions that require immediate access through a communications network to a centralized computer. This offline capability means that users of our system can conduct transactions at any time with other card holders in even the most remote areas so long as a smart card reader, which is often portable and battery powered, is available. Our off-line systems also offer the highest level of availability and affordability by removing any elements that are costly and are prone to outages. Our latest version of the UEPS technology has been certified by EMV, which facilitates our traditionally proprietary UEPS system to interoperate with the global EMV standard and allows card holders to transact at any EMV-enabled point of sale terminal or ATM. The UEPS/EMV technology has been deployed on an extensive scale in South Africa through the issuance of MasterCard-branded UEPS/EMV cards to our social welfare grant customers. In addition to effecting purchases, cash-backs and any form of payment, our system can be used for banking, healthcare management, international money transfers, voting and identification.
We also provide secure financial technology solutions and services, by offering transaction processing, financial and clinical risk management solutions to various industries. We have extensive expertise in secure online transaction processing, cryptography, mobile telephony, integrated circuit card (chip/smart card) technologies, and the design and provision of financial and value-added services to our cardholder base.
Our technology is widely used in South Africa today, where we distribute pension and welfare payments, using our UEPS/EMV technology, to over ten million recipient cardholders across the entire country, process debit and credit card payment transactions on behalf of a wide range of retailers through our EasyPay system, process value-added services such as bill payments and prepaid airtime and electricity for the major bill issuers and local councils in South Africa, and provide mobile telephone top-up transactions for all of the South African mobile carriers. We are the largest provider of third-party and associated payroll payments in South Africa through our FIHRST service. We provide financial inclusion services such as microloans, insurance, mobile transacting and prepaid utilities to our cardholder base.
In addition, through KSNET, we are one of the top three value-added network, or VAN, processors in South Korea, and we offer card processing, payment gateway and banking value-added services in that country. We have expanded our card issuing and acquiring capabilities through the acquisition of Transact24 in Hong Kong. Our Masterpayment subsidiary in Germany provides value added payment services to online retailers across Europe. Our XeoHealth service provides funders and providers of healthcare in United States with an on-line real-time management system for healthcare transactions.
Our ZAZOO business unit is responsible for the worldwide technical development and commercialization of our array of web and mobile applications and payment technologies, such as MVC, Chip and GSM licensing and VTU, and has deployed solutions in many countries, including South Africa, Namibia, Nigeria, Malawi, Cameroon, the Philippines, India and Colombia.
Sources of Revenue
We generate our revenues by charging transaction fees to government agencies, merchants, financial service providers, utility providers, bill issuers, employers, healthcare providers and cardholders; by providing loans and insurance products and by selling hardware, licensing software and providing related technology services.
36
We have structured our business and our business development efforts around four related but separate approaches to deploying our technology. In our most basic approach, we act as a supplier, selling our equipment, software, and related technology to a customer. The revenue and costs associated with this approach are reflected in our Financial inclusion and applied technologies segment.
We have found that we have greater revenue and profit opportunities, however, by acting as a service provider instead of a supplier. In this approach we own and operate the UEPS ourselves, charging one-time and on-going fees for the use of the system either on a fixed or ad valorem basis. This is the case in South Africa, where we distribute welfare grants on behalf of the South African government on a fixed fee basis, but charge a fee on an ad valorem basis for goods and services purchased using our smart card. The revenue and costs associated with this approach are reflected in our South African transaction processing and Financial inclusion and applied technologies segments.
Because our smart cards are designed to enable the delivery of more advanced services and products, we are also willing to supply those services and products directly where the business case is compelling. For instance, we provide short-term UEPS-based loans to our smart card holders. This is an example of the third approach that we have taken. Here we can act as the principal in operating a business that can be better delivered through our UEPS. We can also act as an agent, for instance, in the provision of insurance policies. In both cases, the revenue and costs associated with this approach are reflected in our Financial inclusion and applied technologies segment.
In South Africa, we also generate fees from debit and credit card transaction processing, the provision of value-added services such as bill payments, mobile top-up and prepaid utility sales, and from providing a payroll transaction management service. The revenue and costs associated with these services are reflected in our South African transaction processing and Financial inclusion and applied technologies segments.
Through KSNET, we earn most of our revenue from payment processing services we provide to approximately 225,000 merchants and to card issuers in South Korea through our value-added-network. Through Masterpayment and Transact24 we generate fee revenue through the provision of payment service provider and card issuing and acquiring services in primarily Germany, China and the U.S. Furthermore, in the U.S., we earn transaction fees from our customers utilizing our XeoRules online real-time management system for healthcare transactions. We also generate fees from our customers who utilize our VCPay technology to generate a unique, one-time use prepaid virtual card number to securely purchase goods and services or perform bill payments in any card-not-present environment. The revenue and costs at of all of these businesses are reflected in our International transaction processing segment.
Finally, we have entered into business partnerships or joint ventures to introduce our financial technology solutions to markets such as Namibia and One Credit in Nigeria. In these situations, we take an equity position in the business while also acting as a supplier of technology. In evaluating these types of opportunities, we seek to maintain a highly disciplined approach, carefully selecting partners, participating closely in the development of the business plan and remaining actively engaged in the management of the new business. In most instances, the joint venture or partnership has a license to use our proprietary technologies in the specific territory, including the back-end system. We also own 26% of Finbond Group Limited, or Finbond, a South African public company that has a mutual banking license in South Africa and owns certain state lenders in the U.S. We account for our equity investments using the equity method. When we equity-account these investments, we are required under U.S. GAAP to eliminate our share of the net income generated from sales of hardware and software to the investee. We recognize this net income from these equity-accounted investments during the period in which the hardware and software is utilized in the investee’s operations, or has been sold to third-party customers, as the case may be.
We believe that this flexible approach enables us to drive adoption of our solution while capturing the value created by the implementation of our technology.
Developments during Fiscal 2016
Cancellation of SASSA Tender
In late 2014, SASSA issued a request for proposal, or RFP, as ordered by the South African Constitutional Court. In May 2015, after careful consideration of all the relevant factors, we decided to withdraw from the tender process and did not submit a bid.
In October, 2015, SASSA determined not to award the SASSA tender, in accordance with the recommendation received from the Bid Adjudication Committee, or BAC. The BAC recommended that the tender not be awarded as a result of the non-responsiveness of all the bids received with the mandatory requirements contained in the RFP and that our current SASSA contract should continue until completion of the five-year period for which the contract was initially awarded (March 31, 2017), in accordance with the Constitutional Court’s judgment of April 2014.
37
The BAC also recommended that SASSA file a report with the Constitutional Court setting out all the relevant information on whether and when SASSA will be ready to assume the duty to pay grants itself. SASSA filed this report with the Constitutional Court in November 2015.
Accordingly, we expect that we will continue to provide our social grants payment service to SASSA through March 31, 2017. We cannot predict at this time whether or not we will continue to provide our service after that date. We are committed to continue with the provision of a high level service to SASSA and the social grant beneficiaries in accordance with the service level agreement and the Constitutional Court’s order.
Progress of financial inclusion initiatives in South Africa
In June 2015, we began the rollout of EPE, our business-to-consumer, or B2C, offering in South Africa, and we have experienced rapid growth in the number of new customers. At August 18, 2016, we had more than 1,430,000 active EPE accounts, compared to 1,087,000 at April 30, 2016. EPE is a fully transactional account created to serve the needs of South Africa’s unbanked and under-banked population, and is available to all consumers regardless of their financial or social status or whether they are SASSA recipients. The EPE account offers customers a comprehensive suite of financial and various financial inclusion services, such as prepaid products, in an economical, convenient and secure solution. EPE provides account holders with a UEPS-EMV debit MasterCard, mobile and internet banking services, ATM and POS services, as well as loans, insurance and other financial products and value-added services. However, SASSA is challenging the ability of beneficiaries to freely transact with the grants that they receive.
In order for us to address the sizeable opportunity for EPE and related financial inclusion services in South Africa, we have had to expand our brick-and-mortar financial services branch infrastructure and supplement our nationwide distribution with a UEPS/EMV-enabled ATM network, as well as a dedicated sales force. Such investments have accelerated through fiscal 2016 and at July 31, 2016, we had approximately 140 branches, 904 ATMs, and approximately 2,200 dedicated employees.
Our deployed ATMs, which are both EMV-and UEPS-compliant, provide biometric verification as well as proof of life functionality, in South Africa. We place these ATMs with our merchant partners and within our own branches, creating a new delivery channel for our products and services that did not previously exist. The ATM rollout has continued to make a positive contribution to our reported results and we have been able to expand our customer base because our ATMs accept all South African issued bank cards. We will continue to expand our ATM footprint during fiscal 2017.
In September 2015, we resumed marketing and business development activities in selected areas for the distribution of our simple, low-cost life insurance products and have sold approximately 160,000 new policies through August 7, 2016, in addition to the basic life insurance policy provided with every EPE account opened. We recruited additional and often-times specialized staff to expand our insurance activities during fiscal 2016.
Following the high sequential growth in our lending book during the second quarter of fiscal 2016 as a result of high demand for our loans during the festive season and the opening of new branches, we experienced lower demand during the third quarter of fiscal 2016. Tougher economic conditions in South Africa, aggravated by rising food prices as a result of widespread drought conditions and a weakening currency, has had an impact on the number of clients who qualify for our loan products.
- Remainder of this page left blank -
38
The graph below presents the growth of the number of EPE cards and Smart Life policies:
![]()
ZAZOO
WorldRemit
We processed our first transactions as a result of our relationship with WorldRemit during the third quarter of fiscal 2016. ZAZOO has entered into an agreement with WorldRemit, a global money transfer services provider, to enable South Africans to instantly receive international money transfers directly into their personal bank accounts. WorldRemit has developed an application, or app, that enables people to transfer money to friends and family using a smartphone, tablet or computer at any time from anywhere. ZAZOO enables WorldRemit to offer this service in South Africa by using technology developed and customized by FIHRST, an authorized systems operator and third-party processor. FIHRST’s technology streamlines the relationship between the payer and payee and ensures data integrity using sophisticated encryption routines with secure dedicated lines to South Africa’s major banks.
South Africans receive inbound remittances of more than USD 1 billion per year. According to the Remittance Prices Worldwide report published by the World Bank, the average global cost for remittances is 7.68% of the transaction value, with Sub-Saharan Africa listed as the most expensive region in the world at 9.74% . These numbers emphasize the opportunity that exists in South Africa to attract customers through the introduction of highly efficient financial technology by lowering cost and increasing accessibility.
In addition, unbanked recipients have the option of opening an EPE account. Should a recipient select to receive their funds into their EPE account, ZAZOO will enable that recipient to make use of its Mobile Virtual Card, or MVC, technology to create a virtual MasterCard to spend digitally for any online purchase in South Africa.
39
Oxigen Services India Pvt. Ltd, or Oxigen
ZAZOO has recently entered into an agreement with Oxigen, a payment solutions provider in India, to seamlessly integrate its MVC technology to power VIRTUALe into Oxigen Wallet in association with RBL Bank as sponsor bank and co-branding partner. The Oxigen Wallet utilizes ZAZOO’s MVC technology to power the VIRTUALe Visa Prepaid card securely and offline for card-not-present transactions, such as e-commerce or m-commerce purchases. The MVC technology runs as an application on any mobile phone, transforming it into a cashless, secure and convenient electronic payment device that eliminates the risks of theft, phishing, skimming, spoofing and other fraudulent activities. Oxigen Wallet customers are able to use the application to make any purchases or bill payments at online merchants, or send virtual gift cards to friends and family.
We launched the beta version of our MVC technology with Oxigen during January 2016 and as at August 18, 2016 we had approximately 300,000 users, and during that period had processed transaction value of INR 65 million (approximately $1.0 million translated at exchange rates prevailing as of June 30, 2016).
World Food Program
The Southern Africa Regional Office of the United Nations World Food Program, or the WFP, has awarded us a contract for 12 countries that are members of the Southern African Development Community. Under the terms of the contract, we distribute cash and food grants to hundreds of thousands of WFP beneficiaries in these countries.
Our technology makes use of the existing infrastructure in each territory and allows for the biometric verification of all beneficiaries regardless of whether or not such infrastructure is biometrically enabled. In certain situations, we utilize our patented variable PIN technology in conjunction with fingerprint or voice verification methods using any mobile phone. We do not expect that this socially responsible initiative will necessarily translate into a meaningful financial contributor for us in the short term, but we strongly believe that the exposure and credibility associated with winning and operating a project of this nature and scale will create further opportunities for us to implement the same or similar solutions in other contexts. We have finalized our deployment contract with the WFP office based in South Africa and are preparing for the first deployment of our technology in Zimbabwe.
Acquisitions
Transact24 Limited
On January 20, 2016, we acquired the remaining 56% of the issued and outstanding ordinary shares of Transact24 for $3 million in cash and through the issue of 391,645 shares of our common stock. Transact24 is a specialist Hong Kong-based payment services company and is now our wholly-owned subsidiary. We originally acquired approximately 44% of Transact24 in May 2015. Philip Meyer, the Managing Director of Transact24 and an industry veteran in the international payments and transaction processing industries, has become an executive officer of our company.
During the second half of fiscal 2016, Transact24 obtained Payment Intermediary Services Licenses (“PISL”) in Mauritius and an Authorized Electronic Money Institution License (“AEMIL”) in the United Kingdom. The PISL allows Transact24 to participate in the growing e-commerce market by offering online merchants the ability to accept various forms of electronic payment worldwide. The AEMIL license is a key part of our strategy to establish the regulatory framework we require to expand our product offerings globally, specifically virtual and plastic card issuing and will enable us to apply for membership of the large card schemes and become an issuer and acquirer in our right.
Masterpayment AG
We acquired 60% of Masterpayment in early April 2016, and the remaining 40% we did not own in early June 2016, for an aggregate of approximately $25 million in cash. Masterpayment is a specialist payment services processor based in Munich, Germany. Masterpayment provides payment and acquiring services for all major European debit and credit cards; and invoicing for online retail, digital goods and content. Masterpayment currently has a client portfolio of approximately 5,000 registered merchants.
In collaboration with Bank Frick & Co. AG, a Liechtenstein-based bank, Masterpayment provides its e-commerce merchants with working capital optimization by providing a flexible form of financing, which employs a trading transaction instead of traditional bank credit. Masterpayment’s “Finetrading” product enables the seamless financing of a merchant’s inventory orders, resulting in accelerated payment settlement and the elimination of the requirement for a merchant to maintain rolling reserves or cash advances.
40
As part of the April 2016 transaction, we, together with Masterpayment, entered into a long term co-operation agreement with Bank Frick, in terms of which Bank Frick will become our strategic banking partner and will provide us with the support and banking services required to deploy our products and services, including VCPay, Finetrading and money remittances in Europe. We have developed a pan-European roll-out program for Masterpayment’s working capital financing initiative and we expect to incur significant implementation costs during fiscal 2017 for the recruitment of business development and support staff and the establishment of offices.
Finbond
In March 2016, Finbond completed a rights offering in which we acquired an additional 40,733,723 shares for approximately $8.9 million. In April 2016, our representative was appointed to Finbond’s board of directors and we have determined that we are now able to exert significant influence on Finbond due to our representation on its board of directors combined with our level of shareholding. Up until this date, we had no rights to participate in the financial, operating, or governance decisions made by Finbond. We also had no participation on Finbond’s board of directors whether through contractual agreement or otherwise. Consequently, we have concluded that we did not have significant influence over Finbond and therefore equity accounting was not appropriate up until March 31, 2016, and Finbond was carried as an available for sale asset up until that date.
Issue of shares to the IFC Investors
We received approximately $107.7 million from the IFC Investors on May 11, 2016, in connection with the issuance to them of approximately 9.98 million shares of our common stock at a subscription price of $10.79 per share. We have also entered into a policy agreement with the IFC Investors. Refer to Note 14 to our consolidated financial statements for additional detail regarding the transaction and the policy agreement.
We intend to use the proceeds of the IFC investment primarily for the expansion of our business and technological solutions in emerging markets across the globe. IFC is a member of the World Bank Group and is the largest global development institution focused on the private sector in emerging markets.
Regulatory change to merchant fees in South Korea
Korean regulators have recently introduced specific regulations governing the fees that may be charged on card transactions, as is the case in most other developed economies, that have a direct impact on card issuers in Korea. Consistent with global practices, we expect the card issuers to renegotiate their fees with VAN companies including KSNET, and if successful, such actions may have an adverse impact on KSNET’s financial performance. Transaction processors and acquirers in other international markets facing similar regulation have successfully navigated through this cycle, and we believe we are also well positioned to accommodate these changes and additionally implement initiatives that would further diversify KSNET’s existing business model.
Closure of cases by Hawks
During 2012, shortly after the award of the SASSA tender to us, certain media reports appeared in the South African press which alleged or implied that the SASSA tender process was tainted by corruption through bribes by or on behalf of our subsidiary, Cash Paymaster Service (Pty) Ltd.
In February 2013, we filed an application pursuant to Section 34 of the South African Prevention of Corrupt Activities Act in South Africa with the South African Police Service. Section 34 deals with the reporting of suspected fraud, theft, extortion and forgery. Matters reported under Section 34 are usually referred for investigation to the Serious Economic Offences Unit of the South African Police Service’s Directorate for Priority Crime Investigation, or Hawks. We filed the Section 34 application after we conducted our own internal investigation into the allegations contained in the South African press articles. We found no evidence substantiating any of the press allegations. We then filed the Section 34 application to prompt the Hawks to conduct a wider investigation into the allegations because we did not have access to the personal financial records of the alleged perpetrators. A separate but similar complaint was lodged by the Democratic Alliance, the official opposition political party in South Africa.
In November 2015, we received a written notice from the Hawks, stating that both cases were investigated and brought before two separate prosecutors for decisions. As both prosecutors declined to prosecute these matters, the Hawks have closed the investigations and regard the matters as finalized.
41
Dismissal of class action lawsuit in the U.S.
In September, 2015, the United States District Court for the Southern District of New York dismissed the purported securities class action litigation originally filed on December 24, 2013, against us, our Chief Executive Officer and our Chief Financial Officer.
Critical Accounting Policies
Our consolidated financial statements have been prepared in accordance with U.S. GAAP, which requires management to make estimates and assumptions about future events that affect the reported amount of assets and liabilities and disclosure of contingent assets and liabilities. As future events and their effects cannot be determined with absolute certainty, the determination of estimates requires management’s judgment based on a variety of assumptions and other determinants such as historical experience, current and expected market conditions and certain scientific evaluation techniques. Management believes that the following accounting policies are critical due to the degree of estimation required and the impact of these policies on the understanding of the results of our operations and financial condition.
Business Combinations and the Recoverability of Goodwill
A component of our growth strategy has been to acquire and integrate businesses that complement our existing operations. The purchase price of an acquired business is allocated to the tangible and intangible assets acquired and liabilities assumed based upon their estimated fair value at the date of purchase. The difference between the purchase price and the fair value of the net assets acquired is recorded as goodwill. In determining the fair value of assets acquired and liabilities assumed in a business combination, we use various recognized valuation methods, including present value modeling. Further, we make assumptions using certain valuation techniques, including discount rates and timing of future cash flows.
We review the carrying value of goodwill annually or more frequently if circumstances indicate impairment may have occurred. In performing this review, we are required to estimate the fair value of goodwill that is implied from a valuation of the reporting unit to which the goodwill has been allocated after deducting the fair values of all the identifiable assets and liabilities that form part of the reporting unit.
The determination of the fair value of a reporting unit requires us to make significant judgments and estimates. In determining the fair value of reporting units, we consider the earnings before interest, taxation, depreciation and amortization, or EBITDA, and the EBITDA multiples applicable to peer and industry comparables of the reporting units. We base our estimates on assumptions we believe to be reasonable but that are unpredictable and inherently uncertain. In addition, we make judgments and assumptions in allocating assets and liabilities to each of our reporting units. The results of our impairment tests during fiscal 2016 indicated that the fair value of our reporting units exceeded their carrying values and therefore our reporting units were not at risk of potential impairment.
Intangible Assets Acquired Through Acquisitions
The fair values of the identifiable intangible assets acquired through acquisitions were determined by management using the purchase method of accounting. We completed acquisitions during fiscal 2016 where we identified and recognized intangible assets. We have used the relief from royalty method, the multi-period excess earnings method, the income approach and the cost approach to value acquisition-related intangible assets. In so doing, we made assumptions regarding expected future revenues and expenses to develop the underlying forecasts, applied contributory asset charges, discount rates, exchange rates, cash tax charges and useful lives.
The valuations were based on information available at the time of the acquisition and the expectations and assumptions that have been deemed reasonable by us. No assurance can be given, however, that the underlying assumptions or events associated with such assets will occur as projected. For these reasons, among others, the actual cash flows may vary from forecasts of future cash flows. To the extent actual cash flows vary, revisions to the useful life or impairment of intangible assets may be necessary.
Deferred Taxation
We estimate our tax liability through the calculations done for the determination of our current tax liability, together with assessing temporary differences resulting from the different treatment of items for tax and accounting purposes. These differences result in deferred tax assets and liabilities which are disclosed on our balance sheet. Management then has to assess the likelihood that deferred tax assets are more likely than not to be realized in future periods. In the event it is determined that the deferred tax assets to be realized in the future would be in excess of the net recorded amount, an adjustment to the deferred tax asset valuation allowance would be recorded.
42
This adjustment would increase income in the period such determination was made. Likewise, should it be determined that all or part of the net deferred tax asset would not be realized in the future, an adjustment to increase the deferred tax asset valuation allowance would be charged to income in the period such determination is made. In assessing the need for a valuation allowance, historical levels of income, expectations and risks associated with estimates of future taxable income and ongoing prudent and practicable tax planning strategies are considered. During fiscal 2016, we recorded an increase of $16.3 million to our valuation allowance, and in fiscal 2015 and 2014, respectively, we recorded a decrease of $2.6 million and $29.0 million to our valuation allowance.
Stock-based Compensation and Equity Instrument issued pursuant to BEE transactions
Stock-based compensation
Management is required to make estimates and assumptions related to our valuation and recording of stock-based compensation charges under current accounting standards. These standards require all share-based compensation to employees to be recognized in the statement of operations based on their respective grant date fair values over the requisite service periods and also requires an estimation of forfeitures when calculating compensation expense.
We utilize the Cox Ross Rubinstein binomial model to measure the fair value of stock options granted to employees and directors and recognize compensation cost on a straight line basis. Option-pricing models require estimates of a number of key valuation inputs including expected volatility, expected dividend yield, expected term and risk-free interest rate. Our management has estimated forfeitures based on historic employee behavior under similar compensation plans. The fair value of stock options is affected by the assumptions selected. Net stock-based compensation expense from continuing operations was $3.6 million, $3.2 million and $3.7 million for fiscal 2016, 2015 and 2014, respectively.
Equity instruments
During fiscal 2014, we recorded non-cash charges of $11.3 million associated with the issuance of equity instruments as part of the BEE transactions as these equity instruments were fully vested in that year.
Accounts Receivable and Allowance for Doubtful Accounts Receivable
We maintain an allowance for doubtful accounts receivable related to our Financial inclusion and applied technologies and International transaction-based activities segments with respect to sales or rental of hardware, support and maintenance services provided; or sale of licenses to customers; or the provision of transaction processing services to our customers.
Our policy is to regularly review the aging of outstanding amounts due from customers and adjust the provision based on management’s estimate of the recoverability of the amounts outstanding.
Management considers factors including period outstanding, creditworthiness of the customers, past payment history and the results of discussions by our credit department with the customer. We consider this policy to be appropriate taking into account factors such as historical bad debts, current economic trends and changes in our customer payment patterns. Additional provisions may be required should the ability of our customers to make payments when due deteriorate in the future. A significant amount of judgment is required to assess the ultimate recoverability of these receivables, including on-going evaluation of the creditworthiness of each customer.
UEPS-based lending
We maintain an allowance for doubtful finance loans receivable related to our Financial inclusion and applied technologies segment with respect to UEPS-based loans provided to our customers. Our policy is to regularly review the ageing of outstanding amounts due from borrowers and adjust the provision based on management’s estimate of the recoverability of finance loans receivable. We write off UEPS-based loans and related service fees if a borrower is in arrears with repayments for more than three months or dies.
Management considers factors including the period of the UEPS-loan outstanding, creditworthiness of the customers and the past payment history and trends of its established UEPS-based lending book. We consider this policy to be appropriate taking into account factors such as historical bad debts, current economic trends and changes in our customer payment patterns. Additional allowances may be required should the ability of our customers to make payments when due deteriorate in the future. A significant amount of judgment is required to assess the ultimate recoverability of these finance loan receivables, including on-going evaluation of the creditworthiness of each customer.
43
Research and Development
Accounting standards require product development costs to be charged to expenses as incurred until technological feasibility is attained. Technological feasibility is attained when our software has completed system testing and has been determined viable for its intended use. The time between the attainment of technological feasibility and completion of software development has been short. Accordingly, we did not capitalize any development costs during the years ended June 30, 2016, 2015 or 2014, particularly because the main part of our development is the enhancement and upgrading of existing products.
Costs to develop software for our internal use is expensed as incurred, except to the extent that these costs are incurred during the application development stage. All other costs including those incurred in the project development and post-implementation stages are expensed as incurred.
A significant amount of judgment is required to separate research costs, new development costs and ongoing development costs based as the transition between these stages. A multitude of factors need to be considered by management, including an assessment of the state of readiness of the software and the existence of markets for the software. The possibility of capitalizing development costs in the future may have a material impact on the group’s profitability in the period when the costs are capitalized, and in subsequent periods when the capitalized costs are amortized.
Recent Accounting Pronouncements
Recent accounting pronouncements adopted
Refer to Note 2 of our consolidated financial statements for a full description of recent accounting pronouncements, including the expected dates of adoption and effects on financial condition, results of operations and cash flows.
Recent accounting pronouncements not yet adopted as of June 30, 2016
Refer to Note 2 of our consolidated financial statements for a full description of recent accounting pronouncements not yet adopted as of June 30, 2016, including the expected dates of adoption and effects on financial condition, results of operations and cash flows.
Currency Exchange Rate Information
Actual exchange rates
The actual exchange rates for and at the end of the periods presented were as follows:
| Table 1 | Year ended June 30, | ||||||||
| 2016 | 2015 | 2014 | |||||||
| ZAR : $ average exchange rate | 14.5062 | 11.4494 | 10.3798 | ||||||
| Highest ZAR : $ rate during period | 16.8231 | 12.5779 | 11.2579 | ||||||
| Lowest ZAR : $ rate during period | 12.1965 | 10.5128 | 9.6259 | ||||||
| Rate at end of period | 14.7838 | 12.2854 | 10.5887 | ||||||
| KRW : $ average exchange rate | 1,173 | 1,078 | 1,068 | ||||||
| Highest KRW : $ rate during period | 1,245 | 1,139 | 1,147 | ||||||
| Lowest KRW : $ rate during period | 1,122 | 1,009 | 1,014 | ||||||
| Rate at end of period | 1,153 | 1,128 | 1,014 | ||||||
44
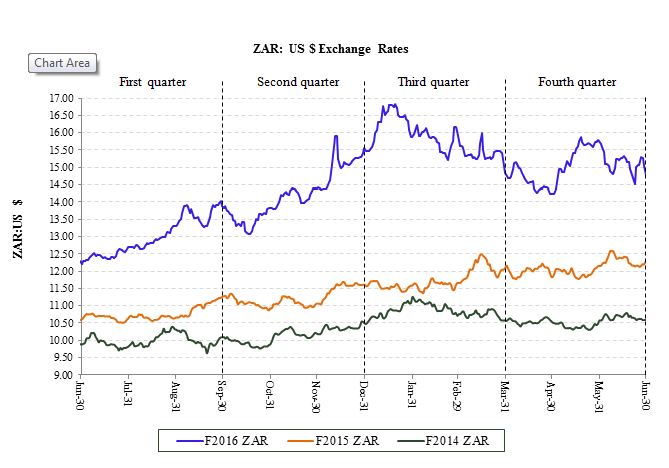
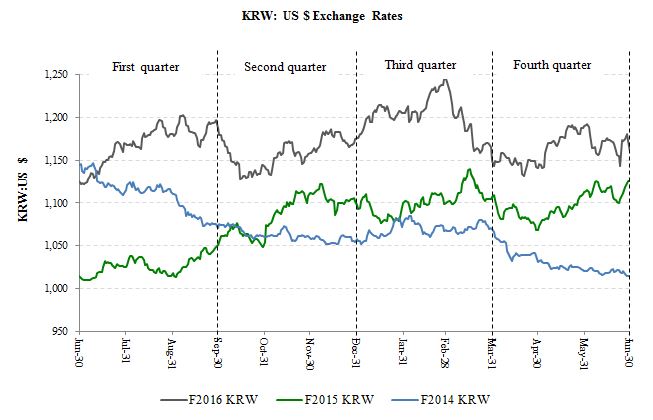
45
Translation Exchange Rates
We are required to translate our results of operations from ZAR to U.S. dollars on a monthly basis. Thus, the average rates used to translate this data for the years ended June 30, 2016, 2015 and 2014, vary slightly from the averages shown in the table above. The translation rates we use in presenting our results of operations are the rates shown in the following table:
| Year ended | |||||||||
| Table 2 | June 30, | ||||||||
| 2016 | 2015 | 2014 | |||||||
| Income and expense items: $1 = ZAR | 14.3842 | 11.4275 | 10.3966 | ||||||
| Income and expense items: $1 = KRW | 1,172 | 1,073 | 1,049 | ||||||
| Balance sheet items: $1 = ZAR | 14.7838 | 12.2854 | 10.5887 | ||||||
| Balance sheet items: $1 = KRW | 1,153 | 1,128 | 1,014 | ||||||
Results of Operations
The discussion of our consolidated overall results of operations is based on amounts as reflected in our audited consolidated financial statements which are prepared in accordance with U.S. GAAP. We analyze our results of operations both in U.S. dollars, as presented in the consolidated financial statements, and supplementally in ZAR, because ZAR is the functional currency of the entities which contribute the majority of our profits and is the currency in which the majority of our transactions are initially incurred and measured. Due to the significant impact of currency fluctuations between the U.S. dollar and ZAR on our reported results and because we use the U.S. dollar as our reporting currency, we believe that the supplemental presentation of our results of operations in ZAR is useful to investors to understand the changes in the underlying trends of our business.
Our operating segment revenue presented in “—Results of operations by operating segment” represents total revenue per operating segment before intercompany eliminations. A reconciliation between total operating segment revenue and revenue presented in our consolidated financial statements is included in Note 23 to those statements.
Fiscal 2016 includes the results of Transact24 from the January 1, 2016 and Masterpayment from April 1, 2016. Fiscal 2015 results exclude MediKredit and NUETS business from July 1, 2014. Refer also to Note 3 to the consolidated financial statements.
Fiscal 2016 Compared to Fiscal 2015
The following factors had an influence on our results of operations during fiscal 2016 as compared with the same period in the prior year:
| • |
Unfavorable impact from the strengthening of the U.S. dollar against primary functional currencies: The U.S. dollar appreciated by 26% against the ZAR and 9% against the KRW during fiscal 2016, which negatively impacted our reported results; | |
| • |
Continued growth in airtime revenue and transaction fees: We continued to grow our financial inclusion services offerings during fiscal 2016, which has resulted in higher revenues and operating income, primarily from more sales of low-margin prepaid airtime and an increase in transaction fees; | |
| • |
Launch of EPE and Smart Life: During fiscal 2016 we launched our EPE and Smart Life offerings and expanded our ATM network, which contributed to an increase in revenue in ZAR, as well as an associated increase in establishment costs for our branch network; | |
| • |
Increased contribution by KSNET: Our results were positively impacted by growth in our Korean operations; and | |
| • |
Tax impact of dividends from South African subsidiary: Our income tax expense includes approximately $6.2 million related to the tax impact, including withholding taxes, resulting from distributions from our South African subsidiary which helped reduce the impact of a weakened ZAR on our reported cash balances. The conversion of a significant portion of our ZAR cash reserves to USD negatively impacted our interest income due to the material difference between ZAR and USD deposit rates. |
Consolidated overall results of operations
This discussion is based on the amounts which were prepared in accordance with U.S. GAAP.
46
The following tables show the changes in the items comprising our statements of operations, both in U.S. dollars and in ZAR:
| In United States Dollars | |||||||||
| Table 3 | (U.S. GAAP) | ||||||||
| Year ended June 30, | |||||||||
| 2016 | 2015 | % | |||||||
| $ ’000 | $ ’000 | change | |||||||
| Revenue | 590,749 | 625,979 | (6% | ) | |||||
| Cost of goods sold, IT processing, servicing and support | 290,101 | 297,856 | (3% | ) | |||||
| Selling, general and administration | 145,886 | 158,919 | (8% | ) | |||||
| Depreciation and amortization | 40,394 | 40,685 | (1% | ) | |||||
| Operating income | 114,368 | 128,519 | (11% | ) | |||||
| Interest income | 15,292 | 16,355 | (6% | ) | |||||
| Interest expense | 3,423 | 4,456 | (23% | ) | |||||
| Income before income tax expense | 126,237 | 140,418 | (10% | ) | |||||
| Income tax expense | 42,080 | 44,136 | (5% | ) | |||||
| Net income before earnings from equity-accounted investments | 84,157 | 96,282 | (13% | ) | |||||
| Earnings from equity-accounted investments | 639 | 452 | 41% | ||||||
| Net income | 84,796 | 96,734 | (12% | ) | |||||
| Less net income attributable to non-controlling interest | 2,342 | 1,999 | 17% | ||||||
| Net income attributable to us | 82,454 | 94,735 | (13% | ) | |||||
| In South African Rand | |||||||||
| Table 4 | (U.S. GAAP) | ||||||||
| Year ended June 30, | |||||||||
| 2016 | 2015 | ||||||||
| ZAR | ZAR | % | |||||||
| ’000 | ’000 | change | |||||||
| Revenue | 8,497,452 | 7,153,375 | 19% | ||||||
| Cost of goods sold, IT processing, servicing and support | 4,172,870 | 3,403,749 | 23% | ||||||
| Selling, general and administration | 2,098,453 | 1,816,047 | 16% | ||||||
| Depreciation and amortization | 581,036 | 464,928 | 25% | ||||||
| Operating income | 1,645,093 | 1,468,651 | 12% | ||||||
| Interest income | 219,963 | 186,897 | 18% | ||||||
| Interest expense | 49,237 | 50,921 | (3% | ) | |||||
| Income before income tax expense | 1,815,819 | 1,604,627 | 13% | ||||||
| Income tax expense | 605,287 | 504,364 | 20% | ||||||
| Net income before earnings from equity-accounted investments | 1,210,532 | 1,100,263 | 10% | ||||||
| Earnings from equity-accounted investments | 9,192 | 5,165 | 78% | ||||||
| Net income | 1,219,724 | 1,105,428 | 10% | ||||||
| Less net income attributable to non-controlling interest | 33,688 | 22,844 | 47% | ||||||
| Net income attributable to us | 1,186,036 | 1,082,584 | 10% | ||||||
In ZAR, the increase in revenue was primarily due to higher prepaid airtime sales, more low-margin transaction fees generated from cardholders using the South African National Payment System, more fees generated from our new EPE and ATM offerings, an increase in the number of SASSA UEPS/ EMV beneficiaries paid, a higher contribution from KSNET and more ad hoc terminal sales, partially offset by lower UEPS-loans fees.
In ZAR, the increase in cost of goods sold, IT processing, servicing and support was primarily due to higher expenses incurred from increased usage of the South African National Payment System by beneficiaries, expenses incurred to roll-out our new EPE and ATM offerings and expanding our branch network, and more prepaid airtime sold.
In ZAR, our selling, general and administration expense increased due to a higher staff complement resulting from our EPE roll-out, as well as increases in goods and services purchased from third parties, offset by a $1.9 million fair value gain resulting from the acquisition of Transact24 and a gain of ZAR 30 million ($2.2 million) resulting from the change in accounting for Finbond due to the appointment of our representative to Finbond’s board of directors.
Our operating income margin for fiscal 2016 and 2015 was 19% and 21%, respectively. We discuss the components of operating income margin under “—Results of operations by operating segment.” The decrease is primarily attributable to the higher cost of goods sold, IT processing, servicing and support referred to above and an increase in depreciation expenses.
47
In ZAR, depreciation and amortization increased primarily as a result of an increase in depreciation related to more terminals used to provide transaction processing in Korea, the roll-out of EPE ATMs and an increase in acquisition-related intangible asset amortization resulting from the Transact24 and Masterpayment transactions, all partially offset by lower overall amortization of intangible assets that are now fully amortized.
In ZAR, interest on surplus cash increased to $15.3 million (ZAR 220.0 million) from $16.4 million (ZAR 186.9 million), due primarily to higher average daily ZAR cash balances and ZAR interest rates, partially offset by the lower interest earned on the USD cash reserves that we converted from ZAR through distributions from our South African subsidiary.
Interest expense decreased to $3.4 million (ZAR 49.2 million) from $4.5 million (ZAR 50.9 million), due to a lower average long-term debt balance on our South Korean debt and a lower interest rate.
Fiscal 2016 tax expense was $42.1 million (ZAR 605.3 million) compared to $44.1 million (ZAR 504.4 million) in fiscal 2015. Our effective tax rate for the fiscal 2016, was 33.3% and was higher than the South African statutory rate as a result of non-deductible expenses (including consulting and legal fees) and the tax impact, including withholding taxes, of approximately $6.2 million attributable to distributions from our South African subsidiary. Our effective tax rate for fiscal 2015, was 31.4% and was higher than the South African statutory rate as a result of non-deductible expenses (including consulting and legal).
Results of operations by operating segment
The composition of revenue and the contributions of our business activities to operating income are illustrated below
| Table 5 | In United States Dollars (U.S. GAAP) | ||||||||||||||
| Year ended June 30, | |||||||||||||||
| 2016 | % of | 2015 | % of | % | |||||||||||
| Operating Segment | $ ’000 | total | $ ’000 | total | change | ||||||||||
| Revenue: | |||||||||||||||
| South African transaction processing | 212,574 | 36% | 236,452 | 38% | (10% | ) | |||||||||
| International transaction processing | 169,807 | 29% | 164,554 | 26% | 3% | ||||||||||
| Financial inclusion and applied technologies | 249,403 | 42% | 272,600 | 44% | (9% | ) | |||||||||
| Subtotal: Operating segments | 631,784 | 107% | 673,606 | 108% | (6% | ) | |||||||||
| Intersegment eliminations | (41,035 | ) | (7% | ) | (47,627 | ) | (8% | ) | (14% | ) | |||||
| Consolidated revenue | 590,749 | 100% | 625,979 | 100% | (6% | ) | |||||||||
| Operating income (loss): | |||||||||||||||
| South African transaction processing | 51,386 | 45% | 51,008 | 40% | 1% | ||||||||||
| International transaction processing | 23,389 | 20% | 26,805 | 21% | (13% | ) | |||||||||
| Financial inclusion and applied technologies | 54,999 | 48% | 72,725 | 57% | (24% | ) | |||||||||
| Subtotal: Operating segments | 129,774 | 113% | 150,538 | 118% | (14% | ) | |||||||||
| Corporate/Eliminations | (15,406 | ) | (13% | ) | (22,019 | ) | (18% | ) | (30% | ) | |||||
| Consolidated operating income | 114,368 | 100% | 128,519 | 100% | (11% | ) | |||||||||
| Table 6 | In South African Rand (U.S. GAAP) | ||||||||||||||
| Year ended June 30, | |||||||||||||||
| 2016 | 2015 | ||||||||||||||
| ZAR | % of | ZAR | % of | % | |||||||||||
| Operating Segment | ’000 | total | ’000 | total | change | ||||||||||
| Revenue: | |||||||||||||||
| South African transaction processing | 3,057,707 | 36% | 2,702,055 | 38% | 13% | ||||||||||
| International transaction processing | 2,442,538 | 29% | 1,880,441 | 26% | 30% | ||||||||||
| Financial inclusion and applied technologies | 3,587,463 | 42% | 3,115,137 | 44% | 15% | ||||||||||
| Subtotal: Operating segments | 9,087,708 | 107% | 7,697,633 | 108% | 18% | ||||||||||
| Intersegment eliminations | (590,256 | ) | (7% | ) | (544,258 | ) | (8% | ) | 8% | ||||||
| Consolidated revenue | 8,497,452 | 100% | 7,153,375 | 100% | 19% | ||||||||||
| Operating income (loss): | |||||||||||||||
| South African transaction processing | 739,147 | 45% | 582,894 | 40% | 27% | ||||||||||
| International transaction processing | 336,432 | 20% | 306,314 | 21% | 10% | ||||||||||
| Financial inclusion and applied technologies | 791,117 | 48% | 831,065 | 57% | (5% | ) | |||||||||
| Subtotal: Operating segments | 1,866,696 | 113% | 1,720,273 | 118% | 9% | ||||||||||
| Corporate/Eliminations | (221,603 | ) | (13% | ) | (251,622 | ) | (18% | ) | (12% | ) | |||||
| Consolidated operating income | 1,645,093 | 100% | 1,468,651 | 100% | 12% | ||||||||||
48
South African transaction processing
In ZAR, the increase in segment revenue and operating income was primarily due to higher EPE transaction revenue as a result of increased usage of our ATMs, more low-margin transaction fees generated from card holders using the South African National Payment System, increased inter-segment transaction processing activities, and a modest increase in the number of social welfare grants distributed.
Our operating income margin for fiscal 2016 and 2015 was 24% and 22%, respectively, and has increased primarily due a modest increase in the margin on transaction fees generated from cardholders using the South African National Payment System and to an increase in the number of beneficiaries paid in fiscal 2016.
International transaction-based activities
Revenue increased primarily due to higher transaction volume at KSNET during fiscal 2016 and the inclusion of the contribution from Transact24 and Masterpayment. Operating income during fiscal 2016 was lower due to an increase in depreciation expense and ongoing ZAZOO start-up costs in the United Kingdom and India, but was partially offset by an increase in revenue contribution from KSNET and a positive contribution from Transact24, Masterpayment and XeoHealth.
Operating income and operating income margin for fiscal 2015, were positively impacted by a refund of approximately $1.7 million that had been paid several years ago in connection with industry-wide litigation. Operating income margin for fiscal 2016 and 2015, was 14% and 16%, respectively.
Financial inclusion and applied technologies
In ZAR, Financial inclusion and applied technologies revenue and operating income increased primarily due to higher prepaid airtime and other value-added services sales, more ad hoc terminal and card sales and, in ZAR, an increase in inter-segment revenues, offset by lower lending service fees. Operating income for fiscal 2016, was adversely impacted by establishment costs for Smart Life and expansion of our branch network.
Operating income margin for the Financial inclusion and applied technologies segment was 22% and 27%, during fiscal 2016 and 2015, respectively, and has decreased primarily due to the sale of more low-margin prepaid airtime and establishment costs for Smart Life and expansion of our branch network.
Corporate/ Eliminations
Our corporate expenses generally include acquisition-related intangible asset amortization; expenditure related to compliance with Sarbanes; non-employee directors’ fees; employee and executive bonuses; stock-based compensation; legal fees; audit fees; directors and officers insurance premiums; telecommunications expenses; property-related expenditures including utilities, rental, security and maintenance; and elimination entries.
In USD, our corporate expenses have decreased primarily due to the impact of the stronger USD on goods and services procured in other currencies, primarily the ZAR, lower amortization costs, lower executive cash incentive awards, the fair value gain resulting from the acquisition of Transact24 and the gain resulting from the change in accounting for Finbond, partially offset by modest increases in USD denominated goods and services purchased from third parties and directors’ fees.
- Remainder of this page left blank -
49
Fiscal 2015 Compared to Fiscal 2014
The following factors had an influence on our results of operations during fiscal 2015 as compared with the same period in the prior year:
| • |
Unfavorable impact from the strengthening of the U.S. dollar against the ZAR: The U.S. dollar appreciated by 10% against the ZAR during fiscal 2015 which negatively impacted our reported results; | |
| • |
Continued growth in financial inclusion services: We continued to expand our financial inclusion service offerings during fiscal 2015, which resulted in higher revenues and operating income from more sales of low-margin prepaid airtime and UEPS-based lending; | |
| • |
Increased contribution by KSNET: Our results were positively impacted by growth in our Korean operations; | |
| • |
Increase in the number of SASSA grants paid: Our revenue and operating income increased as a result of the higher number of SASSA UEPS/EMV cardholders paid during fiscal 2015 compared with 2014; | |
| • |
$26.6 million recovery of expenses in fiscal 2014: During fiscal 2014, we received approximately $26.6 million, or approximately $19.1 million, net of tax, from SASSA related to the recovery of additional implementation costs incurred during the beneficiary re-registration process in fiscal 2012 and 2013; | |
| • |
Fair value charge resulting from issue of equity instruments pursuant to BEE transactions in fiscal 2014: The fair value non-cash charge of $11.3 million related to our BEE transactions adversely impacted our reported results during fiscal 2014; and | |
| • |
Lower DOJ and SEC investigation-related expenses: We incurred DOJ and SEC investigation-related expenses of $0.2 million during fiscal 2015 compared to $3.9 million during 2014. |
Consolidated overall results of operations
This discussion is based on the amounts which were prepared in accordance with U.S. GAAP.
The following tables show the changes in the items comprising our statements of operations, both in U.S. dollars and in ZAR:
| In United States Dollars | |||||||||
| Table 7 | (U.S. GAAP) | ||||||||
| Year ended June 30, | |||||||||
| 2015 | 2014 | % | |||||||
| $ ’000 | $ ’000 | change | |||||||
| Revenue | 625,979 | 581,656 | 8% | ||||||
| Cost of goods sold, IT processing, servicing and support | 297,856 | 260,232 | 14% | ||||||
| Selling, general and administration | 158,919 | 168,072 | (5% | ) | |||||
| Equity instruments issued pursuant to BEE transactions | - | 11,268 | nm | ||||||
| Depreciation and amortization | 40,685 | 40,286 | 1% | ||||||
| Operating income | 128,519 | 101,798 | 26% | ||||||
| Interest income | 16,355 | 14,817 | 10% | ||||||
| Interest expense | 4,456 | 7,473 | (40% | ) | |||||
| Income before income taxes | 140,418 | 109,142 | 29% | ||||||
| Income tax expense | 44,136 | 39,379 | 12% | ||||||
| Net income before income from equity-accounted investments | 96,282 | 69,763 | 38% | ||||||
| Income from equity-accounted investments | 452 | 298 | 52% | ||||||
| Net income | 96,734 | 70,061 | 38% | ||||||
| Less (add) net income (loss) attributable to non-controlling interest | 1,999 | (50 | ) | nm | |||||
| Net income attributable to Net1 | 94,735 | 70,111 | 35% | ||||||
- Remainder of this page left blank -
50
| In South African Rand | |||||||||
| Table 8 | (U.S. GAAP) | ||||||||
| Year ended June 30, | |||||||||
| 2015 | 2014 | ||||||||
| ZAR | ZAR | % | |||||||
| ’000 | ’000 | change | |||||||
| Revenue | 7,153,375 | 6,047,244 | 18% | ||||||
| Cost of goods sold, IT processing, servicing and support | 3,403,749 | 2,705,528 | 26% | ||||||
| Selling, general and administration | 1,816,047 | 1,745,784 | 4% | ||||||
| Equity instruments issued pursuant to BEE transactions | - | 118,740 | nm | ||||||
| Depreciation and amortization | 464,928 | 418,838 | 11% | ||||||
| Operating income | 1,468,651 | 1,058,354 | 39% | ||||||
| Interest income | 186,897 | 154,046 | 21% | ||||||
| Interest expense | 50,921 | 77,694 | (34% | ) | |||||
| Income before income taxes | 1,604,627 | 1,134,706 | 41% | ||||||
| Income tax expense | 504,364 | 409,408 | 23% | ||||||
| Net income before income from equity-accounted investments | 1,100,263 | 725,298 | 52% | ||||||
| Income from equity-accounted investments | 5,165 | 3,098 | 67% | ||||||
| Net income | 1,105,428 | 728,396 | 52% | ||||||
| Less (add) net income (loss) attributable to non-controlling interest | 22,844 | (520 | ) | nm | |||||
| Net income attributable to Net1 | 1,082,584 | 728,916 | 49% | ||||||
The increase in revenue was primarily due to higher contributions from our financial inclusion products and growth at KSNET. These increases were offset by the recovery of implementation costs related to our SASSA contract received in 2014.
The increase in cost of goods sold, IT processing, servicing and support was primarily due to higher expenses incurred from increased usage of the South African National Payment System by beneficiaries and more prepaid airtime sold.
In ZAR, our selling, general and administration expense increased due to increases in goods and services purchased from third parties.
Our operating income margin for fiscal 2015 and 2014 was 21% and 18%, respectively. We discuss the components of operating income margin under “—Results of operations by operating segment.” The increase is primarily attributable to higher transaction volumes in South Africa, including prepaid airtime sales, lending and SASSA grants paid.
The grant date fair value of the equity instruments issued pursuant to our December 2014 BEE transactions was $11.3 million (ZAR 118.7 million) and was expensed in full in fiscal 2014.
Depreciation and amortization were higher primarily as a result of an increase in depreciation related to more terminals used to provide transaction processing in Korea and the roll-out of ATMs in South Africa, which was partially offset by no Eason intangible asset amortization as these intangible assets were fully amortized at the end of June 2014.
Interest on surplus cash increased to $16.4 million (ZAR 186.9 million) from $14.8 million (ZAR 154.0 million), due primarily to higher average daily ZAR cash balances.
Interest expense decreased to $4.5 million (ZAR 50.9 million) from $7.5 million (ZAR 77.7 million), due to a lower average long-term debt balance on our South Korean debt and a lower interest rate.
Fiscal 2015 tax expense was $44.1 million (ZAR 504.4 million) compared to $39.4 million (ZAR 409.4 million) in fiscal 2014. Our effective tax rate for fiscal 2015, was 31.4% and was higher than the South African statutory rate as a result of non-deductible expenses (including consulting and legal). Our effective tax rate for the fiscal 2014, was 36.1% and was higher than the South African statutory rate as a result of non-deductible expenses (including the expense related to the equity instruments issued pursuant to our BEE transactions, interest expense related to our long-term South Korean borrowings and stock-based compensation charges).
51
Results of operations by operating segment
The composition of revenue and the contributions of our business activities to operating income are illustrated below
| Table 9 | In United States Dollars (U.S. GAAP) | ||||||||||||||
| Year ended June 30, | |||||||||||||||
| 2015 | % of | 2014 | % of | % | |||||||||||
| Operating Segment | $ ’000 | total | $ ’000 | total | change | ||||||||||
| Revenue: | |||||||||||||||
| South African transaction processing | 236,452 | 38% | 261,577 | 45% | (10% | ) | |||||||||
| International transaction processing | 164,554 | 26% | 152,725 | 26% | 8% | ||||||||||
| Financial inclusion and applied technologies | 272,600 | 44% | 207,595 | 36% | 31% | ||||||||||
| Subtotal: Operating segments | 673,606 | 108% | 621,897 | 107% | 8% | ||||||||||
| Intersegment eliminations | (47,627 | ) | (8% | ) | (40,241 | ) | (7% | ) | 18% | ||||||
| Consolidated revenue | 625,979 | 100% | 581,656 | 100% | 8% | ||||||||||
| Operating income (loss): | |||||||||||||||
| South African transaction processing | 51,008 | 40% | 61,401 | 60% | (17% | ) | |||||||||
| International transaction processing | 26,805 | 21% | 21,952 | 22% | 22% | ||||||||||
| Financial inclusion and applied technologies | 72,725 | 57% | 60,685 | 60% | 20% | ||||||||||
| Subtotal: Operating segments | 150,538 | 118% | 144,038 | 142% | 5% | ||||||||||
| Corporate/Eliminations | (22,019 | ) | (18% | ) | (42,240 | ) | (42% | ) | (48% | ) | |||||
| Consolidated operating income | 128,519 | 100% | 101,798 | 100% | 26% | ||||||||||
| Table 10 | In South African Rand (U.S. GAAP) | ||||||||||||||
| Year ended June 30, | |||||||||||||||
| 2015 | 2014 | ||||||||||||||
| ZAR | % of | ZAR | % of | % | |||||||||||
| Operating Segment | ’000 | total | ’000 | total | change | ||||||||||
| Revenue: | |||||||||||||||
| South African transaction processing | 2,702,055 | 38% | 2,719,511 | 45% | (1% | ) | |||||||||
| International transaction processing | 1,880,441 | 26% | 1,587,821 | 26% | 18% | ||||||||||
| Financial inclusion and applied technologies | 3,115,137 | 44% | 2,158,282 | 36% | 44% | ||||||||||
| Subtotal: Operating segments | 7,697,633 | 108% | 6,465,614 | 107% | 19% | ||||||||||
| Intersegment eliminations | (544,258 | ) | (8% | ) | (418,370 | ) | (7% | ) | 30% | ||||||
| Consolidated revenue | 7,153,375 | 100% | 6,047,244 | 100% | 18% | ||||||||||
| Operating income (loss): | |||||||||||||||
| South African transaction processing | 582,894 | 40% | 638,362 | 60% | (9% | ) | |||||||||
| International transaction processing | 306,314 | 21% | 228,226 | 22% | 34% | ||||||||||
| Financial inclusion and applied technologies | 831,065 | 57% | 630,918 | 60% | 32% | ||||||||||
| Subtotal: Operating segments | 1,720,273 | 118% | 1,497,506 | 142% | 15% | ||||||||||
| Corporate/Eliminations | (251,622 | ) | (18% | ) | (439,152 | ) | (42% | ) | (43% | ) | |||||
| Consolidated operating income | 1,468,651 | 100% | 1,058,354 | 100% | 39% | ||||||||||
South African transaction processing
In ZAR, revenue increased in fiscal 2015 compared to fiscal 2014 (after excluding the impact of the recovery in fiscal 2014 of implementation costs related to our SASSA contract). The increase in segment revenues exclusive of such recovery was primarily due to more low-margin transaction fees generated from beneficiaries using the South African National Payment System and more inter-segment transaction processing activities. In addition, revenue from the distribution of social welfare grants grew modestly during the year and was in-line with the increase in unique welfare cardholder recipients, net of removal of invalid and fraudulent beneficiaries, offset by the loss of MediKredit revenue as a result of the sale of that business.
Our operating income margin for fiscal 2015 and 2014 was 22% and 23%, respectively. Our operating margin for fiscal 2014 was positively impacted by the recovery of implementation costs related to our SASSA contract. Excluding the impact of this $26.6 million recovery from SASSA, our operating income margin for fiscal 2014 was 15%. Our fiscal 2015 operating income margin is higher than our adjusted fiscal 2014 operating income margin (of 15%) due to more higher-margin inter-segment transaction processing activities, the elimination of MediKredit losses and an increase in the number of beneficiaries paid in fiscal 2015.
52
International transaction-based activities
Revenue increased primarily due to higher transaction volume at KSNET during fiscal 2015. Operating income during fiscal 2015 was higher due to increase in revenue contribution from KSNET, but partially offset by ZAZOO start-up costs in the United Kingdom and India. Operating income and margin for fiscal 2015, was also positively impacted by a refund of approximately $1.7 million that had been paid several years ago in connection with industry-wide litigation that has now been finalized. Operating income margin for fiscal 2015 and 2014 was 16% and 14%, respectively, and was higher in fiscal 2015 primarily due to the refund referred to above.
Financial inclusion and applied technologies
Financial inclusion and applied technologies revenue and operating income increased primarily due to higher prepaid airtime sales driven by the rollout of our prepaid airtime product, an increase in the number of UEPS-based loans as we rolled out our product nationally, and, in ZAR, an increase in intersegment revenues. Fiscal 2014 operating income includes expenses related to the national rollout of our UEPS-based lending offering and the establishment of the allowance for doubtful finance loans in fiscal 2014. Smart Life did not contribute to operating income in fiscal 2015 and 2014 due to the FSB suspension of its license.
Notwithstanding the national rollout expenses incurred in fiscal 2014, operating income margin for the Financial inclusion and applied technologies segment decreased to 27% from 29%, primarily as a result of more low-margin prepaid airtime and the sale of competitively-priced financial inclusion products to address the needs of the broader market.
Corporate/ Eliminations
The decrease in our corporate expenses was primarily due to the non-cash charge in fiscal 2014 related to the equity instruments issued pursuant to our BEE transactions, lower U.S. government investigations-related and U.S. lawsuit expenses, audit fees and other corporate head office-related expenses.
Our corporate expenses also include acquisition-related intangible asset amortization; expenditure related to compliance with Sarbanes; non-employee directors’ fees; employee and executive bonuses; stock-based compensation; audit fees; directors and officers insurance premiums; telecommunications expenses; property-related expenditures including utilities, rental, security and maintenance; and elimination entries.
Liquidity and Capital Resources
At June 30, 2016, our cash balances were $223.6 million, which comprised U.S. dollar-denominated balances of $125.7 million, ZAR-denominated balances of ZAR 1.1 billion ($72.4 million), KRW-denominated balances of KRW 19.5 billion ($16.9 million) and other currency deposits, primarily euro, of $8.6 million. The increase in our cash balances from June 30, 2015, was primarily due to the cash received from issue of our common stock to the IFC Investors and the expansion of all of our core businesses, partially offset by the strengthening of the U.S. dollar against our primary functional currencies, repurchase of shares of our common stock, provisional tax payments, acquisitions and capital expenditures.
We currently believe that our cash and credit facilities are sufficient to fund our future operations for at least the next four quarters.
We generally invest the surplus cash held by our South African operations in overnight call accounts that we maintain at South African banking institutions, and surplus cash held by our non-South African companies in the U.S. and other money markets. We have invested surplus cash in South Korea in short-term investment accounts at South Korean banking institutions.
Historically, we have financed most of our operations, research and development, working capital, capital expenditures and acquisitions through our internally generated cash. When considering whether to borrow under our financing facilities, we consider the cost of capital, cost of financing, opportunity cost of utilizing surplus cash and availability of tax efficient structures to moderate financing costs.
We have a short-term South African credit facility with Nedbank Limited of ZAR 400 million ($27.1 million), which consists of (i) a primary amount of up to ZAR 200 million, which is immediately available, and (ii) a secondary amount of up to ZAR 200 million, which is not immediately available. The primary amounts comprises an overdraft facility of up to ZAR 50 million and indirect and derivative facilities of up to ZAR 150 million, which includes letters of guarantee, letters of credit and forward exchange contracts.
As of June 30, 2016, we have used none of the overdraft and ZAR 131.1 million ($8.9 million) of the indirect and derivative facilities to obtain foreign exchange contracts and to support guarantees issued by Nedbank to various third parties on our behalf. Refer to Note 12 to the consolidated financial statements for more information about the terms of this facility.
53
As of June 30, 2016, we had outstanding long-term debt of KRW 59.7 billion (approximately $51.8 million translated at exchange rates applicable as of June 30, 2016) under credit facilities with a group of South Korean banks. The loans bear interest at the South Korean CD rate in effect from time to time (1.61% as of June 30, 2016) plus a margin of 3.10% for one of the term loan facilities and the revolver and a margin of 2.90% for the other term loan facility. We made a scheduled repayment of KRW 10 billion ($8.7 million) on April 29, 2016. Scheduled remaining repayments of the term loans and loan under the revolving credit facility are as follows: April 2017 and 2018 (KRW 10 billion each) and October 2018 (KRW 30 billion plus all outstanding loans under our revolving credit facility).
On July 29, 2016, we prepaid KRW 20 billion ($17.3 million) of the Facility A loan and KRW 10 billion ($8.7 million) of our Facility C revolving credit facility; both prepayments were translated at exchange rates applicable as of June 30, 2016. Following the subsequent unscheduled debt repayments, we had outstanding long-term debt of KRW 30.0 billion (approximately $26.0 million translated at exchange rates applicable as of June 30, 2016). Refer to Note 13 to the consolidated financial statements for more information about the terms of this facility.
We have a unique cash flow cycle due to the funding mechanism under our SASSA contact and our pre-funding of certain merchants. We generally receive the grant funds 48 hours prior to the provision of the service in a trust account and any interest we earn on these amounts is for the benefit of SASSA. We are required to initiate payments before the start of the pay cycle month in order to have cash, merchant and interbank funds available when the payment cycle commences and this process requires that we have access to the grant funds to be paid. These funds are recorded as settlement assets and liabilities. Historically, we opened the pay cycle at certain participating merchants a few days before the payment of grants at pay sites, however, currently we do not commence the payment cycle at participating merchants before the start of the pay cycle month.
We use our funds to pre-fund certain merchants for grants paid through our merchant acquiring system on our behalf a day or two before the pay cycle opens. We typically reimburse merchants that are not pre-funded within 48 hours after they distribute the grants to the social welfare recipient cardholders.
In addition, as a transaction processor, we receive cash from:
• customers on whose behalf we processes off-payroll payments that we will disburse to customer employees, payroll-related payees and other payees designated by the customer; and
• credit card companies (as well as other types of payment services) which have business relationships with merchants selling goods and services via the internet in South Korea and through Transact24 that are our customers and on whose behalf we process the transactions between various parties and settle the funds from the credit card companies to our merchant customers.
These funds do not represent cash that is available to us and we present these funds, and the associated liability, outside of our current assets and liabilities on our consolidated balance sheet. Movements in these cash balances are presented in investing activities and movements in the obligations are presented in financing activities in our consolidated statement of cash flows.
Cash flows from operating activities
In ZAR, cash flows from operating activities for fiscal 2016 increased to $116.6 million (ZAR 1.7 billion) from $135.3 million (ZAR 1.5 billion) for fiscal 2015. Excluding the impact of interest received, interest paid under our Korean debt and taxes presented in the table below, the increase in cash from operating activities resulted from improved trading activity during fiscal 2016. During fiscal 2016, we paid interest of $3.3 million under our South Korean debt facility.
Cash flows from operating activities for fiscal 2015 increased to $135.3 million (ZAR 1.5 billion) from $37.1 million (ZAR 386.2 million) for fiscal 2014. Excluding the impact of interest received, interest paid under our Korean debt and taxes presented in the table below, the increase in cash from operating activities resulted from improved trading activity during fiscal 2015. During fiscal 2015, we paid interest of $3.6 million under our South Korean debt facility.
During fiscal 2016, we made a first provisional tax payment of $16.0 million (ZAR 239.9 million) and a second provisional tax payment of $13.7 million (ZAR 207.3 million) related to our 2016 tax year in South Africa. We paid dividend withholding taxes of $4.2 million (ZAR 60.0 million). We also paid taxes totaling $5.0 million in other tax jurisdictions, primarily South Korea.
During fiscal 2015, we made a first provisional tax payment of $18.9 million (ZAR 217.2 million) and a second provisional tax payment of $16.2 million (ZAR 199.8 million) related to our 2015 tax year in South Africa. We also paid taxes totaling $7.6 million in other tax jurisdictions, primarily South Korea.
54
Taxes paid during fiscal 2016, 2015 and 2014 were as follows:
| Table 11 | Year ended June 30, | |||||||||||||||||
| 2016 | 2015 | 2014 | 2016 | 2015 | 2014 | |||||||||||||
| $ | $ | $ | ZAR | ZAR | ZAR | |||||||||||||
| ‘000 | ‘000 | ‘000 | ‘000 | ‘000 | ‘000 | |||||||||||||
| First provisional payments | 15,956 | 18,910 | 13,292 | 239,939 | 217,241 | 137,773 | ||||||||||||
| Second provisional payments | 13,733 | 16,234 | 25,004 | 207,329 | 199,779 | 266,573 | ||||||||||||
| Taxation paid related to prior years | 3,436 | 2,408 | 228 | 46,840 | 26,395 | 2,360 | ||||||||||||
| Taxation refunds received | (176 | ) | (468 | ) | (36 | ) | (2,402 | ) | (5,396 | ) | (400 | ) | ||||||
| Dividend withholding taxation | 4,183 | 737 | - | 60,000 | 8,702 | - | ||||||||||||
| Total South African | 37,132 | 37,821 | 38,488 | 551,706 | 446,721 | 406,306 | ||||||||||||
| Foreign, primarily South Korea | 4,991 | 7,638 | 3,929 | 74,844 | 86,857 | 41,506 | ||||||||||||
| Total tax paid | 42,123 | 45,459 | 42,417 | 626,550 | 533,578 | 447,812 | ||||||||||||
We expect to pay additional second provisional payments in South Africa of approximately $1.1 million (ZAR 15.9 million translated at exchange rates applicable as of June 30, 2016) related to our 2016 tax year in the first quarter of fiscal 2017.
Cash flows from investing activities
Cash used in investing activities for fiscal 2016 includes capital expenditure of $35.8 million (ZAR 514.9 million), primarily for the acquisition of payment processing terminals in Korea and the rollout of ATMs in South Africa.
Cash used in investing activities for fiscal 2015 includes capital expenditure of $36.4 million (ZAR 416.4 million), primarily for the acquisition of payment processing terminals in Korea and the rollout of ATMs in South Africa.
Cash used in investing activities for fiscal 2014 includes capital expenditure of $23.9 million (ZAR 248.5 million), primarily for the acquisition of payment processing terminals in South Korea.
We paid approximately $14.8 million and $1.7 million, respectively, net of cash received, to acquire 60% of Masterpayment and approximately 56% of Transact24’s ordinary shares. We also exercised our rights under the Finbond rights offer and paid approximately $8.9 million (ZAR 136.1 million) to acquire an additional 40,733,723 shares of common stock of Finbond.
During fiscal 2015, we paid $13.2 million for non-controlling interests in businesses based in Nigeria and Hong Kong.
Cash flows from financing activities
During fiscal 2016, we received approximately $107.7 million from the issue of 9,984,311 shares of our common stock and approximately $3.8 million from the exercise of stock options. We made scheduled Korean long-term debt repayments of approximately $8.7 million, and utilized approximately $2.1 million of our Korean borrowings to pay quarterly interest due. We also acquired 2,426,704 shares of our common stock and paid approximately $26.6 million during fiscal 2016 and the remaining $0.5 million on July 1, 2016, related to these repurchases and, in June 2016, paid approximately $11.2 million for all of the shares of Masterpayment that we did not already own.
During fiscal 2015, we made a scheduled Korean debt repayment of $14.1 million, repurchased BVI’s remaining 1,837,432 shares of Net1 common stock for approximately $9.2 million, received $1.4 million from BVI for 12.5% of CPS’ issued and outstanding ordinary shares and paid a dividend of $1.0 million to certain of our non-controlling interests. We also utilized approximately $3.8 million of our Korean borrowings to pay quarterly interest due and received approximately $2.0 million from the exercise of stock options.
During fiscal 2014, we refinanced our South Korean debt and used $70.6 million of these new borrowings and $16.4 million of our surplus cash to repay the $87.0 million due under our old facility. In addition, we paid the facility fees related to our new South Korean borrowings of approximately $0.9 million. During fiscal 2014, we utilized approximately $2.1 million of these new borrowings to pay quarterly interest due in South Korea.
During fiscal 2014, we paid approximately $2.0 million for substantially all of the shares of KSNET that we did not already own. We utilized our South African short-term facility during fiscal 2014 and have repaid the full amount outstanding as of June 30, 2014.
55
Off-Balance Sheet Arrangements
We have no off-balance sheet arrangements.
Capital Expenditures
Capital expenditures for the years ended June 30, 2016, 2015 and 2014 were as follows:
| Table 12 | Year ended June 30, | |||||||||||||||||
| 2016 | 2015 | 2014 | 2016 | 2015 | 2014 | |||||||||||||
| $ | $ | $ | ZAR | ZAR | ZAR | |||||||||||||
| Operating Segment | ’000 | ’000 | ’000 | ’000 | ’000 | ’000 | ||||||||||||
| South African transaction processing | 5,101 | 7,008 | 3,425 | 73,374 | 80,084 | 35,608 | ||||||||||||
| International transaction processing | 28,029 | 28,205 | 19,393 | 403,174 | 322,312 | 201,621 | ||||||||||||
| Financial inclusion and applied technologies | 2,667 | 1,223 | 1,088 | 38,363 | 13,976 | 11,312 | ||||||||||||
| Consolidated total | 35,797 | 36,436 | 23,906 | 514,911 | 416,372 | 248,541 | ||||||||||||
Our capital expenditures for fiscal 2016, 2015 and 2014, are discussed under “—Liquidity and Capital Resources—Cash flows from investing activities.”
All of our capital expenditures for the past three fiscal years were funded through internally-generated funds. We had outstanding capital commitments as of June 30, 2016, of $0.1 million related mainly to computer equipment required to maintain and expand operations. We expect to fund these expenditures through internally-generated funds. In addition to these capital expenditures, we expect that capital spending for fiscal 2017 will also relate to expanding our operations in South Korea and South Africa.
Contractual Obligations
The following table sets forth our contractual obligations as of June 30, 2016:
| Table 13 | Payments due by Period, as of June 30, 2016 (in $ ’000s) | ||||||||||||||
| Less | More | ||||||||||||||
| than 1 | 1-3 | 3-5 | than 5 | ||||||||||||
| Total | year | years | years | years | |||||||||||
| Long-term debt obligations (A) | 57,092 | 11,454 | 45,638 | - | - | ||||||||||
| Operating lease obligations | 9,471 | 5,334 | 4,048 | 89 | - | ||||||||||
| Purchase obligations | 3,086 | 3,086 | - | - | - | ||||||||||
| Capital commitments | 88 | 88 | - | - | - | ||||||||||
| Other long-term obligations (B) | 2,376 | - | - | - | 2,376 | ||||||||||
| Total | 72,113 | 19,962 | 49,686 | 89 | 2,376 | ||||||||||
| (A) |
– Includes $51.8 million of long-term debt discussed under “—Liquidity and capital resources” and includes interest payable at the rate applicable as of June 30, 2016. | |
| (B) |
– Includes policy holder liabilities of $1.6 million related to our insurance business. | |
| (C) |
– We have excluded cross-guarantees in the aggregate amount of $8.6 million issued as of June 30, 2016, to Nedbank to secure guarantees it has issued to third parties on our behalf as the amounts that will be settled in cash are not known and the timing of any payments is uncertain. |
56
ITEM 7A. QUANTITATIVE AND QUALITATIVE DISCLOSURES ABOUT MARKET RISK
We seek to reduce our exposure to currencies other than the South African rand, or ZAR, through a policy of matching, to the extent possible, assets and liabilities denominated in those currencies. In addition, we use financial instruments to economically hedge our exposure to exchange rate and interest rate fluctuations arising from our operations. We are also exposed to equity price and liquidity risks as well as credit risks.
Currency Exchange Risk
We are subject to currency exchange risk because we purchase inventories that we are required to settle in other currencies, primarily the euro and U.S. dollar. We have used forward contracts to limit our exposure in these transactions to fluctuations in exchange rates between the ZAR, on the one hand, and the U.S. dollar and the euro, on the other hand. As of June 30, 2016, and 2015, our outstanding foreign exchange contracts were as follows:
As of June 30, 2016
| Fair market | ||||
| Notional amount | Strike price | value price | Maturity | |
| EUR 573,765.00 | ZAR 15.9587 | ZAR 16.3393 | July 20, 2016 | |
| EUR 554,494.50 | ZAR 16.0643 | ZAR 16.4564 | August 19, 2016 | |
| EUR 465,711.00 | ZAR 16.1798 | ZAR 16.582 | September 20, 2016 | |
| EUR 393,675.00 | ZAR 16.2911 | ZAR 16.7017 | October 20, 2016 | |
| EUR 302,368.50 | ZAR 16.4085 | ZAR 16.8301 | November 21, 2016 |
As of June 30, 2015
| Fair market | ||||
| Notional amount | Strike price | value price | Maturity | |
| EUR 526,263.00 | ZAR 15.1145 | ZAR 13.6275 | July 20, 2015 | |
| EUR 526,263.00 | ZAR 15.2025 | ZAR 13.7062 | August 20, 2015 | |
| EUR 526,263.00 | ZAR 15.2944 | ZAR 13.7898 | September 21, 2015 | |
| EUR 526,263.00 | ZAR 15.3809 | ZAR 13.8683 | October 20, 2015 | |
| EUR 509,516.00 | ZAR 15.4728 | ZAR 13.9540 | November 20, 2015 | |
| EUR 529,865.00 | ZAR 15.5654 | ZAR 14.0397 | December 21, 2015 | |
| EUR 526,663.00 | ZAR 15.6625 | ZAR 14.1239 | January 20, 2016 |
Translation Risk
Translation risk relates to the risk that our results of operations will vary significantly as the U.S. dollar is our reporting currency, but we earn most of our revenues and incur most of our expenses in ZAR. The U.S. dollar to ZAR exchange rate has fluctuated significantly over the past three years. As exchange rates are outside our control, there can be no assurance that future fluctuations will not adversely affect our results of operations and financial condition.
Interest Rate Risk
As a result of our normal borrowing and leasing activities, our operating results are exposed to fluctuations in interest rates, which we manage primarily through our regular financing activities. In addition, outstanding indebtedness under our long-term South Korean debt facilities bear interest at the South Korean CD rate plus 3.10% and 2.90%, respectively. As interest rates, and specifically the South Korean CD rate, are outside our control, there can be no assurance that future increases in interest rates, specifically the South Korean CD rate, will not adversely affect our results of operations and financial condition. As of June 30, 2016, the South Korean CD rate was 1.61% .
57
The following table illustrates the effect on our annual expected interest charge, translated at exchange rates applicable as of June 30, 2016, as a result of a change in the South Korean CD rate. The effects of a hypothetical 1% (i.e. 100 basis points) increase and a 1% decrease in the South Korean CD rate as of June 30, 2016, is shown. The selected 1% hypothetical change does not reflect what could be considered the best or worst case scenarios.
| As of June 30, 2016 | |||||||||
| Table 14 | Estimated | ||||||||
| annual | |||||||||
| expected | |||||||||
| Annual | Hypothetical | interest charge | |||||||
| expected | change in | after change in | |||||||
| interest | South | South Korean | |||||||
| charge | Korean CD | CD rate | |||||||
| ($ ’000) | rate | ($ ’000) | |||||||
| Interest on debt facility | 2,440 | 1% | 2,958 | ||||||
| (1% | ) | 1,922 | |||||||
We generally maintain limited investment in cash equivalents and have occasionally invested in marketable securities. The interest earned on our bank balances and short term cash investments is dependent on the prevailing interest rates in the jurisdictions where our cash reserves are invested.
Credit Risk
Credit risk relates to the risk of loss that we would incur as a result of non-performance by counterparties. We maintain credit risk policies with regard to our counterparties to minimize overall credit risk. These policies include an evaluation of a potential counterparty’s financial condition, credit rating, and other credit criteria and risk mitigation tools as our management deems appropriate.
With respect to credit risk on financial instruments, we maintain a policy of entering into such transactions only with South African and European financial institutions that have a credit rating of BBB or better, as determined by credit rating agencies such as Standard & Poor’s, Moody’s and Fitch Ratings.
UEPS-based microlending credit risk
We are exposed to credit risk in our UEPS-based microlending activities, which provides unsecured short-term loans to qualifying customers. We manage this risk by performing an affordability test for each prospective customer and assign a “creditworthiness score”, which takes into account a variety of factors such as other debts and total expenditures on normal household and lifestyle expenses.
Equity Price and Liquidity Risk
Equity price risk relates to the risk of loss that we would incur as a result of the volatility in the exchange-traded price of equity securities that we hold and the risk that we may not be able to liquidate these securities. We have invested in approximately 26% of the issued share capital of Finbond which are exchange-traded equity securities and from April 1, 2016, accounted for using the equity method. The fair value of these securities as of June 30, 2016, represented approximately 1% of our total assets, including these securities. We expect to hold these securities for an extended period of time and we are not concerned with short-term equity price volatility with respect to these securities provided that the underlying business, economic and management characteristics of the company remain sound.
The market price of these securities may fluctuate for a variety of reasons, consequently, the amount we may obtain in a subsequent sale of these securities may significantly differ from the reported market value.
Liquidity risk relates to the risk of loss that we would incur as a result of the lack of liquidity on the exchange on which these securities are listed. We may not be able to sell some or all of these securities at one time, or over an extended period of time without influencing the exchange traded price, or at all. We monitor these investments for impairment and make appropriate reductions in carrying value when an impairment is deemed to be other-than-temporary.
58
ITEM 8. FINANCIAL STATEMENTS AND SUPPLEMENTARY DATA
Our consolidated financial statements, together with the report of our independent registered public accounting firm, appear on pages F-1 through F-58 of this Annual Report on Form 10-K.
ITEM 9. CHANGES IN AND DISAGREEMENTS WITH ACCOUNTANTS ON ACCOUNTING AND FINANCIAL DISCLOSURE
Not applicable.
ITEM 9A. CONTROLS AND PROCEDURES
Evaluation of disclosure controls and procedures
Under the supervision and with the participation of our management, including our chief executive officer and our chief financial officer, we conducted an evaluation of our disclosure controls and procedures, as such term is defined under Rule 13a-15(e) under the Securities Exchange Act of 1934. Based on this evaluation, the chief executive officer and the chief financial officer concluded that our disclosure controls and procedures were effective as of June 30, 2016.
Internal Control over Financial Reporting
Internal control over financial reporting is a process designed by, or under the supervision of, the company’s chief executive officer and chief financial officer, or persons performing similar functions, and effected by the company’s board of directors, management, and other personnel, to provide reasonable assurance regarding the reliability of financial reporting and the preparation of financial statements for external purposes in accordance with U.S. GAAP.
Internal control over financial reporting includes those policies and procedures that (1) pertain to the maintenance of records that, in reasonable detail, accurately and fairly reflect the transactions and dispositions of the assets of the company; (2) provide reasonable assurance that transactions are recorded as necessary to permit preparation of financial statements in accordance with U.S. GAAP, and that receipts and expenditures of the company are being made only in accordance with authorizations of management and directors of the company; and (3) provide reasonable assurance regarding prevention or timely detection of unauthorized acquisition, use or disposition of the company’s assets that could have a material effect on the consolidated financial statements.
Inherent Limitations in Internal Control over Financial Reporting
Internal control over financial reporting cannot provide absolute assurance of achieving financial reporting objectives because of its inherent limitations. Internal control over financial reporting is a process that involves human diligence and compliance and is subject to lapses in judgment and breakdowns resulting from human failures. Internal control over financial reporting also can be circumvented by collusion or improper management override. Because of such limitations, there is a risk that material misstatements may not be prevented or detected on a timely basis by internal control over financial reporting. However, these inherent limitations are known features of the financial reporting process. Therefore, it is possible to design into the process safeguards to reduce, though not eliminate, this risk.
Management’s Report on Internal Control Over Financial Reporting
Management, including our chief executive officer and our chief financial officer, is responsible for establishing and maintaining adequate internal control over our financial reporting. Management conducted an evaluation of the effectiveness of internal control over financial reporting based on the Internal Control – Integrated Framework issued by the Committee of Sponsoring Organizations of the Treadway Commission in 2013. Based on this evaluation, management concluded that our internal control over financial reporting was effective as of June 30, 2016. Deloitte & Touche (South Africa), our independent registered public accounting firm, has issued an audit report on our internal control over financial reporting.
Changes in Internal Control over Financial Reporting
There were no changes in our internal control over financial reporting during the most recent fiscal quarter ended June 30, 2016, that have materially affected, or are reasonably likely to materially affect, our internal control over financial reporting.
59
REPORT OF INDEPENDENT REGISTERED PUBLIC ACCOUNTING FIRM
To the Board of Directors and Shareholders of Net 1 UEPS
Technologies, Inc.
Johannesburg, South Africa
We have audited the internal control over financial reporting of Net 1 UEPS Technologies, Inc. and subsidiaries (the "Company") as of June 30, 2016, based on criteria established in Internal Control — Integrated Framework (2013) issued by the Committee of Sponsoring Organizations of the Treadway Commission. The Company's management is responsible for maintaining effective internal control over financial reporting and for its assessment of the effectiveness of internal control over financial reporting, included in the accompanying Management’s Report on Internal Control Over Financial Reporting. Our responsibility is to express an opinion on the Company's internal control over financial reporting based on our audit.
We conducted our audit in accordance with the standards of the Public Company Accounting Oversight Board (United States). Those standards require that we plan and perform the audit to obtain reasonable assurance about whether effective internal control over financial reporting was maintained in all material respects. Our audit included obtaining an understanding of internal control over financial reporting, assessing the risk that a material weakness exists, testing and evaluating the design and operating effectiveness of internal control based on the assessed risk, and performing such other procedures as we considered necessary in the circumstances. We believe that our audit provides a reasonable basis for our opinion.
A company's internal control over financial reporting is a process designed by, or under the supervision of, the company's principal executive and principal financial officers, or persons performing similar functions, and effected by the company's board of directors, management, and other personnel to provide reasonable assurance regarding the reliability of financial reporting and the preparation of financial statements for external purposes in accordance with generally accepted accounting principles. A company's internal control over financial reporting includes those policies and procedures that (1) pertain to the maintenance of records that, in reasonable detail, accurately and fairly reflect the transactions and dispositions of the assets of the company; (2) provide reasonable assurance that transactions are recorded as necessary to permit preparation of financial statements in accordance with generally accepted accounting principles, and that receipts and expenditures of the company are being made only in accordance with authorizations of management and directors of the company; and (3) provide reasonable assurance regarding prevention or timely detection of unauthorized acquisition, use, or disposition of the company's assets that could have a material effect on the financial statements.
Because of the inherent limitations of internal control over financial reporting, including the possibility of collusion or improper management override of controls, material misstatements due to error or fraud may not be prevented or detected on a timely basis. Also, projections of any evaluation of the effectiveness of the internal control over financial reporting to future periods are subject to the risk that the controls may become inadequate because of changes in conditions, or that the degree of compliance with the policies or procedures may deteriorate.
In our opinion, the Company maintained, in all material respects, effective internal control over financial reporting as of June 30, 2016, based on the criteria established in Internal Control—Integrated Framework (2013) issued by the Committee of Sponsoring Organizations of the Treadway Commission.
We have also audited, in accordance with the standards of the Public Company Accounting Oversight Board (United States), the consolidated financial statements as of and for the year ended June 30, 2016 of the Company and our report dated August 25, 2016, expressed an unqualified opinion on those financial statements.
/s/ Deloitte & Touche
Registered Auditors
Johannesburg, South Africa
August 25, 2016
National Executive: *LL Bam Chief Executive Officer *TMM Jordan Deputy Chief Executive Officer *MJ Jarvis Chief Operating Officer *GM Pinnock Audit *N Sing Risk Advisory *NB Kader Tax TP Pillay Consulting S Gwala BPaas *K Black Clients & Industries *JK Mazzocco Talent & Transformation *MJ Comber Reputation & Risk *TJ Brown Chairman of the Board
| A full list of partners and directors is available on request | *Partner and Registered Auditor |
60
ITEM 9B. OTHER INFORMATION
None.
- Remainder of this page left blank -
61
PART III
ITEM 10. DIRECTORS, EXECUTIVE OFFICERS AND CORPORATE GOVERNANCE
Information about our executive officers is set out in Part I, Item 1 under the caption “Executive Officers and Significant Employees of the Registrant.” The other information required by this Item is incorporated by reference to the sections of our definitive proxy statement for our 2016 annual meeting of shareholders entitled “Board of Directors and Corporate Governance” and “Additional Information.”
ITEM 11. EXECUTIVE COMPENSATION
The information required by this Item is incorporated by reference to the sections of our definitive proxy statement for our 2016 annual meeting of shareholders entitled “Executive Compensation,” “Board of Directors and Corporate Governance—Compensation of Directors” and “—Remuneration Committee Interlocks and Insider Participation.”
ITEM 12. SECURITY OWNERSHIP OF CERTAIN BENEFICIAL OWNERS AND MANAGEMENT AND RELATED STOCKHOLDER MATTERS
The information required by this Item is incorporated by reference to the sections of our definitive proxy statement for our 2016 annual meeting of shareholders entitled “Security Ownership of Certain Beneficial Owners and Management” and “Equity Compensation Plan Information.”
ITEM 13. CERTAIN RELATIONSHIPS AND RELATED TRANSACTIONS, AND DIRECTOR INDEPENDENCE
The information required by this Item is incorporated by reference to the sections of our definitive proxy statement for our 2016 annual meeting of shareholders entitled “Certain Relationships and Related Transactions” and “Board of Directors and Corporate Governance.”
ITEM 14. PRINCIPAL ACCOUNTANT FEES AND SERVICES
The information required by this Item is incorporated by reference to the sections of our definitive proxy statement for our 2016 annual meeting of shareholders entitled “Audit and Non-Audit Fees.”
62
PART IV
ITEM 15. EXHIBITS AND FINANCIAL STATEMENT SCHEDULES
| a) |
The following documents are filed as part of this report |
1. Financial Statements
The following financial statements are included on pages F-1 through F-58.
2. Financial Statement Schedules
Financial statement schedules have been omitted since they are either not required, not applicable, or the information is otherwise included.
(b) Exhibits
| Incorporated by Reference Herein | |||||
| Exhibit | Included | ||||
| No. | Description of Exhibit | Herewith | Form | Exhibit | Filing Date |
| 3.1 | Amended and Restated Articles of Incorporation | 8-K | 3.1 | December 1, 2008 | |
| 3.2 | Amended and Restated By-Laws of Net 1 UEPS Technologies, Inc. | 8-K | 3.2 | November 5, 2009 | |
| 4.1 | Form of common stock certificate | S-1 | 4.1 | June 20, 2005 | |
| 10.1 | Distribution Agreement, dated July 1, 2002, between Net 1 UEPS Technologies, Inc. and Net 1 Investment Holdings (Pty) Limited | S-4 | 10.1 | February 3, 2004 | |
| 10.2 | Patent and Technology Agreement, dated June 19, 2000, by and between Net 1 Holdings S.a.r.1. and Net 1 UEPS Technologies, Inc. | S-4 | 10.2 | February 3, 2004 | |
| 10.3 | Technology License Agreement between Net 1 Investment Holdings (Proprietary) Limited and Visa International Service Association | S-1 | 10.12 | May 26, 2005 | |
| 10.4 | Product License Agreement between Net 1 Holdings S.a.r.1. and Net 1 Operations S.a.r.1. | S-4/A | 10.8 | April 21, 2004 | |
| 10.5 | Non Exclusive UEPS License Agreement between Net 1 Investment Holdings (Proprietary) Limited and SIA Netcards | S-4/A | 10.10 | April 21, 2004 | |
| 10.6 | Assignment of Copyright and License of Patents and Trade Marks between MetroLink (Proprietary) Limited and Net 1 Products (Proprietary) Limited | S-1 | 10.18 | May 26, 2005 | |
| 10.7 | Agreement between Nedcor Bank Limited and Net 1 Products (Proprietary) Limited | S-1/A | 10.16 | July 19, 2005 | |
| 10.8 | Patent and Technology Agreement by and among Net 1 Investment Holdings (Proprietary) Limited, Net 1 Applied Technology Holding Limited and Nedcor Bank Limited | S-1 | 10.19 | May 26, 2005 | |
63
| 10.9 |
Patent and Technology Agreement by and among Net 1 Holdings S.a.r.1., Net 1 Applied Technology Holdings Limited and Nedcor Bank Limited |
S-1/A | 10.19 | July 19, 2005 | |
| 10.10 |
Agreement by and among Nedbank Limited, Net 1 UEPS Technologies, Inc., and Net 1 Applied Technologies South Africa Limited |
S-1/A | 10.20 | July 19, 2005 | |
| 10.11* |
Form of Restricted Stock Agreement |
10-K | 10.13 | August 23, 2012 | |
| 10.12* |
Form of Stock Option Agreement |
10-K | 10.14 | August 23, 2012 | |
| 10.13* |
Form of Restricted Stock Agreement (non- employee directors) |
10-K | 10.15 | August 23, 2012 | |
| 10.14 |
Form of Option issued by the Company to Business Venture Investments No 1567 (Proprietary) Limited (RF) |
8-K | 99.2 | January 26, 2012 | |
| 10.15 |
Contract for the Payment of Social Grants dated February 3, 2012 between CPS and SASSA |
8-K | 99.1 | February 6, 2012 | |
| 10.16 |
Service Level Agreement dated February 3, 2012 between CPS and SASSA |
8-K | 99.2 | February 6, 2012 | |
| 10.17 |
Agreement of Lease, Memorandum of an agreement entered into by and between Buzz Trading 199 (Pty) Ltd and Net 1 Applied Technologies South Africa (Pty) Ltd dated May 7, 2013 |
10-Q | 10.25 | May 9, 2013 | |
| 10.18 |
KRW 85,000,000,000 Senior Facilities Agreement dated October 28, 2013, between Net 1 Applied Technologies Korea, as borrower, Hana Bank, as agent and security agent, financial institutions listed therein as original lenders and Hana Daetoo Securities Co., Ltd., as mandated lead arranger. |
8-K | 10.24 | October 31, 2013 | |
| 10.19 |
Relationship Agreement dated December 10, 2013 between Net 1 UEPS Technologies, Inc., Net 1 Applied Technologies South Africa (Proprietary) Limited, Business Venture Investments No 1567 (Proprietary) Limited (RF) and Mosomo Investment Holdings (Proprietary) Limited. |
8-K | 10.25 | December 10, 2013 | |
| 10.20 |
Relationship Agreement dated December 10, 2013 between Net 1 UEPS Technologies, Inc., Net 1 Applied Technologies South Africa (Proprietary) Limited, Born Free Investments 272 (Pty) Ltd and Mazwi Yako. |
8-K | 10.26 | December 10, 2013 | |
| 10.21 |
Facility Letter between Nedbank Limited and Net1 Applied Technologies South Africa Limited and certain of its subsidiaries dated as of December 13, 2013 and First Addendum thereto dated as of December 18, 2013 |
8-K | 10.27 | December 19, 2013 | |
| 10.22 |
Addendum dated January 31, 2014, to the Relationship Agreement between Net 1 UEPS Technologies, Inc., Net 1 Applied Technologies South Africa (Proprietary) Limited, Business Venture Investments No 1567 (Proprietary) Limited (RF) and Mosomo Investment Holdings (Proprietary) Limited. |
10-Q | 10.28 | February 6, 2014 | |
| 10.23 |
Addendum dated January 31, 2014, to the Relationship Agreement between Net 1 UEPS Technologies, Inc., Net 1 Applied Technologies South Africa (Proprietary) Limited, Born Free Investments 272 (Pty) Ltd and Mazwi Yako. |
10-Q | 10.29 | February 6, 2014 |
64
| 10.24 | Second Addendum dated March 14, 2014, to the Relationship Agreement between Net 1 UEPS Technologies, Inc., Net 1 Applied Technologies South Africa (Proprietary) Limited, Business Venture Investments No 1567 (Proprietary) Limited (RF) and Mosomo Investment Holdings (Proprietary) Limited. | 8-K | 10.30 | March 18, 2014 | |
| 10.25 | Second Addendum dated March 14, 2014, to the Relationship Agreement between Net 1 UEPS Technologies, Inc., Net 1 Applied Technologies South Africa (Proprietary) Limited, Born Free Investments 272 (Pty) Ltd and Mazwi Yako. | 8-K | 10.31 | March 18, 2014 | |
| 10.26* | Service Agreement between KSNET, Inc. and Phil- Hyun Oh dated June 30, 2014 | 8-K | 10.1 | July 2, 2014 | |
| 10.27* | Service Agreement between Net1 Applied Technologies Korea and Phil-Hyun Oh dated June 30, 2014 | 8-K | 10.2 | July 2, 2014 | |
| 10.28 | Subscription and Sale of Shares Agreement dated August 27, 2014, between Net 1 UEPS Technologies, Inc., Net 1 Applied Technologies South Africa (Proprietary) Limited, Business Venture Investments No 1567 (Proprietary) Limited (RF), Mosomo Investment Holdings (Proprietary) Limited and Cash Paymaster Services (Proprietary) Ltd | 10-Q | 10.29 | November 6, 2014 | |
| 10.29* | Amended and Restated 2015 Stock Incentive Plan of Net 1 UEPS Technologies, Inc. | 14A | A | September 25, 2015 | |
| 10.30 | Subscription Agreement, dated April 11, 2016, among the Company and the IFC Investors | 8-K | 10.31 | April 12, 2016 | |
| 10.31 | Policy Agreement, dated April 11, 2016, among the Company and the IFC Investors | 8-K | 10.32 | April 12, 2016 | |
| 10.32 | Form of Indemnification Agreement | X | |||
| 12 | Statement of Ratio of Earnings to Fixed Charges | X | |||
| 14 | Amended and Restated Code of Ethics | 10-K | 14 | August 28, 2014 | |
| 21 | Subsidiaries of Registrant | X | |||
| 23 | Consent of Independent Registered Public Accounting Firm | X | |||
| 31.1 | Certification of Principal Executive Officer pursuant to Rules 13a-14(a) and 15d-14(a) under the Securities Exchange Act of 1934, as amended | X | |||
| 31.2 | Certification of Principal Financial Officer pursuant to Rules 13a-14(a) and 15d-14(a) under the Securities Exchange Act of 1934, as amended | X | |||
| 32 | Certification pursuant to 18 USC Section 1350 | X | |||
| 101.INS | XBRL Instance Document | X | |||
| 101.SCH | XBRL Taxonomy Extension Schema | X | |||
| 101.CAL | XBRL Taxonomy Extension Calculation Linkbase | X | |||
| 101.DEF | XBRL Taxonomy Extension Definition Linkbase | X | |||
| 101.LAB | XBRL Taxonomy Extension Label Linkbase | X | |||
| 101.PRE | XBRL Taxonomy Extension Presentation Linkbase | X |
__________________
* Indicates a management contract or
compensatory plan or arrangement.
65
SIGNATURES
Pursuant to the requirements of Section 13 or 15(d) of the Securities Exchange Act of 1934, the registrant has duly caused this report to be signed on its behalf by the undersigned, thereunto duly authorized.
NET 1 UEPS TECHNOLOGIES, INC.
By: /s/ Serge C.P. Belamant
Serge C.P. Belamant
Chief Executive
Officer, Chairman of the Board and Director
Date: August 25, 2016
Pursuant to the requirements of the Securities Exchange Act of 1934, this report has been signed below by the following persons on behalf of the registrant and in the capacities and on the dates indicated.
| NAME | TITLE | DATE |
| /s/ Serge C.P. Belamant Serge C.P. Belamant |
Chief Executive Officer, Chairman
of the Board and Director (Principal Executive Officer) |
August 25, 2016 |
| /s/ Herman Gideon Kotzé Herman Gideon Kotzé |
Chief Financial Officer,
Treasurer and Secretary and Director (Principal Financial and Accounting Officer) |
August 25, 2016 |
| /s/ Paul Edwards Paul Edwards |
Director | August 25, 2016 |
| /s/ Alasdair Jonathan Kemsley Pein Alasdair Jonathan Kemsley Pein |
Director | August 25, 2016 |
| /s/ Christopher Stefan Seabrooke Christopher Stefan Seabrooke |
Director | August 25, 2016 |
66
NET 1 UEPS TECHNOLOGIES, INC.
LIST OF CONSOLIDATED FINANCIAL STATEMENTS
F-1
REPORT OF INDEPENDENT REGISTERED PUBLIC ACCOUNTING FIRM
To the Board of Directors and Shareholders of Net 1 UEPS
Technologies, Inc.
Johannesburg, South Africa
We have audited the accompanying consolidated balance sheets of Net 1 UEPS Technologies, Inc. and subsidiaries (the “Company”) as of June 30, 2016 and 2015, and the related consolidated statements of operations, comprehensive income, shareholders’ equity, and cash flows for each of the three years in the period ended June 30, 2016. These financial statements are the responsibility of the Company's management. Our responsibility is to express an opinion on these financial statements based on our audits.
We conducted our audits in accordance with the standards of the Public Company Accounting Oversight Board (United States). Those standards require that we plan and perform the audit to obtain reasonable assurance about whether the financial statements are free of material misstatement. An audit includes examining, on a test basis, evidence supporting the amounts and disclosures in the financial statements. An audit also includes assessing the accounting principles used and significant estimates made by management, as well as evaluating the overall financial statement presentation. We believe that our audits provide a reasonable basis for our opinion.
In our opinion, such consolidated financial statements present fairly, in all material respects, the financial position of Net 1 UEPS Technologies, Inc. and subsidiaries as of June 30, 2016 and 2015, and the results of their operations and their cash flows for each of the three years in the period ended June 30, 2016 in conformity with accounting principles generally accepted in the United States of America.
We have also audited, in accordance with the standards of the Public Company Accounting Oversight Board (United States), the Company's internal control over financial reporting as of June 30, 2016, based on the criteria established in Internal Control — Integrated Framework (2013) issued by the Committee of Sponsoring Organizations of the Treadway Commission and our report dated August 25, 2016 expressed an unqualified opinion on the Company's internal control over financial reporting.
/s/ Deloitte & Touche
Registered Auditors
Johannesburg, South Africa
August 25, 2016
National Executive: *LL Bam Chief Executive Officer *TMM Jordan Deputy Chief Executive Officer *MJ Jarvis Chief Operating Officer *GM Pinnock Audit *N Sing Risk Advisory *NB Kader Tax TP Pillay Consulting S Gwala BPaas *K Black Clients & Industries *JK Mazzocco Talent & Transformation *MJ Comber Reputation & Risk *TJ Brown Chairman of the Board
| A full list of partners and directors is available on request | *Partner and Registered Auditor |
F-2
NET 1 UEPS TECHNOLOGIES, INC.
CONSOLIDATED
BALANCE SHEETS
as of June 30, 2016 and 2015
| 2016 | 2015 | |||||
| (In thousands, except share data) | ||||||
| ASSETS | ||||||
| CURRENT ASSETS | ||||||
| Cash and cash equivalents | $ | 223,644 | $ | 117,583 | ||
| Pre-funded social welfare grants receivable (Note 4) | 1,580 | 2,306 | ||||
| Accounts receivable, net (Note 1 and Note 5) | 107,805 | 121,335 | ||||
| Finance loans receivable, net (Note 5) | 37,009 | 40,373 | ||||
| Inventory (Note 6) | 10,004 | 12,979 | ||||
| Deferred income taxes (Note 20) | 6,956 | 7,298 | ||||
| Total current assets before settlement assets | 386,998 | 301,874 | ||||
| Settlement assets (Note 2) | 536,725 | 692,442 | ||||
| Total current assets | 923,723 | 946,316 | ||||
| PROPERTY, PLANT AND EQUIPMENT, net (Note 8) | 54,977 | 52,320 | ||||
| EQUITY-ACCOUNTED INVESTMENTS (Note 7) | 25,645 | 14,329 | ||||
| GOODWILL (Note 9) | 179,478 | 166,437 | ||||
| INTANGIBLE ASSETS, net (Note 9) | 48,556 | 47,124 | ||||
| OTHER LONG-TERM ASSETS (Note 5, Note 7 and Note 10) | 31,121 | 42,430 | ||||
| TOTAL ASSETS | 1,263,500 | 1,316,956 | ||||
| LIABILITIES | ||||||
| CURRENT LIABILITIES | ||||||
| Accounts payable | 14,097 | 21,453 | ||||
| Other payables (Note 11) | 37,479 | 45,595 | ||||
| Current portion of long-term borrowings (Note 13) | 8,675 | 8,863 | ||||
| Income taxes payable | 5,235 | 6,287 | ||||
| Total current liabilities before settlement obligations | 65,486 | 82,198 | ||||
| Settlement obligations (Note 2) | 536,725 | 692,442 | ||||
| Total current liabilities | 602,211 | 774,640 | ||||
| DEFERRED INCOME TAXES (Note 20) | 12,559 | 10,564 | ||||
| LONG-TERM BORROWINGS (Note 13) | 43,134 | 50,762 | ||||
| OTHER LONG-TERM LIABILITIES (Note 10) | 2,376 | 2,205 | ||||
| TOTAL LIABILITIES | 660,280 | 838,171 | ||||
| COMMITMENTS AND CONTINGENCIES (Note 24) | ||||||
| EQUITY | ||||||
| COMMON STOCK (Note 14) | ||||||
| Authorized:
200,000,000 with $0.001 par value; Issued and outstanding shares, net of treasury - 2016: 55,271,954; 2015: 46,679,565 |
74 | 64 | ||||
| PREFERRED STOCK | ||||||
| Authorized shares:
50,000,000 with $0.001 par value; Issued and outstanding shares, net of treasury: 2016: -; 2015: - |
- | - | ||||
| ADDITIONAL PAID-IN CAPITAL | 223,978 | 213,896 | ||||
| TREASURY SHARES, AT COST: 2016: 20,483,932; 2015: 18,057,228 (Note 14) | (241,627 | ) | (214,520 | ) | ||
| ACCUMULATED OTHER COMPREHENSIVE LOSS (Note 15) | (189,700 | ) | (139,181 | ) | ||
| RETAINED EARNINGS | 700,322 | 617,868 | ||||
| TOTAL NET1 EQUITY | 493,047 | 478,127 | ||||
| REDEEMABLE COMMON STOCK (Note 14) | 107,672 | - | ||||
| NON-CONTROLLING INTEREST | 2,501 | 658 | ||||
| TOTAL EQUITY | 603,220 | 478,785 | ||||
| TOTAL LIABILITIES AND SHAREHOLDERS’ EQUITY | $ | 1,263,500 | $ | 1,316,956 | ||
See accompanying notes to consolidated financial statements.
F-3
NET 1 UEPS TECHNOLOGIES, INC.
CONSOLIDATED
STATEMENTS OF OPERATIONS
for the years ended June 30, 2016, 2015 and
2014
| 2016 | 2015 | 2014 | |||||||
| (In thousands, except per share data) | |||||||||
| REVENUE (Note 16) | $ | 590,749 | $ | 625,979 | $ | 581,656 | |||
| Services rendered | 514,847 | 536,046 | 518,297 | ||||||
| Loan-based fees received | 47,117 | 62,235 | 33,560 | ||||||
| Sale of goods | 28,785 | 27,698 | 29,799 | ||||||
| EXPENSE | |||||||||
| Cost of goods sold, IT processing, servicing and support | 290,101 | 297,856 | 260,232 | ||||||
| Selling, general and administration | 145,886 | 158,919 | 168,072 | ||||||
| Equity instruments issued pursuant to BEE transactions (Note 17) | - | - | 11,268 | ||||||
| Depreciation and amortization | 40,394 | 40,685 | 40,286 | ||||||
| OPERATING INCOME | 114,368 | 128,519 | 101,798 | ||||||
| INTEREST INCOME | 15,292 | 16,355 | 14,817 | ||||||
| INTEREST EXPENSE | 3,423 | 4,456 | 7,473 | ||||||
| INCOME BEFORE INCOME TAXES | 126,237 | 140,418 | 109,142 | ||||||
| INCOME TAX EXPENSE (Note 20) | 42,080 | 44,136 | 39,379 | ||||||
| NET INCOME BEFORE EARNINGS FROM EQUITY- ACCOUNTED INVESTMENTS | 84,157 | 96,282 | 69,763 | ||||||
| EARNINGS FROM EQUITY-ACCOUNTED INVESTMENTS | 639 | 452 | 298 | ||||||
| NET INCOME | 84,796 | 96,734 | 70,061 | ||||||
| LESS (ADD): NET INCOME (LOSS) ATTRIBUTABLE TO NON- CONTROLLING INTEREST | 2,342 | 1,999 | (50 | ) | |||||
| NET INCOME ATTRIBUTABLE TO NET1 | $ | 82,454 | $ | 94,735 | $ | 70,111 | |||
| Net income per share, in United States dollars: (Note 21) | |||||||||
| Basic earnings attributable to Net1 shareholders | 1.72 | 2.03 | 1.51 | ||||||
| Diluted earnings attributable to Net1 shareholders | 1.71 | 2.02 | 1.50 | ||||||
See accompanying notes to consolidated financial statements.
F-4
NET 1 UEPS TECHNOLOGIES, INC.
CONSOLIDATED
STATEMENTS OF COMPREHENSIVE INCOME
for the years ended June 30, 2016,
2015 and 2014
| 2016 | 2015 | 2014 | |||||||
| (In thousands) | |||||||||
| NET INCOME | $ | 84,796 | $ | 96,734 | $ | 70,061 | |||
| OTHER COMPREHENSIVE INCOME (LOSS): | |||||||||
| Transfer of assets available for sale, net of tax, to comprehensive income (Note 7) | (1,732 | ) | - | - | |||||
| Net unrealized income on asset available for sale, net of tax | 692 | 422 | 288 | ||||||
| Release of foreign currency translation reserve related to sale/ liquidation of businesses (Note 19) | - | - | 4,277 | ||||||
| Movement in foreign currency translation reserve | (49,941 | ) | (57,074 | ) | 13,730 | ||||
| TOTAL OTHER COMPREHENSIVE INCOME (LOSS) | (50,981 | ) | (56,652 | ) | 18,295 | ||||
| COMPREHENSIVE INCOME | 33,815 | 40,082 | 88,356 | ||||||
| (Less) Add comprehensive (income) loss attributable to non-controlling interest | (1,880 | ) | (1,787 | ) | 50 | ||||
| COMPREHENSIVE INCOME ATTRIBUTABLETO NET1 | $ | 31,935 | $ | 38,295 | $ | 88,406 |
See accompanying notes to consolidated financial statements.
F-5
NET 1 UEPS TECHNOLOGIES, INC.
Consolidated Statement of Changes in
Equity for the year ended June 30, 2014 (dollar amounts in thousands)
| Net 1 UEPS Technologies, Inc. Shareholders | |||||||||||||||||||||||||||||||||
| Number | Accumulated | ||||||||||||||||||||||||||||||||
| Number | of | Number of | Additional | other | Total | Non- | |||||||||||||||||||||||||||
| of | Treasury | Treasury | shares, net of | Paid-In | Retained | comprehensive | Net1 | controlling | |||||||||||||||||||||||||
| Shares | Amount | Shares | Shares | treasury | Capital | Earnings | (loss) income | Equity | Interest | Total | |||||||||||||||||||||||
| Balance – July 1, 2013 | 59,047,640 | $ | 59 | (13,455,090 | ) | $ | (175,823 | ) | 45,592,550 | $ | 160,670 | $ | 452,618 | $ | (100,858 | ) | $ | 336,666 | $ | 3,303 | $ | 339,969 | |||||||||||
| Issue of common stock (Note 14) | 4,400,000 | 4 | 4,400,000 | 25,050 | 25,054 | 25,054 | |||||||||||||||||||||||||||
| Repurchase of common stock (Note 14) | (2,428,122 | ) | (24,858 | ) | (2,428,122 | ) | (24,858 | ) | (24,858 | ) | |||||||||||||||||||||||
| Restricted stock granted (Note 18) | 187,963 | 187,963 | - | - | |||||||||||||||||||||||||||||
| Exercise of stock option (Note 18) | 26,667 | - | 26,667 | 198 | 198 | 198 | |||||||||||||||||||||||||||
| Equity instruments charge (Note 17) | 11,268 | 11,268 | 11,268 | ||||||||||||||||||||||||||||||
| Stock-based compensation charge (Note 18) | 3,724 | 3,724 | 3,724 | ||||||||||||||||||||||||||||||
| Reversal of stock-based compensation charge (Note 18) | (7,171 | ) | (7,171 | ) | (6 | ) | (6 | ) | (6 | ) | |||||||||||||||||||||||
| Income tax benefit from vested stock awards | 5 | 5 | 5 | ||||||||||||||||||||||||||||||
| Acquisition of KSNET non-controlling interest (Note 14) | 1,492 | (178 | ) | 1,314 | (3,276 | ) | (1,962 | ) | |||||||||||||||||||||||||
| Issue of shares pursuant to fiscal 2013 N1MS acquisition | 47,412 | 47,412 | - | - | |||||||||||||||||||||||||||||
| Net income | 70,111 | 70,111 | (50 | ) | 70,061 | ||||||||||||||||||||||||||||
| Other comprehensive income | 18,295 | 18,295 | - | 18,295 | |||||||||||||||||||||||||||||
| Balance – June 30, 2014 | 63,702,511 | $ | 63 | (15,883,212 | ) | $ | (200,681 | ) | 47,819,299 | $ | 202,401 | $ | 522,729 | $ | (82,741 | ) | $ | 441,771 | $ | (23 | ) | $ | 441,748 | ||||||||||
F-6
NET 1 UEPS TECHNOLOGIES, INC.
Consolidated Statement of Changes in
Equity for the year ended June 30, 2015 (dollar amounts in thousands)
| Net 1 UEPS Technologies, Inc. Shareholders | ||||||||||||||||||||||||||||||||||||
| Number | Accumulated | |||||||||||||||||||||||||||||||||||
| Number | of | Number of | Additional | other | Total | Redeemable | Non- | |||||||||||||||||||||||||||||
| of | Treasury | Treasury | shares, net of | Paid-In | Retained | comprehensive | Net1 | common | controlling | |||||||||||||||||||||||||||
| Shares | Amount | Shares | Shares | treasury | Capital | Earnings | (loss) income | Equity | stock | Interest | Total | |||||||||||||||||||||||||
| Balance – July 1, 2014 | 63,702,511 | $ | 63 | (15,883,212 | ) | $ | (200,681 | ) | 47,819,299 | $ | 202,401 | $ | 522,729 | $ | (82,741 | ) | $ | 441,771 | $ | - | $ | (23 | ) | $ | 441,748 | |||||||||||
| Repurchase of common stock (Note 14) | (1,837,432 | ) | (9,151 | ) | (1,837,432 | ) | (9,151 | ) | (9,151 | ) | ||||||||||||||||||||||||||
| Restricted stock granted (Note 18) | 213,237 | 213,237 | - | - | ||||||||||||||||||||||||||||||||
| Exercise of stock option (Note 18) | 773,633 | 1 | (336,584 | ) | (4,688 | ) | 437,049 | 6,732 | 2,045 | 2,045 | ||||||||||||||||||||||||||
| Stock-based compensation charge (Note 18) | 3,195 | 3,195 | 3,195 | |||||||||||||||||||||||||||||||||
| Income tax benefit from vested stock awards | 483 | 483 | 483 | |||||||||||||||||||||||||||||||||
| Transactions with non-controlling interest (Note 14) | 1,085 | 404 | 1,489 | (82 | ) | 1,407 | ||||||||||||||||||||||||||||||
| Dividends paid to non-controlling interest | - | (1,024 | ) | (1,024 | ) | |||||||||||||||||||||||||||||||
| Issue of shares pursuant to fiscal 2013 N1MS acquisition | 47,412 | 47,412 | - | |||||||||||||||||||||||||||||||||
| Net income | 94,735 | 94,735 | 1,999 | 96,734 | ||||||||||||||||||||||||||||||||
| Other comprehensive income | (56,440 | ) | (56,440 | ) | (212 | ) | (56,652 | ) | ||||||||||||||||||||||||||||
| Balance – June 30, 2015 | 64,736,793 | $ | 64 | (18,057,228 | ) | $ | (214,520 | ) | 46,679,565 | $ | 213,896 | $ | 617,868 | $ | (139,181 | ) | $ | 478,127 | $ | - | $ | 658 | $ | 478,785 | ||||||||||||
F-7
NET 1 UEPS TECHNOLOGIES, INC.
Consolidated Statement of Changes in
Equity for the year ended June 30, 2016 (dollar amounts in thousands)
| Net 1 UEPS Technologies, Inc. Shareholders | ||||||||||||||||||||||||||||||||||||
| Number | Accumulated | |||||||||||||||||||||||||||||||||||
| Number | of | Number of | Additional | other | Total | Redeemable | Non- | |||||||||||||||||||||||||||||
| of | Treasury | Treasury | shares, net of | Paid-In | Retained | comprehensive | Net1 | common | controlling | |||||||||||||||||||||||||||
| Shares | Amount | Shares | Shares | treasury | Capital | Earnings | (loss) income | Equity | stock | Interest | Total | |||||||||||||||||||||||||
| Balance – July 1, 2015 | 64,736,793 | $ | 64 | (18,057,228 | ) | $ | (214,520 | ) | 46,679,565 | $ | 213,896 | $ | 617,868 | $ | (139,181 | ) | $ | 478,127 | $ | - | $ | 658 | $ | 478,785 | ||||||||||||
| Issue of common stock that is redeemable for cash or other assets (Note 14) | 9,984,311 | 10 | 9,984,311 | 10 | 107,672 | 107,682 | ||||||||||||||||||||||||||||||
| Repurchase of common stock (Note 14) | (2,426,704 | ) | (27,107 | ) | (2,426,704 | ) | (27,107 | ) | (27,107 | ) | ||||||||||||||||||||||||||
| Restricted stock granted (Note 18) | 319,492 | 319,492 | - | - | ||||||||||||||||||||||||||||||||
| Exercise of stock option (Note 18) | 323,645 | 323,645 | 3,762 | 3,762 | 3,762 | |||||||||||||||||||||||||||||||
| Stock-based compensation charge (Note 18) | 3,598 | 3,598 | 3,598 | |||||||||||||||||||||||||||||||||
| Income tax benefit from vested stock awards | 67 | 67 | 67 | |||||||||||||||||||||||||||||||||
| Acquisition of non-controlling interest (Note 3 and Note 14) | (1,308 | ) | (1,308 | ) | (37 | ) | (1,345 | ) | ||||||||||||||||||||||||||||
| Transact24 acquisition (Note 3) | 391,645 | 391,645 | 3,963 | 3,963 | 3,963 | |||||||||||||||||||||||||||||||
| Net income | 82,454 | 82,454 | 2,342 | 84,796 | ||||||||||||||||||||||||||||||||
| Other comprehensive income | (50,519 | ) | (50,519 | ) | (462 | ) | (50,981 | ) | ||||||||||||||||||||||||||||
| Balance – June 30, 2016 | 75,755,886 | $ | 74 | (20,483,932 | ) | $ | (241,627 | ) | 55,271,954 | $ | 223,978 | $ | 700,322 | $ | (189,700 | ) | $ | 493,047 | $ | 107,672 | $ | 2,501 | $ | 603,220 | ||||||||||||
See accompanying notes to consolidated financial statements.
F-8
NET 1 UEPS TECHNOLOGIES, INC.
CONSOLIDATED
STATEMENTS OF CASH FLOWS
for the years ended June 30, 2016, 2015 and
2014
| 2016 | 2015 | 2014 | |||||||
| (In thousands) | |||||||||
| CASH FLOWS FROM OPERATING ACTIVITIES | |||||||||
| NET INCOME | $ | 84,796 | $ | 96,734 | $ | 70,061 | |||
| ADJUSTMENTS TO RECONCILE NET INCOME TO NET CASH PROVIDED BY OPERATING ACTIVITIES: | |||||||||
| Depreciation and amortization | 40,394 | 40,685 | 40,286 | ||||||
| Earnings from equity-accounted investments | (639 | ) | (452 | ) | (298 | ) | |||
| Fair value adjustment | 519 | 248 | (55 | ) | |||||
| Interest payable | 1,829 | 1,283 | 2,100 | ||||||
| Facility fee amortized | 138 | 208 | 738 | ||||||
| Gain on release from accumulated other comprehensive income (Note 7) | (2,176 | ) | - | - | |||||
| Gain on fair value of Transact24 (Note 3) | (1,909 | ) | - | - | |||||
| Profit on disposal of property, plant and equipment | (286 | ) | (296 | ) | (434 | ) | |||
| Loss on deconsolidation of subsidiaries and business (Note 19) | - | - | 55 | ||||||
| Stock compensation charge, net of forfeitures (Note 18) | 3,598 | 3,195 | 3,718 | ||||||
| Fair value of BEE equity instruments granted (Note 17) | - | - | 11,268 | ||||||
| (Increase) Decrease in accounts and finance loans receivable, and pre-funded grants receivable | (3,401 | ) | 1,399 | (101,447 | ) | ||||
| Decrease (Increase) in inventory | 1,001 | (3,846 | ) | 780 | |||||
| (Decrease) Increase in accounts payable and other payables | (7,840 | ) | (850 | ) | 12,671 | ||||
| Increase in taxes payable | 763 | 606 | 5,523 | ||||||
| Decrease in deferred taxes | (235 | ) | (3,656 | ) | (7,821 | ) | |||
| NET CASH PROVIDED BY OPERATING ACTIVITIES | 116,552 | 135,258 | 37,145 | ||||||
| CASH FLOWS FROM INVESTING ACTIVITIES | |||||||||
| Capital expenditures | (35,797 | ) | (36,436 | ) | (23,906 | ) | |||
| Proceeds from disposal of property, plant and equipment | 1,349 | 857 | 2,990 | ||||||
| Acquisitions, net of cash acquired (Note 3) | (15,767 | ) | - | - | |||||
| Acquisition of available for sale securities (Note 7) | (8,900 | ) | - | - | |||||
| (Acquisition of equity of)/ Capital reduction/ repayment of loan by | |||||||||
| equity-accounted investment | - | (13,200 | ) | 539 | |||||
| Proceeds from sale of business (Note 19) | - | 1,895 | 186 | ||||||
| Net cash outflow from sale of MediKredit (Note 19) | - | - | (669 | ) | |||||
| Other investing activities, net | (5 | ) | (29 | ) | 570 | ||||
| Net change in settlement assets (Note 2) | 53,364 | (33,870 | ) | 11,053 | |||||
| NET CASH USED IN INVESTING ACTIVITIES | (5,756 | ) | (80,783 | ) | (9,237 | ) | |||
| CASH FLOWS FROM FINANCING ACTIVITIES | |||||||||
| Proceeds from issue of common stock (Note 14 and Note 18) | 111,444 | 2,045 | 198 | ||||||
| Acquisition of treasury stock (Note 14) | (26,637 | ) | (9,151 | ) | - | ||||
| Acquisition of interests in non-controlling interests (Note 14) | (11,189 | ) | - | (1,968 | ) | ||||
| Repayment of long-term borrowings (Note 13) | (8,716 | ) | (14,128 | ) | (87,008 | ) | |||
| Long-term borrowings obtained (Note 13) | 2,107 | 3,765 | 73,677 | ||||||
| Sale of equity to non-controlling interest (Note 14) | - | 1,407 | - | ||||||
| Dividends paid to non-controlling interest | - | (1,024 | ) | - | |||||
| Payment of facility fee (Note 13) | - | - | (872 | ) | |||||
| Proceeds from bank overdraft | - | - | 24,580 | ||||||
| Repayment of bank overdraft | - | - | (23,335 | ) | |||||
| Net change in settlement obligations (Note 2) | (53,364 | ) | 33,870 | (11,053 | ) | ||||
| NET CASH PROVIDED (USED IN) BY FINANCING ACTIVITIES | 13,645 | 16,784 | (25,781 | ) | |||||
| Effect of exchange rate changes on cash | (18,380 | ) | (12,348 | ) | 2,880 | ||||
| NET INCREASE IN CASH AND CASH EQUIVALENTS | 106,061 | 58,911 | 5,007 | ||||||
| CASH AND CASH EQUIVALENTS – BEGINNING OF YEAR | 117,583 | 58,672 | 53,665 | ||||||
| CASH AND CASH EQUIVALENTS AT END OF YEAR | $ | 223,644 | $ | 117,583 | $ | 58,672 | |||
See accompanying notes to consolidated financial statements.
F-9
| NET 1 UEPS TECHNOLOGIES, INC. |
| Notes to the consolidated financial statements |
| for the years ended June 30, 2016, 2015 and 2014 |
| (All amounts stated in thousands of United States Dollars, unless otherwise stated) |
| 1. | DESCRIPTION OF BUSINESS AND BASIS OF PRESENTATION |
Description of Business
Net 1 UEPS Technologies, Inc. (“Net1” and collectively with its consolidated subsidiaries, the “Company”) was incorporated in the State of Florida on May 8, 1997. The Company provides payment solutions and transaction processing services across a wide range of industries and in various geographies. It has developed and markets a smart-card based alternative payment system for the unbanked and underbanked populations of developing economies. Its universal electronic payment system (“UEPS”) uses biometrically secure smart cards that operate in real-time but offline, which allows users to enter into transactions at any time with other card holders in even the most remote areas. The Company also develops and provides secure transaction technology solutions and services, and offers transaction processing, financial and on-line real-time healthcare management solutions in the United States. The Company’s technology is widely used in South Africa today, where it distributes pension and welfare payments to recipient cardholders in South Africa, provides financial services, processes debit and credit card payment transactions on behalf of retailers through its EasyPay system, processes value-added services such as bill payments and prepaid electricity for the major bill issuers and local councils in South Africa, processes third-party and associated payroll payments for employees and provides mobile telephone top-up transactions for the major South African mobile carriers. Through KSNET, the Company offers card processing, payment gateway (“PG”) and banking value-added network services (“VAN”) in South Korea. The Company has expanded its card issuing and acquiring capabilities through the acquisition of Transact24 in Hong Kong. The Company’s Masterpayment subsidiary in Germany provides value added payment services to online retailers across Europe.
Basis of presentation
The accompanying consolidated financial statements include subsidiaries over which Net1 exercises control and have been prepared in accordance with accounting principles generally accepted in the United States of America (“GAAP”). During the year ended June 30, 2016, the Company identified a balance sheet misclassification between current assets and long-term assets. The Company has restated these amounts in its consolidated balance sheet as of June 30, 2015, and has decreased its accounts receivable, net of allowances, and increased its other long-term assets by approximately $27.4 million. This restatement has no impact on the Company’s previously reported consolidated income, comprehensive income or cash flows.
| 2. | SIGNIFICANT ACCOUNTING POLICIES |
Principles of consolidation
The financial statements of entities which are controlled by Net1, referred to as subsidiaries, are consolidated. Inter-company accounts and transactions are eliminated upon consolidation.
The Company, if it is the primary beneficiary, consolidates entities which are considered to be variable interest entities (“VIE”). The primary beneficiary is considered to be the entity that will absorb a majority of the entity's expected losses, receive a majority of the entity's expected residual returns, or both. No entities were required to be consolidated in terms of these requirements during the years ended June 30, 2016, 2015 and 2014.
Business combinations
The Company accounts for its business acquisitions under the acquisition method of accounting. The total value of the consideration paid for acquisitions is allocated to the underlying net assets acquired, based on their respective estimated fair values. The Company uses a number of valuation methods to determine the fair value of assets and liabilities acquired, including discounted cash flows, external market values, valuations on recent transactions or a combination thereof, and believes that it uses the most appropriate measure or a combination of measures to value each asset or liability.
Use of estimates
The preparation of financial statements in conformity with GAAP requires management to make estimates and assumptions that affect the reported amounts of assets and liabilities and disclosure of contingent assets and liabilities at the date of the financial statements and the reported amounts of revenues and expenses during the reporting period. Actual results could differ from those estimates.
F-10
| NET 1 UEPS TECHNOLOGIES, INC. |
| Notes to the consolidated financial statements |
| for the years ended June 30, 2016, 2015 and 2014 |
| (All amounts stated in thousands of United States Dollars, unless otherwise stated) |
| 2. | SIGNIFICANT ACCOUNTING POLICIES (continued) |
Translation of foreign currencies
The primary functional currency of the Company is the South African Rand (“ZAR”) and its reporting currency is the U.S. dollar. The Company also has consolidated entities which have other currencies, primarily South Korean won (“KRW”), as their functional currency. Assets and liabilities are translated at the exchange rates in effect at the balance sheet date. Revenues and expenses are translated at average rates for the period. Translation gains and losses are reported in accumulated other comprehensive income in total equity.
Foreign exchange transactions are translated at the spot rate ruling at the date of the transaction. Monetary items are translated at the closing spot rate at the balance sheet date. Transactional gains and losses are recognized in selling, general and administration expense on the Company’s consolidated statement of operations for the period.
Cumulative translation adjustment are released into net income only if the sale or transfer results in the complete or substantially complete liquidation of the foreign entity in which the subsidiary or group of assets had resided.
Allowance for doubtful accounts receivable
Allowance for doubtful finance loans receivable
The Company regularly reviews the ageing of outstanding amounts due from borrowers and adjusts the allowance based on management’s estimate of the recoverability of the finance loans receivable. The Company writes off finance loans receivable and related service fees if a borrower is in arrears with repayments for more than three months or dies.
Allowance for doubtful accounts receivable
A specific provision is established where it is considered likely that all or a portion of the amount due from customers renting point of sale (“POS”) equipment, receiving support and maintenance or transaction services or purchasing licenses from the Company will not be recovered. Non-recoverability is assessed based on a review by management of the ageing of outstanding amounts, the location of the customer and the payment history in relation to those specific amounts.
Inventory
Inventory is valued at the lower of cost and market value. Cost is determined on a first-in, first-out basis and includes transport and handling costs.
Equity-accounted investments
The Company uses the equity method to account for investments in companies when it has significant influence but not control over the operations of the equity-accounted company. Under the equity method, the Company initially records the investment at cost and then adjusts the carrying value of the investment to recognize the proportional share of the equity-accounted company’s net income or loss. In addition, when an investment qualifies for the equity method (as a result of an increase in the level of ownership interest or degree of influence), the cost of acquiring the additional interest in the investee is added to the current basis of the Company’s previously held interest and the equity method would be applied subsequently from the date on which the Company obtains the ability to exercise significant influence over the investee. Any unrealized holding gains or losses in accumulated other comprehensive income related to an available for sale security that becomes eligible for the equity method are recognized in earnings as of the date on which the investment qualifies for the equity method. The Company does not recognize cumulative losses in excess of its investment or loans in an equity-accounted investment except if it has an obligation to provide additional financial support. Dividends received from an equity-accounted investment reduce the carrying value of the Company’s investment.
Leasehold improvement costs
Costs incurred in the adaptation of leased properties to serve the requirements of the Company are capitalized and amortized over the shorter of the estimated useful life of the asset and the remaining term of the lease.
F-11
| NET 1 UEPS TECHNOLOGIES, INC. |
| Notes to the consolidated financial statements |
| for the years ended June 30, 2016, 2015 and 2014 |
| (All amounts stated in thousands of United States Dollars, unless otherwise stated) |
| 2. | SIGNIFICANT ACCOUNTING POLICIES (continued) |
Property, plant and equipment
Property, plant and equipment are shown at cost less accumulated depreciation. Property, plant and equipment are depreciated on the straight-line basis at rates which are estimated to amortize the assets to their anticipated residual values over their useful lives. Within the following asset classifications, the expected economic lives are approximately:
| Computer equipment | 3 to 8 years | |
| Office equipment | 2 to 10 years | |
| Vehicles | 3 to 8 years | |
| Furniture and fittings | 3 to 10 years | |
| Buildings and structures | 8 to 30 years | |
| Plant and equipment | 5 to 10 years |
The gain or loss arising on the disposal or retirement of an asset is determined as the difference between the sales proceeds and the carrying amount of the asset and is recognized in income.
Goodwill
Goodwill represents the excess of the purchase price of an acquired enterprise over the fair values of the identifiable assets acquired and liabilities assumed. The Company tests for impairment of goodwill on an annual basis and at any other time if events or circumstances change that would more likely than not reduce the fair value of the reporting unit goodwill below its carrying amount.
Circumstances that could trigger an impairment test include but are not limited to: a significant adverse change in the business climate or legal factors; an adverse action or assessment by a regulator; unanticipated competition; loss of key personnel; the likelihood that a reporting unit or significant portion of a reporting unit will be sold or otherwise disposed; and results of testing for recoverability of a significant asset group within a reporting unit.
If the carrying amount of the reporting unit goodwill exceeds the implied fair value of that goodwill, an impairment loss is recorded in the statement of operations. Measurement of the fair value of a reporting unit is based on one or more of the following fair value measures: the amount at which the unit as a whole could be bought or sold in a current transaction between willing parties; present value techniques of estimated future cash flows; or valuation techniques based on multiples of earnings or revenue, or a similar performance measure.
Intangible assets
Intangible assets are shown at cost less accumulated amortization. Intangible assets are amortized over the following useful lives:
| Customer relationships | 1 to 15 years | |
| Software and unpatented technology | 3 to 5 years | |
| FTS patent | 10 years | |
| Exclusive licenses | 7 years | |
| Trademarks | 3 to 20 years | |
| Customer databases | 3 years |
Intangible assets are periodically evaluated for recoverability, and those evaluations take into account events or circumstances that warrant revised estimates of useful lives or that indicate that impairment exists.
F-12
| NET 1 UEPS TECHNOLOGIES, INC. |
| Notes to the consolidated financial statements |
| for the years ended June 30, 2016, 2015 and 2014 |
| (All amounts stated in thousands of United States Dollars, unless otherwise stated) |
| 2. | SIGNIFICANT ACCOUNTING POLICIES (continued) |
Policy reserves and liabilities
Reserves for future policy benefits and claims payable
The Company determines its reserves for future policy benefits under its life insurance products using a model which estimates claims incurred that have not been reported at the balance sheet date. This model includes best estimate assumptions of experience plus prescribed margins, as required in the markets in which these products are offered, namely South Africa. The best estimate assumptions include those assumptions related to mortality, morbidity and claim reporting delays, and the main assumptions used to calculate the reserve for future policy benefits include (i) mortality and morbidity assumptions reflecting the company’s most recent experience and (ii) claim reporting delays reflecting Company specific and industry experience. The values of matured guaranteed endowments were increased by late payment interest (net of the asset management fee and allowance for tax on investment income).
Deposits on investment contracts
For the Company’s interest-sensitive life contracts, liabilities approximate the policyholder’s account value. For deferred annuities, the fixed option on variable annuities, guaranteed investment contracts and other investment contracts, the liability is the policyholder’s account value.
Reinsurance contracts held
The Company enters into reinsurance contracts with reinsurers under which the Company is compensated for the entire amount or a portion of losses arising on one or more of the insurance contracts it issues.
The expected benefits to which the Company is entitled under its reinsurance contracts held are recognized as reinsurance assets. These assets consist of short-term balances due from reinsurers (classified within accounts receivable, net) as well as long-term receivables (classified within other long-term assets) that are dependent on the present value of expected claims and benefits arising net of expected premiums payable under the related reinsurance contracts. Amounts recoverable from or due to reinsurers are measured consistently with the amounts associated with the reinsured contracts and in accordance with the terms of each reinsurance contract.
Reinsurance assets are assessed for impairment at each balance sheet date. If there is reliable objective evidence that amounts due may not be recoverable, the Company reduces the carrying amount of the reinsurance asset to its recoverable amount and recognizes that impairment loss in its condensed consolidated statement of operations.
Reinsurance premiums are recognized when due for payment under each reinsurance contract.
Redeemable common stock
Common stock that is redeemable (1) at a fixed or determinable price on a fixed or determinable date, (2) at the option of the holder, or (3) upon the occurrence of an event that is not solely within the control of Company is presented outside of total Net1 equity (i.e. permanent equity). Redeemable common stock is initially recognized at issuance date fair value and the Company does not adjust the issuance date fair value if redemption is not probable. The Company re-measures the redeemable common stock to the maximum redemption amount at the balance sheet date once redemption is probable. Reduction in the carrying amount of the redeemable common stock is only appropriate to the extent that the Company has previously recorded increases in the carrying amount of the redeemable equity instrument as the redeemable common stock may be not be carried at an amount that is less the initial amount reported outside of permanent equity.
Redeemable common stock is reclassified as permanent equity when presentation outside permanent equity is no longer required (if, for example, a redemption feature lapses, or there is a modification of the terms of the instrument). The existing carrying amount of the redeemable common stock is reclassified to permanent equity at the date of the event that caused the reclassification and prior period consolidated financial statements are not adjusted.
F-13
| NET 1 UEPS TECHNOLOGIES, INC. |
| Notes to the consolidated financial statements |
| for the years ended June 30, 2016, 2015 and 2014 |
| (All amounts stated in thousands of United States Dollars, unless otherwise stated) |
| 2. | SIGNIFICANT ACCOUNTING POLICIES (continued) |
Sales taxes
Revenue and expenses are presented net of sales, use and value added taxes, as the case may be.
Revenue recognition
The Company recognizes revenue when:
| • | there is persuasive evidence of an agreement or arrangement; | |
| • | delivery of products has occurred or services have been rendered; | |
| • | the seller’s price to the buyer is fixed or determinable; and | |
| • | collectability is reasonably assured. |
The Company’s principal revenue streams and their respective accounting treatments are discussed below:
Fees
Pension and welfare and South African participating merchants
The Company provides a welfare benefit distribution service to the South African Social Security Agency (“SASSA”). Fee income received for these services is recognized in the statement of operations when distributions have been made to the recipient cardholders.
Recipient cardholders are able to load their welfare grants at merchants enrolled in the Company’s participating merchant system in certain provinces. There is no charge to the recipient cardholder to load the grant onto a smart card at the merchant location, however, a fee is charged to the merchant for purchases made at the merchant using the smart card. A fee is also charged to the merchant when the recipient cardholder makes a cash withdrawal. Fee income received for these services is recognized in the statement of operations when the transaction occurs.
Fees related to management of card issuance programs and utilization of ATMs
The Company manages card issuance programs and owns ATMs in South Africa from which it generates fee revenue. Fee revenue generated from card issuance programs includes interchange and other miscellaneous fees, which are recorded when cardholder transact at either a POS or an ATM. Fee revenue generated from utilization of ATMs includes cash withdrawal, balance enquiry, insufficient funds and other miscellaneous ATM fees which are recorded when an ATM user performs a transaction at an ATM.
Card VAN, banking VAN and payment gateway
Card VAN services consist of services relating to authorization of credit card transactions including transmission of transaction details (“authorization service”), and collection of receipts associated with the credit card transactions (“collection service”). With its authorization service, the Company connects credit card companies with merchants online when a customer uses his/her credit card via terminals installed at merchants’ sites and the Company’s central processing server for approval of credit card transactions. Immediately after approval of credit card transactions, the Company transmits details of the transactions to credit card companies online for processing payments. Collection service captures the transaction data and gathers receipts as documented evidence and provides them to credit card companies upon request. The Company earns service fees based on the number of transactions processed for credit card companies when services are rendered in accordance with the contracts entered into between credit card companies and the Company. The Company bills for its service charges to credit card companies each month. Each service could be provided either individually or collectively, based on terms of contracts.
F-14
| NET 1 UEPS TECHNOLOGIES, INC. |
| Notes to the consolidated financial statements |
| for the years ended June 30, 2016, 2015 and 2014 |
| (All amounts stated in thousands of United States Dollars, unless otherwise stated) |
| 2. | SIGNIFICANT ACCOUNTING POLICIES (continued) |
Revenue recognition (continued)
Fees (continued)
Card VAN, banking VAN and payment gateway (continued)
The Company charges commission fees to credit card companies for the authorization service provided based on the number of approvals transferred. The right to receive a service fee is due once a credit card transaction has been approved and details of the transaction are transmitted by the Company. Therefore, revenues from the authorization service are recognized when the credit card transactions are authorized and details of the transactions are transmitted. The Company earns a collection service fee once it has provided settled funds to the credit card companies. Therefore, revenue from the collection service is recognized when the Company collects the receipts and provides them to the card companies.
For multiple-element arrangements, the Company has identified two deliverables. The first deliverable is the authorization service, and the second deliverable is the collection service. The Company evaluates each deliverable in an arrangement to determine whether it represents a separate unit of accounting. A deliverable constitutes a separate unit of accounting when it has standalone value and there are no customer-negotiated refunds or return rights for the delivered elements. If the arrangement includes a customer-negotiated refund or return right relative to the delivered item and the delivery and performance of the undelivered item is considered probable and substantially in the Company's control, the delivered element constitutes a separate unit of accounting. In instances when the aforementioned criteria are not met, the deliverable is combined with the undelivered elements and the allocation of the arrangement consideration and revenue recognition is determined for the combined unit as a single unit. Allocation of the consideration is determined at arrangement inception on the basis of each unit's relative selling price. In such circumstances, the Company uses a hierarchy to determine the selling price to be used for allocating revenue to deliverables: (i) vendor-specific objective evidence of fair value (“VSOE”), (ii) third-party evidence of selling price (“TPE”), and (iii) best estimate of the selling price (“ESP”).
VSOE generally exists only when the Company sells the deliverable separately and is the price actually charged by the Company for that deliverable. ESPs reflect the Company’s best estimates of what the selling prices of elements would be if they were sold regularly on a stand-alone basis. Because the Company has neither VSOE nor TPE for the two deliverables, the allocation of revenue has been based on the Company’s ESPs. Amounts allocated to the authorization and the collection service are recognized at the time of service, provided the other conditions for revenue recognition have been met.
The Company’s process for determining its ESP for deliverables without VSOE or TPE considers multiple factors that may vary depending upon the unique facts and circumstances related to each deliverable. Key factors considered by the Company in developing the ESPs include prices charged by the Company, historical pricing practices and controls, range of prices for various customers and the nature of the services. Consideration is also given to market conditions such as competitor pricing strategies and market perception.
Banking VAN is a division supporting a company’s fund management business (large payment transfers, collections, etc.) by relaying financial transactions between client companies and financial institutions. Financial transactions between two or more business enterprises, or between business enterprises and their customers, are conducted through the transaction-processing network established between the Company and the banks. Revenue from the banking VAN service is recognized when the service is rendered by the Company.
With its PG service, the Company provides the Internet-based settlement service between an on-line shopping mall and a credit card company when a customer uses his/her credit card, debit card or on-line payment to pay for goods or services. The Company receives fees for carrying out settlements for electronic transactions. Revenue from the PG service is recognized when the service is rendered by the Company.
Microlending service fee
The Company provides short-term loans to customers in South Africa and charges and recognizes monthly service fee revenue under the contractual terms of the loan. The monthly service fee amount is fixed upon initiation and does not change over the term of the loan.
F-15
| NET 1 UEPS TECHNOLOGIES, INC. |
| Notes to the consolidated financial statements |
| for the years ended June 30, 2016, 2015 and 2014 |
| (All amounts stated in thousands of United States Dollars, unless otherwise stated) |
| 2. | SIGNIFICANT ACCOUNTING POLICIES (continued) |
Revenue recognition (continued)
Fees (continued)
Other fees and commissions
The Company provides an automated payment collection service to third parties, for which it charges monthly fees. These fees are recognized in the statement of operations as the underlying services are performed. The Company provides medical-related claims adjudication, reconciliation and settlement services (“medical-related claim service”) to customers, for which it charges fees. These fees are recognized in the statement of operations as the underlying services are performed. The Company sells prepaid electricity and recognizes a commission in its statement of operations once the prepaid electricity token has been delivered to the customer.
Contract variations fees
The Company records additional revenue from variations to contracts for the provision of welfare benefits, if:
| • | there is persuasive evidence of an agreement; | |
| • | collectability is reasonably assured; and | |
| • | all material terms and conditions of the agreement have been adhered to. |
Hardware and prepaid airtime voucher sales
Revenue from hardware and airtime voucher sales is recognized when risk of loss has transferred to the customer and there are no unfulfilled Company obligations that affect the customer’s final acceptance of the arrangement. Any cost of warranties and remaining obligations that are inconsequential or perfunctory are accrued when the corresponding revenue is recognized.
The Company buys terminals from manufacturers, and subsequently sells them through its agencies. Revenue is recognized when significant risks and rewards of ownership of terminals have passed to the buyer, usually on delivery of the terminals to the buyer.
To the extent that sales of hardware are made in an arrangement that includes software that is more than incidental, the Company considers post-contract maintenance and technical support or other future obligations which could impact the timing and amount of revenue recognized.
Software
Revenue from licensed software is recognized on a subscription basis over the period that the client is entitled to use the license. Revenue from the sale of software is recognized if all revenue recognition criteria have been met. Post-contract maintenance and technical support in respect of software is generally negotiated and sold as a separate service and is recognized over the period such items are delivered.
Systems implementation projects
The Company undertakes smart card system implementation projects. The hardware and software installed in these projects are in the form of customized systems, which ordinarily involve modification to meet the customer’s specifications. Software delivered under such arrangements is available to the customer permanently, subject to the payment of annual license fees. Revenue for such arrangements is recognized under the percentage of completion method, save for annual license fees, which are recognized in the period to which they relate. Up-front and interim payments received are recorded as client deposits until customer acceptance.
F-16
| NET 1 UEPS TECHNOLOGIES, INC. |
| Notes to the consolidated financial statements |
| for the years ended June 30, 2016, 2015 and 2014 |
| (All amounts stated in thousands of United States Dollars, unless otherwise stated) |
| 2. | SIGNIFICANT ACCOUNTING POLICIES (continued) |
Revenue recognition (continued)
Systems implementation projects (continued)
The Company’s customer arrangements may have multiple deliverables. Generally, the Company’s multiple element arrangements fall within the scope of specific accounting standards that provide guidance regarding the separation of elements in multiple-deliverable arrangements and the allocation of consideration among those elements. If not, the Company unbundles multiple element arrangements into separate units of accounting when the delivered element(s) has stand-alone value and fair value of the undelivered element(s) exists.
Terminal rental income
The Company leases terminals to merchants participating in its merchant acquiring system. Operating rental income is recognized monthly on a straight-line basis in accordance with the lease agreement.
Other income
Revenue from service and maintenance activities is charged to customers on a time-and-materials basis and is recognized in the statement of operations as services are delivered to customers.
Research and development expenditure
Research and development expenditure is charged to net income in the period in which it is incurred. During the years ended June 30, 2016, 2015 and 2014, the Company incurred research and development expenditures of $2.3 million, $2.4 million and $2.2 million, respectively.
Computer software development
Product development costs in respect of software intended for sale to licensees are expensed as incurred until technological feasibility is attained. Technological feasibility is attained when the Company’s software has completed system testing and has been determined to be viable for its intended use. The time between the attainment of technological feasibility and completion of software development is generally short with immaterial amounts of development costs incurred during this period.
Costs in respect of the development of software for the Company’s internal use are expensed as incurred, except to the extent that these costs are incurred during the application development stage. All other costs including those incurred in the project development and post-implementation stages are expensed as incurred.
Income taxes
The Company provides for income taxes using the asset and liability method. This approach recognizes the amount of taxes payable or refundable for the current year, as well as deferred tax assets and liabilities for the future tax consequence of events recognized in the financial statements and tax returns. Deferred income taxes are adjusted to reflect the effects of changes in tax laws or enacted tax rates.
The Company measured its South African income taxes and deferred income taxes for the years ended June 30, 2016, 2015 and 2014, using the enacted statutory tax rate in South Africa of 28%.
As of June 30, 2016, the Company intends to permanently reinvest its non-U.S. undistributed earnings of $414.2 million in those non-U.S. jurisdictions. Accordingly, the Company has not recognized a deferred tax liability related to future distributions of these undistributed earnings. It is not practicable for the Company to estimate the amount of unrecognized deferred tax liability because of the complexities of the calculations involved. The Company will be required to record a tax charge if it is no longer able to permanently reinvest its undistributed earnings. This may result in an increase in the Company’s effective tax rate in future periods.
F-17
| NET 1 UEPS TECHNOLOGIES, INC. |
| Notes to the consolidated financial statements |
| for the years ended June 30, 2016, 2015 and 2014 |
| (All amounts stated in thousands of United States Dollars, unless otherwise stated) |
| 2. | SIGNIFICANT ACCOUNTING POLICIES (continued) |
Income taxes (continued)
In establishing the appropriate deferred tax asset valuation allowances, the Company assesses the realizability of its deferred tax assets, and based on all available evidence, both positive and negative, determines whether it is more likely than not that the deferred tax assets or a portion thereof will be realized.
Reserves for uncertain tax positions are recognized in the financial statements for positions which are not considered more likely than not of being sustained based on the technical merits of the position on audit by the tax authorities. For positions that meet the more likely than not standard, the measurement of the tax benefit recognized in the financial statements is based upon the largest amount of tax benefit that, in management’s judgement, is greater than 50% likely of being realized based on a cumulative probability assessment of the possible outcomes.
The Company’s policy is to include interest related to unrecognized tax benefits in interest expense and penalties in selling, general and administration in the consolidated statements of operations.
Stock-based compensation
Stock-based compensation represents the cost related to stock-based awards granted. The Company measures equity-based stock-based compensation cost at the grant date, based on the estimated fair value of the award, and recognizes the cost as an expense on a straight-line basis (net of estimated forfeitures) over the requisite service period. In respect of awards with only service conditions that have a graded vesting schedule, the Company recognizes compensation cost on a straight-line basis over the requisite service period for the entire award. The forfeiture rate is estimated using historical trends of the number of awards forfeited prior to vesting. The expense is recorded in the statement of operations and classified based on the recipients’ respective functions.
The Company records deferred tax assets for awards that result in deductions on the Company’s income tax returns, based on the amount of compensation cost recognized and the Company’s statutory tax rate in the jurisdiction in which it will receive a deduction. Differences between the deferred tax assets recognized for financial reporting purposes and the actual tax deduction reported on the Company’s income tax return are recorded in additional paid-in capital (if the tax deduction exceeds the deferred tax asset) or in the statement of operations (if the deferred tax asset exceeds the tax deduction and no additional paid-in capital exists from previous awards).
Equity instruments issued to third parties
Equity instruments issued to third parties represents the cost related to equity instruments granted. The Company measures this cost at the grant date, based on the estimated fair value of the award, and recognizes the cost as an expense on a straight-line basis (net of estimated forfeitures) over the requisite service period. The forfeiture rate is estimated based on the Company’s expectation of the number of awards that will be forfeited prior to vesting.
The Company records deferred tax assets for equity instrument awards that result in deductions on the Company’s income tax returns, based on the amount of equity instrument cost recognized and the Company’s statutory tax rate in the jurisdiction in which it will receive a deduction. Differences between the deferred tax assets recognized for financial reporting purposes and the actual tax deduction reported on the Company’s income tax return are recorded in the statement of operations.
Settlement assets and settlement obligations
Settlement assets comprise (1) cash received from the South African government that the Company holds pending disbursement to recipient cardholders of social welfare grants and (2) cash received from customers on whose behalf the Company processes payroll payments that the Company will disburse to customer employees, payroll-related payees and other payees designated by the customer.
F-18
| NET 1 UEPS TECHNOLOGIES, INC. |
| Notes to the consolidated financial statements |
| for the years ended June 30, 2016, 2015 and 2014 |
| (All amounts stated in thousands of United States Dollars, unless otherwise stated) |
| 2. | SIGNIFICANT ACCOUNTING POLICIES (continued) |
Settlement assets and settlement obligations (continued)
Settlement obligations comprise (1) amounts that the Company is obligated to disburse to recipient cardholders of social welfare grants, and (2) amounts that the Company is obligated to pay to customer employees, payroll-related payees and other payees designated by the customer.
The balances at each reporting date may vary widely depending on the timing of the receipts and payments of these assets and obligations.
During fiscal 2016, and in prior financial years, certain bank accounts, cash in transit and funds in preparation for immediate access by grant beneficiaries, as well as the corresponding obligation to grant beneficiaries, were not included in settlement assets and obligations, primarily due to the reservation of ownership clause in the Company’s agreement with SASSA and the assumption of total risk over the cash by the cash transfer service providers. In the course of the annual consideration of the Company’s accounting practices and in the context of the increased and more diversified payment delivery channels arising from the Company’s ATM and point of sale roll out, the Company has decided that its presentation would be enhanced by including these gross amounts in settlement assets and obligations. The Company has accordingly restated its balance sheet as of June 30, 2015, to record an increase in settlement assets and obligations of $30.5 million. The Company has also restated its consolidated statement of cash flows, and accordingly, it has increased its cash flows used in investing activities and increased its cash flows provided by financing activities by $21.3 million, respectively, during the year ended June 30, 2015, and decreased its cash flows used in investing activities and decreased its cash flows used in financing activities by $12.4 million, respectively, during the year ended June 30, 2014, all balances translated at the average rate applicable during the year ended June 30, 2015 and 2014, respectively. The inclusion of these accounts did not impact on cash and cash equivalents reported nor did it impact on the Company’s current assets before settlement assets and current liabilities before settlement obligations.
Recent accounting pronouncements adopted
In March 2016, the FASB issued guidance regarding Investments — Equity Method and Joint Ventures: Simplifying the Transition to the Equity Method of Accounting. The guidance simplifies the equity method of accounting by eliminating the requirement to retrospectively apply the equity method to an investment that subsequently qualifies for such accounting as a result of an increase in the level of ownership interest or degree of influence. Consequently, when an investment qualifies for the equity method (as a result of an increase in the level of ownership interest or degree of influence), the cost of acquiring the additional interest in the investee would be added to the current basis of the investor’s previously held interest and the equity method would be applied subsequently from the date on which the investor obtains the ability to exercise significant influence over the investee. The guidance further requires that unrealized holding gains or losses in accumulated other comprehensive income related to an available for sale security that becomes eligible for the equity method be recognized in earnings as of the date on which the investment qualifies for the equity method. Early adoption is permitted. The guidance is effective for the Company beginning July 1, 2017, however the Company has early adopted the guidance, effective April 1, 2016. The adoption of this guidance did not have a material impact on the Company’s financial statements.
Recent accounting pronouncements not yet adopted as of June 30, 2016
In May 2014, the FASB issued guidance regarding Revenue from Contracts with Customers. This guidance requires an entity to recognize revenue when a customer obtains control of promised goods or services in an amount that reflects the consideration to which the entity expects to receive in exchange for those goods or services. In addition, the standard requires disclosure of the nature, amount, timing, and uncertainty of revenue and cash flows arising from contracts with customers. The guidance was effective for the Company beginning July 1, 2017, however in August 2015, the FASB issued guidance regarding Revenue from Contracts with Customers, Deferral of the Effective Date. This guidance defers the required implementation date specified in Revenue from Contracts with Customers to December 2017. Public companies may elect to adopt the standard along the original timeline. The Company expects that this guidance may have a material impact on its financial statements and is currently evaluating the impact of this guidance on its financial statements on adoption.
In August 2014, the FASB issued guidance regarding Disclosure of Uncertainties about an Entity’s Ability to Continue as a Going Concern. This guidance requires an entity to perform interim and annual assessments of its ability to continue as a going concern within one year of the date that its financial statements are issued. An entity must provide certain disclosures if conditions or events raise substantial doubt about the entity’s ability to continue as a going concern. The guidance is effective for the Company beginning July 1, 2017. Early adoption is permitted. The Company is currently assessing the impact of this guidance on its financial statements disclosure.
F-19
| NET 1 UEPS TECHNOLOGIES, INC. |
| Notes to the consolidated financial statements |
| for the years ended June 30, 2016, 2015 and 2014 |
| (All amounts stated in thousands of United States Dollars, unless otherwise stated) |
| 2. | SIGNIFICANT ACCOUNTING POLICIES (continued) |
Recent accounting pronouncements not yet adopted as of June 30, 2016 (continued)
In February 2015, the FASB issued guidance regarding Amendments to the Consolidation Analysis. This guidance amends both the variable interest entity and voting interest entity consolidation models. The requirement to assess an entity under a different consolidation model may change previous consolidation conclusions. The guidance is effective for the Company beginning July 1, 2016. Early adoption is permitted. The Company is currently assessing the impact of this guidance on its financial statements disclosure.
In July 2015, the FASB issued guidance regarding Simplifying the Measurement of Inventory. This guidance requires entities to measure most inventory “at the lower of cost and net realizable value,” thereby simplifying the current guidance under which an entity must measure inventory at the lower of cost or market (market in this context is defined as one of three different measures). The guidance will not apply to inventories that are measured by using either the last-in, first-out (“LIFO”) method or the retail inventory method (“RIM”). The guidance is effective for the Company beginning July 1, 2017. Early adoption is permitted. The Company is currently assessing the impact of this guidance on its financial statements disclosure.
In November 2015, the FASB issued guidance regarding Balance Sheet Classification of Deferred Taxes. This guidance requires that deferred tax liabilities and assets are to be classified as non-current in a classified statement of financial position. The current requirement that deferred tax liabilities and assets of a tax-paying component of an entity be offset and presented as a single amount is not affected by the amendments in this update. This guidance is effective for the Company beginning July 1, 2017, with early adoption permitted on a prospective or retrospective basis. The Company is currently assessing the impact of this guidance on its financial statements disclosures.
In January 2016, the FASB issued guidance regarding Recognition and Measurement of Financial Assets and Financial Liabilities. The guidance primarily affects the accounting for equity investments, financial liabilities under the fair value option and the presentation and disclosure requirements for financial instruments. In addition, the guidance clarifies the valuation allowance assessment when recognizing deferred tax assets resulting from unrealized losses on available-for-sale debt securities. This guidance is effective for the Company beginning July 1, 2018, and early adoption is not permitted, with certain exceptions. The amendments are required to be applied by means of a cumulative-effect adjustment on the balance sheet as of the beginning of the fiscal year of adoption. The Company is currently assessing the impact of this guidance on its financial statements disclosure.
In February 2016, the FASB issued guidance regarding Leases. The guidance increases transparency and comparability among organizations by requiring the recognition of lease assets and lease liabilities on the balance sheet. The amendments to current lease guidance includes the recognition of assets and liabilities by lessees for those leases currently classified as operating leases. The guidance also requires disclosures to meet the objective of enabling users of financial statements to assess the amount, timing, and uncertainty of cash flows arising from leases. This guidance is effective for the Company beginning July 1, 2019. Early adoption is permitted. The Company expects that this guidance may have a material impact on its financial statements and is currently evaluating the impact of this guidance on its financial statements on adoption.
In March 2016, the FASB issued guidance regarding Improvements to Employee Share-Based Payment Accounting. The guidance simplifies several aspects of the accounting for employee share-based payment transactions for both public and nonpublic entities, including the accounting for income taxes, forfeitures, and statutory tax withholding requirements, as well as classification in the statement of cash flows. This guidance is effective for the Company beginning July 1, 2017. Early adoption is permitted. The Company is currently assessing the impact of this guidance on its financial statements disclosure.
In June 2016, the FASB issued guidance regarding Measurement of Credit Losses on Financial Instruments. The guidance replaces the incurred loss impairment methodology in current GAAP with a methodology that reflects expected credit losses and requires consideration of a broader range of reasonable and supportable information to inform credit loss estimates. For trade and other receivables, loans, and other financial instruments, a entity is required to use a forward-looking expected loss model rather than the incurred loss model for recognizing credit losses which reflects losses that are probable. Credit losses relating to available-for-sale debt securities will also be recorded through an allowance for credit losses rather than as a reduction in the amortized cost basis of the securities. This guidance is effective for the Company beginning July 1, 2020. Early adoption is permitted beginning July 1, 2019. The Company is currently assessing the impact of this guidance on its financial statements disclosure.
F-20
| NET 1 UEPS TECHNOLOGIES, INC. |
| Notes to the consolidated financial statements |
| for the years ended June 30, 2016, 2015 and 2014 |
| (All amounts stated in thousands of United States Dollars, unless otherwise stated) |
| 3. | ACQUISITIONS |
The cash paid, net of cash received related to the Company’s various acquisitions during the years ended June 30, 2016, 2015 and 2014 are summarized in the table below:
| 2016 | 2015 | 2014 | ||||||||
| Transact24 Limited (“Transact24”) | $ | 1,666 | $ | - | $ | - | ||||
| Masterpayment AG (“Masterpayment”) | 14,101 | - | - | |||||||
| Total cash paid, net of cash received | $ | 15,767 | $ | - | $ | - |
2016 acquisitions
Transact24 Limited
On January 20, 2016, the Company acquired the remaining 56% of the issued and outstanding ordinary shares of Transact24 for $3.0 million in cash and through the issue of 391,645 shares of the Company’s common stock with an aggregate issue date fair value of approximately $4.0 million. Transact24 is a specialist Hong Kong-based payment services company and is now a wholly-owned subsidiary. The Company acquired approximately 44% of Transact24 in May 2015. Philip Meyer, Managing Director of Transact24 and an industry veteran in the international payments and transaction processing industries, has become an executive officer of the Company.
The Company elected to settle part of the purchase price in shares in order to appropriately align the T24 management team with the Company and its global strategy. The parties have agreed that 50% of the Company’s shares issued in the transaction are contractually restricted as to resale until after June 30, 2016, and the remaining 50% of the shares are so restricted until after June 30, 2017.
Masterpayment AG
In April 2016, the Company acquired a 60% interest in Masterpayment AG (“Masterpayment”), a specialist payment services processor based in Munich, Germany for approximately $9.4 million and paid a contractually agreed EBITDA earn-out of $5.4 million in June 2016, for a total purchase consideration of $14.8 million. Masterpayment provides payment and acquiring services for all major European debit and credit cards; and invoicing for online retail, digital goods and content. Masterpayment currently has a client portfolio of approximately 5,000 registered merchants.
The final purchase price allocation of Transact24 and Masterpayment acquisitions, translated at the foreign exchange rates applicable on the date of acquisition, is provided in the table below:
| Transact24 | Masterpayment | Total | ||||||||
| Cash and cash equivalents | $ | 1,334 | $ | 665 | $ | 1,999 | ||||
| Accounts receivable | 2,019 | 765 | 2,784 | |||||||
| Property, plant and equipment, net | 154 | 18 | 172 | |||||||
| Deferred tax assets | 1,070 | - | 1,070 | |||||||
| Intangible assets (Note 9) | 4,974 | 9,428 | 14,402 | |||||||
| Goodwill (Note 9) | 6,024 | 17,084 | 23,108 | |||||||
| Accounts payables and other payables | (1,898 | ) | (1,114 | ) | (3,012 | ) | ||||
| Deferred tax liabilities | (1,243 | ) | (2,236 | ) | (3,479 | ) | ||||
| Fair value of assets and liabilities on acquisition | 12,434 | 24,610 | 37,044 | |||||||
| Less: fair value of equity-accounted investment, comprising: | (5,471 | ) | - | (5,471 | ) | |||||
| Less: gain on re-measurement of previously held interest | (1,908 | ) | - | (1,908 | ) | |||||
| Less: carrying value at the acquisition date | (3,563 | ) | - | (3,563 | ) | |||||
| Less: fair value attributable to controlling interests on acquisition date . | - | (9,844 | ) | (9,844 | ) | |||||
| Total purchase price | $ | 6,963 | 14,766 | $ | 21,729 | |||||
| Add: carrying value of non-controlling interests acquired | 9,867 | |||||||||
| Add: adjustment to Net1 equity (Note 14) | 1,322 | |||||||||
| Cash paid for non-controlling interest (Note 14) | 11,189 | |||||||||
| Total consideration paid for Masterpayment | $ | 25,955 |
F-21
| NET 1 UEPS TECHNOLOGIES, INC. |
| Notes to the consolidated financial statements |
| for the years ended June 30, 2016, 2015 and 2014 |
| (All amounts stated in thousands of United States Dollars, unless otherwise stated) |
| 3. | ACQUISITIONS |
2016 acquisitions (continued)
Pro forma results of operations have not been presented because the effect of the Transact24 and Masterpayment acquisitions, individually and in the aggregate, were not material to the Company. During the year ended June 30, 2016, the Company incurred acquisition-related expenditure of $0.2 million related to these acquisitions. Since the closing of the Transact24 acquisition, it has contributed revenue and net income of $3.8 million and $0.03 million, respectively, for the year ended June 30, 2016. Since the closing of the Masterpayment acquisition, it has contributed revenue and net loss, after acquired intangible asset amortization, net of taxation, non-controlling interest, of $2.4 million and $0.04 million, respectively, for the year ended June 30, 2016.
2015 acquisitions
None.
2014 acquisitions
None.
| 4. | PRE-FUNDED SOCIAL WELFARE GRANTS RECEIVABLE |
Pre-funded social welfare grants receivable represents amounts pre-funded by the Company to certain merchants participating in the merchant acquiring system. The July 2016 payment service commenced on July 1, 2016, but the Company pre-funded certain merchants participating in the merchant acquiring systems in the last two days of June 2016. The July 2015 payment service commenced on July 1, 2015, but the Company pre-funded certain merchants participating in the merchant acquiring systems in the last two days of June 2015.
| 5. | ACCOUNTS RECEIVABLE, net and FINANCE LOANS RECEIVABLE, net |
Accounts receivable, net
| 2016 | 2015(1) | ||||||
| Accounts receivable, trade, net | $ | 57,563 | $ | 67,399 | |||
| Accounts receivable, trade, gross | 59,232 | 69,355 | |||||
| Allowance for doubtful accounts receivable, end of year | 1,669 | 1,956 | |||||
| Beginning of year | 1,956 | 1,313 | |||||
| Reversed to statement of operations | (68) | (61) | |||||
| Charged to statement of operations | 388 | 1,580 | |||||
| Utilized | (361) | (654) | |||||
| Foreign currency adjustment | (246) | (222) | |||||
| Current portion of payments to agents in South Korea amortized over the contract period | 26,572 | 25,998 | |||||
| Payments to agents in South Korea amortized over the contract period | 52,469 | 53,431 | |||||
| Less: Payments to agents in South Korea amortized over the contract period included in other long-term assets (Note 1) | 25,897 | 27,433 | |||||
| Other receivables | 23,670 | 27,938 | |||||
| Total accounts receivable, net | $ | 107,805 | $ | 121,335 |
(1) – Receivables from the sale of prepaid products of $18,448 as of June 30, 2015, have been reclassified from Other receivables to Accounts receivable, trade, gross.
F-22
| NET 1 UEPS TECHNOLOGIES, INC. |
| Notes to the consolidated financial statements |
| for the years ended June 30, 2016, 2015 and 2014 |
| (All amounts stated in thousands of United States Dollars, unless otherwise stated) |
| 5. | ACCOUNTS RECEIVABLE, net and FINANCE LOANS RECEIVABLE, net (continued) |
Accounts receivable, net (continued)
Receivables from customers renting POS equipment from the Company are included in accounts receivable, trade, and are stated net of an allowance for certain amounts that the Company’s management has identified may be unrecoverable. Accounts receivable, trade, also includes amounts due from customers from the sale of hardware, software licenses and SIM cards and provision of transaction processing services. During the years ended June 30, 2016 and 2014, the Company recorded a bad debt expense of $1.2 million and $0.6 million, respectively. The Company did not record a bad debt expense during the year ended June 30, 2015.
Finance loans receivable, net
| 2016 | 2015 | |||||||
| Finance loans receivable, gross | $ | 41,503 | $ | 44,600 | ||||
| Allowance for doubtful finance loans receivable, end of year | 4,494 | 4,227 | ||||||
| Beginning of year | 4,227 | 3,083 | ||||||
| Charged to statement of operations | 2,113 | 3,392 | ||||||
| Utilized | (1,105 | ) | (1,705 | ) | ||||
| Foreign currency adjustment | (741 | ) | (543 | ) | ||||
| Total finance loans receivable, net | $ | 37,009 | $ | 40,373 |
The Company did not expense any unrecoverable finance loans receivable during the year ended June 30, 2016, 2015 and 2014, respectively, because these loans were written off directly against the allowance for doubtful finance loans receivable.
| 6. | INVENTORY |
The Company’s inventory as of June 30, 2016 and 2015, is presented in the table below:
| 2016 | 2015 | ||||||
| Finished goods | $ | 10,004 | $ | 12,979 | |||
| $ | 10,004 | $ | 12,979 |
| 7. | FAIR VALUE OF FINANCIAL INSTRUMENTS |
Fair value of financial instruments
Initial recognition and measurement
Financial instruments are recognized when the Company becomes a party to the transaction. Initial measurements are at cost, which includes transaction costs.
Risk management
The Company seeks to reduce its exposure to currencies other than the South African rand through a policy of matching, to the extent possible, assets and liabilities denominated in those currencies. In addition, the Company uses financial instruments in order to economically hedge its exposure to exchange rate and interest rate fluctuations arising from its operations. The Company is also exposed to equity price and liquidity risks as well as credit risks.
F-23
| NET 1 UEPS TECHNOLOGIES, INC. |
| Notes to the consolidated financial statements |
| for the years ended June 30, 2016, 2015 and 2014 |
| (All amounts stated in thousands of United States Dollars, unless otherwise stated) |
| 7. | FAIR VALUE OF FINANCIAL INSTRUMENTS |
Fair value of financial instruments
Risk management (continued)
Currency exchange risk
The Company is subject to currency exchange risk because it purchases inventories that it is required to settle in other currencies, primarily the euro and U.S. dollar. The Company has used forward contracts in order to limit its exposure in these transactions to fluctuations in exchange rates between the South African rand, on the one hand, and the U.S. dollar and the euro, on the other hand.
Translation risk
Translation risk relates to the risk that the Company’s results of operations will vary significantly as the U.S. dollar is its reporting currency, but it earns most of its revenues and incurs most of its expenses in ZAR. The U.S. dollar to ZAR exchange rate has fluctuated significantly over the past three years. As exchange rates are outside the Company’s control, there can be no assurance that future fluctuations will not adversely affect the Company’s results of operations and financial condition.
Interest rate risk
As a result of its normal borrowing and leasing activities, the Company’s operating results are exposed to fluctuations in interest rates, which it manages primarily through regular financing activities. The Company generally maintains limited investment in cash equivalents and has occasionally invested in marketable securities.
Credit risk
Credit risk relates to the risk of loss that the Company would incur as a result of non-performance by counterparties. The Company maintains credit risk policies with regard to its counterparties to minimize overall credit risk. These policies include an evaluation of a potential counterparty’s financial condition, credit rating, and other credit criteria and risk mitigation tools as the Company’s management deems appropriate.
With respect to credit risk on financial instruments, the Company maintains a policy of entering into such transactions only with South African and European financial institutions that have a credit rating of BBB or better, as determined by credit rating agencies such as Standard & Poor’s, Moody’s and Fitch Ratings.
UEPS-based microlending credit risk
The Company is exposed to credit risk in its UEPS-based microlending activities, which provides unsecured short-term loans to qualifying customers. The Company manages this risk by performing an affordability test for each prospective customer and assigns a “creditworthiness score”, which takes into account a variety of factors such as other debts and total expenditures on normal household and lifestyle expenses.
Equity price and liquidity risk
Equity price risk relates to the risk of loss that the Company would incur as a result of the volatility in the exchange-traded price of equity securities that it holds and the risk that it may not be able to liquidate these securities. The market price of these securities may fluctuate for a variety of reasons, consequently, the amount the Company may obtain in a subsequent sale of these securities may significantly differ from the reported market value.
Liquidity risk relates to the risk of loss that the Company would incur as a result of the lack of liquidity on the exchange on which these securities are listed. The Company may not be able to sell some or all of these securities at one time, or over an extended period of time without influencing the exchange traded price, or at all.
F-24
| NET 1 UEPS TECHNOLOGIES, INC. |
| Notes to the consolidated financial statements |
| for the years ended June 30, 2016, 2015 and 2014 |
| (All amounts stated in thousands of United States Dollars, unless otherwise stated) |
| 7. | FAIR VALUE OF FINANCIAL INSTRUMENTS (continued) |
Financial instruments
Fair value is defined as the price that would be received upon sale of an asset or paid upon transfer of a liability in an orderly transaction between market participants at the measurement date and in the principal or most advantageous market for that asset or liability. The fair value should be calculated based on assumptions that market participants would use in pricing the asset or liability, not on assumptions specific to the entity. In addition, the fair value of liabilities should include consideration of non-performance risk including the Company’s own credit risk.
Fair value measurements and inputs are categorized into a fair value hierarchy which prioritizes the inputs into three levels based on the extent to which inputs used in measuring fair value are observable in the market. Each fair value measurement is reported in one of the three levels which is determined by the lowest level input that is significant to the fair value measurement in its entirety.
These levels are:
| • | Level 1 – inputs are based upon unadjusted quoted prices for identical instruments traded in active markets. |
|
|
||
| • | Level 2 – inputs are based upon quoted prices for similar instruments in active markets, quoted prices for identical or similar instruments in markets that are not active, and model-based valuation techniques for which all significant assumptions are observable in the market or can be corroborated by observable market data for substantially the full term of the assets or liabilities. |
|
|
||
| • | Level 3 – inputs are generally unobservable and typically reflect management’s estimates of assumptions that market participants would use in pricing the asset or liability. The fair values are therefore determined using model-based techniques that include option pricing models, discounted cash flow models, and similar techniques. |
The following section describes the valuation methodologies the Company uses to measure financial assets and liabilities at fair value.
Investments in common stock
In general, and where applicable, the Company uses quoted prices in active markets for identical assets or liabilities to determine fair value. This pricing methodology would apply to Level 1 investments. If quoted prices in active markets for identical assets or liabilities are not available to determine fair value, then the Company uses quoted prices for similar assets and liabilities or inputs other than the quoted prices that are observable either directly or indirectly. These investments would be included in Level 2 investments. In circumstances in which inputs are generally unobservable, values typically reflect management’s estimates of assumptions that market participants would use in pricing the asset or liability. The fair values are therefore determined using model-based techniques that include option pricing models, discounted cash flow models, and similar techniques. Investments valued using such techniques are included in Level 3 investments.
Asset measured at fair value using significant unobservable inputs – investment in Finbond Group Limited (“Finbond”)
During the year ended June 30, 2016, the Company determined that it was able to exert significant influence on Finbond due to its representation on the board of directors (from April 2016) and the level of its shareholding. Accordingly, the Company has recognized its investment in Finbond using the equity method from April 1, 2016. Up until this date, the Company had no rights to participate in the financial, operating, or governance decisions made by Finbond. The Company also had no participation on Finbond’s board of directors whether through contractual agreement or otherwise. Consequently, the Company had concluded that it did not have significant influence over Finbond and therefore equity accounting was not appropriate up until March 31, 2016, and Finbond was carried as an available for sale asset up until that date. The Company’s ownership interest in Finbond as of June 30, 2016, was approximately 26% (representing 197,522,435 shares of common stock). In March 2016, Finbond completed a rights offering in which the Company acquired an additional 40,733,723 shares for approximately $8.9 million.
F-25
| NET 1 UEPS TECHNOLOGIES, INC. |
| Notes to the consolidated financial statements |
| for the years ended June 30, 2016, 2015 and 2014 |
| (All amounts stated in thousands of United States Dollars, unless otherwise stated) |
| 7. | FAIR VALUE OF FINANCIAL INSTRUMENTS (continued) |
Financial instruments (continued)
Asset measured at fair value using significant unobservable inputs – investment in Finbond Group Limited (“Finbond”) (continued)
The Company’s Level 3 asset as of June 30, 2015, represented an investment of 156,788,712 shares of common stock of Finbond, which are exchange-traded equity securities. Finbond’s shares are traded on the Johannesburg Stock Exchange (“JSE”) and the Company has designated such shares as available for sale investments. The Company had concluded that the market for Finbond shares was not active and consequently had employed alternative valuation techniques in order to determine the fair value of such stock. Finbond issues financial products and services under a mutual banking licence and also has a microlending offering. In determining the fair value of Finbond, the Company considered amongst other things Finbond’s historical financial information (including its most recent public accounts), press releases issued by Finbond and its published net asset value. The Company believed that the best indicator of fair value of Finbond is its published net asset value and used this value to determine the fair value.
The fair value of these securities as of June 30, 2015, represented approximately 1% of the Company’s total assets, including these securities. The Company expects to hold these securities for an extended period of time and it is not concerned with short-term equity price volatility with respect to these securities provided that the underlying business, economic and management characteristics of the company remain sound.
Derivative transactions - Foreign exchange contracts
As part of the Company’s risk management strategy, the Company enters into derivative transactions to mitigate exposures to foreign currencies using foreign exchange contracts. These foreign exchange contracts are over-the-counter derivative transactions. Substantially all of the Company’s derivative exposures are with counterparties that have long-term credit ratings of BBB or better. The Company uses quoted prices in active markets for similar assets and liabilities to determine fair value (level 2). The Company has no derivatives that require fair value measurement under level 1 or 3 of the fair value hierarchy.
The Company’s outstanding foreign exchange contracts are as follows:
As of June 30, 2016
| Fair market | ||||
| Notional amount | Strike price | value price | Maturity | |
| EUR 573,765.00 | ZAR 15.9587 | ZAR 16.3393 | July 20, 2016 | |
| EUR 554,494.50 | ZAR 16.0643 | ZAR 16.4564 | August 19, 2016 | |
| EUR 465,711.00 | ZAR 16.1798 | ZAR 16.582 | September 20, 2016 | |
| EUR 393,675.00 | ZAR 16.2911 | ZAR 16.7017 | October 20, 2016 | |
| EUR 302,368.50 | ZAR 16.4085 | ZAR 16.8301 | November 21, 2016 |
As of June 30, 2015
| Fair market | ||||
| Notional amount | Strike price | value price | Maturity | |
| EUR 526,263.00 | ZAR 15.1145 | ZAR 13.6275 | July 20, 2015 | |
| EUR 526,263.00 | ZAR 15.2025 | ZAR 13.7062 | August 20, 2015 | |
| EUR 526,263.00 | ZAR 15.2944 | ZAR 13.7898 | September 21, 2015 | |
| EUR 526,263.00 | ZAR 15.3809 | ZAR 13.8683 | October 20, 2015 | |
| EUR 509,516.00 | ZAR 15.4728 | ZAR 13.9540 | November 20, 2015 | |
| EUR 529,865.00 | ZAR 15.5654 | ZAR 14.0397 | December 21, 2015 | |
| EUR 526,663.00 | ZAR 15.6625 | ZAR 14.1239 | January 20, 2016 |
F-26
| NET 1 UEPS TECHNOLOGIES, INC. |
| Notes to the consolidated financial statements |
| for the years ended June 30, 2016, 2015 and 2014 |
| (All amounts stated in thousands of United States Dollars, unless otherwise stated) |
| 7. | FAIR VALUE OF FINANCIAL INSTRUMENTS (continued) |
Financial instruments (continued)
The following table presents the Company’s assets measured at fair value on a recurring basis as of June 30, 2016, according to the fair value hierarchy:
| Quoted | |||||||||||||
| Price in | |||||||||||||
| Active | Significant | ||||||||||||
| Markets for | Other | Significant | |||||||||||
| Identical | Observable | Unobservable | |||||||||||
| Assets | Inputs | Inputs | |||||||||||
| (Level 1) | (Level 2) | (Level 3) | Total | ||||||||||
| Assets | |||||||||||||
| Related to insurance business (included in other long-term assets): | |||||||||||||
| Cash and cash equivalents | $ | 533 | $ | - | $ | - | $ | 533 | |||||
| Foreign exchange contracts | - | 62 | - | 62 | |||||||||
| Other | - | 37 | - | 37 | |||||||||
| Total assets at fair value | $ | 533 | $ | 99 | $ | - | $ | 632 |
The following table presents the Company’s assets and liabilities measured at fair value on a recurring basis as of June 30, 2015, according to the fair value hierarchy:
| Price in | |||||||||||||
| Active | Significant | ||||||||||||
| Markets for | Other | Significant | |||||||||||
| Identical | Observable | Unobservable | |||||||||||
| Assets | Inputs | Inputs | |||||||||||
| (Level 1) | (Level 2) | (Level 3) | Total | ||||||||||
| Assets | |||||||||||||
| Related to insurance business (included in other long-term assets): | |||||||||||||
| Cash and cash equivalents | $ | 1,640 | $ | - | $ | - | $ | 1,640 | |||||
| Investment in Finbond (available for sale assets included in other long-term assets) | - | - | 7,488 | 7,488 | |||||||||
| Other | - | 1,259 | - | 1,259 | |||||||||
| Total assets at fair value | $ | 1,640 | $ | 1,259 | $ | 7,488 | $ | 10,387 | |||||
| Liabilities | |||||||||||||
| Foreign exchange contracts | $ | - | $ | 452 | $ | - | $ | 452 | |||||
| Total liabilities at fair value | $ | - | $ | 452 | $ | - | $ | 452 |
Changes in the Company’s investment in Finbond (Level 3 that are measured at fair value on a recurring basis) were insignificant during the years ended June 30, 2016 and 2015, respectively. During the year ended June 30, 2016, the Company determined that it was able to exert significant influence on Finbond and transferred the carrying value as of April 1, 2016, to equity-accounted investments. There have been no transfers in or out of Level 3 during the years ended June 30, 2015.
F-27
| NET 1 UEPS TECHNOLOGIES, INC. |
| Notes to the consolidated financial statements |
| for the years ended June 30, 2016, 2015 and 2014 |
| (All amounts stated in thousands of United States Dollars, unless otherwise stated) |
| 7. | FAIR VALUE OF FINANCIAL INSTRUMENTS (continued) |
Financial instruments (continued)
Trade, finance loans and other receivables
Trade, finance loans and other receivables originated by the Company are stated at cost less allowance for doubtful accounts receivable. The fair value of trade, finance loans and other receivables approximate their carrying value due to their short-term nature.
Trade and other payables
The fair values of trade and other payables approximates their carrying amounts, due to their short-term nature.
Assets and liabilities measured at fair value on a nonrecurring basis
The Company measures its assets at fair value on a nonrecurring basis when they are deemed to be other-than-temporarily impaired. The Company has no liabilities that are measured at fair value on a nonrecurring basis. The Company reviews the carrying values of its assets when events and circumstances warrant and considers all available evidence in evaluating when declines in fair value are other-than-temporary. The fair values of the Company’s assets are determined using the best information available, and may include quoted market prices, market comparables, and discounted cash flow projections. An impairment charge is recorded when the cost of the assets exceeds its fair value and the excess is determined to be other-than-temporary. The Company has not recorded any impairment charges during the reporting periods presented herein. The Company owns 25% of One Credit Limited and has provided it a credit facility of up to $10 million in the form of convertible debt, none of which had been utilized as of June 30, 2016 and 2015, respectively.
| 8. | PROPERTY, PLANT AND EQUIPMENT, net |
Summarized below is the cost, accumulated depreciation and carrying amount of property, plant and equipment as of June 30, 2016 and 2015:
| 2016 | 2015 | ||||||
| Cost: | |||||||
| Land | $ | 851 | $ | 869 | |||
| Building and structures | 467 | 477 | |||||
| Computer equipment | 130,998 | 121,033 | |||||
| Furniture and office equipment | 7,262 | 6,295 | |||||
| Motor vehicles | 15,368 | 17,660 | |||||
| Plant and equipment | - | - | |||||
| 154,946 | 146,334 | ||||||
| Accumulated depreciation: | |||||||
| Land | - | - | |||||
| Building and structures | 151 | 134 | |||||
| Computer equipment | 81,423 | 75,681 | |||||
| Furniture and office equipment | 5,048 | 4,901 | |||||
| Motor vehicles | 13,347 | 13,298 | |||||
| Plant and equipment | - | - | |||||
| 99,969 | 94,014 | ||||||
| Carrying amount: | |||||||
| Land | 851 | 869 | |||||
| Building and structures | 316 | 343 | |||||
| Computer equipment | 49,575 | 45,352 | |||||
| Furniture and office equipment | 2,214 | 1,394 | |||||
| Motor vehicles | 2,021 | 4,362 | |||||
| Plant and equipment | - | - | |||||
| $ | 54,977 | $ | 52,320 |
F-28
| NET 1 UEPS TECHNOLOGIES, INC. |
| Notes to the consolidated financial statements |
| for the years ended June 30, 2016, 2015 and 2014 |
| (All amounts stated in thousands of United States Dollars, unless otherwise stated) |
| 9. | GOODWILL AND INTANGIBLE ASSETS, net |
Goodwill
Summarized below is the movement in the carrying value of goodwill for the years ended June 30, 2016, 2015 and 2014:
| Gross | Accumulated | Carrying | ||||||||
| value | impairment | value | ||||||||
| Balance as of July 1, 2013 | $ | 218,558 | $ | (42,752 | ) | $ | 175,806 | |||
| Loss on liquidation of Net1
Universal Electronic Technologies (Austria) GmbH and associated entities (“Net1 UTA”) (Note 19) |
(44,445 | ) | 44,445 | - | ||||||
| Foreign currency adjustment(1) | 12,463 | (1,693 | ) | 10,770 | ||||||
| Balance as of June 30, 2014 | 186,576 | - | 186,576 | |||||||
| Foreign currency adjustment(1) | (20,139 | ) | - | (20,139 | ) | |||||
| Balance as of June 30, 2015 | 166,437 | - | 166,437 | |||||||
| Acquisition of Transact24 (Note 3) | 6,024 | - | 6,024 | |||||||
| Acquisition of Masterpayment (Note 3) | 17,084 | - | 17,084 | |||||||
| Foreign currency adjustment(1) | (10,067 | ) | - | (10,067 | ) | |||||
| Balance as of June 30, 2016 | $ | 179,478 | $ | - | $ | 179,478 |
(1) – the foreign currency adjustment represents the effects of the fluctuations between the South African rand, Euro and the Korean won, and the U.S. dollar on the carrying value.
Goodwill associated with the acquisition of Transact24 and Masterpayment represents the excess of cost over the fair value of acquired net assets. The Transact24 and Masterpayment goodwill is not deductible for tax purposes. See Note 3 for the allocation of the purchase price to the fair value of acquired net assets. Transact24 and Masterpayment have both been allocated to the Company’s International transaction processing operating segment.
The Company assesses the carrying value of goodwill for impairment annually, or more frequently, whenever events occur and circumstances change indicating potential impairment. The Company performs its annual impairment test as of June 30 of each year. The results of our impairment tests during the year ended June 30, 2016 and 2015, indicated that the fair value of the Company’s reporting units exceeded their carrying values and therefore the Company’s reporting units were not at risk of potential impairment.
Goodwill has been allocated to the Company’s reportable segments as follows:
| South | Financial | ||||||||||||
| African | International | inclusion and | |||||||||||
| transaction | transaction | applied | Carrying | ||||||||||
| processing | processing | technologies | value | ||||||||||
| Balance as of June 30, 2014 | $ | 28,517 | $ | 128,427 | $ | 29,632 | $ | 186,576 | |||||
| Foreign currency adjustment(1) | (3,938 | ) | (12,908 | ) | (3,293 | ) | (20,139 | ) | |||||
| Balance as of June 30, 2015 | 24,579 | 115,519 | 26,339 | 166,437 | |||||||||
| Acquisition of Transact24 (Note 3) | - | 6,024 | - | 6,024 | |||||||||
| Acquisition of Masterpayment (Note 3) | - | 17,084 | - | 17,084 | |||||||||
| Foreign currency adjustment(1) | (4,154 | ) | (2,442 | ) | (3,471 | ) | (10,067 | ) | |||||
| Balance as of June 30, 2016 | $ | 20,425 | $ | 136,185 | $ | 22,868 | $ | 179,478 |
(1) – the foreign currency adjustment represents the effects of the fluctuations between the South African rand, Euro and the Korean won, and the U.S. dollar on the carrying value.
F-29
| NET 1 UEPS TECHNOLOGIES, INC. |
| Notes to the consolidated financial statements |
| for the years ended June 30, 2016, 2015 and 2014 |
| (All amounts stated in thousands of United States Dollars, unless otherwise stated) |
| 9. | GOODWILL AND INTANGIBLE ASSETS, net (continued) |
Intangible assets, net
Summarized below is the fair value of intangible assets acquired, translated at the exchange rate applicable as of the relevant acquisition dates, and the weighted-average amortization period:
| Weighted- | |||||||
| Fair value as | Average | ||||||
| of acquisition | Amortization | ||||||
| date | period (in years) | ||||||
| Finite-lived intangible asset: | |||||||
| Transact24 customer relationships | $ | 3,749 | 5 | ||||
| Masterpayment customer relationships | 6,595 | 5 | |||||
| Transact24 software and unpatented technology | 1,225 | 3 | |||||
| Masterpayment software and unpatented technology | 1,765 | 3 | |||||
| Masterpayment trademarks | $ | 1,068 | 5 |
The Company recognized a deferred tax liability of approximately $3.5 million related to the acquisition of the Transact24 and Masterpayment intangible assets during the year ended June 30, 2016.
The Company assesses the carrying value of intangible assets for impairment whenever events occur or circumstances change indicating that the carrying amount of the intangible asset may not be recoverable. No intangible assets have been impaired during the years ended June 30, 2016, 2015 and 2014, respectively.
Summarized below is the carrying value and accumulated amortization of intangible assets as of June 30, 2016 and 2015:
| As of June 30, 2016 | As of June 30, 2015 | ||||||||||||||||||
| Gross | Net | Gross | Net | ||||||||||||||||
| carrying | Accumulated | carrying | carrying | Accumulated | carrying | ||||||||||||||
| value | amortization | value | value | amortization | value | ||||||||||||||
| Finite-lived intangible assets: | |||||||||||||||||||
| Customer relationships(1) | 94,529 | $ | (51,557 | ) | $ | 42,972 | $ | 88,109 | $ | (45,312 | ) | $ | 42,797 | ||||||
| Software and unpatented technology(1) | 31,452 | (28,791 | ) | 2,661 | 29,964 | (28,323 | ) | 1,641 | |||||||||||
| FTS patent | 2,592 | (2,592 | ) | - | 3,119 | (3,119 | ) | - | |||||||||||
| Exclusive licenses | 4,506 | (4,506 | ) | - | 4,506 | (4,506 | ) | - | |||||||||||
| Trademarks(1) | 6,685 | (3,762 | ) | 2,923 | 6,094 | (3,408 | ) | 2,686 | |||||||||||
| Total finite-lived intangible assets . | $ | 139,764 | $ | (91,208 | ) | $ | 48,556 | $ | 131,792 | $ | (84,668 | ) | $ | 47,124 | |||||
(1) Includes the trademarks acquired in the Masterpayment acquisition as well as the customer relationships and software and unpatented technology acquired as part of the Transact24 and Masterpayment acquisition in January 2016 and April 2016, respectively.
Amortization expense charged for the years to June 30, 2016, 2015 and 2014 was $11.2 million, $19.4 million, and $16.6 million, respectively.
Future estimated annual amortization expense for the next five fiscal years, assuming exchange rates prevailing on June 30, 2016, is presented in the table below. Actual amortization expense in future periods could differ from this estimate as a result of acquisitions, changes in useful lives, exchange rate fluctuations and other relevant factors.
| 2017 | $ | 11,919 | ||
| 2018 | 11,305 | |||
| 2019 | 10,686 | |||
| 2020 | 9,986 | |||
| 2021 | 4,315 | |||
| Thereafter | $ | 345 |
F-30
| NET 1 UEPS TECHNOLOGIES, INC. |
| Notes to the consolidated financial statements |
| for the years ended June 30, 2016, 2015 and 2014 |
| (All amounts stated in thousands of United States Dollars, unless otherwise stated) |
| 10. | REINSURANCE ASSETS AND POLICY HOLDER LIABILITIES UNDER INSURANCE AND INVESTMENT CONTRACTS |
Assets and policy holder liabilities under investment contracts
Summarized below is the movement in assets and policy holder liabilities under investment contracts during the years ended June 30, 2016 and 2015:
| Investment | |||||||
| Assets(1) | contracts(2) | ||||||
| Balances acquired on July 1, 2014 | $ | 688 | $ | (688 | ) | ||
| Foreign currency adjustment(3) | (95 | ) | 95 | ||||
| Balance as of June 30, 2015 | $ | 593 | $ | (593 | ) | ||
| Increase in policy holder benefits under investment contracts | 35 | (35 | ) | ||||
| Foreign currency adjustment(3) | (100 | ) | 100 | ||||
| Balance as of June 30, 2016 | $ | 528 | $ | (528 | ) |
(1) Included in other long-term assets;
(2) Included in other long-term liabilities;
(3) The foreign currency
adjustment represents the effects of the fluctuations between the ZAR against
the U.S. dollar.
The Company does not offer any investment products with guarantees related to capital or returns.
Reinsurance assets and policy holder liabilities under insurance contracts
Summarized below is the movement in reinsurance assets and policy holder liabilities under insurance contracts during the years ended June 30, 2016 and 2015:
| Reinsurance | Insurance | ||||||
| assets(1) | contracts(2) | ||||||
| Balances acquired on July 1, 2014 | $ | 21,062 | $ | (21,478 | ) | ||
| Claims and policyholders’ benefits under insurance contracts | 30 | (55 | ) | ||||
| Transfer to reinsurer(3) | (18,000 | ) | 18,000 | ||||
| Foreign currency adjustment(4) | (2,909 | ) | 2,966 | ||||
| Balance as of June 30, 2015 | 183 | (567 | ) | ||||
| Increase in policy holder benefits under insurance contracts | 463 | (1,408 | ) | ||||
| Claims and policyholders’ benefits under insurance contracts | (444 | ) | 801 | ||||
| Foreign currency adjustment(4) | (31 | ) | 96 | ||||
| Balance as of June 30, 2016 | $ | 171 | $ | (1,078 | ) |
(1) Included in other long-term assets;
(2) Included in other long-term liabilities;
(3) Smart Life has agreed
to transfer certain fully reinsured policies to the reinsurer pursuant to
conditions imposed by the South African Financial Service Board to uplift the
suspension of its life insurance license.
(4) The foreign currency
adjustment represents the effects of the fluctuations between the ZAR against
the U.S. dollar.
The Company has agreements with reinsurance companies in order to limit its losses from large insurance contracts, however, if the reinsurer is unable to meet its obligations, the Company retains the liability.
F-31
| NET 1 UEPS TECHNOLOGIES, INC. |
| Notes to the consolidated financial statements |
| for the years ended June 30, 2016, 2015 and 2014 |
| (All amounts stated in thousands of United States Dollars, unless otherwise stated) |
| 11. | OTHER PAYABLES |
Summarized below is the breakdown of other payables as of June 30, 2016 and 2015:
| 2016 | 2015 | ||||||
| Accruals | $ | 12,588 | $ | 14,484 | |||
| Provisions | 10,461 | 17,015 | |||||
| Other | 7,981 | 9,361 | |||||
| Value-added tax payable | 5,022 | 3,327 | |||||
| Payroll-related payables | 992 | 1,008 | |||||
| Participating merchants settlement obligation | 435 | 400 | |||||
| $ | 37,479 | $ | 45,595 |
| 12. | SHORT-TERM FACILITIES |
South Africa
The aggregate amount of the Company’s short-term South African credit facility with Nedbank Limited is up to ZAR 400 million ($27.1 million) and consists of (i) a primary amount of up to ZAR 200 million ($13.5 million), which is immediately available, and (ii) a secondary amount of up to ZAR 200 million($13.5 million), which is not immediately available (all amounts denominated in ZAR and translated at exchange rates applicable as of June 30, 2016). The primary amount comprises an overdraft facility of up to ZAR 50 million ($3.4 million) and indirect and derivative facilities of up to ZAR 150 million ($10.1 million), which include letters of guarantee, letters of credit and forward exchange contracts (all amounts denominated in ZAR and translated at exchange rates applicable as of June 30, 2016). As of June 30, 2016, the interest rate on the overdraft facility was 9.35% . The Company has ceded its investment in Cash Paymaster Services Proprietary Limited (“CPS”), a wholly owned South African subsidiary, as security for its repayment obligations under the facility. A commitment fee of 0.35% per annum is payable on the monthly unutilized amount of the overdraft portion of the short-term facility. The Company is required to comply with customary non-financial covenants, including, without limitation, covenants that restrict its ability to dispose of or encumber its assets, incur additional indebtedness or engage in certain business combinations.
F-32
| NET 1 UEPS TECHNOLOGIES, INC. |
| Notes to the consolidated financial statements |
| for the years ended June 30, 2016, 2015 and 2014 |
| (All amounts stated in thousands of United States Dollars, unless otherwise stated) |
| 12. | SHORT-TERM FACILITIES (continued) |
South Africa (continued)
As of each of June 30, 2016 and 2015, respectively, the Company had not utilized any of its overdraft facility. As of June 30, 2016, the Company had utilized approximately ZAR 131.1 million ($8.9 million, translated at exchange rates applicable as of June 30, 2016) of its ZAR 150 million indirect and derivative facilities to obtain foreign exchange contracts from the bank and to enable the bank to issue guarantees, including stand-by letters of credit, in order for the Company to honor its obligations to third parties requiring such guarantees (refer to Note 24). As of June 30, 2015, the Company had utilized approximately ZAR 139.6 million ($11.4 million, translated at exchange rates applicable as of June 30, 2015) of its ZAR 150 million indirect and derivative facilities.
South Korea
The Company obtained a one year KRW 10 billion short-term overdraft facility from Hana Bank, a South Korean bank, in January 2014. The facility expires annually and was again renewed in January 2016 for one more year and now expires in January 2017. As of June 30, 2016, the interest rate on the overdraft facility was 3.31% . The Company has ceded the warehouse it owns in South Korea as security for its repayment obligations under the facility. As of each of June 30, 2016 and 2015, respectively, the Company had not utilized any of its KRW 10.0 billion ($8.7 million, translated at exchange rates applicable as of June 30, 2016) overdraft facility.
| 13. | LONG-TERM BORROWINGS |
In October 2013, the Company refinanced its long-term South Korean credit facility and signed a new five-year senior secured facilities agreement (the “Facilities Agreement”) with a consortium of South Korean banks. The Facilities Agreement provides for three separate facilities to the Company’s wholly owned subsidiary, Net1 Applied Technologies Korea (“Net1 Korea”): a Facility A loan of up to KRW 60.0 billion ($52.0 million), a Facility B loan of up to KRW 15 billion ($13.0 million) and a Facility C revolving credit facility of up to KRW 10.0 billion ($8.7 million) (all facilities denominated in KRW and translated at exchange rates applicable as of June 30, 2016).
The Facility A and B loans were fully drawn on October 29, 2013, and used to repay KRW 75.0 billion ($70.6 million) of the KRW 92.4 billion ($87.0 million) loan outstanding under the Company’s refinanced South Korean credit facility. The remaining outstanding KRW 17.4 billion ($16.4 million) balance of that facility was paid from cash on hand on October 29, 2013. In addition, the Company drew KRW 1.1 billion ($1.0 million) of the revolving credit facility on October 29, 2013, to pay fees and expenses related to the Facilities Agreement and drew approximately KRW 2.2 billion ($2.1 million) during the last six months of the year ended June 30, 2014, to pay interest due under the Facilities Agreement.
The Company drew approximately KRW 2.5 billion ($2.1 million) and KRW 4.0 billion ($3.8 million) during the year ended June 30, 2016 and 2015, respectively, to pay interest due under the Facilities Agreement. The carrying value as of June 30, 2016, was $51.8 million. As of June 30, 2016, the carrying amount of the long-term borrowings approximated its fair value.
Interest on the loans and revolving credit facility is payable quarterly and is based on the South Korean CD rate in effect from time to time plus a margin of 3.10% for the Facility A loan and Facility C revolving credit facility; and a margin of 2.90% for the Facility B loan. The CD rate was 1.61% on June 30, 2016, and therefore the interest rate in effect as of June 30, 2016, for the Facility A loan and Facility C revolving credit facility was 4.71% . A commitment fee of 0.3% is payable on any un-drawn and un-cancelled amount of the revolving credit facility.
F-33
| NET 1 UEPS TECHNOLOGIES, INC. |
| Notes to the consolidated financial statements |
| for the years ended June 30, 2016, 2015 and 2014 |
| (All amounts stated in thousands of United States Dollars, unless otherwise stated) |
| 13. | LONG-TERM BORROWINGS (continued) |
The Company paid facilities fees of approximately KRW 0.9 billion ($0.9 million) on October 29, 2013, and amortized approximately $0.1 million, $0.2 million and $0.3 million of these fees during the years ended June 30, 2016, 2015 and 2014, respectively. The Company has expensed the remaining prepaid facility fees related to the Company’s refinanced South Korean credit facility of approximately $0.4 million during the year ended June 30, 2014. Total interest expense related to the new and refinanced facilities during the year ended June 30, 2016, 2015 and 2014, was $2.6 million, $3.6 million and $4.8 million, respectively.
The Facility A loan is repayable in three scheduled annual installments of KRW 10 billion, and the first scheduled payment of $8.7 million was made on April 29, 2016, and the second and third payment are due in April 2017 and 2018, with a final installment of KRW 30 billion due at the maturity date (October 29, 2018). The Facility B loan was repaid in full on October 29, 2014. The Facility C revolving credit facility is repayable in full on the maturity date. Prepayment of the revolving credit facility may be withdrawn at any time up to three months before the maturity date.
The loans under the Facilities Agreement are secured by a pledge by Net1 Korea of its entire equity interest in KSNET and a pledge by the immediate parent of Net1 Korea (also one of the Company’s subsidiaries) of its entire equity interest in Net1 Korea. The Facilities Agreement contains customary covenants that require Net1 Korea to maintain agreed leverage and debt service coverage ratios and restricts Net1 Korea’s ability to make certain distributions with respect to its capital stock, prepay other debt, encumber its assets, incur additional indebtedness, or engage in certain business combinations. The loans under the Facilities Agreement are without recourse to, and the covenants and other agreements contained therein do not apply to, the Company or any of the Company’s subsidiaries (other than Net1 Korea).
| 14. | COMMON STOCK |
Common stock
Holders of shares of Net1’s common stock are entitled to receive dividends and other distributions when declared by Net1’s board of directors out of legally available funds. Payment of dividends and distributions is subject to certain restrictions under the Florida Business Corporation Act, including the requirement that after making any distribution Net1 must be able to meet its debts as they become due in the usual course of its business.
Upon voluntary or involuntary liquidation, dissolution or winding up of Net1, holders of common stock share ratably in the assets remaining after payments to creditors and provision for the preference of any preferred stock according to its terms. There are no pre-emptive or other subscription rights, conversion rights or redemption or scheduled installment payment provisions relating to shares of common stock. All of the outstanding shares of common stock are fully paid and non-assessable.
Each holder of common stock is entitled to one vote per share for the election of directors and for all other matters to be voted on by shareholders. Holders of common stock may not cumulate their votes in the election of directors, and are entitled to share equally and ratably in the dividends that may be declared by the board of directors, but only after payment of dividends required to be paid on outstanding shares of preferred stock according to its terms. The shares of Net1 common stock are not subject to redemption.
F-34
| NET 1 UEPS TECHNOLOGIES, INC. |
| Notes to the consolidated financial statements |
| for the years ended June 30, 2016, 2015 and 2014 |
| (All amounts stated in thousands of United States Dollars, unless otherwise stated) |
| 14. | COMMON STOCK (continued) |
Common stock (continued)
The Company’s number of shares, net of treasury, presented in the consolidated balance sheets and consolidated statement of changes in equity includes participating non-vested equity shares (specifically contingently returnable shares) as described below in Note 18“— Amended and Restated Stock Incentive Plan—Restricted Stock—General Terms of Awards”. The following table presents reconciliation between the number of shares, net of treasury, presented in the consolidated statement of changes in equity and the number of shares, net of treasury, excluding non-vested equity shares that have not vested during the years ended June 30, 2016, 2015 and 2014:
| 2016 | 2015 | 2014 | ||||||||
| Number of shares, net of treasury: | ||||||||||
| Statement of changes in equity – common stock | 55,271,954 | 46,679,565 | 47,819,299 | |||||||
| Less: Non-vested equity shares that have not vested as of end of year (Note 18) | 589,447 | 341,529 | 385,778 | |||||||
| Number
of shares, net of treasury excluding non-vested equity shares that have not vested |
54,682,507 | 46,338,036 | 47,433,521 |
Redeemable common stock issued pursuant to transaction with the IFC Investors
Holders of redeemable common stock have all the rights of enjoyed by holders of common stock, however, holders of redeemable common stock have additional contractual rights. On April 11, 2016, the Company entered into a Subscription Agreement (the “Subscription Agreement”) with International Finance Corporation, IFC African, Latin American and Caribbean Fund, LP, IFC Financial Institutions Growth Fund, LP, and Africa Capitalization Fund, Ltd. (collectively, the “IFC Investors”). Under the Subscription Agreement, the IFC Investors purchased, and the Company sold in the aggregate, approximately 9.98 million shares of the Company’s common stock, par value $0.001 per share, at a price of $10.79 per share, for gross proceeds to the Company of approximately $107.7 million. The Company has accounted for these 9.98 million shares as redeemable common stock as a result of the put option discussed below.
The Company has entered into a Policy Agreement with the IFC Investors (the “Policy Agreement”). The material terms of the Policy Agreement are described below.
Board Rights
For so long as the IFC Investors in aggregate beneficially own shares representing at least 5% of the Company’s common stock, the IFC Investors will have the right to nominate one director to the Company’s board of directors. For so long as the IFC Investors in aggregate beneficially own shares representing at least 2.5% of the Company’s common stock, the IFC Investors will have the right to appoint an observer to the Company’s board of directors at any time when they have not designated, or do not have the right to designate, a director.
F-35
| NET 1 UEPS TECHNOLOGIES, INC. |
| Notes to the consolidated financial statements |
| for the years ended June 30, 2016, 2015 and 2014 |
| (All amounts stated in thousands of United States Dollars, unless otherwise stated) |
| 14. | COMMON STOCK (continued) |
Redeemable common stock issued pursuant to transaction with the IFC Investors (continued)
Registration Rights
The Company has agreed to grant certain registration rights to the IFC Investors for the resale of their shares of the Company’s common stock, including filing a resale shelf registration statement and taking certain actions to facilitate resales thereunder.
Put Option
Each Investor will have the right, upon the occurrence of specified triggering events, to require the Company to repurchase all of the shares of its common stock purchased by the IFC Investors pursuant to the Subscription Agreement (or upon exercise of their preemptive rights discussed below). Events triggering this put right relate to (1) the Company being the subject of a governmental complaint alleging, a court judgment finding or an indictment alleging that the Company (a) engaged in specified corrupt, fraudulent, coercive, collusive or obstructive practices; (b) entered into transactions with targets of economic sanctions; or (c) failed to operate its business in compliance with anti-money laundering and anti-terrorism laws; or (2) the Company rejecting a bona fide offer to acquire all of its outstanding Common Stock at a time when it has in place or implements a shareholder rights plan, or adopting a shareholder rights plan triggered by a beneficial ownership threshold of less than twenty percent. The put price per share will be the higher of the price per share paid by the IFC Investors pursuant to the Subscription Agreement (or paid when exercising their preemptive rights) and the volume weighted average price per share prevailing for the 60 trading days preceding the triggering event, except that with respect a put right triggered by rejection of a bona fide offer, the put price per share will be the highest price offered by the offeror. The Company believes that the put option has no value and, accordingly, has not recognized the put option in its consolidated financial statements.
Preemptive Rights
For so long as the IFC Investors hold in aggregate 5% of the outstanding shares of common stock of the Company, each Investor will have the right to purchase its pro-rata share of new issuances of securities by the Company, subject to certain exceptions.
Common stock repurchases
Executed under share repurchase authorizations
During November and December 2015, the Company repurchased an aggregate of 749,213 shares of its common stock for approximately $11.2 million under its share repurchase authorization that was approved on August 21, 2013. On February 3, 2016, the Company’s Board of Directors approved the replenishment of its share repurchase authorization to repurchase up to an aggregate of $100 million of common stock. The authorization has no expiration date. During February and June 2016, the Company repurchased an aggregate of 1,677,491 shares for approximately $15.9 million under its replenished share repurchase authorization which resulted in a total of 2,426,704 shares repurchased for approximately $27.1 million under its various share repurchase authorizations.
The share repurchase authorization will be used at management’s discretion, subject to limitations imposed by SEC Rule 10b-18 and other legal requirements and subject to price and other internal limitations established by the Board. Repurchases will be funded from the Company’s available cash. Share repurchases may be made through open market purchases, privately negotiated transactions, or both. There can be no assurance that the Company will purchase any shares or any particular number of shares. The authorization may be suspended, terminated or modified at any time for any reason, including market conditions, the cost of repurchasing shares, liquidity and other factors that management deems appropriate. The Company did not repurchase any of its shares during the years ended June 30, 2015 and 2014, under this authorization.
F-36
| NET 1 UEPS TECHNOLOGIES, INC. |
| Notes to the consolidated financial statements |
| for the years ended June 30, 2016, 2015 and 2014 |
| (All amounts stated in thousands of United States Dollars, unless otherwise stated) |
| 14. | COMMON STOCK (continued) |
Common stock repurchases (continued)
Executed under share repurchase authorizations (continued)
On June 29, 2016, the Company adopted a Rule 10b5-1 plan for the purpose of repurchasing approximately $50 million of its common stock. The 10b5 Plan was established in connection with the $100 million share repurchase program approved on February 3, 2016. A plan under Rule 10b5-1 allows a company to repurchase its shares at times when it otherwise might be prevented from doing so under insider trading laws or because of self-imposed trading blackout periods. A broker selected by the Company has the authority under the terms and limitations specified in the 10b5-1 Plan to repurchase shares on the Company’s behalf in accordance with the terms thereof.
Other repurchases
During the year ended June 30, 2015, the Company entered into a Subscription and Sale of Shares Agreement with Business Venture Investments No 1567 Proprietary Limited (RF) (“BVI”), one of the Company’s BEE partners, in preparation for any new potential SASSA tender. Pursuant to the agreement: (i) the Company repurchased BVI’s remaining 1,837,432 shares of the Company’s common stock for approximately ZAR 97.4 million in cash ($9.2 million translated at exchange rates prevailing as of August 27, 2014) and (ii) BVI subscribed for new ordinary shares of Cash Paymaster Services (Pty) Ltd (“CPS”) representing approximately 12.5% of CPS’ ordinary shares outstanding after the subscription for ZAR 15.0 million in cash (approximately $1.4 million translated at exchange rates prevailing as of August 27, 2014). In connection with transactions described above, the CPS shareholder agreement that was negotiated as part of the original December 2013 Relationship Agreement became effective. In addition, during the year ended June 30, 2014, the Company repurchased 2,428,122 shares for approximately $24.9 million as described below under “—December 2013 Black Economic Empowerment transactions—Salient terms of the BEE Relationship Agreements”.
December 2013 Black Economic Empowerment transactions
On December 10, 2013, the Company entered into definitive agreements relating to two Black Economic Empowerment (“BEE”) transactions. On April 16, 2014, the Company implemented these transactions and issued 4,400,000 shares of its common stock to its BEE partners after all the agreed conditions had been satisfied. On June 6, 2014, the Company repurchased approximately 2.4 million of these shares of common stock and the BEE partners used the proceeds from the repurchase to settle their obligations due to the South African subsidiary of the Company, as described below. Furthermore, as discussed above under “—Common stock repurchases—Other repurchases”, the Company acquired BVI’s remaining 1,837,432 shares of Company common stock pursuant to a transaction concluded during the year ended June 30, 2015.
Salient terms of the BEE Relationship Agreements
Pursuant to Relationship Agreements between the Company and its BEE partners, the Company sold an aggregate of 4,400,000 shares of its common stock (“BEE shares”), which are contractually restricted as to resale as described below, for a purchase price of ZAR 60.00 per share. This price represented 75% of the closing price of the Company’s common stock on the JSE on December 6, 2013, the date the Company completed final negotiation of the terms of these BEE transactions. In South Africa, it is customary for BEE equity investment transactions in companies, including publicly-traded companies, to be priced at a substantial discount to the fair value or current trading price of the subject company’s shares. The 25% discount was negotiated between the parties on an arm’s length basis and took into account a number of factors reflecting the lack of liquidity of the BEE shares due to the contractual provisions described below.
The Relationship Agreements provided for the entire purchase price for the BEE shares to be financed through a five-year loan to be extended to each of the BEE partners by a South African subsidiary of the Company. The obligations of the BEE partners under the loans were several, and not joint. Each of the BEE partners granted the lender a security interest in all the BEE shares purchased by such BEE partner to secure the repayment of its loan. The principal amount of the loans made by the subsidiary was contributed by Net1 to the equity capital of the subsidiary. As a result of the making of the loans, the net cash position of the Company after the sale of the BEE shares remained unchanged.
F-37
| NET 1 UEPS TECHNOLOGIES, INC. |
| Notes to the consolidated financial statements |
| for the years ended June 30, 2016, 2015 and 2014 |
| (All amounts stated in thousands of United States Dollars, unless otherwise stated) |
| 14. | COMMON STOCK (continued) |
December 2013 Black Economic Empowerment transactions (continued)
Salient terms of the BEE Relationship Agreements (continued)
The loans bore interest at a rate equal to the Johannesburg Interbank Rate plus 300 basis points. Interest on the loans was payable semi-annually in arrears on January 1 and July 1 of each year. 10% of the outstanding principal amount of the loans was payable on each of the first and second anniversaries of the date of issuance of the BEE shares, 15% of the outstanding principal amount of the loans was payable on each of the third and fourth anniversaries of the date of issuance of the BEE shares and the remaining outstanding principal amount of the loans was payable on the fifth anniversary of the date of issuance of the BEE shares. Further, the entire outstanding principal amount of the loans was payable if the price of the Company’s common stock on the JSE equals or exceeds ZAR 120.00 per share at any time during term of the loans. The loans to the BEE partners did not provide that they were recourse only to the BEE shares. Nevertheless, the Company expected that the sole source of repayment of the loans will be proceeds from the sale of its shares by the BEE partners from time to time, in open market or in privately negotiated transactions.
Upon the occurrence of certain “trigger events” with respect to a BEE partner, the BEE shares held by that BEE partner may be repurchased by the Company or one of its designees. These trigger events include the following:
| • | failure by the BEE partner to pay any amount due on its loan (including interest) to the lender (in this case, the Companymay repurchase only that number of shares which would raise sufficient funds to settle any amount due and unpaid); | |
| • | any other breach by the BEE partner (or in certain circumstances its shareholders) of any provision of the Relationship Agreement, including without limitation, its failure to maintain its BEE status; |
|
| • | the Company’s common stock trades at or below ZAR 60.00 on the JSE or at or below the equivalent trading price on Nasdaq; |
|
| • | the occurrence of certain insolvency events or liquidation proceedings affecting the BEE partner; or |
|
| • | the BEE partner fails to satisfy any judgment or arbitration award granted or made against it within 7 days. |
If the trigger event involved a failure by a BEE partner to pay any amount due on its loan, then the repurchase price is the volume-weighted average price of the Company’s common stock on the Nasdaq for the period of 30 trading days prior to the trigger event (“30-day VWAP”). In the case of other trigger events, the repurchase price is the lower of the 30-day VWAP or ZAR 60.00 per share.
The Company’s share price exceeded ZAR 120.00 on June 4, 2014 and all outstanding amounts then became due and payable. The BEE partners were unable to pay all outstanding amounts due on June 5, 2014, and accordingly a trigger event occurred. The Company purchased a total of 2,428,122 shares of its common stock, at the determined VWAP of ZAR109.98, from the BEE partners. The BEE partners used the proceeds from the sale of these shares in order to settle all outstanding amounts due to the South African subsidiary of the Company.
The BEE shares are contractually restricted as to resale for a period of five years from the date of issuance, with the exception of periodic sales which would have been made to fund the repayment of principal and interest on the loans if they had not been repaid in full in June 2014. In addition, the Company may call the BEE shares then owned by the BEE partners, either in exchange for a minority interest in CPS or for a cash payment equal to the 30-day VWAP. Further, after the fifth anniversary of the date of issuance of the BEE shares, the Company will have a right of first refusal on the shares owned by the BEE partners.
Acquisition of non-controlling interests
During the year ended June 30, 2016, the Company acquired all of the issued share capital of Masterpayment and Smart Life that it did not previously own for approximately $11.2 million and $0.001 million, respectively, in cash. During the year ended June 30, 2014, the Company acquired all of the issued share capital of KSNET, Inc. that it did not previously own for approximately $2.0 million in cash. These transactions were accounted for as an equity transaction with a non-controlling interest and accordingly, no gain or loss was recognized in the Company’s consolidated statement of operations. The carrying amount of the respective non-controlling interest was adjusted to reflect the change in ownership interest in each of Masterpayment, Smart Life and KSNET. During the years ended June 30, 2016 and 2014, the difference between the fair value of the consideration paid and the amount by which the non-controlling interest was adjusted, of $1.3 million and $1.5 million, respectively, was recognized in total Net1 equity.
F-38
| NET 1 UEPS TECHNOLOGIES, INC. |
| Notes to the consolidated financial statements |
| for the years ended June 30, 2016, 2015 and 2014 |
| (All amounts stated in thousands of United States Dollars, unless otherwise stated) |
| 15. | ACCUMULATED OTHER COMPREHENSIVE (LOSS) INCOME |
The table below presents the change in accumulated other comprehensive (loss) income per component during years ended June 30, 2016, 2015 and 2014:
| Accumulated | ||||||||||
| Net | ||||||||||
| unrealized | ||||||||||
| Accumulated | income (loss) | |||||||||
| Foreign | on asset | |||||||||
| currency | available for | |||||||||
| translation | sale, net of | |||||||||
| reserve | tax | Total | ||||||||
| ‘000 | ‘000 | ‘000 | ||||||||
| Balance as of July 1, 2013 | $ | (101,188 | ) | $ | 330 | $ | (100,858 | ) | ||
| Movement in foreign currency translation reserve | 13,552 | - | 13,552 | |||||||
| Release of foreign currency translation reserve related to sale/ liquidation of businesses | 4,277 | - | 4,277 | |||||||
| Unrealized gain on asset available for sale, net of tax of $112 | - | 288 | 288 | |||||||
| Balance as of June 30, 2014 | (83,359 | ) | 618 | (82,741 | ) | |||||
| Movement in foreign currency translation reserve | (56,862 | ) | - | (56,862 | ) | |||||
| Unrealized gain on asset available for sale, net of tax of $97 | - | 422 | 422 | |||||||
| Balance as of June 30, 2015 | (140,221 | ) | 1,040 | (139,181 | ) | |||||
| Movement in foreign currency translation reserve | (49,479 | ) | - | (49,479 | ) | |||||
| Unrealized gain on asset available for sale, net of tax of $159 | - | 692 | 692 | |||||||
| Release of gain on asset available for sale, net of taxes of $444 | - | (1,732 | ) | (1,732 | ) | |||||
| Balance as of June 30, 2016 | $ | (189,700 | ) | $ | - | $ | (189,700 | ) |
The Company released a gain of approximately $2.2 million from its accumulated net unrealized income (loss) on asset available for sale, net of tax, to selling, general and administration expense and related taxes of $0.4 million to income tax expense on its consolidated statement of operations during the year ended June 30, 2016, as a result of change in accounting for Finbond to the equity method (see also Note 7). There were no other reclassifications from accumulated other comprehensive loss to comprehensive (loss) income during the year ended June 30, 2016. There were no reclassifications from accumulated other comprehensive loss to comprehensive (loss) income during the year ended June 30, 2015. The Company released a net loss of $4.3 million from its foreign currency translation reserve to selling, general and administration expense on its consolidated statement of operations during the year ended June 30, 2014, as a result of the sale and liquidation of certain subsidiaries (see also Note 19). There were no other reclassifications from accumulated other comprehensive loss to comprehensive (loss) income during the year ended June 30, 2014.
| 16. | REVENUE |
| 2016 | 2015 | 2014 | ||||||||
| Services rendered – comprising mainly fees and commissions | $ | 514,847 | $ | 536,046 | $ | 518,297 | ||||
| Loan-based fees received | 47,117 | 62,235 | 33,560 | |||||||
| Sale of goods – comprising mainly hardware and software sales | 28,785 | 27,698 | 29,799 | |||||||
| $ | 590,749 | $ | 625,979 | $ | 581,656 |
Services rendered – comprising mainly fees and commissions for the year ended June 30, 2014, includes a once-off receipt of $26.6 million related to the recovery of additional implementation costs incurred during the beneficiary re-registration process during the years ended June 30, 2013 and 2012. During the years ended June 30, 2016, 2015 and 2014, the Company did not recognize any revenue using the percentage of completion method.
F-39
| NET 1 UEPS TECHNOLOGIES, INC. |
| Notes to the consolidated financial statements |
| for the years ended June 30, 2016, 2015 and 2014 |
| (All amounts stated in thousands of United States Dollars, unless otherwise stated) |
| 17. | EQUITY INSTRUMENTS ISSUED PURSUANT TO BEE TRANSACTIONS |
2014 transactions
On April 16, 2014, the Company issued 4,400,000 shares of its common stock pursuant to the BEE transactions discussed in Note 14. The charge related to the equity instruments issued pursuant to the BEE transactions was determined to be approximately $11.3 million and was expensed in full during the year ended June 30, 2014, because the BEE partners owned the shares on the issue date. This was a book entry and no cash was actually paid. The charge recorded was determined as the difference between the fair value of the loans provided to the BEE partners and the fair value of the equity instruments granted to the BEE partners.
The fair value of the loans provided to the BEE partners was determined to be their face value. The fair value of the equity instruments was calculated utilizing an adjusted Monte Carlo simulation discounted cash flow model which was developed for the purpose of the valuation of these BEE transactions. Cash flows were calculated for each simulated share price path, taking into account the bespoke features of the BEE transactions, as well as the expected interest and capital repayments (funded through the expected sales of BEE shares). The “adjustment” to the Monte Carlo simulation model incorporates a “jump diffusion” process to the standard Geometric Brownian Motion simulation, in order to capture the discontinuous share price jumps observed in the Company’s share price movements on stock exchanges on which it is listed. Therefore, the simulated share price paths capture the idiosyncrasies of the observed Company share price movements. For each simulation, the resulting expected cash flows were discounted to the valuation date.
The Company used an expected volatility of 21.04%, an expected life of five years, a risk free rate of 7.90% and no future dividends in its calculation of the fair value of the equity instrument. The estimated expected volatility was calculated based on the Company’s 30 day VWAP share price using the exponentially weighted moving average of returns.
| 18. | STOCK-BASED COMPENSATION |
Amended and Restated Stock Incentive Plan
The Company’s Amended and Restated 2015 Stock Incentive Plan (the “Plan”) was most recently amended and restated on November 11, 2015, after approval by shareholders. No evergreen provisions are included in the Plan. This means that the maximum number of shares issuable under the Plan is fixed and cannot be increased without shareholder approval, the plan expires by its terms upon a specified date, and no new stock options are awarded automatically upon exercise of an outstanding stock option. Shareholder approval is required for the repricing of awards or the implementation of any award exchange program.
The Plan permits Net1 to grant to its employees, directors and consultants incentive stock options, nonqualified stock options, stock appreciation rights, restricted stock, performance-based awards and other awards based on its common stock. The Remuneration Committee of the Company’s Board of Directors (“Remuneration Committee”) administers the Plan.
The total number of shares of common stock issuable under the Plan is 11,052,580. The maximum number of shares for which awards, other than performance-based awards, may be granted in any combination during a calendar year to any participant is 569,120. The maximum limits on performance-based awards that any participant may be granted during a calendar year are 569,120 shares subject to stock option awards and $20 million with respect to awards other than stock options. Shares that are subject to awards which terminate or lapse without the payment of consideration may be granted again under the Plan. Shares delivered to the Company as part or full payment for the exercise of an option or to satisfy withholding obligations upon the exercise of an option may be granted again under the Plan in the Remuneration Committee’s discretion. No awards may be granted under the Plan after August 19, 2025, but awards granted on or before such date may extend to later dates.
F-40
| NET 1 UEPS TECHNOLOGIES, INC. |
| Notes to the consolidated financial statements |
| for the years ended June 30, 2016, 2015 and 2014 |
| (All amounts stated in thousands of United States Dollars, unless otherwise stated) |
| 18. | STOCK-BASED COMPENSATION (continued) |
Options
General Terms of Awards
Option awards are generally granted with an exercise price equal to the market price of the Company's stock at the date of grant, with vesting conditioned upon the recipient’s continuous service through the applicable vesting date and expire 10 years after the date of grant. The options generally become exercisable in accordance with a vesting schedule ratably over a period of three years from the date of grant. The Company issues new shares to satisfy stock option award exercises but may also use treasury shares.
Valuation Assumptions
No stock options were awarded during the year ended June 30, 2016. The fair value of each option is estimated on the date of grant using the Cox Ross Rubinstein binomial model that uses the assumptions noted in the following table. The estimated expected volatility is calculated based on the Company’s 250 day volatility. The estimated expected life of the option was determined based historical behavior of employees who were granted options with similar terms. The Company has estimated no forfeitures for options awarded in 2015 and 2014. The table below presents the range of assumptions used to value options granted during the years ended June 30, 2015 and 2014:
| 2015 | 2014 | ||||||
| Expected volatility | 60% | 50% | |||||
| Expected dividends | 0% | 0% | |||||
| Expected life (in years) | 3 | 3 | |||||
| Risk-free rate | 1.0% | 0.9% |
Restricted Stock
General Terms of Awards
Shares of restricted stock are considered to be participating non-vested equity shares (specifically contingently returnable shares) for the purposes of calculating earnings per share (refer to Note 21) because, as discussed in more detail below, the recipient is obligated to transfer any unvested restricted stock back to the Company for no consideration and these shares of restricted stock are eligible to receive non-forfeitable dividend equivalents at the same rate as common stock. Restricted stock generally vests ratably over a three year period, with vesting conditioned upon the recipient’s continuous service through the applicable vesting date and under certain circumstances, the achievement of certain performance targets, as described below.
Restricted stock awarded to non-employee directors and employees of the Company vests ratably over a three-year period. Recipients are entitled to all rights of a shareholder of the Company except as otherwise provided in the restricted stock agreements.
General Terms of Awards (continued)
These rights include the right to vote and receive dividends and/or other distributions. However, the restricted stock agreements generally prohibit transfer of any nonvested and forfeitable restricted stock. If a recipient ceases to be a member of the Board of Directors or an employee for any reason, all shares of his restricted stock that are not then vested and nonforfeitable will be immediately forfeited and transferred to the Company for no consideration.
The Company issues new shares to satisfy restricted stock awards.
Valuation Assumptions
The fair value of restricted stock is based on the closing price of the Company’s stock quoted on The Nasdaq Global Select Market on the date of grant.
F-41
| NET 1 UEPS TECHNOLOGIES, INC. |
| Notes to the consolidated financial statements |
| for the years ended June 30, 2016, 2015 and 2014 |
| (All amounts stated in thousands of United States Dollars, unless otherwise stated) |
| 18. | STOCK-BASED COMPENSATION (continued) |
Amended and Restated Stock Incentive Plan (continued)
Restricted Stock (continued)
Market Conditions - Restricted Stock Granted in August and November 2014
In August and November 2014, respectively, the Remuneration Committee approved an award of 127,626 and 71,530 shares of restricted stock to employees. These shares of restricted stock will vest in full only on the date, if any, the following conditions are satisfied: (1) the closing price of the Company’s common stock equals or exceeds $19.41 (subject to appropriate adjustment for any stock split or stock dividend) for a period of 30 consecutive trading days during a measurement period commencing on the date that the Company files its Annual Report on Form 10-K for the fiscal year ended 2017 and ending on December 31, 2017 and (2) the recipient is employed by the Company on a full-time basis when the condition in (1) is met. If either of these conditions is not satisfied, then none of the shares of restricted stock will vest and they will be forfeited. The $19.41 price target represents a 20% increase, compounded annually, in the price of the Company’s common stock on Nasdaq over the $11.23 closing price on August 27, 2014.
The 127,626 and 71,530 shares of restricted stock are effectively forward starting knock-in barrier options with a strike price of zero. The fair value of these shares of restricted stock was calculated utilizing an adjusted Monte Carlo simulation discounted cash flow model which was developed for the purpose of the valuation of these shares. For each simulated share price path, the market share price condition was evaluated to determine whether or not the shares would vest under that simulation. The “adjustment” to the Monte Carlo simulation model incorporates a “jump diffusion” process to the standard Geometric Brownian Motion simulation, in order to capture the discontinuous share price jumps observed in the Company’s share price movements on stock exchanges on which it is listed. Therefore, the simulated share price paths capture the idiosyncrasies of the observed Company share price movements.
In scenarios where the shares do not vest, the final vested value at maturity is zero. In scenarios where vesting occurs, the final vested value on maturity is the share price on vesting date. The value of the grant is the average of the discounted vested values. The Company used an expected volatility of 76.01%, an expected life of approximately three years, a risk-free rate of 1.27% and no future dividends in its calculation of the fair value of the 127,626 shares of restricted stock. The Company used an expected volatility of 63.73%, an expected life of approximately three years, a risk-free rate of 1.21% and no future dividends in its calculation of the fair value of the 71,530 shares of restricted stock. Estimated expected volatility was calculated based on the Company’s 30 day VWAP share price using the exponentially weighted moving average of returns.
Performance Conditions - Restricted Stock Granted in August 2015
In August 2015, the Remuneration Committee approved an award of 301,537 shares of restricted stock to employees. The shares of restricted stock awarded to employees in August 2015 are subject to time-based and performance-based vesting conditions. In order for any of the shares to vest, the recipient must remain employed by the Company on a full-time basis on the date that it files its Annual Report on Form 10-K for the fiscal year ended June 30, 2018. If that condition is satisfied, then the shares will vest based on the level of Fundamental EPS the Company achieves for the fiscal year ended June 30, 2018 (“2018 Fundamental EPS”), as follows:
| • | One-third of the shares will vest if the Company achieves 2018 Fundamental EPS of $2.88; | |
| • | Two-thirds of the shares will vest if the Company achieves 2018 Fundamental EPS of $3.30; and | |
| • | All of the shares will vest if the Company achieves 2018 Fundamental EPS of $3.76. |
At levels of 2018 Fundamental EPS greater than $2.88 and less than $3.76, the number of shares that will vest will be determined by linear interpolation relative to 2018 Fundamental EPS of $3.30. Any shares that do not vest in accordance with the above-described conditions will be forfeited. All shares of restricted stock have been valued utilizing the closing price of shares of the Company’s common stock quoted on The Nasdaq Global Select Market on the date of grant.
F-42
| NET 1 UEPS TECHNOLOGIES, INC. |
| Notes to the consolidated financial statements |
| for the years ended June 30, 2016, 2015 and 2014 |
| (All amounts stated in thousands of United States Dollars, unless otherwise stated) |
| 18. | STOCK-BASED COMPENSATION (continued) |
Amended and Restated Stock Incentive Plan (continued)
Stock Appreciation Rights
The Remuneration Committee also may grant stock appreciation rights, either singly or in tandem with underlying stock options. Stock appreciation rights entitle the holder upon exercise to receive an amount in any combination of cash or shares of common stock (as determined by the Remuneration Committee) equal in value to the excess of the fair market value of the shares covered by the right over the grant price. No stock appreciation rights have been granted.
Stock option and restricted stock activity
Options
The following table summarizes stock option activity for the years ended June 30, 2016, 2015 and 2014:
| Weighted | ||||||||||||||||
| Average | Weighted | |||||||||||||||
| Weighted | Remaining | Aggregate | Average | |||||||||||||
| average | Contractual | Intrinsic | Grant | |||||||||||||
| Number of | exercise | Term | Value | Date Fair | ||||||||||||
| shares | price ($) | (in years) | ($’000) | Value ($) | ||||||||||||
| Outstanding – July 1, 2013 | 2,648,583 | 15.15 | 5.98 | 313 | ||||||||||||
| Granted under Plan: August 2013 | 224,896 | 7.35 | 10.00 | 568 | 2.53 | |||||||||||
| Exercised | (26,667 | ) | 7.00 | 91 | ||||||||||||
| Forfeited | (136,420 | ) | 23.51 | - | ||||||||||||
| Outstanding – June 30, 2014 | 2,710,392 | 14.16 | 5.38 | 3,909 | ||||||||||||
| Granted under Plan: August 2014 | 464,410 | 11.23 | 10.00 | 2,113 | 4.55 | |||||||||||
| Exercised | (773,633 | ) | 8.35 | 3,845 | ||||||||||||
| Outstanding – June 30, 2015 | 2,401,169 | 15.34 | 4.74 | 11,516 | ||||||||||||
| Exercised | (323,645 | ) | 11.62 | 2,669 | ||||||||||||
| Outstanding – June 30, 2016 | 2,077,524 | 15.92 | 3.65 | 926 |
The following table presents stock options vesting and expecting to vest as of June 30, 2016:
| Weighted | |||||||||||||
| Weighted | Average | ||||||||||||
| average | Remaining | Aggregate | |||||||||||
| exercise | Contractual | Intrinsic | |||||||||||
| Number of | price | Term | Value | ||||||||||
| shares | ($) | (in years) | ($’000) | ||||||||||
| Vested and expecting to vest | |||||||||||||
| – June 30, 2016 | 2,077,524 | 15.92 | 3.65 | 926 |
These options have an exercise price range of $7.35 to $24.46.
F-43
| NET 1 UEPS TECHNOLOGIES, INC. |
| Notes to the consolidated financial statements |
| for the years ended June 30, 2016, 2015 and 2014 |
| (All amounts stated in thousands of United States Dollars, unless otherwise stated) |
| 18. | STOCK-BASED COMPENSATION (continued) |
Stock option and restricted stock activity (continued)
Options (continued)
The following table presents stock options that are exercisable as of June 30, 2016:
| Weighted | |||||||||||||
| Average | |||||||||||||
| Weighted | Remaining | Aggregate | |||||||||||
| average | Contractual | Intrinsic | |||||||||||
| Number of | exercise | Term | Value | ||||||||||
| shares | price ($) | (in years) | ($’000) | ||||||||||
| Exercisable – June 30, 2016 | 1,692,952 | 17.17 | 2.66 | 728 |
During the years ended June 30, 2016, 2015 and 2014, approximately 373,435, 330,967, and 462,333 stock options became exercisable, respectively. During the year ended June 30, 2016, the Company received approximately $3.8 million from the exercise of 323,645 stock options. During the year ended June 30, 2015, the Company received approximately $2.0 million from 201,395 stock options exercised. The remaining 572,238 stock options were exercised through recipients delivering 336,584 shares of the Company’s common stock to the Company on September 9, 2014, to settle the exercise price due. During the year ended June 30, 2014, the Company received $0.2 million from 26,667 stock options exercised by employees. During the year ended June 30, 2014, employees forfeited 136,420 stock options. There were no forfeitures during the years ended June 30, 2016 and 2015, respectively. The Company issues new shares to satisfy stock option exercises.
Restricted stock
The following table summarizes restricted stock activity for the years ended June 30, 2016, 2015 and 2014:
| Number of | Weighted | ||||||
| Shares of | Average Grant | ||||||
| Restricted | Date Fair Value | ||||||
| Stock | ($’000) | ||||||
| Non-vested – July 1, 2013 | 405,226 | 4,393 | |||||
| Granted – August 2013 | 187,963 | 1,382 | |||||
| Vested – August 2013 | (16,907) | 161 | |||||
| Vested – February 2014 | (183,333) | 1,742 | |||||
| Total vested | (200,240) | ||||||
| Forfeitures | (7,171) | 84 | |||||
| Non-vested – June 30, 2014 | 385,778 | 3,534 | |||||
| Granted – August 2014 | 141,707 | 581 | |||||
| Granted – November 2014 | 71,530 | 229 | |||||
| Total granted | 213,237 | ||||||
| Vested – August 2014 | (74,152) | 828 | |||||
| Vested – February 2015 | (183,334) | 2,400 | |||||
| Total vested | (257,486) | ||||||
| Non-vested – June 30, 2015 | 341,529 | 1,759 | |||||
| Granted – August 2015 | 319,492 | 6,406 | |||||
| Vested – August 2015 | (71,574) | 1,435 | |||||
| Non-vested – June 30, 2016 | 589,447 | 7,622 |
The fair value of restricted stock vested during the years ended June 30, 2016, 2015 and 2014, was $1.4 million, $3.2 million and $1.9 million, respectively. A non-employee director resigning during the year ended June 30, 2014, forfeited 7,171 shares of restricted stock that had not vested. Forfeited shares of restricted stock are returned to the Company and, in accordance with the Plan, are available for future issuances by the Remuneration Committee.
F-44
| NET 1 UEPS TECHNOLOGIES, INC. |
| Notes to the consolidated financial statements |
| for the years ended June 30, 2016, 2015 and 2014 |
| (All amounts stated in thousands of United States Dollars, unless otherwise stated) |
| 18. | STOCK-BASED COMPENSATION (continued) |
Stock-based compensation charge and unrecognized compensation cost
The Company has recorded a net stock compensation charge of $3.6 million, $3.2 million and $3.7 million for the years ended June 30, 2016, 2015 and 2014, respectively, which comprised:
| Allocated to | ||||||||||
| cost of goods | ||||||||||
| sold, IT | Allocated to | |||||||||
| Total | processing, | selling, | ||||||||
| charge | servicing | general and | ||||||||
| (reversal) | and support | administration | ||||||||
| Year ended June 30, 2016 | ||||||||||
| Stock-based compensation charge | $ | 3,598 | $ | - | $ | 3,598 | ||||
| Total – year ended June 30, 2016 | $ | 3,598 | $ | - | $ | 3,598 | ||||
| Year ended June 30, 2015 | ||||||||||
| Stock-based compensation charge | $ | 3,195 | $ | - | $ | 3,195 | ||||
| Total – year ended June 30, 2015 | $ | 3,195 | $ | - | $ | 3,195 | ||||
| Year ended June 30, 2014 | ||||||||||
| Stock-based compensation charge | $ | 3,724 | $ | - | $ | 3,724 | ||||
| Reversal of stock compensation charge related to restricted stock forfeited | (6 | ) | - | (6 | ) | |||||
| Total – year ended June 30, 2014 | $ | 3,718 | $ | - | $ | 3,718 |
The stock compensation charge and reversals have been allocated to cost of goods sold, IT processing, servicing and support and selling, general and administration based on the allocation of the cash compensation paid to the employees.
As of June 30, 2016, the total unrecognized compensation cost related to stock options was approximately $0.8 million, which the Company expects to recognize over approximately two years. As of June 30, 2016, the total unrecognized compensation cost related to restricted stock awards was approximately $2.4 million, which the Company expects to recognize over approximately three years.
Tax consequences
The Company has recorded a deferred tax asset of approximately $1.8 million and $1.4 million, respectively, for the years ended June 30, 2016 and 2015, related to the stock-based compensation charge recognized related to employees of Net1 as it is able to deduct the difference between the market value on date of exercise by the option recipient and the exercise price from income subject to taxation in the United States.
| 19. | DECONSOLIDATION OF BUSINESSES SOLD OR LIQUIDATED AND DISPOSAL OF BUSINESS |
The profit (loss) on deconsolidation of businesses sold or liquidated and disposal of business during the years ended June 30, 2016, 2015 and 2014, are summarized in the table below:
| 2016 | 2015 | 2014 | ||||||||
| Profit on sale of MediKredit Integrated Healthcare Solutions Proprietary Limited (“MediKredit”) | $ | - | $ | - | $ | 4,125 | ||||
| Profit on disposal of assets related to the business of Net 1 Universal Electronic | ||||||||||
| Technological Solutions (Pty) Ltd (“NUETS business”) | - | - | 2,081 | |||||||
| Loss on liquidation of Net1 UTA | - | - | (6,261 | ) | ||||||
| Net profit (loss) for the year ended June 30, | $ | - | $ | - | $ | (55 | ) |
F-45
| NET 1 UEPS TECHNOLOGIES, INC. |
| Notes to the consolidated financial statements |
| for the years ended June 30, 2016, 2015 and 2014 |
| (All amounts stated in thousands of United States Dollars, unless otherwise stated) |
| 19. | DECONSOLIDATION OF BUSINESSES SOLD OR LIQUIDATED AND DISPOSAL OF BUSINESS (continued) |
2014 transactions
Sale of MediKredit
On June 17, 2014, the Company sold its MediKredit subsidiary to an unrelated third party. The Company has recorded a profit of approximately $4.1 million related to the sale in selling, general and administration expense on its consolidated statement of operations for the year ended June 30, 2014. The profit has been allocated to corporate/eliminations. The sales price will be paid in three tranches, approximately 57% on June 17, 2014, approximately 14% on June 1, 2015, and the remainder on June 1, 2016. In addition, the parties agreed that MediKredit would continue to operate at the Company’s premises at no cost to the purchaser until September 30, 2014. Furthermore, the parties agreed that MediKredit provide certain development, support and maintenance services (collectively “Services”) related to technology used in the United States at no cost to the Company up to an amount of $0.3 million, translated at the foreign exchange rates applicable as of June 30, 2014. The Company determined that the Services comprise part of the sales price of MediKredit and have increased the profit on sale accordingly. In addition, the Company determined that the provision of an operating area within the Company’s premises represents an obligation on it, and has reduced the profit on sale accordingly. The fair value of the Services and free rental of premises has been determined using prices that would have been charged between unrelated third parties. Finally, the Company was required to release a gain of approximately $2.0 million from its foreign currency transaction reserve which has been included in the profit on sale. During the year ended June 30, 2014, the Company incurred transaction-related expenditure of $0.01 million related to the sale of MediKredit.
The purchaser is contingently obligated to pay the Company additional amounts based on future expansion of the MediKredit business in certain circumstances. The Company has not recorded any of these amounts during the year ended June 30, 2015 and 2014, respectively, as none of the contingent events occurred during these years.
Disposal of assets related to NUETS business
On June 30, 2014, the Company sold the NUETS business, which consisted primarily of customer contracts, other than contracts for UEPS systems in Botswana and Namibia, and equipment for approximately $2.2 million in cash. The Company received $0.2 million of these cash proceeds in June 2014, and the remaining $1.9 million was received in July 2014, and was included in accounts receivable, net, as of June 30, 2014. The Company recorded a profit of approximately $2.1 million on the sale in selling, general and administration expense on its consolidated statement of operations for the year ended June 30, 2014. The profit has been allocated to corporate/eliminations. The shareholders of the purchaser comprise a former employee of the Company, a U.S.-based economic development equity fund and other unrelated individuals and private companies. The Company has provided the purchaser with a non-exclusive, perpetual, worldwide license to use the Company’s UEPS technology. The purchaser may not use this technology in South Africa to provide payment services and specifically may not use the technology in any manner to service the Ministry of Social Development in South Africa and/or SASSA. The parties agreed that the Company provide certain administrative and technical support services related to the NUETS business until March 2015. During the year ended June 30, 2014, the Company incurred transaction-related expenditure of $0.06 million related to the sale of NUETS business.
Liquidation of Net1 UTA
The Company had substantially liquidated its Net1 UTA business during the year ended June 30, 2014, due to an inability to implement and expand its technology into new markets on a profitable basis. Net1 UTA’s operations were streamlined a number of years ago and the Company did not incur significant cash costs to liquidate Net1 UTA. However, the Company was required to release approximately $6.3 million from its foreign currency transaction reserve which has resulted in a loss on liquidation of Net1 UTA. This non-cash loss on liquidation of Net1 UTA has been recorded in selling, general and administration expense on its consolidated statement of operations for the year ended June 30, 2014. The loss has been allocated to corporate/eliminations.
F-46
| NET 1 UEPS TECHNOLOGIES, INC. |
| Notes to the consolidated financial statements |
| for the years ended June 30, 2016, 2015 and 2014 |
| (All amounts stated in thousands of United States Dollars, unless otherwise stated) |
| 20. | INCOME TAXES |
Income tax provision
The table below presents the components of income before income taxes for the years ended June 30, 2016, 2015 and 2014:
| 2016 | 2015 | 2014 | ||||||||
| South Africa | $ | 119,097 | $ | 137,138 | $ | 121,338 | ||||
| United States | (5,915 | ) | (7,286 | ) | (9,923 | ) | ||||
| Other | 13,055 | 10,566 | (2,273 | ) | ||||||
| Income before income taxes | $ | 126,237 | $ | 140,418 | $ | 109,142 |
Presented below is the provision for income taxes by location of the taxing jurisdiction for the years ended June 30, 2016, 2015 and 2014:
| 2016 | 2015 | 2014 | ||||||||
| Current income tax | $ | 88,807 | $ | 48,795 | $ | 61,902 | ||||
| South Africa | 31,815 | 39,901 | 41,326 | |||||||
| United States | 50,750 | 3,109 | 14,838 | |||||||
| Other | 6,242 | 5,785 | 5,738 | |||||||
| Deferred taxation (benefit) charge | (161) | (2,292) | (7,887) | |||||||
| South Africa | 3,044 | 398 | (3,345) | |||||||
| United States | (274) | 485 | (107) | |||||||
| Other | (2,931) | (3,175) | (4,435) | |||||||
| Capital gains tax | - | - | 202 | |||||||
| Foreign tax credits generated – United States | (46,566) | (2,367) | (14,838) | |||||||
| Income tax provision | $ | 42,080 | $ | 44,136 | $ | 39,379 |
There were no significant capital gains taxes paid during the years ended June 30, 2016, 2015 and 2014.
There were no changes to the enacted tax rate in the years ended June 30, 2016, 2015 and 2014.
The movement in the valuation allowance for the year ended June 30, 2016, relates primarily to an increase in the valuation allowance resulting from the generation of unused foreign tax credits during the year. The movement in the valuation allowance for the year ended June 30, 2015, relates primarily to the release of the valuation allowance resulting from the utilization of foreign tax credits during the year. The movement in the valuation allowance for the year ended June 30, 2014, relates to releases of the valuation allowance resulting from the utilization of foreign tax credits during the year and deconsolidation of net operating loss carryforwards for MediKredit.
Net1 included actual and deemed dividends received from one of its South African subsidiaries in its years ended June 30, 2016, 2015 and 2014, taxation computation. Net1 applied net operating losses against this income. Net1 generated foreign tax credits as a result of the inclusion of the dividends in its taxable income. Net1 has applied certain of these foreign tax credits against its current income tax provision for the year ended June 30, 2016, 2015 and 2014.
F-47
| NET 1 UEPS TECHNOLOGIES, INC. |
| Notes to the consolidated financial statements |
| for the years ended June 30, 2016, 2015 and 2014 |
| (All amounts stated in thousands of United States Dollars, unless otherwise stated) |
| 20. | INCOME TAXES (continued) |
A reconciliation of income taxes, calculated at the fully-distributed South African income tax rate to the Company’s effective tax rate, for the years ended June 30, 2016, 2015 and 2014, is as follows:
| 2016 | 2015 | 2014 | ||||||||
| Income tax rate reconciliation: | ||||||||||
| Income taxes at fully-distributed South African tax rates | 28.00% | 28.00% | 28.00% | |||||||
| Non-deductible items | 0.38% | 2.36% | 4.71% | |||||||
| Foreign tax rate differential | 7.42% | 0.06% | 1.89% | |||||||
| Foreign tax credits | (36.88% | ) | (1.68% | ) | (13.59% | ) | ||||
| Taxation on deemed dividends in the United States | 34.60% | 3.46% | 13.46% | |||||||
| Capital gains tax paid | 0.00% | 0.00% | 0.19% | |||||||
| Movement in valuation allowance | (0.09% | ) | (0.08% | ) | 1.23% | |||||
| Prior year adjustments | (0.09% | ) | (0.69% | ) | 0.19% | |||||
| Income tax provision | 33.34% | 31.43% | 36.08% |
Net1 received substantial dividends from one of its South African subsidiaries during the year ended June 30, 2016, which resulted in an increase in the amount of foreign tax credits generated and an increase in taxation on dividends received. A portion of these foreign tax credits generated were not used during the year and a valuation allowance has been created for unused foreign tax credits. The non-deductible items during the year ended June 30, 2015, include primarily legal and consulting fees incurred that are not deductible for tax purposes. The non-deductible items during the year ended June 30, 2014, relates principally to expenses that are not deductible for tax purposes, including the charge related to the equity awards issued pursuant to the Company’s BEE transactions, stock-based compensation charges, costs incurred to support foreign related entities and interest expense. The foreign tax rate differential represents the difference between statutory tax rates in South Africa and foreign jurisdictions, primarily the United States.
Deferred tax assets and liabilities
Deferred income taxes reflect the temporary differences between the financial reporting and tax bases of assets and liabilities using enacted tax rates in effect for the year in which the differences are expected to reverse. The primary components of the temporary differences that gave rise to the Company’s deferred tax assets and liabilities as of June 30, and their classification, were as follows:
| 2016 | 2015 | ||||||
| Total deferred tax assets | |||||||
| Net operating loss carryforwards | $ | 1,982 | $ | 1,216 | |||
| Provisions and accruals | 4,245 | 5,653 | |||||
| FTS patent | 496 | 691 | |||||
| Intangible assets | 733 | 616 | |||||
| Foreign tax credits | 36,750 | 20,212 | |||||
| Other | 7,448 | 7,330 | |||||
| Total deferred tax assets before valuation allowance | 51,654 | 35,718 | |||||
| Valuation allowances | (38,834 | ) | (22,550 | ) | |||
| Total deferred tax assets, net of valuation allowance | 12,820 | 13,168 | |||||
| Total deferred tax liabilities: | |||||||
| Intangible assets | 11,799 | 11,510 | |||||
| Other | 6,624 | 4,924 | |||||
| Total deferred tax liabilities | 18,423 | 16,434 | |||||
| Reported as | |||||||
| Current deferred tax assets | 6,956 | 7,298 | |||||
| Long term deferred tax liabilities | 12,559 | 10,564 | |||||
| Net deferred income tax liabilities | $ | 5,603 | $ | 3,266 |
F-48
| NET 1 UEPS TECHNOLOGIES, INC. |
| Notes to the consolidated financial statements |
| for the years ended June 30, 2016, 2015 and 2014 |
| (All amounts stated in thousands of United States Dollars, unless otherwise stated) |
| 20. | INCOME TAXES (continued) |
Deferred tax assets and liabilities (continued)
Increase in total deferred tax liabilities
Intangible assets
Deferred tax liabilities – intangible assets have moderately increased during the year ended June 30, 2016, primarily as a result of the purchase of intangible assets identified in the Transact24 and Masterpayment acquisitions, partially offset by the amortization of the KSNET intangible assets during the year.
Foreign tax credits and valuation allowances
The increase in foreign tax credits as of June 30, 2016, resulted from the generation of foreign tax credits associated with the dividends received by Net1 during the year ended June 30, 2016. A portion of these foreign tax credits generated were not fully utilized during the year ended June 30, 2016. Accordingly, a valuation allowance has been created for all of these unused foreign tax credits.
Increase in valuation allowance
At June 30, 2016, the Company had deferred tax assets of $12.8 million (2015: $13.2 million), net of the valuation allowance. Management believes, based on the weight of available positive and negative evidence it is more likely than not that the Company will realize the benefits of these deductible differences, net of the valuation allowance. However, the amount of the deferred tax asset considered realizable could be adjusted in the future if estimates of taxable income are revised.
At June 30, 2016, the Company had a valuation allowance of $38.9 million (2015: $22.6 million) to reduce its deferred tax assets to estimated realizable value. The movement in the valuation allowance for the years ended June 30, 2016 and 2015, is presented below:
| Net | |||||||||||||||||||
| Foreign | Tax | operating | |||||||||||||||||
| tax | deductible | loss carry- | FTS | ||||||||||||||||
| Total | credits | goodwill | forwards | patent | Other | ||||||||||||||
| July 1, 2014 | $ | 25,153 | $ | 23,337 | $ | - | $ | 1,244 | $ | 369 | $ | 203 | |||||||
| Reversed to statement of operations | (3,126 | ) | (3,126 | ) | - | - | - | - | |||||||||||
| Charged to statement of operations | 794 | - | - | - | - | 794 | |||||||||||||
| Utilized | (128 | ) | - | - | (128 | ) | - | - | |||||||||||
| Foreign currency adjustment | (143 | ) | - | - | (28 | ) | (115 | ) | - | ||||||||||
| June 30, 2015 | 22,550 | 20,211 | - | 1,088 | 254 | 997 | |||||||||||||
| Charged to statement of operations | 16,537 | 16,537 | - | - | - | - | |||||||||||||
| Utilized | (128 | ) | - | - | (128 | ) | - | - | |||||||||||
| Foreign currency adjustment | (125 | ) | - | - | (29 | ) | (96 | ) | - | ||||||||||
| June 30, 2016 | $ | 38,834 | $ | 36,748 | $ | - | $ | 931 | $ | 158 | $ | 997 |
Net operating loss carryforwards and foreign tax credits
United States
As of June 30, 2016, Net1 had net operating loss carryforwards that will expire, if unused, as follows:
| Year of expiration | U.S. net operating | |||
| loss carry | ||||
| forwards | ||||
| 2025 | $ | 2,608 |
F-49
| NET 1 UEPS TECHNOLOGIES, INC. |
| Notes to the consolidated financial statements |
| for the years ended June 30, 2016, 2015 and 2014 |
| (All amounts stated in thousands of United States Dollars, unless otherwise stated) |
| 20. | INCOME TAXES (continued) |
Net operating loss carryforwards and foreign tax credits (continued)
United States (continued)
During the year ended June 30, 2016 and 2015, Net1 generated additional foreign tax credits related to the cash dividends received. Net1 had no net unused foreign tax credits that are more likely than not to be realized as of June 30, 2016 and 2015, respectively. The unused foreign tax credits generated expire after ten years in 2026, 2024, 2023, 2022, 2021 and 2020.
Uncertain tax positions
As of June 30, 2016 and 2015, the Company has unrecognized tax benefits of $1.9 million and $2.3 million, respectively, all of which would impact the Company’s effective tax rate. The Company files income tax returns mainly in South Africa, South Korea, Hong Kong, Botswana, Germany and in the U.S. federal jurisdiction. As of June 30, 2016, the Company’s South African subsidiaries are no longer subject to income tax examination by the South African Revenue Service for periods before June 30, 2011. The Company is subject to income tax in other jurisdictions outside South Africa, none of which are individually material to its financial position, statement of cash flows, or results of operations. The Company does not expect the change related to unrecognized tax benefits will have a significant impact on its results of operations or financial position in the next 12 months.
The following is a reconciliation of the total amounts of unrecognized tax benefits for the year ended June 30, 2016, 2015 and 2014:
| 2016 | 2015 | 2014 | ||||||||
| Unrecognized tax benefits - opening balance | $ | 2,322 | $ | 1,160 | $ | 1,150 | ||||
| Gross decreases - tax positions in prior periods | (609 | ) | - | - | ||||||
| Gross increases - tax positions in current period | 641 | 1,311 | 38 | |||||||
| Lapse of statute limitations | - | - | - | |||||||
| Foreign currency adjustment | (424 | ) | (149 | ) | (28 | ) | ||||
| Unrecognized tax benefits - closing balance | $ | 1,930 | $ | 2,322 | $ | 1,160 |
As of June 30, 2016 and 2015, the Company had accrued interest related to uncertain tax positions of approximately $0.1 million and $0.3 million, respectively, on its balance sheet.
| 21. | EARNINGS PER SHARE |
The Company has issued redeemable common stock (refer to Note 14) which is redeemable at an amount other than fair value. Redemption of a class of common stock at other than fair value increases or decreases the carrying amount of the redeemable common stock and is reflected in basic earnings per share using the two-class method. There were no redemptions of common stock, or adjustments to the carrying value of the redeemable common stock during the years ended June 30, 2016, 2015 or 2014. Accordingly the two-class method presented below does not include the impact of any redemption.
Basic earnings per share include shares of restricted stock that meet the definition of a participating security because these shares are eligible to receive non-forfeitable dividend equivalents at the same rate as common stock. Basic earnings per share have been calculated using the two-class method and basic earnings per share for the years ended June 30, 2016, 2015 and 2014, reflects only undistributed earnings. The computation below of basic earnings per share excludes the net income attributable to shares of unvested restricted stock (participating non-vested restricted stock) from the numerator and excludes the dilutive impact of these unvested shares of restricted stock from the denominator.
F-50
| NET 1 UEPS TECHNOLOGIES, INC. |
| Notes to the consolidated financial statements |
| for the years ended June 30, 2016, 2015 and 2014 |
| (All amounts stated in thousands of United States Dollars, unless otherwise stated) |
| 21. | EARNINGS PER SHARE (continued) |
Diluted earnings per share has been calculated to give effect to the number of shares of additional common stock that would have been outstanding if the potential dilutive instruments had been issued in each period. Stock options are included in the calculation of diluted earnings per share utilizing the treasury stock method and are not considered to be participating securities as the stock options do not contain non-forfeitable dividend rights. The calculation of diluted earnings per share includes the dilutive effect of a portion of the restricted stock granted to employees in October 2010, November 2010, February 2012, August 2014 and November 2014 as these shares of restricted stock are considered contingently returnable shares for the purposes of the diluted earnings per share calculation and the vesting conditions in respect of a portion of the restricted stock had been satisfied. The vesting conditions are discussed in Note 18.
The following table presents net income attributable to Net1 (income from continuing operations) and the share data used in the basic and diluted earnings per share computations using the two-class method for the years ended June 30, 2016, 2015 and 2014:
| 2016 | 2015 | 2014 | ||||||||
| (in thousands except percent and | ||||||||||
| per share data) | ||||||||||
| Numerator: | ||||||||||
| Net income attributable to Net1 | $ | 82,454 | $ | 94,735 | $ | 70,111 | ||||
| Undistributed earnings | 82,454 | 94,735 | 70,111 | |||||||
| Percent allocated to common shareholders (Calculation 1) | 99% | 99% | 99% | |||||||
| Numerator for earnings per share: basic and diluted | $ | 81,370 | $ | 93,750 | $ | 69,376 | ||||
| Denominator: | ||||||||||
| Denominator for basic
earnings per share: weighted- average common shares outstanding |
47,234 | 46,247 | 45,997 | |||||||
| Effect of dilutive securities: | ||||||||||
| Stock options | 242 | 152 | 119 | |||||||
| Denominator
for diluted earnings per share: adjusted weighted average common shares outstanding and assumed conversion |
47,476 | 46,399 | 46,116 | |||||||
| Earnings per share: | ||||||||||
| Basic | $ | 1.72 | $ | 2.03 | $ | 1.51 | ||||
| Diluted | $ | 1.71 | $ | 2.02 | $ | 1.50 | ||||
| (Calculation 1) | ||||||||||
| Basic weighted-average common shares outstanding (A) | 47,234 | 46,247 | 45,997 | |||||||
| Basic
weighted-average common shares outstanding and unvested restricted shares expected to vest (B) |
47,863 | 46,733 | 46,484 | |||||||
| Percent allocated to common shareholders (A) / (B) | 99% | 99% | 99% | |||||||
Options to purchase 1,597,751 shares of the Company’s common stock at prices ranging from $11.23 to $24.46 per share were outstanding during the year ended June 30, 2015, but were not included in the computation of diluted earnings per share because the options’ exercise price were greater than the average market price of the Company’s common shares. The options, which expire at various dates through on August 27, 2024, were still outstanding as of June 30, 2015.
F-51
| NET 1 UEPS TECHNOLOGIES, INC. |
| Notes to the consolidated financial statements |
| for the years ended June 30, 2016, 2015 and 2014 |
| (All amounts stated in thousands of United States Dollars, unless otherwise stated) |
| 22. | SUPPLEMENTAL CASH FLOW INFORMATION |
Supplemental cash flow information
The following table presents the supplemental cash flow disclosures for the years ended June 30, 2016, 2015 and 2014:
| 2016 | 2015 | 2014 | ||||||||
| Cash received from interest | $ | 15,262 | $ | 16,399 | $ | 14,703 | ||||
| Cash paid for interest | $ | 3,439 | $ | 4,360 | $ | 6,969 | ||||
| Cash paid for income taxes | $ | 42,123 | $ | 45,459 | $ | 42,417 |
Financing activities
Treasury shares, at cost included in the Company’s consolidated balance sheet as of June 30, 2016, includes 47,056 shares of the Company’s common stock acquired for approximately $0.5 million which were paid for on July 1, 2016. The liability for this payment was included in accounts payable on the Company’s consolidated balance sheet as of June 30, 2016.
As discussed in Note 3, on January 20, 2016, the Company issued 391,645 shares of its common stock with an aggregate issue date fair value of approximately $4.0 million as part consideration for the Company’s 56% interest in Transact24.
As discussed in Note 18, during the year ended June 30, 2015, employees exercised stock options through the delivery 336,584 shares of the Company’s common stock at the closing price on September 9, 2014 or $13.93 under the terms of their option agreements. These shares are included in the Company’s total share count and amount reflected as treasury shares on the consolidated balance sheet as of June 30, 2015 and consolidated statement of changes in equity for the year ended June 30, 2015.
The cash flows associated with the December 2013 BEE transactions and buy back of shares from the BEE partners as described in Note 14 were all denominated in South African rand and net settled and there were no actual cash flow transactions between the parties. The Company would have recorded the following movements in its investing and financing activities in its consolidated statement of cash flows for the year ended June 30, 2014, if cash had actually flowed between the parties as follows:
| 2014 | ||||
| Cash (used in ) provided by investing activities: | ||||
| Loans provided to BEE partners | $ | (25,054 | ) | |
| Loans repaid by BEE partners | $ | 24,574 | ||
| Cash provided by (used in) financing activities: | ||||
| Issue of shares of the Company’s common stock to BEE partners | $ | 25,054 | ||
| Purchase of shares from BEE partners | $ | (24,858 | ) |
In addition, the equity instrument charges discussed in Note 17 and expensed during the year ended June 30, 2014 are book entries and were not paid in cash.
| 23. | OPERATING SEGMENTS |
Operating segments
The Company discloses segment information as reflected in the management information systems reports that its chief operating decision maker uses in making decisions and to report certain entity-wide disclosures about products and services, major customers, and the countries in which the entity holds material assets or reports material revenues.
F-52
| NET 1 UEPS TECHNOLOGIES, INC. |
| Notes to the consolidated financial statements |
| for the years ended June 30, 2016, 2015 and 2014 |
| (All amounts stated in thousands of United States Dollars, unless otherwise stated) |
| 23. | OPERATING SEGMENTS (continued) |
Operating segments (continued)
The Company currently has three reportable segments: South African transaction processing, International transaction processing and Financial inclusion and applied technologies. The South African transaction processing and Financial inclusion and applied technologies segments operate mainly within South Africa and the International transaction processing segment operates mainly within South Korea, Hong Kong and the European Union. The Company’s reportable segments offer different products and services and require different resources and marketing strategies and share the Company’s assets.
The South African transaction processing segment currently consists mainly of a welfare benefit distribution service provided to the South African government and transaction processing for retailers, utilities, medical-related claim service customers and banks. Fee income is earned based on the number of recipient cardholders paid. Utility providers and banks are charged a fee for transaction processing services performed on their behalf at retailers. This segment has individually significant customers that each provides more than 10% of the total revenue of the Company. For the year ended June 30, 2016, there was one such customer, providing 21% of total revenue (2015: one such customer, providing 24% of total revenue; 2014: one such customer, providing 27% of total revenue).
The International transaction processing segment consists mainly of activities in South Korea from which the Company generates revenue from the provision of payment processing services to merchants and card issuers through its VAN. This segment generates fee revenue from the provision of payment processing services and to a lesser extent from the sale of goods, primarily point of sale terminals, to customers in South Korea. Fees generated from payment services processing and other processing activities by Transact24 and Masterpayment are included in this segment. Finally, the segment includes start up costs related to ZAZOO in the United Kingdom and India and generates transaction fee revenue from transaction processing of UEPS-enabled smartcards in Botswana.
The Financial inclusion and applied technologies segment derives revenue from the provision of short-term loans as a principal and the provision of smart card accounts, as a fixed monthly fee per card is charged for the maintenance of these accounts. This segment also includes fee income and associated expenses from merchants and card holders using the Company’s merchant acquiring system, the sale of prepaid products (electricity and airtime) as well as the sale of hardware and software. Finally, the Company earns premium income from the sale of life insurance products and investment income through its insurance business.
Corporate/eliminations includes the Company’s head office cost center and the amortization of acquisition-related intangible assets. The $1.9 million fair value gain resulting from the acquisition of Transact24 (refer to Note 3) and the $2.2 million gain resulting from the change in accounting for Finbond (refer to Note 15) that were recognized during the year ended June 30, 2016, have been allocated to corporate/ elimination. The charges related to the BEE equity instrument issued during the year ended June 30, 2014 (refer to Note 17), and the profit related to the deconsolidation of subsidiaries and disposal of business (refer to Note 19), during the year ended June 30, 2014, has been allocated to corporate/eliminations.
F-53
| NET 1 UEPS TECHNOLOGIES, INC. |
| Notes to the consolidated financial statements |
| for the years ended June 30, 2016, 2015 and 2014 |
| (All amounts stated in thousands of United States Dollars, unless otherwise stated) |
| 23. | OPERATING SEGMENTS (continued) |
The reconciliation of the reportable segments revenue to revenue from external customers for the years ended June 30, 2016, 2015 and 2014, respectively, is as follows:
| Revenue | ||||||||||
| From | ||||||||||
| Reportable | Inter- | external | ||||||||
| Segment | segment | customers | ||||||||
| South African transaction processing | $ | 212,574 | $ | 17,615 | $ | 194,959 | ||||
| International transaction processing | 169,807 | - | 169,807 | |||||||
| Financial inclusion and applied technologies | 249,403 | 23,420 | 225,983 | |||||||
| Total for the year ended June 30, 2016 | 631,784 | 41,035 | 590,749 | |||||||
| South African transaction processing | $ | 236,452 | $ | 20,521 | $ | 215,931 | ||||
| International transaction processing | 164,554 | - | 164,554 | |||||||
| Financial inclusion and applied technologies | 272,600 | 27,106 | 245,494 | |||||||
| Total for the year ended June 30, 2015 | 673,606 | 47,627 | 625,979 | |||||||
| South African transaction processing | 261,577 | 11,543 | 250,034 | |||||||
| International transaction processing | 152,725 | - | 152,725 | |||||||
| Financial inclusion and applied technologies | 207,595 | 28,698 | 178,897 | |||||||
| Total for the year ended June 30, 2014 | $ | 621,897 | $ | 40,241 | $ | 581,656 | ||||
The Company does not allocate interest income, interest expense or income tax expense to its reportable segments. The Company evaluates segment performance based on segment operating income before acquisition-related intangible asset amortization which represents operating income before acquisition-related intangible asset amortization and allocation of expenses allocated to Corporate/Eliminations, all under GAAP. The reconciliation of the reportable segments measure of profit or loss to income before income taxes for the years ended June 30, 2016, 2015 and 2014, respectively, is as follows:
| For the years ended June 30, | ||||||||||
| 2016 | 2015 | 2014 | ||||||||
| Reportable segments measure of profit or loss | $ | 129,774 | $ | 150,538 | $ | 144,038 | ||||
| Operating income: Corporate/Eliminations | (15,406 | ) | (22,019 | ) | (42,240 | ) | ||||
| Interest income | 15,292 | 16,355 | 14,817 | |||||||
| Interest expense | (3,423 | ) | (4,456 | ) | (7,473 | ) | ||||
| Income before income taxes | $ | 126,237 | $ | 140,418 | $ | 109,142 | ||||
F-54
| NET 1 UEPS TECHNOLOGIES, INC. |
| Notes to the consolidated financial statements |
| for the years ended June 30, 2016, 2015 and 2014 |
| (All amounts stated in thousands of United States Dollars, unless otherwise stated) |
| 23. | OPERATING SEGMENTS (continued) |
The following tables summarize segment information which is prepared in accordance with GAAP for the years ended June 30, 2016, 2015 and 2014:
| For the years ended June 30, | ||||||||||
| 2016 | 2015 | 2014 | ||||||||
| Revenues | ||||||||||
| South African transaction processing | $ | 212,574 | $ | 236,452 | $ | 261,577 | ||||
| International transaction processing | 169,807 | 164,554 | 152,725 | |||||||
| Financial inclusion and applied technologies | 249,403 | 272,600 | 207,595 | |||||||
| Total | 631,784 | 673,606 | 621,897 | |||||||
| Operating income (loss) | ||||||||||
| South African transaction processing | 51,386 | 51,008 | 61,401 | |||||||
| International transaction processing | 23,389 | 26,805 | 21,952 | |||||||
| Financial inclusion and applied technologies | 54,999 | 72,725 | 60,685 | |||||||
| Subtotal: Operating segments | 129,774 | 150,538 | 144,038 | |||||||
| Corporate/Eliminations | (15,406 | ) | (22,019 | ) | (42,240 | ) | ||||
| Total | 114,368 | 128,519 | 101,798 | |||||||
| Depreciation and amortization | ||||||||||
| South African transaction processing | 6,157 | 7,093 | 7,036 | |||||||
| International transaction processing | 21,852 | 17,846 | 15,823 | |||||||
| Financial inclusion and applied technologies | 1,158 | 808 | 874 | |||||||
| Subtotal: Operating segments | 29,167 | 25,747 | 23,733 | |||||||
| Corporate/Eliminations | 11,227 | 14,938 | 16,553 | |||||||
| Total | 40,394 | 40,685 | 40,286 | |||||||
| Expenditures for long-lived assets | ||||||||||
| South African transaction processing | 5,101 | 7,008 | 3,425 | |||||||
| International transaction processing | 28,029 | 28,205 | 19,393 | |||||||
| Financial inclusion and applied technologies | 2,667 | 1,223 | 1,088 | |||||||
| Subtotal: Operating segments | 35,797 | 36,436 | 23,906 | |||||||
| Corporate/Eliminations | - | - | - | |||||||
| Total | $ | 35,797 | $ | 36,436 | $ | 23,906 | ||||
The segment information as reviewed by the chief operating decision maker does not include a measure of segment assets per segment as all of the significant assets are used in the operations of all, rather than any one, of the segments. The Company does not have dedicated assets assigned to a particular operating segment. Accordingly, it is not meaningful to attempt an arbitrary allocation and segment asset allocation is therefore not presented.
It is impractical to disclose revenues from external customers for each product and service or each group of similar products and services.
Geographic Information
Revenues based on the geographic location from which the sale originated for the years ended June 30, are presented in the table below:
| 2016 | 2015 | 2014 | ||||||||
| South Africa | $ | 422,022 | $ | 461,425 | $ | 428,931 | ||||
| South Korea | 158,609 | 160,853 | 146,667 | |||||||
| Rest of world | 10,118 | 3,701 | 6,058 | |||||||
| Total | $ | 590,749 | $ | 625,979 | $ | 581,656 |
F-55
| NET 1 UEPS TECHNOLOGIES, INC. |
| Notes to the consolidated financial statements |
| for the years ended June 30, 2016, 2015 and 2014 |
| (All amounts stated in thousands of United States Dollars, unless otherwise stated) |
| 23. | OPERATING SEGMENTS (continued) |
Geographic Information (continued)
Long-lived assets based on the geographic location for the years ended June 30, are presented in the table below:
| Long-lived assets | ||||||||||
| 2016 | 2015(1) | 2014(1) | ||||||||
| South Africa | $ | 69,213 | $ | 72,467 | $ | 105,627 | ||||
| South Korea | 221,459 | 230,109 | 253,147 | |||||||
| Rest of world | 49,105 | 20,058 | 6,593 | |||||||
| Total | $ | 339,777 | $ | 322,634 | $ | 365,367 | ||||
(1) As described in Note 1, during the year ended June 30, 2016, the Company identified a balance sheet misclassification between current assets and long-term assets. Long-lived assets for fiscal 2015 and 2014, have been restated, and have increased by $27.4 million and $23.3 million, respectively.
| 24. | COMMITMENTS AND CONTINGENCIES |
Operating lease commitments
The Company leases certain premises. At June 30, 2016, the future minimum payments under operating leases consist of:
| Due within 1 year | $ | 5,334 | ||
| Due within 2 years | $ | 3,258 | ||
| Due within 3 years | $ | 790 | ||
| Due within 4 years | $ | 89 | ||
| Due within 5 years | $ | - |
Operating lease payments related to the premises and equipment were $8.0 million, $6.8 million and $7.5 million, respectively, for the years ended June 2016, 2015 and 2014, respectively.
Capital commitments
As of June 30, 2016 and 2015, the Company had outstanding capital commitments of approximately $0.1 million and $3.4 million, respectively.
Purchase obligations
As of June 30, 2016 and 2015, the Company had purchase obligations totaling $3.1 million and $5.0 million, respectively. The purchase obligations as of June 30, 2016, primarily include inventory that will be delivered to the Company and sold to customers in the next twelve months.
Guarantees
The South African Revenue Service and certain of the Company’s customers, suppliers and other business partners have asked the Company to provide them with guarantees, including standby letters of credit, issued by a South African bank. The Company is required to procure these guarantees for these third parties to operate its business.
Nedbank has issued guarantees to these third parties amounting to ZAR 127.4 million ($8.6 million, translated at exchange rates applicable as of June 30, 2016) and thereby utilizing part of the Company’s short-term facility. The Company in turn has provided nonrecourse, unsecured counter-guarantees to Nedbank for ZAR 127.4 million ($8.6 million, translated at exchange rates applicable as of June 30, 2016). The Company pays commission of between 0.4% per annum to 2.0% per annum of the face value of these guarantees and does not recover any of the commission from third parties.
F-56
| NET 1 UEPS TECHNOLOGIES, INC. |
| Notes to the consolidated financial statements |
| for the years ended June 30, 2016, 2015 and 2014 |
| (All amounts stated in thousands of United States Dollars, unless otherwise stated) |
| 24. | COMMITMENTS AND CONTINGENCIES (continued) |
Guarantees (continued)
The Company has not recognized any obligation related to these counter-guarantees in its consolidated balance sheet as of June 30, 2016. The maximum potential amount that the Company could pay under these guarantees is ZAR 127.4 million ($8.6 million, translated at exchange rates applicable as of June 30, 2016). The guarantees have reduced the amount available for borrowings under the Company’s short-term credit facility described in Note 12.
Contingencies
The Company is subject to a variety of insignificant claims and suits that arise from time to time in the ordinary course of business.
Management currently believes that the resolution of these matters, individually or in the aggregate, will not have a material adverse impact on the Company’s financial position, results of operations and cash flows.
| 25. | RELATED PARTY TRANSACTIONS |
As described in Note 3, the Company has acquired all of the outstanding and issued ordinary shares in Transact24 that it did not own in January 2016 and commenced consolidating Transact24 from that date. Transact24 had an existing relationship in place between itself and a company controlled by the spouse of Transact24’s Managing Director at the time of the Transact24 acquisition. This arrangement therefore was also in place before the Managing Director became an executive officer of the Company. This relationship was disclosed to the Company during the due diligence process and has been considered by the Company’s management to be critical to the ongoing operations of Transact24. The company controlled by the spouse of the managing director performs transaction processing and Transact24 provides technical and administration services to the company. The Company has recorded revenue of approximately $1.9 million related to this relationship during the six months ended June 30, 2015. Transact24’s Managing Director has an indirect interest in these transactions as a result of his relationship with his spouse, with an approximate value of $0.1 million during the six months ended June 30, 2016. As of June 30, 2016, $0.4 million is due to the Company related to the service provided by Transact24 and this amount is included in accounts receivables, net as of June 30, 2016.
| 26. | UNAUDITED QUARTERLY RESULTS |
The following tables contain selected unaudited consolidated statements of operations information for each quarter of fiscal 2016 and 2015:
| Three months ended | ||||||||||||||||
| Year | ||||||||||||||||
| ended | ||||||||||||||||
| Jun 30, | Mar 31, | Dec 31, | Sep 30, | June 30, | ||||||||||||
| 2016 | 2016 | 2015 | 2015 | 2016 | ||||||||||||
| (In thousands except per share data) | ||||||||||||||||
| Revenue | $ | 151,259 | $ | 134,736 | $ | 150,281 | $ | 154,473 | $ | 590,749 | ||||||
| Operating income | 32,183 | 26,191 | 24,779 | 31,215 | 114,368 | |||||||||||
| Net income attributable to Net1 | $ | 24,356 | $ | 18,420 | $ | 16,658 | $ | 23,020 | $ | 82,454 | ||||||
| Net income per share, in United States dollars | ||||||||||||||||
| Basic earnings attributable to Net1 shareholders | $ | 0.48 | $ | 0.40 | $ | 0.35 | $ | 0.49 | $ | 1.72 | ||||||
| Diluted earnings attributable to Net1 shareholders | $ | 0.47 | $ | 0.39 | $ | 0.35 | $ | 0.48 | $ | 1.71 | ||||||
F-57
| NET 1 UEPS TECHNOLOGIES, INC. |
| Notes to the consolidated financial statements |
| for the years ended June 30, 2016, 2015 and 2014 |
| (All amounts stated in thousands of United States Dollars, unless otherwise stated) |
| 26. | UNAUDITED QUARTERLY RESULTS (continued) |
| Three months ended | ||||||||||||||||
| Year | ||||||||||||||||
| ended | ||||||||||||||||
| Jun 30, | Mar 31, | Dec 31, | Sep 30, | June 30, | ||||||||||||
| 2015 | 2015 | 2014 | 2014 | 2015 | ||||||||||||
| (In thousands except per share data) | ||||||||||||||||
| Revenue | $ | 164,286 | $ | 151,121 | $ | 154,131 | $ | 156,441 | $ | 625,979 | ||||||
| Operating income | 32,613 | 31,966 | 30,815 | 33,125 | 128,519 | |||||||||||
| Net income attributable to Net1 | $ | 23,914 | $ | 24,358 | $ | 22,374 | $ | 24,089 | $ | 94,735 | ||||||
| Net income per share, in United States dollars | ||||||||||||||||
| Basic earnings attributable to Net1 shareholders | $ | 0.51 | $ | 0.52 | $ | 0.48 | $ | 0.51 | $ | 2.03 | ||||||
| Diluted earnings attributable to Net1 shareholders | $ | 0.51 | $ | 0.52 | $ | 0.48 | $ | 0.51 | $ | 2.02 | ||||||
*********************
F-58