Attached files
| file | filename |
|---|---|
| EX-32 - EXHIBIT 32 - NET 1 UEPS TECHNOLOGIES INC | exhibit32.htm |
| EX-31.2 - EXHIBIT 31.2 - NET 1 UEPS TECHNOLOGIES INC | exhibit31-2.htm |
| EX-31.1 - EXHIBIT 31.1 - NET 1 UEPS TECHNOLOGIES INC | exhibit31-1.htm |
UNITED STATES
SECURITIES AND EXCHANGE COMMISSION
Washington, D.C. 20549
FORM 10-Q
(Mark One)
[X] QUARTERLY REPORT PURSUANT TO SECTION 13 OR 15(d) OF THE SECURITIES EXCHANGE ACT OF 1934
For the quarterly period ended December 31, 2019
OR
[ ] TRANSITION REPORT PURSUANT TO SECTION 13 OR 15(d) OF THE SECURITIES AND EXCHANGE ACT OF 1934
For the transition period from ___________________ To_____________________
Commission file number: 000-31203
NET 1 UEPS TECHNOLOGIES, INC.
(Exact name of registrant as specified in its charter)
|
Florida |
98-0171860 |
|
(State or other jurisdiction |
(IRS Employer |
|
of incorporation or organization) |
Identification No.) |
|
President Place, 4th Floor, Cnr. Jan Smuts Avenue and Bolton Road |
|
Rosebank, Johannesburg 2196, South Africa |
|
(Address of principal executive offices, including zip code) |
Registrant's telephone number, including area code: 27-11-343-2000
|
Not Applicable |
|
(Former Name, Former Address and Former Fiscal Year, if Changed Since Last Report)
|
on which registered
Indicate by check mark whether the registrant (1) has filed all reports required to be filed by Section 13 or 15(d) of the Securities Exchange Act of 1934 during the preceding 12 months (or for such shorter period that the registrant was required to file such reports), and (2) has been subject to such filing requirements for the past 90 days. YES [X] NO [ ]
Indicate by check mark whether the registrant has submitted electronically every Interactive Data File required to be submitted pursuant to Rule 405 of Regulation S-T (§232.405 of this chapter) during the preceding 12 months (or for such shorter period that the registrant was required to submit such files). YES [X] NO [ ]
Indicate by check mark whether the registrant is a large accelerated filer, an accelerated filer, a non-accelerated filer, smaller reporting company or an emerging growth company. See the definitions of "large accelerated filer," "accelerated filer," "smaller reporting company," and "emerging growth company" in Rule 12b-2 of the Exchange Act (check one):
|
[ ] Large accelerated filer |
[X] Accelerated filer |
|
|
|
|
[ ] Non-accelerated filer |
[X] Smaller reporting company |
|
|
|
|
|
[ ] Emerging growth company |
|
|
|
If an emerging growth company, indicate by check mark if the registrant has elected not to use the extended transition period for complying with any new or revised financial accounting standards provided pursuant to Section 13(a) of the Exchange Act. [ ]
Indicate by check mark whether the registrant is a shell company (as defined in Rule 12b-2 of the Exchange Act). YES [ ] NO [X]
As of February 3, 2020 (the latest practicable date), 56,568,425 shares of the registrant's common stock, par value $0.001 per share, net of treasury shares, were outstanding.
Form 10-Q
NET 1 UEPS TECHNOLOGIES, INC
Table of Contents
Part I. Financial information
Item 1. Financial Statements
NET 1 UEPS TECHNOLOGIES, INC
Unaudited Condensed Consolidated Balance Sheets
| December 31, | June 30, | |||||||||||||
| 2019 | 2019(A) | |||||||||||||
| (In thousands, except share data) | ||||||||||||||
| ASSETS | ||||||||||||||
| CURRENT ASSETS | ||||||||||||||
| Cash and cash equivalents | $ | 50,719 | $ | 46,065 | ||||||||||
| Restricted cash (Note 10) | 84,360 | 75,446 | ||||||||||||
| Accounts receivable, net and other receivables (Note 3) | 68,565 | 72,494 | ||||||||||||
| Finance loans receivable, net (Note 3) | 29,117 | 30,631 | ||||||||||||
| Inventory (Note 4) | 21,196 | 7,535 | ||||||||||||
| Total current assets before settlement assets | 253,957 | 232,171 | ||||||||||||
| Settlement assets (Note 5) | 55,401 | 63,479 | ||||||||||||
| Total current assets | 309,358 | 295,650 | ||||||||||||
| PROPERTY, PLANT AND EQUIPMENT, net of accumulated depreciation of - December: $121,584 June: $129,185 | 16,450 | 18,554 | ||||||||||||
| OPERATING LEASE RIGHT-OF-USE (Note 18) | 7,838 | - | ||||||||||||
| EQUITY-ACCOUNTED INVESTMENTS (Note 7) | 155,627 | 151,116 | ||||||||||||
| GOODWILL (Note 8) | 148,938 | 149,387 | ||||||||||||
| INTANGIBLE ASSETS, NET (Note 8) | 8,043 | 11,889 | ||||||||||||
| DEFERRED INCOME TAXES | 2,112 | 2,151 | ||||||||||||
| OTHER LONG-TERM ASSETS, including reinsurance assets (Note 7 and 9) | 41,144 | 44,189 | ||||||||||||
| TOTAL ASSETS | 689,510 | 672,936 | ||||||||||||
| LIABILITIES | ||||||||||||||
| CURRENT LIABILITIES | ||||||||||||||
| Short-term credit facilities for ATM funding (Note 10) | 84,360 | 75,446 | ||||||||||||
| Short-term credit facilities (Note 10) | 13,906 | 9,544 | ||||||||||||
| Accounts payable | 14,211 | 17,005 | ||||||||||||
| Other payables (Note 11) | 69,134 | 66,449 | ||||||||||||
| Operating lease right of use lease liability - current (Note 18) | 3,534 | - | ||||||||||||
| Current portion of long-term borrowings (Note 10) | 4,063 | - | ||||||||||||
| Income taxes payable | 5,043 | 6,223 | ||||||||||||
| Total current liabilities before settlement obligations | 194,251 | 174,667 | ||||||||||||
| Settlement obligations (Note 5) | 55,402 | 63,479 | ||||||||||||
| Total current liabilities | 249,653 | 238,146 | ||||||||||||
| DEFERRED INCOME TAXES | 4,503 | 4,682 | ||||||||||||
| RIGHT-OF-USE OPERATING LEASE LIABILITY - LONG TERM (Note 18) | 4,499 | - | ||||||||||||
| OTHER LONG-TERM LIABILITIES, including insurance policy liabilities (Note 7) | 2,623 | 3,007 | ||||||||||||
| TOTAL LIABILITIES | 261,278 | 245,835 | ||||||||||||
| REDEEMABLE COMMON STOCK | 107,672 | 107,672 | ||||||||||||
| EQUITY | ||||||||||||||
| COMMON STOCK (Note 12) | ||||||||||||||
| Authorized: 200,000,000 with $0.001 par value; | ||||||||||||||
| Issued and outstanding shares, net of treasury - December: 56,568,425 June: 56,568,425 | 80 | 80 | ||||||||||||
| PREFERRED STOCK | ||||||||||||||
| Authorized shares: 50,000,000 with $0.001 par value; | ||||||||||||||
| Issued and outstanding shares, net of treasury: December: - June: - | - | - | ||||||||||||
| ADDITIONAL PAID-IN-CAPITAL | 277,891 | 276,997 | ||||||||||||
| TREASURY SHARES, AT COST: December: 24,891,292 June: 24,891,292 | (286,951 | ) | (286,951 | ) | ||||||||||
| ACCUMULATED OTHER COMPREHENSIVE LOSS (Note 13) | (194,439 | ) | (199,273 | ) | ||||||||||
| RETAINED EARNINGS | 523,979 | 528,576 | ||||||||||||
| TOTAL NET1 EQUITY | 320,560 | 319,429 | ||||||||||||
| NON-CONTROLLING INTEREST | - | - | ||||||||||||
| TOTAL EQUITY | 320,560 | 319,429 | ||||||||||||
| TOTAL LIABILITIES, REDEEMABLE COMMON STOCK AND SHAREHOLDERS' EQUITY | $ | 689,510 | $ | 672,936 | ||||||||||
(A) - Derived from audited financial statements
See Notes to Unaudited Condensed Consolidated Financial Statements
NET 1 UEPS TECHNOLOGIES, INC
Unaudited Condensed Consolidated Statements of Operations
| Three months ended | Six months ended | ||||||||||||||
| December 31, | December 31, | ||||||||||||||
| 2019 | 2018 | 2019 | 2018 | ||||||||||||
| (In thousands, except per share data) | (In thousands, except per share data) | ||||||||||||||
| REVENUE (Note 17) | $ | 74,080 | $ | 77,442 | $ | 154,836 | $ | 184,539 | |||||||
| EXPENSE | |||||||||||||||
| Cost of goods sold, IT processing, servicing and support | 43,160 | 41,231 | 89,954 | 103,335 | |||||||||||
| Selling, general and administration | 33,393 | 69,730 | 65,324 | 111,152 | |||||||||||
| Depreciation and amortization | 4,381 | 7,191 | 9,146 | 15,048 | |||||||||||
| Impairment loss (Note 8) | - | 8,191 | - | 8,191 | |||||||||||
| OPERATING LOSS | (6,854 | ) | (48,901 | ) | (9,588 | ) | (53,187 | ) | |||||||
| CHANGE IN FAIR VALUE OF EQUITY SECURITIES (Note 6 and 7) | - | (15,836 | ) | - | (15,836 | ) | |||||||||
| GAIN ON DISPOSAL OF FIHRST (Note 2) | 9,743 | - | 9,743 | - | |||||||||||
| INTEREST INCOME | 1,343 | 2,177 | 1,994 | 3,778 | |||||||||||
| INTEREST EXPENSE | 3,221 | 2,563 | 4,576 | 5,121 | |||||||||||
| IMPAIRMENT OF CEDAR CELLULAR NOTE (Note 7) | - | 2,732 | - | 2,732 | |||||||||||
| INCOME (LOSS) BEFORE INCOME TAX EXPENSE (BENEFIT) | 1,011 | (67,855 | ) | (2,427 | ) | (73,098 | ) | ||||||||
| INCOME TAX EXPENSE (BENEFIT) (Note 20) | 1,722 | (4,398 | ) | 3,739 | 577 | ||||||||||
| NET LOSS BEFORE EARNINGS (LOSS) FROM EQUITY-ACCOUNTED INVESTMENTS | (711 | ) | (63,457 | ) | (6,166 | ) | (73,675 | ) | |||||||
| EARNINGS (LOSS) FROM EQUITY-ACCOUNTED INVESTMENTS (Note 7) | 506 | (1,291 | ) | 1,569 | 184 | ||||||||||
| NET LOSS FROM CONTINUING OPERATIONS | (205 | ) | (64,748 | ) | (4,597 | ) | (73,491 | ) | |||||||
| NET INCOME FROM DISCONTINUED OPERATIONS (Note 22) | - | 3,779 | - | 7,418 | |||||||||||
| NET (LOSS) INCOME | (205 | ) | (60,969 | ) | (4,597 | ) | (66,073 | ) | |||||||
| LESS (ADD) NET INCOME (LOSS) ATTRIBUTABLE TO NON-CONTROLLING INTEREST | - | 2,972 | - | 3,067 | |||||||||||
| Continuing | - | 721 | - | (877 | ) | ||||||||||
| Discontinued | - | 2,251 | - | 3,944 | |||||||||||
| NET (LOSS) INCOME ATTRIBUTABLE TO NET1 | (205 | ) | (63,941 | ) | (4,597 | ) | (69,140 | ) | |||||||
| Continuing | (205 | ) | (65,469 | ) | (4,597 | ) | (72,614 | ) | |||||||
| Discontinued | $ | - | $ | 1,528 | $ | - | $ | 3,474 | |||||||
| Net (loss) earnings per share, in United States dollars (Note 15): | |||||||||||||||
| Basic (loss) earnings attributable to Net1 shareholders | $ | (0.00 | ) | $ | (1.13 | ) | $ | (0.08 | ) | $ | (1.22 | ) | |||
| Continuing | $ | (0.00 | ) | $ | (1.16 | ) | $ | (0.08 | ) | $ | (1.28 | ) | |||
| Discontinued | $ | - | $ | 0.03 | $ | - | $ | 0.06 | |||||||
| Diluted (loss) earnings attributable to Net1 shareholders | $ | (0.00 | ) | $ | (1.12 | ) | $ | (0.08 | ) | $ | (1.22 | ) | |||
| Continuing | $ | (0.00 | ) | $ | (1.15 | ) | $ | (0.08 | ) | $ | (1.28 | ) | |||
| Discontinued | $ | - | $ | 0.03 | $ | - | $ | 0.06 | |||||||
| See Notes to Unaudited Condensed Consolidated Financial Statements | |||||||||||||||
NET 1 UEPS TECHNOLOGIES, INC
Unaudited Condensed Consolidated Statements of Comprehensive Income
| Three months ended | Six months ended | |||||||||||||||||||
| December 31, | December 31, | |||||||||||||||||||
| 2019 | 2018 | 2019 | 2018 | |||||||||||||||||
| (In thousands) | (In thousands) | |||||||||||||||||||
| Net loss | $ | (205 | ) | $ | (60,969 | ) | $ | (4,597 | ) | $ | (66,073 | ) | ||||||||
| Other comprehensive income (loss), net of taxes | ||||||||||||||||||||
| Movement in foreign currency translation reserve | 19,114 | (10,353 | ) | 1,029 | (23,675 | ) | ||||||||||||||
| Release of foreign currency translation reserve related to disposal of FIHRST | 1,578 | - | 1,578 | - | ||||||||||||||||
| Movement in foreign currency translation reserve related to equity-accounted investments | (491 | ) | - | 2,227 | 5,430 | |||||||||||||||
| Total other comprehensive income (loss), net of taxes | 20,201 | (10,353 | ) | 4,834 | (18,245 | ) | ||||||||||||||
| Comprehensive income (loss) | 19,996 | (71,322 | ) | 237 | (84,318 | ) | ||||||||||||||
| (Less) Add comprehensive (gain) loss attributable to non-controlling interest | - | (1,363 | ) | - | 1,342 | |||||||||||||||
| Comprehensive income (loss) attributable to Net1 | $ | 19,996 | $ | (72,685 | ) | $ | 237 | $ | (82,976 | ) | ||||||||||
See Notes to Unaudited Condensed Consolidated Financial Statements
NET 1 UEPS TECHNOLOGIES, INC
Unaudited Condensed Consolidated Statements of Changes in Equity
| Net 1 UEPS Technologies, Inc. Shareholders | ||||||||||||||||||||||||||||||||||||
| Number of Shares | Amount | Number of Treasury Shares | Treasury Shares | Number of shares, net of treasury | Additional Paid-In Capital | Retained Earnings | Accumulated other comprehensive (loss) | Total Net1 Equity | Non-controlling Interest | Total | Redeemable common stock | |||||||||||||||||||||||||
| For the three months ended December 31, 2018 (dollar amounts in thousands) |
||||||||||||||||||||||||||||||||||||
| Balance - October 1, 2018 | 81,725,217 | $ | 80 | (24,891,292 | ) | $ | (286,951 | ) | 56,833,925 | $ | 276,865 | $ | 830,995 | $ | (189,630 | ) | $ | 631,359 | $ | 91,477 | $ | 722,836 | $ | 107,672 | ||||||||||||
| Stock-based compensation charge (Note 14) | 598 | 598 | 598 | |||||||||||||||||||||||||||||||||
| Dividends paid to non-controlling interest | - | (1,208 | ) | (1,208 | ) | |||||||||||||||||||||||||||||||
| Net (loss) income | (63,941 | ) | (63,941 | ) | 2,972 | (60,969 | ) | |||||||||||||||||||||||||||||
| Other comprehensive loss (Note 13) | (8,744 | ) | (8,744 | ) | (1,609 | ) | (10,353 | ) | ||||||||||||||||||||||||||||
| Balance - December 31, 2018 | 81,725,217 | $ | 80 | (24,891,292 | ) | $ | (286,951 | ) | 56,833,925 | $ | 277,463 | $ | 767,054 | $ | (198,374 | ) | $ | 559,272 | $ | 91,632 | $ | 650,904 | $ | 107,672 | ||||||||||||
| For the six months ended December 31, 2018 (dollar amounts in thousands) | ||||||||||||||||||||||||||||||||||||
| Balance - July 1, 2018 | 81,577,217 | $ | 80 | (24,891,292 | ) | $ | (286,951 | ) | 56,685,925 | $ | 276,201 | $ | 836,194 | $ | (184,538 | ) | $ | 640,986 | $ | 95,911 | $ | 736,897 | $ | 107,672 | ||||||||||||
| Restricted stock granted | 148,000 | 148,000 | - | - | ||||||||||||||||||||||||||||||||
| Stock-based compensation charge (Note 14) | 1,185 | 1,185 | 1,185 | |||||||||||||||||||||||||||||||||
| Stock-based compensation charge related to equity accounted investment | 77 | 77 | 77 | |||||||||||||||||||||||||||||||||
| Dividends paid to non-controlling interest | - | (2,937 | ) | (2,937 | ) | |||||||||||||||||||||||||||||||
| Net (loss) income | (69,140 | ) | (69,140 | ) | 3,067 | (66,073 | ) | |||||||||||||||||||||||||||||
| Other comprehensive loss (Note 13) | (13,836 | ) | (13,836 | ) | (4,409 | ) | (18,245 | ) | ||||||||||||||||||||||||||||
| Balance - December 31, 2018 | 81,725,217 | $ | 80 | (24,891,292 | ) | $ | (286,951 | ) | 56,833,925 | $ | 277,463 | $ | 767,054 | $ | (198,374 | ) | $ | 559,272 | $ | 91,632 | $ | 650,904 | $ | 107,672 | ||||||||||||
NET 1 UEPS TECHNOLOGIES, INC
Unaudited Condensed Consolidated Statements of Changes in Equity
| Net 1 UEPS Technologies, Inc. Shareholders | ||||||||||||||||||||||||||||||||||||
| Number of Shares | Amount | Number of Treasury Shares | Treasury Shares | Number of shares, net of treasury | Additional Paid-In Capital | Retained Earnings | Accumulated other comprehensive (loss) income | Total Net1 Equity | Non-controlling Interest | Total | Redeemable common stock | |||||||||||||||||||||||||
| For the three months ended December 31, 2019 (dollar amounts in thousands) | ||||||||||||||||||||||||||||||||||||
| Balance - October 1, 2019 | 81,459,717 | $ | 80 | (24,891,292 | ) | $ | (286,951 | ) | 56,568,425 | $ | 277,455 | $ | 524,184 | $ | (214,640 | ) | $ | 300,128 | $ | - | $ | 300,128 | $ | 107,672 | ||||||||||||
| Stock-based compensation charge (Note 14) | 436 | 436 | 436 | |||||||||||||||||||||||||||||||||
| Net loss | (205 | ) | (205 | ) | - | (205 | ) | |||||||||||||||||||||||||||||
| Other comprehensive income (Note 13) | 20,201 | 20,201 | - | 20,201 | ||||||||||||||||||||||||||||||||
| Balance - December 31, 2019 | 81,459,717 | $ | 80 | (24,891,292 | ) | $ | (286,951 | ) | 56,568,425 | $ | 277,891 | $ | 523,979 | $ | (194,439 | ) | $ | 320,560 | $ | - | $ | 320,560 | $ | 107,672 | ||||||||||||
| For the six months ended December 31, 2019 (dollar amounts in thousands) | ||||||||||||||||||||||||||||||||||||
| Balance - July 1, 2019 | 81,459,717 | $ | 80 | (24,891,292 | ) | $ | (286,951 | ) | 56,568,425 | $ | 276,997 | $ | 528,576 | $ | (199,273 | ) | $ | 319,429 | $ | - | $ | 319,429 | $ | 107,672 | ||||||||||||
| Stock-based compensation charge (Note 14) | 823 | 823 | 823 | |||||||||||||||||||||||||||||||||
| Stock-based compensation charge related to equity accounted investment (Note 7) | 71 | 71 | 71 | |||||||||||||||||||||||||||||||||
| Net loss | (4,597 | ) | (4,597 | ) | - | (4,597 | ) | |||||||||||||||||||||||||||||
| Other comprehensive income (Note 13) | 4,834 | 4,834 | - | 4,834 | ||||||||||||||||||||||||||||||||
| Balance - December 31, 2019 | 81,459,717 | $ | 80 | (24,891,292 | ) | $ | (286,951 | ) | 56,568,425 | $ | 277,891 | $ | 523,979 | $ | (194,439 | ) | $ | 320,560 | $ | - | $ | 320,560 | $ | 107,672 | ||||||||||||
| See Notes to Unaudited Condensed Consolidated Financial Statements | ||||||||||||||||||||||||||||||||||||
NET 1 UEPS TECHNOLOGIES, INC
Unaudited Condensed Consolidated Statements of Cash Flows
| Three months ended | Six months ended | ||||||||||||||||
| December 31, | December 31, | ||||||||||||||||
| 2019 | 2018 | 2019 | 2018 | ||||||||||||||
| (In thousands) | (In thousands) | ||||||||||||||||
| Cash flows from operating activities | |||||||||||||||||
| Net loss | $ | (205 | ) | $ | (60,969 | ) | $ | (4,597 | ) | $ | (66,073 | ) | |||||
| Depreciation and amortization | 4,381 | 9,853 | 9,146 | 20,647 | |||||||||||||
| Impairment loss (Note 8) | - | 8,191 | - | 8,191 | |||||||||||||
| Movement in allowance for doubtful accounts receivable | (429 | ) | 21,368 | 83 | 23,958 | ||||||||||||
| (Earnings) loss from equity-accounted investments (Note 7) | (506 | ) | 1,247 | (1,569 | ) | (126 | ) | ||||||||||
| Movement in allowance for doubtful loans | 620 | - | 620 | - | |||||||||||||
| Interest on Cedar Cellular note (Note 7) | - | (1,216 | ) | - | (1,372 | ) | |||||||||||
| Impairment of Cedar Cellular note (Note 7) | - | 2,732 | - | 2,732 | |||||||||||||
| Change in fair value of equity securities (Note 6 and 7) | - | 15,836 | - | 15,836 | |||||||||||||
| Fair value adjustment related to financial liabilities | 147 | 83 | 234 | 1 | |||||||||||||
| Interest payable | 526 | 131 | 1,158 | 241 | |||||||||||||
| Facility fee amortized | - | 68 | - | 155 | |||||||||||||
| Gain on disposal of FIHRST (Note 2) | (9,743 | ) | - | (9,743 | ) | - | |||||||||||
| Profit on disposal of property, plant and equipment | (49 | ) | (139 | ) | (203 | ) | (266 | ) | |||||||||
| Stock-based compensation charge (Note 14) | 436 | 598 | 823 | 1,185 | |||||||||||||
| Dividends received from equity accounted investments | 380 | 454 | 1,448 | 454 | |||||||||||||
| Decrease in accounts receivable, pre-funded social welfare grants receivable and finance loans receivable | 8,767 | 18,753 | 3,101 | 28,755 | |||||||||||||
| (Increase) Decrease in inventory | (682 | ) | (24 | ) | (12,995 | ) | 2,161 | ||||||||||
| Increase (Decrease) in accounts payable and other payables | 3,132 | (11,759 | ) | (264 | ) | (19,535 | ) | ||||||||||
| (Decrease) increase in taxes payable | (2,244 | ) | (7,007 | ) | (956 | ) | 1,347 | ||||||||||
| Decrease in deferred taxes | (117 | ) | (3,436 | ) | (205 | ) | (7,070 | ) | |||||||||
| Net cash provided by (used in) operating activities | 4,414 | (5,236 | ) | (13,919 | ) | 11,221 | |||||||||||
| Cash flows from investing activities | |||||||||||||||||
| Capital expenditures | (827 | ) | (2,547 | ) | (3,451 | ) | (5,665 | ) | |||||||||
| Proceeds from disposal of property, plant and equipment | 90 | 212 | 303 | 486 | |||||||||||||
| Proceeds from disposal of FIHRST (Note 2) | 10,895 | - | 10,895 | - | |||||||||||||
| Investment in equity-accounted investments (Note 7) | - | (2,500 | ) | (1,250 | ) | (2,500 | ) | ||||||||||
| Loan to equity-accounted investment (Note 7) | (612 | ) | - | (612 | ) | - | |||||||||||
| Repayment of loans by equity-accounted investments | - | - | 4,268 | - | |||||||||||||
| Acquisition of intangible assets | - | (1,384 | ) | - | (1,384 | ) | |||||||||||
| Investment in MobiKwik | - | (1,056 | ) | - | (1,056 | ) | |||||||||||
| Return on investment | - | - | - | 284 | |||||||||||||
| Net change in settlement assets | 3,371 | 2,031 | (10,138 | ) | 77,962 | ||||||||||||
| Net cash provided by (used in) investing activities | 12,917 | (5,244 | ) | 15 | 68,127 | ||||||||||||
| Cash flows from financing activities | |||||||||||||||||
| Proceeds from bank overdraft (Note 10) | 207,876 | 221,582 | 391,550 | 306,237 | |||||||||||||
| Repayment of bank overdraft (Note 10) | (193,725 | ) | (245,726 | ) | (378,554 | ) | (245,726 | ) | |||||||||
| Long-term borrowings utilized (Note 10) | - | 3,203 | 14,798 | 11,004 | |||||||||||||
| Repayment of long-term borrowings (Note 10) | (11,313 | ) | (13,551 | ) | (11,313 | ) | (23,811 | ) | |||||||||
| Guarantee fee | - | (258 | ) | (148 | ) | (394 | ) | ||||||||||
| Finance lease capital repayments | (26 | ) | - | (52 | ) | - | |||||||||||
| Dividends paid to non-controlling interest | - | (1,208 | ) | - | (2,937 | ) | |||||||||||
| Net change in settlement obligations | (3,371 | ) | (2,031 | ) | 10,138 | (77,962 | ) | ||||||||||
| Net cash (used in) provided by financing activities | (559 | ) | (37,989 | ) | 26,419 | (33,589 | ) | ||||||||||
| Effect of exchange rate changes on cash | 7,508 | (1,823 | ) | 1,053 | (2,772 | ) | |||||||||||
| Net increase (decrease) in cash and cash equivalents | 24,280 | (50,292 | ) | 13,568 | 42,987 | ||||||||||||
| Cash and cash equivalents - beginning of period | 110,799 | 183,333 | 121,511 | 90,054 | |||||||||||||
| Cash and cash equivalents - end of period(1) | $ | 135,079 | $ | 133,041 | $ | 135,079 | $ | 133,041 | |||||||||
| See Notes to Unaudited Condensed Consolidated Financial Statements | |||||||||||||||||
| (1) Cash, cash equivalents and restricted cash as of December 31, 2019, includes restricted cash of approximately $84.4 million related to cash withdrawn from the Company's various debt facilities to fund ATMs. This cash may only be used to fund ATMs and is considered restricted as to use and therefore is classified as restricted cash. Refer to Note 10 for additional information regarding the Company's facilities. | |||||||||||||||||
NET 1 UEPS TECHNOLOGIES, INC
Notes to the Unaudited Condensed Consolidated Financial Statements
For the three and six months ended December 31, 2019 and 2018
(All amounts in tables stated in thousands or thousands of U.S. dollars, unless otherwise stated)
1. Basis of Presentation and Summary of Significant Accounting Policies
In November 2019, the Company through its wholly owned subsidiary, Net1 Applied Technologies South Africa Proprietary Limited ("Net1 SA"), entered into an agreement with Transaction Capital Payment Solutions Proprietary Limited, or its nominee, a limited liability private company duly incorporated in the Republic of South Africa, pursuant to which Net1 SA agreed to sell its entire shareholding in Net1 FIHRST Holdings Proprietary Limited ("FIHRST") for $11.7 million (ZAR 172.2 million). The transaction closed in December 2019. FIHRST was deconsolidated following the closing of the transaction. Net1 SA was obliged to utilize the full purchase price received from the sale of FIHRST to partially settle its obligations under its lending arrangements and applied the proceeds received against its outstanding borrowings - refer to Note 10.
Unaudited Interim Financial Information
The accompanying unaudited condensed consolidated financial statements include all majority-owned subsidiaries over which the Company exercises control and have been prepared in accordance with U.S. generally accepted accounting principles ("GAAP") and the rules and regulations of the United States Securities and Exchange Commission for Quarterly Reports on Form 10-Q and include all of the information and disclosures required for interim financial reporting. The results of operations for the three and six months ended December 31, 2019 and 2018, are not necessarily indicative of the results for the full year. The Company believes that the disclosures are adequate to make the information presented not misleading.
These financial statements should be read in conjunction with the financial statements, accounting policies and financial notes thereto included in the Company's Annual Report on Form 10-K for the fiscal year ended June 30, 2019. In the opinion of management, the accompanying unaudited condensed consolidated financial statements reflect all adjustments (consisting only of normal recurring adjustments), which are necessary for a fair representation of financial results for the interim periods presented.
References to the "Company" refer to Net1 and its consolidated subsidiaries, collectively, unless the context otherwise requires. References to "Net1" are references solely to Net 1 UEPS Technologies, Inc.
Consideration of going concern
Accounting guidance requires the Company's management to assess whether there are conditions or events, considered in the aggregate, that raise substantial doubt about the Company's ability to continue as a going concern within one year after its unaudited condensed consolidated financial statements are issued. The Company's management has identified certain conditions or events, which, considered in the aggregate, could raise substantial doubt about the Company's ability to continue as a going concern including the risk that the Company will be unable to:
- deliver all or a substantial part of the financial results forecast in its fiscal 2020 budget;
- retain its existing borrowings and facilities, as described in Note 10, or obtain additional borrowings and facilities on commercially reasonable terms;
- arrive at a commercial settlement with SASSA, given the September 30, 2019, Supreme Court of Appeal ruling regarding the repayment of the additional implementation costs received to SASSA (refer Note 11) and the ongoing dispute the Company has with SASSA over fees due for the six-month contract extension period in accordance with National Treasury's recommendation;
- dispose of all or a portion of its remaining 30% interest in DNI-4PL Contracts Proprietary Limited ("DNI"). DNI's operations are also significantly dependent on Cell C because it is the largest distributor of Cell C starter packs in South Africa. Therefore, the inability of Cell C to continue to operate through the next 12 months could also have an adverse impact on DNI's operations; or
- dispose of additional investments in order to realize sufficient cash flows.
The Company's management has implemented a number of plans to alleviate the substantial doubt about the Company's ability to continue as a going concern. These plans include disposing of its Korean business unit, KSNET, as announced in its press release of January 27, 2020, certain non-core assets (refer to Note 3 to the Company's audited consolidated financial statements included in its Annual Report on Form 10-K for the year ended June 30, 2019, for additional information regarding a call option granted to DNI), and extending its existing borrowings used to fund its ATMs through September 2020. Provided the KSNET disposal closes, as expected, in March 2020, this is expected to remove the substantial doubt about the Company's ability to continue as a going concern.
In addition, the Company's management believes it has a number of mitigating actions it can pursue, including (i) limiting the expansion of its microlending finance loans receivable book in South Africa; (ii) implementing further cost cutting measures; (iii) commencing additional asset realizations; (iv) managing its capital expenditures; and (v) accessing alternative sources of capital (including through the issuance of additional shares of its common stock), in order to generate additional liquidity.
1. Basis of Presentation and Summary of Significant Accounting Policies (continued)
Consideration of going concern (continued)
The Company's management believes that these plans and mitigating actions alleviate the substantial doubt referred to above and therefore have concluded that the Company remains a going concern.
Recent accounting pronouncements adopted
In February 2016, the Financial Accounting Standards Board ("FASB") issued guidance regarding Leases. The guidance increases transparency and comparability among organizations by requiring the recognition of lease assets and lease liabilities on the balance sheet. The amendments to current lease guidance include the recognition of assets and liabilities by lessees for those leases currently classified as operating leases. The guidance also requires disclosures to meet the objective of enabling users of financial statements to assess the amount, timing, and uncertainty of cash flows arising from leases. This guidance was effective for the Company beginning July 1, 2019. Refer to Note 18 for the impact of the adoption of this guidance on our condensed consolidated financial statements.
Recent accounting pronouncements not yet adopted as of December 31, 2019
In June 2016, the FASB issued guidance regarding Measurement of Credit Losses on Financial Instruments. The guidance replaces the incurred loss impairment methodology in current GAAP with a methodology that reflects expected credit losses and requires consideration of a broader range of reasonable and supportable information to inform credit loss estimates. For trade and other receivables, loans, and other financial instruments, an entity is required to use a forward-looking expected loss model rather than the incurred loss model for recognizing credit losses, which reflects losses that are probable. Credit losses relating to available-for-sale debt securities will also be recorded through an allowance for credit losses rather than as a reduction in the amortized cost basis of the securities. This guidance is effective for the Company beginning July 1, 2020. Early adoption is permitted beginning July 1, 2019. The Company is currently assessing the impact of this guidance on its financial statements and related disclosures.
In August 2018, the FASB issued guidance regarding Disclosure Framework: Changes to the Disclosure Requirements for Fair Value Measurement. The guidance modifies the disclosure requirements related to fair value measurement. This guidance is effective for the Company beginning July 1, 2020. Early adoption is permitted. The Company is currently assessing the impact of this guidance on its financial statements disclosure.
2. Disposal of controlling interest in FIHRST and KSNET
December 2019 disposal of FIHRST
In November 2019, the Company through its wholly owned subsidiary, Net1 Applied Technologies South Africa Proprietary Limited ("Net1 SA"), entered into an agreement with Transaction Capital Payment Solutions Proprietary Limited, or its nominee, a limited liability private company duly incorporated in the Republic of South Africa, pursuant to which Net1 SA agreed to sell its entire shareholding in Net1 FIHRST Holdings Proprietary Limited ("FIHRST") for $11.7 million (ZAR 172.2 million). The transaction closed in December 2019. FIHRST was deconsolidated following the closing of the transaction. Net1 SA was obliged to utilize the full purchase price received from the sale of FIHRST to partially settle its obligations under its lending arrangements and applied the proceeds received against its outstanding borrowings - refer to Note 10.
2. Disposal of controlling interest in FIHRST and KSNET (continued)
December 2019 disposal of FIHRST (continued)
The table below presents the impact of the deconsolidation of FIHRST and the calculation of the net gain recognized on deconsolidation:
| Total | |||
| Fair value of consideration received | $ | 11,749 | |
| Less: carrying value of FIHRST, comprising | 1,870 | ||
| Cash and cash equivalents | 854 | ||
| Accounts receivable, net | 367 | ||
| Property, plant and equipment, net | 64 | ||
| Goodwill (Note 8) | 599 | ||
| Intangible assets, net | 30 | ||
| Deferred income taxes assets | 42 | ||
| Accounts payable | (7 | ) | |
| Other payables | (1,437 | ) | |
| Income taxes payable | (220 | ) | |
| Released from accumulated other comprehensive income - foreign currency translation reserve (Note 13) | 1,578 | ||
| Settlement assets | 17,406 | ||
| Settlement liabilities | (17,406 | ) | |
| Gain recognized on disposal, before tax | 9,879 | ||
| Taxes related to gain recognized on disposal, comprising: | - | ||
| Capital gains tax | 2,418 | ||
| Release of valuation allowance related to capital gains tax previously unutilized(1) | (2,418 | ) | |
| Transaction costs | 136 | ||
| Gain recognized on disposal, after tax | $ | 9,743 |
(1) Net1 SA recorded a valuation allowance related to capital losses previously generated but not utilized. A portion of these unutilized capital losses was utilized as a result of the disposal of FIHRST and, therefore, the equivalent portion of the valuation allowance created was released.
Pro forma results of operations related to the FIHRST disposal have not been presented because the effect of the disposal was not material to the Company.
Disposal of KSNET
On January 23, 2020, the Company, through its wholly owned subsidiary Net1 Applied Technologies Netherlands B.V. ("Net1 BV"), a limited liability private company duly incorporated in The Netherlands, entered into an agreement with PayletterHoldings LLC, a limited liability private company duly incorporated in the Republic of Korea, in terms of which Net1 BV agreed to sell its entire shareholding in Net1 Applied Technologies Korea Limited, a limited liability private company incorporated in the Republic of Korea and the sole shareholder of KSNET, Inc. for $237.2 million. The transaction is subject to customary closing conditions and is expected to close in March 2020. The transaction is not subject to a financing condition.
3. Accounts receivable, net and other receivables and finance loans receivable, net
Accounts receivable, net and other receivables
The Company's accounts receivable, net, and other receivables as of December 31, 2019, and June 30, 2019, is presented in the table below:
| December 31, | June 30, | ||||||||||
| 2019 | 2019 | ||||||||||
| Accounts receivable, trade, net | $ | 26,568 | $ | 25,136 | |||||||
| Accounts receivable, trade, gross | 27,312 | 26,377 | |||||||||
| Allowance for doubtful accounts receivable, end of period | 744 | 1,241 | |||||||||
| Beginning of period | 1,241 | 1,101 | |||||||||
| Reversed to statement of operations | (535 | ) | (24 | ) | |||||||
| Charged to statement of operations | 108 | 3,296 | |||||||||
| Utilized | (58 | ) | (3,059 | ) | |||||||
| Deconsolidated | - | (38 | ) | ||||||||
| Foreign currency adjustment | (12 | ) | (35 | ) | |||||||
| Current portion of cash payments to agents in South Korea that are amortized over the contract period | 11,927 | 15,543 | |||||||||
| Cash payments to agents in South Korea that are amortized over the contract period | 18,457 | 25,107 | |||||||||
| Less: cash payments to agents in South Korea that are amortized over the contract period included in other long-term assets (Note 7) | 6,530 | 9,564 | |||||||||
| Loans provided to Carbon | 3,000 | 3,000 | |||||||||
| Loan provided to DNI | - | 4,260 | |||||||||
| Other receivables | 27,070 | 24,555 | |||||||||
| Total accounts receivable, net | $ | 68,565 | $ | 72,494 | |||||||
The loan provided to DNI was repaid in full in July 2019. Other receivables include prepayments, deposits and other receivables.
Finance loans receivable, net
The Company's finance loans receivable, net, as of December 31, 2019, and June 30, 2019, is presented in the table below:
| December 31, | June 30, | ||||||||||
| 2019 | 2019 | ||||||||||
| Microlending finance loans receivable, net | $ | 14,504 | $ | 20,981 | |||||||
| Microlending finance loans receivable, gross | 17,091 | 24,180 | |||||||||
| Allowance for doubtful finance loans receivable, end of period | 2,587 | 3,199 | |||||||||
| Beginning of period | 3,199 | 4,239 | |||||||||
| Reversed to statement of operations | (601 | ) | - | ||||||||
| Charged to statement of operations | 1,081 | 28,802 | |||||||||
| Utilized | (1,085 | ) | (29,721 | ) | |||||||
| Foreign currency adjustment | (7 | ) | (121 | ) | |||||||
| Working capital finance loans receivable, gross | 14,613 | 9,650 | |||||||||
| Working capital finance loans receivable, gross | 20,736 | 15,742 | |||||||||
| Allowance for doubtful finance loans receivable, end of period | 6,123 | 6,092 | |||||||||
| Beginning of period | 6,092 | 12,164 | |||||||||
| Charged to statement of operations | 30 | 712 | |||||||||
| Utilized | - | (6,777 | ) | ||||||||
| Foreign currency adjustment | 1 | (7 | ) | ||||||||
| Total accounts receivable, net | $ | 29,117 | $ | 30,631 | |||||||
4. Inventory
The Company's inventory comprised the following categories as of December 31, 2019, and June 30, 2019.
| December 31, | June 30, | ||||||
| 2019 | 2019 | ||||||
| Finished goods | $ | 7,538 | $ | 7,535 | |||
| Finished goods subject to sale restrictions | 13,658 | - | |||||
| $ | 21,196 | $ | 7,535 | ||||
Finished goods subject to sale restrictions represent airtime inventory purchased and held for sale to customers that may only be sold by the Company after March 31, 2020, and only with the express permission of certain South African banks. As discussed in Note 10, the Company obtained additional borrowings from its existing bankers to purchase Cell C airtime from an independent distributor of Cell C airtime. The Company did not pay the vendor for the airtime inventory directly because the parties (the vendor, Cell C, the Company and certain South African banks) agreed that the Company would pay the amount to Cell C to settle amounts payable to Cell C by the vendor in order to inject additional liquidity into Cell C. The Company may not return any unsold airtime inventory to either the vendor or Cell C. The Company agreed to mandatory prepayment terms, which require the Company to use the proceeds from the sale of the airtime inventory to settle certain borrowings. For more information about the amended finance documents, refer to Note 10.
5. Settlement assets and settlement obligations
Settlement assets comprise (1) cash received from the South African government that the Company holds pending disbursement to recipient cardholders of social welfare grants (2) cash received from credit card companies (as well as other types of payment services) which have business relationships with merchants selling goods and services via the internet that are the Company's customers and on whose behalf it processes the transactions between various parties, and (3) cash received from customers on whose behalf the Company processes payroll payments that the Company will disburse to customer employees, payroll-related payees and other payees designated by the customer.
Settlement obligations comprise (1) amounts that the Company is obligated to disburse to recipient cardholders of social welfare grants, (2) amounts that the Company is obligated to disburse to merchants selling goods and services via the internet that are the Company's customers and on whose behalf it processes the transactions between various parties and settles the funds from the credit card companies to the Company's merchant customers, and (3) amounts that the Company is obligated to pay to customer employees, payroll-related payees and other payees designated by the customer.
The balances at each reporting date may vary widely depending on the timing of the receipts and payments of these assets and obligations.
6. Fair value of financial instruments
Initial recognition and measurement
Financial instruments are recognized when the Company becomes a party to the transaction. Initial measurements are at cost, which includes transaction costs.
Risk management
The Company manages its exposure to currency exchange, translation, interest rate, customer concentration, credit and equity price and liquidity risks as discussed below.
Currency exchange risk
The Company is subject to currency exchange risk because it purchases inventories that it is required to settle in other currencies, primarily the euro and U.S. dollar. The Company has used forward contracts in order to limit its exposure in these transactions to fluctuations in exchange rates between the South African rand ("ZAR"), on the one hand, and the U.S. dollar and the euro, on the other hand.
6. Fair value of financial instruments (continued)
Risk management (continued)
Translation risk
Translation risk relates to the risk that the Company's results of operations will vary significantly as the U.S. dollar is its reporting currency, but it earns a significant amount of its revenues and incurs a significant amount of its expenses in ZAR and Korean won ("KRW"). The U.S. dollar to both the ZAR and KRW exchange rates has fluctuated significantly over the past three years. As exchange rates are outside the Company's control, there can be no assurance that future fluctuations will not adversely affect the Company's results of operations and financial condition.
Interest rate risk
As a result of its normal borrowing and lending activities, the Company's operating results are exposed to fluctuations in interest rates, which it manages primarily through regular financing activities. The Company generally maintains limited investments in cash equivalents and held to maturity investments and has occasionally invested in marketable securities.
Credit risk
Credit risk relates to the risk of loss that the Company would incur as a result of non-performance by counterparties. The Company maintains credit risk policies with regard to its counterparties to minimize overall credit risk. These policies include an evaluation of a potential counterparty's financial condition, credit rating, and other credit criteria and risk mitigation tools as the Company's management deems appropriate. With respect to credit risk on financial instruments, the Company maintains a policy of entering into such transactions only with South African, South Korean and European financial institutions that have a credit rating of "B" (or its equivalent) or better, as determined by credit rating agencies such as Standard & Poor's, Moody's and Fitch Ratings.
Microlending credit risk
The Company is exposed to credit risk in its microlending activities, which provide unsecured short-term loans to qualifying customers. The Company manages this risk by performing an affordability test for each prospective customer and assigning a "creditworthiness score", which takes into account a variety of factors such as other debts and total expenditures on normal household and lifestyle expenses.
Equity price and liquidity risk
Equity price risk relates to the risk of loss that the Company would incur as a result of the volatility in the exchange-traded price of equity securities that it holds and the risk that it may not be able to liquidate these securities. The market price of these securities may fluctuate for a variety of reasons and, consequently, the amount that the Company may obtain in a subsequent sale of these securities may significantly differ from the reported market value.
Liquidity risk relates to the risk of loss that the Company would incur as a result of the lack of liquidity on the exchange on which these securities are listed. The Company may not be able to sell some or all of these securities at one time, or over an extended period of time without influencing the exchange traded price, or at all.
Financial instruments
The following section describes the valuation methodologies the Company uses to measure its significant financial assets and liabilities at fair value.
In general, and where applicable, the Company uses quoted prices in active markets for identical assets or liabilities to determine fair value. This pricing methodology would apply to Level 1 investments. If quoted prices in active markets for identical assets or liabilities are not available to determine fair value, then the Company uses quoted prices for similar assets and liabilities or inputs other than the quoted prices that are observable either directly or indirectly. These investments would be included in Level 2 investments. In circumstances in which inputs are generally unobservable, values typically reflect management's estimates of assumptions that market participants would use in pricing the asset or liability. The fair values are therefore determined using model-based techniques that include option pricing models, discounted cash flow models, and similar techniques. Investments valued using such techniques are included in Level 3 investments.
6. Fair value of financial instruments (continued)
Financial instruments (continued)
Asset measured at fair value using significant unobservable inputs - investment in Cell C
The Company's Level 3 asset represents an investment of 75,000,000 class "A" shares in Cell C, a significant mobile telecoms provider in South Africa. The Company used a discounted cash flow model developed by the Company to determine the fair value of its investment in Cell C as of June 30, 2019, and valued Cell C at $0.0 (zero) at December 31, 2019, and June 30, 2019. As of June 30, 2019, the Company changed its valuation methodology from a Company-developed adjusted EV/ EBITDA model to a discounted cash flow approach due to anticipated changes in Cell C's business model and the current challenges faced by Cell C, which would not have been captured by the previous valuation approach. The Company believes the Cell C business plan utilized in the Company's valuation is reasonable based on the current performance and the expected changes in Cell C's business model.
The Company utilized the latest business plan provided by Cell C management for the period ending December 31, 2024, and the following key valuation inputs were used as of December 31, 2019 and June 30, 2019:
|
Weighted Average Cost of Capital: |
Between 15% and 20% over the period of the forecast |
|
Long term growth rate: |
3 % (4,5% as of June 30, 2019) |
|
Marketability discount: |
10% |
|
Minority discount: |
15% |
|
Net adjusted external debt - December 31, 2019:(1) |
ZAR 16,4 billion ($1,2 billion), includes R6 billion of lease liabilities |
|
Net adjusted external debt - June 30, 2019:(2) |
ZAR 13,9 billion ($1 billion), includes R6,4 billion of lease liabilities |
|
Deferred tax (incl, assessed tax losses) - December 31, 2019:(1) |
ZAR 2,9 billion ($206,4 million) |
|
Deferred tax (incl, assessed tax losses) - June 30, 2019:(2) |
ZAR 2,9 billion ($205,9 million) |
|
(1) translated from ZAR to U.S. dollars at exchange rates applicable as of December 31, 2019. |
|
|
(2) translated from ZAR to U.S. dollars at exchange rates applicable as of June 30, 2019. |
|
The Company utilized the aforementioned adjusted EV/EBITDA multiple valuation model in order to determine the fair value of the Cell C shares as of December 31, 2018. The primary inputs to the valuation model as of December 31, 2018, were unchanged from June 30, 2018, except for the EBITDA multiple. The primary inputs to the valuation model were Cell C's annualized adjusted EBITDA for the 11 months ended June 30, 2018, of ZAR 3.9 billion ($270.9 million, translated at exchange rates applicable as of December 31, 2018), an EBITDA multiple of 6.32; Cell C's net external debt of ZAR 8.8 billion ($611.4 million, translated at exchange rates applicable as of December 31, 2018); and a marketability discount of 10% as Cell C is not listed. The EBITDA multiple was determined based on an analysis of Cell C's peer group, which comprises eight African and emerging market mobile telecommunications operators. The fair value of Cell C utilizing the adjusted EV/EBITDA valuation model developed by the Company is sensitive to the following inputs: (i) the Company's determination of adjusted EBITDA; (ii) the EBITDA multiple used; and (iii) the marketability discount used. Utilization of different inputs, or changes to these inputs, may result in significantly higher or lower fair value measurement.
The following table presents the impact on the carrying value of the Company's Cell C investment of a 2.0% increase and 2.0% decrease in the WACC rate and the EBITDA margins used in the Cell C valuation on December 31, 2019, all amounts translated at exchange rates applicable as of December 31, 2019:
| Sensitivity for fair value of Cell C investment | 2.0% increase(A) | 2.0% decrease(A) | ||||
| WACC rate | $ | - | $ | 8,238 | ||
| EBITDA margin | $ | 1,687 | $ | - |
(A) the carrying value of the Cell C investment is not impacted by a 1.0% increase or a 1.0% decrease and therefore the impact of a 2.0% increase and a 2.0% decrease is presented.
The fair value of the Cell C shares as of December 31, 2019, represented approximately 0% of the Company's total assets, including these shares. The Company expects to hold these shares for an extended period of time and that there will be short-term equity price volatility with respect to these shares particularly given the current situation of Cell C's business.
Liability measured at fair value using significant unobservable inputs - DNI contingent consideration
The salient terms of the Company's investment in DNI are described in Note 3 to the Company's audited consolidated financial statements included in its Annual Report on Form 10-K for the year ended June 30, 2019. Under the terms of its subscription agreements with DNI, the Company agreed to pay to DNI an additional amount of up to ZAR 400.0 million ($27.8 million, translated at exchange rates applicable as of December 31, 2018), in cash, subject to the achievement of certain performance targets by DNI.
6. Fair value of financial instruments (continued)
Financial instruments (continued)
Liability measured at fair value using significant unobservable inputs - DNI contingent consideration
The Company expected to pay the additional amount during the first quarter of the year ended June 30, 2020, and recorded an amount of ZAR 385.7 million ($26.8 million) and ZAR 373.6 million ($27.2 million), in other payables in its unaudited condensed consolidated balance sheet as of December 31, 2018, and in long-term liabilities as of June 30, 2018, respectively, which amount represents the present value of the ZAR 400.0 million to be paid (amounts translated at exchange rates applicable as of December 31, 2018, and June 30, 2018, respectively). The amount was settled on March 31, 2019, as described in Note 3 to the Company's audited consolidated financial statements included in its Annual Report on Form 10-K for the year ended June 30, 2019.
Derivative transactions - Foreign exchange contracts
As part of the Company's risk management strategy, the Company enters into derivative transactions to mitigate exposures to foreign currencies using foreign exchange contracts. These foreign exchange contracts are over-the-counter derivative transactions. Substantially all of the Company's derivative exposures are with counterparties that have long-term credit ratings of "B" (or equivalent) or better. The Company uses quoted prices in active markets for similar assets and liabilities to determine fair value (Level 2). The Company has no derivatives that require fair value measurement under Level 1 or 3 of the fair value hierarchy. The Company had no outstanding foreign exchange contracts as of December 31, 2019, or June 30, 2019.
The following table presents the Company's assets and liabilities measured at fair value on a recurring basis as of December 31, 2019, according to the fair value hierarchy:
| Quoted Price in Active Markets for Identical Assets (Level 1) |
Significant Other Observable Inputs (Level 2) |
Significant Unobservable Inputs (Level 3) |
Total | ||||||||||||
| Assets | |||||||||||||||
| Investment in Cell C | $ | - | $ | - | $ | - | $ | - | |||||||
| Related to insurance business: | |||||||||||||||
| Cash, cash equivalents and restricted cash (included in other long term assets) | 587 | - | - | 587 | |||||||||||
| Fixed maturity investments (included in cash and cash equivalents) | 2,845 | - | - | 2,845 | |||||||||||
| Other | - | 414 | - | 414 | |||||||||||
| Total assets at fair value | $ | 3,432 | $ | 414 | $ | - | $ | 3,846 |
The following table presents the Company's assets and liabilities measured at fair value on a recurring basis as of June 30, 2019, according to the fair value hierarchy:
| Quoted Price in Active Markets for Identical Assets (Level 1) |
Significant Other Observable Inputs (Level 2) |
Significant Unobservable Inputs (Level 3) |
Total | ||||||||||||
| Assets | |||||||||||||||
| Investment in Cell C | $ | - | $ | - | $ | - | $ | - | |||||||
| Related to insurance business | |||||||||||||||
| Cash and cash equivalents (included in other long-term assets) | 619 | - | - | 619 | |||||||||||
| Fixed maturity investments (included in cash and cash equivalents) | 5,201 | - | - | 5,201 | |||||||||||
| Other | - | 413 | - | 413 | |||||||||||
| Total assets at fair value | $ | 5,820 | $ | 413 | $ | - | $ | 6,233 |
6. Fair value of financial instruments (continued)
There have been no transfers in or out of Level 3 during the three and six months ended December 31, 2019 and 2018, respectively.
There was no movement in the carrying value of assets measured at fair value on a recurring basis, and categorized within Level 3, during the three and six months ended December 31, 2019. Summarized below is the movement in the carrying value of assets and liabilities measured at fair value on a recurring basis, and categorized within Level 3, during the six months ended December 31, 2019:
| Carrying value | |||||
| Assets | |||||
| Balance as of June 30, 2019 | - | ||||
| Foreign currency adjustment(1) | - | ||||
| Balance as of December 31, 2019 | $ | - | |||
(1) The foreign currency adjustment represents the effects of the fluctuations of the South African rand and the U.S. dollar on the carrying value.
Summarized below is the movement in the carrying value of assets and liabilities measured at fair value on a recurring basis, and categorized within Level 3, during the six months ended December 31, 2018:
| Carrying value | |||||
| Assets | |||||
| Balance as at June 30, 2018 | 172,948 | ||||
| Realized losses | (15,836 | ) | |||
| Foreign currency adjustment(1) | (8,054 | ) | |||
| Balance as of December 31, 2018 | 149,058 | ||||
| Liabilities | |||||
| Balance as at June 30, 2018 | 27,222 | ||||
| Accretion of interest | 835 | ||||
| Foreign currency adjustment(1) | (1,267 | ) | |||
| Balance as of December 31, 2018 | 26,790 | ||||
(1) The foreign currency adjustment represents the effects of the fluctuations of the South African rand and the U.S. dollar on the carrying value.
Assets measured at fair value on a nonrecurring basis
We measure equity investments without readily determinable fair values on a nonrecurring basis. The fair values of these investments are determined based on valuation techniques using the best information available, and may include quoted market prices, market comparables, and discounted cash flow projections.
7. Equity-accounted investments and other long term assets
Refer to Note 9 to the Company's audited consolidated financial statements included in its Annual Report on Form 10-K for the year ended June 30, 2019, for additional information regarding its equity-accounted investments and other long-term assets.
Equity-accounted investments
The Company's ownership percentage in its equity-accounted investments as of December 31, 2019 and June 30, 2019, was as follows:
|
|
December 31, |
June 30, |
|
||
|
|
|
2019 |
|
2019 |
|
|
Bank Frick & Co AG ("Bank Frick") |
|
35% |
|
35% |
|
|
DNI |
|
30% |
|
30% |
|
|
Finbond Group Limited ("Finbond") |
|
29% |
|
29% |
|
|
Carbon Tech Limited ("Carbon"), formerly OneFi Limited |
|
25% |
|
25% |
|
|
Revix ("Revix") |
|
25% |
|
- |
|
|
SmartSwitch Namibia (Pty) Ltd ("SmartSwitch Namibia") |
|
50% |
|
50% |
|
|
V2 Limited ("V2") |
|
50% |
|
50% |
|
|
Walletdoc Proprietary Limited ("Walletdoc") |
|
20% |
|
20% |
|
7. Equity-accounted investments and other long term assets (continued)
Equity-accounted investments (continued)
DNI
During the three and six months ended December 31, 2019, the Company recorded earnings from DNI that resulted in the carrying value of DNI exceeding the amount that the Company could receive pursuant to the call option granted to DNI in May 2019. During the three and six months ended December 31, 2019, the Company has recorded an impairment loss of $0.8 million and $1.1 million, respectively, which represents the difference between the amount that the Company could receive pursuant to the call option and DNI's carrying value.
Bank Frick
On October 2, 2019, the Company exercised its option to acquire an additional 35% interest in Bank Frick from the Frick Family Foundation. The Company will pay an amount, the "Option Price Consideration", for the additional 35% interest in Bank Frick, which represents the higher of CHF 46.4 million ($46.5 million at exchange rates on October 2, 2019) or 35% of 15 times the average annual normalized net income of the Bank over the two years ended December 31, 2018. The shares will only transfer on payment of the Option Price Consideration, which shall occur on the later of (i) 180 days after the date of exercise of the option; (ii) in the event of any regulatory approvals being required, 10 days after receipt of approval (either unconditionally or on terms acceptable to both parties); and (iii) 10 days after the date on which the Option Price Consideration is agreed or finally determined.
Finbond
As of December 31, 2019, the Company owned 268,820,933 shares in Finbond representing approximately 29.1% of its issued and outstanding ordinary shares. Finbond is listed on the Johannesburg Stock Exchange and its closing price on December 31, 2019, the last trading day of the month, was ZAR 3.50 per share. The market value of the Company's holding in Finbond on December 31, 2019, was ZAR 0.9 billion ($67.0 million translated at exchange rates applicable as of December 31, 2019). On August 2, 2019, the Company, pursuant to its election, received an additional 1,148,901 shares in Finbond as a capitalization share issue in lieu of a dividend.
V2 Limited
In August 2019, the Company made a further equity contribution of $1.3 million to V2 Limited ("V2") and in January 2020 it made its final committed equity contribution of $1.3 million bringing the total equity contribution to $5.0 million. The Company has also committed to provide V2 with a working capital facility of $5.0 million, which is subject to the achievement of certain pre-defined objectives.
7. Equity-accounted investments and other long term assets (continued)
Equity-accounted investments (continued)
| DNI | Bank Frick | Finbond | Other(1) | Total | ||||||||||||||||||
| Investment in equity | ||||||||||||||||||||||
| Balance as of June 30, 2019 | $ | 61,030 | $ | 47,240 | $ | 35,300 | $ | 7,398 | $ | 150,968 | ||||||||||||
| Acquisition of shares | - | - | 274 | 1,250 | 1,524 | |||||||||||||||||
| Stock-based compensation | - | - | 71 | - | 71 | |||||||||||||||||
| Comprehensive income (loss): | 1,108 | 469 | 2,718 | (499 | ) | 3,796 | ||||||||||||||||
| Other comprehensive loss | - | - | 2,227 | - | 2,227 | |||||||||||||||||
| Equity accounted earnings (loss) | 1,108 | 469 | 491 | (499 | ) | 1,569 | ||||||||||||||||
| Share of net income | 3,113 | 755 | 491 | (499 | ) | 3,860 | ||||||||||||||||
| Amortization of acquired intangible assets | (1,292 | ) | (376 | ) | - | - | (1,668 | ) | ||||||||||||||
| Deferred taxes on acquired intangible assets | 361 | 90 | - | - | 451 | |||||||||||||||||
| Impairment | (1,074 | ) | - | - | - | (1,074 | ) | |||||||||||||||
| Dividends received | (1,110 | ) | - | (274 | ) | (338 | ) | (1,722 | ) | |||||||||||||
| Foreign currency adjustment(2) | 137 | 453 | 300 | (48 | ) | 842 | ||||||||||||||||
| Balance as of December 31, 2019 | $ | 61,165 | $ | 48,162 | $ | 38,389 | $ | 7,763 | $ | 155,479 | ||||||||||||
| Investment in loans: | ||||||||||||||||||||||
| Balance as of June 30, 2019 | $ | - | $ | - | $ | - | $ | 148 | $ | 148 | ||||||||||||
| Loans granted | - | - | - | 612 | 612 | |||||||||||||||||
| Allowance for doubtful loans | - | - | - | (620 | ) | (620 | ) | |||||||||||||||
| Foreign currency adjustment(2) | - | - | - | 8 | 8 | |||||||||||||||||
| Balance as of December 31, 2019 | $ | - | $ | - | $ | - | $ | 148 | $ | 148 | ||||||||||||
| Equity | Loans | Total | ||||||||||||||||||||
| Carrying amount as of : | ||||||||||||||||||||||
| June 30, 2019 | $ | 150,968 | $ | 148 | $ | 151,116 | ||||||||||||||||
| December 31, 2019 | $ | 155,479 | $ | 148 | 155,627 | |||||||||||||||||
| (1) Includes primarily Carbon, SmartSwitch Namibia, V2 and Walletdoc; | ||||||||||||||||||||||
| (2) The foreign currency adjustment represents the effects of the fluctuations of the South African rand, Swiss franc, Nigerian naira and Namibian dollar, and the U.S. dollar on the carrying value. | ||||||||||||||||||||||
Other long-term assets
Summarized below is the breakdown of other long-term assets as of December 31, 2019, and June 30, 2019:
| December 31, | June 30, | ||||||||
| 2019 | 2019 | ||||||||
| Total equity investments | $ | 26,993 | $ | 26,993 | |||||
| Investment in 15% of Cell C, at fair value (Note 6) | - | - | |||||||
| Investment in 13% of MobiKwik | 26,993 | 26,993 | |||||||
| Total held to maturity investments | - | - | |||||||
| Investment in 7.625% of Cedar Cellular Investment 1 (RF) (Pty) Ltd 8.625% notes | - | - | |||||||
| Long-term portion of payments to agents in South Korea amortized over the contract period (Note 3) | 6,530 | 9,564 | |||||||
| Policy holder assets under investment contracts (Note 9) | 587 | 619 | |||||||
| Reinsurance assets under insurance contracts (Note 9) | 1,159 | 1,163 | |||||||
| Other long-term assets | 5,875 | 5,850 | |||||||
| Total other long-term assets | $ | 41,144 | $ | 44,189 | |||||
7. Equity-accounted investments and other long term assets (continued)
Other long-term assets (continued)
Summarized below are the components of the Company's equity securities without readily determinable fair value and held to maturity investments as of December 31, 2019:
| Cost basis | Unrealized holding | Unrealized holding | Carrying | |||||||||||||||
| gains | losses | value | ||||||||||||||||
| Equity securities: | ||||||||||||||||||
| Investment in Mobikwik | $ | 26,993 | $ | - | $ | - | $ | 26,993 | ||||||||||
| Held to maturity: | ||||||||||||||||||
| Investment in Cedar Cellular notes | - | - | - | - | ||||||||||||||
| Total | $ | 26,993 | $ | - | $ | - | $ | 26,993 | ||||||||||
Summarized below are the components of the Company's equity securities without readily determinable fair value and held to maturity investments as of June 30, 2019:
| Cost basis | Unrealized holding | Unrealized holding | Carrying | |||||||||||||||
| gains | losses | value | ||||||||||||||||
| Equity securities: | ||||||||||||||||||
| Investment in MobiKwik | $ | 26,993 | $ | - | $ | - | $ | - | ||||||||||
| Held to maturity: | ||||||||||||||||||
| Investment in Cedar Cellular notes | - | - | - | - | ||||||||||||||
| Total | $ | 26,993 | $ | - | $ | - | $ | - | ||||||||||
No interest income from the Cedar Cellular note was recorded during the three and six months ended December 31, 2019. The Company recognized interest income of $1.2 million and $1.4 million, related to the Cedar Cellular notes during the three and six months ended December 31, 2018, respectively. Interest on this investment will only be paid, at Cedar Cellular's election, on maturity in August 2022. The Company's effective interest rate on the Cedar Cellular note was 24.82% as of December 31, 2018.
As of December 31, 2018, the Company did not expect to recover the entire amortized cost basis of the Cedar Cellular notes due to a reduction in the amount of future cash flows expected to be collected from the debt security. The Company did not expect to generate any cash flows from the debt security prior to the maturity date in August 2022, and expected to recover approximately $22.0 million at maturity. As of December 31, 2018, the Company calculated the present value of the expected cash flows to be collected from the debt security by discounting the cash flows at the interest rate implicit in the security upon acquisition (at a rate of 24.82%). The present value of the expected cash flows of $9.0 million was less than the amortized cost basis recorded of $11.8 million (before the impairment) as of December 31, 2018. Accordingly, the Company recorded an other-than-temporary impairment related to a credit loss of $2.7 million during the three and six months ended December 31, 2018.
Contractual maturities of held to maturity investments
Summarized below is the contractual maturity of the Company's held to maturity investment as of December 31, 2019:
| Cost basis | Estimated fair value(1) | ||||||
| Due in one year or less | $ | - | $ | - | |||
| Due in one year through five years (2) | - | - | |||||
| Due in five years through ten years | - | - | |||||
| Due after ten years | - | - |
(1) The estimated fair value of the Cedar Cellular note has been calculated utilizing the Company's portion of the security provided to the Company by Cedar Cellular, namely, Cedar Cellular's investment in Cell C.
(2) The cost basis is zero ($0.0 million).
8. Goodwill and intangible assets, net
Goodwill
Impairment loss
The Company assesses the carrying value of goodwill for impairment annually, or more frequently, whenever events occur and circumstances change indicating potential impairment. The Company performs its annual impairment test as of June 30 of each year. During the three and six months ended December 31, 2018, the Company recognized an impairment loss of approximately $8.2 million, of which approximately $7.0 million related to goodwill allocated to its International Payment Group ("IPG") business within its international transaction processing operating segment and $1.2 million related to goodwill within its South African transaction processing operating segment.
Given the consolidation and restructuring of IPG during the period up to December 31, 2018, several business lines were terminated or meaningfully reduced, resulting in lower than expected revenues, profits and cash flows. IPG's new business initiatives are still in their infancy, and it is expected to generate lower cash flows than initially forecast. In order to determine the amount of goodwill impairment, the estimated fair value of the Company's IPG business assets and liabilities were compared to the carrying value of IPG's assets and liabilities. The Company used a discounted cash flow model in order to determine the fair value of IPG. The allocation of the fair value of IPG required the Company to make a number of assumptions and estimates about the fair value of assets and liabilities where the fair values were not readily available or observable. Based on this analysis, the Company determined that the carrying value of IPG's assets and liabilities exceeded their fair value at the reporting date.
In the event that there is a deterioration in the South African transaction processing and the international transaction processing operating segments, or in any other of the Company's businesses, this may lead to additional impairments in future periods.
Summarized below is the movement in the carrying value of goodwill for the six months ended December 31, 2019:
| Gross value | Accumulated impairment | Carrying value | ||||||||||||
| Balance as of June 30, 2019 | $ | 184,544 | $ | (35,157 | ) | $ | 149,387 | |||||||
| Disposal of FIHRST (Note 2) | (599 | ) | - | (599 | ) | |||||||||
| Foreign currency adjustment (1) | 122 | 28 | 150 | |||||||||||
| Balance as of December 31, 2019 | $ | 184,067 | $ | (35,129 | ) | $ | 148,938 | |||||||
| (1) - The foreign currency adjustment represents the effects of the fluctuations between the South African rand, the Euro and the Korean won, and the U.S. dollar on the carrying value. | ||||||||||||||
Goodwill has been allocated to the Company's reportable segments as follows:
| South African transaction processing | International transaction processing | Financial inclusion and applied technologies | Carrying value | |||||||||||||||
| Balance as of June 30, 2019 | $ | 19,208 | $ | 112,728 | $ | 17,451 | $ | 149,387 | ||||||||||
| Disposal of FIHRST (Note 2) | (599 | ) | - | - | (599 | ) | ||||||||||||
| Foreign currency adjustment (1) | 23 | 83 | 44 | 150 | ||||||||||||||
| Balance as of December 31, 2019 | $ | 18,632 | $ | 112,811 | $ | 17,495 | $ | 148,938 | ||||||||||
| (1) - The foreign currency adjustment represents the effects of the fluctuations between the South African rand, the Euro and the Korean won, and the U.S. dollar on the carrying value. | ||||||||||||||||||
8. Goodwill and intangible assets, net (continued)
Intangible assets
Carrying value and amortization of intangible assets
Summarized below is the carrying value and accumulated amortization of the intangible assets as of December 31, 2019 and June 30, 2019:
| As of December 31, 2019 | As of June 30, 2019 | ||||||||||||||||||||||||
| Gross carrying value | Accumulated amortization | Net carrying value | Gross carrying value | Accumulated amortization | Net carrying value | ||||||||||||||||||||
| Finite-lived intangible assets: | |||||||||||||||||||||||||
| Customer relationships | $ | 95,792 | $ | (89,273 | ) | $ | 6,519 | $ | 96,653 | $ | (86,285 | ) | $ | 10,368 | |||||||||||
| Software and unpatented | |||||||||||||||||||||||||
| technology | 28,883 | (28,598 | ) | 285 | 32,071 | (31,829 | ) | 242 | |||||||||||||||||
| FTS patent | 2,727 | (2,727 | ) | - | 2,721 | (2,721 | ) | - | |||||||||||||||||
| Trademarks | 6,784 | (6,307 | ) | 477 | 6,772 | (6,265 | ) | 507 | |||||||||||||||||
| Total finite-lived intangible assets | 134,186 | (126,905 | ) | 7,281 | 138,217 | (127,100 | ) | 11,117 | |||||||||||||||||
| Infinite-lived intangible assets: | |||||||||||||||||||||||||
| Financial institution licenses | 762 | - | 762 | 772 | - | 772 | |||||||||||||||||||
| Total infinite-lived intangible assets | 762 | - | 762 | 772 | - | 772 | |||||||||||||||||||
| Total intangible assets | $ | 134,948 | $ | (126,905 | ) | $ | 8,043 | $ | 138,989 | $ | (127,100 | ) | $ | 11,889 | |||||||||||
Aggregate amortization expense on the finite-lived intangible assets for the three months ended December 31, 2019 and 2018, was approximately $1.9 million and $6.1 million, respectively. Aggregate amortization expense on the finite-lived intangible assets for the six months ended December 31, 2019 and 2018, was approximately $3.8 million and $12.2 million, respectively.
Carrying value and amortization of intangible assets (continued)
Future estimated annual amortization expense for the next five fiscal years and thereafter, assuming exchange rates that prevailed on December 31, 2019, is presented in the table below. Actual amortization expense in future periods could differ from this estimate as a result of acquisitions, changes in useful lives, exchange rate fluctuations and other relevant factors.
| Fiscal 2020 | $ | 7,919 | |||||||||||||||||||
| Fiscal 2021 | 2,807 | ||||||||||||||||||||
| Fiscal 2022 | 73 | ||||||||||||||||||||
| Fiscal 2023 | 73 | ||||||||||||||||||||
| Fiscal 2024 | 72 | ||||||||||||||||||||
| Thereafter | 145 | ||||||||||||||||||||
| Total future estimated annual amortization expense | $ | 11,089 | |||||||||||||||||||
9. Assets and policyholder liabilities under insurance and investment contracts
Reinsurance assets and policyholder liabilities under insurance contracts
Summarized below is the movement in reinsurance assets and policyholder liabilities under insurance contracts during the six months ended December 31, 2019:
| Reinsurance Assets (1) | Insurance contracts (2) | ||||||||
| Balance as of June 30, 2019 | $ | 1,163 | $ | (1,880 | ) | ||||
| Increase in policy holder benefits under insurance contracts | 220 | (3,232 | ) | ||||||
| Claims and policyholders' benefits under insurance contracts | (227 | ) | 3,201 | ||||||
| Foreign currency adjustment (3) | 3 | (5 | ) | ||||||
| Balance as of December 31, 2019 | $ | 1,159 | $ | (1,916 | ) | ||||
|
|
|
(1) Included in other long-term assets. |
|
|||||||
|
|
|
(2) Included in other long-term liabilities. |
|
|||||||
|
|
|
(3) Represents the effects of the fluctuations between the ZAR and the U.S. dollar. |
|
|||||||
The Company has agreements with reinsurance companies in order to limit its losses from large insurance contracts, however, if the reinsurer is unable to meet its obligations, the Company retains the liability. The value of insurance contract liabilities is based on the best estimate assumptions of future experience plus prescribed margins, as required in the markets in which these products are offered, namely South Africa. The process of deriving the best estimates assumptions plus prescribed margins includes assumptions related to claim reporting delays (based on average industry experience).
Assets and policyholder liabilities under investment contracts
Summarized below is the movement in assets and policyholder liabilities under investment contracts during the six months ended December 31, 2019:
| Assets (1) | Investment contracts (2) | ||||||||
| Balance as of June 30, 2019 | $ | 619 | $ | (619 | ) | ||||
| Increase in policy holder benefits under investment contracts | 2 | (2 | ) | ||||||
| Claims and policyholders' benefits under investment contracts | (36 | ) | 36 | ||||||
| Foreign currency adjustment (3) | 2 | (2 | ) | ||||||
| Balance as of December 31, 2019 | $ | 587 | $ | (587 | ) | ||||
|
|
|
(1) Included in other long-term assets. |
|
|||||||
|
|
|
(2) Included in other long-term liabilities. |
|
|||||||
|
|
|
(3) Represents the effects of the fluctuations between the ZAR and the U.S. dollar. |
|
|||||||
The Company does not offer any investment products with guarantees related to capital or returns.
10. Borrowings
Refer to Note 12 to the Company's audited consolidated financial statements included in its Annual Report on Form 10-K for the year ended June 30, 2019, for additional information regarding its borrowings.
South Africa
The amounts below have been translated at exchange rates applicable as of the dates specified.
July 2017 Facilities, as amended, comprising a short-term facility and long-term borrowings
Short-term facility - Facility E
On September 26, 2018, Net1 SA further revised its amended July 2017 Facilities agreement with RMB to include an overdraft facility ("Facility E") of up to ZAR 1.5 billion ($106.8 million, translated at exchange rates applicable as of December 31, 2019) to fund the Company's ATMs. The available Facility E overdraft facility was subsequently reduced to ZAR 1.2 billion ($85.4 million, translated at exchange rates applicable as of December 31, 2019) in September 2019. Interest on the overdraft facility is payable on the last day of each month and on the final maturity date based on the South African prime rate. The overdraft facility will be reviewed in September 2020. The overdraft facility amount utilized must be repaid in full within one month of utilization and at least 90% of the amount utilized must be repaid with 25 days.
10. Borrowings (continued)
South Africa (continued)
July 2017 Facilities, as amended, comprising a short-term facility and long-term borrowings (continued)
Short-term facility - Facility E (continued)
The overdraft facility is secured by a pledge by Net1 SA of, among other things, cash and certain bank accounts utilized in the Company's ATM funding process, the cession of an insurance policy with Senate Transit Underwriters Managers Proprietary Limited, and any rights and claims Net1 SA has against Grindrod Bank Limited. As at December 31, 2019, the Company had utilized approximately ZAR 1.0 billion ($72.7 million) of this overdraft facility.
This ZAR 1.2 billion overdraft facility may only be used to fund ATMs and therefore the overdraft utilized and converted to cash to fund the Company's ATMs is considered restricted cash. The prime rate on December 31, 2019, was 10.00% and reduced to 9.75% on January 17, 2020, following a reduction in the South African repo rate.
Long-term borrowings facility - Facility F
On September 4, 2019, Net1 SA further amended its amended July 2017 Facilities agreement with RMB and Nedbank to include an overdraft facility ("Facility F") of up to ZAR 300.0 million ($21.4 million, translated at exchange rates applicable as of December 31, 2019) for the sole purpose of funding the acquisition of airtime from Cell C. Net1 SA may not dispose of the airtime acquired from Cell C prior to April 1, 2020, without the prior consent of RMB, Absa Bank Limited and Investec Asset Management Proprietary Limited. Facility F comprises (i) a first Senior Facility F loan of ZAR 220.0 million (ii) a second Senior Facility F loan of ZAR 80.0 million, or such lesser amount as may be agreed by the facility agent. Facility F is required to be repaid in full within nine months following the first utilization of the facility. Net1 SA is required to prepay Facility F subject to customary prepayment terms. Interest on Facility F is based on JIBAR plus a margin of 5.50% per annum and is due in full on repayment of the loan. JIBAR was 6.80% on December 31, 2019. The margin on the Facility F increased by 1% on November 1, 2019, because we had not disposed of our remaining shareholding in DNI and FIHRST by that date. Net1 SA paid a non-refundable structuring fee of ZAR 2.2 million ($0.1 million) to the Lenders in September 2019, and the Company expensed this amount in full during the first quarter of fiscal 2020.
Nedbank facility, comprising short-term facilities
As of December 31, 2019, the aggregate amount of the Company's short-term South African credit facility with Nedbank Limited was ZAR 450.0 million ($32.0 million). The credit facility comprises an overdraft facility of (i) up to ZAR 300.0 million ($21.4 million), which is further split into (a) a ZAR 250.0 million ($17.8 million) overdraft facility which may only be used to fund mobile ATMs and (b) a ZAR 50.0 million ($3.6 million) general banking facility and (ii) indirect and derivative facilities of up to ZAR 150.0 million ($10.7 million), which include letters of guarantees, letters of credit and forward exchange contracts. The ZAR 250.0 million component of the primary amount may only be used to fund ATMs and therefore this component of the primary amount utilized and converted to cash to fund the Company's ATMs is considered restricted cash. The short-term facility provides Nedbank with the right to set off funds held in certain identified Company bank accounts with Nedbank against any amounts owed to Nedbank under the facility. As of December 31, 2019, the Company had total funds of $2.7 million in bank accounts with Nedbank which have been set off against $14.4 million drawn under the Nedbank facility, for a net amount drawn under the facility of $11.7 million. As of December 31, 2019, the interest rate on the overdraft facility was 8.85%, and reduced to 8.60% on January 17, 2020, following a reduction in the South African repo rate.
As of December 31, 2019, the Company had utilized approximately ZAR 164.3 million ($11.7 million) of its ZAR 300.0 million overdraft facility to fund ATMs, and none of its ZAR 50.0 million general banking facility. As of December 31, 2019 and June 30, 2019, the Company had utilized approximately ZAR 93.6 million ($6.7 million) and ZAR 93.6 million ($6.6 million), respectively, of its indirect and derivative facilities of ZAR 150 million to enable the bank to issue guarantees, letters of credit and forward exchange contracts, in order for the Company to honor its obligations to third parties requiring such guarantees (refer to Note 21).
United States, a short-term facility
On September 14, 2018, the Company renewed its $10.0 million overdraft facility from Bank Frick and on February 4, 2019, the Company increased the overdraft facility to $20.0 million. The interest rate on the facilities is 4.50% plus 3-month US dollar LIBOR and interest is payable on a quarterly basis. The 3-month US dollar LIBOR rate was 1.91% on December 31, 2019. The facility has no fixed term, however, it may be terminated by either party with six weeks written notice. The facility is secured by a pledge of the Company's investment in Bank Frick. As of December 31, 2019, the Company had utilized approximately $13.9 million of this facility.
10. Borrowings (continued)
South Korea, a short-term facility
The Company obtained a one year KRW 10.0 billion ($8.7 million) short-term overdraft facility from Hana Bank, a South Korean bank, in January 2019. The interest rate on the facility is 1.98% plus the 3-month CD rate. The CD rate as of December 31, 2019 was 1.53%. The facility expires in January 2021, however can be renewed. The facility is unsecured with no fixed repayment terms. As of December 31, 2019, the Company had not utilized this facility.
Movement in short-term credit facilities
Summarized below are the Company's short-term facilities as of December 31, 2019, and the movement in the Company's short-term facilities from as of June 30, 2019 to as of December 31, 2019:
| South Africa | United States | South Korea | Total | ||||||||||||||||||||
| Amended July 2017 | Nedbank | Bank Frick | Hana | ||||||||||||||||||||
| Short-term facilities available as of | |||||||||||||||||||||||
| December 31, 2019 | $ | 85,419 | $ | 32,032 | $ | 20,000 | $ | 8,654 | $ | 146,105 | |||||||||||||
| Overdraft | - | 3,559 | 20,000 | 8,654 | 32,213 | ||||||||||||||||||
| Overdraft restricted as to use for ATM funding only | 85,419 | 17,796 | - | - | 103,215 | ||||||||||||||||||
| Indirect and derivative facilities | - | 10,677 | - | - | 10,677 | ||||||||||||||||||
| Movement in utilized overdraft facilities: | |||||||||||||||||||||||
| Balance as of June 30, 2019 | 69,566 | 5,880 | 9,544 | - | 84,990 | ||||||||||||||||||
| Utilized | 349,466 | 33,722 | 8,362 | - | 391,550 | ||||||||||||||||||
| Repaid | (346,525 | ) | (28,029 | ) | (4,000 | ) | - | (378,554 | ) | ||||||||||||||
| Foreign currency adjustment(1) | 157 | 123 | - | - | 280 | ||||||||||||||||||
| Balance as of December 31, 2019(2) | 72,664 | 11,696 | 13,906 | - | 98,266 | ||||||||||||||||||
| Restricted as to use for ATM funding only | 72,664 | 11,696 | - | - | 84,360 | ||||||||||||||||||
| No restrictions as to use | - | - | 13,906 | - | 13,906 | ||||||||||||||||||
| Movement in utilized indirect and derivative | |||||||||||||||||||||||
| facilities: | |||||||||||||||||||||||
| Balance as of June 30, 2019 | - | 6,643 | - | - | 6,643 | ||||||||||||||||||
| Foreign currency adjustment(1) | - | 17 | - | - | 17 | ||||||||||||||||||
| Balance as of December 31, 2019 | $ | - | $ | 6,660 | $ | - | $ | - | $ | 6,660 | |||||||||||||
(1) Represents the effects of the fluctuations between the ZAR and the U.S. dollar.
(2) Nedbank balance as of December 31, 2019, of $11.7 million comprises the net of total overdraft facilities withdrawn of $14.4 million offset against funds in bank accounts with Nedbank of $2.7 million.
Movement in long-term borrowings
Summarized below is the movement in the Company's long term borrowing from as of June 30, 2019 and December 31, 2019:
| South Africa | ||||||||
| Amended July 2017 | Total | |||||||
| Balance as of June 30, 2019 | $ | - | $ | - | ||||
| Current portion of long-term borrowings | - | - | ||||||
| Long-term borrowings | - | - | ||||||
| Utilized | 14,798 | 14,798 | ||||||
| Repaid | (11,313 | ) | (11,313 | ) | ||||
| Foreign currency adjustment(1) | 578 | 578 | ||||||
| Balance as of December 31, 2019 | 4,063 | 4,063 | ||||||
| Current portion of long-term borrowings | 4,063 | 4,063 | ||||||
| Long-term borrowings | $ | - | $ | - | ||||
(1) Represents the effects of the fluctuations between the ZAR and the U.S. dollar.
10. Borrowings (continued)
Interest expense incurred under the Company's South African long-term borrowing during the three months ended December 31, 2019 and 2018, was $0.4 million and $0.9 million, respectively. Interest expense incurred during the six months ended December 31, 2019 and 2018, was $0.6 million and $2.1 million, respectively. There were no prepaid facility fee amortization during the three and six months ended December 31, 2019. Prepaid facility fees amortized during the three and six months ended December 31, 2018, was $0.1 million and $0.2 million, respectively.
11. Other payables
Summarized below is the breakdown of other payables as of December 31, 2019 and June 30, 2019:
| December 31, | June 30, | ||||||
| 2019 | 2019 | ||||||
| Accrual of implementation costs to be refunded to SASSA | $ | 35,270 | $ | 34,039 | |||
| Accruals | 15,376 | 10,620 | |||||
| Provisions | 4,390 | 6,074 | |||||
| Other | 8,801 | 10,814 | |||||
| Value-added tax payable | 3,624 | 3,234 | |||||
| Payroll-related payables | 1,131 | 1,113 | |||||
| Participating merchants settlement obligation | 542 | 555 | |||||
| $ | 69,134 | $ | 66,449 | ||||
Refer to Note 13 to the Company's audited consolidated financial statements included in its Annual Report on Form 10-K for the year ended June 30, 2019, for additional information regarding Accrual of implementation costs to be refunded to SASSA. As of December 31, 2019, this accrual of $35.3 million (ZAR 495.5 million, translated at exchange rates applicable as of December 31, 2019, comprised a revenue refund of $19.8 million (ZAR 277.6 million), accrued interest of $12.6 million (ZAR 177.6 million), unclaimed indirect taxes of $2.8 million (ZAR 38.9 million) and estimated costs of $0.1 million (ZAR 1.4 million)). As of June 30, 2019, this accrual of $34.0 million (ZAR 479.4 million, translated at exchange rates applicable as of June 30, 2019, comprised a revenue refund of $19.7 million (ZAR 277.6 million), accrued interest of $11.4 million (ZAR 161.0 million), unclaimed indirect taxes of $2.8 million (ZAR 39.4 million) and estimated costs of $0.1 million (ZAR 1.4 million)).
Other includes transactions-switching funds payable, deferred income, client deposits and other payables.
12. Capital structure
The following table presents a reconciliation between the number of shares, net of treasury, presented in the unaudited condensed consolidated statement of changes in equity during the six months ended December 31, 2019 and 2018, respectively, and the number of shares, net of treasury, excluding non-vested equity shares that have not vested during the six months ended December 31, 2019 and 2018, respectively:
| December 31, | December 31, | ||||||
| 2019 | 2018 | ||||||
| Number of shares, net of treasury: | |||||||
| Statement of changes in equity | 56,568,425 | 56,833,925 | |||||
| Non-vested equity shares that have not vested as of end of period | 583,908 | 860,817 | |||||
| Number of shares, net of treasury, excluding non-vested equity shares that have not vested | 55,984,517 | 55,973,108 | |||||
13. Accumulated other comprehensive loss
The table below presents the change in accumulated other comprehensive (loss) income per component during the three months ended December 31, 2019:
| Three months ended | |||||||||
| December 31, 2019 | |||||||||
| Accumulated foreign currency translation reserve | Total | ||||||||
| Balance as of October 1, 2019 | $ | (214,640 | ) | $ | (214,640 | ) | |||
| Release of foreign currency translation reserve related to disposal of FIHRST (Note 2) | 1,578 | 1,578 | |||||||
| Movement in foreign currency translation reserve related to equity-accounted investment | (491 | ) | (491 | ) | |||||
| Movement in foreign currency translation reserve | 19,114 | 19,114 | |||||||
| Balance as of December 31, 2019 | $ | (194,439 | ) | $ | (194,439 | ) | |||
The table below presents the change in accumulated other comprehensive (loss) income per component during the three months ended December 31, 2018:
| Three months ended | |||||||||
| December 31, 2018 | |||||||||
| Accumulated foreign currency translation reserve | Total | ||||||||
| Balance as of October 1, 2018 | $ | (189,630 | ) | $ | (189,630 | ) | |||
| Movement in foreign currency translation reserve | (8,744 | ) | (8,744 | ) | |||||
| Balance as of December 31, 2018 | $ | (198,374 | ) | $ | (198,374 | ) | |||
The table below presents the change in accumulated other comprehensive (loss) income per component during the six months ended December 31, 2019:
| Six months ended | |||||||||
| December 31, 2019 | |||||||||
| Accumulated foreign currency translation reserve | Total | ||||||||
| Balance as of July 1, 2019 | $ | (199,273 | ) | $ | (199,273 | ) | |||
| Release of foreign currency translation reserve related to disposal of FIHRST (Note 2) | 1,578 | 1,578 | |||||||
| Movement in foreign currency translation reserve related to equity-accounted investment | 2,227 | 2,227 | |||||||
| Movement in foreign currency translation reserve | 1,029 | 1,029 | |||||||
| Balance as of December 31, 2019 | $ | (194,439 | ) | $ | (194,439 | ) | |||
13. Accumulated other comprehensive loss (continued)
The table below presents the change in accumulated other comprehensive (loss) income per component during the six months ended December 31, 2018:
| Six months ended | |||||||||
| December 31, 2018 | |||||||||
| Accumulated foreign currency translation reserve | Total | ||||||||
| Balance as of July 1, 2018 | $ | (184,538 | ) | $ | (184,538 | ) | |||
| Movement in foreign currency translation reserve related to equity-accounted investment | 5,430 | 5,430 | |||||||
| Movement in foreign currency translation reserve | (19,266 | ) | (19,266 | ) | |||||
| Balance as of December 31, 2018 | $ | (198,374 | ) | $ | (198,374 | ) | |||
During the three and six months ended December 31, 2019, the Company reclassified $1.6 million from accumulated other comprehensive loss (accumulated foreign currency translation reserve) to net loss related to the FIHRST disposal (refer to Note 2). There were no reclassifications from accumulated other comprehensive loss to net income during the three and six months ended December 31, 2018.
14. Stock-based compensation
Stock option and restricted stock activity
Options
The following table summarizes stock option activity for the six months ended December 31, 2019 and 2018:
| Number of shares | Weighted average exercise price ($) |
Weighted average remaining contractual term (in years) |
Aggregate intrinsic value ($'000) |
Weighted average grant date fair value ($) |
|||||||||||||
| Outstanding - June 30, 2019 | 864,579 | 7.81 | 7.05 | - | 2.62 | ||||||||||||
| Granted - September 2019 | 561,000 | 3.07 | 10.00 | 676 | 1.20 | ||||||||||||
| Outstanding - December 31, 2019 | 1,425,579 | 5.94 | 7.81 | 365 | 2.07 | ||||||||||||
| Outstanding - June 30, 2018 | 809,274 | 13.99 | 2.67 | 370 | 4.20 | ||||||||||||
| Granted - September 2018 | 600,000 | 6.20 | 10.00 | 1,212 | 2.02 | ||||||||||||
| Forfeited | (200,000 | ) | 24.46 | - | - | 7.17 | |||||||||||
| Outstanding - December 31, 2018 | 1,209,274 | 8.41 | 6.15 | 72 | 2.62 | ||||||||||||
During the three and six months ended December 31, 2019, 561,000 stock options were awarded to employees. No stock options were awarded during the three months ended December 31, 2018. During the six months ended December 31, 2018, 600,000 stock options were awarded to executive officers and employees. No stock options were forfeited during the six months ended December 31, 2019 or during the three months ended December 31, 2018. During the six months ended December 31, 2018, executive officers forfeited 200,000 stock options granted in August 2008, with a strike price of $24.46 per share, as these stock options expired unexercised.
The fair value of each option is estimated on the date of grant using the Cox Ross Rubinstein binomial model that uses the assumptions noted in the following table. The estimated expected volatility is calculated based on the Company's 750-day volatility. The estimated expected life of the option was determined based on historical behavior of employees who were granted options with similar terms.
14. Stock-based compensation (continued)
Stock option and restricted stock activity (continued)
Options (continued)
The table below presents the range of assumptions used to value options granted during the six months ended December 31, 2019 and 2018:
| Six months ended | ||||||
| December 31, | ||||||
| 2019 | 2018 | |||||
| Expected volatility | 57% | 44% | ||||
| Expected dividends | 0% | 0% | ||||
| Expected life (in years) | 3 | 3 | ||||
| Risk-free rate | 1.57% | 2.75% | ||||
The following table presents stock options vested and expected to vest as of December 31, 2019 :
| Number of shares |
Weighted average exercise price ($) |
Weighted average remaining contractual term (in years) |
Aggregate intrinsic value ($'000) |
||||||||
| Vested and expecting to vest - December 31, 2019 | 1,425,579 | 5.94 | 7.81 | 365 |
These options have an exercise price range of $3.07 to $11.23.
The following table presents stock options that are exercisable as of December 31, 2019:
| Number of shares |
Weighted average exercise price ($) |
Weighted average remaining contractual term (in years) |
||||||
| Exercisable - December 31, 2019 | 523,914 | 8.86 | 5.52 |
No stock options became exercisable during the three months ended December 31, 2019 or during the three and six months ended December 31, 2018, respectively. However, during the six months ended December 31, 2019, 170,335 stock options became exercisable. The Company issues new shares to satisfy stock option exercises.
Restricted stock
The following table summarizes restricted stock activity for the six months ended December 31, 2019 and 2018:
| Number of shares of restricted stock | Weighted average grant date fair value ($'000) |
||||||||
| Non-vested - June 30, 2019 | 583,908 | 3,410 | |||||||
| Non-vested - December 31, 2019 | 583,908 | 3,410 | |||||||
| Non-vested - June 30, 2018 | 765,411 | 6,162 | |||||||
| Granted - September 2018 | 148,000 | 114 | |||||||
| Vested - August 2018 | (52,594 | ) | 459 | ||||||
| Non-vested - December 31, 2018 | 860,817 | 5,785 | |||||||
The September 2018 grants comprise 148,000 shares of restricted stock awarded to executive officers that are subject to market and time-based vesting. During the three months ended September 30, 2018, 52,594 shares of restricted stock granted to non-employee directors vested.
14. Stock-based compensation (continued)
Stock option and restricted stock activity (continued)
Restricted stock (continued)
Market Conditions - Restricted Stock Granted in September 2018
The 148,000 shares of restricted stock awarded to executive officers in September 2018 are subject to time-based and performance-based (a market condition) vesting conditions and vest in full only on the date, if any, that the following conditions are satisfied: (1) the price of the Company's common stock must equal or exceed certain agreed VWAP levels (as described below) during a measurement period commencing on the date that it files its Annual Report on Form 10-K for the fiscal year ended 2021 and ending on December 31, 2021 and (2) the recipient is employed by the Company on a full-time basis when the condition in (1) is met. If either of these conditions is not satisfied, then none of the shares of restricted stock will vest and they will be forfeited. The $23.00 price target represents an approximate 55% increase, compounded annually, in the price of the Company's common stock on Nasdaq over the $6.20 closing price on September 7, 2018. The VWAP levels and vesting percentages related to such levels are as follows:
- Below $15.00 (threshold)-0%
- At or above $15.00 and below $19.00-33%
- At or above $19.00 and below $23.00-66%
- At or above $23.00-100%
., The fair value of these shares of restricted stock was calculated using a Monte Carlo simulation of a stochastic volatility process. The choice of a stochastic volatility process as an extension to the standard Black Scholes process was driven by both observations of larger than expected moves in the daily time series for the Company's VWAP price, but also the observation of the strike structure of volatility (i.e. skew and smile) for out-of-the money calls and out-of-the money puts versus at-the-money options for both the Company's stock and NASDAQ futures.
In scenarios where the shares do not vest, the final vested value at maturity is zero. In scenarios where vesting occurs, the final vested value on maturity is the share price on vesting date. In its calculation of the fair value of the restricted stock, the Company used an average volatility of 37.4% for the VWAP price, a discounting based on USD overnight indexed swap rates for the grant date, and no future dividends. The average volatility was extracted from the time series for VWAP prices as the standard deviation of log prices for the three years preceding the grant date. The mean reversion of volatility and the volatility of volatility parameters of the stochastic volatility process were extracted by regressing log differences against log levels of volatility from the time series for at-the-money options 30 day volatility quotes, which were available from January 2, 2018 onwards.
Market Conditions - Restricted Stock Granted in August 2017
The 210,000 shares of restricted stock awarded to executive officers in August 2017 are subject to time-based and performance-based (a market condition) vesting conditions and vest in full only on the date, if any, that the following conditions are satisfied: (1) the price of the Company's common stock must equal or exceed certain agreed VWAP levels (as described below) during a measurement period commencing on the date that it files its Annual Report on Form 10-K for the fiscal year ended 2020 and ending on December 31, 2020 and (2) the recipient is employed by the Company on a full-time basis when the condition in (1) is met. If either of these conditions is not satisfied, then none of the shares of restricted stock will vest and they will be forfeited. The $23.00 price target represents an approximate 35% increase, compounded annually, in the price of the Company's common stock on Nasdaq over the $9.38 closing price on August 23, 2017. The VWAP levels and vesting percentages related to such levels are as follows:
- Below $15.00 (threshold)-0%
- At or above $15.00 and below $19.00-33%
- At or above $19.00 and below $23.00-66%
- At or above $23.00-100%
These 210,000 shares of restricted stock are effectively forward starting knock-in barrier options with multi-strike prices of zero. The fair value of these shares of restricted stock was calculated utilizing a Monte Carlo simulation model which was developed for the purpose of the valuation of these shares. For each simulated share price path, the market share price condition was evaluated to determine whether or not the shares would vest under that simulation. A standard Geometric Brownian motion process was used in the forecasting of the share price instead of a "jump diffusion" model, as the share price volatility was more stable compared to the highly volatile regime of previous years. Therefore, the simulated share price paths capture the idiosyncrasies of the observed Company share price movements.
14. Stock-based compensation (continued) (continued)
Stock option and restricted stock activity (continued)
Restricted stock (continued)
Market Conditions - Restricted Stock Granted in August 2017 (continued)
In scenarios where the shares do not vest, the final vested value at maturity is zero. In scenarios where vesting occurs, the final vested value on maturity is the share price on vesting date. The value of the grant is the average of the discounted vested values. The Company used an expected volatility of 44.0%, an expected life of approximately three years, a risk-free rate ranging between 1.275% to 1.657% and no future dividends in its calculation of the fair value of the restricted stock. The estimated expected volatility was calculated based on the Company's 30 day VWAP share price using the exponentially weighted moving average of returns.
Stock-based compensation charge and unrecognized compensation cost
The Company recorded a stock-based compensation charge, net during the three months ended December 31, 2019 and 2018 of $0.4 million and $0.6 million respectively, which comprised:
| Allocated to cost of goods sold, |
Allocated to | |||||||||||||
| IT processing, | selling, general | |||||||||||||
| Total | servicing and | and | ||||||||||||
| charge | support | administration | ||||||||||||
| Three months ended December 31, 2019 | ||||||||||||||
| Stock-based compensation charge | $ | 436 | $ | - | $ | 436 | ||||||||
| Total - three months ended December 31, 2019 | $ | 436 | $ | - | $ | 436 | ||||||||
| Three months ended December 31, 2018 | ||||||||||||||
| Stock-based compensation charge | $ | 598 | $ | - | $ | 598 | ||||||||
| Total - three months ended December 31, 2018 | $ | 598 | $ | - | $ | 598 | ||||||||
The Company recorded a stock-based compensation charge, net during the six months ended December 31, 2019 and 2018 of $0.8 million and $1.2 million respectively, which comprised:
| Allocated to cost of goods sold, |
Allocated to | |||||||||||||
| IT processing, | selling, general | |||||||||||||
| Total | servicing and | and | ||||||||||||
| charge | support | administration | ||||||||||||
| Six months ended December 31, 2019 | ||||||||||||||
| Stock-based compensation charge | $ | 823 | $ | - | $ | 823 | ||||||||
| Total - Six months ended December 31, 2019 | $ | 823 | $ | - | $ | 823 | ||||||||
| Six months ended December 31, 2018 | ||||||||||||||
| Stock-based compensation charge | $ | 1,185 | $ | - | $ | 1,185 | ||||||||
| Total - Six months ended December 31, 2018 | $ | 1,185 | $ | - | $ | 1,185 | ||||||||
The stock-based compensation charges have been allocated to selling, general and administration based on the allocation of the cash compensation paid to the relevant employees.
As of December 31, 2019, the total unrecognized compensation cost related to stock options was approximately $1.3 million, which the Company expects to recognize over approximately three years. As of December 31, 2019, the total unrecognized compensation cost related to restricted stock awards was approximately $1.1 million, which the Company expects to recognize over approximately two years.
As of December 31, 2019 and June 30, 2019, respectively, the Company recorded a deferred tax asset of approximately $0.3 million and $0.2 million, related to the stock-based compensation charge recognized related to employees of Net1. As of December 31, 2019, and June 30, 2019, respectively, the Company recorded a valuation allowance of approximately $0.3 million and $0.2 million, related to the deferred tax asset because it does not believe that the stock-based compensation deduction would be utilized as it does not anticipate generating sufficient taxable income in the United States. The Company deducts the difference between the market value on date of exercise by the option recipient and the exercise price from income subject to taxation in the United States.
15. (Loss) Earnings per share
The Company has issued redeemable common stock which is redeemable at an amount other than fair value. Redemption of a class of common stock at other than fair value increases or decreases the carrying amount of the redeemable common stock and is reflected in basic earnings per share using the two-class method. There were no redemptions of common stock, or adjustments to the carrying value of the redeemable common stock during the three and six months ended December 31, 2019 or 2018. Accordingly, the two-class method presented below does not include the impact of any redemption. The Company's redeemable common stock is described in Note 15 to the Company's audited consolidated financial statements included in its Annual Report on Form 10-K for the year ended June 30, 2019.
Basic (loss) earnings per share includes shares of restricted stock that meet the definition of a participating security because these shares are eligible to receive non-forfeitable dividend equivalents at the same rate as common stock. Basic (loss) earnings per share has been calculated using the two-class method and basic (loss) earnings per share for the three and six months ended December 31, 2019 and 2018, reflects only undistributed earnings. The computation below of basic (loss) earnings per share excludes the net loss attributable to shares of unvested restricted stock (participating non-vested restricted stock) from the numerator and excludes the dilutive impact of these unvested shares of restricted stock from the denominator.
Diluted (loss) earnings per share has been calculated to give effect to the number of shares of additional common stock that would have been outstanding if the potential dilutive instruments had been issued in each period. Stock options are included in the calculation of diluted (loss) earnings per share utilizing the treasury stock method and are not considered to be participating securities, as the stock options do not contain non-forfeitable dividend rights.
The calculation of diluted (loss) earnings per share includes the dilutive effect of a portion of the restricted stock granted to employees in August 2016, August 2017, March 2018, May 2018 and September 2018 as these shares of restricted stock are considered contingently returnable shares for the purposes of the diluted (loss) earnings per share calculation and the vesting conditions in respect of a portion of the restricted stock had been satisfied. The vesting conditions for awards made in September 2018 and August 2017 are discussed in Note 14 above and the vesting conditions for all other awards are discussed in Note 17 to the Company's audited consolidated financial statements included in its Annual Report on Form 10-K for the year ended June 30, 2019.
15. (Loss) Earnings per share (continued)
The following table presents net loss attributable to Net1 (loss from continuing operations) and the share data used in the basic and diluted (loss) earnings per share computations using the two-class method:
| Three months ended | Six months ended | |||||||||||||||||
| December 31, | December, 31 | |||||||||||||||||
| 2019 | 2018 | 2019 | 2018 | |||||||||||||||
| (in thousands except | (in thousands except | |||||||||||||||||
| percent and | percent and | |||||||||||||||||
| per share data) | per share data) | |||||||||||||||||
| Numerator: | ||||||||||||||||||
| Net loss attributable to Net1 | $ | (205 | ) | $ | (63,941 | ) | $ | (4,597 | ) | $ | (69,140 | ) | ||||||
| Undistributed (loss) earnings | (205 | ) | (63,941 | ) | (4,597 | ) | (69,140 | ) | ||||||||||
| Continuing | (205 | ) | (65,469 | ) | (4,597 | ) | (72,614 | ) | ||||||||||
| Discontinued | $ | - | $ | 1,528 | $ | - | $ | 3,474 | ||||||||||
| Percent allocated to common shareholders | ||||||||||||||||||
| (Calculation 1) | 99% | 98% | 99% | 99% | ||||||||||||||
| Numerator for (loss) earnings per share: basic and diluted | (203 | ) | (62,972 | ) | (4,550 | ) | (68,146 | ) | ||||||||||
| Continuing | (203 | ) | (64,477 | ) | (4,550 | ) | (71,570 | ) | ||||||||||
| Discontinued | - | 1,505 | - | 3,424 | ||||||||||||||
| Denominator | ||||||||||||||||||
| Denominator for basic (loss) earnings per share: | ||||||||||||||||||
| weighted-average common shares outstanding | 55,985 | 55,973 | 55,985 | 55,962 | ||||||||||||||
| Stock options | - | 21 | - | 36 | ||||||||||||||
| Denominator for diluted (loss) earnings per share: adjusted weighted average common shares outstanding and assuming conversion | 55,985 | 55,994 | 55,985 | 55,998 | ||||||||||||||
| (Loss) Earnings per share: | ||||||||||||||||||
| Basic | $ | (0.00 | ) | $ | (1.13 | ) | $ | (0.08 | ) | $ | (1.22 | ) | ||||||
| Continuing | $ | (0.00 | ) | $ | (1.16 | ) | $ | (0.08 | ) | $ | (1.28 | ) | ||||||
| Discontinued | $ | - | $ | 0.03 | $ | - | $ | 0.06 | ||||||||||
| Diluted | $ | (0.00 | ) | $ | (1.12 | ) | $ | (0.08 | ) | $ | (1.22 | ) | ||||||
| Continuing | $ | (0.00 | ) | $ | (1.15 | ) | $ | (0.08 | ) | $ | (1.28 | ) | ||||||
| Discontinued | $ | - | $ | 0.03 | $ | - | $ | 0.06 | ||||||||||
| (Calculation 1) | ||||||||||||||||||
| Basic weighted-average common shares outstanding (A) | 55,985 | 55,973 | 55,985 | 55,962 | ||||||||||||||
| Basic weighted-average common shares outstanding and unvested restricted shares expected to vest (B) | 56,568 | 56,834 | 56,568 | 56,778 | ||||||||||||||
| Percent allocated to common shareholders | ||||||||||||||||||
| (A) / (B) | 99% | 98% | 99% | 99% | ||||||||||||||
Options to purchase 1,425,579 shares of the Company's common stock at prices ranging from $3.07 to $11.23 per share were outstanding during the three and six months ended December 31, 2019, respectively, but were not included in the computation of diluted (loss) earnings per share because the options' exercise price was greater than the average market price of the Company's common stock. Options to purchase 1,166,554 and 503,698 shares of the Company's common stock at prices ranging from $6.20 to $13.16 per share and $8.75 to $13.16 per share were outstanding during the three and six months ended December 31, 2018, respectively, but were not included in the computation of diluted (loss) earnings per share because the options' exercise price was greater than the average market price of the Company's common stock. The options, which expire at various dates through October 14, 2029, were still outstanding as of December 31, 2019.
16. Supplemental cash flow information
The following table presents supplemental cash flow disclosures for the three and six months ended December 31, 2019, and 2018:
| Three months ended | Six months ended | |||||||||||
| December 31, | December 31, | |||||||||||
| 2019 | 2018 | 2019 | 2018 | |||||||||
| Cash received from interest | $ | 1,042 | $ | 1,285 | $ | 1,779 | $ | 3,362 | ||||
| Cash paid for interest | $ | 2,293 | $ | 2,588 | $ | 3,107 | $ | 5,654 | ||||
| Cash paid for income taxes | $ | 2,004 | $ | 8,779 | $ | 3,887 | $ | 10,122 | ||||
Leases
The following table presents supplemental cash flow disclosure related to leases for the three and six months ended December 31, 2019:
| December 31, 2019 | ||||||
| Three months ended |
Six months ended |
|||||
| Cash paid for amounts included in the measurement of lease liabilities | ||||||
| Operating cash flows from operating leases | $ | 1,108 | $ | 2,028 | ||
| Right-of-use assets obtained in exchange of lease obligations | ||||||
| Operating leases | $ | 2,260 | $ | 2,490 | ||
17. Revenue recognition
Disaggregation of revenue
The following table presents our revenue disaggregated by major revenue streams, including a reconciliation to operating segments for the three months ended December 31, 2019:
| South Africa | Korea | Rest of the world | Total | |||||||||||
| South African transaction processing | ||||||||||||||
| Processing fees | $ | 17,035 | $ | - | $ | - | $ | 17,035 | ||||||
| Other | 1,136 | - | - | 1,136 | ||||||||||
| Subtotal | 18,171 | - | - | 18,171 | ||||||||||
| International transaction processing | ||||||||||||||
| Processing fees | - | 32,000 | 851 | 32,851 | ||||||||||
| Other | - | 1,512 | - | 1,512 | ||||||||||
| Subtotal | - | 33,512 | 851 | 34,363 | ||||||||||
| Financial inclusion and applied technologies | ||||||||||||||
| Telecom products and services | 6,639 | - | - | 6,639 | ||||||||||
| Account holder fees | 3,103 | - | - | 3,103 | ||||||||||
| Lending revenue | 5,384 | - | - | 5,384 | ||||||||||
| Technology products | 5,042 | - | - | 5,042 | ||||||||||
| Insurance revenue | 1,372 | - | - | 1,372 | ||||||||||
| Other | 6 | - | - | 6 | ||||||||||
| Subtotal | 21,546 | - | - | 21,546 | ||||||||||
| $ | 39,717 | $ | 33,512 | $ | 851 | $ | 74,080 | |||||||
17. Revenue recognition (continued)
Disaggregation of revenue
The following table presents our revenue disaggregated by major revenue streams, including a reconciliation to operating segments for the three months ended December 31, 2018:
| South Africa | Korea | Rest of the world | Total | |||||||||||
| South African transaction processing | ||||||||||||||
| Processing fees | $ | 19,031 | $ | - | $ | - | $ | 19,031 | ||||||
| Other | 1,772 | - | - | 1,772 | ||||||||||
| Subtotal | 20,803 | - | - | 20,803 | ||||||||||
| International transaction processing | ||||||||||||||
| Processing fees | - | 34,382 | 2,543 | 36,925 | ||||||||||
| Other | - | 1,018 | 181 | 1,199 | ||||||||||
| Subtotal | - | 35,400 | 2,724 | 38,124 | ||||||||||
| Financial inclusion and applied technologies | ||||||||||||||
| Telecom products and services | 3,027 | - | - | 3,027 | ||||||||||
| Account holder fees | 3,140 | - | - | 3,140 | ||||||||||
| Lending revenue | 5,969 | - | - | 5,969 | ||||||||||
| Technology products | 4,913 | - | - | 4,913 | ||||||||||
| Insurance revenue | 1,306 | - | - | 1,306 | ||||||||||
| Other | 4,160 | - | - | 4,160 | ||||||||||
| Subtotal | 18,515 | - | - | 18,515 | ||||||||||
| $ | 39,318 | $ | 35,400 | $ | 2,724 | $ | 77,442 | |||||||
The following table presents our revenue disaggregated by major revenue streams, including a reconciliation to operating segments for the six months ended December 31, 2019:
| South Africa | Korea | Rest of the world | Total | |||||||||||
| South African transaction processing | ||||||||||||||
| Processing fees | $ | 33,001 | $ | - | $ | - | $ | 33,001 | ||||||
| Other | 2,369 | - | - | 2,369 | ||||||||||
| Subtotal | 35,370 | - | - | 35,370 | ||||||||||
| International transaction processing | ||||||||||||||
| Processing fees | - | 63,197 | 2,050 | 65,247 | ||||||||||
| Other | - | 3,133 | - | 3,133 | ||||||||||
| Subtotal | - | 66,330 | 2,050 | 68,380 | ||||||||||
| Financial services | ||||||||||||||
| Telecom products and services | 15,933 | - | - | 15,933 | ||||||||||
| Account holder fees | 8,363 | - | - | 8,363 | ||||||||||
| Lending revenue | 10,538 | - | - | 10,538 | ||||||||||
| Technology products | 12,176 | - | - | 12,176 | ||||||||||
| Insurance revenue | 2,758 | - | - | 2,758 | ||||||||||
| Other | 1,318 | - | - | 1,318 | ||||||||||
| Subtotal | 51,086 | - | - | 51,086 | ||||||||||
| $ | 86,456 | $ | 66,330 | $ | 2,050 | $ | 154,836 | |||||||
17. Revenue recognition (continued)
Disaggregation of revenue (continued)
The following table presents our revenue disaggregated by major revenue streams, including a reconciliation to operating segments for the six months ended December 31, 2018:
| South Africa | Korea | Rest of the world | Total | |||||||||||
| South African transaction processing | ||||||||||||||
| Processing fees | $ | 49,260 | $ | - | $ | - | $ | 49,260 | ||||||
| Welfare benefit distributions | 3,086 | - | - | 3,086 | ||||||||||
| Other | 2,920 | - | - | 2,920 | ||||||||||
| Subtotal | 55,266 | - | - | 55,266 | ||||||||||
| International transaction processing | ||||||||||||||
| Processing fees | - | 68,971 | 5,198 | 74,169 | ||||||||||
| Other | - | 2,980 | 362 | 3,342 | ||||||||||
| Subtotal | - | 71,951 | 5,560 | 77,511 | ||||||||||
| Financial services | ||||||||||||||
| Telecom products and services | 7,943 | - | - | 7,943 | ||||||||||
| Account holder fees | 13,745 | - | - | 13,745 | ||||||||||
| Lending revenue | 15,946 | - | - | 15,946 | ||||||||||
| Technology products | 9,941 | - | - | 9,941 | ||||||||||
| Insurance revenue | 3,821 | - | - | 3,821 | ||||||||||
| Other | 366 | - | - | 366 | ||||||||||
| Subtotal | 51,762 | - | - | 51,762 | ||||||||||
| $ | 107,028 | $ | 71,951 | $ | 5,560 | $ | 184,539 | |||||||
18. Leases
The Company elected to adopt the new lease guidance utilizing the modified retrospective approach therefore prior periods were not adjusted. The Company was not required to record a cumulative-effect adjustment to opening retained earnings as of July 1, 2019. The Company applied the package of three practical expedients available, which included the following (i) an entity need not reassess expired or existing contracts which are or contain leases (ii) an entity need not reassess the lease classification for any expired or existing leases, and (iii) an entity need not reassess initial direct costs for any existing leases. The Company also elected to not recognize right-of-use assets and lease liabilities for leases with a term of less than twelve months and to account for all components in a lease arrangement as a single combined lease component.
The Company has entered into leasing arrangements classified as operating leases under accounting guidance. These leasing arrangements relate primarily to the lease of our corporate head office, administration offices and branch locations through which the Company operates its financial services business in South Africa. The Company's operating leases have a remaining lease term of between one to five years. We also operate parts of our financial services business from locations which we lease for a period of less than one year. The Company's operating lease expense during the three and six months ended December 31, 2019, was $1.1 million and $2.0 million, respectively. The Company does not have any significant leases that have not commenced as of December 31, 2019.
18. Leases (continued)
The following table presents supplemental balance sheet disclosure related to our right-of-use assets and our operating lease liabilities as of December 31, 2019 and July 1, 2019, the date of adoption of the new lease guidance (refer to Note 1):
| December 31, | July 1, | |||||||
| 2019 | 2019 | |||||||
| Operating lease right-of-use | $ | 7,838 | $ | 6,739 | ||||
| Weighted average remaining lease term (years) | 3.60 | 2.51 | ||||||
| Weighted average discount rate | 10% | 10% | ||||||
| Maturities of operating lease liabilities | ||||||||
| 2020 (for December 31, 2019 excluding six months to December 31, 2019) | $ | 2,334 | $ | 3,608 | ||||
| 2021 | 3,281 | 2,395 | ||||||
| 2022 | 1,850 | 1,269 | ||||||
| 2023 | 1,011 | 454 | ||||||
| 2024 | 598 | - | ||||||
| Thereafter | 204 | - | ||||||
| Total undiscounted operating lease liabilities | 9,278 | 7,726 | ||||||
| Less imputed interest | 1,245 | 842 | ||||||
| Total operating lease liabilities, included in | 8,033 | 6,884 | ||||||
| Operating lease right-of-use lease liability - current | 3,534 | 5,098 | ||||||
| Right-of-use operating lease liability - long-term | $ | 4,499 | $ | 1,786 | ||||
19. Operating segments
The Company discloses segment information as reflected in the management information systems reports that its chief operating decision maker uses in making decisions and to report certain entity-wide disclosures about products and services, major customers, and the countries in which the entity holds material assets or reports material revenues. A description of the Company's operating segments is contained in Note 21 to the Company's audited consolidated financial statements included in its Annual Report on Form 10-K for the year ended June 30, 2019. As discussed in Note 22, the Company has presented DNI as a discontinued operation.
The reconciliation of the reportable segment's revenue to revenue from external customers for the three months ended December 31, 2019 and 2018, is as follows:
| Revenue | ||||||||||
| Reportable Segment | Inter-segment | From external customers | ||||||||
| South African transaction processing | $ | 20,350 | $ | 2,179 | $ | 18,171 | ||||
| International transaction processing | 34,363 | - | 34,363 | |||||||
| Financial services | 21,986 | 440 | 21,546 | |||||||
| Total for the three months ended December 31, 2019 | $ | 76,699 | $ | 2,619 | $ | 74,080 | ||||
| South African transaction processing | $ | 21,970 | $ | 1,167 | $ | 20,803 | ||||
| International transaction processing | 38,124 | - | 38,124 | |||||||
| Financial services | 38,755 | 532 | 38,223 | |||||||
| Continuing | 19,047 | 532 | 18,515 | |||||||
| Discontinued | 19,708 | - | 19,708 | |||||||
| Total for the three months ended December 31, 2018 | 98,849 | 1,699 | 97,150 | |||||||
| Continuing | 79,141 | 1,699 | 77,442 | |||||||
| Discontinued | $ | 19,708 | $ | - | $ | 19,708 | ||||
19. Operating segments
The reconciliation of the reportable segment's revenue to revenue from external customers for the six months ended December 31, 2019 and 2018, is as follows:
| Revenue | ||||||||||
| Reportable Segment | Inter-segment | From external customers | ||||||||
| South African transaction processing | $ | 39,749 | $ | 4,379 | $ | 35,370 | ||||
| International transaction processing | 68,380 | - | 68,380 | |||||||
| Financial services | 52,131 | 1,045 | 51,086 | |||||||
| Total for the six months ended December 31, 2019 | $ | 160,260 | $ | 5,424 | $ | 154,836 | ||||
| South African transaction processing | $ | 59,719 | $ | 4,453 | $ | 55,266 | ||||
| International transaction processing | 77,511 | - | 77,511 | |||||||
| Financial services | 91,961 | 1,704 | 90,257 | |||||||
| Continuing | 53,466 | 1,704 | 51,762 | |||||||
| Discontinued | 38,495 | - | 38,495 | |||||||
| Total for the six months ended December 31, 2018 | 229,191 | 6,157 | 223,034 | |||||||
| Continuing | 190,696 | 6,157 | 184,539 | |||||||
| Discontinued | $ | 38,495 | $ | - | $ | 38,495 | ||||
The Company does not allocate interest income, interest expense or income tax expense to its reportable segments. The Company evaluates segment performance based on segment operating income before acquisition-related intangible asset amortization which represents operating income before acquisition-related intangible asset amortization and allocation of expenses allocated to Corporate/Eliminations, all under GAAP.
The reconciliation of the reportable segments measures of profit or loss to income before income taxes for the three and six months ended December 31, 2019 and 2018, is as follows:
| Three months ended | Six months ended | |||||||||||||
| December 31, | December 31, | |||||||||||||
| 2019 | 2018 | 2019 | 2018 | |||||||||||
| Reportable segments measure of profit or loss | $ | (1,048 | ) | $ | (34,411 | ) | $ | 858 | $ | (23,860 | ) | |||
| Less: Discontinued operations: reportable segments measure of profit or loss | - | (8,429 | ) | - | (16,261 | ) | ||||||||
| Continuing operations: reportable segments measure of profit or loss | (1,048 | ) | (42,840 | ) | 858 | (40,121 | ) | |||||||
| Continuing operations: Operating income - Corporate/Eliminations | (5,806 | ) | (6,061 | ) | (10,446 | ) | (13,066 | ) | ||||||
| Change in fair value of equity securities | - | (15,836 | ) | - | (15,836 | ) | ||||||||
| Gain on disposal of FIHRST | 9,743 | - | 9,743 | - | ||||||||||
| Interest income | 1,343 | 2,177 | 1,994 | 4,277 | ||||||||||
| Interest expense | (3,221 | ) | (2,563 | ) | (4,576 | ) | (5,537 | ) | ||||||
| Impairment of Cedar Cellular Note | - | (2,732 | ) | - | (2,732 | ) | ||||||||
| Income (Loss) before income taxes | $ | 1,011 | $ | (67,855 | ) | $ | (2,427 | ) | $ | (73,098 | ) | |||
19. Operating segments (continued)
The following tables summarize segment information that is prepared in accordance with GAAP for the three and six months ended December 31, 2019 and 2018, with the impact of the deconsolidation of DNI included in discontinued operations:
| Three months ended | Six months ended | |||||||||||||||||||||
| December 31, | December 31, | |||||||||||||||||||||
| 2019 | 2018 | 2019 | 2018 | |||||||||||||||||||
| Revenues | ||||||||||||||||||||||
| South African transaction processing | $ | 20,350 | $ | 21,970 | $ | 39,749 | $ | 59,719 | ||||||||||||||
| International transaction processing | 34,363 | 38,124 | 68,380 | 77,511 | ||||||||||||||||||
| Financial services | 21,986 | 38,755 | 52,131 | 91,961 | ||||||||||||||||||
| Continuing | 21,986 | 19,047 | 52,131 | 53,466 | ||||||||||||||||||
| Discontinued | - | 19,708 | - | 38,495 | ||||||||||||||||||
| Total | 76,699 | 98,849 | 160,260 | 229,191 | ||||||||||||||||||
| Continuing | 76,699 | 79,141 | 160,260 | 190,696 | ||||||||||||||||||
| Discontinued | - | 19,708 | - | 38,495 | ||||||||||||||||||
| Operating (loss) income | ||||||||||||||||||||||
| South African transaction processing | (2,981 | ) | (11,830 | ) | (6,366 | ) | (15,343 | ) | ||||||||||||||
| International transaction processing | 2,811 | (4,043 | ) | 6,601 | (1,281 | ) | ||||||||||||||||
| Financial services | (878 | ) | (18,538 | ) | 623 | (7,236 | ) | |||||||||||||||
| Continuing | (878 | ) | (26,967 | ) | 623 | (23,497 | ) | |||||||||||||||
| Discontinued | - | 8,429 | - | 16,261 | ||||||||||||||||||
| Subtotal: Operating segments | (1,048 | ) | (34,411 | ) | 858 | (23,860 | ) | |||||||||||||||
| Corporate/Eliminations | (5,806 | ) | (8,664 | ) | (10,446 | ) | (18,319 | ) | ||||||||||||||
| Continuing | (5,806 | ) | (6,061 | ) | (10,446 | ) | (13,066 | ) | ||||||||||||||
| Discontinued | - | (2,603 | ) | - | (5,253 | ) | ||||||||||||||||
| Total | (6,854 | ) | (43,075 | ) | (9,588 | ) | (42,179 | ) | ||||||||||||||
| Continuing | (6,854 | ) | (48,901 | ) | (9,588 | ) | (53,187 | ) | ||||||||||||||
| Discontinued | - | 5,826 | - | 11,008 | ||||||||||||||||||
| Depreciation and amortization | ||||||||||||||||||||||
| South African transaction processing | 664 | 921 | 1,325 | 1,862 | ||||||||||||||||||
| International transaction processing | 1,481 | 2,511 | 3,377 | 5,570 | ||||||||||||||||||
| Financial services | 383 | 405 | 767 | 1,041 | ||||||||||||||||||
| Continuing | 383 | 346 | 767 | 695 | ||||||||||||||||||
| Discontinued | - | 59 | - | 346 | ||||||||||||||||||
| Subtotal: Operating segments | 2,528 | 3,837 | 5,469 | 8,473 | ||||||||||||||||||
| Corporate/Eliminations | 1,853 | 6,016 | 3,677 | 12,174 | ||||||||||||||||||
| Continuing | 1,853 | 3,413 | 3,677 | 6,921 | ||||||||||||||||||
| Discontinued | - | 2,603 | - | 5,253 | ||||||||||||||||||
| Total | 4,381 | 9,853 | 9,146 | 20,647 | ||||||||||||||||||
| Continuing | 4,381 | 7,191 | 9,146 | 15,048 | ||||||||||||||||||
| Discontinued | - | 2,662 | - | 5,599 | ||||||||||||||||||
| Expenditures for long-lived assets | ||||||||||||||||||||||
| South African transaction processing | 157 | 1,047 | 2,021 | 2,333 | ||||||||||||||||||
| International transaction processing | 616 | 841 | 1,293 | 1,641 | ||||||||||||||||||
| Financial services | 54 | 659 | 137 | 1,691 | ||||||||||||||||||
| Continuing | 54 | 475 | 137 | 1,368 | ||||||||||||||||||
| Discontinued | - | 184 | - | 323 | ||||||||||||||||||
| Subtotal: Operating segments | 827 | 2,547 | 3,451 | 5,665 | ||||||||||||||||||
| Corporate/Eliminations | - | - | - | - | ||||||||||||||||||
| Total | 827 | 2,547 | 3,451 | 5,665 | ||||||||||||||||||
| Continuing | 827 | 2,363 | 3,451 | 5,342 | ||||||||||||||||||
| Discontinued | $ | - | $ | 184 | $ | - | $ | 323 | ||||||||||||||
19. Operating segments (continued)
The segment information as reviewed by the chief operating decision maker does not include a measure of segment assets per segment as all of the significant assets are used in the operations of all, rather than any one, of the segments. The Company does not have dedicated assets assigned to a particular operating segment. Accordingly, it is not meaningful to attempt an arbitrary allocation and segment asset allocation is therefore not presented.
20. Income tax
Income tax in interim periods
For the purposes of interim financial reporting, the Company determines the appropriate income tax provision by first applying the effective tax rate expected to be applicable for the full fiscal year to ordinary income. This amount is then adjusted for the tax effect of significant unusual items, for instance, changes in tax law, valuation allowances and non-deductible transaction-related expenses that are reported separately, and have an impact on the tax charge. The cumulative effect of any change in the enacted tax rate, if and when applicable, on the opening balance of deferred tax assets and liabilities is also included in the tax charge as a discrete event in the interim period in which the enactment date occurs.
For the three and six months ended December 31, 2019, the Company's effective tax rate was impacted by the on-going losses incurred by certain of its South African businesses and the associated valuation allowances created related to the deferred tax assets recognized regarding net operating losses incurred by the Company's South African businesses and non-deductible expenses, including transaction-related expenditure, which was partially offset by tax expense recorded by the Company's profitable businesses in South Africa and South Korea.
For the three and six months ended December 31, 2018, the Company's effective tax rate was adversely impacted by the valuation allowances created related to the deferred tax assets recognized regarding net operating losses incurred by the Company's South African businesses, the non-deductible goodwill impairment losses, and non-deductible expenses, including transaction-related expenditure and non-deductible interest on its South African long-term debt facility, which was partially offset by tax expense recorded by the Company's profitable businesses in South Africa and South Korea. The deferred tax impact of the change in the fair value of the Company's equity security also impacted the Company's effective rate for fiscal 2019, as this amount is recorded at a lower rate (at a capital gains rate) than the South African statutory rate.
Uncertain tax positions
There were no significant changes in the Company's uncertain tax positions during the three and six months ended December 31, 2019. As of December 31, 2019, the Company had accrued interest related to uncertain tax positions of approximately $0.1 million on its balance sheet.
The Company does not expect changes related to its unrecognized tax benefits will have a significant impact on its results of operations or financial position in the next 12 months.
As of December 31, 2019 and June 30, 2019, the Company had unrecognized tax benefits of $1.6 million and $1.2 million, respectively, all of which would impact the Company's effective tax rate. The Company files income tax returns mainly in South Africa, South Korea, Germany, Hong Kong, India, the United Kingdom, Botswana and in the U.S. federal jurisdiction. As of December 31, 2019, the Company's South African subsidiaries are no longer subject to income tax examination by the South African Revenue Service for periods before June 30, 2016. The Company is subject to income tax in other jurisdictions outside South Africa, none of which are individually material to its financial position, statement of cash flows, or results of operations
21. Commitments and contingencies
Guarantees
The South African Revenue Service and certain of the Company's customers, suppliers and other business partners have asked the Company to provide them with guarantees, including standby letters of credit, issued by a South African bank. The Company is required to procure these guarantees for these third parties to operate its business.
Nedbank has issued guarantees to these third parties amounting to ZAR 93.6 million ($6.7 million, translated at exchange rates applicable as of December 31, 2019) and thereby utilizing part of the Company's short-term facility. The Company in turn has provided nonrecourse, unsecured counter-guarantees to Nedbank for ZAR 93.6 million ($6.7 million, translated at exchange rates applicable as of December 31, 2019). The Company pays commission of between 0.4% per annum to 1.94% per annum of the face value of these guarantees and does not recover any of the commission from third parties.
21. Commitments and contingencies (continued)
The Company has not recognized any obligation related to these counter-guarantees in its consolidated balance sheet as of December 31, 2019. The maximum potential amount that the Company could pay under these guarantees is ZAR 93.6 million ($6.7 million, translated at exchange rates applicable as of December 31, 2019). The guarantees have reduced the amount available for borrowings under the Company's short-term credit facility described in Note 10.
Contingencies
The Company is subject to a variety of other insignificant claims and suits that arise from time to time in the ordinary course of business. Management currently believes that the resolution of these other matters, individually or in the aggregate, will not have a material adverse impact on the Company's financial position, results of operations or cash flows.
22. Discontinued operation - DNI
The Company determined that the disposal of its controlling interest in DNI is a discontinued operation because it represented a strategic shift that will have a major effect on the Company’s operations and financial results as a result of the sale of a significant portion of its investment in DNI. Refer to Note 3 to the Company’s audited consolidated financial statements included in its Annual Report on Form 10-K for the year ended June 30, 2019, for additional information regarding the deconsolidation of DNI. The table below presents certain major captions to the Company’s unaudited condensed consolidated statement of operations and unaudited condensed consolidated statement of cash flows for three and six months ended December 31, 2018, that have not been separately presented on those statements:
| DNI | ||||||
| December 31, 2018 | ||||||
| Three months ended | Six months ended | |||||
| Unaudited condensed consolidated statement of operations | ||||||
| Discontinued: | ||||||
| Revenue | $ | 19,708 | $ | 38,495 | ||
| Cost of goods sold, IT processing, servicing and support | 9,954 | 20,166 | ||||
| Selling, general and administration | 1,266 | 1,722 | ||||
| Depreciation and amortization | 2,662 | 5,599 | ||||
| Operating income | 5,826 | 11,008 | ||||
| Interest income | 224 | 499 | ||||
| Interest expense | 215 | 416 | ||||
| Net income before tax | 5,835 | 11,091 | ||||
| Income tax expense | 2,100 | 3,615 | ||||
| Net income before earnings from equity-accounted investments | 3,735 | 7,476 | ||||
| Earnings from equity-accounted investments (1) | 44 | (58 | ) | |||
| Net income from discontinued operations | $ | 3,779 | $ | 7,418 | ||
| Unaudited condensed consolidated statement of cash flows | ||||||
| Discontinued: | ||||||
| Total net cash (used in) provided by operating activities | $ | 10,546 | $ | 7,028 | ||
| Total net cash (used in) provided by investing activities | (172 | ) | (197 | ) | ||
| (1) Earnings from equity-accounted investments for the three and six months ended December 31, 2018, represents earnings attributed to equity-accounted investments owned by DNI and included in the Company's results as a result of the consolidation of DNI. | ||||||
22. Discontinued operation - DNI (continued)
The Company retained a continuing involvement in DNI through its 30% interest in DNI (refer to Note 7). The Company expects to retain an interest in DNI for less than 12 months. The Company recorded earnings under the equity method related to its retained investment in DNI during the three and six months ended December 31, 2019, refer to Note 7. The table below presents revenues and expenses between the Company and DNI, after the DNI disposal transaction, during the three and six months ended December 31, 2019:
| DNI | ||||||
| December 31, 2019 | ||||||
| Three months ended | Six months ended | |||||
| Revenue generated from transactions with DNI | $ | - | $ | - | ||
| Expenses incurred related to transactions with DNI | $ | 333 | $ | 2,607 | ||
Refer to Note 7 for the dividends received from DNI and accounted for under the equity method during the six months ended December 31, 2019.
Item 2. Management's Discussion and Analysis of Financial Condition and Results of Operations
The following discussion should be read in conjunction with our Annual Report on Form 10-K for the year ended June 30, 2019, and the unaudited condensed consolidated financial statements and the accompanying notes included in this Form 10-Q.
Forward-looking statements
Some of the statements in this Form 10-Q constitute forward-looking statements. These statements relate to future events or our future financial performance and involve known and unknown risks, uncertainties and other factors that may cause our or our industry's actual results, levels of activity, performance or achievements to be materially different from any future results, levels of activity, performance or achievements expressed, implied or inferred by these forward-looking statements. Such factors include, among other things, those listed under Item 1A.-"Risk Factors" and elsewhere in our Annual Report on Form 10-K for the year ended June 30, 2019. In some cases, you can identify forward-looking statements by terminology such as "may," "will," "should," "could," "would," "expects," "plans," "intends," "anticipates," "believes," "estimates," "predicts," "potential" or "continue" or the negative of such terms and other comparable terminology.
Although we believe that the expectations reflected in the forward-looking statements are reasonable, we do not know whether we can achieve positive future results, levels of activity, performance, or goals. Actual events or results may differ materially. We undertake no obligation to update any of the forward-looking statements after the date of this Form 10-Q to conform those statements to reflect the occurrence of unanticipated events, except as required by applicable law.
You should read this Form 10-Q and the documents that we reference herein and the documents we have filed as exhibits hereto and thereto and which we have filed with the United States Securities and Exchange Commission completely and with the understanding that our actual future results, levels of activity, performance and achievements may be materially different from what we expect. We qualify all of our forward-looking statements by these cautionary statements.
Recent Developments
Financial Inclusion Activities in South Africa
Having taken dramatic steps to reduce costs in our South African operations in fiscal 2019, our focus in fiscal 2020 has been to transition our South African financial inclusion activities towards a business-to-consumer, or B2C, model. We have developed new banking products in cooperation with Finbond and stabilized our financial services offerings, while continuing to make our distribution and infrastructure more efficient. Our ability to expand our account base and financial services offerings have been constrained by the availability of sufficient liquidity thus far. We completed a soft launch of our new banking products on October 1, 2019 and, without any marketing, we opened in excess of 13,000 new accounts by December 31, 2019.
Our loan book has remained fairly steady over the last two quarters, and we have had additional conversations with third-party lenders, including Finbond, to leverage their balance sheets to provide loans to our customers as a mechanism to accelerate growth in our financial inclusion offerings. During the second quarter of fiscal 2019, we launched new loan products in collaboration with Finbond utilizing their balance sheet. These loans are to the higher LSM customers and therefore the first of our efforts to move up to a higher income customer segment. We issued in excess of 60,000 of these new loans during the second quarter. We continue to work with Grindrod Bank on our ATM and other acquiring initiatives.
The majority of our South African operations were stable though modestly lower compared to the first quarter of fiscal 2020. We expect to drive meaningful growth following an injection of additional liquidity into the businesses.
International Activities
IPG – IPG has completed its restructuring, and its newly developed issuing, acquiring and processing products, together with its new brand are ready for deployment. IPG remains somewhat dependent on Bank Frick to bring these new solutions to market, which in turn will be able to support IPG’s activities once it is authorized to conclude a Payment Facilitator agreement with IPG. Visa has provided conditional approval to Bank Frick with the last remaining Visa requirement being an onsite assessment of our operations in Malta, which occurred in late November 2019. We await final approval from Visa and upon receipt, we will be able to launch our new model with Bank Frick in earnest. In the interim, to accelerate our go-to-market strategy we have engaged with other financial institutions, which have progressed well, though with less strategic support or favorable commercials than our agreements with Bank Frick. We are currently completing final tests on our first product in the crypto-currency/ blockchain market, which is expected to launch toward the end of the third quarter of fiscal 2020 and additional products are expected to follow later in the year.
Bank Frick - Bank Frick is systematically pursuing its strategy of working closely with financial intermediaries, offering products for alternative asset classes and fund services, and becoming an internationally recognized leading partner in the blockchain sector. With this strategy in mind, the bank evaluated and acted on various strategic opportunities during the last quarter.
Bank Frick is now the principal bank for more than 200 blockchain-based business clients in "Crypto Valley" of the Zug district along the border of Liechtenstein and Switzerland. The bank's activities have been further supported by the new Blockchain Act implemented in Liechtenstein, which came into effect on January 1, 2020. The Act has created Europe's most comprehensive blockchain regulation, pioneering regulation for the token economy. Unlike many countries who amend existing legislation to accommodate blockchain, Liechtenstein has opted for a universal approach and creating a single law.
In October 2019, Net1 exercised its option to increase ownership in Bank Frick to 70% from 35% currently. The transaction is awaiting approval from Liechtenstein's Financial Market Authority.
Carbon - Carbon continues to report exponential sequential growth across all the key indicators of its business - number of app installations, unique customers, loans disbursed and number of value-added transactions. For its year ended December 31, 2019, Carbon reported a full year net profit for the first time. Carbon's continued growth will be driven by its ability to access capital and/or funding in order to meet the demand for its expanding suite of products.
India - MobiKwik received central bank approval to be a direct issuer during Q2 2020. We are working with MobiKwik and the card networks to re-launch our virtual card offering for both prepaid and credit with MobiKwik as the issuer. Once launched, we intend to offer the solutions to their entire qualified customer base, which is in excess of ten million users. MobiKwik itself continues to perform ahead of expectations, primarily due to its successful transition to being a digital financial services provider. For the quarter ended December 31, 2019, MobiKwik recorded unaudited annualized revenue of $66 million, up from $28 million for the quarter ended December 31, 2018. It has been contribution margin positive since October 2018 and achieved cash EBITDA breakeven in the month of August 2019. Digital financial services now account for approximately 25% of MobiKwik's total monthly revenue, compared to zero during the previous fiscal year and it is currently disbursing in excess of 110,000 new loans per month.
Progress on corporate activities
As part of the extensive strategic review of all of our businesses and investments, we have made progress on multiple fronts:
Sale of KSNET in Korea - On January 23, 2020, we agreed to sell 100% of KSNET to PayletterHoldings LLC for approximately $237 million. The transaction, which is not subject to a financing condition, is expected to close in March 2020.
Sale of FIHRST - In December 2019, the Company sold its payroll processing business FIHRST to Transaction Capital Payments Solutions Proprietary Ltd. for approximately ZAR 172.2 million, or $11.7 million at prevailing exchange rates. The transaction closed on December 12, 2019 and resulted in a capital gain of approximately ZAR 158.2 million, or $10.8 million. Net1 SA was required to utilize the full purchase price received from the sale of FIHRST to settle its obligations under its lending arrangements - refer to Net1's 2019 Form 10-K and Note 10 to its Q2 2020 Form 10-Q.
Disposal of DNI - During the first quarter of fiscal 2020, DNI announced the acquisition of two related businesses that would provide further diversification of its revenue sources, and meaningfully scale its operations. We believe these acquisitions will expand the appeal of DNI to prospective investors and ultimately result in the exercise of the call option to acquire our remaining 30% at a strike price of ZAR 859.0 million, or $61.2 million translated at exchange rates applicable as of December 31, 2019. We have extended the validity of the call option to March 31, 2020.
Cell C - We continued to carry the value of our Cell C investment at $0 (zero) as of December 31, 2019. Cell C has concluded its infrastructure sharing agreement with MTN, and is now focused on its recapitalization. While it remains in default on its various lending arrangements, Cell C and its lenders are working constructively towards formulating a recapitalization intended to ensure its long-term sustainability and allow Cell C to focus on its core business.
SASSA Contract Expiration
Although we have not been involved operationally with SASSA since September 30, 2018, we have been actively trying to resolve all legal and legacy outstanding items to allow us to focus on our core business.
Supreme Court Ruling on refund of implementation costs from 2014 - On September 30, 2019, the Supreme Court dismissed CPS's appeal against the whole order and judgment of the High Court of the Republic of South Africa Gauteng Division, Pretoria and ordered it to pay Corruption Watch's costs, including that of two legal counsel. On October 23, 2019, we filed our leave to appeal the Supreme Court's order with the Constitutional Court of South Africa. However, we cannot predict whether leave to appeal will be granted or if granted, how the Constitutional Court would rule on the matter.
Settlement of payment of fees due for the last six months of the SASSA contract - Following the March 23, 2018 Constitutional Court order for a six-month extension of our contract with SASSA for payment of grants in cash at pay points only, we were allowed to charge our monthly fee based on the previously contracted rate of ZAR 16.44 (including VAT) per cash pay point recipient. Given that we only serviced the highest-cost beneficiaries, the Constitutional Court allowed us to approach the National Treasury in order for them to make a fair determination of the price we should be paid for services rendered. National Treasury recommended a rate of ZAR 51.00 (including VAT) per cash pay point recipient per month to the Constitutional Court. Contrary to SASSA's stance, the Constitutional Court on December 5, 2018, ruled that they are not required to ratify the Treasury recommended rate, and that CPS and SASSA must agree on the pricing. We have commenced legal proceedings to receive an amount in accordance with the National Treasury's recommendation.
Critical Accounting Policies
Our unaudited condensed consolidated financial statements have been prepared in accordance with U.S. GAAP, which requires management to make estimates and assumptions about future events that affect the reported amount of assets and liabilities and disclosure of contingent assets and liabilities. As future events and their effects cannot be determined with absolute certainty, the determination of estimates requires management's judgment based on a variety of assumptions and other determinants such as historical experience, current and expected market conditions and certain scientific evaluation techniques.
Critical accounting policies are those that reflect significant judgments or uncertainties, and potentially may result in materially different results under different assumptions and conditions. We have identified the following critical accounting policies that are described in more detail in our Annual Report on Form 10-K for the year ended June 30, 2019:
- Valuation of investment in Cell C;
- Business combinations and the recoverability of goodwill;
- Intangible assets acquired through acquisitions;
- Deferred taxation;
- Stock-based compensation;
- Accounts receivable and allowance for doubtful accounts receivable; and
- Accounting for transactions following September 2019 Supreme Court ruling.
Recent accounting pronouncements adopted
Refer to Note 1 to our unaudited condensed consolidated financial statements for a full description of recent accounting pronouncements adopted, including the dates of adoption and the effects on our unaudited condensed consolidated financial statements.
Recent accounting pronouncements not yet adopted as of December 31, 2019
Refer to Note 1 to our unaudited condensed consolidated financial statements for a full description of recent accounting pronouncements not yet adopted as of December 31, 2019, including the expected dates of adoption and effects on our financial condition, results of operations and cash flows.
Currency Exchange Rate Information
Actual exchange rates
The actual exchange rates for and at the end of the periods presented were as follows:
| Table 1 | Three months ended | Six months ended | Year end | ||||||||||||
| December 31, | December 31, | June 30, | |||||||||||||
| 2019 | 2018 | 2019 | 2018 | 2019 | |||||||||||
| ZAR : $ average exchange rate | 14.6969 | 14.3043 | 14.6947 | 14.1863 | 14.1926 | ||||||||||
| Highest ZAR : $ rate during period | 15.3017 | 14.8463 | 15.3860 | 15.4335 | 15.4335 | ||||||||||
| Lowest ZAR : $ rate during period | 14.0304 | 13.6911 | 13.8973 | 13.1528 | 13.1528 | ||||||||||
| Rate at end of period | 14.0483 | 14.3960 | 14.0483 | 14.3960 | 14.0840 | ||||||||||
| KRW : $ average exchange rate | 1,175 | 1,127 | 1,185 | 1,124 | 1,135 | ||||||||||
| Highest KRW : $ rate during period | 1,205 | 1,141 | 1,218 | 1,141 | 1,195 | ||||||||||
| Lowest KRW : $ rate during period | 1,155 | 1,109 | 1,155 | 1,108 | 1,108 | ||||||||||
| Rate at end of period | 1,155 | 1,114 | 1,155 | 1,114 | 1,156 | ||||||||||
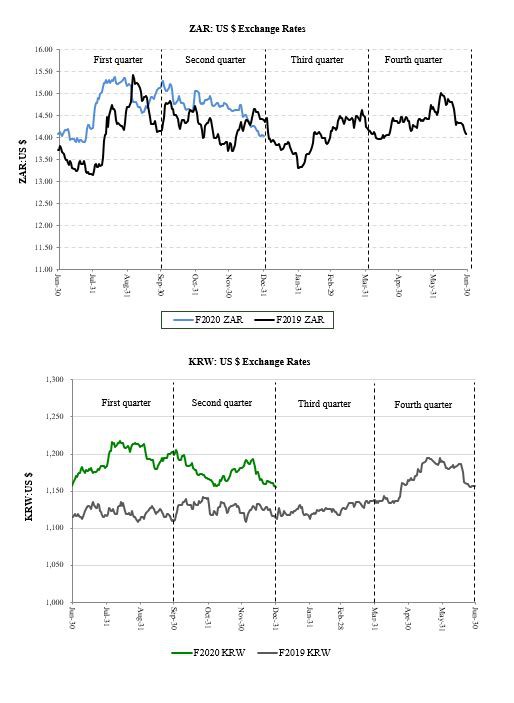
Translation exchange rates for financial reporting purposes
We are required to translate our results of operations from ZAR and KRW to U.S. dollars on a monthly basis. Thus, the average rates used to translate this data for the three and six months ended December 31, 2019 and June 30, 2019, vary slightly from the averages shown in the table above. The translation rates we use in presenting our results of operations are the rates shown in the following table:
| Three months ended | Six months ended | Year end | |||||||||||||
| Table 2 | December 31, | December 31, | June 30, | ||||||||||||
| 2019 | 2018 | 2019 | 2018 | 2019 | |||||||||||
| Income and expense items: $1 = ZAR | 14.6022 | 14.3236 | 14.4023 | 14.3378 | 14.2688 | ||||||||||
| Income and expense items: $1 = KRW | 1,174 | 1,124 | 1,184 | 1,122 | 1,136 | ||||||||||
| Balance sheet items: $1 = ZAR | 14.0483 | 14.3960 | 14.0483 | 14.3960 | 14.0840 | ||||||||||
| Balance sheet items: $1 = KRW | 1,155 | 1,114 | 1,155 | 1,114 | 1,156 | ||||||||||
Results of operations
The discussion of our consolidated overall results of operations is based on amounts as reflected in our unaudited consolidated financial statements which are prepared in accordance with U.S. GAAP. We analyze our results of operations both in U.S. dollars, as presented in the consolidated financial statements, and supplementally in ZAR, because ZAR is the functional currency of the entities which contribute the majority of our revenue and is the currency in which the majority of our transactions are initially incurred and measured. Due to the significant impact of currency fluctuations between the U.S. dollar and ZAR on our reported results and because we use the U.S. dollar as our reporting currency, we believe that the supplemental presentation of our results of operations in ZAR is useful to investors to understand the changes in the underlying trends of our business.
Our operating segment revenue presented in "-Results of operations by operating segment" represents total revenue per operating segment before intercompany eliminations. A reconciliation between total operating segment revenue and revenue presented in our consolidated financial statements is included in Note 19 to those statements.
We used the equity method to account for DNI in fiscal 2020 and accounted for DNI as a discontinued operation in fiscal 2019. We disposed of FIHRST during the second quarter of fiscal 2020 and its contribution to our reported results is excluded from December 1, 2019.
We analyze our business and operations in terms of three inter-related but independent operating segments: (1) South African transaction processing, (2) International transaction processing and (3) Financial inclusion and applied technologies. In addition, corporate and corporate office activities that are impracticable to ascribe directly to any of the other operating segments, as well as any inter-segment eliminations, are included in corporate/eliminations.
Second quarter of fiscal 2020 compared to second quarter of fiscal 2019
The following factors had a significant impact on our results of operations during the second quarter of fiscal 2020 as compared with the same period in the prior year:
• Decline in revenue: Our revenues declined 2% in ZAR primarily due to the decline in EPE account numbers driven by SASSA’s auto-migration of accounts to SAPO, and a reduction in EPE-related financial and value-added services and transaction fees due to a smaller customer base, but partially offset by higher ad hoc terminal and prepaid airtime sales;
• Ongoing operating losses: We continue to experience operating losses primarily in South Africa as a result of lower revenues, coupled with a high-fixed cost infrastructure;
• Gain on disposal of FIHRST: We recorded a gain of $9.7 million related to the disposal of FIHRST in December 2019;
• Higher net interest expense: Net interest expense increased due to lower average cash balances and higher short-term borrowing to fund ATMs and utilization of our overdrafts, but was partially offset by the repayment of our long-term debt in the second half of fiscal 2019; and
• Adverse foreign exchange movements: The U.S. dollar appreciated 2% against the ZAR and 4% against the KRW during the second quarter of fiscal 2020, which adversely impacted our reported results.
Consolidated overall results of operations
This discussion is based on the amounts prepared in accordance with U.S. GAAP.
The following tables show the changes in the items comprising our statements of operations, both in U.S. dollars and in ZAR:
| Table 3 | In United States Dollars (US GAAP) |
|||||||||
| Three months ended December 31, | ||||||||||
| 2019 | 2018(A) | $ % | ||||||||
| $ '000 | $ '000 | change | ||||||||
| Revenue | 74,080 | 77,442 | (4%) | |||||||
| Cost of goods sold, IT processing, servicing and support | 43,160 | 41,231 | 5% | |||||||
| Selling, general and administration | 33,393 | 69,730 | (52%) | |||||||
| Depreciation and amortization | 4,381 | 7,191 | (39%) | |||||||
| Impairment loss | - | 8,191 | nm | |||||||
| Operating loss | (6,854 | ) | (48,901 | ) | (86%) | |||||
| Change in fair value of equity securities | - | (15,836 | ) | nm | ||||||
| Gain on disposal of FIHRST | 9,743 | - | nm | |||||||
| Interest income | 1,343 | 2,177 | (38%) | |||||||
| Interest expense | 3,221 | 2,563 | 26% | |||||||
| Impairment of Cedar Cellular note | - | 2,732 | nm | |||||||
| Income (Loss) before income taxes | 1,011 | (67,855 | ) | nm | ||||||
| Income tax expense (benefit) | 1,722 | (4,398 | ) | nm | ||||||
| Net loss before earnings (loss) from equity-accounted investments | (711 | ) | (63,457 | ) | (99%) | |||||
| Earnings (Loss) from equity-accounted investments | 506 | (1,291 | ) | nm | ||||||
| Net loss from continuing operations | (205 | ) | (64,748 | ) | (100%) | |||||
| Net income from discontinued operations | - | 3,779 | nm | |||||||
| Net (loss) income | (205 | ) | (60,969 | ) | (100%) | |||||
| Less net income attributable to non-controlling interest | - | 2,972 | nm | |||||||
| Continuing | - | 721 | nm | |||||||
| Discontinued | - | 2,251 | nm | |||||||
| Net (loss) income attributable to us | (205 | ) | (63,941 | ) | (100%) | |||||
| Continuing | (205 | ) | (65,469 | ) | (100%) | |||||
| Discontinued | - | 1,528 | nm | |||||||
(A) Refer to Note 22 to the unaudited condensed consolidated financial statements for discontinued operations disclosures.
| Table 4 | In South African Rand (US GAAP) |
|||||||||
| Three months ended December 31, | ||||||||||
| 2019 | 2018(A) | ZAR % | ||||||||
| ZAR '000 | ZAR '000 | change | ||||||||
| Revenue | 1,081,731 | 1,109,248 | (2%) | |||||||
| Cost of goods sold, IT processing, servicing and support | 630,231 | 590,576 | 7% | |||||||
| Selling, general and administration | 487,611 | 998,784 | (51%) | |||||||
| Depreciation and amortization | 63,972 | 103,001 | (38%) | |||||||
| Impairment loss | - | 117,325 | nm | |||||||
| Operating loss | (100,083 | ) | (700,438 | ) | (86%) | |||||
| Change in fair value of equity securities | - | (226,829 | ) | nm | ||||||
| Gain on disposal of FIHRST | 142,269 | - | nm | |||||||
| Interest income | 19,611 | 31,182 | (37%) | |||||||
| Interest expense | 47,034 | 36,711 | 28% | |||||||
| Impairment of Cedar Cellular note | - | 39,132 | nm | |||||||
| Income (Loss) before income taxes | 14,763 | (971,928 | ) | nm | ||||||
| Income tax expense (benefit) | 25,145 | (62,995 | ) | nm | ||||||
| Net loss before earnings (loss) from equity-accounted investments | (10,382 | ) | (908,933 | ) | (99%) | |||||
| Earnings (Loss) from equity-accounted investments | 7,389 | (18,492 | ) | nm | ||||||
| Net loss from continuing operations | (2,993 | ) | (927,425 | ) | (100%) | |||||
| Net income from discontinued operations | - | 54,129 | nm | |||||||
| Net (loss) income | (2,993 | ) | (873,296 | ) | (100%) | |||||
| Less net income attributable to non-controlling interest | - | 42,570 | nm | |||||||
| Continuing | - | 10,328 | nm | |||||||
| Discontinued | - | 32,242 | nm | |||||||
| Net (loss) income attributable to us | (2,993 | ) | (915,866 | ) | (100%) | |||||
| Continuing | (2,993 | ) | (937,753 | ) | (100%) | |||||
| Discontinued | - | 21,887 | nm | |||||||
(A) Refer to Note 22 to the unaudited condensed consolidated financial statements for discontinued operations disclosures.
The decrease in revenue was primarily due to the decline in EPE account numbers driven by SASSA's auto-migration of accounts to SAPO, and a reduction in EPE-related financial and value-added services and transaction fees due to a smaller customer base, but partially offset by higher ad hoc terminal and prepaid airtime sales.
The increase in cost of goods sold, IT processing, servicing and support was primarily due to higher costs related to ad hoc terminal and prepaid airtime sales, but partially offset by fewer SASSA Grindrod-account grant recipients utilizing the South African National Payment System which resulted in lower transaction costs incurred by us.
The decrease in selling, general and administration expense was primarily due to the increase in our allowance for doubtful finance loans receivable recorded during the second quarter of fiscal 2019 of approximately $23.4 million (resulting from SASSA's auto-migration of EPE accounts), and lower costs incurred by our South Africa business as we transition our business strategy in South Africa. We continue to incur committed fixed and variable costs (including premises and staff costs) related to the maintenance of our financial inclusion initiatives in South Africa.
Depreciation and amortization decreased primarily due to lower overall amortization of intangible assets that are fully amortized and tangible assets that are fully depreciated during the second quarter of fiscal 2020.
During the second quarter of fiscal 2019, we recognized an impairment loss of approximately $8.2 million, which included $7.0 million related to the entire amount of IPG goodwill.
Our operating loss margin for the second quarter of fiscal 2020 and 2019 was (9.3%) and (63.1%), respectively. We discuss the components of operating income margin under "-Results of operations by operating segment."
There was no change in the fair value of equity securities during the second quarter of fiscal 2020 with our investment in Cell C carried at $0 (zero). The change in fair value of equity securities during the second quarter of fiscal 2019 represented a non-cash fair value adjustment loss related to Cell C. Refer to Note 6 of our unaudited condensed consolidated financial statements for the methodology and inputs used in the fair value calculation.
We recorded a gain of $9.7 million related to the disposal of FIHRST during the second quarter of fiscal 2020.
Interest on surplus cash decreased to $1.3 million (ZAR 19.6 million) from $2.2 million (ZAR 31.2 million), due primarily to the lower average daily cash balances and cash used to fund the operating losses in the South African operations.
Interest expense increased to $3.2 million (ZAR 47.0 million) from $2.6 million (ZAR 36.7 million), due to interest expense related to cash borrowed to stock our ATMs and utilization of our overdraft facilities, but partially offset by a reduction in our long-term South African debt.
During the second quarter of fiscal 2019, we recorded an impairment loss of $2.7 million related to our Cedar Cellular note as discussed in Note 7 of our unaudited condensed consolidated financial statements.
Fiscal 2020 tax expense was $1.7 million (ZAR 25.1 million) compared to an income tax benefit of $(4.4) million (ZAR (63.0) million) in fiscal 2019. Our effective tax rate for fiscal 2020, was impacted by the on-going losses incurred by certain of our South African businesses and the associated valuation allowances created related to the deferred tax assets recognized regarding net operating losses incurred by these South African businesses and non-deductible expenses, including transaction-related expenditure, which was partially offset by tax expense recorded by our profitable businesses in South Africa and South Korea. Our effective tax rate for fiscal 2019, was adversely impacted by the valuation allowances created related to the deferred tax assets recognized regarding net operating losses incurred by our South African businesses, the non-deductible goodwill impairment losses, and non-deductible expenses, including transaction-related expenditure and non-deductible interest on our South African long-term debt facility, which was partially offset by tax expense recorded by our profitable businesses in South Africa and South Korea. The deferred tax impact of the change in the fair value of our equity security also impacted our effective rate for fiscal 2019, as this amount is recorded at a lower rate (at a capital gains rate) than the South African statutory rate.
DNI was accounted for using the equity method during the second quarter of fiscal 2020. Finbond is listed on the Johannesburg Stock Exchange and reports its six-month results during our first quarter and its annual results during our fourth quarter. The table below presents the relative earnings (loss) from our equity accounted investments:
| Table 5 | Three months ended December 31, | |||||||||
| 2019 | 2018 | $ % | ||||||||
| $ '000 | $ '000 | change | ||||||||
| DNI | 380 | - | nm | |||||||
| Share of net income | 1,650 | - | nm | |||||||
| Amortization of intangible assets, net of deferred tax | (465 | ) | - | nm | ||||||
| Impairment | (805 | ) | - | nm | ||||||
| Bank Frick | 494 | (1,217 | ) | nm | ||||||
| Share of net income | 636 | 402 | 58% | |||||||
| Amortization of intangible assets, net of deferred tax | (142 | ) | (141 | ) | 1% | |||||
| Other | - | (1,478 | ) | nm | ||||||
| Other | (368 | ) | (74 | ) | 397% | |||||
| 506 | (1,291 | ) | nm | |||||||
Results of operations by operating segment
The composition of revenue and the contributions of our business activities to operating income are illustrated below:
| Table 6 | In United States Dollars (US GAAP) | |||||||||||||||
| Three months ended December 31, | ||||||||||||||||
| 2019 | % of | 2018 | % of | % change | ||||||||||||
| Operating Segment | $ '000 | total | $ '000 | total | ||||||||||||
| Consolidated revenue: | ||||||||||||||||
| South African transaction processing | 20,350 | 27% | 21,970 | 23% | (7%) | |||||||||||
| International transaction processing | 34,363 | 46% | 38,124 | 39% | (10%) | |||||||||||
| Financial inclusion and applied technologies | 21,986 | 30% | 38,755 | 40% | (43%) | |||||||||||
| Continuing | 21,986 | 30% | 19,047 | 20% | 15% | |||||||||||
| Discontinued | - | - | 19,708 | 20% | nm | |||||||||||
| Subtotal: Operating segments | 76,699 | 103% | 98,849 | 102% | (22%) | |||||||||||
| Corporate/Eliminations | (2,619 | ) | (3%) | (1,699 | ) | (2%) | 54% | |||||||||
| Total consolidated revenue | 74,080 | 100% | 97,150 | 100% | (24%) | |||||||||||
| Continuing | 74,080 | 100% | 77,442 | 80% | (4%) | |||||||||||
| Discontinued | - | - | 19,708 | 20% | nm | |||||||||||
| Consolidated operating (loss) income: | nm | |||||||||||||||
| South African transaction processing | (2,981 | ) | 43% | (11,830 | ) | 27% | (75%) | |||||||||
| International transaction processing | 2,811 | (41%) | (4,043 | ) | 9% | nm | ||||||||||
| Financial inclusion and applied technologies | (878 | ) | 13% | (18,538 | ) | 43% | (95%) | |||||||||
| Continuing | (878 | ) | 13% | (26,967 | ) | 63% | (97%) | |||||||||
| Discontinued | - | - | 8,429 | (20%) | nm | |||||||||||
| Subtotal: Operating segments | (1,048 | ) | 15% | (34,411 | ) | 79% | (97%) | |||||||||
| Corporate/eliminations | (5,806 | ) | 85% | (8,664 | ) | 21% | (33%) | |||||||||
| Continuing | (5,806 | ) | 85% | (6,061 | ) | 15% | (4%) | |||||||||
| Discontinued | - | - | (2,603 | ) | 6% | nm | ||||||||||
| Total consolidated operating (loss) income | (6,854 | ) | 100% | (43,075 | ) | 100% | (84%) | |||||||||
| Continuing | (6,854 | ) | 100% | (48,901 | ) | 114% | (86%) | |||||||||
| Discontinued | - | - | 5,826 | (14%) | nm | |||||||||||
| Table 7 | In South African Rand (US GAAP) | |||||||||||||||
| Three months ended December 31, | ||||||||||||||||
| 2019 | % of | 2018 | % of | % change | ||||||||||||
| Operating Segment | ZAR '000 | total | ZAR '000 | total | ||||||||||||
| Consolidated revenue: | ||||||||||||||||
| South African transaction processing | 297,155 | 27% | 314,689 | 23% | (6%) | |||||||||||
| International transaction processing | 501,775 | 46% | 546,073 | 39% | (8%) | |||||||||||
| Financial inclusion and applied technologies | 321,044 | 30% | 555,111 | 40% | (42%) | |||||||||||
| Continuing | 321,044 | 30% | 272,821 | 20% | 18% | |||||||||||
| Discontinued | - | - | 282,290 | 20% | nm | |||||||||||
| Subtotal: Operating segments | 1,119,974 | 103% | 1,415,873 | 102% | (21%) | |||||||||||
| Corporate/Eliminations | (38,243 | ) | (3%) | (24,335 | ) | (2%) | 57% | |||||||||
| Total consolidated revenue | 1,081,731 | 100% | 1,391,538 | 100% | (22%) | |||||||||||
| Continuing | 1,081,731 | 100% | 1,109,248 | 80% | (2%) | |||||||||||
| Discontinued | - | - | 282,290 | 20% | nm | |||||||||||
| Consolidated operating (loss) income: | nm | |||||||||||||||
| South African transaction processing | (43,529 | ) | 43% | (169,448 | ) | 27% | (74%) | |||||||||
| International transaction processing | 41,047 | (41%) | (57,910 | ) | 9% | nm | ||||||||||
| Financial inclusion and applied technologies | (12,821 | ) | 13% | (265,531 | ) | 43% | (95%) | |||||||||
| Continuing | (12,821 | ) | 13% | (386,265 | ) | 63% | (97%) | |||||||||
| Discontinued | - | - | 120,734 | (20%) | nm | |||||||||||
| Subtotal: Operating segments | (15,303 | ) | 15% | (492,889 | ) | 79% | (97%) | |||||||||
| Corporate/eliminations | (84,780 | ) | 85% | (124,100 | ) | 21% | (32%) | |||||||||
| Continuing | (84,780 | ) | 85% | (86,816 | ) | 15% | (2%) | |||||||||
| Discontinued | - | - | (37,284 | ) | 6% | nm | ||||||||||
| Total consolidated operating (loss) income | (100,083 | ) | 100% | (616,989 | ) | 100% | (84%) | |||||||||
| Continuing | (100,083 | ) | 100% | (700,439 | ) | 114% | (86%) | |||||||||
| Discontinued | - | - | 83,450 | (14%) | nm | |||||||||||
South African transaction processing
The decrease in segment revenue was primarily due to fewer transactions performed at our ATM base and lower fees as a result of fewer EPE and SASSA accounts. Our South African transaction processing operating segment revenue and operating loss have been adversely impacted by the loss of EPE customers as a result of SASSA's auto-migration of accounts to SAPO. The reduced operating loss in the segment is due to the cost cutting that has occurred over the last 12 months.
Our operating loss margin for the second quarter of fiscal 2020 and 2019 was (14.6%) and (53.8%), respectively.
International transaction-based activities
Segment revenue was lower during the second quarter of fiscal 2020, primarily due to an ongoing contraction in IPG transactions processed, specifically meaningfully lower crypto-exchange and China processing activity, modestly lower KSNET revenue as a result of lower transaction values processed and the impact of the weaker KRW/ USD exchange rate on reported KSNET revenue. Operating income during the second quarter of fiscal 2020 has improved compared with fiscal 2019 due to improved profitability of KSNET and the impairment loss recorded in fiscal 2019.
Operating income (loss) margin for the second quarter of fiscal 2020 and 2019 was 8.2% and (10.6%), respectively. Excluding the goodwill impairment, segment operating income and margin for fiscal 2019 were $3.0 million and 7.8%, respectively.
Financial inclusion and applied technologies
Segment revenue increased primarily due to higher ad hoc terminal and prepaid airtime sales, partially offset by lower lending revenue as a result of a moderate contraction in our lending book and lower insurance revenue as a result of fewer customers, and a decrease in inter-segment revenues. Excluding the impact of the allowance for doubtful finance loans recorded in the second quarter of fiscal 2019, the operating loss from continuing operations for the second quarter of fiscal 2020 was better than fiscal 2019 due to the contribution from the ad hoc terminal and airtime sales. Operating income during the second quarter of fiscal 2019 was significantly impacted by an allowance for doubtful finance loans receivable of $23.4 million (ZAR 335.1 million).
Operating income margin from continuing operations for the Financial inclusion and applied technologies segment was (4.0%) and (141.6%) during the second quarter of fiscal 2020 and 2019, respectively.
Corporate/Eliminations
Our corporate expenses generally include acquisition-related intangible asset amortization; expenses incurred related to acquisitions and investments pursued; expenditure related to compliance with the Sarbanes-Oxley Act of 2002; non-employee directors' fees; employee and executive bonuses; stock-based compensation; legal fees; audit fees; directors and officer's insurance premiums; telecommunications expenses; and elimination entries.
Our corporate expenses decreased primarily due to lower acquired intangible asset amortization expense related to intangible assets that were fully amortized during fiscal 2019, partially offset by higher transaction-related expenditures.
First half of fiscal 2020 compared to first half of fiscal 2019
The following factors had a significant impact on our results of operations during the first half of fiscal 2020 as compared with the same period in the prior year:
• Decline in revenue: Our revenues declined 16% in ZAR primarily due to the expiration of our SASSA contract, the decline in EPE account numbers driven by SASSA's auto-migration of accounts to SAPO, and a reduction in EPE-related financial and value-added services and transaction fees due to a smaller customer base, but partially offset by higher ad hoc terminal and prepaid airtime sales;
• Ongoing operating losses: We continue to experience operating losses primarily in South Africa as a result of lower revenues, coupled with a high-fixed cost infrastructure;
• Gain on disposal of FIHRST: We recorded a gain of $9.7 million related to the disposal of FIHRST in December 2019;
• Higher net interest expense: Net interest expense increased due to lower average cash balances and higher short-term borrowing to fund ATMs and utilization of our overdrafts, but was partially offset by the repayment of our long-term debt in the second half of fiscal 2019;
• Adverse foreign exchange movements: The U.S. dollar appreciated 6% against the KRW during the first half of fiscal 2020, which adversely impacted our reported results.
Consolidated overall results of operations
This discussion is based on the amounts prepared in accordance with U.S. GAAP.
The following tables show the changes in the items comprising our statements of operations, both in U.S. dollars and in ZAR:
| Table 8 | In United States Dollars (US GAAP) |
|||||||||
| Six months ended December 31, | ||||||||||
| 2019 | 2018(A) | $ % | ||||||||
| $ '000 | $ '000 | change | ||||||||
| Revenue | 154,836 | 184,539 | (16%) | |||||||
| Cost of goods sold, IT processing, servicing and support | 89,954 | 103,335 | (13%) | |||||||
| Selling, general and administration | 65,324 | 111,152 | (41%) | |||||||
| Depreciation and amortization | 9,146 | 15,048 | (39%) | |||||||
| Impairment loss | - | 8,191 | nm | |||||||
| Operating loss | (9,588 | ) | (53,187 | ) | (82%) | |||||
| Change in fair value of equity securities | - | (15,836 | ) | nm | ||||||
| Gain on disposal of FIHRST | 9,743 | - | nm | |||||||
| Interest income | 1,994 | 3,778 | (47%) | |||||||
| Interest expense | 4,576 | 5,121 | (11%) | |||||||
| Impairment of Cedar Cellular note | - | 2,732 | nm | |||||||
| Loss before income taxes | (2,427 | ) | (73,098 | ) | (97%) | |||||
| Income tax expense | 3,739 | 577 | 548% | |||||||
| Net loss before earnings from equity-accounted investments | (6,166 | ) | (73,675 | ) | (92%) | |||||
| Earnings from equity-accounted investments | 1,569 | 184 | 753% | |||||||
| Net loss from continuing operations | (4,597 | ) | (73,491 | ) | (94%) | |||||
| Net income from discontinued operations | - | 7,418 | nm | |||||||
| Net (loss) income | (4,597 | ) | (66,073 | ) | (93%) | |||||
| Less (Add) net income (loss) attributable to non-controlling interest | - | 3,067 | nm | |||||||
| Continuing | - | (877 | ) | nm | ||||||
| Discontinued | - | 3,944 | nm | |||||||
| Net (loss) income attributable to us | (4,597 | ) | (69,140 | ) | (93%) | |||||
| Continuing | (4,597 | ) | (72,614 | ) | (94%) | |||||
| Discontinued | - | 3,474 | nm | |||||||
(A) Refer to Note 22 to the unaudited condensed consolidated financial statements for discontinued operations disclosures.
| Table 9 | In South African Rand (US GAAP) |
|||||||||
| Six months ended December 31, | ||||||||||
| 2019 | 2018(A) | ZAR % | ||||||||
| ZAR '000 | ZAR '000 | change | ||||||||
| Revenue | 2,229,994 | 2,645,884 | (16%) | |||||||
| Cost of goods sold, IT processing, servicing and support | 1,295,544 | 1,481,596 | (13%) | |||||||
| Selling, general and administration | 940,815 | 1,593,675 | (41%) | |||||||
| Depreciation and amortization | 131,723 | 215,755 | (39%) | |||||||
| Impairment loss | - | 117,441 | nm | |||||||
| Operating loss | (138,088 | ) | (762,583 | ) | (82%) | |||||
| Change in fair value of equity securities | - | (227,053 | ) | nm | ||||||
| Gain on disposal of FIHRST | 140,322 | - | nm | |||||||
| Interest income | 28,718 | 54,168 | (47%) | |||||||
| Interest expense | 65,905 | 73,424 | (10%) | |||||||
| Impairment of Cedar Cellular note | - | 39,171 | nm | |||||||
| Loss before income taxes | (34,953 | ) | (1,048,063 | ) | (97%) | |||||
| Income tax expense | 53,850 | 8,273 | 551% | |||||||
| Net loss before earnings from equity-accounted investments | (88,803 | ) | (1,056,336 | ) | (92%) | |||||
| Earnings from equity-accounted investments | 22,597 | 2,638 | 757% | |||||||
| Net loss from continuing operations | (1,053,698 | (94%) | ||||||||
| Net income from discontinued operations | 106,358 | nm | ||||||||
| Net (loss) income | (66,206 | ) | (947,340 | ) | (93%) | |||||
| Less (Add) net income (loss) attributable to non-controlling interest | - | 43,974 | nm | |||||||
| Continuing | - | (12,574 | ) | nm | ||||||
| Discontinued | - | 56,548 | nm | |||||||
| Net (loss) income attributable to us | (66,206 | ) | (991,314 | ) | (93%) | |||||
| Continuing | (66,206 | ) | (1,041,124 | ) | (94%) | |||||
| Discontinued | - | 49,810 | nm | |||||||
(A) Refer to Note 22 to the unaudited condensed consolidated financial statements for discontinued operations disclosures.
The decrease in revenue was primarily due to the expiration of our SASSA contract, the decline in EPE account numbers driven by SASSA's auto-migration of accounts to SAPO, and a reduction in EPE-related financial and value-added services and transaction fees due to a smaller customer base, but partially offset by higher ad hoc terminal and prepaid airtime sales.
The decrease in cost of goods sold, IT processing, servicing and support was primarily due to fewer SASSA Grindrod-account grant recipients utilizing the South African National Payment System which resulted in lower transaction costs incurred by us, but partially offset by higher costs related to terminal and prepaid airtime sales.
The decrease in selling, general and administration expense was primarily due to the increase in our allowance for doubtful finance loans receivable recorded during the second quarter of fiscal 2019 of approximately $23.4 million (resulting from SASSA's auto-migration of EPE accounts), lower costs incurred by IPG and by our South Africa business as we transition our business strategy in South Africa.
Depreciation and amortization decreased primarily due to lower overall amortization of intangible assets that are fully amortized and tangible assets that are fully depreciated during the first half of fiscal 2020.
During the first half of fiscal 2019, we recorded an impairment loss of $8.2 million, which included $7.0 million related to the entire amount of IPG goodwill.
Our operating loss margin for the first half of fiscal 2020 and 2019 was (6.2%) and (28.8%), respectively. We discuss the components of operating income margin under "-Results of operations by operating segment."
The change in fair value of equity securities represents a non-cash fair value adjustment loss related to Cell C during the first half of fiscal 2019. Refer to Note 6 of our unaudited condensed consolidated financial statements for the methodology and inputs used in the fair value calculation.
We recorded a gain of $9.7 million related to the disposal of FIHRST during the first half of fiscal 2020.
Interest on surplus cash decreased to $2.0 million (ZAR 28.7 million) from $3.8 million (ZAR 54.2 million), due primarily to the lower average daily cash balances and cash used to fund the operating losses in the South African operations.
Interest expense decreased to $4.6 million (ZAR 65.9 million) from $5.1 million (ZAR 73.4 million), due to a reduction in our long-term South African debt, partially offset by interest expense related to cash borrowed to stock our ATMs and utilization of our overdraft facilities.
During the first half of fiscal 2019, we recorded an impairment loss of $2.7 million related to our Cedar Cellular note as discussed in Note 7 of our unaudited condensed consolidated financial statements.
Fiscal 2020 tax expense was $3.7 million (ZAR 53.9 million) compared to $0.6 million (ZAR 8.3 million) in fiscal 2019. Our effective tax rate for fiscal 2020, was impacted by the on-going losses incurred by certain of our South African businesses and the associated valuation allowances created related to the deferred tax assets recognized regarding net operating losses incurred by these South African businesses and non-deductible expenses, including transaction-related expenditure, which was partially offset by tax expense recorded by our profitable businesses in South Africa and South Korea. Our effective tax rate for fiscal 2019, was (6.8%) and was impacted by the valuation allowances created related to the deferred tax assets recognized regarding net operating losses incurred by our South African businesses, the non-deductible goodwill impairment losses, and non-deductible expenses, including transaction-related expenditure and non-deductible interest on our South African long-term debt facility, which was partially offset by tax expense recorded by our profitable businesses in South Africa and South Korea. The deferred tax impact of the change in the fair value of our equity security also impacted our effective rate for fiscal 2019, as this amount is recorded at a lower rate (at a so-called capital gains rate) than the South African statutory rate.
DNI was accounted for using the equity method during the first half of fiscal 2019. The accounting for DNI as a discontinued operation has adversely impacted the comparability of our (loss) earnings from equity-accounted investments during the first half of fiscal 2020. Finbond is listed on the Johannesburg Stock Exchange and reports its six-month results during our first half and its annual results during our fourth quarter. The table below presents the relative earnings (loss) from our equity accounted investments:
| Table 10 | Six months ended December 31, | |||||||||
| 2019 | 2018 | |||||||||
| $ '000 | $ '000 | $ % change | ||||||||
| DNI | 1,108 | - | nm | |||||||
| Share of net income | 3,113 | - | nm | |||||||
| Amortization of intangible assets, net of deferred tax | (931 | ) | - | nm | ||||||
| Impairment | (1,074 | ) | - | nm | ||||||
| Bank Frick | 469 | (1,805 | ) | nm | ||||||
| Share of net income | 755 | 564 | 34% | |||||||
| Amortization of intangible assets, net of deferred tax | (286 | ) | (285 | ) | 0% | |||||
| Other | - | (2,084 | ) | nm | ||||||
| Finbond | 491 | 1,875 | (74%) | |||||||
| Other | (499 | ) | 114 | nm | ||||||
| 1,569 | 184 | nm | ||||||||
Results of operations by operating segment
The composition of revenue and the contributions of our business activities to operating income are illustrated below:
| Table 11 | In United States Dollars (US GAAP) | |||||||||||||||
| Six months ended December 31, | ||||||||||||||||
| 2019 | % of | 2018 | % of | % | ||||||||||||
| Operating Segment | $ '000 | total | $ '000 | total | change | |||||||||||
| Consolidated revenue: | ||||||||||||||||
| South African transaction processing | 39,749 | 26% | 59,719 | 27% | (33%) | |||||||||||
| International transaction processing | 68,380 | 44% | 77,511 | 35% | (12%) | |||||||||||
| Financial inclusion and applied technologies | 52,131 | 34% | 91,961 | 41% | (43%) | |||||||||||
| Continuing | 52,131 | 34% | 53,466 | 24% | (2%) | |||||||||||
| Discontinued | - | - | 38,495 | 17% | nm | |||||||||||
| Subtotal: Operating segments | 160,260 | 104% | 229,191 | 103% | (30%) | |||||||||||
| Corporate/Eliminations | (5,424 | ) | (4%) | (6,157 | ) | (3%) | (12%) | |||||||||
| Total consolidated revenue | 154,836 | 100% | 223,034 | 100% | (31%) | |||||||||||
| Continuing | 154,836 | 100% | 184,539 | 83% | (16%) | |||||||||||
| Discontinued | - | - | 38,495 | 17% | nm | |||||||||||
| Consolidated operating (loss) income: | nm | |||||||||||||||
| South African transaction processing | (6,366 | ) | 66% | (15,343 | ) | 36% | (59%) | |||||||||
| International transaction processing | 6,601 | (69%) | (1,281 | ) | 3% | nm | ||||||||||
| Financial inclusion and applied technologies | 623 | (6%) | (7,236 | ) | 17% | nm | ||||||||||
| Continuing | 623 | (6%) | (23,497 | ) | 56% | nm | ||||||||||
| Discontinued | - | - | 16,261 | (39%) | nm | |||||||||||
| Subtotal: Operating segments | 858 | (9%) | (23,860 | ) | 56% | nm | ||||||||||
| Corporate/eliminations | (10,446 | ) | 109% | (18,319 | ) | 44% | (43%) | |||||||||
| Continuing | (10,446 | ) | 109% | (13,066 | ) | 32% | (20%) | |||||||||
| Discontinued | - | - | (5,253 | ) | 12% | nm | ||||||||||
| Total consolidated operating (loss) income | (9,588 | ) | 100% | (42,179 | ) | 100% | (77%) | |||||||||
| Continuing | (9,588 | ) | 100% | (53,187 | ) | 126% | (82%) | |||||||||
| Discontinued | - | - | 11,008 | (26%) | nm | |||||||||||
| Table 12 | In South African Rand (US GAAP) | |||||||||||||||
| Six months ended December 31, | ||||||||||||||||
| 2019 | % of | 2018 | % of | % change | ||||||||||||
| Operating Segment | ZAR '000 | total | ZAR '000 | total | ||||||||||||
| Consolidated revenue: | ||||||||||||||||
| South African transaction processing | 572,477 | 26% | 856,239 | 27% | (33%) | |||||||||||
| International transaction processing | 984,829 | 44% | 1,111,337 | 35% | (11%) | |||||||||||
| Financial inclusion and applied technologies | 750,806 | 34% | 1,318,518 | 41% | (43%) | |||||||||||
| Continuing | 750,806 | 34% | 766,584 | 24% | (2%) | |||||||||||
| Discontinued | - | - | 551,934 | 17% | nm | |||||||||||
| Subtotal: Operating segments | 2,308,112 | 104% | 3,286,094 | 103% | (30%) | |||||||||||
| Corporate/Eliminations | (78,118 | ) | (4%) | (88,276 | ) | (3%) | (12%) | |||||||||
| Total consolidated revenue | 2,229,994 | 100% | 3,197,818 | 100% | (30%) | |||||||||||
| Continuing | 2,229,994 | 100% | 2,645,884 | 83% | (16%) | |||||||||||
| Discontinued | - | - | 551,934 | 17% | nm | |||||||||||
| Consolidated operating (loss) income: | nm | |||||||||||||||
| South African transaction processing | (91,685 | ) | 66% | (219,985 | ) | 36% | (58%) | |||||||||
| International transaction processing | 95,070 | (69%) | (18,367 | ) | 3% | nm | ||||||||||
| Financial inclusion and applied technologies | 8,973 | (6%) | (103,748 | ) | 17% | nm | ||||||||||
| Continuing | 8,973 | (6%) | (336,895 | ) | 56% | nm | ||||||||||
| Discontinued | - | - | 233,147 | (39%) | nm | |||||||||||
| Subtotal: Operating segments | 12,358 | (9%) | (342,100 | ) | 56% | nm | ||||||||||
| Corporate/eliminations | (150,446 | ) | 109% | (262,654 | ) | 44% | (43%) | |||||||||
| Continuing | (150,446 | ) | 109% | (187,338 | ) | 32% | (20%) | |||||||||
| Discontinued | - | - | (75,316 | ) | 12% | nm | ||||||||||
| Total consolidated operating (loss) income | (138,088 | ) | 100% | (604,754 | ) | 100% | (77%) | |||||||||
| Continuing | (138,088 | ) | 100% | (762,585 | ) | 126% | (82%) | |||||||||
| Discontinued | - | - | 157,831 | (26%) | nm | |||||||||||
(A) Refer to Note 22 to the unaudited condensed consolidated financial statements for discontinued operations disclosures.
South African transaction processing
The decrease in segment revenue was primarily due to fewer transactions performed at our ATM base and lower fees as a result of fewer EPE and SASSA accounts. Our South African transaction processing operating segment revenue and operating loss have been adversely impacted by the loss of EPE customers as a result of SASSA's auto-migration of accounts to SAPO. The reduction in operating losses in the segment is a reflection of the cost reductions that have occurred over the last 12 months.
Our operating loss margin for the first half of fiscal 2020 and 2019 was (16.0%) and (25.7%), respectively.
International transaction-based activities
Segment revenue was lower during the second quarter of fiscal 2020, primarily due to an ongoing contraction in IPG transactions processed, specifically meaningfully lower crypto-exchange and China processing activity, modestly lower KSNET revenue as a result of the impact of the weaker KRW/ USD exchange rate on reported KSNET revenue. Operating income during the second quarter of fiscal 2020 has improved compared with fiscal 2019 due to improved profitability of KSNET and the impairment loss recorded in fiscal 2019.
Operating income (loss) margin for the first half of fiscal 2020 and 2019 was 9.7% and (1.7%), respectively, due to improving profitability at KSNET. Excluding the goodwill impairment, segment operating income and margin for fiscal 2019 were $5.7 million and 7.4%, respectively.
Financial inclusion and applied technologies
Segment revenue decreased primarily due to lower lending revenue and insurance revenue as a result of fewer customers, and a decrease in inter-segment revenues, partially offset by higher ad hoc terminal and prepaid airtime and value-added services sales. The improved operating income reflects the stabilization of the lending and insurance books, the positive contribution from the ad hoc terminal sales as well as our cost reduction efforts of the last 12 months. Operating income for the first half of fiscal 2019 includes an allowance for doubtful finance loans receivable of $23.4 million (ZAR 335.5 million).
Operating loss margin from continuing operations for the Financial inclusion and applied technologies segment was 1.2% and (43.9%) during the first half of fiscal 2020 and 2019, respectively.
Corporate/Eliminations
Our corporate expenses decreased primarily due to lower acquired intangible asset amortization expense related to intangible assets that were fully amortized during fiscal 2019, partially offset by higher transaction-related expenditures.
Liquidity and Capital Resources
At December 31, 2019, our cash and cash equivalents were $50.7 million and comprised of KRW-denominated balances of KRW 36.2 billion ($31.3 million), ZAR-denominated balances of ZAR 197.0 million ($14.0 million), U.S. dollar-denominated balances of $1.8 million, and other currency deposits, primarily Botswana pula, of $3.6 million, all amounts translated at exchange rates applicable as of December 31, 2019. The increase in our unrestricted cash balances from June 30, 2019, was primarily due to utilization of our short-term borrowings and repayment of a loan outstanding by DNI, which was partially offset by weaker trading activities, capital expenditures, and an additional investment in V2.
We generally invest any surplus cash held by our South African operations in overnight call accounts that we maintain at South African banking institutions, and any surplus cash held by our non-South African companies in U.S. dollar denominated money market accounts. We have invested surplus cash in Korea in KRW-dominated short-term investment accounts at Korean banking institutions.
Historically, we have financed most of our operations, research and development, working capital, and capital expenditures, as well as acquisitions and strategic investments, through internally generated cash and our financing facilities. When considering whether to borrow under our financing facilities, we consider the cost of capital, cost of financing, opportunity cost of utilizing surplus cash and availability of tax efficient structures to moderate financing costs. Recently, we have been required to utilize our short-term financing facilities to fund our daily cash requirements as we adapt to the expiration of the SASSA contract in September 2018 and the transition of our business model. The board is actively managing our liquidity in the light of the significant changes underway in our business and we currently believe that our cash and credit facilities are sufficient to fund our future operations for at least the next four quarters.
Consideration of going concern
Accounting guidance requires our management to assess whether there are conditions or events, considered in the aggregate, that raise substantial doubt about our ability to continue as a going concern within one year after our unaudited condensed consolidated financial statements are issued. Our management has identified certain conditions or events, which, considered in the aggregate, could raise substantial doubt about our ability to continue as a going concern including the risk that we will be unable to:
- deliver all or a substantial part of the financial results forecast in our fiscal 2020 budget;
- retain our existing borrowings and facilities, as described below and in Note 10 of our condensed consolidated financial statements, or obtain additional borrowings and facilities on commercially reasonable terms;
- arrive at a commercial settlement with SASSA, given the September 30, 2019, Supreme Court ruling regarding the repayment of the additional implementation costs received to SASSA (refer Note 11 of our condensed consolidated financial statements) and the ongoing dispute we have with SASSA over fees due for the six-month contract extension period in accordance with National Treasury's recommendation;
- dispose of all or a portion of our remaining 30% interest in DNI. DNI's operations are also significantly dependent on Cell C because it is the largest distributor of Cell C starter packs in South Africa. Therefore, the inability of Cell C to continue to operate through the next 12 months could also have an adverse impact on DNI's operations; or
- dispose of additional investments in order to realize sufficient cash flows.
Our management has implemented a number of plans to alleviate the substantial doubt about our ability to continue as a going concern. These plans include disposing of our Korean business unit, KSNET, as announced in our press release of January 27, 2020, certain non-core assets (refer to Note 3 of our audited consolidated financial statements included in our Annual Report on Form 10-K for the year ended June 30, 2019, for additional information regarding a call option granted to DNI), and extending our existing borrowings used to fund our ATMs through September 2020. Provided the KSNET disposal closes, as expected, in March 2020, this is expected to remove the substantial doubt about our ability to continue as a going concern.
In addition, our management believes there are a number of mitigating actions it can pursue, including (i) limiting the expansion of our microlending finance loans receivable book in South Africa; (ii) implementing further cost cutting measures; (iii) commencing additional asset realizations; (iv) managing our capital expenditures; and (v) accessing alternative sources of capital (including through the issuance of additional shares of our common stock), in order to generate additional liquidity. Our management believes that these plans and mitigating actions alleviate the substantial doubt referred to above and, therefore, has concluded that we remain a going concern.
Available short-term borrowings
We have a short-term South African credit facility with Nedbank of up to ZAR 450.0 million ($32.0 million), which is comprised of an overdraft facility of (i) up to ZAR 300.0 million ($21.4 million), which is further split into (a) a ZAR 250.0 million ($17.8 million) overdraft facility which may only be used to fund mobile ATMs and (b) a ZAR 50.0 million ($3.6 million) general banking facility and (ii) indirect and derivative facilities of up to ZAR 150.0 million ($10.7 million), which include letters of guarantee, letters of credit and forward exchange contracts. The ZAR 250.0 million component of the primary amount may only be used to fund ATMs and therefore this component of the primary amount utilized and converted to cash to fund our ATMs is considered restricted cash. As of December 31, 2019, the interest rate on the overdraft facility was 8.85%, and reduced to 8.60% on January 17, 2020, following a reduction in the South African repo rate. As of December 31, 2019, we had utilized approximately ZAR 164.3 million ($11.7 million) of our ZAR 250.0 million overdraft facility to fund ATMs, and none of our ZAR 50.0 million general banking facility. As of December 31, 2019, we had utilized approximately ZAR 93.6 million ($6.7 million) of the indirect and derivative facilities to support guarantees issued by Nedbank to various third parties on our behalf.
We also have a short-term South African credit facility with RMB of ZAR 1.2 billion ($85.4 million) which may only be used to fund our fixed ATMs in South Africa. As of December 31, 2019, the interest rate on the facility was 10.00% (South African prime) and reduced to 9.75% on January 17, 2020, following a reduction in the South African repo rate. As of December 31, 2019, we had utilized approximately ZAR 1.0 billion ($72.7 million) of this facility.
We have a short-term U.S. dollar-denominated overdraft facility with Bank Frick of $20.0 million. As of December 31, 2019, we had utilized approximately $13.9 million of this facility. The interest rate on the facility is 4.50% plus 3-month US dollar LIBOR and interest is payable on a quarterly basis. The 3-month US dollar LIBOR rate was 1.91% on December 31, 2019. The facility has no fixed term, however, it may be terminated by either party with six weeks written notice.
We also have a one-year KRW 10.0 billion ($8.7 million) short-term overdraft facility from Hana Bank, a South Korean bank. The interest rate on the facilities is 1.98% plus the 3-month CD rate. The 3-month CD rate as of December 31, 2019 was 1.53%. The facility expires in January 2021, however can be renewed. The facility is unsecured with no fixed repayment terms. As of December 31, 2019, we had not utilized this facility.
Available long-term borrowings
On September 4, 2019, we further amended our amended July 2017 Facilities agreement with RMB and Nedbank to include an overdraft facility ("Facility F") of up to ZAR 300.0 million ($21.4 million, translated at exchange rates applicable as of December 31, 2019) for the sole purpose of funding the acquisition of airtime from Cell C. We may not dispose of the airtime acquired from Cell C prior to April 1, 2020, without the prior consent of RMB, Absa Bank Limited and Investec Asset Management Proprietary Limited. Facility F comprises (i) a first Senior Facility F loan of ZAR 220.0 million (ii) a second Senior Facility F loan of ZAR 80.0 million, or such lesser amount as may be agreed by the facility agent. Facility F is required to be repaid in full within nine months following the first utilization of the facility. We are required to prepay Facility F and any outstanding interest subject to customary prepayment terms. In December 2019, we disposed of our entire shareholding in FIHRST and used the proceeds from the disposal to prepay interest and principal outstanding on Facility F. Outstanding interest on Facility F is payable upon maturity of the facility and is calculated based on JIBAR plus a margin of 5.50% per annum. JIBAR was 6.80% on December 31, 2019. The margin on the Facility F increased by 1% on November 1, 2019, because we had not disposed of our remaining shareholding in DNI and FIHRST by that date.
Restricted cash
We have credit facilities with RMB and Nedbank in order to access cash to fund our ATMs in South Africa. Our cash, cash equivalents and restricted cash presented in our unaudited condensed consolidated statement of cash flows as of December 31, 2019, includes restricted cash of approximately $84.4 million related to cash withdrawn from our various debt facilities to fund ATMs. This cash may only be used to fund ATMs and is considered restricted as to use and therefore is classified as restricted cash on our audited consolidated balance sheet.
Cash flows from operating activities
Second quarter
Net cash provided by operating activities during the second quarter of fiscal 2020 was $4.4 million (ZAR 64.5 million) compared to $(5.2) million (ZAR (75.0) million) of net cash used in operating activities during the second quarter of fiscal 2019. The increase in cash provided is primarily due to the repayment of finance loans receivable at the end of December 2019. These finance loans receivable are typically settled at the beginning of the new month (in this case January 2020) but were settled in December 2019, due to the opening of the January 2020 grant distribution file in December 2019.
During the second quarter of fiscal 2020, we paid South African tax of $0.7 million (ZAR 10.7 million) related to our 2020 tax year. We also paid taxes totaling $1.3 million in other tax jurisdictions, primarily South Korea. During the second quarter of fiscal 2019, we paid South African tax of $6.2 million (ZAR 89.1 million) related to our 2019 tax year. We also paid taxes totaling $2.6 million in other tax jurisdictions, primarily South Korea.
Taxes paid during the second quarter of fiscal 2020 and 2019 were as follows:
| Table 13 | Three months ended December 31, | |||||||||||
| 2019 | 2018 | 2019 | 2018 | |||||||||
| $ | $ | ZAR | ZAR | |||||||||
| '000 | '000 | '000 | '000 | |||||||||
| First provisional payments | 740 | 6,245 | 10,657 | 89,144 | ||||||||
| Tax refund received | - | (34 | ) | - | (475 | ) | ||||||
| Total South African taxes paid | 740 | 6,211 | 10,657 | 88,669 | ||||||||
| Foreign taxes paid: Korea | 1,264 | 2,568 | 18,205 | 36,624 | ||||||||
| Total tax paid | 2,004 | 8,779 | 28,862 | 125,293 | ||||||||
First half
Net cash used in operating activities during the first half of fiscal 2020 was $(13.9) million (ZAR (200.5) million) compared to $11.2 million (ZAR 160.9 million) provided by operating activities during the first half of fiscal 2019. The change is primarily due to weaker trading activity during fiscal 2020 compared to 2019, as well as the purchase of $12.3 million of Cell C prepaid airtime that is subject to sale restrictions utilizing our borrowings (refer below under financial activities and to Note 4 to our unaudited condensed consolidated financial statements), partially offset by the repayment of finance loans receivable at the end of December 2019.
During the first half of fiscal 2020, we paid South African tax of $0.7 million (ZAR 10.7 million) related to our 2020 tax year and $0.8 million (ZAR 11.6 million) related to our 2019 tax year. We also paid taxes totaling $2.4 million in other tax jurisdictions, primarily South Korea. During the first half of fiscal 2019, we paid South African tax of $6.2 million (ZAR 89.1 million) related to our 2019 tax year. During the first half of fiscal 2019, we made an additional tax payment of $1.4 million (ZAR 20.5 million) related to our 2018 tax year in South Africa. We also paid taxes totaling $2.6 million in other tax jurisdictions, primarily South Korea.
Taxes paid during the year to date fiscal 2020 and 2019 were as follows:
| Table 14 | Six months ended December 31, | |||||||||||
| 2019 | 2018 | 2019 | 2018 | |||||||||
| $ | $ | ZAR | ZAR | |||||||||
| '000 | '000 | '000 | '000 | |||||||||
| First provisional payments | 740 | 6,245 | 10,657 | 89,144 | ||||||||
| Taxation paid related to prior years | 782 | 1,399 | 11,620 | 20,488 | ||||||||
| Tax refund received | (28 | ) | (96 | ) | (392 | ) | (1,377 | ) | ||||
| Total South African taxes paid | 1,494 | 7,548 | 21,885 | 108,255 | ||||||||
| Foreign taxes paid: Korea | 2,393 | 2,574 | 34,112 | 36,712 | ||||||||
| Total tax paid | 3,887 | 10,122 | 55,997 | 144,967 | ||||||||
Second quarter
Cash used in investing activities for the second quarter of fiscal 2020 included capital expenditures of $0.8 million (ZAR 12.1 million), primarily due to the acquisition of processing equipment in South Korea to maintain operations. During the second quarter of fiscal 2020, we received $10.9 million from the sale of FIHRST. We also extended loan funding of $0.6 million to Revix.
Cash used in investing activities for the second quarter of fiscal 2019 included capital expenditures of $2.5 million (ZAR 36.5 million), primarily due to the acquisition of ATMs in South Africa and the expansion of our branch network. We also paid $2.5 million for a 50% interest in V2 Limited, acquired customer bases in DNI for $1.4 million, and made a further equity contribution of $1.1 million to MobiKwik.
First half
Cash used in investing activities for the first half of fiscal 2020 included capital expenditures of $3.5 million (ZAR 49.7 million), primarily due to the acquisition of ATMs in South Africa and processing equipment in South Korea to maintain operations. During the first half of fiscal 2020, we received $10.9 million from the sale of FIHRST. We also made a further equity contribution of $1.3 million to V2, extended loan funding of $0.6 million to Revix, and received $4.3 million from DNI related to the settlement of a ZAR 60.0 million loan outstanding.
Cash used in investing activities for the first half of fiscal 2019 included capital expenditures of $5.7 million (ZAR 81.2 million), primarily due to the acquisition of ATMs in South Africa and the expansion of our branch network. We also paid $2.5 million for a 50% interest in V2 Limited, acquired customer bases in DNI for $1.4 million, and made a further equity contribution of $1.1 million to MobiKwik.
Cash flows from financing activities
Second quarter
During the second quarter of fiscal 2020, we utilized approximately $200.7 million from our South African overdraft facilities, primarily to fund our ATMs, and repaid $193.8 million of these facilities. We prepaid approximately $11.3 million of Facility F utilizing the proceeds received from the disposal of FIHRST. We also utilized $7.2 million of our Bank Frick overdraft to fund our operations.
During the second quarter of fiscal 2019, we utilized approximately $221.6 million from our overdraft facilities, primarily to fund our ATMs, and repaid $245.7 million of these facilities, including amounts utilized in September 2018. We also utilized approximately $3.2 million of DNI's revolving credit facility to lend funds to Cell C to finance the acquisition and/or requisition of telecommunication towers and other specific uses pre-approved by the lender. We also made a scheduled South African debt facility payment of $10.6 million and paid a non-refundable origination fee of approximately $0.2 million related to DNI's revolving credit facility.
First half
During the first half of fiscal 2020, we utilized approximately $383.2 million from our South African overdraft facilities, primarily to fund our ATMs, and repaid $374.6 million of these facilities. We utilized approximately $14.8 million of our borrowings to fund the purchase of Cell C prepaid airtime that is subject to sale restrictions. We prepaid approximately $11.3 million of these borrowings (Facility F) utilizing the proceeds received from the disposal of FIHRST. We also repaid $4.0 million of our Bank Frick overdraft and utilized $8.4 million of this overdraft to fund our operations.
During the first half of fiscal 2019, we utilized approximately $306.2 million from our overdraft facilities, primarily to fund our ATMs, and repaid $245.7 million of these facilities. We also utilized approximately $11.0 million of DNI's revolving credit facility to lend funds to Cell C to finance the acquisition and/or requisition of telecommunication towers and other specific uses pre-approved by the lender. We also made a scheduled South African debt facility payment of $20.9 million, repaid $2.8 million under DNI's revolving credit facility and paid non-refundable origination fees of approximately $0.4 million related to the credit facilities.
Off-Balance Sheet Arrangements
We have no off-balance sheet arrangements.
Capital Expenditures
We expect capital spending for the third quarter of fiscal 2020 to primarily include limited investments into our ATM infrastructure and branch network in South Africa.
Our capital expenditures for the second quarter of fiscal 2020 and 2019 are discussed under "-Liquidity and Capital Resources-Cash flows from investing activities." All of our capital expenditures for the past three fiscal years were funded through internally generated funds. We had outstanding capital commitments as of December 31, 2019, of $0.1 million related mainly to the procurement of ATMs. We expect to fund these expenditures through internally generated funds and available facilities.
Item 3. Quantitative and Qualitative Disclosures About Market Risk
In addition to the tables below, see Note 7 to the unaudited condensed consolidated financial statements for a discussion of market risk.
We have short-term borrowings which attract interest at rates that fluctuate based on changes in benchmark interest rates such as the South Africa prime interest rate, JIBAR and LIBOR. The following table illustrates the effect on our annual expected interest charge, translated at exchange rates applicable as of December 31, 2019, as a result of changes in (i) the South African prime interest rate, assuming hypothetical short-term borrowings of ZAR 1.0 billion as of December 31, 2019, and (ii) JIBAR, using our December 31, 2019, borrowings of ZAR 57.1 million. The effect of a hypothetical 1% (i.e. 100 basis points) increase and a 1% decrease in the South African prime interest rate and JIBAR rate as of December 31, 2019, are shown. The selected 1% hypothetical change does not reflect what could be considered the best or worst case scenarios.
| Table 15 | As of December 31, 2019 | ||||||||
| Annual expected interest charge ($ '000) |
Hypothetical change in interest rates | Estimated annual expected interest charge after hypothetical change in interest rates ($ '000) |
|||||||
| Interest on South Africa overdraft (South African prime interest rate) | 7,118 | 1% | 7,830 | ||||||
| (1%) | 6,406 | ||||||||
| Interest on South Africa borrowings (JIBAR) | 500 | 1% | 540 | ||||||
| (1%) | 459 | ||||||||
Item 4. Controls and Procedures
Under the supervision and with the participation of our management, including our chief executive officer and our chief financial officer, we conducted an evaluation of our disclosure controls and procedures, as such term is defined under Rule 13a-15(e) promulgated under the Securities Exchange Act of 1934, as amended (the "Exchange Act"), as of December 31, 2019. Management recognizes that any controls and procedures, no matter how well designed and operated, can provide only reasonable assurance of achieving their objectives and management necessarily applies its judgment in evaluating the cost-benefit relationship of possible controls and procedures. Based on this evaluation, and in light of the insufficient time to assess the effectiveness of the procedures we adopted to remediate the material weakness discussed in our Annual Report on Form 10-K for our fiscal year ended June 30, 2019, our chief executive officer and the chief financial officer concluded that our disclosure controls and procedures were not effective as of December 31, 2019.
Changes in Internal Control over Financial Reporting
There were no changes in our internal control over financial reporting during the most recent fiscal quarter ended December 31, 2019, that have materially affected, or are reasonably likely to materially affect, our internal control over financial reporting. We continue to monitor the effectiveness of our internal control over financial reporting in the areas affected by the material weakness described in our Annual Report on Form 10-K for our fiscal year ended June 30, 2019, and we have and will continue to perform additional procedures, including the use of manual mitigating control procedures and employing any additional tools and resources deemed necessary, to ensure that our consolidated financial statements are fairly stated in all material respects.
Part II. Other Information
Item 1. Legal Proceedings
December 5, 2019, securities class action complaint
On December 5, 2019, a putative securities class action complaint was filed in the United States District Court for the Southern District of New York against our company, Herman G. Kotzé and Alex M.R. Smith. The complaint seeks damages based on alleged material misrepresentations and omissions concerning our internal controls over financial reporting, classification of an investment in Cell C Proprietary Limited, and our company's consolidated financial statements for fiscal 2018. The complaint asserts claims for violations of Sections 10(b) of the Exchange Act and Rule 10b-5, and Section 20(a) of the Exchange Act. The proposed class period is September 12, 2018, through November 8, 2018, inclusive. None of the defendants have been served.
Item 1A. Risk Factors
See "Item 1A RISK FACTORS" in Part I of our Annual Report on Form 10-K for the fiscal year ended June 30, 2019, for a discussion of risk factors relating to (i) our business, (ii) operating in South Africa and other foreign markets, (iii) government regulation, and (iv) our common stock. Except as set forth below, there have been no material changes from the risk factors previously disclosed in our Annual Report on Form 10-K for the fiscal year ended June 30, 2019.
We may be unable to recover the carrying value of certain Cell C airtime that we own which is subject to resale restrictions.
In September 2019, we acquired a substantial amount of Cell C airtime inventory ($13.7 million translated at exchange rates applicable as of December 31, 2019). The terms of our South African borrowings, as amended, provide that we may not sell this inventory until after March 31, 2020, and then only with the consent of certain South African banks, which also own Cell C inventory. We may be unable to recover the carrying value of this airtime inventory as a result of the business failure of Cell C or if the South African banks that are required to approve the sale of our Cell C restricted airtime fail to approve the sale for any reason. Failure to recover the carrying value of this inventory may have a material adverse effect on our results of operations or financial condition.
Item 5. Other Information
Subsequent to the issuance of our Form 10-K for the year ended June 30, 2019 and our Form 10-Qs for the three months ended September 30, 2019 and the three and nine months ended March 31, 2019, we determined that our presentation of the discontinued operations of DNI-4PL Contracts Proprietary Limited, or DNI, in the condensed consolidated statements of operations included in those filings was incorrect. In these previous filings, the gross amounts of DNI's operations upon classification as a discontinued operation remained in the condensed consolidated statements of operations which totalled to net (loss) income. Two captioned lines below net (loss) income were presented to show the composition of the net (loss) income between continuing and discontinued operations and the details of amounts relating to DNI's discontinued operations were separately disclosed in a note. The correct presentation removes the gross amounts of a discontinued operation from the condensed consolidated statements of operations, which totals to the net (loss) income from continuing operations before presenting net income from discontinued operations and then totalling to net (loss) income.
We will revise the above referenced previous presentations on the condensed consolidated statements of operations to correct them in future filings the next time these amounts are presented as comparative prior period amounts. The impact of these revisions will reduce each of the previously presented line items in the condensed consolidated statements of operations preceding net income by the amounts shown in the note disclosure for DNI's discontinued operations. The revisions will have no effect on previously presented net (loss) income, net (loss) income for continuing operations, net income from discontinued operations or the note disclosures for DNI's discontinued operations.
We
further considered the impact on our control environment and note that the
control designed to detect and prevent the misstatement was considered to be
ineffective and remains unremediated. A material weakness was reported at
June 30, 2019. Refer to Item 4-"Controls and Procedures" for further
information.
Item 6. Exhibits
The following exhibits are filed as part of this Form 10-Q:
|
|
|
|
|
Incorporated by Reference Herein |
||
|
Exhibit No. |
|
Description of Exhibit |
Included Herewith |
Form |
Exhibit |
Filing Date |
|
|
|
|
|
|
|
|
|
|
Certification of Principal Executive Officer pursuant to Rule 13a-14(a) under the Exchange Act |
|
|
|
||
|
|
Certification of Principal Financial Officer pursuant to Rule 13a-14(a) under the Exchange Act |
|
|
|
||
|
|
|
|
|
|||
|
|
|
|
|
|||
|
|
|
|
|
|||
|
|
|
|
|
|||
|
|
|
|
|
|||
|
|
|
|
|
|||
|
|
|
|
|
|||
SIGNATURES
Pursuant to the requirements of the Securities Exchange Act of 1934, the registrant has caused this report to be signed on its behalf by the undersigned, thereunto duly authorized, on February 10, 2020.
NET 1 UEPS TECHNOLOGIES, INC.
By: /s/ Herman G. Kotzé
Herman G. Kotzé
Chief Executive Officer
By: /s/ Alex M.R. Smith
Alex M.R. Smith
Chief Financial Officer, Treasurer and Secretary