Attached files
| file | filename |
|---|---|
| EX-32.1 - EXHIBIT 32.1 - NET 1 UEPS TECHNOLOGIES INC | exhibit32-1.htm |
| EX-31.2 - EXHIBIT 31.2 - NET 1 UEPS TECHNOLOGIES INC | exhibit31-2.htm |
| EX-31.1 - EXHIBIT 31.1 - NET 1 UEPS TECHNOLOGIES INC | exhibit31-1.htm |
UNITED STATES
SECURITIES AND EXCHANGE COMMISSION
Washington, D.C. 20549
FORM 10-Q
(Mark One)
[X] QUARTERLY REPORT PURSUANT TO SECTION 13 OR 15(d) OF THE SECURITIES EXCHANGE ACT OF 1934
For the quarterly period ended September 30, 2018 OR
[ ] TRANSITION REPORT PURSUANT TO SECTION 13 OR 15(d) OF THE SECURITIES AND EXCHANGE ACT OF 1934
For the transition period from ______________ To ______________
Commission file number: 000-31203
NET 1 UEPS TECHNOLOGIES,
INC.
(Exact name of registrant as specified in its
charter)
| Florida | 98-0171860 |
| (State or other jurisdiction | (IRS Employer |
| of incorporation or organization) | Identification No.) |
President Place, 4th Floor, Cnr.
Jan Smuts Avenue and Bolton Road
Rosebank, Johannesburg 2196,
South Africa
(Address of principal executive offices,
including zip code)
Registrant’s telephone number, including area code: 27-11-343-2000
Not Applicable
(Former Name, Former
Address and Former Fiscal Year, if Changed Since Last Report)
Indicate by check mark whether the registrant (1) has filed all
reports required to be filed by Section 13 or 15(d) of the Securities Exchange
Act of 1934 during the preceding 12 months (or for such shorter period that the
registrant was required to file such reports), and (2) has been subject to such
filing requirements for the past 90 days.
YES [X] NO [ ]
Indicate by check mark whether the registrant has submitted
electronically every Interactive Data File required to be submitted pursuant to
Rule 405 of Regulation S-T (§232.405 of this chapter) during the preceding 12
months (or for such shorter period that the registrant was required to submit
such files).
YES [X] NO [ ]
Indicate by check mark whether the registrant is a large accelerated filer, an accelerated filer, a non-accelerated filer, smaller reporting company or an emerging growth company. See the definitions of “large accelerated filer,” “accelerated filer,” “smaller reporting company,” and “emerging growth company” in Rule 12b-2 of the Exchange Act (check one):
| [ ] | Large accelerated filer | [X] | Accelerated filer |
| [ ] | Non-accelerated filer | [ ] | Smaller reporting company |
| [ ] | Emerging growth company |
If an emerging growth company, indicate by check mark if the registrant has elected not to use the extended transition period for complying with any new or revised financial accounting standards provided pursuant to Section 13(a) of the Exchange Act. [ ]
Indicate by check mark whether the registrant is a shell
company (as defined in Rule 12b-2 of the Exchange Act).
YES [ ] NO [X ]
As of November 9, 2018 (the latest practicable date), 56,833,925 shares of the registrant’s common stock, par value $0.001 per share, net of treasury shares, were outstanding.
Form 10-Q
NET 1 UEPS TECHNOLOGIES, INC.
Table of Contents
1
Part I. Financial Information
Item 1. Financial Statements
NET 1 UEPS TECHNOLOGIES, INC.
Unaudited Condensed
Consolidated Balance Sheets
| Unaudited | As restated(A) | |||||
| September 30, | June 30, | |||||
| 2018 | 2018 | |||||
| (In thousands, except share data) | ||||||
| ASSETS | ||||||
| CURRENT ASSETS | ||||||
| Cash and cash equivalents | $ | 98,555 | $ | 90,054 | ||
| Restricted cash (Note 10) | 84,778 | - | ||||
| Pre-funded social welfare grants receivable (Note 2) | - | 2,965 | ||||
| Accounts receivable, net (Note 3) | 113,924 | 109,683 | ||||
| Finance loans receivable, net (Note 3) | 50,811 | 62,205 | ||||
| Inventory (Note 4) | 10,369 | 12,887 | ||||
| Total current assets before settlement assets | 358,437 | 277,794 | ||||
| Settlement assets (Note 5) | 68,566 | 149,047 | ||||
| Total current assets | 427,003 | 426,841 | ||||
| PROPERTY, PLANT AND EQUIPMENT, net of accumulated depreciation of – September: $130,655; June: $129,185 | 25,222 | 27,054 | ||||
| EQUITY-ACCOUNTED INVESTMENTS (Note 7) | 94,241 | 88,331 | ||||
| GOODWILL (Note 8) | 279,158 | 283,240 | ||||
| INTANGIBLE ASSETS, net (Note 8) | 121,824 | 131,132 | ||||
| DEFERRED INCOME TAXES | 8,007 | 6,312 | ||||
| OTHER LONG-TERM ASSETS, including reinsurance assets (Note 7 and Note 9) | 245,150 | 256,380 | ||||
| TOTAL ASSETS | 1,200,605 | 1,219,290 | ||||
| LIABILITIES | ||||||
| CURRENT LIABILITIES | ||||||
| Short-term credit facilities for ATM funding (Note 10) | 84,778 | - | ||||
| Short-term credit facilities (Note 10) | 3,313 | - | ||||
| Accounts payable | 23,134 | 35,055 | ||||
| Other payables | 82,292 | 47,994 | ||||
| Current portion of long-term borrowings (Note 10) | 33,937 | 44,695 | ||||
| Income taxes payable | 13,898 | 5,742 | ||||
| Total current liabilities before settlement obligations | 241,352 | 133,486 | ||||
| Settlement obligations (Note 5) | 68,566 | 149,047 | ||||
| Total current liabilities | 309,918 | 282,533 | ||||
| DEFERRED INCOME TAXES | 43,567 | 46,606 | ||||
| LONG-TERM BORROWINGS (Note 10) | 11,660 | 5,469 | ||||
| OTHER LONG-TERM LIABILITIES, including insurance policy liabilities (Note 9) | 3,419 | 38,580 | ||||
| TOTAL LIABILITIES | 368,564 | 373,188 | ||||
| COMMITMENTS AND CONTINGENCIES (Note 19) | ||||||
| REDEEMABLE COMMON STOCK | 107,672 | 107,672 | ||||
| EQUITY | ||||||
| COMMON STOCK (Note 11) | ||||||
| Authorized: 200,000,000 with
$0.001 par value; Issued and outstanding shares, net of treasury - September: 56,833,925; June: 56,685,925 |
80 | 80 | ||||
| PREFERRED STOCK | ||||||
| Authorized shares: 50,000,000
with $0.001 par value; Issued and outstanding shares, net of treasury: September: -; June: - |
- | - | ||||
| ADDITIONAL PAID-IN-CAPITAL | 276,865 | 276,201 | ||||
| TREASURY SHARES, AT COST: September: 24,891,292; June: 24,891,292 | (286,951 | ) | (286,951 | ) | ||
| ACCUMULATED OTHER COMPREHENSIVE LOSS (Note 1 and 12) | (189,528 | ) | (184,436 | ) | ||
| RETAINED EARNINGS (Note 1) | 832,426 | 837,625 | ||||
| TOTAL NET1 EQUITY | 632,892 | 642,519 | ||||
| NON-CONTROLLING INTEREST | 91,477 | 95,911 | ||||
| TOTAL EQUITY | 724,369 | 738,430 | ||||
| TOTAL
LIABILITIES, REDEEMABLE COMMON STOCK
AND SHAREHOLDERS’ EQUITY |
$ | 1,200,605 | $ | 1,219,290 | ||
(A) – Certain amounts shown here do not correspond to the Company’s 2018 financial statements and reflects an adjustment made, refer to Note 1 See Notes to Unaudited Condensed Consolidated Financial Statements
2
NET 1 UEPS TECHNOLOGIES, INC.
Unaudited Condensed
Consolidated Statements of Operations
| Three months ended | ||||||
| September 30, | ||||||
| 2018 | 2017 | |||||
| (In thousands, except per share | ||||||
| data) | ||||||
| REVENUE | $ | 125,884 | $ | 152,558 | ||
| EXPENSE | ||||||
| Cost of goods sold, IT processing, servicing and support | 72,316 | 74,652 | ||||
| Selling, general and administration | 41,878 | 43,934 | ||||
| Depreciation and amortization | 10,794 | 8,966 | ||||
| OPERATING INCOME | 896 | 25,006 | ||||
| INTEREST INCOME | 1,876 | 5,044 | ||||
| INTEREST EXPENSE | 2,759 | 2,121 | ||||
| INCOME BEFORE INCOME TAX EXPENSE | 13 | 27,929 | ||||
| INCOME TAX EXPENSE (Note 18) | 6,490 | 10,277 | ||||
| NET (LOSS) INCOME BEFORE EARNINGS FROM EQUITY-ACCOUNTED INVESTMENTS | (6,477 | ) | 17,652 | |||
| EARNINGS FROM EQUITY-ACCOUNTED INVESTMENTS | 1,373 | 2,075 | ||||
| NET (LOSS) INCOME | (5,104 | ) | 19,727 | |||
| NET INCOME ATTRIBUTABLE TO NON-CONTROLLING INTEREST | 95 | 244 | ||||
| NET (LOSS) INCOME ATTRIBUTABLE TO NET1 | $ | (5,199 | ) | $ | 19,483 | |
| Net (loss) income per share, in U.S. dollars (Note 14) | ||||||
| Basic (loss) earnings attributable to Net1 shareholders | $(0.09 | ) | $ | 0.34 | ||
| Diluted (loss) earnings attributable to Net1 shareholders | $(0.09 | ) | $ | 0.34 | ||
See Notes to Unaudited Condensed Consolidated Financial Statements
3
NET 1 UEPS TECHNOLOGIES, INC.
Unaudited Condensed
Consolidated Statements of Comprehensive Income
| Three months ended | ||||||
| September 30, | ||||||
| 2018 | 2017 | |||||
| (In thousands) | ||||||
| Net (loss) income | $ | (5,104 | ) | $ | 19,727 | |
| Other comprehensive (loss) income | ||||||
| Movement in foreign currency translation reserve | (13,322 | ) | (13,880 | ) | ||
| Movement in foreign currency translation reserve related to equity-accounted investments | 5,430 | (227 | ) | |||
| Total other comprehensive (loss) income, net of taxes | (7,892 | ) | (14,107 | ) | ||
| Comprehensive (loss) income | (12,996 | ) | 5,620 | |||
| Add (Less) comprehensive loss (income) attributable to non-controlling interest | 2,705 | (133 | ) | |||
| Comprehensive (loss) income attributable to Net1 | $ | (10,291 | ) | $ | 5,487 | |
See Notes to Unaudited Condensed Consolidated Financial Statements
4
NET 1 UEPS TECHNOLOGIES,
INC.
Unaudited Condensed
Consolidated Statement of Changes in
Equity for the three months ended September 30, 2017
(dollar amounts in thousands)
| Net 1 UEPS Technologies, Inc. Shareholders | ||||||||||||||||||||||||||||||||||||
| Number | Accumulated | |||||||||||||||||||||||||||||||||||
| Number | of | Number of | Additional | Other | Total | Non- | Redeemable | |||||||||||||||||||||||||||||
| of | Treasury | Treasury | Shares, Net | Paid-In | Retained | Comprehensive | Net1 | Controlling | Common | |||||||||||||||||||||||||||
| Shares | Amount | Shares | Shares | of Treasury | Capital | Earnings | (Loss) Income | Equity | Interest | Total | Stock | |||||||||||||||||||||||||
| Balance – July 1, 2017 | 81,261,029 | $ | 80 | (24,891,292 | ) | $ | (286,951 | ) | 56,369,737 | $ | 273,733 | $ | 773,276 | $ | (162,569 | ) | $ | 597,569 | $ | 2,766 | $ | 600,335 | $ | 107,672 | ||||||||||||
| Restricted stock granted (Note 13) | 588,594 | 588,594 | - | - | ||||||||||||||||||||||||||||||||
| Stock-based compensation charge (Note 13) | 869 | 869 | 869 | |||||||||||||||||||||||||||||||||
| Reversal of stock compensation charge (Note 13) | (30,635 | ) | (30,635 | ) | (42 | ) | (42 | ) | (42 | ) | ||||||||||||||||||||||||||
| Reversal of stock based- compensation charge related to equity-accounted investment | (207 | ) | (207 | ) | (207 | ) | ||||||||||||||||||||||||||||||
| Net income | 19,483 | 19,483 | 244 | 19,727 | ||||||||||||||||||||||||||||||||
| Other comprehensive income | (13,996 | ) | (13,996 | ) | (111 | ) | (14,107 | ) | ||||||||||||||||||||||||||||
| Balance – September 30, 2017 | 81,818,988 | $ | 80 | (24,891,292 | ) | $ | (286,951 | ) | 56,927,696 | $ | 274,353 | $ | 792,759 | $ | (176,565 | ) | $ | 603,676 | $ | 2,899 | $ | 606,575 | $ | 107,672 | ||||||||||||
See Notes to Unaudited Condensed Consolidated Financial Statements
5
NET 1 UEPS TECHNOLOGIES, INC.
Unaudited Condensed Consolidated
Statement of Changes in Equity for the three
months ended September 30, 2018 (dollar
amounts in thousands)
| Net 1 UEPS Technologies, Inc. Shareholders | ||||||||||||||||||||||||||||||||||||
| Number | Accumulated | |||||||||||||||||||||||||||||||||||
| Number | of | Number of | Additional | Other | Total | Non- | Redeemabl | |||||||||||||||||||||||||||||
| of | Treasury | Treasury | Shares, Net | Paid-In | Retained | Comprehensive | Net1 | Controlling | Common | |||||||||||||||||||||||||||
| Shares | Amount | Shares | Shares | of Treasury | Capital | Earnings | (Loss) Income | Equity | Interest | Total | Stock | |||||||||||||||||||||||||
| Balance – July 1, 2018 | 81,577,217 | $ | 80 | (24,891,292 | ) | $ | (286,951 | ) | 56,685,925 | $ | 276,201 | $ | 812,426 | $ | (159,237 | ) | $ | 642,519 | $ | 95,911 | $ | 738,430 | $ | 107,672 | ||||||||||||
| Correction of error (Note 1) | 25,199 | (25,199 | ) | - | - | |||||||||||||||||||||||||||||||
| Balance – July 1, 2018 as restated | 81,577,217 | $ | 80 | (24,891,292 | ) | $ | (286,951 | ) | 56,685,925 | $ | 276,201 | $ | 837,625 | $ | (184,436 | ) | $ | 642,519 | $ | 95,911 | $ | 738,430 | $ | 107,672 | ||||||||||||
| Restricted stock granted (Note 13) | 148,000 | 148,000 | - | - | ||||||||||||||||||||||||||||||||
| Stock-based compensation charge (Note 13) | 587 | 587 | 587 | |||||||||||||||||||||||||||||||||
| Stock-based compensation charge related to equity-accounted investment (Note 7) | 77 | 77 | 77 | |||||||||||||||||||||||||||||||||
| Dividends paid to non-controlling interest | (1,729 | ) | (1,729 | ) | ||||||||||||||||||||||||||||||||
| Net (loss) income | (5,199 | ) | (5,199 | ) | 95 | (5,104 | ) | |||||||||||||||||||||||||||||
| Other comprehensive loss income (Note 12) | (5,092 | ) | (5,092 | ) | (2,800 | ) | (7,892 | ) | ||||||||||||||||||||||||||||
| Balance – September 30, 2018 | 81,725,217 | $ | 80 | (24,891,292 | ) | $ | (286,951 | ) | 56,833,925 | $ | 276,865 | $ | 832,426 | $ | (189,528 | ) | $ | 632,892 | $ | 91,477 | $ | 724,369 | $ | 107,672 | ||||||||||||
See Notes to Unaudited Condensed Consolidated Financial Statements
6
NET 1 UEPS TECHNOLOGIES, INC.
Unaudited Condensed
Consolidated Statements of Cash Flows
| Three months ended | ||||||
| September 30, | ||||||
| 2018 | 2017 | |||||
| (In thousands) | ||||||
| Cash flows from operating activities | ||||||
| Net (loss) income | $ | (5,104 | ) | $ | 19,727 | |
| Depreciation and amortization | 10,794 | 8,966 | ||||
| Earnings from equity-accounted investments | (1,373 | ) | (2,075 | ) | ||
| Interest on Cedar Cell note (Note 7) | (156 | ) | - | |||
| Fair value adjustments and re-measurements | (82 | ) | 91 | |||
| Interest payable | 110 | (88 | ) | |||
| Facility fee amortized | 87 | 133 | ||||
| (Profit) Loss on disposal of property, plant and equipment | (127 | ) | 105 | |||
| Stock-based compensation charge, net (Note 13) | 587 | 827 | ||||
| Dividends received from equity accounted investments | - | 912 | ||||
| Decrease (Increase) in accounts receivable, pre-funded social welfare grants receivable and finance loans receivable | 14,296 | (39,141 | ) | |||
| Decrease (Increase) in inventory | 2,185 | (1,526 | ) | |||
| (Decrease) Increase in accounts payable and other payables | (9,480 | ) | 3,429 | |||
| Increase in taxes payable | 8,354 | 8,838 | ||||
| Decrease in deferred taxes | (3,634 | ) | (991 | ) | ||
| Net cash provided by (used in) operating activities | 16,457 | (793 | ) | |||
| Cash flows from investing activities | ||||||
| Capital expenditures | (3,118 | ) | (1,473 | ) | ||
| Proceeds from disposal of property, plant and equipment | 274 | 316 | ||||
| Proceeds on return of investment (Note 7) | 284 | - | ||||
| Investment in Cell C (Note 7) | - | (151,003 | ) | |||
| Investment in equity of equity-accounted investments (Note 7) | - | (72,846 | ) | |||
| Net change in settlement assets | 75,931 | 212,649 | ||||
| Net cash provided by (used in) investing activities | 73,371 | (12,357 | ) | |||
| Cash flows from financing activities | ||||||
| Proceeds from bank overdraft (Note 10) | 84,655 | 31,880 | ||||
| Repayment of long-term borrowings (Note 10) | (10,260 | ) | (14,260 | ) | ||
| Long-term borrowings utilized (Note 10) | 7,801 | 95,431 | ||||
| Dividends paid to non-controlling interest | (1,729 | ) | - | |||
| Payment of guarantee fee (Note 10) | (136 | ) | (552 | ) | ||
| Repayment of bank overdraft (Note 10) | - | (2,952 | ) | |||
| Net change in settlement obligations | (75,931 | ) | (212,649 | ) | ||
| Net cash provided by (used in) financing activities | 4,400 | (103,102 | ) | |||
| Effect of exchange rate changes on cash | (949 | ) | (3,846 | ) | ||
| Net increase (decrease) in cash, cash equivalents and restricted cash | 93,279 | (120,098 | ) | |||
| Cash, cash equivalents and restricted cash – beginning of period | 90,054 | 258,457 | ||||
| Cash, cash equivalents and restricted cash – end of period (1) | $ | 183,333 | $ | 138,359 | ||
See Notes to Unaudited Condensed Consolidated Financial Statements
(1) Cash, cash equivalents and restricted cash as of September 30, 2018, includes restricted cash of approximately $84.8 million related to cash withdrawn from the Company’s various debt facilities to fund ATMs. This cash may only be used to fund ATMs and is considered restricted as to use and therefore is classified as restricted cash. Refer to Note 10 for additional information regarding the Company’s facilities.
7
NET 1 UEPS TECHNOLOGIES, INC.
Notes to the
Unaudited Condensed Consolidated Financial Statements
for the three
months ended September 30, 2018 and 2017
(All amounts in tables
stated in thousands or thousands of U.S. dollars, unless otherwise stated)
1. Basis of Presentation and Summary of Significant Accounting Policies
Unaudited Interim Financial Information
The accompanying unaudited condensed consolidated financial statements include all majority-owned subsidiaries over which the Company exercises control and have been prepared in accordance with U.S. generally accepted accounting principles (“GAAP”) and the rules and regulations of the United States Securities and Exchange Commission for Quarterly Reports on Form 10-Q and include all of the information and disclosures required for interim financial reporting. The results of operations for the three months ended September 30, 2018 and 2017, are not necessarily indicative of the results for the full year. The Company believes that the disclosures are adequate to make the information presented not misleading.
These financial statements should be read in conjunction with the financial statements, accounting policies and financial notes thereto included in the Company’s Annual Report on Form 10-K for the fiscal year ended June 30, 2018. In the opinion of management, the accompanying unaudited condensed consolidated financial statements reflect all adjustments (consisting only of normal recurring adjustments), which are necessary for a fair representation of financial results for the interim periods presented.
References to the “Company” refer to Net1 and its consolidated subsidiaries, collectively, unless the context otherwise requires. References to “Net1” are references solely to Net 1 UEPS Technologies, Inc.
Restatement of Form10-K for the year ended June 30, 2018
Subsequent to the issuance of the Form 10-K, and as disclosed in the Form 8-K dated November 8, 2018, the Company announced that it would restate its consolidated financial statements for the year ended June 30, 2018, included in the Company’s Annual Report on Form 10-K for the year ended June 30, 2018, due to the identification of an error in its accounting for its investment in an equity security. The Company incorrectly classified and recorded its investment in Cell C Proprietary Limited (“Cell C”), an unlisted company that the Company elected to carry at fair value using the fair value option, as available-for-sale and recorded the change in its fair value of $25.2 million, net of taxation of $7.3 million, in other comprehensive income for the year ended June 30, 2018. The Company has now determined that the investment in Cell C should have been accounted at fair value with changes in fair value recorded in the statement of operations. The tables below present the impact of the restatement on each of the Company’s financial statements for the year ended June 30, 2018:
| Consolidated balance sheet | |||||||||
| As of June 30, 2018 | |||||||||
| As | As | ||||||||
| Reported | Correction | Restated | |||||||
| (in thousands) | |||||||||
| Accumulated other comprehensive loss | $ | (159,237 | ) | $ | (25,199 | ) | $ | (184,436 | ) |
| Retained earnings | 812,426 | 25,199 | 837,625 | ||||||
| Total equity | $ | 738,430 | $ | - | $ | 738,430 | |||
| Consolidated statement of operations | |||||||||
| Year ended June 30, 2018 | |||||||||
| As | As | ||||||||
| Reported | Correction | Restated | |||||||
| (in thousands, except per share data) | |||||||||
| Change in fair value of equity securities | $ | - | $ | 32,473 | $ | 32,473 | |||
| Income before income taxes | 67,893 | 32,473 | 100,366 | ||||||
| Income tax expense | 41,353 | 7,274 | 48,627 | ||||||
| Net income before earnings from equity-accounted investments | 26,540 | 25,199 | 51,739 | ||||||
| Net income | 38,270 | 25,199 | 63,469 | ||||||
| Net income attributable to Net1 | $ | 39,150 | $ | 25,199 | $ | 64,349 | |||
| Net income per share, in United States dollars: | |||||||||
| Basic earnings attributable to Net1 shareholders | 0.69 | 0.44 | 1.13 | ||||||
| Diluted earnings attributable to Net1 shareholders | 0.69 | 0.44 | 1.13 | ||||||
8
1. Basis of Presentation and Summary of Significant Accounting Policies (continued)
Restatement of Form10-K for the year ended June 30, 2018 (continued)
| Consolidated statement of comprehensive income | |||||||||
| Year ended June 30, 2018 | |||||||||
| As | As | ||||||||
| Reported | Correction | Restated | |||||||
| (in thousands) | |||||||||
| Net income | $ | 38,270 | $ | 25,199 | $ | 63,469 | |||
| Net unrealized income on asset available for sale, net of tax | 25,199 | (25,199 | ) | - | |||||
| Total other comprehensive income (loss) | 3,234 | (25,199 | ) | (21,965 | ) | ||||
| Comprehensive income | $ | 41,504 | $ | - | $ | 41,504 | |||
| Consolidated statement of changes in equity | ||||||
| Retained | Accumulated other | |||||
| earnings | comprehensive loss | |||||
| (in thousands) | ||||||
| As reported – June 30, 2018 | $ | 812,426 | $ | (159,237) | ||
| Correction of misstatement | 25,199 | (25,199 | ) | |||
| As restated – June 30, 2018 | $ | 837,625 | $ | (184,436 | ) | |
| Consolidated statement of cash flows | |||||||||
| Year ended June 30, 2018 | |||||||||
| As | As | ||||||||
| Reported | Correction | Restated | |||||||
| (in thousands) | |||||||||
| Net income | $ | 38,270 | $ | 25,199 | $ | 63,469 | |||
| Fair value adjustment | 212 | (32,473 | ) | (32,685 | ) | ||||
| Increase (Decrease) in deferred taxes | (1,308 | ) | 7,274 | 5,966 | |||||
| Net cash provided by operating activities | $ | 132,605 | $ | - | $ | 132,605 | |||
The restatement does not affect the current financial results reported on this Quarterly Report on Form 10-Q. For more information concerning the restatement, please see the Current Report on Form 8-K filed by the Company with the Securities and Exchange Commission (“SEC”) on November 8, 2018.
Recent accounting pronouncements adopted
In May 2014, the Financial Accounting Standards Board (“FASB”) issued guidance regarding Revenue from Contracts with Customers. This guidance requires an entity to recognize revenue when a customer obtains control of promised goods or services in an amount that reflects the consideration which the entity expects to receive in exchange for those goods or services. In addition, the standard requires disclosure of the nature, amount, timing, and uncertainty of revenue and cash flows arising from contracts with customers. The guidance was originally set to be effective for the Company beginning July 1, 2017, however in August 2015, the FASB issued guidance regarding Revenue from Contracts with Customers, Deferral of the Effective Date. This guidance deferred the required implementation date specified in Revenue from Contracts with Customers to December 2017. Public companies may elect to adopt the standard along the original timeline. The guidance became effective for the Company beginning July 1, 2018. The Company elected the modified retrospective transition method upon adoption of this guidance. The adoption of this guidance did not have a material impact on the Company’s financial statements, except for the additional footnote disclosures provided.
In January 2016, the FASB issued guidance regarding Recognition and Measurement of Financial Assets and Financial Liabilities. The guidance primarily affects the accounting for equity investments, financial liabilities under the fair value option and the presentation and disclosure requirements for financial instruments. The guidance requires changes in the fair value of the Company’s equity investments, with certain exceptions, to be recognized through net income rather than other comprehensive income. In addition, the guidance clarifies the valuation allowance assessment when recognizing deferred tax assets resulting from unrealized losses on available-for-sale debt securities. This guidance became effective for the Company beginning July 1, 2018, and early adoption is not permitted, with certain exceptions. The amendments are required to be applied by means of a cumulative-effect adjustment on the balance sheet as of the beginning of the fiscal year of adoption. The adoption of this guidance did not have a material impact on the Company’s financial statements.
9
1. Basis of Presentation and Summary of Significant Accounting Policies (continued)
Recent accounting pronouncements adopted (continued)
Equity securities are measured at fair value. The Company may elect to measure equity securities without readily determinable fair values at cost with adjustments for observable changes in price or impairments for the identical or a similar investment of the same issuer. We perform a qualitative assessment on a quarterly basis and recognize an impairment loss if there are sufficient indicators that the fair value of the equity security is less than carrying value. There were no changes in the fair value of our equity securities recorded during the three months ended September 30, 2018. Changes in fair value will be recorded in our condensed consolidated statement of operations in future periods within a caption titled “changes in fair value of equity securities”
In June 2016, the FASB issued guidance regarding Classification of Certain Cash Receipts and Cash Payments. The guidance is intended to reduce diversity in practice and explains how certain cash receipts and payments are presented and classified in the statement of cash flows, including beneficial interests in securitization, which would impact the presentation of the deferred purchase price from sales of receivables.
This guidance became effective for the Company beginning July 1, 2018, and must be applied retrospectively. The Company has elected to classify distributions received from equity method investees using the nature of the distribution approach. This election requires the Company to evaluate each distribution received on the basis of the source of the payment and classify the distribution as either operating cash inflows or investing cash inflows. The adoption of this guidance did not have a material impact on the Company’s financial statements and the Company was not required to make any retrospective adjustments.
In January 2017, the FASB issued guidance regarding Clarifying the Definition of a Business. This guidance provides a more robust framework to use in determining when a set of assets and activities is a business. Because the current definition of a business is interpreted broadly and can be difficult to apply, stakeholders indicated that analyzing transactions is inefficient and costly and that the definition does not permit the use of reasonable judgment. The amendments provide more consistency in applying the guidance, reduce the costs of application, and make the definition of a business more operable. The guidance became effective for the Company beginning July 1, 2018. The adoption of this guidance did not have a material impact on the Company’s financial statements.
In January 2017, the FASB issued guidance regarding Simplifying the Test for Goodwill Impairment. This guidance removes the requirement for an entity to calculate the implied fair value of goodwill (as part of step 2 of the current goodwill impairment test) in measuring a goodwill impairment loss. The guidance is effective for the Company beginning July 1, 2020. Early adoption is permitted for interim or annual goodwill impairment tests performed on testing dates after January 1, 2017. The Company has elected to early adopt this guidance beginning July 1, 2018. The adoption of this guidance did not have a material impact on the Company’s financial statements.
In May 2017, the FASB issued guidance regarding Compensation—Stock Compensation (Topic 718): Scope of Modification Accounting. The guidance amends the scope of modification accounting for share-based payment arrangements and provides guidance on the types of changes to the terms or conditions of share-based payment awards to which an entity would be required to apply modification accounting under Accounting Standards Codification 718. Specifically, an entity would not apply modification accounting if the fair value, vesting conditions, and classification of the awards are the same immediately before and after the modification. The guidance became effective for the Company beginning July 1, 2018. The adoption of this guidance did not have a material impact on the Company’s financial statements.
In June 2018, the FASB issued guidance regarding Improvements to Nonemployee Share-Based Payment Accounting. The guidance simplifies the accounting for share-based payments granted to non-employees for goods and services and aligns the guidance for these share-based payments with guidance applicable to accounting for share-based payments granted to employees. The guidance is effective for the Company beginning July 1, 2019. Early adoption is permitted. The Company has elected to early adopt this guidance beginning July 1, 2018. The adoption of this guidance did not have a material impact on the Company’s financial statements.
Recent accounting pronouncements not yet adopted as of September 30, 2018
In February 2016, the FASB issued guidance regarding Leases. The guidance increases transparency and comparability among organizations by requiring the recognition of lease assets and lease liabilities on the balance sheet. The amendments to current lease guidance include the recognition of assets and liabilities by lessees for those leases currently classified as operating leases. The guidance also requires disclosures to meet the objective of enabling users of financial statements to assess the amount, timing, and uncertainty of cash flows arising from leases. This guidance is effective for the Company beginning July 1, 2019. Early adoption is permitted. The Company expects that this guidance may have a material impact on its financial statements and is currently evaluating the impact of this guidance on its financial statements on adoption.
10
1. Basis of Presentation and Summary of Significant Accounting Policies (continued)
Recent accounting pronouncements not yet adopted as of September 30, 2018 (continued)
In June 2016, the FASB issued guidance regarding Measurement of Credit Losses on Financial Instruments. The guidance replaces the incurred loss impairment methodology in current GAAP with a methodology that reflects expected credit losses and requires consideration of a broader range of reasonable and supportable information to inform credit loss estimates. For trade and other receivables, loans, and other financial instruments, an entity is required to use a forward-looking expected loss model rather than the incurred loss model for recognizing credit losses, which reflects losses that are probable. Credit losses relating to available-for-sale debt securities will also be recorded through an allowance for credit losses rather than as a reduction in the amortized cost basis of the securities. This guidance is effective for the Company beginning July 1, 2020. Early adoption is permitted beginning July 1, 2019. The Company is currently assessing the impact of this guidance on its financial statements disclosure.
In August 2018, the FASB issued guidance regarding Disclosure Framework: Changes to the Disclosure Requirements for Fair Value Measurement. The guidance modifies the disclosure requirements related to fair value measurement. This guidance is effective for the Company beginning July 1, 2020. Early adoption is permitted. The Company is currently assessing the impact of this guidance on its financial statements disclosure.
2. Pre-funded social welfare grants receivable
Pre-funded social welfare grants receivable represents primarily amounts pre-funded by the Company to certain merchants participating in the merchant acquiring system. The Company’s contract with the South African Social Security Agency expired on September 30, 2018, and therefore the Company no longer pre-funds social welfare grants. The July 2018 payment service commenced on July 1, 2018 but the Company pre-funded certain merchants participating in the merchant acquiring systems on the last day of June 2018.
3. Accounts receivable, net and finance loans receivable,
net
Accounts receivable, net
The Company’s accounts receivable, net, as of September 30, 2018 and June 30, 2018, is presented in the table below:
| September 30, | June 30, | ||||||||||
| 2018 | 2018 | ||||||||||
| Accounts receivable, trade, net | $ | 38,240 | $ | 49,365 | |||||||
| Accounts receivable, trade, gross | 39,632 | 50,466 | |||||||||
| Allowance for doubtful accounts receivable, end of period | 1,392 | 1,101 | |||||||||
| Beginning of year | 1,101 | 1,255 | |||||||||
| Reversed to statement of operations | (2 | ) | (47 | ) | |||||||
| Charged to statement of operations | 1,089 | 642 | |||||||||
| Utilized | (832 | ) | (776 | ) | |||||||
| Foreign currency adjustment | 36 | 27 | |||||||||
| Current portion of payments to agents in South Korea amortized over the contract period | 20,695 | 21,971 | |||||||||
| Payments to agents in South Korea amortized over the contract period | 36,641 | 39,554 | |||||||||
| Less:
Payments to agents in South Korea amortized over the contract period
included in other long-term assets (Note 7) |
15,946 | 17,582 | |||||||||
| Loans provided to Finbond | 1,074 | 1,107 | |||||||||
| Contingent purchase consideration | 8,033 | - | |||||||||
| Other receivables | 45,882 | 37,240 | |||||||||
| Total accounts receivable, net | $ | 113,924 | $ | 109,683 |
11
3. Accounts receivable, net and finance loans receivable, net (continued)
Finance loans receivable, net
The Company’s finance loans receivable, net, as of September 30, 2018 and June 30, 2018, is presented in the table below:
| September | |||||||||||
| 30, | June 30, | ||||||||||
| 2018 | 2018 | ||||||||||
| Microlending finance loans receivable, net | $ | 46,078 | $ | 57,504 | |||||||
| Microlending finance loans receivable, gross | 52,453 | 61,743 | |||||||||
| Allowance for doubtful microlending finance loans receivable, end of period | 6,375 | 4,239 | |||||||||
| Beginning of year | 4,239 | 3,717 | |||||||||
| Charged to statement of operations | 4,271 | 4,348 | |||||||||
| Utilized | (2,117 | ) | (3,588 | ) | |||||||
| Foreign currency adjustment | (18 | ) | (238 | ) | |||||||
| Working capital finance receivable, net | 3,834 | 3,959 | |||||||||
| Working capital finance receivable, gross | 16,180 | 16,123 | |||||||||
| Allowance for doubtful working capital finance receivable, end of period | 12,346 | 12,164 | |||||||||
| Beginning of year | 12,164 | 3,752 | |||||||||
| Charged to statement of operations | 181 | 8,415 | |||||||||
| Foreign currency adjustment | 1 | (3 | ) | ||||||||
| Current portion of other finance loans receivable | 899 | 742 | |||||||||
| Total other finance loans receivable | 17,060 | 13,025 | |||||||||
| Less included in other long-term assets | 16,161 | 12,283 | |||||||||
| Total finance loans receivable, net | $ | 50,811 | $ | 62,205 |
4. Inventory
The Company’s inventory comprised the following category as of September 30, 2018 and June 30, 2018.
| September 30, | June 30, | |||||
| 2018 | 2018 | |||||
| Finished goods | $ | 10,369 | $ | 12,887 | ||
| $ | 10,369 | $ | 12,887 |
5. Settlement assets and settlement obligations
Settlement assets comprise (1) cash received from the South African government that the Company holds pending disbursement to recipient cardholders of social welfare grants and (2) cash received from customers on whose behalf the Company processes payroll payments that the Company will disburse to customer employees, payroll-related payees and other payees designated by the customer.
Settlement obligations comprise (1) amounts that the Company is obligated to disburse to recipient cardholders of social welfare grants, and (2) amounts that the Company is obligated to pay to customer employees, payroll-related payees and other payees designated by the customer.
The balances at each reporting date may vary widely depending on the timing of the receipts and payments of these assets and obligations.
12
6. Fair value of financial instruments
Fair value of financial instruments
Initial recognition and measurement
Financial instruments are recognized when the Company becomes a party to the transaction. Initial measurements are at cost, which includes transaction costs.
Risk management
The Company manages its exposure to currency exchange, translation, interest rate, customer concentration, credit and equity price and liquidity risks as discussed below.
Currency exchange risk
The Company is subject to currency exchange risk because it purchases inventories that it is required to settle in other currencies, primarily the euro and U.S. dollar. The Company has used forward contracts in order to limit its exposure in these transactions to fluctuations in exchange rates between the South African rand (“ZAR”), on the one hand, and the U.S. dollar and the euro, on the other hand.
Translation risk
Translation risk relates to the risk that the Company’s results of operations will vary significantly as the U.S. dollar is its reporting currency, but it earns most of its revenues and incurs most of its expenses in ZAR. The U.S. dollar to ZAR exchange rate has fluctuated significantly over the past three years. As exchange rates are outside the Company’s control, there can be no assurance that future fluctuations will not adversely affect the Company’s results of operations and financial condition.
Interest rate risk
As a result of its normal borrowing and lending activities, the Company’s operating results are exposed to fluctuations in interest rates, which it manages primarily through regular financing activities. The Company generally maintains limited investments in cash equivalents and held to maturity investments and has occasionally invested in marketable securities.
Credit risk
Credit risk relates to the risk of loss that the Company would incur as a result of non-performance by counterparties. The Company maintains credit risk policies with regard to its counterparties to minimize overall credit risk. These policies include an evaluation of a potential counterparty’s financial condition, credit rating, and other credit criteria and risk mitigation tools as the Company’s management deems appropriate.
Credit risk (continued)
With respect to credit risk on financial instruments, the Company maintains a policy of entering into such transactions only with South African and European financial institutions that have a credit rating of “B” (or its equivalent) or better, as determined by credit rating agencies such as Standard & Poor’s, Moody’s and Fitch Ratings.
Microlending credit risk
The Company is exposed to credit risk in its microlending activities, which provide unsecured short-term loans to qualifying customers. The Company manages this risk by performing an affordability test for each prospective customer and assigning a “creditworthiness score”, which takes into account a variety of factors such as other debts and total expenditures on normal household and lifestyle expenses.
Equity price and liquidity risk
Equity price risk relates to the risk of loss that the Company would incur as a result of the volatility in the exchange-traded price of equity securities that it holds and the risk that it may not be able to liquidate these securities. The market price of these securities may fluctuate for a variety of reasons and, consequently, the amount that the Company may obtain in a subsequent sale of these securities may significantly differ from the reported market value.
Liquidity risk relates to the risk of loss that the Company would incur as a result of the lack of liquidity on the exchange on which these securities are listed. The Company may not be able to sell some or all of these securities at one time, or over an extended period of time without influencing the exchange traded price, or at all.
13
6. Fair value of financial instruments (continued)
Financial instruments
The following section describes the valuation methodologies the Company uses to measure its significant financial assets and liabilities at fair value.
In general, and where applicable, the Company uses quoted prices in active markets for identical assets or liabilities to determine fair value. This pricing methodology would apply to Level 1 investments. If quoted prices in active markets for identical assets or liabilities are not available to determine fair value, then the Company uses quoted prices for similar assets and liabilities or inputs other than the quoted prices that are observable either directly or indirectly. These investments would be included in Level 2 investments. In circumstances in which inputs are generally unobservable, values typically reflect management’s estimates of assumptions that market participants would use in pricing the asset or liability. The fair values are therefore determined using model-based techniques that include option pricing models, discounted cash flow models, and similar techniques. Investments valued using such techniques are included in Level 3 investments.
Asset measured at fair value using significant unobservable inputs – investment in Cell C
The Company’s Level 3 asset represents an investment of 75,000,000 class “A” shares in Cell C, a leading mobile telecoms provider in South Africa. The Company has developed an adjusted EV/EBITDA multiple valuation model in order to determine the fair value of the Cell C shares. The primary inputs to the valuation model as of September 30, 2018, are unchanged from June 30, 2018. The primary inputs to the valuation model are Cell C’s annualized adjusted EBITDA for the 11 months ended June 30, 2018, of ZAR 3.9 billion ($275.8 million, translated at exchange rates applicable as of September 30, 2018), an EBITDA multiple of 6.75, Cell C’s net external debt of ZAR 8.8 billion ($622.3 million, translated at exchange rates applicable as of September 30, 2018) and a marketability discount of 10% as Cell C is not currently listed, but has publicly stated its intention to list. The EBITDA multiple was determined based on an analysis of Cell C’s peer group, which comprises various African and emerging market mobile telecommunications operators. The fair value of Cell C utilizing the adjusted EV/EBITDA valuation model developed by the Company is sensitive to the following inputs: (i) the Company’s determination of adjusted EBITDA (ii) the EBITDA multiple used and (iii) the marketability discount used. Utilization of different inputs, or changes to these inputs, may result in significantly higher or lower fair value measurement.
The following table presents the impact of a 0.50 increase and 0.50 decrease to the EBITDA multiple used in the Cell C valuation on the September 30, 2018, carrying value of the Company’s Cell C investment (all amounts translated at exchange rates applicable as of September 30, 2018):
| Sensitivity for | |||
| fair value of | |||
| Cell C investment | |||
| EBITDA multiple of 6.25 times | $ | 149,179 | |
| EBITDA multiple of 6.75 times | $ | 167,835 | |
| EBITDA multiple of 7.25 times | $ | 186,490 |
The fair value of the Cell C shares as of September 30, 2018, represented approximately 14% of the Company’s total assets, including these shares. The Company expects to hold these shares for an extended period of time and it is not concerned with short-term equity price volatility with respect to these shares provided that the underlying business, economic and management characteristics of the company remain sound.
Liability measured at fair value using significant unobservable inputs – DNI contingent consideration
The salient terms of the Company’s investment in DNI is described in Note 3 to the Company’s audited consolidated financial statements included in its Annual Report on Form 10-K for the year ended June 30, 2018. Under the terms of its subscription agreements with DNI, the Company has agreed to pay to DNI an additional amount of up to ZAR 400.0 million ($28.3 million, translated at exchange rates applicable as of September 30, 2018), in cash, subject to the achievement of certain performance targets by DNI. The Company expects to pay the additional amount during the first quarter of the year ended June 30, 2020, and has recorded an amount of ZAR 379.6 million ($26.8 million) and ZAR 373.6 million ($27.2 million), in other payables in its unaudited condensed consolidated balance sheet as of September 30, 2018, and in long-term liabilities as of June 30, 2018, respectively, which amount represents the present value of the ZAR 400.0 million to be paid (amounts translated at exchange rates applicable as of September 30, 2018 and June 30, 2018, respectively).
14
6. Fair value of financial instruments (continued)
Financial instruments (continued)
Liability measured at fair value using significant unobservable inputs – DNI contingent consideration (continued)
The present value of ZAR 379.6 million has been calculated using the following assumptions (a) the maximum additional amount of ZAR 400.0 million will be paid on August 1, 2019 and (b) an interest rate of 6.3 % (the rate used to calculate interest earned by the Company on its surplus South African funds) has been used to discount the ZAR 400.0 million to its present value as of September 30, 2018. Utilization of different inputs, or changes to these inputs, may result in significantly higher or lower fair value measurement.
Derivative transactions - Foreign exchange contracts
As part of the Company’s risk management strategy, the Company enters into derivative transactions to mitigate exposures to foreign currencies using foreign exchange contracts. These foreign exchange contracts are over-the-counter derivative transactions. Substantially all of the Company’s derivative exposures are with counterparties that have long-term credit ratings of “B” (or equivalent) or better. The Company uses quoted prices in active markets for similar assets and liabilities to determine fair value (Level 2). The Company has no derivatives that require fair value measurement under Level 1 or 3 of the fair value hierarchy.
The Company’s outstanding foreign exchange contracts are as follows as of September 30, 2018:
| Fair market | |||
| Notional amount | Strike price | value price | Maturity |
| USD 269,800 | ZAR 14.2023 | ZAR 14.1489 | October 2, 2018 |
| USD 280,000 | ZAR 15.2480 | ZAR 14.2466 | November 23, 2018 |
| USD 420,000 | ZAR 15.3071 | ZAR 14.2993 | December 21, 2018 |
| USD 420,000 | ZAR 15.3801 | ZAR 14.3647 | January 25, 2019 |
| USD 140,000 | ZAR 15.4386 | ZAR 14.4168 | February 22, 2019 |
| USD 420,000 | ZAR 15.4939 | ZAR 14.4652 | March 20, 2019 |
| USD 420,000 | ZAR 15.5704 | ZAR 14.5334 | April 26, 2019 |
The Company had no outstanding foreign exchange contracts as of June 30, 2018.
The following table presents the Company’s assets and liabilities measured at fair value on a recurring basis as of September 30, 2018, according to the fair value hierarchy:
| Quoted price in | Significant | ||||||||||||
| active markets | other | Significant | |||||||||||
| for identical | observable | unobservable | |||||||||||
| assets | inputs | inputs | |||||||||||
| (Level 1) | (Level 2) | (Level 3) | Total | ||||||||||
| Assets | |||||||||||||
| Investment in Cell C | $ | - | $ | - | $ | 167,835 | $ | 167,835 | |||||
| Related to insurance business: | |||||||||||||
| Cash, cash equivalents and
restricted cash (included in other long-term assets) |
598 | - | - | 598 | |||||||||
| Fixed
maturity investments (included
in cash and cash equivalents) |
7,853 | - | - | 7,853 | |||||||||
| Other | - | 18 | - | 18 | |||||||||
| Total assets at fair value | $ | 8,451 | $ | 18 | $ | 167,835 | $ | 176,304 | |||||
| Liabilities | |||||||||||||
| DNI contingent consideration | $ | - | $ | - | $ | 26,839 | $ | 26,839 | |||||
| Foreign exchange contracts | - | 152 | - | 152 | |||||||||
| Total liabilities at fair value | $ | - | $ | 152 | $ | 26,839 | $ | 26,991 |
15
6. Fair value of financial instruments (continued)
Financial instruments (continued)
The following table presents the Company’s assets and liabilities measured at fair value on a recurring basis as of June 30, 2018, according to the fair value hierarchy:
| Quoted price in | Significant | |||||||||||
| active markets | other | Significant | ||||||||||
| for identical | observable | unobservable | ||||||||||
| assets | inputs | inputs | ||||||||||
| (Level 1) | (Level 2) | (Level 3) | Total | |||||||||
| Assets | ||||||||||||
| Investment in Cell C | $ | - | $ | - | $ | 172,948 | $ | 172,948 | ||||
| Related to insurance business: | ||||||||||||
| Cash and cash
equivalents (included in
other long-term assets) |
610 | - | - | 610 | ||||||||
| Fixed maturity investments
(included in cash, cash equivalents and restricted cash) |
8,304 | - | - | 8,304 | ||||||||
| Other | - | 18 | - | 18 | ||||||||
| Total assets at fair value | $ | 8,914 | $ | 18 | $ | 172,948 | $ | 181,880 | ||||
| Liabilities | ||||||||||||
| DNI contingent consideration | $ | - | $ | - | $ | 27,222 | $ | 27,222 | ||||
| Total liabilities at fair value | $ | - | $ | - | $ | 27,222 | $ | 27,222 |
There have been no transfers in or out of Level 3 during the three months ended September 30 2018 and 2017, respectively.
Summarized below is the movement in the carrying value of assets and liabilities measured at fair value on a recurring basis, and categorized within Level 3, during the three months ended September 30, 2018:
| Assets |
Carrying value |
||
| Balance as at June 30, 2018 | $ | 172,948 | |
| Foreign currency adjustment | (5,113 | ) | |
| Balance as of September 30, 2018 | $ | 167,835 | |
| Liabilities | |||
| Balance as at June 30, 2018 | $ | 27,222 | |
| Accretion of interest | 422 | ||
| Foreign currency adjustment(1) | (805 | ) | |
| Balance as of September 30, 2018 | $ | 26,839 |
(1) The foreign currency adjustment represents the effects of the fluctuations of the South African rand and the U.S. dollar on the carrying value.
Summarized below is the movement in the carrying value of assets and liabilities measured at fair value on a recurring basis, and categorized within Level 3, during the three months ended September 30, 2017:
| Carrying value | |||
| Assets | |||
| Acquisition of investment in Cell C | $ | 151,003 | |
| Foreign currency adjustment | (3,530 | ) | |
| Balance as of September 30, 2017 | $ | 147,473 |
(1) The foreign currency adjustment represents the effects of the fluctuations of the South African rand and the U.S. dollar on the carrying value.
Assets measured at fair value on a nonrecurring basis
We measure equity investments without readily determinable fair values on a nonrecurring basis. The fair values of these investments are determined based on valuation techniques using the best information available, and may include quoted market prices, market comparables, and discounted cash flow projections.
16
7. Equity-accounted investments and other long-term assets
Refer to Note 9 to the Company’s audited consolidated financial statements included in its Annual Report on Form 10-K for the year ended June 30, 2018, for additional information regarding its equity-accounted investments and other long-term assets.
Equity-accounted investments
The Company’s ownership percentage in its equity-accounted investments as of September 30, 2018 and June 30, 2018, was as follows:
| September | June 30, | ||
| 30, 2018 | 2018 | ||
| Bank Frick & Co AG (“Bank Frick”) | 35% | 35% | |
| Fanaka Holdings (Pty) Ltd (“Fanaka”) | 40% | - | |
| Finbond Group Limited (“Finbond”) | 29% | 29% | |
| OneFi Limited (formerly KZ One) (“OneFi”) | 25% | 25% | |
| SmartSwitch Namibia (Pty) Ltd (“SmartSwitch Namibia”) | 50% | 50% | |
| Speckpack Field Services (Pty) Ltd (“Speckpack”) | 50% | 50% | |
| Walletdoc Proprietary Limited (“Walletdoc”) | 20% | 20% |
Finbond
As of September 30, 2018, the Company owned 267,672,032 shares in Finbond. Finbond is listed on the Johannesburg Stock Exchange and its closing price on September 28, 2018, the last trading day of the quarter, was R3.60 per share. The market value of the Company’s holding in Finbond on September 30, 2018 was ZAR 1.0 billion ($72 million translated at exchange rates applicable as of September 30, 2018). On July 11, 2018, the Company, pursuant to its election, received an additional 6,602,551 shares in Finbond as a capitalization share issue in lieu of a dividend.
V2 Limited
On October 4, 2018, the Company acquired a 50% voting and economic interest in V2 Limited (“V2”) for $2.5 million. V2 is an Africa-focused technology provider dedicated to providing financial inclusion to the roughly one billion underbanked citizens on the continent. The Company has committed to provide V2 with a further equity contribution of $2.5 million and a working capital facility of $5.0 million, which are both subject to the achievement of certain pre-defined objectives. V2 will have access to license Zapper’s quick response (“QR”) payment technology as well as the Company’s various payment solutions such as UEPS/EMV and mobile virtual card. Zapper’s QR technology and payment platform is one of the most advanced and complete QR payment offerings, and it has operations currently in South Africa, the United Kingdom and the United States. V2 will partner with Zapper to launch ZappGroup Africa, a company focused on deploying a universal white-label QR payment solution.
17
7. Equity-accounted investments and other long-term assets (continued)
Equity-accounted investments (continued)
Summarized below is the movement in equity-accounted investments during the three months ended September 30, 2018:
| Bank | ||||||||||||
| Frick | Finbond | Other(1) | Total | |||||||||
| Investment in equity: | ||||||||||||
| Balance as of June 30, 2018 | $ | 48,129 | $ | 30,958 | $ | 6,092 | $ | 85,179 | ||||
| Acquisition of shares | - | 1,920 | - | 1,920 | ||||||||
| Stock-based compensation | - | 77 | - | 77 | ||||||||
| Comprehensive income (loss): | (588 | ) | 7,305 | 86 | 6,803 | |||||||
| Other comprehensive loss | - | 5,430 | - | 5,430 | ||||||||
| Equity accounted earnings (loss) | (588 | ) | 1,875 | 86 | 1,373 | |||||||
| Share of net income | 162 | 1,852 | 86 | 2,100 | ||||||||
| Amortization of acquired intangible assets | (189 | ) | - | - | (189 | ) | ||||||
| Deferred taxes on acquired intangible assets | 45 | - | - | 45 | ||||||||
| Dilution resulting from corporate transactions | - | 23 | - | 23 | ||||||||
| Other | (606 | ) | - | - | (606 | ) | ||||||
| Dividends received | - | (1,920 | ) | - | (1,920 | ) | ||||||
| Return on investment | - | - | (284 | ) | (284 | ) | ||||||
| Foreign currency adjustment(2) | 435 | (1,059 | ) | (57 | ) | (681 | ) | |||||
| Balance as of September 30, 2018 | $ | 47,976 | $ | 37,281 | $ | 5,837 | $ | 91,094 | ||||
| Investment in loans: | ||||||||||||
| Balance as of June 30, 2018 | $ | - | $ | - | $ | 3,152 | $ | 3,152 | ||||
| Foreign currency adjustment(2) | - | - | (5 | ) | (5 | ) | ||||||
| Balance as of September 30, 2018 | $ | - | $ | - | $ | 3,147 | $ | 3,147 |
| Equity | Loans | Total | ||||||||||
| Carrying amount as of: | ||||||||||||
| June 30, 2018 | $ | 85,179 | $ | 3,152 | $ | 88,331 | ||||||
| September 30, 2018 | $ | 91,094 | $ | 3,147 | $ | 94,241 |
(1) Includes OneFi, SmartSwitch
Namibia, Speckpack, Fanaka and Walletdoc;
(2) The foreign currency
adjustment represents the effects of the fluctuations of the South African rand,
Swiss franc, Nigerian naira and Namibian dollar, and the U.S. dollar on the
carrying value.
Other long-term assets
Summarized below is the breakdown of other long-term assets as of September 30, 2018, and June 30, 2018:
| September 30, | June 30, | |||||||
| 2018 | 2018 | |||||||
| Total equity investments | $ | 194,570 | $ | 199,865 | ||||
| Investment in 15% of Cell C, at fair value (Note 6) | 167,835 | 172,948 | ||||||
| Investment in 12% of MobiKwik, at fair value(1) | 26,735 | 26,917 | ||||||
| Total held to maturity investments | 10,551 | 10,395 | ||||||
| Investment in 7.625% of Cedar Cellular Investment 1 (RF) (Pty) Ltd 8.625% notes | 10,551 | 10,395 | ||||||
| Long-term portion of payments to agents in South Korea amortized over the contract period | 15,946 | 17,582 | ||||||
| Long-term portion of other finance loans receivable | 16,161 | 12,283 | ||||||
| Contingent purchase consideration | - | 9,064 | ||||||
| Policy holder assets under investment contracts (Note 9) | 598 | 610 | ||||||
| Reinsurance assets under insurance contracts (Note 9) | 619 | 633 | ||||||
| Other long-term assets | 6,705 | 5,948 | ||||||
| Total other long-term assets | $ | 245,150 | $ | 256,380 |
(1) The Company has determined that MobiKwik does not have readily determinable fair value and has therefore elected to recorded this investment at cost minus impairment, if any, plus or minus changes resulting from observable price changes in orderly transactions for the identical or a similar investment of the same issuer. The Company accounted for its investment in MobiKwik at cost as of June 30, 2018.
18
7. Equity-accounted investments and other long-term assets (continued)
Other long-term assets (continued)
Summarized below are the components of the Company’s held to maturity investments as of September 30, 2018:
| Unrealized | Unrealized | ||||||||||||
| holding | holding | Carrying | |||||||||||
| Cost basis | gains | losses | value | ||||||||||
| Held to maturity: | |||||||||||||
| Investment in Cedar Cellular notes | $ | 9,000 | $ | 1,551 | $ | - | $ | 10,551 | |||||
| Total | $ | 9,000 | $ | 1,551 | $ | - | $ | 10,551 |
Summarized below are the components of the Company’s held to maturity investments as of June 30, 2018:
| Unrealized | Unrealized | ||||||||||||
| holding | holding | Carrying | |||||||||||
| Cost basis | gains | losses | value | ||||||||||
| Held to maturity: | |||||||||||||
| Investment in Cedar Cellular notes | $ | 9,000 | $ | 1,395 | $ | - | $ | 10,395 | |||||
| Total | $ | 9,000 | $ | 1,395 | $ | - | $ | 10,395 |
The unrealized holding gains related to the investment in Cedar Cellular notes were recorded in interest income in the consolidated statement of operations. Interest on this investment will only be paid, at Cedar Cellular’s election, on maturity in August 2022. The Company’s effective interest rate on the Cedar Cellular note is 19.15% as of September 30, 2018, and it has recognized unrealized holding gains of $0.2 million during the three months ended September 30, 2018, which includes unrealized losses attributable to changes in the effective interest rate.
Contractual maturities of held to maturity investments
Summarized below is the contractual maturity of the Company’s held to maturity investment as of September 30, 2018:
| Estimated | ||||||
| Cost | fair | |||||
| basis | value(1) | |||||
| Due in one year or less | $ | - | $ | - | ||
| Due in one year through five years | 9,000 | 9,625 | ||||
| Due in five years through ten years | - | - | ||||
| Due after ten years | - | - | ||||
| Total | $ | 9,000 | $ | 9,625 |
(1) The estimated fair value of the Cedar Cellular note has been calculated utilizing the Company’s portion of the security provided to the Company by Cedar Cellular, namely, Cedar Cellular’s investment in Cell C.
8. Goodwill and intangible assets, net
Goodwill
Summarized below is the movement in the carrying value of goodwill for the three months ended September 30, 2018:
| Accumulated | Carrying | ||||||||
| Gross value | impairment | value | |||||||
| Balance as of June 30, 2018 | $ | 304,013 | $ | (20,773 | ) | $ | 283,240 | ||
| Foreign currency adjustment(1) | (5,152 | ) | 1,070 | (4,082 | ) | ||||
| Balance as of September 30, 2018 | $ | 298,861 | $ | (19,703 | ) | $ | 279,158 |
(1) – the foreign currency adjustment represents the effects of the fluctuations between the South African rand, the Euro and the Korean won, and the U.S. dollar on the carrying value.
19
8. Goodwill and intangible assets, net (continued) Goodwill (continued)
Goodwill has been allocated to the Company’s reportable segments as follows:
| South | Financial | |||||||||||
| African | International | inclusion and | ||||||||||
| transaction | transaction | applied | Carrying | |||||||||
| processing | processing | technologies | value | |||||||||
| Balance as of June 30, 2018 | $ | 20,946 | $ | 123,948 | $ | 138,346 | $ | 283,240 | ||||
| Foreign currency adjustment(1) | (618 | ) | 456 | (3,920 | ) | (4,082 | ) | |||||
| Balance as of September 30, 2018 | $ | 20,328 | $ | 124,404 | $ | 134,426 | $ | 279,158 |
(1) – the foreign currency adjustment represents the effects of the fluctuations between the South African rand, the Euro and the Korean won, and the U.S. dollar on the carrying value.
Intangible assets
Carrying value and amortization of intangible assets
Summarized below is the carrying value and accumulated amortization of the intangible assets as of September 30, 2018 and June 30, 2018:
| As of September 30, 2018 | As of June 30, 2018 | |||||||||||||||||
| Gross | Net | Gross | Net | |||||||||||||||
| carrying | Accumulated | carrying | carrying | Accumulated | carrying | |||||||||||||
| value | amortization | value | value | amortization | value | |||||||||||||
| Finite-lived intangible assets: | ||||||||||||||||||
| Customer relationships | $ | 193,995 | $ | (80,786 | ) | $ | 113,209 | $ | 197,676 | $ | (76,237 | ) | $ | 121,439 | ||||
| Software and unpatented technology | 34,175 | (32,546 | ) | 1,629 | 35,730 | (32,342 | ) | 3,388 | ||||||||||
| FTS patent | 2,709 | (2,709 | ) | - | 2,792 | (2,792 | ) | - | ||||||||||
| Exclusive licenses | 4,506 | (4,506 | ) | - | 4,506 | (4,506 | ) | - | ||||||||||
| Trademarks and brands | 12,345 | (6,147 | ) | 6,198 | 11,101 | (5,589 | ) | 5,512 | ||||||||||
| Total finite-lived intangible assets | 247,730 | (126,694 | ) | 121,036 | 251,805 | (121,466 | ) | 130,339 | ||||||||||
| Indefinite-lived intangible assets: | ||||||||||||||||||
| Financial institution license | 788 | - | 788 | 793 | - | 793 | ||||||||||||
| Total indefinite-lived intangible assets | 788 | - | 788 | 793 | - | 793 | ||||||||||||
| Total intangible assets | $ | 248,518 | $ | (126,694 | ) | $ | 121,824 | $ | 252,598 | $ | (121,466 | ) | $ | 131,132 | ||||
Aggregate amortization expense on the finite-lived intangible assets for the three months ended September 30, 2018 and 2017, was approximately $6.0 million and $2.8 million, respectively.
Future estimated annual amortization expense for the next five fiscal years and thereafter, assuming exchange rates that prevailed on September 30, 2018, is presented in the table below. Actual amortization expense in future periods could differ from this estimate as a result of acquisitions, changes in useful lives, exchange rate fluctuations and other relevant factors.
| Fiscal 2019 | $ | 24,469 | |
| Fiscal 2020 | 19,285 | ||
| Fiscal 2021 | 13,811 | ||
| Fiscal 2022 | 10,604 | ||
| Fiscal 2023 | 10,604 | ||
| Thereafter | 48,473 | ||
| Total future estimated annual amortization expense | $ | 127,246 |
20
9. Reinsurance assets and policyholder liabilities under insurance and investment contracts
Reinsurance assets and policyholder liabilities under insurance contracts
Summarized below is the movement in reinsurance assets and policyholder liabilities under insurance contracts during the three months ended September 30, 2018:
| Reinsurance | Insurance | |||||
| assets(1) | contracts(2) | |||||
| Balance as of June 30, 2018 | $ | 633 | $ | (2,032 | ) | |
| Increase in policyholder benefits under insurance contracts | 169 | (2,901 | ) | |||
| Claims and policyholders’ benefits under insurance contracts . | (164 | ) | 2,690 | |||
| Foreign currency adjustment(3) | (19 | ) | 61 | |||
| Balance as of September 30, 2018 | $ | 619 | $ | (2,182 | ) |
(1) Included in other long-term
assets.
(2) Included in other long-term
liabilities.
(3) Represents the effects
of the fluctuations between the ZAR and the U.S. dollar.
The Company has agreements with reinsurance companies in order to limit its losses from certain insurance contracts, however, if the reinsurer is unable to meet its obligations, the Company retains the liability.
The Company determines its reserves for policy benefits under its life insurance products using a model which estimates claims incurred that have not been reported and total present value of disability claims-in-payment at the balance sheet date. This model allows for best estimate assumptions based on experience (where sufficient) plus prescribed margins, as required in the markets in which these products are offered, namely South Africa. The best estimate assumptions include (i) mortality and morbidity assumptions reflecting the company’s most recent experience and (ii) claim reporting delays reflecting Company specific and industry experience. Most of the disability claims-in-payment reserve is reinsured and the reported values were based on the reserve held by the relevant reinsurer.
Assets and policyholder liabilities under investment contracts
Summarized below is the movement in assets and policyholder liabilities under investment contracts during the three months ended September 30, 2018:
| Investment | ||||||
| Assets(1) | contracts(2) | |||||
| Balance as of June 30, 2018 | $ | 610 | $ | (610 | ) | |
| Increase in policyholder benefits under investment contracts | 6 | (6 | ) | |||
| Foreign currency adjustment(3) | (18 | ) | 18 | |||
| Balance as of September 30, 2018 | $ | 598 | $ | (598 | ) |
(1) Included in other long-term
assets.
(2) Included in other long-term
liabilities.
(3) Represents the effects
of the fluctuations between the ZAR and the U.S. dollar.
The Company does not offer any investment products with guarantees related to capital or returns.
21
10. Borrowings
South Africa
The amounts below have been translated at exchange rates applicable as of the dates specified.
July 2017 Facilities, as amended, comprising a short-term facility and long-term borrowings
Long-term borrowings – Facilities A, B, C and D
The Company’s South African amended July 2017 Facilities agreement is described in Note 14 to the Company’s audited consolidated financial statements included in its Annual Report on Form 10-K for the year ended June 30, 2018. The carrying value of these long-term borrowings as of September 30, 2018, was ZAR 529.9 million ($37.5 million), net of deferred fees of ZAR 2.6 million ($0.2 million), and the carrying amount approximated its fair value. Interest on these term loans is payable on the last business day of March, June, September and December of each year and on the final maturity date based on the Johannesburg Interbank Agreed Rate (“JIBAR”) in effect from time to time plus a margin of 2.75% . The JIBAR has been set at 7.00% for the period to December 28, 2018, in respect of the loans provided under the South African long-term facilities agreement. The next scheduled principal repayment of ZAR 151.3 million ($10.7 million, translated at exchange rates applicable as of September 30, 2018) is due on December 28, 2018.
Short-term facility - Facility E
On September 26, 2018, Net1 Applied Technologies South Africa Proprietary Limited (“Net1 SA”) further amended its amended July 2017 Facilities agreement with Rand Merchant Bank, a division of FirstRand Bank Limited (“RMB”) to include an overdraft facility (“Facility E”) of up to ZAR 1.5 billion ($106.1 million) to fund the Company’s ATMs. Interest on the overdraft facility is payable on the last day of each month and on the final maturity date based on South African prime rate less a margin of 1.00% . The overdraft facility matures on September 26, 2019. The overdraft facility amount utilized must be repaid in full within one month of utilization and at least 90% of the amount utilized must be repaid with 25 days. The overdraft facility is secured by a pledge by Net1 SA of, among other things, cash and certain bank accounts utilized in the Company’s ATM funding process, the cession of an insurance policy with Senate Transit Underwriters Managers Proprietary Limited, and any rights and claims Net1 SA has against Grindrod Bank Limited. The Company paid a non-refundable origination fee of approximately ZAR 3.6 million ($0.2 million) in October 2018. As at September 30, 2018, the Company had utilized approximately ZAR 1.1 billion ($76.6 million translated at exchange rates applicable as of September 30, 2018) of this overdraft facility. This ZAR 1.5 billion overdraft facility may only be used to fund ATMs and therefore the overdraft utilized and converted to cash to fund the Company’s ATMs is considered restricted cash. The prime rate on September 30, 2018, was 10.0% .
Nedbank facility, comprising short-term facilities
As of September 30, 2018, the aggregate amount of the Company’s short-term South African credit facility with Nedbank Limited was ZAR 700.0 million ($49.5 million) and consists of (i) a primary amount of up to ZAR 450 million ($31.8 million), (ii) a temporary amount of ZAR 250.0 million ($17.7 million), and (iii) a secondary amount, which has been temporarily withdrawn as discussed below. The primary amount comprises an overdraft facility of (i) up to ZAR 300 million ($21.2 million), which is further split into (a) a ZAR 250.0 million ($17.7 million) overdraft facility which may only be used to fund ATMs used at pay points and (b) a ZAR 50 million ($3.5 million) general banking facility and (ii) indirect and derivative facilities of up to ZAR 150 million ($10.6 million), which include letters of guarantees, letters of credit and forward exchange contracts. The temporary amount has been made available until January 31, 2019, at which time any amount utilized must be repaid in full and the secondary amount of ZAR 200.0 million ($14.1 million) will be made available again. The ZAR 250.0 million component of the primary amount may only be used to fund ATMs and therefore this component of the primary amount utilized and converted to cash to fund our ATMs is considered restricted cash.
As of September 30, 2018, the interest rate on the overdraft facility was 8.85% . The Company has ceded its investment in Cash Paymaster Services Proprietary Limited (“CPS”), a South African subsidiary, as well as all of its rights, title and interest in an insurance policy issued by Fidelity Risk Proprietary Limited as security for its repayment obligations under the facility. A commitment fee of 0.35% per annum is payable on the monthly unutilized amount of the overdraft portion of the short-term facility. The Company is required to comply with customary non-financial covenants, including, without limitation, covenants that restrict its ability to dispose of or encumber its assets, incur additional indebtedness or engage in certain business combinations.
As of September 30, 2018, the Company has utilized approximately ZAR 115.6 million ($8.2 million) of its ZAR 250 million overdraft facility to fund ATMs. As of September 30, 2018 and June 30, 2018, the Company had utilized approximately ZAR 132.2 million ($9.3 million) and ZAR 108.0 million ($7.9 million), respectively, of its indirect and derivative facilities of ZAR 150 million to enable the bank to issue guarantee, letters of credit and forward exchange contracts, in order for the Company to honor its obligations to third parties requiring such guarantees (refer to Note 19).
22
10. Borrowings (continued)
South Africa (continued)
June 2018 Facility, a long-term borrowing
The Company’s South African long-term facility agreement is described in Note 14 to the Company’s audited consolidated financial statements included in its Annual Report on Form 10-K for the year ended June 30, 2018. The current carrying value as of September 30, 2018, was ZAR 115.0 million ($8.1 million). Interest on the revolving credit facility is payable quarterly based on JIBAR in effect from time to time plus a margin of 2.75% . The Company paid a non-refundable origination fee of approximately ZAR 2.0 million ($0.1 million) during the three months ended September 30, 2018.
United States, a short-term facility
On September 14, 2018, the Company renewed its $10.0 million overdraft facility from Bank Frick. The interest rate on the facilities is 4.50% plus 3-month US dollar LIBOR and interest is payable quarterly commencing on September 30, 2018. The 3-month US dollar LIBOR rate was 2.39838% on September 28, 2018. The facility has no fixed term, however, it may be terminated by either party with six weeks written notice. The facility is secured by a pledge of the Company’s investment in Bank Frick. As of September 30, 2018, the Company had utilized approximately $3.3 million of this facility.
South Korea, comprising long-term borrowings
The Company’s South Korean senior secured loan facility is described in Note 14 to its audited consolidated financial statements included in its Annual Report on Form 10-K for the year ended June 30, 2018. On July 29, 2017, the Company utilized approximately KRW 0.3 billion ($0.3 million) of its Facility C revolving credit facility to pay interest due on the Company’s South Korean senior secured loan facility. On October 20, 2017, the Company made an unscheduled repayment of $16.6 million and settled the full outstanding balance, including interest, related to these borrowings.
Movement in short-term credit facilities
Summarized below are the Company’s short-term facilities as of September 30, 2018, and the movement in the Company’s short-term facilities from as of June 30, 2018 to as of September 30, 2018:
| South Africa | United States | ||||||||||||||
| Amended | |||||||||||||||
| July 2017 | Nedbank | Bank Frick | Total | ||||||||||||
| Short-term facilities as of September 30, 2018: | $ | 106,054 | $ | 49,492 | $ | 10,000 | $ | 165,546 | |||||||
| Overdraft | - | 21,211 | 10,000 | 31,211 | |||||||||||
| Overdraft restricted as to use for ATM funding only | 106,054 | 17,676 | - | 123,730 | |||||||||||
| Indirect and derivative facilities | - | 10,605 | - | 10,605 | |||||||||||
| Movement in utilized overdraft facilities: | |||||||||||||||
| Balance as of June 30, 2018 | - | - | - | - | |||||||||||
| Utilized | 73,500 | 7,842 | 3,313 | 84,655 | |||||||||||
| Foreign currency adjustment(1) | 3,105 | 331 | - | 3,436 | |||||||||||
| Balance as of September 30, 2018 | 76,605 | 8,173 | 3,313 | 88,091 | |||||||||||
| Restricted as to use for ATM funding only | 76,605 | 8,173 | - | 84,778 | |||||||||||
| No restrictions as to use | - | - | 3,313 | 3,313 | |||||||||||
| Movement in utilized indirect and derivative facilities: | |||||||||||||||
| Balance as of June 30, 2018 | - | 7,871 | - | 7,871 | |||||||||||
| Guarantees cancelled | - | (848 | ) | - | (848 | ) | |||||||||
| Utilized | - | 2,436 | - | 2,436 | |||||||||||
| Foreign currency adjustment(1) | - | (110 | ) | - | (110 | ) | |||||||||
| Balance as of September 30, 2018 | $ | - | $ | 9,349 | $ | - | $ | 9,349 | |||||||
(1) Represents the effects of the fluctuations between the ZAR and the U.S. dollar.
23
10. Borrowings (continued)
Movement in long-term borrowings
Summarized below is the movement in the Company’s long term borrowing from as of June 30, 2018 to as of September 30, 2018:
| South Africa | ||||||||||||
| Amended | June 2018 | |||||||||||
| July 2017 | Facility | Total | ||||||||||
| Included in current portion of long-term borrowings | $ | 44,695 | $ | - | $ | 44,695 | ||||||
| Included in long-term borrowings | 5,469 | - | 5,469 | |||||||||
| Balance as of June 30, 2018 | 50,164 | - | 50,164 | |||||||||
| Utilized | - | 7,801 | 7,801 | |||||||||
| Repaid | (10,260 | ) | - | (10,260 | ) | |||||||
| Foreign currency adjustment(1) | (2,438 | ) | 330 | (2,108 | ) | |||||||
| Balance as of September 30, 2018 | 37,466 | 8,131 | 45,597 | |||||||||
| Included in current portion of long-term borrowings | 33,937 | - | 33,937 | |||||||||
| Included in long-term borrowings | $ | 3,529 | $ | 8,131 | $ | 11,660 | ||||||
(1) Represents the effects of the fluctuations between the ZAR and the U.S. dollar.
The Company paid a non-refundable deal origination fee of approximately ZAR 6.3 million ($0.6 million) in August 2017. Interest expense incurred under the Company’s South African long-term borrowing during the three months ended September 30, 2018 and 2017, was $1.1 million and $1.7 million, respectively. The prepaid facility fees amortization charged included in interest expense during each of the three months ended September 30, 2018 and 2017, was $0.1 million, respectively.
Interest expense incurred under the Company South Korean long-term borrowings during the three months ended September 30, 2017, was $0.2 million and prepaid facility fees amortized were $0.03 million.
11. Capital structure
The following table presents a reconciliation between the number of shares, net of treasury, presented in the unaudited condensed consolidated statement of changes in equity during the three months ended September 30, 2018 and 2017, respectively, and the number of shares, net of treasury, excluding non-vested equity shares that have not vested during the three months ended September 30, 2018 and 2017, respectively:
| September 30, | September 30, | |||||
| 2018 | 2017 | |||||
| Number of shares, net of treasury: | ||||||
| Statement of changes in equity | 56,833,925 | 56,927,696 | ||||
| Less: Non-vested equity shares that have not vested (Note 13) | 860,817 | 1,007,182 | ||||
| Number
of shares, net of treasury excluding
non- vested equity shares that have not vested |
55,973,108 | 55,920,514 |
24
12. Accumulated other comprehensive loss
The table below presents the change in accumulated other comprehensive (loss) income per component during the three months ended September 30, 2018:
| Three months ended | ||||||||||
| September 30, 2018 | ||||||||||
| Accumulated | ||||||||||
| net | ||||||||||
| unrealized | ||||||||||
| Accumulated | income on | |||||||||
| foreign | asset | |||||||||
| currency | available for | |||||||||
| translation | sale, net of | |||||||||
| reserve | tax | Total | ||||||||
| Balance as of June 30, 2018 (as reported, refer to Note 1) | $ | (184,436 | ) | $ | 25,199 | $ | (159,237 | ) | ||
| Correction of error (Note 1) | - | (25,199 | ) | (25,199 | ) | |||||
| Balance as of June 30, 2018 (as restated, refer to Note 1) | $ | (184,436 | ) | $ | - | $ | (184,436 | ) | ||
| Movement in foreign currency
translation reserve related to equity- accounted investment |
5,430 | - | 5,430 | |||||||
| Movement in foreign currency translation reserve | (10,522 | ) | - | (10,522 | ) | |||||
| Balance as of September 30, 2018 | $ | (189,528 | ) | $ | - | $ | (189,528 | ) | ||
There were no reclassifications from accumulated other comprehensive loss to net (loss) income during the three months ended September 30, 2018 or 2017.
13. Stock-based compensation
Stock option and restricted stock activity
Options
The following table summarizes stock option activity for the three months ended September 30, 2018 and 2017:
| Weighted | |||||||||||||||
| Weighted | average | Weighted | |||||||||||||
| average | remaining | Aggregate | average | ||||||||||||
| exercise | contractu | intrinsic | grant date | ||||||||||||
| Number of | price | al term | value | fair value | |||||||||||
| shares | ($) | (in years) | ($’000) | ($) | |||||||||||
| Outstanding – June 30, 2018 | 809,274 | 13.99 | 2.67 | 370 | 4.20 | ||||||||||
| Granted – September 2018 | 600,000 | 6.20 | 10.00 | 1,212 | 2.02 | ||||||||||
| Forfeitures | (200,000 | ) | 24.46 | 7.17 | |||||||||||
| Outstanding – September 30, 2018 | 1,209,274 | 8.41 | 6.59 | 1,322 | 2.62 | ||||||||||
| Outstanding – June 30, 2017 | 846,607 | 13.87 | 3.80 | 486 | 4.21 | ||||||||||
| Forfeitures | (37,333 | ) | 11.23 | 4.55 | |||||||||||
| Outstanding – September 30, 2017 | 809,274 | 13.99 | 3.40 | 468 | 4.20 |
During the three months ended September 30, 2018, 600,000 stock options were awarded to executive officers and employees. No stock options were awarded during the three months ended September 30, 2017. During the three months ended September 30, 2018, executive officers forfeited 200,000 stock options granted in August 2008, with a strike price of $24.46 per share, as these stock options expired unexercised. During the three months ended September 30, 2017, employees forfeited 37,333 stock options.
The fair value of each option is estimated on the date of grant using the Cox Ross Rubinstein binomial model that uses the assumptions noted in the following table. The estimated expected volatility is calculated based on the Company’s 750 day volatility. The estimated expected life of the option was determined based on historical behavior of employees who were granted options with similar terms.
25
13. Stock-based compensation (continued)
Stock option and restricted stock activity (continued)
Options (continued)
The table below presents the range of assumptions used to value options granted during the three months ended September 30, 2018:
| Three months | |
| ended | |
| September 30, | |
| 2018 | |
| Expected volatility | 44% |
| Expected dividends | 0% |
| Expected life (in years) | 3 |
| Risk-free rate | 2.75% |
The following table presents stock options vested and expected to vest as of September 30, 2018:
| Weighted | |||||||||||||
| Weighted | average | ||||||||||||
| average | remaining | Aggregate | |||||||||||
| exercise | contractual | intrinsic | |||||||||||
| Number of | price | term | value | ||||||||||
| shares | ($) | (in years) | ($’000) | ||||||||||
| Vested and expected to vest – September 30, 2018 | 1,209,274 | 8.41 | 6.59 | 1,322 |
These options have an exercise price range of $6.20 to $13.16.
The following table presents stock options that are exercisable as of September 30, 2018:
| Weighted | |||||||||||||
| Weighted | average | ||||||||||||
| average | remaining | Aggregate | |||||||||||
| exercise | contractual | intrinsic | |||||||||||
| Number of | price | term | value | ||||||||||
| shares | ($) | (in years) | ($’000) | ||||||||||
| Exercisable – September 30, 2018 | 609,274 | 10.56 | 3.22 | 242 |
During the three months ended September 30, 2018, no stock options became exercisable. However, during the three months ended September 30, 2017 105,982 stock options became exercisable. The Company issues new shares to satisfy stock option exercises.
26
13. Stock-based compensation (continued)
Stock option and restricted stock activity (continued)
Restricted stock
The following table summarizes restricted stock activity for the three months ended September 30, 2018 and 2017:
| Number of | Weighted | |||||
| shares of | average grant | |||||
| restricted | date fair value | |||||
| stock | ($’000) | |||||
| Non-vested – June 30, 2018 | 765,411 | 6,162 | ||||
| Granted – September 2018 | 148,000 | 114 | ||||
| Vested – August 2018 | (52,594 | ) | 459 | |||
| Non-vested – September 30, 2018 | 860,817 | 5,785 | ||||
| Non-vested – June 30, 2017 | 505,473 | 11,173 | ||||
| Granted – August 2017 | 588,594 | 4,288 | ||||
| Vested – August 2017 | (56,250 | ) | 527 | |||
| Forfeitures | (30,635 | ) | 358 | |||
| Non-vested – September 30, 2017 | 1,007,182 | 9,689 |
The September 2018 grants comprise 148,000 shares of restricted stock awarded to executive officers that are subject to market and time-based vesting. The August 2017 grants comprise (i) 326,000 shares of restricted stock awarded to executive officers and employees that are subject to time-based vesting, (ii) 210,000 shares of restricted stock awarded to executive officers that are subject to market and time-based vesting, and (iii) 52,594 shares of restricted stock awarded to non-employee directors.
The 326,000 shares of restricted stock will only vest if the recipient is employed by the Company on a full-time basis on August 23, 2020. The 52,594 shares of restricted stock awarded to non-employee directors in August 2017 vested on August 23, 2018. During the three months ended September 30, 2017, 56,250 shares of restricted stock granted to non-employee directors vested and employees forfeited 30,635 shares of restricted stock with either market or performance conditions upon their termination from the Company.
Market Conditions - Restricted Stock Granted in September 2018
The 148,000 shares of restricted stock awarded to executive officers in September 2018 are subject to time-based and performance-based (a market condition) vesting conditions and vest in full only on the date, if any, that the following conditions are satisfied: (1) the price of the Company’s common stock must equal or exceed certain agreed VWAP levels (as described below) during a measurement period commencing on the date that it files its Annual Report on Form 10-K for the fiscal year ended 2021 and ending on December 31, 2021 and (2) the recipient is employed by the Company on a full-time basis when the condition in (1) is met. If either of these conditions is not satisfied, then none of the shares of restricted stock will vest and they will be forfeited. The $23.00 price target represents an approximate 55% increase, compounded annually, in the price of the Company’s common stock on Nasdaq over the $6.20 closing price on September 7, 2018.
The VWAP levels and vesting percentages related to such levels are as follows:
- Below $15.00 (threshold)—0%
- At or above $15.00 and below $19.00—33%
- At or above $19.00 and below $23.00—66%
- At or above $23.00—100%
The fair value of these shares of restricted stock was calculated using a Monte Carlo simulation of a stochastic volatility process. The choice of a stochastic volatility process as an extension to the standard Black Scholes process was driven by both observation of larger than expected moves in the daily time series for the Company’s VWAP price, but also the observation of the strike structure of volatility (i.e. skew and smile) for out-of-the money calls and out-of-the money puts versus at-the-money options for both the Company’s stock and NASDAQ futures.
27
13. Stock-based compensation (continued)
Stock option and restricted stock activity (continued)
Restricted stock (continued)
Market Conditions - Restricted Stock Granted in September 2018 (continued)
In scenarios where the shares do not vest, the final vested value at maturity is zero. In scenarios where vesting occurs, the final vested value on maturity is the share price on vesting date. In its calculation of the fair value of the restricted stock, the Company used an average volatility of 37.4% for the VWAP price, a discounting based on USD overnight indexed swap rates for the grant date, and no future dividends. The average volatility was extracted from the time series for VWAP prices as the standard deviation of log prices for the three years preceding the grant date. The mean reversion of volatility and the volatility of volatility parameters of the stochastic volatility process were extracted by regressing log differences against log levels of volatility from the time series for at-the-money options 30 day volatility quotes, which were available from January 2, 2018 onwards.
Market Conditions - Restricted Stock Granted in August 2017
The 210,000 shares of restricted stock awarded to executive officers in August 2017 are subject to time-based and performance-based (a market condition) vesting conditions and vest in full only on the date, if any, that the following conditions are satisfied: (1) the price of the Company’s common stock must equal or exceed certain agreed VWAP levels (as described below) during a measurement period commencing on the date that it files its Annual Report on Form 10-K for the fiscal year ended 2020 and ending on December 31, 2020 and (2) the recipient is employed by the Company on a full-time basis when the condition in (1) is met. If either of these conditions is not satisfied, then none of the shares of restricted stock will vest and they will be forfeited. The $23.00 price target represents an approximate 35% increase, compounded annually, in the price of the Company’s common stock on Nasdaq over the $9.38 closing price on August 23, 2017. The VWAP levels and vesting percentages related to such levels are as follows:
- Below $15.00 (threshold)—0%
- At or above $15.00 and below $19.00—33%
- At or above $19.00 and below $23.00—66%
- At or above $23.00—100%
These 210,000 shares of restricted stock are effectively forward starting knock-in barrier options with multi-strike prices of zero. The fair value of these shares of restricted stock was calculated utilizing a Monte Carlo simulation model which was developed for the purpose of the valuation of these shares. For each simulated share price path, the market share price condition was evaluated to determine whether or not the shares would vest under that simulation. A standard Geometric Brownian motion process was used in the forecasting of the share price instead of a “jump diffusion” model, as the share price volatility was more stable compared to the highly volatile regime of previous years. Therefore, the simulated share price paths capture the idiosyncrasies of the observed Company share price movements.
In scenarios where the shares do not vest, the final vested value at maturity is zero. In scenarios where vesting occurs, the final vested value on maturity is the share price on vesting date. The value of the grant is the average of the discounted vested values. The Company used an expected volatility of 44.0%, an expected life of approximately three years, a risk-free rate ranging between 1.275% to 1.657% and no future dividends in its calculation of the fair value of the restricted stock. The estimated expected volatility was calculated based on the Company’s 30 day VWAP share price using the exponentially weighted moving average of returns.
Performance Conditions - Restricted Stock Granted in August 2016
In August 2016 the Company awarded 350,000 shares of restricted stock to executive officers. In May 2017, the Company agreed to accelerate the vesting of 200,000 of these shares of restricted stock granted to the Company’s former Chief Executive Officer. The remaining 150,000 shares continue to be subject to time-based and performance-based vesting conditions. In order for any of the shares to vest, the recipient must remain employed by the Company on a full-time basis on the date that it files its Annual Report on Form 10-K for the fiscal year ended June 30, 2019. If that condition is satisfied, then the shares will vest based on the level of Fundamental EPS the Company achieves for the fiscal year ended June 30, 2019 (“2019 Fundamental EPS”), as follows:
- One-third of the shares will vest if the Company achieves 2019 Fundamental EPS of $2.60;
- Two-thirds of the shares will vest if the Company achieves 2019 Fundamental EPS of $2.80; and
- All of the shares will vest if the Company achieves 2019 Fundamental EPS of $3.00.
28
13. Stock-based compensation (continued)
Stock option and restricted stock activity (continued)
Restricted stock (continued)
Performance Conditions - Restricted Stock Granted in August 2016 (continued)
At levels of 2019 Fundamental EPS greater than $2.60 and less than $3.00, the number of shares that will vest will be determined by linear interpolation relative to 2019 Fundamental EPS of $2.80. Any shares that do not vest in accordance with the above-described conditions will be forfeited. All shares of restricted stock have been valued utilizing the closing price of shares of the Company’s common stock quoted on The Nasdaq Global Select Market on the date of grant.
The fair value of restricted stock vesting during the three months ended September 30, 2018 and 2017, was $0.5 million.
Stock-based compensation charge and unrecognized compensation cost
The Company recorded a stock-based compensation charge during each of the three months ended September 30, 2018 and 2017 of $0.6 million and $0.8 million respectively, which comprised:
| Allocated to cost | ||||||||||
| of goods sold, IT | Allocated to | |||||||||
| processing, | selling, general | |||||||||
| Total | servicing and | and | ||||||||
| charge | support | administration | ||||||||
| Three months ended September 30, 2018 | ||||||||||
| Stock-based compensation charge | $ | 587 | - | $ | 587 | |||||
| Total – three months ended September 30, 2018 | $ | 587 | $ | - | $ | 587 | ||||
| Three months ended September 30, 2017 | ||||||||||
| Stock-based compensation charge | $ | 869 | $ | - | $ | 869 | ||||
| Reversal of stock compensation charge
related to restricted stock forfeited |
(42 | ) | - | (42 | ) | |||||
| Total – three months ended September 30, 2017 | $ | 827 | $ | - | $ | 827 |
The stock-based compensation charges have been allocated to selling, general and administration based on the allocation of the cash compensation paid to the relevant employees.
As of September 30, 2018, the total unrecognized compensation cost related to stock options was approximately $1.2 million, which the Company expects to recognize over approximately three years. As of September 30, 2018, the total unrecognized compensation cost related to restricted stock awards was approximately $3.1 million, which the Company expects to recognize over approximately two years.
As of each of September 30, 2018 and June 30, 2018, respectively, the Company recorded a deferred tax asset of approximately $0.7 million, related to the stock-based compensation charge recognized related to employees of Net1. As of each of September 30, 2018, and June 30, 2018, respectively, the Company recorded a valuation allowance of approximately $0.7 million related to the deferred tax asset because it does not believe that the stock-based compensation deduction would be utilized as it does not anticipate generating sufficient taxable income in the United States. The Company deducts the difference between the market value on date of exercise by the option recipient and the exercise price from income subject to taxation in the United States.
14. Earnings per share
The Company has issued redeemable common stock which is redeemable at an amount other than fair value. Redemption of a class of common stock at other than fair value increases or decreases the carrying amount of the redeemable common stock and is reflected in basic earnings per share using the two-class method. There were no redemptions of common stock, or adjustments to the carrying value of the redeemable common stock during the three months ended September 30, 2018 or 2017. Accordingly, the two-class method presented below does not include the impact of any redemption. The Company’s redeemable common stock is described in Note 15 to the Company’s audited consolidated financial statements included in its Annual Report on Form 10-K for the year ended June 30, 2018.
Basic earnings per share include shares of restricted stock that meet the definition of a participating security because these shares are eligible to receive non-forfeitable dividend equivalents at the same rate as common stock. Basic earnings per share have been calculated using the two-class method and basic earnings per share for the three months ended September 30, 2018 and 2017, reflects only undistributed earnings. The computation below of basic earnings per share excludes the net income attributable to shares of unvested restricted stock (participating non-vested restricted stock) from the numerator and excludes the dilutive impact of these unvested shares of restricted stock from the denominator.
29
14. Earnings per share (continued)
Diluted earnings per share have been calculated to give effect to the number of shares of additional common stock that would have been outstanding if the potential dilutive instruments had been issued in each period. Stock options are included in the calculation of diluted earnings per share utilizing the treasury stock method and are not considered to be participating securities, as the stock options do not contain non-forfeitable dividend rights.
The calculation of diluted earnings per share includes the dilutive effect of a portion of the restricted stock granted to employees in August 2016, August 2017, March 2018, May 2018 and September 2018 as these shares of restricted stock are considered contingently returnable shares for the purposes of the diluted earnings per share calculation and the vesting conditions in respect of a portion of the restricted stock had been satisfied. The vesting conditions for awards made in September 2018, March 2018, August 2017 and August 2016 are discussed in Note 13 and the vesting conditions for all other awards are discussed in Note 18 to the Company’s audited consolidated financial statements included in its Annual Report on Form 10-K for the year ended June 30, 2018.
The following table presents net income attributable to Net1 (income from continuing operations) and the share data used in the basic and diluted earnings per share computations using the two-class method:
| Three months ended | ||||||
| September 30, | ||||||
| 2018 | 2017 | |||||
| (in thousands except | ||||||
| percent and | ||||||
| per share data) | ||||||
| Numerator: | ||||||
| Net (loss) income attributable to Net1 | ($5,199 | ) | $ | 19,483 | ||
| Undistributed (loss) earnings | (5,199 | ) | 19,483 | |||
| Percent allocated to common shareholders (Calculation 1) | 99% | 99% | ||||
| Numerator for earnings per share: basic and diluted | ($5,128 | ) | $ | 19,267 | ||
| Denominator: | ||||||
| Denominator for
basic (loss) earnings per share: weighted-average
common shares outstanding |
55,951 | 56,562 | ||||
| Effect of dilutive securities: | ||||||
| Stock options | 50 | 47 | ||||
| Denominator
for diluted (loss) earnings per share:
adjusted weighted average common shares outstanding and assumed conversion |
56,001 | 56,609 | ||||
| (Loss) Earnings per share: | ||||||
| Basic | $(0.09 | ) | $ | 0.34 | ||
| Diluted | $(0.09 | ) | $ | 0.34 | ||
| (Calculation 1) | ||||||
| Basic weighted-average common shares outstanding (A) | 55,951 | 56,562 | ||||
| Basic weighted-average common
shares outstanding and
unvested restricted shares expected to vest (B) |
56,723 | 57,196 | ||||
| Percent allocated to common shareholders (A) / (B) | 99% | 99% | ||||
Options to purchase 503,698 shares of the Company’s common stock at prices ranging from $8.75 to $13.16 per share were outstanding during the three months ended September 30, 2018, but were not included in the computation of diluted earnings per share because the options’ exercise price was greater than the average market price of the Company’s common stock. The options, which expire at various dates through August 27, 2024, were still outstanding as of September 30, 2018.
30
15. Supplemental cash flow information
The following table presents supplemental cash flow disclosures for the three months ended September 30, 2018 and 2017:
| Three months ended | ||||||
| September 30, | ||||||
| 2018 | 2017 | |||||
| Cash received from interest | $ | 2,077 | $ | 5,286 | ||
| Cash paid for interest | $ | 3,066 | $ | 2,088 | ||
| Cash paid for income taxes | $ | 1,343 | $ | 2,036 | ||
16. Revenue recognition
The Company is a leading provider of transaction processing services, financial inclusion products and services and secure payment technology. The Company operates market-leading payment processors in South Africa and internationally. The Company offers debit, credit and prepaid processing and issuing services for all major payment networks. In South Africa, The Company provides innovative low-cost financial inclusion products, including banking, lending and insurance, and is a leading distributor of mobile subscriber starter packs for Cell C, a South African mobile network operator.
Disaggregation of revenue
The following table represents our revenue disaggregated by major revenue streams, including reconciliation to operating segments for the three months ended September 30, 2018:
| Rest of | ||||||||||||
| South | the | |||||||||||
| Africa | Korea | world | Total | |||||||||
| South African transaction processing | ||||||||||||
| Processing fees | $ | 30,229 | $ | - | $ | - | $ | 30,229 | ||||
| Welfare benefit distributions fees | 3,086 | - | - | 3,086 | ||||||||
| Other | 1,148 | - | - | 1,148 | ||||||||
| Sub-total | 34,463 | - | - | 34,463 | ||||||||
| International transaction processing | ||||||||||||
| Processing fees | - | 34,589 | 2,655 | 37,244 | ||||||||
| Other | - | 1,962 | 181 | 2,143 | ||||||||
| Sub-total | - | 36,551 | 2,836 | 39,387 | ||||||||
| Financial inclusion and applied technologies | ||||||||||||
| Telecom products and services | 19,147 | - | - | 19,147 | ||||||||
| Account holder fees | 10,605 | - | - | 10,605 | ||||||||
| Lending revenue | 9,977 | - | - | 9,977 | ||||||||
| Technology products | 4,268 | - | - | 4,268 | ||||||||
| Insurance revenue | 2,515 | - | - | 2,515 | ||||||||
| Other | 5,522 | - | - | 5,522 | ||||||||
| Sub-total | 52,034 | - | - | 52,034 | ||||||||
| $ | 86,497 | $ | 36,551 | $ | 2,836 | $ | 125,884 |
Nature of goods and services
Processing fees
The Company earns processing fees from transactions processed for its customers. The Company provides its customers with transaction processing services that involve the collection, transmittal and retrieval of all transaction data in exchange for consideration upon completion of the transaction. In certain instances, the Company also provides a funds collection and settlement service for its customers. The Company considers these services as a single performance obligation. The Company’s contracts specify a transaction price for services provided. Processing revenue fluctuates based on the type and the volume of transactions processed. Revenue is recognized on the completion of the processed transaction.
Customers that have a bank account managed by the Company are issued cards that can be utilized to withdraw funds at an ATM or to transact at a merchant point of sale device (“POS”). The Company earns processing fees from transactions processed for these customers. The Company’s contracts specify a transaction price for each service provided (for instance, ATM withdrawal, balance enquiry, etc.). Processing revenue fluctuates based on the type and the volume of transactions performed by the customer. Revenue is recognized on the completion of the processed transaction.
31
16. Revenue recognition (continued)
Nature of goods and services (continued)
Welfare benefit distribution fees
The Company’s provided a welfare benefits distribution service in South Africa to a customer under a contract which expired on September 30, 2018. The Company was required to distribute social welfare grants to identified recipients using an internally developed payment platform at designated distribution points (pay points) which enabled the recipients to access their grants. The contract specified a fixed fee per account for one or more grants received by a recipient. The Company recognized revenue for each grant recipient paid at the fixed fee.
Telecom products and services
The Company has entered into contracts with mobile networks in South Africa to distribute subscriber identity modules (“SIM”) cards on their behalf. The Company is entitled to receive consideration based on the activation of each SIM as well as from a percentage of the value loaded onto each SIM. The Company recognizes revenue from these services once the criteria specified for activation have been met as well as when it is entitled to its consideration related to the value loaded onto the SIM. Revenue from contracts with mobile networks fluctuates based on the number of SIMs activated as well as on the value loaded onto the SIM.
The Company purchases airtime for resale to customers. The Company recognizes revenue as the airtime is delivered to the customer. Revenue from the resale of airtime to customers fluctuates based on volume of airtime sold.
Account holder fees
The Company provides bank accounts to customers and this service is underwritten by a regulated banking institution because the Company is not a bank. The Company charges its customers a fixed monthly bank account administration fee for all active bank accounts regardless of whether the account holder has transacted or not. The Company recognizes account holder fees on a monthly basis on all active bank accounts. Revenue from account holder’s fees fluctuates based on the number of active bank accounts.
Lending revenue
The Company provides short-term loans to customers in South Africa and charges up-front initiation fees and monthly service fees. Initiation fees are recognized using the effective interest rate method, which requires the utilization of the rate of return implicit in the loan, that is, the contractual interest rate adjusted for any net deferred loan fees or costs, premium, or discount existing at the origination or acquisition of the loan. Monthly service fee revenue is recognized under the contractual terms of the loan. The monthly service fee amount is fixed upon initiation and does not change over the term of the loan.
Technology products
The Company supplies hardware and licenses for its customers to use the Company’s technology. Hardware includes the sale of POS devices, SIM cards and other consumables which can occur on an ad hoc basis. The Company recognizes revenue from hardware at the transaction price specified in the contract as the hardware is delivered to the customer. Licenses include right to use certain technology developed by the Company and is recognized ratably over the license period.
Insurance revenue
The Company writes life insurance contracts, and policy holders pay the Company a monthly insurance premium at the beginning of each month. Premium revenue is recognized on a monthly basis net of policy lapses. Policy lapses are provided for on the basis of expected non-payment of policy premiums.
Significant judgments and estimates
The Company is subject to a court process regarding determining the price to be charged for welfare benefit distribution services provided from April 1, 2018 to September 30, 2018. Management determined, under previous revenue guidance, that there was no evidence of an arrangement at a fixed and determinable price other than that noted in the court ordered extension and did not record any additional revenue related to the services provided from April 1, 2018 to June 30, 2018, and recorded revenue at the rate specified in the contract. Upon adoption of the new revenue guidance, the Company has determined it is unable to estimate the amount of revenue that it is entitled to receive because the court has not yet confirmed the amount. Accordingly, the Company has not recorded any additional revenue during the three months ended September 30, 2018, related to the price to be charged for welfare benefit distribution services provided that is subject to the courts confirmation. The Company continues to record revenue at the rate specified in the contact. The Company expects to record any additional revenue in the month that the court confirms the fee that the Company is entitled to charge.
32
16. Revenue recognition (continued)
Accounts Receivable, Contract Assets and Contract Liabilities
The Company recognizes accounts receivable when its right to consideration under its contracts with customers becomes unconditional. The Company has no contract assets or contract liabilities.
17. Operating segments
The Company discloses segment information as reflected in the management information systems reports that its chief operating decision maker uses in making decisions and to report certain entity-wide disclosures about products and services, major customers, and the countries in which the entity holds material assets or reports material revenues. A description of the Company’s operating segments is contained in Note 22 to the Company’s audited consolidated financial statements included in its Annual Report on Form 10-K for the year ended June 30, 2018.
The reconciliation of the reportable segment’s revenue to revenue from external customers for the three months ended September 30, 2018 and 2017, is as follows:
| Revenue | |||||||||
| From | |||||||||
| Reportable | Inter- | external | |||||||
| Segment | segment | customers | |||||||
| South African transaction processing | $ | 37,749 | $ | 3,286 | $ | 34,463 | |||
| International transaction processing | 39,387 | - | 39,387 | ||||||
| Financial inclusion and applied technologies | 53,206 | 1,172 | 52,034 | ||||||
| Total for the three months ended September 30, 2018 | $ | 130,342 | $ | 4,458 | $ | 125,884 | |||
| South African transaction processing | $ | 66,437 | $ | 6,145 | $ | 60,292 | |||
| International transaction processing | 46,022 | - | 46,022 | ||||||
| Financial inclusion and applied technologies | 54,313 | 8,069 | 46,244 | ||||||
| Total for the three months ended September 30, 2017 | $ | 166,772 | $ | 14,214 | $ | 152,558 | |||
The Company does not allocate interest income, interest expense or income tax expense to its reportable segments. The Company evaluates segment performance based on segment operating income before acquisition-related intangible asset amortization which represents operating income before acquisition-related intangible asset amortization and allocation of expenses allocated to Corporate/Eliminations, all under GAAP.
The reconciliation of the reportable segments measure of profit or loss to income before income taxes for the three months ended September 30, 2018 and 2017, is as follows:
| Three months ended | ||||||
| September 30, | ||||||
| 2018 | 2017 | |||||
| Reportable segments measure of profit or loss | $ | 10,551 | $ | 31,568 | ||
| Operating (loss): Corporate/Eliminations | (9,655 | ) | (6,562 | ) | ||
| Interest income | 1,876 | 5,044 | ||||
| Interest expense | (2,759 | ) | (2,121 | ) | ||
| Income before income taxes | $ | 13 | $ | 27,929 | ||
The following tables summarize segment information that is prepared in accordance with GAAP for the three months ended September 30, 2018 and 2017:
| Three months ended | ||||||
| September 30, | ||||||
| 2018 | 2017 | |||||
| Revenues | ||||||
| South African transaction processing | $ | 37,749 | $ | 66,437 | ||
| International transaction processing | 39,387 | 46,022 | ||||
| Financial inclusion and applied technologies | 53,206 | 54,313 | ||||
| Total | $ | 130,342 | $ | 166,772 | ||
33
17. Operating segments (continued)
| Three months ended | ||||||
| September 30, | ||||||
| 2018 | 2017 | |||||
| Operating (loss) income | ||||||
| South African transaction processing | $ | (3,513 | ) | $ | 12,332 | |
| International transaction processing | 2,762 | 5,316 | ||||
| Financial inclusion and applied technologies | 11,302 | 13,920 | ||||
| Subtotal: Operating segments | 10,551 | 31,568 | ||||
| Corporate/Eliminations | (9,655 | ) | (6,562 | ) | ||
| Total | 896 | 25,006 | ||||
| Depreciation and amortization | ||||||
| South African transaction processing | 941 | 1,153 | ||||
| International transaction processing | 3,059 | 4,632 | ||||
| Financial inclusion and applied technologies | 636 | 355 | ||||
| Subtotal: Operating segments | 4,636 | 6,140 | ||||
| Corporate/Eliminations | 6,158 | 2,826 | ||||
| Total | 10,794 | 8,966 | ||||
| Expenditures for long-lived assets | ||||||
| South African transaction processing | 1,286 | 477 | ||||
| International transaction processing | 800 | 906 | ||||
| Financial inclusion and applied technologies | 1,032 | 90 | ||||
| Subtotal: Operating segments | 3,118 | 1,473 | ||||
| Corporate/Eliminations | - | - | ||||
| Total | $ | 3,118 | $ | 1,473 | ||
The segment information as reviewed by the chief operating decision maker does not include a measure of segment assets per segment as all of the significant assets are used in the operations of all, rather than any one, of the segments. The Company does not have dedicated assets assigned to a particular operating segment. Accordingly, it is not meaningful to attempt an arbitrary allocation and segment asset allocation is therefore not presented.
It is impractical to disclose revenues from external customers for each product and service or each group of similar products and services.
18. Income tax
Income tax in interim periods
For the purposes of interim financial reporting, the Company determines the appropriate income tax provision by first applying the effective tax rate expected to be applicable for the full fiscal year to ordinary income. This amount is then adjusted for the tax effect of significant unusual items, for instance, changes in tax law, valuation allowances and non-deductible transaction-related expenses that are reported separately, and have an impact on the tax charge. The cumulative effect of any change in the enacted tax rate, if and when applicable, on the opening balance of deferred tax assets and liabilities is also included in the tax charge as a discrete event in the interim period in which the enactment date occurs.
For the three months ended September 30, 2018, the Company’s effective tax rate was significantly higher than the South African statutory rate as a result of a valuation allowance created related to net operating losses of approximately ZAR 223.4 million ($15.1 million translated at the average exchange rate for the three months ended September 30, 2018) incurred by its South African subsidiary, CPS, and non-deductible expenses, including transaction-related expenditure and non-deductible interest on the Company’s South African long-term debt facility.
The Company’s effective tax rate for the three months ended September 30, 2017, was 36.8% and was higher than the South African statutory rate as a result of non-deductible expenses, including transaction-related expenditure and non-deductible interest on the Company’s South African long-term facility.
34
18. Income tax (continued)
Recent Tax Legislation
On December 22, 2017, the Tax Cuts and Jobs Act (the “TCJA”), was enacted into law, which significantly changes existing U.S. tax law and includes numerous provisions that affect the Company’s business, such as imposing a one-time transition tax on deemed repatriation of deferred foreign income, reducing the U.S. federal statutory tax rate, and adopting a territorial tax system. During the year ended June 30, 2018, the TCJA required the Company to incur a transition tax on deferred foreign income not previously subject to U.S. income tax at a rate of 15.5% for foreign cash and certain other net current assets, and 8% on the remaining income. The TCJA also reduced the U.S. federal statutory tax rate from 35% to 21% effective January 1, 2018. The TCJA includes a provision to tax global intangible low taxed income (“GILTI”) of foreign subsidiaries which is effective for the Company beginning July 1, 2018.
The TCJA was effective in the second quarter of fiscal year 2018. As of September 30, 2018, the Company has not completed its accounting for the estimated tax effects of the TCJA. Due to the timing of the enactment and the complexity in applying the provisions of the TCJA, the provisional net charge is subject to revisions as the Company continues to complete its analysis of the TCJA, collect and prepare necessary data, and interpret additional guidance issued by standard-setting and regulatory bodies. Adjustments may materially impact the Company’s provision for income taxes and effective tax rate in the period in which the adjustments are made. The Company’s accounting for the estimated tax effects of the TCJA will be completed during the measurement period, which should not extend beyond one year from the enactment date. The impacts of the Company’s estimates are described further below.
The Company has made a reasonable estimate of its Transition Tax liability as of June 30, 2018, and recorded a provisional Transition Tax, before the application of any foreign tax credits, of $55.8 million, and has no liability after the application of generated foreign tax credits. In fact, the Company believes that it may generate excess foreign tax credits based on its preliminary calculations. The Company continues to gather additional information to more precisely compute the final amount of the Transition Tax to be included in its income tax return filings with the U.S. tax authorities.
The Company re-measured its deferred taxes to reflect the reduced rate that will apply when these deferred taxes are settled or realized in future periods. The TCJA subjects a U.S. corporation to tax on its GILTI. Due to the complexity of the new GILTI tax rules, the Company continues to evaluate this provision of the TCJA and the application of GAAP. Under GAAP, the Company has the option to make an accounting policy election of either (i) treating taxes due on future U.S. inclusions in taxable income related to GILTI as a current-period expense when incurred (the “period cost method”) or (ii) factoring such amounts into a company’s measurement of its deferred taxes (the “deferred method”). The Company is not yet able to reasonably estimate the effect of this provision of the TCJA on it because whether it expects to have future U.S. inclusions in taxable income related to GILTI depends on a number of different aspects of the Company’s estimated future results of global operations. Therefore, the Company has not made any adjustments related to potential GILTI tax in its financial statements.
Uncertain tax positions
There were no significant changes in the Company’s uncertain tax positions during the three months ended September 30, 2018. As of September 30, 2018, the Company had accrued interest related to uncertain tax positions of approximately $0.1 million on its balance sheet.
The Company does not expect changes related to its unrecognized tax benefits will have a significant impact on its results of operations or financial position in the next 12 months.
As of September 30, 2018 and June 30, 2018, the Company had unrecognized tax benefits of $0.9 million and $0.8 million, respectively, all of which would impact the Company’s effective tax rate. The Company files income tax returns mainly in South Africa, South Korea, Germany, Hong Kong, India, the United Kingdom, Botswana and in the U.S. federal jurisdiction. As of September 30, 2018, the Company’s South African subsidiaries are no longer subject to income tax examination by the South African Revenue Service for periods before June 30, 2014. The Company is subject to income tax in other jurisdictions outside South Africa, none of which are individually material to its financial position, statement of cash flows, or results of operations.
19. Commitments and contingencies
Guarantees
The South African Revenue Service and certain of the Company’s customers, suppliers and other business partners have asked the Company to provide them with guarantees, including standby letters of credit, issued by a South African bank. The Company is required to procure these guarantees for these third parties to operate its business.
35
19. Commitments and contingencies (continued)
Guarantees (continued)
Nedbank has issued guarantees to these third parties amounting to ZAR 96.0 million ($6.8 million, translated at exchange rates applicable as of September 30, 2018) and thereby utilizing part of the Company’s short-term facility. The Company in turn has provided nonrecourse, unsecured counter-guarantees to Nedbank for ZAR 96.0 million ($6.8 million, translated at exchange rates applicable as of September 30, 2018). The Company pays commission of between 0.4% per annum to 1.94% per annum of the face value of these guarantees and does not recover any of the commission from third parties.
The Company has not recognized any obligation related to these counter-guarantees in its consolidated balance sheet as of September 30, 2018. The maximum potential amount that the Company could pay under these guarantees is ZAR 96.0 million ($6.8 million, translated at exchange rates applicable as of September 30, 2018). The guarantees have reduced the amount available for borrowings under the Company’s short-term credit facility described in Note 10.
Contingencies
Challenge to Payment by SASSA of Additional Implementation Costs
On March 23, 2018, the High Court ordered that the June 15, 2012 variation agreement between SASSA and CPS be reviewed and set aside. CPS was ordered to refund ZAR 317.0 million to SASSA, plus interest from June 2014 to date of payment. On April 4, 2018, CPS filed an application seeking leave to appeal the whole order and judgment of the High Court with the High Court because its believes that the High Court erred in its application of the law and/or in fact in its findings. On April 25, 2018, the High Court refused the application seeking leave to appeal.
In May 2018, CPS delivered its petition seeking leave to appeal the whole order and judgment of the High Court with the Supreme Court of Appeal. In September 2018, CPS received notification from the Supreme Court that its petition seeking leave to appeal had been granted. The matter is expected to be heard during the first half of calendar 2019. The Company cannot predict how the Supreme Court will rule on the matter.
The Company is subject to a variety of other insignificant claims and suits that arise from time to time in the ordinary course of business. Management currently believes that the resolution of these other matters, individually or in the aggregate, will not have a material adverse impact on the Company’s financial position, results of operations or cash flows.
20. Related party transactions
Other payables, as of September 30, 2018, include a loan of approximately $0.1 million obtained from JAA Holdings Proprietary Limited, a South African private company partly owned by Mr. A.J. Dunn, an executive officer of the Company. The loan is payable on demand and interest is payable at the South African prime rate, which was 10.0% as of September 30, 2018. The loan was repaid in full on October 31, 2018.
DNI leases a building that is owned by a company in which Mr. A.J. Dunn has a direct shareholding of 16%. During the three months ended September 30, 2018, DNI paid rental of approximately $1.0 million.
36
Item 2. Management’s Discussion and Analysis of Financial Condition and Results of Operations
The following discussion should be read in conjunction with our Annual Report on Form 10-K for the year ended June 30, 2018, and the unaudited condensed consolidated financial statements and the accompanying notes included in this Form 10-Q.
Forward-looking statements
Some of the statements in this Form 10-Q constitute forward-looking statements. These statements relate to future events or our future financial performance and involve known and unknown risks, uncertainties and other factors that may cause our or our industry’s actual results, levels of activity, performance or achievements to be materially different from any future results, levels of activity, performance or achievements expressed, implied or inferred by these forward-looking statements. Such factors include, among other things, those listed under Item 1A.—“Risk Factors” and elsewhere in our Annual Report on Form 10-K for the year ended June 30, 2018. In some cases, you can identify forward-looking statements by terminology such as “may,” “will,” “should,” “could,” “would,” “expects,” “plans,” “intends,” “anticipates,” “believes,” “estimates,” “predicts,” “potential” or “continue” or the negative of such terms and other comparable terminology.
Although we believe that the expectations reflected in the forward-looking statements are reasonable, we do not know whether we can achieve positive future results, levels of activity, performance, or goals. Actual events or results may differ materially. We undertake no obligation to update any of the forward-looking statements after the date of this Form 10-Q to conform those statements to reflect the occurrence of unanticipated events, except as required by applicable law.
You should read this Form 10-Q and the documents that we reference herein and the documents we have filed as exhibits hereto and thereto and which we have filed with the United States Securities and Exchange Commission completely and with the understanding that our actual future results, levels of activity, performance and achievements may be materially different from what we expect. We qualify all of our forward-looking statements by these cautionary statements.
Recent Developments
SASSA Update
On March 23, 2018, the Constitutional Court ordered a six-month extension of our contract with SASSA, for the payment of grants in cash at pay points only, on the same terms and conditions as the contract that was due to expire on March 31, 2018. Since the filing of our Form 10-K on September 12, 2018, we continued to pay grant recipients at pay points in accordance with the court order and in line with our constitutional obligations. Our contract with SASSA terminated on September 30, 2018. The number of recipients paid at pay points in the first quarter of fiscal 2019 declined significantly over the three months, with only 225,000 recipients paid in September and yet we were unable to significantly reduce our cost structures due to the timing of notifications from SASSA and the requirement to comply with the terms of our contract. This resulted in CPS incurring significant operating losses as we continued to recognize revenue at the old contract rate. Given the significant decline in recipients we incurred significant losses during the quarter, even if we had invoiced SASSA at National Treasury’s recommended rate.
The Constitutional Court further ordered that we may approach the National Treasury to investigate and make a recommendation regarding the price to be paid for our contracted services during the six-month period. Despite having filed an urgent application with the Constitutional Court, requesting that the National Treasury recommendation be made an order of the court to enable SASSA to pay us, with a further request to engage with National Treasury to determine a fair price for the last three months of our contract period where there has been a significant decline in the number of recipients we paid, while we have maintained our full payment infrastructure, we still have not received any response from the Constitutional Court regarding this application. For additional information refer to our Form 10-K and “Item 1A.—Risk Factors—The pricing recommended by National Treasury to the Constitutional Court for our services provided at pay points for the period from April 1, 2018 through September 30, 2018, has not yet been approved by the Constitutional Court. If the amount payable to us is not commercially reasonable, our results of operations, financial position and cash flows may be adversely affected.”
Progress of financial inclusion initiatives in South Africa
Following the successful conclusion of the SASSA contract on September 30, 2018, we have refocused our resources and technology on the provision of financial inclusion services to our target market. In particular, we have enabled our mobile ATM payment infrastructure to become part of the South African National Payment System and are now concentrated on taking our ATMs to the rural populations of South Africa so that they have the same access to financial inclusion as they had during the tenure of our contract, without the many inconveniences and inefficiencies of SASSA’s new payment model. We are now able perform cash withdrawals at our mobile ATM's for all Visa/Mastercard cardholders from any South African card issuer.
37
Our financial inclusion initiatives in South Africa include a card issuing offering, namely EPE, a payment acquiring and cash distribution network and other financial inclusion products, including loans, insurance and value-added services.
The events of the last quarter related to the SASSA transition from CPS to SAPO as a grant payments service provider have had far reaching effects on the roll-out of our financial inclusion initiatives. In particular, SASSA’s apparently unilateral decision to move approximately 900,000 EPE customers to the SAPO/ SASSA account during the quarter without their knowledge or consent, as well as their aggressive marketing campaigns in respect of the new SAPO card have materially reduced the number of active EPE accounts to 1.7 million as of the end of October 2018. Despite our efforts to amicably resolve this matter with the Minister and SASSA, they have not acknowledged any wrongdoing and therefore, we are in the process of taking the appropriate legal steps. The SASSA transition has also had an adverse impact on the rate at which we have been able grow our EPE customer base historically. Going forward, we are expanding our own marketing efforts, but have reduced our expectations for the growth in the number of EPE accounts over the remainder of this fiscal year. The biggest risk to our goal is that SASSA unilaterally and unlawfully moves more EPE accounts onto the SAPO platform. We are monitoring the situation closely and will take the appropriate legal action if required.
We continue to grow our infrastructure and as of October 31, 2018, we had 214 branches (July 31, 2018: 169), 1,270 ATMs (July 31, 2018: 1,175), and 2,542 (July 31, 2018: 2,977) dedicated employees, including the temporary staff.
Our lending and insurance businesses have been adversely impacted by the lower number of EPE accounts because we now have fewer users of our financial inclusion products. In addition, as discussed above, we believe that a number of EPE account holders have had their grants redirected to SAPO/ SASSA accounts without their permission and therefore have involuntarily defaulted on their loan repayments and/ or have not met their monthly insurance premium obligation. We believe that these actions directly violate these consumers' rights and we have reported these actions by SAPO/ SASSA to the relevant regulatory bodies in an effort to remedy this unfortunate situation, but we have not received any response to date. Both our loan default rate and our policy lapse rate have increased and we have instituted a number of steps in order to assist our customers to honor their commitments, including establishing a call centre to specifically assist with recovery of outstanding balances and offering alternative payment channels utilizing our EasyPay platform.
Our loan book under Moneyline has declined given our tightening of the lending criteria (these are only provided to EPE cardholders) as well as the reduction we have seen in EPE accounts. We have also seen an increase in non-performing loans and have increased our allowance for credit losses accordingly. We witnessed our first quarterly decline in active Smart Life policies as a result of increased lapse rates and lower number of new policies written. Of concern is the 230,000 debit order rejections Smart Life experienced in October 2018 as these could potentially turn into lapsed policies over the next quarter. We have initiated various new collection mechanisms to deal with the issues in both Moneyline and Smart Life and these have had limited, though increasing, success to date. In terms of our telecoms initiatives, we continue to collaborate with Cell C and DNI over low-cost mobile telephony and data packages but we only expect to gain meaningful traction once Cell C’s recently concluded infrastructure sharing deal in South Africa with MTN is fully operational in our primary target rural geographies, which is currently expected to be in January 2019. Our Manje Mobile business unit has seen significant declines in prepaid volumes in the quarter as we halted access to all non-EPE account holders.
38
Cell C and DNI
Since the acquisition of a controlling interest in DNI on June 30, 2018, we have been focused on the integration of its operations and management teams into Net1, and we are working together with them on identifying the most meaningful of the many opportunities that we see from cross-selling our products and services into each other’s customer bases. In addition to the telecoms opportunity discussed above, we expect to launch some new micro-insurance products through the DNI infrastructure towards during the third quarter of fiscal 2019.
Cell C is performing broadly in line with our expectations. As previously communicated we are now supplying SIMs into Cell C, whose volume requirements are around 35 million units a year as well as working with them on the new telecoms products referred to above.
Bank Frick and Finbond
Bank Frick continues to develop its capacity and expertise in relation to cryptocurrency and blockchain technology. It has expanded its headcount and is tracking its projected calendar 2018 performance despite subdued market conditions during the last quarter. Bank Frick continues to work closely with IPG regarding our acquiring, processing and cryptocurrency storage solution initiatives.
We expect our first Finbond sponsored biometrically-enabled UEPS/EMV cards to be issued in January 2019, which will mark the beginning of a strong partnership to further expand our businesses into our combined target markets. Our complementary branch network and breadth of products and services will position us well and should supplement our growth efforts with our EPE products. Following the receipt of a capitalization share issue from Finbond during the quarter, we now own 267,672,032 shares in Finbond, or 29% of the issued equity.
International Payments Group
We completed the restructuring and re-organization of IPG by consolidating all our e-money licenses and international card issuing, acquiring and processing activities (excluding South Korea and India) under a single management structure and have moved the majority of the processing systems to our Malta office. It has recently completed the new automated underwriting and onboarding solution, which we believe will provide a differentiated processing solution to the thousands of SME businesses in Europe and elsewhere, who battle to readily access these services. In addition, IPG continues to work in close collaboration with Bank Frick and our other specialist departments to develop bespoke blockchain-based solutions, including a highly secure but easily accessible crypto-asset storage solution for crypto-asset investors and exchanges, which we hope to launch in the third quarter of fiscal 2019.
39
India
In April 2018, MobiKwik launched its virtual MobiKwik Visa Exclusive card utilizing our mobile virtual card, or MVC technology. We have continued to grow our user base despite dealing with limitations on the number of users placed by our issuing bank partner, which is currently in the midst of a merger with another financial institution. We have seen very positive trends in the take up and usage among the registered user base, and the number of transactions for the three-month period ending September 30, 2018, increased over 250% compared to the three-month period ending June 30, 2018.
Recent regulations enacted by the Reserve Bank of India are widely regarded as beneficial to the providers in the mobile wallet space as they will enhance interoperability between wallets as well as with banks; and permit wallets to become a direct card issuer without having reliance on an issuing bank partner.
V2 Limited
On October 4, 2018, we acquired a 50% voting and economic interest in V2 Limited, or V2, for $2.5 million. V2 will have access to license quick response (“QR”) payment technology from Zapper, the leading South African QR payments company, as well as our various payment solutions such as UEPS/EMV and mobile virtual card. Zapper has more than a million customers and its QR technology and payment platform is one of the most advanced and complete QR payment offerings. V2 has partnered with Zapper to launch ZappGroup, a company focused on deploying a universal white-label QR payment solution in key regions across West and East Africa, from which regional hubs will be created for further rollouts. QR technology has revolutionized mobile-based payments in China and other parts of Asia due to its ease of use and low infrastructure cost and we believe that the combination of our various payment technologies and QR technology provides a compelling solution for the many countries in Africa with large unbanked populations and sparse traditional payment infrastructures.
Critical Accounting Policies
Our unaudited condensed consolidated financial statements have been prepared in accordance with U.S. GAAP, which requires management to make estimates and assumptions about future events that affect the reported amount of assets and liabilities and disclosure of contingent assets and liabilities. As future events and their effects cannot be determined with absolute certainty, the determination of estimates requires management’s judgment based on a variety of assumptions and other determinants such as historical experience, current and expected market conditions and certain scientific evaluation techniques.
Critical accounting policies are those that reflect significant judgments or uncertainties, and potentially may result in materially different results under different assumptions and conditions. We have identified the following critical accounting policies that are described in more detail in our Annual Report on Form 10-K for the year ended June 30, 2018:
- Business combinations and the recoverability of goodwill;
- Intangible assets acquired through acquisitions;
- Valuation and impairment of marketable securities;
- Deferred taxation;
- Stock-based compensation; and
- Accounts receivable and allowance for doubtful accounts receivable.
Recent accounting pronouncements adopted
Refer to Note 1 to our unaudited condensed consolidated financial statements for a full description of recent accounting pronouncements adopted, including the dates of adoption and the effects on our unaudited condensed consolidated financial statements.
Recent accounting pronouncements not yet adopted as of September 30, 2018
Refer to Note 1 to our unaudited condensed consolidated financial statements for a full description of recent accounting pronouncements not yet adopted as of September 30, 2018, including the expected dates of adoption and effects on our financial condition, results of operations and cash flows.
40
Currency Exchange Rate Information
Actual exchange rates
The actual exchange rates for and at the end of the periods presented were as follows:
| Table 1 | Three months ended | Year ended | |||||||
| September 30, | June 30, | ||||||||
| 2018 | 2017 | 2018 | |||||||
| ZAR : $ average exchange rate | 14.0683 | 13.1731 | 12.8557 | ||||||
| Highest ZAR : $ rate during period | 15.4335 | 13.5643 | 14.4645 | ||||||
| Lowest ZAR : $ rate during period | 13.1528 | 12.8160 | 11.5526 | ||||||
| Rate at end of period | 14.1437 | 13.5618 | 13.7255 | ||||||
| KRW : $ average exchange rate | 1,121 | 1,133 | 1,098 | ||||||
| Highest KRW : $ rate during period | 1,135 | 1,156 | 1,156 | ||||||
| Lowest KRW : $ rate during period | 1,108 | 1,115 | 1,056 | ||||||
| Rate at end of period | 1,110 | 1,152 | 1,114 | ||||||

41
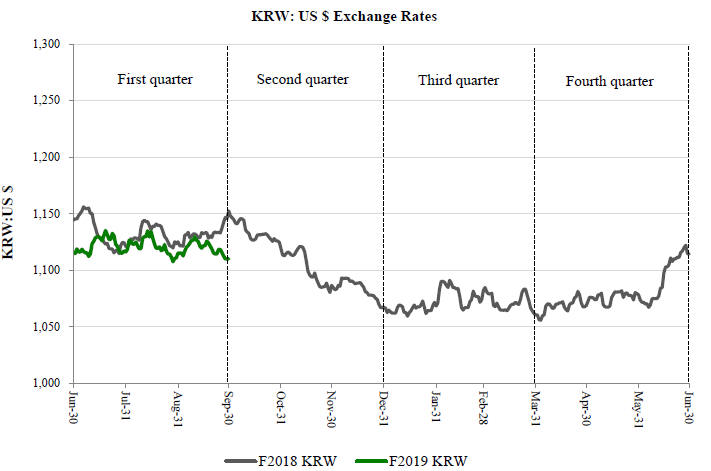
Translation exchange rates for financial reporting purposes
We are required to translate our results of operations from ZAR and KRW to U.S. dollars on a monthly basis. Thus, the average rates used to translate this data for the three months ended September 30, 2018 and 2017, vary slightly from the averages shown in the table above. The translation rates we use in presenting our results of operations are the rates shown in the following table:
| Table 2 | Three months ended | Year ended | |||||||
| September 30, | June 30, | ||||||||
| 2018 | 2017 | 2018 | |||||||
| Income and expense items: $1 = ZAR . | 14.8587 | 13.1691 | 12.6951 | ||||||
| Income and expense items: $1 = KRW | 1,121 | 1,133 | 1,095 | ||||||
| Balance sheet items: $1 = ZAR | 14.1437 | 13.5618 | 13.7255 | ||||||
| Balance sheet items: $1 = KRW | 1,110 | 1,152 | 1,114 | ||||||
Results of operations
The discussion of our consolidated overall results of operations is based on amounts as reflected in our unaudited condensed consolidated financial statements which are prepared in accordance with U.S. GAAP. We analyze our results of operations both in U.S. dollars, as presented in the consolidated financial statements, and supplementally in ZAR, because ZAR is the functional currency of the entities which contribute the majority of our profits and is the currency in which the majority of our transactions are initially incurred and measured. Due to the significant impact of currency fluctuations between the U.S. dollar and ZAR on our reported results and because we use the U.S. dollar as our reporting currency, we believe that the supplemental presentation of our results of operations in ZAR is useful to investors to understand the changes in the underlying trends of our business.
DNI was accounted for using the equity method from August 1, 2017 until June 30, 2018, the date upon which we obtained control of DNI through the acquisition of additional voting and economic interest. Accordingly, the first quarter of fiscal 2019 includes DNI for the entire period as a consolidated subsidiary and the first quarter of fiscal 2018 includes DNI as an equity-accounted investment for two months.
Our operating segment revenue presented in “—Results of operations by operating segment” represents total revenue per operating segment before inter-segment eliminations. Reconciliation between total operating segment revenue and revenue presented in our unaudited condensed consolidated financial statements is included in Note 17 to those statements.
42
We analyze our business and operations in terms of three inter-related but independent operating segments: (1) South African transaction processing, (2) International transaction processing and (3) Financial inclusion and applied technologies. In addition, corporate and corporate office activities that are impracticable to ascribe directly to any of the other operating segments, as well as any inter-segment eliminations, are included in corporate/eliminations.
First quarter of fiscal 2019 compared to first quarter of fiscal 2018
The following factors had a significant influence on our results of operations during the first quarter of fiscal 2019 as compared with the same period in the prior year:
- Consolidation of DNI results in higher revenue and operating income: DNI contributed ZAR 266.5 million and ZAR 112.8 million to our first quarter of fiscal 2019 revenue and operating income respectively;
- Improved contribution from South Korea: Our South Korean operations experienced modest revenue pressures due to regulatory changes and macroeconomic factors, however, its operating income improved compared to the first quarter of fiscal 2018, and sequentially to the fourth quarter of fiscal 2018;
- Successful launch of our rural ATM acquiring initiative: Late in the first quarter of fiscal 2019, we commenced with our rural ATM acquiring offering, and without any prior marketing, serviced in excess of one million customers;
- Reduced contributions from EasyPay Everywhere and financial inclusion initiatives: We have seen a decline in EPE account numbers as a result of SASSA’s initiatives to convert grant recipients to the new SAPO accounts, often unilaterally and without the recipient’s consent. This has reduced the operating income from our EPE accounts and has also had an adverse impact on the profitability of our various financial inclusion initiatives, including Manje Mobile, lending and insurance;
- Decline of CPS revenue and operating income due to the expiration of our SASSA contract: CPS revenue declined 87% and it incurred significant operating losses due to 91% fewer grant recipients paid by CPS and the contract price not yet being adjusted. In order to fulfill our constitutional obligation, we maintained our full payment infrastructure and associated cost base despite National Treasury’s proposed price increase not being ratified by the Constitutional Court during the quarter, resulting in a $15.7 million operating loss;
- High income tax expense due to deferred tax valuation allowance on CPS losses: Our income tax expenses includes a valuation allowance recorded against the net operating loss deferred tax asset generated by CPS as a result of the losses it incurred during the first quarter of fiscal 2019;
- Unfavorable impact from the strengthening of the U.S. dollar against the South African Rand: The U.S. dollar appreciated 13% against the ZAR during the first quarter of fiscal 2019 compared with the first quarter of fiscal 2018, adversely impacting our reported results;
- Higher depreciation and amortization charges resulting from DNI acquisition: Our depreciation and amortization charge has increased during the first quarter of 2019, as a result of the acquisition of DNI;
- Reduced income from equity-accounted investments: Earnings from equity accounted investments decreased as a result of the consolidation of DNI from June 30, 2018; and
- Lower interest income and higher interest expense: The movement in net interest expense was $3.8 million primarily due to lower interest income resulting from the utilization of cash to fund strategic investments and higher interest expense as a result of the South African lending facilities we obtained.
43
Consolidated overall results of operations
This discussion is based on the amounts prepared in accordance with U.S. GAAP.
The following tables show the changes in the items comprising our statements of operations, both in U.S. dollars and in ZAR:
| In U.S. Dollars | |||||||||
| Table 3 | (U.S. GAAP) | ||||||||
| Three months ended September 30, | |||||||||
| 2018 | 2017 | $ % | |||||||
| $’000 | $ ’000 | change | |||||||
| Revenue | 125,884 | 152,558 | (17% | ) | |||||
| Cost of goods sold, IT processing, servicing and support | 72,316 | 74,652 | (3% | ) | |||||
| Selling, general and administration | 41,878 | 43,934 | (5% | ) | |||||
| Depreciation and amortization | 10,794 | 8,966 | 20% | ||||||
| Operating income | 896 | 25,006 | (96% | ) | |||||
| Interest income | 1,876 | 5,044 | (63% | ) | |||||
| Interest expense | 2,759 | 2,121 | 30% | ||||||
| Income before income tax expense | 13 | 27,929 | (100% | ) | |||||
| Income tax expense | 6,490 | 10,277 | (37% | ) | |||||
| Net (loss) income before earnings from equity-accounted investments | (6,477 | ) | 17,652 | nm | |||||
| Earnings from equity-accounted investments | 1,373 | 2,075 | (34% | ) | |||||
| Net (loss) income | (5,104 | ) | 19,727 | nm | |||||
| Less net income attributable to non-controlling interest | 95 | 244 | (61% | ) | |||||
| Net (loss) income attributable to us | (5,199 | ) | 19,483 | nm | |||||
| In South African Rand | |||||||||
| Table 4 | (U.S. GAAP) | ||||||||
| Three months ended September 30, | |||||||||
| 2018 | 2017 | ||||||||
| ZAR | ZAR | ZAR % | |||||||
| ’000 | ’000 | change | |||||||
| Revenue | 1,870,473 | 2,011,951 | (7% | ) | |||||
| Cost of goods sold, IT processing, servicing and support | 1,074,522 | 984,518 | 9% | ||||||
| Selling, general and administration | 622,253 | 579,406 | 7% | ||||||
| Depreciation and amortization | 160,385 | 118,245 | 36% | ||||||
| Operating income | 13,313 | 329,782 | (96% | ) | |||||
| Interest income | 27,875 | 66,521 | (58% | ) | |||||
| Interest expense | 40,995 | 27,972 | 47% | ||||||
| Income before income tax expense | 193 | 368,331 | (100% | ) | |||||
| Income tax expense | 96,433 | 135,534 | (29% | ) | |||||
| Net (loss) income before earnings from equity-accounted investments | (96,240 | ) | 232,797 | nm | |||||
| Earnings from equity-accounted investments | 20,401 | 27,365 | (25% | ) | |||||
| Net (loss) income | (75,839 | ) | 260,162 | nm | |||||
| Less net income attributable to non-controlling interest | 1,412 | 3,218 | (56% | ) | |||||
| Net (loss) income attributable to us | (77,251 | ) | 256,944 | nm | |||||
The decrease in revenue was primarily due to lower contributions received from our South African operations as a result of the expiration of the CPS contract with SASSA and a decrease in our lending business and lower revenue in the international payments group, which was partially offset by the inclusion of DNI, higher fee and transaction income from our EPE and ATM offerings, higher transaction fee revenue, improved insurance activities. KSNET revenue was relatively stable.
In ZAR, the increase in cost of goods sold was primarily due to the inclusion of DNI, increased usage of the South African National Payment System and expenses to support and expand our EPE and ATM offerings, partially offset by lower operating costs associated with our exit from Masterpayment’s working capital finance activities. We were largely unable to reduce the costs in our CPS business, despite lower revenue, due to our constitutional obligations to continue honoring the terms of the contract in respect of cash payments until the contract expiry date on September 30, 2018.
44
In ZAR, the increase in selling, general and administration expense was primarily due to inclusion of DNI, an increase in costs at the international payments group as part of its restructuring, an increase in our allowance for doubtful finance loans receivable, higher compliance costs and costs associated with the company’s strategic positioning. These increases were partially offset by lower executive remuneration and lower transaction-related expenditures compared to the prior year.
Depreciation and amortization increased primarily due to the amortization of acquired intangible assets related to the DNI acquisition, partially offset by an increase in the number of tangible assets that are fully depreciated.
Our operating income margin for first quarter of fiscal 2019 and 2018 was 0.7% and 16.4% respectively. We discuss the components of operating income margin under “—Results of operations by operating segment.” Our operating margin declined primarily due to the losses incurred by CPS during the final months of its contract with SASSA as its fixed costs were not recoverable given the old contract price and a rapidly declining base of grant recipients paid.
Interest on surplus cash decreased to $1.9 million (ZAR 27.9 million) from $5.0 million (ZAR 66.5 million), due primarily to the lower average daily ZAR cash balances given the significant investments over the last 15 months.
Interest expense increased to $2.8 million (ZAR 41.0 million) from $2.1 million (ZAR 28.0 million), due to increased borrowings which we obtained to partially fund our strategic investments, marginally offset by the absence of interest expense on our South Korean debt as a result of its full repayment in October 2017.
Fiscal 2019 tax expense was $6.5 million (ZAR 96.4 million) compared to $10.3 million (ZAR 135.5 million) in fiscal 2018. Our effective tax rate for fiscal 2019, was significantly higher than the South African statutory rate as a result of a valuation allowance created related to net operating losses of approximately ZAR 223.4 million ($15.1 million translated at the average exchange rate for the three months ended September 30, 2018) incurred by our South African subsidiary, CPS, and non-deductible expenses, including transaction-related expenditure and non-deductible interest on our South African long-term debt facility. Our effective tax rate for fiscal 2018, was 36.8% and was higher than the South African statutory rate as a result of non-deductible expenses (including transaction-related expenses and non-deductible interest on our South African long-term facility).
The consolidation of DNI has adversely impacted our (loss) earnings from equity-accounted investments because it no longer contributes to equity-accounted earnings as it is no longer accounted for using the equity method. Finbond is listed on the Johannesburg Stock Exchange and reports its six-month results during our first half and its annual results during our fourth quarter. The table below presents the relative (loss) earnings from our equity accounted investments:
| Table 5 | Three months ended September 30, | ||||||||||
| 2018 | 2017 | $ % | |||||||||
| $’000 | $ ’000 | change | |||||||||
| Bank Frick | (588 | ) | - | nm | |||||||
| Share of net income | 162 | - | nm | ||||||||
| Amortization of intangible assets, net of deferred tax | (144 | ) |
- |
nm |
|||||||
| Other | (606 | ) | - | nm | |||||||
| DNI | - | 865 | nm | ||||||||
| Share of net income | - | 1,408 | nm | ||||||||
| Amortization of intangible assets, net of deferred tax | - | (543 | ) | nm | |||||||
| Finbond | 1,875 | 1,101 | 70% | ||||||||
| Other | 86 | 109 | (21% | ) | |||||||
| Earnings from equity accounted investments | 1,373 | 2,075 | (34% | ) | |||||||
45
Results of operations by operating segment
The composition of revenue and the contributions of our business activities to operating income are illustrated below:
| Table 6 | In U.S. Dollars (U.S. GAAP) | ||||||||||||||
| Three months ended September 30, | |||||||||||||||
| 2018 | % of | 2017 | % of | % | |||||||||||
| Operating Segment | $’000 | total | $’000 | total | change | ||||||||||
| Revenue: | |||||||||||||||
| South African transaction processing | 37,749 | 30% | 66,437 | 44% | (43% | ) | |||||||||
| International transaction processing | 39,387 | 31% | 46,022 | 30% | (14% | ) | |||||||||
| Financial inclusion and applied technologies | 53,206 | 42% | 54,313 | 36% | (2% | ) | |||||||||
| Subtotal: Operating segments | 130,342 | 103% | 166,772 | 110% | (22% | ) | |||||||||
| Intersegment eliminations | (4,458 | ) | (3% | ) | (14,214 | ) | (10% | ) | (69% | ) | |||||
| Consolidated revenue | 125,884 | 100% | 152,558 | 100% | (17% | ) | |||||||||
| Operating (loss) income: | |||||||||||||||
| South African transaction processing | (3,513 | ) | (392% | ) | 12,332 | 49% | (128% | ) | |||||||
| International transaction processing | 2,762 | 308% | 5,316 | 21% | (48% | ) | |||||||||
| Financial inclusion and applied technologies | 11,302 | 1,261% | 13,920 | 56% | (19% | ) | |||||||||
| Subtotal: Operating segments | 10,551 | 1,177% | 31,568 | 126% | (67% | ) | |||||||||
| Corporate/Eliminations | (9,655 | ) | (1,077% | ) | (6,562 | ) | (26% | ) | 47% | ||||||
| Consolidated operating income | 896 | 100% | 25,006 | 100% | (96% | ) | |||||||||
| Table 7 | In South African Rand (U.S. GAAP) | ||||||||||||||
| Three months ended September 30, | |||||||||||||||
| 2018 | |||||||||||||||
| ZAR | % of | 2017 | % of | % | |||||||||||
| Operating Segment | ’000 | total | ZAR ’000 | total | change | ||||||||||
| Revenue: | |||||||||||||||
| South African transaction processing | 560,901 | 30% | 876,178 | 44% | (36% | ) | |||||||||
| International transaction processing | 585,240 | 31% | 606,943 | 30% | (4% | ) | |||||||||
| Financial inclusion and applied technologies | 790,572 | 42% | 716,285 | 36% | 10% | ||||||||||
| Subtotal: Operating segments | 1,936,713 | 103% | 2,199,406 | 110% | (12% | ) | |||||||||
| Intersegment eliminations | (66,240 | ) | (3% | ) | (187,455 | ) | (10% | ) | (65% | ) | |||||
| Consolidated revenue | 1,870,473 | 100% | 2,011,951 | 100% | (7% | ) | |||||||||
| Operating (loss) income: | |||||||||||||||
| South African transaction processing | (52,199 | ) | (392% | ) | 162,636 | 49% | (132% | ) | |||||||
| International transaction processing | 41,040 | 308% | 70,108 | 21% | (41% | ) | |||||||||
| Financial inclusion and applied technologies | 167,933 | 1,261% | 183,578 | 56% | (9% | ) | |||||||||
| Subtotal: Operating segments | 156,774 | 1,177% | 416,322 | 126% | (62% | ) | |||||||||
| Corporate/Eliminations | (143,461 | ) | (1,077% | ) | (86,540 | ) | (26% | ) | 66% | ||||||
| Consolidated operating income | 13,313 | 100% | 329,782 | 100% | (96% | ) | |||||||||
South African transaction processing
The decrease in segment revenue and operating income was primarily due to the substantial decrease in the number of SASSA grant recipients paid under our SASSA contract at the old contracted rate. Our revenue and operating income was also adversely impacted by the significant reduction in the number of SASSA grant recipients with SASSA-branded Grindrod cards linked to Grindrod bank accounts. These decreases in revenue and operating income were partially offset by higher EPE transaction revenue as a result of increased usage of our ATMs.
Our operating (loss) income margin for the first quarter of fiscal 2019 and 2018 was (9.3%) and 18.6%, respectively.
International transaction-based activities
Segment revenue was lower during the first quarter of fiscal 2019, primarily due to a contraction in IPG transactions processed, specifically meaningfully lower China processing activity due to ongoing global trade negotiations, no Mastertrading working capital finance activities and marginally lower KSNET revenue. Operating income during the first quarter of fiscal 2019 was lower due to the decrease in IPG revenues and ongoing losses at Masterpayment, but partially offset by an increased contribution from KSNET.
Operating income margin for the first quarter of fiscal 2019 and 2018 was 7.0% and 11.6%, respectively.
46
Financial inclusion and applied technologies
In ZAR, segment revenue increased primarily due to the inclusion of DNI and increased volumes in our insurance businesses, partially offset by fewer prepaid airtime and value-added services sales, lending revenues, and a decrease in inter-segment revenues. Operating income was moderately higher than first quarter of fiscal 2018, primarily due to the inclusion of DNI. DNI generated revenue of approximately ZAR 266.5 million and operating income of approximately ZAR 112.8 million during the first quarter of fiscal 2019.
Operating income margin for the Financial inclusion and applied technologies segment was 21.2% and 25.6% during the first quarter of fiscal 2019 and 2018, respectively.
Corporate/Eliminations
Our corporate expenses generally include acquisition-related intangible asset amortization; expenses incurred related to acquisitions and investments pursued; expenditure related to compliance with the Sarbanes-Oxley Act of 2002; non-employee directors’ fees; employee and executive bonuses; stock-based compensation; legal fees; audit fees; directors and officer’s insurance premiums; telecommunications expenses; and elimination entries.
Our corporate expenses have increased primarily due to higher acquired intangible asset amortization and higher transaction-related expenditures.
Liquidity and Capital Resources
At September 30, 2018, our cash and cash equivalents were $98.6 million and comprised mainly ZAR-denominated balances of ZAR 732.5 million ($51.8 million), KRW-denominated balances of KRW 41.3 billion ($37.2 million), U.S. dollar-denominated balances of $4.1 million, and other currency deposits, primarily Botswana pula, of $5.5 million, all amounts translated at exchange rates applicable as of September 30, 2018. The increase in our cash balances from June 30, 2018, was primarily due the utilization of our debt facilities to fund our ATMs and to finance our lending to Cell C to fund the construction of mobile telephony network infrastructure, the contribution from the inclusion of DNI, and a marginal decrease in our South African lending book, which was partially offset by significantly weaker trading activities, scheduled debt repayments, dividend payments to non-controlling interests and capital expenditures.
We currently believe that our cash and credit facilities are sufficient to fund our future operations for at least the next four quarters.
We generally invest the surplus cash held by our South African operations in overnight call accounts that we maintain at South African banking institutions, and surplus cash held by our non-South African companies in U.S. dollar denominated money market accounts. We have invested surplus cash in Korea in short-term investment accounts at Korean banking institutions.
Historically, we have financed most of our operations, research and development, working capital, and capital expenditures, as well as acquisitions and strategic investments, through internally generated cash and our financing facilities. When considering whether to borrow under our financing facilities, we consider the cost of capital, cost of financing, opportunity cost of utilizing surplus cash and availability of tax efficient structures to moderate financing costs.
We also have a short-term South African credit facility with Nedbank of ZAR 700.0 million ($49.5 million), which consists of (i) a primary amount of up to ZAR 450 million, ($31.8 million). (ii) a temporary amount of ZAR 250.0 million ($17.7 million), and (iii) a secondary amount, which has been temporarily withdrawn as discussed below. The primary amount comprises an overdraft facility of (i) up to ZAR 300 million ($21.2 million), which is further split into (a) a ZAR 250.0 million ($17.7 million) overdraft facility which may only be used to fund ATMs used at pay points and (b) a ZAR 50 million ($3.5 million) general banking facility and (ii) indirect and derivative facilities of up to ZAR 150 million ($10.6 million), which include letters of guarantee, letters of credit and forward exchange contracts. The temporary amount of ZAR 250.0 million has been made available until January 31, 2019, at which time any amount utilized must be repaid in full and the secondary amount of ZAR 200.0 million ($14.1 million) will be made available again. As of September 30, 2018, the interest rate on the overdraft facility was 8.85% . As of September 30, 2018, we had utilized approximately ZAR 115.6 million ($8.2 million) of the ZAR 250 million overdraft facility to fund ATMs. As of September 30, 2018, we had utilized approximately ZAR 132.2 million ($9.3 million) of the indirect and derivative facilities to support guarantees issued by Nedbank to various third parties on our behalf.
We now have a short-term South African credit facility with Rand Merchant Bank, a division of FirstRand Bank Limited, or RMB, of ZAR 1.5 billion ($106.1 million) which may only be used to fund our ATMs in South Africa. As of September 28, 2018, the interest rate on the overdraft facility was 9.00% (South African prime less a margin of 1%). As of September 30, 2018, we had utilized approximately ZAR 1.1 billion ($76.6 million) of this facility.
47
We have a short-term U.S. dollar-denominated overdraft facility with Bank Frick of $10.0 million. As of September 30, 2018, we had utilized approximately $3.3 million of this facility The interest rate on the facility is 4.50% plus 3 month US dollar LIBOR and interest is payable on a quarterly basis. The 3 month US dollar LIBOR rate was 2.39838% on September 28, 2018. The facility has no fixed term, however, it may be terminated by either party with six weeks written notice.
As of September 30, 2018, we had outstanding long-term debt of ZAR 115.0 million (approximately $8.1 million translated at exchange rates applicable as of September 30, 2018) under our ZAR 200.0 million RMB revolving credit facility agreement. The loan expires in June 2021 and may only be used to finance the acquisition and/ or requisition of telecommunication towers.
As of September 30, 2018, we also had outstanding long-term debt, net of deferred fees, of ZAR 529.9 million (approximately $37.5 million translated at exchange rates applicable as of September 30, 2018) under our South African facilities, comprising (i) ZAR 225 million under Facility A, (ii) ZAR 150 million under Facility B and ZAR 157.5 million under Facility D. Interest due on the facility is based on the Johannesburg Interbank Agreed Rate, or JIBAR, in effect from time to time plus a margin of (i) 2.25% for the Facility A loan, (ii) 3.5% for the Facility B loan, and (iii) 2.75% for the Facility D loan. The JIBAR rate has been set at 7.00% for the period to December 28, 2018. Principal repayments on the outstanding Facility A and Facility B loans are due in three quarterly installments of ZAR 125.0 million each commencing December 28, 2018. Principal repayments on the Facility D loan are due in six quarterly installments, of ZAR 26.3 million each, commencing on December 28, 2018. Voluntary prepayments are permitted without early repayment fees or penalties.
Cash flows from operating activities
First quarter
Net cash provided by operating activities during the first quarter of fiscal 2019 was $16.5 million (ZAR 244.5 million) compared to $0.8 million (ZAR 10.4 million) used in operating activities during the first quarter of fiscal 2018. The increase in cash provided is primarily due to a decrease in our South African lending book, partially offset by an increase in lending to Cell C to finance the acquisition and/ or requisition of telecommunication towers and significantly weaker trading activity during fiscal 2019 compared to 2018.
During the first quarter of fiscal 2019, we paid South African tax of $1.4 million (ZAR 20.4 million) related to our 2018 tax year. During the first quarter of fiscal 2018, we paid South African tax of $1.9 million (ZAR 25.2 million) related to our 2017 tax year.
Taxes paid during the first quarter of fiscal 2019 and 2018 were as follows:
| Table 8 | Three months ended September 30, | |||||||||||
| 2018 | 2017 | 2018 | 2017 | |||||||||
| $ | $ | ZAR | ZAR | |||||||||
| ‘000 | ‘000 | ‘000 | ‘000 | |||||||||
| Taxation paid related to prior years | 1,399 | 1,919 | 20,488 | 25,227 | ||||||||
| Taxation refunds received | (62 | ) | - | (902 | ) | - | ||||||
| Total South African taxes paid | 1,337 | 1,919 | 19,586 | 25,227 | ||||||||
| Foreign taxes paid | 6 | 117 | 88 | 1,538 | ||||||||
| Total tax paid | 1,343 | 2,036 | 19,674 | 26,765 | ||||||||
Cash flows from investing activities
First quarter
Cash used in investing activities for the first quarter of fiscal 2019 includes capital expenditure of $3.1 million (ZAR 46.3 million), which increased primarily due to the acquisition of ATMs in South Africa and the expansion of our branch network.
Cash used in investing activities for the first quarter of fiscal 2018 includes capital expenditure of $1.5 million (ZAR 19.4 million), primarily for the acquisition of payment processing terminals in Korea. We also paid approximately $72.8 million (ZAR 945.0 million) for a 45% interest in DNI and $151.0 million (ZAR 2.0 billion) for a 15% interest in Cell C.
48
Cash flows from financing activities
First quarter
During the first quarter of fiscal 2019, we utilized approximately $84.7 million from our South African overdraft facilities to fund our ATMs and utilized approximately $7.8 million of our revolving credit facility to lend funds to Cell C to finance the acquisition and/or requisition of telecommunication towers. We also made a scheduled South African debt facility payment of $10.3 million and paid a non-refundable origination fee of approximately ZAR 2.0 million ($0.1 million) related to the revolving credit facility.
During the first quarter of fiscal 2018, we utilized approximately $94.3 million (ZAR 1.25 billion) of our South African facility to partially fund our investment in Cell C and utilized approximately $0.3 million of our Korean facility to pay a portion of our quarterly interest due. We also made a scheduled South African debt facility payment of $14.3 million (ZAR 187.5 million).
Off-Balance Sheet Arrangements
We have no off-balance sheet arrangements.
Capital Expenditures
We expect capital spending for the second quarter of fiscal 2019 to primarily include the investments into our ATM infrastructure and branch network in South Africa.
Our capital expenditures for the first quarter of fiscal 2019 and 2018 are discussed under “—Liquidity and Capital Resources—Cash flows from investing activities.” All of our capital expenditures for the past three fiscal years were funded through internally generated funds. We had outstanding capital commitments as of September 30, 2018, of $0.4 million related mainly to the procurement of ATMs. We expect to fund these expenditures through internally generated funds.
Contingent Liabilities, Commitments and Contractual Obligations
The following table sets forth our contractual obligations as of September 30, 2018:
| Table 9 | Payments due by Period, as of September 30, 2018(in $ ’000s) | ||||||||||||||
| Less | More | ||||||||||||||
| than 1 | 1-3 | 3-5 | than 5 | ||||||||||||
| Total | year | years | years | years | |||||||||||
| South African long-term debt obligations (A) | 50,511 | 36,942 | 13,569 | - | - | ||||||||||
| Contingent amount related to DNI investment (B) | 26,839 | 26,839 | - | - | - | ||||||||||
| Short-term credit facilities | 88,091 | 88,091 | - | - | - | ||||||||||
| Operating lease obligations | 13,944 | 6,743 | 5,639 | 1,562 | - | ||||||||||
| Purchase obligations | 3,754 | 3,754 | - | - | - | ||||||||||
| Capital commitments | 380 | 380 | - | - | - | ||||||||||
| Other long-term obligations (C)(D) | 3,419 | - | - | - | 3,419 | ||||||||||
| Total | 186,938 | 162,749 | 19,208 | 1,562 | 3,419 | ||||||||||
| (A) |
– Includes $45.6 million of long-term debt and interest payable at the rate applicable on September 30, 2018, under our South Africa debt facilities. |
| (B) |
– Under the amended DNI transaction agreements, we are obliged to pay to DNI an additional amount not exceeding ZAR 400 million ($28.3 million) in cash, subject to DNI achieving certain performance targets. The present value of the ZAR 400 million, or ZAR 379.6 million ($26.8 million), is included in other payables on our condensed consolidated balance sheet as of September 30, 2018. |
| (C) |
– Includes policyholder liabilities of $2.8 million related to our insurance business. All amounts are translated at exchange rates applicable as of September 30, 2018. |
| (D) |
– We have excluded a cross-guarantees in the aggregate amount of $6.8 million issued as of September 30, 2018, to Nedbank to secure guarantees it has issued to third parties on our behalf as the amounts that will be settled in cash are not known and the timing of any payments is uncertain. We have also excluded contractual commitments to invest approximately $7.5 million in V2 Limited, subject to the achievement of certain contractual conditions. |
49
Item 3. Quantitative and Qualitative Disclosures About Market Risk
In addition to the tables below, see Note 5 to the unaudited condensed consolidated financial statements for a discussion of market risk.
The following table illustrates the effect on our annual expected interest charge, translated at exchange rates applicable as of September 30, 2018, as a result of changes in the JIBAR rate. The effect of a hypothetical 1% (i.e. 100 basis points) increase and a 1% decrease in the JIBAR rate as of September 30, 2018, are shown. The selected 1% hypothetical change does not reflect what could be considered the best or worst case scenarios.
| As of September 30, 2018 | |||||||||
| Table 10 | Estimated annual | ||||||||
| Annual | expected interest | ||||||||
| expected | charge after | ||||||||
| interest | Hypothetical | hypothetical change in | |||||||
| charge | change in | JIBAR | |||||||
| ($ ’000) | JIBAR | ($ ’000) | |||||||
| Interest on South Africa long-term debt (JIBAR) | 4,464 | 1% | 4,921 | ||||||
| (1% | ) | 4,006 | |||||||
Item 4. Controls and Procedures
Evaluation of disclosure controls and procedures
Under the supervision and with the participation of our management, including our chief executive officer and our chief financial officer, we conducted an evaluation of our disclosure controls and procedures, as such term is defined under Rule 13a-15(e) promulgated under the Securities Exchange Act of 1934, as amended (the "Exchange Act"), as of September 30, 2018. Management recognizes that any controls and procedures, no matter how well designed and operated, can provide only reasonable assurance of achieving their objectives and management necessarily applies its judgment in evaluating the cost-benefit relationship of possible controls and procedures. Based on this evaluation, and in light of the material weakness in the design and operation of our internal control over financial reporting related to the material weakness identified in November 2018 discussed below, our chief executive officer and the chief financial officer concluded that our disclosure controls and procedures over internal controls over financial reporting were not effective as of September 30, 2018 , due to the material weakness in internal control over financial reporting described below.
Changes in Internal Control over Financial Reporting
We identified a material weakness in our internal control over financial reporting where the control over the our review of the accounting for non-routine complex transactions was not appropriately designed. The material weakness resulted in the misapplication of GAAP on the recognition of revenue from our SASSA contract extension, specifically, the complexity around the contract extension by the court order, which is considered non-routine, resulted in recognition of revenue at an incorrect rate. In November 2018, the material weakness resulted in adjustments to our financial statements as of and for the year ended June 30, 2018, due to the misapplication of GAAP on the accounting treatment for the investment in Cell C Proprietary Limited, which is currently being restated.
Our remedial procedures include the appointment of a technical resource to review the accounting for non-routine transactions, and the establishment of an in-house accounting technical committee, which will assist in the review of the accounting for all non-routine transactions, including assessing the appropriateness of the accounting treatment adopted. This technical committee will also assess the need to consult external experts on the accounting of non-routine transactions. The aforementioned remediation plan was designed during the three months period ended September 30, 2018 and has likely not been implemented for a sufficient period of time to assess its effectiveness. Management believes the foregoing efforts will effectively remediate the material weakness. As we continue to evaluate and work to improve our internal control over financial reporting, management may modify the remediation plan.
50
Part II. Other Information
Item 1. Legal Proceedings
Litigation Regarding Legality of Debit Orders under Social Assistance Act Regulations
On September 27, 2018, the Supreme Court of Appeal of South Africa, the Supreme Court, denied the petitions of SASSA and the Black Sash for leave to appeal the May 2017 declaratory order of the High Court sought by us that the Social Assistance Act of 2004 and Regulations thereunder in terms thereof do not restrict social grant recipients in their operation of their bank’s accounts. The May 2017 declaratory order clarified that recipients may continue to initiate debit order instructions with any service provider, including the Company and its subsidiaries, against their bank accounts for the payment of goods and services. In accordance with industry practice, recipients may also query and request the reversal of disputed debits.
SASSA, its Chief Executive Officer and the Minister of Social Development were ordered to pay the costs of the application. We believe that this matter is now closed.
Challenge to Payment by SASSA of Additional Implementation Costs
In March 2018, the High Court ordered that the June 2012 variation agreement between SASSA and CPS be reviewed and set aside. CPS was ordered to refund ZAR 317.0 million to SASSA, plus interest from June 2014 to the date of payment. In April 2018, we filed an application seeking leave to appeal the whole order and judgment of the High Court with the High Court because we believe that the High Court erred in its application of the law and/or in fact in its findings. The High Court refused our application. We appealed the High Court’s decision to the Supreme Court of Appeal, which has granted our leave to appeal. The matter is expected to be heard during the first half of calendar 2019. We cannot predict how the Supreme Court will rule on the matter.
Constitutional Court order regarding extension of contract with SASSA for six months for cash payment
On November 9, 2018, CPS filed the requisite independently audited statement of expenses incurred, income received and profit earned under the SASSA contract with the Constitutional Court as required by its March 23, 2018 order. In addition, the Constitutional Court permitted CPS to request National Treasury to evaluate and recommend the price to be charged by CPS for the payment of grants in cash under the extended contract. National Treasury submitted its recommendations to the Constitutional Court on April 30, 2018, proposing fee levels that were materially lower than CPS had requested, but significantly higher than the current fee levels. We submitted various correspondence and requests to the Constitutional Court for an order on the matter, but, until the Constitutional Court issues an order, we do not have certainty around CPS’s compensation for providing this service.
Initiation of legal proceedings against SASSA in respect
of transfer of grant payments from EPE to SAPO accounts
On November 13, 2018, a number of grant beneficiaries and
Moneyline Financial Service Proprietary Limited , one of our subsidiaries, filed
an urgent application with the Gauteng Division of the High Court of South
Africa seeking among other things, a declaration that biometric consent for the
transfer of grant payments to EPE accounts conforms with the requirements of the
Social Assistance Regulations, interdicting SASSA from stopping the payment of
social grants into EPE accounts that were opened with biometric consent prior to
January 1, 2018 when the new directive was issued, directing SASSA to process
all Annexure C forms (the currently required form that has to be completed to
transfer a grant payment to a private bank account) within two weeks of
submission and directing SASSA to make all grant payments in accordance with
duly completed and submitted Annexure C forms. We have applied for the matter to
be heard before the end of November 2018, but we cannot predict whether the
matter will be heard in the requested timelines or how the High Court will rule
on the matter.
Item 1A. Risk Factors
See “Item 1A RISK FACTORS” in Part I of our Annual Report on Form 10-K for the fiscal year ended June 30, 2018, for a discussion of risk factors relating to (i) our business, (ii) operating in South Africa and other foreign markets, (iii) government regulation, and (iv) our common stock. Except as set forth below, there have been no material changes from the risk factors previously disclosed in our Annual Report on Form 10-K for the fiscal year ended June 30, 2018.
SASSA’s apparently unilateral decision to move grant recipients to the SAPO/ SASSA account without the recipients' knowledge or consent, as well as their aggressive marketing campaigns in respect of the new SAPO card, have materially reduced the number of our active EPE accounts. Should this behavior continue, as has been threatened, and if we are unable to effectively challenge these actions, it could further reduce the number of active EPE accounts, which would be likely to have a material adverse effect on our results of operations, financial position and cash flows.
SASSA's apparently unilateral decision to move approximately 900,000 EPE customers to the SAPO/ SASSA account without their knowledge or consent, as well as their aggressive marketing campaigns in respect of the new SAPO card have materially reduced the number of active EPE accounts to 1.7 million in October 2018. Despite our efforts to amicably resolve this matter with the Minister and SASSA, they have not acknowledged any wrongdoing and we are in the process of taking the appropriate legal steps.have initiated legal proceedings against them in this regard. We cannot assure you that our legal challenge will be successful. The SASSA transition has also had an adverse impact on the rate at which we have been able grow our EPE customer base historically. The risk remains that SASSA continues to unilaterally move more EPE accounts onto the SAPO platform. In recent private correspondence they have threatened to transfer all EPE accounts for which they do not have on record the Annexure C form, which is the form required to be submitted by beneficiaries designating their election to have their grants paid into private bank accounts, and indicated that to date, they have currently received only 125,000 Annexure C forms. Should this behavior continue and if we are unable to effectively challenge these actions, it could further reduce the number of active EPE accounts, which would be likely to have a material adverse effect on our results of operations, financial position and cash flows.
51
We are in the process of transforming our South African operations to a business-to-consumer model through our EPE bank account and ATM infrastructure. Future increases in our revenues and operating income will depend in part on our ability to continue to expand this business.
Following the successful conclusion of the SASSA contract on September 30, 2018, we have refocused our resources and technology on the provision of financial inclusion services to our target market. In particular we have enabled our mobile ATM payment infrastructure to become part of the South African National Payment System and are now concentrated on taking our ATMs to the rural populations of South Africa so that they have the same access to financial inclusion as they had during the tenure of our contract, without the many inconveniences and inefficiencies of SASSA’s new payment model.
While we believe that our financial services offerings are convenient and cost-effective, our continued success will depend on the extent to which South African customers continue to use our financial products and services on a widespread basis. Factors which may prevent us from successfully operating and growing our South African financial services business include, but are not limited to:
- reduced adoption and utilization of our EPE accounts and related products and services;
- insufficient utilization of our ATM infrastructure, especially our mobile ATM infrastructure;
- inability to access sufficient funding for our ATM infrastructure;
- competition in the marketplace;
- restrictions imposed by SASSA or government on the manner in which recipients may transact;
- political interference;
- changes in the regulatory environment;
- dependence on existing suppliers to provide the hardware (such as ATMs, cards and POS devices) we require to execute our rollout as anticipated;
- logistical and communications challenges;
- loss of key technical and operations staff; and
- underestimation of the number of customers that will continue to use or obtain an EPE account and use our ATM infrastructure.
52
Item 6. Exhibits
The following exhibits are filed as part of this Form 10-Q:
53
SIGNATURES
Pursuant to the requirements of the Securities Exchange Act of 1934, the registrant has caused this report to be signed on its behalf by the undersigned, thereunto duly authorized, on November 14, 2018.
| NET 1 UEPS TECHNOLOGIES, INC. | |
| By: /s/ Herman G. Kotzé | |
| Herman G. Kotzé | |
| Chief Executive Officer | |
| By: /s/ Alex M.R. Smith | |
| Alex M.R. Smith | |
| Chief Financial Officer, Treasurer and Secretary |
54