Attached files
| file | filename |
|---|---|
| EX-32 - CERTIFICATION - IMMUCELL CORP /DE/ | f10q0616ex32_immucellcorp.htm |
| EX-31 - CERTIFICATION - IMMUCELL CORP /DE/ | f10q0616ex31_immucellcorp.htm |
UNITED STATES
SECURITIES AND EXCHANGE COMMISSION
Washington, D.C. 20549
FORM 10-Q
☒ QUARTERLY REPORT PURSUANT TO SECTION 13 OR 15(d) OF THE SECURITIES EXCHANGE ACT OF 1934
For the quarterly period ended June 30, 2016
001-12934
(Commission file number)
ImmuCell Corporation
(Exact name of registrant as specified in its charter)
| Delaware | 01-0382980 | |
| (State of Incorporation) | (I.R.S.
Employer Identification No.) | |
| 56 Evergreen Drive, Portland, ME | 04103 | |
| (Address of principal executive office) | (Zip Code) |
(207) 878-2770
(Registrant's telephone number)
Indicate by check mark whether the registrant (1) has filed all reports required to be filed by Section 13 or 15(d) of the Securities Exchange Act of 1934 during the preceding 12 months (or for such shorter period that the registrant was required to file such reports), and (2) has been subject to such filing requirements for the past 90 days. Yes ☒ No ☐
Indicate by check mark whether the registrant has submitted electronically and posted on its corporate website, if any, every Interactive Data File required to be submitted and posted pursuant to Rule 405 of Regulation S-T during the preceding 12 months (or for such shorter period that the registrant was required to submit and post such files). Yes ☒ No ☐
Indicate by check mark whether the registrant is a large accelerated filer, an accelerated filer, a non-accelerated filer, or a smaller reporting company. See the definitions of “large accelerated filer,” “accelerated filer” and “smaller reporting company” in Rule 12b-2 of the Exchange Act.
| Large accelerated filer ☐ | Accelerated filer ☐ | Non-accelerated filer ☐ | Smaller reporting company ☒ |
Indicate by check mark whether the registrant is a shell company (as defined in Rule 12b-2 of the Exchange Act). Yes ☐ No ☒
The number of shares of the Registrant’s common stock outstanding at August 9, 2016 was 4,179,844.
ImmuCell Corporation
TABLE OF CONTENTS
June 30, 2016
| PART I: FINANCIAL INFORMATION | ||
| ITEM 1. | Financial Statements | |
| Balance Sheets as of June 30, 2016 and December 31, 2015 | 2 | |
| Statements of (Loss) Income for the three-month and six-month periods ended June 30, 2016 and 2015 | 3 | |
| Statements of Comprehensive (Loss) Income for the three-month and six-month periods ended June 30, 2016 and 2015 | 4 | |
| Statements of Cash Flows for the six-month periods ended June 30, 2016 and 2015 | 5 | |
| Notes to Unaudited Condensed Financial Statements | 6-18 | |
| ITEM 2. | Management’s Discussion and Analysis of Financial Condition and Results of Operations | 19-26 |
| ITEM 3. | Quantitative and Qualitative Disclosures about Market Risk | 27 |
| ITEM 4. | Controls and Procedures | 27 |
| PART II: OTHER INFORMATION | ||
| ITEMS 1 | THROUGH 6 | 27-33 |
| Signature | 34 |
| - 1 - |
ImmuCell Corporation
PART 1. FINANCIAL INFORMATION
ITEM 1. FINANCIAL STATEMENTS
(Unaudited Condensed)
BALANCE SHEETS
| As of June 30, 2016 | As of December 31, 2015 | |||||||
| ASSETS | ||||||||
| CURRENT ASSETS: | ||||||||
| Cash and cash equivalents | $ | 3,650,699 | $ | 1,573,328 | ||||
| Short-term investments | 6,696,000 | 4,464,000 | ||||||
| Accounts receivable, net | 947,293 | 718,103 | ||||||
| Inventory | 1,228,877 | 870,207 | ||||||
| Prepaid expenses and other current assets | 503,093 | 256,698 | ||||||
| Total current assets | 13,025,962 | 7,882,336 | ||||||
| PROPERTY, PLANT AND EQUIPMENT, net | 6,502,333 | 5,718,814 | ||||||
| LONG-TERM INVESTMENTS | 487,000 | 487,000 | ||||||
| DEFERRED TAX ASSET | 287,893 | 452,117 | ||||||
| INTANGIBLE ASSETS, net | 175,598 | 0 | ||||||
| GOODWILL | 95,557 | 0 | ||||||
| TOTAL ASSETS | $ | 20,574,343 | $ | 14,540,267 | ||||
| LIABILITIES AND STOCKHOLDERS’ EQUITY | ||||||||
| CURRENT LIABILITIES: | ||||||||
| Accounts payable and accrued expenses | $ | 963,741 | $ | 662,165 | ||||
| Current portion of bank debt | 129,507 | 130,780 | ||||||
| Total current liabilities | 1,093,248 | 792,945 | ||||||
| LONG-TERM LIABILITIES: | ||||||||
| Bank debt, net of current portion | 2,946,532 | 3,054,977 | ||||||
| Interest rate swaps | 227,416 | 78,525 | ||||||
| Total long-term liabilities | 3,173,948 | 3,133,502 | ||||||
| TOTAL LIABILITIES | 4,267,196 | 3,926,447 | ||||||
| CONTINGENT LIABILITIES AND COMMITMENTS (See Note 15) | ||||||||
| STOCKHOLDERS’ EQUITY: | ||||||||
| Common stock, $0.10 par value per share, 10,000,000 and 8,000,000 shares authorized, 4,384,958 and 3,261,148 shares issued, as of June 30, 2016 and December 31, 2015, respectively | 438,496 | 326,115 | ||||||
| Additional paid-in capital | 15,380,947 | 10,150,190 | ||||||
| Retained earnings | 1,081,964 | 638,672 | ||||||
| Treasury stock, at cost, 205,114 and 206,114 shares as of June 30, 2016 and December 31, 2015, respectively | (448,714 | ) | (450,901 | ) | ||||
| Accumulated other comprehensive loss | (145,546 | ) | (50,256 | ) | ||||
| Total stockholders’ equity | 16,307,147 | 10,613,820 | ||||||
| TOTAL LIABILITIES AND STOCKHOLDERS’ EQUITY | $ | 20,574,343 | $ | 14,540,267 | ||||
The accompanying notes are an integral part of these unaudited condensed financial statements.
| - 2 - |
ImmuCell Corporation
(Unaudited Condensed)
STATEMENTS OF (LOSS) INCOME
| For the Three-Month Periods Ended June 30, | For the Six-Month Periods Ended June 30, | |||||||||||||||
| 2016 | 2015 | 2016 | 2015 | |||||||||||||
| Product sales | $ | 2,375,662 | $ | 1,960,363 | $ | 5,362,021 | $ | 5,061,853 | ||||||||
| Costs of goods sold | 1,135,801 | 829,789 | 2,364,601 | 2,080,355 | ||||||||||||
| Gross margin | 1,239,861 | 1,130,574 | 2,997,420 | 2,981,498 | ||||||||||||
| Sales and marketing expenses | 462,310 | 316,286 | 881,308 | 705,188 | ||||||||||||
| Administrative expenses | 375,652 | 328,546 | 712,808 | 639,851 | ||||||||||||
| Product development expenses | 380,434 | 271,759 | 682,877 | 602,424 | ||||||||||||
| Operating expenses | 1,218,396 | 916,591 | 2,276,993 | 1,947,463 | ||||||||||||
| NET OPERATING INCOME | 21,465 | 213,983 | 720,427 | 1,034,035 | ||||||||||||
| Other expenses, net | 31,299 | 6,498 | 54,685 | 11,948 | ||||||||||||
| (LOSS) INCOME BEFORE INCOME TAXES | (9,834 | ) | 207,485 | 665,742 | 1,022,087 | |||||||||||
| Income tax (benefit) expense | (679 | ) | 113,427 | 222,450 | 448,947 | |||||||||||
| NET (LOSS) INCOME | $ | (9,155 | ) | $ | 94,058 | $ | 443,292 | $ | 573,140 | |||||||
| Weighted average common shares outstanding: | ||||||||||||||||
| Basic | 4,178,855 | 3,034,539 | 4,005,956 | 3,030,962 | ||||||||||||
| Diluted | 4,178,855 | 3,155,663 | 4,116,988 | 3,149,640 | ||||||||||||
| NET (LOSS) INCOME PER SHARE: | ||||||||||||||||
| Basic | $ | (0.00 | ) | $ | 0.03 | $ | 0.11 | $ | 0.19 | |||||||
| Diluted | $ | (0.00 | ) | $ | 0.03 | $ | 0.11 | $ | 0.18 | |||||||
The accompanying notes are an integral part of these unaudited condensed financial statements.
| - 3 - |
ImmuCell Corporation
(Unaudited Condensed)
STATEMENTS OF COMPREHENSIVE (LOSS) INCOME
| For the Three-Month Periods Ended June 30, | For the Six-Month Periods Ended June 30, | |||||||||||||||
| 2016 | 2015 | 2016 | 2015 | |||||||||||||
| Net (loss) income | $ | (9,155 | ) | $ | 94,058 | $ | 443,292 | $ | 573,140 | |||||||
| Other comprehensive (loss) income: | ||||||||||||||||
| Interest rate swaps, before taxes | (47,213 | ) | 8,310 | (148,891 | ) | 1,811 | ||||||||||
| Income tax applicable to interest rate swaps | 16,996 | (3,315 | ) | 53,601 | (723 | ) | ||||||||||
| Other comprehensive (loss) income, net of taxes | (30,217 | ) | 4,995 | (95,290 | ) | 1,088 | ||||||||||
| Total comprehensive (loss) income | $ | (39,372 | ) | $ | 99,053 | $ | 348,002 | $ | 574,228 | |||||||
The accompanying notes are an integral part of these unaudited condensed financial statements.
| - 4 - |
ImmuCell Corporation
(Unaudited Condensed)
STATEMENTS OF CASH FLOWS
For
the Six-Month | ||||||||
| 2016 | 2015 | |||||||
| CASH FLOWS FROM OPERATING ACTIVITIES: | ||||||||
| Net income | $ | 443,292 | $ | 573,140 | ||||
| Adjustments to reconcile net income to net cash provided by operating activities: | ||||||||
| Depreciation | 368,358 | 243,783 | ||||||
| Amortization | 19,285 | 1,438 | ||||||
| Deferred income taxes | 217,825 | 431,667 | ||||||
| Stock-based compensation | 28,952 | 11,483 | ||||||
| (Gain) on disposal of fixed assets | 0 | (7,976 | ) | |||||
| Changes in: | ||||||||
| Accounts receivable | (229,190 | ) | 272,072 | |||||
| Inventory | (245,671 | ) | 299,643 | |||||
| Prepaid expenses and other current assets | (246,395 | ) | (143,484 | ) | ||||
| Accounts payable and accrued expenses | (190,399 | ) | (157,075 | ) | ||||
| Deferred revenue | 0 | (6,690 | ) | |||||
| Net cash provided by operating activities | 166,057 | 1,518,001 | ||||||
| CASH FLOWS FROM INVESTING ACTIVITIES: | ||||||||
| Purchase of property, plant and equipment | (691,278 | ) | (1,434,200 | ) | ||||
| Acquisition of certain business assets | (368,219 | ) | 0 | |||||
| Maturities of investments | 1,984,000 | 2,241,000 | ||||||
| Purchases of investments | (4,216,000 | ) | (1,240,000 | ) | ||||
| Proceeds from sale of fixed assets | 0 | 29,215 | ||||||
| Net cash used for investing activities | (3,291,497 | ) | (403,985 | ) | ||||
| CASH FLOWS FROM FINANCING ACTIVITIES: | ||||||||
| Debt principal repayments | (66,828 | ) | (98,485 | ) | ||||
| Debt issuance costs | (46,734 | ) | 0 | |||||
| Proceeds from exercise of stock options | 3,150 | 45,140 | ||||||
| Tax benefits related to stock options | 0 | 14,480 | ||||||
| Proceeds from public offering, net | 5,313,223 | 0 | ||||||
| Net cash provided by (used for) financing activities | 5,202,811 | (38,865 | ) | |||||
| NET INCREASE IN CASH AND CASH EQUIVALENTS | 2,077,371 | 1,075,151 | ||||||
| BEGINNING CASH AND CASH EQUIVALENTS | 1,573,328 | 850,028 | ||||||
| ENDING CASH AND CASH EQUIVALENTS | $ | 3,650,699 | $ | 1,925,179 | ||||
| SUPPLEMENTAL DISCLOSURES OF CASH FLOW INFORMATION | ||||||||
| CASH PAID FOR: | ||||||||
| Income taxes | $ | 125,125 | $ | 2,800 | ||||
| Interest expense | $ | 77,415 | $ | 26,320 | ||||
| NON-CASH ACTIVITIES: | ||||||||
| Change in capital expenditures included in accounts payable and accrued expenses | $ | 328,222 | $ | (190,771 | ) | |||
| Net change in fair value of interest rate swaps | $ | 95,290 | $ | (1,088 | ) | |||
See Note 8 for non-cash activities related to a 2016 business acquisition
The accompanying notes are an integral part of these unaudited condensed financial statements.
| - 5 - |
ImmuCell Corporation
Notes to Unaudited Condensed Financial Statements
| 1. | BUSINESS OPERATIONS |
ImmuCell Corporation (the “Company”, “we”, “us”, “our”) is a growing animal health company whose purpose is to create scientifically-proven and practical products that improve animal health and productivity in the dairy and beef industries. The Company was originally incorporated in Maine in 1982 and reincorporated in Delaware in 1987, in conjunction with its initial public offering of common stock. We market products that provide immediate immunity to newborn dairy and beef cattle. We are developing product line extensions of our existing products and are in the late stages of developing a novel product that addresses mastitis, the most significant cause of economic loss to the dairy industry. These products help reduce the need to use traditional antibiotics in food producing animals. The Company is subject to certain risks associated with its stage of development including dependence on key individuals, competition from other larger companies, the successful sale of existing products and the development and acquisition of additional commercially viable products with appropriate regulatory approvals, where applicable. These and other risks to our company are further detailed under PART II-OTHER INFORMATION: ITEM 1A– RISK FACTORS.
| 2. | SUMMARY OF SIGNIFICANT ACCOUNTING POLICIES |
| (a) | Basis of Presentation |
We have prepared the accompanying unaudited condensed financial statements reflecting all adjustments, all of which are of a normal recurring nature, that are, in our opinion, necessary in order to ensure that the financial statements are not misleading. We follow accounting standards set by the Financial Accounting Standards Board (FASB). The FASB sets generally accepted accounting principles (GAAP) that we follow to ensure we consistently report our financial condition, results of operations, earnings per share and cash flows. References to GAAP in these footnotes are to the FASB Accounting Standards Codification™ (Codification). Certain prior year accounts have been reclassified to conform with the 2016 financial statement presentation. Certain information and footnote disclosures normally included in the annual financial statements have been condensed or omitted. Accordingly, we believe that although the disclosures are adequate to ensure that the information presented is not misleading, these unaudited condensed financial statements should be read in conjunction with the financial statements for the year ended December 31, 2015 and the notes thereto, contained in our Annual Report on Form 10-K as filed with the Securities and Exchange Commission (SEC).
| (b) | Cash, Cash Equivalents, Short-Term Investments and Long-Term Investments |
We consider all highly liquid investment instruments that mature within three months of their purchase dates to be cash equivalents. Cash equivalents are principally invested in securities backed by the U.S. government. Certain cash balances in excess of Federal Deposit Insurance Corporation (FDIC) limits of $250,000 per financial institution per depositor are maintained in money market accounts at financial institutions that are secured, in part, by the Securities Investor Protection Corporation. Amounts in excess of these FDIC limits per bank that are not invested in securities backed by the U.S. government aggregated $3,150,399 and $1,073,028 as of June 30, 2016 and December 31, 2015, respectively. We account for marketable securities in accordance with Codification Topic 320, Investments - Debt and Equity Securities. Short-term investments are classified as held to maturity and are comprised principally of certificates of deposit that mature in more than three months from their purchase dates and not more than twelve months from the balance sheet date. Long-term investments are classified as held to maturity and are comprised principally of certificates of deposit that mature in more than twelve months from the balance sheet date. Short-term and long-term investments are held at different financial institutions that are insured by the FDIC, within the FDIC limits per financial institution. See Note 3.
| (c) | Inventory |
Inventory includes raw materials, work-in-process and finished goods and is recorded at the lower of cost, on the first-in, first-out method, or market (net realizable value). Work-in-process and finished goods inventories include materials, labor and manufacturing overhead. See Note 4.
| (d) | Accounts Receivable |
Accounts receivable are carried at the original invoice amount less an estimate made for doubtful collection and product returns. Management determines the allowance for doubtful accounts on a monthly basis by identifying troubled accounts and by using historical experience applied to an aging of accounts. Accounts receivable are written off when deemed uncollectible. Recoveries of accounts receivable previously written off are recorded as income when received. Accounts receivable are considered to be past due if any portion of the receivable balance is outstanding for more than 30 days. Interest is charged on past due accounts receivable.
| - 6 - |
ImmuCell Corporation
Notes to Unaudited Condensed Financial Statements (continued)
| (e) | Property, Plant and Equipment |
We depreciate property, plant and equipment on the straight-line method by charges to operations in amounts estimated to expense the cost of the assets from the date they are first put into service to the end of the estimated useful lives of the assets. The cost of our building (which was acquired in 1993) and the 2001 and 2007 additions thereto are being depreciated through 2023. We are depreciating the building addition that was completed during the first quarter of 2015 over twenty-five years. Related building improvements are depreciated over ten year periods. Large and durable fixed assets are depreciated over their useful lives that are generally estimated to be five to ten years. Other fixed assets and computer equipment are depreciated over their useful lives that are generally estimated to be five and three years, respectively. Repairs to fixed assets that benefit more than a current period are capitalized and depreciated over their useful lives. See Note 7.
| (f) | Intangible Assets and Goodwill |
We amortize intangible assets on the straight-line method by charges to operations in amounts estimated to expense the cost of the assets from the date they are first put into service to the end of the estimated useful lives of the assets. We have recorded intangible assets related to customer contracts, customer relationships, non-compete agreements, and technology, each with defined useful lives. We have classified as goodwill the amounts paid in excess of fair value of the net assets (including tax attributes) of assets acquired in purchase transactions. We continually assess that these assets are realizable in accordance with the impairment provisions of Codification Topic 360, Accounting for the Impairment or Disposal of Long-Lived Assets. We assess the impairment of intangible assets and goodwill that have indefinite lives on an annual basis (as of December 31st) and whenever events or changes in circumstances indicate that the carrying value of the asset may not be recoverable. We would record an impairment charge if such an assessment were to indicate that the fair value of such assets was less than their carrying values. Judgement is required in determining whether an event has occurred that may impair the value of identifiable intangible assets or goodwill. Factors that could indicate that an impairment may exist include significant under-performance relative to plan or long-term projections, significant changes in business strategy, significant negative industry or economic trends. Although we believe intangible assets and goodwill are appropriately stated in the accompanying financial statements, changes in strategy or market conditions could significantly impact these judgements and require an adjustment to the recorded balance. See Notes 8 and 9 for additional disclosures.
| (g) | Fair Value Measurements |
In determining fair value measurements, we follow the provisions of Codification Topic 820, Fair Value Measurements and Disclosures. Codification Topic 820 defines fair value, establishes a framework for measuring fair value under GAAP and enhances disclosures about fair value measurements. The topic provides a consistent definition of fair value which focuses on an exit price, which is the price that would be received to sell an asset or paid to transfer a liability in an orderly transaction between market participants at the measurement date. The topic also prioritizes, within the measurement of fair value, the use of market-based information over entity-specific information and establishes a three-level hierarchy for fair value measurements based on the nature of inputs used in the valuation of an asset or liability as of the measurement date. At June 30, 2016 and December 31, 2015, the carrying amounts of cash and cash equivalents, accounts receivable, inventory, other assets, accounts payable and accrued liabilities approximate fair value because of their short-term nature. The three-level hierarchy is as follows:
| Level 1 - | Pricing inputs are quoted prices available in active markets for identical assets or liabilities as of the measurement date. | |
| Level 2 - | Pricing inputs are quoted prices for similar assets or liabilities, or inputs that are observable, either directly or indirectly, for substantially the full term through corroboration with observable market data. |
|
| Level 3 - | Pricing inputs are unobservable for the assets or liabilities, that is, inputs that reflect the reporting entity’s own assumptions about the assumptions market participants would use in pricing the asset or liability. |
| - 7 - |
ImmuCell Corporation
Notes to Unaudited Condensed Financial Statements (continued)
In certain cases, the inputs used to measure fair value may fall into different levels of the fair value hierarchy. In such cases, an asset’s or liability’s level within the fair value hierarchy is based on the lowest level of input that is significant to the fair value measurement. Our assessment of the significance of a particular input to the fair value measurement in its entirety requires judgement, and considers factors specific to the investment.
Our held to maturity securities are comprised of investments in bank certificates of deposit. The value of these securities is disclosed in Note 3. We also hold money market mutual funds in a brokerage account, which are classified as cash equivalents and measured at fair value. The fair value of these investments is based on their closing published net asset value.
We assess the levels of the investments at each measurement date, and transfers between levels are recognized on the actual date of the event or change in circumstances that caused the transfer in accordance with our accounting policy regarding the recognition of transfers between levels of the fair value hierarchy. During the six-month period ended June 30, 2016 and the year ended December 31, 2015, there were no transfers between levels. As of June 30, 2016 and December 31, 2015, our interest rate swap agreements and bank certificates of deposit were classified as Level 2. At June 30, 2016 and December 31, 2015, the Level 1 assets measured at fair value consisted of bank savings accounts and money market funds valued at $3,650,699 and $1,573,328, respectively, and our Level 2 assets measured at fair value consisted of bank certificates of deposit of $7,183,000 and $4,951,000, respectively. There were no assets or liabilities measured at fair value on a nonrecurring basis at June 30, 2016, or December 31, 2015.
| (h) | Valuation of Long-Lived Assets |
We periodically evaluate our long-lived assets, consisting principally of fixed assets and amortizable intangible assets for potential impairment. In accordance with the applicable accounting guidance for the treatment of long-lived assets, we review the carrying value of our long-lived assets or asset group that is held and used, including intangible assets subject to amortization, for impairment whenever events and circumstances indicate that the carrying value of the assets may not be recoverable. Under the held and used approach, the asset or asset group to be tested for impairment should represent the lowest level for which identifiable cash flows are largely independent of the cash flows of other groups of assets and liabilities. We evaluate our long-lived assets whenever events or circumstances suggest that the carrying amount of an asset or group of assets may not be recoverable from the estimated undiscounted future cash flows.
| (i) | Concentration of Risk |
Concentration of credit risk with respect to accounts receivable is principally limited to certain customers to whom we make substantial sales. To reduce risk, we routinely assess the financial strength of our customers and, as a consequence, believe that our accounts receivable credit risk exposure is limited. We maintain an allowance for potential credit losses, but historically we have not experienced significant credit losses related to an individual customer or groups of customers in any particular industry or geographic area. Sales to significant customers that amounted to 10% or more of total product sales are detailed in the following table:
| Three-Month Periods Ended June 30, | Six-Month Periods Ended June 30, | |||||||||||||||
| 2016 | 2015 | 2016 | 2015 | |||||||||||||
| Animal Health International, Inc.(1) | 42 | % | 42 | % | 39 | % | 42 | % | ||||||||
| MWI Animal Health(2) | 20 | % | 13 | % | 20 | % | 21 | % | ||||||||
| Robert J. Matthews Company | * | 11 | % | * | * | |||||||||||
Accounts receivable due from significant customers amounted to the percentages of total trade accounts receivable as detailed in the following table:
| As of June 30, 2016 | As of December 31, 2015 | |||||||
| Animal Health International, Inc.(1) | 38 | % | 26 | % | ||||
| MWI Animal Health(2) | 21 | % | 27 | % | ||||
| ANIMART LLC(3) | * | 11 | % | |||||
(1) During June 2015, Patterson Companies, Inc. (NASDAQ: PDCO) acquired Animal Health International, Inc.
(2) During March 2015, AmerisourceBergen Corporation (NYSE: ABC) acquired MWI Animal Health.
(3) Assumes that the acquisition of Animal Medic by ANIMART LLC had occurred as of the beginning of the periods being reported.
*Amount is less than 10%.
We believe that supplies and raw materials for the production of our products are available from more than one vendor or farm. Our policy is to maintain more than one source of supply for the components used in our products. However, there is a risk that we could have difficulty in efficiently acquiring essential supplies.
| - 8 - |
ImmuCell Corporation
Notes to Unaudited Condensed Financial Statements (continued)
| (j) | Interest Rate Swap Agreements |
All derivatives are recognized on the balance sheet at their fair value. We entered into interest rate swap agreements in 2010 and 2015. On the dates the agreements were entered into, we designated the derivatives as hedges of the variability of cash flows to be paid related to our long-term debt. The agreements have been determined to be highly effective in hedging the variability of identified cash flows, so changes in the fair market value of the interest rate swap agreements are recorded as comprehensive income (loss), until earnings are affected by the variability of cash flows (e.g. when periodic settlements on a variable-rate asset or liability are recorded in earnings). We formally documented the relationship between the interest rate swap agreements and the related hedged items. We also formally assess, both at the interest rate swap agreements’ inception and on an ongoing basis, whether the agreements are highly effective in offsetting changes in cash flow of hedged items. See Note 11.
| (k) | Revenue Recognition |
We sell products that provide immediate immunity to newborn dairy and beef cattle. We recognize revenue in accordance with Staff Accounting Bulletin (SAB) No. 104, “Revenue Recognition”. SAB No. 104 requires that four criteria are met before revenue is recognized. These include i) persuasive evidence that an arrangement exists, ii) delivery has occurred or services have been rendered, iii) the seller’s price is fixed and determinable and iv) collectability is reasonably assured. We recognize revenue at the time of shipment (including to distributors) for substantially all products, as title and risk of loss pass to the customer on delivery to the common carrier after concluding that collectability is reasonably assured. We offer a 50% credit on First Defense® product that is returned to us past its expiration date, which is generally two years past its date of manufacture. We generally experience a minimal amount of product returns.
| (l) | Expense Recognition |
Advertising costs are expensed when incurred, which is generally during the month in which the advertisement is published. Advertising expenses amounted to $37,938 and $44,994 during the six-month periods ended June 30, 2016 and 2015, respectively. All product development expenses are expensed as incurred, as are all related patent costs. We capitalize costs to produce inventory during the production cycle, and these costs are charged to costs of goods sold when the inventory is sold to a customer.
| (m) | Income Taxes |
We account for income taxes in accordance with Codification Topic 740, Income Taxes, which requires that we recognize a current tax liability or asset for current taxes payable or refundable and a deferred tax liability or asset for the estimated future tax effects of temporary differences and carryforwards to the extent they are realizable. We believe it is more likely than not that the deferred tax assets will be realized through future taxable income and future tax effects of temporary differences between book income and taxable income. Accordingly, we have not established a valuation allowance for the deferred tax assets. Codification Topic 740-10 clarifies the accounting for income taxes by prescribing a minimum recognition threshold that a tax position must meet before being recognized in the financial statements. In the ordinary course of business, there are transactions and calculations where the ultimate tax outcome is uncertain. In addition, we are subject to periodic audits and examinations by the Internal Revenue Service and other taxing authorities. We have evaluated the positions taken on our filed tax returns. We have concluded that no uncertain tax positions exist as of June 30, 2016. Although we believe that our estimates are reasonable, actual results could differ from these estimates. See Note 14.
| - 9 - |
ImmuCell Corporation
Notes to Unaudited Condensed Financial Statements (continued)
| (n) | Stock-Based Compensation |
We account for stock-based compensation in accordance with Codification Topic 718, Compensation-Stock Compensation, which generally requires us to recognize non-cash compensation expense for stock-based payments using the fair-value-based method. The fair value of each stock option grant has been estimated on the date of grant using the Black-Scholes option pricing model. Accordingly, we recorded compensation expense pertaining to stock-based compensation of $20,044 and $7,005 during the three-month periods ended June 30, 2016 and 2015 and $28,952 and $11,483 during the six-month periods ended June 30, 2016 and 2015, respectively, which resulted in an increase to the loss before income taxes or a decrease to income before income taxes of less than $0.01 per share during each of the periods reported.
| (o) | Net (Loss) Income Per Common Share |
Net (Loss) Income per common share has been computed in accordance with Codification Topic 260-10, Earnings Per Share. The Net (Loss) per common share has been computed by dividing the Net (Loss) by the weighted average number of common shares outstanding during the period, without giving consideration to outstanding stock options because the impact would be anti-dilutive. The basic Net Income per share has been computed by dividing Net Income by the weighted average number of common shares outstanding during this period. The diluted Net Income per share has been computed by dividing Net Income by the weighted average number of shares outstanding during the period plus all outstanding stock options with an exercise price that is less than the average market price of the common stock during the period less the number of shares that could have been repurchased at this average market price with the proceeds from the hypothetical stock option exercises. The weighted average and diluted number of shares outstanding consisted of the following:
| Three-Month Periods Ended June 30, | Six-Month Periods Ended June 30, | |||||||||||||||
| 2016 | 2015 | 2016 | 2015 | |||||||||||||
| Weighted average number of shares outstanding | 4,178,855 | 3,034,539 | 4,005,956 | 3,030,962 | ||||||||||||
| Effect of dilutive stock options | 0 | 121,124 | 111,032 | 118,678 | ||||||||||||
| Diluted number of shares outstanding | 4,178,855 | 3,155,663 | 4,116,988 | 3,149,640 | ||||||||||||
| Outstanding stock options not included in the calculation because the effect would be anti-dilutive | 270,000 | 5,000 | 49,000 | 7,000 | ||||||||||||
| (p) | Use of Estimates |
The preparation of financial statements in conformity with GAAP requires management to make estimates and assumptions that affect the reported amounts of assets and liabilities and disclosure of contingent assets and liabilities at the date of the financial statements and the reported amounts of revenues and expenses during the period. Although we regularly assess these estimates, actual amounts could differ from those estimates. Changes in estimates are recorded during the period in which they become known. Significant estimates include our inventory, goodwill, accrued expenses and costs of goods sold accounts and amortization of our intangible assets.
| (q) | New Accounting Pronouncements |
In May 2014, the FASB issued Accounting Standards Update (ASU) No. 2014-09, Revenue from Contracts with Customers, which requires an entity to recognize the amount of revenue to which it expects to be entitled for the transfer of promised goods or services to customers. ASU 2014-09 will replace most existing revenue recognition guidance in U.S. GAAP when it becomes effective. ASU 2014-09 was initially to become effective for the Company on January 1, 2017. Early application was not permitted. In July 2015, the FASB approved a one-year deferral in the effective date to January 1, 2018, with the option of applying the standard on the original effective date. ASU 2014-09 permits the use of either the retrospective or cumulative effect transition method. We have evaluated the effect that ASU 2014-09 would have on our financial statements and related disclosures. We expect that ASU 2014-09 will have no significant effect on our ongoing financial reporting, but we continue to evaluate this pending accounting standard.
| - 10 - |
ImmuCell Corporation
Notes to Unaudited Condensed Financial Statements (continued)
In April 2015, the FASB issued ASU No. 2015-03, Interest-Imputation of Interest, which requires that debt issuance costs related to a recognized debt liability be presented in the balance sheet as a direct deduction from the carrying amount of that debt liability, consistent with debt discounts. This update is effective for the annual reporting periods beginning after December 15, 2015. During the first quarter of 2016, we adopted ASU 2015-03 and reclassified $40,792 of debt issuance costs (net) from other assets to a reduction in our bank debt liability as of December 31, 2015. In August 2015, the FASB confirmed that ASU No. 2015-03 did not address the presentation or subsequent measurement of debt issuance costs related to line-of-credit arrangements. For line-of-credit arrangements, borrowers have the option of presenting debt issuance costs as an asset which is subsequently amortized ratably over the term of the line-of-credit arrangement, regardless of whether there are any related outstanding borrowings. ASU No. 2015-03 did not have a material impact on our financial statements.
In July 2015, the FASB issued ASU No. 2015-11, Inventory, which simplifies the existing guidance which requires entities to subsequently measure inventory at the lower of cost or market value. Under ASU No. 2015-11, an entity should measure inventory valued using a first-in, first-out or average cost method at the lower of cost or net realizable value, which is defined as the estimated selling price in the ordinary course of business, less reasonably predictable costs of completion, disposal and transportation. This update is effective for public business entities during fiscal years beginning after December 15, 2016. Early adoption is permitted. ASU 2015-11 is not expected to have a material impact on our financial statements.
In November 2015, the FASB issued ASU No. 2015-17, Income Taxes, which simplifies the existing guidance which requires an entity to separate deferred income tax liabilities and assets into current and noncurrent amounts in a classified statement of financial position. Under ASU No. 2015-17, an entity should classify all deferred tax liabilities and assets as one noncurrent deferred tax liability or asset (net) within the statement of financial position. The amendments apply to all entities that present a classified statement of financial position and are effective for the public business entities for annual periods beginning after December 15, 2016, including interim periods therein. Earlier application is permitted. During the first quarter of 2016, we adopted ASU No. 2015-17 early and reclassified $19,588 of current deferred tax liabilities to long-term, which amount was netted against our long-term deferred tax asset, as of December 31, 2015. ASU No. 2015-17 did not have a material impact on our financial statements.
In February 2016, the FASB issued ASU No. 2016-02, Leases, which requires lessees to put most leases on their balance sheet but recognize expenses on their income statements in a manner similar to today’s accounting. ASU 2016-02 is effective for fiscal years beginning after December 15, 2018, including interim periods therein. Early adoption is permitted. We are not subject to material lease obligations, and we do not expect ASU 2016-02 to have a material impact on our financial statements.
| 3. | CASH, CASH EQUIVALENTS, SHORT-TERM INVESTMENTS AND LONG-TERM INVESTMENTS |
Cash, cash equivalents, short-term investments and long-term investments (at cost) consisted of the following:
As
of | As
of | Increase | ||||||||||
| Cash and cash equivalents | $ | 3,650,699 | $ | 1,573,328 | $ | 2,077,371 | ||||||
| Short-term investments(1) | 6,696,000 | 4,464,000 | 2,232,000 | |||||||||
| Subtotal | 10,346,699 | 6,037,328 | 4,309,371 | |||||||||
| Long-term investments(1) | 487,000 | 487,000 | 0 | |||||||||
| Total | $ | 10,833,699 | $ | 6,524,328 | $ | 4,309,371 | ||||||
(1) We accrued $18,481 and $9,221 in interest income on these investments as of June 30, 2016 and December 31, 2015, respectively, which was recorded in other receivables.
Held to maturity securities are carried at amortized cost. The cost of securities sold is determined based on the specific identification method. Realized gains and losses, and declines in value judged to be other than temporary, are included in investment income. As of June 30, 2016, held to maturity securities consisted of the following:
| Gross Unrealized | Estimated | |||||||||||||||
| Cost | Gains | Losses | Fair Value | |||||||||||||
| Certificates of deposit | $ | 7,183,000 | $ | 5,661 | $ | 0 | $ | 7,188,661 | ||||||||
| - 11 - |
ImmuCell Corporation
Notes to Unaudited Condensed Financial Statements (continued)
| 4. | INVENTORY |
Inventory consisted of the following:
As
of | As
of |
Increase | ||||||||||
| Raw materials | $ | 474,021 | $ | 284,331 | $ | 189,690 | ||||||
| Work-in-process | 581,315 | 452,024 | 129,291 | |||||||||
| Finished goods | 173,541 | 133,852 | 39,689 | |||||||||
| Total | $ | 1,228,877 | $ | 870,207 | $ | 358,670 | ||||||
| 5. | ACCOUNTS RECEIVABLE |
Accounts receivable consisted of the following:
As
of | As
of | Increase (Decrease) | ||||||||||
| Trade accounts receivable, gross | $ | 966,934 | $ | 736,195 | $ | 230,739 | ||||||
| Accumulated allowance for bad debt | (19,641 | ) | (18,092 | ) | (1,549 | ) | ||||||
| Trade accounts receivable, net | $ | 947,293 | $ | 718,103 | $ | 229,190 | ||||||
| 6. | PREPAID EXPENSES AND OTHER CURRENT ASSETS |
Prepaid expenses and other current assets consisted of the following:
As
of | As of December 31, 2015 |
Increase | ||||||||||
| Prepaid expenses and other current assets(1) | $ | 296,654 | $ | 183,396 | $ | 113,258 | ||||||
| Other receivables | 159,508 | 36,001 | 123,507 | |||||||||
| Security deposits | 46,931 | 37,301 | 9,630 | |||||||||
| Total | $ | 503,093 | $ | 256,698 | $ | 246,395 | ||||||
(1) During the first quarter of 2016, we paid $20,500 for an option to purchase additional land nearby to our Portland facility that could be used to construct an additional facility should we decide to exercise the option before the end of 2016 for an additional $184,500.
| 7. | PROPERTY, PLANT AND EQUIPMENT |
Property, plant and equipment consisted of the following, at cost:
| As of June 30, 2016 | As of December 31, 2015 | Increase (Decrease) | ||||||||||
| Laboratory and manufacturing equipment | $ | 5,243,628 | $ | 3,766,556 | $ | 1,477,072 | ||||||
| Building and improvements | 4,935,842 | 4,716,204 | 219,638 | |||||||||
| Office furniture and equipment | 570,824 | 568,188 | 2,636 | |||||||||
| Construction in progress(1) | 521,811 | 1,084,924 | (563,113 | ) | ||||||||
| Land | 347,114 | 333,486 | 13,628 | |||||||||
| Property, plant and equipment, gross | 11,619,219 | 10,469,358 | 1,149,861 | |||||||||
| Accumulated depreciation | (5,116,886 | ) | (4,750,544 | ) | (366,342 | ) | ||||||
| Property, plant and equipment, net | $ | 6,502,333 | $ | 5,718,814 | $ | 783,519 | ||||||
(1) As of June 30, 2016, construction in progress included $95,691 in payments related to the construction of our commercial-scale Nisin plant. As of December 31, 2015, construction in progress consisted principally of partial payments towards new manufacturing equipment related to expanding our production capacity for First Defense®.
| - 12 - |
ImmuCell Corporation
Notes to Unaudited Condensed Financial Statements (continued)
| 8. | BUSINESS ACQUISITION |
On January 4, 2016, we acquired certain business assets from DAY 1™ Technology, LLC of Minnesota. The acquired rights and know-how are primarily related to formulating our bovine antibodies into a gel solution for an oral delivery option to newborn calves via a syringe (or tube). This product format offers customers an alternative delivery option to the bolus (the standard delivery format of the bivalent First Defense® product since first approval by the United States Department of Agriculture (USDA) and product launch in 1991) and could allow more market penetration. The formulation was developed for us and has been sold as a feed product without disease claims since 2012. This purchase also includes certain other related private-label products. The total purchase price was approximately $532,000. Approximately $368,000 of this amount was paid as of the closing date, and the remaining balance will be paid contingent upon successful technology transfer and as a royalty on related product sales made through December 31, 2018. There is no limit on the amount of the royalty, but it is proportional to sales of related product. That amount is reported in accounts payable and accrued expenses on the accompanying balance sheet. The estimated fair values of the assets purchased in this transaction included inventory of $113,000, machinery and equipment of $132,000, a developed technology intangible of $191,000 (which includes an immaterial amount of value associated with customer relationships and a non-compete agreement and was valued using the relief from royalty method) and goodwill of $96,000. The intangible assets and goodwill are deductible for tax return purposes. The goodwill arising from the acquisition consists largely of the estimated value of anticipated growth opportunities arising from synergies and efficiencies. The measurement period for the transaction is closed as of June 30, 2016. The impact of the acquisition on our proforma prior year operations is not significant.
| 9. | INTANGIBLE ASSETS |
The intangible assets described in Note 8 are being amortized over their useful lives, which does not exceed the ten-year period ending December 31, 2025. Intangible amortization expense was $6,134 and $15,442 during the three-month and six-month periods ended June 30, 2016, respectively. A summary of intangible amortization expense estimated for the five years beginning January 1, 2016 and thereafter is as follows:
| Period | Amount | |||
| Six months ending December 31, 2016 | $ | 14,232 | ||
| Year ending December 31, 2017 | 37,306 | |||
| Year ending December 31, 2018 | 37,306 | |||
| Year ending December 31, 2019 | 12,444 | |||
| Year ending December 31, 2020 | 12,444 | |||
| After December 31, 2020 | 61,866 | |||
| Total | $ | 175,598 | ||
| 10. | ACCOUNTS PAYABLE AND ACCRUED EXPENSES |
Accounts payable and accrued expenses consisted of the following:
As
of | As
of | Increase (Decrease) | ||||||||||
| Accounts payable – capital | $ | 329,732 | $ | 1,510 | $ | 328,222 | ||||||
| Accounts payable – trade | 233,441 | 199,105 | 34,336 | |||||||||
| Accrued payroll | 113,469 | 242,690 | (129,221 | ) | ||||||||
| Accrued clinical studies | 0 | 68,428 | (68,428 | ) | ||||||||
| Accrued professional fees | 78,950 | 56,450 | 22,500 | |||||||||
| Accrued other | 208,149 | 93,982 | 114,167 | |||||||||
| Total | $ | 963,741 | $ | 662,165 | $ | 301,576 | ||||||
| - 13 - |
ImmuCell Corporation
Notes to Unaudited Condensed Financial Statements (continued)
| 11. | BANK DEBT |
During the first quarter of 2016, we entered into a bank debt agreement covering certain additional credit facilities with TD Bank N.A. aggregating approximately $4.5 million comprised of: (a) a $2.5 million construction loan, drawable over an 18-month period at up to 80% of the cost of equipment installed in the to be constructed commercial-scale production facility for Mast Out®, during which interest only will be payable at a variable rate equal to the 30-day LIBOR plus 2.25%, which converts to a seven-year term loan facility at the end of construction at the same interest rate with monthly principal and interest payments based on a seven-year amortization schedule and (b) a $2.0 million construction loan, drawable over a 12-month period at up to 75% of the appraised value of the to be constructed commercial-scale production facility for Mast Out®, during which interest only will be payable at a variable rate equal to the 30-day LIBOR plus 2.25%, which converts to a nine-year term loan facility at the end of construction at the same interest rate with monthly principal and interest payments based on a twenty-year amortization schedule. There were no amounts outstanding under these facilities as of June 30, 2016.
Additionally, we have in place certain credit facilities with TD Bank N.A., which are secured by substantially all of our assets. Proceeds from the $1,000,000 mortgage note were received during the third quarter of 2010. Based on a 15-year amortization schedule, a balloon principal payment of approximately $451,885 will be due during the third quarter of 2020. Proceeds from the $2,500,000 mortgage note were received during the third quarter of 2015. Based on a 20-year amortization schedule, a balloon principal payment of approximately $1,550,007 will be due during the third quarter of 2025. Principal payments due under debt outstanding as of June 30, 2016 (excluding any debt proceeds to be drawn under the credit facilities entered into during the first quarter of 2016) are reflected in the following table by the year that payments are due:
| Period | $1,000,000 Mortgage Note | $2,500,000 Mortgage Note | Debt Issuance Costs | Total | ||||||||||||
| Six months ending December 31, 2016 | $ | 29,298 | $ | 39,714 | $ | (5,048 | ) | $ | 63,964 | |||||||
| Year ending December 31, 2017 | 61,056 | 82,308 | (10,095 | ) | 133,269 | |||||||||||
| Year ending December 31, 2018 | 64,876 | 86,097 | (10,095 | ) | 140,878 | |||||||||||
| Year ending December 31, 2019 | 68,908 | 89,997 | (10,095 | ) | 148,810 | |||||||||||
| Year ending December 31, 2020 | 493,696 | 94,005 | (9,462 | ) | 578,239 | |||||||||||
| After December 31, 2020 | 0 | 2,049,766 | (38,887 | ) | 2,010,879 | |||||||||||
| Total | $ | 717,834 | $ | 2,441,887 | $ | (83,682 | ) | $ | 3,076,039 | |||||||
We hedged our interest rate exposure on these mortgage notes with interest rate swap agreements that effectively converted floating interest rates based on the one-month LIBOR plus a bank profit margin of 3.25% and 2.25% to the fixed rates of 6.04% and 4.38%, respectively. As of June 30, 2016, the variable rates on these two mortgage notes were 3.70% and 2.70%, respectively. All derivatives are recognized on the balance sheet at their fair value. At the time of the closings and thereafter, the agreements were determined to be highly effective in hedging the variability of the identified cash flows and have been designated as cash flow hedges of the variability in the hedged interest payments. Changes in the fair value of the interest rate swap agreements are recorded in other comprehensive (loss) income, net of taxes. The original notional amounts of the interest rate swap agreements of $1,000,000 and $2,500,000 amortize in accordance with the amortization of the mortgage notes. The notional amount of the interest rate swaps was $3,159,721 as of June 30, 2016. Payments required by the interest rate swaps totaled $14,984 and $5,217 during the three-month periods ended June 30, 2016 and 2015, and $30,184 and $10,436 during the six-month periods ended June 30, 2016 and 2015, respectively. As the result of our decision to hedge this interest rate risk, we recorded other comprehensive (loss) income, net of taxes, in the amount of ($30,217) and $4,995 during the three-month periods ended June 30, 2016 and 2015, and ($95,290) and $1,088 during the six-month periods ended June 30, 2016 and 2015, respectively, which reflects the change in the fair value of the interest rate swap (liabilities), net of taxes. The fair values of the interest rate swaps have been determined using observable market-based inputs or unobservable inputs that are corroborated by market data. Accordingly, the interest rate swaps are classified as level 2 within the fair value hierarchy provided in Codification Topic 820, Fair Value Measurements and Disclosures.
In connection with the credit facilities entered into during the third quarters of 2010 and 2015 and the first quarter of 2016, we incurred debt issue costs of $26,489, $34,125 and $46,734, respectively, which costs are being amortized to other expenses over the terms of the credit facilities. These credit facilities are subject to certain financial covenants.
Proceeds from a $600,000 note bearing interest at 4.25% were received during the first quarter of 2011. This note was repaid during the third quarter of 2015. The $500,000 line of credit is available as needed and has been extended through May 31, 2017 and is renewable annually thereafter. The line of credit was unused as of June 30, 2016 and December 31, 2015. Interest on any borrowings against the line of credit would be variable at the higher of 4.25% per annum or the one-month LIBOR plus 3.5% per annum.
| - 14 - |
ImmuCell Corporation
Notes to Unaudited Condensed Financial Statements (continued)
| 12. | STOCKHOLDERS’ EQUITY |
On October 28, 2015, we filed a registration statement on Form S-3 with the SEC for the potential issuance of up to $10,000,000 in equity (subject to certain limitations). This registration statement became effective on November 10, 2015. Under this form of registration statement, we were limited to raising gross proceeds of no more than one-third of the market capitalization of our common stock (as determined by the high price within the preceding 60 days leading up to a sale of securities) held by non-affiliates (non-insiders) of the Company within a twelve-month period. This limit was approximately $5,958,000, based on the closing price of $8.08 per share as of January 6, 2016. On February 3, 2016, we sold 1,123,810 shares of common stock at a price to the public of $5.25 per share in an underwritten public offering, raising gross proceeds of approximately $5,900,000, resulting in net proceeds of approximately $5,313,000 (after deducting underwriting discounts and offering expenses) to the Company.
At the June 15, 2016 Annual Meeting of Stockholders, our stockholders voted to approve an amendment to the Company’s Certificate of Incorporation to increase the number of shares of common stock authorized for issuance from 8,000,000 to 10,000,000.
In June 2000, our stockholders approved the 2000 Stock Option and Incentive Plan (the “2000 Plan”) pursuant to the provisions of the Internal Revenue Code of 1986, under which employees and certain service providers may be granted options to purchase shares of the Company’s common stock at i) no less than fair market value on the date of grant in the case of incentive stock options and ii) no less than 85% of fair market value on the date of grant in the case of non-qualified stock options. Vesting requirements are determined by the Compensation and Stock Option Committee of the Board of Directors on a case by case basis. Originally, 250,000 shares of common stock were reserved for issuance under the 2000 Plan. The stockholders of the Company approved an increase in this number to 500,000 shares in June 2001. All options granted under the 2000 Plan expire no later than ten years from the date of grant. The 2000 Plan expired in February 2010, after which date no further options could be granted under the 2000 Plan. However, outstanding options under the 2000 Plan may be exercised in accordance with their terms.
In June 2010, our stockholders approved the 2010 Stock Option and Incentive Plan (the “2010 Plan”) pursuant to the provisions of the Internal Revenue Code of 1986, under which employees and certain service providers may be granted options to purchase shares of the Company’s common stock at i) no less than fair market value on the date of grant in the case of incentive stock options and ii) no less than 85% of fair market value on the date of grant in the case of non-qualified stock options. At that time, 300,000 shares of common stock were reserved for issuance under the 2010 Plan. Vesting requirements are determined by the Compensation and Stock Option Committee of the Board of Directors on a case by case basis. All options granted under the 2010 Plan expire no later than ten years from the date of grant.
Activity under the stock option plans described above was as follows:
| 2000 Plan | 2010 Plan | Weighted Average Exercise | Aggregate Intrinsic Value | |||||||||||||
| Outstanding at December 31, 2013 | 157,500 | 73,500 | $ | 3.30 | $ | 223,000 | ||||||||||
| Grants | 0 | 25,000 | $ | 4.69 | ||||||||||||
| Terminations | 0 | (2,000 | ) | $ | 5.75 | |||||||||||
| Exercises | 0 | (1,000 | ) | $ | 3.15 | |||||||||||
| Outstanding at December 31, 2014 | 157,500 | 95,500 | $ | 3.42 | $ | 364,000 | ||||||||||
| Grants | 0 | 16,000 | $ | 7.40 | ||||||||||||
| Terminations | 0 | (3,000 | ) | $ | 4.95 | |||||||||||
| Exercises | (26,000 | ) | (2,000 | ) | $ | 4.29 | ||||||||||
| Outstanding at December 31, 2015 | 131,500 | 106,500 | $ | 3.57 | $ | 945,000 | ||||||||||
| Grants | 0 | 37,000 | $ | 6.77 | ||||||||||||
| Terminations | 0 | (4,000 | ) | $ | 6.60 | |||||||||||
| Exercises | 0 | (1,000 | ) | $ | 3.15 | |||||||||||
| Outstanding at June 30, 2016 | 131,500 | 138,500 | $ | 3.96 | $ | 793,000 | ||||||||||
| Exercisable at June 30, 2016 | 131,500 | 40,500 | $ | 2.90 | $ | 689,000 | ||||||||||
| Reserved for future grants | 0 | 156,500 | ||||||||||||||
| - 15 - |
ImmuCell Corporation
Notes to Unaudited Condensed Financial Statements (continued)
During the six-month period ended June 30, 2016, one employee exercised stock options covering 1,000 shares. These options were exercised for cash, resulting in total proceeds of $3,150. During the year ended December 31, 2015, eleven employees exercised stock options covering the aggregate of 28,000 shares. These options were exercised for cash, resulting in total proceeds of $120,210. During the year ended December 31, 2014, one employee exercised stock options covering 1,000 shares. These options were exercised for cash, resulting in total proceeds of $3,149. At June 30, 2016, 270,000 shares of common stock were reserved for future issuance under all outstanding stock options described above, and an additional 156,500 shares of common stock were reserved for the potential issuance of stock option grants in the future under the 2010 Plan. The weighted average remaining life of the options outstanding under the 2000 Plan and the 2010 Plan as of June 30, 2016 was approximately four years and six months. The weighted average remaining life of the options exercisable under these plans as of June 30, 2016 was approximately two years and six months. The exercise prices of the options outstanding as of June 30, 2016 ranged from $1.70 to $7.54 per share. The 37,000 stock options granted during the first six months of 2016 had exercise prices between $6.70 and $6.93 per share. The 16,000 stock options granted during 2015 had exercise prices between $6.05 and $7.54 per share. The 25,000 stock options granted during 2014 had exercise prices between $4.25 and $4.80 per share. The aggregate intrinsic value of options exercised during 2016, 2015 and 2014 approximated $4,000, $110,000 and $1,000, respectively. The weighted-average grant date fair values of options granted during 2016, 2015 and 2014 were $3.57, $3.46 and $2.26 per share, respectively. As of June 30, 2016, total unrecognized stock-based compensation related to non-vested stock options aggregated $211,178. That cost is expected to be recognized at a declining rate through the second quarter of 2023 (the remaining vesting period of the outstanding non-vested stock options), including $41,476 during remainder of 2016. The fair value of each stock option grant has been estimated on the date of grant by an independent appraiser using the Black-Scholes option pricing model, for the purpose discussed in Note 2(n), with the following weighted-average assumptions for the three-month and six-month periods ended June 30, 2016 and for the years ended December 31, 2015 and 2014:
| 2016 | 2015 | 2014 | ||||||||||
| Risk-free interest rate | 2.0 | % | 2.0 | % | 2.0 | % | ||||||
| Dividend yield | 0 | % | 0 | % | 0 | % | ||||||
| Expected volatility | 47 | % | 47 | % | 49 | % | ||||||
| Expected life | 6 years | 6 years | 6 years | |||||||||
The risk-free interest rate is based on U.S. Treasury yields for a maturity approximating the expected option term, while the other assumptions are derived from averages of our historical data.
| 13. | OTHER EXPENSES, NET |
Other expenses, net, consisted of the following:
Three-Month Periods Ended June 30, | Six-Month Periods Ended June 30, | |||||||||||||||
| 2016 | 2015 | 2016 | 2015 | |||||||||||||
| Interest expense | $ | 42,400 | $ | 12,883 | $ | 77,998 | $ | 25,954 | ||||||||
| Interest income | (13,410 | ) | (3,190 | ) | (26,745 | ) | (6,172 | ) | ||||||||
| Debt issuance amortization | 2,535 | 719 | 3,843 | 1,438 | ||||||||||||
| Other gains | (226 | ) | (3,914 | ) | (411 | ) | (9,272 | ) | ||||||||
| Other expenses, net | $ | 31,299 | $ | 6,498 | $ | 54,685 | $ | 11,948 | ||||||||
| 14. | INCOME TAXES |
Our income tax (benefit) expense aggregated ($679) and $113,427 for the three-month periods ended June 30, 2016 and 2015, respectively. Our income tax expense aggregated $222,450 and $448,947 for the six-month periods ended June 30, 2016 and 2015, respectively. In 2015, we utilized approximately $1,700,000 of net operating loss carryforwards to offset otherwise taxable income. As of December 31, 2015, we had federal net operating loss carryforwards of approximately $115,000 that we expect to utilize against taxable income in 2016. Additionally, we have federal general business tax credit carryforwards of approximately $262,000 that expire in 2027 through 2034, if not utilized before then, as well as approximately $78,000 of state tax credits.
Deferred tax assets are recognized only when it is probable that sufficient taxable income will be available in future periods against which deductible temporary differences and credits may be utilized. However, the amount of the deferred tax asset could be reduced if projected income is not achieved due to various factors, such as unfavorable business conditions. If projected income is not expected to be achieved, we would decrease the deferred tax asset to the amount that we believe can be realized.
| - 16 - |
ImmuCell Corporation
Notes to Unaudited Condensed Financial Statements (continued)
Net operating loss carryforwards, credits, and other tax attributes are subject to review and possible adjustment by the Internal Revenue Service. Section 382 of the Internal Revenue Code contains provisions that could place annual limitations on the future utilization of net operating loss carryforwards and credits in the event of a change in ownership of the Company, as defined.
The Company files income tax returns in the U.S. federal jurisdiction and several state jurisdictions. With few exceptions, the Company is no longer subject to income tax examinations by tax authorities for years before 2012. We currently have no tax examinations in progress. We also have not paid additional taxes, interest or penalties as a result of tax examinations nor do we have any unrecognized tax benefits for any of the periods in the accompanying financial statements.
| 15. | CONTINGENT LIABILITIES AND COMMITMENTS |
Our bylaws, as amended, in effect provide that the Company will indemnify its officers and directors to the maximum extent permitted by Delaware law. In addition, we make similar indemnity undertakings to each director through a separate indemnification agreement with that director. The maximum payment that we may be required to make under such provisions is theoretically unlimited and is impossible to determine. We maintain directors’ and officers’ liability insurance, which may provide reimbursement to the Company for payments made to, or on behalf of, officers and directors pursuant to the indemnification provisions. Our indemnification obligations were grandfathered under the provisions of Codification Topic 460, Guarantees. Accordingly, we have recorded no liability for such obligations as of June 30, 2016. Since our incorporation, we have had no occasion to make any indemnification payment to any of our officers or directors for any reason.
We enter into agreements with third parties in the ordinary course of business under which we are obligated to indemnify such third parties from and against various risks and losses. The precise terms of such indemnities vary with the nature of the agreement. In many cases, we limit the maximum amount of our indemnification obligations, but in some cases those obligations may be theoretically unlimited. We have not incurred material expenses in discharging any of these indemnification obligations, and based on our analysis of the nature of the risks involved, we believe that the fair value of the liabilities potentially arising under these agreements is minimal. Accordingly, we have recorded no liabilities for such obligations as of June 30, 2016.
The development, manufacturing and marketing of animal health care products entails an inherent risk that liability claims will be asserted against us during the normal course of business. We feel that we have reasonable levels of liability insurance to support our operations. We are aware of no such claims against us as of the date of this filing.
We are committed to purchasing significantly all of our needs for certain parts and services pertaining to Mast Out® exclusively from two contractors. If we do not commercialize the product on a timely basis, we would be liable for a $100,000 termination fee.
As of June 30, 2016, we had committed approximately $863,000 to capital expenditures, $588,000 to the production of inventory and an additional $199,000 to other obligations.
| 16. | SEGMENT INFORMATION |
We principally operate in the business segment described in Note 1. Pursuant to Codification Topic 280, Segment Reporting, we operate in one reportable business segment, that being the development, acquisition, manufacture and sale of products that improve the health and productivity of cows for the dairy and beef industries. Almost all of our internally funded product development expenses are in support of such products. The significant accounting policies of this segment are described in Note 2.
Our primary customers for the majority of our product sales (80% and 82% for the three-month periods ended June 30, 2016 and 2015 and 85% and 82% for the six-month periods ended June 30, 2016 and 2015, respectively) are in the U.S. dairy and beef industries. Product sales to international customers, who are also in the dairy and beef industries, aggregated 17% and 15% of our total product sales for the three-month periods ended June 30, 2016 and 2015 and 13% and 16% of our total product sales for the six-month periods ended June 30, 2016 and 2015, respectively.
| - 17 - |
ImmuCell Corporation
Notes to Unaudited Condensed Financial Statements (continued)
| 17. | RELATED PARTY TRANSACTIONS |
Dr. David S. Tomsche (Chair of our Board of Directors) is a controlling owner of Leedstone Inc. (formerly Stearns Veterinary Outlet, Inc.), a domestic distributor of ImmuCell products (First Defense®, Wipe Out® Dairy Wipes, and CMT) and of J-t Enterprises of Melrose, Inc., an exporter. His affiliated companies purchased $331,946 and $294,857 of products from ImmuCell during the six-month periods ended June 30, 2016 and 2015, respectively, on terms consistent with those offered to other distributors of similar status. We made marketing-related payments of $1,950 and $2,247 to these affiliated companies during the six-month periods ended June 30, 2016 and 2015, respectively. Our accounts receivable (subject to standard and customary payment terms) due from these affiliated companies aggregated $49,098 and $36,528 as of June 30, 2016 and December 31, 2015, respectively.
| 18. | EMPLOYEE BENEFITS |
We have a 401(k) savings plan (the Plan) in which all employees completing one month of service with the Company are eligible to participate. Participants may contribute up to the maximum amount allowed by the Internal Revenue Service. Since August 2012, we have matched 100% of the first 3% of each employee’s salary that is contributed to the Plan and 50% of the next 2% of each employee’s salary that is contributed to the Plan. Under this matching plan, we paid $20,241 and $20,329 into the Plan during the three-month periods ended June 30, 2016 and 2015, and $37,567 and $37,055 during the six-month period ended June 30, 2016 and 2015, respectively.
| 19. | SUBSEQUENT EVENTS |
We have adopted the disclosure provisions of Codification Topic 855-10-50-1, Subsequent Events, which provides guidance to establish general standards of accounting for and disclosures of events that occur after the balance sheet date but before financial statements are issued. Entities are required to disclose the date through which subsequent events were evaluated as well as the rationale for why that date was selected. This disclosure should alert all users of financial statements that an entity has not evaluated subsequent events after that date in the set of financial statements being presented. Codification Topic 855-10-50-1 requires additional disclosures only, and therefore did not have an impact on our financial condition, results of operations, earnings per share or cash flows. Public entities must evaluate subsequent events through the date that financial statements are issued. Accordingly, we have evaluated subsequent events through the time of filing on August 11, 2016, the date we have issued this Quarterly Report on Form 10-Q. As of such date, there were no material, reportable subsequent events.
| - 18 - |
ITEM 2 - MANAGEMENT'S DISCUSSION AND ANALYSIS OF FINANCIAL CONDITION AND RESULTS OF OPERATIONS
Financial Condition
Our strategy is focused on developing and selling products that improve animal health and productivity in the dairy and beef industries. We aim to capitalize on the significant growth in sales of First Defense® and to revolutionize the mastitis treatment paradigm. We have funded most of our product development expenses principally from our gross margin on product sales. After largely completing the significant clinical studies for Mast Out® and by increasing the gross margin earned from sales of First Defense®, we returned to profitability during the years ended December 31, 2012 and 2013. As anticipated, we incurred a net loss during the year ended December 31, 2014 due to an unusually large investment in a pilot plant for Mast Out®. After completing this investment, we did return to profitability, as planned, during the six-month period ended December 31, 2014 and continued this profitability throughout 2015 and for the six-month period ended June 30, 2016. The table below summarizes the changes in selected, key accounts (in thousands, except for percentages):
| As of June 30, | As of December 31, | Increase | ||||||||||||||
| 2016 | 2015 | Amount | % | |||||||||||||
| Cash, cash equivalents, short-term investments and long-term investments | $ | 10,834 | $ | 6,524 | $ | 4,309 | 66 | % | ||||||||
| Net working capital | $ | 11,933 | $ | 7,089 | $ | 4,843 | 68 | % | ||||||||
| Total assets | $ | 20,574 | $ | 14,540 | $ | 6,034 | 41 | % | ||||||||
| Stockholders’ equity | $ | 16,307 | $ | 10,614 | $ | 5,693 | 54 | % | ||||||||
| Common shares outstanding | 4,180 | 3,055 | 1,125 | 37 | % | |||||||||||
Net cash provided by operating activities amounted to $166,000 during the six-month period ended June 30, 2016 in comparison to net cash provided by operating activities of $1,518,000 during the six-month period ended June 30, 2015. Capital investments of $691,000 during the six-month period ended June 30, 2016 compared to capital investments of $1,434,000 during the six-month period ended June 30, 2015. Together with gross margin earned from ongoing product sales, we believe that we have sufficient capital resources to meet our working capital requirements and to finance our ongoing business operations during at least the next twelve months.
During the third quarters of 2010 and 2015, we agreed to terms of certain credit facilities with TD Bank, N.A., which are secured by substantially all of our assets including our building, which was independently appraised at $4,180,000 in connection with the 2015 financing. As of June 30, 2016, our outstanding bank debt balance was approximately $3,160,000. We have a $500,000 line of credit that is available as needed. These credit facilities are subject to certain financial covenants and are secured by substantially all of our assets. We are in compliance with all applicable covenants as of June 30, 2016.
During the first quarter of 2016, we entered into a bank debt agreement covering certain additional credit facilities with TD Bank N.A. aggregating approximately $4.5 million comprised of: (a) a $2.5 million construction loan, drawable over an 18-month period at up to 80% of the cost of equipment installed in the to be constructed commercial-scale production facility for Mast Out®, during which interest only will be payable at a variable rate equal to the 30-day LIBOR plus 2.25%, which converts to a seven-year term loan facility at the end of construction at the same interest rate with monthly principal and interest payments based on a seven-year amortization schedule and (b) a $2.0 million construction loan, drawable over a 12-month period at up to 75% of the appraised value of the to be constructed commercial-scale production facility for Mast Out®, during which interest only will be payable at a variable rate equal to the 30-day LIBOR plus 2.25%, which converts to a nine-year term loan facility at the end of construction at the same interest rate with monthly principal and interest payments based on a twenty-year amortization schedule. As of June 30, 2016, we had not drawn proceeds under either of these credit facilities. These credit facilities are subject to certain financial covenants and are secured by substantially all of our assets. At this point, we do not anticipate drawing funds under the $2.5 million construction loan before the third quarter of 2017 or drawing funds under the $2.0 million construction loan before the first quarter of 2017. These credit facilities may be effectively converted to fixed rate loans when proceeds are drawn (at our option) by entering into interest rate swap agreements.
During the first quarter of 2016, we sold 1,123,810 shares of common stock at a price to the public of $5.25 per share in an underwritten public offering, raising gross proceeds of approximately $5,900,000. The net proceeds of approximately $5,313,000 (after deducting underwriting discounts and offering expenses), together with borrowings under the credit facilities we entered into during the first quarter of 2016, will be used to construct and equip a facility to produce pharmaceutical-grade Nisin, the active ingredient in Mast Out®.
| - 19 - |
The estimated total cost of the Nisin facility is approximately $17,500,000. We initiated this investment during the fourth quarter of 2015. We expect to fund the remaining cost not covered by the stock sale proceeds and the bank borrowings with our available cash and cash to be generated from operations during 2016 to 2018. These costs are being capitalized on our balance sheet as construction in progress until commercial sales are initiated. The following table details the amount and timing of the expected investment:
| Period | Amount(1) | |||
| Six-month period ended June 30, 2016 | $ | 95,691 | ||
| Estimated investment required to complete | 17,404,309 | |||
| Estimated total investment | $ | 17,500,000 | ||
(1) These figures do not include approximately $278,000 that was invested in land for the facility, which was acquired during the fourth quarter of 2015.
As of July 1, 2016, we had additional authorization from our Board of Directors to spend up to approximately $1,099,000 for new manufacturing equipment and other routine and necessary capital expenditures primarily to pay for the acquisition of additional First Defense® production equipment necessary to increase our production capacity and prepare for the launch of a trivalent product format of First Defense®. We completed an investment to increase our liquid processing capacity during the fourth quarter of 2015 and an investment to increase our freeze-drying capacity at the end of the first quarter of 2016. These investments, together with the 7,100 square foot facility addition, described below, are necessary to increase our manufacturing capacity to fill our current backlog of First Defense® orders and to meet the increased sales demand that we are experiencing. This investment does not include cash budgeted for construction of the commercial-scale production facility for Mast Out® described in the preceding paragraph.
During the third quarter of 2013, our Board of Directors approved the aggregate investment of approximately $3,000,000 in two projects. The first investment involved acquiring processing equipment and modifying a portion of our facility to create a pilot production plant for the Mast Out® product development initiative. These expenses were not capitalized because this plant is not expected to support commercial sales. Construction of the facility addition was substantially completed during the third quarter of 2014. This specifically targeted increase in product development expenses resulted in a net loss during the first six months of 2014. The second investment involved acquiring manufacturing equipment and constructing a two-story addition to our facility, providing us with approximately 7,100 square feet of cold storage, production and warehouse space to increase our commercial production capacity for First Defense® and other products. Construction of the facility addition was initiated at the end of the third quarter of 2014 and was substantially completed during the first quarter of 2015. These expenses have been capitalized as they support the commercial sale of our existing products. The following table details the spending on these two projects:
| Period | Expenses | Capital Expenditures | Total Expenses and Capital Expenditures | |||||||||
| Three-month period ended December 31, 2013 | $ | 110,000 | $ | 21,000 | $ | 131,000 | ||||||
| Year ended December 31, 2014 | 973,000 | 1,492,000 | 2,465,000 | |||||||||
| Nine-month period ended September 30, 2015 | 9,000 | 414,000 | 423,000 | |||||||||
| Total investment | $ | 1,092,000 | $ | 1,927,000 | $ | 3,019,000 | ||||||
Results of Operations
Product Sales
Product sales during the three-month period ended June 30, 2016 increased by 21%, or $415,000, to $2,376,000 from $1,960,000 during the three-month period ended June 30, 2015. Product sales during the six-month period ended June 30, 2016, increased by 6%, or $300,000 to $5,362,000 from $5,062,000 during the six-month period ended June 30, 2015. Product sales during the twelve-month period ended June 30, 2016 increased by 17%, or $1,492,000, to $10,529,000 from $9,037,000 during the twelve-month period ended June 30, 2015. As of June 30, 2016, we had a backlog of orders aggregating approximately $365,000 in comparison to backlogs of $1,660,000 as of March 31, 2016 and $1,452,000 as of June 30, 2015. During the six-month period ended June 30, 2016, domestic product sales increased by 11%, or $479,000, and international sales decreased by 21%, or $179,000, in comparison to the same period in 2015. The decrease in international sales was more a result of how we chose to allocate scarce product than a factor of reduced demand.
During the first quarter of 2008, we implemented a modest increase to the selling price of First Defense®. We did not implement another price increase for First Defense® until the third quarter of 2014. During 2015, we implemented an increase to the selling price of First Defense Technology™. The selling price for Wipe Out® Dairy Wipes was increased effective January 1, 2016. Effective for orders placed after April 1, 2016, we implemented a price increase of approximately 5% for First Defense®.
| - 20 - |
Our lead product, First Defense®, continues to benefit from wide acceptance by dairy and beef producers as an effective tool to prevent bovine enteritis (scours) in newborn calves. We believe that our increased investment in sales and marketing personnel and initiatives is helping us introduce First Defense® to new customers. We are selling new product applications of First Defense® under the description First Defense TechnologyTM, which is a unique whey protein concentrate that is processed utilizing our proprietary milk protein purification methods, for the nutritional and feed supplement markets in different formats without the claims of our USDA-licensed product. During the first quarter of 2011, we initiated sales of First Defense TechnologyTM in a bulk powder format (no capsule), which is delivered with a scoop and mixed with colostrum for feeding to calves. During the fourth quarter of 2011, Milk Products, LLC of Chilton, Wisconsin launched commercial sales of their product, Ultra Start® 150 Plus and certain similar private label products, which are colostrum replacers with First Defense TechnologyTM Inside. During the first quarter of 2012, we launched a tube delivery format of our First Defense TechnologyTM in a gel solution. Sales of the First Defense® product line aggregated 92% and 94% of our total product sales during the six-month periods ended June 30, 2016 and 2015, respectively. Sales of the First Defense® product line increased by 24%, or $433,000, during the three-month period ended June 30, 2016 in comparison to the same period in 2015. Sales of the First Defense® product line increased by 4%, or $196,000, during the six-month period ended June 30, 2016 in comparison to the same period in 2015. Sales of the First Defense® product line increased by 15%, or $1,241,000, during the twelve-month period ended June 30, 2016 in comparison to the same period ended June 30, 2015. Sales of the First Defense® product line increased by 36%, 27% and 14% during the years ended December 31, 2015, 2014 and 2013, respectively, in comparison to the prior years. This new level of sales demand for First Defense® exceeded our production capacity and available inventory. In response, we have completed the investments necessary to increase our liquid processing capacity by 50% and our freeze drying capacity by 100%. We began to fully realize the benefit of this capacity expansion during the second quarter of 2016, as we significantly reduced the backlog of orders. We have realized consistently positive sales growth of the First Defense® product line for twenty-one of the last twenty-three quarters, in comparison to the same quarters of the prior year, as demonstrated in the following table:
Q= Quarter FY= Full Year YTD= Year to Date
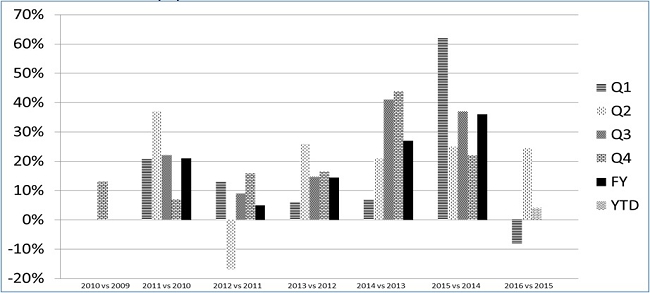
We believe that the long-term growth in sales of the First Defense® product line may reflect, at least in part, the success of our strategic decision initiated in 2010 to invest in additional sales and marketing efforts. Our sales and marketing team currently consists of a vice president, five regional managers and an inside sales and customer service representative. Our facility manager processes all shipments. We launched a new communications campaign at the end of 2010 that continues to emphasize how the unique ability of First Defense® to provide Immediate ImmunityTM generates a dependable return on investment for dairy and beef producers. Preventing newborn calves from becoming sick helps them to reach their genetic potential.
| - 21 - |
Competition for resources that dairy producers allocate to their calf enterprises has increased by the many new products that have been introduced to the calf market. Our sales are normally seasonal, with higher sales expected during the first quarter and lower sales expected during the second and third quarters. Such seasonality is heavily influenced by the beef calving season. Warm and dry weather reduces the producer’s perception of the need for a disease preventative product like First Defense®, but heat stress on calves caused by extremely hot summer weather can increase the incidence of scours. Harsher winter weather benefits our sales. The animal health distribution segment has been aggressively consolidating over the last few years. Larger distributors have been acquiring smaller distributors. Beef herd numbers were reduced because of the 2012 drought conditions in many parts of North America. This resulted in an increase in the value of newborn calves, as producers re-build their herd levels. Such an upswing increased a producer’s likelihood to invest in First Defense® for their calf crop.
We sell topical wipes that are pre-moistened with a Nisin-based formulation (our second leading source of product sales) in two product formats. Since 1999, we have been selling Wipe Out® Dairy Wipes for use in preparing the teat area of a cow for milking. We are competing aggressively on selling price to earn new business against less expensive products and alternative teat sanitizing methods. We believe that sales growth potential for Wipe Out® Dairy Wipes is limited because most of our sales of this product tend to be to smaller dairies that are under continued financial pressures, forcing many small dairy producers out of business. While our product is a high quality tool, there are less expensive ways to sanitize a cow’s udder prior to milking, and many producers opt for a less expensive solution. During the first quarter of 2013, we initiated sales of Nisin-based wipes for pets in a 120-count canister (Preva™ wipes) to Bayer HealthCare Animal Health of St. Joseph, Missouri for commercial sales to pet owners. Sales of the topical wipes product line (both product formats) increased by 70%, or $50,000, during the three-month period ended June 30, 2016 in comparison to the same period in 2015. Sales of the topical wipes product line increased by 58%, or $79,000, during the six-month period ended June 30, 2016 in comparison to the same period in 2015. Sales of the topical wipes product line aggregated 4% and 3% of total product sales during the six-month periods ended June 30, 2016 and 2015, respectively.
Sales of the new private label products (our third leading source of product sales) that we acquired in January 2016 aggregated less than 3% of our total sales during the six-month period ended June 30, 2016. These products generally are comprised of nutritional feed ingredients delivered via a tube or capsule.
Sales of our California Mastitis Test (CMT) aggregated less than $100,000 during the six-month periods ended June 30, 2016 and 2015. We make and sell bulk reagents for Isolate™ (formerly known as Crypto-Scan®), which is a drinking water test that is sold by our distributor in Europe. No sales of Isolate™ were made during the first six months of 2016. Sales of Isolate™ aggregated less than $100,000 during the six-month periods ended June 30, 2015. Sales of these two products aggregated less than 4% of total product sales during the six-month periods ended June 30, 2016 and 2015.
Gross Margin
Changes in the gross margin on product sales are summarized in the following table for the respective periods (in thousands, except for percentages):
| Three-Month Periods Ended June 30, | Increase (Decrease) | |||||||||||||||
| 2016 | 2015 | Amount | % | |||||||||||||
| Gross margin | $ | 1,240 | $ | 1,131 | $ | 109 | 10 | % | ||||||||
| Percent of product sales | 52 | % | 58 | % | (5 | %) | (10 | %) | ||||||||
| Six-Month
Periods Ended June 30, | Increase (Decrease) | |||||||||||||||
| 2016 | 2015 | Amount | % | |||||||||||||
| Gross margin | $ | 2,997 | $ | 2,981 | $ | 16 | 1 | % | ||||||||
| Percent of product sales | 56 | % | 59 | % | (3 | %) | (5 | %) | ||||||||
Twelve-Month
Periods | Increase (Decrease) | |||||||||||||||
| 2016 | 2015 | Amount | % | |||||||||||||
| Gross margin | $ | 6,267 | $ | 5,402 | $ | 865 | 16 | % | ||||||||
| Percent of product sales | 60 | % | 60 | % | (0 | %) | (0 | %) | ||||||||
| - 22 - |
The gross margin as a percentage of product sales decreased to 52% during the three-month period ended June 30, 2016 from 58% during the three-month period ended June 30, 2015. The gross margin as a percentage of product sales decreased to 56% during the six-month period ended June 30, 2016 from 59% during the six-month period ended June 30, 2015. The gross margin as a percentage of product sales remained constant at approximately 60% during the twelve-month period ended June 30, 2016 in comparison to the twelve-month period ended June 30, 2015. The gross margin as a percentage of product sales was 61% and 59% during the years ended December 31, 2015 and 2014, respectively. This compares to gross margin percentages of 51% and 57% during the years ended December 31, 2013 and 2012, respectively. Our objective for the foreseeable future is to maintain the full-year gross margin percentage over 50%, and we have achieved this annual objective since 2009. During the first quarter of 2016, we completed an investment to increase our production capacity to build inventory levels to fill the backlog of orders and meet growing sales demand. A number of factors account for the variability in our costs, resulting in some fluctuations in gross margin percentages from quarter to quarter. The gross margin on First Defense® is affected by biological yields from our raw material, which do vary over time. We are contracting with many new farms to buy more colostrum to increase our production output. As we bring new cows onto our production program, we tend to experience a decrease in yield, which increases our costs of goods sold. Like most U.S. manufacturers, we have been experiencing increases in the cost of raw materials that we purchase. The costs for production of First Defense® and Wipe Out® Dairy Wipes have increased due to increased labor costs and other expenses associated with our efforts to sustain compliance with current Good Manufacturing Practices (cGMP) regulations in our production processes. We have been able to minimize the impact of these cost increases by implementing yield improvements. Product mix also affects gross margin in that we earn a higher gross margin on First Defense® and a much lower gross margin on Wipe Out® Dairy Wipes.
Sales and Marketing Expenses
Sales and marketing expenses increased by approximately 46%, or $146,000, to $462,000 during the three-month period ended June 30, 2016, in comparison to $316,000 during the three-month period ended June 30, 2015, aggregating 19% and 16% of product sales, respectively. Sales and marketing expenses increased by approximately 25%, or $176,000, to $881,000 during the six-month period ended June 30, 2016, in comparison to $705,000 during the six-month period ended June 30, 2015, aggregating 16% and 14% of product sales, respectively. We continue to leverage the efforts of our small sales force by using veterinary distributors. These expenses have increased due principally to a strategic decision to invest more to support First Defense® sales. This investment may have created, at least in part, our recent increase in product sales. Our current budgetary objective in 2016 is to invest 18% or less of product sales in sales and marketing expenses on an annual basis.
Administrative Expenses
Administrative expenses increased by approximately 14%, or $47,000, to $376,000 during the three-month period ended June 30, 2016, in comparison to $329,000 during the three-month period ended June 30, 2015. Administrative expenses increased by approximately 11%, or $73,000, to $713,000 during the six-month period ended June 30, 2016, in comparison to $640,000 during the six-month period ended June 30, 2015. We strive to be efficient with these expenses while funding costs associated with complying with the Sarbanes-Oxley Act of 2002 and other costs associated with being a publicly-held company. Prior to 2014, we had limited our investment in investor relations spending. Beginning in the second quarter of 2014, we initiated an investment in a more actively managed investor relations program. Additionally, we continue to provide full disclosure of the status of our business and financial condition in three quarterly reports and one annual report each year, as well as in Current Reports on Form 8-K when legally required or deemed appropriate by management. Additional information about management and our business is available in our annual Proxy Statement. All of these reports are filed with the SEC and are available on-line or upon request to the Company.
Product Development Expenses
Product development expenses increased by 40%, or $109,000, to $380,000 during the three-month period ended June 30, 2016 compared to $272,000 during the three-month period ended June 30, 2015. These expenses aggregated 16% and 14% of total product sales during these three-month periods, respectively. Product development expenses increased by 13%, or $80,000, to $683,000 during the six-month period ended June 30, 2016 compared to $602,000 during the six-month period ended June 30, 2015. This increase was, in large part, related to personnel recruiting and relocation expenses incurred during the second quarter of 2016. These expenses aggregated 13% and 12% of total product sales during these six-month periods, respectively. During the 17.5 year period that began January 1, 1999 (the year we first re-focused our business strategy on First Defense® and other products for the dairy and beef industries) and ended on June 30, 2016, we invested the aggregate of approximately $22,667,000 in product development expenses, averaging approximately $1,295,000 per year during this period. Approximately $4,130,000 of this investment was offset by product licensing revenues, technology sales and grant income.
The majority of our product development spending is focused on the development of Mast Out®, our Nisin-based intramammary treatment of subclinical mastitis in lactating dairy cows. During the 16.5 year period that began on January 1, 2000 (the year we began the development of Mast Out®) and ended on June 30, 2016, we invested the aggregate of approximately $12,123,000 in the development of Mast Out®. This estimated allocation to Mast Out® reflects only direct expenditures and includes no allocation of product development or administrative overhead expenses. Approximately $2,891,000 of this investment was offset by product licensing revenues and grant income related to Mast Out®.
| - 23 - |
During 2000, we acquired an exclusive license from Nutrition 21, Inc. (formerly Applied Microbiology Inc. or AMBI) to develop and market Nisin-based products for animal health applications, which allowed us to initiate the development of Mast Out®. In 2004, we paid Nutrition 21 approximately $965,000 to buy out this royalty and milestone-based license to Nisin, thereby acquiring control of the animal health applications of Nisin. Nisin, the same active ingredient contained in our topical wipe products, is an antibacterial peptide known to be effective against most Gram-positive and some Gram-negative bacteria. In our pivotal effectiveness study, statistically significant Mast Out® cure rates were associated with a statistically significant reduction in milk somatic cell count, which is an important measure of milk quality. Nisin is an antibacterial peptide known to be effective against most Gram-positive and some Gram-negative bacteria. Nisin is a well characterized substance, having been used in food preservation applications for over 50 years. Food-grade Nisin, however, cannot be used in pharmaceutical applications because of its low purity. Our Nisin technology includes methods to achieve pharmaceutical-grade purity.
It is generally current practice to treat mastitis only when the disease has progressed to the clinical stage where the milk from an infected cow cannot be sold. The use of all mastitis drugs currently on the market is permitted only if the milk from treated cows is discarded during treatment and for a period of time thereafter to allow the antibiotic residues to clear from milk that is to be consumed by humans. We have estimated that the cost of this discarded milk may be approximately $300 million per year. Because milk from cows with subclinical infections can be sold, this disease is largely left untreated to avoid the milk discard penalty. Subclinical mastitis is associated with reduced milk production (some have estimated approximately 1,500 pounds of lost milk, or about $240 at $16.00 per hundredweight, per infected cow), reduced milk premiums, reproduction inefficiencies and an increased incidence of clinical mastitis. We intend to introduce the first mastitis treatment that is not subject to milk discard or meat withhold requirements, which would be a
significant competitive advantage for our product.
In 2004, we entered into a product development and marketing agreement with Pfizer Animal Health (doing business as Zoetis since 2013) covering Mast Out®. Zoetis elected to terminate the agreement in 2007. We believe that this decision was not based on any unanticipated efficacy or regulatory issues. Rather, we believe the decision was primarily driven by a marketing concern relating to their fear that the milk from treated cows could interfere with the manufacture of certain cultured dairy products. Due to the zero milk discard feature, there is a risk that Nisin from the milk of cows treated with Mast Out® could interfere with the manufacture of certain (but not all) commercial cultured dairy products, such as some kinds of cheese and yogurt, if a process tank contains a high enough percentage of milk from treated cows. The impact of this potential interference ranges from a delay in the manufacturing process, which does happen at times for other reasons, to the less likely stopping of a cheese starter culture. Milk from cows that have been treated with Mast Out® that is sold exclusively for fluid milk products presents no such risk. We worked with scientists and mastitis experts to conduct a formal risk assessment to quantify the impact that milk from treated cows may have on cultured dairy products. This study concluded that the dilution of milk from treated cows through comingling with milk from untreated cows during normal milk hauling and storage practices reduces the risk of interference with commercial dairy cultures to a negligible level when Mast Out® is used in accordance with the product label. We do not believe that a premium-priced product such as Mast Out® will be used as part of a whole herd (“blitz”) treatment protocol, which reduces the risk of cheese interference. We do not see this as a significant problem as modern “precision dairying” practices support reducing the indiscriminate use of drug treatments.
Commercial introduction of Mast Out® in the United States is subject to approval of our New Animal Drug Application (NADA) by the Food and Drug Administration (FDA), which approval cannot be assured. Foreign regulatory approvals would be required for sales in key markets outside of the United States, which would involve some similar and some different requirements. The NADA is comprised of five principal Technical Sections and one administrative submission that are subject to the FDA’s phased review. By statute, each Technical Section submission is generally subject to a six-month review cycle by the FDA. Each Technical Section can be reviewed and approved separately. Upon review and assessment by the FDA that all requirements for a Technical Section have been met, the FDA may issue a Technical Section Complete Letter. The current status of our work on these submissions to the FDA is as follows:
1) Environmental Impact: During the third quarter of 2008, we received the Environmental Impact Technical section Complete Letter from the FDA.
2) Target Animal Safety: During the second quarter of 2012, we received the Target Animal Safety Technical Section Complete Letter from the FDA.
3) Effectiveness: During the third quarter of 2012, we received the Effectiveness Technical Section Complete Letter from the FDA. The draft product label carries claims for the treatment of subclinical mastitis associated with Streptococcus agalactiae, Streptococcus dysgalactiae, Streptococcus uberis, and coagulase-negative staphylococci in lactating dairy cattle.
| - 24 - |
4) Human Food Safety (HFS): The HFS Technical Section submission was made during the fourth quarter of 2010. This Technical Section includes several subsections such as: a) toxicology, b) total metabolism, c) effects of drug residues in food on human intestinal microbiology, d) effects on bacteria of human health concern (antimicrobial resistance) and e) pivotal residue chemistry. During the second quarter of 2011, we announced that the FDA had accepted the subsections described above and granted Mast Out® a zero milk discard period and a zero meat withhold period during and after treatment. Before we can obtain this Technical Section Complete Letter, we must transfer our analytical method that measures Nisin residues in milk to a government laboratory. Due to unexpected regulatory demands and review delays, completion of the HFS Technical Section is currently anticipated during the middle of 2017.
5) Chemistry, Manufacturing and Controls (CMC): Obtaining FDA approval of the CMC Technical Section defines the critical path to FDA approval and to initial commercial sales. During the third quarter of 2014, we completed an investment in facility modifications and processing equipment necessary to produce the Drug Substance (the Active Pharmaceutical Ingredient, which is our pharmaceutical-grade Nisin) at small-scale. This small-scale facility has been used to i) expand our process knowledge and controls, ii) establish operating ranges for critical process parameters, iii) optimize process yields and iv) verify the cost of production. We believe these efforts will reduce risk as we invest in the commercial-scale production facility.
The construction of the commercial-scale Drug Substance production facility is the most critical action in front of us on our path to regulatory approval. Our initial plan was to have the Drug Substance produced for us under a Development and Manufacturing Agreement with Lonza Sales, Ltd. of Basel, Switzerland, in order to avoid the investment in a manufacturing facility. By the end of 2011, we determined that the required minimum volumes were too large to permit efficient, continuous production and that the cost of goods under this contract would not be commercially feasible. This contract was terminated during the fourth quarter of 2014 by mutual consent. We presented this product development opportunity to a variety of large and small animal health companies. During the second quarter of 2013, we received a non-refundable $250,000 exclusive license option fee from a prospective partner that considered manufacturing the Drug Substance in a plant of its own. During the third quarter of 2013, this prospective partner decided not to execute a development and marketing license because it had determined that, in its opinion, it could not cost-effectively commercialize the product. While such a corporate partnership could have allowed us to avoid the large investment in a commercial-scale production facility, it would have taken a large share of the gross margin from product sales. We are encouraged by the regulatory and marketing feedback from prospective partners, following their due diligence, that our novel mastitis treatment can achieve FDA approval and have a significant, positive impact on the dairy industry.
We acquired land nearby to our existing Portland facility for this facility during the fourth quarter of 2015. During the first quarter of 2016, we raised equity financing and consummated bank debt facilities aggregating approximately $9.8 million. We are now preparing to construct our own facility for the commercial-scale production of the Drug Substance and hope to complete construction of the building shell by the end of 2016. We have estimated the cost to complete this project to be approximately $17,500,000. This investment is being capitalized as incurred. If we complete the construction and equipping of the Drug Substance facility by the end of 2017, we could make the first commercial-scale CMC Technical Section submission to the FDA during 2018. It is common for the CMC Technical Section submission to require two, six-month review periods by the FDA. Adherence to this schedule could lead to our achieving FDA approval during 2019.
We are party to a long-term, exclusive supply agreement with Plas-Pak Inc. of Norwich, Connecticut covering the proprietary syringe that was developed specifically for treating cows with Mast Out®. These syringes were used for all pivotal studies of Mast Out®. During the fourth quarter of 2015, this contract was extended through December 31, 2020.
Since 2010, we have been party to a long-term, exclusive Contract Manufacture Agreement with Norbrook Laboratories Limited of Newry, Northern Ireland, an FDA-approved Drug Product (filled and packaged syringes) manufacturer, covering the formulating and sterile-filling of the Drug Substance into Drug Product for Mast Out®. Norbrook provided these services for clinical material used in all pivotal studies of Mast Out®. During the fourth quarter of 2015, we entered into a revised agreement with Norbrook covering the final development and commercial-scale (but not at small-scale) launch of Mast Out® after FDA approval.
6) Administrative Submission: After obtaining the final Technical Section Complete Letter and after preparing materials responsive to other administrative requirements, the administrative NADA submission will be assembled for review by the FDA. This final administrative submission is subject to a statutory sixty-day review period. We will continue to provide detailed disclosures about the current status of this drug development process in our periodic filings with the SEC.
| - 25 - |
In addition to our work on Mast Out®, we are actively developing further improvements, extensions or additions to our current First Defense® product line. For example, we currently are developing treatments that could prevent calf scours caused by enteric pathogens in addition to E. coli K99 and bovine coronavirus (the current disease claims for First Defense®). In connection with that effort, during the second quarter of 2009 we entered into an exclusive license with the Baylor College of Medicine covering the underlying rotavirus vaccine technology used to generate the specific antibodies. This perpetual license (if not terminated for cause) is subject to milestone and royalty payments. If approved by the USDA, this would be the first passive antibody product on the market with disease claims against the three leading causes of calf scours, E. coli, coronavirus and rotavirus. Results from pilot studies completed during the first quarter of 2009 justified continued product development. We initiated a second pivotal effectiveness study at Cornell University College of Veterinary Medicine during the second quarter of 2014 and announced positive effectiveness results from this pivotal study during the first quarter of 2015. During the third quarter of 2015, we obtained concurrence from the USDA that we have been granted disease claims against bovine rotavirus. We are working to complete the other laboratory and manufacturing objectives required for product license approval. This could position us to achieve product licensure and market launch with the expanded claims during 2017. We intend to continue selling the bivalent capsule format of First Defense® as an option for customers after launch of the trivalent product. At the same time, we are working to expand our product development pipeline of bacteriocins that can be used as alternatives to traditional antibiotics. During the second quarter of 2015, we entered into an exclusive option agreement to license new bacteriocin technology from the University of Massachusetts Amherst. This technology focuses on bacteriocins having activity against Gram-negative infections for use in combating mastitis in dairy cattle. Subject to the availability of needed financial and other resources, we intend to begin new development projects that are aligned with our core competencies and market focus. We also remain interested in acquiring, on suitable terms, other new products and technologies that fit with our sales focus on the dairy and beef industries.
Net Operating Income
Net operating income during the three-month period ended June 30, 2016 of $21,000 compares to $214,000 during the three-month period ended June 30, 2015. Net operating income during the six-month period ended June 30, 2016 of $720,000 compares to $1,034,000 during the six-month period ended June 30, 2015. We have now reported positive net operating income for eight consecutive quarters.
Other expenses, net
Interest expense increased by approximately $30,000 to $42,000 during the three-month period ended June 30, 2016, in comparison to $13,000 during the three-month period ended June 30, 2015. Interest income increased by approximately $10,000 to $13,000 during the three-month period ended June 30, 2016, in comparison to $3,000 during the three-month period ended June 30, 2015. Other expenses (net) aggregated $31,000 and $6,000 during the three-month periods ended June 30, 2016 and 2015, respectively.
Interest expense increased by approximately $52,000 to $78,000 during the six-month period ended June 30, 2016, in comparison to $26,000 during the six-month period ended June 30, 2015. Interest income increased by approximately $21,000 to $27,000 during the six-month period ended June 30, 2016, in comparison to $6,000 during the six-month period ended June 30, 2015. Other expenses (net) aggregated $55,000 and $12,000 during the six-month periods ended June 30, 2016 and 2015, respectively.
(Loss) Income Before Income Taxes and Net (Loss) Income
Our (loss) before income taxes was ($10,000) during the three-month period ended June 30, 2016 in contrast to income before income taxes of $207,000 during the three-month period ended June 30, 2015. We recorded income tax (benefit) expense of (7%) and 55% of the (loss) income before income taxes during the three-month periods ended June 30, 2016 and 2015, respectively. The lower tax rate in 2016 is principally related to lower state taxes. Our net (loss) was ($9,000), or ($0.00) per share, during the three-month period ended June 30, 2016 in contrast to net income of $94,000, or $0.03 per diluted share, during the three-month period ended June 30, 2015.
Our income before income taxes was $666,000 during the six-month period ended June 30, 2016 compared to income before income taxes of $1,022,000 during the six-month period ended June 30, 2015. We recorded income tax expense of 33% and 44% of the income before income taxes during the six-month periods ended June 30, 2016 and 2015, respectively. The lower tax rate in 2016 is principally related to lower state taxes. Our net income was $443,000, or $0.11 per diluted share, during the six-month period ended June 30, 2016 compared to net income of $573,000, or $0.18 per diluted share, during the six-month period ended June 30, 2015. The decrease in earnings per diluted share was the result of a $130,000 drop in net income and there being more shares outstanding during most of the first six months of 2016.
| - 26 - |
ITEM 3 - QUANTITATIVE AND QUALITATIVE DISCLOSURES ABOUT MARKET RISK
None
ITEM 4 - CONTROLS AND PROCEDURES
Disclosure Controls and Procedures. Our management, with the participation of the individual who serves as our principal executive and principal financial officer, evaluated the effectiveness of our disclosure controls and procedures as of June 30, 2016. Based on this evaluation, that officer concluded that our disclosure controls and procedures were effective as of that date. Disclosure controls and procedures are designed to ensure that information required to be disclosed by us in the reports that we file or submit under the Exchange Act is (i) recorded, processed, summarized and reported within the time periods specified in the Securities and Exchange Commission’s rules and forms and (ii) accumulated and communicated to our management, including our principal executive and principal financial officer, as appropriate to allow timely decisions regarding required disclosures.
Changes in Internal Controls over Financial Reporting. The individual who serves as our principal executive and principal financial officer periodically evaluates any change in internal control over financial reporting which has occurred during the prior fiscal quarter. Management has concluded that there was no change in our internal control over financial reporting that occurred during the quarter ended June 30, 2016 that has materially affected, or is reasonably likely to materially affect, our internal control over financial reporting.
PART II. OTHER INFORMATION
ITEM 1 - LEGAL PROCEEDINGS
None
ITEM 1A - RISK FACTORS
Safe Harbor Statement
This Quarterly Report on Form 10-Q contains “forward-looking statements” within the meaning of Section 27A of the Securities Act of 1933 and Section 21E of the Securities Exchange Act of 1934. Such statements include, but are not limited to, any statements relating to: projections of future financial performance; the scope and timing of future product development work and commercialization of our products; future costs of product development efforts; the estimated prevalence rate of subclinical mastitis; future market share of and revenue generated by products still in development; future sources of financial support for our product development, manufacturing and marketing efforts; the future adequacy of our own manufacturing facilities or those of third parties with which we have contractual relationships to meet demand for our products on a timely basis; the amount and timing of future investments in facility modifications and production equipment; the future adequacy of our working capital and the availability of third party financing; timing and future costs of a facility to produce the Drug Substance (active pharmaceutical ingredient) for Mast Out®; the timing and outcome of pending or anticipated applications for future regulatory approvals; future regulatory requirements relating to our products; future expense ratios and margins; future compliance with bank debt covenants; future realization of deferred tax assets; costs associated with sustaining compliance with cGMP regulations in our current operations and attaining such compliance for the facility to produce the Drug Substance for Mast Out®; factors that may affect the dairy and beef industries and future demand for our products; the cost-effectiveness of additional sales and marketing expenditures and resources; the accuracy of our understanding of our distributors’ ordering patterns; anticipated changes in our manufacturing capabilities and efficiencies; anticipated competitive and market conditions; and any other statements that are not historical facts. Forward-looking statements can be identified by the use of words such as “expects”, “may”, “anticipates”, “aims”, “intends”, “would”, “could”, “should”, “will”, “plans”, “believes”, “estimates”, “targets”, “projects”, “forecasts” and similar words and expressions. In addition, there can be no assurance that future developments affecting us will be those that we anticipate. Such statements involve risks and uncertainties, including, but not limited to, those risks and uncertainties relating to difficulties or delays in development, testing, regulatory approval, production and marketing of our products, competition within our anticipated product markets, alignment between our manufacturing resources and product demand, the uncertainties associated with product development and Drug Substance manufacturing, our potential reliance upon third parties for financial support, products and services, changes in laws and regulations, decision making by regulatory authorities, possible dilutive impacts on existing stockholders from any equity financing transactions in which we may engage, currency fluctuations and other risks detailed from time to time in filings we make with the Securities and Exchange Commission, including our Quarterly Reports on Form 10-Q, our Annual Reports on Form 10-K and our Current Reports on Form 8-K. Such statements are based on our current expectations, but actual results may differ materially due to various factors, including the risk factors summarized below and uncertainties otherwise referred to in this Quarterly Report.
| - 27 - |
Projection of net income: Generally speaking, our financial performance can differ significantly from management projections, due to numerous factors that are difficult to predict or that are beyond our control. Weaker than expected sales of First Defense® or continued or extended shortfalls in production relative to the growing product sales demand could lead to less profits or an operating loss. Large investments in product development (or cost overruns) can result in a net loss. We expect the sales growth trend for First Defense® and the recent profitability trend to continue.
Reliance on sales of First Defense®: We are heavily reliant on the market acceptance of First Defense® to generate product sales and fund our operations (including part of our planned expansion to commercialize Mast Out®). Our business would not have been profitable during the nine consecutive years in the period ended December 31, 2007, or during the years ended December 31, 2012, 2013 and 2015 or during the first six months of 2016 without the gross margin that we earned on sales of First Defense®, which accounted for 92% and 93% of our product sales during the first six-months of 2016 and the year ended December 31, 2015, respectively.
Product risks generally: The sale of our products is subject to financial, efficacy, regulatory, competitive and other market risks. Elevated standards to achieve regulatory compliance required to sell our products continue to evolve. There is no assurance that we will continue to achieve market acceptance at a profitable price level or that we can continue to manufacture our products at a low enough cost to result in a sufficient gross margin to justify their continued manufacture and sale.
Product liability: The manufacture and sale of our products entails a risk of product liability. Our exposure to product liability is mitigated to some extent by the fact that our products are principally directed towards the animal health market. We have maintained product liability insurance in an amount which we believe is reasonable in relation to our potential exposure in this area. We have no history of claims of this nature being made.
Protection of intellectual property: Reliance upon trade secret, rather than patent, protection may cause us to be vulnerable to competitors who successfully replicate our manufacturing techniques and processes. Additionally, there can be no assurance that others may not independently develop similar trade secrets or technology or obtain access to our unpatented trade secrets or proprietary technology. Other companies may have filed patent applications and may have been issued patents involving products or technologies potentially useful to us or necessary for us to commercialize our products or achieve our business goals. There can be no assurance that we would be able to obtain licenses to any such patents on terms that are acceptable.
Regulatory requirements for First Defense®: First Defense® is sold in the United States subject to a product license from the Center for Veterinary Biologics, USDA, which was first obtained in 1991. The potency of serial lots is directly traceable to the original serial used to obtain the product performance claims (the “Reference Standard”). Due to the unique nature of the First Defense® label claims, host animal re-testing is not required as long as periodic laboratory analyses continue to support the stability of stored Reference Standard. To date, these analyses have demonstrated strong stability. However, if the USDA were not to approve requalification of the Reference Standard, additional clinical studies could be required to meet regulatory requirements and allow for continued sales of the product. Similar regulatory oversight risks exist in territories outside of the United States where we sell our products.
Regulatory requirements for Wipe Out®Dairy Wipes: While the FDA regulates the manufacture and sale of Wipe Out®Dairy Wipes, this type of product is permitted to be sold without a NADA approval, in accordance with the FDA’s Compliance Policy Guide 7125.30 (“Teat Dips and Udder Washes for Dairy Cows and Goats”). This policy guide could be withdrawn at the FDA’s discretion, in which case we would likely discontinue sales of the product. The manufacture of Wipe Out®Dairy Wipes is subject to Part 211 of the cGMP regulations. As a result, our operations are subject to inspection by the FDA. During the second quarter of 2007, the FDA inspected our facilities and operations and issued a Warning Letter to us, citing deficiencies in specific areas of the cGMP regulations. We filed an initial response to the FDA during the second quarter of 2007, and we responded to a request for additional information during the second quarter of 2008. During the first quarter of 2013, the FDA again inspected our facilities and operations. The report from this inspection was very favorable, and we responded to the few, minor observations that were noted. We remain subject to the risk of adverse action by the FDA in this respect.
Regulatory requirements for Mast Out®: The commercial introduction of Mast Out® in the United States will require us to obtain FDA approval for this product. Completing the development of Mast Out® through to the submission of the administrative NADA to the FDA involves risk. While three Technical Sections have been approved and the Human Food Safety Technical Section is near completion, the development process timeline has been extensive (16 years) and has involved multiple commercial production strategies. As such, the Chemistry, Manufacturing and Controls Technical Section has not yet been submitted for the Nisin Drug Substance or the Drug Product. To minimize this risk, we have met with the FDA to align on filing strategy and requirements. It presently is uncertain when or if this approval will be achieved, but we have disclosed a timeline of events that could lead to approval during 2019. We are exposed to additional regulatory compliance risks through the subcontractors that we choose to work with to produce Mast Out®, who also need to satisfy certain regulatory requirements in order to provide us with the products and services we need. International regulatory approvals would be required for sales outside of the United States. European regulatory authorities are not expected to approve a product with a zero milk discard claim, which would remove a significant competitive advantage of Mast Out® in that territory. However, the assigned milk discard period may be shorter for Mast Out® than it is for other products on the market in Europe.
| - 28 - |
Concentration of sales: Approximately 98% of our product sales were made to customers in the dairy and beef industries throughout the world during the first six months of 2016 and 2015. Approximately 85% and 82% of our product sales were made to customers in the U.S. dairy and beef industries during the first six-months of 2016 and 2015, respectively. A large portion of our product sales (59% and 63% during the first six months of 2016 and 2015, respectively) was made to two large distributors. A large portion of our trade accounts receivable (59% and 52% as of June 30, 2016 and December 31, 2015, respectively) was due from these two distributors. We have a good history with these distributors, but the concentration of sales and accounts receivable with a small number of customers does present a risk to us, including risks related to such customers experiencing financial difficulties or altering the basis on which they do business with us.
Economics of the dairy and beef industries:
| ● | All cattle and calves in the United States as of January 1, 2016 totaled 92,000,000, which is 3.3% higher than January 1, 2015. Prior to January 1, 2015, the January count of cattle inventory had steadily declined from 97,000,000 as of January 1, 2007. | |
| ● | All cattle and calves in the United States as of July 1, 2015 totaled 98,400,000, which is 2.2% higher than July 1, 2014. This is the first increase in the July count of cattle inventory since 2006, suggesting the rebuilding of the U.S. herd has begun. The July 1, 2014 amount of 96,300,000 was the lowest inventory count as of July 1st in decades. |
| ● | From 1998 through 2015, the size (annual average) of the U.S. dairy herd ranged from approximately the low of 9,011,000 (2004) to the high of 9,317,000 (2015). The 2015 level exceeded the previous high during this eighteen-year period of 9,314,000 in 2008. During the first six months of 2016, this average increased slightly to 9,323,000. |
| ● | While the number of cows in the U.S. herd and the production of milk per cow directly influence the supply of milk, demand for milk is also influenced by very volatile international demand for milk products. The Class III milk price (an industry benchmark that reflects the value of product used to make cheese) is an important indicator because it defines our customers’ revenue level. This annual average milk price level (measured in dollars per hundred pounds of milk) for 2014 of $22.34 (peaking at $24.60 in September 2014) was the highest level since these records were first reported in 1980. This strong price level declined to the average of $15.80 during 2015. This average price decreased further to $13.48 during the first six months of 2016. Future contract prices for later in 2016 are trending higher. The recent annual fluctuations in this milk price level are demonstrated in the following table: |
| Average Class III Milk Price for the year ended December 31, | Increase (Decrease) | |||
| 2012 | 2013 | |||
| $17.44 | $17.99 | 3% | ||
| 2013 | 2014 | |||
| $17.99 | $22.34 | 24% | ||
| 2014 | 2015 | |||
| $22.34 | $15.80 | (29%) | ||
| ● | The actual level of milk prices may be less important than its level relative to feed costs. One measure of this relationship is known as the milk-to-feed price ratio, which represents the amount of feed that one pound of milk can buy. The annual average for this ratio of 1.52 in 2012 was the lowest recorded since this ratio was first reported in 1985. The highest annual average this ratio has reached since 1985 was 3.64 in 1987. Since this ratio reached 3.24 in 2005, it has not exceeded 3.0. The annual average of 2.54 for 2014 was the highest this ratio has been since it was 2.81 in 2007. This ratio dropped to an annual average of 2.12 during 2015 and dropped to 2.02 during the first six months of 2016. The following table demonstrates the annual volatility and the low values of this ratio recently: |
| Average Milk-To-Feed Price Ratio for the year ended December 31, | Increase (Decrease) | |||
| 2012 | 2013 | |||
| 1.52 | 1.75 | 15% | ||
| 2013 | 2014 | |||
| 1.75 | 2.54 | 45% | ||
| 2014 | 2015 | |||
| 2.54 | 2.12 | (16%) | ||
| - 29 - |
| ● | An increase in feed costs also has a negative impact on the beef industry. Widespread severe drought conditions in key U.S. agricultural regions during 2012 drove feed costs higher and the inventory of all cattle and calves lower. The positive trend in these market indices during 2013 and 2014 resulted in an increase in the value of milk cows. The 2014 annual average price for a milk cow increased by 32% to $1,835 in comparison to 2013. Previously, this annual average price since 1970 was only higher when it reached $1,840 in 2007 and $1,953 in 2008. This annual average price for 2015 increased by 9% to $1,993 in comparison to 2014, but this average price has declined to $1,825 during 2016. The industry data referred to above is compiled from USDA databases. The value of newborn bull calves had risen to the unusually high level of approximately $300 to $400, but this value has decreased recently, currently ranging from $50 to $250 depending on region, which is still enough value to justify the investment in First Defense®. Given our focus on the dairy and beef industries, the volatile market conditions and the resulting financial insecurities of our primary end users are risks to our ability to maintain and grow sales at a profitable level. These factors also heighten the challenge of selling premium-priced animal health products (such as Mast Out®) into the dairy market. |
Product development risks: The development of new products is subject to financial, scientific, regulatory and market risks. Our current business growth strategy relies heavily on the development of Mast Out®, which requires (and will continue to require) a substantial investment. Our efforts will be subject to inspection and approval by the FDA. There is no assurance whether or when we will obtain all of the data necessary to support regulatory approval for this product.
Risks associated with Mast Out® funding strategy: The construction of and the financing for the commercial-scale Drug Substance production facility is the most critical action in front of us on our path to U.S. regulatory approval for Mast Out®. During the first quarter of 2016, we sold 1.1 million shares of common stock in an underwritten public offering registered with the SEC, raising $5.3 million in net proceeds. Also during the first quarter of 2016, we closed on a bank financing covering a $4.5 million bank debt facility. Together with our cash and investments, plus cash to be generated from operations, we believe that we will have adequate financing to complete the project. However, due to the risks described herein, we could fail to generate sufficient cash to fully fund that project, and we could experience cost overruns or delays.
Uncertainty of market size and product sales estimates: Even assuming that Mast Out®achieves regulatory approval in the United States with a zero milk discard requirement, estimating the size of the market for this product is subject to numerous uncertainties. Some of the uncertainties surrounding our product include market acceptance, the development of the subclinical mastitis treatment market, the effect of a premium selling price on market penetration, cost of manufacture and integration of milk from treated cows with susceptible cheese starter cultures.
Competition from others: Many of our competitors are significantly larger and more diversified in the relevant markets than we are and have substantially greater financial, marketing, manufacturing and human resources and more extensive product development capabilities than we do, including greater ability to withstand adverse economic or market conditions and declining revenues and/or profitability. Zoetis, Elanco and Boehringer Ingelheim, among other companies, sell products that compete directly with First Defense®in preventing scours in newborn calves. The product sold by Elanco experienced a lack of supply in the market during late 2014 and into the middle of 2015, which appears to have been resolved. The product sold by Zoetis does carry a rotavirus claim (which we do not yet have), but it does not have an E. coli claim (which we do have), and it sells for approximately half the price of our product. The market for the treatment of mastitis in dairy cows is highly competitive, and presently is dominated by large companies such as Zoetis, Merck and Boehringer Ingelheim. There is no assurance that Mast Out®will compete successfully in this market. We may not be aware of other companies that compete with us or intend to compete with us in the future.
Access to raw materials: Our policy is to maintain more than one source of supply for the components used to manufacture and test our products that we obtain from third parties. However, there is a risk that we could have difficulty in efficiently acquiring essential supplies. The loss of farms, or the failure to engage enough new farms, from which we buy raw material for First Defense® could make it difficult for us to produce enough inventory. We are dependent on our manufacturing facility and operations at 56 Evergreen Drive in Portland for the production of First Defense® and our topical wipes and will be dependent on the facility we are preparing to construct for the production of Mast Out® when that product begins commercial sales. The specific antibodies that we purify from colostrum for First Defense® and the Nisin we produce by fermentation for our topical wipes are not readily available from other sources. We expect to be dependent on Plas-Pak for the supply of the syringes used for Mast Out®. We expect to be dependent on Norbrook for the sterile-filling and final packaging of our Drug Substance into Drug Product. Given the requirement that such a facility be inspected and approved by the FDA, it could be costly and time-consuming to find an adequate alternative source for these services. Any significant damage to or other disruption in the services at these facilities (including due to regulatory non-compliance) could adversely affect the production of inventory and result in significant added expenses and loss of future sales.
| - 30 - |
Small size; dependence on key personnel: We are a small company with 47 employees (including 7 part-time employees). As such, we rely on certain key employees to support different operational functions, with limited redundancy in capacity. The loss of any of these key employees could adversely affect our operations until a qualified replacement is hired and trained. Our competitive position will be highly influenced by our ability to attract and retain key scientific, managerial and sales and marketing personnel, to develop proprietary technologies and products, to obtain USDA or FDA approval for new products and to continue to profitably sell our current products. We currently compete on the basis of product performance, price and distribution capability. We continue to monitor our network of independent distributors to maintain our competitive position.
Failure to protect intellectual property: In some cases, we have chosen (and may choose in the future) not to seek patent protection for certain products or processes. Instead, we have sought (and may seek in the future) to maintain the confidentiality of any relevant proprietary technology through operational safeguards and contractual agreements. Reliance upon trade secret, rather than patent, protection may cause us to be vulnerable to competitors who successfully replicate our manufacturing techniques and processes. Additionally, there can be no assurance that others may not independently develop similar trade secrets or technology or obtain access to our unpatented trade secrets or proprietary technology. Other companies may have filed patent applications and may have been issued patents involving products or technologies potentially useful to us or necessary for us to commercialize our products or achieve our business goals. There can be no assurance that we will be able to obtain licenses to such patents on terms that are acceptable. There is also a risk that competitors could challenge the claims in patents that have been issued to us.
Certain provisions might discourage, delay or prevent a change in control of our Company or changes in our management: Provisions of our certificate of incorporation, our bylaws, our Common Stock Rights Plan or Delaware law may discourage, delay or prevent a merger, acquisition or other change in control that stockholders may consider favorable, including transactions in which stockholders might otherwise receive a premium for their shares of our common stock. These provisions may also prevent or frustrate attempts by our stockholders to replace or remove our management. These provisions include:
| ● | limitations on the removal of directors; advance notice requirements for stockholder proposals and nominations; | |
| ● | the ability of our Board of Directors to alter or repeal our bylaws; |
| ● | the ability of our Board of Directors to refuse to redeem rights issued under our Common Stock Rights Plan or otherwise to limit or suspend its operation that would work to dilute the stock ownership of a potential hostile acquirer, likely preventing acquisitions that have not been approved by our Board of Directors; and |
| ● | Section 203 of the Delaware General Corporation Law, which prohibits a publicly-held Delaware corporation from engaging in a business combination with an interested stockholder (generally defined as a person which together with its affiliates owns, or within the last three years has owned, 15% of our voting stock, for a period of three years after the date of the transaction in which the person became an interested stockholder) unless the business combination is approved in a prescribed manner. |
The existence of the foregoing provisions and anti-takeover measures could depress the trading price of our common stock or limit the price that investors might be willing to pay in the future for shares of our common stock. They could also deter potential acquirers of our Company, thereby reducing the likelihood of obtaining a premium for our common stock in an acquisition.
Cost burdens of our reporting obligations as a public company: Operating a public company involves substantial costs to comply with reporting obligations under federal securities laws and the provisions of the Sarbanes-Oxley Act of 2002.
Exposure to risks associated with the financial downturn and global economic crisis: The U.S. economy has technically come out of a recession, which was caused principally by the housing, credit and financial crises that began around 2008. However, such recent positive indications could prove temporary and further downturn could occur, and the European economy remains sluggish and precarious. Certain emerging markets also show signs of slower growth or, in some areas, downturns in economic performance. While we do price our products in U.S. dollars for all export markets, the strength of the dollar against weakening foreign currencies could reduce product demand in international markets. The credit markets continue to be very turbulent and uncertain. This extraordinary period of instability in the U.S. economy and the financial markets has been troubling for nearly all Americans. Some observers believe that the housing market remains problematic for the overall U.S. economy, the United States has taken on too much national debt and the equity markets are overvalued. A combination of the conditions, trends and concerns summarized above could have a corresponding negative effect on our business and operations, including the demand for our products in the U.S. market and our ability to penetrate international markets.
Bovine diseases: The potential for epidemics of bovine diseases such as Foot and Mouth Disease, Bovine Tuberculosis, Brucellosis and Bovine Spongiform Encephalopathy (BSE) presents a risk to us and our customers. Documented cases of BSE in the United States have led to an overall tightening of regulations pertaining to ingredients of animal origin, especially bovine. First Defense® is considered a veterinary medicine rather than a feed ingredient, and it is manufactured from bovine milk (colostrum), which is not considered a BSE risk material. Future regulatory action to increase protection of the human food supply could affect First Defense®, although presently we do not anticipate that this will be the case.
| - 31 - |
Biological terrorism: The threat of biological terrorism is a risk to both the economic health of our customers and our ability to economically acquire and collect good quality raw material from our contract farms. Any act of widespread bioterrorism against the dairy industry could adversely affect our operations.
Stock market valuation: Our common stock trades on The Nasdaq Stock Market (NasdaqCM: ICCC). Our average daily trading volume (although it has increased recently) is lower than the volume for most other companies and the bid/ask stock price spread can be larger, which could result in investors facing difficulty selling their stock for proceeds that they may expect or desire. There are companies in the animal health sector with market capitalization values that greatly exceed our current market capitalization of approximately $29,000,000 as of June 30, 2016. Some of these companies have little or no product sales. We currently have annual product sales of over $10,000,000. The stock prices of some of these companies have been volatile. Before gross margin from the sale of new products is achieved, our market capitalization may be heavily dependent on the perceived potential for growth from our products under development.
No expectation to pay any dividends or repurchase stock for the foreseeable future: We do not anticipate paying any dividends to, or repurchasing stock from, our stockholders for the foreseeable future. Instead, we expect to use cash to fund product development costs and investments in our facility and production equipment and to reduce debt. Stockholders must be prepared to rely on sales of their common stock after price appreciation to earn an investment return, which may never occur. Any determination to pay dividends in the future will be made at the discretion of our Board of Directors and will depend on our financial condition, results of operations, contractual restrictions, restrictions imposed by applicable laws, current and anticipated needs for liquidity and other factors our Board of Directors deems relevant.
ITEM 2 - UNREGISTERED SALES OF EQUITY SECURITIES AND USE OF PROCEEDS
None
ITEM 3 - DEFAULTS UPON SENIOR SECURITIES
None
ITEM 4 - MINE SAFETY DISCLOSURES
None
ITEM 5 - OTHER INFORMATION
None
| - 32 - |
ITEM 6 – EXHIBITS
| Exhibit 31 | Certifications required by Rule 13a-14(a). |
| Exhibit 32 | Certification pursuant to Section 1350, as adopted pursuant to Section 906 of the Sarbanes-Oxley Act of 2002. |
| 101.INS | XBRL Instance Document. |
| 101.SCH | XBRL Taxonomy Extension Schema Document. |
| 101.CAL | XBRL Taxonomy Extension Calculation Linkbase Document. |
| 101.DEF | XBRL Taxonomy Extension Definition Linkbase Document. |
| 101.LAB | XBRL Taxonomy Extension Label Linkbase Document. |
| 101.PRE | XBRL Taxonomy Extension Presentation Linkbase Document. |
| - 33 - |
SIGNATURE
Pursuant to the requirements of Section 13 or 15(d) of the Securities Exchange Act of 1934, the registrant has duly caused this report to be signed on its behalf by the undersigned thereunto duly authorized.
| ImmuCell Corporation | ||
| Registrant | ||
| Date: August 11, 2016 | By: | /s/ Michael F. Brigham |
| Michael F. Brigham | ||
| President, Chief Executive Officer and | ||
| Principal Financial Officer | ||
- 34 -