Attached files
| file | filename |
|---|---|
| EX-32 - EXHIBIT 32 - IMMUCELL CORP /DE/ | v359979_ex32.htm |
| EX-31 - EXHIBIT 31 - IMMUCELL CORP /DE/ | v359979_ex31.htm |
| EXCEL - IDEA: XBRL DOCUMENT - IMMUCELL CORP /DE/ | Financial_Report.xls |
UNITED STATES
SECURITIES AND EXCHANGE COMMISSION
Washington, D.C. 20549
FORM 10-Q
| x | QUARTERLY REPORT PURSUANT TO SECTION 13 OR 15(d) OF THE SECURITIES EXCHANGE ACT OF 1934 |
For the quarterly period ended September 30, 2013
001-12934
(Commission file number)
ImmuCell Corporation
(Exact name of registrant as specified in its charter)
| Delaware | 01-0382980 |
| (State of Incorporation) | (I.R.S. Employer Identification No.) |
| 56 Evergreen Drive, Portland, ME | 04103 |
| (Address of principal executive office) | (Zip Code) |
(207) 878-2770
(Registrant's telephone number)
Indicate by check mark whether the registrant (1) has filed all reports required to be filed by Section 13 or 15(d) of the Securities Exchange Act of 1934 during the preceding 12 months (or for such shorter period that the registrant was required to file such reports), and (2) has been subject to such filing requirements for the past 90 days. Yes x No ¨
Indicate by check mark whether the registrant has submitted electronically and posted on its corporate Web site, if any, every Interactive Data File required to be submitted and posted pursuant to Rule 405 of Regulation S-T during the preceding 12 months (or for such shorter period that the registrant was required to submit and post such files). Yes x No ¨
Indicate by check mark whether the registrant is a large accelerated filer, an accelerated filer, a non-accelerated filer, or a smaller reporting company. See the definitions of “large accelerated filer,” “accelerated filer” and “smaller reporting company” in Rule 12b-2 of the Exchange Act.
Large accelerated filer ¨ Accelerated filer ¨ Non-accelerated filer ¨ Smaller reporting company x
Indicate by check mark whether the registrant is a shell company (as defined in Rule 12b-2 of the Exchange Act).
Yes ¨ No x
The number of shares of the Registrant’s common stock outstanding at November 8, 2013 was 3,019,034.
ImmuCell Corporation
TABLE OF CONTENTS
September 30, 2013
| PART I: FINANCIAL INFORMATION | ||
| | | |
| ITEM 1. | Financial Statements | |
| | | |
| | Balance Sheets as of September 30, 2013 and December 31, 2012 | 2 |
| | Statements of Operations for the three-month and nine-month periods ended September 30, 2013 and 2012 | 3 |
| | Statements of Comprehensive Income (Loss) for the three-month and nine-month periods ended September 30, 2013 and 2012 | 4 |
| | Statements of Stockholders’ Equity for the nine-month periods ended September 30, 2013 and 2012 | 5 |
| | Statements of Cash Flows for the nine-month periods ended September 30, 2013 and 2012 | 6 |
| | Notes to Unaudited Financial Statements | 7-12 |
| ITEM 2. | Management’s Discussion and Analysis of Financial Condition and Results of Operations | 13-20 |
| ITEM 3. | Quantitative and Qualitative Disclosures about Market Risk | 20 |
| ITEM 4. | Controls and Procedures | 20 |
| | ||
| PART II: OTHER INFORMATION | ||
| ITEMS 1 THROUGH 6 | 21-24 | |
| | Signature | 25 |
| - 1 - | ||
ImmuCell Corporation
PART 1. FINANCIAL INFORMATION
ITEM 1. FINANCIAL STATEMENTS
ITEM 1. FINANCIAL STATEMENTS
BALANCE SHEETS
| | | (Unaudited) | | | | | |
| | | As of | | As of | | ||
| | | September 30, 2013 | | December 31, 2012 | | ||
| | | | | | | | |
| ASSETS | | | | | | | |
| CURRENT ASSETS: | | | | | | | |
| Cash and cash equivalents | | $ | 2,935,362 | | $ | 2,673,719 | |
| Short-term investments | | | 2,738,000 | | | 2,240,000 | |
| Trade accounts receivable, net of allowance for doubtful accounts of $14,579 as of September 30, 2013 and $15,111 as of December 31, 2012 | | | 376,092 | | | 574,146 | |
| Other receivables | | | 27,163 | | | 36,860 | |
| Income taxes receivable | | | 48 | | | 348 | |
| Inventory | | | 1,490,524 | | | 1,649,002 | |
| Prepaid expenses | | | 160,277 | | | 157,930 | |
| Current portion of deferred tax asset | | | 16,074 | | | 31,177 | |
| Total current assets | | | 7,743,540 | | | 7,363,182 | |
| | | | | | | | |
| NET PROPERTY, PLANT AND EQUIPMENT, at cost | | | 2,252,692 | | | 2,357,609 | |
| | | | | | | | |
| LONG-TERM PORTION OF DEFERRED TAX ASSET | | | 1,055,300 | | | 1,245,982 | |
| | | | | | | | |
| OTHER ASSETS, net | | | 14,155 | | | 63,634 | |
| | | | | | | | |
| TOTAL ASSETS | | $ | 11,065,687 | | $ | 11,030,407 | |
| | | | | | | | |
| LIABILITIES AND STOCKHOLDERS’ EQUITY | | | | | | | |
| | | | | | | | |
| CURRENT LIABILITIES: | | | | | | | |
| Accrued expenses | | $ | 212,082 | | $ | 255,568 | |
| Accounts payable | | | 166,278 | | | 228,711 | |
| Current portion of bank debt | | | 188,117 | | | 181,491 | |
| Total current liabilities | | | 566,477 | | | 665,770 | |
| | | | | | | | |
| LONG-TERM LIABILITIES: | | | | | | | |
| Long-term portion of bank debt | | | 944,895 | | | 1,086,568 | |
| Interest rate swap | | | 42,994 | | | 83,386 | |
| Total long-term liabilities | | | 987,889 | | | 1,169,954 | |
| | | | | | | | |
| TOTAL LIABILITIES | | | 1,554,366 | | | 1,835,724 | |
| | | | | | | | |
| STOCKHOLDERS’ EQUITY: | | | | | | | |
| Common stock, $0.10 par value per share, 8,000,000 shares authorized, | | | | | | | |
| 3,261,148 shares issued as of September 30, 2013 and December 31, 2012 | | | 326,115 | | | 326,115 | |
| Capital in excess of par value | | | 9,997,407 | | | 9,973,146 | |
| Accumulated deficit | | | (256,705) | | | (524,803) | |
| Treasury stock, at cost, 242,114 shares as of September 30, 2013 and December 31, 2012 | | | (529,655) | | | (529,655) | |
| Accumulated other comprehensive loss | | | (25,841) | | | (50,120) | |
| Total stockholders’ equity | | | 9,511,321 | | | 9,194,683 | |
| | | | | | | | |
| TOTAL LIABILITIES AND STOCKHOLDERS’ EQUITY | | $ | 11,065,687 | | $ | 11,030,407 | |
The accompanying notes are an integral part of these financial statements.
| - 2 - | ||
ImmuCell Corporation
(Unaudited)
STATEMENTS OF OPERATIONS
| | | For the Three-Month | | For the Nine-Month | | ||||||||
| | | Periods Ended September 30, | | Periods Ended September 30, | | ||||||||
| | | 2013 | | 2012 | | 2013 | | 2012 | | ||||
| | | | | | | | | | | | | | |
| Product sales | | $ | 1,234,701 | | $ | 1,076,749 | | $ | 4,447,928 | | $ | 3,968,984 | |
| Costs of goods sold | | | 618,984 | | | 455,791 | | | 1,994,967 | | | 1,664,940 | |
| Gross margin | | | 615,717 | | | 620,958 | | | 2,452,961 | | | 2,304,044 | |
| | | | | | | | | | | | | | |
| Product development expenses | | | 290,853 | | | 223,771 | | | 829,190 | | | 683,285 | |
| Sales and marketing expenses | | | 258,237 | | | 252,562 | | | 725,508 | | | 686,772 | |
| Administrative expenses | | | 226,594 | | | 230,751 | | | 707,841 | | | 701,484 | |
| Operating expenses | | | 775,684 | | | 707,084 | | | 2,262,539 | | | 2,071,541 | |
| | | | | | | | | | | | | | |
| NET OPERATING (LOSS) INCOME | | | (159,967) | | | (86,126) | | | 190,422 | | | 232,503 | |
| | | | | | | | | | | | | | |
| Other revenues (expenses), net | | | 236,868 | | | (8,265) | | | 267,646 | | | (29,136) | |
| | | | | | | | | | | | | | |
| INCOME (LOSS) BEFORE INCOME TAXES | | | 76,901 | | | (94,391) | | | 458,068 | | | 203,367 | |
| | | | | | | | | | | | | | |
| Income tax expense (benefit) | | | 19,565 | | | (30,817) | | | 189,970 | | | 96,992 | |
| | | | | | | | | | | | | | |
| NET INCOME (LOSS) | | $ | 57,336 | | $ | (63,574) | | $ | 268,098 | | $ | 106,375 | |
| | | | | | | | | | | | | | |
| Weighted average common shares outstanding: | | | | | | | | | | | | | |
| Basic | | | 3,019,034 | | | 3,019,034 | | | 3,019,034 | | | 3,018,049 | |
| Diluted | | | 3,085,300 | | | 3,019,034 | | | 3,081,984 | | | 3,111,099 | |
| | | | | | | | | | | | | | |
| NET INCOME (LOSS) PER SHARE: | | | | | | | | | | | | | |
| Basic | | $ | 0.02 | | $ | (0.02) | | $ | 0.09 | | $ | 0.04 | |
| Diluted | | $ | 0.02 | | $ | (0.02) | | $ | 0.09 | | $ | 0.03 | |
The accompanying notes are an integral part of these financial statements.
| - 3 - | ||
ImmuCell Corporation
(Unaudited)
STATEMENTS OF COMPREHENSIVE INCOME (LOSS)
| | | For the Three-Month Periods Ended September 30, | | For the Nine-Month Periods Ended September 30, | | ||||||||
| | | 2013 | | 2012 | | 2013 | | 2012 | | ||||
| Net income (loss) | | $ | 57,336 | | $ | (63,574) | | $ | 268,098 | | $ | 106,375 | |
| Other comprehensive income (loss): | | | | | | | | | | | | | |
| Interest rate swap, before taxes | | | 90 | | | (7,156) | | | 40,392 | | | (20,831) | |
| Income tax applicable to interest rate swap | | | (36) | | | 2,854 | | | (16,113) | | | 8,310 | |
| Other comprehensive income (loss), net of taxes | | | 54 | | | (4,302) | | | 24,279 | | | (12,521) | |
| Total comprehensive income (loss) | | $ | 57,390 | | $ | (67,876) | | $ | 292,377 | | $ | 93,854 | |
The accompanying notes are an integral part of these financial statements.
| - 4 - | ||
ImmuCell Corporation
(Unaudited)
STATEMENTS OF STOCKHOLDERS’ EQUITY
| | | Common Stock | | Capital in | | | | | | | | | Accumulated Other | | Total | | |||||||
| | | $0.10 Par Value | | Excess of | | Accumulated | | Treasury Stock | | Comprehensive | | Stockholders’ | | ||||||||||
| | | Shares | | Amount | | Par Value | | Deficit | | Shares | | | Amount | | Loss | | Equity | | |||||
| | | | | | | | | | | | | | | | | | | | | | | | |
| Balance as of December 31, 2012 | | 3,261,148 | | $ | 326,115 | | $ | 9,973,146 | | $ | (524,803) | | 242,114 | | $ | (529,655) | | $ | (50,120) | | $ | 9,194,683 | |
| | | | | | | | | | | | | | | | | | | | | | | | |
| Net income | | — | | | — | | | — | | | 268,098 | | — | | | — | | | — | | | 268,098 | |
| | | | | | | | | | | | | | | | | | | | | | | | |
| Other comprehensive income, net of taxes | | — | | | — | | | — | | | — | | — | | | — | | | 24,279 | | | 24,279 | |
| | | | | | | | | | | | | | | | | | | | | | | | |
| Stock-based compensation | | — | | | — | | | 24,261 | | | — | | — | | | — | | | — | | | 24,261 | |
| | | | | | | | | | | | | | | | | | | | | | | | |
| Balance as of September 30, 2013 | | 3,261,148 | | $ | 326,115 | | $ | 9,997,407 | | $ | (256,705) | | 242,114 | | $ | (529,655) | | $ | (25,841) | | $ | 9,511,321 | |
| | | Common Stock | | Capital in | | | | | | | | | | Accumulated Other | | Total | | ||||||
| | | $0.10 Par Value | | Excess of | | Accumulated | | Treasury Stock | | Comprehensive | | Stockholders’ | | ||||||||||
| | | Shares | | Amount | | Par Value | | Deficit | | Shares | | Amount | | Loss | | Equity | | ||||||
| | | | | | | | | | | | | | | | | | | | | | | | |
| Balance as of December 31, 2011 | | 3,261,148 | | $ | 326,115 | | $ | 9,911,914 | | $ | (614,315) | | 257,114 | | $ | (562,469) | | $ | (40,812) | | $ | 9,020,433 | |
| | | | | | | | | | | | | | | | | | | | | | | | |
| Net income | | — | | | — | | | — | | | 106,375 | | — | | | — | | | — | | | 106,375 | |
| | | | | | | | | | | | | | | | | | | | | | | | |
| Other comprehensive loss, net of taxes | | — | | | — | | | — | | | — | | — | | | — | | | (12,521) | | | (12,521) | |
| | | | | | | | | | | | | | | | | | | | | | | | |
| Exercise of stock options | | — | | | — | | | 17,986 | | | — | | (15,000) | | | 32,814 | | | — | | | 50,800 | |
| | | | | | | | | | | | | | | | | | | | | | | | |
| Tax benefits related to stock options | | — | | | — | | | 6,842 | | | — | | — | | | — | | | — | | | 6,842 | |
| | | | | | | | | | | | | | | | | | | | | | | | |
| Stock-based compensation | | — | | | — | | | 27,480 | | | — | | — | | | — | | | — | | | 27,480 | |
| | | | | | | | | | | | | | | | | | | | | | | | |
| Balance as of September 30, 2012 | | 3,261,148 | | $ | 326,115 | | $ | 9,964,222 | | $ | (507,940) | | 242,114 | | $ | (529,655) | | $ | (53,333) | | $ | 9,199,409 | |
The accompanying notes are an integral part of these financial statements.
| - 5 - | ||
ImmuCell Corporation
(Unaudited)
STATEMENTS OF CASH FLOWS
| | | For the Nine-Month | | ||||
| | | Periods Ended September 30, | | ||||
| | | | 2013 | | | 2012 | |
| CASH FLOWS FROM OPERATING ACTIVITIES: | | | | | | | |
| Net income | | $ | 268,098 | | $ | 106,375 | |
| Adjustments to reconcile net income to net cash provided by operating activities: | | | | | | | |
| Depreciation | | | 293,116 | | | 304,511 | |
| Amortization | | | 2,175 | | | 2,156 | |
| Deferred income taxes | | | 189,672 | | | 89,245 | |
| Stock-based compensation | | | 24,261 | | | 27,480 | |
| Loss on disposal of fixed assets | | | 36 | | | 288 | |
| Changes in: | | | | | | | |
| Receivables | | | 208,051 | | | (83,290) | |
| Inventory | | | 158,478 | | | (133,305) | |
| Prepaid expenses and other assets | | | 44,957 | | | (66,403) | |
| Accrued expenses | | | (43,486) | | | (98,618) | |
| Accounts payable | | | (130,532) | | | 41,138 | |
| Deferred revenue | | | — | | | (8,250) | |
| Net cash provided by operating activities | | | 1,014,826 | | | 181,327 | |
| | | | | | | | |
| CASH FLOWS FROM INVESTING ACTIVITES : | | | | | | | |
| Purchase of property, plant and equipment | | | (120,136) | | | (249,571) | |
| Maturities of short-term investments | | | 2,240,000 | | | 3,183,000 | |
| Purchases of short-term investments | | | (2,738,000) | | | (2,240,000) | |
| Net cash (used for) provided by investing activities | | | (618,136) | | | 693,429 | |
| | | | | | | | |
| CASH FLOWS FROM FINANCING ACTIVITIES: | | | | | | | |
| Debt principal repayments | | | (135,047) | | | (128,610) | |
| Proceeds from exercise of stock options | | | — | | | 50,800 | |
| Tax benefits related to stock options | | | — | | | 6,842 | |
| Net cash used for financing activities | | | (135,047) | | | (70,968) | |
| | | | | | | | |
| NET INCREASE IN CASH AND CASH EQUIVALENTS | | | 261,643 | | | 803,788 | |
| | | | | | | | |
| BEGINNING CASH AND CASH EQUIVALENTS | | | 2,673,719 | | | 781,516 | |
| | | | | | | | |
| ENDING CASH AND CASH EQUIVALENTS | | $ | 2,935,362 | | $ | 1,585,304 | |
| | | | | | | | |
| INCOME TAXES PAID | | $ | — | | $ | (605) | |
| | | | | | | | |
| INTEREST EXPENSE PAID | | $ | (51,118) | | $ | (57,637) | |
| | | | | | | | |
| NON-CASH ACTIVITIES: | | | | | | | |
| Change in capital expenditures included in accounts payable | | $ | 68,100 | | $ | (25,762) | |
| Net change in fair value of interest rate swap | | $ | (24,279) | | $ | 12,521 | |
The accompanying notes are an integral part of these financial statements.
| - 6 - | ||
ImmuCell Corporation
NOTES TO UNAUDITED FINANCIAL STATEMENTS
September 30, 2013
1. BASIS OF PRESENTATION
We have prepared the accompanying financial statements without audit reflecting all adjustments, all of which are of a normal recurring nature, that are, in our opinion, necessary in order to make the financial statements not misleading. We follow accounting standards set by the Financial Accounting Standards Board (FASB). The FASB sets generally accepted accounting principles (GAAP) that we follow to ensure we consistently report our financial condition, results of operations, earnings per share and cash flows. References to GAAP in these footnotes are to the FASB Accounting Standards Codification™ (Codification). Certain information and footnote disclosures normally included in the annual financial statements have been condensed or omitted. Accordingly, we believe that although the disclosures are adequate to make the information presented not misleading, these financial statements should be read in conjunction with the financial statements for the year ended December 31, 2012 and the notes thereto, contained in our Annual Report on Form 10-K as filed with the Securities and Exchange Commission.
2. CASH, CASH EQUIVALENTS AND SHORT-TERM INVESTMENTS
We consider all highly liquid investment instruments that mature within three months of their purchase dates to be cash equivalents. Cash equivalents are principally invested in securities backed by the U.S. government. Certain cash balances in excess of Federal Deposit Insurance Corporation (FDIC) limits per financial institution are maintained in money market accounts at financial institutions that are insured, in part, by the Securities Investor Protection Corporation. Short-term investments are classified as held to maturity and are comprised principally of certificates of deposit that mature in more than three months from their purchase dates and not more than twelve months from the balance sheet date and are held at different financial institutions that are insured by the FDIC within the FDIC insurance limit of $250,000 per institution per depositor. Cash, cash equivalents and short-term investments consisted of the following:
| | | As of September 30, 2013 | | As of December 31, 2012 | | Increase | | |||
| Cash and cash equivalents | | $ | 2,935,362 | | $ | 2,673,719 | | $ | 261,643 | |
| Short-term investments | | | 2,738,000 | | | 2,240,000 | | | 498,000 | |
| Total | | $ | 5,673,362 | | $ | 4,913,719 | | $ | 759,643 | |
3. INVENTORY
Inventory includes raw materials, work-in-process and finished goods and is recorded at the lower of cost, on the first-in, first-out method, or market (net realizable value). Work-in-process and finished goods inventories include materials, labor and manufacturing overhead. Inventory consisted of the following:
| | | As of September 30, 2013 | | As of December 31, 2012 | | Increase (Decrease) | | |||
| Raw materials | | $ | 282,846 | | $ | 198,441 | | $ | 84,405 | |
| Work-in-process | | | 874,365 | | | 986,243 | | | (111,878) | |
| Finished goods | | | 333,313 | | | 464,318 | | | (131,005) | |
| Inventory | | $ | 1,490,524 | | $ | 1,649,002 | | $ | (158,478) | |
| - 7 - | ||
ImmuCell Corporation
NOTES TO UNAUDITED FINANCIAL STATEMENTS (Continued)
September 30, 2013
4. PROPERTY, PLANT AND EQUIPMENT
Property, plant and equipment consisted of the following, at cost:
| | | As of September 30, 2013 | | As of December 31, 2012 | | ||
| Laboratory and manufacturing equipment | | $ | 3,089,573 | | $ | 3,029,559 | |
| Building and improvements | | | 2,903,695 | | | 2,785,698 | |
| Office furniture and equipment | | | 317,456 | | | 312,979 | |
| Construction in progress | | | 4,370 | | | — | |
| Land | | | 50,000 | | | 50,000 | |
| Property, plant and equipment, gross | | | 6,365,094 | | | 6,178,236 | |
| Less: accumulated depreciation | | | 4,112,402 | | | 3,820,627 | |
| Property, plant and equipment, net | | $ | 2,252,692 | | $ | 2,357,609 | |
5. OTHER ASSETS
Other assets consisted of the following:
| | | As of September 30, 2013 | | As of December 31, 2012 | | ||
| Security deposits | | $ | 550 | | $ | 250 | |
| Debt issue costs | | | 26,489 | | | 26,489 | |
| Other(1) | | | — | | | 47,604 | |
| Other assets, gross | | | 27,039 | | | 74,343 | |
| Less: accumulated amortization of debt issue costs | | | 12,884 | | | 10,709 | |
| Other assets, net | | $ | 14,155 | | $ | 63,634 | |
(1) This asset was written off to product development expenses during the third quarter of 2013.
6. BANK DEBT
During the third quarter of 2010, we agreed to terms of certain credit facilities with TD Bank, N.A. aggregating up to approximately $2,100,000, which are secured by substantially all of our assets. TD Bank, N.A. is a wholly owned subsidiary of TD Financial Group, which is a multinational bank with approximately $800 billion in assets and over 22 million clients worldwide. These credit facilities are comprised of a $1,000,000 ten-year mortgage loan, a $600,000 fifty-four month note and a $500,000 line of credit. Proceeds from the $1,000,000 mortgage were received during the third quarter of 2010. Based on a 15-year amortization schedule, a balloon principal payment of $451,885 will be due in the third quarter of 2020. We hedged our interest rate exposure on this mortgage loan with an interest rate swap agreement that effectively converted a floating interest rate to the fixed rate of 6.04%. All derivatives are recognized on the balance sheet at their fair value. The agreement has been determined to be highly effective in hedging the variability of the identified cash flows and has been designated as a cash flow hedge of the variability in the hedged interest payments. Changes in the fair value of the interest rate swap agreement are recorded in other comprehensive income (loss), net of taxes. The original notional amount of the interest rate swap agreement of $1,000,000 amortizes in accordance with the amortization of the mortgage loan. As the result of our decision to hedge this interest rate risk, we recorded accumulated other comprehensive loss in the amount of ($25,841) and ($50,120) as of September 30, 2013 and December 31, 2012, respectively, which reflects the fair value of the interest rate swap liability, net of taxes. The fair value of the interest rate swap has been determined using observable market-based inputs or unobservable inputs that are corroborated by market data. Accordingly, the interest rate swap is classified as level 2 within the fair value hierarchy provided in Codification Topic 820, Fair Value Measurements and Disclosures. Proceeds from the $600,000 note were received during the first quarter of 2011. Interest on the note is variable at the higher rate of 4.25% or the one month London Interbank Offered Rate (LIBOR) plus 3.25%. The $500,000 line of credit is available as needed and has been extended through May 31, 2014 and is renewable annually thereafter. Interest on any borrowings against the line of credit will be variable at the higher rate of 4.25% or the one month LIBOR plus 3.50%. These credit facilities are subject to certain financial covenants. During the third quarter of 2013, the covenant requiring us to maintain at least $1,000,000 in otherwise unrestricted cash was removed. We are in compliance with all applicable covenants as of September 30, 2013. Principal payments due under debt outstanding as of September 30, 2013 are reflected in the following table by the period that payments are due:
| - 8 - | ||
ImmuCell Corporation
NOTES TO UNAUDITED FINANCIAL STATEMENTS (Continued)
September 30, 2013
| Period | | $1,000,000 mortgage | | $600,000 note | | Total | | |||
| Three months ending December 31, 2013 | | $ | 12,465 | | $ | 33,945 | | $ | 46,410 | |
| Twelve months ending December 31, 2014 | | | 50,900 | | | 139,490 | | | 190,390 | |
| Twelve months ending December 31, 2015 | | | 54,044 | | | 96,248 | | | 150,292 | |
| Twelve months ending December 31, 2016 | | | 57,384 | | | — | | | 57,384 | |
| Twelve months ending December 31, 2017 | | | 61,056 | | | — | | | 61,056 | |
| Twelve months ending December 31, 2018 | | | 64,876 | | | — | | | 64,876 | |
| After December 31, 2018 | | | 562,604 | | | — | | | 562,604 | |
| Total outstanding | | $ | 863,329 | | $ | 269,683 | | $ | 1,133,012 | |
7. OTHER REVENUES (EXPENSES), NET
Other revenues (expenses), net, consisted of the following:
| | | For the Three-Month Periods Ended September 30, | | For the Nine-Month Periods Ended September 30, | ||||||||
| | | | 2013 | | 2012 | | 2013 | | 2012 | |||
| License option fee(1) | | $ | 250,000 | | $ | — | | $ | 250,000 | | $ | — |
| Royalty income | | | — | | | 6,028 | | | (3,000) | | | 14,598 |
| Interest income | | | 3,271 | | | 4,437 | | | 9,789 | | | 13,817 |
| Interest expense | | | (16,522) | | | (18,670) | | | (50,623) | | | (57,134) |
| Other | | | 119 | | | (60) | | | 61,480 | | | (417) |
| Other revenues (expenses), net | | $ | 236,868 | | $ | (8,265) | | $ | 267,646 | | $ | (29,136) |
(1) During the second quarter of 2013, we received a $250,000 exclusive option payment from a prospective partner for the development and marketing of Mast Out®. This payment was recorded as deferred revenue upon receipt. During the third quarter of 2013, this prospective partner decided not to execute a license after its final due diligence. Accordingly, the deferred revenue was recognized during the third quarter of 2013. At the same time, $47,604 in capitalized expenses pertaining to the development of Mast Out® were written off.
8. STOCK-BASED COMPENSATION
We account for stock-based compensation in accordance with Codification Topic 718, Compensation-Stock Compensation, which generally requires us to recognize non-cash compensation expense for stock-based payments using the fair-value-based method. The fair value of each stock option grant has been estimated on the date of grant using the Black-Scholes option pricing model. Accordingly, we recorded compensation expense pertaining to stock-based compensation of $7,940 and $9,463 during the three-month periods ended September 30, 2013 and 2012, respectively, and $24,261 and $27,480 during the nine-month periods ended September 30, 2013 and 2012, respectively.
| - 9 - | ||
ImmuCell Corporation
NOTES TO UNAUDITED FINANCIAL STATEMENTS (Continued)
September 30, 2013
9. INCOME TAXES
We account for income taxes in accordance with Codification Topic 740, Income Taxes,which requires that we recognize a current tax liability or asset for current taxes payable or refundable and a deferred tax liability or asset for the estimated future tax effects of temporary differences and carryforwards to the extent they are realizable. We believe it is more likely than not that the deferred tax assets will be realized through future taxable income and future tax effects of temporary differences between book income and taxable income. Accordingly, we have not established a valuation allowance for the deferred tax assets. Codification Topic 740-10 clarifies the accounting for income taxes by prescribing a minimum recognition threshold that a tax position must meet before being recognized in the financial statements. In the ordinary course of business, there are transactions and calculations where the ultimate tax outcome is uncertain. In addition, we are subject to periodic audits and examinations by the IRS and other taxing authorities. We have evaluated the positions taken on our filed tax returns. We have concluded that no uncertain tax positions exist as of September 30, 2013. Although we believe that our estimates are reasonable, actual results could differ from these estimates.
10. NET INCOME (LOSS) PER COMMON SHARE
The net income (loss) per common share has been computed in accordance with Codification Topic 260-10, Earnings Per Share. The basic net income per share has been computed by dividing the net income by the weighted average number of common shares outstanding during this period. The diluted net income per share has been computed by dividing the net income by the weighted average number of shares outstanding during the period plus all outstanding stock options with an exercise price that is less than the average market price of the common stock during the period less the number of shares that could have been repurchased at this average market price with the proceeds from the hypothetical stock option exercises. The net loss per common share for the three-month period ended September 30, 2012 has been computed by dividing the net loss by the weighted average number of common shares outstanding during the period, without giving consideration to outstanding stock options because the impact would be anti-dilutive.
11. COMMON STOCK RIGHTS PLAN
In September 1995, our Board of Directors adopted a Common Stock Rights Plan (the Rights Plan) and declared a dividend of one common share purchase right (a Right) for each of the then outstanding shares of the common stock of the Company. Each Right entitles the registered holder to purchase from the Company one share of common stock at an initial purchase price of $70.00 per share, subject to adjustment. The description and terms of the Rights are set forth in a Rights Agreement between the Company and American Stock Transfer & Trust Co., as Rights Agent.
The Rights (as amended) become exercisable and transferable apart from the common stock upon the earlier of i) 10 days following a public announcement that a person or group (Acquiring Person) has, without the prior consent of the Continuing Directors (as such term is defined in the Rights Agreement), acquired beneficial ownership of 20% or more of the outstanding common stock or ii) 10 days following commencement of a tender offer or exchange offer the consummation of which would result in ownership by a person or group of 20% or more of the outstanding common stock (the earlier of such dates being called the Distribution Date).
Upon the Distribution Date, the holder of each Right not owned by the Acquiring Person would be entitled to purchase common stock at a discount to the initial purchase price of $70.00 per share, effectively equal to one half of the market price of a share of common stock on the date the Acquiring Person becomes an Acquiring Person. If, after the Distribution Date, the Company should consolidate or merge with any other entity and the Company were not the surviving company, or, if the Company were the surviving company, all or part of the Company’s common stock were changed or exchanged into the securities of any other entity, or if more than 50% of the Company’s assets or earning power were sold, each Right would entitle its holder to purchase, at the Rights’ then current purchase price, a number of shares of the acquiring company’s common stock having a market value at that time equal to twice the Right’s exercise price.
At any time after a person or group becomes an Acquiring Person and prior to the acquisition by such person or group of 50% or more of the outstanding common stock, the Board of Directors of the Company may exchange the Rights (other than Rights owned by such person or group which have become void), in whole or in part, at an exchange ratio of one share of common stock per Right (subject to adjustment). At any time prior to 14 days following the date that any person or group becomes an Acquiring Person (subject to extension by the Board of Directors), the Board of Directors of the Company may redeem the then outstanding Rights in whole, but not in part, at a price of $0.005 per Right, subject to adjustment.
| - 10 - | ||
ImmuCell Corporation
NOTES TO UNAUDITED FINANCIAL STATEMENTS (Continued)
September 30, 2013
On June 8, 2005, our Board of Directors voted to authorize an amendment of the Rights Agreement to extend the Final Expiration Date by an additional three years to September 19, 2008. As of June 30, 2005, we entered into an amendment to the Rights Agreement with the Rights Agent reflecting such extension. No other changes were made to the terms of the Rights or the Rights Agreement at that time. On June 6, 2008, our Board of Directors voted to authorize amendments of the Rights Agreement to extend the Final Expiration Date by an additional three years to September 19, 2011 and to increase the ownership threshold for determining Acquiring Person status from 15% to 18%. As of June 30, 2008, we entered into an amendment to the Rights Agreement with the Rights Agent reflecting such extension and threshold increase. No other changes were made to the terms of the Rights or the Rights Agreement at that time. On August 5, 2011, our Board of Directors voted to authorize amendments of the Rights Agreement to extend the Final Expiration Date by an additional three years to September 19, 2014 and to increase the ownership threshold for determining Acquiring Person status from 18% to 20%. As of August 9, 2011, we entered into an amendment to the Rights Agreement with the Rights Agent reflecting such extension and threshold increase. No other changes were made to the terms of the Rights or the Rights Agreement at that time.
Our Board of Directors believes that there is some risk that the potential value of the Mast Out® product development initiative may not be fairly reflected in the market price of our common stock, as it fluctuates from time to time, and that opportunistic buyers could take advantage of that disparity to the detriment of our stockholders. If this were to happen and result in a potential threat through an unsolicited acquisition effort or otherwise, our Board of Directors feels that the Rights Plan could enhance stockholder value by providing management with negotiating leverage.
12. SEGMENT AND SIGNIFICANT CUSTOMER INFORMATION
Pursuant to Codification Topic 280, Segment Reporting, we operate in one reportable business segment, that being the development, acquisition, manufacture and sale of products that improve the health and productivity of cows for the dairy and beef industries. Almost all of our internally funded product development expenses are in support of such products. Our primary customers for the majority of our product sales (89% and 83% for the three-month periods ended September 30, 2013 and 2012, respectively, and 84% and 81% for the nine-month periods ended September 30, 2013 and 2012, respectively) are in the U.S. dairy and beef industries. Product sales to international customers, who are also in the dairy and beef industries, aggregated 11% and 17% of our total product sales for the three-month periods ended September 30, 2013 and 2012, respectively, and 14% and 16% of our total product sales for the nine-month periods ended September 30, 2013 and 2012, respectively.
The percentage of our total sales that were made to significant customers that amounted to 10% or more of total product sales are detailed in the following table:
| | | For the Three-Month | | | For the Nine-Month | | | ||||||
| | | Periods Ended September 30, | | | Periods Ended September 30, | | | ||||||
| | | 2013 | | | 2012 | | | 2013 | | | 2012 | | |
| Animal Health International, Inc. | | 40 | % | | 35 | % | | 38 | % | | 35 | % | |
| MWI Veterinary Supply Company(1) | | 16 | % | | 17 | % | | 15 | % | | 14 | % | |
(1) Assuming that the acquisition of IVESCO by MWI Veterinary Supply Company (which closed as of November 1, 2013) had closed as of the beginning of the periods being reported, these figures would be 21% and 22% for three-month periods ended September 30, 2013 and 2012, respectively, and 22% and 20% for the nine-month periods ended September 30, 2013 and 2012, respectively.
| - 11 - | ||
ImmuCell Corporation
NOTES TO UNAUDITED FINANCIAL STATEMENTS (Continued)
September 30, 2013
Accounts receivable due from significant customers that amounted to 10% or more of total trade accounts receivable are detailed in the following table:
| | | As of September 30, 2013 | | | As of December 31, 2012 | | |
| Animal Health International, Inc. | | 31 | % | | 28 | % | |
| MWI Veterinary Supply Company(2) | | 20 | % | | 14 | % | |
| Robert J. Matthews Company | | 11 | % | | * | | |
| TCS BioSciences, Ltd. | | * | | | 15 | % | |
(2)Adjusting for the assumption described in note 1 above, these figures would be 28% and 19% as of September 30, 2013 and December 31, 2012, respectively.
*Amount is less than 10%.
13. RELATED PARTY TRANSACTIONS
Dr. David S. Tomsche (Chairman of our Board of Directors) is a controlling owner of Leedstone Inc. (formerly Stearns Veterinary Outlet, Inc.), a domestic distributor of ImmuCell products (First DefenseÒ, Wipe OutÒDairy Wipes, and CMT) and of J-t Enterprises of Melrose, Inc., a Japanese export company. His affiliated companies purchased $288,360 and $221,105 of products from ImmuCell during the nine-month periods ended September 30, 2013 and 2012, respectively, on terms consistent with those offered to other distributors of similar status. Our accounts receivable (subject to standard and customary payment terms) due from these affiliated companies aggregated $34,184 and $27,348 as of September 30, 2013 and December 31, 2012, respectively.
14. SUBSEQUENT EVENTS
We have adopted the disclosure provisions of Codification Topic 855-10-50-1, Subsequent Events, which provides guidance to establish general standards of accounting for and disclosures of events that occur after the balance sheet date but before financial statements are issued. Entities are required to disclose the date through which subsequent events were evaluated as well as the rationale for why that date was selected. This disclosure should alert all users of financial statements that an entity has not evaluated subsequent events after that date in the set of financial statements being presented. Codification Topic 855-10-50-1 requires additional disclosures only, and therefore did not have an impact on our financial condition, results of operations, earnings per share and cash flows. Public entities must evaluate subsequent events through the date that financial statements are issued. Accordingly, we have evaluated subsequent events through the time of filing on November 13, 2013, the date we have issued this Quarterly Report on Form 10-Q.
| - 12 - | ||
ImmuCell Corporation
ITEM 2 - MANAGEMENT'S DISCUSSION AND ANALYSIS OF FINANCIAL CONDITION AND RESULTS OF OPERATIONS
Financial Condition
In 1999, we shifted the primary focus of our product development efforts from human applications of our milk protein purification technology to scientifically-proven and practical products that result in a measurable economic impact on animal health and productivity in the dairy and beef industries. We expect to continue this strategic focus. These product opportunities are generally less expensive to develop than the human health product opportunities that we had worked on during the 1990’s. As a result, we recorded nine consecutive years of profitability during the years ended December 31, 1999 to December 31, 2007. Our strategic decision to continue developing Mast Out® after the product rights were returned to us in 2007 caused us to increase our spending on product development expenses that had been funded by a partner from late 2004 to mid-2007. Accordingly, we incurred net losses of ($469,000), ($216,000), ($385,000) and ($410,000) during the four years ended December 31, 2008, 2009, 2010 and 2011, respectively. Resulting principally from increased gross margin from sales of First Defense® and reduced product development spending on Mast Out®, we returned to profitability during the year ended December 31, 2012, and we continued to be profitable during the first nine months of 2013. As we increase our investment in product development expenses to complete the development of Mast Out®, we expect not to be profitable over the next two to three quarters. This strategy is discussed in greater detail below. We believe that two important indicators that investors should watch going forward will be the gross margin on our product sales and our net operating income (loss).
We had approximately $5,673,000 in cash and short-term investments as of September 30, 2013. The table below summarizes the changes in selected, key balance sheet items (in thousands, except for percentages):
| | | As of | | As of | | Increase | | | |||||
| | | September 30, 2013 | | December 31, 2012 | | $ | | | % | | | ||
| Cash, cash equivalents and short-term investments | | $ | 5,673 | | $ | 4,914 | | $ | 760 | | 15 | % | |
| Total assets | | | 11,066 | | | 11,030 | | | 35 | | 0.3 | % | |
| Net working capital | | | 7,177 | | | 6,697 | | | 480 | | 7 | % | |
| Stockholders’ equity | | $ | 9,511 | | $ | 9,195 | | $ | 317 | | 3 | % | |
Cash, cash equivalents and short-term investments increased by 15%, or $760,000, to $5,673,000 as of September 30, 2013 from $4,914,000 as of December 31, 2012. Net cash provided by operating activities amounted to $1,015,000 during the nine-month period ended September 30, 2013 in comparison to $181,000 during the same period in 2012. Capital investments of $120,000 during the nine-month period ended September 30, 2013 compared to capital investments of $250,000 during the same period in 2012. Total assets increased by 0.3%, or $35,000, to $11,066,000 as of September 30, 2013 from $11,030,000 as of December 31, 2012. Net working capital increased by 7%, or $480,000, to $7,177,000 as of September 30, 2013 from $6,697,000 as of December 31, 2012. During the first nine months of 2013 we repaid $135,000 in bank debt. Stockholders' equity increased by 3%, or $317,000, to $9,511,000 as of September 30, 2013 from $9,195,000 as of December 31, 2012.
During the third quarter of 2010, we agreed to terms of certain credit facilities with TD Bank, N.A. aggregating up to approximately $2,100,000, which are secured by substantially all of our assets. These credit facilities are comprised of a $1,000,000 ten-year mortgage loan, a $600,000 fifty-four month note and a $500,000 line of credit. Proceeds from the $1,000,000 mortgage loan were received during the third quarter of 2010. Proceeds from the $600,000 note were received during the first quarter of 2011. The $500,000 line of credit is available as needed. As of September 30, 2013, our outstanding bank debt balance was approximately $1,133,000. We chose debt financing because we believe that in this market environment, the option to generate funds through the sale of equity securities at an acceptable level of stockholder dilution is unlikely. We believe that this debt financing (together with available cash and gross margin from ongoing product sales) provides us with sufficient funding to meet our working capital requirements and to finance our ongoing business operations during at least the next twelve months.
We are making a sustained investment in compliance with current Good Manufacturing Practice (cGMP) regulations. Compliance with cGMP regulations is required for the production of Wipe Out® Dairy Wipes, and we elected to enforce these quality standards across our product lines. As we make other process improvements, we are investing in personnel, equipment and facility modifications to increase the efficiency and quality of our operations.
| - 13 - | ||
ImmuCell Corporation
The size of this investment in capital expenditures for facility modifications and production equipment is subject to review and approval by our Board of Directors. During the third quarter of 2013, our Board of Directors increased this authorized spending limit by $300,000. As of October 1, 2013, we had remaining available authorization to spend up to approximately $364,000 on capital expenditures. The figures described above do not include the estimated $1,500,000 investment in our Nisin Active Pharmaceutical Ingredient (API) production plant, described below. During the first quarter of 2013, the Center for Veterinary Medicine, U.S. Food and Drug Administration (FDA) conducted a routine inspection of our facilities and operations. The report from this inspection was very favorable, and we have responded to the few, minor observations that were noted.
During the third quarter of 2013, our Board of Directors approved the investment of approximately $1,500,000 to acquire processing equipment and to modify a portion of our facility in Portland, Maine to produce the Nisin API for Mast OutÒ. We expect our facility to produce sufficient Nisin API to complete our regulatory submission and conduct test marketing of Mast OutÒ. Approximately $225,000 of this investment is expected to be capitalized and depreciated over ten years. We expect to expense the balance of this investment as incurred over the fourth quarter of 2013 and first and second quarters of 2014. This specifically targeted increase in product development expenses is expected to result in a net loss during the fourth quarter of 2013, which may be large enough to offset our net income for the nine months ended September 30, 2013 resulting in a net loss for the year ending December 31, 2013. We expect to return to breakeven or profitable results after we complete this $1,500,000 investment, which is currently expected to be completed during the first half of 2014. This anticipated investment is discussed in greater detail under “Product Development” below.
Results of Operations
Product Sales
Product sales increased by approximately 15%, or $158,000, to $1,235,000 during the three-month period ended September 30, 2013 in comparison to $1,077,000 during the same period in 2012. Product sales increased by approximately 12%, or $479,000 to $4,448,000 during the nine-month period ended September 30, 2013 in comparison to $3,969,000 during the same period in 2012. During the nine-month period ended September 30, 2013, domestic sales increased by approximately 16%, or $513,000, and international sales decreased by approximately 5%, or $34,000, in comparison to the same period in 2012. Product sales increased by approximately 11%, or $595,000, to $5,869,000 during the twelve-month period ended September 30, 2013 in comparison to $5,274,000 during the twelve-month period ended September 30, 2012.
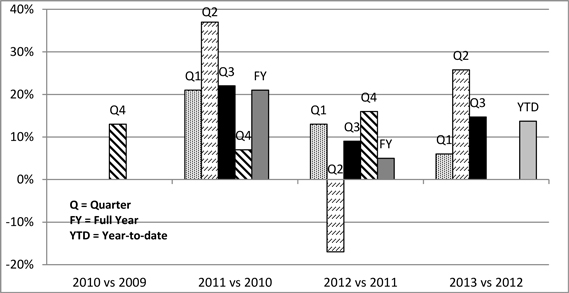
Sales of our lead product, First DefenseÒ, increased by 15%, 14% and 14% during the three-month, nine-month and twelve-month periods ended September 30, 2013, respectively, in comparison to the same periods ended September 30, 2012. We have realized consistently positive sales growth of First DefenseÒ during the last six consecutive quarters and for eleven of the last twelve quarters, as demonstrated in the chart below:
| - 14 - | ||
ImmuCell Corporation
We believe that the long-term growth in sales of First DefenseÒ may reflect, at least in part, the success of our strategic decision to invest in additional sales and marketing efforts. Our sales and marketing team currently consists of one director and three regional sales and marketing managers. Our office manager and facilities manager support our sales efforts by performing all order entry, inside sales and shipping duties. We launched a new communications campaign at the end of 2010 that continues to emphasize how the unique ability of First DefenseÒ to provide Immediate ImmunityTM generates a dependable return on investment for dairy and beef producers. Preventing newborn calves from becoming sick helps them to reach their genetic potential.
Competition for resources that dairy producers allocate to their calf enterprises has been increased by the many new products that have been introduced to the calf market. Our sales are normally seasonal, with higher sales expected during the first quarter. Warm and dry weather reduces the producer’s perception of the need for First DefenseÒ . Heat stress on calves caused by extremely hot summer weather can increase the incidence of bovine enteritis (scours). The severe heat and drought conditions during the summer of 2012 in many key agricultural regions in North America caused a significant increase in the cost of feed that has offset some improvement in milk prices. The combination of mild weather during the spring 2012 beef calving season and the increasing cost of feed has created a very challenging environment in which to sell a disease prevention product. The harsher winter weather in 2013 may have benefited our sales. The animal health distribution segment has been aggressively consolidating over the last few years. Larger distributors have been acquiring smaller distributors. Although beef herd numbers are down currently because of the 2012 drought conditions in many parts of North America, the value of newborn calves could increase as producers re-build their herd levels. Such an upswing would increase a producer’s likelihood to invest in First DefenseÒ for their calf crop. Even in this challenging market, First DefenseÒ continues to benefit from wide acceptance as an effective tool to prevent scours in newborn calves. The third quarter of 2013 marked the 22nd anniversary of the original U.S. Department of Agriculture (USDA) approval of this product in 1991. During the third quarter of 2013, we sold our 13,000,000th dose of First DefenseÒ . We believe that these milestones demonstrate the value of our technology and the long-term market acceptance of our product. It is our production and customer service objective to ship orders within one day of receipt. We have been operating in accordance with this objective, with regards to First DefenseÒ, since the third quarter of 2009.
We are developing new product applications of our First Defense TechnologyTM, which is a unique whey protein concentrate that is processed utilizing our proprietary milk protein purification methods, for the nutritional and feed supplement markets without the claims of our USDA-licensed product. Through our First Defense TechnologyTM, we are selling whey concentrate globulin proteins in different formats. During the first quarter of 2011, we initiated sales of First Defense TechnologyTM in a bulk powder format (no capsule), which is delivered with a scoop and mixed with colostrum for feeding. During the fourth quarter of 2011, Milk Products, LLC of Chilton, Wisconsin launched commercial sales of their product, Ultra StartÒ 150 Plus, a colostrum replacer with First Defense TechnologyTM Inside. During the first quarter of 2012, we initiated a limited launch of a tube delivery format of our First Defense TechnologyTM in a gel solution.
We sell wipes that are pre-moistened with a Nisin-based formulation in two product formats. Since 1999, we have been selling Wipe Out® Dairy Wipes (our second leading source of product sales) for use in preparing the teat area of a cow for milking. Sales of Wipe Out® Dairy Wipes decreased by 11% during the nine-month period ended September 30, 2013 in comparison to the same period during 2012. During the first quarter of 2013, we initiated sales of these wipes for pets in a 120-count canister (Preva™ wipes) to Bayer HealthCare Animal Health of St. Joseph, Missouri. This new source of sales turned the 11% decrease in sales of Wipe Out® Dairy Wipes into a 16% aggregate increase in sales of all wipes during the nine-month period ended September 30, 2013. Sales of our California Mastitis Test (CMT) decreased by 5% during the nine-month period ended September 30, 2013 in comparison to the same period during 2012. Sales of IsolateTM (bulk reagents for use in a drinking water test sold by others in Europe) decreased by 32% during the nine-month period ended September 30, 2013 in comparison to the same period during 2012.
Gross Margin
The gross margin as a percentage of product sales was 50% and 58% during the three-month periods ended September 30, 2013 and 2012, respectively. The gross margin as a percentage of product sales was 55% and 58% during the nine-month periods ended September 30, 2013 and 2012, respectively. The gross margin as a percentage of product sales was 55% and 57% during the twelve-month periods ended September 30, 2013 and 2012, respectively.
| - 15 - | ||
ImmuCell Corporation
Our gross margin percentages were 57%, 55% and 52% for the years ended December 31, 2012, 2011 and 2010, respectively. Our objective is to maintain the full-year gross margin percentage over 50%, and we have achieved this objective during all of the periods being reported, with the exception of 49.9% during the third quarter of 2013. We reduced production output during the third quarter of 2013 to replace and repair certain pieces of critical process equipment, which reduced our gross margin. These investments are being completed during the fourth quarter of 2013. Due to a number of factors, we expect some fluctuations in gross margin percentages from quarter to quarter. Biological yields from the raw material used in the production of First DefenseÒ do fluctuate over time. Like most manufacturers in the United States, we have been experiencing increases in the cost of raw materials that we purchase. Product mix also affects gross margin. We earn a higher gross margin on First DefenseÒ and a lower gross margin on Wipe OutÒ Dairy Wipes. We had held our selling prices without significant increase for approximately the seven-year period ended December 31, 2007, believing that we could benefit more from higher unit sales volume than from a higher average selling price per unit. During the first quarter of 2008, we implemented a modest increase to the selling price of First DefenseÒ and have held that selling price without increase since then. Changes in the gross margin on product sales are summarized in the following table for the respective periods (in thousands, except for percentages):
| | | For the Three-Month Periods Ended September 30, | | | | Decrease | | | ||||||||
| | | 2013 | | | 2012 | | | | Amount | | | % | | | ||
| Gross margin | | $ | 616 | | | $ | 621 | | | $ | (5) | | | (0.8) | % | |
| Percent of product sales | | | 50 | % | | | 58 | % | | | (8) | % | | (14) | % | |
| | | For the Nine-Month Periods Ended September 30, | | Increase (Decrease) | | | ||||||||||
| | | | 2013 | | | 2012 | | | Amount | | | % | | | ||
| Gross margin | | $ | 2,453 | | | $ | 2,304 | | | $ | 149 | | | 7 | % | |
| Percent of product sales | | | 55 | % | | | 58 | % | | | (3) | % | | (5) | % | |
| | | For the Twelve-Month Periods Ended September 30, | | Increase (Decrease) | | | ||||||||||
| | | 2013 | | | 2012 | | | Amount | | % | | | ||||
| Gross margin | | $ | 3,203 | | | $ | 3,029 | | | $ | 174 | | | 6 | % | |
| Percent of product sales | | | 55 | % | | | 57 | % | | | (3) | % | | (5) | % | |
Product Development
Product development expenses increased by 30%, or $67,000, to $291,000 during the three-month period ended September 30, 2013 in comparison to $224,000 during the same period in 2012. Product development expenses increased by 21%, or $146,000, to $829,000 during the nine-month period ended September 30, 2013 in comparison to $683,000 during the same period in 2012. During the third quarter of 2013, we wrote off approximately $48,000 in capitalized product development expenses. We spent approximately $918,000, $1,720,000 and $1,493,000 on product development activities during the years ended December 31, 2012, 2011 and 2010, respectively. Our lead product development initiative is Mast Out®, a Nisin-based intramammary treatment of subclinical mastitis in lactating dairy cows. As anticipated, we reduced product development expenses beginning in 2012 in comparison to our investment level for 2008 to 2011, primarily because we spent less on the development of Mast OutÒ having largely completed the significant clinical studies. This trend is expected to reverse during the fourth quarter of 2013 and the first half of 2014, given our strategic decision to invest in a Nisin API production plant, discussed further below.
During 2000, we acquired an exclusive license from Nutrition 21, Inc. (formerly Applied Microbiology Inc. or AMBI) to develop and market Nisin-based products for animal health applications, which allowed us to initiate the development of Mast OutÒ. In 2004, we paid Nutrition 21 approximately $965,000 to buy out this royalty and milestone-based license to Nisin, thereby acquiring control of the animal health applications of Nisin. Nisin, the same active ingredient contained in Wipe OutÒ Dairy Wipes, is an antibacterial peptide. Nisin is known to have activity against most gram positive and some gram negative bacteria. Nisin is a well characterized substance, having been used in food preservation applications for over 50 years. Food-grade Nisin, however, cannot be used in pharmaceutical applications because of its low purity. Our Nisin technology includes methods to achieve pharmaceutical-grade purity.
In the pivotal effectiveness study, statistically significant Mast OutÒ cure rates were associated with a statistically significant reduction in milk somatic cell count (SCC), which is an important measure of milk quality.
| - 16 - | ||
ImmuCell Corporation
In 2004, we entered into a product development and marketing agreement with Zoetis Inc. (formerly Pfizer Animal Health, a division of Pfizer, Inc.) covering Mast OutÒ. Under that agreement (as amended and supplemented and later terminated), we received $2,375,000 in payments. Zoetis elected to terminate the agreement in 2007. Soon thereafter, Zoetis returned to us all rights, data, information, files, regulatory filings, materials and stocks of Nisin and Nisin producing cultures relating to the development of Mast OutÒ. We believe that the decision of Zoetis to terminate the agreement was not based on any unanticipated efficacy or regulatory issues. Rather, we believe the decision was primarily market driven, largely relating to their fear that the milk from treated cows could interfere with the manufacture of certain cultured dairy products.
Milk from cows treated with intramammary mastitis treatment products on the market today must be discarded for a specified period of time during and after treatment. We believe that all milk from cows treated with Mast OutÒ will be saleable. This is a significant competitive advantage of our product. Due to this zero milk discard feature, there is a risk that Nisin from milk of cows treated with Mast OutÒ could interfere with the manufacture of certain (but not all) commercial cultured dairy products, such as some kinds of cheese and yogurt, if a process tank contains milk from a high enough percentage of treated cows. We conducted a formal risk assessment to quantify the impact that milk from treated cows may have on cultured dairy products. This study concluded that the dilution of milk from treated cows through comingling with milk from untreated cows during normal milk hauling and storage practices reduces the risk of interference with commercial dairy cultures to a negligible level when Mast OutÒ is used in accordance with the product label. Milk from treated cows that is sold exclusively for fluid milk products presents no risk.
The commercial introduction of Mast OutÒ in the United States is subject to approval of our New Animal Drug Application (NADA) by the FDA, which approval cannot be assured. Foreign regulatory approvals would be required for sales in key markets outside of the United States and would involve some similar and some different requirements. The NADA is comprised of five principal Technical Sections subject to the FDA’s phased review of a NADA. By statute, each Technical Section submission is generally subject to a six-month review cycle by the FDA. Each Technical Section can be reviewed and approved separately. Upon review and assessment by the FDA that all requirements for a Technical Section have been met, the FDA may issue a Technical Section Complete Letter. The current status of our work on these Technical Sections is as follows:
1) Environmental Impact: During the third quarter of 2008, we received the Environmental Impact Technical Section Complete Letter from the FDA.
2) Target Animal Safety: During the second quarter of 2012, we received the Target Animal Safety Technical Section Complete Letter from the FDA.
3) Effectiveness: During the third quarter of 2012, we received the Effectiveness Technical Section Complete Letter from the FDA.
4) Human Food Safety (HFS): The HFS Technical Section submission was made during the fourth quarter of 2010. This Technical Section determines whether a milk discard period or meat withhold period post-treatment with Mast OutÒ will be required. This Technical Section includes several subsections such as: a) toxicology, b) total metabolism, c) effects of drug residues in food on human intestinal microbiology, d) effects on bacteria of human health concern (antimicrobial resistance) and e) pivotal residue chemistry. During the second quarter of 2011, we announced that the FDA had accepted the subsections described above and granted Mast OutÒ a zero milk discard time and a zero meat withhold period. Before we can obtain the Technical Section Complete Letter, we must adapt our analytical method that measures Nisin residues in milk around the newly assigned tolerance limit and transfer that method to a FDA laboratory. We first submitted the validated analytical method to the FDA during the fourth quarter of 2012. We submitted a revised submission, which we believe to be responsive to the FDA’s review comments, during the third quarter of 2013. The FDA has informed us that our method transfer to the FDA laboratory would be delayed until the first half of 2014 due to scheduling constraints at the FDA laboratory. Accordingly, our expectation for a Technical Section Complete Letter for the HFS Technical Section has now been pushed back to early 2015.
| - 17 - | ||
ImmuCell Corporation
5) Chemistry, Manufacturing and Controls (CMC): Obtaining FDA approval of the CMC Technical Section defines the critical path to approval of our NADA by the FDA and to commercial sales. We are party to agreements with three manufacturers to produce inventory for us utilizing our proprietary technologies and processes. First, a long-term, exclusive supply agreement with Plas-Pak Inc. of Norwich, Connecticut covers the proprietary syringe that was developed specifically for treating cows with Mast OutÒ. These syringes were used for all pivotal studies of Mast OutÒ. Second, we could have the Nisin Active Pharmaceutical Ingredient (API) produced for us under a Development and Manufacturing Agreement with Lonza Sales, Ltd. of Basel, Switzerland, which provides for the exclusive manufacture of the Nisin API. The Lonza site in Europe is FDA-approved, compliant with cGMP regulations and subject to future FDA approval and inspection. Third, an exclusive Contract Manufacture Agreement with Norbrook Laboratories Limited of Newry, Northern Ireland, an FDA-approved drug product manufacturer, covers the formulation of the Nisin API into drug product, the sterile-fill of syringes and the final packaging. Norbrook provided these services for clinical material used in all pivotal studies of Mast OutÒ. During the fourth quarter of 2012, we withdrew our first submission to the FDA of the CMC Technical Section because of changes we have made to our regulatory filing and manufacturing strategies.
The selection of and (if applicable) the financing for the Nisin API production facility is a critical decision. We had been considering four options: 1) having this work done by a qualified contract manufacturer, such as Lonza, 2) building a new facility, 3) leasing and modifying an existing facility or 4) transferring our technology to a partner’s facility. Our initial plan was to have the Nisin API produced for us under contract in order to avoid the investment in a manufacturing facility. By the end of 2011, we determined that the large minimum production volumes and high cost imposed by the selected contract manufacturer might not be commercially sustainable. For this reason, we investigated controlling the production of the Nisin API ourselves in a plant that we either built or leased. Because we do not have the estimated amount of $13,000,000 to pay for this investment (without some combination of new debt, equity or partner funding) and because of the risk that the actual cost could be higher than we estimated, we investigated potential partnering arrangements. We presented this product opportunity to a variety of large and small animal health companies. During the second quarter of 2013, we received a $250,000 exclusive option payment from one prospective partner who later decided not to execute a license for the development and marketing of Mast Out®. We were informed by the prospective partner that it had determined that, in its opinion, it could not cost effectively commercialize the product. During the third quarter of 2013, we suspended our active pursuit of a partner for Mast Out® for the present time and decided to continue our pursuit of FDA approval of this product by completing the HFS Technical Section and the CMC Technical Section on our own. While recognizing the commercial and near-term financial advantages which could have been realized via a partnering agreement, we believe that, among the currently available options, the greatest long-term value for our stockholders could be achieved through an independent strategy at this stage. We will continue to evaluate the four potential options above, as we actively pursue the alternative strategy discussed below.
During the third quarter of 2013, our Board of Directors approved the investment of approximately $1,500,000 to acquire processing equipment and to modify a portion of our facility in Portland, Maine to produce the Nisin API for Mast OutÒ. We expect our facility to produce sufficient Nisin API to complete our regulatory submission and conduct test marketing of Mast OutÒ. The primary goal of this strategy is to produce the validation batches required to make the first submission of the CMC Technical Section to the FDA during the second half of 2014. Further, this investment will allow us to confirm process yields and the related cost of production and to produce inventory for test marketing and limited initial sales after approval. In short, we aim to secure regulatory approval of the product and demonstrate its commercial viability. We are encouraged by the feedback from all prospective partners that our novel mastitis treatment can achieve FDA approval and have a significant, positive impact on the dairy industry. We continue to believe in the potential value of making this novel treatment option available to dairy producers in order to reduce their reliance on penicillin and cephalosporin-based products. We intend to take all appropriate steps to pursue a successful commercialization of Mast Out®. This anticipated investment and the resulting short-term loss is the vehicle by which we expect to optimize the long-term value of this asset for our stockholders.
It is very common for the CMC Technical Section to require two, six-month review periods by the FDA. After obtaining the final Technical Section Complete Letter and after preparing materials responsive to other administrative requirements, the administrative NADA submission can be assembled for review by the FDA. This final administrative submission is subject to a statutory sixty-day review period. Given all this, we believe we could be in a position to test market the product by the end of 2015. Our options at that point would include a further investment in a larger scale manufacturing capacity by us, a marketing alliance with others, the sale of the product rights or the out-licensing of the product. We now intend to control our decision of whether and when to invest in larger scale production on our own or with a partner that would contribute a larger sales force to optimize commercial sales.
| - 18 - | ||
ImmuCell Corporation
In addition to our work on Mast OutÒ, we are actively exploring further improvements, extensions or additions to our current product line. For example, we currently are developing treatments that could prevent bovine enteritis (calf scours) caused by enteric pathogens other than E. coli K99 and bovine coronavirus (the current disease claims for First Defense®). In connection with that effort, during the second quarter of 2009 we entered into an exclusive license with Baylor College of Medicine covering certain rotavirus vaccine technology. This perpetual license (if not terminated for cause) is subject to milestone and royalty payments. Results from pilot studies completed during the first quarter of 2009 justified continued product development. We completed a pivotal effectiveness study of this experimental formulation during the third quarter of 2011 without seeing the anticipated level of effectiveness needed for regulatory approval and market acceptance. After optimizing the challenge model, we directed our efforts to conducting additional pilot studies of different formulations of this antibody preparation. Having achieved positive results from these pilot studies, we plan to initiate a second pivotal effectiveness study during the first quarter of 2014. During the third quarter of 2012, we entered into an exclusive option to a license with North Carolina State University covering certain recombinant Cryptosporidium parvum vaccine technology. During the third quarter of 2013, we terminated the option to license this technology because the results from the pilot studies did not demonstrate sufficient effectiveness to justify a continued investment. We are developing nutritional and feed supplement product applications (that are not delivered in the capsule format) of our First Defense TechnologyTM, which is a unique whey protein concentrate that is purified utilizing our proprietary milk protein processing methods that does not carry the claims of our USDA-licensed product. As additional opportunities arise to commercialize our own technology, or licensable technology, we may begin new development projects. While we continue to pursue internally funded product development programs, we also remain interested in acquiring new products and technologies that fit with our sales and marketing focus on the dairy and beef industries.
Administrative Expenses
During the three-month period ended September 30, 2013, administrative expenses decreased by 2%, or $4,000, to $227,000 as compared to $231,000 during the same period in 2012. During the nine-month period ended September 30, 2013, administrative expenses increased by less than 1%, or $6,000, to $708,000 as compared to $701,000 during the same period in 2012. While we implement efficiencies where possible, we continue to incur costs associated with complying with the Sarbanes-Oxley Act of 2002 and other costs associated with being a publicly-held company. At this stage in our development, we have limited our investment in investor relations spending. We provide a full disclosure of the status of our business and financial condition in three quarterly reports and one annual report each year, as well as in Current Reports on Form 8-K when legally required or deemed appropriate by management. Additional information about us is available in our annual Proxy Statement. All of these reports are filed with the Securities and Exchange Commission and are available on-line and upon request to the Company. At this time, our financial and time resources are committed principally to managing our commercial business and developing Mast OutÒ. Our Board of Directors is very involved with and supportive of this current resource allocation and is considering the potential benefits of investing in a more actively managed investor relations program. No such significant investment is expected to be initiated during the balance of 2013. While the current strategy of providing cost-effective investor relations through our reporting to the Securities and Exchange Commission is subject to change, we believe that this strategy currently is in the best long-term interest of all stockholders.
Sales and Marketing Expenses
During the three-month period ended September 30, 2013, sales and marketing expenses increased by 2%, or $6,000, to $258,000 in comparison to $253,000 during the same period in 2012, aggregating 21% and 23% of product sales during the three-month periods ended September 30, 2013 and 2012, respectively. During the nine-month period ended September 30, 2013, sales and marketing expenses increased by 6%, or $39,000, to $726,000 in comparison to $687,000 during the same period in 2012, aggregating 16% and 17% of product sales during the nine-month periods ended September 30, 2013 and 2012, respectively. Our current budgetary objective is to invest up to 20% of product sales in sales and marketing expenses for the full year 2013. This level of investment was expected and planned given our strategic decision beginning in 2010 to invest in additional sales and marketing efforts. This investment may have driven, at least in part, our recent increase in product sales.
| - 19 - | ||
ImmuCell Corporation
Other Revenues (Expenses), Net
During the second quarter of 2013, we received a $250,000 exclusive option payment from a prospective partner for the development and marketing of Mast Out®. This payment was recorded as deferred revenue upon receipt. During the third quarter of 2013, this prospective partner decided not to execute a license after its final due diligence. Accordingly, the deferred revenue was recognized during the third quarter of 2013. At the same time, $48,000 in capitalized expenses pertaining to the development of Mast Out® were written off. During the first quarter of 2013, we received a payment of approximately $62,000, as an eligible member of the mutual insurance company that provided products liability insurance to us when it was acquired by another insurance company through a sponsored demutualization transaction that was effective as of January 1, 2013.
Income Before Income Taxes and Net Income
Our income before income taxes was $77,000 during the three-month period ended September 30, 2013 in contrast to a loss before income taxes of ($94,000) during the three-month period ended September 30, 2012. Our income tax expense (benefit) was 25% and (33%) of our income before income taxes during the three-month periods ended September 30, 2013 and 2012, respectively. Our net income for the three-month period ended September 30, 2013 was $57,000, or $0.02 per share, in contrast to a net loss of ($64,000), or ($0.02) per share, during the three-month period ended September 30, 2012. Our income before income taxes was $458,000 during the nine-month period ended September 30, 2013 in comparison to income before income taxes of $203,000 during the nine-month period ended September 30, 2012. Our income tax expense was 41% and 48% of our income before income taxes during the nine-month periods ended September 30, 2013 and 2012, respectively. Our net income for the nine-month period ended September 30, 2013 was $268,000, or $0.09 per share, in comparison to a net income of $106,000, or $0.03 per share, during the nine-month period ended September 30, 2012. The improved financial performance year-to-date is largely due to increased gross margin from sales of First Defense®. Revenue recognized from a $250,000 license option fee pertaining to Mast OutÒ turned a loss before income taxes to income before income taxes during the three-month period ended September 30, 2013 and significantly increased our income before income taxes during the nine-month period ended September 30, 2013.
ITEM 3 - QUANTITATIVE AND QUALITATIVE DISCLOSURES ABOUT MARKET RISK
None
ITEM 4 - CONTROLS AND PROCEDURES
Disclosure Controls and Procedures. Our management, with the participation of the individual who serves as our principal executive and principal financial officer, evaluated the effectiveness of our disclosure controls and procedures as of September 30, 2013. Based on this evaluation, that officer concluded that our disclosure controls and procedures were effective as of that date. Disclosure controls and procedures are designed to ensure that information required to be disclosed by us in the reports that we file or submit under the Exchange Act is (i) recorded, processed, summarized and reported within the time periods specified in the Securities and Exchange Commission’s rules and forms and (ii) accumulated and communicated to our management, including our principal executive and principal financial officer, as appropriate to allow timely decisions regarding required disclosures and an increase in other revenues.
Changes in Internal Controls over Financial Reporting. The individual who serves as our principal executive and principal financial officer periodically evaluates any change in internal control over financial reporting which has occurred during the prior fiscal quarter. Management has concluded that there was no change in our internal control over financial reporting that occurred during the quarter ended September 30, 2013 that has materially affected, or is reasonably likely to materially affect, our internal control over financial reporting.
| - 20 - | ||
ImmuCell Corporation
PART II. OTHER INFORMATION
ITEM 1 - LEGAL PROCEEDINGS
None
ITEM 1A - RISK FACTORS
This Quarterly Report on Form 10-Q contains “forward-looking statements” within the meaning of Section 27A of the Securities Act of 1933 and Section 21E of the Securities Exchange Act of 1934. Such statements include, but are not limited to, any statements relating to: projections of future financial performance; the scope and timing of future product development work and commercialization of our products; future costs of product development efforts; future sources of financial support for our product development, manufacturing and marketing efforts; the amount and timing of future investments in facility modifications and production equipment or the availability and cost of alternative manufacturing and/or distribution resources; the future adequacy of our working capital and the availability of third party financing; timing and future costs of a facility to produce Nisin API for Mast Out®; the timing and outcome of pending or anticipated applications for future regulatory approvals; future regulatory requirements relating to our products; future expense ratios and margins; future compliance with bank debt covenants; future realization of deferred tax assets; costs associated with sustaining compliance with cGMP regulations in our current operations and attaining such compliance for the facility to produce Nisin API for Mast Out®; factors that may affect the dairy and beef industries and future demand for our products; the accuracy of our understanding of our distributors’ ordering patterns; anticipated changes in our manufacturing capabilities and efficiencies; anticipated competitive and market conditions; and any other statements that are not historical facts. Forward-looking statements can be identified by the use of words such as “expects”, “may”, “anticipates”, “aim”, “intends”, “would”, “could”, “should”, “will”, “plans”, “believes”, “estimates”, “targets”, “projects”, “forecasts” and similar words and expressions. In addition, there can be no assurance that future developments affecting us will be those that we anticipate, especially considering the effects the distress in credit and capital markets may have on our current and prospective customers and the global economy and the uncertainties surrounding the potential for a prolonged global recession. Such statements involve risks and uncertainties, including, but not limited to, those risks and uncertainties relating to difficulties or delays in development, testing, regulatory approval, production and marketing of our products, competition within our anticipated product markets, the uncertainties associated with product development, Nisin API manufacturing, our potential reliance upon third parties for financial support, products and services, changes in laws and regulations, decision making by regulatory authorities, currency fluctuations and other risks detailed from time to time in filings we make with the Securities and Exchange Commission, including our Quarterly Reports on Form 10-Q, our Annual Reports on Form 10-K and our Current Reports on Form 8-K. Such statements are based on our current expectations, but actual results may differ materially due to various factors, including the risk factors summarized below and uncertainties otherwise referred to in this Quarterly Report.
Projection of net income: After nine consecutive years of reporting net income, we reported net losses for the four years ended December 31, 2008, 2009, 2010 and 2011, due in large part to our product development strategy. By reducing our investment in the development of Mast OutÒ and increasing sales of First Defense®, we were able to record net operating income of $245,000 and net income of $90,000 during the year ended December 31, 2012. We continued this positive trend by recording net operating income of $190,000 and net income of $268,000 during the nine-month period ended September 30, 2013. Given our strategic decision to invest approximately an additional $1,500,000 in the manufacture of Nisin API to complete the CMC Technical Section for Mast OutÒ, we expect to record a net loss during the fourth quarter of 2013, which may result in a net loss for the full year ending December 31, 2013. We expect to return to breakeven or profitable results after we complete this investment, which is currently expected to be completed during the first half of 2014. Generally speaking, our financial performance can differ significantly from management projections, due to numerous factors that are difficult to predict or that are beyond our control. Stronger than expected sales of First Defense®, for example, could increase our net income. Conversely, weaker than expected sales of First Defense® could lead to less profits or an operating loss.
Reliance on sales of First Defense®: We are heavily reliant on the market acceptance of First Defense® to generate product sales and fund our operations. Our business would not have been profitable during the nine consecutive years in the period ended December 31, 2007, or during the year ended December 31, 2012, or during the first nine months of 2013, without the gross margin that we earned from the sale of First Defense®.
| - 21 - | ||
ImmuCell Corporation
Concentration of sales: During 2012, 80% of our product sales was made to customers in the U.S. dairy and beef industries in comparison to 81% during of 2011. During the nine-month period ended September 30, 2013, 84% of our product sales was made to customers in the U.S. dairy and beef industries, compared to 81% during the same period in 2012. A large portion of our product sales (49%, 52% and 50% for the years ended December 31, 2012, 2011, and 2010, respectively) was made to two large distributors. During the nine-month period ended September 30, 2013, 53% of our sales was made to these two distributors, compared to 49% during the same period in 2012. A large portion of our trade accounts receivable (42% as of December 31, 2012 and 45% as of December 31, 2011) was due from these two distributors. As of September 30, 2013, 51% of our trade accounts receivable was due from these two distributors. We have a good history with these distributors, but the concentration of sales and accounts receivable with a small number of customers does present a risk to us, including risks related to such customers experiencing financial difficulties or altering the basis on which they do business with us.
Economics of the dairy industry: The U.S. dairy industry continues to face difficult economic pressures. There were 89,300,000 head of cattle and calves (dairy and beef) in the United States as of January 1, 2013, which is down 2% from 90,800,000 as of January 1, 2012. This is the lowest inventory of all cattle and calves since we had 88,100,000 head as of January 1, 1952. The size (annual average) of the U.S. dairy herd ranged from approximately 9,011,000 to 9,199,000 cows from 1998 to 2007. This annual average jumped to 9,315,000 cows in 2008. The annual average then declined to 9,203,000 in 2009 and further declined to 9,119,000 in 2010 before increasing to 9,194,000 in 2011 and further increasing to 9,232,000 in 2012. This annual average decreased slightly to 9,226,000 through September 2013. While the number of cows in the U.S. herd and the production of milk per cow directly influence the supply of milk, demand for milk has been influenced by very volatile international demand for milk products. Sales of our products are likely also influenced by the prices of milk, calves and milking cows. The Class III milk price is an industry benchmark that reflects the value of product used to make cheese. The Class III milk price (which is largely out of the direct control of individual dairy producers) is an important indicator because it defines our customers’ revenue level. For 2011, this price level averaged $18.37, which represented a 27% increase from 2010. This average price level for 2011 was higher than the annual average reached in any of the past 30 years, but then it began to decline in 2012. For 2012, this price level averaged $17.44, which represented a 5% decrease from 2011. This average price level increased by 2% during the first nine months of 2013 to $17.76. The actual level of milk prices may be less important than its level relative to costs. The recent improvement in milk prices has been offset, in part, by higher feed costs. One measure of this relationship is known as the milk-to-feed price ratio, which represents the amount of feed that one pound of milk can buy. Whenever this ratio meets or exceeds 3.0, it is considered profitable to buy feed and produce milk. For 2011, this ratio averaged approximately 1.88, which represented a 17% decrease from 2010. For 2012, this ratio averaged approximately 1.52, which represented a 19% decrease from 2011. The ratio of 1.52 is the lowest recorded since this ratio was first reported in 1985. This ratio averaged 1.58 for the first nine months of 2013. This means that a dairy producer can buy only 1.58 pounds of feed for every pound of milk sold. An increase in feed costs also has a negative impact on the beef industry. Widespread severe drought conditions in key U.S. agricultural regions during 2012 drove feed costs higher. Another indication of the economic condition of the dairy industry is the average price for animals sold for dairy herd replacement. This price (reported as of January, April, July and October) averaged approximately $1,420 in 2011, which represented a 7% increase from 2010. This price averaged approximately $1,428 in 2012, which represented a 1% increase from 2011. As of October 2013, this price decreased by 3% to $1,385. The industry data referred to above is compiled from USDA databases. Given our focus on the dairy and beef industries, the financial insecurity of our primary end users is a risk to our ability to maintain and grow sales at a profitable level. It also heightens the challenge of selling premium-priced animal health products (such as Mast OutÒ) into such a market. Further, the loss of farms from which we buy raw material for First Defense® could make it difficult for us to produce enough inventory until supply agreements are reached with replacement farms on suitable terms.
Product development risks: The development of new products is subject to financial, scientific, regulatory and market risks. Our current business growth strategy relies heavily on the development of Mast OutÒ which requires (and will continue to require) a substantial investment. Our efforts will be subject to inspection and approval by the FDA. There is no assurance whether or when we will obtain all of the data necessary to support regulatory approval for this product.
| - 22 - | ||
ImmuCell Corporation
Regulatory requirements for Mast OutÒ: The commercial introduction of Mast OutÒ in the United States will require us to obtain appropriate FDA approval for this product. It presently is uncertain whether or when this approval will be achieved. We are exposed to additional regulatory compliance risks through the subcontractors that we choose to work with to produce Mast OutÒ, who also need to satisfy certain regulatory requirements in order to provide us with the products and services we need. International regulatory approvals would be required for sales outside of the United States. European regulatory authorities are not expected to approve a product with a zero milk discard claim, which would remove a significant competitive advantage of Mast OutÒ in that territory. However, the assigned milk discard period may be shorter for Mast OutÒ than it is for other products on the market in Europe.
Risks associated with Mast OutÒ funding strategy: Completing the development of Mast OutÒ through to the submission of the administrative NADA to the FDA involves a great deal of risk. Our current strategy is to invest approximately an additional $1,500,000 in our small-scale Nisin API production plant in order to gain NADA approval. Uncertainty concerning the availability and terms of financing to develop a larger-scale production plant or alternatively the availability and terms of potential partnering arrangements is a risk to an optimal commercialization of Mast OutÒ.
Uncertainty of market size and product sales estimates: Even assuming that Mast OutÒ achieves regulatory approval in the United States with a zero milk discard requirement, estimating the size of the market for this product is subject to numerous uncertainties. Some of the uncertainties surrounding our product include the development of the subclinical mastitis treatment market, coverage of relevant pathogens, selling price and its effect on market penetration, cost of manufacture, integration of milk from treated cows into cheese starter cultures and market acceptance.
Regulatory requirements for First DefenseÒ: First Defense®, and modifications and extensions thereto, is sold in the United States subject to a product license from the Center for Veterinary Biologics, USDA, which was first obtained in 1991. Similar regulatory oversight risks exist in territories outside of the United States where we sell our products. The potency of serial lots is directly traceable to the original serial used to obtain the product performance claims (the “Reference Standard”). Due to the unique nature of the First DefenseÒ label claims, host animal re-testing is not required as long as periodic laboratory analyses continue to support the stability of stored Reference Standard. To date, these analyses have demonstrated strong stability. However, if the USDA were not to approve requalification of the Reference Standard, additional clinical studies could be required to meet regulatory requirements and allow for continued sales of the product.
Product risks generally: The sale of our products is subject to financial, efficacy, regulatory, competitive and other market risks. We cannot be sure that we will be able to maintain the regulatory compliance required to continue selling our products. There is no assurance that we will continue to achieve market acceptance at a profitable price level or that we can continue to manufacture our products at a sufficient gross margin.
Product liability: The manufacture and sale of certain of our products entails a risk of product liability. Our exposure to product liability is mitigated to some extent by the fact that our products are principally directed towards the animal health market. We have maintained product liability insurance in an amount which we believe is reasonable in relation to our potential exposure in this area. We have no history of claims of this nature being made.
Regulatory requirements for Wipe OutÒ Dairy Wipes: While the FDA regulates the manufacture and sale of Wipe OutÒ Dairy Wipes, this type of product is permitted to be sold without a NADA approval, in accordance with the FDA’s Compliance Policy Guide 7125.30 (“Teat Dips and Udder Washes for Dairy Cows and Goats”). This policy guide could be withdrawn at the FDA’s discretion, in which case we would likely discontinue sales of the product. The manufacture of Wipe OutÒ Dairy Wipes is subject to Part 211 of the cGMP regulations. As such, our operations are subject to inspection by the FDA. We continue to invest in personnel, facility improvements and new equipment to sustain compliance with cGMP regulations across our entire product line. In June 2007, we received a Warning Letter from the FDA citing deficiencies in specific areas of the cGMP regulations. We filed a response to the FDA in June 2007, and we responded to a request for additional information in April 2008. During the first quarter of 2013, the FDA again inspected our facilities and operations. The report from this inspection was very favorable, and we responded to the few, minor observations that were noted. We remain subject to the risk of adverse action by the FDA in this respect.
Competition from others: Many of our competitors are significantly larger and more diversified in the relevant markets, and have substantially greater financial, marketing, manufacturing and human resources and more extensive product development capabilities than we do, including greater ability to withstand adverse economic or market conditions and declining revenues and/or profitability. The market for the treatment of mastitis in dairy cows is highly competitive, and presently is dominated by large companies such as Zoetis, Merck and Boehringer Ingelheim. There is no assurance that Mast OutÒ will compete successfully in this market. We may not be aware of other companies that compete with us or intend to compete with us in the future.
| - 23 - | ||
ImmuCell Corporation
No expectation to pay any dividends for the foreseeable future: We do not anticipate paying any dividends to our stockholders for the foreseeable future. Instead, we expect to use cash to fund product development costs. Any debt or equity financing we obtain to assist in funding our product development programs may include terms prohibiting or restricting our paying dividends or repurchasing stock for a lengthy period. Stockholders must be prepared to rely on sales of their common stock after price appreciation to earn an investment return, which may never occur. Any determination to pay dividends in the future will be made at the discretion of our Board of Directors and will depend on our financial condition, results of operations, contractual restrictions, restrictions imposed by applicable laws and other factors our Board of Directors deems relevant.
Market for common stock: Our common stock trades on the NASDAQ Stock Market (NASDAQ: ICCC). Our average daily trading volume is lower than the volume for most other companies and the bid/ask stock price spread can be larger, which could result in investors facing difficulty selling their stock for proceeds that they may expect or desire.
Stock market valuation: There are companies in the animal health sector with market capitalization values in excess of $300,000,000 in contrast to our value of under $15,000,000. At least one such company has no product sales. We currently have product sales in excess of $5,000,000. Before gross margin from the sale of new products is achieved, our market capitalization may be heavily dependent on the perceived potential of our products under development.
ITEM 2 - UNREGISTERED SALES OF EQUITY SECURITIES AND USE OF PROCEEDS
None
ITEM 3 - DEFAULTS UPON SENIOR SECURITIES
None
ITEM 4 - MINE SAFETY DISCLOSURES
None
ITEM 5 - OTHER INFORMATION
None
ITEM 6 - EXHIBITS
| | Exhibit 31 | Certifications required by Rule 13a-14(a). |
| | | |
| | Exhibit 32 | Certification pursuant to Section 1350, as adopted pursuant to Section 906 of the Sarbanes-Oxley Act of 2002. |
| | | |
| | 101.INS | XBRL Instance Document. |
| | | |
| | 101.SCH | XBRL Taxonomy Extension Schema Document. |
| | | |
| | 101.CAL | XBRL Taxonomy Extension Calculation Linkbase Document. |
| | | |
| | 101.DEF | XBRL Taxonomy Extension Definition Linkbase Document. |
| | | |
| | 101.LAB | XBRL Taxonomy Extension Label Linkbase Document. |
| | | |
| | 101.PRE | XBRL Taxonomy Extension Presentation Linkbase Document. |
| - 24 - | ||
ImmuCell Corporation
SIGNATURE
Pursuant to the requirements of Section 13 or 15(d) of the Securities Exchange Act of 1934, the registrant has duly caused this report to be signed on its behalf by the undersigned thereunto duly authorized.
| | ImmuCell Corporation | |
| | Registrant | |
| | | |
| | | |
| Date: November 13, 2013 | By: | /s/ Michael F. Brigham |
| | Michael F. Brigham | |
| | President, Chief Executive Officer | |
| | and Principal Financial Officer | |
| - 25 - | ||
ImmuCell Corporation
EXHIBIT INDEX
| Exhibit 31 | Certifications required by Rule 13a-14(a). |
| | |
| Exhibit 32 | Certification pursuant to Section 1350, as adopted pursuant to Section 906 of the Sarbanes-Oxley Act of 2002. |
| | |
| 101.INS | XBRL Instance Document. |
| | |
| 101.SCH | XBRL Taxonomy Extension Schema Document. |
| | |
| 101.CAL | XBRL Taxonomy Extension Calculation Linkbase Document. |
| | |
| 101.DEF | XBRL Taxonomy Extension Definition Linkbase Document. |
| | |
| 101.LAB | XBRL Taxonomy Extension Label Linkbase Document. |
| | |
| 101.PRE | XBRL Taxonomy Extension Presentation Linkbase Document. |