Attached files
| file | filename |
|---|---|
| 8-K - FORM 8-K - DTS, INC. | v446309_8k.htm |
| EX-99.1 - EXHIBIT 99.1 - DTS, INC. | v446309_ex99-1.htm |
Exhibit 99.2

Information on this slide is confidential property of DTS. Any unauthorized copying is strictly prohibited. © 2016 DTS, Inc. 1 DTS INVESTOR PRESENTATION Q2 2016 AUGUST 8, 2016

Information on this slide is confidential property of DTS. Any unauthorized copying is strictly prohibited. © 2016 DTS, Inc. 2 During this presentation, management may make forward - looking statements within the meaning of Section 27 A of the U . S . Securities Act of 1933 , as amended, and Section 21 E of the U . S . Securities Exchange Act of 1934 , as amended . Words such as “expects,” “anticipates,” “intends,” “plans,” “believes,” “seeks,” “estimates,” variations of such words and similar expressions are intended to identify such forward - looking statements, which generally are not historical in nature . Such statements are subject to known and unknown risks, uncertainties or other factors that may cause the company’s actual results to be materially different from historical results or any results expressed or implied during this presentation . Information regarding risks and uncertainties that could cause actual results to differ materially and more detailed disclosures concerning the risks facing our business may be found in periodic reports that we file with the SEC including DTS’ most recent forms 10 - K and 10 - Q, available at www . sec . gov . The information in this presentation related to projections or other forward - looking statements, including, but not limited to, statements regarding future financial or operating performance are based on current expectations and we expressly disclaim any responsibility to update forward - looking statements should circumstances change . Forward - looking statements are not guarantees of future performance and involve certain risks, uncertainties and assumptions that are difficult to predict . Although we believe the expectations reflected in any forward - looking statements are based on reasonable assumptions, we can give no assurance that our expectations will be attained and therefore, actual outcomes and results may differ materially from what is expressed or forecasted in such forward - looking statements . Reconciliation of GAAP to Non - GAAP financial measures can be found on the Investor Relations section of our website at www . dts . com . SAFE HARBOR

Information on this slide is confidential property of DTS. Any unauthorized copying is strictly prohibited. © 2016 DTS, Inc. 3 ~45% <15% <40% 2016E Revenue Breakdown by Market Home Mobile Automotive Stock/Financial Information FY Financial Highlights and 2016 Outlook ($ Millions, except per share data) Price per share $26.45 90 Day Avg. Volume 68,106 Shares O/S 17.6M Market Cap $466M Cash $43.8M OCF Year - to - Date $6.3M 2013 2014 2015 2016E Revenue $125.1 $143.9 $138.2 $185 - $190 EPS – GAAP $0.86 $1.55 $(0.71)** $0.70 - $0.80 EPS – Non - GAAP* $1.07 $1.55 $1.17** $2.18 - $2.28 *Excludes the impact of certain items and the related tax effects, including stock - based compensation costs, amortization of int angible assets, change in fair value of contingent consideration, impairment of intangibles, acquisition and integration costs, restructuring and reali gnm ent costs, and certain legal costs, as applicable. The Company’s 2013 tax rates were subject to significant volatility while management worked to address a t hree year cumulative tax loss situation in the U.S. For Non - GAAP purposes, the Company is utilizing a normalized rate of 30% in 2016, 2015, 2014 and 2013 **Includes $4.6 million in revenue, $6.8 million operating expenses and $0.9 million in cost of goods sold from iBiquity 2015A 2016E $138M $185M - $190M Revenue 2015A vs. 2016E DTS, INC. 6/30/16 SNAPSHOT Intro Home Mobile Auto Outlook

Information on this slide is confidential property of DTS. Any unauthorized copying is strictly prohibited. © 2016 DTS, Inc. 4 DTS OVERVIEW Leading Global Audio Solutions Provider ▪ Brand recognized for high quality and innovation ▪ IP licensing model: high margin, low capex, diversified revenue streams ▪ Solid and increasing operating cash flows ▪ Highly defensible intellectual property portfolio, ~600 issued U.S. patents ▪ More than 1/3 of revenue driven by automotive, a sustainable and predictable growth market ▪ Multiple growth opportunities, including increased penetration in home, mobile, and auto ▪ Additional upside with hybrid radio , pre - processing and data services opportunities ▪ Commitment to long - term shareholder value creation $125M $144M $138M 2013 2014 2015 2016 $28M $39M $32M $61M (E) 2013 2014 2015 2016 FY Revenue FY *Non - GAAP Operating Income Intro Home Mobile Auto Results *Non - GAAP reconciliations can be found in appendix B of the presentation and the appendix of the earnings release dated 3/17/14 , 3/2/15, 3/2/16, 5/9/16 and 8/8/16 $187.5M (E)

Information on this slide is confidential property of DTS. Any unauthorized copying is strictly prohibited. © 2016 DTS, Inc. 5 Intro Home Mobile Auto Results ENTERTAINMENT EVOLUTION The Shift Towards IoT Convenience Capability

Information on this slide is confidential property of DTS. Any unauthorized copying is strictly prohibited. © 2016 DTS, Inc. 6 THE TREND TOWARDS HIGH QUALITY ENTERTAINMENT Companies and consumers recognize the importance of premium entertainment • Momentum is building around high - resolution video and audio is next • Immersive audio gaining traction in both cinema and home theaters • OEMs have begun to market sound quality as a way to differentiate products • Consumers in China have downloaded billions of songs via premium services Evolution of Content The ‘Sound Matters’ Effect Intro Home Mobile Auto Results
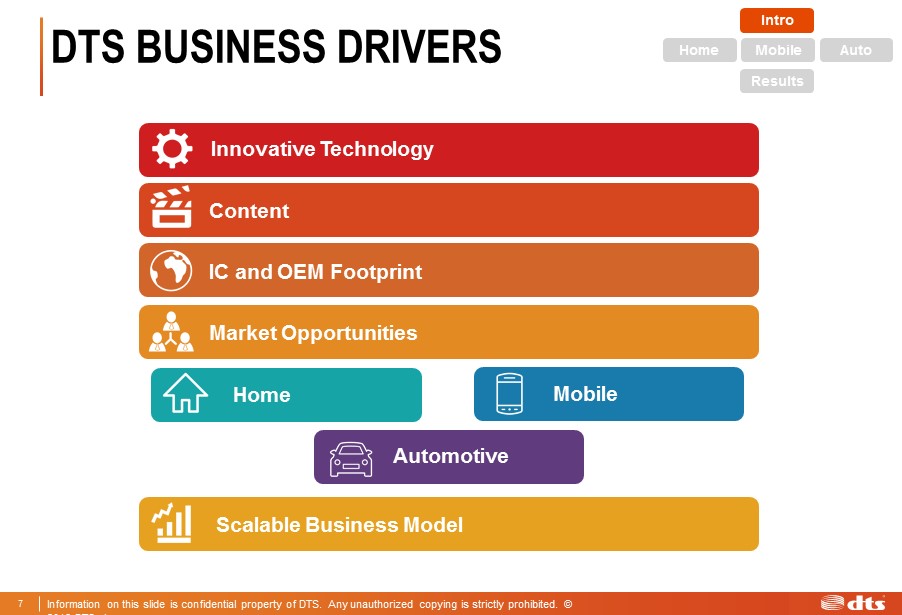
Information on this slide is confidential property of DTS. Any unauthorized copying is strictly prohibited. © 2016 DTS, Inc. 7 Innovative Technology IC and OEM Footprint Market Opportunities Scalable Business Model Mobile Automotive Home Content Automotive Intro Home Mobile Auto Results DTS BUSINESS DRIVERS

Information on this slide is confidential property of DTS. Any unauthorized copying is strictly prohibited. © 2016 DTS, Inc. 8 Non - DTS Encoded Content DTS Content Non - DTS Enabled Products DTS Enabled Products Content Drives OEM Demand OEM Footprint Pulls New DTS Content New DTS Content New Licensees/ Models Intro Home Mobile Auto Results Innovative Tech DRIVING ECOSYSTEMS AT DTS Innovative Technology Accelerates Content and Licensee Adoption

Information on this slide is confidential property of DTS. Any unauthorized copying is strictly prohibited. © 2016 DTS, Inc. 9 Growing IP Portfolio Notes: 1. Chart represents issued patents 2. As of May 2016, DTS has 306 patents pending INNOVATIVE TECHNOLOGY • Team includes PhDs recognized as leaders in audio technology 174 184 218 374 431 502 606 2009 2010 2011 2012 2013 2014 2015 Acquired SRS Labs in 2012 Acquired iBiquity in 2015 World Class Audio Engineering Team • Hundreds of patents protecting unique and innovative audio technologies Wireless Audio Digital Radio Codec and Audio Processing Delivering End - to - End Solutions Intro Home Mobile Auto Results

Information on this slide is confidential property of DTS. Any unauthorized copying is strictly prohibited. © 2016 DTS, Inc. 10 CONTENT Studios DTS Tools Intro Home Mobile Auto DTS Licensed Products Cinema/Streaming/Broadcast Results

Information on this slide is confidential property of DTS. Any unauthorized copying is strictly prohibited. © 2016 DTS, Inc. 11 IC AND OEM FOOTPRINT DTS Licenses to all Major CE OEMs DTS IP is Deployed on all Major ICs Intro Home Mobile Auto Results

Information on this slide is confidential property of DTS. Any unauthorized copying is strictly prohibited. © 2016 DTS, Inc. 12 Automotive Home Mobile TVs Blu - ray stand alone players AVRs Soundbars Wireless speakers Game consoles Set - top - boxes Smartphones Tablets PCs Gaming headsets Auto - head units Broadcast infrastructure MARKET OPPORTUNITIES Today DTS is Integrated in More Than 2B Units Worldwide Intro Home Mobile Auto Results TAM = ~290M units TAM = ~2B units TAM = ~100M units *TAM: Total addressable market

Information on this slide is confidential property of DTS. Any unauthorized copying is strictly prohibited. © 2016 DTS, Inc. 13 Expansion of Play - Fi Ecosystem Play - Fi modules drive higher revenue Play - Fi on more devices (AVRs, Set - top - boxes) DTS:X/ Headphone:X enable advanced functionality ASP Expansion Licensed Units Q2 2016 Highlights • Play - Fi products from McIntosh launched at retail this quarter • Warcraft, Secret Life of Pets, Now you See Me 2, Skiptrace , League of Gods released in DTS:X in theaters • Partnership formed with Paramount Home Media Distribution Target Opp. Advanced Processing TVs/ Soundbars Intro Home Mobile Auto Results TAM = ~40M units Targeting ~10% penetration TAM = ~250M units Targeting ~60% penetration Broader implementation across lower priced devices TAM 2015A 2020E $110M - $120M $90M Target Opportunity 2016E – 2020E TVs, Wireless Speakers, Soundbars , Consoles, Blu - ray, etc. HOME

Information on this slide is confidential property of DTS. Any unauthorized copying is strictly prohibited. © 2016 DTS, Inc. 14 2015A 2020E $60M - $70M $20M Target Opportunity 2016E – 2020E • 14 ASUS phones and tablets released with Headphone:X • Momentum building in gaming accessories with partners including: o Turtlebeach , Logitech, SteelSeries, Madcatz Phones, Tablets, Accessories and PCs MOBILE *JP Morgan Research 4/12/16 Intro Home Mobile Auto Results Q2 2016 Highlights Increasing Penetration in Large Market End - to - end audio solutions offer higher value DTS - enabled content drives demand Headphone:X for VR adds key functionality ASP Expansion Licensed Units Target Opp. Virtual Reality Products TAM = ~2B units Targeting ~25% penetration TAM = ~13M VR capable PCs and ~48M mobile phones* Growth in VR drives demand for mobile products TAM

Information on this slide is confidential property of DTS. Any unauthorized copying is strictly prohibited. © 2016 DTS, Inc. 15 • Neural launched in the Honda Civic, “2016 North American Car of the Year “ • Penetration of HD Radio in new cars sold in the U.S. continued to increase • Expanded broadcaster footprint in Canada – adding Rogers Radio Stations in Toronto and Vancouver 2015A 2020E $100M - $110M $20M* Target Opportunity 2016E – 2020E Auto Head Units AUTOMOTIVE Intro Home Mobile Auto Results Q2 2016 Highlights DTS portfolio adds increased functionality Value - added services Continued design wins DTS portfolio adds increased functionality Value - added services ASP Expansion Licensed Units Target Opp. TAM = ~17M units Targeting ~60% penetration TAM = ROW ~80M units CAN, MEX ~3M units Expand into Canada, Mexico and beyond TAM Expand U.S. Penetration Geographic Expansion & Hybrid Radio *includes only one partial quarter of HD Radio revenue

Information on this slide is confidential property of DTS. Any unauthorized copying is strictly prohibited. © 2016 DTS, Inc. 16 2020E Non - GAAP* Financial Targets Revenue $270M - $300M Operating Margin 40% - 45% EPS** $4.50 - $5.85 Attractive Effective Tax Rate (20 - 25%) Minimal Capex Requirements Operating Cash Flow $100M+ SCALABLE MODEL Intro Home Mobile Auto Results *Non - GAAP reconciliations can be found at the end of this presentation. **Assumes static share count of 18M, but note that share count is likely to change over time

Information on this slide is confidential property of DTS. Any unauthorized copying is strictly prohibited. © 2016 DTS, Inc. 17 Revenue Operating Income Operating Margin EPS Intro Home Mobile Auto FY 2016E FY 2015A YoY Change $185M - $190M $138.2M 34% - 37% $56M - $67M $32.5M 72% - 106% 30% - 35% 23% 30% - 52% $2.18 - $2.28 $1.17 86% - 95% Q2 2016 Q2 2015 YoY Change $48.7M $34.4M 41% $18.5M $9.3M 99% 38% 27% 41% $0.67 $0.34 97% Annual Quarterly FINANCIAL RESULTS 2016 Non - GAAP* Results and Revised Outlook Results *Non - GAAP reconciliations can be found in appendix B of the presentation and the appendix of the earnings release dated 8/9/15, 3/2/16 and 8/8/16

Information on this slide is confidential property of DTS. Any unauthorized copying is strictly prohibited. © 2016 DTS, Inc. 18 Intro Home Mobile Auto CAPITAL ALLOCATION Disciplined Approach Focused on Optimizing Shareholder Value Solid Balance Sheet • Cash + Investments as of 6/30/16: $43.8M • Total debt as of 6/30/16: ~$139M x Began payments under existing line in Q1 / ~$5.5M per quarter x Additional payment made in Q2 of $10M Optimal Use of Capital • Focus on returning value to shareholders x First quarterly cash dividend starting at $0.02/share x Buybacks to date: $173M / 7M shares x 2 million share buyback program announced March 2014 x 1,025,800 shares remaining as of June 2016 • Disciplined M&A approach • Maintaining cash for operating and strategic needs and returning value to shareholders Results

Information on this slide is confidential property of DTS. Any unauthorized copying is strictly prohibited. © 2016 DTS, Inc. 19 $45M $75M $107M $122M $147M $154M $173M $30M $32M $15M $25M $7M $19M FY2007 - FY2009 FY2010 FY2011 FY2012 FY2013 FY2014 FY2015 Cumulative Cash Returned Share Buyback *In 2012, DTS used 2,307,139 treasury shares for consideration for the acquisition of SRS Intro Home Mobile Auto * CAPITAL ALLOCATION Returning Value to Shareholders Results

Information on this slide is confidential property of DTS. Any unauthorized copying is strictly prohibited. © 2016 DTS, Inc. 20 DTS SUMMARY ▪ Brand recognized for high quality and innovation ▪ High margin IP licensing model has multiple revenue sources and low capex, projected to generate solid and growing operating cash flows ▪ Strong, highly defensible intellectual property portfolio with ~600 U.S. patents ▪ More than 1/3 of the business is automotive - sustained and predictable growth, driven by relationships with every major automaker serving the U.S. market ▪ Multiple growth opportunities, including increased penetration in home, mobile, and auto ▪ Additional opportunities with hybrid radio , pre - processing and data services ▪ Commitment to long - term shareholder value creation and responsibly returning capital to shareholders
Information on this slide is confidential property of DTS. Any unauthorized copying is strictly prohibited. © 2016 DTS, Inc. 21 DTS INVESTOR PRESENTATION Q2 2016

Information on this slide is confidential property of DTS. Any unauthorized copying is strictly prohibited. © 2016 DTS, Inc. 22 APPENDIX A Non-GAAP Financial Targets The following tables show the Company's fiscal year 2020 GAAP guidance reconciled to non-GAAP financial targets. Low High Operating income as a % of revenue: GAAP operating income as a % of revenue 28% 34% Amortization of intangible assets 6% 5% Stock-based compensation 6% 6% Non-GAAP operating income as a % of revenue 40% 45% Net income per diluted share: GAAP net income per diluted share 3.12$ 4.47$ Amortization of intangible assets 0.84 0.84 Stock-based compensation 0.94 0.94 Adjustment for income taxes (0.40) (0.40) Non-GAAP net income per diluted share 4.50$ 5.85$ Weighted average shares used to compute non-GAAP net income per diluted share (millions) 18.0 18.0 Fiscal Year 2020 *Provided on earnings call dated 5/9/16

Information on this slide is confidential property of DTS. Any unauthorized copying is strictly prohibited. © 2016 DTS, Inc. 23 APPENDIX B *Provided on earnings call dated 8/8/16 The following tables show the Company's fiscal year 2016 GAAP guidance reconciled to non-GAAP financial targets. Low High Operating income as a % of revenue: GAAP operating income as a % of revenue 10% 15% Amortization of intangible assets 13% 13% Stock-based compensation 7% 7% Non-GAAP operating income as a % of revenue 30% 35% Net income per diluted share: GAAP net income per diluted share 0.70$ 0.80$ Amortization of intangible assets 1.25 1.33 Stock-based compensation 0.73 0.78 Adjustment for income taxes (0.50) (0.63) Non-GAAP net income per diluted share 2.18$ 2.28$ Weighted average shares used to compute non-GAAP net income per diluted share (millions) 18.0 18.0 Fiscal Year 2016 Non-GAAP Financial Targets