Attached files
| file | filename |
|---|---|
| EX-23.1 - EX-23.1 - DTS, INC. | a2202268zex-23_1.htm |
| EX-31.2 - EX-31.2 - DTS, INC. | a2202268zex-31_2.htm |
| EX-32.1 - EX-32.1 - DTS, INC. | a2202268zex-32_1.htm |
| EX-21.1 - EX-21.1 - DTS, INC. | a2202268zex-21_1.htm |
| EX-32.2 - EX-32.2 - DTS, INC. | a2202268zex-32_2.htm |
| EX-31.1 - EX-31.1 - DTS, INC. | a2202268zex-31_1.htm |
UNITED STATES
SECURITIES AND EXCHANGE COMMISSION
Washington, D.C. 20549
FORM 10-K
ý |
ANNUAL REPORT PURSUANT TO SECTION 13 OR 15(d) OF THE SECURITIES EXCHANGE ACT OF 1934 |
|
For the fiscal year ended December 31, 2010 |
||
OR |
||
o |
TRANSITION REPORT PURSUANT TO SECTION 13 OR 15(d) OF THE SECURITIES EXCHANGE ACT OF 1934 |
|
For the transition period from to |
||
Commission File Number 000-50335

DTS, Inc.
(Exact name of Registrant as specified in its charter)
| Delaware (State or Other Jurisdiction of Incorporation or Organization) |
77-0467655 (I.R.S. Employer Identification Number) |
5220 Las Virgenes Road
Calabasas, California 91302
(Address, including zip code, of Registrant's principal executive offices)
Registrant's telephone number, including area code: (818) 436-1000
Securities registered pursuant to Section 12(b) of the Act:
| Title of each class | Name of each exchange on which registered | |
|---|---|---|
| Common Stock, $0.0001 par value | NASDAQ Stock Market LLC |
Securities
registered pursuant to Section 12(g) of the Act:
None
Indicate by check mark if the registrant is a well-known seasoned issuer, as defined in Rule 405 of the Securities Act. Yes o No ý
Indicate by check mark if the registrant is not required to file reports pursuant to Section 13 or Section 15(d) of the Act. Yes o No ý
Indicate by check mark whether the registrant (1) has filed all reports required to be filed by Section 13 or 15(d) of the Securities Exchange Act of 1934 during the preceding 12 months (or for such shorter period that the registrant was required to file such reports), and (2) has been subject to such filing requirements for the past 90 days. Yes ý No o
Indicate by check mark whether the registrant has submitted electronically and posted on its corporate Web site, if any, every Interactive Data File required to be submitted and posted pursuant to Rule 405 of Regulation S-T (§232.405 of this chapter) during the preceding 12 months (or for such shorter period that the registrant was required to submit and post such files). Yes o No o
Indicate by check mark if disclosure of delinquent filers pursuant to Item 405 of Regulation S-K is not contained herein, and will not be contained, to the best of registrant's knowledge, in definitive proxy or information statements incorporated by reference in Part III of this Form 10-K or any amendment to this Form 10-K. ý
Indicate by check mark whether the registrant is a large accelerated filer, an accelerated filer, a non-accelerated filer, or a smaller reporting company. See the definitions of "large accelerated filer," "accelerated filer," and "smaller reporting company" in Rule 12b-2 of the Exchange Act. (Check one):
| Large accelerated filer o | Accelerated filer ý | Non-accelerated filer o (Do not check if a smaller reporting company) |
Smaller reporting company o |
Indicate by check mark whether the registrant is a shell company (as defined in Rule 12b-2 of the Exchange Act). Yes o No ý
The aggregate market value of the voting and non-voting common equity held by non-affiliates of the registrant, as of June 30, 2010 was approximately $556,787,461 (based upon the closing price for shares of the registrant's Common Stock as reported by the NASDAQ Stock Market LLC for that date). Shares of Common Stock held by each officer and director have been excluded as such persons may be deemed affiliates. Exclusion of shares held by any person should not be construed to indicate that such person possesses the power, direct or indirect, to direct or cause the direction of management or policies of the registrant, or that such person is controlled by or under common control with the registrant.
As of February 25, 2011, 17,337,978 shares of common stock were outstanding.
DOCUMENTS INCORPORATED BY REFERENCE
The information required by Part III of this Report, to the extent not set forth herein, is incorporated herein by reference to the registrant's proxy statement relating to the annual meeting of stockholders to be held on or about May 12, 2011.
DTS, INC.
FORM 10-K
For the Fiscal Year Ended December 31, 2010
INDEX
This Annual Report on Form 10-K (including, but not limited to, the section titled "Management's Discussion and Analysis of Financial Condition and Results of Operations") and the documents incorporated herein by reference contain forward-looking statements within the meaning of Section 27A of the Securities Act of 1933, as amended, and Section 21E of the Securities Exchange Act of 1934, as amended. Words such as "believes," "anticipates," "estimates," "expects," "projections," "may," "potential," "plan," "continue" and similar expressions are intended to identify forward-looking statements, but are not the exclusive means of identifying forward-looking statements in this report. All statements, other than statements of historical fact, are statements that could be deemed forward-looking statements, including, but not limited to, statements regarding our future financial performance or position, our business strategy, plans or expectations, and our objectives for future operations, including relating to our products and services. Although forward-looking statements in this report reflect our good faith judgment, such statements can only be based on facts and factors currently known by us. Consequently, forward-looking statements contained herein are inherently subject to risks and uncertainties and our actual results and outcomes may be materially different from those expressed or implied by the forward-looking statements. Factors that could cause or contribute to such differences in results and outcomes include, without limitation, those discussed under the "Risk Factors" section contained in Item 1A below, and elsewhere in this report and in other documents we file with the Securities and Exchange Commission, or SEC. We cannot guarantee future results, levels of activity, performance or achievements. Readers are urged not to place undue reliance on these forward-looking statements, which speak only as of the date of this report. We do not undertake any obligation to revise or update these forward-looking statements to reflect future events or circumstances.
Company Overview
We are a leading provider of high-quality branded entertainment technologies, which are incorporated into an array of entertainment products by hundreds of licensee customers around the world. Our audio technologies enable the delivery and playback of clear, compelling high-definition and is currently used in a variety of product applications, including audio/video receivers, Blu-ray Disc players, DVD based products, personal computers or PCs, car audio products, video game consoles, network capable televisions, digital media players or DMPs, set-top-boxes or STBs, mobile phones and home theater systems. In addition, we provide products and services to motion picture studios, radio and television broadcasters, game developers and other content creators to facilitate the inclusion of compelling, realistic DTS-encoded soundtracks in movies, sporting events, television shows and music content. We also provide a suite of audio processing technologies designed to enhance the entertainment experience from products subject to physical limitations, such as TVs, PCs and smartphones.
The quality of our technology offerings, coupled with our reputation for delivering high-quality entertainment experiences to consumers, led the consumer electronics industry to mandate the use of DTS technology in all Blu-ray Disc players. We believe our mandatory position in this standard provides a significant growth driver for us over the next several years. Our goal is to become an essential ingredient in high-quality entertainment experiences by enabling the creation of compelling content and by incorporating our technology into every device that plays back, controls or delivers high-quality digital entertainment.
We were founded in 1990 and received a key strategic investment in 1993 from a variety of investors, including Universal City Studios, Inc. The first DTS audio soundtrack was created for the release of Steven Spielberg's Jurassic Park in 1993. From this initial release, we established a technical and marketing platform for the development of entertainment technology solutions for the motion
1
picture, home theater, and other consumer markets. In 1996, we launched our consumer technology licensing business, in which we license our technology to consumer electronics and other product manufacturers. To date, we have entered into licensing agreements with substantially all of the world's major consumer electronics manufacturers. We also license our technology to many major semiconductor manufacturers. Our technology, trademarks, copyrights and know-how have been incorporated in hundreds of millions of consumer electronics products worldwide.
The significant growth of our consumer technology licensing business, coupled with our mandatory position in the Blu-ray Disc standard, led us to decide in February 2007 to exit our cinema and digital image processing businesses. These businesses were sold in two separate transactions during the second quarter of 2008 and were classified as Assets of Discontinued Operations Held For Sale on our consolidated balance sheets and as Discontinued Operations on our consolidated statements of income for all periods presented. Except as otherwise noted, information herein is presented for the consumer business or continuing operations only.
On December 31, 2008, we entered into an Asset Purchase Agreement with Neural Audio Corporation, or Neural, and its stockholders providing for the sale to us of substantially all of Neural's assets and certain liabilities. The acquired business expands our branded technology offerings further into the creation, distribution and playback of music, and broadcast programming, for the home A/V, automotive and video game markets.
We develop, market, license and sell our proprietary technology, copyrights, trademarks and services for the following consumer markets:
- •
- Home theater and consumer electronics devices, such as audio/video receivers,
home-theater-in-a-box systems, Blu-ray Disc and DVD players;
- •
- Home media network devices such as digital media players/adapters and network-enabled televisions;
- •
- Game consoles such as Sony's PlayStation 3, or PS3, which has an internal Blu-ray Disc drive;
- •
- Home digital broadcast receivers such as set-top boxes;
- •
- Personal media devices, such as mobile phones, other portable media devices;
- •
- Personal computers, including software applications, PC-based hardware products for home theaters, some of
which may use Blu-ray Disc drives;
- •
- Car audio/video devices such as in-car infotainment systems (in dash audio, video and navigation);
- •
- Audio signal processing software solutions for satellite digital audio radio services;
- •
- Professional audio products for encoding and decoding digital multi-channel content in our proprietary format; and
- •
- Audio encoding and enhancement tools for live sports broadcasting in North America.
Industry Background
Movie soundtracks were originally presented in mono, or one-channel, audio. In the mid-1970s, stereo was introduced. Stereo consists of two channels and presents sound through discrete left and right speakers. Stereo was followed by matrix technology that allowed an inexpensive two-track system to bring better sound to a large number of movie theaters. However, matrix technology allows only limited audio quality enhancement and channel separation over stereo. In the early 1990s, the listening experience of cinema audiences was significantly enhanced through the introduction of digital multi-channel audio technology.
2
Over the past 20 years, the entertainment industry has shifted to take advantage of many technical trends and innovations including:
- •
- the transition from analog to digital content;
- •
- the transition from standard definition to high-definition content;
- •
- advancements in digital coding;
- •
- new modes of transmission and significant increases in bandwidth;
- •
- large increases in computing power and storage with corresponding reductions in cost;
- •
- growth in broadband speed and subscriber base;
- •
- an increase in the types of devices for content playback with matching reductions in cost; and
- •
- the convergence of features and content into devices to create new ways of consuming digital entertainment content.
These trends and innovations helped create a technical foundation for the widespread adoption of digital multi-channel audio and high-definition video for many forms of entertainment.
Proliferation of Home Theater Systems
Home theater systems generally consist of a display, a Blu-ray Disc or DVD player, a digital multi-channel audio/video receiver with full separation in five discrete channels: left, center, right, left surround, right surround, plus a channel dedicated to low frequency effects known as a subwoofer. Home-theater-in-a-box systems contain one each of these elements, with the exception of the display, and are a popular offering to consumers as an all-in-one home theater package for ease of use and installation.
Consumer demand for digital multi-channel capable home theater systems has been fueled by:
- •
- the digital multi-channel audio experience in movie theaters;
- •
- the widespread availability of Blu-ray Discs and DVD with digital multi-channel soundtracks;
- •
- the rapid expansion and availability of Blu-ray Disc movies and music released with
high-definition multi-channel soundtracks;
- •
- the proliferation of high-definition cable and satellite channels with digital multi-channel audio;
- •
- the wide availability of digital multi-channel audio in advanced game consoles;
- •
- the growth of high-definition flat panel displays or televisions;
- •
- the growth of high-definition content streaming services;
- •
- the growth in portable media devices with high-quality content with digital multi-channel audio; and
- •
- declining prices for digital displays, Blu-ray Disc and DVD players, advanced game consoles, high-definition audio/video receivers, and home-theater-in-a-box systems.
Proliferation of Blu-ray Disc Systems
Blu-ray Disc players, including set-top-box stand-alone players and game consoles, are a significant driver of our revenues and future growth. Based on information from the Digital Entertainment Group, or DEG, and other data, we estimate that over 75 million Blu-ray devices, including stand-alone players and game consoles, have been sold worldwide since their launch in November 2006. In the U.S. alone,
3
Blu-ray household penetration has reached 24% in 2010, up from 15% in 2009. According to NPD, a market research company, Blu-ray players set sales records in the U.S. during the 2010 Black Friday weekend period, up more than 50% from the same period in 2009. Almost all Blu-ray players are now network-enabled and a number of models are Wi-Fi embedded and 3D-capable. According to NPD, Profile 2.0 BD Live network compliant Blu-ray players in the United States have grown in volume from 13% of units sold in 2008 to 98% in 2010. In a recent study by Parks Associates, a market research company, one-fifth (20%) of broadband households indicated their Blu-ray player was their means of delivering internet video to the TV. At retail, Blu-ray players are now mainstream and competitively priced for mass market accessibility.
In comparing Blu-ray to DVD, the build-up is consistent. During the first five years, the Blu-ray adoption curve is consistent with that of DVD, with both reaching 30 million households by year five. In fact, we estimate that worldwide Blu-ray annual unit shipments will eclipse DVD within three years. Aiding in the growth and adoption of Blu-ray is the decreasing cost of Blu-ray movies relative to DVD movies. According to Screen Digest, in 2008, the average price for a Blu-ray and DVD movie was $28 and $14, respectively, and in 2011, the average price for a Blu-ray and DVD movie is $20 and $12, respectively.
Blu-ray Disc annual sales in the U.S. have now reached $2.3 billion dollars, representing 12% of overall home entertainment sales, an increase of 40% compared to the previous year. Year-end numbers for 2010 show that Blu-ray movie sales grew by 75% with 170 million sold to consumers. There are now more than 3,500 unique Blu-ray titles available in the U.S. market. According to Blu-ray.com, over two thousand of the Blu-ray releases in North America include a DTS-HD Master Audio soundtrack. In fact, according to Nielsen, a market research company, 85% of the top 100 Blu-ray titles sold in 2010 were encoded with DTS-HD Master Audio.
Emergence of Robust New Markets for High-Quality Branded Entertainment Technologies
Digital multi-channel sound is further extending into a growing number of consumer electronics environments, including homes, cars, personal computers, video game consoles, mobile phones, portable media devices, digital media players, and various forms of broadcast television products. Content providers in the film, television, music and video game markets have recognized that a substantial market opportunity exists for digital multi-channel audio entertainment content.
Car audio, personal computer, and video game console manufacturers are increasingly incorporating digital multi-channel audio capability into their products. Virtual surround sound technology is also beginning to be incorporated into portable media playback devices, such as mobile phones and laptop PCs, which allows listeners to enjoy a simulated surround sound experience using two speakers or headphones. These markets represent significant growth opportunities as content providers and consumers become more familiar with the capability of digital multi-channel audio to enhance the entertainment experience.
Home networks, internet-based content, and digital broadcast products/markets will also represent significant future opportunities for deployment of our technologies and the delivery of high-definition entertainment. Target markets include broadcast hardware, high-definition set-top boxes, televisions, and network-enabled media devices.
With a regulatory demand for broadcasters to adopt digital distribution around the globe, we see increasing demand for our broadcast technology solutions that allow operators to simultaneously interoperate and distribute audio on multiple media formats. Furthermore, the proliferation of digital media distribution creates new demand for playback enhancement technologies for televisions, PCs, mobile phones and portable media players alike.
4
Shift to Network and Cloud-Based Content
Movie and music content for the last 15 years has been primarily purchased and consumed via optical media, such as Blu-ray, DVD, and CD. Today, these are still the dominant way consumers purchase and watch or listen to their favorite content. With the growth of the internet and home computer usage over the last ten years, a shift to home network and cloud-based content acquisition has occurred, including the recent trend to full movie download and streaming services becoming mainstream.
Responding to consumer demand, consumer electronics beyond the traditional PC have added networking features to support the shift to cloud-based content. This adoption of network support in mainstream consumer electronics products (Blu-ray players, TVs, game consoles, mobile phones, etc.) has facilitated the consumer demand to be able to use content in multiple formats, on multiple devices, and in multiple locations. This requirement for broad content portability and support opens up many large, new markets to new media formats, such as digital multi-channel audio, that had not been previously supported. The fundamental structure of the content ecosystem has changed to a focus on portability and ease-of-use and this has substantially expanded the demand for digital media format technologies, such as those provided by DTS.
As part of the home theater evolution, the increase of on-line video content has driven growth in network-enabled devices. Internet-enabled televisions and Blu-ray players bring internet content and services to a variety of consumer electronic devices. Along with numerous high-definition televisions, or HDTV, features, internet-connected TVs will offer consumers a variety of content options at increasingly affordable prices. While reaching nearly 20% today, it is anticipated by 2014 that nearly half of digital displays shipped in 2014 will feature internet connectivity.
DTS Technology Markets, Products and Services
We provide technology that enables distribution of high-quality sound and audio processing for the following key markets: home AV, automotive, personal computer, broadcast, mobile electronics, professional content and other emerging consumer electronics markets. Importantly, DTS technology was selected by the consumer electronics industry as a mandatory audio format in the Blu-ray Disc optical media format. As a result, DTS decoding technology will be utilized, in at least two-channel form, in any product that incorporates a Blu-ray Disc disc drive. To date, our audio technologies have been embedded in hundreds of millions audio/video devices.
- •
- Home AV. The Home AV market includes audio-video
receivers, standalone Blu-ray disc and DVD players including PS3, televisions, and other network-connected playback devices such as DMPs, that facilitate the home theater experience. This
market represents our largest penetration into the consumer electronics industry, and it continues to present opportunities for continued growth. For example, our 2010 partnership with Samsung is one
of many customer partnerships that have entered us into the network-connected television market. This is one example of an area of the Home AV market that presents growth opportunities for our
high-quality sound compression and audio processing technologies.
- •
- Automotive. The automotive market is comprised of in-car infotainment and navigation systems. While this market saw a sharp decrease in overall vehicle sales in 2009, it has recovered quickly, and we are seeing a robust recovery as consumers once again consider purchasing new automobiles with in-car infotainment and navigation systems. As the trend to home and personal network-connected entertainment devices transitions into the automotive market, there is opportunity for us to benefit from the increase in demand beyond disc-based automotive entertainment systems.
Key Markets
5
- •
- PC. Consumers are increasingly using PCs as media hubs and
demand for Blu-ray Disc drives increase. For example, DTS technology is found in all major Blu-ray disc software. Further, our partnership with Intel brings our multi-channel
surround sound and audio processing technologies to PC vendors, such as Onkyo, in the form of a hardware and software combination.
- •
- Broadcast. The broadcast market is generally comprised of
broadcast hardware and set-top boxes, which bring digital and high-definition broadcasts into households. We are actively working with broadcasters, international standards
organizations and set-top manufacturers to expand the penetration of our technology into this market in order to meet the increasing demand for high-quality audio delivery. An
example is our 2010 announcement of a partnership with France Telecom's Orange to create the first top-tier IPTV operator with a high-definition media platform transmitting
audio with DTS audio format technologies.
- •
- Mobile Electronics. The mobile phone market is the largest
single consumer electronics device market in the world, in terms of volume. We are currently focused on the high-value smart-phone sub-segment of the mobile phone market. Also
included within this market are other portable electronics, such as portable media players or PMPs and tablets. Our 2010 partnership with Pantech resulted in the introduction of the first smartphone
and PMP products with a DTS decoder to the market. Further, audio processing technologies represent an attractive opportunity in this market, as the physical limitations of small-size and
speaker location can only be overcome through application of advanced audio solutions.
- •
- Professional Content. The professional content market consists primarily of motion picture studios, post production houses and authoring facilities that need customer centric service and tools. The availability of DTS formatted content drives consumer demand for the electronics that contain DTS technologies for playback. For example, in North America all major motion picture studios are now using DTS-HD Master Audio Suite, which has resulted in us securing the primary audio tracks in the majority of Blu-ray titles.
The DTS Solutions
We provide a range of audio technologies focused around the reproduction and enhancement of high-quality audio. The company launched its surround sound format technology for the consumer market in 1996 and has continued to develop technology, providing solutions for Blu-ray, DVD, broadcast, and digital media delivery. In 2008, we expanded our offering by moving into the audio processing market to provide technology and solutions for enhancing audio playback in a wide variety of devices and environments. Today, we have a complete range of audio playback solutions for media and consumer electronics providers, and we continue to expand through on-going research and development, as well as business and technology acquisitions.
DTS Formats
In 1996, we introduced our Coherent Acoustics technology to bring advanced digital audio entertainment to the home. Coherent Acoustics is an audio compression/decompression algorithm, or codec, that is designed to capture, store, and reproduce audio signals. There are several technical considerations involved in this process, including the frequency of data sampling, the word length, and the bit rate. These factors affect the quality of audio presentation and are commonly managed through compression techniques.
A fundamental challenge with digital audio distribution is that capturing analog signal representations in digital form requires a tremendous amount of data. Therefore, the storage and subsequent transmission of that data presents physical space, efficiency, and economic challenges. We address these challenges by developing coding algorithms and products that reduce the amount of data
6
required to store, transmit and reproduce the audio, all while maintaining the quality of the audio experience.
The design, architecture, and implementation of our coding solution is complex. Signal coding requires a thorough and combined understanding of the disciplines of electrical engineering, computer science, and psychoacoustics, coupled with significant practical experience. One of our key technical strengths has been our ability to develop a system that enables the transparent reproduction of an original audio signal, meaning that the reproduction sounds indistinguishable from its source.
We have designed the following attributes into the basic architecture of our technology:
- •
- scalable, meaning that parameters such as data rate can be set over a very
wide range, as applications require;
- •
- extensible, meaning that the structure itself accommodates additional data
for enhancements both anticipated and unknown; and
- •
- backward compatible, meaning that extensions and enhancements do not preclude the ability of earlier decoders to play the core signal.
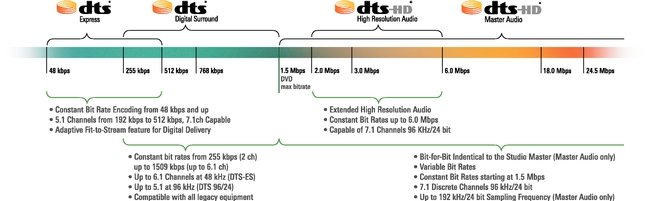
DTS Digital Surround. DTS Digital Surround was the first product based on the Coherent Acoustics technology specification and was the first implementation of the core outlined above. As the core of the Coherent Acoustics technology specification, DTS Digital Surround supports up to 5.1 channels of audio at up to 48kHz sampling rate and up to 1.5Mbps bit rate. From a content perspective, DTS Digital Surround is an optional format in the DVD standard. Utilizing the core + extension architecture of Coherent Acoustics, we expanded on the DTS Digital Surround offering to support 6.1 channels which adds a center back channel for added realism for discrete 6.1 surround sound on DVD. We also developed the only extended definition format for DVD that adds higher sampling rates (96 kHz) and greater bit resolution (24 bit) for even better sounding audio, particularly with multi-channel music.
DTS-HD. DTS-HD is the latest extension to our DTS format technology and is made up of several format profiles and a transcoder. The main profile is the latest instantiation of the Coherent Acoustics technology specification that provides scalable audio formats with constant and variable bit rates as high as 24.5 Mbps for Blu-ray Disc, higher sampling frequencies up to 192 kHz, greater bit depths, additional channels (7.1 for Blu-ray, many more for other applications), lossless audio capability and is backward compatible with all existing DTS content. The transcoder consists of a DTS encoder which re-encodes audio data to DTS Digital Surround at 1.5 Mbps, ensuring transparent backward compatibility to DTS decoders that have a Sony/Philips Digital Interconnect Format (SPDIF) input. DTS-HD Audio allows various levels of performance based on the capabilities of the home audio equipment used for playback:
7
DTS Neural Surround. DTS Neural Surround technology is an encoder/decoder technology that takes up to 7.1 channels of audio and using advanced techniques, encodes the multi-channel audio to stereo while maintaining the surround queues from the discrete digital multi-channel track. The two channel stereo audio can then be broadcast or carried on other media that is limited to stereo tracks. In the home, the DTS Neural Surround decoder then decodes the signal, up to 7.1 channels, providing a surround sound experience. DTS Neural Surround is widely deployed to enhance legacy stereo content for surround sound distribution for HDTV and is an effective method of surround audio encoding and decoding that seamlessly integrates surround sound in a stereo signal without use of a separate data stream.
Audio Processing
Since the discrete multi-channel audio experience and the use of PCs and mobile electronics have changed consumer listening habits and expectations, the consumer electronics marketplace has experienced a growing need for audio processing solutions. This has been magnified by the growth of HDTV, the use of personal computers as complete home entertainment devices, and the proliferation of higher quality portable electronics, including smartphones. We currently offer audio processing solutions that balance loudness levels between diverse multimedia sources, maximize acoustic power beyond the volume limits of products due to small size and speaker location and enhance the quality of compressed audio, improve the input and playback of speech, and connect any audio stream from the PC to a home theater system, and deliver virtual surround sound effects from two speakers or headphones.
Complete Audio Solution Sets
As we have developed more audio technologies, we now deliver complete audio solution sets to various markets. DTS Premium Suite and DTS Surround Sensation UltraPC are examples of these complete audio solution sets that are combinations of our audio format and audio processing technologies. The DTS Premium Suite is part of a cooperative marketing agreement with Intel, signed in February of 2009, for the mobile PC platform. Through this arrangement, DTS and Intel bring a compelling set of audio enhancement technologies that improve audio performance while minimizing energy consumption in mobile PCs. For example, we partnered with Onkyo to include DTS Premium Suite and with Fujitsu to include DTS Surround Sensation UltraPC into a wide range of their mobile and all-in-one PCs.
8
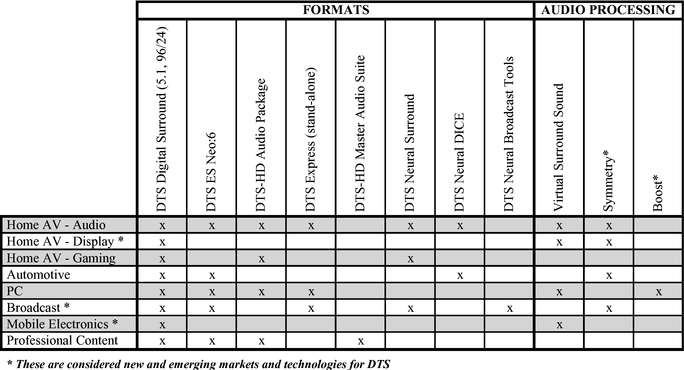
The following table summarizes how each of our proprietary technologies and products relate to the various consumer markets that we serve.
Research and Development
As demonstrated by our portfolio of industry-recognized, advanced technologies, we are centered on strong research and development abilities. We were founded with key research and development that solved customer problems with high-quality and differentiated solutions, and we continue to develop new technologies with that same goal in mind.
As the company has grown, new technologies have not only been developed internally, but also acquired from outside sources. Acquired technologies, and the talent and knowledge that created it, are key elements of our research and development base and will continue to be a source of new ideas going forward.
We have a group of 63 engineers and scientists, including 14 PhDs, focused on research and development. This group oversees our product development efforts and is responsible for implementing our technology into our existing and emerging products. We carry out research and development activities at our corporate headquarters in Calabasas, California and at our facilities in Bangor, Northern Ireland, Kirkland, Washington, Scotts Valley, California and, recently, in Singapore.
Our research and development expenses totaled approximately $12.1 million during 2010, $9.1 million during 2009 and $6.9 million during 2008. We expect that we will continue to commit significant resources to applications engineering efforts, particularly in support of our expansion across a wide variety of digital audio content and playback devices, and to research and development in the future.
9
Intellectual Property
We have developed and maintain a sizeable library of copyrighted software and other technical materials, both printed and digitized, as well as numerous trade secrets. We also have many individual patent families resulting in hundreds of individual patents and patent applications throughout the world.
As a provider of high-quality branded entertainment technologies to markets worldwide, we believe it is extremely important to protect our technology through the use of copyrights, trademarks, patents, and trade secrets in many countries. We have targeted our intellectual property coverage to provide protection in the major manufacturing and commercial markets of the world.
Our audio technologies are embodied in the form of proprietary software to which we retain the copyrights. Accordingly, copyrights are an important component of our intellectual property.
Our trademarks consist of many individual word marks, logos, and slogans registered and in use throughout the world. The marks cover our various products, technology, improvements, and features as well as the services that we provide. Our trademarks are an integral part of our licensing program and, generally, are required to be used on licensed products to identify the technology in the device, to provide greater consumer awareness and to advance the sales of the licensed products bearing the trademarks. In addition to over one hundred trademark registrations, we also have numerous trademark applications pending worldwide, with additional marks in the pre-application phase.
It is our general practice to file patent applications for our technology in the United States and various foreign countries where our customers manufacture, distribute, or sell licensed products. We actively pursue new applications to expand our patent portfolio to address new technological innovations. Most of the patents in our patent portfolio have an average life of 20 years from their date of filing. A number of our patents have expiration dates ranging from 2015 to 2027. The patents that expire sooner primarily cover the process of producing media containing DTS and digital multi-channel audio as well as the individual finished product. We have multiple patents covering unique aspects and improvements for many of our technologies. We do not believe that the expiration of any single patent is likely to significantly affect our intellectual property position or our ability to generate licensing revenues.
Governmental and Industry Standards
There are a variety of governmental and industry-related organizations that are responsible for adopting system and product standards. Standards are important in many technology-focused industries as they help to ensure compatibility across a system or series of products. Generally, standards adoption occurs on either a mandatory basis, requiring the existence of a particular technology or feature, or an optional basis, meaning that a particular technology or feature may be, but is not required to be, utilized.
We believe the market for audio and audio/video products is very standards driven and our active participation with standards organizations is important as we work to include our technology in standards or change our status from optional to mandatory, where possible. We believe our standards involvement also provides us early visibility into future opportunities.
Governmental standards are often operated by non-governmental organizations in cooperation with regional regulatory bodies. These organizations adopt standards by validating and publishing industry standards that are appropriate for various regions and technical requirements. The standards of this nature that we participate in include European Technical Standards Institute (ETSI) which is an affiliated European Standards Organization under the European Union, International Electrotechnical Commission (IEC), and the Moving Pictures Expert Group (MPEG) which is a joint working group under the IEC and International Organization of Standards (ISO).
10
The majority of standards we actively participate in are produced by industry-related organizations. These bodies adopt standards based on industry evaluations and discussions across effected constituencies finalizing with consensus voting as to the best solution around which to standardize. The industry standards we participate include the Alliance for Telecommunications Industry Solutions (ATIS), American Television Standards Committee (ATSC), Audio Engineering Society (AES), Blu-ray Disc Association (BDA), Consumer Electronics Association (CEA), Digital Entertainment Content Ecosystem (DECE), Digital Living Network Alliance (DLNA), Digital Video Broadcast (DVB), DVD Forum, The Khronos Group, Open IPTV Forum (OIPF), Society of Cable Telecommunications Engineers (SCTE), and Society for Motion Picture and Television Engineers (SMPTE).
Some standards bodies are now considering "open standards" that require all technologies included in the standard are based upon non-proprietary and intellectual-property "free" technology platforms in which no company maintains ownership over the dominant technologies. We are actively engaging these bodies to determine how we may participate and the potential impact on our business model and future go to market strategies.
We anticipate being involved in a number of other standards organizations as appropriate to facilitate the adoption and inclusion of our technology.
Branding
Since the first DTS audio soundtrack was created for the release of Steven Spielberg's Jurassic Park in 1993, content producers, electronic manufacturers, and sophisticated audio consumers have recognized the DTS trademark as a symbol of superior multi-channel audio for motion pictures and home theaters.
A core part of our business strategy is to continue to enhance and build the strength of the DTS brand by encouraging the use of our trademarks throughout the entertainment industry so that professionals and consumers alike will know that they are delivering and enjoying a high-quality entertainment experience.
We believe the strong adoption of DTS as a preferred audio format for Blu-ray and our continued technology innovation will continue to proliferate the DTS brand into expanding categories of consumer electronics and in turn grow the positive consumer affiliation with the DTS brand. To accelerate this process we work with content partners and consumer manufacturers to provide marketing programs that associate the DTS brand with exciting and engaging entertainment experience with great DTS sound.
The foundation of our marketing strategy is to build strong affinity for the DTS brand with consumers so that the DTS brand becomes a catalyst in expanding use of our existing technologies in new markets and in commercializing new technologies to existing markets.
Licensing
We have a licensing team headquartered in Limerick, Ireland that markets our technology directly to large consumer electronics product manufacturers and semiconductor manufacturers. This team also includes customer focused employees located in the United States, China, Hong Kong, Japan, the United Kingdom, South Korea and Taiwan. We believe that by locating staff near the leading consumer electronics and semiconductor manufacturers, we can enhance our sales and business development efforts.
We license our technology to consumer electronics product manufacturers primarily through a two step process. First, we license our technology to semiconductor manufacturers who typically embed our decoding software into their digital signal processor chips. In turn, these semiconductor manufacturers are required to sell DTS-enabled chips only to hardware manufacturers who have entered into
11
consumer manufacturer licenses with us. Our business model typically provides for us to receive a per-unit royalty for products produced by the consumer manufacturer licensees that contain our decoding technologies. As part of the licensing terms for both semiconductor and hardware manufacturer licensees, we typically receive fees for access to our developer kits and for our certification, prior to sale, of the quality and performance of their products. We license on a non-exclusive, worldwide basis. We require that all licensees have their integrated circuits or hardware devices certified by us prior to distribution. We reserve the right to audit their records and quality standards. Licensees are generally required to display the appropriate DTS trademark on the products they manufacture.
We market our digital sound encoding equipment directly to the content providers and audio professionals serving the consumer electronics market. We believe that allowing easy access to DTS encoders will result in more DTS content, which we believe will drive consumer demand for DTS-enabled electronic products.
Customers
Consumer Electronics Products Manufacturers
We have licensed our technologies or our trademarks to substantially all of the major consumer electronics product manufacturers for use in hundreds of consumer audio products. Collectively, these manufacturers have sold hundreds of millions of DTS-licensed consumer electronics products worldwide. Sony and Samsung accounted for 17% and 15%, respectively, of total revenues for the year ended December 31, 2010.
Semiconductor Manufacturers
We have licensed to a substantial number of the major semiconductor manufacturers the right to incorporate our technology in their semiconductors and to sell semiconductors with DTS technology to our hardware manufacturer licensees.
Content Providers
We have sold or provided encoding products to many of the leading home video and music content providers and professional audio facilities enabling them to create high-quality DTS-enabled content. To date, thousands of Blu-ray Disc and DVD titles have been produced with DTS digital multi-channel audio tracks.
Seasonality of Business
Generally, consumer electronics manufacturing activities are lowest in the first calendar quarter of each year, and increase progressively throughout the remainder of the year. The third and fourth quarters are typically the strongest in terms manufacturing output as our technology licensees increase their manufacturing output to prepare for the holiday buying season. Since recognition of revenues in our business generally lags manufacturing activity by one quarter, our revenues and earnings are generally lowest in the second quarter.
In general, the introduction and inclusion of DTS technologies in new and rapidly growing markets can have a material effect on quarterly revenues and profits, and can distort the moderate seasonality described above.
Also, from time to time, we may recognize royalty revenues that relate to licensing obligations that occurred in prior periods. These royalty recoveries may cause revenues to be higher than expected during a particular reporting period and may not occur in subsequent periods.
12
Competition
We face strong competition in the consumer electronics market and expect competition to intensify in the future. Our primary competitor is Dolby Laboratories, who develops and markets, among other things, digital multi-channel audio products and services. Dolby was founded over 40 years ago and for many years was the only significant provider of audio technologies. Dolby's long-standing market position, brand, business relationships, and inclusion in various industry standards provide it with a strong competitive position.
In addition to Dolby, we also compete in specific product markets with Fraunhofer Institut Integrierte Schaltungen, Koninklijke Philips Electronics N.V., Microsoft Corporation, Sony Corporation, Technicolor, SRS Labs and various consumer electronics product manufacturers. Many of these competitors have longer operating histories and significantly greater resources or greater name recognition than we do.
We believe that the principal competitive factors in each of our markets include some or all of the following:
- •
- technology performance, flexibility, and range of application;
- •
- quality and reliability of technologies, products and services;
- •
- brand recognition and reputation;
- •
- inclusion in industry standards;
- •
- price;
- •
- relationships with semiconductor, consumer electronics manufacturers, and content producers;
- •
- availability of compatible high-quality audio content;
- •
- timeliness and relevance of new product introductions; and
- •
- relationships and distribution network for North American broadcasters, satellite radio operators, production and post production operators providing content for digital broadcast.
We have been successful in penetrating the consumer electronics markets and building and maintaining market share. A substantial portion of Blu-ray Disc titles include DTS soundtracks. Also, many top selling and premier edition DVDs contain digital multi-channel soundtracks in our format, and a substantial majority of consumer electronics products with digital multi-channel capability incorporate our technology, trademarks, or know-how. Our success has been due in large part to our ability to position our brand as a premium offering that contains superior proprietary technology, the quality of our customer service, our inclusion in industry standards, and our industry relationships.
We believe there are significant barriers to entry in the consumer electronics products market, but we have obtained mandatory status in the Blu-ray Disc format. Also, the standards relating to DVD are well established and support a limited number of technologies including DTS Coherent Acoustics. Numerous other standards we participate in support a limited number of technologies including various DTS technologies.
Employees
As of December 31, 2010, we had 228 employees, which includes 63 employees classified on our income statement as research and development and 165 classified as selling, general and administrative. Of the 228 total employees, 150 work in the United States and 78 work in our various international locations, including 40 in Asia and 31 in Europe. None of our employees are subject to a collective bargaining agreement, and we have never experienced a work stoppage. We believe our relations with
13
our employees are good. Our future success depends on our ability to attract, motivate, and retain highly-qualified technical and management personnel. From time to time, we also employ independent contractors to support our product development, sales, marketing, business development, and information technology and administration organizations.
Website Access To SEC Filings
We maintain an Internet website at www.dts.com. We make available free of charge through our Internet website our annual report on Form 10-K, quarterly reports on Form 10-Q, current reports on Form 8-K, and amendments to those reports filed or furnished pursuant to Section 13(a) or 15(d) of the Securities Exchange Act of 1934, as amended, as soon as reasonably practicable after we electronically file such material with, or furnish it to, the SEC.
Materials we file with the SEC may be read and copied at the SEC's Public Reference Room at 100 F Street, N.E., Washington, D.C. 20549. Information on the operation of the Public Reference Room may be obtained by calling the SEC at 1-800-SEC-0330. The SEC also maintains an Internet website at www.sec.gov that contains reports, proxy and information statements, and other information regarding our Company that we file electronically with the SEC.
14
Set forth below and elsewhere in this report and in other documents we file with the SEC are risks and uncertainties that could cause our actual results to differ materially from the results contemplated by the forward-looking statements contained in this report and other public statements we make. If any of the following risks actually occurs, our business, financial condition, or results of operations could suffer. In that case, the trading price of our common stock could decline, and you may lose all or part of your investment.
Risks Related to Our Business
We may not be able to evolve our technology, products, and services or develop new technology, products, and services that are acceptable to our customers or the changing market.
The market for our technology, products, and services is characterized by:
- •
- rapid technological change;
- •
- new and improved product introductions;
- •
- changing customer demands;
- •
- evolving industry standards; and
- •
- product obsolescence.
Our future success depends on our ability to enhance our existing technology, products, and services and to develop acceptable new technology, products, and services on a timely basis. The development of enhanced and new technology, products, and services is a complex and uncertain process requiring high levels of innovation, highly-skilled engineering and development personnel, and the accurate anticipation of technological and market trends. We may not be able to identify, develop, market, or support new or enhanced technology, products, or services on a timely basis, if at all. Furthermore, our new technology, products, and services may never gain market acceptance, and we may not be able to respond effectively to evolving consumer demands, technological changes, product announcements by competitors, or emerging industry standards. Any failure to respond to these changes or concerns would likely prevent our technology, products, and services from gaining market acceptance or maintaining market share and could lead to our technology, products and services becoming obsolete.
If we fail to protect our intellectual property rights, our ability to compete could be harmed.
Protection of our intellectual property is critical to our success. Copyright, trademark, patent, and trade secret laws and confidentiality and other contractual provisions afford only limited protection and may not adequately protect our rights or permit us to gain or keep any competitive advantage. We face numerous risks in protecting our intellectual property rights, including the following:
- •
- our competitors may produce competitive products or services that do not unlawfully infringe upon our intellectual
property rights;
- •
- the laws of foreign countries may not protect our intellectual property rights to the same extent as the laws of the
United States, and mechanisms for enforcement of intellectual property rights may be inadequate in foreign countries;
- •
- we may be unable to successfully identify or prosecute unauthorized uses of our technology;
- •
- efforts to identify and prosecute unauthorized uses of our technology are time consuming, expensive, and divert resources
from the operation of our business;
- •
- our patents may be challenged, found unenforceable or invalidated by our competitors;
15
- •
- our pending patent applications may not issue, or if issued, may not provide meaningful protection for related products or
proprietary rights;
- •
- we may not be able to practice our trade secrets as a result of patent protection afforded a third-party for such product,
technique or process; and
- •
- we may not be able to prevent the unauthorized disclosure or use of our technical knowledge or other trade secrets by employees, consultants, and advisors.
As a result, our means of protecting our intellectual property rights and brands may not be adequate. Furthermore, despite our efforts, third parties may violate, or attempt to violate, our intellectual property rights. Enforcement, including infringement claims and lawsuits would likely be expensive to resolve and would require management's time and resources. In addition, we have not sought, and do not intend to seek, patent and other intellectual property protections in all foreign countries. In countries where we do not have such protection, products incorporating our technology may be lawfully produced and sold without a license.
We have limited control over existing and potential customers' and licensees' decisions to include our technology in their product offerings.
Except for Blu-ray products, where our technology is mandatory, we are dependent on our customers and licensees—including consumer electronics product manufacturers, semiconductor manufacturers, producers and distributors of content for music, videos, and games—to incorporate our technology into their products, purchase our products and services, or release their content in our proprietary DTS audio format. Although we have contracts and license agreements with many of these companies, these agreements do not require any minimum purchase commitments, are on a non-exclusive basis, and do not typically require incorporation or use of our technology, trademarks or services. Furthermore, the decision by a party dominant in the entertainment value chain to provide audio technology at very low or no cost could impact a licensee's decision to use our technology. Our customers, licensees and other manufacturers might not utilize our technology or services in the future.
If we are unable to maintain a sufficient amount of entertainment content released with DTS audio soundtracks, demand for the technology, products, and services that we offer to consumer electronics product manufacturers may significantly decline.
We expect to derive a significant percentage of our revenues from the technology, products, and services that we offer to manufacturers of consumer electronics products. To date, the most significant driver for the use of our technology in the home theater market has been the release of major movie titles with DTS audio soundtracks. We also believe that demand for our DTS audio technology in growing markets for multi-channel audio, including cars, personal computers, video game consoles, digital media players and mobile handsets will be based on the number, quality, and popularity of the Blu-ray Disc titles, computer software programs, and video games either released with DTS audio soundtracks or capable of being coded and played in DTS format. Although we have existing relationships with many leading providers of movie, music, computer, and video game content, we generally do not have contracts that require these parties to develop and release content with DTS audio soundtracks. In addition, we may not be successful in maintaining existing relationships or developing relationships with other existing providers or new market entrants that provide content. As a result, we cannot assure you that a significant amount of content in movies, Blu-ray Disc titles, computer software programs, video games, or other entertainment mediums will be released with DTS audio soundtracks. If the amount, variety, and popularity of entertainment content released with DTS audio soundtracks do not increase, consumer electronics products manufacturers that pay us per-unit licensing fees may discontinue offering DTS playback capabilities in the consumer electronics products that they sell.
16
The online content delivery market could impact our ability to grow.
Movie and music content for the last 15 years has been primarily purchased and consumed via optical media, such as Blu-ray, DVD, and CD. Today, these are still the dominant way consumers purchase and watch or listen to their favorite content. However, the growth of the internet and home computer usage, and a shift to home network and cloud-based content acquisition has occurred, including the recent trend to full movie download and streaming services becoming mainstream with consumers in various parts of the world.
The services that provide movie content from the cloud are not generally governed by international or national standards and are thus free to choose any media format(s) in order to deliver their product and/or service. This freedom of choice on the part of the content provider could limit DTS's ability to grow.
Our ability to develop proprietary technology in markets in which "open standards" are adopted may be limited, which could adversely affect our ability to generate revenue.
Standards-setting bodies may require the use of so-called "open standards," meaning that the technologies necessary to meet those standards are publicly available free of charge and often on an "open source" basis. These standards are a relatively recent and limited occurrence and have primarily been focused on markets and regions traditionally adverse to the notion of intellectual property ownership and the associated royalties. Examples would include the personal computer, or PC, market, and regions including China. If the concept of "open standards" gains industry momentum in the future, the use of open standards may reduce our opportunity to generate revenue, as open standards technologies are based upon non-proprietary technology platforms in which no one company maintains ownership over the dominant technologies.
Our business is highly dependent on the growth in Blu-ray Disc products, and to the extent that consumer adoption of Blu-ray Disc products fails to materialize, our business will be adversely affected.
Past growth in our business has been due in large part to the rapid growth in sales of DVD based products and home theater systems incorporating our technologies. As the markets for DVD based products mature, we are seeing sales of these products declining and growth in our business shifting to Blu-ray Disc based products. While the release and consumer adoption of Blu-ray Disc players continues to ramp up, potentially slow adoption by consumers of Blu-ray Disc players, particularly in the PC market, could adversely affect our business. In addition, if new technologies, including direct downloads of content, are developed or deployed that substantially compete with or replace Blu-ray Disc products as a dominant medium for consumer video entertainment, our business, operating results and prospects could be adversely affected.
We may have difficulty managing any growth that we might experience.
As a result of a combination of internal growth and growth through acquisitions, we expect to continue to experience growth in the scope of our operations and the number of our employees. If our growth continues, it may place a significant strain on our management team and on our operational and financial systems, procedures, and controls. Our future success will depend in part on the ability of our management team to manage any growth effectively. This will require our management to:
- •
- hire and train additional personnel in the United States and internationally;
- •
- implement and improve our operational and financial systems, procedures, and controls;
- •
- maintain our cost structure at an appropriate level based on the revenues we generate;
- •
- manage multiple concurrent development projects; and
- •
- manage operations in multiple time zones with different cultures and languages.
17
Any failure to successfully manage our growth could distract management's attention, and result in our failure to execute our business plan.
Our business and prospects depend on the strength of our brand, and if we do not maintain and strengthen our brand, our business will be materially harmed.
Establishing, maintaining and strengthening our "DTS" brand is critical to our success. Our brand identity is key to maintaining and expanding our business and entering new markets. Our success depends in large part on our reputation for providing high-quality products, services and technologies to the consumer electronics products industry and the entertainment industry. If we fail to promote and maintain our brand successfully, our business and prospects may suffer. Moreover, we believe that the likelihood that our technologies will be adopted in industry standards depends, in part, upon the strength of our brand, because professional organizations and industry participants are more likely to incorporate technologies developed by a well-respected and well-known brand into standards.
Unanticipated changes in our tax provisions or adverse outcomes resulting from examination of our income tax returns could adversely affect our net income.
We are subject to income taxes in both the United States and foreign jurisdictions. Our effective income tax rates have recently been and could in the future be adversely affected by changes in tax laws or interpretations of those tax laws, by changes in the mix of earnings in countries with differing statutory tax rates, or by changes in the valuation of our deferred tax assets and liabilities. Significant judgment is required in determining our worldwide provision for income taxes. In the ordinary course of our business, there are many transactions and calculations where the ultimate tax determination is uncertain. We may come under audit by tax authorities. For instance, the Internal Revenue Service is examining our 2005 to 2007 federal income tax returns, including certain prior period carry forwards, and the State of California is examining our 2004 and 2005 corporate tax returns. Although we believe our tax estimates are reasonable, the final determination of tax audits and any related litigation could be materially different from our historical income tax provisions and accruals. Based on the results of an audit or litigation, a material effect on our income tax provision, net income or cash flows in the period or periods for which that determination is made could result. In addition, changes in tax rules may adversely affect our future reported financial results or the way we conduct our business. For example, we consider the operating earnings of our foreign subsidiaries to be invested indefinitely outside the United States. We have not provided for United States federal or foreign withholding taxes that may result on future remittances of undistributed earnings of foreign subsidiaries. Our future reported financial results may be adversely affected if tax or accounting rules regarding unrepatriated earnings change.
Current and future governmental and industry standards may significantly limit our business opportunities.
Technology standards are important in the audio and video industry as they help to assure compatibility across a system or series of products. Generally, standards adoption occurs on either a mandatory basis, requiring a particular technology to be available in a particular product or medium, or an optional basis, meaning that a particular technology may be, but is not required to be, utilized. For example, both our digital multi-channel audio technology and Dolby's have optional status in Blu-ray Disc. In the standard for Blu-ray Disc, both DTS and Dolby technologies have been selected as mandatory standards for two-channel output. However, if either or both of these standards are re-examined or a new standard is developed, we may not be included as mandatory in any such new or revised standard which would cause revenue growth in our consumer business to be significantly lower than expected and could have a material adverse affect on our business.
Various national governments have adopted or are in the process of adopting standards for all digital television broadcasts, including cable, satellite, and terrestrial. In the United States, Dolby's
18
audio technology has been selected as the sole, mandatory audio standard for terrestrial digital television broadcasts. As a result, the audio for all digital terrestrial television broadcasts in the United States must include Dolby's technology and must exclude any other format, including ours. We do not know whether this standard will be reopened or amended. If it is not, our audio technology may never be included in that standard. Certain large and developing markets, such as China, have not fully developed their digital television standards. Our technology may or may not ultimately be included in these standards.
As new technologies and entertainment media emerge, new standards relating to these technologies or media may develop. New standards may also emerge in existing markets that are currently characterized by competing formats, such as the market for personal computers. We may not be successful in our efforts to include our technology in any such standards.
We are dependent on our management team and technical talent.
Our success depends, in part, upon the continued availability and contributions of our management team and engineering and technical personnel because of the complexity of our products and services. Important factors that could cause the loss of key personnel include:
- •
- our existing employment agreements with the members of our management team allow such persons to terminate their
employment with us at any time;
- •
- we do not have employment agreements with a majority of our key engineering and technical personnel;
- •
- significant portions of the equity awards held by the members of our management team are vested; and
- •
- equity awards held by some of our executive officers provide for accelerated vesting in the event of a sale or change of control of our company.
The loss of key personnel or an inability to attract qualified personnel in a timely manner could slow our technology and product development and harm our ability to execute our business plan.
Our technology and products are complex and may contain errors that could cause us to lose customers, damage our reputation, or incur substantial costs.
Our technology or products could contain errors that could cause our products or technology to operate improperly and could cause unintended consequences. If our products or technology contain errors we, could be required to replace them, and if any such errors cause unintended consequences, we could face claims for product liability. Although we generally attempt to contractually limit our exposure to incidental and consequential damages, as well as provide insurance coverage for such events, if these contract provisions are not enforced or are unenforceable for any reason, if liabilities arise that are not effectively limited, or if our insurance coverage is inadequate to satisfy the liability, we could incur substantial costs in defending and/or settling product liability claims.
We may be sued by third parties for alleged infringement of their proprietary rights, and we may be subject to litigation proceedings that could harm our business.
Companies that participate in the digital audio, digital image processing, consumer electronics, and entertainment industries hold a large number of patents, trademarks, and copyrights, and are frequently involved in litigation based on allegations of patent infringement or other violations of intellectual property rights. Intellectual property disputes frequently involve highly complex and costly scientific matters, and each party generally has the right to seek a trial by jury which adds additional costs and uncertainty. Accordingly, intellectual property disputes, with or without merit, could be costly and time
19
consuming to litigate or settle, and could divert management's attention from executing our business plan. In addition, our technology and products may not be able to withstand any third-party claims or rights against their use. If we were unable to obtain any necessary license following a determination of infringement or an adverse determination in litigation or in interference or other administrative proceedings, we may need to redesign some of our products to avoid infringing a third party's rights and could be required to temporarily or permanently discontinue licensing our products.
In the past, we have been a party to litigation related to protection and enforcement of our intellectual property, and we may be a party to additional litigation in the future. Litigation is subject to inherent uncertainties, and unfavorable rulings could occur. An unfavorable ruling could include monetary damages (including treble damages under the Clayton Act) and an injunction prohibiting us from licensing our technology in particular ways or at all. Were an unfavorable ruling to occur, our business and results of operations could be materially harmed. In addition, any protracted litigation could divert management's attention from our day-to-day operations, disrupt our business and cause our operating results to suffer.
We rely on the accuracy of our customers' manufacturing reports for reporting and collecting our revenues, and if these reports are untimely or incorrect, our revenues could be delayed or inaccurately reported.
Most of our revenues are generated from consumer electronics product manufacturers who license and incorporate our technology in their consumer electronics products. Under our existing agreements, these customers pay us per-unit licensing fees based on the number of consumer electronics products manufactured that incorporate our technology. We rely on our customers to accurately report the number of units manufactured in collecting our license fees, preparing our financial reports, projections, budgets, and directing our sales and product development efforts. Most of our license agreements permit us to audit our customers, but audits are generally expensive, time consuming, difficult to manage effectively, dependent in large part on the cooperation of our licensees and the quality of the records they keep, and could harm our customer relationships. If any of our customer reports understate the number of products they manufacture, we may not collect and recognize revenues to which we are entitled, or may endure significant expense to obtain compliance.
A loss of one or more of our key customers or licensees in any of our markets could adversely affect our business.
From time to time, one or a small number of our customers or licensees may represent a significant percentage of our revenue. For instance, in 2010, two customers accounted for 17% and 15%, respectively, of revenues from our continuing operations. Although we have agreements with many of our customers, these agreements typically do not require any material minimum purchases or minimum royalty fees and do not prohibit customers from purchasing products and services from competitors. A decision by any of our major customers or licensees not to use our technologies, or their failure or inability to pay amounts owed to us in a timely manner, or at all, could have a significant adverse effect on our business.
We face intense competition. Certain of our competitors have greater resources than we do.
The digital audio, consumer electronics and entertainment markets are intensely competitive, subject to rapid change, and significantly affected by new product introductions and other market activities of industry participants. Our principal competitor is Dolby Laboratories, Inc., who competes with us in most of our markets. We also compete with other companies offering digital audio technology incorporated into consumer electronics product and entertainment mediums, including Fraunhofer Institut Integrierte Schaltungen, Koninklijke Philips Electronics N.V. (Philips), Microsoft Corporation, Sony Corporation, Thomson and SRS Labs, Inc.
20
Certain of our current and potential competitors may enjoy substantial competitive advantages, including:
- •
- greater name recognition;
- •
- a longer operating history;
- •
- more developed distribution channels and deeper relationships with our common customer base;
- •
- a more extensive customer base;
- •
- digital technologies that provide features that ours do not;
- •
- broader product and service offerings;
- •
- greater resources for competitive activities, such as research and development, strategic acquisitions, alliances, joint
ventures, sales and marketing, and lobbying industry and government standards;
- •
- more technicians and engineers; and
- •
- greater technical support.
As a result, these current and potential competitors may be able to respond more quickly and effectively than we can to new or changing opportunities, technologies, standards, or customer requirements.
In addition to the competitive advantages described above, Dolby also enjoys other unique competitive strengths relative to us. For example, it introduced multi-channel audio technology before we did. It has also achieved mandatory standard status in product categories that we have not, including terrestrial digital television broadcasts in the United States. As a result of these factors, Dolby has a competitive advantage in selling its digital multi-channel audio technology to consumer electronics products manufacturers.
We have a limited operating history in certain new and evolving markets.
Our technology has only recently been incorporated into certain markets, such as digital media players, televisions, personal computers, digital satellite and cable broadcast products, portable electronics devices and mobile handsets. We do not have the same experience in these markets as in our traditional consumer electronics business, nor do we have as much operating history as companies, such as Dolby Laboratories, Inc., SRS Labs, Inc. and BBE Sound, Inc. As a result, the demand for our technology, products, and services and the income potential of these businesses is unproven. In addition, because our participation in these markets is relatively new and rapidly evolving, we may have limited insight into trends that may emerge and affect our business. We may make errors in predicting and reacting to relevant business trends, which could harm our business. Before investing in our common stock, you should consider the risks, uncertainties, and difficulties frequently encountered by companies in new and rapidly evolving markets such as ours. We may not be able to successfully address any or all of these risks.
Declining retail prices for consumer electronics products could force us to lower the license or other fees we charge our customers.
The market for consumer electronics products is intensely competitive and price sensitive. Retail prices for consumer electronics products that include our DTS audio technology have decreased significantly and we expect prices to continue to decrease for the foreseeable future. Declining prices for consumer electronics products could create downward pressure on the licensing fees we currently charge our customers who integrate our technology into the consumer electronics products that they
21
sell and distribute. Most of the consumer electronics products that include our audio technology also include Dolby's multi-channel audio technology. As a result of pricing pressure, consumer electronics products manufacturers who manufacture products in which our audio technology is not a mandatory standard could decide to exclude our DTS audio technology from their products altogether.
Economic downturns could disrupt and materially harm our business.
Negative trends in the general economy could cause a downturn in the market for our technology, products and services. The recent financial disruption affecting the global financial markets and the concern whether investment banks and other financial institutions will continue operations in the foreseeable future have resulted in a tightening in the credit markets, a low level of liquidity in many financial markets and extreme volatility in credit and equity markets. The recent financial crisis may adversely affect our operating results if it results, for example, in the insolvency of a key licensee or other customer, the inability of our licensees and/or other customers to obtain credit to finance their operations, including to finance the manufacture of products containing our technologies, and delays in reporting and/or payments from our licensees. Tight credit markets could also delay or prevent us from acquiring or making investments in other technologies, products or businesses that could enhance our technical capabilities, complement our current products and services, or expand the breadth of our markets. If we are unable to execute such acquisitions and/or strategic investments, our operating results and business prospects may suffer.
In addition, global economic conditions, including the credit crisis, increased cost of commodities, widespread employee layoffs, actual or threatened military action by the United States and the continued threat of terrorism, have resulted in decreased consumer spending and may continue to negatively impact consumer confidence and spending. Any reduction in consumer confidence or disposable income, in general, may negatively affect the demand for consumer electronics products that incorporate our digital audio technology.
We cannot predict other negative events that may have adverse effects on the global economy in general and the consumer electronics industry specifically. However, the factors described above and such unforeseen events could negatively affect our revenues and operating results.
Our licensing revenue depends in large part upon semiconductor manufacturers incorporating our technologies into integrated circuits, or ICs, for sale to our consumer electronics product licensees and if, for any reason, our technologies are not incorporated in these ICs or fewer ICs are sold that incorporate our technologies, our operating results would be adversely affected.
Our licensing revenue from consumer electronics product manufacturers depends in large part upon the availability of ICs that implement our technologies. IC manufacturers incorporate our technologies into these ICs, which are then incorporated into consumer electronics products. We do not manufacture these ICs, but rather depend on IC manufacturers to develop, produce and then sell them to licensed consumer electronics product manufacturers. We do not control the IC manufacturers' decisions whether or not to incorporate our technologies into their ICs, and we do not control their product development or commercialization efforts. If these IC manufacturers are unable or unwilling, for any reason, to implement our technologies into their ICs, or if, for any reason, they sell fewer ICs incorporating our technologies, our operating results will be adversely affected.
We may not successfully address problems encountered in connection with any acquisitions.
We expect to consider opportunities to acquire or make investments in other technologies, products, and businesses that could enhance our technical capabilities, complement our current
22
products and services, or expand the breadth of our markets. We have a limited history of acquiring and integrating businesses. Acquisitions and strategic investments involve numerous risks, including:
- •
- problems assimilating the purchased technologies, products, or business operations;
- •
- significant future charges relating to in-process research and development and the amortization of intangible
assets;
- •
- significant amount of goodwill that is not amortizable and is subject to annual impairment review;
- •
- problems maintaining uniform standards, procedures, controls, and policies;
- •
- unanticipated costs associated with the acquisition, including accounting and legal charges, capital expenditures, and
transaction expenses;
- •
- diversion of management's attention from our core business;
- •
- adverse effects on existing business relationships with suppliers and customers;
- •
- risks associated with entering markets in which we have no or limited prior experience;
- •
- unanticipated or unknown liabilities relating to the acquired businesses;
- •
- the need to integrate accounting, management information, manufacturing, human resources and other administrative systems
to permit effective management; and
- •
- potential loss of key employees of acquired organizations.
If we fail to properly evaluate and execute acquisitions and strategic investments, our management team may be distracted from our day-to-day operations, our business may be disrupted, and our operating results may suffer. In addition, if we finance acquisitions by issuing equity or convertible debt securities, our existing stockholders would be diluted. Foreign acquisitions involve unique risks in addition to those mentioned above, including those related to integration of operations across different geographies, cultures and languages, currency risks and risks associated with the particular economic, political and regulatory environment in specific countries. Also, the anticipated benefit of our acquisitions may not materialize, whether because of failure to obtain stockholder approval or otherwise. Future acquisitions could result in potentially dilutive issuances of our equity securities, the incurrence of debt, contingent liabilities or amortization expenses, or write-offs of goodwill, any of which could harm our operating results or financial condition. Future acquisitions may also require us to obtain additional equity or debt financing, which may not be available on favorable terms or at all.
We are subject to additional risks associated with our international operations.
Our licensing headquarters are located in Limerick, Ireland, and we market and sell our products and services outside the United States. We currently have employees located in eight countries, and many of our customers and licensees are located outside the United States. As a key component of our business strategy, we intend to expand our international sales and customer support. During the year ended December 31, 2010, nearly 90% of our revenues were derived internationally. We face numerous risks in doing business outside the United States, including:
- •
- unusual or burdensome foreign laws or regulatory requirements or unexpected changes to those laws or requirements;
- •
- tariffs, trade protection measures, import or export licensing requirements, trade embargos, and other trade barriers;
- •
- difficulties in attracting and retaining qualified personnel and managing foreign operations;
23
- •
- competition from foreign companies;
- •
- dependence on foreign distributors and their sales channels;
- •
- longer accounts receivable collection cycles and difficulties in collecting accounts receivable;
- •
- less effective and less predictable protection and enforcement of our intellectual property;
- •
- changes in the political or economic condition of a specific country or region, particularly in emerging markets;
- •
- fluctuations in the value of foreign currency versus the U.S. dollar and the cost of currency exchange;
- •
- potentially adverse tax consequences; and
- •
- cultural differences in the conduct of business.
Such factors could cause our future international sales to decline.
Our business practices in international markets are also subject to the requirements of the Foreign Corrupt Practices Act. If any of our employees is found to have violated these requirements, we and our employees could be subject to significant fines, criminal sanctions and other penalties.
Our international revenue is mostly denominated in U.S. dollars. As a result, fluctuations in the value of the U.S. dollar and foreign currencies may make our technology, products, and services more expensive for international customers, which could cause them to decrease their purchases from us. Expenses for our subsidiaries are denominated in their respective local currencies. As a result, if the U.S. dollar weakens against the local currency, the translation of our foreign-currency-denominated expenses will result in higher operating expense without a corresponding increase in revenue. Significant fluctuations in the value of the U.S. dollar and foreign currencies could have a material impact on our consolidated financial statements. The main foreign currencies we encounter in our operations are the Yen, Euro, CAD, RMB, KRW, HKD, TWD and GBP. We do not currently engage in currency hedging activities to limit the risk of exchange rate fluctuations.
We expect our operating expenses to increase in the future, which may impact profitability.
We expect our operating expenses to increase as we, among other things:
- •
- expand our sales and marketing activities, including the continued development of our international operations;
- •
- adopt a more customer-focused business model which is expected to entail additional hiring;
- •
- acquire businesses or technologies and integrate them into our existing organization;
- •
- increase our research and development efforts to advance our existing technology, products, and services and develop new
technology, products, and services;
- •
- hire additional personnel, including engineers and other technical staff;
- •
- expand and defend our intellectual property portfolio;
- •
- upgrade our operational and financial systems, procedures, and controls; and
- •
- continue to assume the responsibilities of being a public company.
As a result, we will need to grow our revenues and manage our costs in order to positively impact profitability. In addition, we may fail to accurately estimate and assess our increased operating expenses as we grow.
24
Compliance with changing securities laws, regulations and financial reporting standards will increase our costs and pose challenges for our management team.
Changing laws, regulations and standards relating to corporate governance and public disclosure, including the Dodd-Frank Wall Street Reform and Consumer Protection Act, the Sarbanes-Oxley Act of 2002, and the rules and regulations promulgated thereunder have created uncertainty for public companies and significantly increased the costs and risks associated with operating as a publicly traded company in the United States. Our management team will need to devote significant time and financial resources to comply with both existing and evolving standards for public companies, which will lead to increased general and administrative expenses and a diversion of management time and attention from revenue generating activities to compliance activities. Furthermore, with such uncertainties, we cannot assure you that our system of internal control will be effective or satisfactory to our independent registered public accounting firm. As a result, our financial reporting may not be timely and/or accurate and we may be issued an adverse or qualified opinion by our independent registered public accounting firm. If reporting delays or errors actually occur, we could be subject to sanctions or investigation by regulatory authorities, such as the SEC, and could adversely affect our financial results or result in a loss of investor confidence in the reliability of our financial information, which could materially and adversely affect the market price of our common stock.
Further, the SEC has passed, promulgated and proposed new rules on a variety of subjects including the requirement that we must file our financial statements with the SEC using the interactive data format eXtensible Business Reporting Language, or XBRL, and the possibility that we would be required to adopt International Financial Reporting Standards, or IFRS. We may have to add additional accounting staff, engage consultants or change our internal practices, standards and policies which could significantly increase our costs to comply with XBRL and IFRS requirements.
We believe that these new and proposed laws and regulations could make it more difficult for us to attract and retain qualified members of our Board of Directors, particularly to serve on our audit committee, and qualified executive officers.
Our licensing of industry standard technologies can be subject to limitations that could adversely affect our business and prospects.
When a standards-setting body adopts our technologies as explicit industry standards, we generally must agree to license such technologies on a fair, reasonable and non-discriminatory basis, which we believe means that we treat similarly situated licensees similarly. In these situations, we may be required to limit the royalty rates we charge for these technologies, which could adversely affect our business. Furthermore, we may have limited control over whom we license such technologies to, and may be unable to restrict many terms of the license. From time to time, we may be subject to claims that our licenses of our industry standard technologies may not conform to the requirements of the standards-setting body. Claimants in such cases could seek to restrict or change our licensing practices or our ability to license our technologies in ways that could injure our reputation and otherwise materially and adversely affect our business, operating results and prospects.
We may experience fluctuations in our operating results.
We have historically experienced moderate seasonality in our business due to our business mix and the nature of our products. Consumer electronics manufacturing activities are generally lowest in the first calendar quarter of each year, and increase progressively throughout the remainder of the year. Manufacturing output is generally strongest in the third and fourth quarters as our technology licensees increase manufacturing to prepare for the holiday buying season. Since recognition of revenues generally lags manufacturing activity by one quarter, our revenues and earnings are generally lowest in the second quarter. The introduction of new products and inclusion of our technologies in new and
25
rapidly growing markets can distort and amplify the seasonality described above. Our revenues may continue to be subject to fluctuations, seasonal or otherwise, in the future. Unanticipated fluctuations, whether due to seasonality, economic downturns, product cycles, or otherwise, could cause us to miss our earnings projections, or could lead to higher than normal variation in short-term earnings, either of which could cause our stock price to decline.
In addition, we actively engage in intellectual property compliance and enforcement activities focused on identifying third parties who have either incorporated our technology, trademarks, or know-how without a license or who have underreported to us the amount of royalties owed under license agreements with us. As a result of these activities, from time to time, we may recognize royalty revenues that relate to manufacturing activities from prior periods and we may incur expenditures related to enforcement activity. These royalty recoveries and expenditures, as applicable, may cause revenues to be higher than expected, or net profit to be lower than expected, during a particular reporting period and may not recur in future reporting periods. Such fluctuations in our revenues and operating results may cause declines in our stock price.
The licensing of patents constitutes a significant source of our revenue. If we do not replace expiring patents with new patents or proprietary technologies, our revenue could decline.
We hold patents covering much of the technologies that we license to system licensees, and our licensing revenue is tied in large part to the life of those patents. Our right to receive royalties related to our patents terminates with the expiration of the last patent covering the relevant technologies. Accordingly, to the extent that we do not replace licensing revenue from technologies covered by expiring patents with licensing revenue based on new patents and proprietary technologies, our revenue could decline.
Our future capital needs are uncertain and we may need to raise additional funds in the future, and such funds may not be available on acceptable terms or at all.
Our capital requirements will depend on many factors, including:
- •
- acceptance of, and demand for, our products and technology;
- •
- the costs of developing new products or technology;
- •
- the extent to which we invest in new technology and research and development projects;
- •
- the number and timing of acquisitions and other strategic transactions;
- •
- the costs associated with our expansion, if any; and
- •
- the costs of litigation and enforcement activities to defend our intellectual property.
In the future, we may need to raise additional funds, and such funds may not be available on favorable terms, or at all, particularly given the continuing credit crisis and downturn in the overall global economy. Furthermore, if we issue equity or debt securities to raise additional funds, our existing stockholders may experience dilution, and the new equity or debt securities may have rights, preferences, and privileges senior to those of our existing stockholders. If we cannot raise funds on acceptable terms, or at all, we may not be able to develop or enhance our products and services, execute our business plan, take advantage of future opportunities, or respond to competitive pressures or unanticipated customer requirements. This may materially harm our business, results of operations, and financial condition.
26
Risks Related to Our Common Stock
Anti-takeover provisions under our charter documents and Delaware law could delay or prevent a change of control and could also limit the market price of our stock.
Our Restated Certificate of Incorporation and Restated Bylaws contain provisions that could delay or prevent a change of control of our company or changes in our Board of Directors that our stockholders might consider favorable. Some of these provisions:
- •
- authorize the issuance of preferred stock which can be created and issued by the Board of Directors without prior
stockholder approval, with rights senior to those of the common stock;
- •
- provide for a classified Board of Directors, with each director serving a staggered three-year term;
- •
- prohibit stockholders from filling Board vacancies, calling special stockholder meetings, or taking action by written
consent; and
- •
- require advance written notice of stockholder proposals and director nominations.
In addition, we are governed by the provisions of Section 203 of the Delaware General Corporate Law, which may prohibit certain business combinations with stockholders owning 15% or more of our outstanding voting stock. These and other provisions in our Restated Certificate of Incorporation, Restated Bylaws and Delaware law could make it more difficult for stockholders or potential acquirors to obtain control of our Board or initiate actions that are opposed by the then-current Board, and could delay or impede a merger, tender offer, or proxy contest involving our company. Any delay or prevention of a change of control transaction or changes in our Board could cause the market price of our common stock to decline.
We expect that the price of our common stock will fluctuate substantially.
The market price of our common stock is likely to be highly volatile and may fluctuate substantially due to many factors, including:
- •
- actual or anticipated fluctuations in our results of operations;
- •
- market perception of our progress toward announced objectives;
- •
- announcements of technological innovations by us or our competitors or technology standards;
- •
- announcements of significant contracts by us or our competitors;
- •
- changes in our pricing policies or the pricing policies of our competitors;
- •
- developments with respect to intellectual property rights;
- •
- the introduction of new products or product enhancements by us or our competitors;
- •
- the commencement of or our involvement in litigation;
- •
- resolution of significant litigation in a manner adverse to our business;
- •
- our sale or purchase of common stock or other securities in the future;
- •
- conditions and trends in technology industries;
- •
- changes in market valuation or earnings of our competitors;
- •
- the trading volume of our common stock;
- •
- announcements of potential acquisitions;
27
- •
- the adoption rate of new products incorporating our or our competitors' technologies, including Blu-ray Disc
players;
- •
- changes in the estimation of the future size and growth rate of our markets; and
- •
- general economic conditions.
In addition, the stock market in general, and the Nasdaq Global Select Market and the market for technology companies in particular, has experienced extreme price and volume fluctuations that have often been unrelated or disproportionate to the operating performance of those companies. Further, the market prices of securities of technology companies have been particularly volatile. These broad market and industry factors may materially harm the market price of our common stock, regardless of our operating performance. In the past, following periods of volatility in the market price of a company's securities, securities class-action litigation has often been instituted against that company. Such litigation, if instituted against us, could result in substantial costs and a diversion of management's attention and resources.
Shares of our common stock are relatively illiquid.
As a result of our relatively small public float, our common stock may be less liquid than the common stock of companies with broader public ownership. Among other things, trading of a relatively small volume of our common shares may have a greater impact on the trading price for our shares than would be the case if our public float were larger.
28
Item 1B. Unresolved Staff Comments
None.
Our corporate headquarters and principal office is located in Calabasas, California, where we own real property, which includes an approximately 89,000 square foot building. We lease smaller facilities in other locations including the United States, Republic of Ireland, Canada, China, the United Kingdom, Japan, Korea and Taiwan. We believe that our existing space is adequate for our current operations. We believe that suitable replacement and additional space will be available in the future on commercially reasonable terms.
In the ordinary course of our business, we actively pursue legal remedies to enforce our intellectual property rights and to stop unauthorized use of our technology and trademarks.
On June 22, 2010 we entered into a Settlement Agreement and Release (the "Settlement Agreement") with Datasat Digital Entertainment, Inc., Beaufort International Group Plc and Datasat Communications Limited (collectively the "Datasat Parties"), relating to a October 12, 2009 complaint that we filed in the Superior Court of the State of California, County of Los Angeles against the Datasat Parties asserting claims for breach of contract, breach of the implied covenant of good faith and fair dealing, and unjust enrichment related to the sale of our digital cinema business in May 2008. Pursuant to the Settlement Agreement, the Datasat Parties paid the Company a total of $2.0 million in 2010. There are no further pending matters between the Company and the Datasat Parties.
We are not currently a party to any other material legal proceedings. We may, however, become subject to lawsuits from time to time in the course of our business.
Item 4. (Removed and Reserved)
29
Item 5. Market for Registrant's Common Equity, Related Stockholder Matters and Issuer Purchases of Equity Securities
Our common stock is traded on the Nasdaq Global Select Market under the symbol "DTSI." Prior to July 1, 2006 our common stock was listed on the Nasdaq National Market since our initial public offering on July 9, 2003. The following table sets forth, for the periods indicated, the high and low sales prices for our common stock as reported by the Nasdaq Global Select Market:
| |
High | Low | |||||
|---|---|---|---|---|---|---|---|
2009 |
|||||||
First Quarter |
$ | 24.78 | $ | 13.40 | |||
Second Quarter |
$ | 28.26 | $ | 21.66 | |||
Third Quarter |
$ | 28.45 | $ | 24.25 | |||
Fourth Quarter |
$ | 35.14 | $ | 25.44 | |||
2010 |
|||||||
First Quarter |
$ | 36.18 | $ | 25.95 | |||
Second Quarter |
$ | 35.59 | $ | 31.03 | |||
Third Quarter |
$ | 41.49 | $ | 31.48 | |||
Fourth Quarter |
$ | 49.96 | $ | 37.37 | |||
As of January 26, 2011 there were approximately 4,100 stockholders of record of our common stock. We believe that the number of beneficial owners is substantially greater than the number of record holders because a large portion of our common stock is held through brokerage firms in "street name."
RECENT SALES OF UNREGISTERED SECURITIES
During the fiscal year ended December 31, 2010, we did not issue any securities that were not registered under the Securities Act of 1933.
30
The following graph and table compares the cumulative total stockholder return on our common stock to that of the NASDAQ Market Index and the Russell 2000® Index for the five fiscal year period ending December 31, 2010, the date of our fiscal year end. The following graph and table assumes that a $100 investment was made at the close of trading on December 31, 2005 in our common stock and in each index, and that dividends, if any, were reinvested. The stock price performance shown on the graph below should not be considered indicative of future price performance.
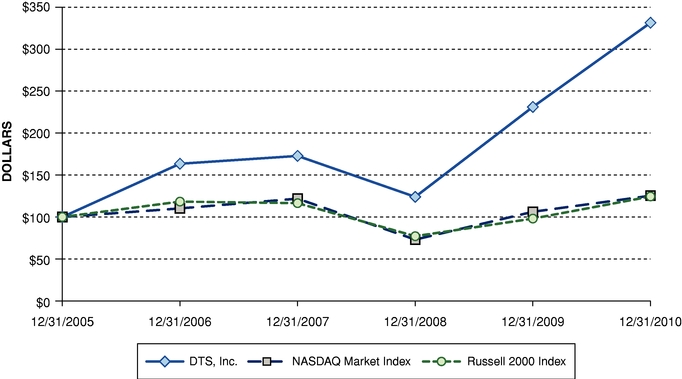
| |
December 31, 2005 |
December 30, 2006 |
December 29, 2007 |
December 31, 2008 |
December 31, 2009 |
December 31, 2010 |
|||||||||||||
|---|---|---|---|---|---|---|---|---|---|---|---|---|---|---|---|---|---|---|---|
DTS, Inc. |
$ | 100.00 | $ | 163.45 | $ | 172.77 | $ | 123.99 | $ | 231.15 | $ | 331.42 | |||||||
NASDAQ Market Index |
100.00 | 110.25 | 121.88 | 73.10 | 106.22 | 125.36 | |||||||||||||
Russell 2000 Index |
100.00 | 118.37 | 116.51 | 77.15 | 98.11 | 124.46 | |||||||||||||
We have never declared or paid any cash dividends on our common stock. We currently intend to retain all available funds to support our operations and to finance the growth and development of our business. We do not anticipate paying any cash dividends in the foreseeable future. Any future determination relating to dividend policy will be made at the discretion of our Board of Directors and will depend on a number of factors, including our future earnings, capital requirements, financial condition, future prospects, and other factors as the Board of Directors may deem relevant.
31
ISSUER PURCHASES OF EQUITY SECURITIES
On August 1, 2006, our Board of Directors authorized, subject to certain business and market conditions, the purchase of up to one million shares of our common stock in the open market or in privately negotiated transactions. Through August 13, 2007, all shares of common stock under this authorization were repurchased for an aggregate cost of $22.7 million.
On February 21, 2008, our Board of Directors authorized, subject to certain business and market conditions, the purchase of up to one million shares of our common stock in the open market or in privately negotiated transactions. Through November 25, 2008, all shares of common stock under this authorization were repurchased for an aggregate cost of $18.9 million.
On November 12, 2009, our Board of Directors authorized, subject to certain business and market conditions, the purchase of up to one million shares of our common stock in the open market or in privately negotiated transactions. Through November 18, 2010, all shares of common stock under this authorization were repurchased for an aggregate cost of $33.3 million.
All shares repurchased under these authorizations are accounted for as treasury stock.
Stock repurchase activity during the quarter ended December 31, 2010 was as follows:
Period
|
Total Number of Shares Purchased |
Average Price Paid per Share |
Total Number of Shares Purchased as Part of Publicly Announced Plan |
Maximum Number of Shares that May Yet Be Purchased Under the Plan |
|||||||||
|---|---|---|---|---|---|---|---|---|---|---|---|---|---|
October 1, 2010 through October 31, 2010 |
— | — | — | 24,846 | |||||||||
November 1, 2010 through November 30, 2010 |
26,269 | (1) | $ | 42.94 | 24,846 | — | |||||||
December 1, 2010 through December 31, 2010 |
5,216 | (2) | $ | 49.05 | — | — | |||||||
Total |
31,485 | $ | 43.95 | (3) | 24,846 | — | |||||||
Notes:
- (1)
- Consists
of shares repurchased in open-market transactions pursuant to an authorization by our Board of Directors that we previously announced.
In November 2009, our Board of Directors authorized us to repurchase up to one million shares of our common stock in the open market or in privately negotiated transactions, depending upon market
conditions and other factors. Also consists of shares repurchased and effectively retired from employees to satisfy statutory withholding requirements upon the vesting of restricted stock.
- (2)
- Consists
of shares repurchased and effectively retired from employees to satisfy statutory withholding requirements upon the vesting of restricted stock.
- (3)
- Represents weighted average price paid per share during the quarter ended December 31, 2010.
32
Item 6. Selected Financial Data
SELECTED CONSOLIDATED FINANCIAL DATA
In the table below, we provide you with historical selected consolidated financial data of DTS, Inc. and its subsidiaries. We derived the following historical data from our audited consolidated financial statements. It is important that you read the selected consolidated financial data set forth below in conjunction with our consolidated financial statements and related notes and "Management's Discussion and Analysis of Financial Condition and Results of Operations" included elsewhere in this Form 10-K.
During the first quarter of 2007, DTS Digital Cinema's assets and liabilities were classified as held for sale and its operations were reported as discontinued operations. As a result, we reclassified our balance sheets and statements of income for all periods presented in this report to reflect DTS Digital Cinema as discontinued operations.
33
Our historical results are not necessarily indicative of the operating results that may be expected in the future. We have described various risks and uncertainties that could affect future operating results under the heading "Risk Factors" included elsewhere in this Form 10-K.
| |
For the Years Ended December 31, | |||||||||||||||||
|---|---|---|---|---|---|---|---|---|---|---|---|---|---|---|---|---|---|---|
| |
2010 | 2009 | 2008 | 2007 | 2006(5) | |||||||||||||
| |
(Amounts in thousands, except per share amounts) |
|||||||||||||||||
Consolidated Statement of Operations Data |
||||||||||||||||||
Revenue |
$ | 87,096 | $ | 77,722 | $ | 60,238 | $ | 53,073 | $ | 50,039 | ||||||||
Cost of revenue |
1,583 | 1,766 | 1,179 | 1,276 | 2,082 | |||||||||||||
Gross profit |
85,513 | 75,956 | 59,059 | 51,797 | 47,957 | |||||||||||||
Operating expenses: |
||||||||||||||||||
Selling, general and administrative |
49,035 | 48,717 | 36,794 | 33,116 | 29,803 | |||||||||||||
Research and development |
12,075 | 9,087 | 6,924 | 6,473 | 6,861 | |||||||||||||
In-process research and development |
— | — | 1,090 | (2) | — | — | ||||||||||||
Restructuring costs |
— | — | — | — | 3,758 | (6) | ||||||||||||
Total operating expenses |
61,110 | 57,804 | 44,808 | 39,589 | 40,422 | |||||||||||||
Operating income |
24,403 | 18,152 | 14,251 | 12,208 | 7,535 | |||||||||||||
Interest and other income, net |
418 | 1,063 | 2,418 | 2,704 | 4,954 | |||||||||||||
Income from continuing operations before income taxes |
24,821 | 19,215 | 16,669 | 14,912 | 12,489 | |||||||||||||
Provision for income taxes |
9,781 | 8,525 | 7,158 | 5,310 | 2,896 | |||||||||||||
Income from continuing operations |
15,040 | 10,690 | 9,511 | 9,602 | 9,593 | |||||||||||||
Income (loss) from discontinued operations, net of tax |
1,001 | (1) | (88 | ) | 1,856 | (3) | (30,041 | )(4) | (6,569 | ) | ||||||||
Net income (loss) |
$ | 16,041 | $ | 10,602 | $ | 11,367 | $ | (20,439 | ) | $ | 3,024 | |||||||
Net income (loss) per common share: |
||||||||||||||||||
Basic: |
||||||||||||||||||
Continuing operations |
$ | 0.88 | $ | 0.62 | $ | 0.54 | $ | 0.54 | $ | 0.54 | ||||||||
Discontinued operations |
0.06 | — | 0.10 | (1.69 | ) | (0.37 | ) | |||||||||||
Net income (loss) |
$ | 0.94 | $ | 0.62 | $ | 0.64 | $ | (1.15 | ) | $ | 0.17 | |||||||
Diluted: |
||||||||||||||||||
Continuing operations |
$ | 0.84 | $ | 0.60 | $ | 0.52 | $ | 0.52 | $ | 0.52 | ||||||||
Discontinued operations |
0.06 | — | 0.11 | (1.63 | ) | (0.36 | ) | |||||||||||
Net income (loss) |
$ | 0.90 | $ | 0.60 | $ | 0.63 | $ | (1.11 | ) | $ | 0.16 | |||||||
Weighted average shares used to compute net income (loss) per common share: |
||||||||||||||||||
Basic |
17,041 | 17,145 | 17,641 | 17,745 | 17,623 | |||||||||||||
Diluted |
17,805 | 17,689 | 18,145 | 18,418 | 18,401 | |||||||||||||
- (1)
- Includes
proceeds from a settlement and release agreement. For additional information regarding, refer to Footnote 11 of our consolidated financial
statements, "Discontinued Operations."
- (2)
- This write-off of in-process research and development relates to the business acquisition from Neural Audio Corporation. For additional information regarding this business combination, refer to Footnote 8 of our consolidated financial statements, "Business Combination."
34
- (3)
- Includes
a $4,963 pre-tax adjustment to increase the carrying value of assets held for sale to fair value, less costs to sell, during the first
quarter of 2008. Also, includes a pre-tax loss of $2,099 for the separate sales transactions of our digital images and cinema businesses during the second quarter of 2008. For additional
information regarding these sales transactions, refer to Footnote 11 of our consolidated financial statements, "Discontinued Operations."
- (4)
- Includes
charge of $19,272, net of $5,381 tax benefit, to reduce the carrying value of the Cinema and Digital Images businesses comprising discontinued
operations to fair value, less costs to sell.
- (5)
- Includes
$20, $1,727 and $222 in cost of goods sold, selling, general and administrative and research and development, respectively, due to the adoption of
stock-based compensation guidance on January 1, 2006. For additional information regarding stock-based compensation, refer to Footnote 12 of our consolidated financial statements, "Stock-Based
Compensation."
- (6)
- Includes $3,000 and $758 for the early termination of a business agreement and the write-down of DTS Entertainment inventory and other assets, respectively.
| |
As of December 31, | |||||||||||||||
|---|---|---|---|---|---|---|---|---|---|---|---|---|---|---|---|---|
| |
2010 | 2009 | 2008 | 2007 | 2006 | |||||||||||
| |
(In thousands) |
|||||||||||||||
Consolidated Balance Sheet Data |
||||||||||||||||
Cash, cash equivalents, and short-term investments |
$ | 96,131 | $ | 75,351 | $ | 68,023 | $ | 85,402 | $ | 108,760 | ||||||
Working capital |
95,394 | 83,725 | 76,773 | 100,220 | 120,510 | |||||||||||
Total assets |
172,295 | 154,218 | 137,678 | 138,217 | 168,200 | |||||||||||
Total long-term liabilities |
8,596 | 5,862 | 3,783 | 2,716 | 1,466 | |||||||||||
Total stockholders' equity |
147,568 | 141,824 | 125,289 | 120,812 | 153,816 | |||||||||||
Item 7. Management's Discussion and Analysis of Financial Condition and Results of Operations
This Annual Report on Form 10-K (including, but not limited to, the following discussion of our financial condition and results of operations) and the documents incorporated herein by reference contain forward-looking statements within the meaning of Section 27A of the Securities Act of 1933, as amended, and Section 21E of the Securities Exchange Act of 1934, as amended. Words such as "believes," "anticipates," "estimates," "expects," "projections," "may," "potential," "plan," "continue" and similar expressions are intended to identify forward-looking statements, but are not the exclusive means of identifying forward-looking statements in this report. All statements, other than statements of historical fact, are statements that could be deemed forward-looking statements, including, but not limited to, statements regarding our future financial performance or position, our business strategy, plans or expectations, and our objectives for future operations, including relating to our products and services. Although forward-looking statements in this report reflect our good faith judgment, such statements can only be based on facts and factors currently known by us. Consequently, forward- looking statements contained herein are inherently subject to risks and uncertainties and our actual results and outcomes may be materially different from those expressed or implied by the forward-looking statements. Factors that could cause or contribute to such differences in results and outcomes include, without limitation, those discussed under the "Risk Factors" section contained in Item 1A and elsewhere in this report and in other documents we file with the Securities and Exchange Commission, or SEC. We cannot guarantee future results, levels of activity, performance or achievements. Readers are urged not to place undue reliance on these forward-looking statements, which speak only as of the date of this report. We do not undertake any obligation to revise or update these forward-looking statements to reflect future events or circumstances.
You should read the following discussion of our financial condition and results of operations in conjunction with the consolidated financial statements and the notes to those statements included
35
elsewhere in this Form 10-K. All discussions and amounts in Management's Discussion and Analysis, except for Liquidity and Capital Resources, for all periods presented relate to continuing operations only, unless otherwise noted.
Overview
We are a leading provider of high-quality branded entertainment technologies, which are incorporated into an array of entertainment products by hundreds of licensee customers around the world. Our audio technologies enable the delivery and playback of clear, compelling high-definition audio and is currently used in a variety of product applications, including audio/video receivers, Blu-ray Disc players, DVD based products, personal computers or PCs, car audio products, video game consoles, network capable televisions, digital media players, set-top-boxes or STBs, mobile phones and home theater systems. In addition, we provide products and services to motion picture studios, radio and television broadcasters, game developers and other content creators to facilitate the inclusion of compelling, realistic DTS-encoded soundtracks in movies, sporting events, television shows and music content. We also provide a suite of audio processing technologies designed to enhance the entertainment experience from products subject to physical limitations, such as TVs, PCs and smartphones.
We derive revenues from licensing our audio technology, trademarks, and know-how under agreements with substantially all of the major consumer audio electronics manufacturers. Our business model provides for these manufacturers to pay us a per-unit amount for DTS-enabled products that they manufacture.
Generally, we actively engage in intellectual property compliance and enforcement activities focused on identifying third parties who have either incorporated our technology, trademarks, or know-how without a license or who have under-reported the amount of royalties owed under license agreements with us. We continue to invest in our compliance and enforcement infrastructure to support the value of our intellectual property to us and our licensees and to improve the long-term realization of revenue from our intellectual property. As a result of these activities, from time to time, we recognize royalty revenues that relate to consumer electronics manufacturing activities from prior periods. These royalty recoveries may cause revenues to be higher than expected during a particular reporting period and may not occur in subsequent periods. While we consider such revenues to be a regular part of our normal operations, we cannot predict such recoveries or the amount or timing of such revenues.
Our cost of revenues consists primarily of amounts paid for products and materials, salaries and related benefits for operations personnel, amortization of acquired intangibles and payments to third parties for copyrighted material.
Our selling, general, and administrative expenses consist primarily of salaries and related benefits for personnel engaged in sales and licensee support, as well as costs associated with promotional and other selling and licensing activities. Selling, general, and administrative expenses also include professional fees, facility-related expenses, and other general corporate expenses, including personnel engaged in corporate administration, finance, human resources, information systems and legal.
Our research and development costs consist primarily of salaries and related benefits for research and development personnel, engineering consulting expenses associated with new product and technology development, and quality assurance and testing costs. Research and development costs are expensed as incurred.
36
Executive Summary
Financial Highlights
- •
- Revenues increased 12% for the year ended December 31, 2010, compared to the same prior year period.
- •
- Royalty recoveries from intellectual property compliance and enforcement activities decreased $13.6 million for the
year ended December 31, 2010, compared to the same prior year period. The decrease in these recoveries related primarily to the settlement of legal matters with Zoran Corporation in 2009.
- •
- Royalties from Blu-ray product markets increased 71% for the year ended December 31, 2010, compared to
the same prior year period.
- •
- Royalties from network connected markets, which includes televisions and digital media players, comprised over 10% of
total revenue for the year ended December 31, 2010, compared to less than 5% for the same prior year period.
- •
- Gross profit percentage for the year ended December 31, 2010 remained at 98%, compared to the same prior year
period.
- •
- Operating income increased to 28% of revenues for the year ended December 31, 2010.
- •
- Diluted earnings per share from continuing operations increased $0.24 to $0.84 for the year ended December 31, 2010, compared to the same prior year period.
Trends, Opportunities, and Challenges
Historically, our revenue has been primarily dependent upon the DVD based home theater market. The success of DVD based systems and products has fueled a demand for higher-quality entertainment in the home, and this demand is extending into the car audio, personal computer, portable electronics, online networked devices, broadcast, video game console and mobile handset markets as well. We have seen the acceleration of the market for high-definition televisions drive demand for Blu-ray Disc players and advanced home theater systems. Consumers are more broadly embracing the Blu-ray technology as prices decline and content availability increases, and as customers realize the value of the advanced features that Blu-ray provides, such as the ability to connect to the internet and ultimately playback 3-D content.
Because we are a mandatory technology in the Blu-ray Disc standard, our revenue growth is closely tracking the growth in sales of Blu-ray equipped players, game consoles and PCs. Further, we believe that this mandatory position in the Blu-ray Disc standard will give us the ability to extend the reach of a broad array of our technologies in several large markets, such as applications beyond optical media. For example, we have signed agreements with a number of digital media player, network-connected digital television and mobile handset manufacturers to incorporate DTS decoders into their products.
One of the largest challenges that we face is the growing consumer trend toward open platform, on-line entertainment consumption and the need to constantly and rapidly evolve our technologies to address the emerging markets. We believe that although the trend has begun, any transition to such open platform, on-line entertainment will take many years. Further, we believe that this trend demands that playback devices be capable of processing content originating in any form, whether disk-based or on-line, which creates a substantial opportunity for our technologies to extend into network connected products that may not have an optical drive. During the transition period, we expect that both optical media and on-line entertainment formats will continue to thrive.
37
Further, we currently face a challenge regarding our ability to determine the impact of the recent global economic downturn on consumer buying patterns. While we do not have visibility into the timing or extent of an economic recovery, we continue to remain optimistic that our revenues from both Blu-ray enabled products and our newer markets will continue to grow.
Critical Accounting Policies and Estimates
Management's Discussion and Analysis of Financial Condition and Results of Operations are based upon our consolidated financial statements, which have been prepared in accordance with generally accepted accounting principles in the United States, or GAAP, and pursuant to the rules and regulations of the SEC. The preparation of our consolidated financial statements requires us to make estimates and judgments that affect the reported amounts of assets, liabilities, revenues, and expenses, and related disclosure of contingent assets and liabilities. On an on-going basis, estimates and judgments are evaluated, including those related to revenue recognition, allowance for doubtful accounts, impairment of long-lived assets, stock-based compensation, and income taxes. These estimates and judgments are based on historical experience and on various other assumptions that we believe to be reasonable under the circumstances, which form the basis for our judgments about the carrying values of assets and liabilities not readily apparent from other sources. By their nature, estimates are subject to an inherent degree of uncertainty. Actual results may differ from these estimates.
We believe the following critical accounting policies, among others, affect our more significant judgments and estimates used in the preparation of our consolidated financial statements.
- •
- Revenue Recognition. We recognize revenues in accordance with GAAP, and the guidelines of the SEC. Revenues from arrangements involving license fees, up-front payments and milestone payments, which are received and/or billable by us in connection with other rights and services that represent continuing obligations of ours, are deferred until all of the elements have been delivered or until we have established objective and verifiable evidence of the fair value of the undelivered elements.
We are responsible for the licensing and enforcement of our patented technologies and pursue third parties that are utilizing our intellectual property without a license or who have under-reported the amount of royalties owed under a license agreement with us. As a result of these activities, from time to time, we may recognize royalty revenues that relate to infringements that occurred in prior periods. These royalty recoveries may cause revenues to be higher than expected during a particular reporting period and may not occur in subsequent periods. Differences between amounts initially recognized and amounts subsequently audited or reported as an adjustment to those amounts due from licensees, will be recognized in the period such adjustment is determined or contracted, as appropriate, as a change in accounting estimate.
We make estimates and judgments when determining whether the collectibility of license fees receivable from licensees is reasonably assured. We assess the collectibility of accrued license fees based on a number of factors, including past transaction history with licensees and the credit-worthiness of licensees. If it is determined that collection is not reasonably assured, the fee is recognized when collectibility becomes reasonably assured, assuming all other revenue recognition criteria have been met, which is generally upon receipt of cash. Management estimates regarding collectibility impact the actual revenues recognized each period and the timing of the recognition of revenues. Our assumptions and judgments regarding future collectibility could differ from actual events, thus materially impacting our financial position and results of operations.
Revenues from licensing audio technology, trademarks, and know-how are generated from licensing agreements with consumer electronics products manufacturers that generally pay a per-unit license fee for products manufactured under those license agreements. Licensees
38
- •
- Impairment of Long-Lived Assets and
Intangibles. We periodically assess potential impairments of our long-lived assets and intangibles in accordance with the
provisions of GAAP. An impairment review is performed whenever events or changes in circumstances indicate that the carrying value may not be recoverable. Factors considered by us include, but are not
limited to, significant underperformance relative to expected historical or projected future operating results; significant changes in the manner of use of the acquired assets or the strategy for our
overall business; and significant negative industry or economic trends. We believe this to be a critical accounting policy because if those estimates or related assumptions change in the future, we
may be required to record impairment charges for such assets which could have a material impact on our results of operations. To date there has been no impairment of long lived assets or intangible
assets for continuing operations.
- •
- Stock-based Compensation. Effective January 1,
2006, we began recognizing compensation costs relating to share-based payment awards made to employees and directors in the financial statements. Stock-based compensation charges are based upon the
fair value of each option on the date of grant using the Black-Scholes option pricing model. This model requires that we estimate a risk free interest rate, expected lives, dividend yield, and the
expected volatility of our stock. We believe this to be a critical accounting policy because if any of the estimates above require significant changes, these changes could result in fluctuating
expenses that could have a material impact on our results of operations.
- •
- Income taxes. We must make estimates and judgments in determining income tax expense for financial statement purposes. These estimates and judgments occur in the calculation of certain tax assets and liabilities, which arise from differences in the timing of recognition of revenue and expense for tax and financial statement purposes. Significant changes to these estimates may result in an increase or decrease to our tax provision in a subsequent period.
generally report manufacturing information within 30 to 60 days after the end of the quarter in which such activity takes place. Consequently, we recognize revenue from these licensing agreements on a three-month lag basis, generally in the quarter following the quarter of manufacture, provided amounts are fixed or determinable and collection is reasonably assured. Use of this lag method allows for the receipt of licensee royalty reports prior to the recognition of revenue, since we cannot reliably estimate the amount of revenue earned prior to our receipt of such reports. Generally, consumer electronics manufacturing activities are lowest in the first calendar quarter of each year, and increase progressively throughout the remainder of the year. The third and fourth quarters are typically the strongest in terms manufacturing output as our technology licensees increase their manufacturing output to prepare for the holiday buying season. Since recognition of revenues in our business generally lags manufacturing activity by one quarter, our revenues and earnings are generally lowest in the second quarter. In general, the introduction and inclusion of DTS technologies in new and rapidly growing markets can have a material effect on quarterly revenues and profits, and can distort the moderate seasonality described above.
Revenues from the sale of digital multi-channel audio and video content are recorded upon shipment to retail accounts or end customers, assuming title and risk of loss has transferred, prices are fixed or determinable, we have no significant obligations remaining, and collection of the related receivable is reasonably assured. We provide for returns on product sales based on historical experience and adjust such reserves as considered necessary. To date, there have been no significant sales returns.
We must assess the likelihood that we will be able to recover our deferred tax assets. Deferred tax assets are reduced by a valuation allowance, if, based upon the weight of available evidence, it is more likely than not that we will not realize some portion or all of the deferred tax assets.
39
We consider all available positive and negative evidence when assessing whether it is more likely than not that deferred tax assets are recoverable. We consider evidence such as our past operating results, the existence of cumulative losses in previous periods and our forecast of future taxable income. We believe this to be a critical accounting policy because should there be a change in our ability to recover our deferred tax assets, our tax provision would increase in the period in which we determine that the recovery is not likely, which could have a material impact on our results of operations.
We have not provided for United States, or U.S., federal income and foreign withholding taxes on the undistributed earnings of our foreign subsidiaries because we intend to reinvest such earnings indefinitely. Should we decide to remit this income to the U.S. in a future period, our provision for income taxes may increase materially in the period that our intent changes.
Other long-term liabilities, at December 31, 2010 and 2009, includes unrecognized tax benefits of $7.3 million and $5.6 million, respectively, for both domestic and foreign issues. Inherent uncertainties exist in estimating accruals for uncertain tax positions due to the progress of income tax audits and changes in tax law, both legislated and concluded through the various jurisdictions' tax court systems. Although the outcome of tax audits is always uncertain, management believes that it has appropriate support for the positions taken on its tax returns and that its annual tax provision includes amounts sufficient to pay any assessments. Nonetheless, the amounts ultimately paid, if any, upon resolution of the issues raised by the taxing authorities may differ materially from the amounts accrued each year.
Geographic Information
Our revenue by geographical area, based on the customer's country of domicile, is as follows (in thousands):
| |
For the Years Ended December 31, | ||||||||||
|---|---|---|---|---|---|---|---|---|---|---|---|
| |
2010 | 2009 | 2008 | ||||||||
U.S. |
$ | 9,805 | $ | 17,421 | $ | 5,160 | |||||
Japan |
41,392 |
34,241 |
31,535 |
||||||||
South Korea |
21,148 | 14,414 | 12,735 | ||||||||
Other international |
14,751 | 11,646 | 10,808 | ||||||||
Total international |
77,291 | 60,301 | 55,078 | ||||||||
Total revenues |
$ | 87,096 | $ | 77,722 | $ | 60,238 | |||||
The following table sets forth, for the periods indicated, long-lived tangible assets by geographic region (in thousands):
| |
As of December 31, | ||||||||||
|---|---|---|---|---|---|---|---|---|---|---|---|
| |
2010 | 2009 | 2008 | ||||||||
U.S. |
$ | 32,207 | $ | 32,494 | $ | 22,461 | |||||
International |
1,431 | 1,391 | 1,317 | ||||||||
Total long-lived tangible assets |
$ | 33,638 | $ | 33,885 | $ | 23,778 | |||||
40
Results of Operations
Revenues
| |
Years Ended December 31, | 2010 vs. 2009 Change |
2009 vs. 2008 Change |
|||||||||||||||||||
|---|---|---|---|---|---|---|---|---|---|---|---|---|---|---|---|---|---|---|---|---|---|---|
| |
2010 | 2009 | 2008 | $ | % | $ | % | |||||||||||||||
| |
($ in thousands) |
|||||||||||||||||||||
Revenues |
$ | 87,096 | $ | 77,722 | $ | 60,238 | $ | 9,374 | 12 | % | $ | 17,484 | 29 | % | ||||||||
Revenues for the year ended December 31, 2010, compared to the same prior year period, included a $13.6 million decrease in royalties recovered through intellectual property compliance and enforcement activities, which we characterize as "royalty recoveries." Revenues for the year ended December 31, 2009, compared to the same prior year period, included an $11.8 million increase in royalty recoveries. These changes in royalty recoveries related primarily to the settlement of legal matters with Zoran Corporation in 2009. Royalty recoveries may cause revenues to be higher than expected during a particular period and may not occur in subsequent periods. Therefore, unless otherwise noted, the impact of royalty recoveries has been excluded from our revenue discussions in order to provide a more meaningful and comparable analysis.
The increase in revenues for the year ended December 31, 2010, compared to the same prior year period, was largely attributable to continued growth in Blu-ray related royalties and royalties from network connected markets, which includes televisions and digital media players. Blu-ray related royalties comprised over 30% and 25% of revenue for the years ended December 31, 2010 and 2009, respectively. In dollar terms, these royalties were up 71% for the year ended December 31, 2010, compared to the same prior year period. Royalties from network connected markets comprised over 10% and less than 5% of revenue for the years ended December 31, 2010 and 2009, respectively. The growth in network connected markets results from a growing consumer interest in consumer electronic products that access on-line content. Royalties from the car market also increased for the year ended December 31, 2010, compared to the same prior year period, due to some improvement in the auto industry and continued expansion of our technology into new car models. We continue to be cautious regarding the outlook for the consumer electronics industry as a whole, and the revenues we derive from that industry, in light of the recent turmoil in the global economic environment. However, we expect technology licensing revenues to grow as wider availability of Blu-ray enabled players, PCs and game consoles, coupled with expected aggressive pricing and promotion of these products by retailers and consumer electronics product manufacturers, should result in increasing licensing revenues from the Blu-ray format.
The increase in revenues for the year ended December 31, 2009, compared to the same prior year period, was primarily attributable to growth in royalties from the Blu-ray product and broadcast markets. Blu-ray related royalties comprised over 25% and 15% of total revenue for the years ended December 31, 2009 and 2008, respectively. In dollar terms, these royalties were up 57% for the year ended December 31, 2009, compared to the same prior year period. Royalties from broadcast markets comprised over 5% and less than 1% of revenue for the years ended December 31, 2009 and 2008, respectively, primarily as a result of the business that we acquired from Neural Audio Corporation, or Neural, on December 31, 2008. Partially offsetting these increases were declines in DVD related royalties and the car audio market.
Gross Profit
| |
Years Ended December 31, | Percentage point change in gross profit margin relative to prior year |
|||||||||||||||||||||||
|---|---|---|---|---|---|---|---|---|---|---|---|---|---|---|---|---|---|---|---|---|---|---|---|---|---|
| |
2010 | 2009 | 2008 | ||||||||||||||||||||||
| |
2010 vs. 2009 | 2009 vs. 2008 | |||||||||||||||||||||||
| |
$ | % | $ | % | $ | % | |||||||||||||||||||
| |
($ in thousands) |
||||||||||||||||||||||||
Gross Profit |
$ | 85,513 | 98 | % | $ | 75,956 | 98 | % | $ | 59,059 | 98 | % | 0 | % | 0 | % | |||||||||
41
Gross profit percentage for the years ended December 31, 2010, 2009 and 2008, remained consistent.
Selling, General and Administrative ("SG&A")
| |
|
|
Change relative to prior year | ||||||||||
|---|---|---|---|---|---|---|---|---|---|---|---|---|---|
| |
SG&A Expenses |
Percent of Revenues |
|||||||||||
Years Ended December 31,
|
$ | % | |||||||||||
| |
($ in thousands) |
||||||||||||
2010 |
$ | 49,035 | 56 | % | $ | 318 | 1 | % | |||||
2009 |
$ | 48,717 | 63 | % | $ | 11,923 | 32 | % | |||||
2008 |
$ | 36,794 | 61 | % | |||||||||
The increase in SG&A expenses for the year ended December 31, 2010, compared to the same prior year period, was minor. However, this increase reflected several partially offsetting activities. The $6.1 million increase in employee related costs resulted primarily from expanded operations resulting from increased headcount as we expand to address a number of new markets and stock-based compensation. The $1.8 million increase in advertising and travel resulted primarily from increased tradeshow and sales activities. The $1.2 million increase in depreciation resulted primarily from our new corporate headquarters, as of November 2009. Partially offsetting these increases was an $8.5 million decrease in professional fees, which resulted largely from the Zoran litigation matters in the prior year period.
The increase in SG&A expenses for the year ended December 31, 2009, compared to the same prior year period, was primarily due to a $7.3 million increase in professional fees. This increase resulted primarily from legal fees for the settlement of legal matters with Zoran Corporation. Also, employee related costs, including expanded operations and stock-based compensation, increased $2.7 million for the year ended December 31, 2009, compared to the same prior year period. Other increases for the year ended December 31, 2009, compared to the same prior year period, included travel related expenses for increased sales activities and expanding operations, occupancy costs for expanded operations and advertising expenses.
Research and Development ("R&D")
| |
|
|
Change relative to prior year | ||||||||||
|---|---|---|---|---|---|---|---|---|---|---|---|---|---|
| |
R&D Expenses | Percent of Revenues | |||||||||||
Years Ended December 31,
|
$ | % | |||||||||||
| |
($ in thousands) |
||||||||||||
2010 |
$ | 12,075 | 14 | % | $ | 2,988 | 33 | % | |||||
2009 |
$ | 9,087 | 12 | % | $ | 2,163 | 31 | % | |||||
2008 |
$ | 6,924 | 11 | % | |||||||||
The increase in R&D expenses for the year ended December 31, 2010, compared to the same prior year period, was primarily due to a $2.9 million increase in employee related costs resulting from expanded operations and severance costs for certain operations that were identified for wind down.
The increase in R&D expenses for the year ended December 31, 2009, compared to the same prior year period, was primarily due to a $1.4 million increase in employee related costs, including expanded operations and stock-based compensation. Other increases for the year ended December 31, 2009, compared to the same prior year period, included occupancy costs for expanded operations and amortization associated with intangibles from the business that we acquired from Neural on December 31, 2008.
In-Process Research and Development ("IPR&D")
There were no IPR&D expenses for the years ended December 31, 2010 and 2009.
IPR&D of $1.1 million for the year ended December 31, 2008, relates to development projects that had not reached technological feasibility, were of no future alternative use and which were
42
expensed upon consummation of the acquisition of assets used in the conduct of Neural's audio technology business by us and the assumption by us of certain liabilities of Neural. Developed technology and in-process research and development were identified and valued through extensive interviews, analysis of data provided by Neural concerning development projects, their stage of development, the time and resources needed to complete them, if applicable, and their expected income generating ability and associated risks. Where development projects had reached technological feasibility, they were classified as developed technology and the value assigned to developed technology was capitalized. The income approach, which includes an analysis of the cash flows and risks associated with achieving such cash flows, was the primary technique utilized in valuing acquired IPR&D. Key assumptions for IPR&D included a discount rate of 55% and estimates of revenue growth, cost of sales, operating expenses and taxes.
Interest and Other Income, Net
| |
Years Ended December 31, | 2010 vs. 2009 Change |
2009 vs. 2008 Change |
|||||||||||||||||||
|---|---|---|---|---|---|---|---|---|---|---|---|---|---|---|---|---|---|---|---|---|---|---|
| |
2010 | 2009 | 2008 | $ | % | $ | % | |||||||||||||||
| |
($ in thousands) |
|||||||||||||||||||||
Interest and other income, net |
$ | 418 | $ | 1,063 | $ | 2,418 | $ | (645 | ) | (61 | )% | $ | (1,355 | ) | (56 | )% | ||||||
The decreases in interest and other income, net, for the years ended December 31, 2010 and 2009, compared to the same prior year periods, was primarily due to the decrease in interest income resulting from lower average interest rates and investment balances in 2010 and 2009. Given the uncertainty in the macro-economic environment and our significant cash outflows in 2009, we have been investing in shorter-term investments, which generally earn a lower yield. Also contributing to the decreases for the years ended December 31, 2010 and 2009, compared to the same prior year periods, were the effects of translation for certain foreign subsidiaries to the U.S. dollar or functional currency.
Income Taxes
| |
Years Ended December 31, | |||||||||
|---|---|---|---|---|---|---|---|---|---|---|
| |
2010 | 2009 | 2008 | |||||||
| |
($ in thousands) |
|||||||||
Provision for income taxes |
$ | 9,781 | $ | 8,525 | $ | 7,158 | ||||
Effective tax rate |
39 | % | 44 | % | 43 | % | ||||
The effective tax rate for 2010 differed from the U.S. statutory rate of 35% primarily due to state income taxes, an increase in the reserve for uncertain tax positions and non-deductible stock-based compensation, partially offset by the effect of different tax rates in foreign jurisdictions and R&D credits.
The effective tax rate for 2009 differed from the U.S. statutory rate of 35% primarily due to state income taxes, the effect of different tax rates in foreign jurisdictions, imputed interest on inter-company balances and an increase in the reserves for uncertain tax positions, partially offset by tax exempt interest and R&D credits.
The effective tax rate for 2008 differed from the U.S. statutory rate of 35% primarily due to the effect of different tax rates in foreign jurisdictions and an increase in the reserve for uncertain tax positions, partially offset by tax exempt interest and R&D credits. In determining the income tax provision for continuing operations, the continuing operations were considered a stand-alone entity. The residual amount of tax expense or benefit due to the difference between the income tax provision for the Company as a whole and the income tax provision as calculated for continuing operations was recorded in discontinued operations.
Our rates have historically differed from statutory rates due to varying foreign tax rates, tax exempt interest, and research and development credits.
43
Results of Discontinued Operations
| |
Years Ended December 31, | 2010 vs. 2009 Change |
2009 vs. 2008 Change |
|||||||||||||||||||
|---|---|---|---|---|---|---|---|---|---|---|---|---|---|---|---|---|---|---|---|---|---|---|
| |
2010 | 2009 | 2008 | $ | % | $ | % | |||||||||||||||
| |
($ in thousands) |
|||||||||||||||||||||
Discontinued operations, net |
$ | 1,001 | $ | (88 | ) | $ | 1,856 | $ | 1,089 | (1,238 | )% | $ | (1,944 | ) | (105 | )% | ||||||
Our digital images and cinema businesses were sold in two separate transactions on April 4, 2008 and May 9, 2008, respectively. Proceeds from these sales were $7.5 million and $3.3 million, respectively. The net assets held for sale of these businesses have been eliminated from our balance sheet as of the respective sale dates, and as a result of these transactions and in conjunction with the previous carrying value adjustments, we realized a pre-tax loss of $2.1 million. This pre-tax loss results primarily from settlement and severance obligations of ours and working capital adjustments that were determined subsequent to the closing of the sale of the digital cinema business, in addition to losses from operations during the partial quarterly period from April 1, 2008 through the closing of the sale.
The loss from discontinued operations for the year ended December 31, 2009, resulted primarily from legal fees associated with our efforts to collect certain contingent consideration from the buyer of the cinema business.
The income from discontinued operations for the year ended December 31, 2010, resulted primarily from a $2.0 million settlement and release agreement with the buyer of the cinema business. For additional information, refer to Footnote 11 of the consolidated financial statements, "Discontinued Operations."
As a result of the business sales and carrying value adjustments, the periods presented are not comparable.
Liquidity and Capital Resources, Continuing and Discontinued Operations
At December 31, 2010, we had cash, cash equivalents, and short-term investments of $96.1 million, compared to $75.4 million at December 31, 2009.
Net cash provided by operating activities was $39.0 million, $21.9 million and $20.0 million for the years ended December 31, 2010, 2009 and 2008, respectively. Cash flows from operating activities consisted of net income adjusted for certain non-cash items, including stock-based compensation, depreciation and amortization, and the effect of changes in working capital and other operating activities. The operating cash flows for the year ended December 31, 2010 were largely impacted by income from operations, including certain adjustments for non-cash items. These cash flows were also impacted by increase in deferred revenue arising primarily from payments for licensing audio technology received in advance of the culmination of the earnings process. Also impacting these cash flows was the timing of payment for certain liabilities, including employee related costs, and an increase in our liabilities for uncertain tax positions. The total operating cash flows for the years ended December 31, 2009 and 2008, remained fairly consistent.
We typically use cash in investing activities primarily to purchase office equipment, fixtures, computer hardware and software, engineering and manufacturing test and certification equipment, for business and technology acquisitions, for securing patent and trademark protection for our proprietary technology and brand name, and to purchase short-term and long-term investments such as bank certificates of deposit and municipal bonds. Cash used in investing activities totaled $21.6 million, $5.8 million and $18.5 million for the years ended December 31, 2010, 2009 and 2008, respectively. Cash used in investing activities for the year ended December 31, 2010, were primarily impacted by investment purchases, net of maturities and sales. Further, we are in the process of acquiring certain intangible assets, and a final payment of $1.2 million is due at the in service date for these assets. Cash used in investing activities for the years ended December 31, 2009 and 2008, consisted primarily of capital expenditures associated with the purchase of certain real property and a building located thereon, which has been used as our new corporate headquarters since November 2009.
44
For the years ended December 31, 2010 and 2008, cash used in financing activities was $17.9 million and $11.7 million, respectively, and primarily consisted of treasury stock purchases partially offset by proceeds from the issuance of common stock under our stock-based compensation plans, including related tax benefits. For the year ended December 31, 2009, cash provided by financing activities was $0.4 million, and primarily consisted of proceeds from the issuance of common stock under our stock-based compensation plans, including related tax benefits, partially offset by treasury stock purchases.
Repurchases of Common Stock
In November 2009, our Board of Directors authorized, subject to certain business and market conditions, the purchase of up to one million shares of our common stock in the open market or in privately negotiated transactions. Through November 18, 2010, all shares of common stock under this authorization were repurchased for an aggregate cost of $33.3 million.
We believe that our cash, cash equivalents, short-term investments, and cash flows from operations will be sufficient to satisfy our working capital and capital expenditure requirements for at least the next twelve months. Changes in our operating plans including lower than anticipated revenues, increased expenses, acquisition of companies, products or technologies or other events, including those described in "Risk Factors" included elsewhere herein and in other filings may cause us to seek additional debt or equity financing on an accelerated basis. Financing may not be available on acceptable terms, or at all, particularly given the continuing crisis in the financial markets, and our failure to raise capital when needed could negatively impact our growth plans and our financial condition and results of operations. Additional equity financing may be dilutive to the holders of our common stock and debt financing, if available, may involve significant cash payment obligations and financial or operational covenants that restrict our ability to operate our business.
Contractual Obligations and Commitments
Future payments due under non-cancelable lease obligations and commitments at December 31, 2010 are described below (in thousands):
| |
2011 | 2012 | 2013 | 2014 | 2015 | 2016 and thereafter |
Total | |||||||||||||||
|---|---|---|---|---|---|---|---|---|---|---|---|---|---|---|---|---|---|---|---|---|---|---|
Operating leases |
$ | 1,099 | $ | 795 | $ | 752 | $ | 462 | $ | 226 | $ | 1,640 | $ | 4,974 | ||||||||
Purchase orders or contracts for the purchase of raw materials and other goods and services are not included in the table above. We are not able to determine the aggregate amount of such purchase orders that represent contractual obligations, as purchase orders may represent authorizations to purchase rather than binding agreements. Our purchase orders are typically based on our current needs and are typically fulfilled by our vendors within short time horizons.
As of December 31, 2010, our total amount of unrecognized tax benefits was $7.3 million and is considered a long-term obligation. We are currently unable to make reasonably reliable estimates of the periods of cash settlements associated with these obligations.
Recently Issued Accounting Standards
Refer to the "Recent Accounting Pronouncements" discussion at Footnote 2 of the consolidated financial statements, "Significant Accounting Policies."
Item 7A. Quantitative and Qualitative Disclosures About Market Risk
Market risk represents the risk of loss arising from adverse changes in market rates and foreign exchange rates.
Our interest income is sensitive to changes in the general level of U.S. interest rates, particularly since a significant portion of our investments are and will be in short-term and long-term marketable
45
securities, U.S. government securities and corporate bonds. Due to the nature and maturity of our short-term investments, we have concluded that there is no material market risk exposure to our principal at December 31, 2010. The estimated average maturity of our investment portfolio is less than one year. As of December 31, 2010, a one percentage point change in interest rates throughout a one-year period would have an annual effect of approximately $1.0 million on our income before income taxes.
During the year ended December 31, 2010, we derived nearly 90% of our revenues from sales outside the U.S., and maintain research, sales, marketing, or business development offices in seven foreign countries. Therefore, our results could be negatively affected by such factors as changes in foreign currency exchange rates, trade protection measures, longer accounts receivable collection patterns, and changes in regional or worldwide economic or political conditions. The risks of our international operations are mitigated in part by the extent to which our revenues are denominated in U.S. dollars and, accordingly, we are not exposed to significant foreign currency risk on these items. We do have limited foreign currency risk on certain revenues and operating expenses such as salaries and overhead costs of our foreign operations and a small amount of cash maintained by these operations. Revenues denominated in foreign currencies accounted for approximately 4% of total revenues during 2010. Operating expenses, including cost of sales, for our foreign subsidiaries were approximately $16.5 million in 2010. Based upon these expenses for 2010, a 10% or greater change in foreign currency rates throughout a one-year period could have a material impact on our operating income.
Our international business is subject to risks, including, but not limited to, differing economic conditions, changes in political climate, differing tax structures, other regulations and restrictions, and foreign exchange rate volatility when compared to the U.S. dollar. Accordingly, our future results could be materially impacted by changes in these or other factors.
We are also affected by exchange rate fluctuations as the financial statements of our foreign subsidiaries are translated into the U.S. dollar in consolidation. As exchange rates vary, these results, when translated, may vary from expectations and could adversely or positively impact overall profitability. During 2010, the impact of foreign exchange rate fluctuations related to translation of our foreign subsidiaries' financial statements was immaterial to comprehensive income.
46
Item 8. Financial Statements and Supplementary Data
DTS, INC.
INDEX TO CONSOLIDATED FINANCIAL STATEMENTS
47
REPORT OF INDEPENDENT REGISTERED PUBLIC ACCOUNTING FIRM
Board
of Directors and Stockholders
DTS, Inc.
We have audited the accompanying consolidated balance sheets of DTS, Inc. as of December 31, 2010 and 2009, and the related consolidated statements of income, stockholders' equity, and cash flows for each of the three years in the period ended December 31, 2010. Our audits of the basic financial statements included the financial statement schedule listed in the index appearing under Item 15(a)(2). These financial statements and financial statement schedule are the responsibility of the Company's management. Our responsibility is to express an opinion on these financial statements and financial statement schedule based on our audits.
We conducted our audits in accordance with the standards of the Public Company Accounting Oversight Board (United States). Those standards require that we plan and perform the audit to obtain reasonable assurance about whether the financial statements are free of material misstatement. An audit includes examining, on a test basis, evidence supporting the amounts and disclosures in the financial statements. An audit also includes assessing the accounting principles used and significant estimates made by management, as well as evaluating the overall financial statement presentation. We believe that our audits provide a reasonable basis for our opinion.
In our opinion, the consolidated financial statements referred to above present fairly, in all material respects, the financial position of DTS, Inc. as of December 31, 2010 and 2009, and the results of its operations and its cash flows for each of the three years in the period ended December 31, 2010 in conformity with accounting principles generally accepted in the United States of America. Also in our opinion, the related financial statement schedule, when considered in relation to the basic financial statements taken as a whole, presents fairly, in all material respects, the information set forth therein.
We also have audited, in accordance with the standards of the Public Company Accounting Oversight Board (United States), DTS, Inc.'s internal control over financial reporting as of December 31, 2010, based on criteria established in Internal Control—Integrated Framework issued by the Committee of Sponsoring Organizations of the Treadway Commission (COSO) and our report dated March 3, 2011 expressed an unqualified opinion.
/s/
GRANT THORNTON LLP
San Diego, California
March 3, 2011
48
REPORT OF INDEPENDENT REGISTERED PUBLIC ACCOUNTING FIRM ON INTERNAL
CONTROL OVER FINANCIAL REPORTING
Board
of Directors and Stockholders
DTS, Inc.
We have audited DTS, Inc.'s internal control over financial reporting as of December 31, 2010, based on criteria established in Internal Control—Integrated Framework issued by the Committee of Sponsoring Organizations of the Treadway Commission (COSO). DTS, Inc.'s management is responsible for maintaining effective internal control over financial reporting and for its assessment of the effectiveness of internal control over financial reporting, included in the accompanying Management's Report on Internal Control Over Financial Reporting. Our responsibility is to express an opinion on DTS, Inc.'s internal control over financial reporting based on our audit.
We conducted our audit in accordance with the standards of the Public Company Accounting Oversight Board (United States). Those standards require that we plan and perform the audit to obtain reasonable assurance about whether effective internal control over financial reporting was maintained in all material respects. Our audit included obtaining an understanding of internal control over financial reporting, assessing the risk that a material weakness exists, testing and evaluating the design and operating effectiveness of internal control based on the assessed risk, and performing such other procedures as we considered necessary in the circumstances. We believe that our audit provides a reasonable basis for our opinion.
A company's internal control over financial reporting is a process designed to provide reasonable assurance regarding the reliability of financial reporting and the preparation of financial statements for external purposes in accordance with generally accepted accounting principles. A company's internal control over financial reporting includes those policies and procedures that (1) pertain to the maintenance of records that, in reasonable detail, accurately and fairly reflect the transactions and dispositions of the assets of the company; (2) provide reasonable assurance that transactions are recorded as necessary to permit preparation of financial statements in accordance with generally accepted accounting principles, and that receipts and expenditures of the company are being made only in accordance with authorizations of management and directors of the company; and (3) provide reasonable assurance regarding prevention or timely detection of unauthorized acquisition, use, or disposition of the company's assets that could have a material effect on the financial statements.
Because of its inherent limitations, internal control over financial reporting may not prevent or detect misstatements. Also, projections of any evaluation of effectiveness to future periods are subject to the risk that controls may become inadequate because of changes in conditions, or that the degree of compliance with the policies or procedures may deteriorate.
In our opinion, DTS, Inc. maintained, in all material respects, effective internal control over financial reporting as of December 31, 2010, based on criteria established in Internal Control—Integrated Framework issued by COSO.
We also have audited, in accordance with the standards of the Public Company Accounting Oversight Board (United States), the consolidated balance sheets of DTS, Inc. as of December 31, 2010 and 2009, and the related statements of income, stockholders' equity, and cash flows for each of the three years in the period ended December 31, 2010 and our report dated March 3, 2011 expressed an unqualified opinion.
/s/
GRANT THORNTON LLP
San Diego, California
March 3, 2011
49
DTS, INC.
CONSOLIDATED BALANCE SHEETS
| |
As of December 31, | |||||||||
|---|---|---|---|---|---|---|---|---|---|---|
| |
2010 | 2009 | ||||||||
| |
(Amounts in thousands, except per share amounts) |
|||||||||
ASSETS |
||||||||||
Current assets: |
||||||||||
Cash and cash equivalents |
$ | 41,744 | $ | 42,222 | ||||||
Short-term investments |
54,387 | 33,129 | ||||||||
Accounts receivable, net of allowance for doubtful accounts of $226 and $229 at December 31, 2010 and 2009, respectively |
6,078 | 5,731 | ||||||||
Deferred income taxes |
5,551 | 4,945 | ||||||||
Prepaid expenses and other current assets |
1,666 | 1,617 | ||||||||
Income taxes receivable, net |
2,099 | 2,613 | ||||||||
Total current assets |
111,525 | 90,257 | ||||||||
Property and equipment, net |
33,638 | 33,885 | ||||||||
Intangible assets, net |
7,525 | 6,565 | ||||||||
Goodwill |
1,257 | 1,257 | ||||||||
Deferred income taxes |
12,192 | 13,152 | ||||||||
Long-term investments |
5,313 | 8,515 | ||||||||
Other assets |
845 | 587 | ||||||||
Total assets |
$ | 172,295 | $ | 154,218 | ||||||
LIABILITIES AND STOCKHOLDERS' EQUITY |
||||||||||
Current liabilities: |
||||||||||
Accounts payable |
$ | 774 | $ | 826 | ||||||
Accrued expenses |
9,659 | 5,663 | ||||||||
Deferred revenue |
5,698 | 43 | ||||||||
Total current liabilities |
16,131 | 6,532 | ||||||||
Other long-term liabilities |
8,596 | 5,862 | ||||||||
Commitments and contingencies (Note 9) |
||||||||||
Stockholders' equity: |
||||||||||
Preferred stock—$0.0001 par value, 5,000 shares authorized at December 31, 2010 and 2009; no shares issued and outstanding |
— | — | ||||||||
Common stock—$0.0001 par value, 70,000 shares authorized at December 31, 2010 and 2009; 20,325 and 19,652 shares issued at December 31, 2010 and 2009, respectively; 17,325 and 17,522 shares outstanding at December 31, 2010 and 2009, respectively |
3 | 2 | ||||||||
Additional paid-in capital |
180,708 | 161,710 | ||||||||
Treasury stock, at cost—3,000 and 2,130 at December 31, 2010 and 2009, respectively |
(74,923 | ) | (45,498 | ) | ||||||
Accumulated other comprehensive income |
491 | 362 | ||||||||
Retained earnings |
41,289 | 25,248 | ||||||||
Total stockholders' equity |
147,568 | 141,824 | ||||||||
Total liabilities and stockholders' equity |
$ | 172,295 | $ | 154,218 | ||||||
See accompanying notes to consolidated financial statements.
50
DTS, INC.
CONSOLIDATED STATEMENTS OF INCOME
| |
For the Years Ended December 31, | |||||||||||
|---|---|---|---|---|---|---|---|---|---|---|---|---|
| |
2010 | 2009 | 2008 | |||||||||
| |
(Amounts in thousands, except per share amounts) |
|||||||||||
Revenue |
$ | 87,096 | $ | 77,722 | $ | 60,238 | ||||||
Cost of revenue |
1,583 | 1,766 | 1,179 | |||||||||
Gross profit |
85,513 | 75,956 | 59,059 | |||||||||
Operating expenses: |
||||||||||||
Selling, general and administrative |
49,035 | 48,717 | 36,794 | |||||||||
Research and development |
12,075 | 9,087 | 6,924 | |||||||||
In-process research and development |
— | — | 1,090 | |||||||||
Total operating expenses |
61,110 | 57,804 | 44,808 | |||||||||
Operating income |
24,403 | 18,152 | 14,251 | |||||||||
Interest and other income, net |
418 | 1,063 | 2,418 | |||||||||
Income from continuing operations before income taxes |
24,821 | 19,215 | 16,669 | |||||||||
Provision for income taxes |
9,781 | 8,525 | 7,158 | |||||||||
Income from continuing operations |
15,040 | 10,690 | 9,511 | |||||||||
Income (loss) from discontinued operations, net of tax |
1,001 | (88 | ) | 1,856 | ||||||||
Net income |
$ | 16,041 | $ | 10,602 | $ | 11,367 | ||||||
Net income per common share: |
||||||||||||
Basic: |
||||||||||||
Continuing operations |
$ | 0.88 | $ | 0.62 | $ | 0.54 | ||||||
Discontinued operations |
0.06 | — | 0.10 | |||||||||
Net income |
$ | 0.94 | $ | 0.62 | $ | 0.64 | ||||||
Diluted: |
||||||||||||
Continuing operations |
$ | 0.84 | $ | 0.60 | $ | 0.52 | ||||||
Discontinued operations |
0.06 | — | 0.11 | |||||||||
Net income |
$ | 0.90 | $ | 0.60 | $ | 0.63 | ||||||
Weighted average shares used to compute net income per common share: |
||||||||||||
Basic |
17,041 | 17,145 | 17,641 | |||||||||
Diluted |
17,805 | 17,689 | 18,145 | |||||||||
See accompanying notes to consolidated financial statements.
51
DTS, INC.
CONSOLIDATED STATEMENTS OF STOCKHOLDERS' EQUITY
| |
Common Stock | |
|
Accumulated Other Comprehensive Income |
|
|
||||||||||||||||||
|---|---|---|---|---|---|---|---|---|---|---|---|---|---|---|---|---|---|---|---|---|---|---|---|---|
| |
Additional Paid-in Capital |
Treasury Stock |
Retained Earnings |
Total Stockholders' Equity |
||||||||||||||||||||
| |
Shares | Amount | ||||||||||||||||||||||
| |
(Amounts in thousands) |
|||||||||||||||||||||||
Balance at December 31, 2007 |
17,669 | $ | 2 | $ | 140,008 | $ | (22,670 | ) | $ | 193 | $ | 3,279 | $ | 120,812 | ||||||||||
Exercise of options and related tax benefit of $206 |
456 | — | 7,185 | — | — | — | 7,185 | |||||||||||||||||
Issuance of common stock under employee stock purchase plan |
37 | — | 641 | — | — | — | 641 | |||||||||||||||||
Restricted stock award grants, net of forfeitures and shares withheld for taxes |
128 | — | (595 | ) | — | — | — | (595 | ) | |||||||||||||||
Stock-based compensation charge |
— | 4,655 | — | — | — | 4,655 | ||||||||||||||||||
Stock repurchases |
(1,000 | ) | — | — | (18,938 | ) | — | — | (18,938 | ) | ||||||||||||||
Comprehensive income: |
||||||||||||||||||||||||
Net income |
— | — | — | — | — | 11,367 | 11,367 | |||||||||||||||||
Other comprehensive income |
— | — | — | — | 162 | — | 162 | |||||||||||||||||
Total comprehensive income |
— | — | — | — | — | — | 11,529 | |||||||||||||||||
Balance at December 31, 2008 |
17,290 | 2 | 151,894 | (41,608 | ) | 355 | 14,646 | 125,289 | ||||||||||||||||
Exercise of options and related tax benefit of $491 |
184 | — | 3,578 | — | — | — | 3,578 | |||||||||||||||||
Issuance of common stock under employee stock purchase plan |
69 | — | 956 | — | — | — | 956 | |||||||||||||||||
Restricted stock award grants, net of forfeitures and shares withheld for taxes |
109 | — | (368 | ) | — | — | — | (368 | ) | |||||||||||||||
Stock-based compensation charge |
— | 5,650 | — | — | — | 5,650 | ||||||||||||||||||
Stock repurchases |
(130 | ) | — | — | (3,890 | ) | — | — | (3,890 | ) | ||||||||||||||
Comprehensive income: |
||||||||||||||||||||||||
Net income |
— | — | — | — | — | 10,602 | 10,602 | |||||||||||||||||
Other comprehensive income |
— | — | — | — | 7 | — | 7 | |||||||||||||||||
Total comprehensive income |
— | — | — | — | — | — | 10,609 | |||||||||||||||||
Balance at December 31, 2009 |
17,522 | 2 | 161,710 | (45,498 | ) | 362 | 25,248 | 141,824 | ||||||||||||||||
Exercise of options and related tax benefit of $628 |
628 | — | 11,607 | — | — | — | 11,607 | |||||||||||||||||
Issuance of common stock under employee stock purchase plan |
82 | 1 | 1,198 | — | — | — | 1,199 | |||||||||||||||||
Restricted stock award forfeitures and shares withheld for taxes |
(39 | ) | — | (1,132 | ) | — | — | — | (1,132 | ) | ||||||||||||||
Restricted stock unit vesting |
2 | — | — | — | — | — | — | |||||||||||||||||
Stock-based compensation charge |
— | 7,325 | — | — | — | 7,325 | ||||||||||||||||||
Stock repurchases |
(870 | ) | — | — | (29,425 | ) | — | — | (29,425 | ) | ||||||||||||||
Comprehensive income: |
||||||||||||||||||||||||
Net income |
— | — | — | — | — | 16,041 | 16,041 | |||||||||||||||||
Other comprehensive income |
— | — | — | — | 129 | — | 129 | |||||||||||||||||
Total comprehensive income |
— | — | — | — | — | — | 16,170 | |||||||||||||||||
Balance at December 31, 2010 |
17,325 | $ | 3 | $ | 180,708 | $ | (74,923 | ) | $ | 491 | $ | 41,289 | $ | 147,568 | ||||||||||
See accompanying notes to consolidated financial statements.
52
DTS, INC.
CONSOLIDATED STATEMENTS OF CASH FLOWS
| |
For the Years Ended December 31, | ||||||||||||
|---|---|---|---|---|---|---|---|---|---|---|---|---|---|
| |
2010 | 2009 | 2008 | ||||||||||
| |
(Amounts in thousands) |
||||||||||||
Cash flows from operating activities: |
|||||||||||||
Net income |
$ | 16,041 | $ | 10,602 | $ | 11,367 | |||||||
Adjustments to reconcile net income to net cash provided by operating activities: |
|||||||||||||
Depreciation and amortization |
4,881 | 3,828 | 2,672 | ||||||||||
Adjustment to carrying value of assets held for sale |
— | — | (4,963 | ) | |||||||||
Loss (gain) on sale of assets from discontinued operations |
(2,000 | ) | — | 2,099 | |||||||||
Stock-based compensation charges |
7,325 | 5,650 | 4,655 | ||||||||||
Deferred income taxes |
354 | (308 | ) | (429 | ) | ||||||||
In-process research and development |
— | — | 1,090 | ||||||||||
Tax benefits from stock-based awards |
628 | 491 | 206 | ||||||||||
Excess tax benefits from stock-based awards |
(508 | ) | (640 | ) | (204 | ) | |||||||
Other |
163 | 214 | 226 | ||||||||||
Changes in operating assets and liabilities: |
|||||||||||||
Accounts receivable |
(347 | ) | 2,786 | 3,950 | |||||||||
Prepaid expenses and other assets |
(307 | ) | (299 | ) | (684 | ) | |||||||
Accounts payable, accrued expenses and other liabilities |
5,646 | (267 | ) | (87 | ) | ||||||||
Deferred revenue |
6,615 | (15 | ) | 479 | |||||||||
Income taxes receivable |
514 | (146 | ) | (332 | ) | ||||||||
Net cash provided by operating activities |
39,005 | 21,896 | 20,045 | ||||||||||
Cash flows from investing activities: |
|||||||||||||
Purchases of investments: |
|||||||||||||
Held-to-maturity |
(69,143 | ) | (45,143 | ) | (59,149 | ) | |||||||
Available for sale |
— | — | (12,909 | ) | |||||||||
Maturities of held-to-maturity investments |
48,837 | 49,261 | 36,050 | ||||||||||
Sales of available for sale investments |
2,250 | 2,950 | 37,175 | ||||||||||
Proceeds from the sale of assets from discontinued operations |
2,000 | — | 8,578 | ||||||||||
Cash paid for business and technology acquisitions, net |
— | (330 | ) | (7,726 | ) | ||||||||
Purchase of property and equipment |
(3,172 | ) | (12,173 | ) | (19,969 | ) | |||||||
Purchase of intangible assets |
(2,384 | ) | (322 | ) | (584 | ) | |||||||
Net cash used in investing activities |
(21,612 | ) | (5,757 | ) | (18,534 | ) | |||||||
Cash flows from financing activities: |
|||||||||||||
Proceeds from the issuance of common stock under stock-based compensation plans |
12,178 | 4,043 | 7,620 | ||||||||||
Repurchase of common stock for restricted stock withholdings |
(1,132 | ) | (368 | ) | (595 | ) | |||||||
Excess tax benefits from stock-based awards |
508 | 640 | 204 | ||||||||||
Purchase of treasury stock |
(29,425 | ) | (3,890 | ) | (18,938 | ) | |||||||
Net cash provided by (used in) financing activities |
(17,871 | ) | 425 | (11,709 | ) | ||||||||
Net change in cash and cash equivalents of discontinued operations |
— | — | 333 | ||||||||||
Net increase (decrease) in cash and cash equivalents |
(478 | ) | 16,564 | (9,865 | ) | ||||||||
Cash and cash equivalents, beginning of the year |
42,222 | 25,658 | 35,523 | ||||||||||
Cash and cash equivalents, end of the year |
$ | 41,744 | $ | 42,222 | $ | 25,658 | |||||||
Supplemental disclosure of cash flow information: |
|||||||||||||
Cash paid for income taxes |
$ | 1,903 | $ | 2,028 | $ | 167 | |||||||
See accompanying notes to consolidated financial statements.
53
DTS, INC.
NOTES TO CONSOLIDATED FINANCIAL STATEMENTS
(Amounts in thousands, except per share data)
Note 1—The Company
DTS, Inc. (the "Company") is a leading provider of high-quality branded entertainment technologies, which are incorporated into an array of entertainment products by hundreds of licensee customers around the world. The Company's audio technologies enable the delivery and playback of clear, compelling high-definition audio and is currently used in a variety of product applications, including audio/video receivers, Blu-ray Disc players, DVD based products, personal computers or PCs, car audio products, video game consoles, network capable televisions, digital media players, set-top-boxes, mobile phones and home theater systems. In addition, the Company provides products and services to motion picture studios, radio and television broadcasters, game developers and other content creators to facilitate the inclusion of compelling, realistic DTS-encoded soundtracks in movies, sporting events, television shows and music content. The Company also provides a suite of audio processing technologies designed to enhance the entertainment experience from products subject to physical limitations, such as TVs, PCs and smartphones.
The Company commenced operations in 1990 as Digital Theater Systems Corporation ("DTS Corp"). In 1993, DTS Corp became the general partner of Digital Theater Systems, L.P., a Delaware limited partnership ("the Partnership"). In 1994, the Partnership formed DTS Technology, LLC ("DTS Technology") to develop audio technologies for the consumer electronics and other markets. On October 24, 1997, the Company completed a reorganization and tax-free exchange with the predecessor entities and was incorporated in Delaware. The reorganization and formation of the Company was accounted for as a transaction by entities under common control and was effected by each of the former stockholders and owners of DTS Corp, the Partnership and DTS Technology receiving an ownership interest in the Company, represented by shares of common stock and warrants to acquire shares of common stock, substantially equivalent to their previous interests in DTS Corp, the Partnership and DTS Technology. On July 9, 2003, the Company completed its initial public offering for the sale of 4,091 shares of common stock at a price to the public of $17.00 per share. All of the shares of common stock sold in the offering were registered under the Securities Act of 1933, as amended (the "Securities Act") on a Registration Statement on Form S-1 (Reg. No. 333-104761) that was declared effective by the Securities and Exchange Commission (the "SEC") on July 9, 2003 and a Registration Statement filed pursuant to Rule 426(b) under the Securities Act that was filed on July 9, 2003 (Reg. No. 333-106920). In May 2005, the Company changed its name from Digital Theater Systems, Inc. to DTS, Inc.
In January 2007, the Company combined its cinema and digital images businesses into a single business known as "DTS Digital Cinema." In February 2007, the Company's Board of Directors approved a plan to sell DTS Digital Cinema to enable the Company to focus exclusively on licensing branded entertainment technology to the large and evolving audio, game console, personal computer, portable, broadcast, and other markets. During the second quarter of 2008, the Company sold its cinema and digital images businesses in two separate transactions. For additional information, refer to Footnotes 2 and 11 of the consolidated financial statements, "Significant Accounting Policies" and "Discontinued Operations", respectively.
On December 31, 2008, the Company entered into an Asset Purchase Agreement with Neural Audio Corporation ("Neural") and its stockholders providing for the sale to the Company of substantially all of Neural's assets used in the conduct of its audio technology business and certain patents and patent applications owned by such stockholders and the assumption by the Company of certain liabilities of Neural. The sale was consummated the same day. For additional information, refer to Footnote 8 of the consolidated financial statements, "Business Combination."
54
DTS, INC.
NOTES TO CONSOLIDATED FINANCIAL STATEMENTS (Continued)
(Amounts in thousands, except per share data)
Note 2—Significant Accounting Policies
Principles of Consolidation
The accompanying consolidated financial statements have been prepared in accordance with generally accepted accounting principles in the United States of America ("GAAP") and pursuant to the rules and regulations of the SEC. The consolidated financial statements include the accounts of the Company and its subsidiaries. All material intercompany accounts and transactions have been eliminated.
Discontinued Operations
During the first quarter of 2007, DTS Digital Cinema's assets and liabilities were classified as held for sale and its operations were reported as discontinued operations. As a result, in 2007, the Company reclassified its balance sheets and statements of income for all periods presented in this report to reflect DTS Digital Cinema as discontinued operations. In the statements of cash flows, the cash flows of discontinued operations are not separately classified or aggregated, and are reported in the respective categories with those of continuing operations.
Assets that were classified as held for sale were measured at the lower of their carrying amount or fair value less cost to sell and were not depreciated (amortized) while classified as held for sale. Fair value of assets held for sale was based on estimates of future cash flows, which may have included expected proceeds to be received or the present value of estimated future cash flows. Costs to sell were the direct incremental costs estimated to transact a sale. A loss was recognized for any initial or subsequent write-down to fair value less cost to sell. A gain was recognized for any subsequent increase in fair value less cost to sell, but not in excess of the cumulative loss previously recognized. For additional information, refer to Footnote 11 of the consolidated financial statements, "Discontinued Operations."
All discussions and amounts in the consolidated financial statements and related notes, except for cash flows, for all periods presented relate to continuing operations only, unless otherwise noted.
Use of Estimates
The preparation of financial statements in accordance with GAAP and pursuant to the rules and regulations of the SEC requires management to make estimates and assumptions that affect the reported amounts of assets and liabilities, disclosure of contingent assets and liabilities at the date of the financial statements, and the reported amounts of revenues and expenses during the reporting period. On an on-going basis, the Company evaluates its estimates and assumptions, including those related to revenue recognition, adequacy of allowance for doubtful accounts, valuation of long-lived assets, stock-based compensation and income taxes. The Company bases its estimates on historical and anticipated results, trends and on various other assumptions that it believes are reasonable under the circumstances, including assumptions as to future events. These estimates form the basis for making assumptions about the carrying values of assets and liabilities that are not readily apparent from other sources. By their nature, estimates are subject to an inherent degree of uncertainty. Actual results could differ from those estimates.
55
DTS, INC.
NOTES TO CONSOLIDATED FINANCIAL STATEMENTS (Continued)
(Amounts in thousands, except per share data)
Note 2—Significant Accounting Policies (Continued)
Reclassifications
Certain prior period amounts have been reclassified to conform to current year presentation.
Cash and Cash Equivalents
The Company considers all short-term highly liquid investments with an original maturity of three months or less, when acquired, to be cash equivalents. Cash and cash equivalents consist of funds held in general checking accounts, money market accounts, municipal securities and United States ("U.S.") government and agency securities. Cash and cash equivalents are stated at cost plus accrued interest, which approximates fair value.
Investments
The Company considers, at the time that they are purchased, investments with maturities greater than three months, but less than one year, to be short-term investments. Investments that have maturities of more than one year are classified as long-term investments. Investments classified as available-for-sale are reported at fair value with unrealized gains or losses, if any, reported, net of tax, in accumulated other comprehensive income. Investments in debt securities classified as held-to-maturity, consistent with the Company's intent and ability to hold, are reported at amortized cost. All income generated and realized gains or losses from investments are recorded to interest and other income, net.
The Company reviews its investments to identify and evaluate investments that have an indication of possible impairment. Factors considered in determining whether a loss is temporary include the length of time and extent to which fair value has been less than the cost basis, the financial condition and near-term prospects of the investee, and our intent and ability to hold the investment for a period of time sufficient to allow for any anticipated recovery in market value. Credit losses and other-than-temporary impairments declines in fair value that are not expected to recover are charged to interest and other income, net.
Concentration of Business and Credit Risk
The Company markets its products and services to consumer electronics product manufacturers in the U.S. and internationally. Although the Company is generally subject to the financial well being of the consumer electronics industry, management does not believe that the Company is subject to significant credit risk with respect to trade accounts receivable. Additionally, the Company performs ongoing credit evaluations of its customers and maintains allowances for potential credit losses which, when realized, have generally been within the range of management's expectations.
Two customers accounted for 17% and 15%, respectively, of revenues for the year ended December 31, 2010. Two customers accounted for 15% and 13%, respectively, of revenues for the year ended December 31, 2009. One customer accounted for 19% of revenues for the year ended December 31, 2008. The revenue from the customer accounting for 13% of revenues for the year ended December 31, 2009 is the only activity within this discussion that resulted from a non-recurring intellectual property compliance or enforcement activity. For additional information, see the "Revenue Recognition" significant accounting policy below.
56
DTS, INC.
NOTES TO CONSOLIDATED FINANCIAL STATEMENTS (Continued)
(Amounts in thousands, except per share data)
Note 2—Significant Accounting Policies (Continued)
Four customers accounted for 27%, 17%, 13% and 11%, respectively, of accounts receivable at December 31, 2010. Two customers accounted for 26% and 10%, respectively, of accounts receivable at December 31, 2009.
The Company deposits its cash and cash equivalents in accounts with major financial institutions worldwide. At times, such deposits may be in excess of insured limits. The Company's investment accounts are with major financial institutions and include investment grade municipal securities and U.S. agency securities. The Company has not incurred any significant losses on its investments.
Allowance For Doubtful Accounts
The Company continually monitors customer payments and maintains a reserve for estimated losses resulting from its customers' inability to make required payments. In determining the reserve, the Company evaluates the collectibility of its accounts receivable based upon a variety of factors. In cases where the Company becomes aware of circumstances that may impair a specific customer's ability to meet its financial obligations, the Company records a specific allowance against amounts due. For all other customers, the Company recognizes allowances for doubtful accounts based on its historical write-off experience in conjunction with the length of time the receivables are past due, customer creditworthiness, geographic risk and the current business environment. Actual future losses from uncollectible accounts may differ from the Company's estimates.
Property and Equipment
Property and equipment are recorded at cost, less accumulated depreciation. Depreciation is calculated using the straight-line method over the related assets' estimated useful lives, generally as follows:
Machinery and equipment |
2 to 5 years | |
Software |
2 to 7 years | |
Office furniture and fixtures |
3 to 7 years | |
Leasehold improvements |
Lesser of useful life or related lease term | |
Building and improvements |
Up to 35 years |
Expenditures that materially increase asset life are capitalized, while ordinary maintenance and repairs are expensed as incurred.
Capitalized Software Costs
The Company capitalizes the costs of purchased software licenses, consulting costs and payroll-related costs incurred in developing or implementing internal use computer software. These costs are included in property and equipment, net on the accompanying consolidated balance sheets. Costs incurred during the preliminary project and post-implementation stages are charged to expense. The Company's capitalized software costs are amortized on a straight-line basis over the estimated useful life of the software upon being placed in service, generally two to seven years.
57
DTS, INC.
NOTES TO CONSOLIDATED FINANCIAL STATEMENTS (Continued)
(Amounts in thousands, except per share data)
Note 2—Significant Accounting Policies (Continued)
Long-Lived Assets
The Company periodically assesses potential impairments to its long-lived assets in accordance with GAAP, which requires, among other things, that an entity perform an impairment review whenever events or changes in circumstances indicate that the carrying value may not be fully recoverable. Factors considered by the Company include, but are not limited to: significant underperformance relative to expected historical or projected future operating results; significant changes in the manner of use of the acquired assets or the strategy for the Company's overall business; and significant negative industry or economic trends. When the Company determines that the carrying value of a long-lived asset may not be recoverable based upon the existence of one or more of the above indicators of impairment, the Company estimates the future undiscounted cash flows expected to result from the use of the asset and its eventual disposition. If the sum of the expected future undiscounted cash flows and eventual disposition is less than the carrying amount of the asset, the Company recognizes an impairment loss. An impairment loss is reflected as the amount by which the carrying amount of the asset exceeds the fair market value of the asset, based on the fair market value if available, or discounted cash flows. To date, there has been no impairment of long-lived assets for continuing operations.
Goodwill and Intangible Assets
The Company accounts for goodwill in accordance with GAAP which, among other things, establishes standards for goodwill acquired in a business combination, eliminates the amortization of goodwill and requires the carrying value of goodwill and certain non-amortizing intangibles to be evaluated for impairment on an annual basis. The Company considers its market capitalization and the carrying value of its assets and liabilities, including goodwill, when performing its goodwill impairment test, as it operates as a single reporting unit. If the carrying value of the assets and liabilities, including goodwill, were to exceed the Company's estimation of the fair value, the Company would record an impairment charge in an amount equal to the excess of the carrying value of goodwill over the implied fair value of the goodwill. The Company performs an evaluation of goodwill as of October 31 of each year, absent any indicators of earlier impairment, to ensure that impairment charges, if applicable, are reflected in our financial results before December 31 of each year. To date, there has been no impairment of goodwill for continuing operations.
The Company accounts for intangible assets in accordance with GAAP, which requires that intangible assets with definite lives be amortized over their estimated useful lives and reviewed for impairment whenever events or changes in circumstances indicate an asset's carrying value may not be recoverable. Recoverability of an asset is measured by comparison of its carrying amount to the expected future undiscounted cash flows that the asset is expected to generate. If it is determined that an asset is not recoverable, an impairment loss is recorded in the amount by which the carrying amount of the asset exceeds its fair value. The Company's intangible assets principally consist of acquired technology and developed patents and trademarks, which are being amortized over their respective lives. To date, there has been no impairment of intangible assets for continuing operations.
Costs incurred in securing patents and trademarks and protecting the Company's proprietary technology and brand name are capitalized. Patent and trademark costs are amortized over their
58
DTS, INC.
NOTES TO CONSOLIDATED FINANCIAL STATEMENTS (Continued)
(Amounts in thousands, except per share data)
Note 2—Significant Accounting Policies (Continued)
estimated useful lives, typically ten years and five years, respectively. The amortization period commences when the patent or trademark is issued.
Business Combinations
For business combinations consummated prior to January 1, 2009, the Company used the purchase method of accounting, in accordance with Statement of Financial Accounting Standards ("SFAS") No. 141, "Business Combinations." Accordingly, the assets and liabilities of the acquired entities were recorded at their estimated fair values at the date of acquisition. Goodwill represents the excess of the purchase price over the fair value of net assets, including the amount assigned to identifiable intangible assets.
The purchase price allocation process requires an analysis of the fair values of the assets acquired and the liabilities assumed. When a business combination agreement provides for an adjustment to the cost of the combination contingent on future events, the Company includes that adjustment in the cost of the combination when the contingent consideration is determinable beyond a reasonable doubt and can be reliably estimated and should not otherwise be expensed according to the provisions of SFAS No. 141. The results of operations of the acquired business are included in the Company's consolidated financial statements from the respective date of acquisition.
For additional information, refer to Footnote 8 of the consolidated financial statements, "Business Combination."
During 2010 and 2009, the Company did not engage in any business combinations.
Revenue Recognition
The Company recognizes revenue when persuasive evidence of a sales arrangement exists, delivery has occurred or services have been rendered, the buyer's price is fixed or determinable and collection is reasonably assured.
Revenue from licensing audio technology, trademarks and know-how is generated from licensing agreements with consumer electronics product manufacturers that pay a per-unit license fee for products manufactured under those license agreements. Licensees generally report manufacturing information within 30 to 60 days after the end of the quarter in which such activity takes place. Consequently, the Company recognizes revenue from these licensing agreements on a three-month lag basis, generally in the quarter following the quarter of manufacture, provided amounts are fixed or determinable and collection is reasonably assured, since the Company cannot reliably estimate the amount of revenue earned prior to the receipt of such reports. Use of this lag method allows for the receipt of licensee royalty reports prior to the recognition of revenue. Also, the Company is responsible for the licensing and enforcement of its patented technologies and pursues third parties that are utilizing its intellectual property without a license or who have under-reported the amount of royalties owed under a license agreement with it. As a result of these activities, from time to time, the Company may recognize royalty revenues that relate to infringements that occurred in prior periods. These royalty recoveries may cause revenues to be higher than expected during a particular reporting period and may not occur in subsequent periods. Differences between amounts initially recognized and
59
DTS, INC.
NOTES TO CONSOLIDATED FINANCIAL STATEMENTS (Continued)
(Amounts in thousands, except per share data)
Note 2—Significant Accounting Policies (Continued)
amounts subsequently audited or reported as an adjustment to those amounts due from licensees, will be recognized in the period such adjustment is determined or contracted, as appropriate.
Deferred revenues arise primarily from payments for licensing audio technology received in advance of the culmination of the earnings process. Deferred revenues expected to be recognized within the next twelve months are classified within current liabilities. Deferred revenues will be recognized as revenue in future periods when the applicable revenue recognition criteria are met.
Revenue from the sale of multi-channel audio content is recorded upon delivery to retail accounts or end customers, assuming title and risk of loss has transferred to the customer, prices are fixed or determinable, no significant Company obligations remain and collection of the related receivable is reasonably assured. The Company's shipping terms are customarily FOB shipping point with title transfer and risk of loss transferring to the customer upon shipment.
Management provides for returns on product sales based on historical experience and adjusts such reserves as considered necessary.
The Company recognizes revenue net of unamortized discounts based on imputed interest for the time value of money when the payment terms extend beyond one year. The related accounts receivable, net of unamortized discount, is classified as short or long-term, as appropriate, and the unamortized discount is recognized as interest income at a constant rate over the duration of the payment terms.
Licensing revenue is recognized gross of withholding taxes that are remitted by the Company's licensees directly to their local tax authorities. For the years ended December 31, 2010, 2009 and 2008, withholding taxes were $5,305, $4,029 and $3,491, respectively.
Research and Development ("R&D") Costs
The Company conducts its R&D internally and expenses are comprised of the following types of costs incurred in performing research and development activities: salaries and benefits, allocated overhead, contract services, consultants and other outside costs. In accordance with GAAP, all R&D costs are expensed as incurred.
Acquired In-process Research and Development ("IPR&D")
For business combinations consummated prior to January 1, 2009, the value assigned to acquired IPR&D was determined by identifying specific acquired IPR&D projects that would be continued and for which the fair value is estimable with reasonable reliability. Upon consummation of a business combination, acquired IPR&D is expensed where (i) technological feasibility has not been established at the acquisition date and (ii) there is no alternative future use.
For additional information, refer to Footnote 8 of the consolidated financial statements, "Business Combination."
During 2010 and 2009, the Company did not engage in any business combinations.
60
DTS, INC.
NOTES TO CONSOLIDATED FINANCIAL STATEMENTS (Continued)
(Amounts in thousands, except per share data)
Note 2—Significant Accounting Policies (Continued)
Foreign Currency Translation
The functional currency of one of the Company's wholly-owned subsidiaries is the currency of the primary economic environment in which it operates. The assets and liabilities of this wholly-owned subsidiary are translated at the prevailing rate of exchange at the balance sheet date, while the results of operations are translated at the average exchange rate in effect for the period. The translation adjustments resulting from translating the functional currency into U.S. dollars have been deferred as a component of accumulated other comprehensive income in stockholders' equity.
The functional currency of the Company's other wholly-owned subsidiaries is the U.S. dollar and accordingly, nonmonetary balance sheet accounts are remeasured with the appropriate historical rates. All other balance sheet accounts are translated at the prevailing rate of exchange at the balance sheet date, while the results of operations are translated at the average exchange rate in effect for the period. The gains and losses resulting from this remeasurement and translation are reflected in the determination of net income.
To date, annual foreign currency translation adjustments, gains and losses have not been significant.
Comprehensive Income
The Company accounts for comprehensive income in accordance with GAAP, and comprehensive income, as defined, includes all changes in stockholders' equity during a period from non-owner sources. To date, accumulated comprehensive income is comprised mostly of foreign currency translation.
Advertising Expenses
Advertising and promotional costs are expensed as incurred and amounted to $3,678, $2,744 and $2,266 for the years ended December 31, 2010, 2009 and 2008, respectively.
Treasury Stock
Repurchased shares of the Company's common stock are held as treasury shares until they are reissued or retired. Should the Company reissue treasury stock, and the proceeds from the sale exceed the average price that was paid by the Company to acquire the shares, the Company would record such excess as an increase in additional paid-in capital. Conversely, if the proceeds from the sale are less than the average price the Company paid to acquire the shares, the Company would record such difference as a decrease in additional paid-in capital to the extent of increases previously recorded, with the balance recorded as a decrease in retained earnings.
Restricted Stock Withholdings
The Company issues restricted stock, awards and units, as part of its equity incentive plans. For a majority of the restricted stock granted, the number of shares released on the date the restricted stock vest is net of the statutory withholding requirements that the Company pays to the appropriate taxing
61
DTS, INC.
NOTES TO CONSOLIDATED FINANCIAL STATEMENTS (Continued)
(Amounts in thousands, except per share data)
Note 2—Significant Accounting Policies (Continued)
authorities on behalf of its employees. The shares repurchased to satisfy the statutory withholding requirements are immediately and effectively retired.
Income Taxes
The Company utilizes the asset and liability method of accounting for income taxes. Under this method, the deferred tax assets and liabilities are measured each year based on the difference between the financial statement and tax bases of assets and liabilities at the applicable enacted tax rates. Additionally, a valuation allowance is recorded for that portion of deferred tax assets for which it is more likely than not that the assets will not be realized. In assessing the need for a valuation allowance, the Company considers all available positive and negative evidence, including scheduled reversals of deferred tax liabilities, projected future taxable income, tax planning strategies and recent financial performance. The deferred tax provision is the result of changes in the deferred tax assets and liabilities. The Company recognizes interest and penalties related to income taxes in the provision for income taxes.
Fair Value of Financial Instruments
The carrying amount of cash, cash equivalents, short-term investments, accounts receivable, accounts payable and accrued liabilities approximates fair value due to the short-term nature of these instruments.
Subsequent Events
The Company has evaluated subsequent events through the date that the consolidated financial statements were issued. Based on this evaluation, there were no material subsequent events that required recognition or disclosure.
Recent Accounting Pronouncements
In October 2009, the Financial Accounting Standards Board ("FASB") issued Accounting Standards Update ("ASU") 2009-13, "Revenue Recognition: Multiple-Deliverable Revenue Arrangements" and ASU 2009-14, "Software: Certain Revenue Arrangements That Include Software Elements." ASU 2009-13 requires entities to allocate revenue in an arrangement using estimated selling prices of the delivered goods and services based on a selling price hierarchy. ASU 2009-13 also eliminates the residual method of revenue allocation and requires revenue to be allocated using the relative selling price method. In addition, ASU 2009-13 expands the disclosure requirements for revenue recognition. ASU 2009-14 removes tangible products from the scope of software revenue guidance and provides guidance on determining whether software deliverables in an arrangement that includes a tangible product are covered by the scope of the software revenue guidance. ASU 2009-13 and ASU 2009-14 will be effective for the first annual reporting period beginning on or after June 15, 2010, with early adoption permitted provided that the revised guidance is retroactively applied to the beginning of the year of adoption. The Company is currently evaluating the future impact of this new accounting update on its consolidated financial statements.
62
DTS, INC.
NOTES TO CONSOLIDATED FINANCIAL STATEMENTS (Continued)
(Amounts in thousands, except per share data)
Note 2—Significant Accounting Policies (Continued)
In January 2010, the FASB issued ASU 2010-6, "Fair Value Measurements and Disclosures: Improving Disclosures About Fair Value Measurements," which requires entities to make new disclosures about recurring or nonrecurring fair value measurements including significant transfers into and out of Level 1 and Level 2 fair value measurements and information on purchases, sales, issuances, and settlements on a gross basis in the reconciliation of Level 3 fair value measurements. ASU 2010-6 is effective for annual reporting periods beginning after December 15, 2009, except for Level 3 reconciliation disclosures which are effective for annual periods beginning after December 15, 2010. The adoption of ASU 2010-6, with respect to Level 1 and Level 2 guidance, did not have a material impact on the Company's consolidated financial statements. The Company is currently evaluating the future impact of this new accounting update, with respect to Level 3 guidance, on its consolidated financial statements.
Note 3—Cash and Investments
Cash and investments consist of the following:
| |
As of December 31, | |||||||||
|---|---|---|---|---|---|---|---|---|---|---|
| |
2010 | 2009 | ||||||||
Cash and cash equivalents: |
||||||||||
Cash |
$ | 14,840 | $ | 28,424 | ||||||
Money market accounts |
17,846 | 13,293 | ||||||||
U.S. government and agency securities |
5,553 | 250 | ||||||||
Municipal securities |
3,505 | 255 | ||||||||
Total cash and cash equivalents |
$ | 41,744 | $ | 42,222 | ||||||
Short-term investments: |
||||||||||
Held-to-maturity securities: |
||||||||||
Certificates of deposit |
$ | 2,018 | $ | 2,470 | ||||||
Commercial paper |
5,648 | 5,303 | ||||||||
U.S. government and agency securities |
34,084 | 15,245 | ||||||||
Municipal securities |
12,637 | 10,111 | ||||||||
Total short-term investments |
$ | 54,387 | $ | 33,129 | ||||||
Long-term investments: |
||||||||||
Available-for-sale securities: |
||||||||||
Municipal securities |
$ | — | $ | 2,250 | ||||||
Held-to-maturity securities: |
||||||||||
Certificates of deposit |
104 | 1,248 | ||||||||
Commercial paper |
— | 3,720 | ||||||||
U.S. government and agency securities |
5,051 | — | ||||||||
Municipal securities |
158 | 1,297 | ||||||||
Total long-term investments |
$ | 5,313 | $ | 8,515 | ||||||
63
DTS, INC.
NOTES TO CONSOLIDATED FINANCIAL STATEMENTS (Continued)
(Amounts in thousands, except per share data)
Note 3—Cash and Investments (Continued)
The Company had no material gross realized or unrealized holding gains or losses from its investments in securities classified as available-for-sale or held-to-maturity for the years ended December 31, 2010, 2009 and 2008.
Investments in auction rate securities are classified as available-for-sale. For additional information, refer to Footnote 4 of the consolidated financial statements, "Fair Value Measurements."
The contractual maturities of investments at December 31, 2010 are as follows:
Held-to-maturity securities: |
|||||
Due within one year |
$ | 54,387 | |||
Due after one year through five years |
5,313 | ||||
Total investments |
$ | 59,700 | |||
Note 4—Fair Value Measurements
During the second quarter of 2010, the Company's remaining auction rate securities were all redeemed at par. As of December 31, 2009, the Company held certain financial assets that were required to be measured at fair value on a recurring basis. These financial assets were the Company's auction rate security instruments, which were classified as available-for-sale investments. The auction rate securities held at December 31, 2009 were tax-exempt municipal bonds issued by governmental entities located within the U.S. that are insured and had a AAA rating.
On October 24, 2008, the Company accepted an offer from UBS AG ("UBS") to liquidate its auction rate securities held in UBS accounts on February 13, 2008. The terms or rights of the UBS offer were publicly filed in a prospectus, dated October 7, 2008. As of December 31, 2009, the Company owned $2,250 par value of these securities. From January 2, 2009 and ending January 4, 2011, the Company had the right, but not the obligation, to sell, at par, these auction rate securities to UBS, and such a transaction would be initiated by UBS. Prior to January 4, 2011, the Company continued to earn and receive all interest that was payable for these auction rate securities. Furthermore, prior to January 4, 2011, UBS, at its sole discretion, may sell, or otherwise dispose of, and/or enter orders in the auctions process with respect to these securities on the Company's behalf so long as it receives par value for the auction rate securities sold. UBS also agreed to use its best efforts to facilitate issuer redemptions and/or to resolve the liquidity concerns of holders of their auction rate securities through restructurings and other means. In addition, UBS agreed to provide "no net cost" loans to holders of the illiquid securities that were subject to bank repurchase, thereby providing the Company with short-term liquidity on its auction rate securities portfolio at no additional cost. As a result of this arrangement with UBS, the Company believes that it had Level 2 inputs within the fair value hierarchy as of December 31, 2009, and par value or cost was a reasonable approximation of fair value.
Due to the Company's belief that it may have taken until January 2011 to liquidate the remaining securities, its auction rate security instruments were classified as long-term investments on the consolidated balance sheet as of December 31, 2009.
64
DTS, INC.
NOTES TO CONSOLIDATED FINANCIAL STATEMENTS (Continued)
(Amounts in thousands, except per share data)
Note 4—Fair Value Measurements (Continued)
The Company's financial assets measured at fair value on a recurring basis were as follows:
| |
|
Fair Value Measurements at Reporting Date Using |
|||||||||||
|---|---|---|---|---|---|---|---|---|---|---|---|---|---|
Auction Rate Securities
|
Total | Quoted Prices in Active Markets for Identical Assets (Level 1) |
Significant Other Observable Inputs (Level 2) |
Significant Unobservable Inputs (Level 3) |
|||||||||
As of December 31, 2009 |
$ | 2,250 | $ | — | $ | 2,250 | $ | — | |||||
Note 5—Property and Equipment
Property and equipment consist of the following:
| |
As of December 31, | |||||||
|---|---|---|---|---|---|---|---|---|
| |
2010 | 2009 | ||||||
Land |
$ | 6,600 | $ | 6,600 | ||||
Building and improvements(1) |
21,057 | 19,946 | ||||||
Machinery and equipment |
2,854 | 2,647 | ||||||
Office furniture and fixtures |
5,045 | 5,300 | ||||||
Leasehold improvements |
1,527 | 1,156 | ||||||
Software |
5,647 | 5,608 | ||||||
|
42,730 | 41,257 | ||||||
Less: Accumulated depreciation |
(9,092 | ) | (7,372 | ) | ||||
Property and equipment, net |
$ | 33,638 | $ | 33,885 | ||||
- (1)
- Beginning in November 2009, the Company is using this building as its new corporate headquarters. Also, depreciation expense for this building and related improvements began as of November 2009.
Depreciation expense was $3,468, $2,281 and $2,042 for the years ended December 31, 2010, 2009 and 2008, respectively.
Note 6—Goodwill and Intangibles
In the year ended December 31, 2008, the Company added $972 to goodwill in connection with the business acquisition from Neural. As a result of purchase price adjustments during 2009, the goodwill from this business acquisition was $1,257 at December 31, 2009. For additional information, refer to Footnote 8 of the consolidated financial statements, "Business Combination."
Included in cost of revenue were $841, $1,031 and $362 of amortization relating to existing technologies for the years ended December 31, 2010, 2009 and 2008, respectively. Included in operating expenses were $572, $516 and $268 of amortization relating to existing technologies, patents and trademarks for the years ended December 31, 2010, 2009 and 2008, respectively. The following table
65
DTS, INC.
NOTES TO CONSOLIDATED FINANCIAL STATEMENTS (Continued)
(Amounts in thousands, except per share data)
Note 6—Goodwill and Intangibles (Continued)
summarizes the weighted average lives and the carrying values of the Company's acquired intangible and other intangible assets by category:
| |
|
As of December 31, 2010 | As of December 31, 2009 | ||||||||||||||||||||
|---|---|---|---|---|---|---|---|---|---|---|---|---|---|---|---|---|---|---|---|---|---|---|---|
| |
Weighted Average Life (Years) |
||||||||||||||||||||||
| |
Gross Amount |
Accumulated Amortization |
Net Carrying Amount |
Gross Amount |
Accumulated Amortization |
Net Carrying Amount |
|||||||||||||||||
Acquired intangible assets: |
|||||||||||||||||||||||
Existing technology |
6 | $ | 6,276 | $ | (3,228 | ) | $ | 3,048 | $ | 6,276 | $ | (2,367 | ) | $ | 3,909 | ||||||||
Contractual rights(1) |
5 | 2,000 | — | 2,000 | — | — | — | ||||||||||||||||
Customer relationships |
7 | 1,050 | (300 | ) | 750 | 1,050 | (150 | ) | 900 | ||||||||||||||
Non-compete |
3 | 515 | (343 | ) | 172 | 515 | (172 | ) | 343 | ||||||||||||||
Tradename |
3 | 190 | (127 | ) | 63 | 190 | (63 | ) | 127 | ||||||||||||||
|
$ | 10,031 | $ | (3,998 | ) | $ | 6,033 | $ | 8,031 | $ | (2,752 | ) | $ | 5,279 | |||||||||
Other intangible assets: |
|||||||||||||||||||||||
Patents |
10 | 1,836 | (684 | ) | 1,152 | 1,502 | (557 | ) | 945 | ||||||||||||||
Trademarks |
5 | 508 | (168 | ) | 340 | 469 | (128 | ) | 341 | ||||||||||||||
|
2,344 | (852 | ) | 1,492 | 1,971 | (685 | ) | 1,286 | |||||||||||||||
Total intangible assets |
$ | 12,375 | $ | (4,850 | ) | $ | 7,525 | $ | 10,002 | $ | (3,437 | ) | $ | 6,565 | |||||||||
- (1)
- Amortization will begin upon the in service date, which is expected to occur in 2011. A final payment of $1,200 is due at the in service date.
The Company expects the future amortization of intangible assets held at December 31, 2010 to be as follows:
Years Ending December 31,
|
Estimated Amortization Expense |
||||
|---|---|---|---|---|---|
2011 |
$ | 1,759 | |||
2012 |
1,552 | ||||
2013 |
1,370 | ||||
2014 |
1,316 | ||||
2015 |
1,300 | ||||
2016 and thereafter |
228 | ||||
Total |
$ | 7,525 | |||
66
DTS, INC.
NOTES TO CONSOLIDATED FINANCIAL STATEMENTS (Continued)
(Amounts in thousands, except per share data)
Note 7—Accrued Expenses
Accrued expenses consist of the following:
| |
As of December 31, | |||||||
|---|---|---|---|---|---|---|---|---|
| |
2010 | 2009 | ||||||
Accrued payroll and related benefits |
$ | 7,264 | $ | 3,969 | ||||
Production advance |
382 | 383 | ||||||
Other |
2,013 | 1,311 | ||||||
Total accrued expenses |
$ | 9,659 | $ | 5,663 | ||||
Note 8—Business Combination
On December 31, 2008, the Company and its wholly-owned subsidiaries, DTS Washington LLC and DTS (BVI) Limited, entered into an Asset Purchase Agreement (the "Agreement") with Neural Audio Corporation (the "Seller") and its stockholders providing for the sale of substantially all of the Seller's assets used in the conduct of its audio technology business to the Company and certain patents and patent applications owned by such stockholders (the "Acquired Assets") and the assumption by the Company of certain liabilities of the Seller. The sale was consummated the same day. Pursuant to the terms of the Agreement, the Company paid cash consideration of approximately $7,500 at closing and may be obligated to pay up to an additional $7,500 in additional cash consideration over the next five years based on performance of certain of the Acquired Assets. The Agreement contains customary representations, warranties and covenants.
On July 21, 2009, the Company and its wholly-owned subsidiaries, DTS Washington LLC and DTS (BVI) Limited, entered into a Settlement Agreement (the "Settlement Agreement") with the Seller and its stockholders providing that $450 be paid to the Company, as the working capital conveyed to the Company was less than the threshold required by the Agreement. The $450 settlement reduced goodwill accordingly.
On November 30, 2009, the Company and its wholly-owned subsidiaries, DTS Washington LLC and DTS (BVI) Limited, entered into an Earnout Buyout And Escrow Release Agreement (the "Buyout and Release Agreement") with the Seller and its stockholders providing that the Company buyout all contingent consideration obligations for $500, as it was independently concluded by both parties to be in their respective best interests. This $500 payment increased goodwill accordingly. The Buyout and Release Agreement also provided that the cash consideration paid at closing that remained in escrow be remitted to the Seller.
The total purchase price for the acquisition of the Acquired Assets and the assumption by the Company of certain liabilities of the Seller is as follows:
Cash |
$ | 7,550 | ||
Direct acquisition costs |
222 | |||
Total estimated purchase price |
$ | 7,772 | ||
This acquisition was accounted for as a purchase business combination in accordance with SFAS No. 141. Under the purchase method of accounting, the total purchase price is allocated to the
67
DTS, INC.
NOTES TO CONSOLIDATED FINANCIAL STATEMENTS (Continued)
(Amounts in thousands, except per share data)
Note 8—Business Combination (Continued)
acquired business' net tangible and intangible assets based on their estimated fair value as of the date of completion of the acquisition. Based on the purchase price and the valuation, the purchase price allocation is as follows:
Accounts receivable |
$ | 127 | |||
Prepaid assets |
5 | ||||
Tangible assets |
180 | ||||
Other assets |
9 | ||||
Amortizable intangible assets: |
|||||
Existing technology |
3,600 | ||||
Customer relationships |
1,050 | ||||
Non-compete |
515 | ||||
Tradename |
190 | ||||
IPR&D |
1,090 | ||||
Goodwill |
1,257 | ||||
Total assets acquired |
8,023 | ||||
Liabilities assumed: |
|||||
Accounts payable |
217 | ||||
Accrued liabilities |
34 | ||||
Total liabilities assumed |
251 | ||||
Total purchase price |
$ | 7,772 | |||
A final estimate of $5,355 has been allocated to amortizable intangible assets consisting of existing technology, customer relationships, non-compete and tradename.
A final estimate of $1,257 has been allocated to goodwill. Goodwill represents the excess of the purchase price over the fair market value of the net tangible and amortizable intangible assets acquired. Goodwill will not be amortized, and it will be tested for impairment at least annually. The goodwill estimate increased $285 during the twelve months ended December 31, 2009 as a result of the aforementioned Settlement and Buyout and Release Agreements, net of additional information relating to the fair value of certain assets and liabilities and the aforementioned additional direct acquisition costs.
The purchase price and the valuation of the net assets acquired have been finalized as of December 31, 2009 or one year from the date of acquisition.
68
DTS, INC.
NOTES TO CONSOLIDATED FINANCIAL STATEMENTS (Continued)
(Amounts in thousands, except per share data)
Note 8—Business Combination (Continued)
IPR&D, relating to development projects which had not reached technological feasibility and that were of no future alternative use, was expensed upon consummation of the acquisition. Other identifiable intangible assets are being amortized over the following estimated economic useful lives:
| |
Estimated Useful Life (Years) |
|||
|---|---|---|---|---|
Existing technology |
7 | |||
Customer relationships |
7 | |||
Non-compete |
3 | |||
Tradename |
3 | |||
Developed technology and IPR&D were identified and valued through extensive interviews, analysis of data provided by Neural concerning development projects, their stage of development, the time and resources needed to complete them, if applicable, and their expected income generating ability and associated risks. Where development projects had reached technological feasibility, they were classified as developed technology and the value assigned to developed technology was capitalized. The income approach, which includes an analysis of the cash flows and risks associated with achieving such cash flows, was the primary technique utilized in valuing acquired IPR&D. Key assumptions for IPR&D included a discount rate of 55% and estimates of revenue growth, cost of sales, operating expenses and taxes.
Note 9—Commitments and Contingencies
Office facilities and certain office equipment are leased under operating leases expiring in various years through 2029. Some leases contain renewal options and escalation clauses including increases in annual rents based upon increases in the consumer price index. Minimum future rental payments under non-cancelable operating leases, net of sublease income, are as follows:
Years Ending December 31,
|
|
|||
|---|---|---|---|---|
2011 |
$ | 1,099 | ||
2012 |
795 | |||
2013 |
752 | |||
2014 |
462 | |||
2015 |
226 | |||
2016 and thereafter |
1,640 | |||
|
$ | 4,974 | ||
Rent expense amounted to $931, $1,436 and $1,145 for the years ended December 31, 2010, 2009 and 2008, respectively.
During its normal course of business, the Company has made certain indemnities, commitments and guarantees under which it may be required to make payments in relation to certain transactions. Those indemnities include intellectual property indemnities to the Company's customers in connection with the sale of its products and the licensing of its technology, indemnities for liabilities associated with the infringement of other parties' technology based upon the Company's products and technology,
69
DTS, INC.
NOTES TO CONSOLIDATED FINANCIAL STATEMENTS (Continued)
(Amounts in thousands, except per share data)
Note 9—Commitments and Contingencies (Continued)
and indemnities to directors and officers of the Company to the maximum extent permitted under the laws of the State of Delaware. The duration of these indemnities, commitments and guarantees varies, and in certain cases, is indefinite. The majority of these indemnities, commitments and guarantees do not provide for any limitation of the maximum potential future payments that the Company could be obligated to make. To date, the Company has not been required to make any payments and has not recorded any liability for these indemnities, commitments and guarantees in the accompanying balance sheets. The Company does, however, accrue for losses for any known contingent liability, including those that may arise from indemnification provisions, when future payment is probable.
In the normal course of business, the Company is subject to certain claims and litigation, including unasserted claims. The Company is of the opinion that, based on information presently available, the outcome of any such legal matters will not have a material adverse effect on the financial position, results of operations or cash flows of the Company.
Note 10—Income Taxes
U.S. and foreign income (loss) before taxes and details of the provision for income taxes are as follows:
| |
Years Ended December 31, | |||||||||||
|---|---|---|---|---|---|---|---|---|---|---|---|---|
| |
2010 | 2009 | 2008 | |||||||||
U.S. |
$ | 1,385 | $ | 2,579 | $ | 2,734 | ||||||
Foreign |
23,436 | 16,636 | 13,935 | |||||||||
Income before income taxes |
$ | 24,821 | $ | 19,215 | $ | 16,669 | ||||||
Current: |
||||||||||||
Federal |
$ | (152 | ) | $ | 999 | $ | 1,012 | |||||
State |
1,753 | 1,268 | 143 | |||||||||
Foreign |
7,825 | 6,567 | 4,608 | |||||||||
Total current |
9,426 | 8,834 | 5,763 | |||||||||
Deferred: |
||||||||||||
Federal |
1,121 | (48 | ) | 1,801 | ||||||||
State |
(251 | ) | (26 | ) | (633 | ) | ||||||
Foreign |
(515 | ) | (235 | ) | 227 | |||||||
Total deferred |
355 | (309 | ) | 1,395 | ||||||||
Provision for income taxes |
$ | 9,781 | $ | 8,525 | $ | 7,158 | ||||||
70
DTS, INC.
NOTES TO CONSOLIDATED FINANCIAL STATEMENTS (Continued)
(Amounts in thousands, except per share data)
Note 10—Income Taxes (Continued)
The components of temporary differences that gave rise to deferred income tax are as follows:
| |
As of December 31, | ||||||||
|---|---|---|---|---|---|---|---|---|---|
| |
2010 | 2009 | |||||||
Deferred tax assets: |
|||||||||
Accrued revenues |
$ | 966 | $ | 1,384 | |||||
Net operating loss carryforwards |
3,641 | 6,121 | |||||||
Capital loss carryforwards |
536 | 537 | |||||||
Inventory |
22 | 196 | |||||||
Credit carryforwards |
5,599 | 5,344 | |||||||
Deferred Revenue |
385 | — | |||||||
Stock-based compensation |
4,147 | 3,630 | |||||||
Accruals, reserves and other |
3,396 | 1,930 | |||||||
Acquired intangibles |
746 | 593 | |||||||
Total gross deferred tax assets |
19,438 | 19,735 | |||||||
Valuation allowance |
(996 | ) | (537 | ) | |||||
Total deferred tax assets |
18,442 | 19,198 | |||||||
Deferred tax liabilities: |
|||||||||
Depreciation and amortization |
699 | 1,101 | |||||||
Deferred tax assets, net |
$ | 17,743 | $ | 18,097 | |||||
|
|||||||||
Current deferred tax assets |
$ | 5,551 | $ | 4,945 | |||||
Non-current deferred tax assets, net |
12,192 | 13,152 | |||||||
Deferred tax assets, net |
$ | 17,743 | $ | 18,097 | |||||
Other than the valuation allowances for a U.S. capital loss carryforward and a foreign net operating loss carryforward, there was no valuation allowance for deferred tax assets, net, of $17,743 and $18,097 at December 31, 2010 and 2009, respectively, based on management's assessment of the Company's ability to utilize these deferred tax assets. Realization of the net deferred tax assets is dependent on the Company generating sufficient taxable income in the future. Although realization is not assured, the Company believes it is more likely than not that the deferred tax assets will be realized. The amount of the deferred tax assets considered realizable, however, could be reduced in the future if estimates of future taxable income are reduced.
At December 31, 2010, the Company had approximately $41,408 in tax loss carryforwards. These tax loss carryforwards consist of federal and state net operating losses of $30,426 and $10,982, respectively, and begin to expire in 2027 and 2017, respectively. Included in these tax loss carryforwards are stock-based compensation deductions that, when fully utilized, reduce cash income taxes and will result in a financial statement income tax benefit of $8,230. The future income tax benefit, if realized, will be recorded to additional paid-in capital. The Company follows the with-and-without approach for determining when the stock-based compensation deductions are considered realized. At December 31,
71
DTS, INC.
NOTES TO CONSOLIDATED FINANCIAL STATEMENTS (Continued)
(Amounts in thousands, except per share data)
Note 10—Income Taxes (Continued)
2010, the Company had foreign tax credit carryforwards of $3,892, which begin to expire in 2015, and R&D and other credits of $1,707, which begin to expire in 2023.
The income tax provision excludes the current year income tax deductions related to the issuance of common stock from the exercise of stock options for which no compensation expense was recorded for accounting purposes or for which the income tax deduction exceeded the expense recorded for accounting purposes.
The provision for income taxes differs from the amount obtained by applying the federal statutory income tax rate to income before provision for income taxes as follows:
| |
Years Ended December 31, | |||||||||
|---|---|---|---|---|---|---|---|---|---|---|
| |
2010 | 2009 | 2008 | |||||||
Statutory federal rate |
35.0 | % | 35.0 | % | 35.0 | % | ||||
State income taxes, net |
3.3 | 3.1 | 3.3 | |||||||
Effect of varying foreign rates |
(4.8 | ) | (2.0 | ) | (1.0 | ) | ||||
Tax exempt interest |
(0.1 | ) | (0.7 | ) | (3.7 | ) | ||||
Equity based compensation expense |
2.2 | 1.6 | 1.8 | |||||||
Research and development credits |
(0.8 | ) | (1.0 | ) | (0.4 | ) | ||||
Unrecognized tax benefits |
4.8 | 9.4 | 6.9 | |||||||
Other |
(0.2 | ) | (1.0 | ) | 1.0 | |||||
Effective tax rate |
39.4 | % | 44.4 | % | 42.9 | % | ||||
The Company had not provided for U.S. income taxes or foreign withholding taxes in its effective tax rate on approximately $49,605 of undistributed earnings from its foreign subsidiaries as of December 31, 2010. The Company intends to reinvest these earnings indefinitely in operations outside of the U.S.
At December 31, 2010 and 2009, the Company's liability for uncertain tax positions increased to $7,271 and $5,578, respectively, which was recorded in other long-term liabilities. This amount consists of $7,205 and $5,523, respectively, for unrecognized tax benefits and $66 and $55, respectively, for accruals related to the payment of interest. The increase in unrecognized tax benefits during the year ended December 31, 2010 was primarily attributable to uncertain tax positions relating to the Company's eligibility for the extraterritorial income exclusion, transfer pricing positions taken with respect to the Company's foreign subsidiaries and the California franchise tax sourcing methodology. These unrecognized tax benefits would affect the Company's effective tax rate if recognized. The Company believes that it has adequately provided for all tax positions based on its assessment of many factors, including past experience and interpretations of tax law applied to the facts of each matter. However, due to inherent uncertainties in estimating accruals for uncertain tax positions, amounts asserted by tax authorities could be greater or less than the amounts accrued by the Company. Accordingly, the Company's provision on federal, state and foreign tax-related matters to be recorded in the future may change as revised estimates are made or the underlying matters are settled or otherwise resolved. As of December 31, 2010, the Company does not believe that its estimates, as otherwise provided for, on such tax positions will significantly increase or decrease within the next twelve months.
72
DTS, INC.
NOTES TO CONSOLIDATED FINANCIAL STATEMENTS (Continued)
(Amounts in thousands, except per share data)
Note 10—Income Taxes (Continued)
The following is a tabular reconciliation of the total amounts of unrecognized tax benefits for the years ended December 31, 2008, 2009 and 2010.
| |
Unrecognized Tax Benefits | |||
|---|---|---|---|---|
Balance at January 1, 2008 |
$ | 2,147 | ||
Additions for tax positions of prior years |
1,153 | |||
Additions for tax positions of the current year |
228 | |||
Settlements |
(60 | ) | ||
Balance at December 31, 2008 |
3,468 | |||
Additions for tax positions of prior years |
1,314 | |||
Additions for tax positions of the current year |
741 | |||
Balance at December 31, 2009 |
5,523 | |||
Additions for tax positions of prior years |
335 | |||
Additions for tax positions of the current year |
1,347 | |||
Balance at December 31, 2010 |
$ | 7,205 | ||
The Company may, from time to time, be assessed interest or penalties by major tax jurisdictions, although any such assessments historically have been minimal and immaterial to the Company's financial results.
The Company, or one of its subsidiaries, files income tax returns in the U.S. and other foreign jurisdictions. With few exceptions, the Company is no longer subject to U.S. federal income tax examinations by tax authorities for the years prior to 2004. The Internal Revenue Service ("IRS") is examining the Company's 2005 through 2007 federal income tax returns. However, the scope also includes certain prior period carryforwards. In addition, the California Franchise Tax Board is conducting a state tax examination for the years 2004 and 2005. Judgment is required in determining the consolidated provision for income taxes as the Company considers its worldwide taxable earnings and the impact of the audit process conducted by various tax authorities. The final outcome of tax audits by any foreign jurisdictions, the IRS and various state governments could differ materially from that which is reflected in the Consolidated Financial Statements.
Note 11—Discontinued Operations
On April 4, 2008, the Company, DTS Digital Images, Inc., a wholly-owned subsidiary of the Company ("DI"), and Reliance Big Entertainment Private Limited ("Reliance"), entered into a Stock Purchase Agreement providing for the sale of DI by the Company to Reliance. The sale was consummated the same day. Pursuant to the terms of the Stock Purchase Agreement, the Company received cash consideration of approximately $7,500. The Agreement contains customary representations, warranties and covenants. As a result of this transaction and in conjunction with the previous carrying value adjustments, the Company realized a pre-tax gain of $21 during the three months ended June 30, 2008, reported in income from discontinued operations, net of tax. During a transition period from the sale date and ending prior to June 30, 2008, the Company provided certain transition services to Reliance related to DI. The Company has concluded that the direct cash flows
73
DTS, INC.
NOTES TO CONSOLIDATED FINANCIAL STATEMENTS (Continued)
(Amounts in thousands, except per share data)
Note 11—Discontinued Operations (Continued)
resulting from these transition services were not material, and the Company did not have any continuing ownership interest or other influence over DI during this period.
On May 9, 2008, the Company, Beaufort California, Inc. ("Beaufort") and Beaufort International Group Plc. entered into an Asset Purchase Agreement (the "DC Agreement") providing for the sale of substantially all of the Company's assets used predominantly in the conduct of its digital cinema business ("DC business") to Beaufort and the assumption by Beaufort of certain liabilities of the DC business. The sale was consummated the same day. Pursuant to the terms of the DC Agreement, the Company received cash consideration of approximately $3,250 upon the closing of this sale, and it could receive an additional $11,750 in additional consideration. For the purposes of measuring the pre-tax loss on this sale, the Company has not attributed any fair value to the additional consideration. As a result of this transaction and in conjunction with the previous carrying value adjustments, the Company realized a pre-tax loss of $2,120 during the three months ended June 30, 2008, reported in income from discontinued operations, net of tax. This pre-tax loss results primarily from settlement and severance obligations of the Company and working capital adjustments that were determined subsequent to the closing of this sale, in addition to losses from operations during the period from April 1, 2008 through the closing of this sale. Continuing cash flows from discontinued operations subsequent to June 30, 2008, resulted from certain income tax adjustments, the resolution of certain estimated costs associated with the sale and other expenses. As further relevant information becomes available relating to the contingent consideration or further obligations of the Company, if any, additional adjustments and expenses may be recorded through discontinued operations in future periods.
The Company entered into a Settlement Agreement and Release (the "Settlement and Release Agreement"), dated June 22, 2010, with Datasat Digital Entertainment, Inc., Beaufort International Group Plc and Datasat Communications Limited (collectively the "Datasat Parties"), providing that the Datasat Parties pay the Company $2,000 and pursuant to which the Datasat Parties are released from the obligation to pay the Company any further consideration associated with the purchase of its digital cinema business on May 9, 2008. The Settlement and Release Agreement requires that an initial payment of $1,000 ("Initial Payment") be paid to the Company on June 25, 2010, and the final payment of $1,000 ("Final Payment") be paid to the Company on July 23, 2010. Both of the Initial and Final Payments were received in accordance with the terms of the Settlement and Release Agreement. For additional information, refer to Part I Item 3, "Legal Proceedings," in this report.
74
DTS, INC.
NOTES TO CONSOLIDATED FINANCIAL STATEMENTS (Continued)
(Amounts in thousands, except per share data)
Note 11—Discontinued Operations (Continued)
The following table presents revenue and expense information for the discontinued operations of DTS Digital Cinema for the years ended December 31, 2010, 2009 and 2008.
| |
For the Years Ended December 31, | |||||||||
|---|---|---|---|---|---|---|---|---|---|---|
| |
2010 | 2009 | 2008 | |||||||
Revenue |
$ | — | $ | — | $ | 6,214 | ||||
|
||||||||||
Pre-tax income (loss) |
1,623 | (1) | (141 | )(2) | (768 | )(3) | ||||
Income tax provision (benefit) |
622 | (53 | ) | (2,624 | )(4) | |||||
Income (loss) from discontinued operations, net of tax |
$ | 1,001 | $ | (88 | ) | $ | 1,856 | |||
- (1)
- Includes
proceeds from the aforementioned Settlement and Release Agreement.
- (2)
- The
loss from discontinued operations resulted primarily from legal fees associated with the Company's efforts to collect certain amounts due and contingent
consideration from Beaufort.
- (3)
- Includes
a pre-tax loss of $2,099 from the sales of the DI and DC businesses. Also includes a carrying value write up of $4,963 to increase the
carrying value of the assets held for sale to fair value less costs to sell. For additional information, see the "Adjustment to Carrying Value of Assets Held for Sale" discussion below.
- (4)
- Includes the correction of prior period errors that the Company determined were not material to the prior or current year financial statements. For additional information, see the "Correction of Error" discussion below.
Adjustment to Carrying Value of Assets Held for Sale
Assets held for sale with a carrying amount of $5,387 were written up to their fair value of $10,750, less costs to sell of $400 (or $10,350), resulting in an adjustment to carrying value of assets held for sale of $4,963, which was included in the results of discontinued operations for the three months ended March 31, 2008. The Company's estimate of fair value reflected expected proceeds to be realized from potential buyers in a future sale, which it believed was the current market value of these assets.
Note 12—Stock-Based Compensation
The Company accounts for stock-based compensation in accordance with GAAP and SEC guidance which requires the measurement and recognition of compensation expense for all share-based payment awards made to employees and directors in the financial statements.
75
DTS, INC.
NOTES TO CONSOLIDATED FINANCIAL STATEMENTS (Continued)
(Amounts in thousands, except per share data)
Note 12—Stock-Based Compensation (Continued)
The Company's stock-based compensation cost and related income tax benefit for the years ended December 31, 2010, 2009 and 2008 were as follows:
| |
For the Years Ended December 31, | |||||||||||
|---|---|---|---|---|---|---|---|---|---|---|---|---|
| |
2010 | 2009 | 2008 | |||||||||
Stock-based compensation cost: |
||||||||||||
Cost of revenue |
$ | 10 | $ | 19 | $ | 12 | ||||||
Selling, general and administrative |
5,791 | 4,831 | 3,760 | |||||||||
Research and development |
1,524 | 800 | 569 | |||||||||
Total continuing operations |
7,325 | 5,650 | 4,341 | |||||||||
Discontinued operations |
— | — | 314 | |||||||||
Total stock-based compensation cost |
$ | 7,325 | $ | 5,650 | $ | 4,655 | ||||||
|
||||||||||||
Income tax benefit |
$ | 2,985 | $ | 2,302 | $ | 1,897 | ||||||
Various Stock Plans
Stock Option and Restricted Stock Plans
In 1997, the Company adopted a stock option plan (the "1997 Plan") for eligible employees, directors and consultants. In 2002, the Company adopted a stock option plan (the "2002 Plan") for management and certain key employees. Options granted under the plans may be incentive stock options intended to satisfy the requirements of Section 422 of the Internal Revenue Code ("IRC") of 1986, as amended, and the regulations thereunder, or non-qualified options. Options generally become exercisable over a four-year period and expire in ten years. The total number of shares of common stock that may be issued under both plans amounted to a maximum of 2,071. Options granted prior to 2002 were granted at exercise prices equal to the preferred stock financing prices, which were in excess of the estimated fair value of the underlying common stock.
In April 2003, the Company adopted the 2003 Equity Incentive Plan (the "2003 Plan") under which an additional 929 shares were authorized for future issuances of common stock. Additionally, the shares available for issuances of common stock options under the 1997 and 2002 Plans were transferred to the 2003 Plan for future issuances of common stock options. The 2003 Plan contains a provision (the "Evergreen Provision") for an automatic increase in the number of shares available for grant starting January 1, 2004 and each January thereafter until and including January 1, 2013, subject to certain limitations, by a number of shares equal to the lesser of: (i) four percent of the number of shares issued and outstanding on the immediately preceding December 31, (ii) 1,500 shares, or (iii) a number of shares set by the Board of Directors.
76
DTS, INC.
NOTES TO CONSOLIDATED FINANCIAL STATEMENTS (Continued)
(Amounts in thousands, except per share data)
Note 12—Stock-Based Compensation (Continued)
Stock Options
The fair value of each employee option grant is estimated on the date of the grant using the Black-Scholes option pricing model with the following weighted average key assumptions:
| |
Years Ended December 31, | |||||||||
|---|---|---|---|---|---|---|---|---|---|---|
| |
2010 | 2009 | 2008 | |||||||
Risk free interest rate |
1.9 | % | 1.6 | % | 1.9 | % | ||||
Expected lives (years) |
3.9 | 3.7 | 3.8 | |||||||
Dividend yield |
0 | % | 0 | % | 0 | % | ||||
Expected volatility |
50 | % | 50 | % | 45 | % | ||||
The dividend yield was not calculated because the Company does not currently expect to pay a dividend. The expected life of the options granted was derived from the historical activity of the Company's options and represented the period of time that options granted were expected to be outstanding. The expected volatility was based on the historical volatility of the Company's common stock. The risk-free interest rate was the average interest rates of U.S. government bonds of comparable term to the options on the dates of the option grants.
There were 457, 510 and 381 options granted during the year ended December 31, 2010, 2009 and 2008, respectively. The weighted-average grant-date fair value of options granted during the year ended December 31, 2010, 2009 and 2008 was $11.28, $6.64 and $8.26, respectively. Compensation expense for stock options was $3,498, $2,859 and $2,544 for the years ended December 31, 2010, 2009 and 2008, respectively.
The following table summarizes information about stock option activity during the year ended December 31, 2010:
| |
Options Outstanding |
Weighted- Average Exercise Price |
Weighted- Average Remaining Contractual Life (Years) |
Aggregate Intrinsic Value |
||||||||||
|---|---|---|---|---|---|---|---|---|---|---|---|---|---|---|
Options outstanding at December 31, 2009 |
1,997 | $ | 18.13 | |||||||||||
Granted |
457 | 28.07 | ||||||||||||
Exercised |
(628 | ) | 17.42 | |||||||||||
Expired or cancelled |
(9 | ) | 20.85 | |||||||||||
Options outstanding at December 31, 2010 |
1,817 | $ | 20.87 | 6.93 | $ | 51,202 | ||||||||
Options exercisable at December 31, 2010 |
911 | $ | 18.96 | 5.47 | $ | 27,423 | ||||||||
The aggregate intrinsic value of options exercised during the year ended December 31, 2010, 2009 and 2008 was $13,689, $2,510 and $7,038, respectively. As of December 31, 2010, total remaining unearned compensation related to unvested stock options was approximately $6,023, which will be amortized over the weighted-average remaining service period of 1.3 years.
77
DTS, INC.
NOTES TO CONSOLIDATED FINANCIAL STATEMENTS (Continued)
(Amounts in thousands, except per share data)
Note 12—Stock-Based Compensation (Continued)
In accordance with the Evergreen Provision in the 2003 Plan and as approved by the Board of Directors, effective January 1, 2010, the number of shares reserved under the 2003 Plan was increased by 695 shares.
Restricted Stock
Compensation expense on shares of restricted stock, awards and units, was $3,242, $2,350 and $1,832 for the years ended December 31, 2010, 2009 and 2008. The following table summarizes information about restricted stock activity during the year ended December 31, 2010:
| |
Number of Shares |
Weighted- Average Grant-Date Fair Value |
|||||
|---|---|---|---|---|---|---|---|
Unvested stock at December 31, 2009 |
295 | $ | 20.29 | ||||
Granted |
149 | 28.94 | |||||
Vested |
(128 | ) | 20.98 | ||||
Forfeited |
(8 | ) | 25.44 | ||||
Unvested stock at December 31, 2010 |
308 | $ | 24.06 | ||||
As of December 31, 2010, total remaining unearned compensation related to restricted stock was $4,852, which will be amortized over the weighted-average remaining service period of 1.2 years.
Employee Stock Purchase Plan
On April 17, 2003, the Company adopted the 2003 Employee Stock Purchase Plan and the 2003 Foreign Subsidiary Employee Stock Purchase Plan ("ESPP"), under which, subject to certain limitations, the initial aggregate number of shares of stock that may be issued is 500, with a provision (the "Evergreen Provision") that provides for an automatic increase in the number of shares available for issuance on January 1, 2004 and each January 1 thereafter until and including January 1, 2013 by the lesser of: (i) 500 shares, (ii) one percent of the number of shares of all classes of common stock of the Company outstanding on that date, or (iii) a lesser amount determined by the Board of Directors. Under the ESPP, shares are only issued during the second and fourth quarter of each year. The values were estimated at the date of grant using the Black-Scholes option pricing model with the following weighted average key assumptions:
| |
Years Ended December 31, | |||||||||
|---|---|---|---|---|---|---|---|---|---|---|
| |
2010 | 2009 | 2008 | |||||||
Risk free interest rate |
0.8 | % | 1.0 | % | 1.9 | % | ||||
Expected lives (years) |
1.5 | 1.2 | 0.7 | |||||||
Dividend yield |
0 | % | 0 | % | 0 | % | ||||
Expected volatility |
47 | % | 64 | % | 57 | % | ||||
The dividend yield was not calculated because the Company does not currently expect to pay a dividend. The expected life represented the service period. The expected volatility was based on the
78
DTS, INC.
NOTES TO CONSOLIDATED FINANCIAL STATEMENTS (Continued)
(Amounts in thousands, except per share data)
Note 12—Stock-Based Compensation (Continued)
historical volatility of the Company's common stock. The risk-free interest rate was the average interest rates of U.S. government bonds of comparable term to the service period.
Compensation expense under the ESPP was $585, $441 and $278 for the years ended December 31, 2010, 2009 and 2008, respectively.
Non-Employee Equity Awards
The Company grants options to purchase shares of common stock to non-employee consultants. Additionally the terms of the plan allow employees who are terminated, but have continuing service obligations to the Company to continue vesting in their equity awards. The total stock-based compensation cost that has been recognized in the consolidated statements of income was $0, $0 and $1 for the years ended December 31, 2010, 2009 and 2008, respectively, and was recorded to selling, general and administrative expenses.
Note 13—Defined Contribution Plan
The Company has savings and investment plans, including a savings plan that qualifies as a defined contribution plan under Section 401(k) of the IRC. Prior to 2010, the Company allowed eligible employees to allocate up to 15% of salary through payroll deductions. Effective beginning in 2010, the Company allows eligible employees to allocate up to 100% of their annual compensation or 20% of their annual compensation, if considered highly compensated under Section 401(k) of the IRC, up to the annual maximum described under Section 401(k) of the IRC through payroll deductions. Substantially all full-time employees on the payroll of the Company are eligible to participate in the plans. Prior to 2004, the Company matched up to 50% of the employee's contributions up to 6% of salary. Effective beginning in 2004, the Company matches 50% of the first 4% of salary contributed to the plan and up to 6% of salary if certain financial targets are met. Effective beginning 2010, the Company adopted a Roth 401(k) option and it matches 100% of the first 4% of salary contributed to the plan and may match up to 6% of salary if certain financial targets are met. For the years ended December 31, 2010, 2009 and 2008, the costs of these matching payments were $493, $206 and $224, respectively.
Note 14—Stock Repurchase Plans
In August 2006, the Company's Board of Directors authorized, subject to certain business and market conditions, the purchase of up to 1,000 shares of the Company's common stock in the open market or in privately negotiated transactions. During the second and third quarters of 2007, the Company repurchased all shares of common stock under this authorization for an aggregate cost of $22,670.
In February 2008, the Company's Board of Directors authorized, subject to certain business and market conditions, the purchase of up to 1,000 shares of the Company's common stock in the open market or in privately negotiated transactions. During the third and fourth quarters of 2008, the Company repurchased all shares of common stock under this authorization for an aggregate of $18,938.
In November 2009, the Company's Board of Directors authorized, subject to certain business and market conditions, the purchase of up to 1,000 shares of the Company's common stock in the open
79
DTS, INC.
NOTES TO CONSOLIDATED FINANCIAL STATEMENTS (Continued)
(Amounts in thousands, except per share data)
Note 14—Stock Repurchase Plans (Continued)
market or in privately negotiated transactions. Through the fourth quarter of 2010, the Company repurchased all shares of common stock under this authorization for an aggregate of $33,315.
All shares repurchased under these authorizations are accounted for as treasury stock.
Note 15—Geographic Information
The Company's revenue by geographical area, based on the customer's country of domicile, for the years ended December 31, 2010, 2009 and 2008 was as follows:
| |
For the Years Ended December 31, | ||||||||||
|---|---|---|---|---|---|---|---|---|---|---|---|
| |
2010 | 2009 | 2008 | ||||||||
U.S. |
$ | 9,805 | $ | 17,421 | $ | 5,160 | |||||
|
|||||||||||
Japan |
41,392 | 34,241 | 31,535 | ||||||||
South Korea |
21,148 | 14,414 | 12,735 | ||||||||
Other international |
14,751 | 11,646 | 10,808 | ||||||||
Total international |
77,291 | 60,301 | 55,078 | ||||||||
Total revenues |
$ | 87,096 | $ | 77,722 | $ | 60,238 | |||||
The following table sets forth, for the periods indicated, long-lived tangible assets by geographic region:
| |
As of December 31, | |||||||
|---|---|---|---|---|---|---|---|---|
| |
2010 | 2009 | ||||||
U.S. |
$ | 32,207 | $ | 32,494 | ||||
International |
1,431 | 1,391 | ||||||
Total long-lived tangible assets |
$ | 33,638 | $ | 33,885 | ||||
Note 16—Net Income Per Share
Basic net income per common share is calculated by dividing net income by the weighted average number of common shares outstanding during the period. Diluted net income per common share is calculated by dividing net income by the sum of the weighted average number of common shares outstanding plus the dilutive effect of outstanding stock options, unvested restricted stock, and the ESPP using the "treasury stock" method.
80
DTS, INC.
NOTES TO CONSOLIDATED FINANCIAL STATEMENTS (Continued)
(Amounts in thousands, except per share data)
Note 16—Net Income Per Share (Continued)
The following table sets forth the computation of basic and diluted net income per share:
| |
For the Years Ended December 31, | ||||||||||||
|---|---|---|---|---|---|---|---|---|---|---|---|---|---|
| |
2010 | 2009 | 2008 | ||||||||||
Basic net income per common share: |
|||||||||||||
Numerator: |
|||||||||||||
Income from continuing operations |
$ | 15,040 | $ | 10,690 | $ | 9,511 | |||||||
Income (loss) from discontinued operations |
1,001 | (88 | ) | 1,856 | |||||||||
Net income |
$ | 16,041 | $ | 10,602 | $ | 11,367 | |||||||
Denominator: |
|||||||||||||
Weighted average common shares outstanding |
17,041 | 17,145 | 17,641 | ||||||||||
Continuing operations |
$ | 0.88 | $ | 0.62 | $ | 0.54 | |||||||
Discontinued operations |
0.06 | — | 0.10 | ||||||||||
Basic net income per common share |
$ | 0.94 | $ | 0.62 | $ | 0.64 | |||||||
Diluted net income per common share: |
|||||||||||||
Numerator: |
|||||||||||||
Income from continuing operations |
$ | 15,040 | $ | 10,690 | $ | 9,511 | |||||||
Income (loss) from discontinued operations |
1,001 | (88 | ) | 1,856 | |||||||||
Net income |
$ | 16,041 | $ | 10,602 | $ | 11,367 | |||||||
Denominator: |
|||||||||||||
Weighted average shares outstanding |
17,041 | 17,145 | 17,641 | ||||||||||
Effect of dilutive securities: |
|||||||||||||
Common stock options |
620 | 448 | 442 | ||||||||||
Restricted stock |
128 | 88 | 60 | ||||||||||
ESPP |
16 | 8 | 2 | ||||||||||
Diluted shares outstanding |
17,805 | 17,689 | 18,145 | ||||||||||
Continuing operations |
$ | 0.84 | $ | 0.60 | $ | 0.52 | |||||||
Discontinued operations |
0.06 | — | 0.11 | ||||||||||
Diluted net income per common share |
$ | 0.90 | $ | 0.60 | $ | 0.63 | |||||||
For the years ended December 31, 2010, 2009 and 2008, 260, 631 and 528 shares, respectively, of the Company's stock options and restricted stock were excluded from the calculation of diluted earnings per share because their inclusion would have been anti-dilutive.
81
DTS, INC.
NOTES TO CONSOLIDATED FINANCIAL STATEMENTS (Continued)
(Amounts in thousands, except per share data)
Note 17—Selected Quarterly Data (Unaudited)
| |
For the Quarter Ended | ||||||||||||||
|---|---|---|---|---|---|---|---|---|---|---|---|---|---|---|---|
| |
Mar. 31, | June 30, | Sep. 30, | Dec. 31, | |||||||||||
2010 |
|||||||||||||||
Revenues |
$ | 21,736 | $ | 17,460 | $ | 21,041 | $ | 26,859 | |||||||
Gross profit |
$ | 21,286 | $ | 17,000 | $ | 20,720 | $ | 26,507 | |||||||
|
|||||||||||||||
Income from continuing operations |
$ | 3,920 | $ | 1,556 | $ | 3,417 | $ | 6,147 | |||||||
Income (loss) from discontinued operations, net of tax |
(170 | ) | 1,173 | (1) | (9 | ) | 7 | ||||||||
Net income |
$ | 3,750 | $ | 2,729 | $ | 3,408 | $ | 6,154 | |||||||
Net income (loss) per common share: |
|||||||||||||||
Basic: |
|||||||||||||||
Continuing operations |
$ | 0.23 | $ | 0.09 | $ | 0.20 | $ | 0.36 | |||||||
Discontinued operations |
(0.01 | ) | 0.07 | — | — | ||||||||||
Net income |
$ | 0.22 | $ | 0.16 | $ | 0.20 | $ | 0.36 | |||||||
Diluted: |
|||||||||||||||
Continuing operations |
$ | 0.22 | $ | 0.09 | $ | 0.19 | $ | 0.34 | |||||||
Discontinued operations |
(0.01 | ) | 0.06 | — | — | ||||||||||
Net income |
$ | 0.21 | $ | 0.15 | $ | 0.19 | $ | 0.34 | |||||||
2009 |
|||||||||||||||
Revenues |
$ | 17,262 | $ | 24,165 | (2) | $ | 15,078 | $ | 21,217 | ||||||
Gross profit |
$ | 16,817 | $ | 23,716 | $ | 14,630 | $ | 20,793 | |||||||
|
|||||||||||||||
Income from continuing operations |
$ | 190 | $ | 3,626 | $ | 1,969 | $ | 4,905 | |||||||
Income (loss) from discontinued operations, net of tax |
(3 | ) | 4 | (24 | ) | (65 | ) | ||||||||
Net income |
$ | 187 | $ | 3,630 | $ | 1,945 | $ | 4,840 | |||||||
Net income (loss) per common share: |
|||||||||||||||
Basic: |
|||||||||||||||
Continuing operations |
$ | 0.01 | $ | 0.21 | $ | 0.11 | $ | 0.29 | |||||||
Discontinued operations |
— | — | — | (0.01 | ) | ||||||||||
Net income |
$ | 0.01 | $ | 0.21 | $ | 0.11 | $ | 0.28 | |||||||
Diluted: |
|||||||||||||||
Continuing operations |
$ | 0.01 | $ | 0.21 | $ | 0.11 | $ | 0.27 | |||||||
Discontinued operations |
— | — | — | — | |||||||||||
Net income |
$ | 0.01 | $ | 0.21 | $ | 0.11 | $ | 0.27 | |||||||
- (1)
- Includes
proceeds from the aforementioned Settlement and Release Agreement. For additional information regarding, refer to Footnote 11 of our consolidated
financial statements, "Discontinued Operations."
- (2)
- Includes $12,959 of royalty recoveries from intellectual property compliance and enforcement activities.
82
DTS, INC.
SCHEDULE II—VALUATION AND QUALIFYING ACCOUNTS
(Amounts in thousands)
For the Years Ended December 31,
|
Balance at Beginning of Year | Charged to Costs and Expenses | Deductions From Reserves | Balance at End of Year | ||||||||||
|---|---|---|---|---|---|---|---|---|---|---|---|---|---|---|
Allowance for doubtful accounts:(1) |
||||||||||||||
2010 |
$ | 229 | $ | — | $ | 3 | $ | 226 | ||||||
2009 |
64 | 170 | 5 | 229 | ||||||||||
2008 |
81 | 15 | 32 | 64 | ||||||||||
- (1)
- The additions to the allowance for doubtful accounts represent the estimates of our bad debt expense based upon the factors for which we evaluate the collectability of our accounts receivable. Deductions are the actual write-offs of the receivables.
83
Item 9. Changes in and Disagreements With Accountants on Accounting and Financial Disclosure
None.
Item 9A. Controls and Procedures
Disclosure Controls and Procedures
The Company's management, with the participation of the Company's Chief Executive Officer and Chief Financial Officer, evaluated the effectiveness of the Company's disclosure controls and procedures (as such term is defined in Rules 13a-15(e) and 15d-15(e) under the Securities Exchange Act of 1934, as amended (the "Exchange Act")) as of the end of the period covered by this report. Based on such evaluation, the Company's Chief Executive Officer and Chief Financial Officer concluded that the Company's disclosure controls and procedures were effective as of December 31, 2010.
Management's Report on Internal Control Over Financial Reporting
The Company's management is responsible for establishing and maintaining adequate internal control over financial reporting, as defined in Exchange Act Rules 13a-15(f) or 15d-15(f). The Company's internal control over financial reporting is designed to provide reasonable assurance regarding the reliability of financial reporting and the preparation of financial statements for external purposes, in accordance with generally accepted accounting principles.
The Company's internal control over financial reporting includes policies and procedures that pertain to the maintenance of records that, in reasonable detail, accurately and fairly reflect the transactions and dispositions of assets of the Company; provide reasonable assurance that transactions are recorded as necessary to permit preparation of financial statements in accordance with generally accepted accounting principles, and that receipts and expenditures are being made only in accordance with authorizations of management and directors of the Company; and provide reasonable assurance regarding prevention or timely detection of unauthorized acquisition, use or disposition of the Company's assets that could have a material effect on the Company's financial statements.
Because of its inherent limitations, internal control over financial reporting may not prevent or detect misstatements. Also, projections of any evaluation of effectiveness to future periods are subject to the risk that controls may become inadequate because of changes in conditions, or that the degree of compliance with the policies or procedures may deteriorate.
The Company's management, with the participation of the Company's Chief Executive Officer and Chief Financial Officer, evaluated the effectiveness of the Company's internal control over financial reporting as of December 31, 2010, based on the framework established by the Committee of Sponsoring Organizations of the Treadway Commission in Internal Control—Integrated Framework.
Based on this evaluation, management concluded that the Company's internal control over financial reporting was effective as of December 31, 2010.
Grant Thornton LLP, the Company's independent registered public accounting firm, has issued an attestation report on the Company's internal control over financial reporting as stated in their report which appears herein in Item 8.
Changes in Internal Control Over Financial Reporting
There has not been any change in the Company's internal control over financial reporting (as such term is defined in Rules 13a-15(f) and 15d-15(f) under the Exchange Act) during the fiscal quarter ended December 31, 2010 that has materially affected, or is reasonably likely to materially affect, the Company's internal control over financial reporting.
None.
84
Item 10. Directors, Executive Officers and Corporate Governance
The information concerning our executive officers to be included under the caption "Executive Officers and Significant Employees" in our proxy statement relating to our 2011 annual meeting of stockholders to be filed by us with the Securities and Exchange Commission no later than 120 days after the close of our fiscal year ended December 31, 2010 (the "Proxy Statement") is incorporated herein by reference.
The information concerning our directors to be included in our Proxy Statement under the caption "Item 1—Election of Directors" is incorporated herein by reference.
The information to be included in the Proxy Statement under the caption "Section 16(a) Beneficial Ownership Reporting Compliance" is incorporated herein by reference.
The information concerning our code of ethics and code of conduct to be included in the Proxy Statement under the caption "Governance of the Company" is incorporated herein by reference.
Item 11. Executive Compensation
The information to be included in the Proxy Statement under the captions "Executive Compensation," "Compensation Discussion and Analysis," "Compensation of Directors" and "Report of Compensation Committee" is incorporated herein by reference.
Item 12. Security Ownership of Certain Beneficial Owners and Management and Related Stockholder Matters
The information to be included in the Proxy Statement under the captions "Equity Compensation Plan Information" and "Security Ownership of Certain Beneficial Owners and Management" is incorporated herein by reference.
Item 13. Certain Relationships and Related Transactions, and Director Independence
Information concerning certain relationships and related transactions will be included in the Proxy Statement under the caption "Certain Relationships and Related Transactions" and is incorporated herein by reference. Information concerning director independence will be included in the Proxy Statement under the caption "Governance of the Company" and is incorporated herein by reference.
Item 14. Principal Accountant Fees and Services
Information concerning principal accounting fees and services will be included in the Proxy Statement under the caption "Item 2—Ratification of Independent Registered Public Accountants" and is incorporated herein by reference.
85
Item 15. Exhibits and Financial Statement Schedules
(a)(1) and (2) Financial Statements and Schedules
The information required by this Item is included in Item 8 of Part II of this report.
(a)(3) Exhibits
See Item 15 (b) below.
(b) Exhibits:
| Exhibit Number |
Description | ||
|---|---|---|---|
| 2.1 | Stock Purchase Agreement among the Registrant, DTS Digital Images, Inc., and Reliance Big Entertainment Private Limited, dated April 4, 2008(1) | ||
2.2 |
Asset Purchase Agreement among the Registrant, Beaufort California, Inc., and Beaufort International Group, Inc., dated May 9, 2008(2) |
||
2.3 |
Asset Purchase Agreement among the Registrant, DTS Washington LLC, DTS (BVI) Limited, Neural Audio Corporation, Robert W. Reams, Paul T. Hubert, Robert D. Golden and Robert A. Koester, dated December 31, 2008† |
||
3.1 |
Restated Bylaws(3) |
||
3.2 |
Restated Certificate of Incorporation, as amended by Amendment dated May 20, 2005(4) |
||
4.1 |
Specimen Common Stock Certificate(5) |
||
10.1 |
1997 Stock Option Plan(6)* |
||
10.2 |
Form of Incentive Stock Option Agreement for grants under the 1997 Stock Option Plan(6)* |
||
10.3 |
Form of Nonqualified Stock Option Agreement for grants under the 1997 Stock Option Plan(6)* |
||
10.4 |
2002 Stock Option Plan(6)* |
||
10.5 |
Form of Incentive Stock Option Agreement for grants under the 2002 Stock Option Plan(6)* |
||
10.6 |
Form of Non-qualified Stock Option Agreement for grants under the 2002 Stock Option Plan(6)* |
||
10.7 |
2003 Equity Incentive Plan, as amended on May 9, 2005, May 15, 2008, February 19, 2009, February 15, 2010, June 3, 2010 and October 8, 2010(7)* |
||
10.8 |
Form of Grant of Stock Option under 2003 Equity Incentive Plan(5)* |
||
10.9 |
Form of Option Exercise and Stock Purchase Agreement under 2003 Equity Incentive Plan(5)* |
||
10.10 |
Form of Restricted Stock Grant Notice under 2003 Equity Incentive Plan(5)* |
||
10.11 |
Form of Restricted Stock Grant Notice and Restricted Stock Agreement under 2003 Equity Incentive Plan (for annual non-employee director grants)(8)* |
||
10.12 |
Form of Restricted Stock Grant Notice and Restricted Stock Agreement under 2003 Equity Incentive Plan (for employee and consultant grants)(8)* |
||
86
| Exhibit Number |
Description | ||
|---|---|---|---|
| 10.13 | Form of Restricted Stock Unit Grant Notice and Restricted Stock Unit Agreement under 2003 Equity Incentive Plan(9)* | ||
10.14 |
2003 Employee Stock Purchase Plan(5)* |
||
10.15 |
2003 Foreign Subsidiary Employee Stock Purchase Plan(5)* |
||
10.16 |
Description of acceleration of vesting of certain unvested stock options(10)* |
||
10.17 |
Executive Employment Agreement by and between the Registrant and Jon Kirchner, dated February 17, 2011(11)* |
||
10.18 |
Employment Agreement by and between the Registrant and William Paul Smith, dated November 1, 2002(6)* |
||
10.19 |
Second Amendment to Service Agreement between the Registrant and William Paul Smith, dated June 3, 2005(4)* |
||
10.20 |
Employment Agreement by and between the Registrant and Melvin Flanigan, effective as of May 20, 2005(4)* |
||
10.21 |
Amendment to Employment Agreement by and between the Registrant and Melvin Flanigan, effective as of December 17, 2008(12)* |
||
10.22 |
Employment Agreement by and between the Registrant and Blake Welcher, effective as of May 20, 2005(4)* |
||
10.23 |
Amendment to Employment Agreement by and between the Registrant and Blake Welcher, effective as of December 17, 2008(12)* |
||
10.24 |
Employment Agreement by and between the Registrant and Brian D. Towne, effective as of May 20, 2005(4)* |
||
10.25 |
Amendment to Employment Agreement by and between the Registrant and Brian D. Towne, effective as of December 17, 2008(12)* |
||
10.26 |
Employment Agreement by and between the Registrant and Brian D. Towne, executed May 8, 2009, effective as of April 14, 2009(13)* |
||
10.27 |
Amendment to Employment Agreement by and between the Registrant and Brian D. Towne, effective as of June 28, 2010 (14)* |
||
10.28 |
Employment Agreement by and between the Registrant and Frederick L. Kitson, executed on March 3, 2010 and effective as of February 26, 2010(9)* |
||
10.29 |
Employment Agreement by and between the Registrant and Patrick Watson, effective as of May 20, 2005(4)* |
||
10.30 |
Amendment to Employment Agreement by and between the Registrant and Patrick Watson, effective as of December 17, 2008(12)* |
||
10.31 |
Employment Agreement by and between the Registrant and Sharon Faltemier, dated as of June 28, 2006(15)* |
||
10.32 |
Amendment to Employment Agreement by and between the Registrant and Sharon Faltemier, effective as of December 17, 2008(12)* |
||
10.33 |
Employment Agreement between the Registrant and Daniel E. Slusser, executed as of January 22, 2008, effective May 31, 2007(16)* |
||
87
| Exhibit Number |
Description | ||
|---|---|---|---|
| 10.34 | Amendment to Employment Agreement by and between the Registrant and Daniel E. Slusser, effective as of December 17, 2008(12)* | ||
10.35 |
Employment Agreement by and between the Registrant and Daniel E. Slusser, executed March 23, 2009, effective as of January 1, 2009(13)* |
||
10.36 |
Amendment to Employment Agreement by and between the Registrant and Daniel E. Slusser, effective as of February 9, 2010(17)* |
||
10.37 |
Form of Indemnification Agreement between the Registrant and its directors(6) |
||
10.38 |
Form of Indemnification Agreement between the Registrant and its officers(6) |
||
10.39 |
Revolving Credit Agreement between the Registrant and Comerica Bank—California, effective June 30, 2004(18) |
||
10.40 |
Loan Extension Agreement and Modification to Loan Documents between the Registrant and Comerica Bank, effective July 7, 2005(19) |
||
10.41 |
Loan Extension Agreement and Modification to Loan Documents between the Registrant and Comerica Bank, effective June 12, 2006(15) |
||
10.42 |
Purchase and Sale Agreement, dated August 28, 2008, and First Amendment to Purchase and Sale Agreement, dated October 13, 2008, between DTS, Inc. and Countrywide Home Loans, Inc.(20) |
||
21.1 |
List of all subsidiaries of the Registrant |
||
23.1 |
Consent of Grant Thornton LLP, independent registered public accounting firm |
||
31.1 |
Certification of Chief Executive Officer pursuant to Rule 13a-14(a)/15d-14(a) of the Securities Exchange Act of 1934, as amended |
||
31.2 |
Certification of Chief Financial Officer pursuant to Rule 13a-14(a)/15d-14(a) of the Securities Exchange Act of 1934, as amended |
||
32.1 |
Certification of the Chief Executive Officer pursuant to Rule 13a-14(b) of the Securities Exchange Act of 1934, as amended, and 18 U.S.C. section 1350‡ |
||
32.2 |
Certification of the Chief Financial Officer pursuant to Rule 13a-14(b) of the Securities Exchange Act of 1934, as amended, and 18 U.S.C. section 1350‡ |
||
- *
- Indicates
management contract, arrangement or compensatory plan.
- †
- Certain
confidential portions of this exhibit were omitted by means of redacting a portion of the text. This exhibit has been filed separately
with the Secretary of the Securities and Exchange Commission without such redactions pursuant to the Registrant's related application requesting confidential treatment under Rule 406 under the
Securities Act of 1933, as amended.
- ‡
- This
certification is being furnished solely to accompany this report pursuant to 18 U.S.C. 1350, and is not being filed for purposes of
Section 18 of the Securities Exchange Act of 1934, and is not to be incorporated by reference into any filing of the Company, whether made before or after the date hereof, regardless of any
general incorporation language in such filing.
- (1)
- Incorporated by reference to the Registrant's Report on Form 8-K filed with the Securities and Exchange Commission on April 10, 2008 (SEC file number 000-50335-08750521).
88
- (2)
- Incorporated
by reference to the Registrant's Report on Form 8-K filed with the Securities and Exchange Commission on May 15, 2008
(SEC file number 000-50335-08836240).
- (3)
- Incorporated
by reference to the Registrant's Report on Form 8-K filed with the Securities and Exchange Commission on November 19,
2008 (SEC file number 000-50335-081200177).
- (4)
- Incorporated
by reference to the Registrant's Quarterly Report on Form 10-Q for the quarter ended June 30, 2005 (SEC file
number 000-50335-051003863).
- (5)
- Incorporated
by reference to the Registrant's Amendment No. 1 to Form S-1 Registration Statement on June 5, 2003 (SEC file
number 333-104761-03734287).
- (6)
- Incorporated
by reference to the Registrant's Form S-1 Registration Statement on April 25, 2003 (SEC file
number 333-104761-03665001).
- (7)
- Incorporated
by reference to the Registrant's Report on Form 10-Q filed with the Securities and Exchange Commission on November 8,
2010 (SEC file number 000-50335-101172804).
- (8)
- Incorporated
by reference to the Registrant's Report on Form 10-Q filed with the Securities and Exchange Commission on August 9,
2006 (SEC file number 000-50335-061017963).
- (9)
- Incorporated
by reference to the Registrant's Report on Form 10-Q filed with the Securities and Exchange Commission on May 10,
2010 (SEC file number 000-50335-10816984).
- (10)
- Incorporated
by reference to the Registrant's Report on Form 8-K filed with the Securities and Exchange Commission on
November 23, 2005 (SEC file number 000-50335-051222387).
- (11)
- Incorporated
by reference to the Registrant's Report on Form 8-K filed with the Securities and Exchange Commission on
February 23, 2011 (SEC file number 000-50335-11631546).
- (12)
- Incorporated
by reference to the Registrant's Annual Report on Form 10-K for the year ended December 31, 2008 (SEC file
number 000-50335-09662980).
- (13)
- Incorporated
by reference to the Registrant's Report on Form 10-Q filed with the Securities and Exchange Commission on May 11,
2009 (SEC file number 000-50335-09815716).
- (14)
- Incorporated
by reference to the Registrant's Report on Form 10-Q filed with the Securities and Exchange Commission on August 9,
2010 (SEC file number 000-50335-101001957).
- (15)
- Incorporated
by reference to the Registrant's Annual Report on Form 10-K for the year ended December 31, 2006 (SEC file
number 000-50335-07700129).
- (16)
- Incorporated
by reference to the Registrant's Report on Form 8-K filed with the Securities and Exchange Commission on January 24,
2008 (SEC file number 000-50335-08546816).
- (17)
- Incorporated
by reference to the Registrant's Annual Report on Form 10-K for the year ended December 31, 2009 (SEC file
number 000-50335-10653577).
- (18)
- Incorporated
by reference to the Registrant's Quarterly Report on Form 10-Q for the quarter ended June 30, 2004 (SEC file
number 000-50335-04975317).
- (19)
- Incorporated
by reference to the Registrant's Annual Report on Form 10-K for the year ended December 31, 2005 (SEC file
number 000-50335-06691413).
- (20)
- Incorporated by reference to the Registrant's Report on Form 10-Q filed with the Securities and Exchange Commission on November 10, 2008 (SEC file number 000-50335-081176147).
89
Pursuant to the requirements of Section 13 or 15(d) of the Securities Exchange Act of 1934, the registrant has duly caused this report to be signed on its behalf by the undersigned, thereunto duly authorized, on this 3rd day of March, 2011.
|
DTS, INC. | |||
|
By: |
/s/ JON E. KIRCHNER |
||
Pursuant to the requirements of the Securities Exchange Act of 1934, this report has been signed below by the following persons on behalf of the registrant and in the capacities and on the dates indicated.
Signature
|
Title(s)
|
Date
|
||
|---|---|---|---|---|
| /s/ JON E. KIRCHNER Jon E. Kirchner |
Chairman, Chief Executive Officer, and Director (principal executive officer) | March 3, 2011 | ||
/s/ MELVIN L. FLANIGAN Melvin L. Flanigan |
Executive Vice President, Finance and Chief Financial Officer (principal financial and accounting officer) |
March 3, 2011 |
||
/s/ JOERG D. AGIN Joerg D. Agin |
Lead Independent Director |
March 3, 2011 |
||
/s/ CRAIG S. ANDREWS Craig S. Andrews |
Director |
March 3, 2011 |
||
/s/ L. GREGORY BALLARD L. Gregory Ballard |
Director |
March 3, 2011 |
||
/s/ C. ANN BUSBY C. Ann Busby |
Director |
March 3, 2011 |
||
/s/ BRADFORD D. DUEA Bradford D. Duea |
Director |
March 3, 2011 |
||
/s/ V. SUE MOLINA V. Sue Molina |
Director |
March 3, 2011 |
||
/s/ RONALD N. STONE Ronald N. Stone |
Director |
March 3, 2011 |
90