Attached files
| file | filename |
|---|---|
| EXCEL - IDEA: XBRL DOCUMENT - DTS, INC. | Financial_Report.xls |
| EX-23.2 - EX-23.2 - DTS, INC. | a2223535zex-23_2.htm |
| EX-23.1 - EX-23.1 - DTS, INC. | a2223535zex-23_1.htm |
| EX-31.1 - EX-31.1 - DTS, INC. | a2223535zex-31_1.htm |
| EX-21.1 - EX-21.1 - DTS, INC. | a2223535zex-21_1.htm |
| EX-32.1 - EX-32.1 - DTS, INC. | a2223535zex-32_1.htm |
| EX-31.2 - EX-31.2 - DTS, INC. | a2223535zex-31_2.htm |
| EX-32.2 - EX-32.2 - DTS, INC. | a2223535zex-32_2.htm |
| EX-10.37 - EX-10.37 - DTS, INC. | a2223535zex-10_37.htm |
Use these links to rapidly review the document
TABLE OF CONTENTS
Item 8. Financial Statements and Supplementary Data
UNITED STATES
SECURITIES AND EXCHANGE COMMISSION
Washington, D.C. 20549
FORM 10-K
ý |
ANNUAL REPORT PURSUANT TO SECTION 13 OR 15(d) OF THE SECURITIES EXCHANGE ACT OF 1934 |
|
For the fiscal year ended December 31, 2014 |
||
OR |
||
o |
TRANSITION REPORT PURSUANT TO SECTION 13 OR 15(d) OF THE SECURITIES EXCHANGE ACT OF 1934 |
|
For the transition period from to |
||
Commission File Number 000-50335

DTS, Inc.
(Exact name of Registrant as specified in its charter)
| Delaware (State or Other Jurisdiction of Incorporation or Organization) |
77-0467655 (I.R.S. Employer Identification Number) |
|
5220 Las Virgenes Road Calabasas, California 91302 (Address, including zip code, of Registrant's principal executive offices) |
||
Registrant's telephone number, including area code: (818) 436-1000
Securities registered pursuant to Section 12(b) of the Act:
| Title of each class | Name of each exchange on which registered | |
|---|---|---|
| Common Stock, $0.0001 par value | NASDAQ Stock Market LLC |
Securities
registered pursuant to Section 12(g) of the Act:
None
Indicate by check mark if the registrant is a well-known seasoned issuer, as defined in Rule 405 of the Securities Act. Yes o No ý
Indicate by check mark if the registrant is not required to file reports pursuant to Section 13 or Section 15(d) of the Act. Yes o No ý
Indicate by check mark whether the registrant (1) has filed all reports required to be filed by Section 13 or 15(d) of the Securities Exchange Act of 1934 during the preceding 12 months (or for such shorter period that the registrant was required to file such reports), and (2) has been subject to such filing requirements for the past 90 days. Yes ý No o
Indicate by check mark whether the registrant has submitted electronically and posted on its corporate Web site, if any, every Interactive Data File required to be submitted and posted pursuant to Rule 405 of Regulation S-T (§232.405 of this chapter) during the preceding 12 months (or for such shorter period that the registrant was required to submit and post such files). Yes ý No o
Indicate by check mark if disclosure of delinquent filers pursuant to Item 405 of Regulation S-K is not contained herein, and will not be contained, to the best of registrant's knowledge, in definitive proxy or information statements incorporated by reference in Part III of this Form 10-K or any amendment to this Form 10-K. ý
Indicate by check mark whether the registrant is a large accelerated filer, an accelerated filer, a non-accelerated filer, or a smaller reporting company. See the definitions of "large accelerated filer," "accelerated filer," and "smaller reporting company" in Rule 12b-2 of the Exchange Act. (Check one):
| Large accelerated filer o | Accelerated filer ý | Non-accelerated filer o (Do not check if a smaller reporting company) |
Smaller reporting company o |
Indicate by check mark whether the registrant is a shell company (as defined in Rule 12b-2 of the Exchange Act). Yes o No ý
The aggregate market value of the voting and non-voting common equity held by non-affiliates of the registrant, as of June 30, 2014 was approximately $243,917,109 (based upon the closing price of shares of the registrant's Common Stock as reported on the NASDAQ Global Select Market for that date). Shares of Common Stock held by each officer and director have been excluded as such persons may be deemed affiliates. The determination of "affiliate" status for purposes of this report on Form 10-K shall not be deemed a determination as to whether an individual is an "affiliate" of the registrant for any other purposes.
As of March 5, 2015, 17,458,154 shares of common stock were outstanding.
DOCUMENTS INCORPORATED BY REFERENCE
Portions of the registrant's Definitive Proxy Statement to be filed with the Commission pursuant to Regulation 14A in connection with the registrant's 2015 Annual Meeting of Stockholders, to be filed subsequent to the date hereof within 120 days of the registrant's fiscal year ended December 31, 2014, are incorporated by reference into Part III of this Report, to the extent not set forth herein.
DTS, INC.
FORM 10-K
For the Fiscal Year Ended December 31, 2014
INDEX
This Annual Report on Form 10-K (including, but not limited to, the section titled "Management's Discussion and Analysis of Financial Condition and Results of Operations") and the documents incorporated herein by reference contain forward-looking statements within the meaning of Section 27A of the Securities Act of 1933, as amended, and Section 21E of the Securities Exchange Act of 1934, as amended ("Exchange Act"). Words such as "believes," "anticipates," "estimates," "expects," "intends," "projections," "may," "can," "will," "should," "potential," "plans," "continues" and similar expressions are intended to identify those assertions as forward-looking statements, but are not the exclusive means of identifying forward-looking statements in this report. All statements, other than statements of historical fact, are statements that could be deemed forward-looking statements, including, but not limited to, statements regarding our future financial performance or position, future economic conditions, our business strategy, plans or expectations, our future effective tax rates, and our objectives for future operations, including relating to our products and services. Although forward-looking statements in this report reflect our good faith judgment, such statements are based on facts and factors currently known by us. We caution readers that forward-looking statements are not guarantees of future performance and our actual results and outcomes may be materially different from those expressed or implied by the forward-looking statements. Important factors that could cause or contribute to such differences in results and outcomes include, without limitation, those discussed under the "Risk Factors" section contained in Part I, Item 1A below in this Annual Report on Form 10-K and in other documents we file with the Securities and Exchange Commission ("SEC"). Readers are urged not to place undue reliance on these forward-looking statements, which speak only as of the date of this report. We undertake no obligation to revise or update these forward-looking statements to reflect future events or circumstances, unless otherwise required by law.
References to "we," "us" and "our" refer to DTS, Inc. and its consolidated subsidiaries.
COMPANY OVERVIEW
We are a premier audio technology solutions provider for high-definition entertainment experiences. Our mission is to make the world sound better—anytime, anywhere, on any device. Our audio solutions are designed to enable recording, delivery and playback of simple, personalized, and immersive high-definition audio and are incorporated by hundreds of licensee customers around the world into an array of consumer electronics devices, including televisions (TVs), personal computers (PCs), smartphones, tablets, digital media players (DMPs), set-top-boxes, soundbars, wireless speakers, video game consoles, Blu-ray Disc players, automotive audio systems, audio/video receivers (AVRs), DVD-based products, and home theater systems.
Sound, long known to be a powerful driver of people's emotional connection with content such as movies, music and games, is emerging as an important product differentiator for a rapidly growing range of consumer electronics devices, especially mobile, small screen devices, as consumers are using these devices to watch and listen to more entertainment than ever before. After years of focus on video quality and usability features, industry professionals and consumers alike are realizing that sound is the next frontier in the technical advancement of the high-definition entertainment experience. Simply put, sound changes the way we see.
We believe that we have industry leading end-to-end audio solutions designed to enhance the entertainment experience for users of consumer electronics devices, particularly those subject to the physical limitations of smaller speakers, such as TVs, PCs and mobile devices. Additionally, we provide products and services to motion picture studios, radio and TV broadcasters, game developers and other
1
content creators to facilitate the inclusion of compelling, realistic DTS-encoded audio within their content.
We are dedicated to making the world sound better, one device at a time, because sound matters. Our goal is to be an essential ingredient in engaging, dynamic and realistic entertainment experiences by incorporating our technology into every connected device that plays or delivers high-definition entertainment.
As a premier audio solutions provider to the entertainment industry, our history of innovation has spanned more than 20 years across multiple markets, with the total available market size increasing over time, as shown below:
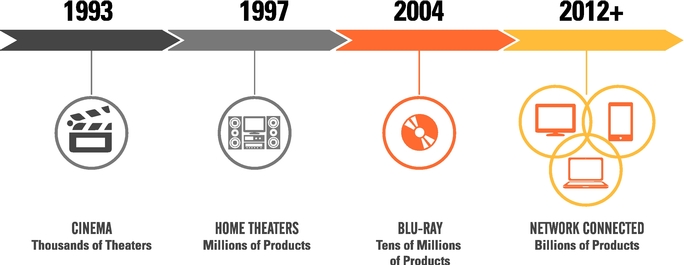
In the Cinema. We were founded in 1990 and received a key strategic investment in 1993 from a variety of investors, including Universal City Studios, Inc. The first DTS audio soundtrack was created for the release of Steven Spielberg's Jurassic Park in 1993. From this initial release, we established a technical and marketing platform for the development of entertainment technology solutions for the motion picture, home theater, and other consumer markets.
In Home Theaters. In 1996, we launched our technology licensing business, in which we license our technology to consumer electronics manufacturers.
On Blu-ray. We believe the significant growth of our technology licensing business and our position as the quality leader in home theater products led to us attaining a mandatory position in the Blu-ray standard in 2004, which in turn led us to exit our cinema business in 2008. We believe our mandatory position in the Blu-ray standard remains important for our business, as it firmly establishes us as the premier audio solutions provider for high-definition entertainment on optical disc based media.
On Connected Devices. Cloud-based entertainment delivery is growing very rapidly. As content providers and consumer electronics manufacturers seek to deliver a premium audio experience for digital entertainment, we believe this segment will drive the majority of our growth for many years to come. Over the past couple of years, we have significantly broadened our market reach with new customers in the network-connected markets as the trend toward network-connected devices and commercial digital download and streaming of content continues to gain momentum. We are partnering with a growing number of cloud-based content providers to supply consumers with clear, compelling high-definition sound, despite the bandwidth limitations of online and cellular networks and the physical limitations of devices with smaller speakers.
2
To date, we have entered into licensing agreements with substantially all of the world's major consumer electronics manufacturers. We also license our technology to substantially all relevant integrated circuit (IC) manufacturers. As a result, our technology, trademarks, copyrights and know-how have been incorporated into billions of consumer electronics products worldwide.
INDUSTRY BACKGROUND
Over the past 20 years, the entertainment industry has evolved to take advantage of many technical trends and innovations, including the transition from analog to digital content, growth in broadband speed and subscriber base, an increase in the types of devices supporting content playback, and the transition from physical media to network delivery via streaming and downloading. The mobilization of content consumption allows for entertainment on the go—anytime, anywhere, on any device.
Shift to Network and Cloud-Based Content
Movie, music and other content was historically purchased and consumed primarily via optical disc based media, such as Blu-ray Disc, DVD, and CD. Beginning in 2004, as consumers' demand for high-definition entertainment grew, Blu-ray emerged as the newest form of optical disc based media. Given our mandatory position in this standard, Blu-ray Disc players, including stand-alone players and game consoles, continue to contribute meaningfully to our revenues.
With the growth of PC and mobile usage over the last decade, the shift to network and cloud-based content acquisition continues to occur, including the trend toward full movie and music downloading and streaming services. Furthermore, in this age of convenience, devices are becoming thinner, smaller and more portable than previous models, but as a result, sound quality is commonly sacrificed due to physical limitations. While the smaller, sleeker forms of these devices meet the demand for style or portability, consumers still believe that sound matters, and they demand a higher quality audio experience from these sophisticated devices. A recent 2014 "State of Play" report by CSR (the "2014 CSR Report") shows that a resounding 82% of consumers describe sound quality as critical when selecting a product, and 70% of consumers are prepared to pay more for better sound quality.
In addition, consumer demand for multi-screen playback of content is increasing. As the network connected space continues to expand, consumers now more than ever expect to purchase content once and be able to enjoy such content on all of their devices.
From our success in Blu-ray, we are recognized as a premier audio solutions provider for high-definition entertainment, and as cloud-based service providers look to expand and differentiate their media offerings to multi-screen platforms, such as tablets and smartphones, we are in the unique position to help them deliver high-quality content and new entertainment experiences to consumers across multiple devices.
Wireless Audio Playback
As a result of increased connectivity, portability, and the growing popularity of streaming music services, wireless speakers and multi-room audio products are experiencing rapid growth and are forecasted to continue on this trend for years to come. Wireless audio devices use common wireless audio networking technologies, such as those available under the trademarks Bluetooth, Wi-Fi, Airplay and DLNA, for the wireless streaming of music from audio enabled devices to wireless output systems. With wireless transmissions that can now match the sound quality of direct wire connections, wireless speakers are gaining popularity with consumers. According to the 2014 CSR Report, 68% of respondents would like to see speakers in every room of their home, and two thirds of respondents said it would frustrate them if they couldn't easily link up their smartphone, PC or TV to their home audio system or speakers.
3
Object-Based Audio
The industry is in the early stages of shifting away from purely channel-based audio (stereo, 5.1, 7.1, etc.) to object-based audio, also referred to as "3D audio" or "immersive audio". Development of object-based audio begins at the time of creation of an audio mix where the artist no longer specifies what mix of sounds comes from each speaker, but tells the system where, in space, each sound should come from regardless of speaker positions. When this object-audio is played back, it is rendered in space based on the speakers available in the playback environment resulting in a more accurate and consistent spatial representation. Object-based audio can be used in conjunction with channel-based audio content to produce immersive sound experiences. We believe this area provides a tremendous opportunity to sustain and extend our current codec licensing business, while providing opportunities for new business as our solutions in this space offer a true next-generation, immersive audio experience.
In summary, the proliferation of connected devices, cloud-based content, and the trend towards next-generation audio creates significant opportunities for the deployment of our solutions to deliver high-definition entertainment.
DTS VALUE DRIVERS
To achieve our goal of making the world sound better, our business focus is on several key value drivers, which include:
- •
- Developing and bringing to market a strong pipeline of innovative audio technology solutions
- •
- Driving the proliferation of DTS encoded content
- •
- Actively participating in standards relevant to the audio industry
- •
- Investing in and broadening the IC footprint that supports the inclusion of our technologies
- •
- Elevating the DTS brand among consumers
Innovative Audio Technology Solutions
End-to-End Audio Solutions
At DTS, we combine various technologies and capabilities into what we call "solutions," each designed to address the needs of a particular product, market, or consumer use case and tuned for optimum performance by our technical teams. Our portfolio of advanced audio solutions addresses a broad spectrum of product applications within the markets that we have targeted. Our solutions typically combine several technologies, frequently including both codec and audio processing capabilities, to deliver a comprehensive, easy to deploy package for the enhancement of a product's audio performance. Through the combination of leading edge audio codecs and an unsurpassed portfolio of audio processing technologies, coupled with our device tuning "know how," we are uniquely positioned to fulfill our vision of making the world sound better.
We have a complete range of end-to-end audio solutions—from ingest, through distribution and onto playback—and we continue to expand our offerings through ongoing research and development, targeted acquisitions, and strategic partnerships with IC and consumer electronics manufacturers, content creators and providers, and others within the digital media ecosystem.
4
Our solution offerings are tailored specifically for each market. Examples of the range of technologies available for certain markets include:
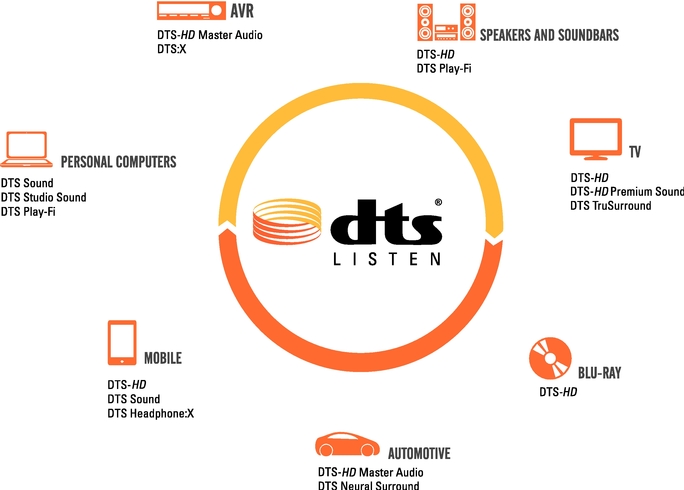
| DTS-HD® is our core surround sound audio decoder offering high quality audio output for streaming disc and cloud based content. | ||

|
DTS-HD Master Audio™ is our advanced surround sound decoder that utilizes variable bit-rate technology to deliver ultimate audio quality while conserving file size and bandwidth, allowing for an uncompromised audio experience. |
|

|
DTS Sound™ is a tailored, entry level suite of components from both our spatial processing and loudness and dynamics portfolio of technologies that provides a value audio enhancement offering to our customers. |
|

|
DTS Studio Sound™ is our premium audio processing offering that includes a number of our latest sound processing features. Our customers can use this suite to create the ultimate in sound quality. |
5

|
DTS-HD Premium Sound™ couples our DTS Sound or DTS Studio Sound offerings with our DTS-HD surround sound decoder to provide best in class solutions to the consumer electronics industry and consumers. | |

|
DTS TruSurround® is an audio processing technology delivering surround sound over multi-channel configurations, offering rich bass, dialog clarity and high frequency definition. |
|

|
DTS Neural Surround™ offers seamless conversion between stereo and surround sound audio, enabling stereo and surround audio to be presented in a consistent, rich surround environment. |
|

|
DTS Headphone:X™ includes our integrated surround headphone technology and DTS-HD surround sound decoder, coupled with user-driven, headphone specific tuning and personalization features for output over headphones and earbuds. |
|

|
DTS Play-Fi® allows the synchronized streaming of music directly from a mobile device or PC over a standard Wi-Fi network to anywhere in the home. Play-Fi is currently available for mobile devices that utilize the Android, Kindle Fire or iOS operating systems, as well as the Windows PC platform. |
|

|
DTS:X™ is our state of the art object-based audio format designed for bringing enhanced realism through more accurate spatial rendering, height audio elements, and customizations that adapt to any speaker layout. |
DTS Headphone:X—Surround Sound Now Available on the Go

The rapid growth in usage of smartphones, tablets, portable computers and gaming devices for entertainment consumption has led to significant growth in the use of headphones and earbuds by consumers. The introduction of DTS Headphone:X in 2013 raised the bar for immersive, realistic high-definition audio in the headphones space, as it allows mobile devices to turn an ordinary pair of headphones or earbuds into an impressive personal surround sound system capable of delivering immersive sound where listeners can accurately hear sounds in a multidimensional space. Sound comes from above, below, beside and in front of listeners when content and technologies are enabled with DTS Headphone:X.
6
DTS Headphone:X technology externalizes sound, so instead of the listener hearing the sound "inside their heads," as is typical for traditional headphone listening, they perceive it as coming from speakers located some distance around them. In addition to delivering immersive listening, DTS Headphone:X also improves stereo listening. Moreover, this experience can be achieved through one's favorite pair of headphones or earbuds, as the technology is typically embedded in the playback device rather than in the headphones or earbuds themselves.
We all hear differently and our ears have different physical characteristics that affect how we experience content. DTS Headphone:X provides consumers with a way to personalize their listening experience and enables them to simply create and store a personal "sonic profile," which then enhances the playback of all content on the device according to the personalized preferences. This, in turn, creates a truly unique and unparalleled listening experience. Similarly, product manufacturers can use this customization capability to create a unique, signature sound for their products.
Simply put, DTS Headphone:X dramatically improves the mobile entertainment experience.
DTS Play-Fi—Hi-Fi over Wi-Fi

Our Play-Fi solution targets the booming wireless audio space. Our wireless streaming technology allows Wi-Fi enabled sources, such as PCs, smartphones, and tablets, to stream to Play-Fi enabled products, such as speakers, soundbars, TVs, and home theater systems.
Importantly, DTS Play-Fi enables the synchronized streaming of music across multiple speakers directly from a smartphone, tablet, PC or other Play-Fi enabled device over a standard Wi-Fi network to anywhere the Wi-Fi reaches. Play-Fi leverages Wi-Fi's extensive range and capacity to stream audio with bit-for-bit accuracy for a higher quality audio experience. This solution allows the consumer to play music uninterrupted without the various alerts that plague Bluetooth audio playback, while still being able to use the mobile device for calls, text messages, internet, etc. In addition, Play-Fi provides seamless multi-room, multi-zone audio synchronization, again utilizing standard Wi-Fi capabilities that
7
are built into most mobile devices and an increasing number of homes. With two or more Play-Fi enabled-speakers in a home, a consumer has the option to play different content in different rooms or the same content throughout the house.
Currently, Play-Fi is available for mobile devices that utilize the Android, Kindle Fire or iOS operating systems and is also available for the Windows PC platform. Additionally, this solution is licensed to customers in the PC market and will expand into the Home AV and Mobile markets. Play-Fi enabled speakers and receivers are available online and at select retailers through the Phorus, Wren, Polk and Definitive Technology brands. More recently, the ecosystem has been further expanded with the announcement of support from additional leading consumer electronics brands, including McIntosh, Sonus Faber, Wadia, MartinLogan, Paradigm and Anthem.
Combined, Headphone:X and Play-Fi are designed to make a uniquely compelling use case for the modern connected lifestyle. Historically, making the connection between mobile and whole-home entertainment has been challenging, due to physical connections, wires, and less-than-ideal point-to-point streaming that has limited consumer enjoyment and expectations for what the home audio experience should be. Today's consumers frequently listen to their favorite music and music services on mobile devices through their favorite pair of headphones or earbuds, and when they get home, they typically want to remove the headphones or earbuds and listen to their music out loud. With our Headphone:X and Play-Fi technologies, consumers can walk into their house, disconnect their headphones or earbuds, and seamlessly send their audio entertainment throughout the home wirelessly over their existing Wi-Fi network. We believe this is how consumers want to enjoy their entertainment today, and our technologies represent unique, integrated solutions capable of providing this end-to-end capability.
DTS:X—Object-Based Audio
Looking beyond today's channel-based audio paradigm is DTS:X, our first open, object-based audio format designed for consumer delivery. The DTS:X audio decoder enables soundbar, home theater system and AVR manufacturers to bring the advanced features of object-based audio to the consumer market, and gives content creators a new approach for the creation of ever more compelling soundtracks.
Object-based audio brings enhanced realism through more accurate spatial rendering, height audio elements and customizations that adapt to any speaker layout. In addition to rendering object-based audio content, DTS:X supports complete compatibility for playback of DTS channel based content, providing the best audio experience from any content encoded in DTS audio.
The benefits of DTS:X include:
- •
- Environmentally compensated audio rendering allows consumers to hear audio directionality and dimensionality with more precision than
ever before.
- •
- Object control enables consumers to interact with key objects within the audio mix and adjust them to their preference.
- •
- Customized rendering designed for arbitrary speaker layouts enables consumers to adapt their AV system to their own home environment, rather than have to use pre-determined speaker layouts as is the case with competing offerings.
In summary, we have a complete range of advanced audio solutions, including leading edge audio codecs, audio processing technologies, industry leading wireless speaker playback technology, and forward-thinking object-based audio. Our advanced audio solutions are specifically engineered to meet the unique needs of the markets we support, and we believe that our unsurpassed, industry-leading portfolio of solutions uniquely positions us to drive meaningful growth going forward.
8
Intellectual Property
We have developed and maintain a sizeable library of copyrighted technologies and other technical materials, both printed and digitized, as well as numerous trade secrets. We also have many individual patent families resulting in hundreds of individual patents and patent applications throughout the world.
As a provider of high-definition audio technologies to markets worldwide, we believe it is extremely important to protect our technology through the use of copyrights, trademarks, patents, and trade secrets in many countries. We have targeted our intellectual property coverage to provide protection in the major manufacturing and commercial markets of the world.
Our audio solutions are embodied in the form of proprietary technology to which we retain the copyrights. Accordingly, copyrights are an important component of our intellectual property.
Our trademarks consist of many individual word marks, logos and slogans registered and in use throughout the world. The marks cover our various products, technologies, improvements and features as well as the services that we provide. Our trademarks are an integral part of our licensing program and, generally, are required to be used on licensed products to identify the source of the technology in the device, to provide greater consumer awareness and to advance the sales of the licensed products bearing the trademarks. In addition to over one hundred trademark registrations, we also have numerous trademark applications pending worldwide, with additional marks in the pre-application phase.
It is our general practice to file patent applications for our technology in the US and various foreign countries where our customers manufacture, distribute or sell licensed products. We actively pursue new applications to expand our patent portfolio to address new technological innovations. Most of the patents in our patent portfolio have an average life of 20 years from their date of filing. A number of our patents have expiration dates ranging from 2015 to 2032. We have multiple patents covering unique aspects and improvements for many of our technologies. We do not believe that the expiration of any single patent is likely to significantly affect our intellectual property position or our ability to generate licensing revenues.
Presence in Content
The proliferation of connected devices that can support streaming and downloadable content has made presence within the digital ecosystem increasingly important, as the availability of DTS-enabled content drives consumer demand for electronics that support DTS technologies. We have implemented focused efforts in this area with various content partners to help drive the expansion of our presence across the digital ecosystem.
Content Delivery Ecosystem
Adding advanced audio technologies to an existing or new content delivery system requires multifaceted back-end integrations across numerous technology partners. Unlike the optical disc based media distribution business, where only a few parties are involved in the replication and distribution of a disc, the digital content delivery ecosystem can be vast—involving dozens of interrelationships to get entertainment content from the creator to the ultimate consumer. We have spent years developing relationships throughout the ecosystem, and we believe we are now well positioned with relevant industry partners to make DTS-encoded, high-definition content more readily available.
With the increasing popularity of network-connectivity, the fundamental structure of the content ecosystem has now changed to focus not only on accessibility and ease-of-use, but also on higher quality audio and video. This change significantly expands the market for digital media format technologies, such as those provided by DTS.
9
Connected devices with varying content delivery requirements necessitate production tools capable of delivering high volumes of digital content files in multiple formats. We have spent several years bolstering our production tools, which include multiplexers, transcoders and automated quality control tools.
All major North American motion picture studios use the DTS-HD Master Audio Suite, a production tool that has allowed DTS to secure the primary audio tracks on the majority of Blu-ray Disc titles. As content delivery has moved beyond optical disc based media, consumers of production tools now include online services and broadcast facilities. We have provided our digital sound encoding tools to many of the leading home video and music content providers and professional audio facilities, enabling them to create high-definition DTS-enabled content. To date, thousands of Blu-ray Disc and DVD titles have been produced with DTS high-definition audio tracks. According to Nielsen, over 90% of the top 100 Blu-ray titles sold in 2014, including nine out of the top ten movies, were encoded with DTS-HD Master Audio.
Additionally, our recent acquisition of Manzanita Systems was another strategic step to acquire the necessary talent, tools offerings, and know-how in the tools space for us to more rapidly deploy new technologies into the market, broaden our customer support capabilities and accelerate DTS-encoded content creation and support of playback on devices within the network-connected market.
As the transition to digital content delivery accelerates, we continue to pursue strategic partnerships with top streaming technology companies to integrate DTS technologies into content and to be available on as many connected devices as possible, thereby enabling growth in our licensing opportunities. To date, our premium audio technologies have been integrated into thousands of titles, and we are actively pursuing other partnerships to expand the integration of our premium audio technologies into streaming content, including CinemaNow, M-GO, Starz, Encore and Paramount Pictures. This integration of our technology gives major studios, content creators, and retailers turn-key access to digitally distributed content with unparalleled audio quality.
Standards Participation
There are a variety of governmental and industry-related organizations that are responsible for adopting system and product standards. Standards are important in many technology-focused industries as they help to ensure compatibility of technologies across a system or series of products. Generally, standards adoption occurs on either a mandatory basis, requiring the existence of a particular technology or feature, or an optional basis, meaning that a particular technology or feature may be, but is not required to be, utilized.
We believe the market for audio and audio/video products is very standards driven and our active participation with standards organizations is important as we work to include our technology in standards or change our status from optional to mandatory, where possible. We believe our standards involvement also provides us early visibility into future opportunities.
Governmental standards are often operated by non-governmental organizations in cooperation with regional regulatory bodies. These organizations adopt standards by validating and publishing industry standards that are appropriate for various regions and technical requirements. The standards of this nature that we participate in include European Technical Standards Institute (ETSI) which is an affiliated European Standards Organization under the European Union, International Electrotechnical Commission (IEC), and the Moving Pictures Expert Group (MPEG) which is a joint working group under the IEC and International Organization for Standardization (ISO).
The majority of standards we actively participate in are produced by industry-related organizations. These bodies adopt standards based on industry evaluations and discussions across affected constituencies finalizing with consensus voting as to the best solution around which to standardize.
10
More recently, we have joined the Secure Content Storage Association (SCSA), a group of companies working to create storage and transfer solutions for high-definition and premium copyright-protected content on hard drives, flash memory products and solid state drives. SCSA's mission is to increase market opportunities for content owners, content distributors and high-end device manufacturers by delivering a secure solution that allows consumers to enjoy the highest-quality entertainment content across multiple devices.
Some standards bodies are now "open standards" that require all technologies included in the standard be included on non-proprietary and intellectual-property "free" technology platforms in which no company maintains ownership over the dominant technologies. We are actively engaging these bodies to determine how we may participate and the potential impact on our business model and future go-to-market strategies.
Currently, we are actively participating in over 20 standards, including Digital Entertainment Content Ecosystem (DECE), Advanced Television Systems Committee (ATSC) and High-Definition Multimedia Interface (HDMI), amongst others. We anticipate being involved in a number of other standards organizations as appropriate to facilitate the deployment of our technology.
IC Footprint
Traditionally, our technology has resided on an IC chip. We license a defined limited set of rights to incorporate our technology into these IC chips, and the IC manufacturers sell these DTS-enabled chips to our consumer electronics products manufacturer licensees. As such, maintaining a large footprint with the IC manufacturers is critical to drive growth.
Over the past several years, DTS has been working closely with the world's leading IC manufacturers to enable DTS technologies to support the new programmable architectures that fuel innovation and flexibility in today's consumer electronics products. Our partners specialize in key vertical markets and work closely with us to enable our latest technologies for these programmable parts. Together we offer these solutions to DTS licensees. Recently, DTS has gone a step further to develop both decoder and audio processing solutions for ARM-based processors, allowing our partners to quickly integrate DTS technology into their ARM-based processors targeted at popular, high-level operating systems such as Android and iOS, potentially saving their customers months of porting effort and thus providing rapid time-to-market solutions.
We have devoted significant time and resources to develop a broad range of solutions with key partners in certain markets, including Qualcomm, Mediatek, Mstar, Intel, Realtek, Cirrus Logic, Analog Devices, Cadence, Amlogic, and many others.
DTS Branding
Our marketing drives awareness and understanding of the DTS brands and solutions among listeners and customers by creating marketing, advertising, and communications programs that demonstrate the superior sound DTS enables. We envision a DTS-powered future where every sound experience is exciting, engaging, and effortless—in all entertainment, across all devices.
The foundation of our marketing strategy is to increase awareness and understanding of DTS solutions among listeners who highly value experience. When we connect with these influential listeners and demonstrate the sound DTS delivers, our brands become a catalyst for expanding the use of our existing technologies in new markets and in successfully penetrating existing markets with new technologies.
Our marketing campaigns, taken as a whole, aim to establish DTS as the "magic audio ingredient" across all devices—delivering the highest quality sound, unbound from barriers. In 2014, DTS Headphone:X campaigns showed listeners how Headphone:X can create a personalized, immersive
11
experience for their favorite music. We also collaborated with our customers to successfully launch several DTS Play-Fi enabled speaker brands and platforms, in the process demonstrating that awareness drives action and that listeners desire wireless choice and superior quality for their home audio systems. Finally, we continued our compelling innovation with DTS:X—showing off the immersiveness, flexibility, and interactive capabilities of our next-generation codec.
We believe that investments in building the DTS brands, the continued dominance of DTS as the preferred audio format for Blu-ray Disc content, and our further expansion into network-connected devices will result in the proliferation of the DTS brands into expanding categories of consumer electronics, and in turn, grow consumer awareness of and desire for DTS as "the magic audio ingredient."
We remain focused on accelerating these key value drivers as we advance our position in offering high-definition audio experiences, anytime, anywhere, on any device.
KEY MARKETS AND STRATEGIES
Network-Connected Markets
The network-connected markets category has become the largest area of our business and includes consumer electronics devices that are network-capable, including TVs, smartphones, tablets, wireless speakers, and PCs. Our strategy continues to center around further penetrating the various network-connected markets.
TVs
One of our strongest positions in the network-connected space is in the connected TV market. Our key strategy in the connected TV market is joining forces with leading consumer electronics manufacturers like Samsung, LG, Sony, Toshiba, and Vizio, allowing us to play a more significant role in the connected home entertainment market and further ensuring consumer access to high-quality audio when enjoying entertainment content at home. In 2014, we announced a worldwide strategic alliance with LG Electronics to incorporate DTS premium audio technology in LG's complete lineup of home entertainment products, including connected 4K TVs. We have partnerships with nearly every TV manufacturer worldwide, including all of the top 15 brands, and our DTS codec is incorporated into all of the top 10 TV original equipment manufacturers (OEMs).
Mobile
The mobile electronics market is currently, and expected to be for the foreseeable future, the largest single consumer electronics device market in the world in terms of unit volume, and we are currently focused primarily on the high- to mid-tier smartphone and tablet sub-segments of the mobile market.
In years past, mobile product manufacturers had only a few entertainment services to offer their customers over known and predictable networks. However, the explosion of media services, network topographies and device capabilities has caused the range of audio technologies needed by our partners to increase, and we have helped to simplify their businesses by offering simple, scalable solutions to meet their needs.
As smartphones continue to evolve into more feature-rich and sophisticated devices, consumers are seeking similar sound quality that they are accustomed to from their home theater or automobile. We believe that sound matters across all of these platforms; for example, with the integration of DTS Sound and DTS StudioSound into a smartphone, customers can experience uncompromising sound at their fingertips, redefining the quality of the experience. Moreover, with our more recent DTS Headphone:X technology, consumers can receive this same high-quality sound even when using their
12
favorite pair of headphones or earbuds on their mobile devices. Importantly, mobile product manufacturers are beginning to realize that sound, and thus our audio solutions, can be a powerful differentiator for their products.
Today's consumers increasingly expect high-quality sound in all of their electronics. Partnering with key manufacturers, such as Huawei, Sharp, Acer, ZTE and vivo, as well as mobile service providers, such as Nextreaming and Saffron Digital, allows us the opportunity to improve the mobile audio experience through our audio solutions. Notable accomplishments in 2014 within the mobile market include:
- •
- expanding our relationship with Huawei to include DTS Sound within select Huawei smartphone models, starting with the X1 and M1 models
in the MediaPad product line; and
- •
- the integration of DTS-HD into ZTE's new nubia branded smartphones, to decode high-definition audio for videos, music, gaming or streaming content.
As the use of headphones and earbuds and the demand for immersive high-definition audio continues to grow, we have expanded the reach of our Headphone:X technology by:
- •
- incorporating the technology into headphone designs from G-Star Industrial Co. Ltd., a leading global original design
manufacturer (ODM) of headsets and headphones for the PC and gaming industries;
- •
- working with castLabs to integrate the first in-app SDK integration of DTS Headphone:X in the castLabs media player for iOS and
Android;
- •
- teaming up with artists such as Soundgarden and Florida Georgia Line to release new albums specifically mixed in Headphone:X; and
- •
- collaborating with Above Technologies and Deepak Chopra to produce an app allowing users to experience meditative poetry featuring Headphone:X technology over any set of headphones.
We are continuing to pursue relationships to further expand the presence of our Headphone:X technologies in the mobile space.
Wireless Speakers
In the wireless speaker market, over the past year, we have seen significant growth in the adoption of our Play-Fi technology in speaker products. We continue to maintain a Play-Fi Certified ODM Program, which includes many leading audio manufacturers such as Amtran Technology, Anam Electronics, Eastech Electronics Inc., Fenda Technology Co., Ltd., Hansong Technology, LiteOn Technology Corporation, Meiloon Industrial Co. Ltd., Solidex Audio Corporation, Tymphany Corporation, Wistron Corporation, and Zylux Acoustic Corp. Additionally, we have expanded the presence of our Play-Fi technology by:
- •
- collaborating with Aerix to bring DTS Play-Fi technology to its brand of Wi-Fi speakers in the growing European whole-home audio
market;
- •
- working with leading music subscription services, such as Pandora, Songza and SiriusXM, to integrate subscription services into our
Play-Fi app;
- •
- developing a next-generation Phorus PS5 speaker, which features an elegant new design, renowned DTS sound, and is the only speaker in
its class that includes both dual band Wi-Fi streaming and premium Bluetooth options in one affordable, great-sounding, wireless audio speaker; and
- •
- expanding the Play-Fi ecosystem to include support from additional leading consumer electronics brands, including McIntosh, Sonus Faber, Wadia, MartinLogan, Paradigm and Anthem, in
13
addition to existing partnerships with Wren and Sound United's Polk and Definitive Technology products.
We will continue to work with current and new partners to grow the Play-Fi ecosystem.
PCs
The PC market, composed of notebooks, ultrabooks, laptops, desktops, and all-in-one PCs is large, with laptops and notebooks leading the way. Consumers continue to use PCs as multi-media hubs, including Blu-ray Disc drives for high-definition playback. Additionally, with our DTS encoder, consumers can encode their own content into the DTS format and enjoy playback on DTS enabled devices.
The PC market, like the smartphone and tablet markets, is facing shrinking device sizes and decreasing margins. As a result, the market is increasingly turning to audio processing to augment device capabilities. At the same time, the demands of consumers for PCs with improved audio for applications such as movies, music and games continues to rise, creating an increasing demand for advanced audio technologies. We address these demands with solutions tailored to meet both the high and low ends of an OEM's product lines. With DTS Sound and DTS StudioSound, we are meeting the needs of major OEMs, such as HP, LG, Toshiba, and ASUS.
As PC manufacturers continue to adopt our solutions across various platforms ranging from motherboards to all-in-ones (AIOs), and from notebooks to ultrabooks, there are growing opportunities for us to help these manufacturers differentiate and improve audio experiences on their thinner, smaller and lighter platforms which are in demand by today's consumers.
As devices in the network-connected markets play a more versatile role in the household, consumers are becoming increasingly aware that sound matters. The integration of our solutions into a growing number of TVs, mobile devices, wireless speakers, and PCs further reinforces our prominence in providing manufacturers a means to deliver an immersive, realistic sound experience regardless of the platform.
Base Markets
The base of our business is rooted in certain mature markets, including Blu-ray, Home AV, and Automotive. While these markets do not present the same scale of potential growth as the network-connected markets, they continue to generate a meaningful and relatively stable foundation of revenue, profitability and cash flow.
The Blu-ray market includes standalone players, gaming devices and disc drives included in PCs. As a mandated technology in the Blu-ray standard, our codec is in every product that incorporates a Blu-ray optical disc drive. As such, Blu-ray remains an important contributor to our revenues, most recently driven by the success of the latest gaming cycle launched by Sony and Microsoft. Almost all newly manufactured Blu-ray Disc players are now network-enabled, and a number of models are 3D-capable. We believe our dominant position on Blu-ray Disc content establishes us as the premier audio format for high-definition entertainment and is expected to drive future growth as the industry transitions to 4K video and network-based high-definition content delivery.
The Home AV market includes AVRs, soundbars, DVD players and other home theater equipment. With DVD on the decline, our focus in this market is on the rapidly growing soundbar category. The Home AV market continues to represent an important revenue base, and it continues to present opportunities for growth for our high-definition sound technologies, including our new DTS:X technology. Manufacturers representing nearly 90% of the home AVR and surround processor market, including Anthem, Denon, Integra, Krell, Marantz, McIntosh, Onkyo, Outlaw Audio, Pioneer, Steinway
14
Lyngdorf, Theta Digital, Trinnov Audio, and Yamaha, have already embraced the new technology and have agreed to launch products supporting DTS:X in 2015.
The Automotive market is comprised of infotainment systems, which may include network connectivity. As the trend toward network connectivity transitions into the automotive market, there is opportunity for us to benefit from the increase in demand for our solutions beyond optical disc based infotainment systems. The growing prevalence of using mobile consumer electronics for hosting personal music and movie libraries has prompted automobile manufacturers to enhance their vehicles by allowing mobile devices to interact with automotive infotainment systems. Our strategy in the automotive market is to collaborate with automobile manufacturers and their audio systems suppliers to use and incorporate our audio solutions at the factory level. We partner with key automobile manufacturers such as Acura, Audi, BMW, Cadillac, GM, Honda, Hyundai, Jaguar Land Rover, Lincoln and Mercedes, to incorporate our audio solutions into certain models.
LICENSING TO CUSTOMERS
We have two licensing teams, one headquartered in Ireland and one in California, that market our technology directly to consumer electronics product manufacturers and to IC manufacturers. We also have customer-focused employees located in the US, Europe, China, Japan, South Korea, Taiwan and Singapore. We believe that locating staff near the leading consumer electronics and IC manufacturers is essential to providing the level of customer support necessary in today's rapidly evolving global marketplace.
For the vast majority of our business, we license our technology to consumer electronics product manufacturers primarily through a two-step process:
- •
- IC Manufacturers. First, we license to a substantial
number of major IC manufacturers a limited/restricted set of rights to incorporate our technology in their chips, and to sell these chips supporting DTS technology to our consumer electronics products
manufacturer licensees.
- •
- Consumer Electronics Product Manufacturers. Secondly, we also license hardware manufacturers a limited/restricted set of rights to utilize our technology (incorporated in the IC licensee's chips) in their physical products. Our business model provides for us to receive royalties for products produced by the consumer manufacturer licensees that contain our technologies.
As part of the licensing terms for both IC and hardware manufacturer licensees, we receive fees for access to our technology and for product certification, in addition to royalties received from hardware manufacturer licensees. Generally, we license on a non-exclusive, worldwide basis. We require that all licensees have their chips or hardware devices certified by us prior to distribution, and licensees are generally required to display the appropriate DTS trademark on the products they manufacture. We also reserve the right to audit their books, records and quality standards.
Our licensing business mainly consists of two general types of licensing models: per-unit and minimum guarantee arrangements. Customers with a per-unit arrangement pay us a per-unit license fee for each product manufactured or shipped, as set forth in each license agreement. Such information is reported to us in the subsequent quarter, and consequently, per-unit revenues are recognized on a quarter lag basis when reported. Minimum guarantee arrangements consist of a minimum flat fee paid by the customer for the right to license specified technologies over the contract term. These arrangements stipulate a flat fee that corresponds to a minimum number of units or dollars, with additional per-unit fees for any units or dollars exceeding the minimum. The minimum or flat fee portion of these arrangements is recognized ratably over the contract term, and any overage is recognized on a quarter lag basis when reported.
We have licensed our technologies and our trademarks to substantially all of the major consumer electronics product manufacturers worldwide. Collectively, these manufacturers have sold billions of
15
DTS-licensed consumer electronics products. While our business is not substantially dependent on any single customer agreement, we have entered into several license agreements with the various divisions and companies that comprise Sony Corporation and Samsung Electronics Co., Ltd. and which relate to various types of consumer electronics devices. Each of these significant customers, in the aggregate, accounts for more than 10% of total revenues for the year ended December 31, 2014.
In addition, we sell DTS Play-Fi enabled hardware modules to consumer electronics manufacturers to incorporate our Play-Fi technology into their products. These modules are manufactured by third-party vendors. For 2014, such hardware sales did not represent a material portion of our total consolidated revenue.
SEASONALITY OF BUSINESS
Generally, consumer electronics manufacturing activities are lowest in the first calendar quarter of each year, and increase progressively throughout the remainder of the year. The third and fourth quarters are typically the strongest in terms manufacturing output as our technology licensees increase their manufacturing output to prepare for the holiday selling season. Since recognition of revenues for most arrangements lag manufacturing activity by one quarter due to the timing of licensee reporting to us, part of our revenues and earnings may by impacted by this seasonal trend on a quarter lag basis. However, the seasonal impact to our business is lessened to a certain extent by the growing number of minimum guarantee arrangements with our customers.
In general, the introduction and inclusion of DTS technologies in new and rapidly growing markets can have a material effect on quarterly revenues and profits, and can distort the moderate seasonality described above.
We actively police and enforce our intellectual property and pursue third parties who have under-reported the amount of royalties owed under a license agreement or who utilize our intellectual property without a license. As a result of these activities, from time to time, we may recognize royalty revenues that relate to licensing obligations that occurred in prior periods. These royalty recoveries may cause revenues to be higher than expected during a particular reporting period and may not occur in subsequent periods.
RESEARCH AND DEVELOPMENT
As demonstrated by our portfolio of industry-recognized, advanced technologies, we are centered around strong research and development abilities. We were founded on key research and development that focused on providing unique, cost effective and differentiated audio solutions, and we continue to develop new technologies with this same goal in mind.
As we have grown, new technologies have not only been developed internally, but also acquired from outside sources. Our technologies, and the talent and knowledge that created them, are key elements of our research and development base and will continue to be a source of new solutions going forward.
We have a group of over 160 engineers and scientists, including 19 PhDs, focused on research and development. This group oversees our product development efforts and is responsible for implementing our technology into existing and emerging products. We carry out research and development activities in the US, China, Japan, Korea, Northern Ireland, Singapore and Taiwan.
Our research and development expenses totaled $37.3 million during 2014, $31.1 million during 2013 and $25.8 million during 2012. We expect that we will continue to commit resources to research and development efforts in the future, particularly in support of our expansion across a wide variety of digital audio content and playback devices.
16
COMPETITION
We face strong competition in the consumer electronics market and expect competition to continue to intensify in the future. Our primary competitor is Dolby Laboratories, who develops and markets, among other things, high-definition audio products and services. Dolby was founded over 40 years ago and for many years was the only significant provider of audio technologies. Dolby's long-standing market position, brand, business relationships, resources and inclusion in various industry standards provide it with a strong competitive position.
In addition to Dolby, we compete in specific product markets with companies such as Fraunhofer Institut Integrierte Schaltungen and various other consumer electronics product manufacturers. Many of these competitors have a wide variety of strengths that afford them competitive advantages, such as longer operating histories, significantly greater resources, greater name recognition, or the ability to offer their technologies for a lower price or for free.
We believe that the principal competitive factors in each of our markets include some or all of the following:
- •
- technology performance, flexibility, and range of application;
- •
- quality and reliability of technologies, products and services;
- •
- expertise in engineering support and proximity to customers;
- •
- brand recognition and reputation;
- •
- inclusion in industry standards;
- •
- price;
- •
- relationships with IC, consumer electronics manufacturers, and content creators and providers;
- •
- availability of encoding tools that deliver compatible high-definition audio content;
- •
- timeliness and relevance of new product introductions; and
- •
- relationships with, and distribution networks for, production and post-production operators providing content for digital broadcast.
We have been successful in penetrating the consumer electronics markets and building and growing market share. Many top selling Blu-ray Dics and DVDs contain high-definition soundtracks in our format, and a substantial majority of consumer electronics products with high-definition or surround sound audio capability incorporate our technology, trademarks or know-how. Our success has been due in large part to our ability to position our brand as a premium offering that contains superior proprietary technology, the quality of our customer service, our inclusion in industry standards and our industry relationships.
We believe there are significant barriers to entry into the consumer electronics products market, such as our mandatory status in the Blu-ray format. Also, the standards relating to DVD are well established and support a limited number of technologies, including our codecs. Numerous other standards in which we participate support a limited number of technologies, including various DTS technologies.
EMPLOYEES
As of December 31, 2014, we had 372 employees. None of our employees are subject to a collective bargaining agreement, and we have never experienced a work stoppage. We believe our relations with our employees are good.
17
WEBSITE ACCESS TO SEC FILINGS
We file annual, quarterly and current reports, and amendments to those reports, and other information with the SEC. You may access and read our filings without charge through the SEC's website, at www.sec.gov. We also maintain an internet website at www.dts.com. We make available, free of charge through our website, our annual reports on Form 10-K, quarterly reports on Form 10-Q, current reports on Form 8-K, proxy statements and any amendments to those reports filed or furnished pursuant to Section 13(a) or 15(d) of the Securities Exchange Act of 1934, as amended, as soon as reasonably practicable after we electronically file such material with, or furnish it to, the SEC.
18
You should consider each of the following factors as well as the other information in this Annual Report in evaluating our business and our prospects. The risks and uncertainties described below are not the only ones we face. Additional risks and uncertainties not presently known to us or that we currently consider immaterial may also impair our business operations. If any of the following risks actually occur, our business, financial condition, or results of operations could suffer. In that case, the trading price of our common stock could decline, and you may lose all or part of your investment.
Risks Related to Our Business
If we are unable to maintain a sufficient amount of content released in the DTS audio format, demand for the technologies, products, and services that we offer to consumer electronics product manufacturers may significantly decline, which would adversely impact our business and prospects.
We expect to derive a significant percentage of our revenues from the technologies, products, and services that we offer to manufacturers of consumer electronics products. We believe that demand for our audio technologies in growing markets for multi-channel and/or high resolution audio, including TVs, tablets and mobile phones, video game consoles, automobiles, and soundbars, will be based on the amount, quality, and popularity of content (such as movies, TV shows, music, and games) either released in the DTS audio format or capable of being coded and played in the DTS format. In particular, our ability to penetrate the growing markets in the network-connected space depends on the presence of streaming and downloadable content released in the DTS audio format. We generally do not have contracts that require providers of streaming and downloadable content to develop and release such content in a DTS audio format. Accordingly, our revenue could decline if these parties elect not to incorporate DTS audio into their content or if they sell less content that incorporates DTS audio.
In addition, we may not be successful in maintaining existing relationships or developing new relationships with other existing or new content providers. As a result, we cannot assure you that a sufficient amount of content will be released in a DTS audio format to ensure that manufacturers continue offering DTS decoders in the consumer electronics products that they sell.
We may not be able to evolve our technologies, products, and services, or develop new technologies, products, and services, that are acceptable to our customers or the evolving markets.
The markets for our technologies, products, and services is characterized by:
- •
- rapid technological change and product obsolescence;
- •
- new and improved product introductions;
- •
- changing consumer demands;
- •
- increasingly competitive product landscape; and
- •
- evolving industry standards.
Our future success depends upon our ability to enhance our existing technologies, products, and services and to develop acceptable new technologies, products, and services on a timely basis. The development of enhanced and new technologies, products, and services is a complex and uncertain process requiring high levels of innovation, highly-skilled engineering and development personnel, and the accurate anticipation of technological and market trends. We may not be able to identify, develop, market, or support new or enhanced technologies, products, or services on a timely basis, if at all. Furthermore, our new technologies, products, and services may never gain market acceptance, and we may not be able to respond effectively to evolving consumer demands, technological changes, product
19
announcements by competitors, or emerging industry standards. Any failure to respond to these changes or concerns would likely prevent our technologies, products, and services from gaining market acceptance or maintaining market share and could lead to our technologies, products, and services becoming obsolete.
Our ability to develop proprietary technologies in markets in which "open standards" are adopted may be limited, which could adversely affect our ability to generate revenue and growth.
Standards-setting bodies may require the use of open standards, meaning that the technologies necessary to meet those standards are publicly available, free of charge and often on an "open source" basis. These standards are a relatively recent and limited occurrence and have primarily been focused on markets and regions traditionally adverse to the notion of intellectual property ownership and the associated royalties. If the concept of open standards gains industry momentum in the future, the use of open standards may reduce our opportunity to generate revenue, as open standards technologies are based upon non-proprietary technology platforms in which no one company maintains ownership over the dominant technologies.
A loss of one or more of our key customers or licensees in any of our markets could adversely affect our business.
From time to time, one or a small number of our customers or licensees may represent a significant percentage of our revenue. While our business is not substantially dependent on any single customer agreement, we have entered into several license agreements with the various divisions and companies that comprise Sony Corporation and Samsung Electronics Co., Ltd., which relate to various types of consumer electronics devices. Each of these significant customers, in the aggregate, accounted for more than 10% of total revenues for the year ended December 31, 2014. For additional information, refer to "Concentration of Business and Credit Risk" in Note 2 of our consolidated financial statements. Although we have agreements with our customers, many of these agreements do not require any material minimum purchases or minimum royalty fees and typically do not prohibit customers from purchasing or licensing technologies, products, and services from competitors. A decision by any of our major customers or licensees not to use our technologies, or their failure or inability to pay amounts owed to us in a timely manner, or at all, could have a significant adverse effect on our business.
We face intense competition and certain of our competitors have greater resources than we do.
The digital audio, consumer electronics and entertainment markets are intensely competitive, subject to rapid change, and significantly affected by new product introductions and other market activities of industry participants. Our principal competitor is Dolby Laboratories, Inc. (Dolby), who competes with us in most of our markets. We also compete with other companies offering digital audio technology incorporated into consumer electronics product and entertainment mediums, such as Fraunhofer Institut Integrierte Schaltungen.
Certain of our current and potential competitors may enjoy substantial competitive advantages, including:
- •
- greater name recognition;
- •
- a longer operating history;
- •
- a greater global footprint and presence;
- •
- more developed distribution channels and deeper relationships with our common customer base;
- •
- a more extensive customer base;
20
- •
- digital technologies that provide features that ours do not;
- •
- broader product and service offerings;
- •
- greater resources for competitive activities, such as research and development, strategic acquisitions, alliances, joint ventures,
sales and marketing, subsidies and lobbying industry and government standards;
- •
- more technicians and engineers;
- •
- greater technical support;
- •
- the ability to offer open source or free codecs; and
- •
- greater inclusion in government or industry standards.
As a result, these current and potential competitors may be able to respond more quickly and effectively than we can to new or changing opportunities, technologies, standards, or customer requirements.
In addition to the competitive advantages described above, Dolby also enjoys other unique competitive strengths relative to us. For example, it introduced multi-channel audio technology before we did. It has also achieved mandatory standard status in product categories that we have not, including terrestrial digital TV broadcasts in the US. As a result of these factors, Dolby has a competitive advantage in selling its digital multi-channel audio technology.
Our customers, who are also our current or potential competitors, may choose to use their own or competing technologies rather than ours.
We face competitive risks in situations where our customers are also current or potential competitors. For example, certain of our licensee customers maintain in-house audio engineering teams. To the extent that our customers choose to use technologies they have developed or in which they have an interest, rather than use our technologies, our business and operating results could be adversely affected.
Our business and prospects depend upon the strength of our brands, and if we do not maintain and strengthen our brands, our business could be materially harmed.
Establishing, maintaining and strengthening our corporate and product brands is critical to our success. Our brand identity is key to maintaining and expanding our business and entering new markets. Our success depends in large part on our reputation for providing high-quality technologies, products, and services to the consumer electronics and entertainment industries. If we fail to promote and maintain our brands successfully, our business and prospects may suffer. Additionally, we believe that the likelihood that our technologies will be adopted in industry standards depends, in part, upon the strength of our brands, because professional organizations and industry participants are more likely to incorporate technologies developed by well-respected and well-known brands into standards.
Declining retail prices for consumer electronics products could force us to lower the license or other fees we charge our customers or prompt our customers to exclude our audio technologies from their products altogether, which would adversely affect our business and operating results.
The market for consumer electronics products is intensely competitive and price sensitive. Retail prices for consumer electronics products that include our audio technologies have decreased significantly, and we expect prices to continue to decrease for the foreseeable future. Declining prices for consumer electronics products could create downward pressure on the licensing fees we currently charge our customers who integrate our technologies into the consumer electronics products that they
21
sell and distribute. As a result of pricing pressure, consumer electronics product manufacturers who produce products in which our audio technologies are not a mandatory standard could decide to exclude our audio technologies from their products altogether.
Our revenue is dependent upon our customers and licensees incorporating our technologies into their products, and we have limited control over existing and potential customers' and licensees' decisions to include our technologies in their product offerings.
Except for Blu-ray products, where our technology is mandatory, we are dependent upon our customers and licensees—including consumer electronics product manufacturers, semiconductor manufacturers, producers and distributors of content—to incorporate our technologies into their products, purchase our products and services, or release their content in our proprietary DTS audio format. We have contracts and license agreements with many of these companies, which generally are non-exclusive and do not contain any minimum purchase commitments. Furthermore, the decision by a party dominant in the entertainment value chain to provide audio technology at very low or no cost could impact a licensee's decision to use our technology. Our customers, licensees and other manufacturers might not utilize our technologies or services in the future. Accordingly, our revenue could decline if our customers and licensees choose not to incorporate our technologies in their products, or if they sell fewer products incorporating our technologies.
Our licensing revenue depends in large part upon semiconductor manufacturers incorporating our technologies into integrated circuits (ICs), for sale to our consumer electronics product licensees. If our technologies are not incorporated in these ICs, IC production is delayed, or fewer ICs are sold that incorporate our technologies, our operating results would be adversely affected.
Our licensing revenue from consumer electronics product manufacturers depends in large part upon the availability of ICs that implement our technologies. IC manufacturers incorporate our technologies into these ICs, which are then incorporated into consumer electronics products. We do not manufacture these ICs, but rather depend upon IC manufacturers to develop, produce and then sell them to licensed consumer electronics product manufacturers. We do not control the IC manufacturers' decisions whether or not to incorporate our technologies into their ICs, and we do not control their product development or commercialization efforts. If these IC manufacturers are unable or unwilling to implement our technologies into their ICs, production is delayed, or if they sell fewer ICs incorporating our technologies, our operating results could be adversely affected.
If there is a continued decline in optical disc based media consumption and if our ability to further penetrate the streaming and downloadable content delivery markets and adapt our technologies for those markets is limited, our revenues and ability to grow could be adversely impacted.
Video and audio content has historically been purchased and consumed primarily via optical disc based media, such as Blu-ray Disc, DVD, and CD. However, the growth of the internet and network-connected device usage (including PCs, TVs, set-top boxes and DMPs, tablets, and smartphones), along with the rapid advancement of online and mobile content delivery has resulted in the recent trend to entertainment download and streaming services becoming mainstream with consumers in various parts of the world. We expect the shift away from optical disc based media to streaming and downloadable content consumption to continue, which may result in further declines in revenue from Blu-ray Disc and DVD players that incorporate our technologies.
Also, the services that provide content from the cloud are not generally governed by international or national standards and are thus free to choose any media format(s) to deliver their products and services. This freedom of choice on the part of online content providers could limit our ability to grow if such content providers do not incorporate our technologies into their services, which could affect demand for our technologies.
22
Furthermore, our inclusion in mobile and other network-connected devices may be less profitable for us than optical disc players. The online and mobile markets are characterized by intense competition, evolving industry standards and business and distribution models, disruptive software and hardware technology developments, frequent new product and service introductions, short product and service life cycles, and price sensitivity on the part of consumers, all of which may result in downward pressure on pricing. Any of the foregoing could adversely affect our business and operating results.
The licensing of patents constitutes a significant source of our revenue. If we do not replace expiring patents with new patents or proprietary technologies, our revenue could decline.
We hold patents covering a majority of the technologies that we license, and our licensing revenue is tied in large part to the life of those patents. Our right to receive royalties related to our patents terminates with the expiration of the last patent covering the relevant technologies. Accordingly, to the extent that we do not replace licensing revenue from technologies covered by expiring patents with licensing revenue based on new patents and proprietary technologies, our revenue could decline.
If we fail to protect our intellectual property rights or if changing laws have an adverse effect on our ability to protect such rights, our ability to compete could be harmed.
Protection of our intellectual property is critical to our success. Copyright, trademark, patent, and trade secret laws and confidentiality and other contractual provisions afford only limited protection and may not adequately protect our rights or permit us to gain or keep any competitive advantage. We face numerous risks in protecting our intellectual property rights, including the following:
- •
- our competitors may produce competitive technologies, products or services that do not unlawfully infringe upon our intellectual
property rights;
- •
- the laws related to the protection of intellectual property may not be the same in all countries or may change over time resulting in
no or inadequate protection for our intellectual property, and mechanisms for enforcement of intellectual property rights may be inadequate;
- •
- we may be unable to successfully identify or prosecute unauthorized uses of our technologies;
- •
- efforts to identify and prosecute unauthorized uses of our technologies are time consuming, expensive, and divert resources from the
operation of our business;
- •
- our patents may be challenged, found unenforceable or invalidated by our competitors;
- •
- our pending patent applications may be found not patentable, may not issue, or if issued, may not provide meaningful protection for
related products or proprietary rights;
- •
- we may not be able to practice our trade secrets as a result of patent protection afforded a third-party for such product, technique
or process; and
- •
- we may not be able to prevent the unauthorized disclosure or use of our technical knowledge or other trade secrets by employees, consultants, and advisors.
As a result, our means of protecting our intellectual property rights and brands may prove inadequate or unenforceable. Furthermore, despite our efforts, third parties may violate, or attempt to violate, our intellectual property rights. Enforcement, including infringement claims and lawsuits would likely be expensive to resolve and would require management's time and resources. In addition, we have not sought, and do not intend to seek, patent and other intellectual property protections in all foreign countries. In countries where we do not have such protection, products incorporating our technology may be able to be lawfully produced and sold without a license.
23
We may be sued by third parties for alleged infringement of their proprietary rights, and we may be subject to litigation proceedings that could harm our business.
Companies that participate in the digital audio, consumer electronics, and entertainment industries hold a large number of patents, trademarks, and copyrights, and are frequently involved in litigation based on allegations of patent infringement or other violations of intellectual property rights. Intellectual property disputes frequently involve highly complex and costly scientific matters, and each party generally has the right to seek a trial by jury which adds additional costs and uncertainty. Accordingly, intellectual property disputes, with or without merit, could be costly and time consuming to litigate or settle, and could divert management's attention from executing our business plan. In addition, our technologies and products may not be able to withstand any third-party claims or rights against their use. If we were unable to obtain any necessary license following a determination of infringement or an adverse determination in litigation or in interference or other administrative proceedings, we may need to redesign some of our technologies or products to avoid infringing a third party's rights and could be required to temporarily or permanently discontinue licensing our technologies or products.
In the past, we have been a party to litigation related to protection and enforcement of our intellectual property, and we may be a party to litigation in the future. Litigation is subject to inherent uncertainties and unfavorable rulings could occur. An unfavorable ruling could include monetary damages (including treble damages under the Clayton Act) and an injunction prohibiting us from licensing our technologies in particular ways or at all. If an unfavorable ruling occurred, our business and operating results could be materially harmed. In addition, any protracted litigation could divert management's attention from our day-to-day operations, disrupt our business and cause our operating results to suffer.
We rely on the accuracy of our customers' manufacturing reports for reporting and collecting our revenues, and if these reports are untimely or incorrect, our revenues could be delayed or inaccurately reported.
Most of our revenues are generated from consumer electronics product manufacturers who license and incorporate our technology in their consumer electronics products. Under our existing agreements, many of these customers pay us per-unit licensing fees based on the number of consumer electronics products manufactured that incorporate our technology. We rely on our customers to accurately report the number of units manufactured in collecting our license fees, preparing our financial reports, projections, budgets, and directing our sales and product development efforts. Our license agreements permit us to audit our customers, but audits are generally expensive, time consuming, difficult to manage effectively, dependent in large part upon the cooperation of our licensees and the quality of the records they keep, and could harm our customer relationships. If any of our customer reports understate the number of products they manufacture, we may not collect and recognize revenues to which we are entitled, or may endure significant expense to obtain compliance. Alternatively, customer reports could overstate the number of products manufactured, which would require us to refund the customer and reflect the overstated amount as a reduction of revenue in the period determined.
We have in the past and may in the future have disputes with our licensees regarding our licensing arrangements.
At times, we are engaged in disputes regarding the licensing of our intellectual property rights, including matters related to misreporting of units manufactured, application of royalty rates, and interpretation of other terms of our licensing arrangements. These types of disputes can be asserted by our customers or prospective customers or by other third parties as part of negotiations with us or in private actions seeking monetary damages or injunctive relief, or in regulatory actions. In the past, licensees have threatened to initiate litigation against us regarding our licensing royalty rate practices including our adherence to licensing on fair, reasonable, and non-discriminatory terms and potential
24
antitrust claims. Damages and requests for injunctive relief asserted in claims like these could be material, and could be disruptive to our business. Any disputes with our customers or potential customers or other third parties could adversely affect our business, results of operations, and prospects.
Our technologies and products are complex and may contain errors that could cause us to lose customers, damage our reputation, or incur substantial costs.
Our technologies or products could contain errors that could cause our technologies or products to operate improperly and could cause unintended consequences. If our technologies or products contain errors, we could be required to replace them, and if any such errors cause unintended consequences, we could face claims for product liability. Although we generally attempt to contractually limit our exposure to incidental and consequential damages, as well as provide insurance coverage for such events, if these contract provisions are not enforced or are unenforceable, if liabilities arise that are not effectively limited, or if our insurance coverage is inadequate to satisfy the liability, we could incur substantial costs in defending or settling product liability claims.
We expect our expenses to increase in the future, which may impact profitability.
We expect our expenses to increase as we, among other things:
- •
- expand our sales and marketing activities, including the continued development of our international operations and increased
advertising;
- •
- adopt a more customer-focused business model which is expected to entail additional hiring;
- •
- acquire businesses or technologies and integrate them into our existing organization;
- •
- increase our research and development efforts to advance our existing technologies, products, and services and develop new
technologies, products, and services;
- •
- hire additional personnel, including engineers and other technical staff;
- •
- expand and defend our intellectual property portfolio; and
- •
- upgrade our operational and financial systems, procedures, and controls.
As a result, we will need to grow our revenues and manage our costs in order to positively impact profitability. In addition, we may fail to accurately estimate and assess our increased operating expenses as we grow.
We may not successfully address problems encountered in connection with acquisitions or strategic investments.
We consider opportunities to acquire or make investments in other technologies, products, and businesses that could enhance our technical capabilities, complement our current technologies, products and services, or expand the breadth of our markets. While we have acquired a number of businesses in the past, our history of acquiring and integrating businesses is limited, and there can be no assurance that we will be successful in realizing the expected benefits from an acquisition or investment. Future success depends, in part, upon our ability to manage an expanded business, which could pose substantial challenges for management. Acquisitions and strategic investments involve numerous risks and potential difficulties, including:
- •
- problems assimilating the purchased technologies, products, or business operations;
- •
- significant future charges relating to in-process research and development and the amortization of intangible assets;
25
- •
- significant amount of goodwill and intangible assets that are not amortizable and are subject to annual impairment review and
potential impairment losses;
- •
- problems maintaining and enforcing uniform standards, procedures, controls, policies and information systems;
- •
- unanticipated costs, including accounting and legal fees, capital expenditures, and transaction expenses;
- •
- diversion of management's attention from our core business;
- •
- adverse effects on existing business relationships with suppliers and customers;
- •
- risks associated with entering markets in which we have no or limited experience;
- •
- unanticipated or unknown liabilities relating to the acquired businesses;
- •
- the need to integrate accounting, management information, manufacturing, human resources and other administrative systems and
personnel to permit effective management; and
- •
- potential loss of key employees of acquired organizations.
If we fail to properly evaluate and execute acquisitions and strategic investments, our management team may be distracted from our day-to-day operations, our business may be disrupted, and our operating results may suffer. In addition, if we finance acquisitions by issuing equity or convertible debt securities, our existing stockholders would be diluted. Foreign acquisitions and investments involve unique risks in addition to those mentioned above, including those related to integration of operations across different geographies, cultures and languages, currency risks and risks associated with the particular economic, political and regulatory environment in specific countries. Furthermore, future results will be affected by our ability or inability to integrate acquired businesses quickly and obtain the anticipated benefits and synergies. Also, in cases where stockholder approval of an acquisition or strategic investment is required, and we fail to obtain such stockholder approval, the anticipated benefit of our acquisitions and investments may not materialize.
Future acquisitions and investments could result in potentially dilutive issuances of our equity securities, the incurrence of debt or contingent liabilities, amortization expenses, or impairment losses on goodwill and intangible assets, any of which could harm our operating results and financial condition. Future acquisitions may also require us to obtain additional equity or debt financing, which may not be available on favorable terms or at all.
We may have difficulty managing any growth that we might experience.
As a result of a combination of organic growth and growth through acquisitions, we expect to continue to experience growth in the scope of our operations and the number of our employees. If our growth continues, it may place a significant strain on our management team and on our operational and financial systems, procedures, and controls. Our future success will depend in part upon the ability of our management team to manage any growth effectively, requiring our management to:
- •
- recruit, hire, and train additional personnel;
- •
- implement and improve our operational and financial systems, procedures, and controls;
- •
- maintain our cost structure at an appropriate level based on the revenues we forecast and generate;
- •
- manage multiple concurrent development projects; and
- •
- manage operations in multiple time zones with different cultures and languages.
26
Any failure to successfully manage our growth could distract management's attention and result in failure to execute our business plan.
We are dependent upon certain key employees.
Our success depends, in part, upon the continued availability and contributions of our management team and engineering and technical personnel because of the complexity of our technologies, products, and services. Important factors that could cause the loss of key personnel include:
- •
- our existing employment agreements with the members of our management team allow such persons to terminate their employment with us at
any time;
- •
- we do not have employment agreements with a majority of our key engineering and technical personnel;
- •
- not maintaining a competitive compensation package, including cash and equity compensation;
- •
- our ability to obtain stockholder support for new or amended equity plans to provide the level of initial and annual equity grants
expected by key talent in today's competitive job market; and
- •
- significant portions of the equity awards are vested or may be underwater.
The loss of key personnel or an inability to attract qualified personnel in a timely manner could slow our technology and product development and harm our ability to execute our business plan.
We have identified material weaknesses in our internal control over financial reporting. If we are unable to maintain effective internal controls over our financial reporting, investors may lose confidence in our ability to provide reliable and timely financial reports and the value of our common stock may decline.
We are required, pursuant to Section 404 of the Sarbanes-Oxley Act, to furnish a report by management on, among other things, the effectiveness of our internal control over financial reporting. This assessment includes disclosure of any material weaknesses identified by our management in our internal control over financial reporting, as well as a statement that our independent registered public accounting firm has issued an attestation report on the effectiveness of our internal control over financial reporting.
Our management concluded that our internal control over financial reporting was ineffective as of December 31, 2013 because a material weakness existed in internal control over financial reporting related to the accounting for revenue. Management determined that this material weakness was remediated during 2014. Our management concluded that our internal control over financial reporting was ineffective as of December 31, 2014 because a material weakness existed in our internal control over financial reporting related to the accounting for income taxes. Refer to Item 9A, "Controls and Procedures" for additional information.
Internal control over financial reporting is a process designed to provide reasonable assurance regarding the reliability of financial reporting in accordance with accounting principles generally accepted in the United States. Because the inherent limitations of internal control over financial reporting cannot guarantee the prevention or detection of a material weakness, we can never guarantee a material weakness over financial reporting will not occur, including with respect to any previously reported material weaknesses. If we identify one or more additional material weaknesses in the future, investors could lose confidence in the accuracy and completeness of our financial reports, which could have a material adverse effect on the price of our common stock.
27
Our multi-national legal structure is complex, which increases the risk of errors in financial reporting related to our accounting for income taxes. We may find additional errors in our accounting for income taxes or discover new facts that cause us to reach different conclusions. In addition, given the complexity of certain of the Company's license agreements and the accounting standards governing revenue recognition related thereto, we may find additional errors in our accounting for revenue or discover new facts that cause us to reach different conclusions. This could result in adjustments that could have an adverse effect on our consolidated financial statements. This could also adversely impact our stock price, damage our reputation or cause us to incur substantial costs.
Compliance with changing securities laws, regulations and financial reporting standards will increase our costs and pose challenges for our management team.
Changing laws, regulations and standards relating to corporate governance and public disclosure, including the Dodd-Frank Wall Street Reform and Consumer Protection Act, the Sarbanes-Oxley Act of 2002, and the rules and regulations promulgated thereunder have created uncertainty for public companies and significantly increased the costs and risks associated with operating as a publicly traded company in the US. Our management team will need to devote significant time and financial resources to comply with both existing and evolving standards for public companies, which will lead to increased general and administrative expenses and a diversion of management time and attention from revenue generating activities to compliance activities. Furthermore, with such uncertainties, we cannot assure you that our system of internal control will be effective or satisfactory to our independent registered public accounting firm. As a result, our financial reporting may not be timely or accurate and we may be issued an adverse or qualified opinion by our independent registered public accounting firm. If reporting delays or material errors actually occur, we could be subject to sanctions or investigation by regulatory authorities, such as the SEC, which could adversely affect our financial results or result in a loss of investor confidence in the reliability of our financial information, which could materially and adversely affect the market price of our common stock.
The SEC has adopted rules regarding disclosure of the use of conflict minerals (commonly referred to as tantalum, tin, tungsten, and gold), which are sourced from the Democratic Republic of the Congo and surrounding countries. This requirement could affect the sourcing, availability and pricing of materials used to manufacture certain of our products. Consequently, we will incur costs in complying with these disclosure requirements, including due diligence to determine the source of the minerals used in our products, and we may not be able to sufficiently verify the origins for the minerals used in our products. Our reputation may suffer if we determine that our products contain conflict minerals that are not determined to be conflict free or if we are unable to sufficiently verify the origins for all conflict minerals used in our products.
In addition, the Committee of Sponsoring Organizations of the Treadway Commission (COSO) has issued a new 2013 version of its internal control framework, which was deemed by COSO to supersede the 1992 version of the framework effective December 15, 2014. To the best of our knowledge, we have conformed to this updated framework to design and implement our system of internal control over financial reporting. We have invested significant costs and efforts to adopt this updated framework, which has required and may continue to require management's ongoing attention to documenting, maintaining and auditing our internal controls under the new COSO framework.
Further, the SEC has passed, promulgated and proposed new rules on a variety of subjects including the possibility that we would be required to adopt International Financial Reporting Standards (IFRS). Additionally, the Financial Accounting Standards Board (FASB) continually updates accounting standards with which we may be required comply. In order to comply with IFRS requirements or implementation of new or updated accounting standards, we may have to add additional accounting staff, engage consultants or change our internal practices, standards and policies which could significantly increase our costs.
28
We believe that these new and proposed laws and regulations could make it more difficult for us to attract and retain qualified members of our Board of Directors, particularly to serve on our audit committee, and qualified executive officers.
Current and future governmental and industry standards may significantly limit our business opportunities.
Technology standards are important in the audio and video industry as they help to assure compatibility across a system or series of products. Generally, standards adoption occurs on either a mandatory basis, requiring a particular technology to be available in a particular product or medium, or an optional basis, meaning that a particular technology may be, but is not required to be, utilized. For example, both our digital multi-channel audio technology and Dolby's have optional status in Blu-ray, while both our two-channel output and Dolby's technologies have been selected as mandatory standards in Blu-ray. However, if either or both of these standards are re-examined or a new standard is developed, we may not be included as mandatory in any such new or revised standard which would cause revenue growth in that area of our business to be significantly lower than expected and could have a material adverse effect on our business.
Various national governments have adopted or are in the process of adopting standards for all digital TV broadcasts, including cable, satellite, and terrestrial. In the US, Dolby's audio technology has been selected as the sole, mandatory audio standard for terrestrial digital TV broadcasts. As a result, the audio for all digital terrestrial TV broadcasts in the US must include Dolby's technology and must exclude any other format, including ours. We do not know whether this standard will be reopened or amended. If it is not, our audio technology may never be included in that standard. Certain large and developing markets, such as China, have not fully developed their digital TV standards. Our technology may or may not ultimately be included in these standards.
As new technologies and entertainment media emerge, new standards relating to these technologies or media may develop. New standards may also emerge in existing markets that are currently characterized by competing formats, such as the market for PCs. We may not be successful in our efforts to include our technology in any such standards.
Our licensing of industry standard technologies can be subject to limitations that could adversely affect our business and prospects.
When a standards-setting body adopts our technologies as explicit industry standards, we generally must agree to license such technologies on a fair, reasonable and non-discriminatory basis, which we believe means that we treat similarly situated licensees similarly. In these situations, we may be required to limit the royalty rates we charge for these technologies, which could adversely affect our business. Furthermore, we may have limited control over whom we license such technologies to, and may be unable to restrict many terms of the license. From time to time, we may be subject to claims that our licenses of our industry standard technologies may not conform to the requirements of the standards-setting body. Claimants in such cases could seek to restrict or change our licensing practices or our ability to license our technologies in ways that could injure our reputation and otherwise materially and adversely affect our business, operating results and prospects.
Our business, operations and reputation could suffer in the event of security breaches.
Attempts by others to gain unauthorized access to information technology systems, including systems designed and managed by third parties, are becoming more sophisticated and successful. These attempts can include introducing malware to computers and networks, impersonating authorized users, overloading systems and servers and data theft. While we seek to detect and investigate any security issue, in some cases, we might be unaware of an incident or its magnitude and effects. The theft, unauthorized use or publication of our intellectual property or confidential business information could
29
harm our competitive position, reduce the value of our investment in research and development and other strategic initiatives or otherwise adversely affect our business. To the extent that any security breach results in inappropriate disclosure of our customers' or licensees' confidential information, we may incur liability as a result. Further, disruptions to certain of our information technology systems could have severe consequences to our business operations, including financial loss and reputational damage.
We may experience fluctuations in our operating results.
We have historically experienced moderate seasonality in our business due to our business mix and the nature of our products. Consumer electronics manufacturing activities are generally lowest in the first calendar quarter of each year, and increase progressively throughout the remainder of the year. Manufacturing output is generally strongest in the third and fourth quarters as our technology licensees increase manufacturing to prepare for the holiday buying season. Since recognition of a majority of revenue lags manufacturing activity by one quarter, our revenues and earnings are generally lowest in the second quarter. The introduction of new technologies, products and services and inclusion of our technologies in new and rapidly growing markets can distort and amplify the seasonality described above. Our revenues may continue to be subject to fluctuations, seasonal or otherwise, in the future. Unanticipated fluctuations, whether due to seasonality, economic downturns, product cycles, or otherwise, could cause us to miss our revenue and earnings projections, or could lead to higher than normal variation in short-term revenue and earnings, either of which could cause our stock price to decline.
In addition, we actively engage in intellectual property compliance and enforcement activities focused on identifying third parties who have either incorporated our technologies, trademarks, or know-how without a license or who have underreported to us the amount of royalties owed under license agreements with us. As a result of these activities, from time to time, we may recognize royalty revenues that relate to manufacturing activities from prior periods, and we may incur expenditures related to enforcement activity. These royalty recoveries and expenditures, as applicable, may cause revenues to be higher than expected, or results to be lower than expected, during a particular reporting period and may not recur in future reporting periods. Such fluctuations in our revenues and operating results may cause declines in our stock price.
We are subject to additional risks associated with our international operations.
We market and sell our technologies, products and services outside the US. We currently have employees located in several countries throughout Europe and Asia, and most of our customers and licensees are located outside the US. As a key component of our business strategy, we intend to expand our international sales and customer support. During the year ended December 31, 2014, over 85% of our revenues were derived internationally. We face numerous risks in doing business outside the US, including:
- •
- unusual or burdensome foreign laws or regulatory requirements or unexpected changes to those laws or requirements;
- •
- tariffs, trade protection measures, import or export licensing requirements, trade embargos, and other trade barriers;
- •
- difficulties in attracting and retaining qualified personnel and managing foreign operations;
- •
- competition from foreign companies;
- •
- dependence upon foreign distributors and their sales channels;
- •
- longer accounts receivable collection cycles and difficulties in collecting accounts receivable;
30
- •
- less effective and less predictable protection and enforcement of our intellectual property;
- •
- changes in the political or economic condition of a specific country or region, particularly in emerging markets;
- •
- fluctuations in the value of foreign currency versus the US dollar and the cost of currency exchange;
- •
- potentially adverse tax consequences, including withholding VAT and other sales-related taxes, and changes in tax laws; and
- •
- cultural differences in the conduct of business.
Such factors could cause our future international sales to decline.
Our business practices in international markets are also subject to the requirements of the Foreign Corrupt Practices Act. If any of our employees are found to have violated these requirements, we and our employees could be subject to significant fines, criminal sanctions and other penalties.
Our international revenue is mostly denominated in US dollars. As a result, fluctuations in the value of the US dollar and foreign currencies may make our technologies, products, and services more expensive for international customers, which could cause them to decrease their business with us. Expenses for our subsidiaries are denominated in their respective local currencies. As a result, if the US dollar weakens against the local currency, the translation of our foreign-currency-denominated expenses will result in higher operating expense without a corresponding increase in revenue. Significant fluctuations in the value of the US dollar and foreign currencies could have a material impact on our consolidated financial statements. The main foreign currencies we encounter in our operations are the EUR, GBP, HKD, JPY, KRW, RMB, SGD and TWD. We do not currently engage in currency hedging activities to limit the risk of exchange rate fluctuations.
Unanticipated changes in our tax provisions or adverse outcomes resulting from examination of our income tax returns could adversely affect our net income.
We are subject to income taxes in both the US and in foreign jurisdictions. Our effective income tax rate could be adversely affected by changes in tax laws or interpretations of those tax laws, by changes in the mix of earnings in countries with differing statutory tax rates or by changes in the valuation of our deferred tax assets and liabilities. Significant judgment is required in determining our worldwide provision for income taxes. In the ordinary course of our business, there are many transactions and calculations where the ultimate tax determination is uncertain. We may come under audit by tax authorities. For instance, the California Franchise Tax Board (FTB) is examining our 2009 and 2010 corporate tax returns, including certain prior period carryforwards from 2006 to 2008. Although we believe our tax estimates are reasonable, the final determination of tax audits and any related litigation could be materially different from our historical income tax provisions and accruals. Based on the results of an audit or litigation, a material effect on our income tax provision, net income or cash flows in the period or periods for which that determination is made could result. In addition, changes in tax rules, such as expiration of tax credits, may adversely affect our future reported financial results or the way we conduct our business. We earn a significant amount of our operating income from outside the US, and any repatriation of funds currently held in foreign jurisdictions would result in additional tax expense. In addition, there have been proposals to change US and foreign tax laws that would significantly impact how US multinational corporations are taxed on foreign earnings. For example, the Organization for Economic Co-operation and Development (OECD), an international association of 34 countries including the United States, is contemplating revisions to certain corporate tax, transfer pricing, and tax treaty provisions. If and when the OECD finalizes these revisions, they could be adopted by many countries. These contemplated revisions, if adopted by various countries, could increase our income taxes and adversely affect our provision for income taxes. Although we
31
cannot predict whether or in what form this proposed legislation will pass, if enacted, it could have a material adverse impact on our tax expense and cash flows.
Economic downturns could disrupt and materially harm our business.
Negative trends in the general economy could cause a downturn in the market for our technologies, products and services, as the end-products in which our technologies are incorporated are discretionary goods, including TVs, speakers, soundbars, PCs, and mobile devices. Weakness in the global financial markets could result in a tightening in the credit markets, a low level of liquidity in many financial markets and volatility in credit and equity markets. Such a weakness could adversely affect our operating results if it results, for example, in the insolvency of a key licensee or other customer, the inability of our licensees or other customers to obtain credit to finance their operations, including financing the manufacture of products containing our technologies, and delays in reporting or payments from our licensees. Tight credit markets could also delay or prevent us from acquiring or making investments in other technologies, products or businesses that could enhance our technical capabilities, complement our current technologies, products, and services, or expand the breadth of our markets. If we are unable to execute such acquisitions or strategic investments, our operating results and business prospects may suffer.
In addition, global economic conditions, including increased cost of commodities, widespread employee layoffs, actual or threatened military action by the US and the threat of terrorism could result in decreased consumer confidence, disposable income and spending. Any reduction in consumer confidence or disposable income may negatively affect the demand for consumer electronics products that incorporate our technologies.
We cannot predict other negative events that may have adverse effects on the global economy in general and the consumer electronics industry specifically. However, the factors described above and such unforeseen events could negatively affect our revenues and operating results.
We have a limited operating history in certain new and evolving consumer electronics markets.
Our technologies have only recently been incorporated into certain markets, such as mobile devices and wireless speakers. We do not have the same experience in these markets as in our traditional consumer electronics business, nor do we have as much operating history as other companies, such as Dolby. As a result, the demand for our technologies, products, and services and the income potential of these businesses is unproven. In addition, because our participation in these markets is relatively new and rapidly evolving, we may have limited insight into trends that may emerge and affect our business. We may make errors in predicting and reacting to relevant business trends, which could harm our business. Before investing in our common stock, investors should consider the risks, uncertainties, and difficulties frequently encountered by companies in new and rapidly evolving markets such as ours. We may not be able to successfully address any or all of these risks.
We have incurred a significant amount of indebtedness. Our level of indebtedness, and covenant restrictions under such indebtedness, could adversely affect our operations and liquidity.
We entered into a credit agreement with Wells Fargo Bank, National Association (Wells Fargo) in September 2014, which provides us with a $25.0 million secured revolving line of credit and a $25.0 million secured term loan. During 2014, we repaid the $30.0 million line of credit under the previously existing loan agreement with MUFG Union Bank, N.A. (formerly known as Union Bank, N.A.), and repaid $5.0 million on the term loan with Wells Fargo. As of December 31, 2014, we had $20.0 million outstanding under the term loan and $5.0 million under the revolving line of credit.
32
Our indebtedness could adversely affect our operations and liquidity, by, among other things:
- •
- making it more difficult for us to pay or refinance our debts as they become due during adverse economic and industry conditions,
because we may not have sufficient cash flows to make our scheduled debt payments;
- •
- causing us to use a larger portion of our cash flows to fund interest and principal payments, reducing the availability of cash to
fund working capital, capital expenditures, and other business activities;
- •
- making it more difficult for us to take advantage of significant business opportunities, such as acquisition opportunities, and to
react to changes in market or industry conditions; and
- •
- limiting our ability to borrow additional monies in the future to fund working capital, capital expenditures and other general corporate purposes.
The terms of our indebtedness include certain reporting and financial covenants, as well as other covenants, that, among other things, may restrict our ability to: dispose of assets, incur additional indebtedness, incur guarantee obligations, pay dividends, repurchase common stock, create liens on assets, enter into sale and leaseback transactions, make investments, loans or advances, make acquisitions, engage in mergers or consolidations, change the business conducted, and engage in certain transactions with affiliates. If we fail to comply with any of these covenants or restrictions, such failure may result in an event of default, which if not cured or waived, could result in the lenders increasing the interest rate as of the date of default or accelerating the maturity of our indebtedness. If the maturity is accelerated, we may not have sufficient cash resources to satisfy our debt obligations and such acceleration would adversely affect our business and financial condition. In addition, the indebtedness under our credit agreement is secured by a security interest in substantially all of our tangible and intangible assets and therefore, if we are unable to repay such indebtedness, the lenders could foreclose on these assets, which would adversely affect our ability to operate our business.
Our future capital needs are uncertain and we may need to raise additional funds in the future, and such funds may not be available on acceptable terms or at all.
Our capital requirements will depend upon many factors, including:
- •
- acceptance of, and demand for, our technologies, products and services;
- •
- the costs of developing new technologies or products;
- •
- the extent to which we invest in new technologies and research and development projects;
- •
- the number and timing of acquisitions and other strategic transactions;
- •
- the costs associated with our expansion; and
- •
- the costs of litigation and enforcement activities to defend our intellectual property.
In the future, we may need to raise additional funds, and such funds may not be available on favorable terms, or at all, particularly given the credit crisis and downturn in the overall global economy. Furthermore, if we issue equity or debt securities to raise additional funds, our existing stockholders may experience dilution, and the new equity or debt securities may have rights, preferences, and privileges senior to those of our existing stockholders. If we cannot raise funds on acceptable terms, or at all, we may not be able to develop or enhance our technologies, products, and services, execute our business plan, take advantage of future opportunities, or respond to competitive pressures or unanticipated customer requirements. This may materially harm our business, results of operations, and financial condition.
33
Natural or other disasters could disrupt our business and negatively impact our operating results and financial condition.
Natural or other disasters such as earthquakes, hurricanes, tsunamis or other adverse weather and climate conditions, whether occurring in the US or abroad, and the consequences and effects thereof, including energy shortages and public health issues, could disrupt our operations, or the operations of our business partners and customers, or result in economic instability that may negatively impact our operating results and financial condition. Our corporate headquarters and many of our operations are located in California, a seismically active region, potentially exposing us to greater risk of natural disasters.
Risks Related to Our Common Stock
The price of our common stock may fluctuate.
The market price of our common stock has been highly volatile and may fluctuate substantially due to many factors, including:
- •
- actual or anticipated fluctuations in our results of operations or non-GAAP operating income or loss;
- •
- market perception of our progress toward announced objectives;
- •
- announcements of technological innovations by us or our competitors or technology standards;
- •
- announcements of significant contracts or partnerships by us or our competitors;
- •
- changes in our pricing policies or the pricing policies of our competitors;
- •
- developments with respect to intellectual property rights;
- •
- the introduction of new technologies or products or product enhancements by us or our competitors;
- •
- the commencement of or our involvement in litigation;
- •
- resolution of significant litigation in a manner adverse to our business;
- •
- our sale or purchase of common stock or other securities in the future;
- •
- conditions and trends in technology and entertainment industries;
- •
- changes in market valuation or earnings of our competitors;
- •
- the trading volume of our common stock;
- •
- announcements of potential acquisitions;
- •
- the adoption rate of new products incorporating our or our competitors' technologies, including mobile devices;
- •
- changes in the estimation of the future size and growth rate of our markets; and
- •
- general economic conditions.
In addition, the stock market in general, and the NASDAQ Global Select Market and the market for technology companies in particular, has experienced extreme price and volume fluctuations that have often been unrelated or disproportionate to the operating performance of those companies. These broad market and industry factors may materially harm the market price of our common stock, regardless of our operating performance. In the past, following periods of volatility in the market price of a company's securities, securities class-action litigation has often been instituted against that
34
company. Such litigation, if instituted against us, could result in substantial costs and a diversion of management's attention and resources.
Shares of our common stock may be relatively illiquid.
As a result of our relatively small public float, our common stock may be less liquid than the common stock of companies with broader public ownership. Among other things, trading of a relatively small volume of our common shares may have a greater impact on the trading price for our shares than would be the case if our public float were larger.
If securities or industry analysts publish inaccurate or unfavorable research about our business or if our operating results do not meet or exceed their projections, our stock price could decline.
The trading market for our common stock depends in part on the research and reports that securities or industry analysts publish about us or our business. If one or more of the analysts who cover us or our industry downgrade our stock or the stock of other companies in our industry, or publish inaccurate or unfavorable research about our business or industry, or if our results do not meet or exceed their projections, our stock price would likely decline. If one or more of these analysts cease coverage of our company or fail to publish reports on us regularly, demand for our stock could decrease, which might cause our stock price and trading volume to decline.
Anti-takeover provisions under our charter documents and Delaware law could delay or prevent a change of control and could also limit the market price of our stock.
Our Restated Certificate of Incorporation and Restated Bylaws contain provisions that could delay or prevent a change of control of our company or changes in our Board of Directors that our stockholders might consider favorable. Some of these provisions:
- •
- authorize the issuance of preferred stock which can be created and issued by the Board of Directors without prior stockholder
approval, with rights senior to those of the common stock;
- •
- provide for a classified Board of Directors, with each director serving a staggered three-year term;
- •
- prohibit stockholders from filling Board vacancies, calling special stockholder meetings, or taking action by written consent; and
- •
- require advance written notice of stockholder proposals and director nominations.
In addition, we are governed by the provisions of Section 203 of the Delaware General Corporate Law, which may prohibit certain business combinations with stockholders owning 15% or more of our outstanding voting stock. These and other provisions in our Restated Certificate of Incorporation, Restated Bylaws and Delaware law could make it more difficult for stockholders or potential acquirers to obtain control of our Board or initiate actions that are opposed by the then-current Board, and could delay or impede a merger, tender offer, or proxy contest involving our company. Any delay or prevention of a change of control transaction or changes in our Board could cause the market price of our common stock to decline.
Item 1B. Unresolved Staff Comments
None.
Our corporate headquarters and principal office is located in Calabasas, California, where we own real property, which includes an approximately 89,000 square foot building. We lease smaller facilities
35
in other locations including the US, Republic of Ireland, Hong Kong, China, the United Kingdom, Japan, South Korea, Taiwan and Singapore. We believe that our existing space is adequate for our current operations. We believe that suitable replacement and additional space, to the extent needed, will be available in the future on commercially reasonable terms.
In the ordinary course of our business, we actively pursue legal remedies to enforce our intellectual property rights and to stop unauthorized use of our technology and trademarks.
We are not currently a party to any material legal proceedings. We may, however, become subject to lawsuits from time to time in the course of our business.
Item 4. Mine Safety Disclosures
None.
36
Item 5. Market for Registrant's Common Equity, Related Stockholder Matters and Issuer Purchases of Equity Securities
Our common stock is traded on the NASDAQ Global Select Market under the symbol "DTSI." The following table sets forth, for the periods indicated, the high and low sales prices for our common stock as reported by the NASDAQ Global Select Market:
| |
High | Low | |||||
|---|---|---|---|---|---|---|---|
2013 |
|||||||
First Quarter |
$ | 20.74 | $ | 16.25 | |||
Second Quarter |
$ | 23.25 | $ | 15.35 | |||
Third Quarter |
$ | 24.24 | $ | 19.61 | |||
Fourth Quarter |
$ | 24.65 | $ | 19.48 | |||
2014 |
|||||||
First Quarter |
$ | 24.00 | $ | 18.25 | |||
Second Quarter |
$ | 20.25 | $ | 16.76 | |||
Third Quarter |
$ | 25.49 | $ | 17.85 | |||
Fourth Quarter |
$ | 34.00 | $ | 24.80 | |||
As of January 31, 2015, there were approximately 70 stockholders of record of our common stock. We believe that the number of beneficial owners is substantially greater than the number of record holders because a large portion of our common stock is held through brokerage firms in "street name."
SALES OF UNREGISTERED SECURITIES
During the year ended December 31, 2014, we did not issue any securities that were not registered under the Securities Act of 1933, as amended.
37
The following graph and table compares the cumulative total stockholder return on our common stock to that of the NASDAQ Market Index and the Russell 2000 Index for the five fiscal year period ending December 31, 2014, the date of our fiscal year end. The graph and table assumes that a $100 investment was made at the close of trading on December 31, 2009 in our common stock and in each index, and that dividends, if any, were reinvested. The stock price performance shown should not be considered indicative of future price performance.
| |
December 31, 2009 |
December 31, 2010 |
December 31, 2011 |
December 31, 2012 |
December 31, 2013 |
December 31, 2014 |
|||||||||||||
|---|---|---|---|---|---|---|---|---|---|---|---|---|---|---|---|---|---|---|---|
DTS, Inc. |
$ | 100.00 | $ | 143.38 | $ | 79.63 | $ | 48.82 | $ | 69.89 | $ | 89.89 | |||||||
NASDAQ Market Index |
$ | 100.00 | $ | 118.02 | $ | 117.04 | $ | 137.47 | $ | 192.62 | $ | 221.02 | |||||||
Russell 2000 Index |
$ | 100.00 | $ | 126.81 | $ | 121.52 | $ | 141.42 | $ | 196.32 | $ | 205.93 | |||||||
We have never declared or paid any cash dividends on our common stock. We currently intend to retain all available funds to support our operations and to finance the growth and development of our business. We do not anticipate paying any cash dividends in the foreseeable future. Any future determination relating to our dividend policy will be made at the discretion of our Board of Directors and will depend on a number of factors, including our future earnings, capital requirements, financial condition, contract restrictions, future prospects, and other factors as the Board of Directors may deem relevant. In addition, the provisions of our credit agreement limit, among other things, our ability to pay dividends.
38
ISSUER PURCHASES OF EQUITY SECURITIES
On March 17, 2014, we announced a share repurchase program that was authorized by the Board of Directors in February 2014, for us to repurchase up to two million shares of our common stock in the open market or in privately negotiated transactions, depending upon market conditions and other factors. This share repurchase program does not have an expiration date. There was no stock repurchase activity during the quarter ended December 31, 2014, and 1,625,800 shares remained available for repurchase under this authorization.
Item 6. Selected Financial Data
In the table below, we provide you with historical selected consolidated financial data of DTS, Inc. and its subsidiaries. We derived the following historical data from our audited consolidated financial statements. It is important that you read the selected consolidated financial data set forth below in conjunction with our consolidated financial statements and related notes and "Management's Discussion and Analysis of Financial Condition and Results of Operations" included elsewhere in this Form 10-K. References to "Notes" are Notes included in our Notes to Consolidated Financial Statements.
During the first quarter of 2007, DTS Digital Cinema's assets and liabilities were classified as held for sale and its operations were reported as discontinued operations. As a result, operations of DTS Digital Cinema for 2010 have been reflected as discontinued.
On July 5, 2012, we completed our acquisition of substantially all of the assets of Phorus, Inc. and Phorus, LLC, pursuant to an Asset Purchase Agreement. On July 20, 2012, we completed our acquisition of SRS Labs, Inc.'s common stock. On August 14, 2014, we acquired substantially all of the assets of Manzanita Systems, Inc. As a result, the net assets acquired and results of operations of these acquisitions have been included in our consolidated balance sheets and statements of operations, respectively, as of the aforementioned acquisition dates.
39
Our historical results are not necessarily indicative of the operating results that may be expected in the future. We have described various risks and uncertainties that could affect future operating results in Part I, Item 1A, "Risk Factors."
| |
For the Years Ended December 31, | |||||||||||||||
|---|---|---|---|---|---|---|---|---|---|---|---|---|---|---|---|---|
| |
2014 | 2013 | 2012 | 2011 | 2010 | |||||||||||
| |
(Amounts in thousands, except per share amounts) |
|||||||||||||||
Consolidated Statement of Operations Data |
||||||||||||||||
Revenue |
$ | 143,913 | $ | 125,148 | $ | 100,649 | $ | 96,922 | $ | 87,096 | ||||||
Cost of revenue |
11,095 | 9,788 | 4,347 | 860 | 1,583 | |||||||||||
| | | | | | | | | | | | | | | | | |
Gross profit |
132,818 | 115,360 | 96,302 | 96,062 | 85,513 | |||||||||||
Operating expenses: |
||||||||||||||||
Selling, general and administrative(1) |
78,570 | 79,753 | 78,409 | 52,904 | 49,035 | |||||||||||
Research and development(2) |
37,298 | 31,145 | 25,774 | 13,539 | 12,075 | |||||||||||
Change in fair value of contingent consideration |
400 | (6,000) | (3) | — | — | — | ||||||||||
Impairment of intangible assets |
— | 2,820 | (4) | — | — | — | ||||||||||
| | | | | | | | | | | | | | | | | |
Total operating expenses |
116,268 | 107,718 | 104,183 | 66,443 | 61,110 | |||||||||||
| | | | | | | | | | | | | | | | | |
Operating income (loss) |
16,550 | 7,642 | (7,881 | ) | 29,619 | 24,403 | ||||||||||
Interest and other income (expense), net |
(413 | ) | (521 | ) | (352 | ) | 311 | 418 | ||||||||
| | | | | | | | | | | | | | | | | |
Income (loss) from continuing operations before income taxes |
16,137 | 7,121 | (8,233 | ) | 29,930 | 24,821 | ||||||||||
Provision (benefit) for income taxes |
(11,006) | (5) | (8,634) | (6) | 7,665 | (7) | 11,661 | 9,781 | ||||||||
| | | | | | | | | | | | | | | | | |
Income (loss) from continuing operations |
27,143 | 15,755 | (15,898 | ) | 18,269 | 15,040 | ||||||||||
Income from discontinued operations, net of tax |
— | — | — | — | 1,001 | (8) | ||||||||||
| | | | | | | | | | | | | | | | | |
Net income (loss) |
$ | 27,143 | $ | 15,755 | $ | (15,898 | ) | $ | 18,269 | $ | 16,041 | |||||
| | | | | | | | | | | | | | | | | |
| | | | | | | | | | | | | | | | | |
| | | | | | | | | | | | | | | | | |
Net income (loss) per common share: |
||||||||||||||||
Basic: |
||||||||||||||||
Continuing operations |
$ | 1.58 | $ | 0.87 | $ | (0.91 | ) | $ | 1.08 | $ | 0.88 | |||||
Discontinued operations |
— | — | — | — | 0.06 | |||||||||||
| | | | | | | | | | | | | | | | | |
Net income (loss) |
$ | 1.58 | $ | 0.87 | $ | (0.91 | ) | $ | 1.08 | $ | 0.94 | |||||
| | | | | | | | | | | | | | | | | |
| | | | | | | | | | | | | | | | | |
| | | | | | | | | | | | | | | | | |
Diluted: |
||||||||||||||||
Continuing operations |
$ | 1.55 | $ | 0.86 | $ | (0.91 | ) | $ | 1.04 | $ | 0.84 | |||||
Discontinued operations |
— | — | — | — | 0.06 | |||||||||||
| | | | | | | | | | | | | | | | | |
Net income (loss) |
$ | 1.55 | $ | 0.86 | $ | (0.91 | ) | $ | 1.04 | $ | 0.90 | |||||
| | | | | | | | | | | | | | | | | |
| | | | | | | | | | | | | | | | | |
| | | | | | | | | | | | | | | | | |
Weighted average shares outstanding: |
||||||||||||||||
Basic |
17,180 | 18,097 | 17,466 | 16,982 | 17,041 | |||||||||||
| | | | | | | | | | | | | | | | | |
| | | | | | | | | | | | | | | | | |
| | | | | | | | | | | | | | | | | |
Diluted |
17,561 | 18,334 | 17,466 | 17,575 | 17,805 | |||||||||||
| | | | | | | | | | | | | | | | | |
| | | | | | | | | | | | | | | | | |
| | | | | | | | | | | | | | | | | |
- (1)
- Includes
$185, $1,528 and $13,469 for the years ended December 31, 2014, 2013 and 2012, respectively, of acquisition and integration related costs
(refer to Note 6, "Business Combinations").
- (2)
- Includes $8, $38 and $2,234 for the years ended December 31, 2014, 2013 and 2012, respectively, of acquisition and integration related costs (refer to Note 6, "Business Combinations").
40
- (3)
- We
recorded decreases to the fair value of the contingent consideration associated with the Phorus acquisition, resulting in a gain (refer to Note 4,
"Fair Value Measurements").
- (4)
- We
recorded an impairment charge relating to certain intangibles associated with Phorus (refer to Note 7, "Goodwill and Other Intangibles").
- (5)
- Includes
a $12,612 tax benefit relating to the special one-time transfer of certain Japan and Taiwan intellectual property licensing rights to the US on
January 1, 2014 (refer to Note 11, "Income Taxes").
- (6)
- Includes
a $7,919 tax benefit as a result of a release of the valuation allowance on US federal deferred tax assets (refer to Note 11, "Income
Taxes").
- (7)
- We
established a valuation allowance against our deferred tax assets as a result of determining that it was more likely than not that our US federal
deferred tax assets would not be realized (refer to Note 11, "Income Taxes").
- (8)
- Includes proceeds from a settlement and release agreement related to the 2008 sale of our former digital cinema business.
| |
As of December 31, | |||||||||||||||
|---|---|---|---|---|---|---|---|---|---|---|---|---|---|---|---|---|
| |
2014 | 2013 | 2012 | 2011 | 2010 | |||||||||||
| |
(In thousands) |
|||||||||||||||
Consolidated Balance Sheet Data |
||||||||||||||||
Cash, cash equivalents, and short-term investments |
$ | 99,435 | $ | 71,029 | $ | 72,045 | $ | 85,641 | $ | 96,131 | ||||||
Working capital |
96,337 | 71,553 | 67,169 | 90,891 | 95,394 | |||||||||||
Total assets |
288,270 | 241,798 | 247,059 | 159,470 | 172,295 | |||||||||||
Total long-term liabilities |
31,993 | 33,480 | 39,817 | 7,886 | 8,596 | |||||||||||
Total stockholders' equity |
218,903 | 183,112 | 180,926 | 145,802 | 147,568 | |||||||||||
41
Item 7. Management's Discussion and Analysis of Financial Condition and Results of Operations
In Management's Discussion and Analysis of Financial Condition and Results of Operations, "we," "us" and "our" refer to DTS, Inc. and its consolidated subsidiaries. References to "Notes" are Notes included in our Notes to Consolidated Financial Statements.
In addition to historical information, the following discussion contains forward-looking statements that are subject to risks and uncertainties. Actual results may differ substantially from those referred to herein due to a number of factors, including but not limited to risks described in the section entitled "Risk Factors" and elsewhere in this Annual Report. Refer to "Forward-Looking Statements" for further discussion.
You should read the following discussion and analysis of our financial condition and results of operations in conjunction with the consolidated financial statements and the Notes included elsewhere in this Form 10-K.
Overview
We are a premier audio solutions provider for high-definition entertainment experiences. Our mission is to make the world sound better—anytime, anywhere, on any device. Our audio solutions are designed to enable recording, delivery and playback of simple, personalized, and immersive high-definition audio which are incorporated by hundreds of licensee customers around the world, into an array of consumer electronics devices, including televisions (TVs), personal computers (PCs), smartphones, tablets, digital media players, set-top-boxes, soundbars, wireless speakers, video game consoles, Blu-ray Disc players, automotive audio systems, audio/video receivers, DVD-based products, and home theater systems.
We derive revenues from licensing our audio technologies, copyrights, trademarks, and know-how under agreements with substantially all of the major consumer audio electronics manufacturers. Our business model provides for these manufacturers to pay us royalties for DTS-enabled products that they manufacture or ship.
We actively engage in intellectual property compliance and enforcement activities focused on identifying third parties who have either incorporated our technologies, copyrights, trademarks or know-how without a license or who have under-reported the amount of royalties owed under license agreements with us. We continue to invest in our compliance and enforcement infrastructure to support the value of our intellectual property to us and our licensees and to improve the long-term realization of revenues from our intellectual property. As a result of these activities, from time to time, we recognize royalty revenues that relate to consumer electronics manufacturing activities from prior periods. These royalty recoveries may cause revenues to be higher than expected during a particular reporting period and may not occur in subsequent periods. While we consider such revenues to be a part of our normal operations, we cannot predict such recoveries or the amount or timing of such revenues.
Our cost of revenues consists primarily of amortization of acquired intangibles. It also includes costs for products and materials, as well as payments to third parties for copyrighted material.
Our selling, general and administrative (SG&A) expenses consist primarily of salaries and related benefits and expenses for personnel engaged in sales and licensee support, as well as costs associated with promotional and other selling and licensing activities. SG&A expenses also include professional fees, facility-related expenses and other general corporate expenses, including salaries and related benefits and expenses for personnel engaged in corporate administration, finance, human resources, information systems and legal.
Our research and development (R&D) costs consist primarily of salaries and related benefits and expenses for research and development personnel, engineering consulting expenses associated with new
42
product and technology development, the commercialization of our R&D engineering efforts, and quality assurance and testing costs. R&D costs are expensed as incurred.
Acquisition of Phorus' Assets
On July 5, 2012, we acquired substantially all of the assets of Phorus pursuant to an Asset Purchase Agreement. Pursuant to the terms of the Asset Purchase Agreement, we paid initial cash consideration of $3.0 million upon the closing of the acquisition, and may have been required to pay up to an additional $10.0 million in consideration subject to the achievement of certain revenue milestones. In October 2013, the Asset Purchase Agreement was amended to reduce the total potential contingent consideration to $2.0 million, and the revenue milestones were reduced to reflect changes made in the Phorus business model.
Acquisition of SRS
On July 20, 2012, we acquired SRS pursuant to the Agreement and Plan of Merger and Reorganization, dated as of April 16, 2012. In connection with the merger, we issued 2.3 million shares of our common stock and paid $66.9 million in cash to former SRS stockholders and paid $13.3 million in cash to former SRS equity award holders. Aggregate consideration for this acquisition was valued at $124.8 million, based on a $19.32 per share closing price of our common stock on July 20, 2012.
Acquisition of Manzanita Systems, Inc.'s Assets
On August 14, 2014, we acquired substantially all of the assets of Manzanita Systems, Inc. The allocation of the purchase price, which is immaterial to the consolidated financial statements, was based on estimates and valuations.
Executive Summary
Financial Highlights
- •
- Revenues for the year ended December 31, 2014 were $143.9 million, an increase of 15% over the prior year.
- •
- Royalty recoveries from intellectual property compliance and enforcement activities increased $7.1 million for the year ended
December 31, 2014, compared to the prior year.
- •
- Royalties from network-connected markets increased 16% for the year ended December 31, 2014, compared to the prior year.
Trends, Opportunities, and Challenges
Historically, our revenue was primarily dependent upon the DVD and Blu-ray Disc based home theater markets. Because we are a mandatory technology in the Blu-ray standard, our revenue stream from this market is closely tracking the sales trend of Blu-ray equipped players, game consoles and PCs. However, the market for optical disc based media players, in general, has slowed in favor of a growing trend toward network-based delivery of entertainment content to network-connected devices—what we call the network-connected markets. In response to this shift in entertainment delivery and consumption over the past several years, we have transitioned our primary focus to providing end-to-end audio solutions to the network-connected markets, and we believe that our mandatory position in the Blu-ray standard has given us the ability to extend the reach of our audio into the growing network-connected markets.
We have signed agreements with a number of network-connected digital TV, mobile device and PC manufacturers to incorporate DTS audio solutions into their products. We have also pursued
43
partnerships to expand the integration of our premium audio technologies into streaming and downloadable content. To date, our technologies have been integrated into thousands of titles, and we continue to work with numerous partners to expand our presence in streaming and downloadable content, including CinemaNow, M-GO, Starz, Encore and Paramount Pictures. Additionally, we have maintained a strategy focused on increasing DTS support among providers of streaming and downloadable solutions and tools within the cloud-based content delivery ecosystem, working with partners such as Digital Rapids, Elemental Technologies, NexStreaming, Deluxe Digital Distribution and CastLabs.
One of the largest challenges we face is the growing consumer trend toward open platform, online entertainment consumption and the need to constantly and rapidly evolve our technologies to address the emerging consumer electronics markets. We believe that although the trend has begun, any transition to such open platform, online entertainment will take many years. Further, we believe that this trend demands that playback devices be capable of processing content originating in any form, whether optical disc based or online, which creates a substantial opportunity for our technologies to extend into network-connected products that may not have an optical disc drive. During the transition period, we expect that optical disc based media will continue to contribute meaningfully to our revenues, while online entertainment formats will continue to grow and thrive.
Critical Accounting Policies and Estimates
Management's Discussion and Analysis of Financial Condition and Results of Operations are based upon our consolidated financial statements, which have been prepared in accordance with accounting principles generally accepted in the United States of America and pursuant to the rules and regulations of the SEC. The preparation of our consolidated financial statements requires us to make estimates and judgments that affect the reported amounts of assets, liabilities, revenues and expenses, and the related disclosures of contingent assets and liabilities. On an ongoing basis, estimates and judgments are evaluated, including those related to revenue recognition; valuations of goodwill, other intangible assets and long-lived assets; stock-based compensation; income taxes; and business combinations. These estimates and judgments are based on historical experience and on various other assumptions that we believe to be reasonable under the circumstances, which form the basis for our judgments about the carrying values of assets and liabilities that are not readily apparent from other sources. By their nature, estimates are subject to an inherent degree of uncertainty. Actual results may differ materially from these estimates.
We believe the following accounting policies and estimates are most critical to the understanding of our consolidated financial statements. For additional information relating to these accounting policies, refer to Note 2, "Significant Accounting Policies."
- •
- Revenue Recognition. We recognize revenue when persuasive evidence of a sales arrangement exists, delivery has occurred or services have been rendered, the buyer's price is fixed or determinable and collection is reasonably assured. Determining whether and when these criteria have been satisfied may involve assumptions and judgments that can have a significant impact on the timing and amount of revenue that is reported.
We make estimates and judgments when determining whether the collectibility of license fees receivable from licensees is reasonably assured. We assess the collectibility of accrued license fees based on a number of factors, including past transaction history with licensees and the credit-worthiness of licensees. If it is determined that collection is not reasonably assured, the revenue is recognized when collectibility becomes reasonably assured, assuming all other revenue recognition criteria have been met, which is generally upon receipt of cash. Management estimates regarding collectibility impact the actual revenues recognized each period and the timing of the recognition of revenues. Our assumptions and judgments regarding future collectibility could differ from actual events, thus materially impacting our consolidated financial statements.
44
- •
- Goodwill, Other Intangible Assets and Long-Lived Assets. We evaluate the carrying value of goodwill and indefinite-lived intangibles for impairment on an annual basis as of October 31 of each year, or more frequently if events or circumstances indicate that the goodwill and other intangibles might be impaired. We evaluate goodwill for impairment at the reporting unit level, which is identified based on our current organizational structure, availability of discrete financial information, and economic similarity of the components under our operating segment.
We actively police and enforce our intellectual property, and as a result, we may recognize royalty revenues that relate to infringements or under-reporting that occurred in prior periods. We recognize such amounts, as appropriate, in the period that such an adjustment is determined or contracted.
- •
- Stock-based Compensation. Stock-based compensation charges for stock options are based upon the fair value of each award on the date of grant using the Black-Scholes option pricing model. This model requires that we estimate a risk free interest rate, expected term, dividend yield, and the expected volatility of our stock. Additionally, we reduce stock-based compensation expense for estimated forfeitures based on our historical experience. We estimate forfeitures at the time of the grant and adjust compensation expense, as needed, in subsequent periods if actual forfeitures differ from our estimate. We believe this to be a critical accounting estimate because if any of the estimates above require significant changes, these changes could result in fluctuating expenses that could have a material impact on our results of operations.
Significant judgments are required in assessing impairment of goodwill, other intangibles, and long-lived assets, which includes estimating future revenues, cash flows, determining appropriate discount and growth rates and other assumptions. Changes in these estimates and assumptions could materially affect the amount of impairment charges, if any. The estimates used represent management's best estimates, which we believe to be reasonable, but future declines in business performance may impair the recoverability of our goodwill, other intangibles and long-lived assets.
For additional information refer to Note 7, "Goodwill and Other Intangibles."
- •
- Income Taxes. We must make estimates and judgments in determining our income tax provision. These estimates and judgments occur in the calculation of certain tax assets and liabilities, which arise from differences in the timing of recognition of revenue and expense for tax and financial statement purposes. Our multi-national legal structure is complex, which increases the complexity of the estimates and judgments used in our accounting for income taxes. Significant changes to our estimates or judgments may result in an increase or decrease to our tax provision in a subsequent period.
For additional information refer to Note 12, "Stock-Based Compensation."
We must assess the likelihood that we will be able to utilize our deferred tax assets. Deferred tax assets are reduced by a valuation allowance, if, based upon the weight of available evidence, it is more likely than not that we will not realize a portion or all of the deferred tax assets. We consider all available positive and negative evidence when assessing whether it is more likely than not that deferred tax assets are realizable. We consider evidence such as our past operating results, scheduled reversals of deferred tax liabilities, the existence of cumulative losses in previous periods and our forecast of future taxable income. We believe this to be a critical accounting estimate, because when we establish or reduce the valuation allowance against deferred tax assets, our provision for income taxes will increase or decrease, which could have a material impact on our results of operations.
We have not provided for US income or foreign withholding taxes on the undistributed earnings of our foreign subsidiaries, because we intend to reinvest such earnings indefinitely. Should we
45
- •
- Business Combinations. We allocate the fair value of purchase consideration to the tangible assets acquired, liabilities assumed and intangible assets acquired, including in-process research and development (IPR&D), based on their estimated fair values. The excess of the purchase consideration over the fair values of these identifiable assets and liabilities is recorded as goodwill. Such valuations require management to make significant estimates and assumptions, especially with respect to intangible assets.
decide to remit this income to the US in a future period, our provision for income taxes may increase materially in the period that our intent changes.
We evaluate and record unrecognized tax benefits for both domestic and foreign uncertain tax positions. Inherent uncertainties exist in estimating accruals for uncertain tax positions due to the progress of income tax audits and changes in tax law, both legislated and concluded through the various jurisdictions' tax court systems. Although the outcome of tax audits is always uncertain, management believes that it has appropriate support for the positions taken on its tax returns and that its annual tax provision includes amounts sufficient to cover any assessments. Nonetheless, the amounts ultimately agreed to upon resolution of the issues raised by the taxing authorities may differ materially from the amounts accrued.
For additional information refer to Note 11, "Income Taxes."
Critical estimates in valuing certain intangible assets include, but are not limited to: future expected cash flows from customer contracts, customer lists, and acquired developed technologies and patents; expected costs to develop IPR&D into commercially viable products and estimating cash flows from projects when completed; brand awareness and market position, as well as assumptions about the period of time the brand will continue to be used in our product portfolio; and discount rates.
Other estimates associated with the accounting for acquisitions may change as additional information becomes available regarding the assets acquired and liabilities assumed, as more fully discussed in Note 6, "Business Combinations."
Geographic Information
For revenue by geographical area, refer to Note 15, "Segment and Geographic Information."
Long-lived tangible assets, net of accumulated depreciation, by geographic region was (in thousands):
| |
As of December 31, | |||||||||
|---|---|---|---|---|---|---|---|---|---|---|
| |
2014 | 2013 | 2012 | |||||||
US |
$ | 25,494 | $ | 27,979 | $ | 30,894 | ||||
International |
1,595 | 2,137 | 2,431 | |||||||
| | | | | | | | | | | |
Total long-lived tangible assets, net of accumulated depreciation |
$ | 27,089 | $ | 30,116 | $ | 33,325 | ||||
| | | | | | | | | | | |
| | | | | | | | | | | |
| | | | | | | | | | | |
46
Results of Operations
Revenue
| |
Years Ended December 31, | 2014 vs. 2013 Change |
2013 vs. 2012 Change |
|||||||||||||||||||
|---|---|---|---|---|---|---|---|---|---|---|---|---|---|---|---|---|---|---|---|---|---|---|
| |
2014 | 2013 | 2012 | $ | % | $ | % | |||||||||||||||
| |
($ in thousands) |
|||||||||||||||||||||
Revenue |
$ | 143,913 | $ | 125,148 | $ | 100,649 | $ | 18,765 | 15 | % | $ | 24,499 | 24 | % | ||||||||
Revenue for 2014 included $13.4 million of royalties recovered through intellectual property compliance and enforcement activities, which we characterize as "royalty recoveries." Revenue for 2013 and 2012 included $6.3 million and $2.4 million in royalty recoveries, respectively. While we believe royalty recoveries are a normal and ongoing aspect of our business, royalty recoveries may cause revenues to be higher than expected during a particular period and may not occur in subsequent periods. Therefore, unless otherwise noted, the impact of royalty recoveries has been excluded from our revenue discussions in order to provide a more comparable analysis.
Year Ended December 31, 2014 Compared to Year Ended December 31, 2013
Excluding royalty recoveries, the increase in revenue was primarily attributable to increased royalties from network-connected markets, which were up 16%. These royalties approached 50% of total revenue for 2014, and were approximately 45% of total revenue for 2013. The increase in royalties from network-connected markets was primarily driven by increased royalties from connected TVs. The increase was also driven by growth from Blu-ray related royalties, up 17%, which was largely the result of the success of the new game console cycle that launched in late 2013 and continued throughout 2014. Blu-ray related royalties comprised over 20% of revenue for both 2014 and 2013. These increases were partially offset by a decrease in royalties from home AV markets, which were down 12%, as network-connected devices become more mainstream. Home AV royalties represented less than 15% of revenue for both 2014 and 2013. We expect to see continued growth from the network-connected markets, as we expand our footprint in terms of both products and geographies served.
Year Ended December 31, 2013 Compared to Year Ended December 31, 2012
The increase in revenue was largely attributable to continued growth in royalties from network-connected markets, which were up 94%. These royalties comprised approximately 45% and 25% of revenue for 2013 and 2012, respectively. The growth in network-connected markets was primarily driven by increased royalties from connected TVs and supported by increased royalties from PC and mobile. Partially offsetting these increases in revenue were declines in Blu-ray and DVD related royalties. The decline in Blu-ray related royalties of 14% was largely the result of softness in consumer demand for stand-alone Blu-ray players and anticipation surrounding the new game console cycle that was not launched until the fourth quarter of 2013. Blu-ray related royalties comprised over 20% and 30% of revenue for 2013 and 2012, respectively. DVD related royalties continued to decline as Blu-ray and network-connected devices become more mainstream. DVD related royalties declined 57% and comprised less than 5% and 10% of revenue for 2013 and 2012, respectively.
Gross Profit
| |
Years Ended December 31, | Percentage point change in gross margin |
|||||||||||||||||||||||
|---|---|---|---|---|---|---|---|---|---|---|---|---|---|---|---|---|---|---|---|---|---|---|---|---|---|
| |
2014 | 2013 | 2012 | ||||||||||||||||||||||
| |
2014 vs. 2013 |
2013 vs. 2012 |
|||||||||||||||||||||||
| |
$ | % | $ | % | $ | % | |||||||||||||||||||
| |
($ in thousands) |
||||||||||||||||||||||||
Gross Profit |
$ | 132,818 | 92 | % | $ | 115,360 | 92 | % | $ | 96,302 | 96 | % | 0 | % | (4 | )% | |||||||||
47
Our gross profit percentage for 2014 remained relatively flat compared to 2013. Our gross profit percentage for 2013 compared to 2012 decreased primarily due to additional amortization of intangibles from the SRS and Phorus acquisitions.
Selling, General and Administrative (SG&A)
| |
|
|
Change relative to prior year |
||||||||||
|---|---|---|---|---|---|---|---|---|---|---|---|---|---|
| |
SG&A Expenses |
Percent of Revenues |
|||||||||||
Years Ended December 31,
|
$ | % | |||||||||||
| |
($ in thousands) |
||||||||||||
2014 |
$ | 78,570 | 55% | $ | (1,183 | ) | (1 | )% | |||||
2013 |
$ | 79,753 | 64% | $ | 1,344 | 2 | % | ||||||
2012 |
$ | 78,409 | 78% | ||||||||||
Year Ended December 31, 2014 Compared to Year Ended December 31, 2013
The decrease in SG&A was primarily due to decreases in professional services fees and advertising and related activities for brand marketing and tradeshows. These decreases were partially offset by increases in employee related costs, which resulted primarily from increased accruals for estimated incentive compensation.
Year Ended December 31, 2013 Compared to Year Ended December 31, 2012
The dollar increase in SG&A was primarily due to increases in employee related costs, advertising and related activities for brand marketing and tradeshows and professional services fees, partially offset by an $11.9 million decrease in acquisition and integration related costs due to the winding down of the SRS and Phorus integrations.
Research and Development (R&D)
| |
|
|
Change relative to prior year |
||||||||||
|---|---|---|---|---|---|---|---|---|---|---|---|---|---|
| |
R&D Expenses |
Percent of Revenues |
|||||||||||
Years Ended December 31,
|
$ | % | |||||||||||
| |
($ in thousands) |
||||||||||||
2014 |
$ | 37,298 | 26% | $ | 6,153 | 20 | % | ||||||
2013 |
$ | 31,145 | 25% | $ | 5,371 | 21 | % | ||||||
2012 |
$ | 25,774 | 26% | ||||||||||
Year Ended December 31, 2014 Compared to Year Ended December 31, 2013
The increase in R&D was primarily due to an increase in employee related costs, largely due to increased accruals for estimated incentive compensation, as well as consultant expenses to support our new programs and initiatives.
Year Ended December 31, 2013 Compared to Year Ended December 31, 2012
The dollar increase in R&D was primarily due to employee related costs, including our acquisitions of SRS and Phorus in July 2012, and consultant related expenses to support our growth, partially offset by a $2.2 million decrease in acquisition and integration related costs due to the winding down of the SRS and Phorus integrations.
48
Change in Fair Value of Contingent Consideration
For the year ended December 31, 2014, we recorded an increase to the fair value of the contingent consideration associated with the Phorus acquisition, resulting in a loss of $0.4 million. This change in the fair value was due to improved forecasts as well as the passage of time. Offsetting the increased liability was a payout in the fourth quarter of 2014 of $0.5 million as a result of a milestone achievement.
For the year ended December 31, 2013, we recorded decreases in the fair value of the contingent consideration, resulting primarily from revised forecasts and an amendment to the contingent consideration arrangement, resulting in a gain of $6.0 million. Additionally, we paid out $0.5 million in the fourth quarter of 2013 as a result of a milestone achievement.
For additional information refer to Note 4, "Fair Value Measurements."
Interest and Other Income (Expense), Net
| |
Years Ended December 31, | 2014 vs. 2013 Change |
2013 vs. 2012 Change |
|||||||||||||||||||
|---|---|---|---|---|---|---|---|---|---|---|---|---|---|---|---|---|---|---|---|---|---|---|
| |
2014 | 2013 | 2012 | $ | % | $ | % | |||||||||||||||
| |
($ in thousands) |
|||||||||||||||||||||
Interest and other income (expense), net |
$ | (413 | ) | $ | (521 | ) | $ | (352 | ) | $ | 108 | 21 | % | $ | (169 | ) | (48 | )% | ||||
Interest and other income (expense), net is comprised mostly of interest expense associated with our debt and the effects of translation of foreign subsidiaries to the US dollar. Other income for 2014 also included a gain from the sale of certain other assets.
Income Taxes
| |
Years Ended December 31, | ||||||||
|---|---|---|---|---|---|---|---|---|---|
| |
2014 | 2013 | 2012 | ||||||
| |
($ in thousands) |
||||||||
Provision for income taxes |
$ | (11,006) | $ | (8,634) | $ | 7,665 | |||
Effective tax rate |
(68)% | (121)% | (93)% | ||||||
The effective tax rate for 2014 differed from the US statutory rate of 35% primarily due to a net tax benefit associated with the transfer of intellectual property licensing rights to the US and a tax benefit associated with the settlement of our 2009 to 2011 federal tax audit with the Internal Revenue Service (IRS).
The effective tax rate for 2013 differed from the US statutory rate primarily due to the release of the valuation allowance on US federal deferred tax assets and the favorable settlement of both our 2003, 2005 and 2006 federal tax audit with the IRS and 2004 and 2005 state tax audit with the Franchise Tax Board.
The effective tax rate for 2012 differed from the US statutory rate primarily due to state income taxes, the establishment of a valuation allowance against our US federal deferred tax assets, an IRS settlement of our 2007 federal tax audit and non-deductible transaction costs in conjunction with the acquisition of SRS, partially offset by a decrease in the reserve for uncertain tax positions.
Our rates have also differed from the US statutory rate due to varying foreign income tax rates and foreign withholding taxes, non-deductible stock-based compensation, and state research and development tax credits. Due in part to the transfer of certain Japan and Taiwan intellectual property rights discussed in Note 11, "Income Taxes," we expect our annualized effective tax rate before discrete items to be generally lower than the US statutory rate for the foreseeable future.
49
Liquidity and Capital Resources
At December 31, 2014, we had cash, cash equivalents, and short-term investments of $99.4 million, compared to $71.0 million at December 31, 2013. At December 31, 2014, $79.4 million of cash, cash equivalents, and short-term investments was held by our foreign subsidiaries. If these funds are needed for our operations in the US, they would be subject to US federal and state income taxes, less applicable foreign tax credits. However, our intent is to permanently reinvest funds outside of the US and our current plans do not demonstrate a need to repatriate them to fund our US operations.
Net cash provided by operating activities was $41.1 million, $21.4 million, $14.8 million for the years ended December 31, 2014, 2013 and 2012, respectively. Cash flows from operating activities were impacted by income (loss) from operations, adjusted for non-cash items, including stock-based compensation, depreciation and amortization, and the effect of changes in working capital and other operating activities. The operating cash flows for the years ended December 31, 2014 and 2013 were also impacted by the timing of collections of accounts receivable balances relating to royalty recoveries and accruals and payments for certain operating liabilities, including incentive compensation. The operating cash flows for the year ended December 31, 2012 were also impacted by an increase in deferred revenues and the timing of collections from accounts receivable.
We typically use cash in investing activities to purchase office equipment, fixtures, computer hardware and software, and engineering and certification equipment, for securing patent and trademark protection for our proprietary technology and brand names, and to purchase investments such as US government and agency securities. Net cash used in investing activities totaled $1.1 million for the year ended December 31, 2014, which primarily resulted from cash paid for business acquisitions, intangible assets and property and equipment, partially offset by investment maturities. Net cash provided by investing activities totaled $10.5 million for the year ended December 31, 2013, which primarily resulted from investment maturities, partially offset by purchases of investments and property and equipment. Net cash used in investing activities totaled $29.2 million for the year ended December 31, 2012 and were primarily payments related to the acquisition of SRS, partially offset by net proceeds from investment maturities and sales.
Net cash used in financing activities totaled $6.6 million for the year ended December 31, 2014, which resulted primarily from repayment of long-term borrowings and purchases of treasury stock, partially offset by proceeds from long-term borrowings and the issuance of common stock under stock-based compensation plans, including related tax benefits. Net cash used in financing activities totaled $23.7 million for the year ended December 31, 2013, which were primarily purchases of treasury stock, partially offset by proceeds from the issuance of common stock under stock-based compensation plans, including related tax benefits. Net cash provided by financing activities totaled $25.3 million for the year ended December 31, 2012, which resulted primarily from a new credit facility and the recognition of certain windfall tax benefits, partially offset by purchases of treasury stock.
Credit Agreement
On September 29, 2014, we entered into a Credit Agreement with Wells Fargo Bank, National Association, together with the other lenders thereunder from time to time (the "Credit Agreement"). The Credit Agreement provides us with $50 million in the form of (i) a $25.0 million secured revolving line of credit (the "Revolver"), and (ii) a $25.0 million secured term loan (the "Term Loan"). In connection with the Credit Agreement, we borrowed $25.0 million under the Term Loan and $5.0 million under the Revolver, and repaid the $30.0 million line of credit under the previously existing loan agreement with MUFG Union Bank, N.A. (formerly known as Union Bank, N.A.). The Revolver and Term Loan will be used to finance permitted acquisitions and for working capital and general corporate purposes.
50
In the fourth quarter of 2014, we repaid $5.0 million on the Term Loan, resulting in $25.0 million total outstanding under the Credit Agreement as of December 31, 2014. All advances under the Revolver will become due and payable on September 29, 2017, or earlier in the event of a default. $5.0 million of the principal amount of the Term Loan will become due and payable on October 1, 2015, and $1.25 million of the principal amount of the Term Loan will be due and payable in quarterly installments thereafter, with the remaining balance due and payable on September 29, 2017. We anticipate that repayment of the Credit Agreement will be satisfied with our future available cash and cash equivalents and operating cash flows, or by renewing the credit facility or entering into a new credit facility. As of December 31, 2014, we were in compliance with all covenants and remain so as of the date of this report.
Repurchases of Common Stock
In February 2012, our Board of Directors authorized, subject to certain business and market conditions, the purchase of up to 2.0 million shares of our common stock in the open market or in privately negotiated transactions. Through the fourth quarter of 2013, all shares of common stock under this authorization were repurchased for an aggregate of $39.4 million.
In February 2014, our Board of Directors authorized, subject to certain business and market conditions, the purchase of up to 2.0 million shares of our common stock in the open market or in privately negotiated transactions. Through December 31, 2014, 0.4 million shares of common stock under this authorization were repurchased for an aggregate cost of $7.5 million.
Working Capital and Capital Expenditure Requirements
We believe that our cash, cash equivalents, short-term investments and cash flows from operations will be sufficient to satisfy our working capital and capital expenditure requirements for at least the next twelve months. Additionally, in the third quarter of 2014, we entered into the Credit Agreement to be used to finance permitted acquisitions and for working capital and general corporate purposes. As our investments matured in 2014, and our interest rates remain low, we focused our investment strategy in cash equivalents to provide more liquidity and available cash to fund our working capital and other expenditure requirements, as well as pay down a portion of the Term Loan early, and we may use this same strategy in the future.
Changes in our operating plans, including lower than anticipated revenues, increased expenses, acquisitions of businesses, products or technologies or other events, including those described in "Risk Factors" included elsewhere herein and in other filings, may cause us to seek additional debt or equity financing on an accelerated basis. Financing may not be available on acceptable terms, or at all, particularly given current economic conditions, including lack of confidence in the financial markets and limited availability of capital and demand for debt and equity securities. Our failure to raise capital when needed could negatively impact our growth plans and our financial condition and results of operations. Additional equity financing may be dilutive to the holders of our common stock and debt financing, if available, and may involve significant cash payment obligations and financial or operational covenants that restrict our ability to operate our business.
Recently Issued Accounting Standards
Refer to "Recent Accounting Pronouncements" in Note 2 to our consolidated financial statements.
51
Contractual Obligations and Commitments
Future payments due under long-term debt and non-cancelable lease obligations as of December 31, 2014 were (in thousands):
| |
Payments due by period | |||||||||||||||
|---|---|---|---|---|---|---|---|---|---|---|---|---|---|---|---|---|
| |
Less than 1 year |
1 - 3 years |
3 - 5 years |
More than 5 years |
Total | |||||||||||
Long-term debt(1) |
$ | 5,000 | $ | 20,000 | $ | — | $ | — | $ | 25,000 | ||||||
Operating leases |
$ | 2,267 | $ | 2,977 | $ | 1,428 | $ | 1,279 | $ | 7,951 | ||||||
- (1)
- Under the Credit Agreement, our long-term debt bears an interest rate, and we are required to pay an annual commitment fee on the unused portion of the Revolver (refer to Note 9, "Long-term Debt").
Purchase orders or contracts for the purchase of other goods and services are not included in the table above. We are not able to determine the aggregate amount of such purchase orders that represent contractual obligations, as purchase orders may represent authorizations to purchase rather than binding agreements. Our purchase orders are typically based on our current needs and are typically fulfilled by our vendors within short time horizons.
As of December 31, 2014, our total amount of gross unrecognized tax benefits was $11.2 million before netting with deferred tax assets for tax credit carryforwards and is considered a long-term obligation. We are currently unable to make reasonably reliable estimates of the periods of cash settlements associated with these obligations.
As of December 31, 2014, we have accrued $1.0 million of payments due under certain contractual rights arrangements. Additionally, under existing contractual rights arrangements, we may be obligated to pay up to approximately $6.7 million over an estimated period of five years if certain milestones are achieved. Subsequent to December 31, 2014, we entered into an additional contractual rights arrangement under which we may be obligated to pay up to approximately $2.1 million over an estimated period of five years if certain milestones are achieved.
In connection with the contingent consideration arrangement related to Phorus, we may be required to pay up to an additional $1.0 million in consideration by the end of 2015, subject to the achievement of certain revenue milestones.
Item 7A. Quantitative and Qualitative Disclosures About Market Risk
Market risk represents the risk of loss arising from adverse changes in market rates and foreign exchange rates.
Interest Rate Risk
Our interest rate risk relates primarily to interest income from investments and interest expense on our debt. Our interest income is sensitive to changes in the general level of US interest rates, particularly since a significant portion of our investments were, and may in the future be, in short-term and long-term marketable securities, US government securities and corporate bonds. However, we held no investments as of December 31, 2014. As of December 31, 2014, a one percentage point change in interest rates for cash and cash equivalents throughout a one year period would have an annual effect of approximately $1.0 million on our income before income taxes. As of December 31, 2014, a one percentage point change in interest rates on our debt throughout a one-year period would have an immaterial annual effect on our income before income taxes.
52
Exchange Rate Risk
During the year ended December 31, 2014, we derived approximately 85% of our revenues from sales outside the US and maintain research and development, sales, marketing, or business development offices in several foreign countries. Therefore, our results could be negatively affected by factors such as changes in foreign currency exchange rates, trade protection measures, longer accounts receivable collection patterns, and changes in regional or worldwide economic or political conditions. The risks of our international operations are mitigated in part by the extent to which our revenues are denominated in US dollars and, accordingly, we are not exposed to significant foreign currency risk on these items. We do have limited foreign currency risk on certain revenues and operating expenses such as salaries and overhead costs of our foreign operations and a small amount of cash maintained by these operations. Revenues denominated in foreign currencies accounted for approximately 1% of total revenues during 2014. Operating expenses, including cost of revenue, for our foreign subsidiaries were approximately $23.6 million in 2014. Based on these expenses for 2014, a 10% or greater change in foreign currency rates throughout a one-year period could have a material impact on our income before income taxes.
Our international business is subject to risks, including, but not limited to, differing economic conditions, changes in political climate, differing tax structures, other regulations and restrictions, and foreign exchange rate volatility when compared to the US dollar. Accordingly, our future results could be materially impacted by changes in these or other factors.
We are also affected by exchange rate fluctuations as the financial statements of our foreign subsidiaries are translated into the US dollar in consolidation. As exchange rates vary, these results, when translated, may vary from expectations and could adversely or positively impact overall profitability. During 2014, the impact of foreign exchange rate fluctuations related to translation of our foreign subsidiaries' financial statements was immaterial to our consolidated financial statements.
53
Item 8. Financial Statements and Supplementary Data
DTS, INC.
INDEX TO CONSOLIDATED FINANCIAL STATEMENTS
54
REPORT OF INDEPENDENT REGISTERED PUBLIC ACCOUNTING FIRM
To
the Board of Directors and Stockholders of DTS, Inc.
Calabasas, California
We have audited the accompanying consolidated balance sheet of DTS, Inc. and subsidiaries (the "Company") as of December 31, 2014, and the related consolidated statements of operations, comprehensive income (loss), stockholders' equity, and cash flows for the year ended December 31, 2014. Our audit also included the financial statement schedule for the year ended December 31, 2014 listed in the Index at Item 15. These consolidated financial statements and financial statement schedule are the responsibility of the Company's management. Our responsibility is to express an opinion on the consolidated financial statements and financial statement schedule based on our audit.
We conducted our audit in accordance with the standards of the Public Company Accounting Oversight Board (United States). Those standards require that we plan and perform the audit to obtain reasonable assurance about whether the financial statements are free of material misstatement. An audit includes examining, on a test basis, evidence supporting the amounts and disclosures in the financial statements. An audit also includes assessing the accounting principles used and significant estimates made by management, as well as evaluating the overall financial statement presentation. We believe that our audit provides a reasonable basis for our opinion.
In our opinion, such consolidated financial statements present fairly, in all material respects, the financial position of DTS, Inc. and subsidiaries as of December 31, 2014, and the results of their operations and their cash flows for the year ended December 31, 2014, in conformity with accounting principles generally accepted in the United States of America. Also, in our opinion, such financial statement schedule, when considered in relation to the basic consolidated financial statements taken as a whole, presents fairly, in all material respects, the information set forth therein.
We have also audited, in accordance with the standards of the Public Company Accounting Oversight Board (United States), the Company's internal control over financial reporting as of December 31, 2014, based on the criteria established in Internal Control—Integrated Framework (2013) issued by the Committee of Sponsoring Organizations of the Treadway Commission and our report dated March 16, 2015 expressed an adverse opinion on the Company's internal control over financial reporting because of a material weakness.
/s/
DELOITTE & TOUCHE LLP
Los Angeles, California
March 16, 2015
55
REPORT OF INDEPENDENT REGISTERED PUBLIC ACCOUNTING FIRM
To
the Board of Directors and Stockholders of DTS, Inc.
Calabasas, California
We have audited DTS, Inc. and subsidiaries' (the "Company's") internal control over financial reporting as of December 31, 2014, based on criteria established in Internal Control—Integrated Framework (2013) issued by the Committee of Sponsoring Organizations of the Treadway Commission. The Company's management is responsible for maintaining effective internal control over financial reporting and for its assessment of the effectiveness of internal control over financial reporting, included in the accompanying Management's Report on Internal Control Over Financial Reporting. Our responsibility is to express an opinion on the Company's internal control over financial reporting based on our audit.
We conducted our audit in accordance with the standards of the Public Company Accounting Oversight Board (United States). Those standards require that we plan and perform the audit to obtain reasonable assurance about whether effective internal control over financial reporting was maintained in all material respects. Our audit included obtaining an understanding of internal control over financial reporting, assessing the risk that a material weakness exists, testing and evaluating the design and operating effectiveness of internal control based on that risk, and performing such other procedures as we considered necessary in the circumstances. We believe that our audit provides a reasonable basis for our opinion.
A company's internal control over financial reporting is a process designed by, or under the supervision of, the company's principal executive and principal financial officers, or persons performing similar functions, and effected by the company's board of directors, management, and other personnel to provide reasonable assurance regarding the reliability of financial reporting and the preparation of financial statements for external purposes in accordance with generally accepted accounting principles. A company's internal control over financial reporting includes those policies and procedures that (1) pertain to the maintenance of records that, in reasonable detail, accurately and fairly reflect the transactions and dispositions of the assets of the company; (2) provide reasonable assurance that transactions are recorded as necessary to permit preparation of financial statements in accordance with generally accepted accounting principles, and that receipts and expenditures of the company are being made only in accordance with authorizations of management and directors of the company; and (3) provide reasonable assurance regarding prevention or timely detection of unauthorized acquisition, use, or disposition of the company's assets that could have a material effect on the financial statements.
Because of the inherent limitations of internal control over financial reporting, including the possibility of collusion or improper management override of controls, material misstatements due to error or fraud may not be prevented or detected on a timely basis. Also, projections of any evaluation of the effectiveness of the internal control over financial reporting to future periods are subject to the risk that the controls may become inadequate because of changes in conditions, or that the degree of compliance with the policies or procedures may deteriorate.
A material weakness is a deficiency, or a combination of deficiencies, in internal control over financial reporting, such that there is a reasonable possibility that a material misstatement of the company's annual or interim financial statements will not be prevented or detected on a timely basis. The following material weakness has been identified and included in management's assessment: the Company has identified a material weakness in its internal controls over financial reporting related to the accounting for income taxes; specifically, the controls around the review and monitoring of work performed by third party tax advisors were not designed properly. This material weakness was considered in determining the nature, timing, and extent of audit tests applied in our audit of the consolidated financial statements and financial statement schedule as of and for the year ended
56
December 31, 2014 of the Company and this report does not affect our report on such financial statements and financial statement schedule.
In our opinion, because of the effect of the material weakness identified above on the achievement of the objectives of the control criteria, the Company has not maintained effective internal control over financial reporting as of December 31, 2014, based on the criteria established in Internal Control—Integrated Framework 2013 issued by the Committee of Sponsoring Organizations of the Treadway Commission.
We have also audited, in accordance with the standards of the Public Company Accounting Oversight Board (United States), the consolidated financial statements and financial statement schedule as of and for the year ended December 31, 2014, of the Company and our report dated March 16, 2015 expressed an unqualified opinion on those financial statements and financial statement schedule.
/s/
DELOITTE & TOUCHE LLP
Los Angeles, California
March 16, 2015
57
REPORT OF INDEPENDENT REGISTERED PUBLIC ACCOUNTING FIRM
Board
of Directors and Stockholders
DTS, Inc.
We have audited the accompanying consolidated balance sheet of DTS, Inc. (the "Company") as of December 31, 2013, and the related consolidated statements of operations, comprehensive income (loss), stockholders' equity, and cash flows for each of the two years in the period then ended. Our audits of the basic consolidated financial statements included the financial statement schedule for each of the two years in the period ended December 31, 2013 listed in the Index appearing under Item 15(a)(2). These financial statements and financial statement schedule are the responsibility of the Company's management. Our responsibility is to express an opinion on these financial statements and financial statement schedule based on our audits.
We conducted our audits in accordance with the standards of the Public Company Accounting Oversight Board (United States). Those standards require that we plan and perform the audit to obtain reasonable assurance about whether the financial statements are free of material misstatement. An audit includes examining, on a test basis, evidence supporting the amounts and disclosures in the financial statements. An audit also includes assessing the accounting principles used and significant estimates made by management, as well as evaluating the overall financial statement presentation. We believe that our audits provide a reasonable basis for our opinion.
In our opinion, the consolidated financial statements referred to above present fairly, in all material respects, the financial position of DTS, Inc. as of December 31, 2013, and the results of its operations and its cash flows for each of the two years in the period then ended in conformity with accounting principles generally accepted in the United States of America. Also in our opinion, the related financial statement schedule, when considered in relation to the basic consolidated financial statements taken as a whole, present fairly, in all material respects, the information set forth therein for each of the two years in the period ended December 31, 2013.
/s/
GRANT THORNTON LLP
Irvine, California
March 20, 2014
58
DTS, INC.
CONSOLIDATED BALANCE SHEETS
(Amounts in thousands, except per share amounts)
| |
As of December 31, | ||||||
|---|---|---|---|---|---|---|---|
| |
2014 | 2013 | |||||
ASSETS |
|||||||
Current assets: |
|||||||
Cash and cash equivalents |
$ | 99,435 | $ | 66,025 | |||
Short-term investments |
— | 5,004 | |||||
Accounts receivable, net of allowance for doubtful accounts of $143 and $1,388 at December 31, 2014 and 2013, respectively |
12,364 | 11,637 | |||||
Deferred income taxes |
12,095 | 5,787 | |||||
Prepaid expenses and other current assets |
5,892 | 5,480 | |||||
Income taxes receivable |
3,925 | 2,826 | |||||
| | | | | | | | |
Total current assets |
133,711 | 96,759 | |||||
Property and equipment, net |
27,089 | 30,116 | |||||
Intangible assets, net |
48,543 | 50,225 | |||||
Goodwill |
50,356 | 48,418 | |||||
Deferred income taxes |
26,176 | 11,667 | |||||
Other long-term assets |
2,395 | 4,613 | |||||
| | | | | | | | |
Total assets |
$ | 288,270 | $ | 241,798 | |||
| | | | | | | | |
| | | | | | | | |
| | | | | | | | |
LIABILITIES AND STOCKHOLDERS' EQUITY |
|||||||
Current liabilities: |
|||||||
Accounts payable |
$ | 4,492 | $ | 2,802 | |||
Accrued expenses |
16,761 | 12,142 | |||||
Deferred revenue |
10,827 | 10,262 | |||||
Income taxes payable |
294 | — | |||||
Current portion of long-term debt |
5,000 | — | |||||
| | | | | | | | |
Total current liabilities |
37,374 | 25,206 | |||||
Long-term debt |
20,000 | 30,000 | |||||
Other long-term liabilities |
11,993 | 3,480 | |||||
Commitments and contingencies (Note 10) |
|||||||
Stockholders' equity: |
|||||||
Preferred stock—$0.0001 par value, 5,000 shares authorized at December 31, 2014 and 2013; no shares issued and outstanding |
— | — | |||||
Common stock—$0.0001 par value, 70,000 shares authorized at December 31, 2014 and 2013; 21,440 and 20,972 shares issued at December 31, 2014 and 2013, respectively; 17,373 and 17,279 shares outstanding at December 31, 2014 and 2013, respectively |
3 | 3 | |||||
Additional paid-in capital |
241,053 | 224,971 | |||||
Treasury stock, at cost—4,067 and 3,693 at December 31, 2014 and 2013, respectively |
(92,184 | ) | (84,689 | ) | |||
Accumulated other comprehensive income |
808 | 747 | |||||
Retained earnings |
69,223 | 42,080 | |||||
| | | | | | | | |
Total stockholders' equity |
218,903 | 183,112 | |||||
| | | | | | | | |
Total liabilities and stockholders' equity |
$ | 288,270 | $ | 241,798 | |||
| | | | | | | | |
| | | | | | | | |
| | | | | | | | |
See accompanying notes to consolidated financial statements.
59
DTS, INC.
CONSOLIDATED STATEMENTS OF OPERATIONS
(Amounts in thousands, except per share amounts)
| |
For the Years Ended December 31, | |||||||||
|---|---|---|---|---|---|---|---|---|---|---|
| |
2014 | 2013 | 2012 | |||||||
Revenue |
$ | 143,913 | $ | 125,148 | $ | 100,649 | ||||
Cost of revenue |
11,095 | 9,788 | 4,347 | |||||||
| | | | | | | | | | | |
Gross profit |
132,818 | 115,360 | 96,302 | |||||||
Operating expenses: |
||||||||||
Selling, general and administrative |
78,570 | 79,753 | 78,409 | |||||||
Research and development |
37,298 | 31,145 | 25,774 | |||||||
Change in fair value of contingent consideration |
400 | (6,000 | ) | — | ||||||
Impairment of intangible assets |
— | 2,820 | — | |||||||
| | | | | | | | | | | |
Total operating expenses |
116,268 | 107,718 | 104,183 | |||||||
| | | | | | | | | | | |
Operating income (loss) |
16,550 | 7,642 | (7,881 | ) | ||||||
Interest and other income (expense), net |
(413 | ) | (521 | ) | (352 | ) | ||||
| | | | | | | | | | | |
Income (loss) before income taxes |
16,137 | 7,121 | (8,233 | ) | ||||||
Provision (benefit) for income taxes |
(11,006 | ) | (8,634 | ) | 7,665 | |||||
| | | | | | | | | | | |
Net income (loss) |
$ | 27,143 | $ | 15,755 | $ | (15,898 | ) | |||
| | | | | | | | | | | |
| | | | | | | | | | | |
| | | | | | | | | | | |
Net income (loss) per common share: |
||||||||||
Basic |
$ | 1.58 | $ | 0.87 | $ | (0.91 | ) | |||
| | | | | | | | | | | |
| | | | | | | | | | | |
| | | | | | | | | | | |
Diluted |
$ | 1.55 | $ | 0.86 | $ | (0.91 | ) | |||
| | | | | | | | | | | |
| | | | | | | | | | | |
| | | | | | | | | | | |
Weighted average shares outstanding: |
||||||||||
Basic |
17,180 | 18,097 | 17,466 | |||||||
| | | | | | | | | | | |
| | | | | | | | | | | |
| | | | | | | | | | | |
Diluted |
17,561 | 18,334 | 17,466 | |||||||
| | | | | | | | | | | |
| | | | | | | | | | | |
| | | | | | | | | | | |
See accompanying notes to consolidated financial statements.
60
DTS, INC.
CONSOLIDATED STATEMENTS OF COMPREHENSIVE INCOME (LOSS)
(Amounts in thousands)
| |
For the Years Ended December 31, | |||||||||
|---|---|---|---|---|---|---|---|---|---|---|
| |
2014 | 2013 | 2012 | |||||||
Net income (loss) |
$ | 27,143 | $ | 15,755 | $ | (15,898 | ) | |||
Other comprehensive income (loss), net of tax: |
||||||||||
Foreign currency translation adjustments, net |
— | 94 | 56 | |||||||
Other, net |
61 | (6 | ) | (41 | ) | |||||
| | | | | | | | | | | |
Total comprehensive income (loss) |
$ | 27,204 | $ | 15,843 | $ | (15,883 | ) | |||
| | | | | | | | | | | |
| | | | | | | | | | | |
| | | | | | | | | | | |
See accompanying notes to consolidated financial statements.
61
DTS, INC.
CONSOLIDATED STATEMENTS OF STOCKHOLDERS' EQUITY
(Amounts in thousands)
| |
Common Stock | |
|
Accumulated Other Comprehensive Income |
|
|
||||||||||||||||
|---|---|---|---|---|---|---|---|---|---|---|---|---|---|---|---|---|---|---|---|---|---|---|
| |
Additional Paid-in Capital |
Treasury Stock |
Retained Earnings |
Total Stockholders' Equity |
||||||||||||||||||
| |
Shares | Amount | ||||||||||||||||||||
Balance at December 31, 2011 |
16,536 | $ | 3 | $ | 192,819 | $ | (107,222 | ) | $ | 644 | $ | 59,558 | $ | 145,802 | ||||||||
Exercise of options and related tax benefit of $8,661 |
78 | — | 9,432 | — | — | — | 9,432 | |||||||||||||||
Issuance of common stock under employee stock purchase plan |
70 | — | 1,205 | — | — | — | 1,205 | |||||||||||||||
Restricted stock award forfeitures and shares withheld for taxes |
(22 | ) | — | (985 | ) | — | — | — | (985 | ) | ||||||||||||
Restricted stock unit vesting |
48 | — | — | — | — | — | — | |||||||||||||||
Stock-based compensation charge |
— | — | 11,316 | — | — | — | 11,316 | |||||||||||||||
Stock issued as consideration for business acquisition |
2,307 | — | — | 61,906 | — | (17,335 | ) | 44,571 | ||||||||||||||
Stock repurchases |
(809 | ) | — | — | (14,532 | ) | — | — | (14,532 | ) | ||||||||||||
Net loss |
— | — | — | — | — | (15,898 | ) | (15,898 | ) | |||||||||||||
Other comprehensive income |
— | — | — | — | 15 | — | 15 | |||||||||||||||
| | | | | | | | | | | | | | | | | | | | | | | |
Balance at December 31, 2012 |
18,208 | $ | 3 | $ | 213,787 | $ | (59,848 | ) | $ | 659 | $ | 26,325 | $ | 180,926 | ||||||||
Exercise of options and related tax shortfall of $2,090 |
27 | — | (1,673 | ) | — | — | — | (1,673 | ) | |||||||||||||
Issuance of common stock under employee stock purchase plan |
161 | — | 2,059 | — | — | — | 2,059 | |||||||||||||||
Restricted stock award forfeitures and shares withheld for taxes |
(8 | ) | — | (929 | ) | — | — | — | (929 | ) | ||||||||||||
Restricted stock unit vesting |
82 | — | — | — | — | — | — | |||||||||||||||
Stock-based compensation charge |
— | — | 11,727 | — | — | — | 11,727 | |||||||||||||||
Stock repurchases |
(1,191 | ) | — | — | (24,841 | ) | — | — | (24,841 | ) | ||||||||||||
Net income |
— | — | — | — | — | 15,755 | 15,755 | |||||||||||||||
Other comprehensive income |
— | — | — | — | 88 | — | 88 | |||||||||||||||
| | | | | | | | | | | | | | | | | | | | | | | |
Balance at December 31, 2013 |
17,279 | $ | 3 | $ | 224,971 | $ | (84,689 | ) | $ | 747 | $ | 42,080 | $ | 183,112 | ||||||||
Exercise of options and related tax shortfall of $310 |
206 | — | 4,174 | — | — | — | 4,174 | |||||||||||||||
Issuance of common stock under employee stock purchase plan |
172 | — | 2,233 | — | — | — | 2,233 | |||||||||||||||
Shares withheld for taxes |
— | — | (817 | ) | — | — | — | (817 | ) | |||||||||||||
Restricted stock unit vesting |
90 | — | — | — | — | — | — | |||||||||||||||
Stock-based compensation charge |
— | — | 10,492 | — | — | — | 10,492 | |||||||||||||||
Stock repurchases |
(374 | ) | — | — | (7,495 | ) | — | — | (7,495 | ) | ||||||||||||
Net income |
— | — | — | — | — | 27,143 | 27,143 | |||||||||||||||
Other comprehensive income |
— | — | — | — | 61 | — | 61 | |||||||||||||||
| | | | | | | | | | | | | | | | | | | | | | | |
Balance at December 31, 2014 |
17,373 | $ | 3 | $ | 241,053 | $ | (92,184 | ) | $ | 808 | $ | 69,223 | $ | 218,903 | ||||||||
| | | | | | | | | | | | | | | | | | | | | | | |
| | | | | | | | | | | | | | | | | | | | | | | |
| | | | | | | | | | | | | | | | | | | | | | | |
See accompanying notes to consolidated financial statements.
62
DTS, INC.
CONSOLIDATED STATEMENTS OF CASH FLOWS
(Amounts in thousands)
| |
For the Years Ended December 31, |
|||||||||
|---|---|---|---|---|---|---|---|---|---|---|
| |
2014 | 2013 | 2012 | |||||||
Cash flows from operating activities: |
||||||||||
Net income (loss) |
$ | 27,143 | $ | 15,755 | $ | (15,898 | ) | |||
Adjustments to reconcile net income (loss) to net cash provided by operating activities: |
||||||||||
Depreciation and amortization |
14,404 | 15,399 | 9,625 | |||||||
Stock-based compensation charges |
10,492 | 11,727 | 11,316 | |||||||
Deferred income taxes |
(14,740 | ) | (14,849 | ) | 5,392 | |||||
Tax benefits (shortfalls) from stock-based awards |
(310 | ) | (2,090 | ) | 8,661 | |||||
Excess tax benefits from stock-based awards |
(518 | ) | (67 | ) | (8,879 | ) | ||||
Change in fair value of contingent consideration |
400 | (6,000 | ) | — | ||||||
Impairment of intangible assets |
— | 2,820 | — | |||||||
Other |
117 | 858 | 822 | |||||||
Changes in operating assets and liabilities, net of business acquisitions: |
||||||||||
Accounts receivable |
(377 | ) | (2,474 | ) | 5,316 | |||||
Prepaid expenses and other assets |
(1,799 | ) | (980 | ) | (2,381 | ) | ||||
Accounts payable, accrued expenses and other liabilities |
6,600 | (3,568 | ) | (2,899 | ) | |||||
Deferred revenue |
459 | 2,603 | 6,032 | |||||||
Income taxes receivable/payable |
(805 | ) | 2,281 | (2,316 | ) | |||||
| | | | | | | | | | | |
Net cash provided by operating activities |
$ | 41,066 | $ | 21,415 | $ | 14,791 | ||||
| | | | | | | | | | | |
Cash flows from investing activities: |
||||||||||
Purchases of held-to-maturity investments |
— | — | (3,450 | ) | ||||||
Purchases of available-for-sale investments |
— | (4,974 | ) | (46,890 | ) | |||||
Maturities of held-to-maturity investments |
— | — | 20,120 | |||||||
Maturities of available-for-sale investments |
5,000 | 19,184 | 31,534 | |||||||
Sales of held-to-maturity investments |
— | — | 9,109 | |||||||
Sales of available-for-sale investments |
— | — | 24,760 | |||||||
Cash paid for business acquisitions, net |
(3,200 | ) | — | (59,616 | ) | |||||
Sale of other assets |
725 | — | — | |||||||
Purchases of property and equipment |
(1,579 | ) | (2,766 | ) | (4,225 | ) | ||||
Purchases of intangible assets |
(2,025 | ) | (938 | ) | (584 | ) | ||||
| | | | | | | | | | | |
Net cash provided by (used in) investing activities |
$ | (1,079 | ) | $ | 10,506 | $ | (29,242 | ) | ||
| | | | | | | | | | | |
Cash flows from financing activities: |
||||||||||
Proceeds from long-term borrowings |
30,000 | — | 30,000 | |||||||
Repayment of long-term borrowings |
(35,000 | ) | — | — | ||||||
Payment of contingent consideration |
(500 | ) | (500 | ) | — | |||||
Proceeds from the issuance of common stock under stock-based compensation plans |
6,717 | 2,476 | 1,976 | |||||||
Cash paid for shares withheld for taxes |
(817 | ) | (929 | ) | (985 | ) | ||||
Excess tax benefits from stock-based awards |
518 | 67 | 8,879 | |||||||
Purchases of treasury stock |
(7,495 | ) | (24,841 | ) | (14,532 | ) | ||||
| | | | | | | | | | | |
Net cash provided by (used in) financing activities |
$ | (6,577 | ) | $ | (23,727 | ) | $ | 25,338 | ||
| | | | | | | | | | | |
Net change in cash and cash equivalents |
33,410 | 8,194 | 10,887 | |||||||
Cash and cash equivalents, beginning of the year |
66,025 | 57,831 | 46,944 | |||||||
| | | | | | | | | | | |
Cash and cash equivalents, end of the year |
$ | 99,435 | $ | 66,025 | $ | 57,831 | ||||
| | | | | | | | | | | |
| | | | | | | | | | | |
| | | | | | | | | | | |
Supplemental disclosure of cash flow information: |
||||||||||
Cash paid for interest |
$ | 349 | $ | 363 | $ | 168 | ||||
| | | | | | | | | | | |
| | | | | | | | | | | |
| | | | | | | | | | | |
Cash paid for income taxes |
$ | 771 | $ | 1,942 | $ | 2,091 | ||||
| | | | | | | | | | | |
| | | | | | | | | | | |
| | | | | | | | | | | |
Significant non-cash transactions: |
||||||||||
Contingent consideration for business acquisition |
$ | — | $ | — | $ | 7,500 | ||||
| | | | | | | | | | | |
| | | | | | | | | | | |
| | | | | | | | | | | |
Common stock issued as consideration for business acquisition |
$ | — | $ | — | $ | 44,571 | ||||
| | | | | | | | | | | |
| | | | | | | | | | | |
| | | | | | | | | | | |
Accruals for purchases of intangible assets |
$ | 1,000 | $ | — | $ | — | ||||
| | | | | | | | | | | |
| | | | | | | | | | | |
| | | | | | | | | | | |
See accompanying notes to consolidated financial statements.
63
DTS, INC.
NOTES TO CONSOLIDATED FINANCIAL STATEMENTS
(Amounts in thousands, except per share data)
Note 1—The Company
DTS, Inc. (the "Company") is a leading provider of premier audio solutions that are incorporated into an array of consumer electronics devices by hundreds of licensee customers around the world. The Company's audio technologies enable recording, delivery and playback of simple, personalized, and immersive high-definition audio and are currently used in a variety of product applications, including televisions (TVs), personal computers (PCs), smartphones, tablets, digital media players, set-top-boxes, soundbars, wireless speakers, video game consoles, Blu-ray Disc players, automotive audio systems, audio/video receivers, DVD-based products and home theater systems. In addition, the Company provides technologies and services to motion picture studios, radio and TV broadcasters, game developers and other content creators to facilitate the inclusion of compelling, realistic DTS-encoded audio in their content. The Company also provides a suite of audio processing technologies designed to enhance the entertainment experience for users of consumer electronics products subject to physical limitations, such as TVs, PCs and mobile electronics.
The Company commenced operations in 1990 as Digital Theater Systems Corporation ("DTS Corp"). In 1993, DTS Corp became the general partner of Digital Theater Systems, L.P., a Delaware limited partnership ("the Partnership"). In 1994, the Partnership formed DTS Technology, LLC to develop audio technologies for the consumer electronics and other markets. In 1997, the Company completed a reorganization and tax-free exchange with the predecessor entities and was incorporated in Delaware. In 2003, the Company completed its initial public offering, and in May 2005, the Company changed its name from Digital Theater Systems, Inc. to DTS, Inc.
Acquisitions
On July 5, 2012, the Company completed its acquisition of assets from Phorus, Inc. and Phorus, LLC (collectively "Phorus") pursuant to an Asset Purchase Agreement. During 2013, the Company finalized the purchase price accounting related to Phorus.
On July 20, 2012, the Company completed its acquisition of SRS Labs, Inc. (SRS), pursuant to the Agreement and Plan of Merger and Reorganization, dated as of April 16, 2012. During 2013, the Company finalized the purchase price accounting related to SRS and retrospectively applied measurement period adjustments to the consolidated financial statements.
On August 14, 2014, the Company acquired substantially all of the assets of Manzanita Systems, Inc. (Manzanita). The preliminary allocation of the purchase price, which the Company considers to be immaterial to the consolidated financial statements, was based on estimates and valuations. The final allocation of the purchase price was completed in the fourth quarter of 2014, resulting in no material adjustments.
For additional information, refer to Notes 2, 4 and 6, "Significant Accounting Policies", "Fair Value Measurements" and "Business Combinations", respectively.
Note 2—Significant Accounting Policies
Principles of Consolidation
The accompanying consolidated financial statements have been prepared in accordance with generally accepted accounting principles in the United States of America (US GAAP) and pursuant to
64
DTS, INC.
NOTES TO CONSOLIDATED FINANCIAL STATEMENTS (Continued)
(Amounts in thousands, except per share data)
Note 2—Significant Accounting Policies (Continued)
the rules and regulations of the Securities and Exchange Commission (SEC). The consolidated financial statements include the accounts of the Company and its subsidiaries. All intercompany accounts and transactions have been eliminated.
Use of Estimates
The preparation of financial statements in accordance with US GAAP and pursuant to the rules and regulations of the SEC requires management to make estimates and assumptions that affect the reported amounts of assets and liabilities, disclosure of contingent assets and liabilities as of the date of the financial statements, and the reported amounts of revenues and expenses during the reporting period. On an ongoing basis, the Company evaluates its estimates and assumptions, including those related to revenue recognition, valuations of goodwill, other intangible assets, and long-lived assets, stock-based compensation, income taxes and business combinations. The Company bases its estimates on historical and anticipated results, trends and various other assumptions that it believes are reasonable under the circumstances, including assumptions as to future events. These estimates form the basis for making assumptions about the carrying values of assets and liabilities that are not readily apparent from other sources. By their nature, estimates are subject to an inherent degree of uncertainty. Actual results could differ materially from those estimates.
Cash Equivalents
The Company considers all short-term highly liquid investments with an original maturity of three months or less to be cash equivalents. Cash equivalents primarily consist of funds held in money market accounts. Cash equivalents are stated at cost plus accrued interest, which approximates fair value.
Investments
The Company considers, at the time that they are purchased, investments with maturities greater than three months, but less than one year, to be short-term investments. Investments that have maturities of more than one year are classified as long-term investments. Investments are classified as available-for-sale and are reported at fair value with unrealized gains or losses, if any, reported, net of tax, in accumulated other comprehensive income. The cost of investments sold is based on the specific identification method, and all income generated and realized gains or losses from investments are recorded to interest and other income (expense), net.
The Company reviews its investments to identify and evaluate investments that have an indication of possible impairment. Factors considered in determining whether a loss is temporary include the length of time and extent to which fair value has been less than the cost basis, the financial condition and near-term prospects of the investee, and the Company's intent and ability to hold the investment for a period of time sufficient to allow for any anticipated recovery in market value. Credit losses and other-than-temporary impairments are declines in fair value that are not expected to recover and are charged to interest and other income (expense), net.
65
DTS, INC.
NOTES TO CONSOLIDATED FINANCIAL STATEMENTS (Continued)
(Amounts in thousands, except per share data)
Note 2—Significant Accounting Policies (Continued)
Concentration of Business and Credit Risk
The Company markets its technologies to consumer electronics products manufacturers in the US and internationally. Although the Company is generally subject to the financial well-being of the consumer electronics industry, management does not believe that the Company is subject to significant credit risk with respect to trade accounts receivable. Additionally, the Company performs ongoing credit evaluations of its customers and maintains allowances for potential credit losses which, when realized, have generally been within the range of management's expectations.
Two customers accounted for 15% and 14%, respectively, of revenues for the year ended December 31, 2014. Three customers accounted for 21%, 12% and 12%, respectively, of revenues for the year ended December 31, 2013. The revenue from one of the customers accounting for 12% of revenues for the year ended December 31, 2013 exceeded 10% of revenues due to royalty recoveries. Two customers accounted for 13% and 11%, respectively, of revenues for the year ended December 31, 2012.
As of December 31, 2014, one customer accounted for 42% of accounts receivable, which resulted from the normal course of business, and another customer accounted for 26% of accounts receivable, which resulted from royalty recoveries. One customer accounted for 51% of accounts receivable at December 31, 2013, which resulted largely from royalty recoveries.
The Company deposits its cash and cash equivalents in accounts with major financial institutions worldwide. At times, such deposits may be in excess of insured limits. The Company's investment accounts are with major financial institutions and include investment grade municipal securities and US agency securities. The Company has not incurred any significant credit losses on its investments.
Allowance For Doubtful Accounts
The Company continually monitors customer payments and maintains a reserve for estimated losses resulting from its customers' inability to make required payments. In determining the reserve, the Company evaluates the collectibility of its accounts receivable based upon a variety of factors. In cases where the Company becomes aware of circumstances that may impair a specific customer's ability to meet its financial obligations, the Company records a specific allowance against amounts due. For all other customers, the Company recognizes allowances for doubtful accounts based on its historical write-off experience in conjunction with the length of time the receivables are past due, customer creditworthiness, geographic risk and the current business environment. Actual future losses from uncollectible accounts may differ from the Company's estimates.
66
DTS, INC.
NOTES TO CONSOLIDATED FINANCIAL STATEMENTS (Continued)
(Amounts in thousands, except per share data)
Note 2—Significant Accounting Policies (Continued)
Property and Equipment
Property and equipment are recorded at cost, less accumulated depreciation. Depreciation is calculated using the straight-line method over the related assets' estimated useful lives:
Machinery and equipment |
2 to 5 years | |
Software |
2 to 7 years | |
Office furniture and fixtures |
3 to 7 years | |
Leasehold improvements |
Lesser of useful life or related lease term | |
Building and improvements |
Up to 35 years |
Expenditures that materially increase asset life are capitalized, while ordinary maintenance and repairs are expensed as incurred.
Capitalized Software Costs
The Company capitalizes the costs of purchased software licenses, consulting costs and payroll-related costs incurred in developing or implementing internal use computer software. These costs are included in property and equipment, net on the consolidated balance sheets. Costs incurred during the preliminary project and post-implementation stages are charged to expense as incurred. The Company's capitalized software costs are amortized on a straight-line basis over the estimated useful life of the software upon being placed in service, two to seven years.
Long-Lived Assets
The Company periodically assesses potential impairments to its long-lived assets by performing an impairment review whenever events or changes in circumstances indicate that the carrying value may not be fully recoverable. Factors considered by the Company include, but are not limited to: significant underperformance relative to expected historical or projected future operating results; significant changes in the manner of use of the acquired assets or the strategy for the Company's overall business; and significant negative industry or economic trends. When the Company determines that the carrying value of a long-lived asset may not be recoverable based upon the existence of one or more of the above indicators of impairment, the Company estimates the future undiscounted cash flows expected to result from the use of the asset and its eventual disposition. If the sum of the expected future undiscounted cash flows and eventual disposition is less than the carrying amount of the asset, the Company recognizes an impairment charge. An impairment charge is reflected as the amount by which the carrying amount exceeds the fair market value of the asset, based on the fair market value if available, or discounted cash flows. To date, there has been no impairment of long-lived tangible assets.
Goodwill and Other Intangible Assets
The Company evaluates the carrying value of goodwill and indefinite-lived intangibles for impairment on an annual basis as of October 31 of each year at the reporting unit level, or more frequently if events or circumstances indicate that the goodwill and other intangibles might be impaired. Reporting units are identified based on the current organizational structure, availability of discrete financial information, and economic similarity of components under the Company's operating
67
DTS, INC.
NOTES TO CONSOLIDATED FINANCIAL STATEMENTS (Continued)
(Amounts in thousands, except per share data)
Note 2—Significant Accounting Policies (Continued)
segment. The Company operates in one reportable and operating segment and has two separate reporting units: (i) the Phorus business, and (ii) the rest of the business.
To test goodwill for impairment, the Company performs a qualitative assessment (Step 0) to determine whether further impairment testing is necessary. Qualitative factors considered include but are not limited to general macroeconomic conditions; industry and market conditions and trends; overall financial performance and trends in cash flows or revenue; changes in strategy or customers; and changes in share price.
If further testing is necessary, a Step 1 test is performed to evaluate the recoverability of goodwill, which includes valuation of the underlying reporting unit using fair value techniques, which may include both income and market approaches. If the carrying value of the reporting unit exceeds its estimated fair value, or if the reporting unit has a negative carrying value and the Company believes it is more likely than not that a goodwill impairment exists, the Company would proceed to Step 2 and estimate the fair value of the goodwill itself and compare it to the carrying value. The Company would record an impairment charge in an amount equal to the excess of the carrying value of the goodwill over the estimated fair value. Goodwill impairment is measured subsequent to the completion of any impairment of all other intangible and long-lived assets associated with the reporting unit.
Similar to goodwill, impairment of indefinite-lived intangibles is tested by estimating the fair value of the assets, and an impairment charge would be recorded to the extent that the carrying amount of such assets exceeds the estimated fair value.
The Company's definite-lived intangibles principally consist of customer relationships, acquired technology, contractual rights arrangements and patents, tradenames and trademarks, which are being amortized over their respective estimated useful lives. Costs incurred in securing patents and trademarks and protecting the Company's proprietary technology and brand name paid to third parties are capitalized and internal costs are expensed as incurred. Patent and trademark costs are amortized over their estimated useful lives, typically five and ten years, respectively. The amortization period commences when the patent or trademark is issued. The Company reviews such assets for impairment whenever events or changes in circumstances indicate an asset's carrying value may not be recoverable. Factors considered include, but are not limited to, significant underperformance relative to expected historical or projected future operating results; significant changes in the manner of use of the acquired assets or projected future operating results; significant changes in the strategy of the overall business; and significant negative industry or economic trends. Recoverability of an intangible is measured by comparing its carrying amount to the expected future undiscounted cash flows that the asset is expected to generate. If it is determined that an asset is not recoverable, an impairment charge is recorded in the amount by which the carrying amount of the asset exceeds its fair value.
If the Company is unable to finalize the results of impairment tests prior to the issuance of the financial statements and an impairment charge is probable and can be reasonably estimated, the Company recognizes its best estimate of the loss in the current period financial statements and discloses that the amount is an estimate. The Company would then recognize any adjustments to that estimate in subsequent reporting periods, once the results of the impairment tests have been finalized.
68
DTS, INC.
NOTES TO CONSOLIDATED FINANCIAL STATEMENTS (Continued)
(Amounts in thousands, except per share data)
Note 2—Significant Accounting Policies (Continued)
Business Combinations
The Company includes the results of operations of the businesses that it has acquired in its consolidated results as of the respective dates of acquisition. However, as noted below in the revenue recognition policy, the Company did not begin to recognize revenue from per-unit licensing agreements acquired with SRS until the fourth quarter of 2012.
The Company allocates the fair value of the purchase consideration of its acquisitions to the tangible assets, liabilities and intangible assets acquired, including in-process research and development (IPR&D), based on their estimated fair values. The excess of the fair value of purchase consideration over the fair values of these identifiable assets and liabilities is recorded as goodwill. The primary items that generate goodwill include the value of the synergies between the acquired companies and the Company and the acquired assembled workforce, neither of which qualifies as an identifiable intangible asset. IPR&D is initially capitalized at fair value as an intangible asset with an indefinite life and assessed for impairment thereafter. When the IPR&D project is complete, it is reclassified as an amortizable purchased intangible asset and is amortized over its estimated useful life. If an IPR&D project is abandoned, the Company records a charge for the value of the related intangible asset in its consolidated statement of operations in the period it is abandoned. The fair value of contingent consideration associated with acquisitions is remeasured each reporting period and adjusted accordingly. Acquisition and integration related costs are recognized separately from the business combination and are expensed as incurred.
Revenue Recognition
The Company recognizes revenue when persuasive evidence of a sales arrangement exists, delivery has occurred or services have been rendered, the buyer's price is fixed or determinable and collection is reasonably assured. Determining whether and when these criteria have been satisfied may involve assumptions and judgments that can have a significant impact on the timing and amount of revenue that is reported.
Revenue from licensing audio technology, trademarks and know-how is generated from licensing agreements with consumer electronics products manufacturers that pay a license fee for products manufactured or shipped. Licensees with a per-unit arrangement pay a per-unit license fee for each product manufactured or shipped, as set forth in each license agreement. Licensees report manufacturing or shipping information in the quarter subsequent to when such activity takes place. Consequently, the Company recognizes revenue from these per-unit licensing agreements in the quarter following the quarter of manufacture or shipment, provided amounts are fixed or determinable and collection is reasonably assured, since the Company cannot reliably estimate the amount of revenue earned prior to the receipt of such reports. Use of this quarter lag method allows for the receipt of licensee royalty reports prior to the recognition of revenue.
Certain cash collections from per-unit licensing agreements acquired with SRS during the year ended December 31, 2012 were the result of product shipments prior to July 20, 2012, the acquisition date. Therefore, the Company did not recognize revenue from these per-unit licensing agreements and certain other licensing arrangements acquired with SRS during the year ended December 31, 2012.
69
DTS, INC.
NOTES TO CONSOLIDATED FINANCIAL STATEMENTS (Continued)
(Amounts in thousands, except per share data)
Note 2—Significant Accounting Policies (Continued)
Accordingly, the Company recognized revenue from per-unit licensing agreements acquired with SRS that resulted from product shipments after the acquisition date.
Certain licensees have entered into minimum guarantee arrangements, whereby licensees pay a flat fee for the right to license certain technology over the contract term. These agreements stipulate a flat fee that corresponds to a minimum number of units or dollars, with additional per-unit fees for any units or dollars exceeding the minimum. For these agreements, the Company recognizes the minimum, or flat fee amount, on these agreements as revenue ratably over the contract term. Consistent with the aforementioned policy for per-unit license fee agreements, the Company recognizes revenue relating to any additional per-unit fees on a quarter lag basis, since the Company cannot reliably estimate the amount of revenue earned from additional units manufactured or shipped prior to the receipt of licensee reports.
The Company actively polices and enforces its intellectual property, and pursues third parties who have under-reported the amount of royalties owed under a license agreement or who utilize its intellectual property without a license. As a result of these activities, from time to time, the Company may recognize royalty revenues that relate to infringements or under-reporting that occurred in prior periods. These royalty recoveries may cause revenues to be higher than expected during a particular reporting period and may not occur in subsequent periods. Differences between amounts initially recognized and amounts subsequently audited or reported as an adjustment to those amounts due from licensees, will be recognized in the period such adjustment is determined or contracted, as appropriate.
Deferred revenues arise primarily from payments for licensing audio technology received in advance of the culmination of the earnings process. Deferred revenues are recognized as revenue in future periods when the applicable revenue recognition criteria are met. Typically, deferred revenues arise from flat fee or minimum guarantee arrangements that allow licensees to manufacture an unlimited or specified number of units over a specified term, and accordingly, these deferred revenues will be recognized as revenue ratably over the term of the arrangement.
Licensing revenue is recognized gross of withholding taxes that are remitted by the Company's licensees directly to their local tax authorities. For the years ended December 31, 2014, 2013 and 2012, withholding taxes were $3,377, $5,610, and $4,970, respectively. Withholding taxes were lower in 2014 compared to the prior years due to the transfer of Japan intellectual property licensing rights from Ireland to the US in 2014.
Research and Development (R&D) Costs
The Company conducts its R&D internally and expenses are primarily comprised of the following types of costs incurred in performing research and development activities: salaries and benefits, related employee expenses, allocated overhead, contract services, and consultants. R&D costs are expensed as incurred.
Foreign Currency Translation
The functional currency of all the Company's wholly-owned subsidiaries is the US dollar. Certain subsidiaries have monetary assets and liabilities that are denominated in a currency that is different than the functional currency. The gains and losses resulting from this remeasurement and translation of
70
DTS, INC.
NOTES TO CONSOLIDATED FINANCIAL STATEMENTS (Continued)
(Amounts in thousands, except per share data)
Note 2—Significant Accounting Policies (Continued)
monetary assets denominated in a currency that is different than the functional currency are reflected in the determination of net income (loss) and included in interest and other income (expense), net.
Comprehensive Income (Loss)
Comprehensive income (loss) includes all changes in stockholders' equity during a period from non-owner sources. To date, accumulated other comprehensive income has been comprised mostly of foreign currency translation, as a result of certain wholly-owned subsidiaries having a non-US dollar functional currency in prior years.
Advertising Expenses
Advertising and promotional costs are expensed as incurred and amounted to $4,489, $4,408, and $3,584, for the years ended December 31, 2014, 2013 and 2012, respectively.
Stock Repurchases
Repurchased shares of the Company's common stock are held as treasury shares until they are reissued or retired. When the Company reissues treasury stock, and the proceeds from the sale exceed the average price that was paid by the Company to acquire the shares, the Company records such excess as an increase in additional paid-in capital. Conversely, if the proceeds from the sale are less than the average price the Company paid to acquire the shares, the Company records such difference as a decrease in additional paid-in capital to the extent of increases previously recorded, with the balance recorded as a decrease in retained earnings.
Stock-Based Compensation
The Company accounts for stock-based compensation using the fair value recognition approach. The Company uses the Black-Scholes option-pricing model to determine the fair value of any stock options granted, which requires the Company to make estimates regarding dividend yields on its common stock, expected volatility in the price of its common stock, risk free interest rates, forfeiture rates and the expected life of the option. The fair value of any restricted stock awarded is calculated using the closing market price of the Company's common stock on the date of grant. The Company recognizes these compensation costs net of the applicable forfeiture rates and for only those shares expected to vest on a straight-line basis over the requisite service period of each award, which is generally four years. The Company estimates the forfeiture rate based on its historical experience.
Income Taxes
The Company utilizes the asset and liability method of accounting for income taxes. Under this method, the deferred tax assets and liabilities are measured each year based on the difference between the financial statement and tax basis of assets and liabilities at the applicable enacted tax rates. The deferred tax provision is primarily the result of changes in the deferred tax assets and liabilities. The Company recognizes interest and penalties related to income taxes in the provision for income taxes. Additionally, a valuation allowance is recorded for that portion of deferred tax assets for which it is more likely than not that the assets will not be realized. In assessing the need for a valuation
71
DTS, INC.
NOTES TO CONSOLIDATED FINANCIAL STATEMENTS (Continued)
(Amounts in thousands, except per share data)
Note 2—Significant Accounting Policies (Continued)
allowance, the Company considers all available positive and negative evidence, including scheduled reversals of deferred tax liabilities, projected future taxable income, tax planning strategies and recent financial performance. In the event that all or part of the deferred tax assets are determined not to be realizable in the future, an adjustment to the valuation allowance may be necessary. A valuation allowance adjustment would be recorded in the provision for income taxes in the period such determination is made.
Fair Value of Financial Instruments
The carrying amount of cash equivalents, short-term investments, accounts receivable, accounts payable and accrued liabilities approximates fair value due to the short-term nature of these instruments. Long-term debt approximates fair value due to the variable rate nature of the debt.
Recent Accounting Pronouncements
In July 2013, the Financial Accounting Standards Board (FASB) issued Accounting Standards Update (ASU) 2013-11, "Income Taxes (Topic 740): Presentation of an Unrecognized Tax Benefit When a Net Operating Loss Carryforward, a Similar Tax Loss, or a Tax Credit Carryforward Exists." This ASU provides guidance regarding when an unrecognized tax benefit should be classified as a reduction to a deferred tax asset or when it should be classified as a liability. This ASU is effective prospectively for fiscal years, and interim periods within those years, beginning after December 15, 2013. The Company fully adopted this ASU in the first quarter of 2014. As of December 31, 2014, $2,052 of unrecognized tax benefits were recorded as a reduction to non-current deferred tax assets on the consolidated balance sheet.
In May 2014, the FASB issued ASU 2014-09, "Revenue from Contracts with Customers (Topic 606)." This ASU outlines a single comprehensive model for entities to use in accounting for revenue arising from contracts with customers and supersedes most current revenue recognition guidance, including industry-specific guidance. For public entities, this ASU is effective for fiscal years, and interim periods within those years, beginning after December 15, 2016. Early adoption is not permitted. Entities have the option of applying either a full retrospective approach or a modified approach. The Company is evaluating the potential impact of adoption of this ASU on its consolidated financial statements.
72
DTS, INC.
NOTES TO CONSOLIDATED FINANCIAL STATEMENTS (Continued)
(Amounts in thousands, except per share data)
Note 3—Cash, Cash Equivalents and Investments
Cash, cash equivalents and investments consist of the following:
| |
As of December 31, | ||||||
|---|---|---|---|---|---|---|---|
| |
2014 | 2013 | |||||
Cash and cash equivalents: |
|||||||
Cash |
$ | 17,899 | $ | 26,374 | |||
Money market accounts |
81,536 | 39,651 | |||||
| | | | | | | | |
Total cash and cash equivalents |
$ | 99,435 | $ | 66,025 | |||
| | | | | | | | |
| | | | | | | | |
| | | | | | | | |
Short-term investments: |
|||||||
US government and agency securities |
— | 5,004 | |||||
| | | | | | | | |
Total short-term investments |
$ | — | $ | 5,004 | |||
| | | | | | | | |
| | | | | | | | |
| | | | | | | | |
The Company had no material gross realized or unrealized holding gains or losses from its investments for the years ended December 31, 2014, 2013 and 2012.
Note 4—Fair Value Measurements
The Company's investments are required to be measured and recorded at fair value on a recurring basis. The Company's contingent consideration related to its acquisition of assets from Phorus is also measured and recorded at fair value on a recurring basis until it can be determined whether or not any future payments will be made. Increases or decreases in the fair value of contingent consideration can result from accretion of the liability due to the passage of time, changes in the timing and amount of revenue estimates, changes in discount rates, or remittance of payments.
The Company obtained the fair value of its available-for-sale securities, which are not in active markets, from a third-party professional pricing service using quoted market prices for identical or comparable instruments, rather than direct observations of quoted prices in active markets. The Company's professional pricing service gathers observable inputs for all of its fixed income securities from a variety of industry data providers (e.g., large custodial institutions) and other third-party sources. Once the observable inputs are gathered, all data points are considered and the fair value is determined. The Company validates the quoted market prices provided by its primary pricing service by comparing their assessment of the fair values against the fair values provided by its investment managers. The Company's investment managers use similar techniques to its professional pricing service to derive pricing as described above. As all significant inputs were observable, derived from observable information in the marketplace or supported by observable levels at which transactions are executed in the marketplace, the Company has classified its available-for-sale securities within Level 2 of the fair value hierarchy.
The Company classifies the fair value of the contingent consideration liability within Level 3 of the fair value hierarchy, as the fair value is based upon unobservable inputs supported by no market activity. As of December 31, 2014 and 2013, the Company measured the fair value of the remaining contingent consideration using an income approach, based on an analysis of projected cash flows using a discount rate of 15% and 17%, respectively. Considerable judgment is required in the assumptions used in fair value measurements. Accordingly, use of different assumptions, such as significant increases or decreases in estimated revenues, cash flows or the discount rate, could result in materially different fair value estimates.
73
DTS, INC.
NOTES TO CONSOLIDATED FINANCIAL STATEMENTS (Continued)
(Amounts in thousands, except per share data)
Note 4—Fair Value Measurements (Continued)
For additional information on contingent consideration, refer to Notes 6 and 10, "Business Combinations" and "Commitments and Contingencies", respectively.
The Company's financial assets and liabilities, measured at fair value on a recurring basis, were as follows:
| |
|
Fair Value Measurements at Reporting Date Using |
|||||||||||
|---|---|---|---|---|---|---|---|---|---|---|---|---|---|
Assets (Liabilities)
|
Total | Quoted Prices in Active Markets for Identical Assets (Level 1) |
Significant Other Observable Inputs (Level 2) |
Significant Unobservable Inputs (Level 3) |
|||||||||
As of December 31, 2014 |
|||||||||||||
Contingent consideration(1) |
$ | (900 | ) | $ | — | $ | — | $ | (900 | ) | |||
As of December 31, 2013 |
|||||||||||||
US government and agency securities |
$ | 5,004 | $ | — | $ | 5,004 | $ | — | |||||
Contingent consideration(2) |
$ | (1,000 | ) | $ | — | $ | — | $ | (1,000 | ) | |||
- (1)
- The
full balance was classified in accrued expenses on the consolidated balance sheet.
- (2)
- $400 and $600 were classified in accrued expenses and other long-term liabilities, respectively, on the consolidated balance sheet.
The changes in the fair value of liabilities categorized as Level 3 were:
| |
For the Years Ended December 31, |
||||||
|---|---|---|---|---|---|---|---|
| |
2014 | 2013 | |||||
Balance, beginning of year |
$ | (1,000 | ) | $ | (7,500 | ) | |
Payment of contingent consideration(1) |
500 | 500 | |||||
Change in fair value of contingent consideration(2) |
(400 | ) | 6,000 | ||||
| | | | | | | | |
Balance, end of year |
$ | (900 | ) | $ | (1,000 | ) | |
| | | | | | | | |
| | | | | | | | |
| | | | | | | | |
- (1)
- This
resulted from achievement of the first and second milestones of the Phorus contingent consideration in the fourth quarters of 2014 and 2013,
respectively.
- (2)
- These changes are reflected within operating expenses in the consolidated statements of operations.
74
DTS, INC.
NOTES TO CONSOLIDATED FINANCIAL STATEMENTS (Continued)
(Amounts in thousands, except per share data)
Note 5—Property and Equipment
Property and equipment was:
| |
As of December 31, | ||||||
|---|---|---|---|---|---|---|---|
| |
2014 | 2013 | |||||
Land |
$ | 6,600 | $ | 6,600 | |||
Building and improvements |
21,407 | 21,433 | |||||
Machinery and equipment |
5,520 | 5,264 | |||||
Office furniture and fixtures |
7,988 | 7,560 | |||||
Leasehold improvements |
4,418 | 4,409 | |||||
Software |
7,188 | 6,738 | |||||
| | | | | | | | |
|
53,121 | 52,004 | |||||
Less: Accumulated depreciation |
(26,032 | ) | (21,888 | ) | |||
| | | | | | | | |
Property and equipment, net |
$ | 27,089 | $ | 30,116 | |||
| | | | | | | | |
| | | | | | | | |
| | | | | | | | |
Depreciation expense was $4,587, $5,550, and $4,833, for the years ended December 31, 2014, 2013 and 2012, respectively.
Note 6—Business Combinations
Acquisition of SRS
On July 20, 2012, the Company completed its acquisition of SRS, which was accounted for using the acquisition method of accounting. Aggregate consideration for this merger was valued at $124,785. The preliminary allocation of the purchase price was prepared by the Company, based in part on preliminary estimates and valuations of independent consultants. The Company completed the final allocation of the purchase price related to SRS in 2013.
During the year ended December 31, 2013, the Company retrospectively recognized adjustments to the fair value of certain assets acquired and liabilities assumed in 2012. The effect of these adjustments on the preliminary purchase price allocation was an increase in accounts receivable of $2,550, an increase in prepaid expenses and other current assets of $303, a decrease in goodwill of $2,896, a
75
DTS, INC.
NOTES TO CONSOLIDATED FINANCIAL STATEMENTS (Continued)
(Amounts in thousands, except per share data)
Note 6—Business Combinations (Continued)
decrease in deferred tax assets of $25, an increase in accounts payable of $25, and a decrease in accrued expenses of $93. The final purchase price allocation, as adjusted, was:
| |
Weighted Average Estimated Useful Life (years) |
|
Estimated Fair Value |
|||||||
|---|---|---|---|---|---|---|---|---|---|---|
Cash and cash equivalents |
$ | 23,298 | ||||||||
Short-term investments |
8,529 | |||||||||
Accounts receivable |
9,835 | |||||||||
Prepaid expenses and other current assets |
1,628 | |||||||||
Income taxes receivable |
200 | |||||||||
Property and equipment |
1,027 | |||||||||
Goodwill |
41,708 | |||||||||
Identifiable intangible assets: |
||||||||||
Customer relationships |
8 | 44,540 | ||||||||
Developed technology |
6 | 7,920 | ||||||||
Trademarks/tradenames |
5 | 2,810 | ||||||||
IPR&D |
1,180 | |||||||||
| | | | | | | | | | | |
Total identifiable intangible assets |
56,450 | |||||||||
Deferred tax assets |
5,882 | |||||||||
Long-term investments |
249 | |||||||||
Accounts payable |
(476 | ) | ||||||||
Accrued expenses |
(2,279 | ) | ||||||||
Deferred revenue |
(506 | ) | ||||||||
Deferred tax liabilities |
(19,978 | ) | ||||||||
Other long-term liabilities |
(782 | ) | ||||||||
| | | | | | | | | | | |
Total purchase price |
$ | 124,785 | ||||||||
| | | | | | | | | | | |
| | | | | | | | | | | |
| | | | | | | | | | | |
Acquisition and integration related costs for this acquisition included severance costs, change in control costs, banker fees, legal fees, other professional fees, contract termination costs and other administrative costs. The acquisition and integration related costs included in the consolidated statements of operations were:
| |
For the Years Ended December 31, |
||||||
|---|---|---|---|---|---|---|---|
| |
2013 | 2012 | |||||
Selling, general and administrative |
$ | 1,520 | $ | 13,276 | |||
Research and development |
38 | 2,234 | |||||
| | | | | | | | |
Total acquisition and integration related costs |
$ | 1,558 | $ | 15,510 | |||
| | | | | | | | |
| | | | | | | | |
| | | | | | | | |
76
DTS, INC.
NOTES TO CONSOLIDATED FINANCIAL STATEMENTS (Continued)
(Amounts in thousands, except per share data)
Note 6—Business Combinations (Continued)
Acquisition of Phorus' Assets
On July 5, 2012, the Company acquired substantially all of the assets of Phorus. This asset purchase was accounted for using the acquisition method of accounting. The preliminary allocation of the purchase price was prepared by the Company, based in part on preliminary estimates and valuations of independent consultants. The final allocation of the purchase price was completed in 2013, resulting in no adjustments.
The Company paid initial cash consideration of $3,000, including a $300 holdback for potential indemnification matters, upon the closing of the acquisition, and it would have been required to pay up to an additional $10,000 in consideration subject to the achievement of certain revenue milestones. In October 2013, the Asset Purchase Agreement was amended to reduce the total potential contingent consideration to $2,000, and the revenue milestones were reduced to reflect changes made by the Company in the Phorus business model. For additional information on contingent consideration, refer to Note 4, "Fair Value Measurements."
Acquisition of Manzanita's Assets
On August 14, 2014, the Company acquired substantially all of the assets of Manzanita. This asset purchase was accounted for using the acquisition method of accounting. The preliminary allocation of the purchase price, which the Company considers to be immaterial to the consolidated financial statements, was based on estimates and valuations. The final allocation of the purchase price was completed in the fourth quarter of 2014, resulting in no material adjustments.
Note 7—Goodwill and Other Intangibles
During the year ended December 31, 2014, the Company did not identify any events or changes in circumstances that indicated the carrying value of its intangibles may not be recoverable. As such, there was no impairment of intangibles for the year ended December 31, 2014. In the fourth quarter of 2014, the Company performed its annual assessment of goodwill impairment for its two reporting units as of October 31, 2014. The Company performed a qualitative assessment (Step 0) of both reporting units to determine whether further impairment testing was necessary using the qualitative factors as discussed in Note 2, "Significant Accounting Policies." Based on the assessments, no goodwill impairment was identified for the year ended December 31, 2014.
During the year ended December 31, 2013, the Company performed an interim impairment test of goodwill and certain intangibles associated with the Phorus reporting unit as a result of revised forecasts and lower than expected results. For the definite-lived intangibles, the Company first performed an undiscounted cash flow analysis which indicated the definite-lived intangible assets were not fully recoverable, and then used a discounted cash flow method to estimate the fair value, resulting in an impairment charge for the amount that the carrying amount of the definite-lived intangible assets exceeded the fair value. For the indefinite-lived intangibles, the Company used a discounted cash flow method to estimate the fair value of the assets and recognized an impairment charge for the amount that the carrying amount of the assets exceeded the fair value. As a result, the Company recorded an impairment charge of $2,820 in the consolidated statement of operations. For goodwill, due to the negative carrying value of the Phorus reporting unit, the Company performed a qualitative assessment
77
DTS, INC.
NOTES TO CONSOLIDATED FINANCIAL STATEMENTS (Continued)
(Amounts in thousands, except per share data)
Note 7—Goodwill and Other Intangibles (Continued)
and determined that it was more likely than not that a goodwill impairment existed. As such, the Company proceeded to Step 2 of the goodwill impairment test, and estimated the fair value of the reporting unit using both income and market approaches, including a discounted cash flow method. The Company estimated that the fair value of goodwill associated with the Phorus reporting unit substantially exceeded the carrying value. As such, no goodwill impairment was recognized for the year ended December 31, 2013.
The changes in the Company's goodwill were:
| |
Goodwill | |||
|---|---|---|---|---|
Balance at December 31, 2012 and 2013 |
$ | 48,418 | ||
Increase related to business acquisitions |
1,938 | |||
| | | | | |
Balance at December 31, 2014 |
$ | 50,356 | ||
| | | | | |
| | | | | |
| | | | | |
To date, there has been no impairment of goodwill.
The Company's other intangible assets were:
| |
|
As of December 31, 2014 | As of December 31, 2013 | |||||||||||||||||||
|---|---|---|---|---|---|---|---|---|---|---|---|---|---|---|---|---|---|---|---|---|---|---|
| |
Weighted Average Life (Years) |
Gross Amount(1) |
Accumulated Amortization |
Net Carrying Amount |
Gross Amount(1) |
Accumulated Amortization |
Net Carrying Amount |
|||||||||||||||
Acquired technology |
6 | $ | 18,483 | $ | (10,575 | ) | $ | 7,908 | $ | 16,763 | $ | (8,193 | ) | $ | 8,570 | |||||||
Customer relationships |
8 | 45,801 | (14,525 | ) | 31,276 | 45,590 | (8,792 | ) | 36,798 | |||||||||||||
Non-compete |
2 | 492 | (402 | ) | 90 | 384 | (350 | ) | 34 | |||||||||||||
Tradename |
5 | 3,261 | (1,581 | ) | 1,680 | 3,000 | (1,002 | ) | 1,998 | |||||||||||||
Patents |
5 | 3,405 | (1,233 | ) | 2,172 | 3,036 | (953 | ) | 2,083 | |||||||||||||
Trademarks |
10 | 785 | (357 | ) | 428 | 669 | (297 | ) | 372 | |||||||||||||
Contractual Rights |
5 | 6,288 | (1,299 | ) | 4,989 | — | — | — | ||||||||||||||
| | | | | | | | | | | | | | | | | | | | | | | |
Total amortizable intangible assets |
78,515 | (29,972 | ) | 48,543 | 69,442 | (19,587 | ) | 49,855 | ||||||||||||||
IPR&D |
— |
— |
— |
370 |
— |
370 |
||||||||||||||||
| | | | | | | | | | | | | | | | | | | | | | | |
Total intangible assets |
$ | 78,515 | $ | (29,972 | ) | $ | 48,543 | $ | 69,812 | $ | (19,587 | ) | $ | 50,225 | ||||||||
| | | | | | | | | | | | | | | | | | | | | | | |
- (1)
- Includes write-downs of $2,304 for acquired technology, $156 for non-compete, and $360 for IPR&D, which are reflected within operating expenses in the consolidated statement of operations for the year ended December 31, 2013.
The Company capitalizes amounts due or paid under certain contractual rights arrangements and amortizes the amounts over their expected useful lives, which is generally five years. The associated amortization expense has been included in cost of revenue in the consolidated statements of operations. As of December 31, 2013, these assets amounted to $3,330, net of accumulated amortization of $620. Of this net amount, $662 was included in prepaid expenses and other current assets and $2,668 was included in other long-term assets in the consolidated balance sheet as of December 31, 2013. As of
78
DTS, INC.
NOTES TO CONSOLIDATED FINANCIAL STATEMENTS (Continued)
(Amounts in thousands, except per share data)
Note 7—Goodwill and Other Intangibles (Continued)
December 31, 2014, the Company has reclassified the balances of these assets to intangible assets. Future amounts due or paid under these arrangements will be capitalized as intangible assets and reflected as investing activities in the Company's consolidated statements of cash flows.
Amortization of intangibles included in the consolidated statements of operations was:
| |
For the Years Ended December 31, |
|||||||||
|---|---|---|---|---|---|---|---|---|---|---|
| |
2014 | 2013 | 2012 | |||||||
Cost of revenue |
$ | 8,793 | $ | 8,848 | $ | 4,151 | ||||
Operating expenses |
1,024 | 1,001 | 641 | |||||||
| | | | | | | | | | | |
Total amortization of intangible assets |
$ | 9,817 | $ | 9,849 | $ | 4,792 | ||||
| | | | | | | | | | | |
| | | | | | | | | | | |
| | | | | | | | | | | |
The Company expects the future amortization of intangible assets held at December 31, 2014 to be:
Years Ending December 31,
|
Estimated Amortization Expense |
|||
|---|---|---|---|---|
2015 |
$ | 10,962 | ||
2016 |
10,240 | |||
2017 |
9,673 | |||
2018 |
7,844 | |||
2019 |
6,584 | |||
2020 and thereafter |
3,240 | |||
| | | | | |
Total |
$ | 48,543 | ||
| | | | | |
| | | | | |
| | | | | |
Note 8—Accrued Expenses
Accrued expenses consisted of:
| |
As of December 31, | ||||||
|---|---|---|---|---|---|---|---|
| |
2014 | 2013 | |||||
Accrued payroll and related benefits |
$ | 13,893 | $ | 9,073 | |||
Contingent consideration |
900 | 400 | |||||
Other |
1,968 | 2,669 | |||||
| | | | | | | | |
Total accrued expenses |
$ | 16,761 | $ | 12,142 | |||
| | | | | | | | |
| | | | | | | | |
| | | | | | | | |
Note 9—Long-term Debt
On September 29, 2014, the Company entered into a Credit Agreement (the "Credit Agreement") with Wells Fargo Bank, National Association (Wells Fargo), together with the other lenders thereunder from time to time (collectively, the "Lenders"). The Credit Agreement provides the Company with $50,000 in the form of (i) a $25,000 secured revolving line of credit (the "Revolver"), with a $1,000
79
DTS, INC.
NOTES TO CONSOLIDATED FINANCIAL STATEMENTS (Continued)
(Amounts in thousands, except per share data)
Note 9—Long-term Debt (Continued)
sublimit for the issuance of letters of credit, and (ii) a $25,000 secured term loan (the "Term Loan"). In connection with the Credit Agreement, the Company borrowed $25,000 under the Term Loan and $5,000 under the Revolver, and repaid the $30,000 line of credit under the previously existing agreement with MUFG Union Bank, N.A. (formerly known as Union Bank, N.A.). The Revolver and Term Loan will be used to finance permitted acquisitions and for working capital and general corporate purposes. In the fourth quarter of 2014, the Company repaid $5,000 on the Term Loan, resulting in $20,000 remaining due under the Term Loan and $5,000 due under the Revolver as of December 31, 2014.
Amounts borrowed under the Credit Agreement bear interest, at the option of the Company, at either (i) LIBOR plus 1.0% or (ii) the higher of (a) the rate of interest most recently announced by Wells Fargo as its prime rate or (b) the Federal Funds Rate plus 0.50%. Pursuant to the Credit Agreement, the Company is required to pay an annual commitment fee on the unused portion of the Revolver of either (i) 0.20%, if an average minimum deposit equal to or greater than $10,000 is held in a Wells Fargo bank account, or (ii) 0.30% otherwise.
The Company's ability to borrow amounts under the Credit Agreement is conditioned upon its compliance with specified covenants, including certain financial covenants that require the Company to maintain a (i) minimum rolling four quarter adjusted EBITDA of $30,000 for each fiscal quarter ending prior to December 31, 2014, and $32,000 for each fiscal quarter ending after December 31, 2014; and (ii) minimum liquidity amount of $35,000. In addition, the Credit Agreement contains covenants that, among other things, restrict the Company's ability to dispose of property, enter into mergers, acquisitions or other business combination transactions, incur additional indebtedness, grant liens, pay dividends and make certain other restricted payments. The Company may pay dividends on its stock provided that after giving effect to any such dividend, the Company (i) is in pro forma compliance with the financial covenants described above, (ii) has a debt to adjusted EBITDA ratio not exceeding 1.25 to 1.00, (iii) retains cash and cash equivalents of not less than $40,000 and (iv) has not undergone an event of default.
The Credit Agreement contains customary events of default. All advances under the Revolver are due on September 29, 2017, or earlier in the event of a default. $5,000 of the principal amount of the Term Loan is due on October 1, 2015, and $1,250 of the principal amount is due in quarterly installments thereafter, with the remaining balance due on September 29, 2017. Upon the occurrence and during the continuance of an event of default, the Lenders may declare all outstanding amounts under the Revolver and the Term Loan immediately due and payable and may terminate commitments to make any additional advances thereunder.
In connection with the Credit Agreement, the Company and certain of its US subsidiaries entered into a security agreement with Wells Fargo pursuant to which the Company and certain of its US subsidiaries granted the Lenders a first priority perfected security interest in (i) all their respective current and later acquired tangible and intangible assets and certain current and future domestic subsidiaries and (ii) up to 65% of the stock of certain current and future foreign subsidiaries to secure amounts borrowed under the Credit Agreement.
80
DTS, INC.
NOTES TO CONSOLIDATED FINANCIAL STATEMENTS (Continued)
(Amounts in thousands, except per share data)
Note 10—Commitments and Contingencies
Office facilities and certain office equipment are leased under operating leases expiring in various years through 2029. Some leases contain renewal options and escalation clauses including increases in annual rents based upon increases in the consumer price index. Minimum future rental payments under non-cancelable operating leases are as follows:
Years Ending December 31,
|
|
|||
|---|---|---|---|---|
2015 |
$ | 2,267 | ||
2016 |
1,911 | |||
2017 |
1,066 | |||
2018 |
778 | |||
2019 |
650 | |||
2020 and thereafter |
1,279 | |||
| | | | | |
|
$ | 7,951 | ||
| | | | | |
| | | | | |
| | | | | |
Rent expense amounted to $2,388, $2,270, and $1,874 for the years ended December 31, 2014, 2013 and 2012, respectively.
Pursuant to the amended Phorus Asset Purchase Agreement, contingent consideration of up to $1,000 could be due and payable by the end of 2015. For additional information, refer to Notes 4 and 6, "Fair Value Measurements" and "Business Combinations", respectively.
As of December 31, 2014, the Company has accrued $1,000 of payments due under certain contractual rights arrangements. Additionally, under existing contractual rights arrangements, the Company may be obligated to pay up to approximately $6,700 over an estimated period of five years if certain milestones are achieved. Subsequent to December 31, 2014, the Company entered into an additional contractual rights arrangement under which the Company may be obligated to pay up to approximately $2,100 over an estimated period of five years if certain milestones are achieved.
During the year ended December 31, 2014, the Company implemented certain staffing changes to allow the Company to facilitate further investments in growth markets. In connection with these changes, the Company recorded severance and related costs of $1,799, of which $522 was unpaid as of December 31, 2014.
During its normal course of business, the Company has made certain indemnities, commitments and guarantees under which it may be required to make payments in relation to certain transactions. Those indemnities include intellectual property indemnities to the Company's customers in connection with the sale of its products and the licensing of its technology, indemnities for liabilities associated with the infringement of other parties' technology based upon the Company's products and technology, and indemnities to directors and officers of the Company to the maximum extent permitted under the laws of the State of Delaware. The duration of these indemnities, commitments and guarantees varies, and in certain cases, is indefinite. The majority of these indemnities, commitments and guarantees do not provide for any limitation of the maximum potential future payments that the Company could be obligated to make. To date, the Company has not been required to make any payments and has not recorded any liability for these indemnities, commitments and guarantees in the accompanying consolidated balance sheets. The Company does, however, accrue for losses for any known contingent
81
DTS, INC.
NOTES TO CONSOLIDATED FINANCIAL STATEMENTS (Continued)
(Amounts in thousands, except per share data)
Note 10—Commitments and Contingencies (Continued)
liability, including those that may arise from indemnification provisions, when future payment is probable.
In the normal course of business, the Company is subject to certain claims and litigation, including unasserted claims. The Company is of the opinion that, based on information presently available, the outcome of any such legal matters will not have a material adverse effect on the Company's consolidated financial statements.
Note 11—Income Taxes
US and foreign income (loss) before income taxes and details of the provision (benefit) for income taxes were:
| |
For the Years Ended December 31, |
|||||||||
|---|---|---|---|---|---|---|---|---|---|---|
| |
2014 | 2013 | 2012 | |||||||
US |
$ | 6,032 | $ | (18,019 | ) | $ | (22,498 | ) | ||
Foreign |
10,105 | 25,140 | 14,265 | |||||||
| | | | | | | | | | | |
Income (loss) before income taxes |
$ | 16,137 | $ | 7,121 | $ | (8,233 | ) | |||
| | | | | | | | | | | |
| | | | | | | | | | | |
| | | | | | | | | | | |
Current: |
||||||||||
Federal |
$ | 498 | $ | (1,135 | ) | $ | (2,289 | ) | ||
State |
(918 | ) | 19 | (1,080 | ) | |||||
Foreign |
4,154 | 7,331 | 5,642 | |||||||
| | | | | | | | | | | |
Total current |
3,734 | 6,215 | 2,273 | |||||||
| | | | | | | | | | | |
Deferred: |
||||||||||
Federal |
(15,127 | ) | (13,301 | ) | 2,974 | |||||
State |
568 | (1,133 | ) | 971 | ||||||
Foreign |
(181 | ) | (415 | ) | 1,447 | |||||
| | | | | | | | | | | |
Total deferred |
(14,740 | ) | (14,849 | ) | 5,392 | |||||
| | | | | | | | | | | |
Provision (benefit) for income taxes |
$ | (11,006 | ) | $ | (8,634 | ) | $ | 7,665 | ||
| | | | | | | | | | | |
| | | | | | | | | | | |
| | | | | | | | | | | |
82
DTS, INC.
NOTES TO CONSOLIDATED FINANCIAL STATEMENTS (Continued)
(Amounts in thousands, except per share data)
Note 11—Income Taxes (Continued)
The components of temporary differences that gave rise to deferred income taxes were:
| |
As of December 31, | ||||||
|---|---|---|---|---|---|---|---|
| |
2014 | 2013 | |||||
Deferred tax assets: |
|||||||
Accrued revenues |
$ | 7,899 | $ | 1,496 | |||
Net operating loss carryforwards |
559 | 5,364 | |||||
Credit carryforwards, net of unrecognized tax benefits |
14,418 | 13,800 | |||||
Depreciation and amortization |
933 | 1,737 | |||||
Stock-based compensation |
8,893 | 8,026 | |||||
Accruals, reserves and other |
2,084 | 1,236 | |||||
Acquired intangibles |
17,424 | 2,551 | |||||
| | | | | | | | |
Total gross deferred tax assets |
52,210 | 34,210 | |||||
Valuation allowance |
(494 | ) | (579 | ) | |||
| | | | | | | | |
Total deferred tax assets |
51,716 | 33,631 | |||||
| | | | | | | | |
Deferred tax liabilities: |
|||||||
Acquired intangibles |
13,410 | 16,130 | |||||
Prepaid expenses |
35 | 47 | |||||
| | | | | | | | |
Total deferred tax liabilities |
13,445 | 16,177 | |||||
| | | | | | | | |
Deferred tax assets, net |
$ | 38,271 | $ | 17,454 | |||
| | | | | | | | |
| | | | | | | | |
| | | | | | | | |
Current deferred tax assets, net |
$ | 12,095 | $ | 5,787 | |||
Non-current deferred tax assets, net |
26,176 | 11,667 | |||||
| | | | | | | | |
Deferred tax assets, net |
$ | 38,271 | $ | 17,454 | |||
| | | | | | | | |
| | | | | | | | |
| | | | | | | | |
The Company regularly evaluates the need for a valuation allowance against its deferred tax assets. In 2012, the Company's US operations had moved to a position of cumulative loss for the then most recent three-year period. As such, as of December 31, 2012, the Company established a valuation allowance against its US federal deferred tax assets as a result of determining that it was more likely than not that its deferred tax assets would not be realized.
During the fourth quarter of 2013, the Company substantially completed a tax planning strategy which the Company believed would generate sufficient US taxable income to make it more likely than not that its net US federal deferred tax assets would be realized. The strategy included a special one-time transfer of certain Japan and Taiwan intellectual property licensing rights that was transacted on January 1, 2014, creating US taxable income. As of the transfer date, the US has a right to share in future royalty income from customers in Japan and Taiwan, in addition to royalty income from customers in the US. The transaction did not result in a change in the Company's accumulated reinvested earnings in its foreign subsidiaries, and did not affect the Company's status of being permanently reinvested in its foreign subsidiaries. As a result of the US taxable income created by this strategy, the Company concluded that it was more likely than not that the valuation allowance on US federal deferred tax assets was no longer necessary. Accordingly, the Company released all of the
83
DTS, INC.
NOTES TO CONSOLIDATED FINANCIAL STATEMENTS (Continued)
(Amounts in thousands, except per share data)
Note 11—Income Taxes (Continued)
US federal valuation allowance against net US federal deferred tax assets resulting in a $7,919 increase in the benefit for income taxes for the year ended December 31, 2013.
As of December 31, 2014, the Company believes it is more likely than not that its future taxable income will be sufficient to realize all of its deferred tax assets, with the exception of its foreign net operating losses incurred by the Company's subsidiary in the United Kingdom.
Since the intellectual property rights transfer did not result in a change in the Company's accumulated reinvested earnings in its foreign subsidiaries, no deferred tax liability was recorded for the year ended December 31, 2013. For the year ended December 31, 2014, the net impact of the taxable intellectual property rights transfer was a tax benefit, as a result of the related foreign tax credits and future tax deductions available under Section 197 of the Internal Revenue Code (IRC).
As of December 31, 2014, the Company had approximately $1,601 and $14,420 in federal and state tax loss carryforwards which begin to expire in 2032 and 2018, respectively. Included in these loss carryforwards are stock-based compensation deductions that, when fully utilized, reduce cash income taxes and will result in a financial statement income tax benefit of $948. The future income tax benefit, if realized, will be recorded to additional paid-in capital on the consolidated balance sheet. The Company follows the with-and-without approach for determining when the stock-based compensation deductions are considered realized. As of December 31, 2014, the Company had federal foreign tax credit carryforwards of $10,999 and federal R&D and other tax credit carryforwards of $2,056, which begin to expire in 2019. In addition, the Company had state R&D tax credit carryforwards of $2,801, which do not expire. Utilization of certain credit carryforwards are subject to an annual limitation under IRC Section 382.
The income tax provision (benefit) excludes the current year income tax deductions related to the issuance of common stock from the exercise of stock options for which no compensation expense was recorded for financial statement purposes or for which the income tax deduction exceeded the expense recorded in the financial statements.
84
DTS, INC.
NOTES TO CONSOLIDATED FINANCIAL STATEMENTS (Continued)
(Amounts in thousands, except per share data)
Note 11—Income Taxes (Continued)
The provision (benefit) for income taxes differs from the amount obtained by applying the federal statutory income tax rate to income (loss) before income taxes as follows:
| |
For the Years Ended December 31, |
|||||||||
|---|---|---|---|---|---|---|---|---|---|---|
| |
2014 | 2013 | 2012 | |||||||
Statutory federal rate |
35.0 | % | 35.0 | % | 35.0 | % | ||||
State income taxes, net |
(0.6 | ) | (5.5 | ) | (2.1 | ) | ||||
Effect of varying foreign rates |
(15.5 | ) | (96.5 | ) | 50.1 | |||||
Foreign withholding taxes |
20.9 | 78.8 | (60.2 | ) | ||||||
Unremitted earnings of foreign subsidiary |
— | (3.4 | ) | (9.7 | ) | |||||
Foreign IP transfer to US |
147.4 | — | — | |||||||
Amortization of acquired foreign intangibles |
(103.5 | ) | — | — | ||||||
Non-deductible meals and entertainment |
0.4 | 1.0 | (0.6 | ) | ||||||
Stock-based compensation expense |
5.1 | 7.0 | (7.6 | ) | ||||||
Foreign tax credits |
(131.4 | ) | — | — | ||||||
Research and development credits |
(4.5 | ) | (11.9 | ) | — | |||||
Domestic production activities deduction |
(2.5 | ) | — | — | ||||||
Unrecognized tax benefits |
6.6 | 8.0 | 38.3 | |||||||
Tax audit settlements |
(20.6 | ) | (11.6 | ) | (108.9 | ) | ||||
Deferred tax asset adjustment |
(2.0 | ) | (12.0 | ) | 3.6 | |||||
Prepaid income taxes |
(4.2 | ) | — | — | ||||||
Valuation allowance |
— | (111.2 | ) | (16.4 | ) | |||||
Other |
1.2 | 1.1 | (14.6 | ) | ||||||
| | | | | | | | | | | |
Effective tax rate |
(68.2 | )% | (121.2 | )% | (93.1 | )% | ||||
| | | | | | | | | | | |
| | | | | | | | | | | |
| | | | | | | | | | | |
The effective tax rate for the year ended December 31, 2014 differed from the US statutory rate largely due to the net tax benefit of $12,612 associated with the transfer of intellectual property licensing rights on January 1, 2014, which allowed the Company to utilize certain foreign taxes paid as credits in the US, and to amortize the Company's basis in the intellectual property over 15 years for tax purposes.
The Company has not provided for US income taxes or foreign withholding taxes in its effective tax rate on approximately $72,289 of undistributed earnings of foreign subsidiaries as of December 31, 2014. It is not practicable to calculate the unrecognized deferred tax liability on the unremitted earnings. The Company intends to reinvest these earnings indefinitely in operations outside of the US, and accordingly, no deferred tax liability has been established relative to these earnings.
As of December 31, 2014 and 2013, the Company's uncertain tax positions were $11,246 and $9,701, respectively, of which $9,194 and $1,713, respectively, were recorded in other long-term liabilities. The remaining amounts were recorded as a reduction to non-current deferred tax assets. These amounts include $136 and $121, respectively, for accrued interest. The increase in unrecognized tax benefits during the year ended December 31, 2014 was primarily attributable to uncertain tax positions relating to foreign tax credits and transfer pricing positions taken with respect to the Company's foreign subsidiaries. The settlement of the 2009 to 2011 US federal tax audit with the
85
DTS, INC.
NOTES TO CONSOLIDATED FINANCIAL STATEMENTS (Continued)
(Amounts in thousands, except per share data)
Note 11—Income Taxes (Continued)
Internal Revenue Service (IRS) in 2014 had no material impact on the Company's unrecognized tax benefits. These unrecognized tax benefits would affect the Company's effective tax rate if recognized. The Company believes that it has adequately provided for all tax positions based on its assessment of many factors, including past experience and interpretations of tax law applied to the facts of each matter. However, due to inherent uncertainties in estimating accruals for uncertain tax positions, amounts asserted by tax authorities could be materially different than the amounts accrued by the Company. Accordingly, the Company's provision on federal, state and foreign tax-related matters to be recorded in the future may change as revised estimates are made or the underlying matters are settled or otherwise resolved. As of December 31, 2014, the Company does not believe that its estimates, as otherwise provided for, on such tax positions will significantly increase or decrease within the next twelve months.
The following is a reconciliation of the gross unrecognized tax benefits:
| |
Unrecognized Tax Benefits |
|||
|---|---|---|---|---|
Balance at January 1, 2012 |
$ | 7,263 | ||
Additions for tax positions of prior years |
6,868 | |||
Additions for tax positions of the current year |
427 | |||
Settlements |
(3,501 | ) | ||
| | | | | |
Balance at December 31, 2012 |
11,057 | |||
Additions for tax positions of prior years |
100 | |||
Additions for tax positions of the current year |
804 | |||
Settlements |
(2,135 | ) | ||
Lapse of applicable statutes |
(246 | ) | ||
| | | | | |
Balance at December 31, 2013 |
9,580 | |||
Additions for tax positions of prior years |
876 | |||
Additions for tax positions of the current year |
919 | |||
Lapse of applicable statutes |
(265 | ) | ||
| | | | | |
Balance at December 31, 2014 |
$ | 11,110 | ||
| | | | | |
| | | | | |
| | | | | |
The Company may, from time to time, be assessed interest or penalties by major tax jurisdictions, although any such assessments historically have been minimal and immaterial to the Company's consolidated financial statements.
The Company, or one of its subsidiaries, files income tax returns in the US and other foreign jurisdictions. With few exceptions, the Company is no longer subject to US federal income tax examinations by the IRS for the years prior to 2012. The California Franchise Tax Board (FTB) is conducting a state tax examination for the years 2009 and 2010, including certain prior period carryforwards. Significant judgment is required in determining the consolidated provision for income taxes as the Company considers its worldwide taxable earnings and the impact of the audit process conducted by various tax authorities. The final outcome of tax audits by various foreign jurisdictions, the IRS, the FTB, and various state governments could differ materially from that recorded in the consolidated financial statements.
86
DTS, INC.
NOTES TO CONSOLIDATED FINANCIAL STATEMENTS (Continued)
(Amounts in thousands, except per share data)
Note 12—Stock-Based Compensation
The Company measures and recognizes compensation expense on a straight-line basis over the requisite service period for all share-based payment awards made to employees and directors in the consolidated financial statements.
Stock-based compensation costs and related income tax benefits were:
| |
For the Years Ended December 31, |
|||||||||
|---|---|---|---|---|---|---|---|---|---|---|
| |
2014 | 2013 | 2012 | |||||||
Stock-based compensation cost: |
||||||||||
Selling, general and administrative |
$ | 7,819 | $ | 8,872 | $ | 8,940 | ||||
Research and development |
2,673 | 2,855 | 2,376 | |||||||
| | | | | | | | | | | |
Total stock-based compensation cost |
$ | 10,492 | $ | 11,727 | $ | 11,316 | ||||
| | | | | | | | | | | |
| | | | | | | | | | | |
| | | | | | | | | | | |
Income tax benefit |
$ | 3,070 | $ | 4,779 | $ | 4,611 | ||||
| | | | | | | | | | | |
| | | | | | | | | | | |
| | | | | | | | | | | |
Stock Plans
In April 2003, the Company adopted the 2003 Equity Incentive Plan (the "2003 Plan") under which a total of 3,000 shares were authorized for future issuances of common stock. The 2003 Plan contained a provision for an automatic increase in the number of shares available for grant starting January 1, 2004 and each January thereafter until and including January 1, 2013, subject to certain limitations, by a number of shares equal to the lesser of: (i) four percent of the number of shares issued and outstanding on the immediately preceding December 31, (ii) 1,500 shares, or (iii) a number of shares set by the Board of Directors.
In May 2012, the Company adopted the 2012 Equity Incentive Plan (the "2012 Plan"). The shares available for issuances of common stock under the 2003 Plan were transferred to the 2012 Plan for future issuances of common stock. The total number of shares of common stock that may be issued under the 2012 Plan amounted to a maximum of 1,500.
In conjunction with the acquisition of SRS, the Company also acquired SRS' 2006 Stock Incentive Plan (the "2006 Plan") under which 234 shares were authorized for future issuances of common stock to: (i) former employees of SRS, and (ii) employees hired by the Company after the acquisition date of SRS, July 20, 2012. At the acquisition date of SRS, all outstanding equity awards under the 2006 Plan were tendered for cash.
In August 2014, the Company's Board of Directors adopted the DTS, Inc. 2014 New Employee Incentive Plan (the "2014 Plan") without stockholder approval pursuant to Rule 5635(c)(4) of the NASDAQ Listing Rules, and reserved 50 shares of common stock for issuance pursuant to the grant of stock-based awards under this plan.
Options granted under all the plans may be non-qualified options. Furthermore, options granted under all the plans other than the 2014 Plan may be incentive stock options intended to satisfy the requirements of Section 422 of the IRC and the regulations thereunder. Options generally become exercisable over a four-year period and expire in ten years. Restricted stock units granted under the plans generally vest over a four-year period.
87
DTS, INC.
NOTES TO CONSOLIDATED FINANCIAL STATEMENTS (Continued)
(Amounts in thousands, except per share data)
Note 12—Stock-Based Compensation (Continued)
Stock Options
The fair value of each option grant was estimated on the date of the grant using the Black-Scholes option pricing model with the following weighted average key assumptions:
| |
Years Ended December 31, |
|||||||||
|---|---|---|---|---|---|---|---|---|---|---|
| |
2014 | 2013 | 2012 | |||||||
Risk free interest rate |
1.1 | % | 0.7 | % | 0.6 | % | ||||
Expected lives (years) |
4.3 | 4.2 | 4.0 | |||||||
Dividend yield |
0 | % | 0 | % | 0 | % | ||||
Expected volatility |
43 | % | 44 | % | 49 | % | ||||
The risk-free interest rate was the average interest rate of US government bonds of comparable term to the options on the dates of the option grants. The expected life of the options granted was derived from the historical activity of the Company's options and represented the period of time that options granted were expected to be outstanding. The dividend yield was not calculated because the Company does not currently expect to pay a dividend. The expected volatility was based on the historical volatility of the Company's common stock.
The following summarizes stock option activity:
| |
Number of options |
Weighted- Average Exercise Price |
Weighted- Average Remaining Contractual Life (Years) |
Aggregate Intrinsic Value |
|||||||||
|---|---|---|---|---|---|---|---|---|---|---|---|---|---|
Options outstanding at December 31, 2013 |
3,319 | $ | 24.68 | ||||||||||
Granted |
439 | 21.07 | |||||||||||
Exercised |
(206 | ) | 21.76 | ||||||||||
Forfeited |
(65 | ) | 21.66 | ||||||||||
Expired |
(174 | ) | 26.91 | ||||||||||
| | | | | | | | | | | | | | |
Options outstanding at December 31, 2014 |
3,313 | $ | 24.33 | 6.2 | $ | 25,319 | |||||||
| | | | | | | | | | | | | | |
| | | | | | | | | | | | | | |
| | | | | | | | | | | | | | |
Options exercisable at December 31, 2014 |
1,972 | $ | 24.89 | 4.8 | $ | 14,656 | |||||||
| | | | | | | | | | | | | | |
| | | | | | | | | | | | | | |
| | | | | | | | | | | | | | |
Options vested and expected to vest at December 31, 2014 |
3,289 | $ | 24.34 | 6.2 | $ | 25,081 | |||||||
| | | | | | | | | | | | | | |
| | | | | | | | | | | | | | |
| | | | | | | | | | | | | | |
There were 439, 724, and 924 options granted during the years ended December 31, 2014, 2013 and 2012, respectively. The weighted-average grant-date fair value of options granted during the years ended December 31, 2014, 2013 and 2012 was $7.66, $7.24, and $10.25, respectively. The aggregate intrinsic value of options exercised during the years ended December 31, 2014, 2013 and 2012 was $1,438, $152, and $1,399, respectively.
Compensation expense for stock options was $5,040, $5,507, and $5,153 for the years ended December 31, 2014, 2013 and 2012, respectively. As of December 31, 2014, total remaining unrecognized compensation expense related to unvested stock options was approximately $7,629, which will be amortized over the weighted-average remaining service period of 1.6 years.
88
DTS, INC.
NOTES TO CONSOLIDATED FINANCIAL STATEMENTS (Continued)
(Amounts in thousands, except per share data)
Note 12—Stock-Based Compensation (Continued)
Restricted Stock
The following summarizes restricted stock activity:
| |
Number of Shares |
Weighted- Average Grant-Date Fair Value |
|||||
|---|---|---|---|---|---|---|---|
Unvested stock at December 31, 2013 |
306 | $ | 26.14 | ||||
Granted |
358 | 20.54 | |||||
Vested |
(130 | ) | 26.81 | ||||
Forfeited |
(46 | ) | 22.12 | ||||
| | | | | | | | |
Unvested stock at December 31, 2014 |
488 | $ | 22.27 | ||||
| | | | | | | | |
| | | | | | | | |
| | | | | | | | |
The weighted-average grant-date fair value of restricted stock granted during the years ended December 31, 2014, 2013 and 2012 was $20.54, $19.95 and $25.92, respectively.
Compensation expense on restricted stock awards and units was $3,902, $3,529, and $3,669 for the years ended December 31, 2014, 2013 and 2012, respectively. As of December 31, 2014, total remaining unrecognized compensation expense related to restricted stock was $7,692, which will be amortized over the weighted-average remaining service period of 1.8 years.
Market Stock Units
On February 27, 2011, the Compensation Committee of the Board of Directors of the Company approved market stock unit agreements ("MSU Agreements") for the grant of certain performance-based equity awards under the Company's 2003 Plan. Pursuant to the MSU Agreements, units payable in shares of common stock would vest based on the attainment of certain performance criteria regarding both the Company's total shareholder return and the performance of the Company as measured against the performance of the NASDAQ Composite Total Return Index over a 3-year performance period from January 1, 2011 to December 31, 2013. The Company granted 199 units on February 27, 2011, which had an aggregate grant-date fair value of $5,287, which was measured on the date of grant using the Monte Carlo simulation model. The aggregate grant-date fair value for these awards was recognized as compensation expense on a straight-line basis over the requisite service period, which began on the date of grant and ended on December 31, 2013. Compensation expense on shares of market stock units was $1,820, and $1,826 for the years ended December 31, 2013 and 2012, respectively. As of December 31, 2013, the performance criteria were not met and the units automatically expired.
89
DTS, INC.
NOTES TO CONSOLIDATED FINANCIAL STATEMENTS (Continued)
(Amounts in thousands, except per share data)
Note 12—Stock-Based Compensation (Continued)
Performance-Based Restricted Stock Units (PSUs)
On March 13, 2014, the Compensation Committee of the Board of Directors granted 134 PSUs to certain employees under the 2012 Plan. The PSUs will vest in two equal installments upon achievement of certain internal performance goals, with one-half vesting on February 15, 2016 and the remaining vesting on February 15, 2017, in each case assuming the specified performance goals are achieved and the service conditions are met. The performance goals will be measured as of December 31, 2015. Each PSU represents the contingent right to receive between zero and two shares of the Company's common stock upon vesting, subject to the level of achievement of the specified performance goals. Any portion of the PSUs that do not vest due to performance below the minimum required level for vesting will be forfeited.
The PSUs had a grant-date fair value of $20.37 per PSU. The related compensation expense is calculated using the number of shares of common stock expected to vest based on the probability and estimated level of achievement of the performance goals. Compensation expense is recognized over the requisite service period, and will be adjusted in subsequent reporting periods if the assessed probability or estimated level of achievement of the performance goals changes.
For the year ended December 31, 2014, compensation expense for PSUs was $578. As of December 31, 2014, total remaining unrecognized compensation expense related to PSUs was estimated to be $1,110, which will be amortized over the weighted-average remaining service period of 1.7 years.
Considerable judgment is required in assessing the probability and estimated level of achievement of the performance goals. Accordingly, use of different assumptions or estimates could result in materially different compensation expense.
Employee Stock Purchase Plan
On April 17, 2003, the Company adopted the 2003 Employee Stock Purchase Plan and the 2003 Foreign Subsidiary Employee Stock Purchase Plan, under which, subject to certain limitations, the initial aggregate number of shares of stock that may be issued is 500, with a provision that provides for an automatic increase in the number of shares available for issuance on January 1, 2004 and each January 1 thereafter until and including January 1, 2013 by the lesser of: (i) 500 shares, (ii) one percent of the number of shares of all classes of common stock of the Company outstanding on that date, or (iii) a lesser amount determined by the Board of Directors.
On November 13, 2012, the Company adopted the 2013 Employee Stock Purchase Plan and the 2013 Foreign Subsidiary Employee Stock Purchase Plan (collectively "ESPP"). Both plans were approved by the stockholders of the Company at the annual meeting on June 6, 2013. Subject to certain limitations, the aggregate number of shares of stock that may be issued under both plans is 750. Under the ESPP, each eligible employee may authorize payroll deductions of up to 15% of their compensation to purchase shares of the Company's common stock on two purchase dates during the second and fourth quarter of each year. Each offering period has a 24-month duration with purchase periods of six month intervals. The purchase price per share for the common stock is equal to 85% of the lower of the closing market price per share of the Company's common stock on (i) the participant's entry date into the two-year offering period, or (ii) the end of each six-month purchase period within the offering period. The ESPP has a two-year look-back feature, whereby the offering period resets if
90
DTS, INC.
NOTES TO CONSOLIDATED FINANCIAL STATEMENTS (Continued)
(Amounts in thousands, except per share data)
Note 12—Stock-Based Compensation (Continued)
the fair value of the Company's common stock on the first day of any purchase period is less than that on the original offering date. Each eligible employee's purchases are subject to a maximum of $25 in fair market value in any calendar year or 2.5 shares on any single purchase date.
The fair values for ESPP were estimated at the date of grant using the Black-Scholes option pricing model with the following weighted average key assumptions:
| |
Years Ended December 31, |
|||||||||
|---|---|---|---|---|---|---|---|---|---|---|
| |
2014 | 2013 | 2012 | |||||||
Risk free interest rate |
0.1 | % | 0.2 | % | 0.2 | % | ||||
Expected lives (years) |
1.2 | 1.2 | 0.7 | |||||||
Dividend yield |
0 | % | 0 | % | 0 | % | ||||
Expected volatility |
39 | % | 52 | % | 61 | % | ||||
The risk-free interest rate was the average interest rate of US government bonds of comparable term to the expected life. The expected life represents the estimated length of each offering period. The dividend yield was not calculated because the Company does not currently expect to pay a dividend. The expected volatility was based on the historical volatility of the Company's common stock.
Compensation expense under the ESPP was $972, $871, and $668 for the years ended December 31, 2014, 2013 and 2012, respectively.
Note 13—Defined Contribution Plan
The Company has savings and investment plans, including a savings plan that qualifies as a defined contribution plan under Section 401(k) of the IRC. The Company allows eligible employees to allocate up to 100% of the participant's eligible compensation through payroll deductions. All regular full time employees on the US payroll of the Company are eligible to participate in the plan. The Company provides a discretionary match of up to 100% of the first 4% of salary contributed to the plan and may match up to 6% of salary if certain financial targets are met. In 2010, the Company adopted a Roth 401(k) option. For the years ended December 31, 2014, 2013 and 2012, the costs of the Company's matching contributions were $1,100, $859, and $656, respectively.
Note 14—Common Stock Repurchases
In February 2012, the Company's Board of Directors authorized, subject to certain business and market conditions, the purchase of up to 2,000 shares of the Company's common stock in the open market or in privately negotiated transactions. Through the fourth quarter of 2013, the Company repurchased all shares of its common stock under this authorization for an aggregate of $39,374.
In February 2014, the Company's Board of Directors authorized, subject to certain business and market conditions, the purchase of up to 2,000 shares of the Company's common stock in the open market or in privately negotiated transactions. As of December 31, 2014, the Company had repurchased 374 shares of common stock under this authorization for an aggregate of $7,495.
All shares repurchased under these authorizations were accounted for as treasury stock.
91
DTS, INC.
NOTES TO CONSOLIDATED FINANCIAL STATEMENTS (Continued)
(Amounts in thousands, except per share data)
Note 15—Segment and Geographic Information
The Company operates as a single reportable segment on an enterprise-wide basis. The Company primarily generates revenue by licensing its technologies to consumer electronics manufacturers.
Revenue by geographical area, based on the customer's country of domicile, was:
| |
For the Years Ended December 31, | |||||||||
|---|---|---|---|---|---|---|---|---|---|---|
| |
2014 | 2013 | 2012 | |||||||
US |
$ | 21,227 | $ | 12,998 | $ | 11,693 | ||||
Japan |
57,156 |
42,256 |
41,203 |
|||||||
South Korea |
33,952 | 45,051 | 27,110 | |||||||
China |
16,126 | 12,690 | 7,395 | |||||||
Other international |
15,452 | 12,153 | 13,248 | |||||||
| | | | | | | | | | | |
Total international |
122,686 | 112,150 | 88,956 | |||||||
| | | | | | | | | | | |
Total revenues |
$ | 143,913 | $ | 125,148 | $ | 100,649 | ||||
| | | | | | | | | | | |
| | | | | | | | | | | |
| | | | | | | | | | | |
Long-lived tangible assets, net of accumulated depreciation, by geographic region were:
| |
As of December 31, | ||||||
|---|---|---|---|---|---|---|---|
| |
2014 | 2013 | |||||
US |
$ | 25,494 | $ | 27,979 | |||
International |
1,595 | 2,137 | |||||
| | | | | | | | |
Total long-lived tangible assets, net of accumulated depreciation |
$ | 27,089 | $ | 30,116 | |||
| | | | | | | | |
| | | | | | | | |
| | | | | | | | |
Note 16—Net Income (Loss) Per Share
Basic net income (loss) per common share is calculated by dividing net income (loss) by the weighted average number of common shares outstanding during the period. Diluted net income per common share is calculated by dividing net income (loss) by the sum of the weighted average number of common shares outstanding plus the dilutive effect of any outstanding stock options, unvested restricted stock, any unvested PSUs for which the performance conditions have been satisfied at the reporting date, and ESPP using the treasury stock method. Due to the net loss for the year ended December 31, 2012, all potential common shares are excluded from the diluted shares outstanding for that period.
92
DTS, INC.
NOTES TO CONSOLIDATED FINANCIAL STATEMENTS (Continued)
(Amounts in thousands, except per share data)
Note 16—Net Income (Loss) Per Share (Continued)
The computation of basic and diluted net income (loss) per share was:
| |
For the Years Ended December 31, | |||||||||
|---|---|---|---|---|---|---|---|---|---|---|
| |
2014 | 2013 | 2012 | |||||||
Numerator: |
||||||||||
Net income (loss) |
$ | 27,143 | $ | 15,755 | $ | (15,898 | ) | |||
| | | | | | | | | | | |
| | | | | | | | | | | |
| | | | | | | | | | | |
Denominator: |
||||||||||
Weighted average shares outstanding |
17,180 | 18,097 | 17,466 | |||||||
Effect of dilutive securities: |
||||||||||
Common stock options |
267 | 153 | — | |||||||
Restricted stock |
95 | 67 | — | |||||||
ESPP |
19 | 17 | — | |||||||
| | | | | | | | | | | |
Diluted shares outstanding |
17,561 | 18,334 | 17,466 | |||||||
| | | | | | | | | | | |
| | | | | | | | | | | |
| | | | | | | | | | | |
Basic net income (loss) per common share |
$ | 1.58 | $ | 0.87 | $ | (0.91 | ) | |||
| | | | | | | | | | | |
| | | | | | | | | | | |
| | | | | | | | | | | |
Diluted net income (loss) per common share |
$ | 1.55 | $ | 0.86 | $ | (0.91 | ) | |||
| | | | | | | | | | | |
| | | | | | | | | | | |
| | | | | | | | | | | |
Anti-dilutive shares excluded from the determination of diluted net income (loss) per share |
2,331 | 3,163 | 2,697 | |||||||
| | | | | | | | | | | |
| | | | | | | | | | | |
| | | | | | | | | | | |
Note 17—Selected Quarterly Data (Unaudited)
| |
For the Quarter Ended | ||||||||||||
|---|---|---|---|---|---|---|---|---|---|---|---|---|---|
| |
Mar. 31, | June 30, | Sep. 30, | Dec. 31, | |||||||||
2014 |
|||||||||||||
Revenue |
$ | 36,835 | $ | 36,189 | $ | 35,676 | $ | 35,213 | |||||
Gross profit |
$ | 34,504 | $ | 33,729 | $ | 32,374 | $ | 32,211 | |||||
Net income |
$ |
14,311 |
(1) |
$ |
7,015 |
$ |
3,869 |
$ |
1,948 |
||||
Basic earnings per share |
$ | 0.83 | (1) | $ | 0.41 | $ | 0.23 | $ | 0.11 | ||||
Diluted earnings per share |
$ | 0.81 | (1) | $ | 0.41 | $ | 0.22 | $ | 0.11 | ||||
2013 |
|||||||||||||
Revenue |
$ | 32,728 | $ | 27,188 | $ | 28,159 | $ | 37,073 | |||||
Gross profit |
$ | 30,406 | $ | 24,776 | $ | 25,726 | $ | 34,452 | |||||
Net income (loss) |
$ |
(1,532 |
) |
$ |
(2,027 |
) |
$ |
1,988 |
(2) |
$ |
17,326 |
(3) |
|
Basic earnings (loss) per share |
$ | (0.08 | ) | $ | (0.11 | ) | $ | 0.11 | $ | 0.98 | |||
Diluted earnings (loss) per share |
$ | (0.08 | ) | $ | (0.11 | ) | $ | 0.11 | $ | 0.96 | |||
- (1)
- Reflects restated amounts correcting an understatement of income tax benefit relating to the Company's special one-time transfer of certain Japan and Taiwan intellectual property licensing rights to the US on January 1, 2014. Refer to the amended Quarterly Report on Form 10-Q/A for the quarter ended March 31, 2014.
93
DTS, INC.
NOTES TO CONSOLIDATED FINANCIAL STATEMENTS (Continued)
(Amounts in thousands, except per share data)
Note 17—Selected Quarterly Data (Unaudited) (Continued)
- (2)
- Includes
an impairment charge of $2,820 relating to certain intangibles (refer to Note 7, "Goodwill and Other Intangibles"). Also, includes a gain of
$5,300 recorded within operating expenses relating to changes in the fair value of contingent consideration.
- (3)
- Includes a $7,919 tax benefit as a result of a release of the valuation allowance on US federal deferred tax assets (refer to Note 11, "Income Taxes"). Also, includes a gain of $700 recorded within operating expenses relating to changes in the fair value of contingent consideration.
94
SCHEDULE II—VALUATION AND QUALIFYING ACCOUNTS
(Amounts in thousands)
For the Years Ended December 31,
|
Balance at Beginning of Year |
Charged to Costs and Other |
Deductions From Reserves |
Balance at End of Year |
|||||||||
|---|---|---|---|---|---|---|---|---|---|---|---|---|---|
Allowance for doubtful accounts:(1) |
|||||||||||||
2014 |
$ | 1,388 | $ | 29 | $ | 1,274 | $ | 143 | |||||
2013 |
$ | 679 | $ | 709 | $ | — | $ | 1,388 | |||||
2012 |
$ | 251 | $ | 460 | $ | 32 | $ | 679 | |||||
Deferred tax assets—valuation allowance:(2) |
|||||||||||||
2014 |
$ | 579 | $ | — | $ | 85 | $ | 494 | |||||
2013 |
$ | 8,702 | $ | — | $ | 8,123 | $ | 579 | |||||
2012 |
$ | 817 | $ | 7,885 | $ | — | $ | 8,702 | |||||
- (1)
- The
additions to the allowance for doubtful accounts represent the estimates of our bad debt expense based upon the factors for which we evaluate the
collectability of our accounts receivable, as well as recoveries of previously reserved receivables. Deductions are the actual write-offs of the receivables.
- (2)
- The additions to and reductions in the deferred tax assets—valuation allowance represent the portion of a deferred tax asset for which either: (i) it is more likely than not that a tax benefit will not be realized, or (ii) it is more likely than not a tax benefit will be realized.
95
Item 9. Changes in and Disagreements with Accountants on Accounting and Financial Disclosure
None.
Item 9A. Controls and Procedures
Disclosure Controls and Procedures
The Company's management is responsible for establishing and maintaining adequate internal control over financial reporting. As of the end of the period covered by this report, the Company's management with the participation of the Chief Executive Officer and Chief Financial Officer carried out an evaluation of the effectiveness of the Company's disclosure controls and procedures (as such term is defined in Rules 13a-15(e) and 15d-15(e) of the Exchange Act). Based upon this evaluation, the Company's Chief Executive Officer and Chief Financial Officer concluded that the Company's disclosure controls and procedures were not effective as of December 31, 2014 as a result of the material weakness described below.
Management's Report on Internal Control Over Financial Reporting
The Company's management is responsible for establishing and maintaining adequate internal control over financial reporting, as defined in Exchange Act Rules 13a-15(f) or 15d-15(f). The Company's internal control over financial reporting is designed to provide reasonable assurance regarding the reliability of financial reporting and the preparation of consolidated financial statements for external purposes, in accordance with generally accepted accounting principles, and includes policies and procedures that: (1) pertain to the maintenance of records that in reasonable detail accurately and fairly reflect the Company's transactions and dispositions of assets, (2) provide reasonable assurance that transactions are recorded as necessary to permit preparation of consolidated financial statements in accordance with generally accepted accounting principles, and that the Company's receipts and expenditures are being made only in accordance with authorizations of the Company's management and directors, and (3) provide reasonable assurance regarding prevention or timely detection of unauthorized acquisition, use or disposition of the Company's assets that could have a material effect on the consolidated financial statements.
The Company's management, with the participation of the Company's Chief Executive Officer and Chief Financial Officer, evaluated the effectiveness of our internal control over financial reporting as of December 31, 2014 based on the criteria set forth in the 2013 Internal Control—Integrated Framework issued by the Committee of Sponsoring Organizations of the Treadway Commission. Based on this evaluation, we concluded that the Company's internal control over financial reporting was not effective as of December 31, 2014 because a material weakness existed in the Company's internal control over financial reporting related to the accounting for income taxes, as further described below.
Material Weakness Related to Accounting for Income Taxes
As described in Item 9A in our Annual Report on Form 10-K for the year ended December 31, 2013 and Item 4 of our Quarterly Reports on Form 10-Q/A for the quarters ended March 31, 2014, June 30, 2014 and September 30, 2014, we had previously identified a material weakness in our internal control over financial reporting related to the inadequate design of internal controls over the accounting for income taxes.
During the audit for the year ended December 31, 2014, we determined that certain income tax benefits were understated by $8.7 million in the income tax provision for the first quarter of 2014. This was a result of a special one-time transfer of certain Japan and Taiwan intellectual property (IP) licensing rights to the US on January 1, 2014. Due to the complexity of this transaction, we engaged a team of accounting, tax and legal professionals with relevant expertise in global IP, legal and tax
96
structures. In particular, a leading global accounting firm was selected for its expertise in specific areas of international taxation to assist in the planning and execution of the transaction, as well as review of the quarterly and annual income tax provisions for 2014. During the audit of our income tax provision for the year ended December 31, 2014, it was discovered that certain foreign tax credits available to us had been inadvertently excluded from the first quarter income tax provision. This error resulted in a restatement of our interim 2014 financial statements for the periods ended March 31, 2014, June 30, 2014 and September 30, 2014.
As of December 31, 2014, we have identified a material weakness in our internal controls over financial reporting related to the accounting for income taxes; specifically, our controls around the review and monitoring of work performed by third party tax advisors were not designed properly.
Remediation Plan. We have initiated a plan to enhance our control procedures over the accounting for income taxes. During 2013, we took steps to remediate this material weakness by increasing the use of third party advisors with appropriate expertise to assist with the preparation and review of the quarterly and annual income tax provision. During 2014, we continued to utilize third party advisors with significant experience in domestic and multinational income taxes to assist with the preparation and review of the income tax provision. We will enhance our review and monitoring procedures when interacting with third party tax advisors that are assisting us in reviewing key elements of our income tax provision. This will include expanding our assessment of the adequacy of the scope of procedures performed by third party tax advisors and enhancing our review of significant assumptions used by the third party tax advisors.
Limitations on the Effectiveness of Controls
Because of its inherent limitations, internal control over financial reporting may not prevent or detect misstatements. Also, projections of any evaluation of effectiveness to future periods are subject to the risk that controls may become inadequate because of changes in conditions, or that the degree of compliance with the policies or procedures may deteriorate.
Attestation Report of the Registered Public Accounting Firm
The effectiveness of the Company's internal control over financial reporting as of December 31, 2014 has been audited by Deloitte and Touche LLP, an independent registered public accounting firm, as stated in their report, which is included in this Annual Report.
Remediation of Previous Material Weakness Related to Accounting for Revenue
As described in Item 9A in our Annual Report on Form 10-K for the year ended December 31, 2013 and Item 4 of our Quarterly Reports on Form 10-Q and 10-Q/A for the quarters ended March 31, 2014 and June 30, 2014, we identified a material weakness in internal control over financial reporting related to the inadequate design of internal controls over the accounting for revenue. Specifically, the Company's controls over the evaluation of non-standard financial terms and conditions contained in certain of the Company's license agreements were not effective to ensure that revenue under these agreements was sufficiently identified, analyzed and recorded. Although this deficiency did not lead to material adjustments to revenue, management determined that deficiencies in the control processes in its accounting for revenue under such license agreements, in the aggregate, constituted a material weakness because this control deficiency could have resulted in a material misstatement of revenue. We took steps to remediate this material weakness by enhancing our control procedures with respect to identification and review of revenue under license agreements with non-standard financial terms including additional analysis of our license agreements to evaluate the non-standard financial terms, performance of additional accounting research and detailed checklists to ensure that all agreements with non-standard financial terms are sufficiently identified and evaluated, and revenue is properly
97
recognized. Based on the testing of our enhanced controls, management determined that, as of September 30, 2014, our controls over the accounting for revenue under license agreements with non-standard financial terms were adequate and that the implementation of the additional control procedures fully remediated this material weakness.
Changes in Internal Control Over Financial Reporting
Other than as described above, there have been no changes in our internal control over financial reporting during the quarter ended December 31, 2014 that have materially affected, or are reasonably likely to materially affect, our internal control over financial reporting.
None.
98
Item 10. Directors, Executive Officers and Corporate Governance
The information concerning our executive officers to be included under the caption "Executive Officers" in our proxy statement relating to our 2015 annual meeting of stockholders to be filed by us with the Securities and Exchange Commission no later than 120 days after the close of our fiscal year ended December 31, 2014 (the "Proxy Statement") is incorporated herein by reference.
The information concerning our directors to be included in the Proxy Statement under the caption "Election of Directors" is incorporated herein by reference.
The information to be included in the Proxy Statement under the caption "Section 16(a) Beneficial Ownership Reporting Compliance" is incorporated herein by reference.
The information concerning our code of ethics and code of conduct to be included in the Proxy Statement under the caption "Governance of the Company" is incorporated herein by reference.
Item 11. Executive Compensation
The information to be included in the Proxy Statement under the captions "Executive Compensation and Related Information," "Compensation Discussion and Analysis," "Compensation of Directors" and "Report of the Compensation Committee" is incorporated herein by reference.
Item 12. Security Ownership of Certain Beneficial Owners and Management and Related Stockholder Matters
The information to be included in the Proxy Statement under the captions "Equity Compensation Plan Information" and "Security Ownership of Certain Beneficial Owners and Management" is incorporated herein by reference.
Item 13. Certain Relationships and Related Transactions, and Director Independence
The information concerning certain relationships and related transactions to be included in the Proxy Statement under the caption "Certain Relationships and Related Transactions" is incorporated herein by reference. The information concerning director independence to be included in the Proxy Statement under the caption "Governance of the Company" is incorporated herein by reference.
Item 14. Principal Accountant Fees and Services
The information concerning principal accounting fees and services to be included in the Proxy Statement under the caption "Ratification of Independent Registered Public Accountants" is incorporated herein by reference.
Item 15. Exhibits and Financial Statement Schedules
Financial statements and schedules required by this Item are included in Item 8 of Part II of this report.
Refer to the "Exhibit Index" immediately following the signature page, which is incorporated herein by reference.
99
Pursuant to the requirements of Section 13 or 15(d) of the Securities Exchange Act of 1934, the registrant has duly caused this report to be signed on its behalf by the undersigned, thereunto duly authorized, on this 16th day of March, 2015.
| DTS, INC. | ||||
By: |
/s/ JON E. KIRCHNER Jon E. Kirchner Chairman and Chief Executive Officer |
|||
Pursuant to the requirements of the Securities Exchange Act of 1934, this report has been signed below by the following persons on behalf of the registrant and in the capacities and on the dates indicated.
Signature
|
Title(s)
|
Date
|
||
|---|---|---|---|---|
| /s/ JON E. KIRCHNER Jon E. Kirchner |
Chairman, Chief Executive Officer, and Director (principal executive officer) | March 16, 2015 | ||
/s/ MELVIN L. FLANIGAN Melvin L. Flanigan |
Executive Vice President, Finance and Chief Financial Officer (principal financial and accounting officer) |
March 16, 2015 |
||
/s/ CRAIG S. ANDREWS Craig S. Andrews |
Lead Independent Director |
March 16, 2015 |
||
/s/ L. GREGORY BALLARD L. Gregory Ballard |
Director |
March 16, 2015 |
||
/s/ DAVID C. HABIGER David C. Habiger |
Director |
March 16, 2015 |
||
/s/ V. SUE MOLINA V. Sue Molina |
Director |
March 16, 2015 |
100
| |
|
|
Incorporated by Reference | ||||||||
|---|---|---|---|---|---|---|---|---|---|---|---|
| Exhibit Number |
|
Filed with this Form 10-K |
|||||||||
| Exhibit Title | Form | File No. | Date Filed | ||||||||
2.1 |
Agreement and Plan of Merger and Reorganization, dated as of April 16, 2012, by and among DTS, Inc., DTS Merger Sub, Inc, DTS LLC, and SRS Labs, Inc. | 8-K | 000-50335-12764511 | 4/17/2012 | |||||||
|
|||||||||||
3.1 |
Composite Certificate of Incorporation | 10-K | 000-50335-13698275 | 3/18/2013 | |||||||
|
|||||||||||
3.2 |
Amended and Restated Bylaws | 8-K | 000-50335-15628362 | 2/18/2015 | |||||||
|
|||||||||||
4.1 |
Specimen Common Stock Certificate | S-1/A-2 | 333-104761-03750962 | 6/20/2003 | |||||||
|
|||||||||||
10.1 |
* | 2003 Equity Incentive Plan, as amended on May 9, 2005, May 15, 2008, February 19, 2009, February 15, 2010, June 3, 2010 and October 8, 2010 | 10-Q | 000-50335-101172804 | 11/8/2010 | ||||||
|
|||||||||||
10.2 |
* | Form of Grant of Stock Option under 2003 Equity Incentive Plan | S-1/A-1 | 333-104761-03734287 | 6/5/2003 | ||||||
|
|||||||||||
10.3 |
* | Form of Option Exercise and Stock Purchase Agreement under 2003 Equity Incentive Plan | S-1/A-1 | 333-104761-03734287 | 6/5/2003 | ||||||
|
|||||||||||
10.4 |
* | Form of Restricted Stock Grant Notice and Restricted Stock Agreement under 2003 Equity Incentive Plan (for annual non-employee director grants) | 10-Q | 000-50335-061017963 | 8/9/2006 | ||||||
|
|||||||||||
10.5 |
* | Form of Restricted Stock Grant Notice and Restricted Stock Agreement under 2003 Equity Incentive Plan (for employee and consultant grants) | 10-Q | 000-50335-061017963 | 8/9/2006 | ||||||
|
|||||||||||
10.6 |
* | Form of Restricted Stock Unit Grant Notice and Restricted Stock Unit Agreement under 2003 Equity Incentive Plan | 10-Q | 000-50335-10816984 | 5/10/2010 | ||||||
|
|||||||||||
10.7 |
* | 2003 Employee Stock Purchase Plan | S-1/A-1 | 333-104761-03734287 | 6/5/2003 | ||||||
|
|||||||||||
101
| |
|
|
Incorporated by Reference | ||||||||
|---|---|---|---|---|---|---|---|---|---|---|---|
| Exhibit Number |
|
Filed with this Form 10-K |
|||||||||
| Exhibit Title | Form | File No. | Date Filed | ||||||||
10.8 |
* | 2003 Foreign Subsidiary Employee Stock Purchase Plan | S-1/A-1 | 333-104761-03734287 | 6/5/2003 | ||||||
|
|||||||||||
10.9 |
* | Description of acceleration of vesting of certain unvested stock options | 8-K | 000-50335-051222387 | 11/23/2005 | ||||||
|
|||||||||||
10.10 |
* | Executive Employment Agreement by and between the Registrant and Jon Kirchner, dated February 17, 2011 | 8-K | 000-50335-11631546 | 2/23/2011 | ||||||
|
|||||||||||
10.11 |
* | Form of Indemnification Agreement between the Registrant and its directors | S-1 | 333-104761-03665001 | 4/25/2003 | ||||||
|
|||||||||||
10.12 |
* | Form of Indemnification Agreement between the Registrant and its officers | S-1 | 333-104761-03665001 | 4/25/2003 | ||||||
|
|||||||||||
10.13 |
* | Form of Market Stock Unit Agreement under 2003 Equity Incentive Plan (for Jon Kirchner) | 10-Q | 000-50335-11823912 | 5/9/2011 | ||||||
|
|||||||||||
10.14 |
* | Form of Market Stock Unit Agreement under 2003 Equity Incentive Plan (for executives other than Jon Kirchner) | 10-Q | 000-50335-11823912 | 5/9/2011 | ||||||
|
|||||||||||
10.15 |
* | Employment Agreement, dated May 12, 2011, between DTS, Inc. and Melvin L. Flanigan | 10-Q | 000-50335-111017706 | 8/8/2011 | ||||||
|
|||||||||||
10.16 |
* | Employment Agreement, dated May 12, 2011, between DTS, Inc. and Frederick L. Kitson | 10-Q | 000-50335-111017706 | 8/8/2011 | ||||||
|
|||||||||||
10.17 |
* | Employment Agreement, dated May 12, 2011, between DTS, Inc. and Brian D. Towne | 10-Q | 000-50335-111017706 | 8/8/2011 | ||||||
|
|||||||||||
10.18 |
* | Employment Agreement, dated May 12, 2011, between DTS, Inc. and Blake A. Welcher | 10-Q | 000-50335-111017706 | 8/8/2011 | ||||||
|
|||||||||||
10.19 |
* | Form of Director Confidentiality Agreement | 8-K | 000-50335-11847230 | 5/16/2011 | ||||||
|
|||||||||||
10.20 |
* | Employment Agreement, dated March 1, 2012, between DTS, Inc. and Patrick J. Watson | 10-K | 000-50335-12662201 | 3/2/2012 | ||||||
|
|||||||||||
102
| |
|
|
Incorporated by Reference | ||||||||
|---|---|---|---|---|---|---|---|---|---|---|---|
| Exhibit Number |
|
Filed with this Form 10-K |
|||||||||
| Exhibit Title | Form | File No. | Date Filed | ||||||||
10.21 |
* | 2012 Equity Incentive Plan | S-8 | 333-181447-12846445 | 5/15/2012 | ||||||
|
|||||||||||
10.22 |
* | Form of Stock Option Agreement under 2012 Equity Incentive Plan | S-8 | 333-181447-12846445 | 5/15/2012 | ||||||
|
|||||||||||
10.23 |
* | Form of Restricted Stock Agreement under 2012 Equity Incentive Plan | S-8 | 333-181447-12846445 | 5/15/2012 | ||||||
|
|||||||||||
10.24 |
* | Form of Restricted Stock Unit Agreement under 2012 Equity Incentive Plan | S-8 | 333-181447-12846445 | 5/15/2012 | ||||||
|
|||||||||||
10.25 |
* | Form of Stock Option Agreement (Non US) under 2012 Equity Incentive Plan | S-8 | 333-181447-12846445 | 5/15/2012 | ||||||
|
|||||||||||
10.26 |
* | Form of Restricted Stock Unit Agreement (Non US) under 2012 Equity Incentive Plan | S-8 | 333-181447-12846445 | 5/15/2012 | ||||||
|
|||||||||||
10.27 |
Loan Agreement, dated as of July 18, 2012, by and between DTS, Inc. and Union Bank, N.A., together with any other lender thereunder from time to time. | 8-K | 000-50335-12977271 | 7/24/2012 | |||||||
|
|||||||||||
10.28 |
Security Agreement, dated July 18, 2012, by and among DTS, Inc., and each other guarantor thereunder and Union Bank, N.A. | 8-K | 000-50335-12977271 | 7/24/2012 | |||||||
|
|||||||||||
10.29 |
* | SRS Labs, Inc. 2006 Stock Incentive Plan, as amended and restated on August 9, 2012 (the "2006 Plan") | S-8 | 333-183289-121028624 | 8/13/2012 | ||||||
|
|||||||||||
10.30 |
* | Form of Stock Option Agreement under the 2006 Plan | S-8 | 333-183289-121028624 | 8/13/2012 | ||||||
|
|||||||||||
10.31 |
* | Form of Restricted Stock Unit Agreement under the 2006 Plan | S-8 | 333-183289-121028624 | 8/13/2012 | ||||||
|
|||||||||||
10.32 |
* | Form of Stock Option Agreement (Non U.S.) under the 2006 Plan | S-8 | 333-183289-121028624 | 8/13/2012 | ||||||
|
|||||||||||
10. 33 |
* | Form of Restricted Stock Unit Agreement (Non U.S.) under the 2006 Plan | S-8 | 333-183289-121028624 | 8/13/2012 | ||||||
|
|||||||||||
103
| |
|
|
Incorporated by Reference | ||||||||
|---|---|---|---|---|---|---|---|---|---|---|---|
| Exhibit Number |
|
Filed with this Form 10-K |
|||||||||
| Exhibit Title | Form | File No. | Date Filed | ||||||||
10.34 |
* | Employment Agreement, dated April 1, 2013, between DTS, Inc. and Kris M. Graves | 10-Q | 000-50335-13824975 | 5/8/2013 | ||||||
|
|||||||||||
10.35 |
* | 2013 Employee Stock Purchase Plan, as amended and restated effective November 31, 2012 | S-8 | 333-190677-131044650 | 8/16/2013 | ||||||
|
|||||||||||
10.36 |
* | 2013 Foreign Subsidiary Employee Stock Purchase Plan, as amended and restated effective November 31, 2012 | S-8 | 333-190677-131044650 | 8/16/2013 | ||||||
|
|||||||||||
10.37 |
* | Form of 2015 Executive Incentive Compensation Plan | X | ||||||||
|
|||||||||||
10.38 |
* | Amendment to Employment Agreement, dated March 13, 2014, between DTS, Inc. and Brian D. Towne | 10-Q | 000-50335-14833723 | 5/12/2014 | ||||||
|
|||||||||||
10.39 |
* | Employment Agreement, dated January 20, 2014, between DTS, Inc. and Kevin Doohan | 10-Q | 000-50335-14833723 | 5/12/2014 | ||||||
|
|||||||||||
10.40 |
* | DTS, Inc. 2014 New Employee Incentive Plan | 8-K | 000-50335-14833594 | 8/20/2014 | ||||||
|
|||||||||||
10.41 |
Credit Agreement, dated as of September 29, 2014, by and between DTS, Inc. and Wells Fargo Bank, National Association, together with any other lender thereunder from time to time. | 8-K | 000-50335-141140155 | 10/03/2014 | |||||||
|
|||||||||||
10.42 |
Security Agreement, dated as of September 29, 2014, by and among DTS, Inc., and each other guarantor thereunder and Wells Fargo Bank, National Association. | 8-K | 000-50335-141140155 | 10/03/2014 | |||||||
|
|||||||||||
10.43 |
* | Form of Stock Option Agreement under the 2014 Plan | S-8 | 333-200077-141209493 | 11/10/2014 | ||||||
|
|||||||||||
10.44 |
* | Form of Stock Option Agreement (Non U.S.) under the 2014 Plan | S-8 | 333-200077-141209493 | 11/10/2014 | ||||||
|
|||||||||||
10.45 |
* | Form of Restricted Stock Unit Agreement under the 2014 Plan | S-8 | 333-200077-141209493 | 11/10/2014 | ||||||
|
|||||||||||
104
| |
|
|
Incorporated by Reference | ||||||||
|---|---|---|---|---|---|---|---|---|---|---|---|
| Exhibit Number |
|
Filed with this Form 10-K |
|||||||||
| Exhibit Title | Form | File No. | Date Filed | ||||||||
10.46 |
* | Form of Restricted Stock Unit Agreement (Non U.S.) under the 2014 Plan | S-8 | 333-200077-141209493 | 11/10/2014 | ||||||
|
|||||||||||
21.1 |
List of all subsidiaries of the Registrant | X | |||||||||
|
|||||||||||
23.1 |
Consent of Deloitte & Touche LLP, independent registered public accounting firm | X | |||||||||
|
|||||||||||
23.2 |
Consent of Grant Thornton LLP, independent registered public accounting firm | X | |||||||||
|
|||||||||||
31.1 |
Certification of Chief Executive Officer pursuant to Rule 13a-14(a)/15d-14(a) of the Securities Exchange Act of 1934, as amended | X | |||||||||
|
|||||||||||
31.2 |
Certification of Chief Financial Officer pursuant to Rule 13a-14(a)/15d-14(a) of the Securities Exchange Act of 1934, as amended | X | |||||||||
|
|||||||||||
32.1 |
‡ | Certification of the Chief Executive Officer pursuant to Rule 13a-14(b) of the Securities Exchange Act of 1934, as amended, and 18 U.S.C. section 1350 | X | ||||||||
|
|||||||||||
32.2 |
‡ | Certification of the Chief Financial Officer pursuant to Rule 13a-14(b) of the Securities Exchange Act of 1934, as amended, and 18 U.S.C. section 1350 | X | ||||||||
|
|||||||||||
101.INS |
XBRL Instance Document | X | |||||||||
|
|||||||||||
101.SCH |
XBRL Taxonomy Extension Schema Document | X | |||||||||
|
|||||||||||
101.CAL |
XBRL Taxonomy Extension Calculation Linkbase Document | X | |||||||||
|
|||||||||||
101.DEF |
XBRL Extension Definition | X | |||||||||
|
|||||||||||
101.LAB |
XBRL Taxonomy Extension Label Linkbase Document | X | |||||||||
|
|||||||||||
105
| |
|
|
Incorporated by Reference | ||||||||
|---|---|---|---|---|---|---|---|---|---|---|---|
| Exhibit Number |
|
Filed with this Form 10-K |
|||||||||
| Exhibit Title | Form | File No. | Date Filed | ||||||||
101.PRE |
XBRL Taxonomy Extension Presentation Linkbase Document | X | |||||||||
- *
- Indicates
management contract, arrangement or compensatory plan.
- ‡
- This certification is being furnished solely to accompany this report pursuant to 18 U.S.C. 1350, and is not being filed for purposes of Section 18 of the Securities Exchange Act of 1934, and is not to be incorporated by reference into any filing of the Company, whether made before or after the date hereof, regardless of any general incorporation language in such filing.
106