Attached files
| file | filename |
|---|---|
| EX-99.1 - EXHIBIT 99.1 - TCF FINANCIAL CORP | tcf63016form8-kexhibit991r.htm |
| 8-K - 8-K - TCF FINANCIAL CORP | tcf63016form8-kearningsrel.htm |
2016 Second Quarter Earnings Presentation
July 22, 2016
Exhibit 99.2
Agenda
INTRODUCTION
• Craig Dahl (Chief Executive Officer)
HIGHLIGHTS / REVENUE / LOANS AND LEASES / CREDIT
• Craig Dahl
EXPENSES / DEPOSITS / INTEREST RATES / CAPITAL
• Brian Maass (Chief Financial Officer)
CLOSING COMMENTS
• Craig Dahl
Q&A
2
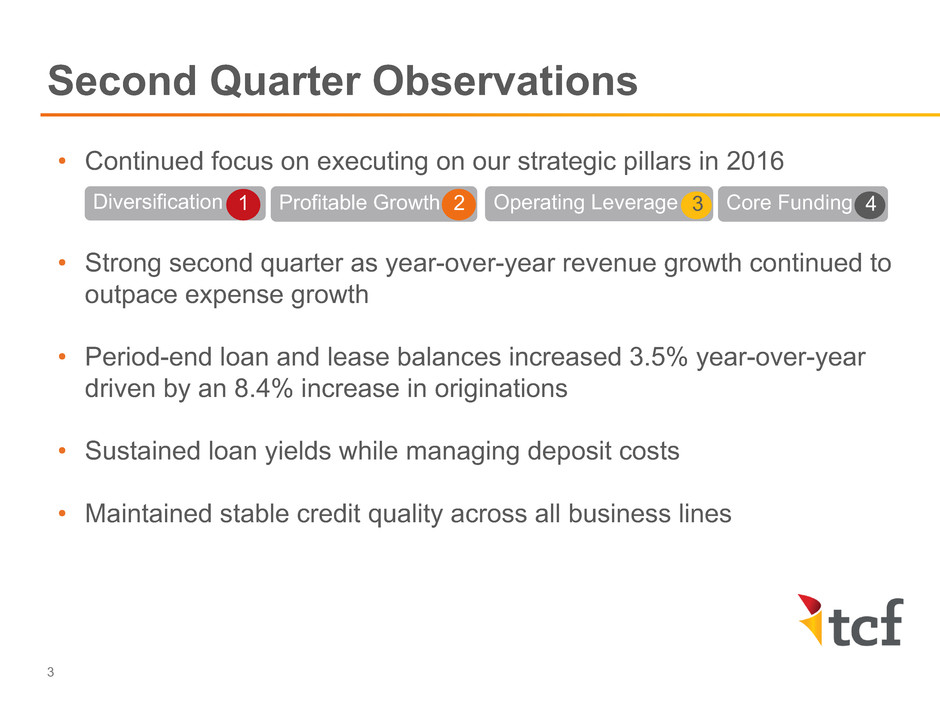
• Continued focus on executing on our strategic pillars in 2016
• Strong second quarter as year-over-year revenue growth continued to
outpace expense growth
• Period-end loan and lease balances increased 3.5% year-over-year
driven by an 8.4% increase in originations
• Sustained loan yields while managing deposit costs
• Maintained stable credit quality across all business lines
Second Quarter Observations
3
Diversification 1 Profitable Growth 2 Operating Leverage 3 Core Funding 4
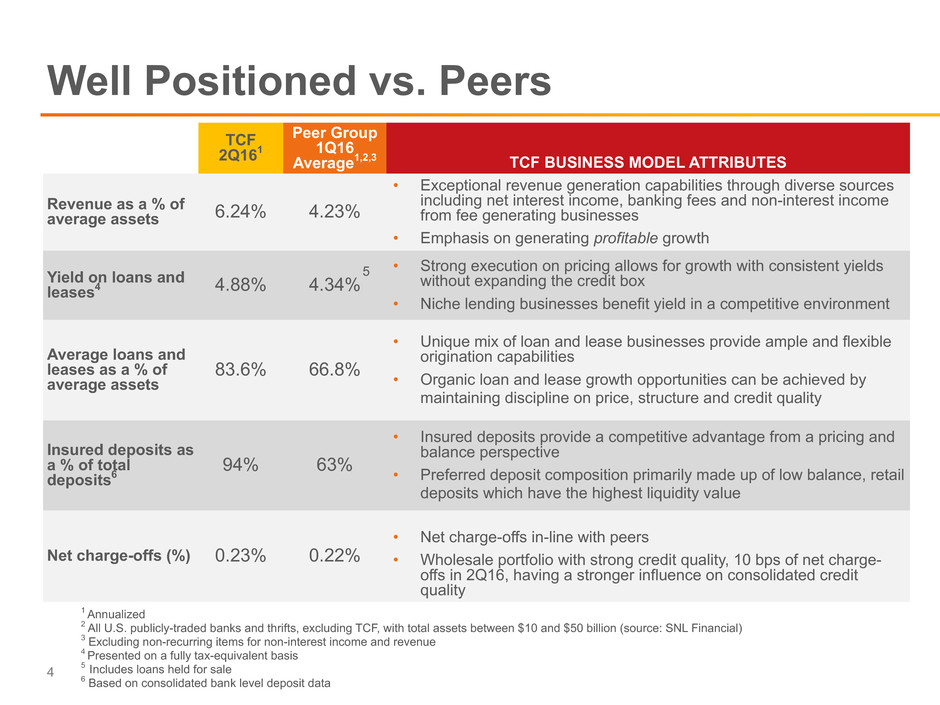
TCF
2Q161
Peer Group
1Q16
Average1,2,3 TCF BUSINESS MODEL ATTRIBUTES
Revenue as a % of
average assets 6.24% 4.23%
• Exceptional revenue generation capabilities through diverse sources
including net interest income, banking fees and non-interest income
from fee generating businesses
• Emphasis on generating profitable growth
Yield on loans and
leases4 4.88% 4.34%
• Strong execution on pricing allows for growth with consistent yields
without expanding the credit box
• Niche lending businesses benefit yield in a competitive environment
Average loans and
leases as a % of
average assets
83.6% 66.8%
• Unique mix of loan and lease businesses provide ample and flexible
origination capabilities
• Organic loan and lease growth opportunities can be achieved by
maintaining discipline on price, structure and credit quality
Insured deposits as
a % of total
deposits6
94% 63%
• Insured deposits provide a competitive advantage from a pricing and
balance perspective
• Preferred deposit composition primarily made up of low balance, retail
deposits which have the highest liquidity value
Net charge-offs (%) 0.23% 0.22%
• Net charge-offs in-line with peers
• Wholesale portfolio with strong credit quality, 10 bps of net charge-
offs in 2Q16, having a stronger influence on consolidated credit
quality
Well Positioned vs. Peers
4
1 Annualized
2 All U.S. publicly-traded banks and thrifts, excluding TCF, with total assets between $10 and $50 billion (source: SNL Financial)
3 Excluding non-recurring items for non-interest income and revenue
4 Presented on a fully tax-equivalent basis
5 Includes loans held for sale
6 Based on consolidated bank level deposit data
5
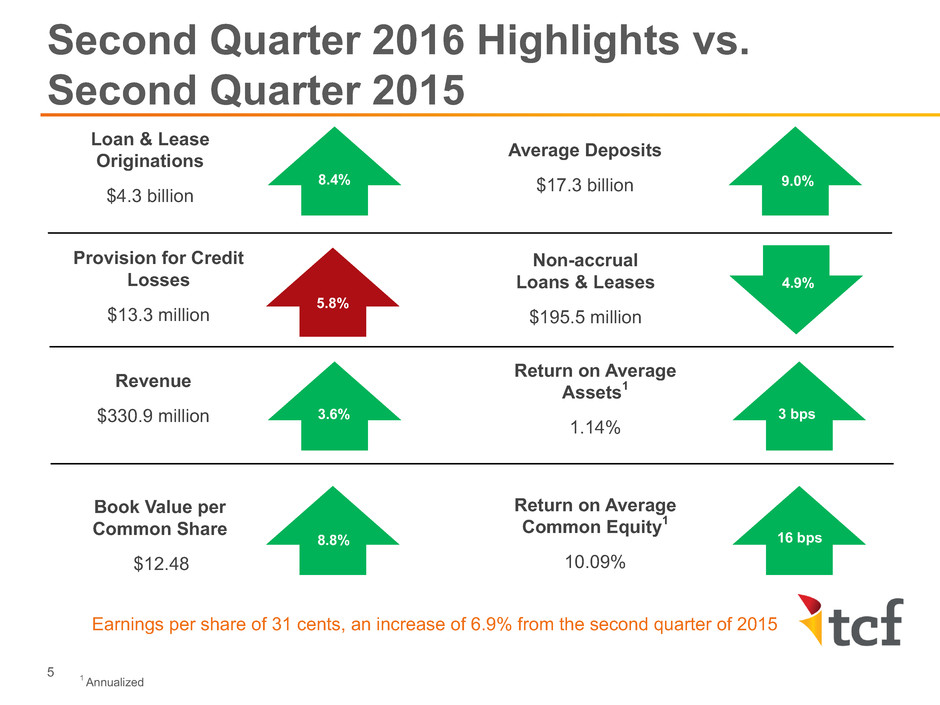
Earnings per share of 31 cents, an increase of 6.9% from the second quarter of 2015
Second Quarter 2016 Highlights vs.
Second Quarter 2015
Revenue
$330.9 million
Non-accrual
Loans & Leases
$195.5 million
Loan & Lease
Originations
$4.3 billion
Average Deposits
$17.3 billion
Provision for Credit
Losses
$13.3 million
Return on Average
Assets1
1.14%
Return on Average
Common Equity1
10.09%
5
3.6%
16 bps
8.4%
Book Value per
Common Share
$12.48
1 Annualized
9.0%
3 bps
8.8%
4.9%
5.8%
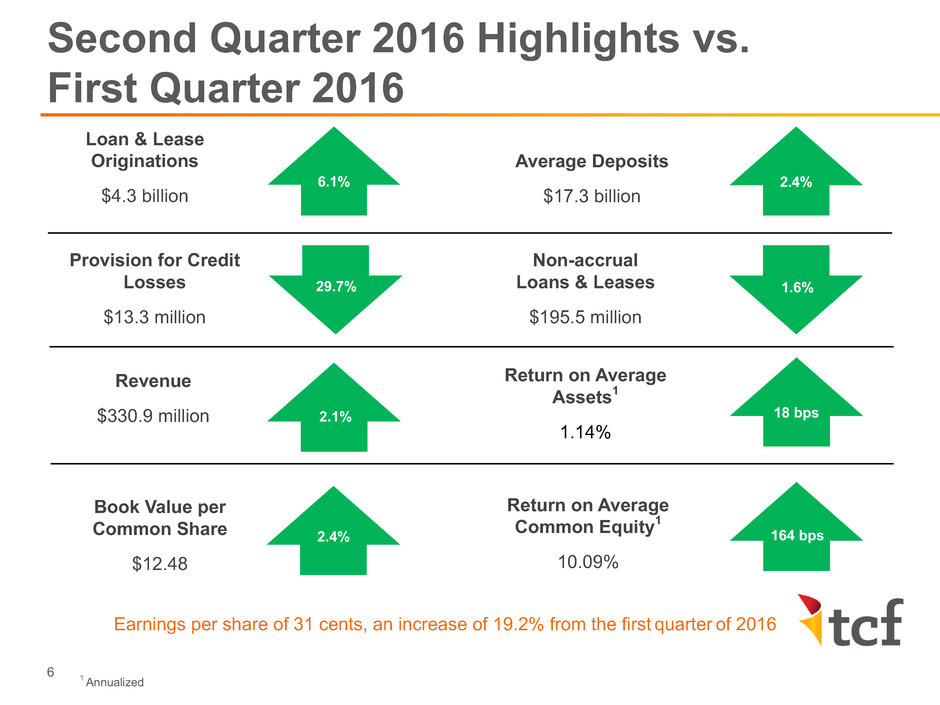
Second Quarter 2016 Highlights vs.
First Quarter 2016
Revenue
$330.9 million
Loan & Lease
Originations
$4.3 billion
Average Deposits
$17.3 billion
Provision for Credit
Losses
$13.3 million
Return on Average
Assets1
1.14%
Return on Average
Common Equity1
10.09%
1 Annualized
6
6.1%
1.6%
2.1%
Book Value per
Common Share
$12.48
Earnings per share of 31 cents, an increase of 19.2% from the first quarter of 2016
2.4%
2.4%
Non-accrual
Loans & Leases
$195.5 million
1.6%
18 bps
18 bps
164 bps
29.7%
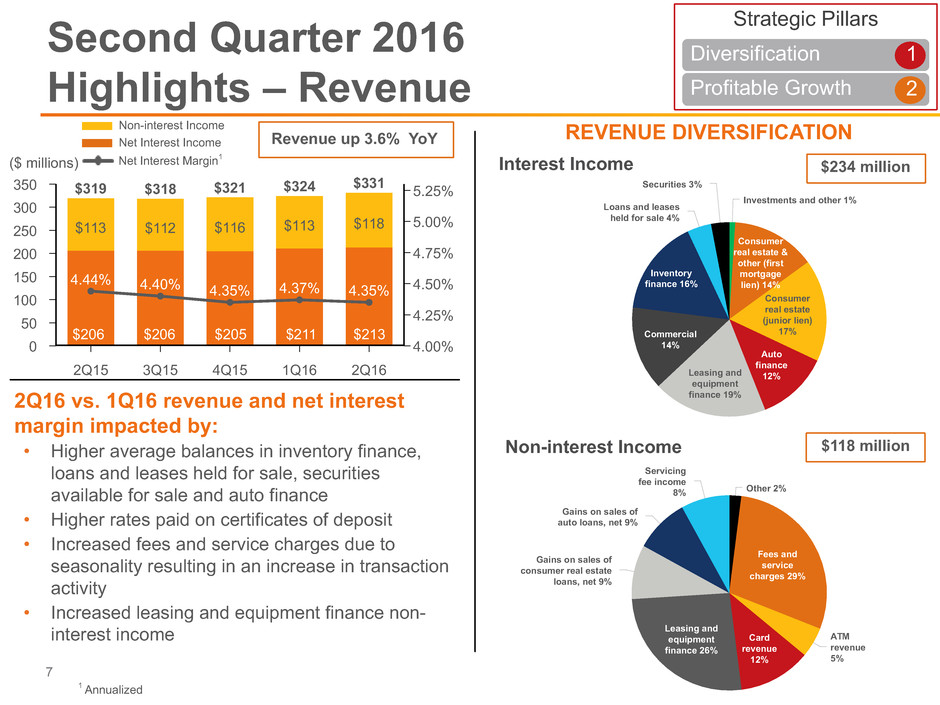
Revenue up 3.6% YoY
Investments and other 1%
Consumer
real estate &
other (first
mortgage
lien) 14%
Consumer
real estate
(junior lien)
17%
Auto
finance
12%Leasing and
equipment
finance 19%
Commercial
14%
Inventory
finance 16%
Loans and leases
held for sale 4%
Securities 3%350
300
250
200
150
100
50
0
5.25%
5.00%
4.75%
4.50%
4.25%
4.00%
2Q15 3Q15 4Q15 1Q16 2Q16
$113
$319
$112
$318
$116
$321
$113
$324
$118
$331
4.44% 4.40% 4.35% 4.37% 4.35%
Net Interest Margin1
1 Annualized
2Q16 vs. 1Q16 revenue and net interest
margin impacted by:
• Higher average balances in inventory finance,
loans and leases held for sale, securities
available for sale and auto finance
• Higher rates paid on certificates of deposit
• Increased fees and service charges due to
seasonality resulting in an increase in transaction
activity
• Increased leasing and equipment finance non-
interest income
Second Quarter 2016
Highlights – Revenue
7
REVENUE DIVERSIFICATION
$234 million
Non-interest Income
Interest Income($ millions)
$206 $206 $205 $211 $213
Non-interest Income
Net Interest Income
$118 million
Other 2%
Fees and
service
charges 29%
ATM
revenue
5%
Card
revenue
12%
Leasing and
equipment
finance 26%
Gains on sales of
consumer real estate
loans, net 9%
Gains on sales of
auto loans, net 9%
Servicing
fee income
8%
Strategic Pillars
Diversification 1
Profitable Growth 2
8
6/15 9/15 12/15 3/16 6/16
$16,877 $17,201
$17,436 $17,472
13%
18%
22%
14%
17%
16%
13%
18%
23%
15%
16%
15%
15%
18%
22%
16%
15%
14%
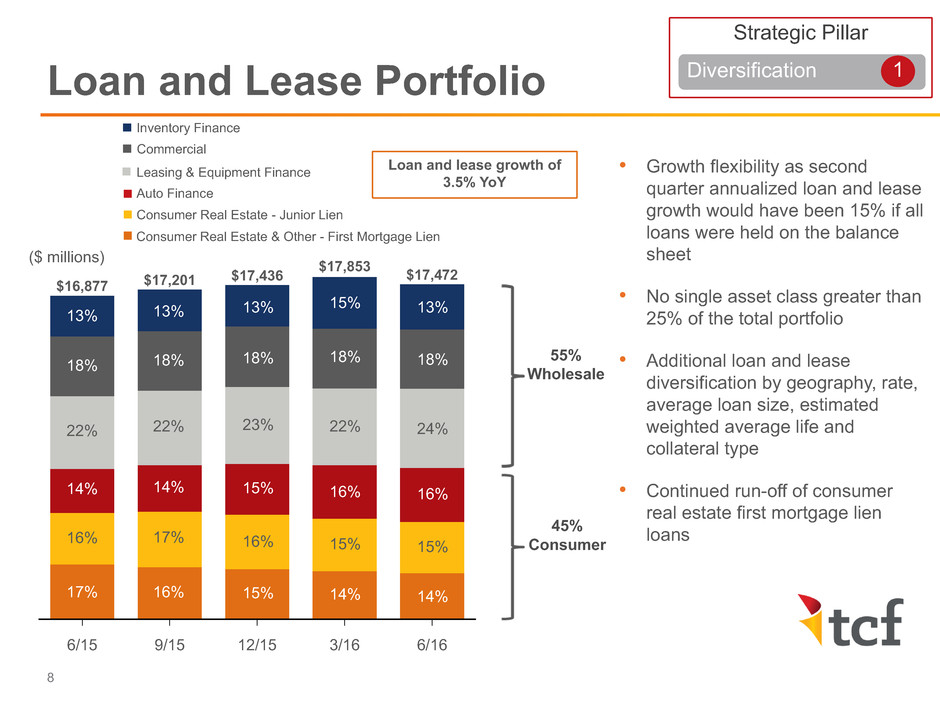
• Growth flexibility as second
quarter annualized loan and lease
growth would have been 15% if all
loans were held on the balance
sheet
• No single asset class greater than
25% of the total portfolio
• Additional loan and lease
diversification by geography, rate,
average loan size, estimated
weighted average life and
collateral type
• Continued run-off of consumer
real estate first mortgage lien
loans
55%
Wholesale
45%
Consumer
Loan and Lease Portfolio
8
($ millions)
13%
18%
22%
14%
16%
17%
Inventory Finance
Leasing & Equipment Finance
Commercial
Auto Finance
Consumer Real Estate - Junior Lien
Consumer Real Estate & Other - First Mortgage Lien
$17,853
13%
18%
24%
16%
15%
14%
Strategic Pillar
Diversification 1
Loan and lease growth of
3.5% YoY
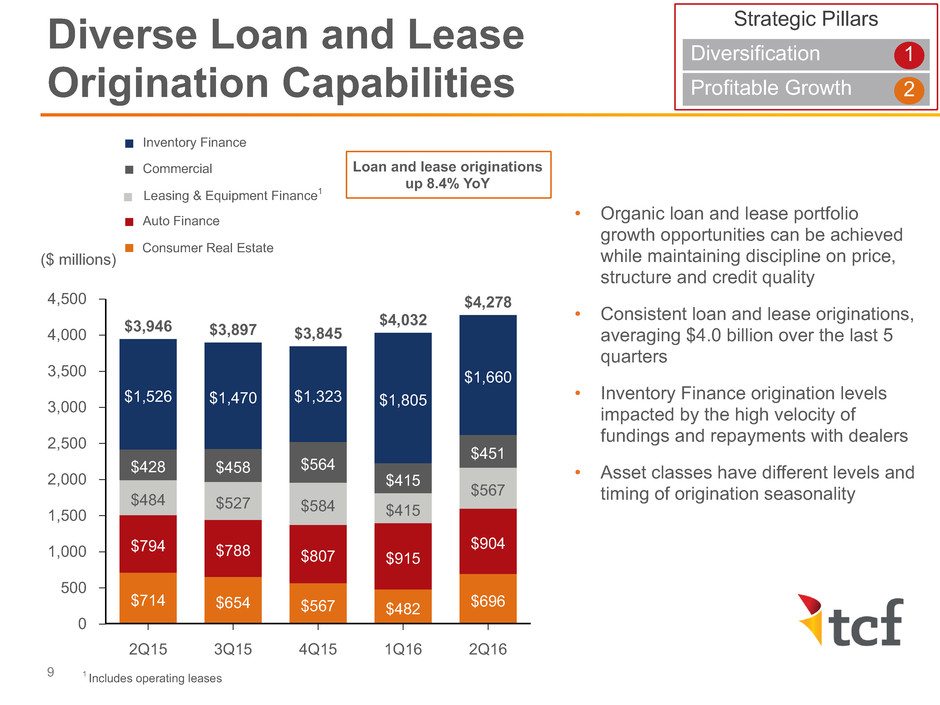
• Organic loan and lease portfolio
growth opportunities can be achieved
while maintaining discipline on price,
structure and credit quality
• Consistent loan and lease originations,
averaging $4.0 billion over the last 5
quarters
• Inventory Finance origination levels
impacted by the high velocity of
fundings and repayments with dealers
• Asset classes have different levels and
timing of origination seasonality
Diverse Loan and Lease
Origination Capabilities
9
Strategic Pillars
Diversification 1
Profitable Growth 2
($ millions)
Inventory Finance
Leasing & Equipment Finance1
Commercial
Auto Finance
Consumer Real Estate
4,500
4,000
3,500
3,000
2,500
2,000
1,500
1,000
500
0
2Q15 3Q15 4Q15 1Q16 2Q16
$714 $654 $567 $482 $696
$794 $788 $807 $915
$904
$484 $527 $584 $415
$567
$428 $458 $564
$415
$451
$1,526
$3,946
$1,470
$3,897
$1,323
$3,845
$1,805
$4,032
$1,660
$4,278
1 Includes operating leases
Loan and lease originations
up 8.4% YoY
Other
Auto
Consumer Real Estate & Other Consumer
1,000
800
600
400
200
0
2Q15 3Q15 4Q15 1Q16 2Q16
($ millions)
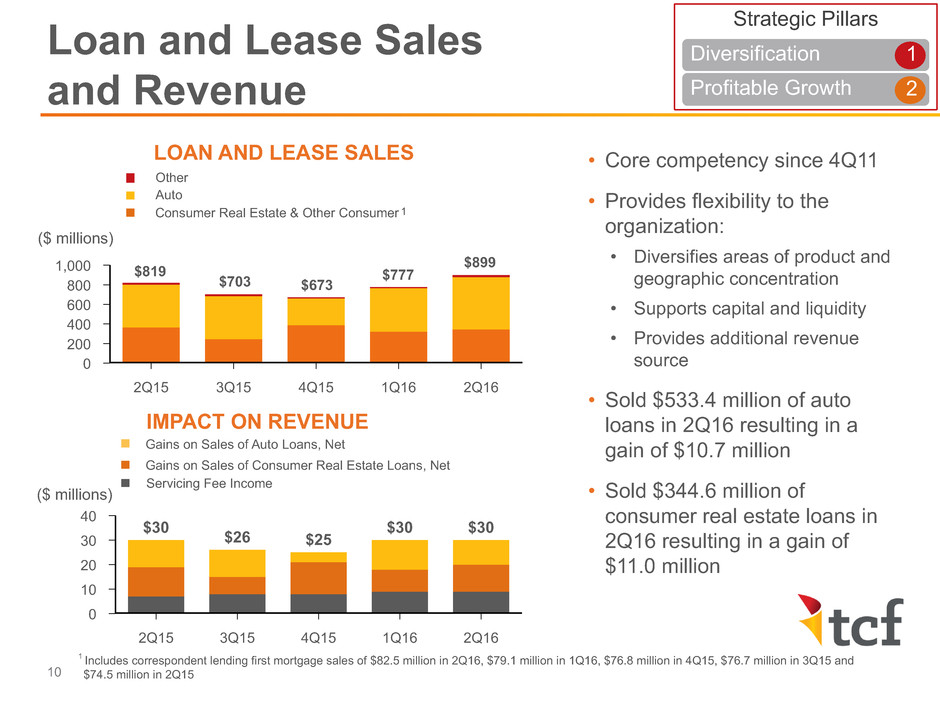
• Core competency since 4Q11
• Provides flexibility to the
organization:
• Diversifies areas of product and
geographic concentration
• Supports capital and liquidity
• Provides additional revenue
source
• Sold $533.4 million of auto
loans in 2Q16 resulting in a
gain of $10.7 million
• Sold $344.6 million of
consumer real estate loans in
2Q16 resulting in a gain of
$11.0 million
1 Includes correspondent lending first mortgage sales of $82.5 million in 2Q16, $79.1 million in 1Q16, $76.8 million in 4Q15, $76.7 million in 3Q15 and
$74.5 million in 2Q15
Loan and Lease Sales
and Revenue
10
1
$703
$819
$673
$777
$899
40
30
20
10
0
2Q15 3Q15 4Q15 1Q16 2Q16
$30 $26 $25
$30 $30
LOAN AND LEASE SALES
IMPACT ON REVENUE
Servicing Fee Income
Gains on Sales of Auto Loans, Net
Gains on Sales of Consumer Real Estate Loans, Net
Strategic Pillars
Diversification 1
Profitable Growth 2
($ millions)
10
8
6
4
2
0
2Q15 3Q15 4Q15 1Q16 2Q16
$7.2 $8.0
$8.6 $8.9 $9.5
24,000
20,000
16,000
12,000
8,000
4,000
0
2Q15 3Q15 4Q15 1Q16 2Q16
$17,439 $17,409 $17,642 $18,258 $18,356
$3,692
$21,131
$3,976
$21,385
$4,167
$21,809
$4,386
$22,644
$4,685
$23,041
Servicing Fee Income
Serviced for Others Portfolio
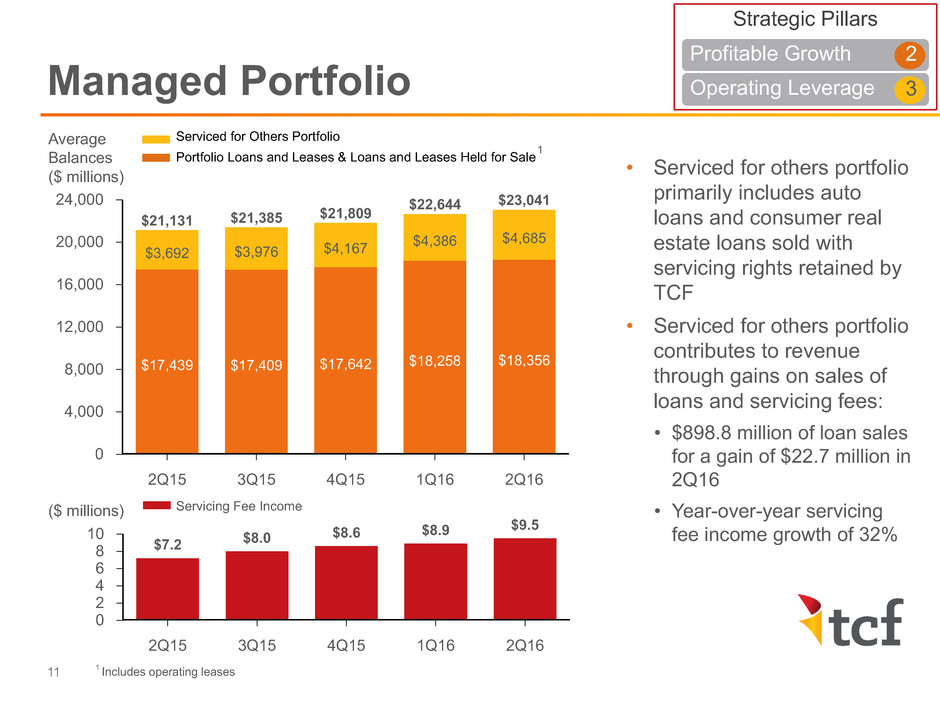
Portfolio Loans and Leases & Loans and Leases Held for Sale • Serviced for others portfolio
primarily includes auto
loans and consumer real
estate loans sold with
servicing rights retained by
TCF
• Serviced for others portfolio
contributes to revenue
through gains on sales of
loans and servicing fees:
• $898.8 million of loan sales
for a gain of $22.7 million in
2Q16
• Year-over-year servicing
fee income growth of 32%
1 Includes operating leases
Managed Portfolio
1
Average
Balances
($ millions)
11
Strategic Pillars
Profitable Growth 2
Operating Leverage 3
($ millions)
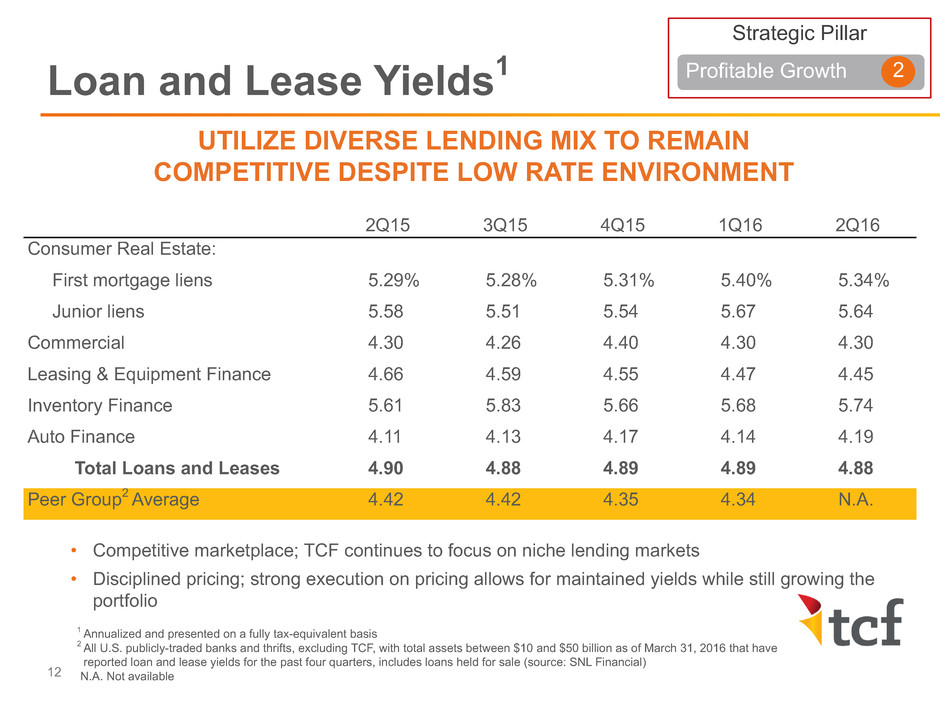
• Competitive marketplace; TCF continues to focus on niche lending markets
• Disciplined pricing; strong execution on pricing allows for maintained yields while still growing the
portfolio
UTILIZE DIVERSE LENDING MIX TO REMAIN
COMPETITIVE DESPITE LOW RATE ENVIRONMENT
12
1 Annualized and presented on a fully tax-equivalent basis
2 All U.S. publicly-traded banks and thrifts, excluding TCF, with total assets between $10 and $50 billion as of March 31, 2016 that have
reported loan and lease yields for the past four quarters, includes loans held for sale (source: SNL Financial)
N.A. Not available
2Q15 3Q15 4Q15 1Q16 2Q16
Consumer Real Estate:
First mortgage liens 5.29% 5.28% 5.31% 5.40% 5.34%
Junior liens 5.58 5.51 5.54 5.67 5.64
Commercial 4.30 4.26 4.40 4.30 4.30
Leasing & Equipment Finance 4.66 4.59 4.55 4.47 4.45
Inventory Finance 5.61 5.83 5.66 5.68 5.74
Auto Finance 4.11 4.13 4.17 4.14 4.19
Total Loans and Leases 4.90 4.88 4.89 4.89 4.88
Peer Group2 Average 4.42 4.42 4.35 4.34 N.A.
Loan and Lease Yields1
Strategic Pillar
Profitable Growth 2
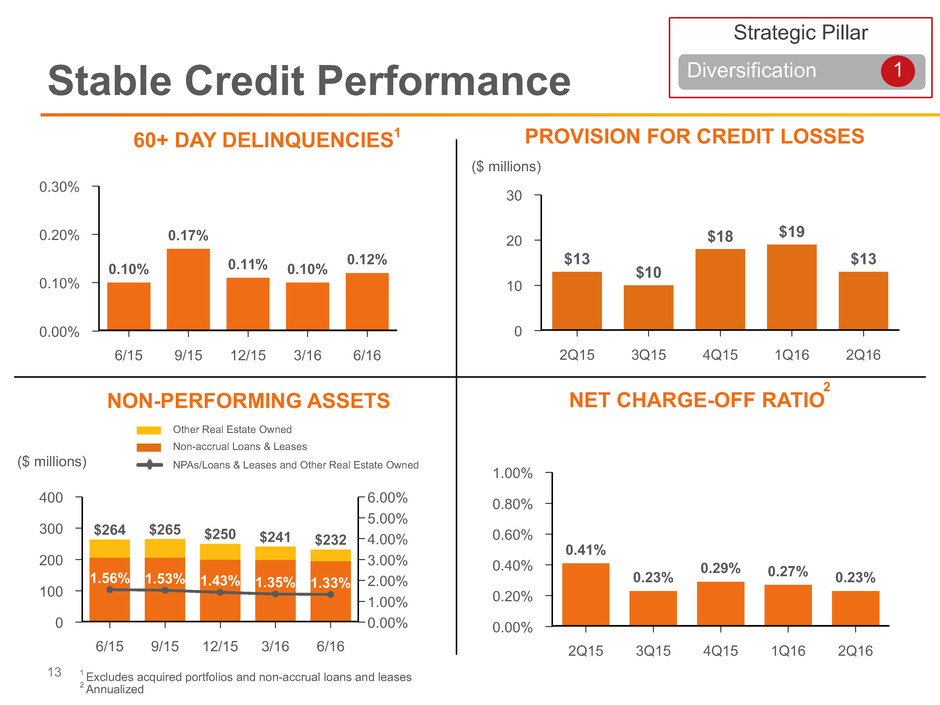
PROVISION FOR CREDIT LOSSES
30
20
10
0
2Q15 3Q15 4Q15 1Q16 2Q16
$13
$10
$18 $19
$13
1 Excludes acquired portfolios and non-accrual loans and leases
2 Annualized
($ millions)
Stable Credit Performance
13
0.30%
0.20%
0.10%
0.00%
6/15 9/15 12/15 3/16 6/16
0.10%
0.17%
0.11% 0.10% 0.12%
1.00%
0.80%
0.60%
0.40%
0.20%
0.00%
2Q15 3Q15 4Q15 1Q16 2Q16
0.41%
0.23% 0.29% 0.27% 0.23%
400
300
200
100
0
6.00%
5.00%
4.00%
3.00%
2.00%
1.00%
0.00%
6/15 9/15 12/15 3/16 6/16
$264 $265 $250 $241 $232
1.56% 1.53% 1.43% 1.35% 1.33%
($ millions)
2
60+ DAY DELINQUENCIES1
NET CHARGE-OFF RATIO NON-PERFORMING ASSETS
Other Real Estate Owned
Non-accrual Loans & Leases
NPAs/Loans & Leases and Other Real Estate Owned
Strategic Pillar
Diversification 1
1 Annualized
2 Includes Other
Net Charge-off Ratio
14
Quarter Ended1
Change from
Quarter Ended
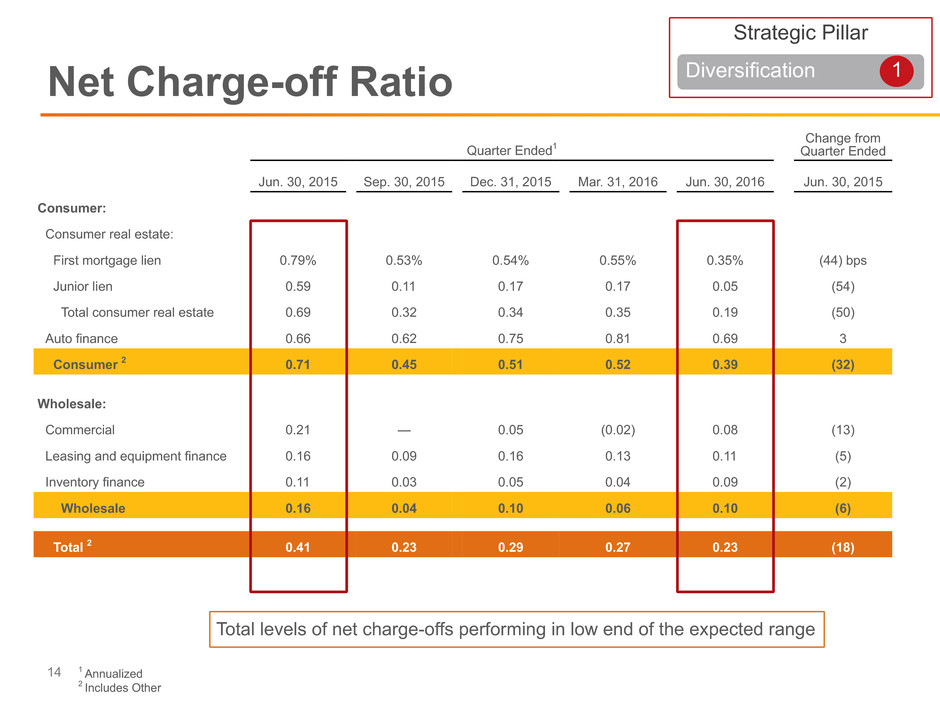
Jun. 30, 2015 Sep. 30, 2015 Dec. 31, 2015 Mar. 31, 2016 Jun. 30, 2016 Jun. 30, 2015
Consumer:
Consumer real estate:
First mortgage lien 0.79% 0.53% 0.54% 0.55% 0.35% (44) bps
Junior lien 0.59 0.11 0.17 0.17 0.05 (54)
Total consumer real estate 0.69 0.32 0.34 0.35 0.19 (50)
Auto finance 0.66 0.62 0.75 0.81 0.69 3
Consumer 2 0.71 0.45 0.51 0.52 0.39 (32)
Wholesale:
Commercial 0.21 — 0.05 (0.02) 0.08 (13)
Leasing and equipment finance 0.16 0.09 0.16 0.13 0.11 (5)
Inventory finance 0.11 0.03 0.05 0.04 0.09 (2)
Wholesale 0.16 0.04 0.10 0.06 0.10 (6)
Total 2 0.41 0.23 0.29 0.27 0.23 (18)
Strategic Pillar
Diversification 1
Total levels of net charge-offs performing in low end of the expected range
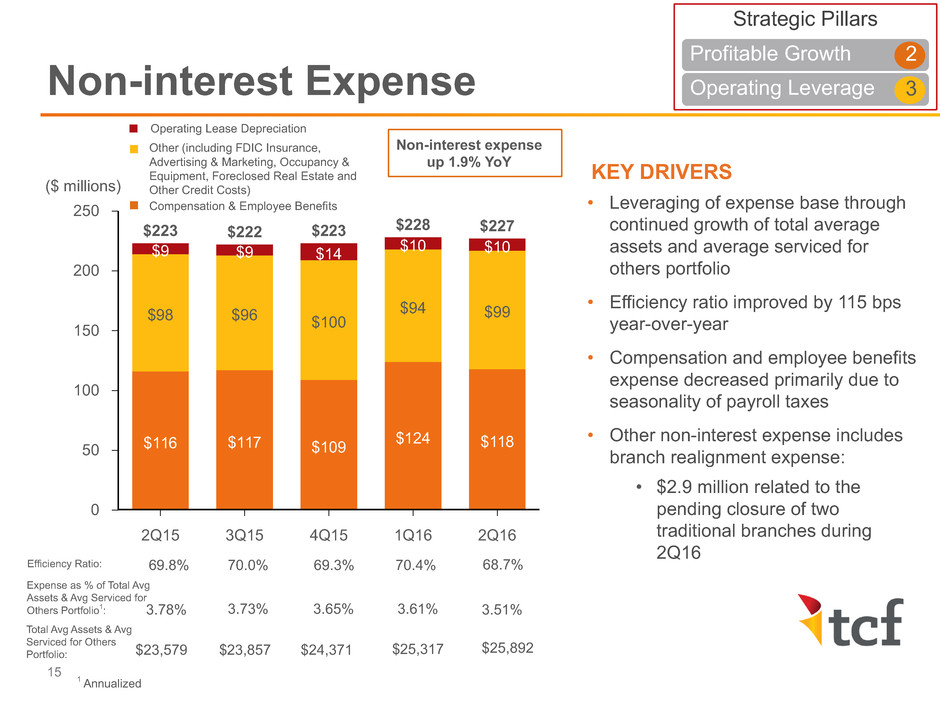
KEY DRIVERS
• Leveraging of expense base through
continued growth of total average
assets and average serviced for
others portfolio
• Efficiency ratio improved by 115 bps
year-over-year
• Compensation and employee benefits
expense decreased primarily due to
seasonality of payroll taxes
• Other non-interest expense includes
branch realignment expense:
• $2.9 million related to the
pending closure of two
traditional branches during
2Q16
15
Expense as % of Total Avg
Assets & Avg Serviced for
Others Portfolio1: 3.78% 3.73% 3.65%
1 Annualized
Total Avg Assets & Avg
Serviced for Others
Portfolio: $23,579 $23,857 $24,371 $25,317
3.61%
$25,892
3.51%
Non-interest Expense
250
200
150
100
50
0
2Q15 3Q15 4Q15 1Q16 2Q16
$116 $117 $109 $124 $118
$98 $96 $100
$94 $99
$9
$223
$9
$222
$14
$223
$10
$228
$10
$227
Compensation & Employee Benefits
Foreclosed Real Estate and Other Credit Cost
Compensation & Employee Benefits
350
300
250
200
150
100
50
0
$
(M
ill
io
ns
)
6/14 9/14 12/14 3/15 6/15
($ millions)
Operating Lease Depreciation
Other (including FDIC Insurance,
Advertising & Marketing, Occupancy &
Equipment, Foreclosed Real Estate and
Other Credit Costs)
Compensation & Employee Benefits
Efficiency Ratio: 69.8% 70.0% 69.3% 70.4% 68.7%
Strategic Pillars
Profitable Growth 2
Operating Leverage 3
Non-interest expense
up 1.9% YoY

18,000
16,000
14,000
12,000
10,000
8,000
6,000
4,000
2,000
0
2Q15 3Q15 4Q15 1Q16 2Q16
$15,855 $15,976 $16,289
$16,885 $17,283
16
• Checking account attrition rate
improved by 330 bps year-over-year
• 94% of total deposits are insured by
the FDIC
• Average interest cost increased due
to promotions for certificates of
deposit
• Provides long-term value as over
80% of promotional certificates
of deposit customers also utilize
additional TCF banking products
• 87% of period-end balances of
certificates of deposit are less than
$250,000
0.28% 0.31% 0.34% 0.36% 0.37%
Average
interest cost:
Deposit Generation
Average Balances
($ millions)
Certificates of Deposit
Money Market
Savings
Checking
Strategic Pillars
Profitable Growth 2
Core Funding 4
20%
14%
32%
34%
21%
14%
31%
34%
23%
15%
29%
33%
24%
15%
28%
33%
25%
15%
27%
33%
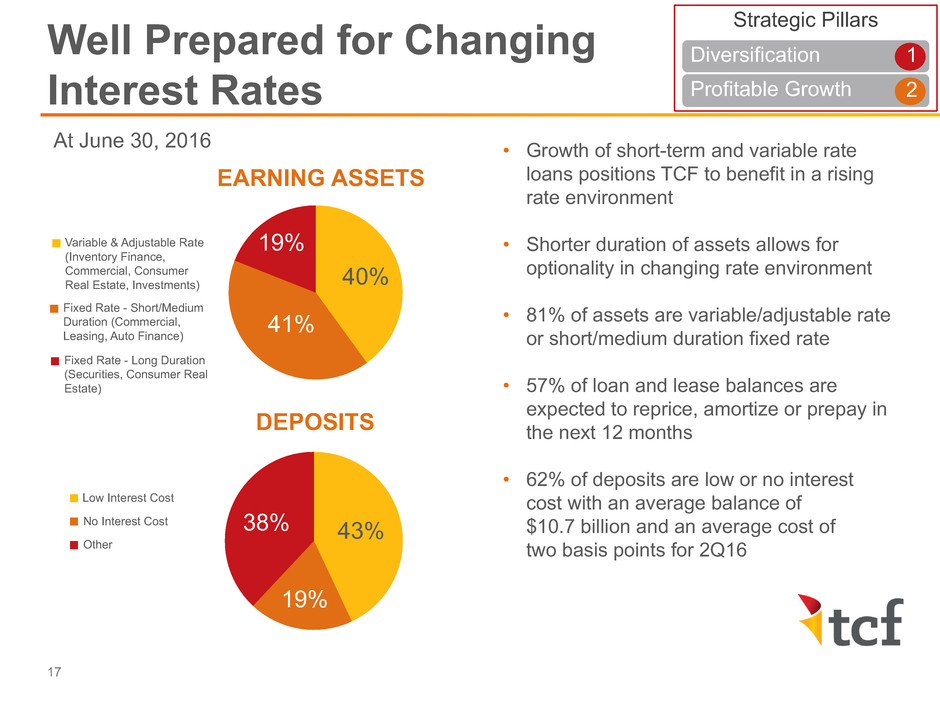
43%
19%
38%
40%
41%
19%
Well Prepared for Changing
Interest Rates
17
EARNING ASSETS
DEPOSITS
• Growth of short-term and variable rate
loans positions TCF to benefit in a rising
rate environment
• Shorter duration of assets allows for
optionality in changing rate environment
• 81% of assets are variable/adjustable rate
or short/medium duration fixed rate
• 57% of loan and lease balances are
expected to reprice, amortize or prepay in
the next 12 months
• 62% of deposits are low or no interest
cost with an average balance of
$10.7 billion and an average cost of
two basis points for 2Q16
Variable & Adjustable Rate
(Inventory Finance,
Commercial, Consumer
Real Estate, Investments)
Fixed Rate - Long Duration
(Securities, Consumer Real
Estate)
Fixed Rate - Short/Medium
Duration (Commercial,
Leasing, Auto Finance)
Low Interest Cost
No Interest Cost
Other
At June 30, 2016
Strategic Pillars
Diversification 1
Profitable Growth 2
18
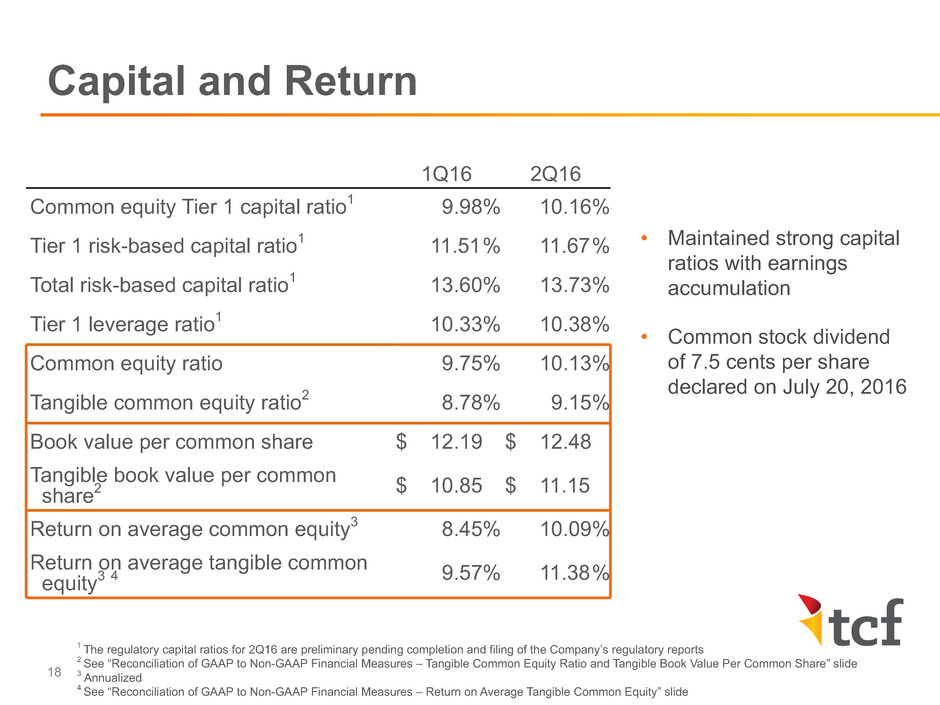
1Q16 2Q16
Common equity Tier 1 capital ratio1 9.98% 10.16%
Tier 1 risk-based capital ratio1 11.51% 11.67%
Total risk-based capital ratio1 13.60% 13.73%
Tier 1 leverage ratio1 10.33% 10.38%
Common equity ratio 9.75% 10.13%
Tangible common equity ratio2 8.78% 9.15%
Book value per common share $ 12.19 $ 12.48
Tangible book value per common
share2 $ 10.85 $ 11.15
Return on average common equity3 8.45% 10.09%
Return on average tangible common
equity3 4 9.57% 11.38%
• Maintained strong capital
ratios with earnings
accumulation
• Common stock dividend
of 7.5 cents per share
declared on July 20, 2016
Capital and Return
1 The regulatory capital ratios for 2Q16 are preliminary pending completion and filing of the Company’s regulatory reports
2 See “Reconciliation of GAAP to Non-GAAP Financial Measures – Tangible Common Equity Ratio and Tangible Book Value Per Common Share” slide
3 Annualized
4 See “Reconciliation of GAAP to Non-GAAP Financial Measures – Return on Average Tangible Common Equity” slide
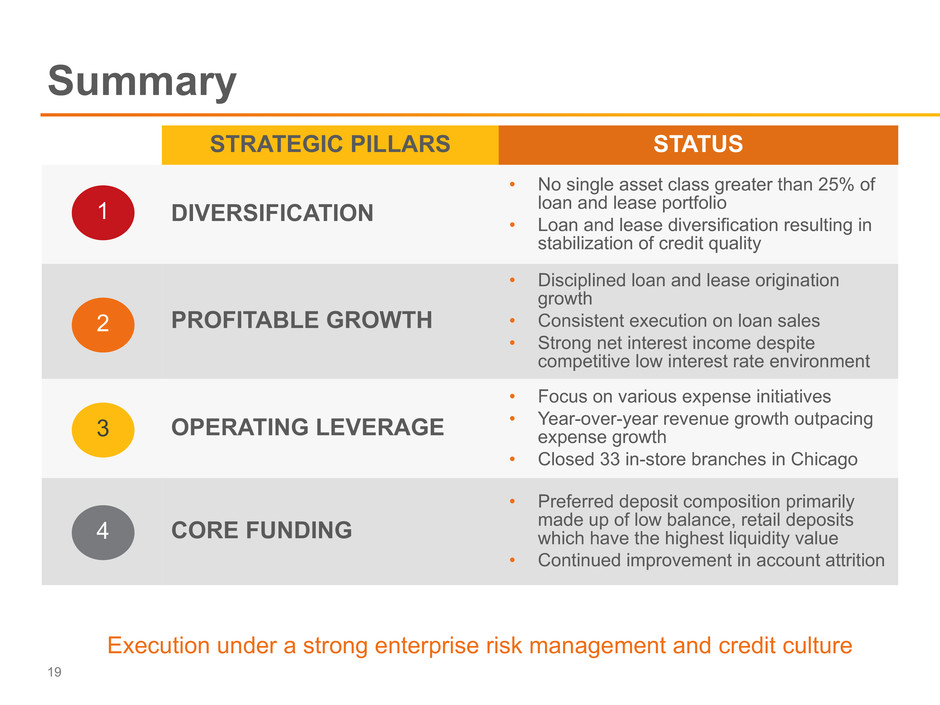
STRATEGIC PILLARS STATUS
DIVERSIFICATION
• No single asset class greater than 25% of
loan and lease portfolio
• Loan and lease diversification resulting in
stabilization of credit quality
PROFITABLE GROWTH
• Disciplined loan and lease origination
growth
• Consistent execution on loan sales
• Strong net interest income despite
competitive low interest rate environment
OPERATING LEVERAGE
• Focus on various expense initiatives
• Year-over-year revenue growth outpacing
expense growth
• Closed 33 in-store branches in Chicago
CORE FUNDING
• Preferred deposit composition primarily
made up of low balance, retail deposits
which have the highest liquidity value
• Continued improvement in account attrition
1
2
3
4
Execution under a strong enterprise risk management and credit culture
Summary
19
Appendix
Cautionary Statements for Purposes of the Safe
Harbor Provisions of the Securities Litigation
Reform Act
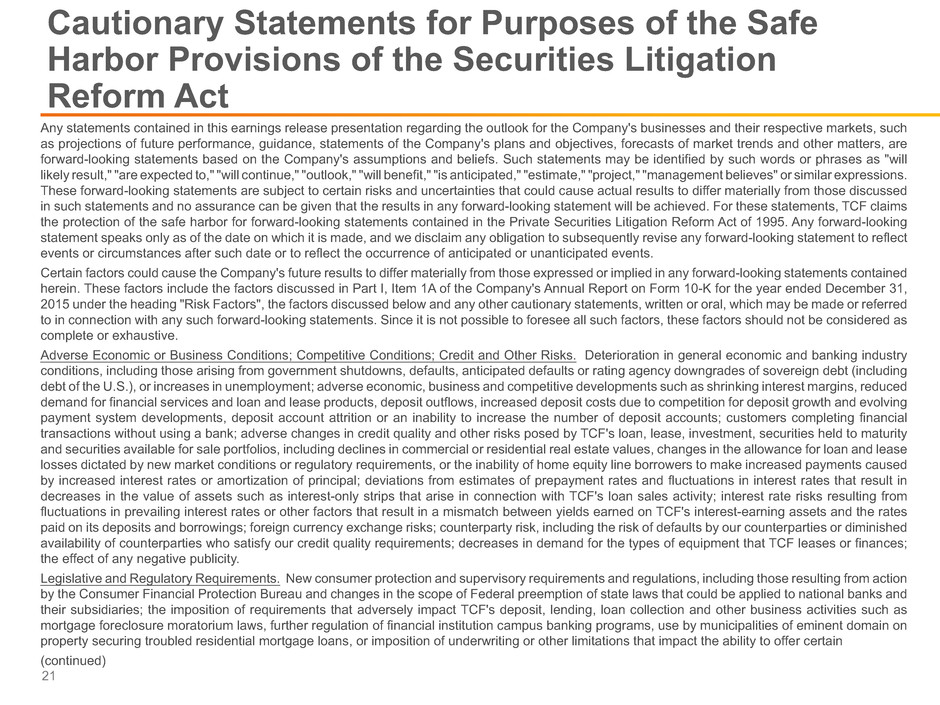
Any statements contained in this earnings release presentation regarding the outlook for the Company's businesses and their respective markets, such
as projections of future performance, guidance, statements of the Company's plans and objectives, forecasts of market trends and other matters, are
forward-looking statements based on the Company's assumptions and beliefs. Such statements may be identified by such words or phrases as "will
likely result," "are expected to," "will continue," "outlook," "will benefit," "is anticipated," "estimate," "project," "management believes" or similar expressions.
These forward-looking statements are subject to certain risks and uncertainties that could cause actual results to differ materially from those discussed
in such statements and no assurance can be given that the results in any forward-looking statement will be achieved. For these statements, TCF claims
the protection of the safe harbor for forward-looking statements contained in the Private Securities Litigation Reform Act of 1995. Any forward-looking
statement speaks only as of the date on which it is made, and we disclaim any obligation to subsequently revise any forward-looking statement to reflect
events or circumstances after such date or to reflect the occurrence of anticipated or unanticipated events.
Certain factors could cause the Company's future results to differ materially from those expressed or implied in any forward-looking statements contained
herein. These factors include the factors discussed in Part I, Item 1A of the Company's Annual Report on Form 10-K for the year ended December 31,
2015 under the heading "Risk Factors", the factors discussed below and any other cautionary statements, written or oral, which may be made or referred
to in connection with any such forward-looking statements. Since it is not possible to foresee all such factors, these factors should not be considered as
complete or exhaustive.
Adverse Economic or Business Conditions; Competitive Conditions; Credit and Other Risks. Deterioration in general economic and banking industry
conditions, including those arising from government shutdowns, defaults, anticipated defaults or rating agency downgrades of sovereign debt (including
debt of the U.S.), or increases in unemployment; adverse economic, business and competitive developments such as shrinking interest margins, reduced
demand for financial services and loan and lease products, deposit outflows, increased deposit costs due to competition for deposit growth and evolving
payment system developments, deposit account attrition or an inability to increase the number of deposit accounts; customers completing financial
transactions without using a bank; adverse changes in credit quality and other risks posed by TCF's loan, lease, investment, securities held to maturity
and securities available for sale portfolios, including declines in commercial or residential real estate values, changes in the allowance for loan and lease
losses dictated by new market conditions or regulatory requirements, or the inability of home equity line borrowers to make increased payments caused
by increased interest rates or amortization of principal; deviations from estimates of prepayment rates and fluctuations in interest rates that result in
decreases in the value of assets such as interest-only strips that arise in connection with TCF's loan sales activity; interest rate risks resulting from
fluctuations in prevailing interest rates or other factors that result in a mismatch between yields earned on TCF's interest-earning assets and the rates
paid on its deposits and borrowings; foreign currency exchange risks; counterparty risk, including the risk of defaults by our counterparties or diminished
availability of counterparties who satisfy our credit quality requirements; decreases in demand for the types of equipment that TCF leases or finances;
the effect of any negative publicity.
Legislative and Regulatory Requirements. New consumer protection and supervisory requirements and regulations, including those resulting from action
by the Consumer Financial Protection Bureau and changes in the scope of Federal preemption of state laws that could be applied to national banks and
their subsidiaries; the imposition of requirements that adversely impact TCF's deposit, lending, loan collection and other business activities such as
mortgage foreclosure moratorium laws, further regulation of financial institution campus banking programs, use by municipalities of eminent domain on
property securing troubled residential mortgage loans, or imposition of underwriting or other limitations that impact the ability to offer certain
(continued)
21
Cautionary Statements for Purposes of the Safe
Harbor Provisions of the Securities Litigation
Reform Act (cont)
variable-rate products; changes affecting customer account charges and fee income, including changes to interchange rates; regulatory actions or changes
in customer opt-in preferences with respect to overdrafts, which may have an adverse impact on TCF; changes to bankruptcy laws which would result in
the loss of all or part of TCF's security interest due to collateral value declines; deficiencies in TCF's compliance under the Bank Secrecy Act in past or future
periods, which may result in regulatory enforcement action including monetary penalties; increased health care costs resulting from Federal health care
reform; regulatory criticism and resulting enforcement actions or other adverse consequences such as increased capital requirements, higher deposit
insurance assessments or monetary damages or penalties; heightened regulatory practices, requirements or expectations, including, but not limited to,
requirements related to enterprise risk management, the Bank Secrecy Act and anti-money laundering compliance activity.
Earnings/Capital Risks and Constraints, Liquidity Risks. Limitations on TCF's ability to pay dividends or to increase dividends because of financial performance
deterioration, regulatory restrictions or limitations; increased deposit insurance premiums, special assessments or other costs related to adverse conditions
in the banking industry; the impact on banks of regulatory reform, including additional capital, leverage, liquidity and risk management requirements or
changes in the composition of qualifying regulatory capital; adverse changes in securities markets directly or indirectly affecting TCF's ability to sell assets
or to fund its operations; diminished unsecured borrowing capacity resulting from TCF credit rating downgrades or unfavorable conditions in the credit
markets that restrict or limit various funding sources; costs associated with new regulatory requirements or interpretive guidance relating to liquidity;
uncertainties relating to future retail deposit account changes, including limitations on TCF's ability to predict customer behavior and the impact on TCF's
fee revenues.
Branching Risk; Growth Risks. Adverse developments affecting TCF's supermarket banking relationships or any of the supermarket chains in which TCF
maintains supermarket branches; costs related to closing underperforming branches; inability to timely close underperforming branches due to long-term
lease obligations; slower than anticipated growth in existing or acquired businesses; inability to successfully execute on TCF's growth strategy through
acquisitions or cross-selling opportunities; failure to expand or diversify TCF's balance sheet through new or expanded programs or opportunities; failure
to successfully attract and retain new customers, including the failure to attract and retain manufacturers and dealers to expand the inventory finance
business; failure to effectuate, and risks of claims related to, sales and securitizations of loans; risks related to new product additions and addition of
distribution channels (or entry into new markets) for existing products.
Technological and Operational Matters. Technological or operational difficulties, loss or theft of information, cyber-attacks and other security breaches,
counterparty failures and the possibility that deposit account losses (fraudulent checks, etc.) may increase; failure to keep pace with technological change,
including the failure to develop and maintain technology necessary to satisfy customer demands; ability to attract and retain employees given competitive
conditions.
Litigation Risks. Results of litigation or government enforcement actions, including class action litigation or enforcement actions concerning TCF's lending
or deposit activities, including account opening/origination, servicing practices, fees or charges, employment practices, or checking account overdraft program
"opt in" requirements; and possible increases in indemnification obligations for certain litigation against Visa U.S.A.
Accounting, Audit, Tax and Insurance Matters. Changes in accounting standards or interpretations of existing standards; federal or state monetary, fiscal
or tax policies, including adoption of state legislation that would increase state taxes; ineffective internal controls; adverse federal, state or foreign tax
assessments or findings in tax audits; lack of or inadequate insurance coverage for claims against TCF; potential for claims and legal action related to TCF's
fiduciary responsibilities.
22

Reconciliation of GAAP to Non-GAAP Financial
Measures – Return on Average Tangible Common
Equity1
QTD QTD
Mar. 31, 2016 Jun. 30, 2016
Net income available to common stockholders (a) $ 43,199 $ 52,847
Plus: Other intangibles amortization 366 366
Less: Income tax expense attributable to other intangibles amortization 131 129
Adjusted net income available to common stockholders (b) $ 43,434 $ 53,084
Average balances:
Total equity $ 2,327,005 $ 2,383,329
Less: Non-controlling interest in subsidiaries 19,224 25,820
Total TCF Financial Corporation stockholders' equity 2,307,781 2,357,509
Less: Preferred stock 263,240 263,240
Average total common stockholders' equity (c) 2,044,541 2,094,269
Less:
Goodwill 225,640 225,640
Other intangibles 2,966 2,596
Average tangible common equity (d) $ 1,815,935 $ 1,866,033
Return on average common equity2 (a) / (c) 8.45% 10.09%
Return on average tangible common equity2 (b) / (d) 9.57% 11.38%
($ thousands)
1 When evaluating capital adequacy and utilization, management considers financial measures such as return on average tangible common
equity. This measure is a non-GAAP financial measure and is viewed by management as a useful indicator of capital levels available to
withstand unexpected market or economic conditions, and also provide investors, regulators and other users with information to be viewed in
relation to other banking institutions.
2 Annualized
23

Reconciliation of GAAP to Non-GAAP Financial
Measures – Tangible Common Equity Ratio and
Tangible Book Value Per Common Share1
Mar. 31, 2016 Jun. 30, 2016
Total equity $ 2,368,841 $ 2,419,758
Less: Non-controlling interest in subsidiaries 25,928 21,660
Total TCF Financial Corporation stockholders' equity 2,342,913 2,398,098
Less: Preferred stock 263,240 263,240
Total common stockholders' equity (a) 2,079,673 2,134,858
Less:
Goodwill 225,640 225,640
Other intangibles 2,760 2,394
Tangible common equity (b) $ 1,851,273 $ 1,906,824
Total assets (c) $ 21,321,102 $ 21,069,510
Less:
Goodwill 225,640 225,640
Other intangibles 2,760 2,394
Tangible assets (d) $ 21,092,702 $ 20,841,476
Common stock shares outstanding (e) 170,604,689 171,005,952
Common equity ratio (a) / (c) 9.75% 10.13%
Tangible common equity ratio (b) / (d) 8.78% 9.15%
Book value per common share (a) / (e) $ 12.19 $ 12.48
Tangible book value per common share (b) / (e) $ 10.85 $ 11.15
1 When evaluating capital adequacy and utilization, management considers financial measures such as the tangible common equity ratio and tangible book value
per common share. These measures are non-GAAP financial measures and are viewed by management as useful indicators of capital levels available to
withstand unexpected market or economic conditions, and also provide investors, regulators and other users with information to be viewed in relation to other
banking institutions.
($ thousands, except per share data)
24
