Attached files
| file | filename |
|---|---|
| EX-23.1 - EXHIBIT 23.1 - hhgregg, Inc. | consent-2016331_ex231.htm |
| EX-32.2 - EXHIBIT 32.2 - hhgregg, Inc. | hgg-2016331xex322.htm |
| EX-32.1 - EXHIBIT 32.1 - hhgregg, Inc. | hgg-2016331_ex321.htm |
| EX-31.1 - EXHIBIT 31.1 - hhgregg, Inc. | hgg-2016331_ex311.htm |
| EX-31.2 - EXHIBIT 31.2 - hhgregg, Inc. | hgg-2016331_ex312.htm |
UNITED STATES
SECURITIES AND EXCHANGE COMMISSION
Washington, D.C. 20549
FORM 10-K
ý | ANNUAL REPORT PURSUANT TO SECTION 13 OR 15(d) OF THE SECURITIES EXCHANGE ACT OF 1934 |
For the fiscal year ended March 31, 2016
OR
¨ | TRANSITION REPORT PURSUANT TO SECTION 13 OR 15(d) OF THE SECURITIES EXCHANGE ACT OF 1934 |
For the transition period from to
Commission file number 001-33600

hhgregg, Inc.
(Exact name of registrant as specified in its charter)
Indiana | 47-4850538 | |
(State or other jurisdiction of incorporation or organization) | (I.R.S. Employer Identification No.) | |
4151 East 96th Street Indianapolis, IN | 46240 | |
(Address of principal executive offices) | (Zip Code) | |
Registrant’s telephone number, including area code: (317) 848-8710 | ||
Securities registered pursuant to Section 12(b) of the Act: | ||
Title of each class | Name of each exchange on which registered | |
Common Stock, par value $.0001 per share | New York Stock Exchange | |
Securities registered pursuant to section 12(g) of the Act:
None
(Title of class)
Indicate by check mark if the registrant is a well-known seasoned issuer, as defined in Rule 405 of the Securities Act. ¨ Yes ý No
Indicate by check mark if the registrant is not required to file reports pursuant to Section 13 or Section 15(d) of the Act. ¨ Yes ý No
Indicate by check mark whether the registrant: (1) has filed all reports required to be filed by Section 13 or 15(d) of the Securities Exchange Act of 1934 during the preceding 12 months (or for such shorter period that the registrant was required to file such reports), and (2) has been subject to such filing requirements for the past 90 days. ý Yes ¨ No
Indicate by check mark whether the registrant has submitted electronically and posted on its corporate Web site, if any, every Interactive Data File required to be submitted and posted pursuant to Rule 405 of Regulation S-T (§ 232.405 of this chapter) during the preceding 12 months (or for such shorter period that the registrant was required to submit and post such files). Yes ý No ¨
Indicate by check mark if disclosure of delinquent filers pursuant to Item 405 of Regulation S-K (§229.405 of this chapter) is not contained herein, and will not be contained, to the best of registrant’s knowledge, in definitive proxy or information statements incorporated by reference in Part III of this Form 10-K or any amendment to this Form 10-K. ý
Indicate by check mark whether the registrant is a large accelerated filer, an accelerated filer, a non-accelerated filer, or a smaller reporting company. See the definitions of “large accelerated filer,” “accelerated filer” and “smaller reporting company” in Rule 12b-2 of the Exchange Act.
Large accelerated filer | ¨ | Accelerated Filer | ý | |
Non-accelerated filer | ¨(Do not check if a smaller reporting company) | Smaller reporting company | ¨ | |
Indicate by check mark whether the registrant is a shell company (as defined in Rule 12b-2 of the Exchange Act). ¨ Yes ý No
The aggregate market value of the voting and non-voting common stock held by non-affiliates of the registrant as of the last day of the second fiscal quarter ended September 30, 2015 was approximately $61,049,302 based on the closing stock price of $4.87 per share on that day. (For purposes of this calculation, all of the registrant’s directors and executive officers are deemed affiliates of the registrant.)
The number of shares of hhgregg, Inc.’s common stock outstanding as of May 16, 2016 was 27,707,978.
DOCUMENTS INCORPORATED BY REFERENCE
Portions of the Registrant’s definitive Proxy Statement (to be filed pursuant to Regulation 14A within 120 days after the Registrant’s fiscal year-end of March 31, 2016) for the regular meeting of stockholders to be held on August 1, 2016 are incorporated by reference into Part III of this Annual Report on Form 10-K.
TABLE OF CONTENTS
Part I. | ||
Item 1. | Business | |
Item 1A. | Risk Factors | |
Item 1B. | Unresolved Staff Comments | |
Item 2. | Properties | |
Item 3. | Legal Proceedings | |
Item 4. | Mine Safety Disclosures | |
Part II. | ||
Item 5. | Market for Registrant’s Common Equity, Related Stockholder Matters and Issuer Purchases of Equity Securities | |
Item 6. | Selected Financial Data | |
Item 7. | Management’s Discussion and Analysis of Financial Condition and Results of Operations | |
Item 7A. | Quantitative and Qualitative Disclosures about Market Risk | |
Item 8. | Financial Statements and Supplementary Data | |
Item 9. | Changes in and Disagreements with Accountants on Accounting and Financial Disclosure | |
Item 9A. | ||
Item 9B. | Other Information | |
Part III. | ||
Item 10. | Directors, Executive Officers and Corporate Governance | |
Item 11. | Executive Compensation | |
Item 12. | Security Ownership of Certain Beneficial Owners and Management and Related Stockholder Matters | |
Item 13. | Certain Relationships and Related Transactions, and Director Independence | |
Item 14. | Principal Accounting Fees and Services | |
Part IV. | ||
Item 15. | Exhibits, Financial Statement Schedules | |
2
Cautionary Note Regarding Forward-Looking Statements
Section 27A of the Securities Act of 1933, as amended, and Section 21E of the Securities Exchange Act of 1934, as amended (the “Exchange Act”), provide a “safe harbor” for forward-looking statements to encourage companies to provide prospective information about their companies. Some of the statements in this document and any documents incorporated by reference constitute “forward-looking statements” within the meaning of Section 21E of the Exchange Act. These statements relate to future events or our future financial performance and involve known and unknown risks, uncertainties and other factors that may cause our businesses or our industries’ actual results, levels of activity, performance or achievements to be materially different from those expressed or implied by any forward-looking statements. Such statements include statements about our plans, strategies, prospects, changes, outlook and trends in our business and the markets in which we operate; our drivers of customer loyalty, referrals and repeat business; the impact of a motivated full-time sales force; expectations around slowing future store growth; expectations around becoming a national retailer; our approach to building store density; impact of our store development strategy on our results of operations, net sales growth and capital expenditures; how we enhance our brand image and customer experience; awareness around our financing offers; non-recourse nature of financing offerings; increasing our service offerings; changes to our e-commerce experience; improvements to customer delivery capabilities; the richness of our products’ features and innovations; our ability to compete in our market and industry; our ability to cut costs; our ability to generate strong cash flows; customer purchases of higher-margin, feature rich products; the outcome and impact of legal proceedings; payment of dividends; emphasis on appliances in our marketing strategies; expectations around the U.S. housing market and general economy; impact of accounting policies and estimates; expectations around capital expenditures; our revolving credit facility; ability to fund operations; ability to obtain additional debt financing; and our interest rate risk. In some cases, you can identify forward-looking statements by terminology such as “may,” “will,” “could,” “would,” “should,” “expect,” “plan,” “anticipate,” “intend,” “tends,” “believe,” “estimate,” “predict,” “potential” or “continue” or the negative of those terms or other comparable terminology. These statements are only predictions. Actual events or results may differ materially because of market conditions in our industries or other factors that are in some cases beyond our control. All of the forward-looking statements are subject to risks and uncertainties. Some of the key factors that could cause actual results to differ from our expectations are:
• | our ability to successfully execute our strategies and initiatives, particularly in returning the Company to profitable growth; |
• | our ability to increase customer traffic and conversion; |
• | competition in the retail industry; |
• | our ability to maintain a positive brand perception and recognition; |
• | our ability to attract and retain qualified personnel; |
• | our ability to maintain the security of customer, associate and Company information; |
• | rules, regulations, contractual obligations, compliance requirements and fees associated with accepting a variety of payment methods; |
• | our ability to effectively achieve cost cutting initiatives; |
• | our ability to generate strong cash flows to support our operating activities; |
• | our relationships and operations of our key suppliers; |
• | our ability to generate sufficient cash flows to recover the fair value of long-lived assets; |
• | our ability to maintain and upgrade our information technology systems; |
• | the fluctuation of our comparable store sales; |
• | the effect of general and regional economic and employment conditions on our net sales; |
• | our ability to meet financial performance guidance; |
• | disruption in our supply chain; |
• | changes in trade regulation, currency fluctuations and prevailing interest rates; and |
• | the potential for litigation. |
Other factors that could cause actual results to differ from those implied by the forward-looking statements in this Annual Report on Form 10-K are more fully described in the “Risk Factors” section and elsewhere herein. Given these risks and uncertainties, you are cautioned not to place undue reliance on these forward-looking statements. The forward-looking
3
statements included herein are made only as of the date hereof. Except as required by law, we do not undertake and specifically decline any obligation to update any of these forward-looking statements or to publicly announce the results of any revisions to these forward-looking statements to reflect future events or developments.
4
PART I. | |
ITEM 1. | Business. |
Our Company
Unless the context otherwise requires, the terms “we”, “us”, “our”, “hhgregg” and the “Company” in this Annual Report on Form 10-K refer to hhgregg, Inc. and its subsidiaries. Our fiscal year ends on March 31, refer to Note 1 of the Consolidated Financial Statements.
Founded in 1955 and operating under the name hhgregg® , we are a multi-regional retailer which provides an extensive selection of premium appliances, consumer electronics, home products and computers and tablets in our 226 brick-and-mortar stores in 20 states and nationwide via hhgregg.com. We operate in one reportable segment and do not have international operations.
We differentiate ourselves from our competitors by providing our customers with a consultative and educational purchase experience, combined with superior delivery and installation capabilities on many of our products. Our superior customer purchase experience has enabled us to successfully compete against other leading appliance and consumer electronics retailers over the course of our 61-year history. We have a knowledgeable and friendly salesforce that is trained to meet the buying needs of our customers. We design our stores and e-commerce platform to be visually appealing to our customers and to highlight our premium selection of appliances, consumer electronics, and furniture.
Our sales can be categorized into four product categories:
• | Appliances: We offer a broad selection of major appliances, including the latest generation refrigerators, cooking ranges, dishwashers, freezers, washers and dryers, grills, air conditioners and small home appliances sold under a variety of leading brand names. Representative brands include Amana, Bosch, Frigidaire, GE, Haier, KitchenAid, LG, Maytag, Samsung and Whirlpool. For fiscal 2016, home appliances represented 53% of net sales. Historically, our appliance business has provided us with financial stability and consistently strong cash flow |
• | Consumer electronics: We offer a broad selection of the latest consumer electronics products, such as 4K and OLED televisions, audio systems, cameras and Blu-ray players. Representative brands include Curtis, Epson, Haier, Hisene, LG, RCA, Phillips, Samsung, Seiki, Sharp, and Sony. For fiscal 2016, consumer electronics products represented 36% of net sales. Our consumer electronics products are typically more seasonal in nature. |
• | Home products: We offer furniture, mattresses and other home products. Our furniture selections focus on the great room, a large room in a modern house that combines features of a living room with those of a dining room or family room. Representative brands include Bello, Corinthian, Delta, Jackson, Homestretch, Serta, South Motion, Standard Furniture, Steve Silver and Tempur-Pedic. For fiscal 2016, home products represented 6% of net sales. |
• | Computers and tablets: We offer a broad selection of computers, computer accessories and tablets. Representative brands include Apple, Asus, Canon, Curtis, Dell, Kindle, Lenovo, Hewlett Packard, Samsung and Toshiba. For fiscal 2016, computers and tablets represented 5% of net sales. |
Additionally, we sell a comprehensive suite of services including third-party premium service plans (“PSPs”), third-party in-home service and repair of our products, delivery and installation and in-home repair and maintenance. Services and PSP revenues are included as a component of net sales in each of the categories listed above. Our suite of services is aimed at enhancing our customers’ superior purchase experience and aims to be a connection for us to our customers for the life of the product.
Brand Platform
Our brand platform is focused on service, selection and satisfaction. We want hhgregg to be the first, last and best place for our customers to turn to for the products that make a house a home. Our objective with our brand platform is to serve our customers in a manner that generates loyalty, referrals and repeat business. We focus on making every customer’s purchase experience a positive one and aim to be the primary destination for home appliances, consumer electronics, computers and tablets and home products in our markets.
Our philosophy for providing our customers with a superior purchase experience includes:
5
• | employing a highly motivated, commissioned sales force and training them so they are able to educate our customers on the benefits of feature-rich, higher-margin products; |
• | offering a deep product assortment in our four core categories; |
• | providing a warm and bright store ambiance that favorably showcases our products; |
• | providing quick and efficient delivery for many of our products and quality in-home installation services; |
• | offering extended-term financing through third-party providers to qualified customers; |
• | soliciting customer feedback to allow us to monitor and improve individual store, employee and delivery team performance; |
• | offering customer support through our central call center seven days per week or via social media; and |
• | delivering a multi-channel that is integrated with our store network and gives our customers 24-hour access to our products and information. |
Our Brand Platform has the following key components:
Multi-channel. Our multi-channel strategy provides our customers with a superior shopping experience by allowing consumers to experience an integrated online and in-store purchase experience through our website, mobile app, social media and brick and mortar stores. Our website, hhgregg.com, provides a 24/7 shopping experience for our customers and helps reduce the complexity of product decisions for home product purchases by providing product information, features and benefits of our products and services, customer ratings and reviews, availability of rebate incentive opportunities, store locations and hours of operation. These tools help consumers make more informed decisions and give them confidence as they undertake the purchasing process. Additionally, these tools drive in-store purchases of our merchandise and services. Our multi-channel strategy, which we call Store2Door service, gives customers the ability to make a purchase in store, to buy online and pick up either in store or to buy online and have the product shipped or delivered. Over the past year, we have added features including an expanded assortment of products available online only, a mobile phone application, mobile commerce capabilities, online financing application process and we have continued to make infrastructure upgrades. We expect to continue to focus investment dollars on our multi-channel capabilities in fiscal 2017.
Fine Lines. In order to enhance our appliance product selection, we plan to open additional Fine Lines departments. Fine Lines departments incorporate ultra premium appliance brands that are not found in our hhgregg stores. Fine Lines departments have historically improved our appliance revenues in stores. As of March 31, 2016, 11 of our stores had Fine Lines departments. We expect to open up to 15 additional Fine Lines departments in fiscal 2017.
Attractive Finance Offerings. We offer customers financing through a private-label credit card with a third-party financial institution. The third-party financial institution assumes the risk of collection from our customers and has no recourse against us for any uncollected amounts. Additionally, we offer secondary financing for lower-middle income customers that do not qualify for the private-label credit card and “lease to own” financing. Both financing offers are offered through third-party providers and are non-recourse to our business.
Best in class delivery and installation capabilities. We offer delivery for many of our products and also provide quality in-home installation services through our outsourced delivery partners. Our network of 14 regional and local distribution centers provides a local supply of inventory that supports our delivery strategy. We conduct a significant number of customer surveys each year to provide us with feedback to continue improving our superior customer purchase experience to ensure customer satisfaction. Over the past 12 months, we have invested in greater delivery capabilities so customers can better communicate with the delivery drivers regarding the time of their delivery.
Highly trained sales associates. We are able to educate our customers on the features and benefits of the products we offer through our extensively trained, commissioned sales force. We believe that when fully informed, customers frequently purchase higher-end, more feature-rich products. We seek to hire individuals who are career-oriented and motivated by a commission-based environment. Our sales associates are compensated based on both sales and profitability of the products and services they sell. New sales associates are required to complete an initial in-house training program focused on product knowledge and functionality, customer service and general store operations before interacting with our customers. Sales associates also participate in on-going training to stay current with new product offerings and customer service initiatives. This on-going training includes quarterly meetings with vendors to learn about upcoming product releases.
6
Merchandising and Purchasing
Merchandise. We offer an extensive product and brand selection at everyday competitive prices and provide a balance of appliances, consumer electronics products, home products and computers and tablets. Our premium products help drive margins and profitability while our lower-margin products help drive customer traffic. In addition, we offer additional products not carried in the stores via www.hhgregg.com.
Vendor Relationships. Our top 10 and 20 suppliers accounted for 84.5% and 91.8%, respectively, of merchandise purchased by us during fiscal 2016. Our key suppliers include Bosch, Curtis, Frigidaire, GE, Haier, Hewlett Packard, LG, Samsung, Sony and Whirlpool.
Our purchasing strategy varies by vendor and product line. We do not have long-term contracts with any of our major suppliers. Inventory purchases are managed through the placement of purchase orders with our vendors. Our ability to sell a broad selection of products has made us an important partner to our vendors for showcasing their heavily-featured product offerings and introducing new products and technologies to consumers. In an effort to support our strategy, vendors offer us various incentives including volume discounts, trade financing, co-op advertising, purchase discounts and allowances, promotional items and, in some cases, inventory on a consignment basis.
Distribution and Warehousing
Our distribution and warehousing functions are designed to optimize inventory availability and turnover, increase delivery efficiency and minimize product handling. Our distribution and warehousing system at March 31, 2016 consisted of five regional distribution centers, or RDCs, and nine local distribution centers, or LDCs. RDCs receive products directly from manufacturers and stock merchandise for local customer delivery as well as store and LDC replenishment. LDCs receive inventory daily from their respective RDCs or directly from manufacturers for home delivery. Merchandise is generally not transferred between stores. Our RDCs and LDCs operate seven days per week. All of our distribution facilities are leased.
The following table sets forth certain information relating to our RDCs and LDCs as of March 31, 2016:
Facility | Opening Date | Area Served | Size (sq. ft) | |||
RDC: | ||||||
Atlanta, Georgia | January 2003 | Southeast | 273,200 | |||
Brandywine, Maryland | March 2010 | Mid-Atlantic | 393,440 | |||
Aurora, Illinois | July 2011 | Great Lakes | 247,360 | |||
Indianapolis, Indiana | June 1986 | Midwest | 319,458 | |||
Davenport, Florida | April 2008 | Florida | 282,126 | |||
LDC: | ||||||
Charlotte, North Carolina | April 2005 | Charlotte | 60,000 | |||
Cincinnati, Ohio | March 1999 | Cincinnati | 100,800 | |||
Cleveland, Ohio | September 2001 | Cleveland | 60,000 | |||
Columbus, Ohio | August 1999 | Columbus | 89,643 | |||
Pembroke Park, Florida | May 2011 | Miami | 66,095 | |||
Nashville, Tennessee | October 2006 | Nashville | 50,000 | |||
Philadelphia, Pennsylvania | April 2010 | Philadelphia | 86,304 | |||
Pittsburgh, Pennsylvania | September 2011 | Pittsburgh | 20,465 | |||
Raleigh, North Carolina | August 2007 | Raleigh | 108,000 | |||
Competition
The appliance and consumer electronics industries are highly competitive and concentrated among a group of major retailers. The home furnishing industry, including the furniture and mattress businesses, are highly fragmented with sales coming from various types of retailers. Our stores compete against other consumer electronics retailers, home furnishing retailers, specialty home office retailers, mass merchants, home improvement superstores and internet-based businesses. Our stores also compete against independent dealers, regional chain discount stores, wholesale clubs and other specialty single- and
7
multi-unit retail stores. Mass merchants continue to increase their offerings of consumer electronics products. Additionally, internet retailers continue to gain market share in smaller size consumer electronics products.
Our product offerings compete on product selection, price and customer service. We differentiate ourselves through our emphasis on an extensive product offering and customer service and satisfaction while matching our competitors on price, with some exceptions including certain holiday promotions. We believe that our highly trained commissioned sales force, broad product and brand offerings and customer support services, including delivery and installation and finance offerings, allow us to compete effectively in our markets for the following reasons:
• | Our commissioned sales force is motivated to attend to customer needs quickly and is knowledgeable about the products we carry. The majority of our key competitors pay their sales force on an hourly basis. Because our sales staff is commissioned and highly trained in product knowledge, we believe our sales force is driven to more quickly and efficiently assist our customers in making their purchase decisions. We believe that when fully informed, customers purchase higher-end, feature-rich products due to an appreciation of the performance of those products. |
• | By combining this knowledgeable sales force with a broad selection of key brands and products with complex, premium features, we differentiate ourselves from our competitors. |
• | We promote our products both in our stores and through advertising. We also highlight our service offerings, such as delivery, in-home installation and private-label and other credit financing promotions. These services are key to our customer base, which appreciates better product information, high-end products, quality delivery and installation and financing offers. |
Environmental Matters
We are not aware of any federal, state or local provisions which have been enacted or adopted regulating the discharge of materials into the environment, or otherwise relating to the protection of the environment, that have materially affected, or are likely to materially affect, our net earnings or competitive position, or have resulted or are expected to result in material capital expenditures. During fiscal 2016, we had no capital expenditures for environmental control facilities and no such expenditures are anticipated in the foreseeable future.
Seasonality
We experience seasonal fluctuations in our net sales and operating results due in part to seasonal shopping patterns for our products. For example, in fiscal 2016 and 2015, we generated 30.3% and 31.3%, respectively, of our net sales in the fiscal quarter ended December 31, which includes the holiday selling season.
Trade Names and Trademarks
We have registered, acquired the registration of, have pending registrations for, or claim ownership of the following trade names and trademarks that are important in our branding and marketing of our business: Extraordinary Appliances for the Heart of your Home®, Fear of Better Options™, FOBO™, hhgregg®, hhgregg (Stylized)®, hhgregg (and Design)®, HHGREGG.COM®, Fill Your Home with Happy®, Fine Lines®, hhgregg Fine Lines (and Design)®.
Employees
As of March 31, 2016, we employed approximately 5,100 employees, of whom approximately 73% were full-time. We have no collective bargaining agreements covering any of our employees and have never experienced any material labor disruption. We consider our employee relations to be good.
Reincorporation
On August 31, 2015, hhgregg Inc., a Delaware corporation and our predecessor entity, changed its state of incorporation from Delaware to Indiana. This reincorporation was effectuated by a merger ("Reincorporation Merger") of the Company with and into hhgregg Indiana, Inc., an Indiana corporation (“hhgregg Indiana”), then a wholly-owned Indiana subsidiary of the Company established for such purpose. At that time, hhgregg Indiana changed its name to “hhgregg, Inc.”
8
Working Capital
We fund our business operations through a combination of available cash, cash from operations and our revolving credit facility as described in Note 5 of the Consolidated Financial Statements.
Available Information
We are subject to the reporting requirements of the Exchange Act and its rules and regulations. The Exchange Act requires us to file reports, proxy statements and other information with the U.S. Securities and Exchange Commission (the “SEC”). Copies of these reports, proxy statements and other information can be read and copied at:
SEC Public Reference Room
100 F Street N.E.
Washington, D.C. 20549
Information on the operation of the Public Reference Room may be obtained by calling the SEC at 1-800-SEC-0330.
The SEC maintains a website that contains reports, proxy statements and other information regarding issuers that file electronically with the SEC. These materials may be obtained electronically by accessing the SEC’s website at www.sec.gov.
We make available, free of charge on our website, our Annual Report on Form 10-K, Quarterly Reports on Form 10-Q, Current Reports on Form 8-K and amendments to these reports filed or furnished pursuant to Section 13(a) or 15(d) of the Exchange Act, as soon as reasonably practicable after we electronically file these documents with, or furnish them to, the SEC. These documents are posted on our website at www.hhgregg.com — select the “Investor Relations” link and then the “Financials and SEC Filings” link.
We also make available, free of charge on our website, the charters of the Audit Committee, Compensation Committee, Executive Committee and Nominating and Corporate Governance Committee, as well as the Code of Business Conduct and Ethics, Whistleblower Policy, Related Party Policy and the Corporate Governance Guidelines. These documents are posted on our website at www.hhgregg.com — select the “Investor Relations” link and then the “Corporate Governance” link.
Copies of any of the above-referenced documents will also be made available to any stockholder, free of charge, upon written request to:
hhgregg, Inc.
Director of Investor Relations
4151 E 96th Street
Indianapolis, IN 46240
9
ITEM 1A. | Risk Factors |
Described below are certain risks that our management believes are applicable to our business and the industry in which we operate. You should carefully consider each of the following risks and all of the information set forth in this Annual Report on Form 10-K.
If any of the events described below occur, our business, financial condition, results of operations, liquidity or access to the capital markets could be materially adversely affected. The following risks could cause our actual results to differ materially from our historical experience and from results predicted by forward-looking statements made by us or on our behalf related to conditions or events we anticipate may occur in the future. All forward-looking statements made by us or on our behalf are qualified by the risks below.
Our success depends upon our effective execution of our strategies.
Our success depends on our ability to effectively identify, develop and execute our strategies. In the upcoming year we intend to execute on key initiatives to grow revenue, increase productivity and the organization of our business as described in Item 7 “Management's Discussion and Analysis of Financial Condition and Results of Operations - Overview.” During fiscal 2017, our focus remains on continuing the Company's return to profitable growth, building upon the efforts from fiscal 2016, and impacting the long-term health of the Company. However, it may take longer than expected to achieve our objectives, and actual results may be materially different than planned. Our ability to improve our operating results depends upon a significant number of factors, some of which are beyond our control, including:
• | customer response to our marketing and merchandise strategies; |
• | our ability to properly deploy and utilize capital and other resources to better position our business to drive additional traffic and increase sales in our comparable store base; |
• | our ability to maintain and increase net sales in both new and existing product categories; |
• | our ability to provide customers with highly trained and consultative sales associates, best-in-class delivery and installation services and compelling financing offers; |
• | our ability to respond to competitive pressures in our industry and maintain our market share; |
• | our ability to effectively manage inventory; |
• | the success of our omnichannel strategy; |
• | our ability to benefit from capital improvements made to our store environment; |
• | our ability to access adequate and uninterrupted supply of merchandise from suppliers at expected levels and on acceptable terms; and |
• | general economic conditions. |
Failure to execute these initiatives and strategies could have a material adverse effect on our business, financial condition and results of operations.
Our ability to increase sales and store productivity is largely dependent upon our ability to increase customer traffic and conversion.
Customer traffic depends upon our ability to successfully market compelling merchandise assortments as well as present an appealing shopping environment and experience to customers. Our marketing model utilizes all of the major channels for advertising with a focus on TV, print, digital and direct mail. As part of our strategic initiatives, we continually test a variety of marketing media mix tactics to learn and make adjustments between medias in order to efficiently and effectively reach our targeted customers to deliver sustainable profits. Our marketing strategy may fail to reach the intended market and may not be successful in generating incremental customer traffic or increasing conversion rates. This could result in a continued or accelerated reduction in customer traffic and conversion. Any such outcome, alone or in combination with other events or circumstances, may adversely affect our operating results. In addition, external events outside of our control, including pandemics, terrorist threats, domestic conflicts and civil unrest, may influence customers' decisions to visit stores or might otherwise cause customers to avoid public places. There is no assurance that we will be able to reverse any decline in traffic or that any such decline in store traffic will be offset by an increase in web sales. We may need to respond to any declines in
10
customer traffic or conversion rates by increasing markdowns or promotions to attract customers, which could adversely impact our gross margins, operating results and cash flows from operating activities.
The retail industry that we compete in has strong competition from traditional store-based retailers, multi-channel retailers, internet-based businesses, our vendors, and other forms of retail e-commerce, which directly affects our sales and margins.
The retail industry for major home appliances, consumer electronics and home furniture is intensely competitive. We compete with many other local, regional, and national retailers, e-commerce retailers and certain of our vendors who offer products directly to consumers. Price is of primary importance to customers and price transparency and comparability continues to increase, particularly as a result of digital technology. Some online-only businesses have lower operating costs than us and are not required to collect and remit sales taxes in all U.S. states, which can negatively impact the ability of multi-channel retailers to be price competitive on a tax-included basis. The ability of consumers to compare prices on a real-time basis puts additional pressure on us to maintain competitive prices to attract customers. Also, some of our competitors have greater financial resources than us and may be able to offer lower prices than us for a sustained period of time. Our competitors may use a number of different strategies to compete against us, including lower pricing, more aggressive advertising and marketing, enhanced product and service offerings, extension of credit to customers on terms more favorable than we make available, innovative store formats, including store within a store, improved retail sales methods, enhanced customer service experiences, online product offerings and expansion into markets where we currently operate.
The retail industry continues to experience a trend towards an increase in sales initiated online and using mobile applications. Customer expectations about the methods by which they purchase and receive products or services are becoming more demanding. Customers are increasingly using technology and mobile devices to rapidly compare products and prices, determine real-time product availability and purchase products which changes the way we interact with them. We must continually anticipate and adapt to these changes in the purchasing process. Our website, hhgregg.com, is a sales channel for our products, and is also a method of making product information available to customers that impacts our in-store sales. In addition to hhgregg.com, we have multiple affiliated websites and mobile apps through which we seek to inform, cross-sell and otherwise interact with our customers. Our website is a significant component of our advertising strategy. In order to promote our products and services, allow our customers to complete credit applications in the privacy of their homes and drive traffic to our stores, we must effectively create, design, publish and distribute content over the internet. There can be no assurance that we will be able to design and publish web content with a high level of effectiveness or grow our e-commerce business in a profitable manner. Because our business strategy is based on offering superior levels of customer service and a full range of services to complement the products we offer, our cost structure is higher than some of our competitors, and this, in conjunction with price transparency, puts pressure on our margins.
If we fail to anticipate changes in consumer preferences and maintain positive brand perception and recognition or if there is a lack of new product introductions and innovation, our net sales and profitability may decline.
Our products must appeal to a broad range of consumers whose preferences cannot be predicted with certainty and are subject to change. Our ability to maintain and increase net sales depends to a large extent on the periodic introduction and availability of new products and technologies. Our success depends upon our ability to anticipate and respond in a timely manner to trends in consumer preferences relating to major household appliances and consumer electronics such as OLED and Ultra HD 4K televisions as well as alternative options for delivery of those products quickly and at a low-cost to consumers. Significant deviations from the anticipated consumer preferences for the products we sell or related services we provide could result in lost net sales and lower margins due to the need to mark down excess inventory. If we are unable to effectively introduce and sell new products to our customers, our business and results of operations could be adversely affected. Conversely, if we fail to anticipate or react to consumer demand for our products, we may experience inventory shortages, which would result in lost sales and could negatively affect our customer goodwill, our brand image and our profitability.
We believe that a focus on customer service fosters the development of our brand recognition and reputation. If we are unable to maintain our high level of customer service, our brand recognition, reputation, business and results of operations could be adversely affected. Additionally, the increasing usage of web-based social media means that consumer feedback and other information about our Company are shared with a broad audience in a manner that is easily accessible and rapidly disseminated. The impact of such feedback could negatively affect our brand perception and recognition, and as a result could result in declines in customer loyalty, lower employee retention and productivity, vendor relationship issues and other factors, all of which could materially and adversely affect our business and results of operations.
11
If we fail to hire, train and retain key management, qualified managers, sales associates and other employees, we could have difficulty implementing our business strategy, which may result in reduced net sales, operating margins and profitability.
Our performance is highly dependent on attracting and retaining qualified employees, including our senior management team and other key employees. A key element of our competitive strategy is to provide product expertise to our customers through our extensively trained, commissioned sales associates, which, we believe, results in more of our customers purchasing higher-margin, feature-rich products. The turnover rate in the retail industry is relatively high, and there is an ongoing need to recruit and train new employees. If we are unable to attract and retain qualified personnel as needed in the future, our level of customer service may decline, which may decrease our net sales and profitability. Other factors that impact our ability to maintain sufficient levels of qualified employees in all areas of the business include, but are not limited to, the Company’s reputation, employee morale, the current macroeconomic environment, competition from other employers and our ability to offer adequate compensation packages. Adverse changes in health care costs could also adversely impact our ability to achieve our operational and financial goals and to offer attractive benefit programs to our employees. Our ability to control labor costs, which may impact our ability to hire and retain qualified personnel, is subject to numerous external factors, including prevailing wage rates, the impact of legislation or regulations governing healthcare benefits or labor relations. If our labor and/or benefit costs increase, we may not be able to hire or maintain qualified personnel to the extent necessary to execute our competitive strategy, which could adversely affect our results of operations.
If we do not maintain the security of customer, associate, or Company information, we could damage our reputation, incur substantial additional costs and become subject to litigation.
The use and handling of personally identifiable data by us, our employees, our business associates and third parties is regulated at the state, federal and international levels. We are also contractually obligated to comply with certain industry standards regarding payment card information. Increasing costs associated with information security, such as increased investment in technology, the costs of compliance and costs resulting from consumer fraud, could cause our business and results of operations to suffer materially. Additionally, the success of our online operations depends upon the secure transmission of customer and other confidential information over public networks, including the use of cashless payments. While we take significant steps to protect this information, lapses in our controls or the intentional or negligent actions of employees, business associates or third parties may undermine our security measures. As a result, unauthorized parties may obtain access to our data systems and misappropriate customer and other confidential data. There can be no assurance that advances in computer capabilities, new discoveries in the field of cryptography or other developments will prevent the compromise of our customer transaction processing capabilities and customer personal data. Furthermore, because the methods used to obtain unauthorized access change frequently and may not be immediately detected, we may be unable to anticipate these methods or promptly implement preventative measures. There is no guarantee that the procedures that we have implemented to protect against unauthorized access to secured data are adequate to safeguard against all data security breaches. Any such compromise of our security or the security of information residing with our business associates or third parties could have a material adverse affect on our reputation and may expose us to material costs, penalties, compensation claims, lost sales, fines and lawsuits. In addition, any compromise of our data security may materially increase the costs we incur to protect against such breaches and could subject us to additional legal risk.
We are subject to payment-related risks that could increase our operating costs, expose us to fraud or theft, subject us to potential liability, impact our credit card financing offers available to customers and potentially disrupt our business and have a material adverse impact on our net sales and profitability.
We accept payments using a variety of methods, including cash, checks, credit and debit cards, our private label credit cards, and gift cards, and we may offer new payment options over time. Acceptance of these payment options subjects us to rules, regulations, contractual obligations and compliance requirements, including payment network rules and operating guidelines, data security standards and certification requirements, and rules governing electronic funds transfers. These requirements may change over time or be reinterpreted, making compliance more difficult or costly. For certain payment methods, including credit and debit cards, we pay interchange and other fees, which may increase over time and raise our operating costs. We rely on third parties to provide payment processing services, including the processing of credit cards, debit cards, and other forms of electronic payment. If these companies become unable to provide these services to us, or if their systems are compromised, it could potentially disrupt our business. The payment methods that we offer also subject us to potential fraud and theft by criminals, who are becoming increasingly more sophisticated, seeking to obtain unauthorized access to or exploit weaknesses that may exist in the payment systems. If we fail to comply with applicable rules or requirements for the payment methods we accept, or if payment-related data is compromised due to a breach or misuse of data, we may be liable for costs incurred by payment card issuing banks and other third parties or subject to fines and higher transaction fees, or our ability to accept or facilitate certain types of payments may be impaired. In addition, our customers
12
could lose confidence in certain payment types, which may result in a shift to other payment types or potential changes to our payment systems that may result in higher costs. As a result, our business and operating results could be adversely affected.
We offer private-label credit cards through third-party financial institutions that manage and directly extend credit to our customers. Additionally, we offer secondary financing for lower-middle income customers that do not qualify for the private-label credit card and “lease to own” financing, both of which are through third-party providers and non-recourse to our business. If any of our programs ended prematurely, the terms and provisions, or interpretations thereof, were substantially modified, or approval rates or types of financing offered to our customers amended, promotional financing volumes and our net sales and results of operations, could be materially adversely affected.
Failure to effectively achieve our cost cutting initiatives could have a material adverse affect on our profitability.
As part of our continuing efforts to improve operating efficiencies and reduce operating costs, we have implemented numerous cost cutting initiatives. We plan to continue to implement additional cost cutting initiatives in fiscal 2017 and beyond. If we are unable to achieve, or have any unexpected delays in achieving, the anticipated cost savings and benefits associated with these initiatives, our results of operations and cash flow may be adversely affected.
Additionally, certain elements of our cost structure are largely fixed in nature. The negative impact of consumer spending on our sales results makes it more challenging for us to maintain or increase our operating income. The competitiveness in our industry and increasing price transparency means that the focus on achieving efficient operations is greater than ever. Failure to manage our labor and benefit rates, advertising and marketing expenses, operating leases, other store expenses or indirect spending could materially adversely affect our profitability.
We depend upon strong cash flows from our operations to supply capital to fund our operations.
Our business depends upon our operations to continue to generate strong cash flow to supply capital to support our general operating activities. Our inability to continue to generate sufficient cash flows to support these activities could adversely affect our financial performance including our earnings per share. We borrow on occasion to finance our activities, and if financing were not available to us in adequate amounts and on appropriate terms we needed, it could also adversely affect our financial performance.
A disruption in our relationships with, or in the operations of, any of our key suppliers could cause our net sales and profitability to decline.
The success of our business and our growth strategy depends to a significant degree on our relationships with our suppliers. Our largest suppliers include Bosch, Curtis, Frigidaire, GE, Haier, Hewlett Packard, LG, Samsung, Sony and Whirlpool. Our top 10 and 20 suppliers represented 84.5% and 91.8%, respectively, of our purchases in fiscal 2016. The loss of any one or more of our key suppliers or our failure to establish and maintain terms with these and other suppliers could materially adversely affect our supply and assortment of products, as we may not be able to find suitable replacements to supply products at competitive prices. Our ability to continue to identify and develop relationships with qualified suppliers who can satisfy our high standards for quality and responsible sourcing, as well as our need to access products in a timely and efficient manner, is a significant challenge. Our ability to access products from our suppliers can be adversely affected by political instability, military conflict, the financial instability of suppliers (particularly in light of continuing economic difficulties in various regions of the world), suppliers’ noncompliance with applicable laws, trade restrictions, tariffs, currency exchange rates, any disruptions in our suppliers’ logistics or supply chain networks, and other factors beyond our or our suppliers’ control.
If products that we purchase from vendors are damaged or prove to be defective, we may not be able to return products to these vendors and obtain refunds or replacements of our purchase price or obtain other indemnification from them, which could have a material adverse affect on our net sales and results of operations.
The financial condition of our suppliers may also adversely affect their access to capital and liquidity with which to maintain their inventory, production levels and product quality and to operate their businesses, all of which could adversely affect our supply chain. Negative impacts on the financial condition of any of our suppliers may cause suppliers to reduce their offerings of customer incentives and vendor allowances, cooperative marketing expenditures and product promotions. It may also cause them to change their pricing policies, which could impact demand for their products. The current weakness in, and volatility of, the overall economy makes it difficult for us and our suppliers to accurately forecast future product demand trends, which could cause us to carry too much or too little merchandise in various product categories.
13
We could incur additional charges due to impairment of long-lived assets.
At March 31, 2016, we had long-lived asset balances of $87.5 million, which are subject to periodic testing for impairment. During fiscal 2016 and 2015, we have recorded impairment charges of $20.9 million and $47.9 million, respectively. See Note 2 of the Notes to Consolidated Financial Statements, included elsewhere in this Annual Report on Form 10-K for further information. Failure to achieve sufficient levels of cash flow generated from operations at individual store locations could result in additional impairment charges for the related fixed assets, which could have a material adverse effect on our reported results of operations.
Any failure of our e-commerce functions or other information technology infrastructure or management information systems could cause a disruption in our business and our results of operations could be materially adversely impacted.
Our ability to operate our business from day to day largely depends on the efficient operation of our information technology infrastructure and management information systems. We use our management information systems to conduct our operations and for critical corporate and business planning functions, including store operations, sales management, merchandising, marketing, supply chain and inventory management, financial reporting and accounting, delivery and other customer services and various administrative functions. Our systems are subject to damage or interruption from power outages, computer and telecommunications failures, computer viruses, security breaches, catastrophic events such as fires, tornadoes and hurricanes, and usage errors by our employees. Operating legacy systems subjects us to inherent costs and risks associated with maintaining, upgrading and replacing these systems and retaining sufficiently skilled personnel to maintain and operate the systems, demands on management time, and other risks and costs. Any failure that is not covered by our disaster recovery plan could cause an interruption in our operations and adversely affect our results of operations.
In addition, we utilize complex information technology platforms to operate our websites and mobile applications. Disruptions to these services, such as those caused by unforeseen traffic levels or other technical difficulties, could cause us to forgo material revenues and adversely affect our reputation with consumers. Performance issues with these customer-facing technology systems, including temporary outages caused by distributed denial of service or other cyber-attacks, or a complete failure of one or more of them without a disaster recovery plan that can be quickly implemented could quickly destroy the positive benefits they provide to our business and negatively affect our customers’ perceptions of hhgregg as a reliable online vendor and source of information about appliances, consumer electronics, furniture and other home products and services, which could negatively affect our results of operations.
Our comparable store sales may not be an indication of our future results of operations because they fluctuate
significantly.
Our historical comparable store sales figures have fluctuated significantly from quarter to quarter. A number of factors have historically affected, and will continue to affect, our comparable store sales results, including:
• | Changes in competition, such as pricing pressure and the opening of new stores by competitors in our markets; |
• | General economic conditions; |
• | New product introductions; |
• | Consumer trends; |
• | Changes in our marketing programs; |
• | Changes in our merchandise mix; |
• | Changes in the relative sales price points of our major product categories; |
• | Our ability to offer attractive credit programs to our customers; |
• | Weather conditions in our markets; |
• | Timing of promotional events; |
• | Reduction in new store openings; |
• | The percentage of our stores that are mature stores; |
• | The locations of our stores and the traffic drawn to those areas; |
• | How often we update our stores; and |
• | Our ability to execute our business strategies effectively. |
Changes in our quarterly and annual comparable store sales results could cause the price of our common stock to fluctuate significantly.
14
Our business is dependent on the general economic conditions in our markets.
In general, our sales depend on discretionary spending by our customers. General economic factors and other conditions that may affect our business include periods of slow economic growth or recession, political factors including uncertainty in social or fiscal policy, an overly anti-business climate or sentiment, volatility and/or lack of liquidity from time to time in U.S. and world financial markets and the consequent reduced availability and/or higher cost of borrowing to us and our customers, slower rates of growth in real disposable personal income, sustained high rates of unemployment, high consumer debt levels, increasing fuel and energy costs, inflation or deflation of commodity prices, natural disasters and acts of terrorism and developments in the war against terrorism. Additionally, any of these circumstances concentrated in the region of the U.S. in which we operate could have a material adverse effect on our net sales and results of operations. General economic conditions and discretionary spending are beyond our control and are affected by, among other things:
• | consumer confidence in the economy; |
• | unemployment trends; |
• | consumer debt levels; |
• | consumer credit availability; |
• | the housing and home improvement markets; |
• | gasoline and fuel prices; |
• | interest rates and inflation; |
• | slower rates of growth in real disposable personal income; |
• | natural disasters; |
• | national and international geopolitical concerns; |
• | tax rates and tax policy; and |
• | other matters that influence consumer confidence and spending. |
Volatility in financial markets may cause some of the above factors to change with an even greater degree of frequency and magnitude. The above factors could result in slowdown in the economy or an uncertain economic outlook, which could have a material adverse effect on our business and results of operations.
Other conditions that may impact our results of operations include disruptions in the availability of content such as sporting events or other televised content. Such disruptions may influence the demand for hardware that our customers purchase to access such content, which would have an adverse effect on our results of operations.
We may fail to meet analyst expectations, which could cause the price of our stock to decline.
Our common stock is traded publicly and various securities analysts follow our financial results and issue reports on us. These reports include information about our historical financial results as well as the analysts’ estimates of our future performance. The analysts’ estimates are based upon their own independent opinions and can be different from our estimates or expectations. If our operating results are below the estimates or expectations of public market analysts and investors, our stock price could decline. If our stock price is volatile, we may become involved in litigation in the future. Any litigation could result in substantial costs and a diversion of management’s attention and resources that are needed to successfully run our business.
Disruptions in our supply chain and other factors affecting the distribution of our merchandise, including our third-paty delivery services, could adversely impact our business.
Any disruption in the operation of our distribution centers could result in our inability to meet our customers’ delivery requirements, which could impair our ability to meet customer demand for products and result in lost sales; increased costs; damage to our reputation; inability to stock our stores; or longer lead time associated with distributing merchandise. Any such disruption within our supply chain network, including damage or destruction to one of our five regional distribution centers; weather-related events; natural disasters; trade restrictions; tariffs; third-party strikes, lock-outs, work stoppages or slowdowns; shipping capacity constraints; supply or shipping interruptions or costs; or other factors beyond our control could negatively impact our financial performance or financial condition.
In addition, our deliveries are outsourced to third-party delivery providers. Our third-party delivery services are subject to risks that are beyond our control. If our products are not delivered to our customers on time, our customers may cancel their orders or we may lose business from these customers in the future. As a result, our net sales and profitability may decline.
15
We are subject to certain statutory, regulatory and legal developments which could have a material adverse impact on our business.
Our statutory, regulatory and legal environment exposes us to complex compliance and litigation risks that could materially adversely affect our operations and financial results. The most significant compliance and litigation risks we face are:
• | The difficulty of complying with sometimes conflicting statutes and regulations in local, state and national jurisdictions; |
• | The impact of proposed, new or changing statutes and regulations, including, but not limited to, corporate governance matters, environmental, financial reform, Health Insurance Portability and Accountability Act, health care reform, labor reform, Payment Card Industry compliance and/or other as yet unknown legislation that could affect how we operate and execute our strategies as well as alter our expense structure; |
• | The impact of changes in tax laws (or interpretations thereof by courts and taxing authorities) and accounting standards; |
• | The impact of litigation trends, including class action lawsuits involving consumers and stockholders, and labor and employment matters; and |
• | Changes in trade regulations, currency fluctuations, economic or political instability, natural disasters, public health emergencies and other factors beyond our control may increase the cost of items we purchase or create shortages of these items, which in turn could have a material adverse effect on our cost of goods, or may force us to increase prices, thereby adversely impacting net sales and profitability. |
Adapting to regulatory changes and defending against lawsuits and other proceedings may involve significant expense and divert management’s attention and resources from other matters, which could adversely affect our results of operations.
Our executive officers, directors and stockholders affiliated with our directors own a large percentage of our voting common stock and could limit the influence of our other stockholders on corporate decisions.
Our executive officers, directors, current holders of more than 5% of our outstanding common stock and their respective affiliates beneficially own, in the aggregate, approximately 49.0% of our outstanding common stock. As a result, any person who acquires shares of our common stock will likely have little or no ability to influence control of the Company. The interests of these stockholders may not always coincide with our corporate interests or the interests of our other stockholders, and they may act in a manner with which our other stockholders may not agree or that may not be in the best interests of our other stockholders.
We have anti-takeover defense provisions in our certificate of incorporation and bylaws that may deter potential acquirers and depress the price of our common stock.
Our articles of incorporation and bylaws contain provisions that could have the effect of making it more difficult for a third party to acquire, or of discouraging a third party from attempting to acquire, control of us. These provisions:
• | authorize our board of directors to issue “blank check” preferred stock and determine the powers, preferences and privileges of those shares without prior stockholder approval; |
• | limit the calling of special meetings of stockholders; |
• | impose a requirement that an affirmative vote of the holders of 66 2/3% of the outstanding shares of common stock is required to amend certain provisions of the articles of incorporation and bylaws; |
• | the prohibition on action by written consent of shareholders as required by the Indiana Business Corporation Law, or the IBCL; and |
• | the application of the Business Combination provisions of the IBCL. |
Because of these various provisions in our articles of incorporation and bylaws, a takeover attempt or third-party acquisition of us, including a takeover attempt that may result in a premium over the market price for shares of our common stock, could be delayed, deterred or prevented. In addition, these provisions may prevent the market price of our common stock from increasing in response to actual or rumored takeover attempts and may also prevent changes in our management. As a result, these anti-takeover and change of control provisions may limit the price investors are willing to pay in the future for shares of our common stock.
16
ITEM 1B. | Unresolved Staff Comments. |
None.
17
ITEM 2. | Properties. |
Stores and Store Operations
Operations. Our store operations are organized into 22 geographic regions. Each region is supervised by a regional manager who monitors store operations and meets regularly with store managers to discuss merchandising, new product introductions, sales promotions, customer feedback and store operating performance. A store is typically overseen by a general manager, one or two sales managers and a staff averaging 12 salespeople and six additional support staff. Our stores are open seven days a week.
Locations. As of March 31, 2016, we leased all of our stores and distribution centers, which are located in Alabama, Delaware, Florida, Georgia, Illinois, Indiana, Kentucky, Louisiana, Maryland, Mississippi, Missouri, New Jersey, North Carolina, Ohio, Pennsylvania, South Carolina, Tennessee, Virginia, West Virginia, and Wisconsin. Our stores average approximately 31,000 square feet. We also lease our corporate headquarters which is located in Indianapolis, Indiana. Our corporate headquarters includes a store, corporate training center, regional distribution and warehousing facility, and corporate call center. Our distribution and warehousing system consists of five RDCs, and nine LDCs. For a description of our RDCs and LDCs, see “Item 1. Business-Distribution and Warehousing.”
The following table sets forth our store locations as of March 31, 2016. During fiscal 2016 there was one store opening and three store closures.
State | Number of stores open | |
Alabama | 6 | |
Delaware | 3 | |
Florida | 36 | |
Georgia | 16 | |
Illinois | 19 | |
Indiana | 17 | |
Kentucky | 6 | |
Louisiana | 3 | |
Maryland | 11 | |
Mississippi | 1 | |
Missouri | 3 | |
New Jersey | 3 | |
North Carolina | 17 | |
Ohio | 28 | |
Pennsylvania | 19 | |
South Carolina | 7 | |
Tennessee | 10 | |
Virginia | 15 | |
West Virginia | 1 | |
Wisconsin | 5 | |
226 | ||
Market and Site Selection. We target markets that meet our demographic and competitive criteria, including areas that demonstrate above average economic growth and household incomes and home ownership rates. Our target markets typically include most or all of our major competitors. When considering new sites, we analyze total store and market potential and advertising and occupancy costs for a market, as well as proximity to distribution facilities. Within our markets, we open or acquire our stores in power centers or freestanding locations in high traffic areas, usually near our major competitors. Primary site evaluation criteria include total sales volume potential, co-tenancies, traffic patterns, visibility, access, parking availability
18
and occupancy costs. We initially open multiple stores in a new market and add stores to the market over time to increase market share and to further leverage our fixed costs.
Historically, we have been able to locate and open stores profitably in a wide variety of trade areas by negotiating lease terms that we believe are favorable. In fiscal 2016, we opened one new store and remodeled the sales floor at several locations. At their lease expiration, we closed two stores in April 2015 and one store in January 2016. As a natural course of business, we regularly evaluate our real estate positions to determine when and where it makes the most sense to operate for our customers and our company. Based on the age of the real estate in these location, we did not find it prudent to reinvest in these locations.
ITEM 3. | Legal Proceedings. |
We are engaged in various legal proceedings in the ordinary course of business and have certain unresolved claims pending. Although we diligently defend against these claims, we may enter into discussions regarding settlement of these and other lawsuits and may enter into settlement agreements, if we believe settlement is in the best interests of our Company and our stockholders. The ultimate liability, if any, for the aggregate amounts claimed cannot be determined at this time. However, management believes, based on the examination of these matters and experiences to date, that the ultimate liability, if any, in excess of amounts already provided for in the consolidated financial statements is not likely to have a material effect on our consolidated financial position, results of operations or cash flows.
The Company is the defendant in a class action lawsuit captioned, Dwain Underwood, on behalf of himself and all others similarly situated v. Gregg Appliances, Inc. and hhgregg, Inc., filed in the Superior Court in Marion County, Indiana, where a former employee alleged that the Company breached a contract by failing to correctly calculate his (and other class members) incentive bonus. On July 9, 2014, the judge granted the plaintiff’s motion for class certification, and on July 17, 2015, the judge granted the plaintiff’s motion for summary judgment, although no finding on damages was made. The Company's interlocutory appeal was accepted on October 23, 2015. The Company has completed the appeal briefing process and oral argument is scheduled for June 29, 2016. If the Company does not ultimately prevail in this case, the potential liability is approximately $2.4 million based on those individuals included in the class, excluding potential interest and other fees which cannot be determined at this time. The Company believes the loss is not probable, and thus, as of March 31, 2016, a liability has not been recorded for this matter.
ITEM 4. | Mine Safety Disclosures. |
Not applicable.
19
PART II. | |
ITEM 5. | Market for Registrant’s Common Equity, Related Stockholder Matters and Issuer Purchases of Equity Securities. |
Market for Registrant’s Common Equity
Our common stock is traded on the New York Stock Exchange under the ticker symbol “HGG”. The table below sets forth the high and low sales prices of our common stock as reported on the New York Stock Exchange — Composite Index during the periods indicated.
Stock Price | |||||||
High | Low | ||||||
Fiscal 2016 | |||||||
Fourth Quarter | $ | 3.82 | $ | 1.53 | |||
Third Quarter | 5.69 | 3.66 | |||||
Second Quarter | 6.43 | 3.28 | |||||
First Quarter | 6.35 | 3.20 | |||||
Fiscal 2015 | |||||||
Fourth Quarter | $ | 7.39 | $ | 5.04 | |||
Third Quarter | 7.99 | 4.83 | |||||
Second Quarter | 10.42 | 5.95 | |||||
First Quarter | 10.21 | 7.87 | |||||
Holders
As of May 2, 2016, there were 60 holders of record of our common stock (which does not include the number of individual beneficial owners whose shares were held on their behalf by brokerage firms in street name).
Dividends
We did not pay cash dividends on our common stock during the last two fiscal years and do not expect to pay cash dividends in the near future. In addition, the terms of our credit facilities place restrictions on our ability to pay dividends and otherwise transfer assets to our stockholders. See “Item 7. Management’s Discussion and Analysis of Financial Condition and Results of Operations-Liquidity and Capital Resources” for more information on our credit facilities.
Purchases of Equity Securities by the Issuer and Affiliated Purchasers
From time to time, we repurchase our common stock in the open market pursuant to programs approved by our Board of Directors. We may repurchase our common stock for a variety of reasons, such as acquiring shares to offset dilution related to equity-based incentives, including stock options and restricted stock units, and optimizing our capital structure.
On May 14, 2014, our Board of Directors authorized a new stock repurchase program, which became effective on May 20, 2014 (the “May 2014 Program”) allowing the Company to repurchase up to $40.0 million of its common stock. The stock repurchase program allows for the repurchase of our common stock on the open market or in privately negotiated transactions in accordance with applicable laws and regulations and expired on May 20, 2015. During fiscal 2016, there were no shares repurchased. During fiscal 2015, we repurchased 0.8 million shares at a cost of $5.3 million.
Securities Authorized for Issuance Under Equity Compensation Plans
The following table summarizes information as of March 31, 2016 relating to our equity compensation plans to which grants of options, restricted stock units or other rights to acquire shares of our common stock may be granted from time to time:
20
(a) | (b) | (c) | ||||||||||||
Plan Category | Number of securities to be issued upon exercise of outstanding options, warrants and rights (#) | Weighted-average exercise price of outstanding options, warrants and rights ($) (1) | Number of securities remaining available for future issuance under equity compensation plans (excluding securities reflected in column (a)) (#) | |||||||||||
Equity compensation plans approved by securities holders | 3,197,551 | $ | 11.86 | 5,141,459 | ||||||||||
Equity compensation plans not approved by securities holders | N/A | N/A | N/A | |||||||||||
Total | 3,197,551 | $ | 11.86 | 5,141,459 | ||||||||||
(1) | This number reflects the exclusion of 370,383 shares in the form of restricted stock units granted pursuant to our equity plans included in column (a). These awards allow for the distribution of shares to the grant recipient upon vesting and do not have an associated exercise price. Accordingly, these awards are not reflected in the weighted-average exercise price. |
21
hhgregg Stock Comparative Performance Graph
The information contained in this hhgregg Stock Comparative Performance Graph section shall not be deemed to be “soliciting material” or “filed” or incorporated by reference in future filings with the SEC, or subject to the liabilities of Section 18 of the Exchange Act, except to the extent that we specifically incorporate it by reference into a document filed under the Securities Act of 1933, as amended, or the Exchange Act.
The graph and table below compares the cumulative total stockholder return on our common stock for the last five fiscal years with the cumulative total return on the Standard & Poor’s 500 Index (“S&P 500”), and the Standard & Poor’s Retail Composite Index (“S&P Retail Composite Index”). The S&P Retail Composite Index is a capitalization-weighted index of domestic equities traded on the New York Stock Exchange (“NYSE”) and the National Association of Securities Dealers Automated Quotes (“NASDAQ”), and includes high-capitalization stocks representing the retail sector of the S&P 500.
The graph assumes an investment of $100 at the close of trading on March 31, 2011 in hhgregg common stock, the S&P 500 and the S&P Retail Composite Index and reinvestment of any dividends. The comparison in the graph below is based solely on historical data and is not intended to forecast the possible future performance of our common stock.
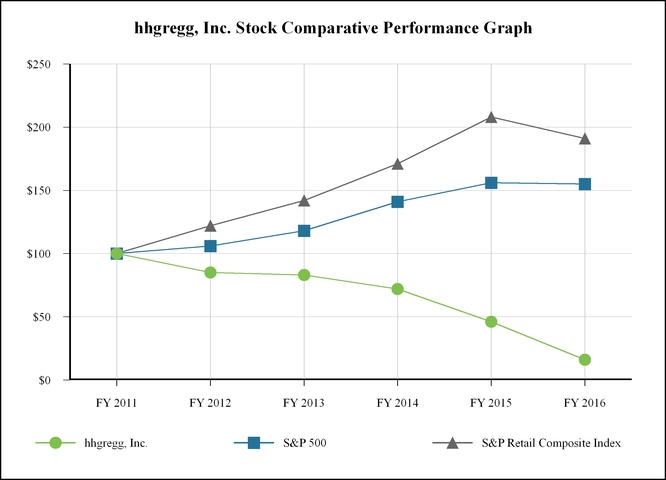
FY 2011 | FY 2012 | FY 2013 | FY 2014 | FY 2015 | FY 2016 | ||||||||||||
hhgregg, Inc. | 100 | 84.99 | 82.52 | 71.77 | 45.78 | 15.76 | |||||||||||
S&P 500 | 100 | 106.23 | 118.36 | 141.22 | 155.97 | 155.35 | |||||||||||
S&P Retail Composite Index | 100 | 121.78 | 142.07 | 171.45 | 207.66 | 191.40 | |||||||||||
22
ITEM 6. | Selected Financial Data. |
The following table sets forth our selected historical consolidated financial data and store operating information as of the dates and for the periods indicated. The selected historical consolidated statement of operations and balance sheet data as of and for each of the fiscal years ended March 31, 2016, 2015, 2014, 2013 and 2012 are derived from, and are qualified in their entirety by, our historical audited consolidated financial statements. Historical results are not necessarily indicative of the results to be expected in the future. You should read the following data together with Item 1. “Business,” Item 7. “Management’s Discussion and Analysis of Financial Condition and Results of Operations” and our historical consolidated financial statements and the related notes. In the following tables (including the footnotes thereto), dollars are in thousands, except share and per share data and as otherwise indicated.
Fiscal Year Ended March 31, | ||||||||||||||||||||
2016 (1) | 2015 (1) (10) | 2014 (1) (9) | 2013 (1) | 2012 (1) (4) (8) | ||||||||||||||||
Statement of Operations Data: | ||||||||||||||||||||
Net sales | $ | 1,959,998 | $ | 2,129,374 | $ | 2,338,570 | $ | 2,474,759 | $ | 2,493,392 | ||||||||||
Gross profit | 553,782 | 605,838 | 664,539 | 717,586 | 720,388 | |||||||||||||||
(Loss) income from operations | (51,725 | ) | (99,448 | ) | 2,677 | 43,759 | 109,800 | |||||||||||||
Net (loss) income | $ | (54,879 | ) | $ | (132,746 | ) | $ | 228 | $ | 25,369 | $ | 81,373 | ||||||||
Share and Per Share Data: | ||||||||||||||||||||
Weighted average shares outstanding | ||||||||||||||||||||
Basic | 27,701,055 | 28,129,596 | 30,209,928 | 34,430,641 | 37,749,354 | |||||||||||||||
Diluted | 27,701,055 | 28,129,596 | 30,683,989 | 34,496,788 | 38,079,685 | |||||||||||||||
Net (loss) income per share | ||||||||||||||||||||
Basic(2) | $ | (1.98 | ) | $ | (4.72 | ) | $ | 0.01 | $ | 0.74 | $ | 2.16 | ||||||||
Diluted (3) | $ | (1.98 | ) | $ | (4.72 | ) | $ | 0.01 | $ | 0.74 | $ | 2.14 | ||||||||
Cash Flow Data: | ||||||||||||||||||||
Capital expenditures | $ | 12,828 | $ | 22,522 | $ | 22,257 | $ | 54,020 | $ | 81,429 | ||||||||||
Operating Statistics: | ||||||||||||||||||||
Gross profit (as a percentage of net sales) | 28.3 | % | 28.5 | % | 28.4 | % | 29.0 | % | 28.9 | % | ||||||||||
(Loss) income from operations (as a percentage of net sales) | (2.6 | )% | (4.7 | )% | 0.1 | % | 1.8 | % | 4.4 | % | ||||||||||
Working capital (as a percentage of net sales) (5) | 5.1 | % | 5.4 | % | 6.5 | % | 7.0 | % | 7.4 | % | ||||||||||
Number of stores, end of period | 226 | 228 | 228 | 228 | 208 | |||||||||||||||
Total store square footage (in thousands) | 7,099 | 7,301 | 7,309 | 7,309 | 6,772 | |||||||||||||||
Comparable store sales decrease (6) | (7.7 | )% | (9.2 | )% | (7.3 | )% | (8.7 | )% | (1.1 | )% | ||||||||||
Inventory turnover (7) | 5.5x | 5.5x | 5.5x | 5.9x | 7.2x | |||||||||||||||
Balance Sheet Data: | ||||||||||||||||||||
Cash and cash equivalents | $ | 3,703 | $ | 30,401 | $ | 48,164 | $ | 48,592 | $ | 59,244 | ||||||||||
Total assets | 385,352 | 467,629 | 625,963 | 676,421 | 642,784 | |||||||||||||||
Total debt, including current portion | — | — | — | — | — | |||||||||||||||
Stockholders’ equity | 121,354 | 173,588 | 307,134 | 346,658 | 359,520 | |||||||||||||||
23
(1) | Fiscal 2016, fiscal 2015, fiscal 2014, fiscal 2013, and fiscal 2012 net (loss) income includes $20.9 million, $47.9 million, $0.6 million, $0.5 million, and $0.8 million, respectively, of asset impairment charges. Impairment charges were related to specific stores where the expected future cash flows were less than the carrying amount of the property. Please refer to Note 2 of the Notes to the Consolidated Financial Statements included elsewhere herein for a discussion of the impairment charges for fiscal 2016, fiscal 2015 and fiscal 2014. |
(2) | Basic net (loss) income per share is calculated by dividing net income by the weighted-average number of common shares outstanding. |
(3) | Diluted net (loss) income per share is calculated by dividing net income by the weighted-average number of common shares outstanding adjusted by the number of additional shares that would have been outstanding had the potentially dilutive common shares from outstanding options and restricted stock units been issued. |
(4) | Fiscal 2014 capital expenditures represents capital expenditures offset by the proceeds and deposits received from sale leaseback transactions. |
(5) | Working capital represents current assets excluding the current portion of deferred income taxes less current liabilities as of the end of the respective fiscal year-end, expressed as a percentage of net sales. |
(6) | Comprised of net sales at stores operating for at least 14 full months, including remodeled and relocated locations and our website. Stores that are closed are excluded from the calculation the month before closing. |
(7) | Inventory turnover for the specified period is calculated by dividing our cost of goods sold for the fiscal year by the average of the beginning and ending inventory for that year. |
(8) | Fiscal 2012 net income, income from operations, and net income per share include $40.0 million of life insurance proceeds. |
(9) | Fiscal 2014 net income, income from operations, and net income per share include a pre-tax charge of $2.9 million to exit the contract-based mobile phone business. |
(10) | Fiscal 2015 net loss, loss from operations, and net loss per share include a charge of $66.1 million, which was comprised of $41.4 million of tax expense for previously recognized deferred tax assets and $24.7 million of tax benefits not recognized related to losses incurred during fiscal 2015. |
24
ITEM 7. | Management’s Discussion and Analysis of Financial Condition and Results of Operations. |
You should read this discussion and analysis of our financial condition and results of operations in conjunction with our “Selected Historical Consolidated Financial and Other Data,” and our consolidated financial statements and related notes appearing elsewhere in this report. Some of the statements in the following discussion are forward-looking statements. See Item 1A. “Risk Factors” and “Cautionary Note Regarding Forward-Looking Statements” for more information.
Management’s Discussion and Analysis of Financial Condition and Results of Operations (“MD&A”) is designed to provide a reader of our financial statements with a narrative from the perspective of our management on our financial condition, results of operations, liquidity and certain other factors that may affect our future results. Our MD&A is presented in seven sections:
• | Overview |
• | Critical Accounting Estimates |
• | Results of Operations |
• | Liquidity and Capital Resources |
• | Impact of Inflation |
• | Contractual Obligations |
• | Off Balance Sheet Items |
Overview
hhgregg, Inc. is an appliance, electronics and furniture retailer that is committed to providing customers with a truly differentiated purchase experience through superior customer service, highest quality product selections and customer satisfaction. Founded in 1955, hhgregg is a multi-regional retailer with 226 brick-and-mortar stores in 20 states that also offers market-leading global and local brands at value prices nationwide via hhgregg.com. We operate in one reportable segment and do not have international operations. References to fiscal years in this report relate to the respective 12-month period ended March 31. Our 2016 fiscal year is the 12-month period that ended on March 31, 2016.
Throughout our MD&A, we refer to comparable store sales. Comparable store sales is comprised of net sales at stores in operation for at least 14 full months, including remodeled and relocated stores, as well as net sales for our website. Stores that are closed are excluded from the calculation the month before closing. The method of calculating comparable store sales varies across the retail industry and our method of calculating comparable store sales may not be the same as other retailers’ methods.
This overview section is divided into three sub-sections discussing our operating strategy and performance, business strategy and core philosophies, and seasonality.
Operating Strategy and Performance. We focus the majority of our floor space, advertising expense and distribution infrastructure on the marketing, delivery and installation of a wide selection of premium appliance, consumer electronics and home furniture products. In addition, we offer additional products not available in our store locations online at www.hhgregg.com. Appliance and consumer electronics sales comprised 89% and 88% of our net sales mix for the 12 months ended March 31, 2016 and 2015, respectively.
We strive to differentiate ourselves through our customer purchase experience starting with a highly-trained, consultative commissioned sales force which educates our customers on the features and benefits of our products, followed by rapid product delivery and installation, and ending with post-sales support services. We carefully monitor our competition to ensure that our prices are competitive in the market place. Our experience has been that informed customers often choose to buy a more heavily-featured product once they understand the applicability and benefits of its features. Heavily-featured products typically carry higher average selling prices and higher margins than less-featured, entry-level price point products.
In response to the declines in our overall comparable store sales in fiscal 2016, for fiscal 2017 we are focusing on revenue growth, productivity and focusing and realigning the organization of our business.
25
Our first focus for fiscal 2017 is revenue growth. Similar to previous years, the appliance category will continue to be the centerpiece of our business, and as such, we will continue to drive specific initiatives around the category. We will continue to enhance our product selection by adding additional Fine Lines departments. Fine Lines departments incorporate ultra premium appliances brands that are not currently in our hhgregg stores and historically have improved our appliance revenues in stores. During fiscal 2016, we opened one Fine Lines department and plan on opening up to 15 additional Fine Lines departments in fiscal 2017, throughout the fiscal year. To grow revenues in the consumer electronics category, we intend to expand our product selection and grow our online revenues through www.hhgregg.com. We plan on optimizing www.hhgregg.com to increase the online purchase of televisions and other consumer electronics by consumers as well as expand the endless aisle concept, offering products not available in stores. This will also allow us to broaden our footprint by shipping to customers throughout the entire United States.
During fiscal 2016, we transformed the layout of 25 stores to better showcase our selection of appliances, consumer electronics, home products and computers and tablets. These changes were designed to make our stores more visually appealing to our customers, as well as to display merchandise by functionality. Furniture and appliances are prominently displayed in the front of the store. Due to the connected nature of the products, consumer electronics and computers and tablets are displayed together. We expect to complete the redesign of up to 100 existing stores before the fiscal 2017 holiday selling season.
In all of our categories we plan on continuing to offer delivery and installation capabilities and will invest in the infrastructure and revenue generating capabilities of these areas by improving upon the Store2Door service. Store2Door allows the customer to purchase online and have the product delivered and/or installed in their home or to allow the customer to pick the product up in the store seamlessly. In order to accomplish this, we will refine our processes and offerings. We also plan on adding a Store2Door kiosk in appliance and furniture categories which will allow customers who visit our store to purchase products not available in the store and have them delivered to their home.
We believe that a happy customer is a customer who returns to our stores or our website and will become a customer for life. We want to gain our customer's trust during the sales process. In order to reach this goal, we will continue to train and develop our consultative sales staff so they are able to educate our customers on the benefits of feature-rich products. We also offer the ultimate price center which shows the customer the competitor's price in the store so that the customer can be assured that they are paying the lowest price possible. By putting the customer first, we plan on gaining our customer's trust and ensuring that the customer has a positive sales experience which will lead to repeat business.
Our second focus for fiscal 2017 is productivity. We will continue to focus on reducing our overall selling, general and administrative expenses including store level, corporate and logistics expenses. We have plans to evaluate our logistics network to determine the best logistics design for optimization efficiency. We will also evaluate inventory productivity to determine ways to reduce inventory in all categories. Using the knowledge we obtained during fiscal 2016, we will optimize our fiscal 2017 marketing spend to the most effective mediums with the goal to drive in-store and online traffic.
Our third focus for fiscal 2017 relates to our organization. We will increase the focus on growing our talent pool and investing in our people throughout the organization through training and development programs. We will align strategic goals to our key performance indicators so we can evaluate our progression.
Key Metrics
The following table summarizes certain operating data that we believe are important to understanding our operating model:
Fiscal Year Ended March 31, | ||||||||
2016 | 2015 | 2014 | ||||||
Inventory turnover (1) | 5.5x | 5.5x | 5.5x | |||||
Working capital (as a percentage of net sales) (2) | 5.1 | % | 5.4 | % | 6.5 | % | ||
Net capital expenditures (as a percentage of net sales) | 0.7 | % | 1.1 | % | 1.0 | % | ||
(Loss) income from operations (as a percentage of net sales) | (2.6 | )% | (4.7 | )% | 0.1 | % | ||
(1) | Inventory turnover for the specified period is calculated by dividing our cost of goods sold for the fiscal year by the average of the beginning and ending inventory for the year. |
(2) | Working capital represents current assets excluding the current portion of deferred income taxes less current liabilities as of the end of the respective fiscal year-end, expressed as a percentage of net sales. |
We focus on leveraging our semi-fixed expenditures in advertising, distribution and regional management through closely managing our inventory, working capital and store development expenditures. Our inventory has averaged 5.5 turns per year
26
over the past three fiscal years. During fiscal 2015 and 2016, we were able to maintain appropriate inventory levels given the continued decline in our net sales from fiscal 2014 and 2015. During fiscal 2014, our net sales decline had a negative impact on our inventory turnover calculation. Our working capital, expressed as a percentage of net sales, has averaged 5.7% over the past three fiscal years. Our net capital expenditures, measured as a percentage of net sales, have averaged 0.9% over the past three fiscal years.
Business Strategy and Core Philosophies. Our business strategy is centered around offering our customers a superior customer purchase experience. From the time the customers walk in the door, they experience a well-designed, customer-friendly store. Our stores are brightly lit and have clearly distinguished departments that allow our customers to find what they are looking for. We greet and assist our customers with our highly-trained consultative sales force, who educate the customers about the different product features.
We believe our products are rich in features and innovation. We believe that customers find it helpful to have someone explain the features and benefits of a product as this assistance allows them the opportunity to buy the product that most closely matches their needs. We focus our product assortment on big box items requiring in-home delivery and installation in order to utilize service offerings. We follow up on the customer purchase experience by offering delivery capabilities on many of our products and in-home installation service.
While we believe many of our product offerings are considered essential items by our customers, other products and certain features are viewed as discretionary purchases. As a result, our results of operations are susceptible to a challenging macro-economic environment. As consumers show a more cautious approach to purchases of discretionary items, customer traffic and spending patterns continue to be difficult to predict. By providing a knowledgeable consultative sales force, delivery capabilities, credit offerings and expanded product offerings, we believe we offer our customers a differentiated value proposition. There are many variables that affect consumer demand for the home product purchases that we offer, including:
• | Growth in real disposable personal income is projected to moderate to 2.9% in 2016 as compared with 3.4% growth in 2015, based on the March 2016 Blue Chip Economic Indicators®. * |
• | The average unemployment rate for 2016 is forecasted to decline to 4.7%, according to the March 2016 Blue Chip Economic Indicators, which would be an improvement from the 5.3% average in 2015. The unemployment rate should continue to trend lower as the job market continues to expand at a moderate pace. |
• | Recent evidence suggests that home prices will continue to increase. In 2015, home price appreciation increased 5.5% which was consistent with the 2014 increase, according to the Federal Housing Finance Agency index. Economists generally expect the rate of home price growth to moderate to 3.2% in 2016. |
• | Housing turnover increased an estimated 7.4% in 2015 after a 2.6% decrease in 2014, according to The National Association of Realtors and U.S. Census Bureau. Turnover is generally expected to continue to increase in 2016, supported by a strengthening jobs market, rising incomes, and historically low mortgage rates. |
*Blue Chip Economic Indicators® (ISSN: 0193-4600) is published monthly by Aspen Publishers, 76 Ninth Avenue, New York, NY 10011, a division of Wolters Kluwer Law and Business. Printed in the U.S.A.
Retail appliance sales are correlated to the housing industry and housing turnover. As more people purchase existing homes in the market, appliance sales tend to trend upward. Conversely, when demand in the housing market declines, appliance sales are negatively impacted. The U.S. Census Bureau’s data on New Residential Construction shows that U.S. Housing Start-Up’s experienced a 13.3% increase for the twelve-month period ended March 31, 2016 over the prior year comparable period. The appliance industry has benefited from increased innovation in energy efficient products. While these energy efficient products typically carry a higher average selling price than traditional products, they save the consumer significant dollars in annual energy savings. Average unit selling prices of major appliances are not expected to change dramatically in the foreseeable future. For fiscal 2016, we had an increase in average unit selling prices compared to fiscal 2015. According to the U.S. Department of Commerce - Bureau of Economic Analysis, personal consumption for home appliances increased 1.5% from $46.1 billion in 2014 to $46.8 billion in 2015. Major household appliances, such as refrigerators, stovetops, dishwashers and washer and dryers, account for approximately 86.3% of this total at $40.4 billion in 2015. For the fiscal year ended 2016, we generated 53% of total product sales from the sale of home appliances. Despite the improvement in the U.S. housing market and general economy, we experienced a decline of units sold in our appliance sales in fiscal 2016. As we are a multi-regional retailer, the housing market and general economy national trends vary from the markets we serve. In addition there was strong promotional competition. The Association of Home Appliance Manufactures estimates 2-3% of growth for calendar 2016 compared to calendar 2015. Based on this, for fiscal 2017 we believe the appliance industry will continue to experience an increase in demand and with the addition of the Fine Lines departments, promotions aimed towards appliances and refined product assortments by geography, we hope to drive additional traffic converting into additional revenues for the appliance category.
27
The consumer electronics industry depends on new product innovations to drive sales and profitability. Innovative, heavily-featured products are typically introduced at relatively high price points. Over time, price points are gradually reduced to drive consumption. Accordingly, there has been consistent price compression in flat panel televisions for equivalent screen sizes in recent years without a widely accepted innovation in technology to offset this compression. As new technology has not been sufficient to keep demand constant, the industry has seen falling demand, gross margin rate declines, and average selling price declines. Over the last couple of years, we have proactively shifted our focus towards larger screen sizes with higher profit margins, which has also resulted in lost market share in the consumer electronics category, as we offered fewer smaller screen size televisions. As a result we experienced higher average selling prices in the category as consumer preference shifts towards new products such as OLED and ultra HD TV’s and larger screen sizes. In addition, we have seen the evolution of traditional consumer electronics devices change to connected devices in the last few years. We will continue to assort and promote value products across all segments of the category to drive the video business both in-store and online. As vendor models transition for the year, we will add additional online skus in both value and premium brands. According to the U.S. Department of Commerce - Bureau of Economic Analysis, personal consumption for consumer electronics was $216.1 billion in 2015, a 2.5% increase from 2014. From this total, televisions accounted for $36.6 billion compared to $36.7 billion in the prior year, a 0.1% decrease, and personal computers and equipment accounted for $55.4 billion compared to $52.7 billion in the prior year, a 5.1% increase. For fiscal 2016, we had a comparable store sales decrease of 10.3% for consumer electronics due to the fact, relative to our competitors, we were highly indexed in large premium televisions. For the fiscal year ended 2016, we generated 41% of total product sales from the sale of consumer electronics and computers and tablets. For calendar 2016, U.S. Consumer Technology Association projects that unit sales of digital displays will be down 1% compared to calendar 2015 and total computing will be down 7% for calendar 2016 compared to calendar 2015.
In previous years, we have introduced new products with the hope of offsetting falling market demand and market share losses of our product categories. We will continue to monitor the performance of these new categories, along with market share shifts between the competitive set in our existing categories. We continue to refine our assortment in the furniture category and plan on focusing on the great room, a large room in a modern house that combines features of a living room with those of a dining room or family room. As we are currently experiencing growth in this product category, we are optimistic about the growth experienced by the industry as well. According to the U.S. Department of Commerce - Bureau of Economic Analysis, personal consumption for household furniture was $103.1 billion in 2015, an increase of 5.0% from $98.2 billion in 2014. Our home products comparable store sales for fiscal 2016 was an increase of 5.4%. For the fiscal year ended 2016, we generated 6% of total product sales from the sale of furniture and mattresses.
Seasonality. Our business is seasonal, with a higher portion of net sales, operating costs, and operating profit realized during the quarter that ends December 31 due to the overall demand for consumer electronics during the holiday shopping season. Appliance sales are impacted by seasonal weather patterns, but are less seasonal than our electronics business and helps to offset the seasonality of our overall business.
Critical Accounting Estimates
Our consolidated financial statements are prepared in accordance with U.S. Generally Accepted Accounting Principles (“U.S. GAAP”). In connection with the preparation of our consolidated financial statements, we are required to make assumptions and estimates about future events, and apply judgments that affect the reported amounts of assets, liabilities, revenue, expenses and the related disclosures. We base our assumptions, estimates and judgments on historical experience, current trends and other factors that management believes to be relevant at the time our consolidated financial statements are prepared. On a regular basis, management reviews the accounting policies, assumptions, estimates and judgments to ensure that our consolidated financial statements are presented fairly and in accordance with U.S. GAAP. However, because future events and their effects cannot be determined with certainty, actual results could differ from our assumptions and estimates, and such differences could be material.
Our significant accounting policies are discussed in Note 1, Summary of Significant Accounting Policies, of the Notes to our Consolidated Financial Statements, included in Item 8, Financial Statements and Supplementary Data, of this Annual Report on Form 10-K. Management believes that the following accounting estimates are the most critical to aid in fully understanding and evaluating our reported financial results, and they require management’s most difficult, subjective or complex judgments, resulting from the need to make estimates about the effect of matters that are inherently uncertain. Management has reviewed these critical accounting estimates and related disclosures with the Audit Committee of our Board of Directors.
Vendor Allowances
We receive funds from our vendors for various programs including volume purchase rebates, marketing support, inventory markdowns, margin protection, product training and sales incentives. Vendor allowances provided as a reimbursement of specific, incremental and identifiable costs incurred to promote a vendor’s products are included as an
28
expense reduction when the cost is incurred. All other vendor allowances are initially deferred and recorded as a reduction of merchandise inventories. The deferred amounts are then included as a reduction of cost of goods sold when the related product is sold.
We have two primary types of vendor allowances that do not represent reimbursements of specific, incremental and identifiable costs. The first type of allowance is calculated based on a specific percentage of our purchases. In most cases the percentage is not dependent on any monthly, quarterly or annual purchase volumes or any other performance terms with our vendors. Additionally, these allowances are deducted directly from the amounts we owe to the vendor for the product. For this type of vendor allowance, we record inventory at net cost (i.e. invoice cost less vendor allowance) at the time of receipt.
The second type of vendor allowance is based on the satisfaction of certain terms of the vendor program. We determine the amount of the accrued vendor allowance by estimating the point at which we will have completed our performance under the program and estimate the earned allowance at the balance sheet date using the rates negotiated with our vendors and actual purchase volumes to date.
During the year, due to complexity and diversity of the individual vendor programs, we perform analyses and review historical trends to ensure the amounts earned are appropriately recorded. Amounts accrued throughout the year could be impacted if actual purchase volumes differ from projected purchase volumes. Additionally, on a monthly basis we review the collectability of the accrued vendor allowances and adjust for any valuation concerns.
We have not made any material changes in the accounting methodology used to record vendor allowances in the past three fiscal years.
We do not believe there is a reasonable likelihood that there will be a material change in the estimates or assumptions we use to calculate our vendor allowances. If actual results are not consistent with the assumptions and estimates used, we may be exposed to additional adjustments that could materially impact, positively or negatively, our gross margin and inventory. However, substantially all vendor allowance receivables and deferrals outstanding at year end are collected and recognized within the following quarter, and therefore do not require subjective long-term estimates. Adjustments to gross margin and inventory in the following fiscal year have historically not been material. A 10% difference in our vendor allowance receivables at March 31, 2016, would have affected net earnings by approximately $0.2 million in fiscal 2016.
Inventory Reserves
We value our inventory at the lower of the cost of the inventory or fair market value through the establishment of markdown and inventory loss reserves. Our markdown reserve represents the excess of the carrying amount, typically average cost, over the amount we expect to realize from the ultimate sale or other disposal of the inventory. Markdowns establish a new cost basis for our inventory. Subsequent changes in facts or circumstances do not result in the restoration of previously recorded markdowns or an increase in the newly established cost basis.
Our markdown reserve contains uncertainties because the calculation requires management to make assumptions and to apply judgment regarding inventory aging, forecasted consumer demand, the promotional environment and technological obsolescence. We have not made any material changes in the accounting methodology used to establish our markdown reserve during the past three fiscal years.
We do not believe there is a reasonable likelihood that there will be a material change in the estimates or assumptions we use to calculate our markdown reserve. However, if estimates regarding consumer demand are inaccurate or changes in technology or customer preferences affect demand for certain products in an unforeseen manner, we may be exposed to losses or gains that could be material. A 10% difference in our actual markdown reserve at March 31, 2016, would have affected net earnings by approximately $0.2 million in fiscal 2016.
Our inventory loss reserve represents anticipated physical inventory losses (e.g., theft) that have occurred since the last physical inventory date. Physical inventory counts are taken on a regular basis to ensure the inventory reported in our consolidated financial statements is properly stated. During the interim period between physical inventory counts, we reserve for anticipated physical inventory losses on a consolidated basis.
Our inventory loss reserve contains uncertainties because the calculation requires management to make assumptions and to apply judgment regarding a number of factors, including historical results and current inventory loss trends. We have not made any material changes in the accounting methodology used to establish our inventory loss reserve during the past three fiscal years.
We do not believe there is a reasonable likelihood that there will be a material change in the estimates or assumptions we use to calculate our inventory loss reserve. However, if our estimates regarding physical inventory losses are inaccurate, we
29
may be exposed to losses or gains that could be material. A 10% difference in actual physical inventory losses reserved for at March 31, 2016, would have affected net earnings by less than $0.1 million in fiscal 2016.
Long-Lived Assets
Long-lived assets other than goodwill and indefinite-lived intangible assets, which are separately tested for impairment, are evaluated for impairment whenever events or changes in circumstances indicate that the carrying amount may not be recoverable.
When evaluating long-lived assets for potential impairment, we first compare the carrying amount of the asset or asset group to the asset’s or asset group’s estimated undiscounted future cash flows. If the estimated undiscounted future cash flows are less than the carrying amount of the asset or asset group, we calculate an impairment loss. The impairment loss calculation compares the carrying amount of the asset or asset group to the asset’s or asset group’s estimated fair value, which may be based on estimated discounted future cash flows. We recognize an impairment loss if the amount of the asset’s or asset group’s net book value exceeds the asset’s or asset group’s estimated fair value. If we recognize an impairment loss, the adjusted net book value of the asset or asset group becomes its new cost basis. For a depreciable long-lived asset, the new cost basis will be depreciated (amortized) over the remaining useful life of that asset or asset group.
Our impairment loss calculations contain uncertainties because they require management to make assumptions and to apply judgment to estimate future cash flows and asset fair values, including forecasting useful lives of the assets and selecting the discount rate that reflects the risk inherent in future cash flows.
We have not made any material changes in our impairment loss assessment methodology during the past three fiscal years.
We do not believe there is a reasonable likelihood that there will be a material change in the estimates or assumptions we use to calculate long-lived asset impairment losses. However, if actual results are not consistent with our estimates and assumptions used in estimating future cash flows and asset fair values, we may be exposed to losses that could be material. For the fiscal years ended March 31, 2016, 2015 and 2014, we recorded pre-tax impairment losses of $20.9 million, $47.9 million, and $0.6 million, respectively.
Accruals for Uncertain Tax Positions and Income Taxes
Accounting guidance on income taxes prescribes a recognition threshold and measurement attribute for the financial statement recognition and measurement of a tax position taken or expected to be taken in a tax return.
We are subject to U.S. federal and certain state and local income taxes. Our income tax returns, like those of most companies, are periodically audited by federal and state tax authorities. These audits include questions regarding our tax filing positions, including the timing and amount of deductions and the allocation of income among various tax jurisdictions. At any one time, multiple tax years are subject to audit by the various tax authorities. In evaluating the exposures associated with our various tax filing positions, we record a liability for more likely than not exposures. A number of years may elapse before a particular matter for which we have established a liability is audited and fully resolved or clarified. We adjust our liability for unrecognized tax benefits and income tax provision in the period in which an uncertain tax position is effectively settled, or the statute of limitations expires for the relevant taxing authority to examine the tax position or when more information becomes available.
We use significant estimates that require management’s judgment in calculating our provision for income taxes. Significant judgment is required in evaluating our tax positions and determining our provision for income taxes. The objectives of accounting for income taxes are to recognize the amount of taxes payable or refundable for the current year and the deferred tax liabilities and assets for the future tax consequences of events that have been recognized in an entity’s financial statements or tax returns. Variations in the actual outcome of these future tax consequences could materially impact our consolidated financial position, results of operations or cash flows.
Our effective income tax rate is also affected by changes in tax law, the tax jurisdiction of new stores or business ventures, the level of earnings and the results of tax audits. In assessing the recoverability of deferred tax assets, management considers whether it is more likely than not that some portion or all of the deferred tax assets will not be realized. The ultimate realization of deferred tax assets is dependent upon generation of future taxable income during the periods in which temporary differences become deductible. Management considers the scheduled reversal of deferred tax liabilities, projected future taxable income and tax planning strategies in making this assessment and ensuring that the deferred tax asset valuation allowance is adjusted as appropriate. During fiscal 2015, the Company recorded a full valuation allowance on its deferred tax assets. As of March 31, 2016 and 2015, the valuation allowance was $82.9 and $66.1 million, respectively.
30
Although management believes that the judgments and estimates discussed herein are reasonable, actual results could differ, and we may be exposed to losses or gains that could be material.
To the extent we prevail in matters for which a liability has been established, or are required to pay amounts in excess of our established liability, our effective income tax rate in a given financial statement period could be materially affected. An unfavorable tax settlement generally would require use of our cash and would result in an increase in our effective income tax rate in the period of resolution. A favorable tax settlement would be recognized as a reduction in our effective income tax rate in the period of resolution. At March 31, 2016 and 2015, we had no liability for unrecognized tax benefits.
Revenue Recognition
We recognize revenue, net of estimated returns, at the time the customer takes possession of the merchandise or receives service. We honor returns from customers within 30 days from the date of sale and provide allowances for estimated returns based on historical experience.
We sell gift cards to our customers in our retail stores and online. We do not charge administrative fees on unused gift cards and our gift cards do not have an expiration date. We recognize revenue from gift cards when: (i) the gift card is redeemed by the customer or (ii) the likelihood of the gift card being redeemed by the customer is remote, which we refer to as gift card breakage, and we determine that we do not have a legal obligation to remit the value of unredeemed gift cards to the relevant jurisdictions. We determine our gift card breakage rate based on historical redemption patterns. Breakage recognized was not material to our results of operations during fiscal 2016, 2015 or 2014.
We sell premium service plans (“PSPs”) on appliance and electronic merchandise for periods ranging up to 10 years. For PSPs sold by us on behalf of a third party, the net commission revenue is recognized at the time of sale. We are not the primary obligor on PSPs sold on behalf of third parties. Funds received for PSPs in which we are the primary obligor are deferred and the incremental direct costs of selling the PSPs are capitalized and amortized on a straight-line basis over the term of the service agreement. Costs of services performed pursuant to the PSPs are expensed as incurred.
Our revenue recognition accounting methodology contains uncertainties because it requires management to make assumptions regarding and to apply judgment to estimate future sales returns. Our estimate of the amount and timing of sales returns is based primarily on historical transaction experience.
We have not made any material changes in the accounting methodology used to measure sales returns or recognize revenue for PSPs sold during the past three fiscal years.
We do not believe there is a reasonable likelihood that there will be a material change in the estimates or assumptions we use to measure sales returns or recognize revenue for our gift card program. However, if actual results are not consistent with our estimates or assumptions, we may be exposed to losses or gains that could be material.
A 10% change in our sales return reserve at March 31, 2016 would have affected net earnings by less than $0.1 million in fiscal 2016.
Self-Insured Liabilities
We are self-insured for certain losses related to workers’ compensation, medical insurance, general liability and motor vehicle insurance claims. However, we obtain third-party insurance coverage to limit our exposure to these claims.
The following table provides our stop loss coverage for the fiscal years ended March 31, 2016, 2015 and 2014 (in thousands):
Fiscal Year Ended March 31, | ||||||
2016 | 2015 | 2014 | ||||
Workers’ Compensation — per occurrence | $300 | $300 | $300 | |||
Workers’ Compensation — per occurrence (OH) | $300 | $300 | $500 | |||
General Liability — per occurrence | $250 | $250 | $250 | |||
Motor Vehicles — per occurrence | $100 | $100 | $100 | |||
Medical Insurance — per participant, per year | $300 | $300 | $300 | |||
When estimating our self-insured liabilities, we consider a number of factors, including historical claims experience, demographic factors, severity factors and valuations provided by independent third-party actuaries. On a quarterly basis, management reviews its assumptions and the valuation provided by an independent third-party actuary to determine the adequacy of our self-insured liabilities.
31
Our self-insured liabilities contain uncertainties because management makes assumptions and applies judgment to estimate the ultimate cost to settle reported claims and claims incurred but not reported at the balance sheet date.
We have not made any material changes in the accounting methodology used to establish and adjust our self-insured liabilities during the past three fiscal years. We do not believe there is a reasonable likelihood that there will be a material change in the estimates or assumptions we use to calculate our self-insured liabilities. However, if actual results are not consistent with our estimates or assumptions, we may be exposed to losses or gains that could be material. A 10% change in our self-insured liabilities at March 31, 2016, would have affected net earnings by approximately $0.2 million in fiscal 2016.
32
Results of Operations
Operating Performance. The following table presents selected consolidated financial data (in thousands, except share amounts, per share amounts and store count data):
Years Ended | |||||||||||
March 31, | |||||||||||
2016 | 2015 | 2014 | |||||||||
Net sales | $ | 1,959,998 | $ | 2,129,374 | $ | 2,338,570 | |||||
Net sales % decrease | (8.0 | )% | (8.9 | )% | (5.5 | )% | |||||
Comparable store sales % decrease (1) | (7.7 | )% | (9.2 | )% | (7.3 | )% | |||||
Gross profit as a % of net sales | 28.3 | % | 28.5 | % | 28.4 | % | |||||
SG&A as a % of net sales | 22.8 | % | 22.9 | % | 21.1 | % | |||||
Net advertising expense as a % of net sales | 5.4 | % | 6.0 | % | 5.3 | % | |||||
Depreciation and amortization expense as a % of net sales | 1.6 | % | 1.9 | % | 1.8 | % | |||||
Asset impairment charges as a % of net sales | 1.1 | % | 2.2 | % | — | % | |||||
(Loss) income from operations as a % of net sales | (2.6 | )% | (4.7 | )% | 0.1 | % | |||||
Net interest expense as a % of net sales | 0.1 | % | 0.1 | % | 0.1 | % | |||||
Net (loss) income | $ | (54,879 | ) | $ | (132,746 | ) | $ | 228 | |||
Net (loss) income per diluted share | $ | (1.98 | ) | $ | (4.72 | ) | $ | 0.01 | |||
Weighted average shares outstanding—diluted | 27,701,055 | 28,129,596 | 30,683,989 | ||||||||
Number of stores open at the end of period | 226 | 228 | 228 | ||||||||
(1) | Comprised of net sales at stores in operation for at least 14 full months, including remodeled and relocated stores, as well as net sales for our website. Stores that are closed are excluded from the calculation the month before closing. |
Net loss was $54.9 million, or $1.98 per diluted share, for fiscal 2016 compared with net loss of $132.7 million, or $4.72 per diluted share, for fiscal 2015 and net income of $0.2 million, or $0.01 per diluted share, for fiscal 2014. The results for the twelve months ended March 31, 2016 include a $20.9 million pre-tax, non-cash charge related to impairment of property and equipment. The results for the twelve months ended March 31, 2015 include a $47.9 million pre-tax, non-cash charge related to impairment of property and equipment and a $66.1 million non-cash charge related to establishing a valuation allowance for deferred tax assets, which was comprised of $41.4 million of tax expense for previously recognized deferred tax assets and $24.7 million of tax benefits not recognized related to losses incurred during fiscal 2015. The balance of the increase in net income for fiscal 2016 as compared to fiscal 2015 was largely due to a decrease in SG&A expense, net advertising expense and depreciation and amortization expenses, partially offset by a comparable store sales decrease of 7.7% and a decrease in gross profit as a percentage of net sales from 28.5% to 28.3%. The decrease in net income for fiscal 2015 as compared to fiscal 2014 was largely due to the $47.9 million asset impairment charge and the $66.1 million charge establishing a valuation allowance for deferred tax assets, as detailed above, coupled with a comparable store sales decrease of 9.2%.
Net sales decreased 8.0% in fiscal 2016 to $1.96 billion from $2.13 billion in fiscal 2015. Net sales decreased 8.9% in fiscal 2015 to $2.13 billion from $2.34 billion in fiscal 2014. The decrease in net sales for fiscal 2016 as compared to fiscal 2015 was attributable to a comparable store sales decrease of 7.7%. The decrease in net sales for fiscal 2015 as compared to fiscal 2014 was attributable to a comparable store sales decrease of 9.2%.
33
Net sales mix and comparable store sales percentage changes by product category for fiscal 2016, 2015 and 2014 were as follows:
Net Sales Mix Summary | Comparable Store Sales Summary | ||||||||||||||||
Twelve Months Ended March 31, | Twelve Months Ended March 31, | ||||||||||||||||
2016 | 2015 | 2014 | 2016 | 2015 | 2014 | ||||||||||||
Appliances | 53 | % | 51 | % | 47 | % | (3.2 | )% | (3.1 | )% | 3.0 | % | |||||
Consumer electronics (1) | 36 | % | 37 | % | 38 | % | (10.3 | )% | (10.9 | )% | (18.8 | )% | |||||
Home products (2) | 6 | % | 5 | % | 5 | % | 5.4 | % | (4.7 | )% | 35.8 | % | |||||
Computers and tablets | 5 | % | 7 | % | 10 | % | (35.0 | )% | (34.0 | )% | (14.7 | )% | |||||
Total | 100 | % | 100 | % | 100 | % | (7.7 | )% | (9.2 | )% | (7.3 | )% | |||||
(1) | Primarily consists of televisions, audio, personal electronics and accessories. |
(2) | Primarily consists of furniture and mattresses. |
Fiscal Year Ended March 31, 2016 Compared to Fiscal Year Ended March 31, 2015
The Company's comparable store sales drivers for the twelve months ended March 31, 2016 are summarized below:
Comparable Store Sales | Average Selling Price | Sales Unit Volume | |||||
Appliances | (3.2 | )% | Increase | Decrease | |||
Consumer electronics (1) | (10.3 | )% | Increase | Decrease | |||
Home products (2) | 5.4 | % | Increase | Increase | |||
Computers and tablets | (35.0 | )% | Decrease | Decrease | |||
Total | (7.7 | )% | |||||
(1) | Primarily consists of televisions, audio, personal electronics and accessories. |
(2) | Primarily consists of furniture and mattresses. |
The decrease in comparable store sales for the twelve months ended March 31, 2016 was 7.7%. The decrease in comparable store sales was driven by decreases in appliances, consumer electronics and computer and tablets, partially offset by an increase in home products. The 3.2% decrease in comparable store sales of the appliance category was due to a decrease in sales unit volume offset by an increase in average selling prices. The consumer electronics category comparable store sales decline of 10.3% was primarily due to a double digit decline in units sold offset slightly by an increase in average selling price, which was driven by an increase in sales of larger screen and more premium-featured televisions. The increase of 5.4% in comparable store sales for the home product category was the result of both an increase in units sold and average selling prices driven by furniture. The decrease in comparable store sales of 35.0% for the computers and tablets category for the twelve-month period was driven by double digit decreases in both unit demand and average selling prices for computers and tablets.
Gross profit margin, expressed as gross profit as a percentage of net sales, decreased slightly for the twelve months ended March 31, 2016 to 28.3% from 28.5% as compared to the twelve months ended March 31, 2015. The decrease was due to lower gross profit margin rates in all categories, except home products, partially offset by a favorable sales mix shift to product categories with higher gross profit rates, such as appliances and furniture.
Selling, general and administrative expense (“SG&A”), as a percentage of net sales, decreased 10 basis points, from 22.9% to 22.8%, for the twelve months ended March 31, 2016. The decrease in SG&A as a percentage of net sales was a result of a (i) a 59 basis points decrease, or $26.7 million, in wages due to our continuing effort to drive efficiencies in our labor structure, (ii) a decrease of 12 basis points, or $8.1 million, in delivery services due to efficiencies in routing and lower fuel prices, and (iii) a 17 basis point decrease, or $5.8 million, in employee benefits due to a reduction of medical expenses and payroll taxes driven by the efficiencies in our labor structure. These decreases were partially offset by a 57 basis point increase, or $1.3 million, in occupancy costs due primarily to increased property tax rates and a 30 basis point increase, or $4.2 million, in fees associated with offering higher-cost customer financing options and higher private label credit card penetration.
Net advertising expense, as a percentage of net sales, decreased 69 basis points, or $23.8 million, during the twelve months ended March 31, 2016, as compared to the twelve months ended March 31, 2015. The decrease as a percentage of net
34
sales was primarily due to a reduction of gross advertising spend primarily driven by reductions in print media along with rebalancing of spending among more efficient advertising mediums.
Depreciation and amortization expense, as a percentage of net sales, decreased 25 basis points, or $8.2 million, for the twelve months ended March 31, 2016 as compared to the twelve months ended March 31, 2015. The reduction of expense was the result of a lower depreciable asset base due to the $47.9 million asset impairment charge recorded in fiscal 2015 and the $20.9 million asset impairment charge recorded in the third quarter of fiscal 2016.
For the twelve months ended March 31, 2016, we recorded $0.4 million income tax expense compared to $30.8 million tax expense for the twelve months ended March 31, 2015. For fiscal 2016, the income tax expense recorded was due primarily to a $1.2 million settlement of an Internal Revenue Service examination for prior years, partially offset by monetizing a $0.8 million federal tax credit that was previously fully reserved. There was no income tax expense or benefit related to the results of fiscal 2016 operations due to our full valuation allowance. In fiscal 2015, we recognized income tax expense on a pretax loss resulting from the full valuation allowance that was recorded to reduce the net deferred tax assets of the Company to zero.
Fiscal Year Ended March 31, 2015 Compared to Fiscal Year Ended March 31, 2014
The Company's comparable store sales drivers for the twelve months ended March 31, 2015 are summarized below:
Comparable Store Sales | Comparable Store Sales Excluding Mobile and Fitness (3) | Average Selling Price | Sales Unit Volume | |||||||
Appliances | (3.1 | )% | (3.1 | )% | Decrease | Decrease | ||||
Consumer electronics (1) | (10.9 | )% | (10.9 | )% | Increase | Decrease | ||||
Home products (2) | (4.7 | )% | 0.5 | % | Increase | Decrease | ||||
Computers and tablets | (34.0 | )% | (28.6 | )% | Decrease | Decrease | ||||
Total | (9.2 | )% | (8.3 | )% | ||||||
(1) | Primarily consists of televisions, audio, personal electronics and accessories. |
(2) | Primarily consists of furniture and mattresses. |
(3) | We exited the mobile and fitness product lines in fiscal 2015. |
The decrease in comparable store sales for the twelve months ended March 31, 2015 was 9.2%. The decrease in comparable store sales was driven by decreases in all major product categories. Excluding mobile phones and fitness equipment, due to the exit from these product lines, the decrease in comparable store sales for the twelve months ended March 31, 2015 was 8.3%. The decrease in comparable store sales of the appliance category was due to a decrease in both average selling price and units sold. The consumer electronics category comparable store sales decline was primarily due to a double digit decline in units sold within the video category offset slightly by an increase in average selling price, which was driven by an increase in sales of larger screen and more premium-featured televisions. The decrease in comparable store sales for the computers and tablets category for the twelve-month period was driven by a decrease in unit demand for computers and tablets as well as a decrease in the average selling prices for computers and tablets and the exit from the contract-based mobile phone business. Excluding mobile phones, the decrease in comparable store sales for the twelve months ended March 31, 2015 for the computers and tablets category was 28.6%. The decrease in comparable store sales for the home products category was largely a result of the exit from fitness equipment and a double digit unit sales decline within the television stand and the recliner product lines, offset slightly by increased average selling prices among nearly all product lines within this category. Excluding fitness equipment, comparable store sales for the twelve-month period for the home products category increased by 0.5%.
Gross profit margin, expressed as gross profit as a percentage of net sales, increased slightly for the twelve months ended March 31, 2015 to 28.5% from 28.4% for the comparable prior year period. The twelve month period ended March 31, 2014 includes an approximately $1.7 million charge related to the write down of inventory for the exit from the contract-based mobile phone business. Excluding this charge, the gross profit margin, as adjusted, for the twelve month period ended March 31, 2014 was 28.5%. The gross profit margin for the period had a favorable sales mix shift to product categories with higher gross profit margin rates and an increase in gross profit margin for the video category due to an increase in sales of larger screen and more premium featured televisions, offset by a decrease in gross profit margin rates across the remaining categories.
Selling, general and administrative expense (“SG&A”), as a percentage of net sales, increased 181 basis points from 21.1% to 22.9% for the twelve months ended March 31, 2015 compared to the twelve months ended March 31, 2014. Excluding the $1.9 million charge for the write-off of store fixtures associated with our changing product mix, SG&A, as a
35
percentage of net sales, for the twelve month period ended March 31, 2014 was 21.0%. The increase in SG&A as a percentage of net sales was a result of a 43 basis point increase in occupancy costs as a percentage of net sales due to the deleveraging effect of the net sales decline, a 26 basis point increase in bank transaction fees associated with higher cost financing options to the customer and higher private-label credit card penetration, a 19 basis point increase in product services from a higher percentage of home delivery, an 18 basis point increase in consulting expenses to assist in rationalizing our marketing spend, optimizing our logistics network and accelerating our transformation efforts, and increases in other SG&A expenses primarily due to the deleveraging effect of the net sales decline. During fiscal 2015, we incurred $3.2 million in fees associated with consulting expenses to assist in the transformation efforts. The impact of these expenses was $0.11 of net loss per diluted share.
Net advertising expense, as a percentage of net sales, increased 74 basis points during the twelve months ended March 31, 2015, compared to the twelve months ended March 31, 2014. The increase as a percentage of net sales was primarily due to the deleveraging effect of the net sales decline and less vendor support due to programs being based on a percentage of sales.
Depreciation and amortization expense, as a percentage of net sales, increased slightly for the twelve months ended March 31, 2015 compared to the twelve months ended March 31, 2014. The increase as a percentage of net sales was primarily due to the deleveraging effect of our net sales decline, offset by lower depreciable assets from the asset impairment in the third quarter of fiscal 2015.
As of March 31, 2015, the Company had recognized income tax expense on a pretax loss resulting from the full valuation allowance that was recorded to reduce the net deferred tax assets of the Company to zero. We evaluate our deferred income tax assets and liabilities quarterly to determine whether or not a valuation allowance is necessary. We are required to assess the available positive and negative evidence to estimate if sufficient income will be generated to utilize deferred tax assets. The establishment of valuation allowances requires significant judgment and is impacted by various estimates. A significant piece of negative evidence that we consider is cumulative losses in recent periods. Such evidence is a significant piece of objective negative evidence that is difficult to overcome. While we believe positive evidence exists with regard to the realizability of these deferred tax assets, it is not considered sufficient to outweigh the objectively verifiable negative evidence. The significant negative evidence of our losses generated before income taxes and the unfavorable shift in our business could not be overcome by considering other sources of taxable income in recent periods, which included tax planning strategies. The full valuation allowance will remain until there exists significant objective positive evidence, such as sustained achievement of cumulative profits.
Liquidity and Capital Resources
The following table presents a summary on a consolidated basis of our net cash provided by (used in) operating, investing and financing activities (dollars are in thousands):
March 31, 2016 | March 31, 2015 | March 31, 2014 | |||||||||
Net cash provided by (used in) operating activities | $ | (21,782 | ) | $ | 12,763 | $ | 82,651 | ||||
Net cash used in investing activities | (12,928 | ) | (23,123 | ) | (22,724 | ) | |||||
Net cash provided by (used in) financing activities | 8,012 | (7,403 | ) | (60,355 | ) | ||||||
Our liquidity requirements arise primarily from our need to fund working capital requirements and capital expenditures. We make capital expenditures in investments in new stores and new distribution facilities, remodeling and relocation of existing stores, and information technology and other infrastructure-related projects that support our operations.
During fiscal 2017, we plan to relocate one store, add up to 15 Fine Lines departments to existing stores and remodel the sales floor of up to 100 existing stores. In addition, we plan to continue to invest in our infrastructure, including management information systems and distribution capabilities. We expect capital expenditures, net of sale and leaseback proceeds and tenant allowances from landlords, for fiscal 2017 to range between $20 million and $25 million. We expect capital expenditures for fiscal 2017 will be funded through cash, cash flow from operations, and borrowings under our Amended Facility (described below).
36
Net cash provided by (used in) operating activities. Net cash provided by (used in) operating activities primarily consists of net income (loss) as adjusted for increases or decreases in working capital and non-cash charges such as depreciation, asset impairment, deferred taxes and stock-based compensation expense. Net cash provided by (used in) operating activities was $(21.8) million, $12.8 million and $82.7 million for fiscal 2016, 2015 and 2014, respectively. The decrease in cash provided by operating activities in fiscal 2016 as compared to fiscal 2015 is primarily due to a net loss of $54.9 million coupled with changes in depreciation expense, deferred income taxes, asset impairment charges and changes in operating assets and liabilities. The net change in other current operating assets and liabilities was primarily a result of a decrease in inventory levels and differences in timing of customer sales and vendor payments. The decrease in cash provided by operating activities from fiscal 2015 to fiscal 2014 is primarily due to the net loss experienced in fiscal 2015 compared to the net income experienced in fiscal 2014, as adjusted for the increase in income tax expense and asset impairment charges. The net change in other current operating assets and liabilities was primarily a result of a decrease in inventory levels and differences in timing of customer sales and vendor payments.
Net cash used in investing activities. Net cash used in investing activities was $12.9 million, $23.1 million, and $22.7 million for fiscal 2016, 2015 and 2014, respectively. The decrease in cash used for in investing activities in fiscal 2016 as compared to fiscal 2015 is primarily due to a decrease in capital expenditures. In fiscal 2016, we opened one new store with a Fine Lines department, began a multi-store sales floor renovation project which will continue into fiscal 2017 and invested in infrastructure and e-commerce. In fiscal 2015, we opened one new store, relocated four stores, relocated a distribution center, opened five Fine Lines departments and began construction related to one new store which opened during the first quarter of fiscal 2016. Capital expenditures in fiscal 2016 also related to management information systems, e-commerce improvements and IT infrastructure. Cash used in investing activities remained relatively consistent for fiscal 2015 compared to fiscal 2014. Capital expenditures in fiscal 2014 related to store relocations and remodels, as well as management information systems and IT infrastructure.
Net cash provided by (used in) financing activities. Net cash provided by (used in) financing activities was $8.0 million, $(7.4) million, and $(60.4) million for fiscal 2016, 2015 and 2014 respectively. The increase in cash provided by financing activities from fiscal 2016 to fiscal 2015 is due to $8.0 million in net borrowings on the inventory financing facility in fiscal 2016 compared to $2.1 million in net repayments on the inventory financing facility in fiscal 2015. In addition, we did not have any treasury stock repurchases in fiscal 2016 compared to repurchases of $5.3 million in fiscal 2015. The decrease in funds used in financing activities from fiscal 2015 to fiscal 2014 is primarily due to a decrease in funds used for treasury stock repurchases of $43.9 million, a decrease in cash used by bank overdrafts of $11.5 million, partially offset by a decrease in funds provided by the exercise of stock options of $5.8 million.
Amended Facility. On July 29, 2013, Gregg Appliances, Inc. (“Gregg Appliances”) , a wholly owned subsidiary, entered into Amendment No. 1 to the Amended and Restated Loan and Security Agreement (the “Amended Facility”) to increase the maximum credit available to $400 million from $300 million, subject to borrowing base availability, and extend the term of the facility to expire on July 29, 2018.
Interest on borrowings (other than Eurodollar rate borrowings) is payable monthly at a fluctuating rate based on the bank’s prime rate or LIBOR plus an applicable margin. Interest on Eurodollar rate borrowings is payable on the last day of each “interest period” applicable to such borrowing or on the three month anniversary of the beginning of such “interest period” for interest periods greater than three months. The unused line rate is determined based on the amount of the daily average of the outstanding borrowings for the immediately preceding calendar quarter period (the “Daily Average”). For a Daily Average greater than or equal to 50% of the defined borrowing base, the unused line rate is 0.25%. For a Daily Average less than 50% of the defined borrowing base, the unused line rate is 0.375%. The Amended Facility is guaranteed by Gregg Appliances’ wholly-owned subsidiary, HHG Distributing LLC (“HHG Distributing”), which has no assets or operations. The guarantee is full and unconditional, and Gregg Appliances has no other subsidiaries.
Pursuant to the Amended Facility, the borrowing base is equal to the sum of (i) 90% of the amount of the eligible commercial accounts, (ii) 90% of the amount of eligible commercial and credit card receivables of Gregg Appliances and (iii) 90% of the net recovery percentage multiplied by the value of eligible inventory consistent with the most recent appraisal of such eligible inventory.
Under the Amended Facility, Gregg Appliances is not required to comply with any financial maintenance covenant unless “excess availability” is less than the greater of (i) 10.0% of the lesser of (A) the defined borrowing base or (B) the defined maximum credit or (ii) $20.0 million during the continuance of which event Gregg Appliances is subject to compliance with a fixed charge coverage ratio of 1.0 to 1.0.
37
Pursuant to the Amended Facility, if Gregg Appliances has “excess availability” of less than 12.5% of the lesser of (A) the defined borrowing base or (B) the defined maximum credit, it may, in certain circumstances more specifically described in the Amended Facility, become subject to cash dominion control.
The Amended Facility places limitations on the ability of Gregg Appliances to, among other things, incur debt, create other liens on its assets, make investments, sell assets, pay dividends, undertake transactions with affiliates, enter into merger transactions, enter into unrelated businesses, open collateral locations outside of the United States or enter into consignment assignments or floor plan financing arrangements. The Amended Facility also contains various customary representations and warranties, financial and collateral reporting requirements and other affirmative and negative covenants. Gregg Appliances was in compliance with the restrictions and covenants of the Amended Facility at March 31, 2016.
As of March 31, 2016 and 2015, Gregg Appliances had no borrowings outstanding under the Amended Facility. As of March 31, 2016, Gregg Appliances had $5.5 million of letters of credit outstanding, which expire at various dates through February 22, 2017. As of March 31, 2015, Gregg Appliances had $6.5 million of letters of credit outstanding which expired by December 31, 2015. The total borrowing availability under the Amended Facility was $139.9 million and $134.6 million as of March 31, 2016 and 2015, respectively. The interest rate based on the bank’s prime rate was 4.25% and 3.75% as of March 31, 2016 and 2015, respectively.
Inventory Financing Facility. We also have an inventory financing facility, which is a $10 million unsecured credit line that is non-interest bearing and is not collateralized with the inventory purchased. The facility includes customary covenants as well as customary events of default. The amount of borrowings included within accounts payable as of March 31, 2016 and 2015 were $10.0 million and $3.2 million, respectively.
Long Term Liquidity. Anticipated cash flows from operations and funds available from our Amended Facility, together with cash on hand, should provide sufficient funds to finance our operations for the next 12 months. As a normal part of our business, we consider opportunities to refinance our existing indebtedness, based on market conditions. Although we may refinance all or part of our existing indebtedness in the future, there can be no assurances that we will do so. Changes in our operating plans, lower than anticipated sales, changes in vendor terms, increased expenses, acquisitions or other events may require us to seek additional debt or equity financing. There can be no guarantee that financing will be available on acceptable terms or at all. Additional debt financing, if available, could impose additional cash payment obligations, additional covenants and operating restrictions.
Impact of Inflation
The impact of inflation and changing prices has not been material to our net sales or net income in any of the last three fiscal years. Highly competitive market conditions and the general economic environment have minimized inflation’s impact on the selling prices of our products and our expenses. In addition, price deflation and the continued commoditization of key technology products in the consumer electronics category affect our ability to increase our gross profit margin in the consumer electronics category.
Contractual Obligations
Our contractual obligations at March 31, 2016 were as follows (dollars are in thousands):
Payments due by period | ||||||||||||||||||||
Total | Less than 1 year | 1-3 years | 4-5 years | More than 5 years | ||||||||||||||||
Operating lease obligations | $ | 454,596 | $ | 92,068 | $ | 171,287 | $ | 125,251 | $ | 65,990 | ||||||||||
Advertising commitments | 2,758 | 729 | 2,029 | — | — | |||||||||||||||
Revolving credit facility | — | — | — | — | — | |||||||||||||||
Total | $ | 457,354 | $ | 92,797 | $ | 173,316 | $ | 125,251 | $ | 65,990 | ||||||||||
The above contractual obligation table excludes any future payments made in connection with our Frozen Non-Qualified Deferred Compensation Plan. The aggregate balance outstanding for all participants in the plan as of March 31, 2016 was approximately $4.0 million. We are unable to estimate the timing of these future payments under the plan. Refer to Note 9 of our Consolidated Financial Statements included in this report for further information.
We lease our retail stores, warehouse and office space, corporate airplane and certain vehicles under operating leases. Our noncancelable lease agreements expire at various dates through fiscal 2026, require various minimum annual rentals and contain certain options for renewal. The majority of the real estate leases require payment of property taxes, normal
38
maintenance and insurance on the properties. Total rent expense with respect to real property was approximately $89.9 million, $90.4 million and $90.4 million in fiscal 2016, 2015 and 2014, respectively. Contingent rentals based upon sales are applicable to certain of the store leases. There was no contingent rent expense in 2016. For each of fiscal 2015 and 2014 the contingent rent expense was approximately $0.1 million.
Off Balance Sheet Items
We do not have any off balance sheet arrangements. We finance some of our development programs through sale and leaseback transactions, which involve selling stores to third parties and then leasing the stores back under leases that are accounted for as operating leases in accordance with U.S. GAAP. A summary of our operating lease obligations by fiscal year is included in the “Contractual Obligations” section above. Additional information regarding our operating leases is available in “Business—Properties,” and Note 8, Leases, in the Notes to our audited consolidated financial statements included elsewhere in this Annual Report on Form 10-K.
ITEM 7A. | Quantitative and Qualitative Disclosures about Market Risk. |
In addition to the risks inherent in our operations, we are exposed to certain market risks, including interest rate risk. As of March 31, 2016, our debt was comprised of our Amended Facility. Interest on borrowings under our Amended Facility is payable at a fluctuating rate based on the bank’s prime rate or LIBOR plus an applicable margin. As of March 31, 2016, we had no cash borrowings under our Amended Facility.
39
ITEM 8. | Financial Statements and Supplementary Data. | |
INDEX TO CONSOLIDATED FINANCIAL STATEMENTS | ||
HHGREGG, INC. AND SUBSIDIARIES CONSOLIDATED FINANCIAL STATEMENTS | ||
Management’s Report on the Consolidated Financial Statements | ||
Management’s Report on Internal Control Over Financial Reporting | ||
Report of Independent Registered Public Accounting Firm | ||
Consolidated Statements of Operations for Fiscal Years Ended March 31, 2016, 2015 and 2014 | ||
Consolidated Balance Sheets as of March 31, 2016 and 2015 | ||
Consolidated Statements of Stockholders’ Equity for Fiscal Years Ended March 31, 2016, 2015 and 2014 | ||
Consolidated Statements of Cash Flows for Fiscal Years Ended March 31, 2016, 2015 and 2014 | ||
Notes to Consolidated Financial Statements | ||
40
Management’s Report on the Consolidated Financial Statements
Our management is responsible for the preparation, integrity and objectivity of the accompanying consolidated financial statements and the related financial information. The consolidated financial statements have been prepared in conformity with U.S. GAAP and necessarily include certain amounts that are based on estimates and informed judgments. Our management also prepared the related financial information included in this Annual Report on Form 10-K and is responsible for its accuracy and consistency with the consolidated financial statements.
The accompanying consolidated financial statements have been audited by KPMG LLP, an independent registered public accounting firm, which conducted its audits in accordance with the standards of the Public Company Accounting Oversight Board (U.S.) (PCAOB). The independent registered public accounting firm’s responsibility is to express an opinion on the consolidated financial statements based on its audits in accordance with the standards of the PCAOB.
Management’s Report on Internal Control Over Financial Reporting
Our management is responsible for establishing and maintaining adequate internal control over financial reporting as defined in Rule 13a-15(f) under the Securities Exchange Act of 1934, as amended. Our internal control over financial reporting is designed under the supervision of our principal executive officer and principal financial and accounting officer, and effected by our Board of Directors, management and other personnel, to provide reasonable assurance regarding the reliability of financial reporting and the preparation of financial statements for external purposes in accordance with U.S. GAAP and includes those policies and procedures that:
(1) | Pertain to the maintenance of records that in reasonable detail accurately and fairly reflect our transactions and the dispositions of our assets; |
(2) | Provide reasonable assurance that our transactions are recorded as necessary to permit preparation of financial statements in accordance with U.S. GAAP, and that our receipts and expenditures are being made only in accordance with authorizations of our management and Board of Directors; and |
(3) | Provide reasonable assurance regarding prevention or timely detection of the unauthorized acquisition, use or disposition of our assets that could have a material effect on our financial statements. |
Under the supervision and with the participation of our management, including our principal executive officer and principal financial and accounting officer, we assessed the effectiveness of our internal control over financial reporting as of March 31, 2016, using the criteria set forth by the Committee of Sponsoring Organizations of the Treadway Commission (COSO) in Internal Control — Integrated Framework (2013). Based on our assessment, we have concluded that our internal control over financial reporting was effective as of March 31, 2016. During our assessment, we did not identify any material weaknesses in our internal control over financial reporting. KPMG LLP, an independent registered public accounting firm, has audited the consolidated financial statements included in this Annual Report on Form 10-K and, as a part of this audit, has issued their report, included in Item 8, Financial Statements and Supplementary Data, on the effectiveness of our internal control over financial reporting. Because of its inherent limitations, internal control over financial reporting may not prevent or detect misstatements. Therefore, even those systems determined to be effective can provide only reasonable assurance with respect to financial statement preparation and presentation. Also, projections of any evaluation of the effectiveness of internal control over financial reporting to future periods are subject to the risk that the control may become inadequate because of a change in conditions, or that the degree of compliance with the policies or procedures may deteriorate.
/s/ ROBERT J. RIESBECK | /s/ KEVIN J. KOVACS | |
Robert J. Riesbeck | Kevin J. Kovacs | |
Interim Chief Executive Officer and Chief Financial Officer | Vice President, Controller | |
(Principal Executive and Financial Officer) | (Principal Accounting Officer) | |
41
Report of Independent Registered Public Accounting Firm
The Board of Directors and Stockholders
hhgregg, Inc.:
We have audited the accompanying consolidated balance sheets of hhgregg, Inc. and subsidiaries (the “Company”) as of March 31, 2016 and 2015, and the related consolidated statements of operations, stockholders’ equity, and cash flows for each of the years in the three-year period ended March 31, 2016. We also have audited the Company’s internal control over financial reporting as of March 31, 2016, based on criteria established in Internal Control – Integrated Framework (2013) issued by the Committee of Sponsoring Organizations of the Treadway Commission (“COSO”). The Company’s management is responsible for these consolidated financial statements, for maintaining effective internal control over financial reporting, and for its assessment of the effectiveness of internal control over financial reporting, included in the accompanying management’s report on internal control over financial reporting under Item 8. Our responsibility is to express an opinion on these consolidated financial statements and an opinion on the Company’s internal control over financial reporting based on our audits.
We conducted our audits in accordance with the standards of the Public Company Accounting Oversight Board (United States). Those standards require that we plan and perform the audits to obtain reasonable assurance about whether the financial statements are free of material misstatement and whether effective internal control over financial reporting was maintained in all material respects. Our audits of the consolidated financial statements included examining, on a test basis, evidence supporting the amounts and disclosures in the financial statements, assessing the accounting principles used and significant estimates made by management, and evaluating the overall financial statement presentation. Our audit of internal control over financial reporting included obtaining an understanding of internal control over financial reporting, assessing the risk that a material weakness exists, and testing and evaluating the design and operating effectiveness of internal control based on the assessed risk. Our audits also included performing such other procedures as we considered necessary in the circumstances. We believe that our audits provide a reasonable basis for our opinions.
A company’s internal control over financial reporting is a process designed to provide reasonable assurance regarding the reliability of financial reporting and the preparation of financial statements for external purposes in accordance with generally accepted accounting principles. A company’s internal control over financial reporting includes those policies and procedures that (1) pertain to the maintenance of records that, in reasonable detail, accurately and fairly reflect the transactions and dispositions of the assets of the company; (2) provide reasonable assurance that transactions are recorded as necessary to permit preparation of financial statements in accordance with generally accepted accounting principles, and that receipts and expenditures of the company are being made only in accordance with authorizations of management and directors of the company; and (3) provide reasonable assurance regarding prevention or timely detection of unauthorized acquisition, use, or disposition of the company’s assets that could have a material effect on the financial statements.
Because of its inherent limitations, internal control over financial reporting may not prevent or detect misstatements. Also, projections of any evaluation of effectiveness to future periods are subject to the risk that controls may become inadequate because of changes in conditions, or that the degree of compliance with the policies or procedures may deteriorate.
In our opinion, the consolidated financial statements referred to above present fairly, in all material respects, the financial position of hhgregg, Inc. and subsidiaries as of March 31, 2016 and 2015, and the results of their operations and their cash flows for each of the years in the three-year period ended March 31, 2016, in conformity with U.S. generally accepted accounting principles. Also in our opinion, the Company maintained, in all material respects, effective internal control over financial reporting as of March 31, 2016, based on criteria established in Internal Control — Integrated Framework (2013) issued by COSO.
/s/ KPMG LLP
Indianapolis, Indiana
May 19, 2016
42
HHGREGG, INC. AND SUBSIDIARIES
Consolidated Statements of Operations
Years Ended March 31, 2016, 2015, and 2014
2016 | 2015 | 2014 | |||||||||
(In thousands, except share and per share data) | |||||||||||
Net sales | $ | 1,959,998 | $ | 2,129,374 | $ | 2,338,570 | |||||
Cost of goods sold | 1,406,216 | 1,523,536 | 1,674,031 | ||||||||
Gross profit | 553,782 | 605,838 | 664,539 | ||||||||
Selling, general and administrative expenses | 447,508 | 488,391 | 493,950 | ||||||||
Net advertising expense | 105,046 | 128,826 | 124,179 | ||||||||
Depreciation and amortization expense | 32,043 | 40,200 | 43,120 | ||||||||
Asset impairment charges | 20,910 | 47,869 | 613 | ||||||||
(Loss) income from operations | (51,725 | ) | (99,448 | ) | 2,677 | ||||||
Other expense (income): | |||||||||||
Interest expense | 2,742 | 2,600 | 2,465 | ||||||||
Interest income | (22 | ) | (63 | ) | (10 | ) | |||||
Total other expense | 2,720 | 2,537 | 2,455 | ||||||||
(Loss) income before income taxes | (54,445 | ) | (101,985 | ) | 222 | ||||||
Income tax expense (benefit) | 434 | 30,761 | (6 | ) | |||||||
Net (loss) income | $ | (54,879 | ) | $ | (132,746 | ) | $ | 228 | |||
Net (loss) income per share | |||||||||||
Basic | $ | (1.98 | ) | $ | (4.72 | ) | $ | 0.01 | |||
Diluted | $ | (1.98 | ) | $ | (4.72 | ) | $ | 0.01 | |||
Weighted average shares outstanding-basic | 27,701,055 | 28,129,596 | 30,209,928 | ||||||||
Weighted average shares outstanding-diluted | 27,701,055 | 28,129,596 | 30,683,989 | ||||||||
See accompanying notes to consolidated financial statements.
43
HHGREGG, INC. AND SUBSIDIARIES
Consolidated Balance Sheets
March 31, 2016 and 2015
2016 | 2015 | ||||||
(In thousands, except share data) | |||||||
Assets | |||||||
Current assets: | |||||||
Cash | $ | 3,703 | $ | 30,401 | |||
Accounts receivable—trade, less allowances of $5 and $19, respectively | 11,106 | 11,901 | |||||
Accounts receivable—other | 14,937 | 16,715 | |||||
Merchandise inventories, net | 256,559 | 257,469 | |||||
Prepaid expenses and other current assets | 6,333 | 6,581 | |||||
Income tax receivable | 1,130 | 5,326 | |||||
Total current assets | 293,768 | 328,393 | |||||
Net property and equipment | 87,472 | 128,107 | |||||
Deferred financing costs, net | 1,257 | 1,796 | |||||
Deferred income taxes | — | 6,489 | |||||
Other assets | 2,855 | 2,844 | |||||
Total long-term assets | 91,584 | 139,236 | |||||
Total assets | $ | 385,352 | $ | 467,629 | |||
Liabilities and Stockholders’ Equity | |||||||
Current liabilities: | |||||||
Accounts payable | $ | 107,474 | $ | 112,143 | |||
Customer deposits | 43,235 | 48,742 | |||||
Accrued liabilities | 43,370 | 46,723 | |||||
Deferred income taxes | — | 6,489 | |||||
Total current liabilities | 194,079 | 214,097 | |||||
Long-term liabilities: | |||||||
Deferred rent | 59,101 | 67,935 | |||||
Other long-term liabilities | 10,818 | 12,009 | |||||
Total long-term liabilities | 69,919 | 79,944 | |||||
Total liabilities | 263,998 | 294,041 | |||||
Stockholders’ equity: | |||||||
Preferred stock, par value $.0001; 10,000,000 shares authorized; no shares issued and outstanding as of March 31, 2016 and 2015, respectively | — | — | |||||
Common stock, par value $.0001; 150,000,000 shares authorized; 41,204,660 and 41,161,753 shares issued; and 27,707,978 and 27,665,071 outstanding as of March 31, 2016 and March 31, 2015, respectively | 4 | 4 | |||||
Additional paid-in capital | 304,325 | 301,680 | |||||
Retained earnings (accumulated deficit) | (32,747 | ) | 22,132 | ||||
Common stock held in treasury at cost, 13,496,682 shares as of March 31, 2016 and March 31, 2015, respectively | (150,228 | ) | (150,228 | ) | |||
Total stockholders’ equity | 121,354 | 173,588 | |||||
Total liabilities and stockholders’ equity | $ | 385,352 | $ | 467,629 | |||
See accompanying notes to consolidated financial statements.
44
HHGREGG, INC. AND SUBSIDIARIES
Consolidated Statements of Stockholders’ Equity
Years Ended March 31, 2016, 2015, and 2014
(Dollars in thousands)
Common Shares | Preferred Stock | Common Stock | Additional Paid-in Capital | Retained Earnings (Accumulated Deficit) | Common Stock Held in Treasury | Total Stockholders’ Equity | ||||||||||||||||||||
Balance at March 31, 2013 | 31,468,453 | $ | — | $ | 4 | $ | 287,806 | $ | 154,650 | $ | (95,802 | ) | $ | 346,658 | ||||||||||||
Net income | — | — | — | — | 228 | — | 228 | |||||||||||||||||||
Exercise of stock options | 480,647 | — | — | 5,814 | — | — | 5,814 | |||||||||||||||||||
Stock compensation expense | — | — | — | 4,428 | — | — | 4,428 | |||||||||||||||||||
Excess tax deficiency from stock-based compensation | — | — | — | (849 | ) | — | — | (849 | ) | |||||||||||||||||
Repurchase of common stock | (3,488,882 | ) | — | — | — | — | (49,145 | ) | (49,145 | ) | ||||||||||||||||
Balance at March 31, 2014 | 28,460,218 | $ | — | $ | 4 | $ | 297,199 | $ | 154,878 | $ | (144,947 | ) | $ | 307,134 | ||||||||||||
Net loss | — | — | — | — | (132,746 | ) | — | (132,746 | ) | |||||||||||||||||
Vesting of RSU's, net of withholdings | 40,363 | — | — | (142 | ) | — | — | (142 | ) | |||||||||||||||||
Stock compensation expense | — | — | — | 4,623 | — | — | 4,623 | |||||||||||||||||||
Repurchase of common stock | (835,510 | ) | — | — | — | — | (5,281 | ) | (5,281 | ) | ||||||||||||||||
Balance at March 31, 2015 | 27,665,071 | $ | — | $ | 4 | $ | 301,680 | $ | 22,132 | $ | (150,228 | ) | $ | 173,588 | ||||||||||||
Net loss | — | — | — | — | (54,879 | ) | — | (54,879 | ) | |||||||||||||||||
Vesting of RSU's, net of tax withholdings | 42,907 | — | — | (64 | ) | — | — | (64 | ) | |||||||||||||||||
Stock compensation expense | — | — | — | 2,709 | — | — | 2,709 | |||||||||||||||||||
Balance at March 31, 2016 | 27,707,978 | $ | — | $ | 4 | $ | 304,325 | $ | (32,747 | ) | $ | (150,228 | ) | $ | 121,354 | |||||||||||
See accompanying notes to consolidated financial statements.
45
HHGREGG, INC. AND SUBSIDIARIES
Consolidated Statements of Cash Flows
Years Ended March 31, 2016, 2015, and 2014
2016 | 2015 | 2014 | |||||||||
(In thousands) | |||||||||||
Cash flows from operating activities: | |||||||||||
Net (loss) income | $ | (54,879 | ) | $ | (132,746 | ) | $ | 228 | |||
Adjustments to reconcile net (loss) income to net cash provided by operating activities: | |||||||||||
Depreciation and amortization | 32,043 | 40,200 | 43,120 | ||||||||
Amortization of deferred financing costs | 539 | 538 | 604 | ||||||||
Stock-based compensation | 2,709 | 4,623 | 4,428 | ||||||||
Excess tax deficiency from stock-based compensation | — | — | 849 | ||||||||
Loss (gain) on sales of property and equipment | (19 | ) | 252 | 1,646 | |||||||
Deferred income taxes | — | 41,402 | (392 | ) | |||||||
Asset impairment charges | 20,910 | 47,869 | 613 | ||||||||
Tenant allowances received from landlords | 812 | 986 | 2,705 | ||||||||
Changes in operating assets and liabilities: | |||||||||||
Accounts receivable—trade | 795 | 3,220 | 9,150 | ||||||||
Accounts receivable—other | 986 | 384 | 2,407 | ||||||||
Merchandise inventories | 910 | 41,073 | 17,020 | ||||||||
Income tax receivable | 4,196 | (3,946 | ) | (815 | ) | ||||||
Prepaid expenses and other assets | 454 | (108 | ) | (1,066 | ) | ||||||
Accounts payable | (12,537 | ) | (26,882 | ) | 6,125 | ||||||
Customer deposits | (5,507 | ) | 7,224 | 3,476 | |||||||
Income tax payable | — | (122 | ) | (2,023 | ) | ||||||
Accrued liabilities | (3,417 | ) | (4,317 | ) | 1,476 | ||||||
Deferred rent | (8,854 | ) | (7,176 | ) | (7,115 | ) | |||||
Other long-term liabilities | (923 | ) | 289 | 215 | |||||||
Net cash provided by (used in) operating activities | (21,782 | ) | 12,763 | 82,651 | |||||||
Cash flows from investing activities: | |||||||||||
Purchases of property and equipment | (12,828 | ) | (22,522 | ) | (22,257 | ) | |||||
Proceeds from sales of property and equipment | 117 | 45 | 217 | ||||||||
Purchases of corporate-owned life insurance | (217 | ) | (646 | ) | (684 | ) | |||||
Net cash used in investing activities | (12,928 | ) | (23,123 | ) | (22,724 | ) | |||||
Cash flows from financing activities: | |||||||||||
Purchases of treasury stock | — | (5,281 | ) | (49,145 | ) | ||||||
Proceeds from exercise of stock options | — | — | 5,814 | ||||||||
Excess tax deficiency from stock-based compensation | — | — | (849 | ) | |||||||
Net decrease in bank overdrafts | — | — | (11,506 | ) | |||||||
Net (repayments) borrowings on inventory financing facility | 8,012 | (2,122 | ) | (3,723 | ) | ||||||
Payment of financing costs | — | — | (946 | ) | |||||||
Net cash provided by (used in) financing activities | 8,012 | (7,403 | ) | (60,355 | ) | ||||||
Net decrease in cash | (26,698 | ) | (17,763 | ) | (428 | ) | |||||
Cash | |||||||||||
Beginning of period | 30,401 | 48,164 | 48,592 | ||||||||
End of period | $ | 3,703 | $ | 30,401 | $ | 48,164 | |||||
Supplemental disclosure of cash flow information: | |||||||||||
Interest paid | $ | 2,205 | $ | 2,085 | $ | 1,881 | |||||
Income taxes (received) paid | $ | (3,523 | ) | $ | (6,411 | ) | $ | 3,418 | |||
Capital expenditures included in accounts payable | $ | 1,265 | $ | 1,409 | $ | 1,068 | |||||
See accompanying notes to consolidated financial statements.
46
HHGREGG, INC. AND SUBSIDIARIES
Notes to Consolidated Financial Statements
(1) | Summary of Significant Accounting Policies |
Description of Business
hhgregg, Inc. is an appliance, electronics and furniture retailer that is committed to providing customers with a truly differentiated purchase experience through superior customer service, knowledgeable sales associates and the highest quality product selections. Founded in 1955, hhgregg is a multi-regional retailer with 226 brick-and-mortar stores in 20 states that also offers market-leading global and local brands at value prices nationwide via hhgregg.com. The Company reports its results as one reportable segment.
(a) | Formation |
hhgregg, Inc. was formed in Delaware on April 12, 2007. As part of a corporate reorganization effected on July 19, 2007, the stockholders of Gregg Appliances Inc. (“Gregg Appliances”) contributed all of their shares of Gregg Appliances to hhgregg, Inc. in exchange for common stock of hhgregg, Inc. As a result, Gregg Appliances became a wholly-owned subsidiary of hhgregg, Inc.
On August 31, 2015, hhgregg Inc., a Delaware corporation, changed its state of incorporation from Delaware to Indiana. This reincorporation was effectuated by a merger ("Reincorporation Merger") of the Company with and into hhgregg Indiana, Inc., an Indiana corporation (“hhgregg Indiana”), then a wholly-owned Indiana subsidiary of the Company established for such purpose. At that time, hhgregg Indiana changed its name to “hhgregg, Inc.”
(b) | Principles of Consolidation |
The consolidated financial statements include the accounts of hhgregg, Inc. and its wholly-owned subsidiary, Gregg Appliances (the “Company” or “hhgregg”). The financial statements of Gregg Appliances include its wholly-owned subsidiary HHG Distributing LLC (“HHG Distributing”), which has no assets or operations. All intercompany balances and transactions have been eliminated upon consolidation.
(c) | Estimates |
Management uses estimates and assumptions in preparing financial statements in conformity with accounting principles generally accepted in the United States. Those estimates and assumptions affect the reported amounts of assets and liabilities, the disclosure of contingent assets and liabilities, and the reported revenues and expenses. Actual results could differ from those estimates and assumptions. The Company's significant estimates include vendor allowances, inventory reserves, long-lived assets, accruals for uncertain tax positions and income taxes, revenue recognition and self-insured liabilities.
(d) | Fiscal Year |
The Company’s fiscal year is the twelve-month period ended March 31.
(e) | Cash |
Cash primarily consists of cash on hand and bank deposits. The Company had no outstanding checks in excess of funds on deposit (book overdrafts) at March 31, 2016 and 2015.
(f) | Accounts Receivable |
Accounts receivable are recorded at the invoiced amount and are subject to finance charges. Accounts receivable-trade consists of credit card and trade receivables. Accounts receivable-other consists mainly of amounts due from vendors for advertising and volume rebates. The allowance for doubtful accounts is the Company’s best estimate of the amount of probable credit losses in the Company’s existing accounts receivable. The Company reviews its allowance for doubtful accounts monthly. Past due balances over 90 days and over a specified amount are reviewed individually for collectability. Account balances are charged off against the allowance after all means of collection have been exhausted and the potential for recovery is considered remote. The Company does not have any off-balance sheet credit exposure related to its customers.
47
(g) | Merchandise Inventories |
Inventory is valued at the lower of the cost of the inventory or fair market value through the establishment of markdown and inventory loss reserves. The Company’s markdown reserve represents the excess of the carrying amount, typically average cost, over the amount it expects to realize from the ultimate sale or other disposal of the inventory. Subsequent changes in facts or circumstances do not result in the restoration of previously recorded markdowns or an increase in that newly established cost basis.
The Company purchases a significant portion of its merchandise from two vendors. For the year ended March 31, 2016, two vendors accounted for 38.5% and 15.6%, respectively, of merchandise purchases. For the year ended March 31, 2015, two vendors accounted for 32.4% and 16.3%, respectively, of merchandise purchases. For the year ended March 31, 2014, two vendors accounted for 29.2% and 17.1%, respectively, of merchandise purchases.
The Company included amounts due to a third party financing company for use of an inventory financing facility, entered into during fiscal 2013, within accounts payable in the accompanying consolidated balance sheet. Borrowings and payments on the inventory financing facility are classified as financing activities in the consolidated statements of cash flows. Originally the inventory financing facility was a $20 million unsecured credit line; however, during the fourth fiscal quarter of 2015 it was amended and is now a $10 million facility. The facility is non-interest bearing and is not collateralized with the inventory purchased. The facility includes customary covenants as well as customary events of default. The amounts borrowed on the credit line fluctuate on a daily basis. The amount of borrowings included within accounts payable as of March 31, 2016 and 2015 were $10.0 million and $3.2 million, respectively. As of March 31, 2016 the Company did not have any availability under the facility. As of March 31, 2015 the Company had $6.8 million available under the facility. The Company incurred no interest on these borrowings for the years ended March 31, 2016 and 2015.
(h) | Property and Equipment |
Property and equipment are recorded at cost and are depreciated over their expected useful lives on a straight-line basis. Leasehold improvements are depreciated over the shorter of the lease term or expected useful life. Repairs and maintenance costs are charged directly to expense as incurred. In certain lease arrangements, the Company is considered the owner of the building during the construction period. At the end of the construction period, the Company will sell and lease the location back applying provisions of lease accounting guidance. Any gains on sale and leaseback transactions are deferred and amortized over the life of the respective lease. The Company does not have any continuing involvement with the sale and leaseback locations, other than a normal leaseback, and the locations are accounted for as operating leases. In fiscal 2016 and 2015, the Company did not execute any sale and leaseback transactions.
Property and equipment consisted of the following at March 31, 2016 and 2015 (in thousands):
2016 | 2015 | ||||||
Machinery and equipment | $ | 23,700 | $ | 25,956 | |||
Store fixtures and furniture | 150,390 | 162,737 | |||||
Vehicles | 1,757 | 1,962 | |||||
Signs | 11,959 | 15,070 | |||||
Leasehold improvements | 103,908 | 130,887 | |||||
Construction in progress | 1,792 | 3,862 | |||||
293,506 | 340,474 | ||||||
Less accumulated depreciation and amortization | (206,034 | ) | (212,367 | ) | |||
Net property and equipment | $ | 87,472 | $ | 128,107 | |||
Estimated useful lives by major asset category are as follows:
Asset | Life (in years) |
Machinery and equipment | 5-7 |
Store fixtures and furniture | 3-7 |
Vehicles | 5 |
Signs | 7 |
Leasehold improvements | 5-15 |
48
Depreciation and amortization expense for the years ended March 31, 2016, 2015 and 2014 was $32.0 million, $40.2 million and $43.1 million, respectively.
(i) | Impairment of Long-Lived Assets |
Long-lived assets other than goodwill and indefinite-lived intangible assets, which are separately tested for impairment, are evaluated for impairment whenever events or changes in circumstances indicate that the carrying amount may not be recoverable. When evaluating long-lived assets for potential impairment, the Company compares the carrying amount of the asset or asset group to the asset’s or asset group’s estimated undiscounted future cash flows. If the estimated undiscounted future cash flows are less than the carrying amount of the asset or asset group, an impairment loss is calculated. The impairment loss calculation compares the carrying amount of the asset or asset group to the asset’s or asset group’s estimated fair value, which may be based on estimated discounted future cash flows. An impairment loss is recognized for the amount by which the asset’s or asset group’s carrying amount exceeds the asset’s or asset group’s estimated fair value. If an impairment loss is recognized, the adjusted carrying amount of the asset or asset group becomes its new cost basis. For a depreciable long-lived asset, the new cost basis will be depreciated (amortized) over the remaining useful life of that asset or asset group. Refer to Note 2.
(j) | Deferred Financing Costs |
Costs incurred related to debt financing are capitalized and amortized over the life of the related debt as a component of interest expense. Debt financing costs are related to the Company’s Amended Facility as discussed in Note 5 below. The Company recognized related amortization expense of deferred financing costs of $0.5 million, $0.5 million and $0.6 million for the years ended March 31, 2016, 2015 and 2014, respectively.
(k) | Self-Insured Liabilities |
The Company is self-insured for certain losses related to workers’ compensation, medical insurance, general liability and motor vehicle insurance claims. However, the Company obtains third-party insurance coverage to limit its exposure to these claims. The following table provides the Company’s stop loss coverage for the fiscal years ended March 31, 2016, 2015 and 2014 (in thousands):
Fiscal Year Ended March 31, | |||||||||||
2016 | 2015 | 2014 | |||||||||
Workers’ Compensation — per occurrence | $ | 300 | $ | 300 | $ | 300 | |||||
Workers’ Compensation — per occurrence (OH) | $ | 300 | $ | 300 | $ | 500 | |||||
General Liability — per occurrence | $ | 250 | $ | 250 | $ | 250 | |||||
Motor Vehicles — per occurrence | $ | 100 | $ | 100 | $ | 100 | |||||
Medical Insurance — per participant, per year | $ | 300 | $ | 300 | $ | 300 | |||||
When estimating self-insured liabilities, a number of factors are considered, including historical claims experience, demographic factors, severity factors and valuations provided by independent third-party actuaries. Quarterly, management reviews its assumptions and the valuations provided by independent third-party actuaries to determine the adequacy of the self-insured liabilities.
(l) | Accrued Straight-Line Rent |
Retail and distribution operations are conducted from leased locations. The leases generally require payment of real estate taxes, insurance and common area maintenance, in addition to rent. The terms of the lease agreements generally range from 10 to 15 years. Most of the leases contain renewal options and escalation clauses, and certain store leases require contingent rents based on factors such as specified percentages of revenue or the consumer price index.
For leases that contain predetermined fixed escalations of the minimum rent, the related rent expense is recognized on a straight-line basis from the date the Company takes possession of the property to the end of the lease term. Any difference between the straight-line rent amounts and amounts payable under the leases are recorded as part of deferred rent. Cash or lease incentives received upon entering into certain store leases (tenant allowances) are recognized on a straight-line basis as a reduction to rent from the date the Company takes possession of the property through the end of the lease term. The unamortized portion of tenant allowances is recorded as a part of deferred rent. For leases that require contingent rents,
49
management makes an estimate of the contingent rent annually and recognizes the related rent expense on a straight-line basis over the year. As of March 31, 2016 and 2015, deferred rent included in long-term liabilities in the Company’s consolidated balance sheets was $59.1 million and $67.9 million, respectively.
Transaction costs associated with the sale and leaseback of properties and any related deferred gain or loss are recognized on a straight-line basis over the initial period of the lease agreements. The Company does not have any retained or contingent interests in the properties, nor does the Company provide any guarantees in connection with the sale and leaseback of properties, other than a corporate-level guarantee of lease payments. At March 31, 2016 and 2015, deferred gains of $1.2 million and $1.5 million, respectively, were recorded in other long term liabilities relating to sale and leaseback transactions.
(m) | Revenue Recognition |
The Company recognizes revenue from the sale of merchandise at the time the customer takes possession of the merchandise. The Company recognizes revenue related to the delivery of merchandise at the time the merchandise is delivered. The Company honors returns from customers within 30 days from the date of sale and provides allowances for returns based on historical experience. The Company recorded an allowance for sales returns in accrued liabilities of $0.4 million and $0.5 million at March 31, 2016 and 2015, respectively. The Company recognizes service revenue at the time that evidence of an agreement exists, the service is completed, the price is fixed or determinable and collectability is reasonably assured.
The Company sells gift cards to its customers in its retail stores. The Company does not charge administrative fees on unused gift cards and the Company’s gift cards (other than promotional rebate gift cards) do not have an expiration date. Revenue is recognized from gift cards when: (i) the gift card is redeemed by the customer or (ii) the likelihood of the gift card being redeemed by the customer is remote, referred to as gift card breakage, and the Company determines that it does not have a legal obligation to remit the value of unredeemed gift cards to the relevant jurisdictions. The Company determines its gift card breakage rate based on historical redemption patterns. Breakage recognized was not material to the Company’s results of operations during fiscal 2016, 2015 or 2014.
The Company sells premium service plans (“PSPs”) on appliance and electronic merchandise for periods ranging up to 10 years. For PSPs sold by the Company on behalf of a third party, the net commission revenue is recognized at the time of sale. The Company is not the primary obligor on PSPs sold on behalf of third parties. Funds received for PSPs in which the Company is the primary obligor are deferred in accrued liabilities and other long-term liabilities in the Company’s consolidated balance sheets and amortized on a straight-line basis over the term of the service agreement. Costs of services performed pursuant to the PSPs are expensed as incurred.
The information below provides the changes in the Company’s deferred revenue on extended service agreements for the years ended March 31, 2016, 2015 and 2014 (in thousands):
2016 | 2015 | 2014 | |||||||||
Deferred revenue on extended service agreements: | |||||||||||
Balance at beginning of year | $ | 2,338 | $ | 1,423 | $ | 1,048 | |||||
Revenue deferred on new agreements | 1,561 | 2,190 | 1,360 | ||||||||
Revenue recognized | (1,913 | ) | (1,275 | ) | (985 | ) | |||||
Balance at end of year | $ | 1,986 | $ | 2,338 | $ | 1,423 | |||||
For revenue transactions that involve multiple deliverables, the Company defers the revenue associated with any undelivered elements. The amount of revenue deferred in connection with the undelivered elements is determined using the relative fair value of each element, which is generally based on each element’s relative retail price. The Company frequently offers sales incentives that entitle customers to receive a reduction in the price of a product or service by submitting a claim for a refund or rebate. When certain purchase requirements are met, the customer is eligible to receive a hhgregg rebate gift card that may be redeemed on future purchases at hhgregg stores. Rebate gift cards expire six months from the date of issuance. The Company defers revenue at the time an eligible transaction occurs, based on the percentage of gift cards that are projected to be redeemed which includes an estimate of breakage and the relative fair value of the gift cards. The Company recognizes revenue when: (i) a gift card is redeemed by the customer, or (ii) a rebate gift card expires. Deferred revenue related to the rebate gift cards included within accrued liabilities within our Consolidated Balance Sheets was $4.3 million and $3.8 million at March 31, 2016 and 2015, respectively.
The Company offers a private-label credit card agreement through a lending institution for the issuance of promotional financing bearing the hhgregg brand name. Under the agreement, the lending institution manages and directly extends credit to the customers. Cardholders who choose a private-label credit card can receive zero-interest promotional financing on
50
qualifying purchases. The bank is the sole owner of the accounts receivable generated under the program and absorbs losses associated with non-payment by the cardholders and fraudulent usage of the accounts. Accordingly, the Company does not hold any consumer receivables related to these programs. The Company pays financing fees to the lending institution and these fees are variable based on certain factors such as the London Interbank Offered Rate (“LIBOR”) and types of promotional financing offers.
The Company collects certain taxes from their customers at the time of sale and remits the collected taxes to government authorities. These taxes are excluded from net sales and cost of goods sold in the Company’s consolidated statements of income.
(n) | Cost of Goods Sold |
Cost of goods sold is defined as the cost of gross inventory sold, including any handling charges, in-bound freight expenses and physical inventory losses, less the recognized portion of certain vendor allowances. Because the Company does not include costs related to its store distribution facilities, including depreciation expense, in cost of goods sold, the Company’s gross profit may not be comparable to that of other retailers that include these costs in cost of goods sold and in the calculation of gross profit.
(o) | Selling, General and Administrative Expenses |
Selling, general and administrative expenses (“SG&A”) includes wages, rent, taxes (other than income taxes), insurance, utilities, delivery costs, distribution costs, service expense, repairs and maintenance of stores and equipment, store opening costs, stock-based compensation and other general administrative expenses.
Shipping and handling costs and expenses of $104.5 million, $109.0 million, and $111.3 million for fiscal 2016, 2015 and 2014, respectively, were included in SG&A expenses. Included in these costs were home delivery expenses of $50.7 million, $56.7 million, and $59.8 million for the years ended March 31, 2016, 2015, and 2014, respectively.
(p) | Vendor Allowances |
The Company receives funds from its vendors for various programs including volume purchase rebates, marketing support, markdowns, margin protection, training and sales incentives. Vendor allowances provided as a reimbursement of specific, incremental and identifiable costs incurred to promote a vendor’s products are included as an expense reduction when the cost is incurred. All other vendor allowances are initially deferred and recorded as a reduction of merchandise inventories. The deferred amounts are then included as a reduction of cost of goods sold when the related product is sold.
(q) | Advertising Costs |
Advertising costs are expensed as incurred, with the exception of television production costs which are expensed the first time the advertisement is aired. These amounts have been reduced by vendor allowances under cooperative advertising which totaled $29.9 million, $32.4 million, and $37.0 million for the years ended March 31, 2016, 2015 and 2014, respectively.
(r) | Store Opening Costs |
Store opening costs, other than capital expenditures, are expensed as incurred and recorded in selling, general and administrative expenses.
(s) | Income Taxes |
The Company recognizes deferred tax assets and liabilities for the future tax consequences attributable to differences between the financial statement carrying amounts of existing assets and liabilities and their respective tax bases and operating loss and tax credit carryforwards.
Deferred tax assets and liabilities are measured using enacted tax rates expected to apply to taxable income in the years in which those temporary differences are expected to be recovered or settled. The effect on deferred tax assets and liabilities of a change in tax rates is recognized in income in the period that includes the enactment date.
The Company is subject to U.S. federal and certain state and local income taxes. The Company’s income tax returns, like those of most companies, are periodically audited by federal and state tax authorities. These audits include questions regarding the Company’s tax filing positions, including the timing and amount of deductions and the allocation of income among various tax jurisdictions. At any one time, multiple tax years are subject to audit by the various tax authorities. In evaluating the exposures associated with the Company’s various tax filing positions, the Company records a liability for more likely than not
51
exposures. A number of years may elapse before a particular matter, for which the Company has established a liability, is audited and fully resolved or clarified. The Company adjusts its liability for unrecognized tax benefits and income tax provision in the period in which an uncertain tax position is effectively settled, the statute of limitations expires for the relevant taxing authority to examine the tax position or when more information becomes available.
The Company evaluates its deferred income tax assets and liabilities quarterly to determine whether or not a valuation allowance is necessary. It is required to assess the available positive and negative evidence to estimate if sufficient income will be generated to utilize deferred tax assets. Refer to note 6 for additional information regarding the Company's process and the deferred tax valuation allowance.
(t) | Stock-Based Compensation |
The Company records all stock-based compensation, including grants of employee stock options and restricted stock units, using the fair value-based method. Refer to note 7 for additional information regarding the Company’s stock-based compensation.
(u) | Litigation |
Liabilities for loss contingencies arising from claims, assessments, litigation, fines and penalties and other sources are recorded when it is probable that a liability has been incurred and the amount of the loss can be reasonably estimated. Legal costs incurred in connection with loss contingencies are expensed as incurred. Refer to note 10 for additional information on the Company's contingencies.
(v) | Recently Issued Accounting Pronouncements |
In March 2016, the FASB issued ASU 2016-09, Improvements to Employee Share-Based Payment Accounting, ("ASU 2016-09") which is intended to improve the accounting for share-based payment transactions as part of the FASB’s simplification initiative. The ASU changes certain aspects of the accounting for share-based payment award transactions, including: (1) accounting for income taxes; (2) classification of excess tax benefits on the statement of cash flows; (3) forfeitures; (4) minimum statutory tax withholding requirements; and (5) classification of employee taxes paid on the statement of cash flows when an employer withholds shares for tax-withholding purposes. ASU 2016-09 is effective for fiscal years beginning after December 15, 2016, and interim periods within those years with early adoption permitted. The Company is evaluating the effect that ASU No. 2016-02 will have on its consolidated financial statements and related disclosures.
In February 2016, the Financial Accounting Standards Board ("FASB") issued Accounting Standards Update No. 2016-02, "Leases (Topic 842)" ("ASU No. 2016-02"), which requires an entity that is a lessee to recognize the assets and liabilities arising from leases on the balance sheet. This guidance also requires disclosures about the amount, timing and uncertainty of cash flows arising from leases. This guidance is effective for annual reporting periods beginning after December 15, 2018, and interim periods within those annual periods and early adoption is permitted. The Company is evaluating the effect that ASU No. 2016-02 will have on its consolidated financial statements and related disclosures.
In November 2015, the FASB issued Accounting Standards Update ("ASU") 2015-17, Balance Sheet Classification of Deferred Taxes, which will require entities to present deferred tax assets ("DTA") and deferred tax liabilities ("DTL") as non-current in a classified balance sheet. The ASU simplified the current guidance, which requires entities to separately present DTAs and DTLs as current and non-current in a classified balance sheet. This standard is effective for annual periods and interim periods within those fiscal years, beginning after December 15, 2016 but permits entities to early adopt at the beginning of any interim or annual period. The Company adopted ASU 2015-17 in the period ending December 31, 2015, prospectively, as it believes the adoption of this standard reduces complexity of its condensed consolidated financial statements as well as enhances the usefulness of the related financial information. Prior periods presented in the consolidated balance sheet are not retrospectively adjusted.
In April 2015, the FASB issued an accounting pronouncement, FASB ASU 2015-03, related to the presentation of debt issuance costs (FASB ASC Subtopic 835-30). This standard will require debt issuance costs related to a recognized debt liability to be presented on the balance sheet as a direct deduction from the debt liability rather than as an asset. These costs will continue to be amortized to interest expense using the effective interest method. In August 2015, FASB issued ASU No. 2015-15, “Presentation and Subsequent Measurement of Debt Issuance Costs Associated with Line-of-Credit Arrangement.” ASU 2015-15 clarifies the presentation and measurement of debt issuance costs incurred in connection with line-of-credit arrangements given the lack of guidance on this topic in ASU 2015-03. For line-of-credit arrangements, an entity can continue to present debt issuance costs as an asset and amortize the deferred debt issuance costs ratably over the term of the line-of-credit arrangement. These pronouncements are effective for fiscal years, and for interim periods within those fiscal years,
52
beginning after December 15, 2015, and retrospective adoption is required. The Company adopted these pronouncement for its fiscal year beginning April 1, 2016 and it did not have an effect on its consolidated financial statements.
In May 2014, the Financial Accounting Standards Board ("FASB") issued Accounting Standards Update 2014-09, Revenue from Contracts with Customers (Topic 606), to clarify the principles used to recognize revenue for all entities. The original standard was to be effective for fiscal years beginning after December 15, 2016; however, in July 2015, the FASB approved a one-year deferral of this standard, with a new effective date for fiscal years beginning after December 15, 2017. While the Company is still in the process of evaluating the impact the adoption of this guidance will have on its financial position and results of operations, the Company does not currently expect a material impact on its consolidated financial statements.
(2) | Fair Value Measurements |
The Company uses a three-tier valuation hierarchy for its fair value measurements based upon observable and non-observable inputs:
Level 1 — unadjusted quoted prices in active markets for identical assets or liabilities that the Company has the ability to access.
Level 2 — inputs other than quoted market prices included in Level 1 that are observable, either directly or indirectly, for the asset or liability, such as interest rates and yield curves that are observable at commonly quoted intervals.
Level 3 — unobservable inputs for the asset or liability, as there is little, if any, market activity at the measurement date.
Assets and Liabilities that are Measured at Fair Value on a Recurring Basis
The fair value hierarchy requires the use of observable market data when available. In instances in which the inputs used to measure fair value fall into different levels of the fair value hierarchy, the fair value measurement has been determined based on the lowest level input that is significant to the fair value measurement in its entirety. The Company’s assessment of the significance of a particular item to the fair value measurement in its entirety requires judgment, including the consideration of inputs specific to the asset or liability. The underlying investments within the Company’s deferred compensation plan for company-owned life insurance, recorded within Other long-term assets, totaled $1.5 million and $1.4 million as of March 31, 2016 and 2015, respectively, and consist of equity index funds and fixed income assets, which are considered Level 2 in the hierarchy described above.
Assets and Liabilities that are Measured at Fair Value on a Non-Recurring Basis
The Company has property and equipment that are measured at fair value on a non-recurring basis when impairment indicators are present. When evaluating long-lived assets for potential impairment, the Company compares the carrying amount of the asset or asset group to the asset’s or asset group’s estimated undiscounted future cash flows. If the estimated undiscounted future cash flows are less than the carrying amount of the asset or asset group, an impairment loss is calculated. The impairment loss calculation compares the net book value of the asset or asset group to the asset’s or asset group’s estimated fair value, which is determined based on estimated discounted future cash flows. An impairment loss is recognized for the amount by which the asset’s or asset group’s net book value exceeds the asset’s or asset group’s estimated fair value. If an impairment loss is recognized, the adjusted net book value of the asset or asset group becomes its new cost basis. For a depreciable long-lived asset, the new cost basis will be depreciated (amortized) over the remaining useful life of that asset or asset group
The categorization of the framework used to value such assets is considered Level 3, due to the subjective nature of the unobservable inputs used to determine the fair value. Property and equipment fair values are derived using a discounted cash flow model to estimate the present value of net cash flows that the asset group expected to generate. The key inputs to the discounted cash flow model generally included the Company's forecasts of net cash generated from revenue, expenses and other significant cash outflows, such as certain capital expenditures, as well as a discount rate.
The need for an impairment analysis to be performed was triggered by declining sales and overall profitability in recent periods. The Company had several locations whose profit contributions were significantly lower than chain average due to decreased sales in the fiscal years ended March 31, 2016 and 2015. As a result of these analyses, for the fiscal year ended March 31, 2016, property and equipment at 40 locations with a net book value of $21.7 million were reduced to estimated aggregate fair value of $0.8 million based on their projected cash flows, discounted at 15%. For the fiscal year ended March 31, 2015, property and equipment at 56 locations with a net book value of $48.7 million were reduced to estimated aggregate fair value of $0.8 million based on their projected cash flows, discounted at 15%. This resulted in asset impairment charges of $20.9 million and $47.9 million for the fiscal years ended March 31, 2016 and 2015, respectively. The fair values were
53
determined using a probability based cash flow analysis based on management's estimates of future store-level sales, gross margins, and direct expenses. During fiscal 2014, the Company recorded an asset impairment charge as a result of entering into a lease modification to downsize a store. In conjunction with the downsize, the Company determined that certain of the assets in use would be abandoned at the time construction to downsize begins, and as a result, determined this to be a triggering event for an impairment analysis to be performed in accordance with guidance on impairment of long-lived assets. The estimated undiscounted future cash flows generated by the store was less than its carrying amount, therefore the carrying amount of the assets related to this store were reduced to fair value. In addition, the Company recorded an asset impairment charge during fiscal 2014 as a result of idling certain store fixtures. The Company determined this to be a triggering event for an impairment analysis to be performed, and the carrying amount of the assets were reduced to fair value.
The following table summarizes the fair value remeasurements recorded during the years ended March 31, 2016, 2015, and 2014 (in millions):
2016 | 2015 | 2014 | |||||||||
Net book value (pre-asset impairment) | $ | 21.7 | $ | 48.7 | $ | 1.0 | |||||
Asset impairment charges (included in income from operations) | 20.9 | 47.9 | 0.6 | ||||||||
Remaining net book value | $ | 0.8 | $ | 0.8 | $ | 0.4 | |||||
Fair Value of Financial Instruments
The carrying amounts of cash, accounts receivable — trade, accounts receivable — other, accounts payable and customer deposits approximate fair value because of the short maturity of these instruments.
(3) | Net (Loss) Income per Share |
Net (loss) income per basic share is calculated based on the weighted-average number of outstanding common shares. Net (loss) income per diluted share is calculated based on the weighted-average number of outstanding common shares plus the effect of potential dilutive common shares. Potential dilutive common shares are composed of shares of common stock issuable upon the exercise of stock options and restricted stock units. When the Company reports net income, the calculation of net income per diluted share excludes shares underlying outstanding stock options and restricted stock units with exercise prices that exceed the average market price of the Company’s common stock for the period and certain options and restricted stock units with unrecognized compensation cost, as the effect would be antidilutive. For the years ended March 31, 2016 and 2015, the diluted loss per common share calculation represents the weighted average common shares outstanding with no additional dilutive shares as the Company incurred a net loss for the period and such shares would be antidilutive.
The following table presents net (loss) income per basic and diluted share for the years ended March 31, 2016, 2015 and 2014 (in thousands, except share and per share amounts):
2016 | 2015 | 2014 | |||||||||
Net (loss) income (A) | $ | (54,879 | ) | $ | (132,746 | ) | $ | 228 | |||
Weighted average outstanding shares of common stock (B) | 27,701,055 | 28,129,596 | 30,209,928 | ||||||||
Dilutive effect of employee stock options and restricted stock units | — | — | 474,061 | ||||||||
Common stock and potential dilutive common shares (C) | 27,701,055 | 28,129,596 | 30,683,989 | ||||||||
Net (loss) income per share: | |||||||||||
Basic (A/B) | $ | (1.98 | ) | $ | (4.72 | ) | $ | 0.01 | |||
Diluted (A/C) | $ | (1.98 | ) | $ | (4.72 | ) | $ | 0.01 | |||
Antidilutive shares not included in the net (loss) income per diluted share calculation for the years ended March 31, 2016, 2015 and 2014 were 3,303,153, 3,746,721 and 1,225,819, respectively.
54
(4) | Inventories |
Net merchandise inventories consisted of the following at March 31, 2016 and 2015 (in thousands):
2016 | 2015 | ||||||
Appliances | $ | 126,025 | $ | 119,396 | |||
Consumer electronics | 91,080 | 94,441 | |||||
Computers and tablets | 18,338 | 24,697 | |||||
Home products | 21,116 | 18,935 | |||||
Net merchandise inventory | $ | 256,559 | $ | 257,469 | |||
(5) | Debt |
A summary of debt at March 31, 2016 and 2015 is as follows (in thousands):
2016 | 2015 | ||||||
Line of credit | $ | — | $ | — | |||
Amended Facility
On July 29, 2013, Gregg Appliances entered into Amendment No. 1 to the Amended and Restated Loan and Security Agreement (the “Amended Facility”) The capacity for borrowings under the Company's Amended Facility is $400 million, subject to borrowing base availability, and extend the term of the facility to expire on July 29, 2018.
Interest on borrowings (other than Eurodollar rate borrowings) is payable monthly at a fluctuating rate based on the bank’s prime rate or LIBOR plus an applicable margin based on the average quarterly excess availability. Interest on Eurodollar rate borrowings is payable on the last day of each “interest period” applicable to such borrowing or on the three month anniversary of the beginning of such “interest period” for interest periods greater than three months. The unused line rate is determined based on the amount of the daily average of the outstanding borrowings for the immediately preceding calendar quarter period (the “Daily Average”). For a Daily Average greater than or equal to 50% of the defined borrowing base, the unused line rate is 0.25%. For a Daily Average less than 50% of the defined borrowing base, the unused line rate is 0.375%. The Amended Facility is guaranteed by Gregg Appliances’ wholly-owned subsidiary, HHG Distributing, which has no assets or operations. The guarantee is full and unconditional and Gregg Appliances has no other subsidiaries.
Pursuant to the Amended Facility, the borrowing base is equal to the sum of (i) 90% of the amount of the eligible commercial accounts, (ii) 90% of the amount of eligible credit card receivables of Gregg Appliances and (iii) 90% of the net recovery percentage multiplied by the value of eligible inventory consistent with the most recent appraisal of such eligible inventory.
Under the Amended Facility, Gregg Appliances is not required to comply with any financial maintenance covenant unless “excess availability” is less than the greater of (i) 10.0% of the lesser of (A) the defined borrowing base or (B) the defined maximum credit or (ii) $20.0 million during the continuance of which event Gregg Appliances is subject to compliance with a fixed charge coverage ratio of 1.0 to 1.0.
Pursuant to the Amended Facility, if Gregg Appliances has “excess availability” of less than 12.5% of the lesser of (A) the defined borrowing base or (B) the defined maximum credit, it may, in certain circumstances more specifically described in the Amended Facility, become subject to cash dominion control.
The Amended Facility places limitations on the ability of Gregg Appliances to, among other things, incur debt, create other liens on its assets, make investments, sell assets, pay dividends, undertake transactions with affiliates, enter into merger transactions, enter into unrelated businesses, open collateral locations outside of the United States, or enter into consignment assignments or floor plan financing arrangements. The Amended Facility also contains various customary representations and warranties, financial and collateral reporting requirements and other affirmative and negative covenants. Gregg Appliances was in compliance with the restrictions and covenants of the Amended Facility at March 31, 2016.
55
As of March 31, 2016 and 2015, Gregg Appliances had no borrowings outstanding under the Amended Facility. As of March 31, 2016, Gregg Appliances had $5.5 million of letters of credit outstanding, which expire at various dates through February 22, 2017. As of March 31, 2015, Gregg Appliances had $6.5 million of letters of credit outstanding which expired by December 31, 2015. The total borrowing availability under the Amended Facility was $139.9 million and $134.6 million as of March 31, 2016 and 2015, respectively. The interest rate based on the bank’s prime rate was 4.25% as of March 31, 2016 and 3.75% as of March 31, 2015.
(6) | Income Taxes |
Income tax expense (benefit) for the years ended March 31, 2016, 2015 and 2014 consisted of the following (in thousands):
2016 | 2015 | 2014 | |||||||||
Current: | |||||||||||
Federal | $ | 478 | $ | (9,949 | ) | $ | 1,528 | ||||
State | (44 | ) | (692 | ) | (246 | ) | |||||
Total current | 434 | (10,641 | ) | 1,282 | |||||||
Deferred: | |||||||||||
Federal | — | 33,815 | (1,618 | ) | |||||||
State | — | 7,587 | 330 | ||||||||
Total deferred | — | 41,402 | (1,288 | ) | |||||||
Total expense (benefit) | $ | 434 | $ | 30,761 | $ | (6 | ) | ||||
Deferred income taxes at March 31, 2016 and 2015 consisted of the following (in thousands):
2016 | 2015 | ||||||
Deferred tax assets: | |||||||
Goodwill for tax purposes | $ | 25,009 | $ | 31,534 | |||
Accrued expenses | 12,286 | 12,341 | |||||
Long-term deferred compensation | 2,153 | 2,281 | |||||
Property and equipment | 7,275 | — | |||||
Stock-compensation expense | 6,776 | 7,239 | |||||
Other | 1,876 | 2,303 | |||||
Credit carryforwards | 5,716 | 6,509 | |||||
Net operating loss carryforward | 30,294 | 13,979 | |||||
Valuation allowance | (82,873 | ) | (66,122 | ) | |||
Total deferred tax assets | 8,512 | 10,064 | |||||
Deferred tax liabilities: | |||||||
Property and equipment | — | (2,986 | ) | ||||
Inventories | (7,414 | ) | (5,903 | ) | |||
Other | (1,098 | ) | (1,175 | ) | |||
Total deferred tax liabilities | (8,512 | ) | (10,064 | ) | |||
Net deferred tax assets | $ | — | $ | — | |||
As of March 31, 2016, the Company had federal and state income tax credit carryforwards of approximately $5.9 million, comprised primarily of an Alternative Minimum Tax (“AMT”) credit of $4.5 million. The AMT credit does not expire and will be carried forward indefinitely. The Company also has federal net operating loss carryforwards of approximately $72.9 million and state net operating loss carryforwards of approximately $108.6 million. The federal net operating loss carryforwards will expire at various dates through fiscal 2036 if unused prior to that time. The state net operating loss carryforwards will begin to expire in fiscal 2026 through fiscal 2036 if unused prior to that time as states have varying carryforward periods.
The Company evaluates its deferred income tax assets and liabilities quarterly to determine whether or not a valuation allowance is necessary. The Company is required to assess the available positive and negative evidence to estimate if sufficient income will be generated to utilize deferred tax assets. The establishment of valuation allowances requires significant judgment and is impacted by various estimates. A significant piece of negative evidence that we consider is cumulative losses
56
in recent periods. Such evidence is a significant piece of objective negative evidence that is difficult to overcome. While management believes positive evidence exists with regard to the realizability of these deferred tax assets, it is not considered sufficient to outweigh the objectively verifiable negative evidence. The significant negative evidence of its losses generated before income taxes in recent periods and the unfavorable shift in its business could not be overcome by considering other sources of taxable income, which included tax planning strategies. Therefore, we recorded a valuation allowance of $66.1 million as of March 31, 2015. Due to fiscal 2016 net loss, we increased the valuation allowance by $16.8 million to $82.9 million as of March 31, 2016. The full valuation allowance will remain until there exists significant objective positive evidence, such as sustained achievement of cumulative profits.
The Company recognizes interest and penalties in income tax expense in its consolidated statements of income. At March 31, 2016 and 2015, the Company had no accrued interest and penalties.
The Company files a consolidated U.S. federal income tax return, as well as income tax returns in various states. With few exceptions, the Company is no longer subject to U.S. federal, state and local income tax examinations by tax authorities for years before fiscal 2013.
The expense (benefit) for income taxes differs from the amount of income tax determined by applying the U.S. federal income tax rate of 35% to income before income taxes due to the following (in thousands):
2016 | 2015 | 2014 | |||||||||
Computed “expected” tax (benefit) expense | $ | (19,056 | ) | $ | (35,695 | ) | $ | 78 | |||
State income tax (benefit) expense, net of federal income tax impact | (2,293 | ) | (4,295 | ) | 49 | ||||||
Valuation allowance | 16,751 | 66,122 | — | ||||||||
Stock compensation | 1,542 | 2,254 | 26 | ||||||||
Other | 3,490 | 2,375 | (159 | ) | |||||||
$ | 434 | $ | 30,761 | $ | (6 | ) | |||||
(7) | Stock-based Compensation |
Stock Options
The Company maintains stock-based compensation plans which allow for the issuance of non-qualified stock options and restricted stock to officers, other key employees and members of the Board of Directors. On April 12, 2007, the Company’s Board of Directors approved the adoption of the hhgregg, Inc. 2007 Equity Incentive Plan (“Equity Incentive Plan”). The Equity Incentive Plan provides for the grant of nonqualified stock options, incentive stock options, stock appreciation rights, awards of restricted stock, awards of restricted stock units, awards of performance units, and stock grants. Effective June 20, 2014, the Company adopted an Amendment to the hhgregg, Inc. 2007 Equity Incentive Plan which increased the number of shares of common stock reserved for issuance under the Equity Incentive Plan to 9,000,000. If an option expires, is terminated or canceled without having been exercised or repurchased by the Company, or common stock is used to exercise an option, the terminated portion of the option or the common stock used to exercise the option will become available for future grants under the Equity Incentive Plan unless the Equity Incentive Plan is terminated. The term of the Company’s Equity Incentive Plan commenced on the date of approval by the Company’s Board of Directors and continues until the tenth anniversary of the approval by the Company’s Board of Directors. The Equity Incentive Plan is administered by the Company’s Compensation Committee.
During the years ended March 31, 2016, 2015 and 2014 the Company granted options for 312,625, 1,133,640, and 1,820,805 shares of common stock under the Equity Incentive Plan to certain employees and directors of the Company. The options vest in equal amounts over a three-year period beginning on the first anniversary of the date of grant and expire 7 years from the date of the grant. The fair value of each option grant is estimated on the date of grant and is amortized on a straight-line basis over the vesting period.
57
The weighted-average estimated fair value of options granted to employees and directors under the 2007 Equity Incentive Plan was $1.84, $4.06, and $7.08 during the fiscal years ended March 31, 2016, 2015 and 2014, respectively, as determined using the Black-Scholes model with the following weighted average assumptions:
2016 | 2015 | 2014 | ||||||
Risk-free interest rate | 1.23% - 1.55 | 1.22% - 1.6 | 0.06% - 1.53 | |||||
Dividend yield | — | — | — | |||||
Expected volatility | 58.7% - 58.9% | 57.0 | % | 63.0 | % | |||
Expected life of the options (years) | 4.5 | 4.5 | 4.5 | |||||
The following table summarizes the activity under the Company’s Stock Option Plans for the fiscal year ended March 31, 2016:
Number of Options Outstanding | Weighted Average Exercise Price | Weighted Average Remaining Contractual Life | Aggregate Intrinsic Value (in thousands) | |||||||||
Outstanding at March 31, 2015 | 3,497,922 | $ | 12.41 | |||||||||
Granted | 312,625 | 3.79 | ||||||||||
Exercised | — | — | ||||||||||
Canceled | (462,807 | ) | 9.30 | |||||||||
Expired | (520,572 | ) | 12.96 | |||||||||
Outstanding at March 31, 2016 | 2,827,168 | $ | 11.86 | 3.09 | $ | — | ||||||
Vested or expected to vest at March 31, 2016 | 2,770,438 | $ | 11.97 | 3.04 | $ | — | ||||||
Exercisable at March 31, 2016 | 1,991,869 | $ | 13.16 | 2.20 | $ | — | ||||||
During fiscal 2016, 2015 and 2014, $2.1 million, $4.2 million and $4.2 million ($2.5 million net of tax), respectively, was charged to expense related to the stock option plans. The total intrinsic value of options exercised during the fiscal year ended March 31, 2014 was $2.6 million; there were no options exercised during the fiscal years ended March 31, 2016 and 2015. Total unrecognized stock option compensation cost (adjusted for forfeitures) at March 31, 2016 was $1.6 million and is expected to be recognized over a weighted average period of 1.23 years. Net cash proceeds from the exercise of stock options was $5.8 million in fiscal 2014; there were no proceeds from the exercise of stock options in fiscal years ended March 31, 2016 and 2015. The total grant date fair value of stock options vested during the fiscal years ended March 31, 2016, 2015 and 2014 was $3.7 million, $4.1 million and $2.6 million, respectively.
Time Vested Restricted Stock Units
During the fiscal years ended March 31, 2016, 2015 and 2014 the Company granted 415,121, 45,150 and 30,595 time vested restricted stock units (“RSUs”) under the Equity Incentive Plan to certain employees and directors of the Company. The time vested RSUs granted in the fiscal year ended March 31, 2016 vest in equal amounts over a three-year period beginning on the first anniversary of the date of grant. The time vested RSUs granted in the fiscal years ended March 31, 2015 and 2014, vest three years from the date of grant. Upon vesting, the outstanding number of time vested RSUs will be converted into shares of common stock. Time vested RSUs are forfeited if they have not vested before the employment of the participant terminates for any reason other than death or total permanent disability or certain other circumstances as described in such participant’s RSU agreement. Upon death or disability, the participant is entitled to receive a portion of the award based upon the period of time lapsed between the date of grant of the time vested RSU and the termination of employment. The fair value of time vested RSU awards is the Company’s stock price at the close of the market on the date of grant. Total unrecognized compensation cost for the time vested RSUs (adjusted for forfeitures) at March 31, 2016 was $1.2 million and is expected to be recognized over a weighted average period of 1.92 years.
58
The following table summarizes time vested RSU vesting activity for the fiscal year ended March 31, 2016:
Nonvested RSU’s | Shares | Weighted Average Grant-Date Fair Value | Weighted Average Remaining Contractual Life | Aggregate Intrinsic Value (in thousands) | ||||||||
Nonvested at March 31, 2015 | 126,953 | $ | 11.07 | |||||||||
Granted | 415,121 | 3.79 | ||||||||||
Vested | (58,900 | ) | 10.86 | |||||||||
Forfeited | (112,791 | ) | 4.87 | |||||||||
Nonvested at March 31, 2016 | 370,383 | $ | 4.83 | 1.92 | $ | — | ||||||
(8) | Leases |
The composition of net rent expense for all operating leases, including leases of property and equipment, was as follows for the years ended March 31, 2016, 2015 and 2014 (in thousands):
2016 | 2015 | 2014 | ||||||||||
Minimum rentals | $ | 90,548 | $ | 90,868 | $ | 91,174 | ||||||
Contingent rentals | — | 13 | 52 | |||||||||
Total rent expense | $ | 90,548 | $ | 90,881 | $ | 91,226 | ||||||
Future minimum required rental payments for noncancelable operating leases, with terms of one year or more, consist of the following as of March 31, 2016 (in thousands):
Rental Payments | |||
Payable in fiscal year: | |||
2017 | $ | 92,068 | |
2018 | 88,211 | ||
2019 | 83,076 | ||
2020 | 73,784 | ||
2021 | 51,467 | ||
Thereafter | 65,990 | ||
Total required payments | $ | 454,596 | |
Total minimum rental lease payments have not been reduced by minimum sublease rent income of approximately $0.4 million due under future noncancelable subleases.
(9) | Employee Benefit Plans |
The Company sponsors a 401(k) retirement savings plan (the “Plan”) covering all employees who have attained the age of 21 and have worked at least 1000 hours within a 12-month period. Plan participants may elect to contribute 1% to 12% of their compensation to the Plan, subject to IRS limitations. The Company provides a discretionary matching contribution up to 7% of each participant’s compensation. Total Company expense, including payment of administrative fees, aggregated approximately $0.4 million, $0.7 million, and $0.6 million for the years ended March 31, 2016, 2015, and 2014, respectively.
During the fiscal year ended March 31, 2014, the Company established a non-qualified deferred compensation plan for highly compensated employees whose contributions are limited under the qualified defined contribution plan. Amounts contributed and deferred under the deferred compensation plans are credited or charged with the performance of investment options offered under the plans and elected by the participants. In the event of bankruptcy, the assets of these plans are available to satisfy the claims of general creditors. The liability for compensation deferred under the the plan was $1.5 million and $1.4 million at March 31, 2016 and 2015, respectively and is included in “Other long-term liabilities”. Total expense recorded under the plan was $0.2 million for each of the fiscal years ended March 31, 2016 and 2015.
59
The Company has another unfunded, non-qualified deferred compensation plan for members of executive management which was frozen during the fiscal year ended March 31, 2014. Benefits accrue to individual participants annually based on a predetermined formula, as defined, which considers operating results of the Company and the participant’s base salary. Vesting of benefits is attained upon reaching 55 years of age or 10 years of continuous service, measurement of which is retroactive to the participant’s most recent start date. Annual interest is credited to participant accounts at an interest rate determined at the sole discretion of the Company. Benefits will be paid to individual participants upon the later of terminating employment with the Company or the participant attaining the age of 55. Amounts accrued in other long-term liabilities at March 31, 2016 and 2015 related to this plan were $4.0 million and $4.5 million. The Company made distributions of $0.3 million and $0.6 million for the years ended March 31, 2016 and 2015, respectively. The Company recorded forfeitures of $0.2 million for the years ended March 31, 2016 and 2015. The Company recorded $0.2 million in expense related to this plan for the year ended March 31, 2014 representing interest earned, but did not contribute additional amounts as the Company did not achieve the predetermined operating results target prior to the date which the plan was frozen.
(10) | Contingencies |
The Company is engaged in various legal proceedings in the ordinary course of business and has certain unresolved claims pending. The ultimate liability, if any, for the aggregate amounts claimed cannot be determined at this time. However, management believes, based on the examination of these matters and experiences to date, that the ultimate liability, if any, in excess of amounts already provided for in the unaudited condensed consolidated financial statements is not likely to have a material effect on its consolidated financial position, results of operations or cash flows.
The Company is the defendant in a class action lawsuit captioned, Dwain Underwood, on behalf of himself and all others similarly situated v. Gregg Appliances, Inc. and hhgregg, Inc., filed in the Superior Court in Marion County, Indiana, where a former employee alleged that the Company breached a contract by failing to correctly calculate his (and other class members) incentive bonus. On July 9, 2014, the judge granted the plaintiff’s motion for class certification, and on July 17, 2015, the judge granted the plaintiff’s motion for summary judgment, although no finding on damages was made. The Company's interlocutory appeal was accepted on October 23, 2015. The Company has completed the appeal briefing process and oral argument is scheduled for June 29, 2016. If the Company does not ultimately prevail in this case, the potential liability is approximately $2.4 million based on those individuals included in the class, excluding potential interest and other fees which cannot be determined at this time. The Company believes the loss is not probable, and thus, as of March 31, 2016, a liability has not been recorded for this matter.
(11) | Interim Financial Results (Unaudited) |
The following table sets forth certain unaudited quarterly information for each of the eight fiscal quarters for the years ended March 31, 2016 and 2015 (in thousands, except net loss per share data). In management’s opinion, this unaudited quarterly information has been prepared on a consistent basis with the audited financial statements and includes all necessary adjustments, consisting only of normal recurring adjustments that management considers necessary for a fair presentation of the unaudited quarterly results when read in conjunction with the consolidated financial statements.
60
For the Year Ended March 31, 2016 | ||||||||||||||||
First Quarter | Second Quarter | Third Quarter | Fourth Quarter | |||||||||||||
Net sales | $ | 441,063 | $ | 486,876 | $ | 593,219 | $ | 438,840 | ||||||||
Cost of goods sold | 306,706 | 348,231 | 438,189 | 313,090 | ||||||||||||
Gross profit | 134,357 | 138,645 | 155,030 | 125,750 | ||||||||||||
Selling, general and administrative expenses | 111,104 | 113,479 | 116,533 | 106,392 | ||||||||||||
Net advertising expense | 23,054 | 26,254 | 34,168 | 21,570 | ||||||||||||
Depreciation and amortization expense | 8,369 | 8,391 | 8,355 | 6,928 | ||||||||||||
Asset impairment charge | — | — | 20,910 | — | ||||||||||||
Loss from operations | (8,170 | ) | (9,479 | ) | (24,936 | ) | (9,140 | ) | ||||||||
Other expense (income): | ||||||||||||||||
Interest expense | 590 | 649 | 727 | 776 | ||||||||||||
Interest income | (5 | ) | (2 | ) | (2 | ) | (13 | ) | ||||||||
Total other expense | 585 | 647 | 725 | 763 | ||||||||||||
Loss before income taxes | (8,755 | ) | (10,126 | ) | (25,661 | ) | (9,903 | ) | ||||||||
Income tax (benefit) expense | — | — | 1,252 | (818 | ) | |||||||||||
Net loss | $ | (8,755 | ) | $ | (10,126 | ) | $ | (26,913 | ) | $ | (9,085 | ) | ||||
Net loss per share | ||||||||||||||||
Basic | $ | (0.32 | ) | $ | (0.37 | ) | $ | (0.97 | ) | $ | (0.33 | ) | ||||
Diluted | $ | (0.32 | ) | $ | 0.37 | $ | (0.97 | ) | $ | (0.33 | ) | |||||
For the Year Ended March 31, 2015 | ||||||||||||||||
First Quarter | Second Quarter | Third Quarter | Fourth Quarter | |||||||||||||
Net sales | $ | 472,293 | $ | 505,862 | $ | 665,616 | $ | 485,603 | ||||||||
Cost of goods sold | 331,954 | 358,817 | 486,114 | 346,651 | ||||||||||||
Gross profit | 140,339 | 147,045 | 179,502 | 138,952 | ||||||||||||
Selling, general and administrative expenses | 116,589 | 119,112 | 132,563 | 120,127 | ||||||||||||
Net advertising expense | 27,224 | 33,049 | 38,915 | 29,638 | ||||||||||||
Depreciation and amortization expense | 10,475 | 10,823 | 10,062 | 8,840 | ||||||||||||
Asset impairment charge | — | — | 42,987 | 4,882 | ||||||||||||
Loss from operations | (13,949 | ) | (15,939 | ) | (45,025 | ) | (24,535 | ) | ||||||||
Other expense (income): | ||||||||||||||||
Interest expense | 629 | 678 | 615 | 678 | ||||||||||||
Interest income | (5 | ) | (2 | ) | (47 | ) | (9 | ) | ||||||||
Total other expense | 624 | 676 | 568 | 669 | ||||||||||||
Loss before income taxes | (14,573 | ) | (16,615 | ) | (45,593 | ) | (25,204 | ) | ||||||||
Income tax (benefit) expense | (4,304 | ) | (6,231 | ) | 41,272 | 24 | ||||||||||
Net loss | $ | (10,269 | ) | $ | (10,384 | ) | $ | (86,865 | ) | $ | (25,228 | ) | ||||
Net loss per share | ||||||||||||||||
Basic | $ | (0.36 | ) | $ | (0.37 | ) | $ | (3.10 | ) | $ | (0.91 | ) | ||||
Diluted | $ | (0.36 | ) | $ | (0.37 | ) | $ | (3.10 | ) | $ | (0.91 | ) | ||||
(12) | Stock Repurchase Program |
On May 14, 2014, the Company’s Board of Directors authorized a stock repurchase program, which became effective on May 20, 2014 (the “May 2014 Program”) allowing the Company to repurchase up to $40 million of its common stock. The May 2014 Program allowed the Company to purchase its common stock on the open market or in privately negotiated transactions in accordance with applicable laws and regulations, and expired on May 20, 2015.
61
The following table shows the number and cost of shares repurchased during the twelve months ended March 31, 2016 and 2015, respectively ($ in thousands):
Years Ended | |||||||
March 31, 2016 | March 31, 2015 | ||||||
May 2014 Program | |||||||
Number of shares repurchased | — | 835,510 | |||||
Cost of shares repurchased | $ | — | $ | 5,281 | |||
The repurchased shares are classified as treasury stock within stockholders’ equity in the accompanying consolidated balance sheets.
62
ITEM 9. | Changes in and Disagreements with Accountants on Accounting and Financial Disclosure. |
None.
ITEM 9A. | Controls and Procedures |
Disclosure Controls and Procedures
We maintain disclosure controls and procedures that are designed to ensure that information required to be disclosed by us in the reports we file or submit under the Exchange Act is recorded, processed, summarized and reported within the time periods specified in the SEC’s rules and forms, and that such information is accumulated and communicated to our management, including our Interim Chief Executive Officer and Chief Financial Officer (principal executive and financial officer), as appropriate to allow timely decisions regarding required disclosure. We have established a Disclosure Committee, consisting of certain members of management, to assist in this evaluation. Our Disclosure Committee meets on a quarterly basis and more often if necessary.
Our management, including our Interim Chief Executive Officer and Chief Financial Officer, evaluated the effectiveness of our disclosure controls and procedures (as defined in Rules 13a-15(e) and 15d-15(e) promulgated under the Exchange Act), as of March 31, 2016. Based on that evaluation, our Interim Chief Executive Officer and Chief Financial Officer concluded that, as of March 31, 2016, our disclosure controls and procedures were effective.
Management’s Report on Internal Control over Financial Reporting
Management’s report on our internal control over financial reporting is included in Item 8, Financial Statements and Supplementary Data, of this Annual Report on Form 10-K.
Attestation Report of Independent Registered Public Accounting Firm
The report of KPMG LLP, our independent registered public accounting firm, on the effectiveness of our internal control over financial reporting is included in Item 8, Financial Statements and Supplementary Data, of this Annual Report on Form 10-K.
Changes in Internal Control Over Financial Reporting
During the fiscal quarter ended March 31, 2016, there was no change in our internal control over financial reporting that has materially affected, or is reasonably likely to materially affect, our internal control over financial reporting.
ITEM 9B. | Other Information |
None.
63
PART III.
ITEM 10. | Directors, Executive Officers and Corporate Governance. |
See the information set forth in the sections entitled “Proposal No. 1 — Election of Directors,” “Corporate Governance Matters and Committees of the Board,” “Report of the Audit Committee of the Board of Directors,” “Nominees for Election to our Board,” “Section 16(a) Beneficial Ownership Reporting Compliance,” and “Non-Director Named Officers” in our proxy statement for the 2016 annual meeting of stockholders to be filed with the SEC within 120 days after the end of the fiscal year ended March 31, 2016 (the “2016 Proxy Statement”), which is incorporated herein by reference.
ITEM 11. | Executive Compensation. |
See information set forth under the captions “Compensation Committee Report,” “Compensation Discussion and Analysis,” “Employment Agreements” and “Executive Compensation” in the 2016 Proxy Statement which is incorporated herein by reference.
ITEM 12. | Security Ownership of Certain Beneficial Owners and Management and Related Stockholder Matters. |
See the information set forth in the sections entitled “Security Ownership of Certain Beneficial Owners and Management” and “Securities Authorized for Issuance Under Equity Compensation Plans” in the 2016 Proxy Statement, which is incorporated herein by reference.
For information required by Item 201(d) of Regulation S-K, please refer to Item 5 under Part II of this Annual Report on Form 10-K.
ITEM 13. | Certain Relationships and Related Transactions, and Director Independence. |
See the information provided under the captions “Proposal No. 1 — Election of Directors,” “Corporate Governance Matters and Committees of the Board of Directors” and “Certain Relationships and Related Party Transactions” in the 2016 Proxy Statement, which is incorporated herein by reference.
ITEM 14. | Principal Accounting Fees and Services. |
See the information provided under the caption “Proposal No. 2 — Ratification of Appointment of our Independent Registered Public Accountants” in the 2016 Proxy Statement, which is incorporated herein by reference.
64
PART IV. | ||
Item 15. | Exhibits, Financial Statement Schedules | |
Financial Statements | ||
(a)(1) | The Consolidated Financial Statements of hhgregg and subsidiaries are incorporated under Item 8 of this Form 10-K. | |
(a)(2) | Financial Statements and Schedules | |
Schedules have been omitted because they are not applicable, are not required or the information required to be set forth therein is included in the Consolidated Financial Statements and Notes thereto. | ||
(a)(3) | Exhibits | |
Exhibit Number | Description of Document | |
3.1 (1) | Amended and Restated of Incorporation of the Company. | |
3.2 (1) | Amended and Restated Bylaws of the Company. | |
4.1 (1) | Specimen Stock Certificate for shares of common stock of the Company. | |
4.2 (2) | Registration Rights Agreement, dated April 12, 2007, by and among FS Equity Partners V, L.P., FS Affiliates V, L.P., California State Teachers’ System, A.S.F. Co. Investment Partners II, L.P., the Jerry W. Throgmartin 2007 Grantor Retained Annuity Trust, Jerry W. Throgmartin, Gregg William Throgmartin, Dennis L. May and the Company. | |
10.1 (2) + | Gregg Appliances, Inc. Nonqualified Deferred Compensation Plan, dated April 1, 2000. | |
10.2 (2) + | Amendment No. 1 to Gregg Appliances, Inc. Nonqualified Deferred Compensation Plan, dated December 26, 2004. | |
10.3 (2) | Non-Standardized Adoption Agreement of Gregg Appliances, Inc. dated January 29, 2005. | |
10.4 (2) + | Gregg Appliances Inc. 2005 Stock Option Plan, dated March 8, 2005. | |
10.5 (2) + | Amendment No. 1 to Gregg Appliances, Inc. 2005 Stock Option Plan, dated April 12, 2007. | |
10.6 (2) + | hhgregg, Inc. Equity Incentive Plan. | |
10.7 (1) | Form of Indemnity Agreement. | |
10.8 (3) + | Form of hhgregg, Inc. 2007 Equity Incentive Plan Option Award. | |
10.9 (3) + | Employment Agreement, dated June 1, 2008, between Gregg Appliances Inc. and Charles B. Young. | |
10.10 (4) | Stock Subscription Agreement, dated July 15, 2009, among Gregg Appliances, Inc. and the Subscriber as defined therein. | |
10.11 (5) | Amended and Restated Loan and Security Agreement, dated March 29, 2011, among Gregg Appliances, Inc., HHG Distributing, LLC, Wells Fargo Bank, National Association, as administrative agent and collateral agent, Wells Fargo Capital Finance, LLC and J.P. Morgan Securities LLC, as joint lead arrangers and joint bookrunners, J.P. Morgan Chase Bank, N.A., as syndication agent, KeyBank National Association, Regions Bank and Suntrust Bank, as co-documentation agents and the lenders party thereto.* | |
10.12 (6) | Amendment No. 1 to Trademark Collateral Assignment and Security Agreement, dated March 29, 2011, between Gregg Appliances and Wells Fargo Bank, National Association. | |
65
Exhibit Number | Description of Document | |
10.13 (7) | Amendment No. 1 to the Amended and Restated Loan and Security Agreement, dated July 29, 2013, among Gregg Appliances, Inc., HHG Distributing, LLC, Wells Fargo Bank, National Association, as administrative agent and collateral agent, Wells Fargo Capital Finance, LLC and J.P. Morgan Securities LLC, as joint lead arrangers and joint bookrunners, J.P. Morgan Chase Bank, N.A., as syndication agent, KeyBank National Association, Regions Bank and Suntrust Bank co-documentation agents and the lenders party thereto. | |
10.14 (8) + | Employment Agreement, dated January 5, 2015, between Gregg Appliances, Inc. and Robert Riesbeck. | |
10.15(9)+ | Employment Agreement, dated September 15, 2014, between Gregg Appliances, Inc. and Keith M. Zimmerman. | |
10.15(10)+ | Employment Agreement, dated December 16, 2015, between Gregg Appliances, Inc. and Robert J. Riesbeck. | |
10.15(10)+ | Employment Agreement, dated December 16, 2015, between Gregg Appliances, Inc. and Charles Young. | |
10.15(10)+ | Employment Agreement, dated December 16, 2015, between Gregg Appliances, Inc. and Keith M. Zimmerman. | |
14.1 (2) | Finance Code of Ethics. | |
21.1(2) | List of our Subsidiaries. | |
23.1 | Consent of KPMG LLP, Independent Registered Public Accounting Firm. | |
31.1 | Certification of the Chief Executive Officer pursuant to Rule 13a-14(a) and 15d-14(a) under the Securities Exchange Act of 1934, as adopted pursuant to Section 302 of the Sarbanes-Oxley Act of 2002. | |
31.2 | Certification of the Chief Financial Officer pursuant to Rule 13a-14(a) and 15d-14(a) under the Securities Exchange Act of 1934, as adopted pursuant to Section 302 of the Sarbanes-Oxley Act of 2002. | |
32.1 ++ | Certification of the Chief Executive Officer pursuant to 18 U.S.C. Section 1350, as adopted pursuant to Section 906 of the Sarbanes-Oxley Act of 2002. | |
32.2 ++ | Certification of the Chief Financial Officer pursuant to 18 U.S.C. Section 1350, as adopted pursuant to Section 906 of the Sarbanes-Oxley Act of 2002. | |
**101 | The following materials from hhgregg, Inc.’s Annual Report on Form 10-K for the fiscal year ended March 31, 2016, formatted in XBRL (eXtensible Business Reporting Language): (1) Consolidated Statements of Operations for fiscal years ended March 31, 2016, 2015 and 2014, (2)Consolidated Balance Sheets as of March 31, 2016 and 2015, (3) Consolidated Statements of Stockholders’ Equity for fiscal years ended March 31, 2016, 2015 and 2014, (4) Consolidated Statements of Cash Flows for fiscal years ended March 31, 2016, 2015 and 2014 and (5) Notes to Consolidated Financial Statements. | |
(1) | Incorporated by reference from the Company's Current Report on Form 8-K filed with SEC on September 3, 2015 |
(2) | Incorporated by reference from the Company’s Registration Statement on Form S-1 (Reg. No. 333-142181) filed with the SEC on April 18, 2007. |
(3) | Incorporated by reference from the Company’s Annual Report on Form 10-K filed with the SEC on June 3, 2008. |
(4) | Incorporated by reference from the Company’s Current Report on Form 8-K filed with the SEC on July 16, 2009. |
(5) | Incorporated by reference from the Company’s Current Report on Form 8-K filed with the SEC on April 1, 2011. |
(6) | Incorporated by reference from the Company’s Annual Report on Form 10-K filed with the SEC on May 26, 2011. |
(7) | Incorporated by reference from the Company’s Quarterly Report on Form 10-Q filed with the SEC on August 1, 2013. |
(8) | Incorporated by reference from the Company’s Quarterly Report on Form 10-Q filed with the SEC on September 11, 2014. |
(9) | Incorporated by reference from the Company’s Current Report on Form 8-K filed with the SEC on December 24, 2014. |
(10) | Incorporated by reference from the Company’s Current Report on Form 8-K filed with the SEC on December 18, 2015. |
* | Confidential treatment requested for certain confidential portions of this exhibit. These confidential portions have been omitted from this exhibit and filed separately with the Securities and Exchange Commission. |
** | Pursuant to Rule 406T of Regulation S-T, the Interactive Data Files on Exhibit 101 hereto are deemed not filed or part of a registration statement of prospectus for purposes of Sections 11 or 12 of the Securities Act of 1933, as amended, are deemed not filed for purposes of Section 18 of the Exchange Act, as amended, and otherwise are not subject to liability under those sections. |
+ | Indicates management contract or compensation plan or arrangement. |
++ | This exhibit shall not be deemed “filed” for purposes of Section 18 as the Exchange Act, as amended, or otherwise subject to the liabilities of that section, nor shall it be deemed incorporated by reference in any filings under the Securities Act of 1933, as amended, or the Exchange Act, as amended, whether made before or after the date hereof and irrespective of any general incorporation language in any filings. |
66
SIGNATURES
Pursuant to the requirements of Section 13 or 15 (d) of the Securities Exchange Act of 1934, the registrant has duly caused this report to be signed on its behalf by the undersigned, thereunto duly authorized.
HHGREGG, INC. | ||
By: | /s/ ROBERT J. RIESBECK | |
Robert J. Riesbeck Interim President and Chief Executive Officer and Chief Financial Officer (Principal Executive and Financial Officer) | ||
Dated: May 19, 2016
Pursuant to the requirements of the Securities Exchange Act of 1934, this report has been signed below by the following persons on behalf of the registrant and in the capacities and on the dates indicated.
Signature | Title | Date | ||
/s/ ROBERT J. RIESBECK | Interim President and Chief Executive Officer and Chief Financial Officer | May 19, 2016 | ||
Robert J. Riesbeck | (Principal Executive and Financial Officer) | |||
/s/ KEVIN J. KOVACS | Vice President, Controller | May 19, 2016 | ||
Kevin J. Kovacs | (Principal Accounting Officer) | |||
/s/ GREGORY M. BETTINELLI | Director | May 19, 2016 | ||
Gregory M. Bettinelli | ||||
/s/ WILLIAM P. CARMICHAEL | Director | May 19, 2016 | ||
William P. Carmichael | ||||
/s/ LAWRENCE P. CASTELLANI | Director | May 19, 2016 | ||
Lawrence P. Castellani | ||||
/s/ BENJAMIN D. GEIGER | Director | May 19, 2016 | ||
Benjamin D. Geiger | ||||
/s/ CATHERINE A. LANGHAM | Chairperson of the Board and Director | May 19, 2016 | ||
Catherine A. Langham | ||||
/s/ JOHN M. ROTH | Director | May 19, 2016 | ||
John M. Roth | ||||
/s/ PETER M. STARRETT | Director | May 19, 2016 | ||
Peter M. Starrett | ||||
/s/ KATHLEEN C. TIERNEY | Director | May 19, 2016 | ||
Kathleen C. Tierney | ||||
/s/ DARELL E. ZINK | Director | May 19, 2016 | ||
Darell E. Zink | ||||
67