Attached files
| file | filename |
|---|---|
| EXCEL - IDEA: XBRL DOCUMENT - hhgregg, Inc. | Financial_Report.xls |
| EX-31.1 - CERTIFICATION OF THE CHIEF EXECUTIVE OFFICER - hhgregg, Inc. | d340850dex311.htm |
| EX-31.2 - CERTIFICATION OF THE CHIEF FINANCIAL OFFICER - hhgregg, Inc. | d340850dex312.htm |
| EX-32.2 - CERTIFICATION OF THE CHIEF FINANCIAL OFFICER - hhgregg, Inc. | d340850dex322.htm |
| EX-32.1 - CERTIFICATION OF THE CHIEF EXECUTIVE OFFICER - hhgregg, Inc. | d340850dex321.htm |
| EX-10.32 - EMPLOYMENT AGREEMENT, DATED FEBRUARY 15, 2012 - hhgregg, Inc. | d340850dex1032.htm |
| EX-10.31 - EMPLOYMENT AGREEMENT, DATED SEPTEMBER 13, 2011 - hhgregg, Inc. | d340850dex1031.htm |
| EX-23.1 - CONSENT OF KPMG LLP, INDEPENDENT REGISTERED PUBLIC ACCOUNTING FIRM - hhgregg, Inc. | d340850dex231.htm |
Table of Contents
UNITED STATES
SECURITIES AND EXCHANGE COMMISSION
Washington, D.C. 20549
FORM 10-K
| x | ANNUAL REPORT PURSUANT TO SECTION 13 OR 15(d) OF THE SECURITIES EXCHANGE ACT OF 1934 |
For the fiscal year ended March 31, 2012
or
| ¨ | TRANSITION REPORT PURSUANT TO SECTION 13 OR 15(d) OF THE SECURITIES EXCHANGE ACT OF 1934 |
For the transition period from to
Commission file number 001-33600

hhgregg, Inc.
(Exact Name of Registrant as Specified in Its Charter)
| Delaware | 20-8819207 | |
| (State or Other Jurisdiction of Incorporation or Organization) | (I.R.S. Employer Identification No.) | |
| 4151 East 96th Street Indianapolis, IN | 46240 | |
| (Address of Principal Executive Offices) | (Zip Code) | |
Registrant’s telephone number, including area code: (317) 848-8710
Securities registered pursuant to Section 12(b) of the Act:
| Title of each class |
Name of each exchange on which registered | |
| Common Stock, par value $.0001 per share |
New York Stock Exchange |
Securities registered pursuant to section 12(g) of the Act:
None
(Title of class)
Indicate by check mark if the registrant is a well-known seasoned issuer, as defined in Rule 405 of the Securities Act. ¨ Yes x No
Indicate by check mark if the registrant is not required to file reports pursuant to Section 13 or Section 15(d) of the Act. ¨ Yes x No
Indicate by check mark whether the registrant (1) has filed all reports required to be filed by Section 13 or 15(d) of the Securities Exchange Act of 1934 during the preceding 12 months (or for such shorter period that the registrant was required to file such reports), and (2) has been subject to such filing requirements for the past 90 days. x Yes ¨ No
Indicate by check mark whether the registrant has submitted electronically and posted on its corporate Web site, if any, every Interactive Data File required to be submitted and posted pursuant to Rule 405 of Regulation S-T (§232.405 of this chapter) during the preceding 12 months (or for such shorter period that the registrant was required to submit and post such files). x Yes ¨ No
Indicate by check mark if disclosure of delinquent filers pursuant to Item 405 of Regulation S-K (§229.405) is not contained herein, and will not be contained, to the best of registrant’s knowledge, in definitive proxy or information statements incorporated by reference in Part III of this Form 10-K or any amendment to this Form 10-K. x
Indicate by check mark whether the registrant is a large accelerated filer, an accelerated filer, a non-accelerated filer, or a smaller reporting company. See the definitions of “large accelerated filer,” “accelerated filer” and “smaller reporting company” in Rule 12b-2 of the Exchange Act.(Check one):
| Large accelerated filer ¨ |
Accelerated filer x | |||
| Non-accelerated filer ¨ |
(Do not check if a smaller reporting company) | Smaller reporting company ¨ |
Indicate by check mark whether the registrant is a shell company (as defined in Rule 12b-2 of the Act). ¨ Yes x No
The aggregate market value of the voting and non-voting common stock held by non-affiliates of the registrant as of the last day of the second fiscal quarter ended September 30, 2011 was approximately $164,408,780 based on the closing stock price of $9.75 per share on that day. (For purposes of this calculation all of the registrant’s directors and executive officers are deemed affiliates of the registrant.)
The number of shares of hhgregg, Inc.’s common stock outstanding as of May 11, 2012 was 36,356,216.
DOCUMENTS INCORPORATED BY REFERENCE
Portions of the Registrant’s definitive Proxy Statement (to be filed pursuant to Regulation 14A within 120 days after the Registrant’s fiscal year-end of March 31, 2012) for the regular meeting of stockholders to be held on July 31, 2012, are incorporated by reference into Part III of this Annual Report on Form 10-K.
Table of Contents
| 5 | ||||||
| ITEM 1. |
5 | |||||
| ITEM 1A. |
13 | |||||
| ITEM 1B. |
21 | |||||
| ITEM 2. |
21 | |||||
| ITEM 3. |
23 | |||||
| ITEM 4. |
23 | |||||
| 24 | ||||||
| ITEM 5. |
24 | |||||
| ITEM 6. |
26 | |||||
| ITEM 7. |
Management’s Discussion and Analysis of Financial Condition and Results of Operations |
28 | ||||
| ITEM 7A. |
42 | |||||
| ITEM 8. |
43 | |||||
| ITEM 9. |
Changes in and Disagreements with Accountants on Accounting and Financial Disclosure |
68 | ||||
| ITEM 9A. |
68 | |||||
| ITEM 9B. |
68 | |||||
| 69 | ||||||
| ITEM 10. |
69 | |||||
| ITEM 11. |
69 | |||||
| ITEM 12. |
Security Ownership of Certain Beneficial Owners and Management and Related Stockholder Matters |
69 | ||||
| ITEM 13. |
Certain Relationships and Related Transactions, and Director Independence |
69 | ||||
| ITEM 14. |
69 | |||||
| 70 | ||||||
| ITEM 15. |
70 | |||||
2
Table of Contents
Cautionary Note Regarding Forward-Looking Statements
Section 27A of the Securities Act of 1933, as amended, and Section 21E of the Securities Exchange Act of 1934, as amended (“Exchange Act”), provide a “safe harbor” for forward-looking statements to encourage companies to provide prospective information about their companies. Some of the statements in this document and any documents incorporated by reference constitute “forward-looking statements” within the meaning of Section 21E of the Exchange Act. These statements relate to future events or our future financial performance and involve known and unknown risks, uncertainties and other factors that may cause our businesses or our industries’ actual results, levels of activity, performance or achievements to be materially different from those expressed or implied by any forward-looking statements. Such statements include, in particular, statements about our plans, strategies, prospects, changes, outlook and trends in our business and the markets in which we operate under the heading “Management’s Discussion and Analysis of Financial Condition and Results of Operations.” In some cases, you can identify forward-looking statements by terminology such as “may,” “will,” “could,” “would,” “should,” “expect,” “plan,” “anticipate,” “intend,” “tends,” “believe,” “estimate,” “predict,” “potential” or “continue” or the negative of those terms or other comparable terminology. These statements are only predictions. Actual events or results may differ materially because of market conditions in our industries or other factors. All of the forward-looking statements are qualified in their entirety by reference to the factors discussed under “Management’s Discussion and Analysis of Financial Condition and Results of Operations” herein. The forward-looking statements are made as of the date of this document or the date of the documents incorporated by reference in this document, as the case may be, and we assume no obligation to update the forward-looking statements or to update the reasons why actual results could differ from those projected in the forward-looking statements. Some of the key factors that could cause actual results to differ from our expectations are:
| • | the effect of general and regional economic and employment conditions on our net sales; |
| • | the impact of average selling prices on net sales; |
| • | competition in existing, adjacent and new metropolitan markets; |
| • | competition from internet retailers; |
| • | ability to modify our product mix based on changes in consumer trends and preferences; |
| • | our ability to effectively manage and monitor our operations, costs and service quality; |
| • | our reliance on a small number of suppliers; |
| • | rapid inflation or deflation in core product prices; |
| • | the failure of manufacturers to introduce new products and technologies; |
| • | customer acceptance of new technology; |
| • | our dependence on our key management personnel; |
| • | our ability to attract and retain qualified sales personnel; |
| • | our ability to negotiate with our suppliers to provide product on a timely basis at competitive prices; |
| • | the identification and acquisition of suitable sites for our stores and the negotiation of acceptable leases for those sites; |
| • | fluctuation in seasonal demand; |
| • | our ability to maintain our rate of growth and penetrate new geographic areas; |
| • | our ability to obtain additional financing and maintain our credit facilities; |
| • | our ability to maintain and upgrade our information technology systems; |
| • | the effect of a disruption at our regional distribution centers; |
3
Table of Contents
| • | changes in cost for print and television advertising; and |
| • | changes in trade regulation, currency fluctuations and prevailing interest rates. |
Other factors that could cause actual results to differ from those implied by the forward-looking statements in this Annual Report on Form 10-K are more fully described in the “Risk Factors” section and elsewhere herein. Given these risks and uncertainties, you are cautioned not to place undue reliance on these forward-looking statements. The forward-looking statements included herein are made only as of the date hereof. We do not undertake and specifically decline any obligation to update any of these statements or to publicly announce the results of any revisions to these statements to reflect future events or developments.
4
Table of Contents
| ITEM 1. | Business. |
Our Company
Unless the context otherwise requires, the use of the terms “we”, “us”, “our”, “hhgregg” and the “Company” in this Annual Report on Form 10-K refers to hhgregg, Inc. and our subsidiaries. Our fiscal year ends on March 31.
We are a specialty retailer of home appliances, televisions, computers, consumer electronics, mattresses and related services operating under the name hhgregg™. As of March 31, 2012, we operated 208 stores in Alabama, Delaware, Florida, Georgia, Illinois, Indiana, Kentucky, Maryland, Mississippi, New Jersey, North Carolina, Ohio, Pennsylvania, South Carolina, Tennessee and Virginia. We differentiate ourselves from our competitors by providing our customers with a consultative and educational purchase experience. We also distinguish ourselves by offering next-day delivery on many of our products. Our superior customer purchase experience has enabled us to successfully compete against the other leading video and appliance retailers over the course of our 57-year history.
We design our stores to be visually appealing to our customers and to highlight our premium selection of consumer electronics and appliances. We utilize flat panel television display walls, appliance displays and digital product centers to showcase our broad selection of products with advanced features and functionality. We carry approximately 100 models of flat panel televisions and 350 models of appliances. Our new store prototypes typically range from 25,000 to 30,000 square feet and are located in power centers or freestanding locations in high traffic areas, as close as feasible to our major competitors. We drive store traffic and enhance our brand recognition through year-round television advertising, weekly newspaper inserts, direct mail, e-mail and web promotions.
Our sales can be categorized in the following manner:
| • | Video: We offer a broad selection of the latest video products, such as LED televisions and Blu-ray players. Representative brands include Coby, Curtis, Hisense, LG, Panasonic, Samsung, Sharp, Sony and Toshiba. For fiscal 2012, video products represented 43% of net sales. |
| • | Appliances: We offer a broad selection of major appliances, including the latest generation refrigerators, cooking ranges, dishwashers, freezers, washers and dryers, sold under a variety of leading brand names. Representative brands include Bosch, Frigidaire, GE, Haier, KitchenAid, LG, Maytag, Samsung and Whirlpool. For fiscal 2012, home appliances represented 37% of net sales. |
| • | Computing and mobile phones: We offer a broad selection of computer and mobile phone products, including notebook computers, tablets and mobile phones. Representative brands include Acer, Asus, Hewlett Packard, Samsung, Sony, Toshiba and Verizon. For fiscal 2012, computing and mobile phones represented 9% of net sales. |
| • | Other: We also sell audio products, furniture, mattresses and other select popular consumer electronics and accessories. Products such as home audio systems, cameras, personal navigation, gaming bundles, telephones and advanced cables generate and support store traffic and create cross-selling opportunities with our core products. Our suite of services is aimed at enhancing our customers’ superior purchase experience. For fiscal 2012, other products and services represented 11% of net sales. |
| • | Additionally, we sell a suite of services including third-party premium service plans (“PSPs”), third-party in-home service and repair of our products, next-day delivery and installation and in-home repair and maintenance. Services and PSP revenues are included as a component of net sales in the categories listed above. |
5
Table of Contents
We believe the following strengths contribute significantly to our success and position us for growth within our existing and new markets:
Superior customer purchase experience. We provide a superior purchase experience to our customers through our in-store experience, high level of customer service and delivery and installation capabilities, which we believe drives customer loyalty, referrals and repeat business. We are able to educate our customers on the features and benefits of the products we offer through our extensively trained, commissioned sales force. Approximately 95% of our sales associates are full-time employees, supporting our goal of hiring individuals who are career oriented and motivated. We believe that, when fully informed, customers frequently purchase higher-end, feature-rich products. Our ability to drive sales of more advanced video and appliance products has made us an important partner for our vendors to present their state-of-the-art offerings and enables us to be among the first to introduce new products and technologies in our stores. This further enhances our brand image and customer experience.
We offer next-day delivery for many of our products and also provide quality in-home installation services. These features significantly enhance our ability to sell large, more complex products. Our network of 17 regional and local distribution centers provides a local supply of inventory that supports our next-day delivery strategy. We conduct a significant number of customer surveys each year to ensure customer satisfaction and provide us with feedback to continue improving our superior customer purchase experience.
Balanced mix of premium video products and appliances. We offer an extensive selection of premium video products and appliances. Historically, our appliance business has provided us with financial stability and consistently strong cash flow while our video products are typically more seasonal in nature. Our cash flow tends to be more stable over the long term as a result of our balanced merchandise mix of video products and appliances. In addition, the combination of large screen televisions and appliances, each of which frequently requires home delivery and installation, provides us with efficiencies in home delivery and installation.
Proven ability to successfully penetrate new markets. We seek to expand our highly portable store concept into new markets where we believe there is significant underlying demand for our product mix and customer services, as well as an attractive demographic profile. We have successfully opened or acquired stores in 14 new metropolitan markets in the past five years, most recently in the Chicago, Illinois and Miami, Florida markets. We typically enter a market with a scaled presence to efficiently leverage our advertising spending, regional management and delivery and distribution infrastructure. Within a short time period, usually not exceeding 18 months, we grow our store count in the new market to optimize leverage of our fixed costs and our market share. In fiscal 2013, we plan to open 20 to 22 new stores, predominately in the markets of St. Louis, Missouri and Milwaukee, Wisconsin.
Strong store economics. We closely adhere to our prototype store format when opening new stores, which helps simplify our operations and ensures consistent execution. Our stores typically generate positive cash flow within three months of opening and provide a cash payback in less than three years. Strong store economics, combined with efficient inventory management, generate significant free cash flow to internally fund a portion of our growth. Stores opened during fiscal years 2009, 2010 and 2011 had strong first full year performance, including average net sales of $12.0 million, which contributed to our 4.4% operating income margin in fiscal 2012. During this same period, our new stores required average net capital expenditures of $0.7 million and average initial net-owned inventory investments of $1.0 million.
Multi-channel. We have enhanced our multi-channel capabilities to allow consumers to experience an integrated online and in-store purchase experience. Our multi-channel approach gives customers the ability to make a purchase in store, to buy online and pick up in store or to buy online and have the product shipped or delivered.
6
Table of Contents
Customer Purchase Experience
Our goal is to serve our customers in a manner that generates loyalty, referrals and repeat business. We focus on making every customer’s purchase experience a positive one and aim to be the primary destination for consumer electronics and home appliances in our markets. We employ multiple internal systems to ensure customer satisfaction in each of our markets, and we focus on offering a comprehensive suite of services such as delivery and home installation to our customers. We aim to offer the customer a convenient shopping experience by locating our stores in high traffic areas with a focus on visibility, access and parking availability.
Our philosophy for providing our customers with a superior purchase experience includes:
| • | employing a highly motivated, commissioned sales force and training them so they are able to educate our customers on the benefits of feature-rich, higher margin products; |
| • | offering a deep product assortment in core categories; |
| • | providing a warm and bright store ambiance that showcases our products well; |
| • | providing quick and efficient delivery for many of our products and quality in-home installation services; |
| • | offering extended-term financing through a third-party private label credit card to qualified customers; |
| • | offering convenient 40 minute call-ahead service for delivery; |
| • | soliciting customer feedback to allow us to monitor and improve individual employee performance; |
| • | conducting broad consumer and market research to ensure a top quality, competitively-priced offering; and |
| • | offering customer support through our central call center seven days per week. |
Private Label Credit Card. We offer customers financing through a private label credit card with a third-party financial institution. The third-party financial institution assumes the risk of collection from our customers and has no recourse against us for any uncollected amounts. Private label credit card sales accounted for 31%, 29% and 29% of our net sales in fiscal 2012, 2011 and 2010, respectively.
Product Service and Support. We currently outsource product service and repair of our products sold with and without extended warranties. The majority of extended warranties we sell to our customers are third-party PSPs. The PSPs typically extend three to five years beyond the manufacturer’s warranty and cover all service and repair-related maintenance. We closely monitor the performance of our third-party vendor to ensure the quality and timeliness of their repair services. We offer customer support via our central customer service call center. Our service center is open seven days a week and provides customers with a toll-free resource to ask product and other support-related questions. We complete the customer purchase experience by offering a full array of in-store and in-home product services, including PC optimization and home theater and appliance installation to ensure the customer is able to fully enjoy their purchase.
Merchandising and Purchasing
Merchandise. We focus on offering extensive product and brand selections. We offer a broad selection of leading brands at everyday competitive prices and provide a balance of digital and home theater products and appliances. Our premium products help drive margins and profitability while our lower-margin products help drive customer traffic. Our balanced mix of premium video products and appliances historically has provided us with a more stable and less-seasonal cash flow.
7
Table of Contents
Product Categories. We sell a wide variety of premium video products, including digital televisions and home theater systems, appliances, audio products, notebook computers, mattresses and related services. The table below lists selected products and representative brands for our core merchandise categories:
| Category |
Products |
Selected Brands | ||
| Video |
Flat panel televisions and Blu-Ray and DVD players | Coby, Curtis, Hisense, LG, Panasonic, Samsung, Sharp, Sony and Toshiba | ||
| Appliances |
Washers and dryers, refrigerators, cooking ranges, dishwashers, freezers, and air conditioners | Bosch, Frigidaire, GE, Haier, KitchenAid, LG, Maytag, Samsung and Whirlpool | ||
| Computing and mobile phones |
Computers, mobile phones and tablets | Acer, Asus, Hewlett Packard, Samsung, Sony, Toshiba and Verizon | ||
| Other |
Digital camcorders, digital cameras, gaming bundles, home theater receivers, mattresses, MP3 players, personal navigation, speaker systems and telephones | Canon, Nikon, Samsung, Serta and Sony | ||
Vendor Relationships. Our top 10 and 20 suppliers accounted for over 77.2% and 89.9%, respectively, of merchandise purchased by us during fiscal 2012. Our key suppliers include Frigidaire, GE, HP, LG, Panasonic, Samsung, Sharp, Sony, Toshiba and Whirlpool.
Our purchasing strategy varies by vendor and product line. We do not have long-term contracts with any of our major suppliers. Inventory purchases are managed through the placement of purchase orders with our vendors. Our ability to sell a broad selection of products has made us an important partner to our vendors for showcasing their higher-margin product offerings and introducing new products and technologies to consumers. In an effort to support our strategy, vendors offer us various incentives including volume discounts, trade financing, co-op advertising, purchase discounts and allowances, promotional items and inventory on a consignment basis.
Personnel and Training
Commissioned Sales Associates. We seek to hire individuals who are career-oriented and motivated by a commission-based environment. Approximately 95% of our sales associates are full-time employees. Our sales associates are compensated based on both sales and product profitability. New sales associates are required to complete 80 hours of initial in-house training focused on product knowledge and functionality, customer service and general store operations. Sales associates also participate in on-going training for an average of ten hours per month to stay current with new product offerings and customer service initiatives. This on-going training includes quarterly meetings with vendors to learn about upcoming product releases.
Manager-In-Training (MIT) Program. We operate a professional development program that provides managers with a variety of tools and training to assist them in leading their associates and meeting their performance objectives. Manager candidates undergo comprehensive training in store operations, sales, management and communication skills so that they can eventually manage their own stores and have the opportunity to become regional managers. Candidates first participate in our MIT program, which develops each manager’s managerial and supervisory skills. After completion of our training programs, manager candidates work as assistant managers. Managers earn an opportunity to operate higher-volume stores as they demonstrate greater proficiency in their management skills.
8
Table of Contents
Our store and regional managers are essential to our store expansion strategy. We use experienced store and regional managers from our existing markets to open new markets. Our MIT program provides a pipeline of future store and regional managers. This program enables us to staff our management positions in new stores from a pool of experienced managers and backfill the openings created in existing stores with well-developed, internal promotions.
Distribution and Warehousing
Our distribution and warehousing functions are designed to optimize inventory availability and turnover, increase delivery efficiency, and minimize product handling. Our distribution and warehousing system at March 31, 2012 consisted of five regional distribution centers, or RDCs, and 12 local distribution centers, or LDCs. RDCs receive products directly from manufacturers and stock merchandise for local customer delivery as well as store and LDC replenishment. LDCs receive inventory daily from their respective RDCs or directly from manufacturers for home delivery. Merchandise is generally not transferred between stores. Our RDCs and LDCs operate seven days a week. All of our distribution facilities are leased.
The following table sets forth certain information relating to our RDCs and LDCs as of March 31, 2012:
| Facility |
Opening Date | Area Served | Size (sq. ft) | |||||
| RDC: |
||||||||
| Atlanta, Georgia |
January 2003 | Southeast | 273,200 | |||||
| Brandywine, Maryland |
March 2010 | Mid-Atlantic | 393,440 | |||||
| Aurora, Illinois |
July 2011 | Great Lakes | 247,360 | |||||
| Indianapolis, Indiana |
June 1986 | Midwest | 319,458 | |||||
| Davenport, Florida |
April 2008 | Florida | 282,126 | |||||
| LDC: |
||||||||
| Birmingham, Alabama |
April 2007 | Birmingham | 65,000 | |||||
| Charlotte, North Carolina |
April 2005 | Charlotte | 99,688 | |||||
| Cincinnati, Ohio |
March 1999 | Cincinnati | 100,800 | |||||
| Cleveland, Ohio |
September 2001 | Cleveland | 100,800 | |||||
| Columbus, Ohio |
August 1999 | Columbus | 89,643 | |||||
| Jacksonville, Florida |
March 2008 | Jacksonville | 71,760 | |||||
| Louisville, Kentucky |
August 2002 | Louisville | 61,000 | |||||
| Pembroke Park, Florida |
May 2011 | Miami | 66,095 | |||||
| Nashville, Tennessee |
October 2006 | Nashville | 100,000 | |||||
| Philadelphia, Pennsylvania |
April 2010 | Philadelphia | 86,304 | |||||
| Pittsburgh, Pennsylvania |
September 2011 | Pittsburgh | 20,465 | |||||
| Raleigh, North Carolina |
August 2007 | Raleigh | 108,000 | |||||
Typically, large appliances, large-screen televisions, home theater products and mattresses are delivered to a customer’s home. The majority of our customers purchasing these products also use our delivery or installation service. Our stores carry a limited inventory of these larger items to accommodate customers who prefer to transport merchandise themselves. Smaller-sized items such as Blu-Ray players, digital cameras, notebook computers, small appliances, tablets and televisions less than 50 inches are adequately stocked in-store to meet customer demand.
Our delivery is outsourced in all of our markets. Our outsourcing partners assign certain contractors to us and those contractors deliver products exclusively for us, generally carry our logo on their vehicles and wear hhgregg uniforms. This allows us to maintain our brand identity and high customer service levels following the purchase of our products. We remain the customer’s primary point of contact throughout the delivery and installation process regardless of whether or not the service is outsourced, thereby ensuring that we maintain
9
Table of Contents
control over the quality of the service provided. We also closely monitor our delivery partners to assess our customers’ satisfaction with their services. We are not subject to any long-term agreements with any of our delivery partners.
Advertising and Promotion
We utilize ongoing advertising and weekly promotions to increase our brand awareness and to drive online and in-store traffic. We aggressively promote our products and services through the use of a balanced media mix, which includes preprinted newspaper inserts, television, direct mail, e-mail communications, radio, digital advertising, social media, web promotions, outdoor billboards and event sponsorship. We currently outsource creative and media placement to advertising agencies, but handle newspaper insert and direct mail design and placement internally.
We enter new major markets with a comprehensive brand awareness campaign for a three-week period leading up to our grand opening. During the week of grand opening, we utilize a combination of television, radio, direct mail, social media and special newspaper insert offers to drive traffic to our stores.
Our website, www.hhgregg.com, features our full line of products and services and provides useful information to consumers on the features and benefits of our products, services, store locations and hours of operation. We offer both online shopping with delivery, as well as an in-store pickup option to increase customer traffic. We also utilize the internet as an important customer information resource to drive in-store purchases of our merchandise and services.
Management Information Systems
Over the past five years, we have been systematically updating and upgrading our management information systems in a multi-phase process to improve the efficiency of our store operations and enhance critical corporate and business planning functions. During this time period, we
| • | installed a new enterprise data warehouse to better integrate operating and merchandising information in a relational data base environment, |
| • | implemented a demand management and forecasting tool to add more robust analytical capabilities to our inventory management process, |
| • | opened an off-site data center to enhance our disaster recovery capabilities, and |
| • | converted our financial reporting and accounting systems to a retail industry standard application to support our anticipated future growth. |
Our management information systems include a wide-area network linking our stores and distribution centers to our corporate offices. This provides real-time polling of sales, scheduled deliveries and inventory levels at the store and distribution center level. In our distribution centers, we use radio frequency networks to assist in receiving, stock put-away, stock movement, order filling, cycle counting and inventory management.
Competition
The consumer electronics and appliance industry is highly competitive and concentrated among a group of major retailers. Our stores compete against other consumer electronics retailers, specialty home office retailers, mass merchants, home improvement superstores and internet-based businesses. Our stores also compete against independent dealers, regional chain discount stores, wholesale clubs and other specialty single- and multi-unit retail stores. Mass merchants continue to increase their offerings of consumer electronics products, primarily those that are less complex to sell, deliver and install. Additionally, internet retailers continue to gain market share in smaller size consumer electronics products.
10
Table of Contents
We compete against national retailers including Best Buy, Home Depot, Lowe’s, Sears and Wal-Mart in the vast majority of our markets. We also compete against regional retailers, such as BrandsMart and Fry’s, in several of our markets. We continue to perform well in digital televisions and major appliances in the majority of our markets. This performance is achieved despite the presence, or entrance, of each of these leading competitors in our markets.
The consumer electronics and appliance industry competes on product selection, price and customer service. We differentiate ourselves through our emphasis on an extensive product offering, customer service and satisfaction while matching our competitors on price. We believe that our highly trained commissioned sales force, broad product and brand offerings and customer support services allow us to compete effectively in our markets for the following reasons:
| • | Our commissioned sales force is motivated to attend to customer needs quickly and is knowledgeable about the products we carry. The majority of our key competitors pay their sales force on an hourly basis. Because our sales staff is commissioned and highly trained in product knowledge, we believe our sales force is driven to more quickly and efficiently assist our customers in making their purchase decisions. We believe that when fully informed, customers purchase higher-end, feature-rich products due to an appreciation of the performance of those products. |
| • | By combining this knowledgeable sales force with a broad selection of key brands and products with complex, premium features, we differentiate ourselves from our competitors. |
| • | We promote our products both in our stores and through advertising. We also highlight our service offerings, such as next-day delivery and 40 minute call-ahead delivery. These services are key to our customer base which appreciates better product information, high-end products and more flexible delivery. |
Environmental Matters
We are not aware of any federal, state or local provisions which have been enacted or adopted regulating the discharge of materials into the environment, or otherwise relating to the protection of the environment, that have materially affected, or are likely to materially affect, our net earnings or competitive position, or have resulted or are expected to result in material capital expenditures. During fiscal 2012, we had no capital expenditures for environmental control facilities and no such expenditures are anticipated in the foreseeable future.
Seasonality
We experience seasonal fluctuations in our net sales and operating results due in part to seasonal shopping patterns. For example, in fiscal 2012 and 2011, we generated 33.2% and 30.0%, respectively, of our net sales in the fiscal quarter ended December 31, which includes the holiday selling season. We also incur significant additional costs and expenses during the fiscal quarter ended December 31 due to increased staffing levels and higher purchase volumes.
Trade Names and Trademarks
We have registered, acquired the registration of, or claim ownership of the following trade names and trademarks for use in our business: hhgregg™, HHGREGG.COM®, H.H. Gregg Appliances Electronics Computers®, HHGREEN® , GIVING YOU THE POWER TO GO GREEN®, HHG®, Fine Lines®, hhgregg Fine Lines™, Fine Points™ and Price and Advice Guaranteed™.
Employees
As of March 31, 2012, we employed approximately 6,700 employees, of whom approximately 85% were full-time. We have no collective bargaining agreements covering any of our employees and have never experienced any material labor disruption. We consider our employee relations to be good.
11
Table of Contents
Available Information
We are subject to the reporting requirements of the Exchange Act and its rules and regulations. The Exchange Act requires us to file reports, proxy statements and other information with the U.S. Securities and Exchange Commission (SEC). Copies of these reports, proxy statements and other information can be read and copied at:
SEC Public Reference Room
100 F Street N.E.
Washington, D.C. 20549
Information on the operation of the Public Reference Room may be obtained by calling the SEC at 1-800-SEC-0330.
The SEC maintains a Web site that contains reports, proxy statements and other information regarding issuers that file electronically with the SEC. These materials may be obtained electronically by accessing the SEC’s Web site at http://www.sec.gov.
We make available, free of charge on our Web site, our Annual Report on Form 10-K, Quarterly Reports on Form 10-Q, Current Reports on Form 8-K and amendments to these reports filed or furnished pursuant to Section 13(a) or 15(d) of the Exchange Act, as soon as reasonably practicable after we electronically file these documents with, or furnish them to, the SEC. These documents are posted on our Web site at www.hhgregg.com — select the “Investor Relations” link and then the “Financials and SEC Filings” link.
We also make available, free of charge on our Web site, the charters of the Audit Committee, Compensation Committee, Executive Committee and Nominating and Corporate Governance Committee, as well as the Code of Business Conduct and Ethics, Whistleblower Policy, Related Party Policy and the Corporate Governance Guidelines. These documents are posted on our Web site at www.hhgregg.com — select the “Investor Relations” link and then the “Corporate Governance” link.
Copies of any of the above-referenced documents will also be made available, free of charge, upon written request to:
hhgregg, Inc.
Vice President of Finance
4151 E 96th Street
Indianapolis, IN 46240
12
Table of Contents
| ITEM 1A. | Risk Factors |
Described below are certain risks that our management believes are applicable to our business and the industry in which we operate. You should carefully consider each of the following risks and all of the information set forth in this Annual Report on Form 10-K.
If any of the events described below occur, our business, financial condition, results of operations, liquidity or access to the capital markets could be materially adversely affected. The following risks could cause our actual results to differ materially from our historical experience and from results predicted by forward-looking statements made by us or on our behalf related to conditions or events we anticipate may occur in the future. All forward-looking statements made by us or on our behalf are qualified by the risks below.
Our business is dependent on the general economic conditions in our markets.
In general, our sales depend on discretionary spending by our customers. General economic factors and other conditions that may affect our business, include periods of slow economic growth or recession, volatility and/or lack of liquidity from time to time in U.S. and world financial markets and the consequent reduced availability and/or higher cost of borrowing to hhgregg and its customers, slower rates of growth in real disposable personal income, sustained high rates of unemployment, high consumer debt levels, increasing fuel and energy costs, inflation or deflation of commodity prices, natural disasters, acts of terrorism and developments in the war against terrorism. General economic conditions and discretionary spending are beyond our control and are affected by, among other things:
| • | consumer confidence in the economy; |
| • | unemployment trends; |
| • | consumer debt levels; |
| • | consumer credit availability; |
| • | the housing and home improvement markets; |
| • | gasoline and fuel prices; |
| • | interest rates and inflation; |
| • | slower rates of growth in real disposable personal income; |
| • | natural disasters; |
| • | national and international security concerns; |
| • | tax rates and tax policy; and |
| • | other matters that influence consumer confidence and spending. |
Increasing volatility in financial markets may cause some of the above factors to change with an even greater degree of frequency and magnitude. The above factors could result in slowdown in the economy or an uncertain economic outlook, which could have a material adverse effect on our business and results of operations.
Other conditions that may impact our results of operations include disruptions in the availability of content such as sporting events or other televised content. Such disruptions may influence the demand for hardware that our customers purchase to access such content, which would have an adverse effect on our results of operations.
We have many competitors, direct and indirect. If we fail to execute our merchandising, marketing and distribution strategies effectively, those competitors could take sales and market share from us.
The retail market for consumer electronics and major home appliances is intensely competitive. We currently compete against a diverse group of national retailers, including Best Buy, Home Depot, Lowe’s, Sears,
13
Table of Contents
Wal-Mart, internet retailers, regional or independent specialty retail stores and mass merchandisers that sell many of the same or similar consumer electronics and major home appliances that we do. There are few barriers to entry and as a result new competitors may enter our existing or new markets at any time.
We may not be able to compete successfully against existing and future competitors. Some of our competitors have financial resources that are substantially greater than ours and may be able to purchase inventory at lower prices. Our competitors may respond more quickly to new or emerging technologies and may have greater resources to devote to discounts, promotions and sales of products and services. They may also have financial resources that enable them to weather economic downturns better than us. As it relates to internet retailers, we will need to ensure we have an effective multi-channel strategy.
Our existing competitors or new entrants into our industry may use a number of different strategies to compete against us, including:
| • | lower pricing; |
| • | more aggressive advertising and marketing; |
| • | enhanced product and service offerings; |
| • | extension of credit to customers on terms more favorable than we make available; |
| • | innovative store formats; |
| • | improved retail sales methods; |
| • | online product offerings; |
| • | not charging sales tax at the time of sale on internet purchases; and |
| • | expansion into markets where we currently operate. |
Competition could cause us to lose market share, net sales and customers, which could negatively impact our comparable store sales, increase expenditures or reduce prices or margins, any of which could have a material adverse effect on our business and results of operations.
Our ability to maintain and increase both net sales and product margins depends to a large extent on the periodic introduction and availability of new products and technologies.
We believe that the introduction and continued growth in consumer acceptance of new products will have a significant impact on our ability to increase net sales and maintain product margins. Our products are subject to significant technological changes, and we are dependent on our suppliers to continually invest in research and development to ensure we have new products and technologies in our stores. Innovative, heavily-featured products are typically introduced at relatively high price points. In response to continuing pressure from consumers and our competitors, price points may be reduced more quickly and to a greater degree, as compared to our prior practice in order to drive consumption. As a result, unit sales must increase at a greater rate than average selling prices decline in order to maintain or grow comparable store sales. If new product introductions do not drive enough sales volume at higher price points, prices will have to be reduced in order to sell existing inventory, which may negatively impact our ability to maintain our historical comparable store sales levels. If there were no new technologies or features in our products, we would see a material adverse impact to our revenues and product margins.
A disruption in our relationships with, or in the operations of, any of our key suppliers could cause our net sales and profitability to decline.
The success of our business and our growth strategy depends to a significant degree on our relationships with our suppliers. Our largest suppliers include Frigidaire, GE, Hewlett Packard, LG, Panasonic, Samsung,
14
Table of Contents
Sharp, Sony, Toshiba and Whirlpool. We do not have long-term supply agreements or exclusive arrangements with our major suppliers. We typically order our inventory through the issuance of individual purchase orders to vendors. We have no contractual assurance of the continued supply of merchandise in the amount and assortment we currently offer our customers and we may be subject to rationing by suppliers. In addition, we rely heavily on a relatively small number of suppliers. Our top 10 and 20 suppliers represented 77.2% and 89.9%, respectively, of our purchases in fiscal 2012. The loss of any one or more of our key suppliers or our failure to establish and maintain relationships with these and other suppliers could materially adversely affect our supply and assortment of products, as we may not be able to find suitable replacements to supply products at competitive prices.
Our suppliers also supply us with marketing funds and volume rebates. If our suppliers fail to continue these incentives, it could have a material adverse effect on our sales and results of operations.
The ongoing global crisis may also adversely affect our suppliers’ access to capital and liquidity with which to maintain their inventory, production levels and product quality and to operate their businesses, all of which could adversely affect our supply chain. It may cause suppliers to reduce their offerings of customer incentives and vendor allowances, cooperative marketing expenditures and product promotions. It may also cause them to change their pricing policies, which could impact demand for their products. The ongoing crisis and market instability make it difficult for us and our suppliers to accurately forecast future product demand trends, which could cause us to carry too much or too little merchandise in various product categories.
Disruptions in our supply chain and other factors affecting the distribution of our merchandise could adversely impact our business.
Any disruption in the operation of our distribution centers could result in our inability to meet our customers’ delivery requirements, higher costs, inability to stock our stores, or longer lead time associated with distributing merchandise. Any such disruption within our supply chain network, including damage or destruction to one of our five regional distribution centers, could result in decreased net sales, increased costs and reduced profits.
If we fail to anticipate changes in consumer preferences, our net sales and profitability may decline.
Our products must appeal to a broad range of consumers whose preferences cannot be predicted with certainty and are subject to change. Our ability to maintain and increase net sales depends to a large extent on the periodic introduction and availability of new products and technologies. Our success depends upon our ability to anticipate and respond in a timely manner to trends in consumer preferences relating to major household appliances and consumer electronics such as high efficiency appliances and high definition televisions. These products are subject to significant technological changes and pricing limitations and are subject to the actions and cooperation of third parties, such as movie distributors and television and radio broadcasters, all of which could affect the success of these and other new consumer electronics technologies. It is possible that new products will never achieve widespread consumer acceptance. Our margins are enhanced due to our ability to sell more feature-rich products with higher margins early in the product life cycle, thus a lack of new products in the market would impair our ability to maintain gross margins as a percentage of sales. Significant deviations from the anticipated consumer preferences for the products we sell could result in lost sales and lower margins due to the need to mark down excess inventory. If we are unable to effectively introduce and sell new products to our customers, our business and results of operations could be adversely affected.
Our growth strategy depends in part on our ability to open and profitably operate new stores in existing and new geographic markets. If we fail to successfully manage the challenges our planned growth poses, fail to maintain our financial and internal controls and systems or encounter unexpected difficulties during our expansion, our net sales and profitability could be materially adversely affected.
New stores that we open may not be profitable or may take longer than anticipated to open or to reach desired levels of profitability. Furthermore, the addition of new stores in existing markets may adversely affect
15
Table of Contents
the performance of nearby stores. Collectively, these circumstances could lower our profit, operating income and profit margins. There are a number of factors that could affect our ability to open or acquire, as well as operate new stores at profitable levels consistent with our existing stores, including:
| • | the inability to identify and acquire suitable store sites and to negotiate acceptable leases for these sites; |
| • | competition in existing, adjacent and new markets; |
| • | the failure to open enough stores in new markets to achieve a sufficient market presence to compete successfully; |
| • | the unfamiliarity with local real estate markets and demographics in adjacent and new markets; |
| • | difficulties associated with the hiring, training and retention of additional sales personnel and store managers; |
| • | the inability to obtain government approvals, licenses and permits in a timely manner; |
| • | the failure to adequately supervise construction and manage development costs; |
| • | the inability to secure adequate landlord financing; |
| • | difficulties or delay in obtaining construction materials and labor; and |
| • | problems or delays in pre-opening store promotion and related publicity. |
In addition, our growth plans will require management to expend significant time, effort and resources to ensure the continuing adequacy of our financial and other internal controls, operating procedures, information systems, product purchasing, inventory management, warehousing and distribution systems and employee training programs. We may not be able to effectively manage these increased demands or respond on a timely basis to the changing demands that our planned expansion will impose on our management, financial and other internal controls and information systems. If we fail to successfully manage the challenges our planned growth poses, fail to improve these systems and controls or encounter unexpected difficulties during our expansion, our net sales and profitability could be materially adversely affected.
Lack of available retail store sites on terms acceptable to us, rising real estate prices and other costs and risks relating to new store openings could severely limit our growth opportunities. Our strategy includes opening stores in new and existing markets. We must successfully choose store sites, execute favorable real estate transactions on terms that are acceptable to us, hire competent personnel and effectively open and operate these new stores. Our plans to increase our number of retail stores will depend in part on the availability of existing retail stores or store sites. A lack of available financing on terms acceptable to real estate developers or a tightening credit market may adversely affect the number or quality of retail sites available to us. We cannot assure you that stores or sites will be available to us, or that they will be available on terms acceptable to us. If additional retail store sites are unavailable on acceptable terms, we may not be able to carry out a significant part of our growth strategy. Rising real estate costs and acquisition, construction and development costs could also inhibit our ability to grow. If we fail to locate desirable sites, obtain lease rights to these sites on terms acceptable to us, hire adequate personnel and open and effectively operate these new stores, our financial performance could be adversely affected. In addition, our expansion in new and existing markets may present competitive, distribution, merchandising and regulatory challenges that differ from our current challenges, including competition among our stores, diminished novelty of our store design and concept, added strain on our distribution centers, additional information to be processed by our management information systems and diversion of management attention from operations, such as the control of inventory levels in our stores. We also cannot guarantee that we will be able to obtain and distribute adequate product supplies to our stores or maintain adequate warehousing and distribution capability at acceptable costs. New stores also may have lower than anticipated sales volumes relative to previously opened stores during their comparable years of operation, and sales volumes at new stores may not be sufficient to achieve store-level profitability or profitability comparable to that of existing stores. New stores in new markets, where we are less familiar with the target customer and less well-known, may face different or additional risks and increased costs compared to stores operated in existing
16
Table of Contents
markets or new stores in existing markets. For example, expansion into new markets could bring us into direct competition with retailers with whom we have no past experience as direct competitors. We also may not be able to advertise cost-effectively in new or smaller markets in which we have less store density, which could slow sales growth at such stores. To the extent that we are not able to meet these various challenges, our sales could decrease, our operating costs could increase and our profitability could be impacted.
If we fail to hire, train and retain qualified managers, sales associates and other employees we could lose sales to our competitors.
A key element of our competitive strategy is to provide product expertise to our customers through our extensively trained, commissioned sales associates which, we believe, results in more of our customers purchasing higher-margin, feature-rich products. If we are unable to attract and retain qualified personnel as needed in the future, including qualified sales personnel and candidates for our MIT program, our level of customer service may decline, which may decrease our net sales and profitability. Our ability to control labor costs, which may impact our ability to hire and retain qualified personnel, is subject to numerous external factors, including prevailing wage rates, the impact of legislation or regulations governing healthcare benefits or labor relations, such as the Employee Free Choice Act, and health and other insurance costs. Additionally, the National Labor Relations Board could significantly impact the nature of labor relations in the U.S. and how union elections and contract negotiations are conducted. If our labor and/or benefit costs increase, we may not be able to hire or maintain qualified personnel to the extent necessary to execute our competitive strategy, which could adversely affect our results of operations.
If we do not maintain the security of customer, associate, or company information, we could damage our reputation, incur substantial additional costs and become subject to litigation.
Any significant compromise or breach of customer, associate or company data security could significantly damage our reputation and result in additional costs, lost sales, fines and lawsuits. The regulatory environment related to information security and privacy is increasingly rigorous, with new and constantly changing requirements applicable to our business, and compliance with those requirements could result in additional costs. There is no guarantee that the procedures that we have implemented to protect against unauthorized access to secured data are adequate to safeguard against all data security breaches. If any such compromise or breach were to occur, it could adversely affect our results of operations.
Regulatory developments in the United States could impact our private-label credit card financing offers and have a material adverse impact on our net sales and profitability.
We offer private-label credit cards through a third-party financial institution that manages and directly extends credit to our customers. Cardholders who choose the private-label card can receive low- or no-interest promotional financing on qualifying purchases. If a customer utilizes a deferred interest financing offer and fails to comply with the terms of the offer, all deferred interest becomes due and payable to the third-party financial institution. Private label credit card sales accounted for 31%, 29% and 29% of our net sales in fiscal 2012, 2011 and 2010, respectively. Recently enacted legislative and regulatory changes that focus on a variety of credit related matters have had no material adverse impact on our operations to date. However, if future legislative or regulatory restrictions or prohibitions arise that affect our ability to offer promotional financing and we are unable to adjust our operations in a timely manner, our revenue and profitability may be materially adversely affected.
If our third-party delivery services are unable to meet our promised delivery schedule, our net sales may decline due to a decline in customer satisfaction.
We offer next-day delivery on many of the products we sell. Our deliveries are outsourced to third-party delivery services. Our third-party delivery services are subject to risks that are beyond our control. If our
17
Table of Contents
products are not delivered to our customers on time, our customers may cancel their orders or we may lose business from these customers in the future. As a result, our net sales and profitability may decline.
Because our hhgregg stores are generally concentrated in the eastern half of the United States, we are subject to regional risks.
During fiscal 2012, we operated stores in Alabama, Delaware, Florida, Georgia, Illinois, Indiana, Kentucky, Maryland, Mississippi, New Jersey, North Carolina, Ohio, Pennsylvania, South Carolina, Tennessee and Virginia. We therefore have exposure to these local economies as well as weather conditions and natural disasters occurring in these markets. If these markets individually or collectively suffer an economic downturn or other adverse event, there could be an adverse impact on our comparable store sales, net sales and profitability and our ability to implement our planned expansion program. Several of our larger competitors operate stores nationwide and thus are not as vulnerable as we are to these risks. In addition, our net sales depend on discretionary consumer spending, which may decrease on a regional basis due to a number of factors beyond our control, including unfavorable economic conditions, increases in consumer debt levels, unemployment or inflation, or other factors that adversely affect consumer confidence.
Any failure of our information technology infrastructure or management information systems, could cause a disruption in our business and our results of operations could be materially adversely impacted.
Our ability to operate our business from day to day largely depends on the efficient operation of our information technology infrastructure and management information systems. We use our management information systems to conduct our operations and for critical corporate and business planning functions, including store operations, sales management, merchandising, marketing, supply chain and inventory management, financial reporting and accounting, delivery and other customer services and various administrative functions. Any failure that is not covered by our disaster recovery plan could cause an interruption in our operations and adversely affect our results of operations.
We are subject to certain statutory, regulatory and legal developments which could have a material adverse impact on our business.
Our statutory, regulatory and legal environment exposes us to complex compliance and litigation risks that could materially adversely affect our operations and financial results. The most significant compliance and litigation risks we face are:
| • | The difficulty of complying with sometimes conflicting statutes and regulations in local, state and national jurisdictions; |
| • | The impact of proposed, new or changing statues and regulations, including, but not limited to, financial reform, environmental, labor reform, health care reform, corporate governance matters and/or other as yet unknown legislation that could affect how we operate and execute our strategies as well as alter our expense structure; |
| • | The impact of changes in tax laws (or interpretations thereof by courts and taxing authorities) and accounting standards; |
| • | The impact of litigation trends, including class action lawsuits involving consumers and stockholders, and labor and employment matters; and |
| • | Changes in trade regulations, currency fluctuations, economic or political instability, natural disasters, public health emergencies and other factors beyond our control may increase the cost of items we purchase or create shortages of these items, which in turn could have a material adverse effect on our cost of goods, or may force us to increase prices, thereby adversely impacting net sales and profitability. |
18
Table of Contents
Adapting to regulatory changes and defending against lawsuits and other proceedings may involve significant expense and divert management’s attention and resources from other matters which could adversely affect our results of operations.
We have significant future capital needs that we may be unable to fund and this failure could curtail our projected growth.
Our expansion plans will require substantial capital, including funds for capital expenditures, pre-opening costs, working capital requirements and initial operating losses related to new store openings. We also require additional capital for remodeling and renovating our existing stores and continuous management information systems updates. Net capital expenditures during fiscal 2012 were $81.4 million. If the cash provided by operating activities, available borrowings under our revolving credit facility and proceeds from sale and leaseback transactions are not sufficient to fund our operations, store expansion and renovation activities and infrastructure and information technology investment, we may be required to seek additional capital. If we are not able to obtain such additional financing on favorable terms, we may need to curtail our expansion plans and defer some or all of the upgrade of our management information systems.
Our quarterly results fluctuate due to seasonal demand for our products and if we miscalculate this demand our net sales and profitability could decline.
We experience seasonal fluctuations in our net sales and operating results due in part to seasonal shopping patterns. For example, in fiscal 2012 and 2011, we generated 33.2% and 30.0%, respectively, of our net sales in the fiscal quarter ended December 31, which includes the holiday selling season. We also incur significant additional costs and expenses during this fiscal quarter due to increased staffing levels and higher purchase volumes. If we miscalculate the demand for our products generally or for our product mix during the fiscal quarter ending December 31, our net sales could decline, resulting in excess inventory, which could tie up our working capital and revolving credit facility, as well as lower our profit margin as a result of product markdowns. A shortfall in expected net sales, combined with significant additional expenses during the fiscal quarter ended December 31, could cause a significant decline in our operating results.
If we are unable to retain key management, we could have difficulty implementing our business strategy, which may result in reduced net sales, operating margins and profitability.
We are dependent on the skills, experience and continued service of our senior management. We have employment agreements with these key officers which include secrecy, non-competition and other customary provisions. If members of senior management cease to be active in the management of our business or decide to join a competitor or otherwise compete directly or indirectly with us, our business and operations could be harmed, and we could have difficulty in implementing our strategy, which may result in reduced net sales, operating margins and profitability.
Our executive officers, directors and stockholders affiliated with our directors own a large percentage of our voting common stock and could limit the influence of our other stockholders on corporate decisions.
Our executive officers, directors, current holders of more than 5% of our outstanding common stock and their respective affiliates beneficially own, in the aggregate, approximately 50.0% of our outstanding common stock. Should some of these stockholders act together, they would be able to control all matters requiring approval by our stockholders, including mergers, sales of assets, the election of directors or other significant corporate transactions. The interests of these stockholders may not always coincide with our corporate interests or the interests of our other stockholders, and they may act in a manner with which our other stockholders may not agree or that may not be in the best interests of our other stockholders.
19
Table of Contents
We may be subject to periodic litigation and other regulatory proceedings. These proceedings may be affected by changes in laws and government regulations or changes in the enforcement thereof.
We are involved in a number of legal proceedings that arise from time to time in the ordinary course of business. Litigation is inherently unpredictable, and the outcome of some of these proceedings and other contingencies could require us to take or refrain from taking action which, in either case, could adversely affect our operations or reduce our net income. Additionally, defending against these lawsuits and proceedings may involve significant expense and diversion of management’s attention and resources from other matters.
We have anti-takeover defense provisions in our certificate of incorporation and bylaws that may deter potential acquirers and depress the price of our common stock.
Our certificate of incorporation and bylaws contain provisions that could have the effect of making it more difficult for a third party to acquire, or of discouraging a third party from attempting to acquire, control of us. These provisions:
| • | authorize our board of directors to issue “blank check” preferred stock and determine the powers, preferences and privileges of those shares without prior stockholder approval; |
| • | limit the calling of special meetings of stockholders; and |
| • | impose a requirement that an affirmative vote of the holders of 66 2/3% of the outstanding shares of common stock is required to amend certain provisions of the certificate of incorporation and bylaws. |
Under these various provisions in our certificate of incorporation, bylaws, a takeover attempt or third-party acquisition of us, including a takeover attempt that may result in a premium over the market price for shares of our common stock, could be delayed, deterred or prevented. In addition, these provisions may prevent the market price of our common stock from increasing in response to actual or rumored takeover attempts and may also prevent changes in our management. As a result, these anti-takeover and change of control provisions may limit the price investors are willing to pay in the future for shares of our common stock.
20
Table of Contents
| ITEM 1B. | Unresolved Staff Comments. |
None.
| ITEM 2. | Properties. |
Stores and Store Operations
Operations. Our store operations are organized into 27 geographic regions. Each region is supervised by a regional manager who monitors store operations and meets regularly with store managers to discuss merchandising, new product introductions, sales promotions, customer feedback and store operating performance. A store is typically overseen by a general manager, two sales managers and a staff averaging 20 salespeople and 10 additional support staff. Our stores are open seven days and six nights a week.
Locations. As of March 31, 2012, we leased all of our stores and distribution centers, which are located in Alabama, Delaware, Florida, Georgia, Illinois, Indiana, Kentucky, Maryland, Mississippi, New Jersey, North Carolina, Ohio, Pennsylvania, South Carolina, Tennessee and Virginia. Our stores average approximately 33,000 square feet. We also lease our corporate headquarters which is located in Indianapolis, Indiana. Our corporate headquarters includes a store, corporate training center, regional distribution and warehousing facility, and corporate call center. Our distribution and warehousing system consists of five regional distribution centers, or RDCs, and twelve local distribution centers, or LDCs. For a description of our RDCs and LDCs, see “Item 1. Business-Distribution and Warehousing.”
The following table sets forth our store locations:
| State |
Stores Opened at March 31, 2011 |
Store Openings |
Store Closures |
Stores Opened at March 31, 2012 |
||||||||||||
| Alabama |
5 | 1 | — | 6 | ||||||||||||
| Delaware |
3 | — | — | 3 | ||||||||||||
| Florida |
23 | 11 | — | 34 | ||||||||||||
| Georgia |
15 | — | — | 15 | ||||||||||||
| Illinois |
— | 15 | — | 15 | ||||||||||||
| Indiana |
17 | 1 | — | 18 | ||||||||||||
| Kentucky |
6 | — | — | 6 | ||||||||||||
| Maryland |
11 | — | — | 11 | ||||||||||||
| Mississippi |
1 | — | — | 1 | ||||||||||||
| New Jersey |
3 | — | — | 3 | ||||||||||||
| North Carolina |
17 | — | — | 17 | ||||||||||||
| Ohio |
26 | 2 | — | 28 | ||||||||||||
| Pennsylvania |
14 | 4 | — | 18 | ||||||||||||
| South Carolina |
6 | 1 | — | 7 | ||||||||||||
| Tennessee |
11 | — | — | 11 | ||||||||||||
| Virginia |
15 | — | — | 15 | ||||||||||||
|
|
|
|
|
|
|
|
|
|||||||||
| 173 | 35 | — | 208 | |||||||||||||
|
|
|
|
|
|
|
|
|
|||||||||
Market and Site Selection. We target markets that meet our demographic and competitive criteria, including areas that demonstrate above average economic growth and household incomes, and home ownership rates. Our target markets typically include most or all of our major competitors. When considering new sites, we analyze total store and market potential and advertising and occupancy costs for a market, as well as proximity to distribution facilities. Within our markets, we open or acquire our stores in power centers or freestanding locations in high traffic areas, usually near our major competitors. Primary site evaluation criteria include total sales volume potential, co-tenancies, traffic patterns, visibility, access, parking availability and occupancy costs.
21
Table of Contents
We initially open multiple stores in a new market and add stores to the market over time to increase market share and improve the leverage of our fixed costs. We plan to continue to open or acquire stores in new and existing markets.
Store Development. In the past five years, we have successfully entered 14 new metropolitan markets, most recently in Chicago, Illinois and Miami, Florida. Historically, we have been able to locate and open stores profitably in a wide variety of trade areas by negotiating lease terms that we believe are favorable. Approximately 12 to 18 months are required for site approval, lease negotiation, property build out, the hiring and training of associates and the stocking of inventory before the opening of a store. This timeframe can be reduced to six to nine months when no new property build-out is required. In fiscal 2013, we plan to open 20 to 22 new stores, predominately in the markets of St. Louis, Missouri and Milwaukee, Wisconsin.
We generally lease new stores through build-to-suit arrangements, whereby a landlord develops a building shell for long-term rental to us. This strategy significantly reduces our capital outlay for new store construction by limiting our capital outlay to furniture, fixtures and equipment. Additionally, we occasionally execute a sale and leaseback on stores not developed through a build-to-suit program. Through this sale and leaseback process, in which the land, building and/or leasehold improvements are sold to a third party and leased back to us on a single tenant basis, much of the construction cost associated with a new store can be deferred and recognized over a long-term rental period, which is generally 10 to 15 years.
22
Table of Contents
| ITEM 3. | Legal Proceedings. |
We are engaged in various legal proceedings in the ordinary course of business and have certain unresolved claims pending. Although we diligently defend against these claims, we may enter into discussions regarding settlement of these and other lawsuits and may enter into settlement agreements, if we believe settlement is in the best interests of our company and our stockholders. The ultimate liability, if any, for the aggregate amounts claimed cannot be determined at this time. However, management believes, based on the examination of these matters and experiences to date, that the ultimate liability, if any, in excess of amounts already provided for in the consolidated financial statements is not likely to have a material effect on our consolidated financial position, results of operations or cash flows.
| ITEM 4. | Mine Safety Disclosures. |
Not applicable.
23
Table of Contents
| ITEM 5. | Market for Registrant’s Common Equity, Related Stockholder Matters and Issuer Purchases of Equity Securities. |
Our common stock is traded on the New York Stock Exchange under the ticker symbol HGG. The table below sets forth the high and low sales prices of our common stock as reported on the New York Stock Exchange — Composite Index during the periods indicated.
| Stock Price | ||||||||
| High | Low | |||||||
| Fiscal 2012 |
||||||||
| Fourth Quarter |
$ | 13.81 | $ | 10.03 | ||||
| Third Quarter |
16.45 | 9.48 | ||||||
| Second Quarter |
13.64 | 9.75 | ||||||
| First Quarter |
15.47 | 12.02 | ||||||
| Fiscal 2011 |
||||||||
| Fourth Quarter |
$ | 21.97 | $ | 13.16 | ||||
| Third Quarter |
26.03 | 20.95 | ||||||
| Second Quarter |
25.00 | 18.90 | ||||||
| First Quarter |
30.22 | 23.32 | ||||||
We did not pay cash dividends on our common stock during the last two fiscal years and do not expect to pay cash dividends in the near future. In addition, the terms of our credit facilities place restrictions on our ability to pay dividends and otherwise transfer assets to our stockholders. See “Item 7. Management’s Discussion and Analysis of Financial Condition and Results of Operations-Liquidity and Capital Resources”. As of April 30, 2012, there were 76 holders of record of our common stock (which does not include the number of individual beneficial owners whose shares were held on their behalf by brokerage firms in street name).
24
Table of Contents
hhgregg Stock Comparative Performance Graph
The information contained in this hhgregg Stock Comparative Performance Graph section shall not be deemed to be “soliciting material” or “filed” or incorporated by reference in future filings with the SEC, or subject to the liabilities of Section 18 of the Exchange Act, except to the extent that we specifically incorporate it by reference into a document filed under the Securities Act of 1933 or the Exchange Act.
The graph below compares the cumulative total stockholder return on hhgregg common stock from the initial public offering (IPO) date of July 19, 2007 through March 31, 2012 with the cumulative total return on the Standard & Poor’s 500 Index (S&P 500), and the Standard & Poor’s Retail Index (S&P Retail Index).
The graph assumes an investment of $100 at the close of trading on July 19, 2007, the hhgregg IPO date, in hhgregg common stock, the S&P 500 and the S&P Retail Index and reinvestment of any dividends. The comparison in the graph below is based solely on historical data and is not intended to forecast the possible future performance of our common stock.
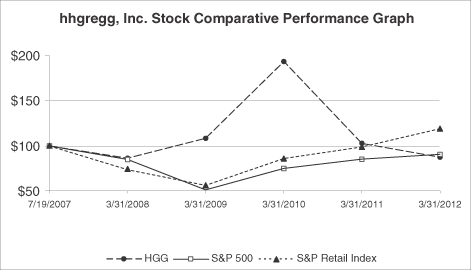
| July 19, 2007 | March 31, 2008 | March 31, 2009 | March 31, 2010 | March 31, 2011 | March 31, 2012 | |||||||||||||||||||
| hhgregg, Inc. |
100 | 86.54 | 108.81 | 194.15 | 103.00 | 87.54 | ||||||||||||||||||
| S&P 500 |
100 | 85.17 | 51.38 | 75.30 | 85.37 | 90.69 | ||||||||||||||||||
| S&P Retail Index |
100 | 73.72 | 56.24 | 86.14 | 98.97 | 119.20 | ||||||||||||||||||
25
Table of Contents
| ITEM 6. | Selected Financial Data. |
The following table sets forth our selected historical consolidated financial data and store operating information as of the dates and for the periods indicated. The selected historical consolidated statement of income and balance sheet data as of and for each of the fiscal years ended March 31, 2012, 2011, 2010, 2009 and 2008 are derived from, and are qualified in their entirety by, our historical audited consolidated financial statements. Historical results are not necessarily indicative of the results to be expected in the future. You should read the following data together with “Business,” “Management’s Discussion and Analysis of Financial Condition and Results of Operations” and our historical consolidated financial statements and the related notes. In the following tables (including the footnotes thereto), dollars are in thousands, except share and per share data and as otherwise indicated. We have not declared cash dividends for the periods indicated below.
| Fiscal Year Ended March 31, | ||||||||||||||||||||
| 2012 (2) | 2011 (1)(2) | 2010 (1) | 2009 (2) | 2008 (1) | ||||||||||||||||
| Statement of Income Data: |
||||||||||||||||||||
| Net sales |
$ | 2,493,392 | $ | 2,077,651 | $ | 1,534,253 | $ | 1,396,678 | $ | 1,256,666 | ||||||||||
| Gross profit |
720,388 | 629,760 | 466,941 | 435,108 | 388,933 | |||||||||||||||
| Income from operations (9) |
109,800 | 86,271 | 68,791 | 69,643 | 68,317 | |||||||||||||||
| Net income (9) |
$ | 81,373 | $ | 48,208 | $ | 39,198 | $ | 36,497 | $ | 21,406 | ||||||||||
| Share and Per Share Data: |
||||||||||||||||||||
| Weighted average shares outstanding |
||||||||||||||||||||
| Basic |
37,749,354 | 39,394,708 | 36,649,515 | 32,391,392 | 31,130,680 | |||||||||||||||
| Diluted |
38,079,685 | 40,368,223 | 37,990,208 | 33,063,511 | 32,188,984 | |||||||||||||||
| Net income per share |
||||||||||||||||||||
|
Basic (3) |
$ | 2.16 | $ | 1.22 | $ | 1.07 | $ | 1.13 | $ | 0.69 | ||||||||||
| Diluted (4) |
$ | 2.14 | $ | 1.19 | $ | 1.03 | $ | 1.10 | $ | 0.67 | ||||||||||
| Cash Flow Data: |
||||||||||||||||||||
| Net capital expenditures (5) |
$ | 81,429 | $ | 59,938 | $ | 58,510 | $ | 21,117 | $ | 34,915 | ||||||||||
| Operating Statistics: |
||||||||||||||||||||
| Gross profit (as a percentage of net sales) |
28.9 | % | 30.3 | % | 30.4 | % | 31.2 | % | 30.9 | % | ||||||||||
| Income from operations (as a percentage of net sales) (9) |
4.4 | % | 4.2 | % | 4.5 | % | 5.0 | % | 5.4 | % | ||||||||||
| Working capital (as a percentage of net sales) (6) |
7.4 | % | 7.7 | % | 12.0 | % | 5.1 | % | 2.1 | % | ||||||||||
| Number of stores, end of period |
208 | 173 | 131 | 110 | 91 | |||||||||||||||
| Total store square footage (in thousands) |
6,772 | 5,737 | 4,403 | 3,698 | 3,127 | |||||||||||||||
| Comparable store sales (decrease) increase (7) |
(1.1 | )% | (4.0 | )% | (6.6 | )% | (8.3 | )% | 4.8 | % | ||||||||||
| Inventory turnover (8) |
7.2x | 7.0x | 6.2x | 7.0x | 7.0x | |||||||||||||||
| Balance Sheet Data: |
||||||||||||||||||||
| Cash and cash equivalents |
$ | 59,244 | $ | 72,794 | $ | 157,837 | $ | 21,496 | $ | 1,869 | ||||||||||
| Total assets |
642,784 | 549,645 | 605,919 | 350,375 | 329,919 | |||||||||||||||
| Total debt, including current portion |
— | — | 88,341 | 92,608 | 92,608 | |||||||||||||||
| Stockholders’ equity |
359,520 | 316,586 | 253,408 | 125,153 | 81,674 | |||||||||||||||
| (1) | Fiscal 2011, fiscal 2010 and fiscal 2008 net income includes losses related to the early extinguishment of debt of $2.1 million, $0.1 million and $21.9 million, respectively. Please refer to footnote 5 of the notes to our audited consolidated financial statements included elsewhere herein for a discussion of the fiscal 2011 and fiscal 2010 amounts. |
26
Table of Contents
| (2) | Fiscal 2012, fiscal 2011 and fiscal 2009 net income includes $0.8 million, $0.1 million and $0.6 million of asset impairment charges, respectively. Impairment charges were related to specific stores where the expected future cash flows were less than the carrying amount of the property. Please refer to footnote 1(i) of the notes to our audited consolidated financial statements included elsewhere herein for a discussion of the impairment charges for fiscal 2012 and fiscal 2011. |
| (3) | Basic net income per share is calculated by dividing net income by the weighted-average number of common shares outstanding. |
| (4) | Diluted net income per share is calculated by dividing net income by the weighted-average number of common shares outstanding adjusted by the number of additional shares that would have been outstanding had the potentially dilutive common shares from outstanding options and restricted stock units been issued. |
| (5) | Represents the capital expenditures offset by the proceeds and deposits received from sale leaseback transactions. |
| (6) | Working capital represents current assets excluding customer deposits and the current portion of deferred income taxes less current liabilities as of the end of the respective fiscal year-end, expressed as a percentage of net sales. |
| (7) | Comprised of net sales at stores operating for at least 14 full months, including remodeled and relocated locations and our website. |
| (8) | Inventory turnover for the specified period is calculated by dividing our cost of goods sold for the fiscal year by the average of the beginning and ending inventory for that period. |
| (9) | Fiscal 2012 net income and income from operations include $40.0 million of life insurance proceeds. |
27
Table of Contents
| ITEM 7. | Management’s Discussion and Analysis of Financial Condition and Results of Operations. |
You should read this discussion and analysis of our financial condition and results of operations in conjunction with our “Selected Historical Consolidated Financial and Other Data,” and our consolidated financial statements and related notes appearing elsewhere in this report. Some of the statements in the following discussion are forward-looking statements. See “Risk Factors” and “Cautionary Note Regarding Forward-Looking Statements.”
Management’s Discussion and Analysis of Financial Condition and Results of Operations (MD&A) is designed to provide a reader of our financial statements with a narrative from the perspective of our management on our financial condition, results of operations, liquidity and certain other factors that may affect our future results. Our MD&A is presented in seven sections:
| • | Overview |
| • | Critical Accounting Estimates |
| • | Results of Operations |
| • | Liquidity and Capital Resources |
| • | Impact of Inflation |
| • | Contractual Obligations |
| • | Off Balance Sheet Items |
Overview
We are a specialty retailer of home appliances, televisions, computers, consumer electronics, mattresses and related services operating under the name hhgregg™. As of March 31, 2012, we operated 208 stores in Alabama, Delaware, Florida, Georgia, Illinois, Indiana, Kentucky, Maryland, Mississippi, New Jersey, North Carolina, Ohio, Pennsylvania, South Carolina, Tennessee and Virginia.
hhgregg, Inc. was formed in Delaware on April 12, 2007. As part of a corporate reorganization effected on July 19, 2007, the stockholders of Gregg Appliances contributed all of their shares of Gregg Appliances to hhgregg in exchange for common stock of hhgregg. As a result, Gregg Appliances became a wholly-owned subsidiary of hhgregg.
This overview section is divided into four sub-sections discussing our operating strategy and performance, store development strategy, business strategy and core philosophies and seasonality.
Operating Strategy and Performance. We focus the majority of our floor space, advertising expense and distribution infrastructure on the marketing, delivery and installation of a wide selection of premium video and appliance products. We display approximately 100 models of flat panel televisions and 350 major appliances in our stores with an especially broad assortment of models in the middle- to upper-end of product price ranges. Video and appliance net sales comprised 80% and 82% of our net sales mix in fiscal 2012 and 2011, respectively.
We strive to differentiate ourselves through our customer purchase experience starting with a highly-trained, consultative commissioned sales force which educates our customers on the features and benefits of our products, followed by rapid product delivery and installation, and ending with helpful post-sales support services. We carefully monitor our competition to ensure that our prices are competitive in the market place. Our experience has been that informed customers often choose to buy a more heavily-featured product once they understand the applicability and benefits of its features. Heavily-featured products typically carry higher average selling prices and higher margins than less-featured, entry-level price point products.
28
Table of Contents
During fiscal 2012, we implemented several initiatives designed to better position our business to drive additional traffic and increase sales in our comparable store base. The first initiative was to grow our appliance market share. We restructured our in-store management team to include an appliance sales manager and a dedicated consumer electronics manager in lieu of a sales manager and an operations manager. The appliance manager focuses on the appliance and bedding categories, increasing management focus and ensuring a superior customer purchase experience. We expect to continue our increased marketing efforts in the appliance category with more appliance specific marketing messaging.
Our second initiative was the development of our computing and mobile phones category. This category previously included computers and tablets, and was expanded to include mobile phones in the second quarter of fiscal 2012. The development of our mobile phone business included the integration of all of the Verizon Cellular Connection kiosks located within each of our stores into our internal operations. The transition took place on August 28, 2011. In addition to mobile phones, we have expanded and will continue to expand our assortment of computers, tablets, peripherals and computer service offerings.
Our third initiative for fiscal 2012 was the launch of our redesigned website. During the second quarter of fiscal 2012, we launched our new website which offers an updated look and feel, in addition to significant functionality enhancements. This increased functionality includes options to buy our products online and pick up in store and the ability to ship products bought online directly to consumers from store locations. Our new website design provides an enhanced purchase experience for our online customers and enhances our multi-channel retail strategy.
We also launched a new advertising campaign, “We Help,” which focuses on our commitment to educating consumers and helping them to complete their purchase experience with the right product at a great price. This campaign seeks to increase brand awareness among consumers and set us apart from our competitors.
The following table summarizes certain operating data that we believe are important to an understanding of our operating model:
| Fiscal Year Ended March 31, | ||||||||||||
| 2012 | 2011 | 2010 | ||||||||||
| Inventory turnover (1) |
7.2 | x | 7.0 | x | 6.2 | x | ||||||
| Working capital (as a percentage of net sales) (2) |
7.4 | % | 7.7 | % | 12.0 | % | ||||||
| Net capital expenditures (as a percentage of net sales) (3) |
3.3 | % | 2.9 | % | 3.8 | % | ||||||
| Income from operations (as a percentage of net sales) (4) |
4.4 | % | 4.2 | % | 4.5 | % | ||||||
| (1) | Inventory turnover for the specified period is calculated by dividing our cost of goods sold for the fiscal year by the average of the beginning and ending inventory for that period. |
| (2) | Working capital represents current assets excluding customer deposits and the current portion of deferred income taxes less current liabilities as of the end of the respective fiscal year-end, expressed as a percentage of net sales. |
| (3) | Net capital expenditures represent capital expenditures less proceeds and deposits from sale and leaseback transactions, expressed as a percentage of net sales. |
| (4) | For the fiscal year ended March 31, 2012, income from operations includes $40.0 million of life insurance proceeds. |
We focus on leveraging our semi-fixed expenditures in advertising, distribution and regional management through closely managing our inventory, working capital and store development expenditures. Our inventory has averaged 6.8 turns per year over the past three fiscal years. Our working capital, expressed as a percentage of net sales, has averaged 8.7% over the past three fiscal years. Our net capital expenditures, measured as a percentage of net sales, have averaged 3.3% over the past three fiscal years.
29
Table of Contents
Store Development Strategy. Over the past several years, we have adhered closely to a development strategy of adding stores to metropolitan markets in clusters to achieve rapid market share penetration and more efficiently leverage our distribution network, advertising and regional management costs. Our expansion plans include looking for new markets where we believe there is significant underlying demand for stores, typically in areas that demonstrate above-average economic growth, strong household incomes and growth in new housing starts and/or remodeling activity. Our markets typically include most or all of our major competitors. We plan to continue to follow our approach of building store density in each major market and distribution area, which in the past has helped us to improve our market share and realize operating efficiencies.
During fiscal 2012, we opened a net total of 35 stores all of which were opened in new markets. The new markets included Chicago, Illinois; Miami, Florida and Pittsburgh, Pennsylvania. During the past 12 months, we also opened a new regional distribution center in Aurora, Illinois and a new local distribution center in Pembroke Park, Florida to support our growth plans. Our intention is to open between 20 and 22 new stores during fiscal 2013. The majority of these store openings are expected to be in new markets, including St. Louis, Missouri; Milwaukee, Wisconsin and other locations in Illinois.
Business Strategy and Core Philosophies. Our business strategy is focused around offering our customers a superior customer purchase experience. From the time the customers walk in the door, they will experience a well-designed, customer friendly store. Our stores are brightly lit and have clearly distinguished departments that allow our customers to find what they are looking for. We greet and assist our customers with our highly trained consultative sales force, who are there to educate customers about different product features.
Our products are rich in features and innovations and are ever-changing. We believe that customers find it helpful to have someone explain the features and benefits of our products. We believe this assistance gives our customers the opportunity to buy the product that most closely matches their needs. We follow up on the customer purchase experience by offering next-day delivery on many of our products and high quality, in-home installation service.
While many of our product offerings are considered essential items by our customers, other products and certain features are viewed as discretionary purchases. As a result, our results of operations are susceptible to a challenging macro-economic environment. Factors such as changes in consumer confidence, unemployment, consumer credit availability and the condition of the housing market have negatively impacted our core product categories and added volatility to our overall business. As consumers show a more cautious approach to purchases of discretionary items, customer traffic and spending patterns continue to be difficult to predict.
The consumer electronics industry depends on new products to drive sales and profitability. Innovative, heavily-featured products are typically introduced at relatively high price points. Over time, price points are gradually reduced to drive consumption. Accordingly, there has been price compression in flat panel televisions for equivalent screen sizes over the past few years. According to the NPD Group, the prices of flat panel televisions in the industry have fallen more than 50% since January 2008. As with similar product life cycles for console televisions, DVD players and large-screen projection televisions, we have responded to this risk by shifting our sales mix to focus on newer, higher margin televisions that feature IPTV technology, with an increased focus on selection and larger screen sizes. In addition to declining average selling prices, promotional activity within the video category has resulted in a reduction in the gross profit margin rate for the category. Management expects the year over year gross profit rate pressure to continue through the first half of fiscal 2013. In addition to our shift in television sales mix, we have also added an increased selection of computers and tablets to our product assortment, and placed a focus on the development of our computing and mobile phones category. However, lower than expected demand and pricing pressures could result in price points for heavily-featured items declining more quickly, and to a greater extent, than we have historically experienced. In addition to declining average selling prices, promotional activity within the consumer electronics industry could result in a reduction in the gross profit margin rate for these product categories.
30
Table of Contents
Retail appliance sales are highly correlated to the housing industry and housing turnover. As more people purchase existing homes in the market, appliance sales tend to trend upward. Conversely, when demand in the housing market declines, appliance sales traffic is also negatively impacted. The appliance industry has benefited greatly from increased innovation in energy efficient products. While these energy efficient products typically carry a higher average selling price than traditional products, they save the consumer significant dollars in annual energy savings. Average unit selling prices of major appliances are not expected to change dramatically in the foreseeable future.
Seasonality. We experience seasonal fluctuations in our net sales and operating results due in part to seasonal shopping patterns. For example, in fiscal 2012 and 2011, we generated 33.2% and 30.0%, respectively, of our net sales in the fiscal quarter ended December 31, which includes the holiday selling season. We also incur significant additional costs and expenses during the fiscal quarter ended December 31 due to increased staffing levels and higher purchase volumes. Appliance revenue is impacted by seasonal weather patterns but is less seasonal than our electronics business and helps to offset the seasonality of our overall business.
Critical Accounting Estimates
Our consolidated financial statements are prepared in accordance with U.S. Generally Accepted Accounting Principles (“U.S. GAAP”). In connection with the preparation of our consolidated financial statements, we are required to make assumptions and estimates about future events, and apply judgments that affect the reported amounts of assets, liabilities, revenue, expenses and the related disclosures. We base our assumptions, estimates and judgments on historical experience, current trends and other factors that management believes to be relevant at the time our consolidated financial statements are prepared. On a regular basis, management reviews the accounting policies, assumptions, estimates and judgments to ensure that our consolidated financial statements are presented fairly and in accordance with U.S. GAAP. However, because future events and their effects cannot be determined with certainty, actual results could differ from our assumptions and estimates, and such differences could be material.
Our significant accounting policies are discussed in Note 1, Summary of Significant Accounting Policies, of the notes to our consolidated financial statements, included in Item 8, Financial Statements and Supplementary Data, of this Annual Report on Form 10-K. Management believes that the following accounting estimates are the most critical to aid in fully understanding and evaluating our reported financial results, and they require management’s most difficult, subjective or complex judgments, resulting from the need to make estimates about the effect of matters that are inherently uncertain. Management has reviewed these critical accounting estimates and related disclosures with the Audit Committee of our Board.
Vendor Allowances
We receive funds from our vendors for various programs including volume purchase rebates, marketing support, inventory markdowns, margin protection, product training and sales incentives. Vendor allowances provided as a reimbursement of specific, incremental and identifiable costs incurred to promote a vendor’s products are included as an expense reduction when the cost is incurred. All other vendor allowances are initially deferred and recorded as a reduction of merchandise inventories. The deferred amounts are then included as a reduction of cost of goods sold when the related product is sold.
We have two primary types of vendor allowances that do not represent reimbursements of specific, incremental and identifiable costs. The first type of allowance is calculated based on a specific percentage of our purchases. The percentage is not dependent on any monthly, quarterly or annual purchase volumes or any other performance terms with our vendors. Additionally, these allowances are deducted directly from the amounts we owe to the vendor for the product. For this type of vendor allowance, we record inventory at net cost (i.e. invoice cost less vendor allowance) at the time of receipt.
31
Table of Contents
The second type of vendor allowance is based on the satisfaction of certain terms of the vendor program. We determine the amount of the accrued vendor allowance by estimating the point at which we will have completed our performance under the program and estimate the earned allowance at the balance sheet date using the rates negotiated with our vendors and actual purchase volumes to date.
During the year, due to complexity and diversity of the individual vendor programs, we perform analyses and review historical trends to ensure the amounts earned are appropriately recorded. Amounts accrued throughout the year could be impacted if actual purchase volumes differ from projected purchase volumes. Additionally, on a monthly basis we review the collectability of the accrued vendor allowances and adjust for any valuation concerns.
We have not made any material changes in the accounting methodology used to record vendor allowances in the past three fiscal years.
We do not believe there is a reasonable likelihood that there will be a material change in the future estimates or assumptions we use to calculate our vendor allowances. If actual results are not consistent with the assumptions and estimates used, we may be exposed to additional adjustments that could materially impact, positively or negatively, our gross margin and inventory. However, substantially all vendor allowance receivables and deferrals outstanding at year end are collected and recognized within the following quarter, and therefore do not require subjective long-term estimates. Adjustments to gross margin and inventory in the following fiscal year have historically not been material. A 10% difference in our vendor allowance receivables at March 31, 2012, would have affected net earnings by approximately $0.6 million in fiscal 2012.
Inventory Reserves
We value our inventory at the lower of the cost of the inventory or fair market value through the establishment of markdown and inventory loss reserves. Our markdown reserve represents the excess of the carrying amount, typically average cost, over the amount we expect to realize from the ultimate sale or other disposal of the inventory. Markdowns establish a new cost basis for our inventory. Subsequent changes in facts or circumstances do not result in the restoration of previously recorded markdowns or an increase in the newly established cost basis.
Our markdown reserve contains uncertainties because the calculation requires management to make assumptions and to apply judgment regarding inventory aging, forecasted consumer demand, the promotional environment and technological obsolescence. We have not made any material changes in the accounting methodology used to establish our markdown reserve during the past three fiscal years.
We do not believe there is a reasonable likelihood that there will be a material change in the future estimates or assumptions we use to calculate our markdown reserve. However, if estimates regarding consumer demand are inaccurate or changes in technology affect demand for certain products in an unforeseen manner, we may be exposed to losses or gains that could be material. A 10% difference in our actual markdown reserve at March 31, 2012, would have affected net earnings by approximately $0.1 million in fiscal 2012.
Our inventory loss reserve represents anticipated physical inventory losses (e.g., theft) that have occurred since the last physical inventory date. Physical inventory counts are taken on a regular basis to ensure the inventory reported in our consolidated financial statements is properly stated. During the interim period between physical inventory counts, we reserve for anticipated physical inventory losses on a consolidated basis.
Our inventory loss reserve contains uncertainties because the calculation requires management to make assumptions and to apply judgment regarding a number of factors, including historical results and current inventory loss trends. We have not made any material changes in the accounting methodology used to establish our inventory loss reserve during the past three fiscal years.
32
Table of Contents
We do not believe there is a reasonable likelihood that there will be a material change in the future estimates or assumptions we use to calculate our inventory loss reserve. However, if our estimates regarding physical inventory losses are inaccurate, we may be exposed to losses or gains that could be material. A 10% difference in actual physical inventory losses reserved for at March 31, 2012, would have affected net earnings by less than $0.1 million in fiscal 2012.
Long-Lived Assets
Long-lived assets other than goodwill and indefinite-lived intangible assets, which are separately tested for impairment, are evaluated for impairment whenever events or changes in circumstances indicate that the carrying amount may not be recoverable.
When evaluating long-lived assets for potential impairment, we first compare the carrying amount of the asset or asset group to the asset’s or asset group’s estimated undiscounted future cash flows. If the estimated future cash flows are less than the carrying amount of the asset or asset group, we calculate an impairment loss. The impairment loss calculation compares the carrying amount of the asset or asset group to the asset’s or asset group’s estimated fair value, which may be based on estimated discounted future cash flows. We recognize an impairment loss if the amount of the asset’s or asset group’s carrying amount exceeds the asset’s or asset group’s estimated fair value. If we recognize an impairment loss, the adjusted carrying amount of the asset or asset group becomes its new cost basis. For a depreciable long-lived asset, the new cost basis will be depreciated (amortized) over the remaining useful life of that asset or asset group.
Our impairment loss calculations contain uncertainties because they require management to make assumptions and to apply judgment to estimate future cash flows and asset fair values, including forecasting useful lives of the assets and selecting the discount rate that reflects the risk inherent in future cash flows.
We have not made any material changes in our impairment loss assessment methodology during the past three fiscal years.
We do not believe there is a reasonable likelihood that there will be a material change in the estimates or assumptions we use to calculate long-lived asset impairment losses. However, if actual results are not consistent with our estimates and assumptions used in estimating future cash flows and asset fair values, we may be exposed to losses that could be material. For the fiscal year ended March 31, 2012, we recorded a pre-tax impairment loss of $0.8 million related to asset impairment of two of our retail locations. For the fiscal year ended March 31, 2011, we recorded a pre-tax impairment loss of $0.1 million related to asset impairment of one of our retail locations. There was no impairment recorded for the fiscal year ended March 31, 2010.
Accruals for Uncertain Tax Positions and Income Taxes
Accounting guidance on income taxes prescribes a recognition threshold and measurement attribute for the financial statement recognition and measurement of a tax position taken or expected to be taken in a tax return.
We are subject to U.S. federal and certain state and local income taxes. Our income tax returns, like those of most companies, are periodically audited by federal and state tax authorities. These audits include questions regarding our tax filing positions, including the timing and amount of deductions and the allocation of income among various tax jurisdictions. At any one time, multiple tax years are subject to audit by the various tax authorities. In evaluating the exposures associated with our various tax filing positions, we record a liability for more likely than not exposures. A number of years may elapse before a particular matter for which we have established a liability is audited and fully resolved or clarified. We adjust our liability for unrecognized tax benefits and income tax provision in the period in which an uncertain tax position is effectively settled, or the statute of limitations expires for the relevant taxing authority to examine the tax position or when more information becomes available.
33
Table of Contents
We use significant estimates that require management’s judgment in calculating our provision for income taxes. Significant judgment is required in evaluating our tax positions and determining our provision for income taxes. The objectives of accounting for income taxes are to recognize the amount of taxes payable or refundable for the current year and the deferred tax liabilities and assets for the future tax consequences of events that have been recognized in an entity’s financial statements or tax returns. Variations in the actual outcome of these future tax consequences could materially impact our consolidated financial position, results of operations, or cash flows.
Our effective income tax rate is also affected by changes in tax law, the tax jurisdiction of new stores or business ventures, the level of earnings and the results of tax audits. In assessing the recoverability of deferred tax assets, management considers whether it is more likely than not that some portion or all of the deferred tax assets will not be realized. The ultimate realization of deferred tax assets is dependent upon generation of future taxable income during the periods in which temporary differences become deductible. Management considers the scheduled reversal of deferred tax liabilities, projected future taxable income and tax planning strategies in making this assessment and ensuring that the deferred tax asset valuation allowance is adjusted as appropriate.
Although management believes that the judgments and estimates discussed herein are reasonable, actual results could differ, and we may be exposed to losses or gains that could be material.
To the extent we prevail in matters for which a liability has been established, or are required to pay amounts in excess of our established liability, our effective income tax rate in a given financial statement period could be materially affected. An unfavorable tax settlement generally would require use of our cash and may result in an increase in our effective income tax rate in the period of resolution. A favorable tax settlement may be recognized as a reduction in our effective income tax rate in the period of resolution. At March 31, 2012 and 2011, we had no liability for unrecognized tax benefits.
Revenue Recognition
We recognize revenue, net of estimated returns, at the time the customer takes possession of the merchandise or receives service. We honor returns from customers within 30 days from the date of sale and provide allowances for estimated returns based on historical experience.
We sell gift cards to our customers in our retail stores and online. We do not charge administrative fees on unused gift cards and our gift cards do not have an expiration date. We recognize revenue from gift cards when: (i) the gift card is redeemed by the customer or (ii) the likelihood of the gift card being redeemed by the customer is remote, which we refer to as gift card breakage, and we determine that we do not have a legal obligation to remit the value of unredeemed gift cards to the relevant jurisdictions. We determine our gift card breakage rate based on historical redemption patterns. Prior to fiscal 2011, we did not have historical data to estimate gift card breakage and thus did not recognize any gift card breakage in earnings. Breakage recognized was not material to our results of operations during fiscal 2012 or fiscal 2011 and would not have been material to our results of operations during fiscal 2010.
We sell premium service plans (“PSPs”) on appliance and electronic merchandise for periods ranging up to 10 years. For PSPs sold by us on behalf of a third party, the net commission revenue is recognized at the time of sale. We are not the primary obligor on PSPs sold on behalf of third parties. Funds received for PSPs in which we are the primary obligor are deferred and the incremental direct costs of selling the PSPs are capitalized and amortized on a straight-line basis over the term of the service agreement. Costs of services performed pursuant to the PSPs are expensed as incurred.
Our revenue recognition accounting methodology contains uncertainties because it requires management to make assumptions regarding and to apply judgment to estimate future sales returns. Our estimate of the amount and timing of sales returns is based primarily on historical transaction experience.
34
Table of Contents
We have not made any material changes in the accounting methodology used to measure sales returns or recognize revenue for PSPs sold during the past three fiscal years.
We do not believe there is a reasonable likelihood that there will be a material change in the future estimates or assumptions we use to measure sales returns or recognize revenue for our gift card program. However, if actual results are not consistent with our estimates or assumptions, we may be exposed to losses or gains that could be material.
A 10% change in our sales return reserve at March 31, 2012 would have affected net earnings by less than $0.1 million in fiscal 2012.
Self-Insured Liabilities
We are self-insured for certain losses related to workers’ compensation, medical insurance, general liability and motor vehicle insurance claims. However, we obtain third-party insurance coverage to limit our exposure to these claims.
The following table provides our stop loss coverage for the fiscal years ended March 31, 2012, 2011 and 2010 (in thousands):
| Fiscal Year ended March 31, | ||||||||||||
| 2012 | 2011 | 2010 | ||||||||||
| Workers’ Compensation — per occurrence |
$ | 300 | $ | 300 | $ | 300 | ||||||
| General Liability — per occurrence |
$ | 250 | $ | 250 | $ | 250 | ||||||
| Motor Vehicles — per occurrence |
$ | 100 | $ | 100 | $ | 100 | ||||||
| Medical Insurance — per participant, per year |
$ | 200 | $ | 200 | $ | 150 | ||||||
When estimating our self-insured liabilities, we consider a number of factors, including historical claims experience, demographic factors, severity factors and valuations provided by independent third-party actuaries. On a quarterly basis, management reviews its assumptions and the valuations provided by independent third-party actuaries to determine the adequacy of our self-insured liabilities.
Our self-insured liabilities contain uncertainties because management makes assumptions and applies judgment to estimate the ultimate cost to settle reported claims and claims incurred but not reported at the balance sheet date.
We have not made any material changes in the accounting methodology used to establish our self-insured liabilities during the past three fiscal years. We do not believe there is a reasonable likelihood that there will be a material change in the estimates or assumptions we use to calculate our self-insured liabilities. However, if actual results are not consistent with our estimates or assumptions, we may be exposed to losses or gains that could be material. A 10% change in our self-insured liabilities at March 31, 2012, would have affected net earnings by approximately $0.5 million in fiscal 2012.
35
Table of Contents
Results of Operations
Operating Performance. The following table presents selected consolidated financial data (dollars in thousands, except per share amounts):
| Twelve Months Ended March 31, | ||||||||||||
| 2012 | 2011 | 2010 | ||||||||||
| Net sales |
$ | 2,493,392 | $ | 2,077,651 | $ | 1,534,253 | ||||||
| Net sales % increase |
20.0 | % | 35.4 | % | 9.9 | % | ||||||
| Comparable store sales % decrease (1) |
(1.1 | )% | (4.0 | )% | (6.6 | )% | ||||||
| Gross profit as % of net sales |
28.9 | % | 30.3 | % | 30.4 | % | ||||||
| SG&A as % of net sales |
20.0 | % | 20.7 | % | 21.1 | % | ||||||
| Net advertising expense as a % of net sales |
4.7 | % | 4.2 | % | 3.8 | % | ||||||
| Depreciation and amortization expense as a % of net sales |
1.4 | % | 1.3 | % | 1.1 | % | ||||||
| Income from operations as a % of net sales |
4.4 | % | 4.2 | % | 4.5 | % | ||||||
| Net interest expense as a % of net sales |
0.1 | % | 0.2 | % | 0.3 | % | ||||||
| Loss related to early extinguishment of debt as a % of net sales |
0.0 | % | 0.1 | % | 0.0 | % | ||||||
| Net income |
$ | 81,373 | $ | 48,208 | $ | 39,198 | ||||||
| Net income per diluted share |
$ | 2.14 | $ | 1.19 | $ | 1.03 | ||||||
| Weighted average shares outstanding — diluted |
38,079,685 | 40,368,223 | 37,990,208 | |||||||||
| Number of stores open at the end of the period |
208 | 173 | 131 | |||||||||
| (1) | Comprised of net sales of stores in operation for at least 14 full months, including remodeled and relocated stores, as well as net sales for our website. |
Net income was $81.4 million, or $2.14 per diluted share, for fiscal 2012, compared with net income of $48.2 million, or $1.19 per diluted share, for fiscal 2011 and $39.2 million, or $1.03 per diluted share, for fiscal 2010. The increase in net income for fiscal 2012 as compared to fiscal 2011 was the result of the receipt of $40.0 million of life insurance proceeds and a 20.0% increase in net sales due to the net addition of 35 stores during the past 12 months, offset by a comparable store sales decrease of 1.1%, a decrease in gross profit as a percentage of net sales and an increase in net advertising as a percentage of net sales. The increase in net income for fiscal 2011 as compared to fiscal 2010 was the result of a 35.4% increase in net sales due to the net addition of 42 stores during fiscal 2011 and a decrease in SG&A as a percentage of net sales, offset by an increase in net advertising expense as a percentage of net sales, a comparable store sales decrease of 4.0%, and a charge for a loss related to early extinguishment of debt.
Net sales increased 20.0% in fiscal 2012 to $2.5 billion from $2.1 billion in fiscal 2011. Net sales for fiscal 2011 increased 35.4% to $2.1 billion from $1.5 billion for fiscal 2010. The increase in net sales for fiscal 2012 was primarily attributable to the net addition of 35 stores during fiscal 2012 partially offset by a 1.1% decrease in comparable store sales. The increase in sales for fiscal 2011 was primarily attributable to the net addition of 42 stores during fiscal 2011 partially offset by a 4.0% decrease in comparable store sales.
36
Table of Contents
Net sales mix and comparable store sales percentage changes by product category for fiscal 2012, 2011 and 2010, respectively, were as follows:
| Net Sales Mix Summary | Comparable Store Sales Summary | |||||||||||||||||||||||
| Twelve Months Ended March 31, | Twelve Months Ended March 31, | |||||||||||||||||||||||
| 2012 | 2011 | 2010 | 2012 | 2011 | 2010 | |||||||||||||||||||
| Video |
43 | % | 46 | % | 47 | % | (8.7 | )% | (6.3 | )% | (12.3 | )% | ||||||||||||
| Appliances |
37 | % | 36 | % | 35 | % | 3.0 | % | (0.2 | )% | (3.9 | )% | ||||||||||||
| Computing and mobile phones (1) |
9 | % | 6 | % | 4 | % | 52.9 | % | 21.6 | % | 92.9 | % | ||||||||||||
| Other (2) |
11 | % | 12 | % | 14 | % | (9.2 | )% | (14.2 | )% | (6.4 | )% | ||||||||||||
|
|
|
|
|
|
|
|
|
|
|
|
|
|||||||||||||
| Total |
100 | % | 100 | % | 100 | % | (1.1 | )% | (4.0 | )% | (6.6 | )% | ||||||||||||
|
|
|
|
|
|
|
|
|
|
|
|
|
|||||||||||||
| (1) | Primarily consists of computers, mobile phones and tablets. |
| (2) | Primarily consists of audio, furniture and accessories, mattresses and personal electronics. |
Fiscal Year Ended March 31, 2012 Compared to Fiscal Year Ended March 31, 2011
Our 1.1% comparable store sales decrease for the 12 months ended March 31, 2012 was primarily driven by the 8.7% decrease in the video category, which was to the result of a double digit decline in average selling prices partially offset by increased unit demand. The 3.0% comparable store sales increase in appliances was due to an increase in both demand and average selling prices, driven largely by our initiatives to capture market share and outpace the marketplace in comparable store sales growth. The increase in the computing and mobile phone category was driven by increased demand in notebook computers and the additional offering of tablets and mobile phones in fiscal 2012. The 9.2% comparable store sales decrease in the other category was due primarily to double digit comparable store sales decreases in small electronics and mid single digit decreases in cameras and camcorders, offset by strong double digit growth in mattresses.
Gross profit increased $90.6 million for the 12 months ended March 31, 2012 when compared with the prior year, which represents a decrease of 142 basis points as a percentage of net sales. The gross profit margin percentage decrease was largely due to gross profit margin pressure in the video category, which was primarily the result of increased promotional activity in the category. The computing and mobile phones category, which carries a gross profit margin percentage lower than our company average, increased as an overall percentage of our net sales mix, which resulted in a decrease in our total gross profit margin percentage. The appliance category experienced a modest increase in gross profit margin percentage compared with the prior year period.
SG&A increased $68.8 million or, as a percentage of net sales, decreased approximately 69 basis points for the 12 months ended March 31, 2012, compared with the prior year period. The improvement in SG&A was largely due to slight decreases in occupancy costs and wage expenses, offset by a slight increase in delivery costs, which was a result of an increase in appliances as a percentage of our total net sales.
Net advertising expense, as a percentage of net sales, increased approximately 51 basis points during the year ended March 31, 2012. Net advertising expense was $117.4 million for the 12 months ended March 31, 2012 compared to $87.3 million for the comparable prior year period. The increase in advertising expense as a percentage of net sales was driven largely by increased promotions to drive market share and the launch of our new mobile phone department.
Other expense was $2.6 million for the 12 months ended March 31, 2012 compared $7.0 million in the prior year period. The change in other expense was primarily due to a loss on early debt extinguishment of $2.1 million incurred in fiscal 2011 and lower interest expense as a result of lower debt levels in fiscal 2012 as compared to the prior year.
37
Table of Contents
Our effective income tax rate for the fiscal year ended March 31, 2012 decreased to 24.1% compared to 39.2% in the comparable prior year period. The decrease in the effective income tax rate was primarily due to the impact of non-taxable life insurance proceeds received and federal income tax credits recognized under the Hiring Incentives to Restore Employment Act of 2010.
Fiscal Year Ended March 31, 2011 Compared to Fiscal Year Ended March 31, 2010
Our 4.0% comparable store sales decrease for the 12 months ended March 31, 2011 was primarily driven by the 6.3% decrease in the video category, which was due to a double digit decline in average selling prices driven by lower than expected demand for emerging technologies, partially offset by an increase in overall unit demand. Comparable store sales in the appliance category for the 12 month period ended March 31, 2011 remained consistent with the comparable prior year period. The 6.0% comparable store sales decrease in the other category was due primarily to double digit comparable store sales decreases in cameras and camcorders and mid single digit decreases in small electronics, partially offset by double digit increases in sales of computers and video games.
Gross profit increased $162.8 million for the 12 months ended March 31, 2011 when compared with the prior year, which represents a decrease of 12 basis points as a percentage of net sales. The gross profit margin percentage decrease was driven by a decrease in the gross margin rate of the video category, partially offset by increases in the appliance and other categories. The decrease in the video category was largely driven by a net sales mix shift within the video category. The video category saw a greater increase in demand of entry level products, including smaller screen sizes which carry lower margins than bigger, more feature rich screen sizes. The appliance increase was largely driven by an increased sales mix of energy efficient products. The other category gross margin rate increased in the majority of the sub-categories despite an overall increase in the computer category as a percentage of the net sales mix within the other category. The computer category carries a gross margin rate less than the Company average.
SG&A increased $106.6 million or, as a percentage of net sales, decreased approximately 37 basis points for the 12 months ended March 31, 2011, compared with the prior year period. The improvement in SG&A was largely due to the timing of the pre-opening expenses for fiscal 2011 stores occurring in fiscal 2010, due to the early timing of the store openings, partially offset by the de-leverage effect of the decrease in comparable store sales.
Net advertising expense, as a percentage of net sales, increased approximately 44 basis points during the year ended March 31, 2011. Net advertising expense was $87.3 million for the 12 months ended March 31, 2011 compared to $57.8 million for the comparable prior year period. The increase in advertising expense as a percentage of net sales was driven largely by the deleveraging effect of our comparable store sales decrease, in addition to increased spend associated with the grand opening of 43 stores in fiscal 2011, compared to the grand opening of 22 stores in fiscal 2010. The increase in advertising spend was offset by a slight increase in advertising support from vendors.
Other expense remained flat compared to the prior year period as a percentage of net sales. Other expense increased $1.8 million, due to a $1.9 million increase in loss related to early extinguishment of debt and a $0.1 million impairment charge, offset by a decline in net interest expense as a result of lower debt levels in fiscal 2011 as compared to the prior year.
Income tax expense increased $6.7 million or, as a percentage of net sales, decreased 9 basis points during the 12 months ended March 31, 2011 when compared with the respective comparable prior year period. Our effective income tax rate for the 12 months ended March 31, 2011 increased to 39.2% compared to 38.3% in the comparable prior year period. The increase in the effective income tax rate was primarily the result of changes in the annual effective state income tax rate for fiscal 2011, driven by our expansion into states with higher state tax rates than our historical average.
38
Table of Contents
Liquidity and Capital Resources
The following table presents a summary on a consolidated basis of our net cash provided by (used in) operating, investing and financing activities (dollars are in thousands):
| Fiscal Year Ended March 31, | ||||||||||||
| 2012 | 2011 | 2010 | ||||||||||
| Net cash provided by operating activities |
$ | 117,037 | $ | 58,997 | $ | 107,880 | ||||||
| Net cash used in investing activities |
(81,349 | ) | (59,785 | ) | (58,432 | ) | ||||||
| Net cash (used in) provided by financing activities |
(49,238 | ) | (84,255 | ) | 86,893 | |||||||
Our liquidity requirements arise primarily from our need to fund working capital requirements and capital expenditures. We make capital expenditures principally to fund our expansion strategy, which includes, among other things, investments in new stores and new distribution facilities, remodeling and relocation of existing stores, as well as information technology and other infrastructure-related projects that support our expansion.
We plan to open between 20 and 22 new stores during fiscal 2013. In addition, we plan to continue to invest in our infrastructure, including our management information systems and distribution capabilities, as well as incur capital remodeling and improvement costs. We expect net capital expenditures, net of sale and leaseback proceeds and tenant allowances from landlords, for fiscal 2013 store openings and relocations, to range between $50 million and $55 million. Capital expenditures for fiscal 2013 will be funded through cash and cash equivalents, borrowings on our revolving credit facility and tenant allowances from landlords.
Cash Provided by Operating Activities. Cash provided by operating activities primarily consists of net income as adjusted for increases or decreases in working capital and non-cash depreciation and amortization. Cash provided by operating activities was $117.0 million, $59.0 million and $107.9 million for fiscal 2012, fiscal 2011 and fiscal 2010, respectively. The increase in cash provided by operating activities is primarily due to the $40.0 million in life insurance proceeds received, a decrease in our net investment in merchandise inventories (merchandise inventories less accounts payable), an increase in tenant allowances received from landlords, and a decrease in the excess tax benefits from stock-based compensation. These increases in cash provided by operating activities were partially offset by the net change in our other current operating assets and liabilities, the change in which was primarily a result of differences in timing of customer sales and vendor payments. The decrease in cash flows from fiscal 2011 to fiscal 2010 was primarily due to an increase in our net investment in merchandise inventories (merchandise inventories less accounts payable) and excess tax benefits from stock-based compensation, partially offset by an increase in net income excluding depreciation expense, cash provided by tenant allowances received from landlords and the net change in our other current operating assets and liabilities.
Cash Used in Investing Activities. Cash used in investing activities was $81.3 million, $59.8 million and $58.4 million for fiscal 2012, fiscal 2011 and fiscal 2010, respectively. The increase for fiscal 2012 compared to fiscal 2011, is primarily due to capital expenditures related to new stores. We opened 35 new stores in fiscal 2012 compared to 43 new stores in fiscal 2011, however the expenditures for fiscal 2012 stores were primarily incurred during fiscal 2012 due to the timing of the store openings. For fiscal 2011, $22.7 million in capital expenditures incurred in fiscal 2010 related to new stores opened in fiscal 2011 due to the timing of new store openings, resulting in capital expenditures slightly higher in fiscal 2010 as compared to fiscal 2011. We also received approximately $1.6 million and $4.7 million of sale leaseback proceeds during fiscal 2012 and 2010, respectively, and did not receive any sale leaseback proceeds during fiscal 2011.
Cash (Used in) Provided by Financing Activities. Cash (used in) provided by financing activities was ($49.2) million, ($84.3) million and $86.9 million for fiscal 2012, fiscal 2011 and fiscal 2010, respectively. The decrease in cash used in financing activities from fiscal 2012 to fiscal 2011 was primarily due to payments totaling $89.9 million, including principal repayments to retire our term debt and transaction costs to amend our revolving credit facility in fiscal 2011, offset by $47.6 million in repurchases of treasury stock during fiscal 2012.
39
Table of Contents
The change from fiscal 2011 to fiscal 2010 was primarily due to the $89.9 million in payments made related to the fiscal 2011 debt transactions, compared to fiscal 2010, during which we completed an equity offering that provided proceeds of approximately $78.1 million, net of transaction costs.
Senior Secured Term Loan. On July 25, 2007, Gregg Appliances entered into a senior credit agreement (the “Term B Facility”) with a bank group obtaining $100 million senior secured term loan B maturing on July 25, 2013. On March 29, 2011, Gregg Appliances repaid the Term B Facility loan balance in full using excess cash. In connection with this repayment, we recorded a pre-tax loss related to the early extinguishment of debt of $1.8 million, which was primarily due to the write off of capitalized debt issuance costs and the termination of an interest rate swap arrangement.
Revolving Credit Facility. On July 25, 2007, Gregg Appliances entered into an Amended and Restated Loan and Security Agreement (“Revolving Credit Facility”) with a bank group for up to $100 million. On September 15, 2009, Gregg Appliances entered into Amendment No. 1 and Joinder to the Amended and Restated Loan and Security Agreement (“Amendment No. 1”) with a bank group, which increased the maximum amount available under the Revolving Credit Facility from $100 million to $125 million, subject to borrowing base availability. On March 29, 2011, Gregg Appliances entered into an Amended and Restated Loan and Security Agreement (the “Amended Facility”). The Amended Facility increased the maximum credit available from $125 million to $300 million, subject to borrowing base availability, and extended the term of the facility to March 29, 2016. In connection with the amendment, we recorded a pre-tax loss related to the early extinguishment of debt of $0.3 million, which was primarily due to the write off of capitalized debt issuance costs.
Interest (other than Eurodollar rate borrowings) on borrowings is payable monthly at a fluctuating rate based on the bank’s prime rate or LIBOR plus an applicable margin. Interest on Eurodollar rate borrowings is payable on the last day of each “interest period” applicable to such borrowing or on the three month anniversary of the beginning of such “interest period” for interest periods greater than three months. The unused line rate is determined based on the amount of the daily average of the outstanding borrowings for the immediately preceding calendar quarter period (the “Daily Average”). For a Daily Average greater than or equal to 50% of the defined borrowing base, the unused line rate is 0.375%. For a Daily Average less than 50% of the defined borrowing base, the unused line rate is 0.50%. The Amended Facility is guaranteed by Gregg Appliances’ wholly-owned subsidiary, HHG Distributing LLC (HHG), which has no assets or operations. The guarantee is full and unconditional and Gregg Appliances has no other subsidiaries.
Pursuant to the Amended Facility, the borrowing base was modified to equal the sum of (i) the lesser of (a) 90% of the net orderly liquidation value of all eligible inventory of Gregg Appliances or (b) 75% of the net book value of such eligible inventory and (ii) 90% of all commercial and credit card receivables of Gregg Appliances, in each case subject to customary reserves and eligibility criteria. The Amended Facility required payment to the lenders of a commitment fee of approximately $1.1 million.
Under the Amended Facility, Gregg Appliances is not required to comply with any financial maintenance covenant unless “excess availability” is less than the greater of (i) 10.0% of the lesser of (A) the defined borrowing base or (B) the defined maximum credit or (ii) $15.0 million until September 30, 2012 and $20.0 million thereafter, during the continuance of which event Gregg Appliances is subject to compliance with a fixed charge coverage ratio of 1.0 to 1.0.
Pursuant to the Amended Facility, if Gregg Appliances has “excess availability” less than 12.5% of the lesser of (A) the defined borrowing base or (B) the defined maximum credit, it may, in certain circumstances more specifically described in the Amended Facility, become subject to cash dominion control.
The Amended Facility places limitations on the ability of Gregg Appliances to, among other things, incur debt, create other liens on its assets, make investments, sell assets, pay dividends, undertake transactions with affiliates, enter into merger transactions, enter into unrelated businesses, open collateral locations outside of the United States, or enter into consignment assignments or floor plan financing arrangements. The Amended
40
Table of Contents
Facility also contains various customary representations and warranties, financial and collateral reporting requirements and other affirmative and negative covenants. Gregg Appliances was in compliance with the restrictions and covenants in the Amended Facility at March 31, 2012.
As of March 31, 2012, Gregg Appliances had no borrowings outstanding under the Amended Facility and $5.2 million of letters of credit outstanding, which expire through December 31, 2012. As of March 31, 2012, the total borrowing availability under the Amended Facility was $175.0 million. The interest rate based on the bank’s prime rate as of March 31, 2012 was 4.25%.
Long Term Liquidity. Anticipated cash flows from operations and funds available from our Amended Facility, together with cash on hand, should provide sufficient funds to finance our operations for at least the next 12 months. As a normal part of our business, we consider opportunities to refinance our existing indebtedness, based on market conditions. Although we may refinance all or part of our existing indebtedness in the future, there can be no assurances that we will do so. Changes in our operating plans, lower than anticipated sales, increased expenses, acquisitions or other events may require us to seek additional debt or equity financing. There can be no guarantee that financing will be available on acceptable terms or at all. Additional debt financing, if available, could impose additional cash payment obligations and additional covenants and operating restrictions.
Impact of Inflation
The impact of inflation and changing prices has not been material to our net sales or net income in any of the last three fiscal years. Highly competitive market conditions and the general economic environment have minimized inflation’s impact on the selling prices of our products and our expenses. In addition, price deflation and the continued commoditization of key technology products in the video category affect our ability to increase our gross profit margin.
Contractual Obligations
Our contractual obligations at March 31, 2012 were as follows (dollars are in thousands):
| Payments due by period | ||||||||||||||||||||
| Total | Less than 1 year |
1-3 years | 4-5 years | More than 5 years |
||||||||||||||||
| Operating lease obligations |
$ | 697,341 | $ | 86,162 | $ | 167,198 | $ | 155,074 | $ | 288,907 | ||||||||||
| Advertising commitments |
18,305 | 12,557 | 3,545 | 2,203 | — | |||||||||||||||
| Revolving Credit Facility |
— | — | — | — | — | |||||||||||||||
|
|
|
|
|
|
|
|
|
|
|
|||||||||||
| Total |
$ | 715,646 | $ | 98,719 | $ | 170,743 | $ | 157,277 | $ | 288,907 | ||||||||||
|
|
|
|
|
|
|
|
|
|
|
|||||||||||
The above contractual obligation table excludes any future payments made in connection with our Non-Qualified Deferred Compensation Plan. The aggregate balance outstanding for all participants in the plan as of March 31, 2012 was approximately $5.6 million. We are unable to estimate the timing of these future payments under the plan.
We lease our retail stores, warehouse and office space, corporate airplane and certain vehicles under operating leases. Our noncancelable lease agreements expire at various dates through fiscal year 2026, require various minimum annual rentals, and contain certain options for renewal. Certain of these leases are with related parties, including one of our stockholders. The majority of the real estate leases require payment of property taxes, normal maintenance and insurance on the properties. Total rent expense with respect to real property was approximately $80.9 million, $68.9 million and $49.8 million in fiscal 2012, 2011 and 2010, respectively. Contingent rentals based upon sales are applicable to certain of the store leases. Contingent rent expense was approximately $0.1 million, $0.1 million and $0.5 million in fiscal 2012, 2011 and 2010, respectively. Total rental expense with respect to real property has increased as a result of the increase in the number of our stores.
41
Table of Contents
Off Balance Sheet Items
We do not have any off balance sheet arrangements. We finance some of our development programs through sale and leaseback transactions, which involve selling stores to third parties and then leasing the stores back under leases that are accounted for as operating leases in accordance with U.S. GAAP. A summary of our operating lease obligations by fiscal year is included in the “Contractual Obligations” section above. Additional information regarding our operating leases is available in “Business—Properties,” and Note 9, Leases, in the Notes to our audited consolidated financial statements included elsewhere in this Annual Report on Form 10-K.
| ITEM 7A. | Quantitative and Qualitative Disclosures about Market Risk. |
In addition to the risks inherent in our operations, we are exposed to certain market risks, including interest rate risk.
Interest Rate Risk
As of March 31, 2012, our debt was comprised of our Amended Facility.
Interest on borrowings under our Amended Facility is payable monthly at a fluctuating rate based on the bank’s prime rate or LIBOR plus an applicable margin. As of March 31, 2012, we had no cash borrowings under our Amended Facility.
42
Table of Contents
| ITEM 8. | Financial Statements and Supplementary Data. |
INDEX TO CONSOLIDATED FINANCIAL STATEMENTS
HHGREGG, INC. AND SUBSIDIARIES CONSOLIDATED FINANCIAL STATEMENTS
43
Table of Contents
Management’s Report on the Consolidated Financial Statements
Our management is responsible for the preparation, integrity and objectivity of the accompanying consolidated financial statements and the related financial information. The consolidated financial statements have been prepared in conformity with U.S. GAAP and necessarily include certain amounts that are based on estimates and informed judgments. Our management also prepared the related financial information included in this Annual Report on Form 10-K and is responsible for its accuracy and consistency with the consolidated financial statements.
The accompanying consolidated financial statements have been audited by KPMG LLP, an independent registered public accounting firm, which conducted its audits in accordance with the standards of the Public Company Accounting Oversight Board (U.S.). The independent registered public accounting firm’s responsibility is to express an opinion on the consolidated financial statements based on its audits in accordance with the standards of the PCAOB.
Management’s Report on Internal Control Over Financial Reporting
Our management is responsible for establishing and maintaining adequate internal control over financial reporting as defined in Rule 13a-15(f) under the Securities Exchange Act of 1934, as amended. Our internal control over financial reporting is designed under the supervision of our principal executive officer and principal financial and accounting officer, and effected by our Board of Directors, management and other personnel, to provide reasonable assurance regarding the reliability of financial reporting and the preparation of financial statements for external purposes in accordance with U.S. GAAP and include those policies and procedures that:
| (1) | Pertain to the maintenance of records that in reasonable detail accurately and fairly reflect our transactions and the dispositions of our assets; |
| (2) | Provide reasonable assurance that our transactions are recorded as necessary to permit preparation of financial statements in accordance with U.S. GAAP, and that our receipts and expenditures are being made only in accordance with authorizations of our management and Board of Directors; and |
| (3) | Provide reasonable assurance regarding prevention or timely detection of the unauthorized acquisition, use or disposition of our assets that could have a material effect on our financial statements. |
Under the supervision and with the participation of our management, including our principal executive officer and principal financial and accounting officer, we assessed the effectiveness of our internal control over financial reporting as of March 31, 2012, using the criteria set forth by the Committee of Sponsoring Organizations of the Treadway Commission (COSO) in Internal Control — Integrated Framework. Based on our assessment, we have concluded that our internal control over financial reporting was effective as of March 31, 2012. During our assessment, we did not identify any material weaknesses in our internal control over financial reporting. KPMG LLP, an independent registered public accounting firm, has audited the consolidated financial statements included in this Annual Report on Form 10-K and, as a part of this audit, has issued their report, included in Item 8, Financial Statements and Supplementary Data, on the effectiveness of our internal control over financial reporting. Because of its inherent limitations, internal control over financial reporting may not prevent or detect misstatements. Therefore, even those systems determined to be effective can provide only reasonable assurance with respect to financial statement preparation and presentation. Also, projections of any evaluation of the effectiveness of internal control over financial reporting to future periods are subject to the risk that the control may become inadequate because of a change in conditions, or that the degree of compliance with the policies or procedures may deteriorate.
| /s/ DENNIS L. MAY |
/s/ JEREMY J. AGUILAR | |
| Dennis L. May | Jeremy J. Aguilar | |
| Chief Executive Officer | Chief Financial Officer | |
| (Principal Executive Officer) | (Principal Financial and Accounting Officer) |
44
Table of Contents
Report of Independent Registered Public Accounting Firm
The Board of Directors and Stockholders
hhgregg, Inc.:
We have audited the accompanying consolidated balance sheets of hhgregg, Inc. and subsidiaries (the “Company”) as of March 31, 2012 and 2011, and the related consolidated statements of income, stockholders’ equity and comprehensive income, and cash flows for each of the years in the three-year period ended March 31, 2012. We also have audited the Company’s internal control over financial reporting as of March 31, 2012, based on criteria established in Internal Control – Integrated Framework issued by the Committee of Sponsoring Organizations of the Treadway Commission (“COSO”). The Company’s management is responsible for these consolidated financial statements, for maintaining effective internal control over financial reporting, and for its assessment of the effectiveness of internal control over financial reporting, included in the accompanying management’s report on internal control over financial reporting under Item 8. Our responsibility is to express an opinion on these consolidated financial statements and an opinion on the Company’s internal control over financial reporting based on our audits.
We conducted our audits in accordance with the standards of the Public Company Accounting Oversight Board (United States). Those standards require that we plan and perform the audits to obtain reasonable assurance about whether the financial statements are free of material misstatement and whether effective internal control over financial reporting was maintained in all material respects. Our audits of the consolidated financial statements included examining, on a test basis, evidence supporting the amounts and disclosures in the financial statements, assessing the accounting principles used and significant estimates made by management, and evaluating the overall financial statement presentation. Our audit of internal control over financial reporting included obtaining an understanding of internal control over financial reporting, assessing the risk that a material weakness exists, and testing and evaluating the design and operating effectiveness of internal control based on the assessed risk. Our audits also included performing such other procedures as we considered necessary in the circumstances. We believe that our audits provide a reasonable basis for our opinions.
A company’s internal control over financial reporting is a process designed to provide reasonable assurance regarding the reliability of financial reporting and the preparation of financial statements for external purposes in accordance with generally accepted accounting principles. A company’s internal control over financial reporting includes those policies and procedures that (1) pertain to the maintenance of records that, in reasonable detail, accurately and fairly reflect the transactions and dispositions of the assets of the company; (2) provide reasonable assurance that transactions are recorded as necessary to permit preparation of financial statements in accordance with generally accepted accounting principles, and that receipts and expenditures of the company are being made only in accordance with authorizations of management and directors of the company; and (3) provide reasonable assurance regarding prevention or timely detection of unauthorized acquisition, use, or disposition of the company’s assets that could have a material effect on the financial statements.
Because of its inherent limitations, internal control over financial reporting may not prevent or detect misstatements. Also, projections of any evaluation of effectiveness to future periods are subject to the risk that controls may become inadequate because of changes in conditions, or that the degree of compliance with the policies or procedures may deteriorate.
In our opinion, the consolidated financial statements referred to above present fairly, in all material respects, the financial position of hhgregg, Inc. and subsidiaries as of March 31, 2012 and 2011, and the results of their operations and their cash flows for each of the years in the three-year period ended March 31, 2012, in conformity with U.S. generally accepted accounting principles. Also in our opinion, hhgregg, Inc. maintained, in all material respects, effective internal control over financial reporting as of March 31, 2012, based on criteria established in Internal Control — Integrated Framework issued by COSO.
/s/ KPMG LLP
Indianapolis, Indiana
May 23, 2012
45
Table of Contents
HHGREGG, INC. AND SUBSIDIARIES
Consolidated Statements of Income
Years Ended March 31, 2012, 2011 and 2010
| 2012 | 2011 | 2010 | ||||||||||
| (In thousands, except share and per share data) | ||||||||||||
| Net sales |
$ | 2,493,392 | $ | 2,077,651 | $ | 1,534,253 | ||||||
| Cost of goods sold |
1,773,004 | 1,447,891 | 1,067,312 | |||||||||
|
|
|
|
|
|
|
|||||||
| Gross profit |
720,388 | 629,760 | 466,941 | |||||||||
| Selling, general and administrative expenses |
498,600 | 429,823 | 323,182 | |||||||||
| Net advertising expense |
117,423 | 87,340 | 57,808 | |||||||||
| Depreciation and amortization expense |
33,752 | 26,238 | 17,160 | |||||||||
| Life insurance proceeds |
(40,000 | ) | — | — | ||||||||
| Asset impairment charges |
813 | 88 | — | |||||||||
|
|
|
|
|
|
|
|||||||
| Income from operations |
109,800 | 86,271 | 68,791 | |||||||||
| Other expense (income): |
||||||||||||
| Interest expense |
2,658 | 4,992 | 5,154 | |||||||||
| Interest income |
(23 | ) | (22 | ) | (49 | ) | ||||||
| Loss related to early extinguishment of debt |
— | 2,071 | 146 | |||||||||
|
|
|
|
|
|
|
|||||||
| Total other expense |
2,635 | 7,041 | 5,251 | |||||||||
|
|
|
|
|
|
|
|||||||
| Income before income taxes |
107,165 | 79,230 | 63,540 | |||||||||
| Income tax expense |
25,792 | 31,022 | 24,342 | |||||||||
|
|
|
|
|
|
|
|||||||
| Net income |
$ | 81,373 | $ | 48,208 | $ | 39,198 | ||||||
|
|
|
|
|
|
|
|||||||
| Net income per share |
||||||||||||
| Basic |
$ | 2.16 | $ | 1.22 | $ | 1.07 | ||||||
| Diluted |
$ | 2.14 | $ | 1.19 | $ | 1.03 | ||||||
| Weighted average shares outstanding-Basic |
37,749,354 | 39,394,708 | 36,649,515 | |||||||||
| Weighted average shares outstanding-Diluted |
38,079,685 | 40,368,223 | 37,990,208 | |||||||||
See accompanying notes to consolidated financial statements.
46
Table of Contents
HHGREGG, INC. AND SUBSIDIARIES
Consolidated Balance Sheets
March 31, 2012 and 2011
| 2012 | 2011 | |||||||
| (In thousands, except share data) | ||||||||
| Assets |
||||||||
| Current assets: |
||||||||
| Cash and cash equivalents |
$ | 59,244 | $ | 72,794 | ||||
| Accounts receivable — trade, less allowances of $25 and $134, respectively |
19,467 | 8,931 | ||||||
| Accounts receivable — other |
18,630 | 19,806 | ||||||
| Merchandise inventories, net |
282,409 | 212,008 | ||||||
| Prepaid expenses and other current assets |
5,562 | 11,062 | ||||||
| Deferred income taxes |
9,639 | 5,606 | ||||||
|
|
|
|
|
|||||
| Total current assets |
394,951 | 330,207 | ||||||
|
|
|
|
|
|||||
| Net property and equipment |
204,273 | 162,781 | ||||||
| Deferred financing costs, net |
2,656 | 3,232 | ||||||
| Deferred income taxes |
38,970 | 52,385 | ||||||
| Other assets |
1,934 | 1,040 | ||||||
|
|
|
|
|
|||||
| Total long-term assets |
247,833 | 219,438 | ||||||
|
|
|
|
|
|||||
| Total assets |
$ | 642,784 | $ | 549,645 | ||||
|
|
|
|
|
|||||
| Liabilities and Stockholders’ Equity |
||||||||
| Current liabilities: |
||||||||
| Accounts payable |
$ | 122,596 | $ | 94,363 | ||||
| Customer deposits |
28,993 | 21,791 | ||||||
| Accrued liabilities |
48,093 | 49,191 | ||||||
|
|
|
|
|
|||||
| Total current liabilities |
199,682 | 165,345 | ||||||
|
|
|
|
|
|||||
| Long-term liabilities: |
||||||||
| Deferred rent |
71,304 | 55,240 | ||||||
| Other long-term liabilities |
12,278 | 12,474 | ||||||
|
|
|
|
|
|||||
| Total long-term liabilities |
83,582 | 67,714 | ||||||
|
|
|
|
|
|||||
| Total liabilities |
283,264 | 233,059 | ||||||
|
|
|
|
|
|||||
| Stockholders’ equity: |
||||||||
| Preferred stock, par value $.0001; 10,000,000 shares authorized; no shares issued and outstanding as of March 31, 2012 and 2011 |
— | — | ||||||
| Common stock, par value $.0001; 150,000,000 shares authorized; 40,066,005 and 39,724,737 shares issued; and 36,351,716 and 39,724,737 outstanding as of March 31, 2012 and 2011, respectively |
4 | 4 | ||||||
| Additional paid-in capital |
277,846 | 268,715 | ||||||
| Retained earnings |
129,281 | 47,908 | ||||||
| Common stock held in treasury at cost, 3,714,289 and 0 shares as of March 31, 2012 and 2011, respectively |
(47,570 | ) | — | |||||
|
|
|
|
|
|||||
| 359,561 | 316,627 | |||||||
| Note receivable for common stock |
(41 | ) | (41 | ) | ||||
|
|
|
|
|
|||||
| Total stockholders’ equity |
359,520 | 316,586 | ||||||
|
|
|
|
|
|||||
| Total liabilities and stockholders’ equity |
$ | 642,784 | $ | 549,645 | ||||
|
|
|
|
|
|||||
See accompanying notes to consolidated financial statements.
47
Table of Contents
HHGREGG, INC. AND SUBSIDIARIES
Consolidated Statements of Stockholders’ Equity and Comprehensive Income
Years Ended March 31, 2012, 2011 and 2010
(in thousands)
| Common Shares |
Preferred Stock |
Common Stock |
Additional Paid-in Capital |
Accumulated Other Comprehensive Loss |
Retained Earnings (Accumulated Deficit) |
Note Receivable For Common Stock |
Common Stock Held in Treasury |
Total Stockholders’ Equity |
||||||||||||||||||||||||||||
| Balance at March 31, 2009 |
32,744,111 | $ | — | $ | 3 | $ | 165,524 | $ | (747 | ) | $ | (39,498 | ) | $ | (129 | ) | $ | — | $ | 125,153 | ||||||||||||||||
|
|
|
|
|
|
|
|
|
|
|
|
|
|
|
|
|
|
|
|||||||||||||||||||
| Comprehensive income: |
||||||||||||||||||||||||||||||||||||
| Net income |
39,198 | $ | 39,198 | |||||||||||||||||||||||||||||||||
| Unrealized loss on hedge arrangement, net of tax benefit of $154 |
(235 | ) | (235 | ) | ||||||||||||||||||||||||||||||||
|
|
|
|||||||||||||||||||||||||||||||||||
| Total comprehensive income |
38,963 | |||||||||||||||||||||||||||||||||||
| Issuance of common stock |
5,025,000 | — | 1 | 82,912 | — | — | — | — | 82,913 | |||||||||||||||||||||||||||
| Transaction costs for stock issuance |
— | — | — | (4,764 | ) | — | — | — | — | (4,764 | ) | |||||||||||||||||||||||||
| Payments received on notes receivable for issuance of common stock |
— | — | — | — | — | — | 45 | — | 45 | |||||||||||||||||||||||||||
| Exercise of stock options |
748,277 | — | — | 4,658 | — | — | — | — | 4,658 | |||||||||||||||||||||||||||
| Stock compensation expense |
— | — | — | 3,455 | — | — | — | — | 3,455 | |||||||||||||||||||||||||||
| Excess tax benefits from stock-based compensation |
— | — | — | 2,985 | — | — | — | — | 2,985 | |||||||||||||||||||||||||||
|
|
|
|
|
|
|
|
|
|
|
|
|
|
|
|
|
|
|
|||||||||||||||||||
| Balance at March 31, 2010 |
38,517,388 | $ | — | $ | 4 | $ | 254,770 | $ | (982 | ) | $ | (300 | ) | $ | (84 | ) | $ | — | $ | 253,408 | ||||||||||||||||
|
|
|
|
|
|
|
|
|
|
|
|
|
|
|
|
|
|
|
|||||||||||||||||||
| Comprehensive income: |
||||||||||||||||||||||||||||||||||||
| Net income |
48,208 | $ | 48,208 | |||||||||||||||||||||||||||||||||
| Unrealized gain on hedge arrangement, net of tax expense of $303 |
462 | 462 | ||||||||||||||||||||||||||||||||||
| Early termination of hedge arrangement, net of tax benefit of $345 |
520 | 520 | ||||||||||||||||||||||||||||||||||
|
|
|
|||||||||||||||||||||||||||||||||||
| Total comprehensive income |
49,190 | |||||||||||||||||||||||||||||||||||
| Payments received on notes receivable for issuance of common stock |
— | — | — | — | — | — | 43 | — | 43 | |||||||||||||||||||||||||||
| Exercise of stock options |
1,919,485 | — | — | 4,955 | — | — | — | — | 4,955 | |||||||||||||||||||||||||||
| Stock compensation expense |
— | — | — | 5,199 | — | — | — | — | 5,199 | |||||||||||||||||||||||||||
| Excess tax benefits from stock-based compensation |
— | — | — | 14,913 | — | — | — | — | 14,913 | |||||||||||||||||||||||||||
| Net settlement of shares — taxes |
(712,136 | ) | (11,122 | ) | (11,122 | ) | ||||||||||||||||||||||||||||||
|
|
|
|
|
|
|
|
|
|
|
|
|
|
|
|
|
|
|
|||||||||||||||||||
| Balance at March 31, 2011 |
39,724,737 | $ | — | $ | 4 | $ | 268,715 | $ | — | $ | 47,908 | $ | (41 | ) | $ | — | $ | 316,586 | ||||||||||||||||||
|
|
|
|
|
|
|
|
|
|
|
|
|
|
|
|
|
|
|
|||||||||||||||||||
| Net income |
81,373 | $ | 81,373 | |||||||||||||||||||||||||||||||||
| Exercise of stock options and vesting of RSUs |
341,268 | — | — | 2,464 | — | — | — | — | 2,464 | |||||||||||||||||||||||||||
| Stock compensation expense |
— | — | — | 5,935 | — | — | — | — | 5,935 | |||||||||||||||||||||||||||
| Excess tax benefits from stock-based compensation |
— | — | — | 732 | — | — | — | — | 732 | |||||||||||||||||||||||||||
| Repurchase of common stock |
(3,714,289 | ) | — | — | — | — | — | — | (47,570 | ) | (47,570 | ) | ||||||||||||||||||||||||
|
|
|
|
|
|
|
|
|
|
|
|
|
|
|
|
|
|
|
|||||||||||||||||||
| Balance at March 31, 2012 |
36,351,716 | $ | — | $ | 4 | $ | 277,846 | $ | — | $ | 129,281 | $ | (41 | ) | $ | (47,570 | ) | $ | 359,520 | |||||||||||||||||
|
|
|
|
|
|
|
|
|
|
|
|
|
|
|
|
|
|
|
|||||||||||||||||||
See accompanying notes to consolidated financial statements.
48
Table of Contents
HHGREGG, INC. AND SUBSIDIARIES
Consolidated Statements of Cash Flows
Years Ended March 31, 2012, 2011 and 2010
| 2012 | 2011 | 2010 | ||||||||||
| (In thousands) | ||||||||||||
| Cash flows from operating activities: |
||||||||||||
| Net income |
$ | 81,373 | $ | 48,208 | $ | 39,198 | ||||||
| Adjustments to reconcile net income to net cash provided by operating activities: |
||||||||||||
| Depreciation and amortization |
33,752 | 26,238 | 17,160 | |||||||||
| Amortization of deferred financing costs |
664 | 1,198 | 998 | |||||||||
| Stock-based compensation |
5,935 | 5,199 | 3,455 | |||||||||
| Excess tax benefits from stock-based compensation |
(732 | ) | (14,913 | ) | (2,985 | ) | ||||||
| Gain on sales of property and equipment |
(332 | ) | (379 | ) | (69 | ) | ||||||
| Loss on early extinguishment of debt |
— | 2,071 | 146 | |||||||||
| Deferred income taxes |
9,382 | 11,612 | 11,888 | |||||||||
| Asset impairment charges |
813 | 88 | — | |||||||||
| Tenant allowances received from landlords |
22,895 | 16,040 | 13,647 | |||||||||
| Changes in operating assets and liabilities: |
||||||||||||
| Accounts receivable — trade |
(10,536 | ) | (1,619 | ) | (1,993 | ) | ||||||
| Accounts receivable — other |
(2,836 | ) | 3,605 | (4,422 | ) | |||||||
| Merchandise inventories |
(70,401 | ) | (10,505 | ) | (59,893 | ) | ||||||
| Prepaid expenses and other assets |
4,606 | (2,706 | ) | (4,648 | ) | |||||||
| Accounts payable |
38,374 | (48,976 | ) | 71,483 | ||||||||
| Customer deposits |
7,202 | 1,461 | 5,096 | |||||||||
| Accrued liabilities |
(366 | ) | 19,258 | 17,005 | ||||||||
| Deferred rent |
(2,819 | ) | 1,914 | 14,026 | ||||||||
| Other long-term liabilities |
63 | 1,203 | (12,212 | ) | ||||||||
|
|
|
|
|
|
|
|||||||
| Net cash provided by operating activities |
117,037 | 58,997 | 107,880 | |||||||||
|
|
|
|
|
|
|
|||||||
| Cash flows from investing activities: |
||||||||||||
| Purchases of property and equipment |
(83,054 | ) | (59,938 | ) | (62,161 | ) | ||||||
| Net proceeds from sale leaseback transactions |
1,625 | — | 4,694 | |||||||||
| Deposit on future sale leaseback transactions applied |
— | — | (1,043 | ) | ||||||||
| Proceeds from sales of property and equipment |
80 | 153 | 78 | |||||||||
|
|
|
|
|
|
|
|||||||
| Net cash used in investing activities |
(81,349 | ) | (59,785 | ) | (58,432 | ) | ||||||
|
|
|
|
|
|
|
|||||||
| Cash flows from financing activities: |
||||||||||||
| Proceeds for issuance of common stock |
— | — | 82,913 | |||||||||
| Transaction costs for stock issuance |
— | — | (4,764 | ) | ||||||||
| Purchases of treasury stock |
(47,570 | ) | — | — | ||||||||
| Proceeds from exercise of stock options |
2,464 | 4,955 | 4,658 | |||||||||
| Excess tax benefits from stock-based compensation |
732 | 14,913 | 2,985 | |||||||||
| Net settlement of shares — payment of tax witholding |
— | (11,122 | ) | — | ||||||||
| Net (decrease) increase in bank overdrafts |
(4,776 | ) | (2,263 | ) | 7,039 | |||||||
| Payments on notes payable |
— | (908 | ) | (908 | ) | |||||||
| Payment of financing costs |
(88 | ) | (2,440 | ) | (1,640 | ) | ||||||
| Payment for early debt extinguishment |
— | (87,433 | ) | (3,435 | ) | |||||||
| Other, net |
— | 43 | 45 | |||||||||
|
|
|
|
|
|
|
|||||||
| Net cash (used in) provided by financing activities |
(49,238 | ) | (84,255 | ) | 86,893 | |||||||
|
|
|
|
|
|
|
|||||||
| Net (decrease) increase in cash and cash equivalents |
(13,550 | ) | (85,043 | ) | 136,341 | |||||||
| Cash and cash equivalents |
||||||||||||
| Beginning of year |
72,794 | 157,837 | 21,496 | |||||||||
|
|
|
|
|
|
|
|||||||
| End of year |
$ | 59,244 | $ | 72,794 | $ | 157,837 | ||||||
|
|
|
|
|
|
|
|||||||
| Supplemental disclosure of cash flow information: |
||||||||||||
| Interest paid |
$ | 726 | $ | 3,571 | $ | 4,463 | ||||||
| Income taxes paid |
$ | 13,219 | $ | 1,975 | $ | 9,694 | ||||||
| Capital expenditures included in accounts payable |
$ | 1,216 | $ | 6,581 | $ | 10,393 | ||||||
See accompanying notes to consolidated financial statements.
49
Table of Contents
HHGREGG, INC. AND SUBSIDIARIES
Notes to Consolidated Financial Statements
| (1) | Summary of Significant Accounting Policies |
Description of Business
hhgregg, Inc. (the “Company” or “hhgregg”) is a specialty retailer of home appliances, televisions, computers, consumer electronics, mattresses and related services operating under the name hhgregg™. As of March 31, 2012, the Company had 208 stores located in Alabama, Delaware, Florida, Georgia, Illinois, Indiana, Kentucky, Maryland, Mississippi, New Jersey, North Carolina, Ohio, Pennsylvania, South Carolina, Tennessee and Virginia. The Company operates in one reportable segment.
| (a) | Formation |
hhgregg was formed in Delaware on April 12, 2007. As part of a corporate reorganization effected on July 19, 2007, the stockholders of Gregg Appliances Inc. (“Gregg Appliances”) contributed all of their shares of Gregg Appliances to hhgregg in exchange for common stock of hhgregg. As a result, Gregg Appliances became a wholly-owned subsidiary of hhgregg.
| (b) | Principles of Consolidation |
The consolidated financial statements include the accounts of hhgregg and its wholly-owned subsidiary, Gregg Appliances. The financial statements of Gregg Appliances include its wholly-owned subsidiary HHG Distributing LLC (“HHG Distributing”) which has no assets or operations.
| (c) | Estimates |
Management uses estimates and assumptions in preparing financial statements in conformity with accounting principles generally accepted in the United States. Those estimates and assumptions affect the reported amounts of assets and liabilities, the disclosure of contingent assets and liabilities, and the reported revenues and expenses. Actual results could differ from those estimates and assumptions.
| (d) | Fiscal Year |
The Company’s fiscal year is the twelve month period ended March 31.
| (e) | Cash and Cash Equivalents |
Cash primarily consists of cash on hand and bank deposits. Cash equivalents primarily consist of money market accounts and other highly liquid investments with an original maturity of three months or less when purchased. The amounts of cash equivalents at March 31, 2012 and 2011 were $0.0 million and $71.3 million, respectively. The weighted-average interest on cash equivalents at March 31, 2011 was 0.01%.
Outstanding checks in excess of funds on deposit (book overdrafts) totaled approximately $0.0 million and $4.7 million at March 31, 2012 and 2011, respectively, and are reflected as accounts payable in the Company’s consolidated balance sheets.
| (f) | Accounts Receivable |
Accounts receivable are recorded at the invoiced amount and are subject to finance charges. Accounts receivable-trade primarily consists of credit card receivables. Accounts receivable-other consists mainly of amounts due from vendors for advertising and volume rebates. The allowance for doubtful accounts is the
50
Table of Contents
Company’s best estimate of the amount of probable credit losses in the Company’s existing accounts receivable. The Company reviews its allowance for doubtful accounts monthly. Past due balances over 90 days and over a specified amount are reviewed individually for collectability. Account balances are charged off against the allowance after all means of collection have been exhausted and the potential for recovery is considered remote. The Company does not have any off-balance sheet credit exposure related to its customers. Activity for the allowance for doubtful accounts for the years ended March 31, 2012, 2011 and 2010, in thousands, was as follows:
| Allowance for Doubtful Accounts | ||||||||||||||||
| Balance at beginning of period |
Charged to Costs and Expenses |
Deductions | Balance at End of Period |
|||||||||||||
| Year ended March 31, 2012 |
134 | 84 | (193 | ) | 25 | |||||||||||
| Year ended March 31, 2011 |
177 | 92 | (135 | ) | 134 | |||||||||||
| Year ended March 31, 2010 |
219 | 321 | (363 | ) | 177 | |||||||||||
| (g) | Merchandise Inventories |
Inventory is valued at the lower of the cost of the inventory or fair market value through the establishment of markdown and inventory loss reserves. The Company’s markdown reserve represents the excess of the carrying amount, typically average cost, over the amount it expects to realize from the ultimate sale or other disposal of the inventory. Subsequent changes in facts or circumstances do not result in the restoration of previously recorded markdowns or an increase in that newly established cost basis.
The Company purchases a significant portion of its merchandise from two vendors. For the year ended March 31, 2012, two vendors accounted for 20.5% and 15.2%, respectively, of merchandise purchases. For the year ended March 31, 2011, two vendors accounted for 19.1% and 18.4%, respectively, of merchandise purchases. For the year ended March 31, 2010, two vendors accounted for 21.9% and 18.8%, respectively, of merchandise purchases.
| (h) | Property and Equipment |
Property and equipment are recorded at cost and are depreciated over their expected useful lives on a straight-line basis. Leasehold improvements are depreciated over the shorter of the lease term or expected useful life. Repairs and maintenance costs are charged directly to expense as incurred. In certain lease arrangements, the Company is considered the owner of the building during the construction period. At the end of the construction period, the Company will sell and lease the location back applying provisions of lease accounting guidance. Any gains on sale and leaseback transactions are deferred and amortized over the life of the respective lease. The Company does not have any continuing involvement with the sale and leaseback locations, other than a normal leaseback, and the locations are accounted for as operating leases. In fiscal 2012, the Company executed one sale and leaseback transaction netting $1.6 million in proceeds on the sale. In fiscal 2011, the Company did not execute any sale and leaseback transactions. In fiscal 2010, the Company executed three sale and leaseback transactions netting $4.7 million in proceeds on the sales.
51
Table of Contents
Property and equipment consisted of the following at March 31, 2012 and 2011 (in thousands):
| 2012 | 2011 | |||||||
| Machinery and equipment |
23,340 | 19,047 | ||||||
| Office furniture and equipment |
146,924 | 119,639 | ||||||
| Vehicles |
2,286 | 3,125 | ||||||
| Signs |
16,969 | 13,427 | ||||||
| Leasehold improvements |
146,983 | 100,457 | ||||||
| Construction in progress |
11,429 | 18,140 | ||||||
|
|
|
|
|
|||||
| 347,931 | 273,835 | |||||||
| Less accumulated depreciation and amortization |
(143,658 | ) | (111,054 | ) | ||||
|
|
|
|
|
|||||
| Net property and equipment |
$ | 204,273 | $ | 162,781 | ||||
|
|
|
|
|
|||||
Estimated useful lives by major asset category are as follows:
| Asset |
Life (in years) | |
| Machinery and equipment |
5-7 | |
| Office furniture and equipment |
3-7 | |
| Vehicles |
5 | |
| Signs |
7 | |
| Leasehold improvements |
5-15 |
Depreciation and amortization expense for the years ended March 31, 2012, 2011 and 2010 was $33.8 million, $26.2 million and $17.2 million, respectively.
| (i) | Impairment of Long-Lived Assets |
Long-lived assets other than goodwill and indefinite-lived intangible assets, which are separately tested for impairment, are evaluated for impairment whenever events or changes in circumstances indicate that the carrying amount may not be recoverable. When evaluating long-lived assets for potential impairment, the Company compares the carrying amount of the asset or asset group to the asset’s or asset group’s estimated undiscounted future cash flows. If the estimated future cash flows are less than the carrying amount of the asset or asset group, an impairment loss is calculated. The impairment loss calculation compares the carrying amount of the asset or asset group to the asset’s or asset group’s estimated fair value, which may be based on estimated discounted future cash flows. An impairment loss is recognized for the amount by which the asset’s or asset group’s carrying amount exceeds the asset’s or asset group’s estimated fair value. If an impairment loss is recognized, the adjusted carrying amount of the asset or asset group becomes its new cost basis. For a depreciable long-lived asset, the new cost basis will be depreciated (amortized) over the remaining useful life of that asset or asset group.
For the fiscal year ended March 31, 2012, the Company had two stores and in the fiscal year ended March 31, 2011, the Company had one store, whose profit contributions were significantly lower than the chain average due to decreased sales at each respective location. This decrease in profit triggered the need for an impairment analysis to be performed in accordance with guidance on impairment of long-lived assets. The estimated undiscounted future cash flows generated by the stores were less than their carrying amounts, therefore the carrying amounts of the assets related to these stores were reduced to fair value, resulting in a pre-tax charge of $0.8 million and $0.1 million for the years ended March 31, 2012 and 2011, respectively. There was no impairment loss recognized for the year ended March 31, 2010.
52
Table of Contents
| (j) | Deferred Financing Costs |
Costs incurred related to debt financing are capitalized and amortized over the life of the related debt as a component of interest expense. Debt financing costs are related to the Company’s Amended Facility as discussed in note 5 below. The Company recognized related amortization expense of deferred financing costs of $0.7 million, $1.2 million and $1.0 million for the years ended March 31, 2012, 2011 and 2010, respectively. $1.2 million and $0.1 million of deferred financing costs were written off in fiscal 2011 and 2010, respectively, in connection with the Company’s early extinguishment of debt related primarily to the Amended Facility and Term B Facility.
| (k) | Self-Insured Liabilities |
The Company is self-insured for certain losses related to workers’ compensation, medical insurance, general liability and motor vehicle insurance claims. However, the Company obtains third-party insurance coverage to limit its exposure to these claims. The following table provides the Company’s stop loss coverage for the fiscal years ended March 31, 2012, 2011 and 2010 (in thousands):
| Fiscal Year ended March 31, |
||||||||||||
| 2012 | 2011 | 2010 | ||||||||||
| Workers’ Compensation — per occurrence |
$ | 300 | $ | 300 | $ | 300 | ||||||
| General Liability — per occurrence |
$ | 250 | $ | 250 | $ | 250 | ||||||
| Motor Vehicles — per occurrence |
$ | 100 | $ | 100 | $ | 100 | ||||||
| Medical Insurance — per participant, per year |
$ | 200 | $ | 200 | $ | 150 | ||||||
When estimating self-insured liabilities, a number of factors are considered, including historical claims experience, demographic factors, severity factors and valuations provided by independent third-party actuaries. Quarterly, management reviews its assumptions and the valuations provided by independent third-party actuaries to determine the adequacy of the self-insured liabilities.
| (l) | Accrued Straight-Line Rent |
Retail and distribution operations are conducted from leased locations. The leases generally require payment of real estate taxes, insurance and common area maintenance, in addition to rent. The terms of the lease agreements generally range from 10 to 15 years. Most of the leases contain renewal options and escalation clauses, and certain store leases require contingent rents based on factors such as specified percentages of revenue or the consumer price index.
For leases that contain predetermined fixed escalations of the minimum rent, the related rent expense is recognized on a straight-line basis from the date the Company takes possession of the property to the end of the lease term. Any difference between the straight-line rent amounts and amounts payable under the leases are recorded as part of deferred rent, and are included in long-term liabilities. Cash or lease incentives received upon entering into certain store leases (tenant allowances) are recognized on a straight-line basis as a reduction to rent from the date the Company takes possession of the property through the end of the lease term. The unamortized portion of tenant allowances is recorded as a part of deferred rent, in long-term liabilities. For leases that require contingent rents, management makes an estimate of the contingent rent annually and recognizes the related rent expense on a straight-line basis over the year. At March 31, 2012 and 2011, deferred rent included in long-term liabilities in the Company’s consolidated balance sheets was $71.3 million and $55.2 million, respectively.
Transaction costs associated with the sale and leaseback of properties and any related deferred gain or loss are recognized on a straight-line basis over the initial period of the lease agreements. The Company does not have any retained or contingent interests in the properties, nor does the Company provide any guarantees in connection with the sale and leaseback of properties, other than a corporate-level guarantee of lease payments. At March 31, 2012 and 2011, deferred gains of $2.3 million and $2.4 million, respectively, were recorded in other long term liabilities relating to sale and leaseback transactions.
53
Table of Contents
| (m) | Revenue Recognition |
The Company recognizes revenue from the sale of merchandise at the time the customer takes possession of the merchandise. The Company recognizes revenue related to the delivery of merchandise at the time the merchandise is delivered. The Company honors returns from customers within 30 days from the date of sale and provides allowances for returns based on historical experience. The Company recorded an allowance for sales returns in accrued liabilities of $0.7 million and $0.3 million at March 31, 2012 and 2011, respectively. The Company recognizes service revenue at the time that evidence of an agreement exists, the service is completed, the price is fixed or determinable, and collectability is reasonably assured.
The Company only sells gift cards to its customers in its retail stores. The Company does not charge administrative fees on unused gift cards and the Company’s gift cards do not have an expiration date. Revenue is recognized from gift cards when: (i) the gift card is redeemed by the customer or (ii) the likelihood of the gift card being redeemed by the customer is remote, referred to as gift card breakage, and the Company determines that it does not have a legal obligation to remit the value of unredeemed gift cards to the relevant jurisdictions. The Company determines it’s gift card breakage rate based on historical redemption patterns. Prior to fiscal 2011, the Company did not have sufficient historical data to estimate gift card breakage and thus did not recognize any gift card breakage in earnings. Breakage recognized was not material to the Company’s results of operations during fiscal 2012 or fiscal 2011, and would not have been material to the Company’s results of operations during fiscal 2010.
The Company sells premium service plans (“PSPs”) on appliance and electronic merchandise for periods ranging up to 10 years. For PSPs sold by the Company on behalf of a third party, the net commission revenue is recognized at the time of sale. The Company is not the primary obligor on PSPs sold on behalf of third parties. Funds received for PSPs in which the Company is the primary obligor are deferred in accrued liabilities and other long-term liabilities in the Company’s consolidated balance sheets, and the incremental direct costs of selling the PSP are capitalized and amortized on a straight-line basis over the term of the service agreement. Costs of services performed pursuant to the PSP are expensed as incurred.
The information below provides the changes in the Company’s deferred revenue on extended service agreements for the years ended March 31, 2012, 2011 and 2010 (in thousands):
| 2012 | 2011 | 2010 | ||||||||||
| Deferred revenue on extended service agreements: |
||||||||||||
| Balance at beginning of year |
$ | 485 | $ | 377 | $ | 325 | ||||||
| Revenue deferred on new agreements |
2,403 | 1,945 | 1,459 | |||||||||
| Revenue recognized |
(2,265 | ) | (1,837 | ) | (1,407 | ) | ||||||
|
|
|
|
|
|
|
|||||||
| Balance at end of year |
$ | 623 | $ | 485 | $ | 377 | ||||||
|
|
|
|
|
|
|
|||||||
| (n) | Cost of Goods Sold |
Cost of goods sold is defined as the cost of gross inventory sold, including any handling charges, in-bound freight expenses and physical inventory losses, less the recognized portion of certain vendor allowances. Because the Company does not include costs related to its store distribution facilities, including depreciation expense, in cost of goods sold, the Company’s gross profit may not be comparable to that of other retailers that include these costs in cost of goods sold and in the calculation of gross profit.
| (o) | Selling, General and Administrative Expenses |
Selling, general and administrative expenses includes wages, rent, taxes (other than income taxes), insurance, utilities, delivery costs, distribution costs, service expense, repairs and maintenance of stores and equipment, store opening costs, stock-based compensation and other general administrative expenses.
54
Table of Contents
Shipping and handling costs and expenses of $102.9 million, $84.3 million, and $62.6 million for fiscal 2012, 2011 and 2010, respectively, were included in selling, general, and administrative expenses. Included in these costs were delivery expenses of $51.0 million, $40.9 million, and $29.6 million for the years ended March 31, 2012, 2011, and 2010, respectively.
| (p) | Vendor Allowances |
The Company receives funds from its vendors for various programs including volume purchase rebates, marketing support, markdowns, margin protection, training and sales incentives. Vendor allowances provided as a reimbursement of specific, incremental and identifiable costs incurred to promote a vendor’s products are included as an expense reduction when the cost is incurred. All other vendor allowances are initially deferred and recorded as a reduction of merchandise inventories. The deferred amounts are then included as a reduction of cost of goods sold when the related product is sold.
| (q) | Advertising Costs |
Advertising costs are expensed as incurred, with the exception of television production costs which are expensed the first time the advertisement is aired. These amounts have been reduced by vendor allowances under cooperative advertising which totaled $44.4 million, $40.6 million, and $27.3 million for the years ended March 31, 2012, 2011, and 2010, respectively.
| (r) | Store Opening Costs |
Store opening costs, other than capital expenditures, are expensed as incurred and recorded in selling, general and administrative expenses.
| (s) | Income Taxes |
The Company recognizes deferred tax assets and liabilities for the future tax consequences attributable to differences between the financial statement carrying amounts of existing assets and liabilities and their respective tax bases and operating loss and tax credit carryforwards.
Deferred tax assets and liabilities are measured using enacted tax rates expected to apply to taxable income in the years in which those temporary differences are expected to be recovered or settled. The effect on deferred tax assets and liabilities of a change in tax rates is recognized in income in the period that includes the enactment date.
The Company is subject to U.S. federal and certain state and local income taxes. The Company’s income tax returns, like those of most companies, are periodically audited by federal and state tax authorities. These audits include questions regarding the Company’s tax filing positions, including the timing and amount of deductions and the allocation of income among various tax jurisdictions. At any one time, multiple tax years are subject to audit by the various tax authorities. In evaluating the exposures associated with the Company’s various tax filing positions, the Company records a liability for more likely than not exposures. A number of years may elapse before a particular matter, for which the Company has established a liability, is audited and fully resolved or clarified. The Company adjusts its liability for unrecognized tax benefits and income tax provision in the period in which an uncertain tax position is effectively settled, the statute of limitations expires for the relevant taxing authority to examine the tax position or when more information becomes available.
In assessing the realizability of deferred tax assets, the Company considers whether it is more likely than not that all or some portion of the deferred tax assets will not be realized. The ultimate realization of deferred tax assets is dependent upon the generation of future taxable income during the periods in which those temporary differences become deductible. The Company considers the scheduled reversal of deferred tax liabilities,
55
Table of Contents
projected future taxable income, and tax planning strategies in making this assessment. Based upon the level of historical taxable income and projections for future taxable income over the periods in which temporary differences are expected to reverse, the Company believes it is more likely than not that it will realize the benefits of these deductible differences.
The Company collects certain taxes from their customers at the time of sale and remits the collected taxes to government authorities. These taxes are excluded from net sales and cost of goods sold in the Company’s consolidated statements of income.
| (t) | Stock Based Compensation |
The Company records all stock-based compensation, including grants of employee stock options, using the fair value-based method. As the Company was considered a nonpublic entity at the date of adoption that used the minimum value method for pro forma disclosures under the stock compensation guidance, the Company was required to apply the prospective transition method. As such, the Company applies the guidance to any new awards and to any awards modified, repurchased or cancelled since April 1, 2006. Refer to note 7 for additional information regarding the Company’s stock-based compensation.
| (u) | Derivative Instruments and Hedging Activities |
The Company accounts for derivatives and hedging activities in accordance with accounting guidance on fair value measurements and disclosures, which requires entities to recognize all derivative instruments as either assets or liabilities in the balance sheet at their respective fair values. For derivatives designated as hedges, changes in the fair value are either offset against the change in fair value of the assets and liabilities through earnings, or recognized in accumulated other comprehensive income (loss) until the hedged item is recognized in earnings.
The Company only enters into derivative contracts that it intends to designate as a hedge of a forecasted transaction or the variability of cash flows to be received or paid related to a recognized asset or liability (cash flow hedge). For all hedging relationships the Company formally documents the hedging relationship and its risk- management objective and strategy for undertaking the hedge, the hedging instrument, the hedged item, the nature of the risk being hedged, how the hedging instrument’s effectiveness in offsetting the hedged risk will be assessed prospectively and retrospectively, and a description of the method of measuring ineffectiveness. The Company also formally assesses, both at the hedge’s inception and on an ongoing basis, whether the derivatives that are used in hedging transactions are highly effective in offsetting cash flows of hedged items. Changes in the fair value of a derivative that is highly effective and that is designated and qualifies as a cash-flow hedge are recorded in accumulated other comprehensive income (loss) to the extent that the derivative is effective as a hedge, until earnings are affected by the variability in cash flows of the designated hedged item. The ineffective portion of the change in fair value of a derivative instrument that qualifies as a cash-flow hedge is reported in earnings.
The Company discontinues hedge accounting prospectively when it is determined that the derivative is no longer effective in offsetting cash flows of the hedged item, the derivative expires or is sold, terminated, or exercised, the derivative is no longer designated as a hedging instrument because it is unlikely that a forecasted transaction will occur, or management determines that designation of the derivative as a hedging instrument is no longer appropriate.
In all situations in which hedge accounting is discontinued and the derivative is retained, the Company continues to carry the derivative at its fair value on the balance sheet and recognizes any subsequent changes in its fair value in earnings. When it is probable that a forecasted transaction will not occur, the Company discontinues hedge accounting and recognizes immediately in earnings gains and losses that were accumulated in other comprehensive income (loss).
56
Table of Contents
| (v) | Litigation |
Liabilities for loss contingencies arising from claims, assessments, litigation, fines and penalties and other sources, are recorded when it is probable that a liability has been incurred and the amount of the assessment and/or remediation can be reasonably estimated. Legal costs incurred in connection with loss contingencies are expensed as incurred.
| (w) | Comprehensive Income |
Comprehensive income is computed as net income plus certain other items that are recorded directly to stockholders’ equity. In addition to net income, comprehensive income for the years ended March 31, 2011 and 2010 includes the changes in fair value of the Company’s interest rate swaps, net of tax. Comprehensive income for the years ended March 31, 2012, 2011 and 2010, in thousands, is calculated as follows:
| 2012 | 2011 | 2010 | ||||||||||
| Net income, as reported |
$ | 81,373 | $ | 48,208 | $ | 39,198 | ||||||
| Reclassification adjustment for loss reclassified into income, net of tax |
— | 874 | 1,059 | |||||||||
| Unrealized loss on hedge arrangement, net of tax |
— | (412 | ) | (1,294 | ) | |||||||
| Early termination of hedge arrangement, net of tax |
— | 520 | — | |||||||||
|
|
|
|
|
|
|
|||||||
| Comprehensive income |
$ | 81,373 | $ | 49,190 | $ | 38,963 | ||||||
|
|
|
|
|
|
|
|||||||
| (2) | Fair Value Measurements |
The Company uses a three-tier valuation hierarchy for its fair value measurements based upon observable and non-observable inputs:
Level 1 — unadjusted quoted prices in active markets for identical assets or liabilities that we have the ability to access.
Level 2 — inputs other than quoted market prices included in Level 1 that are observable, either directly or indirectly, for the asset or liability, such as interest rates and yield curves that are observable at commonly quoted intervals.
Level 3 — unobservable inputs for the asset or liability, as there is little, if any, market activity at the measurement date.
Assets and Liabilities that are Measured at Fair Value on a Recurring Basis
The fair value hierarchy requires the use of observable market data when available. In instances in which the inputs used to measure fair value fall into different levels of the fair value hierarchy, the fair value measurement has been determined based on the lowest level input that is significant to the fair value measurement in its entirety. The Company’s assessment of the significance of a particular item to the fair value measurement in its entirety requires judgment, including the consideration of inputs specific to the asset or liability. The Company had no assets or liabilities that were measured at fair value on a recurring basis as of March 31, 2012 or 2011.
Assets and Liabilities that are Measured at Fair Value on a Non-Recurring Basis
During the year ended March 31, 2012, the Company incurred an impairment charge of $0.8 million to record the assets of two stores at their fair value. During the year ended March 31, 2011, the Company incurred an impairment charge of $0.1 million to record the assets of one store at its fair value. The fair value of fixed assets used in the impairment calculations were based on estimated discounted future cash flows, and were based on unobservable inputs for each respective asset or asset group (Level 3). The Company had no other measurements of assets or liabilities at fair value on a non-recurring basis, such as property and equipment, subsequent to their initial recognition.
57
Table of Contents
Fair Value of Financial Instruments
The carrying amounts of cash and cash equivalents, accounts receivable — trade, accounts receivable — other, accounts payable and customer deposits approximate fair value because of the short maturity of these instruments.
| (3) | Derivative Instruments and Hedging Activities |
In October 2009 the Company entered into an interest rate swap agreement to manage its exposure on $75 million of its Term B Facility effective October 2009 with an original expiration date of October 2011. This interest rate swap arrangement was terminated on March 29, 2011 in connection with the repayment of our Term B Facility.
Changes in the fair value of interest rate swaps designated as hedging instruments that effectively offset the variability of cash flows associated with variable-rate, long-term debt obligations are reported in accumulated other comprehensive income (loss). These amounts subsequently are reclassified into interest expense as a yield adjustment of the hedged interest payments in the same period in which the related interest affects earnings.
During the year ended March 31, 2011 the hedge was considered effective and a net unrealized gain of $0.5 million was recorded in other comprehensive income. Upon termination of the hedge on March 29, 2011, the remaining balance in other comprehensive loss was written off and was included in loss related to early extinguishment of debt in the Company’s consolidated statements of income.
| (4) | Inventories |
Net inventories consisted of the following at March 31, 2012 and 2011 (in thousands):
| 2012 | 2011 | |||||||
| Appliances |
$ | 102,703 | $ | 77,369 | ||||
| Video |
88,191 | 78,578 | ||||||
| Computing and mobile phones |
41,615 | 14,844 | ||||||
| Other |
49,900 | 41,217 | ||||||
|
|
|
|
|
|||||
| $ | 282,409 | $ | 212,008 | |||||
|
|
|
|
|
|||||
| (5) | Debt |
A summary of debt at March 31, 2012 and 2011 is as follows (in thousands):
| March 31, 2012 |
March 31, 2011 |
|||||||
| Revolving Credit Facility |
$ | — | $ | — | ||||
Senior Secured Term Loan
On July 25, 2007, Gregg Appliances entered into a senior credit agreement (the “Term B Facility”) with a bank group obtaining $100 million senior secured term loan B maturing on July 25, 2013. On March 29, 2011, Gregg Appliances repaid the Term B Facility loan balance in full using excess cash. In connection with this repayment, the Company recorded a pre-tax loss related to the early extinguishment of debt of $1.8 million, which was primarily due to the write off of capitalized debt issuance costs and the termination of an interest rate swap arrangement.
58
Table of Contents
Revolving Credit Facility
On July 25, 2007, Gregg Appliances entered into an Amended and Restated Loan and Security Agreement (“Revolving Credit Facility”) with a bank group for up to $100 million. On September 15, 2009, Gregg Appliances entered into Amendment No. 1 and Joinder to the Amended and Restated Loan and Security Agreement (“Amendment No. 1”) with a bank group, which increased the maximum amount available under the Revolving Credit Facility from $100 million to $125 million, subject to borrowing base availability. On March 29, 2011, Gregg Appliances entered into an Amended and Restated Loan and Security Agreement (the “Amended Facility”). The Amended Facility increased the maximum credit available from $125 million to $300 million, subject to borrowing base availability, and extended the term of the facility to March 29, 2016. In connection with the amendment, the Company recorded a pre-tax loss related to the early extinguishment of debt of $0.3 million, which was primarily due to the write off of capitalized debt issuance costs.
Interest (other than Eurodollar rate borrowings) on borrowings is payable monthly at a fluctuating rate based on the bank’s prime rate or LIBOR plus an applicable margin. Interest on Eurodollar rate borrowings is payable on the last day of each “interest period” applicable to such borrowing or on the three month anniversary of the beginning of such “interest period” for interest periods greater than three months. The unused line rate is determined based on the amount of the daily average of the outstanding borrowings for the immediately preceding calendar quarter period (the “Daily Average”). For a Daily Average greater than or equal to 50% of the defined borrowing base, the unused line rate is 0.375%. For a Daily Average less than 50% of the defined borrowing base, the unused line rate is 0.50%. The Amended Facility is guaranteed by Gregg Appliances’ wholly-owned subsidiary, HHG Distributing LLC (HHG), which has no assets or operations. The guarantee is full and unconditional and Gregg Appliances has no other subsidiaries.
Pursuant to the Amended Facility, the borrowing base was modified to equal the sum of (i) the lesser of (a) 90% of the net orderly liquidation value of all eligible inventory of Gregg Appliances or (b) 75% of the net book value of such eligible inventory and (ii) 90% of all commercial and credit card receivables of Gregg Appliances, in each case subject to customary reserves and eligibility criteria. The Amended Facility required payment to the lenders of a commitment fee of approximately $1.1 million.
Under the Amended Facility, Gregg Appliances is not required to comply with any financial maintenance covenant unless “excess availability” is less than the greater of (i) 10.0% of the lesser of (A) the defined borrowing base or (B) the defined maximum credit or (ii) $15.0 million until September 30, 2012 and $20.0 million thereafter, during the continuance of which event Gregg Appliances is subject to compliance with a fixed charge coverage ratio of 1.0 to 1.0.
Pursuant to the Amended Facility, if Gregg Appliances has “excess availability” less than 12.5% of the lesser of (A) the defined borrowing base or (B) the defined maximum credit, it may, in certain circumstances more specifically described in the Amended Facility, become subject to cash dominion control.
The Amended Facility places limitations on the ability of Gregg Appliances to, among other things, incur debt, create other liens on its assets, make investments, sell assets, pay dividends, undertake transactions with affiliates, enter into merger transactions, enter into unrelated businesses, open collateral locations outside of the United States, or enter into consignment assignments or floor plan financing arrangements. The Amended Facility also contains various customary representations and warranties, financial and collateral reporting requirements and other affirmative and negative covenants. Gregg Appliances was in compliance with the restrictions and covenants in the Amended Facility at March 31, 2012.
As of March 31, 2012 under the Amended Facility, Gregg Appliances had no borrowings outstanding and $5.2 million of letters of credit outstanding, which expire through December 31, 2012. As of March 31, 2012, the total borrowing availability under the Amended Facility was $175.0 million. The interest rate based on the bank’s prime rate as of March 31, 2012 was 4.25%.
59
Table of Contents
As of March 31, 2011 under the Amended Facility, Gregg Appliances had no borrowings outstanding and $4.8 million of letters of credit outstanding, which expired through December 31, 2011. As of March 31, 2011, the total borrowing availability under the Amended Facility was $127.1 million. The interest rate based on the bank’s prime rate as of March 31, 2011 was 4.5%.
| (6) | Income Taxes |
Income tax expense for the years ended March 31, 2012, 2011 and 2010 consisted of the following (in thousands):
| 2012 | 2011 | 2010 | ||||||||||
| Current: |
||||||||||||
| Federal |
$ | 12,428 | $ | 14,715 | $ | 9,741 | ||||||
| State |
3,982 | 4,695 | 2,713 | |||||||||
|
|
|
|
|
|
|
|||||||
| Total current |
16,410 | 19,410 | 12,454 | |||||||||
|
|
|
|
|
|
|
|||||||
| Deferred: |
||||||||||||
| Federal |
8,960 | 11,384 | 10,605 | |||||||||
| State |
422 | 228 | 1,283 | |||||||||
|
|
|
|
|
|
|
|||||||
| Total deferred |
9,382 | 11,612 | 11,888 | |||||||||
|
|
|
|
|
|
|
|||||||
| Total expense |
$ | 25,792 | $ | 31,022 | $ | 24,342 | ||||||
|
|
|
|
|
|
|
|||||||
Deferred income taxes at March 31, 2012 and 2011 consisted of the following (in thousands):
| 2012 | 2011 | |||||||
| Deferred tax assets: |
||||||||
| Goodwill for tax purposes |
$ | 51,629 | $ | 58,367 | ||||
| Accrued expenses |
10,456 | 8,848 | ||||||
| Long-term deferred compensation |
2,219 | 2,397 | ||||||
| Inventories |
2,995 | 2,273 | ||||||
| Stock-compensation expense |
6,261 | 4,163 | ||||||
| Other |
2,007 | 1,062 | ||||||
| Credit carryforwards |
2,691 | 303 | ||||||
|
|
|
|
|
|||||
| Total deferred tax assets |
78,258 | 77,413 | ||||||
|
|
|
|
|
|||||
| Deferred tax liabilities: |
||||||||
| Property and equipment |
28,667 | 18,482 | ||||||
| Other |
982 | 940 | ||||||
|
|
|
|
|
|||||
| Total deferred tax liabilities |
29,649 | 19,422 | ||||||
|
|
|
|
|
|||||
| Net deferred tax assets |
$ | 48,609 | $ | 57,991 | ||||
|
|
|
|
|
|||||
At March 31, 2012 and 2011, the Company had no net operating loss carryforwards for federal or state income tax purposes and the Company had no liability for unrecognized tax benefits. At March 31, 2012, the Company had an Alternative Minimum Tax credit carryforward of $2.4 million.
The Company recognizes interest and penalties in income tax expense in its consolidated statements of income. At March 31, 2012 and 2011, the Company had no accrued interest and penalties.
The Company files a consolidated U.S. federal income tax return, as well as income tax returns in various states. With few exceptions, the Company is no longer subject to U.S. federal, state and local income tax examinations by tax authorities for years before fiscal 2009.
60
Table of Contents
The expense (benefit) for income taxes differs from the amount of income tax determined by applying the U.S. federal income tax rate of 35% to income before income taxes due to the following (in thousands):
| 2012 | 2011 | 2010 | ||||||||||
| Computed “expected” tax expense |
$ | 37,508 | $ | 27,730 | $ | 22,239 | ||||||
| State income tax expense, net of federal income tax benefit |
2,901 | 3,200 | 2,648 | |||||||||
| Non-taxable Life Insurance Proceeds |
(14,000 | ) | — | — | ||||||||
| Other |
(617 | ) | 92 | (545 | ) | |||||||
|
|
|
|
|
|
|
|||||||
| $ | 25,792 | $ | 31,022 | $ | 24,342 | |||||||
|
|
|
|
|
|
|
|||||||
| (7) | Stock-based Compensation |
Stock Options
The Company maintains stock-based compensation plans which allow for the issuance of non-qualified stock options and restricted stock to officers, other key employees and members of the Board of Directors. On April 12, 2007, the Company’s Board of Directors approved the adoption of the hhgregg, Inc. 2007 Equity Incentive Plan (“Equity Incentive Plan”). The Equity Incentive Plan provides for the grant of nonqualified stock options, incentive stock options, stock appreciation rights, awards of restricted stock, awards of restricted stock units, awards of performance units, and stock grants. On June 23, 2010, an amendment (the “Amendment”) to the Equity Incentive Plan was adopted by the Company’s Board of Directors that increased the number of shares of common stock reserved for issuance under the Equity Incentive Plan from 3,000,000 to 6,000,000. The Amendment was ratified and approved by the Company’s stockholders at the annual meeting of stockholders on August 3, 2010. If an option expires, is terminated or canceled without having been exercised or repurchased by the Company, or common stock is used to exercise an option, the terminated portion of the option or the common stock used to exercise the option will become available for future grants under the Equity Incentive Plan unless the plan is terminated. The term of the Company’s Equity Incentive Plan commenced on the date of approval by the Company’s Board of Directors and continues until the tenth anniversary of the approval by the Company’s Board of Directors. The Company’s Equity Incentive Plan is administered by the Company’s Compensation Committee. Prior to the Equity Incentive Plan being adopted, the Company utilized the Gregg Appliances, Inc. 2005 Stock Option Plan (Stock Option Plan). The Stock Option Plan provided for the grant of incentive stock options and nonqualified stock options to the Company’s officers, directors, consultants, and key employees.
During the years ended March 31, 2012, 2011 and 2010, the Company granted options for 813,400, 805,000 and 761,000 shares of common stock respectively under the Equity Incentive Plan to certain employees and directors of the Company. The options vest in equal amounts over a three-year period beginning on the first anniversary of the date of grant and expire seven years from the date of the grant. The Company estimated the fair value of stock options using the Black-Scholes valuation model. The fair value of each option grant is estimated on the date of grant and is amortized on a straight-line basis over the vesting period. The option exercise price is equal to the fair market value of a share of common stock on the date of the grant of the option.
The weighted-average estimated fair value of options granted to employees and directors under the Equity Incentive Plan was $6.06, $11.10 and $6.75 during the 12 months ended March 31, 2012, 2011 and 2010, respectively, using the Black-Scholes model with the following weighted average assumptions:
| March 31, 2012 | March 31, 2011 | March 31, 2010 | ||||||||||
| Risk-free interest rate |
1.3 | % | 1.9 | % | 2.6 | % | ||||||
| Dividend yield |
— | — | — | |||||||||
| Expected volatility |
52.18 | % | 45.50 | % | 51.00 | % | ||||||
| Expected life of the options (years) |
4.5 | 4.5 | 4.5 | |||||||||
61
Table of Contents
Activity under the stock option plans is summarized as follows:
| Shares | Weighted Average Exercise Price |
Weighted Average Remaining Contractual Life |
Aggregate Intrinsic Value (in thousands) |
|||||||||||||
| Outstanding at March 31, 2011 |
3,393,068 | $ | 15.20 | |||||||||||||
| Granted |
813,400 | 13.85 | ||||||||||||||
| Exercised |
(340,335 | ) | 7.24 | |||||||||||||
| Canceled or forfeited |
(164,662 | ) | 20.46 | |||||||||||||
| Expired |
(27,609 | ) | 16.50 | |||||||||||||
|
|
|
|
|
|||||||||||||
| Outstanding at March 31, 2012 |
3,673,862 | $ | 15.40 | 3.63 | $ | 2,456 | ||||||||||
| Vested or expected to vest at March 31, 2012 |
3,633,755 | 15.39 | 3.60 | 2,454 | ||||||||||||
| Exercisable at March 31, 2012 |
2,253,012 | $ | 13.45 | 2.36 | $ | 2,428 | ||||||||||
The following table summarizes stock option vesting activity during the fiscal year ended March 31, 2012:
| Nonvested shares |
Shares | Weighted Average Grant-Date Fair Value |
||||||
| Nonvested at March 31, 2011 |
1,444,950 | $ | 8.94 | |||||
| Granted during fiscal 2012 |
813,400 | 6.06 | ||||||
| Vested during fiscal 2012 |
(672,838 | ) | 8.06 | |||||
| Canceled during fiscal 2012 |
(164,662 | ) | 8.50 | |||||
|
|
|
|
|
|||||
| Nonvested at March 31, 2012 |
1,420,850 | $ | 7.75 | |||||
During fiscal 2012, 2011 and 2010, $5.7 million ($3.4 million net of tax), $5.2 million ($3.1 million net of tax) and $3.5 million ($2.1 million net of tax), respectively, was charged to expense related to the stock option plans. The total intrinsic value of options exercised during the years ended March 31, 2012, 2011 and 2010 was $2.5 million, $39.0 million and $8.5 million, respectively. Total unrecognized stock option compensation cost (adjusted for forfeitures) at March 31, 2012 was $7.1 million and is expected to be recognized over a weighted average period of 1.7 years. Net cash proceeds from the exercise of stock options were $2.5 million, $5.0 million and $4.7 in fiscal 2012, 2011 and 2010, respectively. The total grant date fair value of stock options vested during the years ended March 31, 2012, 2011 and 2010 was $5.4 million, $3.5 million and $2.7 million, respectively.
Time Vested Restricted Stock Units
During the fiscal year ended March 31, 2012, the Company granted 81,300 time vested restricted stock units (“RSUs”) under the 2007 Equity Incentive Plan to certain employees and directors of the Company. The time vested RSUs vest three years from the date of grant. Upon vesting, the outstanding number of time vested RSUs will be converted into shares of common stock. Time vested RSUs are forfeited if they have not vested before the employment of the holder terminates for any reason other than death or total permanent disability or certain other circumstances as described in the agreement. Upon death or disability, the holder is entitled to receive a fractional portion of the award based upon the period of time lapsed between the date of grant of the time vested RSU and the termination of employment. The fair value of time vested RSU awards is based on the Company’s stock price at the close of market on the date of grant. The weighted average grant date fair value for the time vested RSUs issued during the fiscal year ended March 31, 2012 was $14.18. During fiscal 2012, $0.3 million ($0.2 million net of tax) was charged to expense related to the RSUs.
62
Table of Contents
The following table summarizes RSU vesting activity during the fiscal year ended March 31, 2012:
| Nonvested RSU’s |
Shares | Weighted Average Grant-Date Fair Value |
||||||
| Nonvested at March 31, 2011 |
— | $ | — | |||||
| Granted during fiscal 2012 |
81,300 | 14.18 | ||||||
| Vested during fiscal 2012 |
(933 | ) | 14.20 | |||||
| Forfeited during fiscal 2012 |
(7,467 | ) | 14.20 | |||||
|
|
|
|
|
|||||
| Nonvested at March 31, 2012 |
72,900 | $ | 14.17 | |||||
Performance-Based Restricted Stock Units
The Company awarded performance-based RSUs to certain officers of the Company during the fiscal year ended March 31, 2012. Under these awards, a number of performance-based RSUs will be granted to each participant based upon the attainment of the applicable bonus targets as approved by the Company’s Compensation Committee. Performance-based RSUs are earned shortly after the end of the performance measurement period and vest three years after grant date. If a participant is not employed by the Company on the date the performance-based RSUs vest, the performance-based RSUs are forfeited, except in the case of death or total permanent disability or certain other circumstances as described in the agreement. Upon death or disability, the holder is entitled to receive a fractional portion of the award based upon the period of time lapsed between the date of grant of the performance-based RSU and the termination of employment if the applicable performance target was achieved. Additionally, to the extent performance conditions are not met, performance-based RSUs are forfeited.
During the fiscal year ended March 31, 2012, the Company granted 76,440 performance-based RSUs. The fair value of performance-based RSUs is based on the Company’s stock price at the close of market on the date of grant and the probability that the established bonus targets will be achieved. The weighted average grant date fair value for the performance-based RSUs outstanding for the fiscal year ended March 31, 2012 was $14.14. The Company did not charge any expense related to the performance-based RSUs during fiscal 2012 as the Company did not achieve the applicable predetermined targets, which resulted in the forfeiture of all performance-based RSUs granted during fiscal year 2012.
63
Table of Contents
| (8) | Net Income per Share |
Basic net income per share is calculated based on the weighted-average number of outstanding common shares. Diluted net income per share is calculated based on the weighted-average number of outstanding common shares plus the effect of potential dilutive common shares. When the Company reports net income, the calculation of diluted net income per share excludes shares underlying outstanding stock options and restricted stock units with exercise prices that exceed the average market price of the Company’s common stock for the period and certain options and restricted stock units with unrecognized compensation cost, as the effect would be antidilutive. Potential common shares are composed of shares of common stock issuable upon the exercise of stock options and restricted stock units. The following table presents basic and diluted net income per share for the years ended March 31, 2012, 2011 and 2010 (in thousands, except share and per share amounts):
| 2012 | 2011 | 2010 | ||||||||||
| Net income, as reported (A) |
$ | 81,373 | $ | 48,208 | $ | 39,198 | ||||||
| Weighted average outstanding shares of common stock (B) |
37,749,354 | 39,394,708 | 36,649,515 | |||||||||
| Dilutive effect of employee stock options and RSUs |
330,331 | 973,515 | 1,340,693 | |||||||||
|
|
|
|
|
|
|
|||||||
| Common stock and common stock equivalents (C) |
38,079,685 | 40,368,223 | 37,990,208 | |||||||||
| Net income per share: |
||||||||||||
| Basic (A/B) |
$ | 2.16 | $ | 1.22 | $ | 1.07 | ||||||
| Diluted (A/C) |
$ | 2.14 | $ | 1.19 | $ | 1.03 | ||||||
Antidilutive shares not included in the diluted per share calculation for the years ended March 31, 2012, 2011 and 2010 were 2,660,197, 797,500 and 753,000, respectively.
| (9) | Leases |
The composition of net rent expense for all operating leases, including leases of property and equipment, was as follows for the years ended March 31, 2012, 2011 and 2010 (in thousands):
| 2012 | 2011 | 2010 | ||||||||||
| Minimum rentals |
$ | 76,497 | $ | 64,597 | $ | 46,223 | ||||||
| Minimum rentals with related parties |
6,118 | 6,095 | 5,678 | |||||||||
| Contingent rentals |
147 | 116 | 479 | |||||||||
|
|
|
|
|
|
|
|||||||
| Total rent expense |
$ | 82,792 | $ | 70,808 | $ | 52,380 | ||||||
|
|
|
|
|
|
|
|||||||
Future minimum required rental payments for noncancelable operating leases, with terms of one year or more, consist of the following as of March 31, 2012 (in thousands):
| Rental Payments |
||||
| Payable in fiscal year: |
||||
| 2013 |
$ | 86,162 | ||
| 2014 |
84,832 | |||
| 2015 |
82,366 | |||
| 2016 |
78,706 | |||
| 2017 |
76,368 | |||
| Thereafter |
288,907 | |||
|
|
|
|||
| Total required payments |
$ | 697,341 | ||
|
|
|
|||
64
Table of Contents
| (10) | Related Party Transactions |
The Company had a consulting agreement with a member of the former Executive Chairman and Director of the Company’s immediate family. Payments on the agreement were not material for the year ended March 31, 2010. The agreement expired on February 3, 2010.
The Company also has several leases with the former Executive Chairman and Director of the Company and members of his immediate family for its headquarters and certain stores. See note 9 for discussion of minimum rentals with related parties.
| (11) | Employee Benefit Plans |
The Company sponsors a 401(k) retirement savings plan covering all employees who have attained the age of 21 and have worked at least 1,000 hours within a 12-month period. Plan participants may elect to contribute 1% to 12% of their compensation to the Plan, subject to IRS limitations. The Company provides a discretionary matching contribution up to 7% of each participant’s compensation, with total Company expense, including payment of administrative fees, aggregating approximately $0.7 million, $0.4 million, and $0.4 million for the years ended March 31, 2012, 2011, and 2010, respectively.
The Company has an unfunded, non-qualified deferred compensation plan for members of executive management. Benefits accrue to individual participants annually based on a predetermined formula, as defined, which considers operating results of the Company and the participant’s base salary. Vesting of benefits is attained upon reaching 55 years of age or 10 years of continuous service, measurement of which is retroactive to the participant’s most recent start date. Annual interest is credited to participant accounts at an interest rate determined at the sole discretion of the Company. Benefits will be paid to individual participants upon the later of terminating employment with the Company or the participant attaining the age of 55. The Company recorded $0.2 million in expense related to this plan for the year ended March 31, 2012 representing interest earned, but did not contribute additional amounts as the Company did not achieve the predetermined operating results target. The Company recorded approximately $0.9 million and $0.8 million in expenses related to this plan for the years ended March 31, 2011 and 2010, respectively. Amounts accrued in other long-term liabilities at March 31, 2012 and 2011 were as follows:
| 2012 | 2011 | |||||||
| Beginning accrual |
$ | 6,054 | $ | 5,417 | ||||
| Annual benefit accrual |
— | 768 | ||||||
| Credited annual interest |
151 | 151 | ||||||
| Payments to vested participants |
(456 | ) | (216 | ) | ||||
| Plan forfeitures |
(131 | ) | (66 | ) | ||||
|
|
|
|
|
|||||
| Ending accrual |
$ | 5,618 | $ | 6,054 | ||||
|
|
|
|
|
|||||
| (12) | Legal Proceedings |
The Company is engaged in various legal proceedings in the ordinary course of business and has certain unresolved claims pending. The ultimate liability, if any, for the aggregate amounts claimed cannot be determined at this time. However, management believes, based on the examination of these matters and experiences to date, that the ultimate liability, if any, in excess of amounts already provided for in the consolidated financial statements is not likely to have a material effect on the Company’s consolidated financial position, results of operations or cash flows.
65
Table of Contents
| (13) | Interim Financial Results (Unaudited) |
The following table sets forth certain unaudited quarterly information for each of the eight fiscal quarters for the years ended March 31, 2012 and 2011 (in thousands). In management’s opinion, this unaudited quarterly information has been prepared on a consistent basis with the audited financial statements and includes all necessary adjustments, consisting only of normal recurring adjustments that management considers necessary for a fair presentation of the unaudited quarterly results when read in conjunction with the consolidated financial statements.
| For the Year Ended March 31, 2012 | ||||||||||||||||
| First Quarter | Second Quarter | Third Quarter | Fourth Quarter | |||||||||||||
| Net sales |
$ | 431,455 | $ | 618,603 | $ | 829,546 | $ | 613,788 | ||||||||
| Cost of goods sold |
301,141 | 441,924 | 603,640 | 426,299 | ||||||||||||
|
|
|
|
|
|
|
|
|
|||||||||
| Gross profit |
130,314 | 176,679 | 225,906 | 187,489 | ||||||||||||
| Selling, general and administrative expenses |
103,244 | 127,676 | 140,609 | 127,071 | ||||||||||||
| Net advertising expense |
20,195 | 30,466 | 39,488 | 27,274 | ||||||||||||
| Depreciation and amortization expense |
7,287 | 8,184 | 8,765 | 9,516 | ||||||||||||
| Life insurance proceeds |
— | — | — | (40,000 | ) | |||||||||||
| Asset impairment charge |
— | — | — | 813 | ||||||||||||
|
|
|
|
|
|
|
|
|
|||||||||
| (Loss) income from operations |
(412 | ) | 10,353 | 37,044 | 62,815 | |||||||||||
| Other expense (income): |
||||||||||||||||
| Interest expense |
512 | 571 | 881 | 694 | ||||||||||||
| Interest income |
(4 | ) | — | (1 | ) | (18 | ) | |||||||||
|
|
|
|
|
|
|
|
|
|||||||||
| Total other expense |
508 | 571 | 880 | 676 | ||||||||||||
|
|
|
|
|
|
|
|
|
|||||||||
| (Loss) income before income taxes |
(920 | ) | 9,782 | 36,164 | 62,139 | |||||||||||
| Income tax (benefit) expense |
(159 | ) | 3,756 | 13,686 | 8,509 | |||||||||||
|
|
|
|
|
|
|
|
|
|||||||||
| Net (loss) income |
$ | (761 | ) | $ | 6,026 | $ | 22,478 | $ | 53,630 | |||||||
|
|
|
|
|
|
|
|
|
|||||||||
| Net (loss) income per share |
||||||||||||||||
| Basic |
$ | (0.02 | ) | $ | 0.16 | $ | 0.60 | $ | 1.46 | |||||||
| Diluted |
$ | (0.02 | ) | $ | 0.16 | $ | 0.60 | $ | 1.45 | |||||||
| For the Year Ended March 31, 2011 | ||||||||||||||||
| First Quarter | Second Quarter | Third Quarter | Fourth Quarter | |||||||||||||
| Net sales |
$ | 435,975 | $ | 480,926 | $ | 653,731 | $ | 507,019 | ||||||||
| Cost of goods sold |
303,587 | 336,594 | 460,190 | 347,520 | ||||||||||||
|
|
|
|
|
|
|
|
|
|||||||||
| Gross profit |
132,388 | 144,332 | 193,541 | 159,499 | ||||||||||||
| Selling, general and administrative expenses |
100,847 | 106,201 | 118,110 | 104,665 | ||||||||||||
| Net advertising expense |
19,959 | 23,897 | 22,939 | 20,545 | ||||||||||||
| Depreciation and amortization expense |
5,879 | 6,514 | 6,944 | 6,901 | ||||||||||||
| — | — | — | 88 | |||||||||||||
|
|
|
|
|
|
|
|
|
|||||||||
| Income from operations |
5,703 | 7,720 | 45,548 | 27,300 | ||||||||||||
| Other expense (income): |
||||||||||||||||
| Interest expense |
1,211 | 1,240 | 1,288 | 1,253 | ||||||||||||
| Interest income |
(5 | ) | (9 | ) | (5 | ) | (3 | ) | ||||||||
| Loss related to early extinguishment of debt |
— | — | — | 2,071 | ||||||||||||
|
|
|
|
|
|
|
|
|
|||||||||
| Total other expense |
1,206 | 1,231 | 1,283 | 3,321 | ||||||||||||
|
|
|
|
|
|
|
|
|
|||||||||
| Income before income taxes |
4,497 | 6,489 | 44,265 | 23,979 | ||||||||||||
| Income tax expense |
1,773 | 2,552 | 17,352 | 9,345 | ||||||||||||
|
|
|
|
|
|
|
|
|
|||||||||
| Net income |
$ | 2,724 | $ | 3,937 | $ | 26,913 | $ | 14,634 | ||||||||
|
|
|
|
|
|
|
|
|
|||||||||
| Net income per share |
||||||||||||||||
| Basic |
$ | 0.07 | $ | 0.10 | $ | 0.68 | $ | 0.37 | ||||||||
| Diluted |
$ | 0.07 | $ | 0.10 | $ | 0.66 | $ | 0.36 | ||||||||
66
Table of Contents
| (14) | Stockholders’ Equity |
On July 24, 2007, hhgregg completed an initial public offering of 9,375,000 shares of its common stock, 5,625,000 of which were sold by certain selling stockholders. Additionally, as part of the initial public offering, 28,491,600 shares of Gregg Appliances were converted into shares of hhgregg.
The Company filed a universal shelf registration statement which was declared effective on July 14, 2009, registering $200 million principal amount of its securities which may be sold by hhgregg under such registration statement at any time. Each of Gregg Appliances and HHG Distributing were additional registrants to the shelf registration statement because each may guaranty any debt securities that are issued by hhgregg under the shelf registration statement. Gregg Appliances and HHG Distributing are exempt from reporting under the Securities Exchange Act of 1934, as amended (the Exchange Act), pursuant to Rule 12h-5 under the Exchange Act as: (i) hhgregg has no independent assets or operations; (ii) any guarantees of the subsidiary guarantors of debt securities issued under the shelf registration statement are full and unconditional and joint and several: and (iii) there are no subsidiaries of hhgregg other than Gregg Appliances and HHG Distributing.
During the fiscal year ended March 31, 2010, the Company consummated an underwritten public offering of 4,025,000 shares of its common stock under the $200 million shelf-registration statement and a private placement of an aggregate of 1,000,000 shares of its common stock which resulted in aggregate proceeds, net of underwriting and placement fees, to the Company of approximately $78.1 million. As of March 31, 2012, there were 36,351,716 basic shares outstanding.
On May 19, 2011, the Company’s Board of Directors authorized a share repurchase program allowing it to repurchase up to $50 million of its common stock. The share repurchase program allows the Company to purchase its common stock on the open market or in privately negotiated transactions in accordance with applicable laws and regulations, and expires on May 19, 2012. During the twelve months ended March 31, 2012, the Company repurchased 3,714,289 shares of its common stock at an aggregate cost of $47.6 million, or an average price of $12.81 per share. As of March 31, 2012, the Company had $2.4 million remaining under the $50 million share repurchase program. The repurchased shares are classified as treasury stock within stockholders’ equity in the accompanying condensed consolidated balance sheet.
| (15) | Life Insurance Proceeds |
During the fiscal year ended March 31, 2012, the Company received $40.0 million in proceeds on a key man life insurance policy that was held on our Executive Chairman of the Board, who passed away on January 22, 2012. The proceeds were non-taxable and are recorded in income from operations in the accompanying consolidated statements of income for fiscal 2012.
67
Table of Contents
| ITEM 9. | Changes in and Disagreements with Accountants on Accounting and Financial Disclosure. |
None.
| ITEM 9A. | Controls and Procedures. |
Disclosure Controls and Procedures
We maintain disclosure controls and procedures that are designed to ensure that information required to be disclosed by us in the reports we file or submit under the Exchange Act is recorded, processed, summarized and reported within the time periods specified in the SEC’s rules and forms, and that such information is accumulated and communicated to our management, including our Chief Executive Officer (principal executive officer) and Chief Financial Officer (principal financial officer), to allow timely decisions regarding required disclosure. We have established a Disclosure Committee, consisting of certain members of management, to assist in this evaluation. Our Disclosure Committee meets on a quarterly basis and more often if necessary.
Our management, including our Chief Executive Officer and Chief Financial Officer, evaluated the effectiveness of our disclosure controls and procedures (as defined in Rules 13a-15(e) and 15d-15(e) promulgated under the Exchange Act), as of March 31, 2012. Based on that evaluation, our Chief Executive Officer and Chief Financial Officer concluded that, as of March 31, 2012, our disclosure controls and procedures were effective.
Management’s Report on Internal Control over Financial Reporting
Management’s report on our internal control over financial reporting is included in Item 8, Financial Statements and Supplementary Data, of this Annual Report on Form 10-K.
Report on Independent Registered Public Accounting Firm
The report of KPMG LLP, our independent registered public accounting firm, on the effectiveness of our internal control over financial reporting is included in Item 8, Financial Statements and Supplementary Data, of this Annual Report on Form 10-K.
Changes in Internal Control Over Financial Reporting
During the fiscal quarter ended March 31, 2012, there was no change in our internal control over financial reporting that has materially affected, or is reasonably likely to materially affect, our internal control over financial reporting.
| ITEM 9B. | Other Information |
None.
68
Table of Contents
| Item 10. | Directors, Executive Officers and Corporate Governance. |
See the information set forth in the sections entitled “Proposal No. 1 — Election of Directors,” “Corporate Governance Matters and Committees of the Board,” “Report of the Audit Committee of the Board of Directors,” “Section 16(a) Beneficial Ownership Reporting Compliance,” and “Non-Director Named Officers” in our proxy statement for the 2012 annual meeting of stockholders to be filed with the SEC within 120 days after the end of the fiscal year ended March 31, 2012 (the “2012 Proxy Statement”), which is incorporated herein by reference.
| Item 11. | Executive Compensation. |
See information set forth under the captions “Compensation Committee Report,” “Compensation Discussion and Analysis” and “Executive Compensation” in the 2012 Proxy Statement which is incorporated herein by reference.
| Item 12. | Security Ownership of Certain Beneficial Owners and Management and Related Stockholder Matters. |
See the information set forth in the sections entitled “Security Ownership of Certain Beneficial Owners and Management” and “Securities Authorized for Issuance Under Equity Compensation Plans” in the 2012 Proxy Statement, which is incorporated herein by reference.
| Item 13. | Certain Relationships and Related Transactions, and Director Independence. |
See the information provided under the captions “Director Independence,” and “Certain Relationships and Related Party Transactions” in the 2012 Proxy Statement, which is incorporated herein by reference.
| Item 14. | Principal Accounting Fees and Services. |
See the information provided under the caption “Ratification of Appointment of our Independent Registered Public Accountants” in the 2012 Proxy Statement, which is incorporated herein by reference.
69
Table of Contents
| Item 15. | Exhibits and Financial Statement Schedules |
| (a)(1) | Consolidated Financial Statements of hhgregg, Inc. and subsidiaries are incorporated under Item 8 of this Form 10-K. | |
| (a)(2) | Financial Statements and Schedules | |
| Schedules have been omitted because they are not applicable, are not required or the information required to be set forth therein is included in the Consolidated Financial Statements and Notes thereto. | ||
| (a)(3) | Exhibits | |
| Exhibit |
Description of Document | |
| 3.1 (1) | Certificate of Incorporation of the Company. | |
| 3.2 (1) | Bylaws of the Company. | |
| 4.1 (2) | Specimen stock certificate for shares of common stock of the Company. | |
| 4.2 (1) | Registration Rights Agreement, dated April 12, 2007, by and among FSEP V, FSA V, CalSTRS, ASF, the Throgmartin Trust, Jerry W. Throgmartin, Gregg William Throgmartin, Dennis L. May and the Company. | |
| 10.1 (1) | Employment Agreement, dated October 19, 2004, between Gregg Appliances and Jerry W. Throgmartin. | |
| 10.2 (1) | Amendment No. 1 to Employment Agreement, dated April 12, 2007, between Gregg Appliances and Jerry W. Throgmartin. | |
| 10.3 (1) | Employment Agreement, dated October 19, 2004, between Gregg Appliances and Dennis L. May. | |
| 10.4 (1) | Gregg Appliances Nonqualified Deferred Compensation Plan, dated April 1, 2000. | |
| 10.5 (1) | Amendment No. 1 to Gregg Appliances Nonqualified Deferred Compensation Plan, dated December 26, 2004. | |
| 10.6 (1) | Non-Standardized Adoption Agreement of Gregg Appliances, dated January 29, 2005. | |
| 10.7 (1) | Trademark Collateral Assignment and Security Agreement, dated February 3, 2005 between Gregg Appliances and Wells Fargo Bank, National Association (as successor-in-interest to Congress Financial Corporation). | |
| 10.9 (1) | Gregg Appliances Inc. 2005 Stock Option Plan, dated March 8, 2005. | |
| 10.10 (1) | Amendment No. 1 to 2005 Stock Option Plan, dated April 12, 2007. | |
| 10.11 (1) | hhgregg, Inc. Equity Incentive Plan. | |
| 10.15 (3) | Form of Indemnity Agreement. | |
| 10.16 (3) | Form of hhgregg, Inc. Equity Incentive Plan Option Award. | |
| 10.17 (3) | Employment Agreement, dated June 1, 2008, between Gregg Appliances Inc. and Michael D. Stout | |
| 10.18 (3) | Employment Agreement, dated June 1, 2008, between Gregg Appliances Inc. and Stephen R. Nelson | |
| 10.19 (3) | Employment Agreement, dated June 1, 2008, between Gregg Appliances Inc. and Charles B. Young | |
| 10.20 (3) | Employment Agreement, dated June 1, 2008, between Gregg Appliances Inc. and Gregg W. Throgmartin | |
70
Table of Contents
| Exhibit |
Description of Document | |
| 10.21 (3) | Employment Agreement, dated June 1, 2008, between Gregg Appliances Inc. and Jeffrey J. McClintic | |
| 10.22 (3) | Employment Agreement, dated June 1, 2008, between Gregg Appliances Inc. and Michael G. Larimer | |
| 10.23 (4) | Amendment No. 2 to Employment Agreement dated December 29, 2008 between Gregg Appliances and Jerry W. Throgmartin | |
| 10.24 (4) | Amendment No. 1 to the Employment Agreement dated December 30, 2008 between Gregg Appliances and Dennis L. May | |
| 10.25 (5) | Stock Subscription Agreement dated July 15, 2009 | |
| 10.26 (6) | Amendment No. 3 to Employment Agreement dated August 5, 2009 between Gregg Appliances and Jerry W. Throgmartin | |
| 10.27 (6) | Amendment No. 2 to the Employment Agreement dated August 5, 2009 between Gregg Appliances and Dennis L. May | |
| 10.28 (7) | Employment Agreement, dated September 4, 2009, between Gregg Appliances Inc. and Jeremy J. Aguilar | |
| 10.29 (8) | Amended and Restated Loan and Security Agreement, dated March 29, 2011, among Gregg Appliances, Inc., HHG Distributing, LLC, Wells Fargo Bank, National Association, as administrative agent and collateral agent, Wells Fargo Capital Finance, LLC and J.P. Morgan Securities LLC as joint lead arrangers and joint bookrunners, J.P. Morgan Chase Bank, N.A. as syndication agent, KeyBank National Association, Regions Bank and Suntrust Bank as co-documentation agents and the lenders party thereto.* | |
| 10.30 (9) | Amendment No. 1 to Trademark Collateral Assignment and Security Agreement, dated March 29, 2011, between Gregg Appliances and Wells Fargo Bank, National Association. | |
| 10.31 | Employment Agreement, dated September 13, 2011, between Gregg Appliances, Inc. and Trent Taylor | |
| 10.32 | Employment Agreement, dated February 15, 2012, between Gregg Appliances, Inc. and Douglas T. Moore | |
| 14.1 (1) | Finance Code of Ethics | |
| 21.1 (1) | List of our Subsidiaries | |
| 23.1 | Consent of KPMG LLP, Independent Registered Public Accounting Firm | |
| 31.1 | Certification of the Chief Executive Officer pursuant to Rule 13a-14(a) and 15d-14(a) under the Securities Exchange Act of 1934, as adopted pursuant to Section 302 of the Sarbanes-Oxley Act of 2002. | |
| 31.2 | Certification of the Chief Financial Officer pursuant to Rule 13a-14(a) and 15d-14(a) under the Securities Exchange Act of 1934, as adopted pursuant to Section 302 of the Sarbanes-Oxley Act of 2002. | |
| 32.1 | Certification of the Chief Executive Officer pursuant to 18 U.S.C. Section 1350, as adopted pursuant to Section 906 of the Sarbanes-Oxley Act of 2002. | |
| 32.2 | Certification of the Chief Financial Officer pursuant to 18 U.S.C. Section 1350, as adopted pursuant to Section 906 of the Sarbanes-Oxley Act of 2002. | |
71
Table of Contents
| Exhibit |
Description of Document | |
| **101 | The following materials from hhgregg, Inc.’s Annual Report on Form 10-K for the fiscal year ended March 31, 2012, formatted in XBRL (eXtensible Business Reporting Language): (1) Consolidated Statements of Income for fiscal years ended March 31, 2012, 2011 and 2010, (2) Consolidated Balance Sheets as of March 31, 2012 and 2011, (3) Consolidated Statements of Stockholders’ Equity and Comprehensive Income for fiscal years ended March 31, 2012, 2011 and 2010, (4) Consolidated Statements of Cash Flows for fiscal years ended March 31, 2012, 2011 and 2010 and (5) Notes to Consolidated Financial Statements, tagged as blocks of text. | |
| (1) | Incorporated by reference from the Company’s Registration Statement on Form S-1 (Reg. No. 333-142181) filed with the SEC on April 18, 2007. |
| (2) | Incorporated by reference from Amendment No. 1 to the Company’s Registration Statement on Form S-1 (Reg. No. 333-142181) filed with the SEC on June 29, 2007. |
| (3) | Incorporated by reference from the Company’s Annual Report on Form 10-K filed with the SEC on June 3, 2008. |
| (4) | Incorporated by reference from the Company’s Quarterly Report on Form 10-Q filed with the SEC on February 5, 2009. |
| (5) | Incorporated by reference from the Company’s Current Report on Form 8-K filed with the SEC on July 16, 2009. |
| (6) | Incorporated by reference from the Company’s Current Report on Form 8-K filed with the SEC on August 18, 2009. |
| (7) | Incorporated by reference from the Company’s Current Report on Form 8-K filed with the SEC on September 9, 2009. |
| (8) | Incorporated by reference from the Company’s Current Report on Form 8-K filed with the SEC on April 1, 2011. |
| (9) | Incorporated by reference from the Company’s Annual Report on Form 10-K filed with the SEC on May 26, 2011. |
| * | Confidential treatment requested for certain confidential portions of this exhibit. These confidential portions have been omitted from this exhibit and filed separately with the Securities and Exchange Commission. |
| ** | Pursuant to Rule 406T of Regulation S-T, the Interactive Data Files on Exhibit 101 hereto are deemed not filed or part of a registration statement of prospectus for purposes of Sections 11 or 12 of the Securities Act of 1933, as amended, are deemed not filed for purposes of Section 18 of the Securities and Exchange Act of 1934, as amended, and otherwise are not subject to liability under those sections. |
72
Table of Contents
SIGNATURES
Pursuant to the requirements of Section 13 or 15(d) of the Securities Exchange Act of 1934, the registrant has duly caused this report to be signed on its behalf by the undersigned, thereunto duly authorized.
| HHGREGG, INC. | ||
| By: |
/s/ DENNIS L. MAY | |
| Dennis L. May President and Chief Executive Officer (Principal Executive Officer) | ||
| By: |
/s/ JEREMY J. AGUILAR | |
| Jeremy J. Aguilar Chief Financial Officer (Principal Financial and Accounting Officer) | ||
Dated: May 23, 2012
Pursuant to the requirements of the Securities Exchange Act of 1934, this report has been signed below by the following persons on behalf of the registrant and in the capacities and on the dates indicated.
| Signature |
Title |
Date | ||
| /s/ DENNIS L. MAY Dennis L. May |
President and Chief Executive Officer and Director (Principal Executive Officer) |
May 23, 2012 | ||
| /s/ JEREMY J. AGUILAR Jeremy J. Aguilar |
Chief Financial Officer (Principal Financial and Accounting Officer) |
May 23, 2012 | ||
| /s/ LAWRENCE P. CASTELLANI Lawrence P. Castellani |
Director | May 23, 2012 | ||
| /s/ BENJAMIN D. GEIGER Benjamin D. Geiger |
Director | May 23, 2012 | ||
| /s/ CATHERINE A. LANGHAM Catherine A. Langham |
Director | May 23, 2012 | ||
| /s/ JOHN M. ROTH John M. Roth |
Director | May 23, 2012 | ||
| /s/ CHARLES P. RULLMAN Charles P. Rullman |
Director | May 23, 2012 | ||
| /s/ MICHAEL L. SMITH Michael L. Smith |
Chairman of the Board and Director | May 23, 2012 | ||
| /s/ PETER M. STARRETT Peter M. Starrett |
Director | May 23, 2012 | ||
| /s/ GREGG W. THROGMARTIN Gregg W. Throgmartin |
Director | May 23, 2012 | ||
| /s/ KATHLEEN C. TIERNEY Kathleen C. Tierney |
Director | May 23, 2012 | ||
| /s/ DARELL E. ZINK Darell E. Zink |
Director | May 23, 2012 | ||
73