Attached files
| file | filename |
|---|---|
| EX-32.1 - EXHIBIT 32.1 - NTELOS HOLDINGS CORP. | exhibit3212015.htm |
| EX-23.1 - EXHIBIT 23.1 - NTELOS HOLDINGS CORP. | exhibit2312015.htm |
| EX-21.1 - EXHIBIT 21.1 - NTELOS HOLDINGS CORP. | exhibit2112015.htm |
| EX-31.1 - EXHIBIT 31.1 - NTELOS HOLDINGS CORP. | exhibit3112015.htm |
| EX-32.2 - EXHIBIT 32.2 - NTELOS HOLDINGS CORP. | exhibit3222015.htm |
| EX-31.2 - EXHIBIT 31.2 - NTELOS HOLDINGS CORP. | exhibit3122015.htm |
UNITED STATES
SECURITIES AND EXCHANGE COMMISSION
Washington, D.C. 20549
FORM 10-K
(Mark One)
ý | ANNUAL REPORT PURSUANT TO SECTION 13 OR 15(d) OF THE SECURITIES EXCHANGE ACT OF 1934 |
For the fiscal year ended December 31, 2015
or
¨ | TRANSITION REPORT PURSUANT TO SECTION 13 OR 15(d) OF THE SECURITIES EXCHANGE ACT OF 1934 |
For the transition period from to
Commission File Number: 000-51798
NTELOS Holdings Corp.
(Exact name of registrant as specified in its charter)
Delaware | 36-4573125 | |
(State or other jurisdiction of incorporation or organization) | (I.R.S. Employer Identification No.) | |
1154 Shenandoah Village Drive, Waynesboro, Virginia 22980
(Address of principal executive offices) (Zip Code)
(540) 946-3500
(Registrant’s telephone number, including area code)
Securities registered pursuant to Section 12(b) of the Act:
Title of each class | Name of each exchange on which registered | |
Common stock, $0.01 par value | The NASDAQ Stock Market LLC | |
Securities registered pursuant to Section 12(g) of the Act: None |
Indicate by check mark if the registrant is a well-known seasoned issuer, as defined in Rule 405 of the Securities Act. ¨ Yes ý No
Indicate by check mark if the registrant is not required to file reports pursuant to Section 13 or Section 15(d) of the Act. ¨ Yes ý No
Indicate by check mark whether the registrant (1) has filed all reports required to be filed by Section 13 or 15(d) of the Securities Exchange Act of 1934 during the preceding 12 months (or for such shorter period that the registrant was required to file such reports), and (2) has been subject to such filing requirements for the past 90 days. ý Yes ¨ No
Indicate by check mark whether the registrant has submitted electronically and posted on its corporate Web site, if any, every Interactive Data File required to be submitted and posted pursuant to Rule 405 of Regulation S-T (§ 232.405 of this chapter) during the preceding 12 months (or for such shorter period that the registrant was required to submit and post such files). ý Yes ¨ No
Indicate by check mark if disclosure of delinquent filers pursuant to Item 405 of Regulation S-K (§ 229.405 of this chapter) is not contained herein, and will not be contained, to the best of registrant’s knowledge, in definitive proxy or information statements incorporated by reference in Part III of this Form 10-K or any amendment to this Form 10-K. ý
Indicate by check mark whether the registrant is a large accelerated filer, an accelerated filer, a non-accelerated filer or a smaller reporting company. See definitions of “large accelerated filer,” “accelerated filer” and “smaller reporting company” in Rule 12b-2 of the Exchange Act.
Large accelerated filer | ¨ | Accelerated filer | ý | |||
Non-accelerated filer | ¨ (Do not check if a smaller reporting company) | Smaller reporting company | ¨ | |||
Indicate by check mark whether the registrant is a shell company (as defined in Rule 12b-2 of the Exchange Act). ¨ Yes ý No
The aggregate market value of the voting and non-voting common equity held by non-affiliates of the registrant on June 30, 2015 was $80.6 million (based on the closing price for shares of the registrant’s common stock as reported on the NASDAQ Global Market on that date). In determining this figure, the registrant has assumed that all of its directors, executive officers and persons beneficially owning more than 10% of the outstanding common stock are affiliates. This assumption shall not be deemed conclusive for any other purpose.
There were 22,257,794 shares of the registrant’s common stock outstanding as of the close of business on March 8, 2016.
DOCUMENTS INCORORATED BY REFERENCE : NONE
NTELOS HOLDINGS CORP.
TABLE OF CONTENTS
Page No. | ||
Item 1. | ||
Item 1A. | ||
Item 1B. | ||
Item 2. | ||
Item 3. | ||
Item 4. | ||
Item 5. | ||
Item 6. | ||
Item 7. | ||
Item 7A. | ||
Item 8. | ||
Item 9. | ||
Item 9A. | ||
Item 9B. | ||
Item 10. | ||
Item 11. | ||
Item 12. | ||
Item 13. | ||
Item 14. | ||
Item 15. | ||
GLOSSARY OF TERMS AND ABBREVIATIONS
3G | Third Generation of Mobile Telephony Standards | |
4G | Fourth Generation of Mobile Telecommunication Standards | |
Amended and Restated Credit Agreement | Amendment No.6, dated November 9, 2012, of the Original Credit Agreement and as further amended and restated as of January 31, 2014 | |
ABPU | Average Billings per User | |
ASC | Accounting Standards Codification | |
ASU | Accounting Standards Update | |
AWS | Advanced Wireless Services | |
CALEA | Communications Assistance for Law Enforcement Act of 1994 | |
CDMA | Code Division Multiple Access | |
CMRS | Commercial Mobile Radio Service | |
Communications Act | Communications Act of 1934, as amended | |
Congress | United States Congress | |
EIP | Equipment Installment Plan | |
Exchange Act | Securities Exchange Act of 1934, as amended | |
FAA | Federal Aviation Administration | |
FASB | Financial Accounting Standards Board | |
FCC | Federal Communications Commission | |
FTC | Federal Trade Commission | |
GAAP | Generally Accepted Accounting Principles in the United States of America | |
GHz | Gigahertz | |
IRC | Internal Revenue Code of 1986, as amended | |
IRS | Internal Revenue Service | |
LEC | Local Exchange Carrier | |
LIBOR | London Interbank Offered Rate | |
LTE | Long-Term Evolution Wireless Technology | |
Lumos Networks | Lumos Networks Corp. | |
MHz | Megahertz | |
MLA | Master License Agreement | |
MSC | Mobile Switching Center | |
MVNO | Mobile Virtual Network Operator | |
NASDAQ | NASDAQ Stock Market LLC | |
NEPA | National Environmental Policy Act | |
NOL | Net Operating Loss | |
NPRM | Notice of Proposed Rule Making | |
Original Credit Agreement | Credit Agreement dated August 7, 2009 | |
PCS | Personal Communications Services | |
POPs | Population | |
PSAP | Public Safety Answering Point | |
Quadrangle | Quadrangle Capital Partners LLP and certain of its affiliates | |
SEC | United States Securities and Exchange Commission | |
Shentel | Shenandoah Telecommunications Company | |
SNA | Strategic Network Alliance | |
SprintCom | SprintCom, Inc., a Kansas corporation | |
Sprint Spectrum | Sprint Spectrum L.P., a Delaware limited partnership | |
USF | Universal Service Fund | |
UTB | Unrecognized Income Tax Benefit | |
VoIP | Voice over Internet Protocol | |
1
PART I
In this Annual Report on Form 10-K, we use the terms “NTELOS,” “we,” the “Company,” “our” and “us” to refer to NTELOS Holdings Corp. and its subsidiaries.
Available Information
Our website address is www.ntelos.com. We use our website as a channel of distribution for the Company's information. We make available free of charge on the Investor Relations section of our website (http://ir.ntelos.com) our Annual Report on Form 10-K, Quarterly Reports on Form 10-Q, Current Reports on Form 8-K, and all amendments to those reports as soon as reasonably practicable after such material is electronically filed with or furnished to the SEC pursuant to Section 13(a) or 15(d) of the Exchange Act. We also make available through our website other reports filed with or furnished to the SEC under the Exchange Act, including our proxy statements and reports filed by officers and directors under Section 16(a) of the Exchange Act, as well as our Code of Business Conduct and Ethics. Financial and other material information regarding the Company is routinely posted on and accessible at http://ir.ntelos.com. We do not intend for information contained in our website to be part of this Annual Report on Form 10-K. Any materials we file with the SEC may be read and copied at the SEC’s Public Reference Room at 100 F Street, NE, Washington, DC, 20549. Information on the operation of the Public Reference Room may be obtained by calling the SEC at 1-800-SEC-0330. The SEC maintains an Internet site (http://www.sec.gov) that contains reports, proxy and information statements and other information regarding issuers that file electronically with the SEC.
Item 1. | Business. |
General
We are a regional provider of digital wireless communications services to consumers and businesses primarily in Virginia, West Virginia, and certain portions of surrounding states. We offer wireless voice and digital data PCS products and services to retail and business customers under the “NTELOS Wireless” and “FRAWG Wireless” brand names. We conduct our business through NTELOS-branded retail operations, which sell our products and services via direct and indirect distribution channels, and provide network access to other telecommunications carriers, most notably through an arrangement with Sprint Spectrum L.P. (“Sprint Spectrum”), and Sprint Spectrum on behalf of and as an agent for SprintCom, Inc. (“SprintCom”) (Sprint Spectrum and SprintCom collectively, “Sprint”), which arrangement is referred to herein as the “Strategic Network Alliance” or the "SNA".
We conduct all of our business through our wholly-owned subsidiary NTELOS Inc. and its subsidiaries. Our principal executive offices are located at 1154 Shenandoah Village Drive, Waynesboro, Virginia 22980. The telephone number at that address is (540) 946-3500.
For a detailed review of our financial condition and results of operations, see Part II, Item 7. Management’s Discussion and Analysis of Financial Condition and Results of Operations of this Annual Report on Form 10-K.
Agreement and Plan of Merger with Shenandoah Telecommunications Company ("Shentel")
On August 10, 2015, we announced that we entered into a definitive agreement to be acquired by Shentel (the "Merger Agreement") in an all-cash transaction valued at approximately $640 million, including net debt (the "Merger"). Our stockholders will receive approximately $208 million in cash, or $9.25 per share and Shentel will assume our debt at closing.
Concurrent with the signing of the Merger Agreement, Shentel entered into a series of agreements with Sprint, including the expansion of Shentel’s “affiliate” relationship with Sprint. This will result in the “nTelos” brand eventually being discontinued after closing and NTELOS’s approximately 300,000 wireless retail customers eventually becoming Sprint-branded customers. Additionally, NTELOS’s retail stores will convert into Sprint-branded stores.
The Merger is subject to customary closing conditions, including the completion of Shentel’s re-affiliation transaction with Sprint, approval of the Merger by the Company’s stockholders and receipt of all necessary regulatory approvals. The Company has already received shareholder approval for the Merger and all necessary approvals from federal and state regulators necessary to complete the Merger, other than approval from the FCC. The Company expects to receive FCC approval late in the first quarter or early in the second quarter of 2016 and that the Merger will close soon thereafter.
For additional information, see Note 1 of the Notes to Consolidated Financial Statements.
2
Sale of Virginia East Spectrum and Shut Down of Eastern Markets
On December 1, 2014, the Company entered into an agreement to sell its wireless spectrum licenses in its eastern Virginia and Outer Banks of North Carolina markets (“Eastern Markets”) for approximately $56.0 million. The transaction closed on April 15, 2015. The Company entered into lease agreements to continue using the Eastern Markets spectrum licenses for varying terms ranging from the closing date through November 15, 2015. Effective November 15, 2015, we ceased commercial operations and all subscribers had been migrated off our network. As a result of no longer providing service in the Eastern Markets, certain assets, liabilities and results of operations associated with this market are now being reported as discontinued operations.
For additional information, see Note 3 of the Notes to Consolidated Financial Statements.
Our Business
Overview
We operate a 100% CDMA digital PCS network and are actively deploying fourth generation mobile communications standards / Long Term Evolution wireless technology (“4G LTE”) across our footprint in Virginia, West Virginia, and certain portions of surrounding states with covered POPs of approximately 3.1 million. We believe our strategic focus, commitment to personalized local service, contiguous service area and leveraged use of our network via our wholesale contracts provide us with a differentiated competitive position relative to our primary wireless competitors, most of whom are national.
Spectrum Holdings
We utilize radio spectrum licensed to us by the FCC to provide our wireless broadband mobile services to our customers. The FCC has allocated spectrum in a variety of different spectrum blocks, bandwidths and geographic license areas, and we and many of our competitors utilize a combination of spectrum in the various bands to provide wireless services. We also hold licenses in seven additional basic trading areas, which we currently consider excess spectrum. We hold licenses and lease spectrum from Sprint for the 1900 MHz PCS spectrum used in our network. We also hold AWS and other spectrum in several of our markets that is currently not deployed and is intended to be used by mobile devices for voice, data, video and messaging services. In addition, the SNA with Sprint provides 800 MHz, 1900 MHz and 2.5 GHz spectrum to us in the SNA territory through spectrum leases.
Retail Operations
Our customers can choose from a variety of dependable postpay and prepay services. Our “value” proposition targets value-conscious consumers who want both reliable voice and high-speed data network performance, a broad array of devices and smartphones, and local customer service. It also focuses on voice and data services that include nationwide coverage through our wholesale relationship with Sprint and other roaming partners.
We currently offer approximately 24 devices across 11 brands, including Apple iPhone, Motorola, LG, Samsung and HTC products, and offer our customers smartphone operating systems such as Android and iOS. All devices are available for both postpay and prepay/no-contract services. Our customer service is supported by our call centers, and our direct and indirect distribution channel which is comprised of 35 company-operated direct retail locations, 142 indirect retail distribution locations, and an additional 223 third-party payment centers. We also offer an interactive web presence, which provides customers with access to their accounts, auto-pay billing services, account monitoring services and other customer care support. This functionality has been largely extended to the mobile devices through “My nTelos” and “My FRAWG” applications which are available in both the iTunes and Google Play stores. Advertising and marketing is geared towards enhancing brand consideration and attracting customers from other wireless carriers (“switchers”) who want comparable features and national coverage at a better value. Our primary focus has been on high-value postpay customers, data users and the prepay market.
Our Postpaid offering, nControl, includes various voice, messaging, and data usage options that provide maximum flexibility and customization. Additionally, these plans have a customizable structure for families and individuals with multiple devices, with different levels of monthly device pricing for smartphones, data cards, and feature phones. We also provide our customers the ability to purchase devices under equipment installment plans (“EIP”). This offering allows the customer to purchase a device with zero down, provides discounts on service plans and provides the ability to upgrade more frequently than traditional plans.
We also market FRAWG Wireless, a no contract service intended to attract consumers who choose a prepay service option. FRAWG Wireless is a simple service offering that has a minimum number of plans, offers attractive features and provides national or regional coverage. This “no contract” option generally has a higher retail "out the door" price on the device and offers a variety of competitive rate plans.
3
Service Offerings
The table below briefly describes our postpay and prepay plans and provides a breakdown of subscribers as of December 31, 2015:
Retail Subscribers | ||
Product | Subscribers | % of Subscribers |
Postpay | 233,300 | 77% |
Prepay | 68,700 | 23% |
Total | 302,000 | |
Product | Description | ||
Postpay | • | Branded as NTELOS Wireless | |
• | High-speed, dependable coverage | ||
• | 2 Year Equipment Installment Plan for Smartphones, Tablets and Data Cards | ||
• | 1 or 2 year pricing option for feature phones | ||
• | Usage based data service plans that offer Unlimited talk and text, along with features consisting of text and picture messaging, mobile broadband access through hotspots, and access to a variety of applications. | ||
• | Plans are offered for individuals and families and include long distance calling, caller ID, three-way calling and voicemail | ||
• | Broad array of full featured handsets tablets, data cards and smartphones, including popular brands such as Apple, Samsung, LG, Motorola and HTC | ||
Prepay | • | Branded as FRAWG Wireless | |
• | Usage based and unlimited nationwide voice, text and data services | ||
• | Prepackaged version of FRAWG Wireless includes a handset and a month of service in a “grab and go” package that can be found at convenience stores and neighborhood retailers | ||
• | Monthly charges are paid in advance using most accepted forms of payment via web, handset app, interactive voice response, phone or in person | ||
• | Other data service offerings consist of text and picture messaging, mobile broadband access and mobile hotspots, and access to a variety of applications, including games, ring tones and other mobile applications | ||
Sales, Marketing and Customer Care
With U.S. wireless penetration exceeding 100%, we primarily target switchers as well as customers interested in high speed, dependable coverage, by offering competitive plans in both the postpay and prepay markets. With our high-speed dependable network, we provide services to not only the consumer market, but also to small/medium sized enterprises and the education, municipal and medical vertical markets.
Marketing efforts are focused on building brand consideration and driving value-conscious consumers to our company-operated direct retail locations, indirect agent locations, inside sales associates and e-commerce. The Company uses a blended media strategy that includes print, broadcast, direct mail, billboard, digital and social media to reach potential customers. Messaging is focused primarily on our value proposition which features comparable savings for dependable coverage and popular handsets at affordable prices. We also have added features and improved communication to customers with expanded email, text and outbound calling campaigns utilizing predictive analytics. These initiatives support our commitment to deliver superior customer value and the best possible wireless experience.
Our direct distribution is supplemented by master agents and NTELOS-branded dealers. Our master agent program allows us to recruit experienced master agents, introduce the “Exclusive Retail Partner program” that we believe enhances our brand positioning with additional branded retail locations, and recruit experienced multi-unit retailers.
We operate as a single virtual call center, minimizing headcount and providing uniform customer service across our region. We provide customer care representatives with incentives to sell additional products and features. We utilize a loyalty/retention
4
team to focus on renewing or responding to our customers. Business operations are supported by an integrated systems infrastructure which allows for consistent customer interactions. Our web presence enhances the experience for our customers desiring self care services and it also enables a fully integrated shopping cart.
Wholesale Operations
We provide wireless digital PCS services on a wholesale basis to other PCS providers, most notably through the SNA with Sprint in which we are the exclusive wholesale provider of wireless services in our western Virginia and West Virginia service area for all Sprint CDMA and LTE wireless customers. In May 2014 the parties entered into an amended agreement to extend the SNA through at least December 2022. Pursuant to the terms of the SNA, we are required to upgrade our network in the SNA service area to provide LTE services. As part of the amendment, we lease spectrum, on a non-cash basis, from Sprint in order to enhance the PCS/LTE services. The non-cash consideration attributable to the leased spectrum is approximately $4.9 million per year. The lease expense is recognized over the term of the lease and recorded within cost of services, with the offsetting consideration recorded within wholesale and other revenue. Additionally, the amended SNA provides us access to Sprint’s nationwide 3G and 4G LTE network at rates that are reciprocal to rates paid by Sprint under the amended SNA. The amended SNA provides that a portion of the amount paid by Sprint thereunder is fixed. The billable fixed fee element of the agreement was reduced pursuant to the amended SNA on August 1, 2015 and again on January 1, 2016. Additional annual reductions will occur on January 1 of each year. We account for this fixed fee portion of the revenue earned from the SNA revenue on a straight line basis over the term of the agreement. In addition, these reductions are subject to further upward or downward resets in the fixed fee element. These resets, if any, will be recognized in the period in which it occurs.
Network Technology
As of December 31, 2015, we had 1,008 cell sites in operation and we owned 12 of these cell sites and leased the remaining 996 cell sites (approximately 99%). Of the leased cell sites, 579 (approximately 57%) are installed on structures controlled by three tower companies, Crown Communications, American Tower, and SBA.
In January 2015, we announced that we entered into a definitive agreement to sell up to 103 towers for approximately $41.0 million. We closed on 96 towers during 2015, one in early 2016 with an additional tower expected to close this year. The sale agreement provides for long term lease agreements for towers in our operating footprint.
We continue the deployment of our 4G LTE network, finishing 2015 with 4G LTE reaching 70% of our covered POPs. We now have 4G LTE coverage in all of our core markets.
Switching Centers
We have two MSC facilities which house all of our core switching and routing equipment that is used for processing voice calls and data services. The MSCs also house adjunct platforms that enable services including text messaging, voicemail, picture messaging, and over-the-air functionality (the ability to download information to the handset via our wireless network).
Network Performance
We set high network performance standards and continually monitor network quality metrics, including dropped call rates and blocked call rates.
Competition
The retail market for wireless broadband mobile services is highly competitive. We compete directly with other facilities and non-facilities based wireless broadband mobile and fixed service providers, wireline, internet, cable, satellite and other communications service providers. We believe that competition for customers among wireless broadband providers is based on price, service area, brand awareness and reputation, services and features, handset selection, call quality and customer service. In 2015, we saw continued emphasis by our postpay competitors on selling bundled services, which include voice, text and LTE data, as well as expanding unlimited nationwide services, often at reduced prices. Our value proposition in the postpay market competes with several nationwide and regional carriers including AT&T, Sprint, Verizon, T-Mobile and U.S. Cellular, as well as a number of reseller/affiliates of some or all of these companies. These competitors have financial resources, marketing resources, brand awareness, equipment availability, and customer bases significantly greater than ours. We expect postpay competition to continue to be intense as carriers focus on taking market share from competitors.
Competition in the prepay market space has continued to intensify, particularly with aggressively-priced, nationwide, unlimited plan offerings by our competitors. In addition, our competitors continue to significantly increase their points of distribution and advertising. These competitors have access to a large number of points of distribution, including large big box retailers. We also face competition from companies that resell prepay wireless service to customers but do not hold FCC licenses or own their
5
own networks, referred to as MVNOs. These competitors include, but are not limited to Boost, Straight Talk, Virgin Mobile, TracFone, Simple Mobile and Net10. We differentiate ourselves in the prepay markets from our competitors by offering high value products and plans, dependable high-speed nationwide services and by providing local customer service and retail support coupled with a strong commitment to the community.
Employees
As of December 31, 2015, we had approximately 540 full time equivalent employees. None of our employees are covered by a collective bargaining agreement or represented by an employee union. We believe that we have good relations with our employees.
Regulation
The following summary does not describe all present and proposed federal, state and local legislation and regulations affecting the telecommunications industry. Some legislation and regulations are currently the subject of judicial proceedings, legislative hearings and administrative proposals which could change the manner in which this industry operates. Neither the outcome of any of these developments, nor their potential impact on us, can be predicted at this time. Regulation can change rapidly in the telecommunications industry, and such changes may have an adverse effect on us in the future. See “Risk Factors” described in Item 1A. of this Annual Report on Form 10-K.
Overview
Our communications services are subject to varying degrees of federal, state and local regulation. Under the federal Communications Act, as amended, the FCC has jurisdiction over interstate and international common carrier services, over certain aspects of interconnection between carriers, and over the allocation, licensing, and regulation of wireless services. In 1996, Congress enacted the Telecommunications Act of 1996, which amended the Communications Act and mandated significant changes in telecommunications rules and policies to promote competition, ensure nationwide availability of telecommunications services and to streamline regulation of the telecommunications industry to remove regulatory burdens as competition develops.
In addition to FCC regulation, our communications services are regulated to different degrees by state public service commissions and by local authorities. Such local authorities have jurisdiction over public rights of way, video franchises, and zoning for antenna structures. The FAA regulates the location, lighting and construction of antenna structures. We also are subject to various other federal laws and regulations, including privacy, antitrust, environmental, labor, wage, health and safety, personal information laws and regulations as set forth by the FTC, the Environmental Protection Agency, the Occupational Safety and Health Administration and state and local regulatory agencies and legislative bodies.
Our wireless operations are subject to various federal and state laws intended to protect the privacy of customers who subscribe to our services. The FCC has regulations that place restrictions on the permissible uses that we can make of customer-specific information, known as Customer Proprietary Network Information, received from subscribers and that govern procedures for release of such information. On November 1, 2008, the FTC’s “Red Flag” rules went into effect and the FTC began to enforce those rules on December 31, 2010. Among other requirements, the Red Flag rules require companies to develop and implement written Identity Theft Prevention programs. The FTC is considering additional regulations governing on-line behavioral marketing and consumer privacy. Congress, federal agencies and states also are considering imposing additional requirements on entities that possess consumer information to protect the privacy of consumers. In February 2013, the President of the United States issued an executive order which establishes additional measures for the voluntary sharing of cyber security information, requires certain critical industry participants to adopt certain cyber security measures, and potentially may limit participation in government contracts to companies which have adopted certain cyber security measures.
Many of the services we offer are unregulated or subject only to minimal regulation. Internet services are not considered to be common carrier services, although the regulatory treatment of certain internet services, including VoIP services, is evolving and still uncertain. To date, the FCC has, among other things, directed providers of certain VoIP services to offer Enhanced 911 (“E-911”) emergency calling capabilities to their subscribers, applied the requirements of CALEA to these VoIP providers, and determined that the VoIP providers are subject to federal universal service assessments. The FCC has preempted states from exercising entry and related economic regulation of nomadic VoIP providers, but the FCC has not preempted state regulation of fixed VoIP service commonly offered by cable operators.
6
Regulation of the Wireless Communications Industry
Pursuant to 1993 CMRS amendments to the Communications Act, certain service providers over cellular, personal communications, advanced wireless, and 700 MHz spectrum are classified as commercial mobile radio services because they are offered to the public and are interconnected to the public switched telephone network. Consequently, our wireless services are generally classified as CMRS and are subject to FCC regulation. The states are preempted from engaging in entry or rate regulation of CMRS, although the states may regulate other terms and conditions of CMRS offerings including customer billing, termination of service arrangements, advertising, certification of operation, use of handsets when driving, service quality, sales practices, and management of customer call records.
The licensing, construction, modification, operation, sale, ownership and interconnection arrangements of wireless communications networks are regulated to varying degrees by the FCC, Congress, state regulatory agencies, the courts and other governmental bodies. Some examples of the kinds of regulation to which we are subject are presented below. A failure to maintain compliance with the Communications Act and/or the FCC’s rules could subject us to fines, forfeitures, license revocations, license conditions or other penalties.
Licensing of PCS Systems
In general, PCS licenses, such as those held by our subsidiaries, were originally awarded for specific geographic market areas and for one of six specific spectrum blocks. The geographic license areas utilized included basic trading areas and collections of basic trading areas known as major trading areas, although geographic partitioning policies have permitted licensees to subdivide and transfer those original licenses into other geographic areas. The spectrum blocks awarded were originally either 30 MHz or 10 MHz licenses, although spectrum disaggregation rules have permitted licensees to subdivide such licenses into smaller spectrum blocks.
All PCS licenses have a 10-year term, at the end of which they must be renewed. Between 2005 and 2009, we applied for and were granted renewal of all of our PCS licenses.
PCS Construction Requirements
All PCS licensees must satisfy build-out deadlines and geographic coverage requirements within five and/or ten years after the license grant date. Under the FCC’s original rules, these initial requirements are met for 10 MHz licenses when adequate service is offered to at least one-quarter of the population of the licensed area, or the licensee provides substantial service, within five years, and for 30 MHz licenses when adequate service is offered to at least one-third of the population within five years and two-thirds of the population within ten years. The FCC’s policies have now been modified, however, and 30 MHz licensees are permitted to make a demonstration of substantial service to meet the ten year build-out requirement. Failure to comply with these coverage requirements could cause the revocation or non-renewal of a provider’s wireless licenses or the imposition of fines and/or other sanctions.
AWS Licenses
In 2006, we acquired additional licenses in an auction conducted by the FCC for AWS spectrum in the 1710-1755 MHz and 2110-2155 MHz bands. The FCC regulations applicable to these licenses are generally similar to those applied to our PCS licenses, although our AWS licenses have a longer term (15 years) and are not subject to any construction requirements other than the requirement that we provide substantial service at renewal. Like other auctioned AWS licenses, the licenses we acquire are subject to the rights of certain incumbents, including Federal government systems and microwave radio users. For the most part, Federal government users will transition their operations out of the band through a multiyear process funded through proceeds from the auction itself. The non-government users would have to be relocated by us if our AWS deployments would interfere, and we may incur cost-sharing obligations even if we deploy services on our AWS spectrum after the links are relocated.
The FCC’s rules provide a formal presumption that PCS and AWS licenses will be renewed, called a “renewal expectancy,” if the licensee (1) has provided substantial service during its past license term, and (2) has substantially complied with applicable FCC rules and policies and the Communications Act. The FCC defines substantial service as service which is sound, favorable and substantially above a level of mediocre service that might only minimally warrant renewal. If a licensee does not receive a renewal expectancy, then the FCC will accept competing applications for the license renewal period and, subject to a comparative hearing, may award the license to another party. In 2011, the FCC released an NPRM proposing to establish more consistent requirements for renewal of licenses, uniform policies governing discontinuances of service, and to clarify certain construction obligations across all of the wireless service bands. The proposed changes to the applicable renewal and discontinuance of service requirements may be applied to existing licenses that will be renewed in the future. We are unable to predict with any certainty the likely timing or outcome of this wireless renewal standards proceeding.
7
Transfer and Assignment of PCS and AWS Licenses
The Communications Act and FCC rules require the FCC’s prior approval of the assignment or transfer of control of a license for a PCS or AWS system, with limited exceptions, and the FCC may prohibit or impose conditions on assignments and transfers of control of licenses. Non-controlling interests in an entity that holds an FCC license generally may be bought or sold without FCC approval. Although we cannot be certain that the FCC will approve or act in a timely fashion upon any future requests for approval of assignment or transfer of control applications that we file, we have no reason to believe that the FCC would not approve or grant such requests or applications in due course. In the course of such review, we further note that the FCC engages in a case-by-case competitive review of transactions that involve the consolidation of spectrum licenses. Because an FCC license is necessary to lawfully provide PCS and/or AWS service, if the FCC were not to approve any such filing, our business plans would be adversely affected. The FCC in June 2014 adopted an Order which updated the spectrum screen that the FCC uses in order to conduct its competitive review of proposed secondary market transactions. The FCC’s Order continued the FCC’s policy of conducting case-by-case analysis of a combined entity's spectrum screen holdings for proposed transactions, revised its existing spectrum screen to reflect the current suitability and availability of spectrum for mobile wireless services, and adopted certain limitations with respect to the purchase and transfer of 600 MHz spectrum.
Foreign Ownership
Under existing law, no more than 20% of an FCC CMRS licensee’s capital stock may be owned, directly or indirectly, or voted by non-U.S. citizens or their representatives, by a foreign government or its representatives or by a foreign corporation. If an FCC CMRS licensee is controlled by another entity, as is the case with our ownership structure, up to 25% of that entity’s capital stock may be owned or voted by non-U.S. citizens or their representatives, by a foreign government or its representatives or by a foreign corporation. Foreign ownership above the 25% holding company level may be allowed should the FCC find such higher levels not inconsistent with the public interest. The FCC has ruled that higher levels of foreign ownership in CMRS licensees, even up to 100%, are presumptively consistent with the public interest with respect to investors from certain nations who are members of the World Trade Organization. If our foreign ownership were to exceed the permitted level, the FCC could revoke our wireless licenses, although we could seek a declaratory ruling from the FCC allowing the foreign ownership or take other actions to reduce our foreign ownership percentage in order to avoid the loss of our licenses. We have no knowledge of any present foreign ownership in violation of these restrictions. In 2013, the FCC streamlined its policies and procedures for reviewing foreign ownership of U.S. companies with common carrier licenses, such as ourselves, under the Communications Act.
E-911 Services
The FCC requires CMRS carriers to make available basic 911 and E-911 emergency services to subscribers that provide the caller’s telephone number and detailed location information to emergency responders, and to make available 911 emergency services to users with speech or hearing disabilities. Our obligations to implement these services occur in phases and on a market-by-market basis as emergency service providers request the implementation of E-911 services in their locales. On January 29, 2015, the FCC adopted additional rules and regulations that require us and other carriers to implement requirements regarding location accuracy requirements for E-911. These stronger rules will enhance the ability of Public Safety Answering Points (PSAPs) to accurately identify the location of wireless 911 callers when a caller is indoors. These revised rules also strengthen the FCC’s existing E-911 location accuracy rules to improve location determination for outdoor calls as well. In 2013, the FCC adopted rules requiring wireless carriers, such as ourselves, and certain other text messaging service providers to send an automatic ‘bounce-back’ text message to consumers who try to text 911 where text-to-911 is not available, indicating the unavailability of such services. In August 2014, the FCC required all wireless carriers, such as ourselves, as well as other providers of interconnected text messaging applications, to be capable of supporting text-to-911 service by December 31, 2014, and to provide such service to requesting PSAPs by June 30, 2015 or six months after a request from a PSAP, whichever is later. The FCC has also sought further comment regarding additional regulations pertaining to the provision of text-to-911 service.
Local Number Portability
FCC rules also require that local exchange carriers and most CMRS providers, including PCS and AWS providers, allow customers to change service providers without changing telephone numbers. For CMRS providers, this mandate is referred to as wireless local number portability. In addition, the FCC has adopted rules governing the porting of wireline telephone numbers to wireless carriers and vice versa. Number portability makes it easier for customers to switch among carriers.
Reciprocal Compensation
FCC rules provide that all telecommunications carriers are obligated, upon reasonable request, to interconnect directly or indirectly with the facilities and networks of other telecommunications carriers. All LECs also must, upon request, enter into
8
mutual or reciprocal compensation arrangements with CMRS carriers for the exchange of local traffic. As a CMRS provider, we are required to pay reciprocal compensation under such arrangements to a wireline LEC that transports and terminates a local call that originated on our network. Under the revised intercarrier compensation regime adopted by the FCC in October 2011, where there is no pre-existing agreement between a CMRS carrier and a LEC for the exchange of local traffic, such traffic between CMRS providers and most LECs is to be compensated pursuant to a default bill-and-keep regime. We negotiate interconnection agreements for our network with major incumbent LECs and smaller rural LECs. Negotiated interconnection agreements are subject to state approval. If an agreement cannot be reached, parties to interconnection negotiations can submit outstanding disputes to state authorities or the FCC, as appropriate, for arbitration. The FCC’s interconnection rules and rulings, as well as state arbitration proceedings, will directly impact the nature and costs of facilities necessary for the interconnection of our network with other telecommunications networks. They also will determine the amount of revenue we receive for terminating calls originating on the networks of LECs and other telecommunications carriers. The FCC’s new intercarrier compensation rules may affect the manner in which we are charged or compensated for the exchange of traffic. The FCC’s overhaul of the rules governing intercarrier compensation currently are subject to a petition before the United States Supreme Court, as well as various petitions for reconsideration before the FCC. We cannot predict with any certainty the likely timing or outcome of such petitions.
Universal Service
Pursuant to the Communications Act, all telecommunications carriers that provide interstate and/or international telecommunications services, including CMRS providers, are required to make an “equitable and non-discriminatory contribution” to support the cost of federal universal service programs. In addition, providers of interconnected VoIP services must contribute. These programs are designed to achieve a variety of public interest goals, including affordable telephone service nationwide, as well as subsidizing telecommunications services for schools and libraries. Contributions are calculated on the basis of each carrier’s interstate and international retail telecommunications revenue. The FCC is currently examining the way in which it collects carrier contributions to the USF, including a proposal to base collections on the number of telephone numbers or network connections in use by each carrier. An assessment mechanism based on numbers or network connections could increase the contributions to the USF by wireless and local exchange carriers, while reducing contributions from long distance service providers.
We receive funding from the federal USF in Virginia, West Virginia and Kentucky. In 2011, the FCC adopted wide ranging revisions to its universal service distribution rules. We cannot predict with any certainty the effect any such revisions will have on our business or on our ability to collect USF funds in the future. The FCC’s overhaul of the rules governing the distribution of USF currently are subject to a petition before the United States Supreme Court, as well as various petitions for reconsideration before the FCC. We cannot predict with any certainty the likely timing or outcome of such petitions.
Universal Service Mobility Fund Support
In October 2011, the FCC released an Order reforming the USF program, which previously has provided support to carriers seeking to offer telecommunications service in high-cost areas and to low-income households. As part of these reforms, the FCC announced that beginning in June 2012 it will phase out existing Universal Service support at a rate of 20% per year over the next five years. It also created two new replacement funds, the Connect America Fund and the Mobility Fund, both of which allow for the provisioning of USF funds for broadband services, in addition to voice services. The new funds are intended to provide targeted financial support to areas that are unserved or underserved by voice and broadband service providers and will be initiated during the phase out of USF support. In addition, the FCC is seeking further comment on a number of additional issues regarding the implementation of its USF overhaul.
During this five year phase-out period, the FCC will begin to distribute funds through new mechanisms associated with the Connect America Fund and the Mobility Fund. In July 2012, the FCC initiated the application process for the Mobility Fund I program, a reverse auction for a one-time distribution of up to $300 million intended to stimulate 3G and 4G wireless coverage in unserved and underserved geographic areas. These funds will be distributed to winning bidders who commit to comply with certain FCC construction and other requirements associated with the distribution of such funds.
West Virginia PCS Alliance, L.C., our subsidiary, participated in the Mobility Fund I reverse auction on September 27, 2012. On October 3, 2012, the FCC announced that we had bid successfully for approximately $5.0 million of Mobility Fund I support. In June 2013, the FCC authorized Mobility Fund Support for our winning bid, which allowed for the first disbursement of funds to us, in the amount of approximately $1.7 million. These funds will allow us to expand our voice and broadband networks in certain geographic areas in order to offer either 3G or 4G coverage.
9
CALEA
CALEA requires all telecommunications carriers, including wireless carriers, to ensure that their equipment is capable of permitting the government, pursuant to a court order or other lawful authorization, to intercept any wire and electronic communications carried by the carrier to or from its subscribers. CALEA remains subject to FCC implementation proceedings. Compliance with the requirements of CALEA, further FBI requests, and the FCC’s rules could impose significant additional direct and/or indirect costs on us and other wireless carriers.
Roaming
In 2007, the FCC adopted a requirement that CMRS carriers permit other CMRS carriers’ customers to “roam” on their systems, holding that automatic in-market voice roaming is a common carrier service obligation for such carriers and that CMRS carriers must provide certain automatic voice roaming services to other CMRS carriers upon reasonable request and on a just, reasonable and nondiscriminatory basis. In an order adopted in April 2010, the FCC extended this requirement for automatic voice roaming to apply in markets in which the carrier seeking to roam holds an FCC license even if such carrier has yet to build out its network in such a market. In 2011, the FCC found that the automatic roaming obligation should be extended to non-CMRS services, such as wireless Internet access services, which is an information service. The FCC found that automatic data roaming shall be offered by providers of such services to requesting carriers on a commercially reasonable basis, when technologically compatible and economically feasible.
Tower Siting
Under the Communications Act, state and local authorities maintain authority over the zoning of sites where our antennas are located. They are permitted to manage public rights of way and they can require fair and reasonable compensation for use of such rights of way. These authorities, however, may not legally discriminate against or prohibit our services through their use of zoning authority. The FCC adopted rules that are intended to expedite siting decisions by state and local authorities, but the rules currently are subject to appeal before the United States Supreme Court. Wireless networks also are subject to certain FCC and FAA regulations regarding the location, marking, lighting and construction of transmitter towers and antennas and are subject to regulation under the NEPA, the National Historic Preservation Act, and various environmental regulations. Compliance with these provisions could impose additional direct and/or indirect costs on us and other licensees. The FCC’s rules require antenna structure owners to notify the FAA of structures that may require marking or lighting, and there are specific restrictions applicable to antennas placed near airports. FCC regulations implementing NEPA place responsibility on each applicant to investigate any potential environmental effects of a proposed operation, including health effects relating to radio frequency emissions, and impacts on endangered species such as certain migratory birds, and to disclose any significant effects on the environment to the agency prior to commencing construction. In the event that the FCC determines that a proposed tower would have a significant environmental impact, the FCC would require preparation of an environmental impact statement. In some jurisdictions, local laws, zoning or land-use regulations may impose similar requirements.
Network Neutrality Regulations
The FCC, in March 2015, adopted net neutrality rules for broadband Internet providers, including mobile broadband Internet providers, in which such providers would not be able to engage in various forms of blocking, throttling or engaging in paid prioritization agreements with respect to Internet content, subject to reasonable network management. The FCC also adopted enhanced transparency rules and a general conduct rule regarding behavior of broadband Internet providers. In doing so, the FCC reclassified broadband Internet service as a Title II service under the Communications Act. These network neutrality rules have been appealed to the Court of Appeals for the District of Columbia, and such appeal remains pending. We cannot predict with any certainty the likely timing or outcome of any Court action.
Miscellaneous
We also are subject or potentially subject to numerous regulatory requirements, including, paying regulatory fees; number administration; number pooling rules; rules governing billing; cramming; technical coordination of frequency usage with adjacent carriers; height and power restrictions on our wireless transmission facilities; rules regarding radio frequency limits; outage reporting rules; and rules requiring us to offer equipment and services that are hearing aid compatible and accessible to and usable by persons with disabilities. Some of these requirements pose technical and operational challenges to which we, and the industry as a whole, have not yet developed clear solutions. We are unable to predict how they may affect our business, financial condition or results of operations. A number of wireless providers have been investigated by both the FTC and FCC for, and paid significant fines in connection with, the provision of unauthorized premium text messaging services, a practice known as cramming. Both the FTC and FCC have warned wireless carriers that they will be vigilant in prosecuting such practices. In addition, a number of states and localities have banned, or are considering banning or restricting, the use of
10
wireless phones while driving a motor vehicle. Texting while driving in Virginia is prohibited. West Virginia prohibits text messaging and use of handheld cell phones while driving, although use of hands-free devices is allowed.
11
Item 1A. | Risk Factors. |
RISK FACTORS
The following risk factors and other information included in this Annual Report on Form 10-K should be carefully considered. The risks and uncertainties described below are not the only ones we face. Additional risks and uncertainties not presently known to us or that we currently deem immaterial also may adversely impact our business operations. Our business, financial condition or results of operations could be materially adversely affected by any or all of these risks. Until the consummation of the Merger, we are subject to a number of business uncertainties and contractual restrictions under the Merger Agreement.
Risk Factors Related to the Merger with Shentel
There are risks related to the Merger that could have a material adverse impact on our business, financial condition, financial results and stock price.
Completion of the Merger with Shentel is subject to the satisfaction of various conditions, including approval of our stockholders and various government and regulatory approvals. Several of these conditions have been substantially satisfied, however, we have not received approval, or any indication thereof, from the FCC. There is no assurance that all conditions will be satisfied, that the FCC will provide its approval, or that the Merger will be consummated within the expected time frame or at all. If the Merger is not completed, the price of our common stock may decline to the extent that the current market price reflects a premium related to the potential Merger consideration. Prior to the announcement of the proposed Merger, our common stock traded at a materially lower price. In addition, under certain circumstances, if the Merger Agreement is terminated, we may be required to pay Shentel a termination fee of $8.8 million, plus the reimbursement of up to $2.5 million of fees, costs and expenses incurred by or on behalf of Shentel in connection with the Merger.
The Merger Agreement also restricts us from engaging in certain activities and taking certain actions without Shentel’s approval, which could prevent us from pursuing opportunities that may arise prior to the closing of the Merger.
The pendency of the Merger, and potential failure to complete the Merger, could materially and adversely impact our business.
The Merger with Shentel could cause disruptions in our business, which could have an adverse effect on our results of operations and financial condition. For example:
● | our employees may experience uncertainty about us and their future roles with us, which might adversely affect our ability to retain and hire key managers and other employees; | ||
● | customers and suppliers may experience uncertainty about the future and may seek alternative business relationships with third parties or seek to alter their business relationships with us; | ||
● | the attention of our management may be directed to transaction-related considerations and may be diverted from the day-to-day operations of our business; and | ||
● | we have incurred, and will continue to incur, significant fees for professional services and other transaction costs in connection with the Merger with Shentel, and many of these fees and costs are payable by us regardless of whether we consummate the transaction. | ||
In addition, if the Merger is not completed, our Board of Directors may consider various alternatives available to us, including, among others, continuing as a public company with no material changes to our business or capital structure, seeking to raise capital through the sale of equity or debt securities, seeking additional debt financing, or attempting to sell our company to another potential acquirer. These alternatives may involve additional risks to our business, including, among others, risks related to the diversion of management’s attention and additional expenses, our ability to consummate any such alternative transaction, our ability to obtain capital sufficient to operate our business, the valuation assigned to our business in any such alternative transaction, our ability or a potential buyer’s ability to access capital on acceptable terms or at all and other matters that may materially and adversely affect our business, results of operations and financial condition.
12
Risk Factors Related to Our Business
Increased competition and new market entrants in the wireless industry could materially adversely affect our business, financial condition and operating results.
Competition in the wireless industry is currently intense and is expected to continue to be intense. Our competition is led by the four largest nationwide providers of wireless services dominating the market. Our competition in the markets we serve have significantly greater resources than us, which could put us at a disadvantage in such things as product offerings, pricing, and roaming services. Additionally, new entrants have recently announced their intentions to compete for wireless subscribers, including cable companies and Google, potentially further increasing the competitive landscape. Our ability to effectively compete in this highly competitive market could adversely affect our business, financial condition and operating results.
If we are unable to attract and retain subscribers, our financial performance could be materially adversely affected.
We are primarily in the business of selling wireless communications services to subscribers, and our success in that business is based on our ability to attract new subscribers and retain current subscribers. Our business strategy to attract and retain subscribers historically has been to differentiate our regional brand relative to our primary competitors, most of whom are national providers, based on offering our customers savings and service. Although attracting new subscribers and retaining existing subscribers are both important to the financial viability of our business, there is an added focus on customer retention because the costs of adding a new subscriber, including but not limited to commissions, equipment subsidies and other sales incentives, are significantly higher than the costs associated with retaining an existing subscriber.
If our business strategy is unsuccessful and we are unable to differentiate our products and services from those offered by our competitors, we may have difficulty attracting new customers and retaining current subscribers, which could adversely affect our business, financial condition and operating results due to reduced revenues and higher operating costs.
The telecommunications industry is generally characterized by rapid development and technological innovations, which could increase our operating costs and diminish our ability to attract and retain subscribers, and have an adverse effect on our business, financial condition and operating results.
The telecommunications industry has been, and we believe will continue to be, characterized by several trends, including the rapid development and introduction of new technologies and services, including but not limited to 5G, voice over WiFi or other technologies. A number of our competitors have deployed or are in the process of deploying next generation technologies that are focused on the provisioning of mobile data services with even higher speeds, which increasingly are becoming a critical component of many wireless service provider offerings. We believe our continued success will depend, in part, on our ability to anticipate or adapt to technological changes, to complete our 4G network upgrade plan, and to offer, on a timely basis, new services and technologies that meet customer demands.
As new technologies are developed and deployed by competitors in our service area, some of our subscribers may select other providers’ offerings based on price, capabilities and personal preferences. We may not be able to respond to future changes and obtain access to new technologies on a timely basis or at an acceptable cost. The development of these new technologies, products and services may cause us to incur considerably more in capital expenditures and incremental operating costs than we have anticipated. To the extent that we do not keep pace with technological advances, fail to offer technologies comparable to those of our competitors or fail to respond timely to changes in competitive factors in our industry, we could lose existing customers and experience a decline in revenues and net income. Each of these factors could have a material adverse effect on our business, financial condition and results of operations.
The loss of our largest wholesale customer, Sprint, would materially adversely affect our business, financial condition and operating results.
For the year ended December 31, 2015, we generated approximately 37.8% of our revenues from the SNA with Sprint. In May 2014 the parties reached an amended agreement to extend the SNA through at least December 2022. Our business, financial condition, and operating results would suffer material adverse consequences due to lost revenues and decreased cash flows if (a) we were to lose Sprint as a customer, such as because of termination of the SNA due to our failure to upgrade to 4G LTE as required, (b) we are unable to realize the benefits under the SNA, such as preferred device pricing and nationwide 4G LTE roaming charges, or (c) Sprint experiences severe financial difficulties and/or is unwilling or unable to pay our charges or becomes bankrupt.
13
The pricing arrangements under our SNA with Sprint may fluctuate and there could be a decrease in the usage of our networks by Sprint customers, either of which could result in a decline in our wholesale revenues.
Under the SNA, our wholesale revenues are based on usage of our network by Sprint’s customers. In May 2014 the parties reached an amended agreement to extend the SNA through at least December 2022. The billable fixed fee element of the agreement was reduced pursuant to the amended SNA on August 1, 2015 and again on January 1, 2016. Additional annual reductions will occur on January 1 of each year resulting in a continual decrease of payments for the fixed fee element. Sprint could make changes to its subscriber contracts and national calling plans that could result in a decline in its overall subscriber base or Sprint may choose to manage its customers or distribution in our territories differently or take steps that reduce customer data or voice usage of our network. Additionally, we could experience migration by Sprint of its customers to non-CDMA technology, such as WiFi offloading or see a decline in the usage of our network by Sprint if we are unable to meet their customer demand for data services or fail to successfully design, build and deploy new technologies and services. If any or all of such events were to occur, or if, for any other reason, fewer Sprint customers were using our network or we experience lower usage of our network by Sprint, we could experience reduced revenues from Sprint.
Under the SNA, there are provisions, including rate reset provisions, which could, and have previously, resulted in disputes between us and Sprint from time to time. The SNA features a dispute resolution process which historically the parties have used in order to resolve open disputes. However, there can be no assurance that any future disputes will be resolved to our satisfaction and it is possible that the dispute resolution process might yield a result that would potentially lower Sprint’s payment obligations, which could have a material adverse effect on our business, financial condition and operating results.
Our largest competitors may build networks in our markets or use alternative suppliers, which may result in decreased revenues and severe price-based competition.
The national carriers and other larger wireless providers are investing substantial capital to deploy the necessary equipment for 4G LTE, LTE-A, 5G, and other enhanced network technologies and services, and may build or expand their own wireless networks in our service areas or obtain roaming services from alternative sources. Additionally, if any current or potential roaming partner or new alternative facilities-based provider were to launch or expand networks in our markets, we could experience increased price competition and potential loss of roaming business, which would adversely affect our revenues and operating results.
Our inability to obtain or gain access to additional spectrum in the future, including the licensing of additional spectrum by the FCC, could adversely affect our ability to compete in providing wireless services.
We may need to acquire or gain access to additional spectrum in the future in order to continue our customer growth, maintain our quality of service, meet increasing customer data usage demands and deploy new technologies. The wireless industry in general is experiencing a spectrum shortage and there is no assurance that any additional spectrum will be made available by Congress or the FCC, through auction or otherwise, on a timely basis, on terms and conditions or under service rules that we consider suitable for our commercial uses. Any additional spectrum made available from the FCC or from third parties may not be compatible with our existing spectrum, may not be readily usable as a result of the lack of technical standards of that spectrum, or we may not be able to acquire such spectrum at a reasonable cost or at all. Furthermore, the continued aggregation of spectrum by the largest nationwide carriers who, in the past, generally have been disinclined to divest or lease spectrum in secondary market transactions, may reduce our ability to obtain or gain access to additional spectrum from other carriers. Each of these factors would have a material adverse effect on our business, financial condition and results of operations.
If suppliers or vendors experience problems or favor our competitors, we could fail to obtain sufficient quantities of devices and accessories, or the products and services we require to operate our network successfully.
We depend on a limited number of key suppliers and vendors, including Apple, Samsung and others, for devices and accessories. Due to the scale of our operations, we may have difficulty obtaining specific types of devices, applications and content in a timely manner, or at all. The lack of availability to us of some of the latest and most popular devices, applications, and content, whether as a result of exclusive dealings, volume discounting, or otherwise, could put us at a significant competitive disadvantage and could make it more difficult for us to attract and retain our customers, especially as our competitors continue to aggressively offer device promotions with increased features, functionality and applications.
Apple devices represent a significant percentage of all devices sold by us. We have extended our existing contract with Apple through May 28, 2016. However, if we are unable to further extend our contract with Apple or enter into a new contract on a longer-term basis, with reasonable terms, or at all, our ability to attract and retain subscribers would be materially impacted.
We also rely on a limited number of network equipment manufacturers, including Alcatel-Lucent, Cisco Systems, Inc. and others, related to our network infrastructure. If these suppliers experience manufacturing delays, interruptions or other
14
problems delivering equipment and network components on a timely basis, our revenue and operating results could suffer significantly. Our initial choice of a network infrastructure supplier can, where proprietary technology of the supplier is an integral component of the network, cause us effectively to be locked into one or a few suppliers for key network components. If these companies experience financial or other problems, alternative suppliers and vendors may become necessary and we may not be able to obtain satisfactory and timely replacement supplies on economically attractive terms, or at all.
We may incur significantly higher wireless device and other costs than we anticipate in attracting new and retaining current subscribers.
Subscribers are purchasing data-centric devices and smartphones, such as the iPhone, as technological innovations occur. The cost of these multi-functional devices continues to increase as the number of features and applications they support increase. In addition, we believe we generally pay more, on average, to purchase devices than many of our national competitors, who buy from manufacturers in larger volumes. As more subscribers purchase or upgrade to new data-centric devices and smartphones, our business, financial condition and operating results could be adversely affected during the period of the sale or upgrade.
The loss of or inability to obtain or maintain voice and/or data roaming agreements, including for 4G LTE data roaming, at cost-effective rates or at all could have a material adverse effect on our business.
We rely on roaming agreements, primarily with Sprint and also with other wireless carriers, to provide nationwide coverage. These agreements are subject to renewal and termination rights, and if such agreements are terminated or not renewed, or the rates charged to us increase substantially, we may be required to pay significantly more for roaming service and we may be unable to provide competitive regional and nationwide wireless service to our customers on a cost-effective basis. If we are unable to meet our customers’ expectations for nationwide coverage for the services they want, including data roaming, it could reduce the number of new customers we add to our services and may increase our customer churn. In addition, many of our roaming partners have changed their technology from 3G to 4G LTE which may impact our ability to maintain 3G roaming for our customers with 3G only devices. Any inability to retain or obtain such data roaming agreements, 3G and 4G LTE, at cost-effective rates may limit our ability to compete effectively for subscribers, which could materially adversely affect our business, financial condition and operating results.
Future regulatory changes also may affect our ability to enter into new or maintain existing roaming agreements on competitive terms. We have encountered substantial difficulty attempting to negotiate what we believe are reasonable roaming rates for data services with a number of national carriers. We believe this is a result of the continuing consolidation that has occurred within the telecommunications industry, which has resulted in substantial amounts of spectrum being amassed by a few industry participants. We believe that the rates charged by the largest carriers for voice and data roaming services are higher than the rates such carriers charge to other roaming partners and resellers, and in most cases higher than they charge their retail customers, and that such carriers, due to their nationwide networks, do not have the necessary incentives to provide both voice and data roaming on reasonable terms and conditions. If we are unable to negotiate reasonable voice and data roaming rates, and in the absence of regulatory action to prevent the warehousing and effective blocking of access to the use of spectrum at reasonable roaming rates, we may be unable to provide nationwide roaming services to our customers on a cost-effective basis, which could have a material adverse effect on our business.
We offer customers the ability to purchase devices under an EIP with discounted postpaid service rates and the ability to upgrade more frequently than traditional postpaid contracts, which could result in higher churn, higher bad debt expense and higher retention expense, which could materially adversely affect our business, financial condition and operating results.
In August 2014, we started offering EIP which differs from the traditional subsidized postpaid plans. These plans do not require a customer to sign a service agreement to obtain postpaid service, but allow the customer to finance their device over 24 months, receive a discount on the postpaid service and allow for more frequent upgrades than traditional plans. We could experience reduced revenues from higher churn, increased costs from additional upgrades, increased credit risk and bad debt expense, and increased marketing efforts to retain customers. In addition, allowing these customers to pay for their device over 24 months will have a negative impact on working capital. If our EIP offering strategy is ineffective, our financial condition and operating results could be materially adversely affected.
We rely on indirect distribution channels to sell our products and services and are concentrated with two primary third party dealers. If we are unable to attract, incentivize and retain these third-party dealers, our revenues could decline and our costs could increase.
Our indirect distribution channel generates approximately 33.1% of our gross adds. Additionally, two primary third-party dealers represent approximately 85% of our total indirect gross adds. These two dealers along with the other dealers maintain
15
approximately 142 indirect retail distribution locations, many of which are not exclusive dealers, which means that these dealers may sell other third-party products and services in direct competition with us. As more of our competitors use third-party dealers to sell their products and services, competition for dealers intensifies and larger wireless carriers may be able to switch our two primary indirect distribution dealers, as well as the other smaller dealers, to their products and services by presenting more lucrative commissions and other benefits, due to a wider variety of products and services offered by these competitors. Additionally, due to dealer mismanagement, industry trends, macro-economic developments, or other reasons, our indirect distribution agents may experience problems and may be unable to continue or grow their operations. As a result, we may have difficulty attracting and retaining dealers and any inability to do so could have a negative effect on our ability to attract and obtain customers, which could have an adverse impact on our business. Additionally, a number of dealers that sell our products and services operate a significant number of separate locations. The loss of one or more of such dealers could have a material adverse impact on our business.
We will require a significant amount of cash to service our debt in future years and fund our other business needs, and may require additional capital to upgrade and operate our business, which may not be available to us on acceptable terms or at all.
Our ability to make payments on, or to refinance or repay, our debt, and to fund capital expenditures will depend largely upon our ability in the future to generate cash flows from operations, including from our wholesale relationship with Sprint, and to raise additional funds, including through the offering of equity or debt securities. Our future operating performance is subject to general economic, financial, competitive, legislative and regulatory factors, as well as other factors that are beyond our control. Our business may not generate enough cash flow, or future borrowings may not be available to us under the NTELOS Inc. Amended and Restated Credit Agreement or otherwise, in an amount sufficient to enable us to pay our debts or fund our other liquidity needs, including any unanticipated capital expenditures. Any failure to pay our debts or fund our liquidity needs could materially adversely affect our business, financial condition and results of operations.
Our substantial level of indebtedness could adversely affect our financial health and ability to compete.
As of December 31, 2015, our total outstanding debt, including capital lease obligations, was approximately $523.4 million. The significant amount of cash required to service our contractual obligations could substantially limit our resources for alternative capital needs by, among other things:
• | limiting our ability to obtain any additional financing we may need to operate, develop and expand our business; |
• | requiring us to dedicate a substantial portion of any cash flows from operations to service our debt, which reduces the funds available for operations and future business opportunities, potentially decreasing our ability to effectively compete in our industry; and |
• | exposing us to risks inherent in interest rate fluctuations because our borrowings have variable interest rates, which could result in higher interest expense if interest rates rise. |
The ability to make payments on our debt will depend upon our subsidiaries’ future operating performance, which is subject to general economic and competitive conditions and to financial, business and other factors, many of which we cannot control. If the cash flows from our subsidiaries’ operating activities are insufficient to service our debt obligations, we may take actions, such as delaying or reducing capital expenditures, reducing or terminating the amount of our stock repurchase program, attempting to restructure or refinance our debt, selling assets or operations or seeking additional equity capital. Any or all of these actions may not be sufficient to allow us to service our debt obligations. Further, we may be unable to take any of these actions on satisfactory terms, in a timely manner or at all. The NTELOS Inc. Amended and Restated Credit Agreement limits our subsidiaries’ ability to take several of these actions. Our failure to generate sufficient funds to pay our debts or to successfully undertake any of these actions could lead to our inability to repay our obligations under our indebtedness which, in turn, could have a material adverse effect on our business, financial condition and results of operations.
The NTELOS Inc. Amended and Restated Credit Agreement imposes operating covenants and restrictions, which may prevent us from capitalizing on business opportunities and taking some corporate actions.
The NTELOS Inc. Amended and Restated Credit Agreement imposes operating covenants and restrictions on our subsidiaries. These covenants and restrictions generally:
• | restrict our subsidiaries’ ability to incur additional indebtedness; |
• | restrict our subsidiaries from entering into transactions with affiliates; |
• | restrict our subsidiaries’ ability to consolidate, merge or sell all or substantially all of their assets; |
16
• | require our subsidiaries to use a portion of “Excess Cash Flow” (as defined in the agreement) to repay indebtedness if our leverage ratio exceeds specified levels; and |
• | restrict our subsidiaries’ ability to pay dividends or make advances to us to grant dividends. |
These covenants and restrictions could adversely affect our ability to pay dividends or repurchase stock, finance our future operations or capital needs or pursue available business opportunities. A breach of any of these covenants and restrictions could result in a default of the NTELOS Inc. Amended and Restated Credit Agreement. If a default occurs, our indebtedness under the NTELOS Inc. Amended and Restated Credit Agreement could be declared immediately due and payable, which could have a material effect on our business, financial position, results of operations and cash flows.
If interest rates increase, our net income could be negatively affected.
We are exposed to certain market risks including the impact of interest rate changes, due to our substantial level of indebtedness. If interest rates for our long-term debt increase, our future cash interest expense could be negatively affected, which could have a material adverse effect on our business, financial condition, operating results and cash flows. See Part II, Item 7A. Quantitative and Qualitative Disclosures About Market Risk of this Annual Report on Form 10-K for more specific information related to our exposure to changes in interest rates.
Failure to maintain our credit ratings could adversely affect our liquidity, capital position, future borrowing costs and access to capital markets.
Our credit risk is evaluated by independent rating agencies, which could downgrade our credit ratings in the future. Any downgrade could affect our ability to raise money in the future or increase the cost of new borrowings. There can be no assurance that we will be able to maintain our current credit ratings, and any actual or anticipated changes or downgrades in our credit ratings, including any announcement that our ratings are under review for a downgrade, may further impact us in a similar manner and may have a negative impact on our liquidity, capital position and access to capital markets.
Our success depends on our ability to attract and retain qualified management and other personnel.
Our business is led by a small number of key executive officers, and directed by a core group of senior level financial and operational management, technical and sales personnel (“qualified personnel”). We believe that our future success depends in substantial part on our continued ability to attract and retain highly knowledgeable qualified personnel. We believe that competition for highly qualified personnel is intense, and there can be no assurance that we will be successful in attracting and retaining other highly qualified personnel in the future sufficient to support our continued growth. We have experienced occasional difficulties in recruiting qualified personnel and there can be no assurance that we will not experience such difficulties in the future. In addition, at this time, the exercise price of a substantial portion of our stock options is above, and in some cases significantly above, the current trading prices of our common stock, which we believe negatively impacts our retention of qualified personnel. The departure of, or our inability to attract or retain, highly qualified personnel could have a material adverse effect on our business, financial condition and operating results.
If we lose the right to install our equipment on wireless cell sites or are unable to renew expiring leases for wireless cell sites on favorable terms or at all, our business and operating results could be adversely impacted.
As of December 31, 2015, approximately 99% of our cell sites were installed on leased facilities, with approximately 57% of the leased facilities installed on facilities owned by three tower companies, American Tower, Crown Communications and SBA, pursuant to license agreements, lease agreements, master lease agreements or master license agreements that govern the general terms of our use of that company’s facilities. If a license agreement, lease agreement, master lease agreement or master license agreement with one of these tower companies were to terminate, or if one of these tower companies were unable to support our use of its facilities, we would have to find new sites or rebuild the affected portion of our network. In addition, the concentration of our cell site leases with a limited number of tower companies could adversely affect our operating results and financial condition if we are unable to renew our expiring leases with these tower companies either on terms comparable to those we have today or at all. If any of the tower companies with which we do business were to experience severe financial difficulties, or file for bankruptcy protection, our ability to use facilities leased from that company could be adversely affected. If a material number of cell sites were no longer available for our use, our financial condition and operating results could be adversely affected.
A change or disruption in our system infrastructure, including those from our third-party vendors, or our systems’ ability to support changes in technologies and services expected by customers, could materially adversely affect our business.
Sophisticated information and billing systems are vital to our ability to monitor and control costs, bill customers, process customer orders, provide customer service, capture financial data and achieve operating efficiencies. We currently rely on
17
internal systems and third-party vendors to provide all of our information and processing systems. A disruption in our systems could be caused by aging systems and software, improperly installed new or upgraded business intelligence tools, performance issues experienced from our third party vendors, and dependency on licensing agreements. Additionally, our systems may not be able to support new technologies or changes to add and retain customers. In the event of any such disruption or inability to support technologies or expectations, we may not be able to conduct business in the normal course, which could cause a loss of customers and revenue and incur significant costs to repair or replace such systems.
In addition, we may, in the future, migrate our internal billing and point of sale systems to new third-party systems. Our inability to successfully migrate customers to new billing systems could result in billing delays and negative impacts to sales and customer service. These factors could materially adversely affect our business.
A disruption to our operations or those of other companies critical to our network operations could cause delays or interruptions of service, which could cause us to lose revenues and incur expenses.
To be successful, we must provide our customers reliable network service. Some of the risks to our network and infrastructure include:
• | physical damage to outside plant facilities including third-party locations and network providers; |
• | power surges or outages; |
• | software defects; |
• | human error; |
• | disruptions beyond our control, including disruptions caused by terrorist activities or severe weather; and |
• | failures in operational support systems. |
Network disruptions may cause interruptions in service or reduced capacity for customers, either of which could cause us to lose revenues and incur expenses.
Unauthorized use of, or interference with, our network could disrupt service and increase our costs.
We may incur costs associated with the unauthorized use of our network including administrative and capital costs associated with detecting, monitoring and reducing the incidence of fraud. Fraudulent use of our network may impact interconnection costs, capacity costs, administrative costs, fraud prevention costs and payments to other carriers for fraudulent roaming.
Cyber events may cause harm to our business and reputation and result in a loss of customers and significant expenses.
Our network and systems, including those of our third party vendors, may be vulnerable to cyber-attacks, computer viruses, hacking, theft, or similar unauthorized access and disruptive problems that pose risks to our ability to sustain service levels and ensure data security (collectively, “cyber events”). Cyber events are not limited to particular groups or locations and may be committed by employees or third parties from any location, including jurisdictions where law enforcement measures or remedies may be unavailable or ineffective. We do experience cyber events and attempts of cyber events of varying degrees periodically, however, to date, none have been material, individually or in aggregate, to our operational or financial condition. We maintain technical and administrative controls in an effort to reduce the risks and potential of cyber events and maintain insurance in an effort to mitigate the expenses associated with the occurrence of a cyber event. However, such controls and/or insurance may become more expensive or difficult to obtain, or prove insufficient to repel or mitigate a cyber event in the future.
Cyber events may cause equipment failure or damage, or disrupt our networks and systems and those of our customers, suppliers, or other third parties we rely on. Damaged equipment, reduced network capacity, or other issues with networks or systems that may result from a cyber event may be difficult to remedy in a timely or cost effective manner. Our inability to operate networks or systems or provide services to our customers, even for a limited period of time, could have an adverse effect on our business. Further, a cyber event may result in confidential, personal, and/or payment information regarding our customers being accessed, stolen, deleted, modified, or published. Improper access to, misuse, or disclosure of such information could result in substantial harm to our customers and to us. We may incur significant expenses for any cyber event, including investigating the cause of the cyber event, repair or replacement of affected equipment, legally mandated notification costs, expensive incentives offered to existing customers to retain their business, increased expenditures on security measures, lost revenues, and/or litigation. Additionally, as a result of any cyber event, we may suffer damage to our reputation, which could result in a loss of customers or suppliers and adversely impact customer and investor confidence. The occurrence of any cyber event could result in a material adverse effect on our operations and financial condition.
18
We and our suppliers may be subject to claims of infringement regarding telecommunications technologies that are protected by patents and other intellectual property rights.
In general, we do not manufacture any of the equipment or software used in our telecommunications businesses and we do not own any patents. Instead, we purchase the infrastructure equipment, handsets and software used in our business from third parties and we obtain licenses to use the associated intellectual property. Telecommunications technologies are protected by a wide variety of patents and other intellectual property rights. We and some of our suppliers and service providers may receive assertions and claims from third parties that the products or software utilized by us or our suppliers and service providers infringe on the patents or other intellectual property rights of these third parties. These claims could require us or an infringing supplier or service provider to cease certain activities or to cease selling the relevant products and services. The manufacturers and suppliers that provide us with the equipment and technology we use in our business may agree to indemnify us against possible infringement claims. However, we do not always have such indemnification protections in place and, even if we have such agreements in place, we may not be fully protected against all losses associated with infringement claims. In addition, the manufacturers and suppliers also may require us to indemnify them against infringement claims asserted against them with respect to equipment they sell to us. Whether or not infringement claims are valid or successful, such claims could adversely affect our business by diverting management attention, involving us in costly and time-consuming litigation, requiring us to enter into royalty or licensing agreements (which may not be available on acceptable terms, or at all), or requiring us to cease certain activities or to cease selling certain products and services to avoid claims of infringement.
If our long-lived or indefinite lived assets become impaired, it would materially adversely affect impact our operating results.
We test long-lived assets and intangibles subject to amortization for impairment when events and circumstances warrant. We test goodwill and other indefinite-lived intangible assets for impairment annually or whenever events or changes in circumstances warrant. Factors that may be considered a change in circumstances include declines in stock price, market capitalization, financial performance, or expectation of selling or disposing of an asset group or reporting unit. We are required to record a significant charge to earnings during the period in which any impairment was determined, negatively impacting our results of operations. In 2014, we recorded impairment charges on certain long-lived and indefinite-lived assets in the Eastern Markets. See Note 3 of the Notes to Consolidated Financial Statements.
The impact of economic downturns or other conditions leading to a decline in consumer discretionary spending may harm our business and materially adversely impact our operating results.
The impact of economic downturns on our customers, including unemployment and disruptions to the credit and financial markets, could cause customers to reduce spending. If demand for our services decreases, deactivations might increase and our revenues could be affected. In addition, during challenging economic times our customers may face issues gaining timely access to sufficient credit, which could impair their ability to pay for services they have purchased and lead to greater expense for uncollectible customer balances. Any of the above could have a material adverse effect on our business, financial position, results of operations and cash flows.
We also are susceptible to risks associated with the potential financial instability of the vendors and third parties on which we rely to provide services or to which we outsource certain functions. The same economic conditions that may affect our customers could negatively affect such vendors and third parties and lead to significant increases in prices, reduction in quality or the bankruptcy of our vendors or third parties upon which we rely. Any interruption in the services provided by our vendors or by such third parties could adversely affect our business, financial position, results of operations and cash flows.
The loss of our licenses could adversely affect our ability to provide wireless services.
Our wireless licenses are generally valid for ten years from the effective date of the license. Licensees may renew their licenses for additional ten-year periods by filing renewal applications with the FCC. Our wireless licenses expire in various years. The renewal applications are subject to FCC review and potentially public comment to ensure that the licensees meet their licensing requirements and comply with other applicable FCC mandates. If we fail to file for renewal at the appropriate time or fail to meet any regulatory requirements for renewal, we could be denied a license renewal and, accordingly, our ability to provide or continue to provide service in that license area would be adversely affected.
Additionally, many of our licenses are subject to interim or final construction requirements. While the licensees have generally met “safe harbor” standards for ensuring such benchmarks are met, we have relied on, and will in the future rely on, “substantial service” thresholds for meeting build-out requirements. In such cases, there is no guarantee that the FCC will find our construction sufficient to meet the applicable construction requirement, in which case the FCC could terminate our license and our ability to continue to provide service in that license area would be adversely affected.
19
The telecommunications industry is subject to legislative changes or regulatory requirements, which could affect our ability to compete and offer services.
As competition develops and technology evolves, federal and state regulation of the telecommunications industry continues to change. We anticipate that this state of regulatory flux will continue in the future as the FCC and state regulators respond to competitive, technological and legislative developments by modifying their existing regulations or adopting new ones. A number of recent actions indicate that the FCC will be proactive and potentially increase the regulatory requirements of wireless service providers. At this time, pending congressional legislative efforts to reform the Communications Act may cause major industry and regulatory changes that are difficult to predict. Taken together or individually, new or changed regulatory requirements affecting the telecommunications industry may harm our business and restrict the manner in which we operate our business. The enactment of adverse regulation or regulatory requirements may slow our growth and have a material adverse effect upon our business, results of operations and financial condition.
Our failure to comply with regulatory mandates could adversely affect our ability to provide wireless services.
The FCC regulates the licensing, operation, acquisition and sale of the licensed spectrum that is essential to our business. We must comply with a number of regulatory requirements, including, but not limited to, E-911, CALEA and the customer privacy mandates of the Customer Proprietary Network Information rules. We also must comply with regulations pertaining to the winning bid of our subsidiary in Mobility Fund Phase I. The FCC has taken an expansive view with respect to the scope of its authority over wireless carriers, which may lead to increased regulation of such carriers in the future. In addition, we must pay a variety of federal and state surcharges and fees on our gross revenues derived by interstate and intrastate services, the amount of which may be subject to review and revision in the future. Failure to comply with these and other regulatory requirements may have an adverse effect on our licenses or operations and could result in sanctions, fines or other penalties.
On January 29, 2015, the FCC adopted additional rules and regulations that require us and other carriers to implement requirements regarding location accuracy requirements for E-911. These stronger rules will enhance the ability of Public Safety Answering Points (PSAPs) to accurately identify the location of wireless 911 callers when a caller is indoors. These revised rules also strengthen the FCC’s existing E-911 location accuracy rules to improve location determination for outdoor calls as well. In addition, the FCC, in March 2015, adopted net neutrality rules for broadband Internet providers, including mobile broadband Internet providers, in which such providers would not be able to engage in various forms of blocking, throttling or engaging in paid prioritization agreements with respect to Internet content, subject to reasonable network management. The FCC also adopted enhanced transparency rules and a general conduct rule regarding behavior of broadband Internet providers. In doing so, the FCC reclassified broadband Internet service as a Title II service under the Communications Act. These network neutrality rules have been appealed to the Court of Appeals for the District of Columbia, and such appeal remains pending. We cannot predict with any certainty the likely timing or outcome of any Court action. The FCC, together with the FAA, also regulates tower marking and lighting. In addition, tower construction is affected by federal, state and local statutes addressing zoning, environmental protection and historic preservation. The FCC adopted significant changes to its rules governing historic preservation review of projects, which makes it more difficult and expensive to deploy antenna facilities, and is considering changes to its rules regarding environmental protection as related to tower construction, which, if adopted, could make it more difficult to deploy facilities.
Failure to maintain effective internal controls in accordance with Section 404 of the Sarbanes-Oxley Act could result in a loss of investor confidence regarding our financial statements or may have a material adverse effect on our business.
In accordance with Section 404 of the Sarbanes-Oxley Act, we along with our independent registered public accounting firm are required to report on the effectiveness of our internal control over financial reporting. Failure to design and maintain effective internal controls could constitute a material weakness which could result in inaccurate financial statements, inaccurate disclosures or failure to prevent fraud. If we were unable to conclude that we have effective internal controls, investor confidence regarding our financial statements and our business could be materially adversely affected.
Unanticipated changes in our tax provisions, the adoption of new tax legislation or exposure to additional tax liabilities could affect our profitability.
We are required to make judgments in order to estimate our obligations to taxing authorities. These tax obligations include income, real estate, sales and use and employment-related taxes and ongoing appeals issues related to these tax matters. These judgments include reserves for potential adverse outcomes regarding tax positions that have been taken that may be subject to challenge by the tax authorities. We also estimate our ability to utilize tax benefits, including those in the form of NOL carry-forwards and tax credits. See Note 14 of the Notes to Consolidated Financial Statements for additional information on our taxes.
20
We are subject to ongoing tax audits in various jurisdictions. Tax authorities may disagree with our judgments or other matters and assess additional taxes. We regularly assess the likely outcomes of these audits in order to determine the appropriateness of our tax provision and reserves. However, there can be no assurance that we will accurately predict the outcomes of these audits, and the amounts ultimately paid upon resolution of audits could be materially different from the amounts previously included in our income tax expense or operating taxes, and therefore could have a material impact on our net income and cash flows.
In addition, our effective tax rate in the future could be adversely affected by changes in tax laws and the discovery of new information in the course of our tax return preparation process. President Obama’s administration has announced proposals for other U.S. tax legislation that, if adopted, could adversely affect our tax rate. There are other tax proposals that have been introduced, that are being considered, or that have been enacted by Congress that could affect our tax rate or our tax liabilities. Any of these changes could affect our net income and cash flows.
Increases in our costs of providing benefits under our defined benefit pension and other postretirement benefit plans could negatively impact our results of operations and cash flows.
The measurement of the plan obligations and costs of providing benefits under our defined benefit pension and other postretirement benefit plans involves various factors, including the development of valuation assumptions and accounting policy elections. We are required to make assumptions and estimates that include the discount rate applied to benefit obligations, the long-term expected rate of return on plan assets, the anticipated rate of increase of health care costs, our expected level of contributions to the plans, the incidence of mortality, the expected remaining service period of plan participants, the level of compensation and rate of compensation increases, employee age, length of service, and the long-term expected investment rate credited to employees of certain plans, among other factors. See Note 15 of the Notes to Consolidated Financial Statements for additional information regarding the accounting for the defined benefit pension and other postretirement benefit plans. If our benefit plans’ costs increase, due to adverse changes in the U.S. securities markets, resulting in worse-than-assumed investment returns and discount rates, and adverse medical cost trends, our financial condition and operating results could be adversely affected.
Risk Factors Related to Our Common Stock
Our stock price has historically been volatile and may continue to be volatile and may not reflect our actual operations and performance.
Prior to entering into the Merger Agreement, the trading price of our common stock had been and may in the future, particularly in the event that the Merger is not consummated, be subject to significant fluctuations. Our stock price may fluctuate in response to a number of events and factors unrelated to our performance, some of which are beyond our control, including, but not limited to:
• | actual or anticipated variations in our quarterly and annual operating results or those of our competitors, including announcements of subscribers and churn rates; |
• | changes in financial estimates by us or changes in financial estimates or recommendations by any securities analysts who might cover our stock; |
• | speculation in the media or investment community about, or actual changes in, our current or future relationship with Sprint; |
• | actual or anticipated changes in Sprint’s business, financial condition and operating results; |
• | changes in general or industry specific market conditions, trends or governmental regulations and approvals; |
• | conditions, trends or changes in the securities marketplace or stock market performance in the United States, including trading volumes; |
• | adverse changes in economic conditions, including the cost and availability or perceived availability of additional capital and market perceptions relating to our access to this capital; |
• | changes in the market valuations of other companies operating in our industry; |
• | significant or sustained changes to our market capitalization; |
• | technological innovations by us or our competitors, including the availability of 4G LTE and/or deployment of next generation networks; |
• | announcements by us or our competitors of acquisitions, strategic partnerships, significant contracts or divestitures; |
21
• | announcements of investigations, regulatory scrutiny of our operations or lawsuits filed against us; |
• | changes in domestic and global economic and political factors, including those resulting from war, incidents of terrorism or responses to such events; |
• | changes in accounting principles; |
• | additions or departures of key personnel; and |
• | sales of large blocks of our common stock, including sales of our common stock by our directors, executive officers or affiliates. |
Stock price volatility and sustained decreases in our share price could subject our stockholders to losses and us to takeover bids or lead to action by the NASDAQ. For these reasons, investors should not rely on recent or historical trends to predict future stock prices, financial condition, results of operations or cash flows.
Quadrangle continues to have significant influence over our business and could delay, deter or prevent a change of control, change in management or business combination that may not be beneficial to our stockholders and as a result, may depress the market price of our stock.
As of December 31, 2015, Quadrangle beneficially owned approximately 4.2 million shares of our common stock, or approximately 19% of our outstanding common stock. In addition, two of the eight directors that serve on our board of directors are representatives or designees of Quadrangle. By virtue of such stock ownership and representation on the board of directors, including a representative of Quadrangle being Chairman of the Board of Directors, Quadrangle continues to have the ability to influence corporate and management policies and all matters submitted to our stockholders, including the election of the directors, and to exercise significant control over our business, policies and affairs. Quadrangle’s interests as a stockholder may not always coincide with the interests of other stockholders. In the event that the Merger is not consummated, such concentration of voting power could have the effect of delaying, deterring or preventing a change of control, change in management or business combination that might otherwise be beneficial to our stockholders and, as a result, may depress the market price of our stock.
Provisions in our charter documents and the General Corporation Law of Delaware could discourage potential acquisition proposals, could delay, deter or prevent a change in control and could limit the price certain investors might be willing to pay for our common stock.
Although our board of directors has approved the Merger Agreement, certain provisions of the General Corporation Law of Delaware, the state in which we are organized, and our certificate of incorporation and by-laws may inhibit a change of control not approved by our board of directors or changes in the composition of our board of directors, which could result in the entrenchment of current management. These provisions include:
• | advance notice requirements for stockholder proposals and director nominations; |
• | limitations on the ability of stockholders to amend, alter or repeal our by-laws; |
• | limitations on the removal of directors; |
• | the inability of the stockholders to act by written consent; and |
• | the authority of the board of directors to issue, without stockholder approval, preferred stock with such terms as the board of directors may determine and additional shares of our common stock. |
Item 1B. | Unresolved Staff Comments. |
None.
22
Item 2. | Properties. |
We are headquartered in Waynesboro, Virginia and own offices and facilities in a number of locations within our operating markets. We believe that our current facilities are adequate to meet our needs in our existing markets for the foreseeable future. The table below provides the location, description and approximate square footage of our material owned properties.
Location | Property Description | Approximate Square Footage | |
Waynesboro, VA | Corporate Headquarters Building | 51,000 | |
Waynesboro, VA | Customer Care Building | 31,000 | |
Waynesboro, VA | Wireless Switch Building | 17,000 | |
Waynesboro, VA | Retail Store | 4,000 | |
Clifton Forge, VA | Commercial Rental Property | 15,600 | |
Norfolk, VA | Wireless Switch Building | 4,900 | |
As of December 31, 2015, we owned 12 cell sites and leased 996 cell sites of which approximately 57% are installed on structures controlled by three tower companies, Crown Communications, American Tower and SBA.
In January 2015, we entered into a definitive agreement to sell most of our owned towers. We closed on 96 towers during 2015, one in early 2016 with an additional tower expected to close this year. The agreement provides for long term lease agreements for towers in our operating footprint.
We also lease properties from third parties associated with our retail stores located throughout our operating markets, two warehouses located in Charleston, WV and Waynesboro, VA, an additional customer care facility located in Covington, VA, and two regional operations centers located in Charleston, WV and Richmond, VA.
Item 3. | Legal Proceedings. |
We are involved in routine litigation in the ordinary course of our business. We do not believe that any pending or threatened litigation of which we are aware will have a material adverse effect on our financial condition, results of operations or cash flows. In addition, on August 24, 2015, Mr. Marvin Westen and Mr. Paul Sekerak, each filed a purported class action complaint relating to the Merger in the Court of Chancery of the State of Delaware. The Company cannot presently determine the ultimate resolution of this matter nor can it reasonably estimate the range of possible losses.
Item 4. | Mine Safety Disclosures. |
Not applicable.
23
PART II
Item 5. | Market for Registrant’s Common Equity, Related Stockholder Matters and Issuer Purchases of Equity Securities. |
Market Information
Our common stock trades on the NASDAQ Global Select Market under the symbol “NTLS.” On March 8, 2016, the last reported sale price for our common stock was $9.20 per share.
The following table sets forth, for the periods indicated, the high and low closing prices per share of our common stock and the cash dividends declared per common share.
Fiscal Year 2015 | Fiscal Year 2014 | ||||||||||||||||||||||||||||||
Fourth Quarter | Third Quarter | Second Quarter | First Quarter | Fourth Quarter | Third Quarter | Second Quarter | First Quarter | ||||||||||||||||||||||||
High price | $ | 9.23 | $ | 9.23 | $ | 8.74 | $ | 6.36 | $ | 11.07 | $ | 13.61 | $ | 15.10 | $ | 21.40 | |||||||||||||||
Low price | 9.08 | 4.52 | 4.62 | 3.88 | 3.85 | 10.44 | 11.20 | 12.40 | |||||||||||||||||||||||
Dividends declared | — | — | — | — | — | — | 0.42 | 0.42 | |||||||||||||||||||||||
Stock Performance Graph
The following indexed line graph indicates our cumulative total return to stockholders from December 31, 2010 to December 31, 2015, as compared to the total return for the NASDAQ Composite Index and the NASDAQ Telecommunications Index for the same period. The calculations in the graph assume that $100 was invested on December 31, 2010 in our common stock and in each index. The calculations assume cash dividend reinvestment and reinvestment of $15.86, the opening price of Lumos Networks common stock on November 1, 2011, one share of which was distributed by the Company for each share of NTLS common stock outstanding following the 1-for-2 reverse split, all of which occurred after the market close on October 31, 2011.
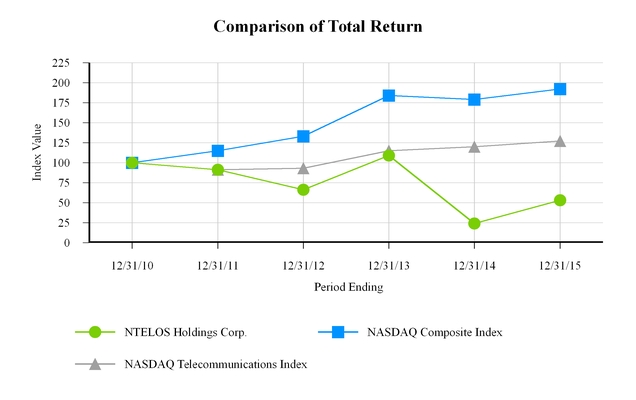
24
December 31, 2010 | December 31, 2011 | December 31, 2012 | December 31, 2013 | December 31, 2014 | December 31, 2015 | ||||||||||||||||||
NTELOS Holdings Corp. | $ | 100 | $ | 91 | $ | 66 | $ | 109 | $ | 24 | $ | 53 | |||||||||||
NASDAQ Composite Index | 100 | 115 | 133 | 184 | 179 | 192 | |||||||||||||||||
NASDAQ Telecommunications Index | 100 | 91 | 93 | 115 | 120 | 127 | |||||||||||||||||
Holders
There were approximately 146 registered holders and 4,400 beneficial holders of our common stock on March 8, 2016.
Dividends/Dividend Policy
On May 22, 2014, the board of directors, in order to support our LTE network expansion and wholesale and retail growth initiatives, eliminated the quarterly dividend. Any decision to declare future dividends will be made at the discretion of the board of directors and will depend on, among other things, our results of operations, cash requirements, investment opportunities, financial condition, contractual restrictions and other factors that the board of directors may deem relevant. We are a holding company that does not operate any business of our own. As a result, we are dependent on cash dividends and distributions and other transfers from our subsidiaries to make dividend payments or to make other distributions to our stockholders, including by means of a stock repurchase. Amounts available to us to pay cash dividends or repurchase stock are restricted by the NTELOS Inc. Amended and Restated Credit Agreement.
Purchases of Equity Securities by the Issuer and Affiliated Purchasers
In August 2009, the Company’s board of directors authorized management to repurchase up to $40.0 million of the Company’s common stock. The Company did not purchase any shares of its common stock during the years ended December 31, 2015 and 2014 under the authorization. The approximate dollar value of shares that may yet be purchased under the plan was $23.1 million as of December 31, 2015. During the fiscal years 2015 and 2014, the Company repurchased approximately $0.1 million of restricted common stock in order to satisfy certain minimum tax withholding obligations in connection with the vesting of restricted stock. Amounts available to us to repurchase stock are restricted by the NTELOS Inc. Amended and Restated Credit Agreement.
25
Item 6. | Selected Financial Data. |
SELECTED HISTORICAL FINANCIAL INFORMATION
Year Ended December 31, | |||||||||||||||||||
(In thousands, except per share amounts) | 2015 | 2014 | 2013 | 2012 (1) | 2011 (1) | ||||||||||||||
Consolidated Statements of Operations Data | |||||||||||||||||||
Operating revenues | $ | 362,640 | $ | 360,134 | $ | 359,766 | $ | 453,989 | $ | 422,629 | |||||||||
Operating expenses | 331,079 | 322,392 | 289,415 | 390,847 | 356,375 | ||||||||||||||
Operating income | 31,561 | 37,742 | 70,351 | 63,142 | 66,254 | ||||||||||||||
Other expenses | (30,509 | ) | (33,812 | ) | (30,536 | ) | (30,138 | ) | (26,451 | ) | |||||||||
Income from continuing operations before income taxes | 1,052 | 3,930 | 39,815 | 33,004 | 39,803 | ||||||||||||||
Income tax expense | 2,187 | 747 | 16,127 | 12,676 | 16,363 | ||||||||||||||
Income (loss) from continuing operations | (1,135 | ) | 3,183 | 23,688 | 20,328 | 23,440 | |||||||||||||
Income (loss) from discontinued operations, net | (9,903 | ) | (55,349 | ) | 3,051 | — | (45,386 | ) | |||||||||||
Net income (loss) | (11,038 | ) | (52,166 | ) | 26,739 | 20,328 | (21,946 | ) | |||||||||||
Net income attributable to noncontrolling interests | (1,168 | ) | (1,468 | ) | (2,061 | ) | (1,941 | ) | (1,769 | ) | |||||||||
Net income (loss) attributable to NTELOS Holdings Corp. | $ | (12,206 | ) | $ | (53,634 | ) | $ | 24,678 | $ | 18,387 | $ | (23,715 | ) | ||||||
Earnings (Loss) per Share Attributable to NTELOS Holdings Corp. (2) | |||||||||||||||||||
Basic | |||||||||||||||||||
Continuing operations | $ | (0.10 | ) | $ | 0.08 | $ | 1.02 | $ | 0.88 | $ | 1.04 | ||||||||
Discontinued operations | (0.47 | ) | (2.62 | ) | 0.15 | — | (2.18 | ) | |||||||||||
Total | $ | (0.57 | ) | $ | (2.54 | ) | $ | 1.17 | $ | 0.88 | $ | (1.14 | ) | ||||||
Diluted | |||||||||||||||||||
Continuing operations | $ | (0.10 | ) | $ | 0.08 | $ | 0.99 | $ | 0.86 | $ | 1.02 | ||||||||
Discontinued operations | (0.47 | ) | (2.62 | ) | 0.14 | — | (2.13 | ) | |||||||||||
Total | $ | (0.57 | ) | $ | (2.54 | ) | $ | 1.13 | $ | 0.86 | $ | (1.11 | ) | ||||||
Cash Dividends Declared per Share – Common Stock | $ | — | $ | 0.84 | $ | 1.68 | $ | 1.68 | $ | 2.10 | |||||||||
As of December 31, | |||||||||||||||||||
(In thousands) | 2015 | 2014 | 2013 (1) | 2012 (1) | 2011 (1) | ||||||||||||||
Balance Sheet Data | |||||||||||||||||||
Cash | $ | 72,687 | $ | 73,546 | $ | 88,441 | $ | 76,197 | $ | 59,950 | |||||||||
Property, Plant and Equipment, net | 326,260 | 266,054 | 319,376 | 303,103 | 288,368 | ||||||||||||||
Total Assets | 642,989 | 647,717 | 716,251 | 680,114 | 632,658 | ||||||||||||||
Total Debt | 520,239 | 525,219 | 490,366 | 494,079 | 458,409 | ||||||||||||||
Total NTELOS Holdings Corp. Stockholders’ Equity (Deficit) | (40,598 | ) | (34,132 | ) | 43,283 | 44,525 | 51,584 | ||||||||||||
(1) | Consolidated Statement of Operations information for 2012 and 2011 and Balance Sheet information for 2013, 2012, and 2011 have not been recast to reflect discontinued operations from the shut down of our Eastern Markets. Financial information for 2011 reflects the discontinued operations related to the spin-off of Lumos Networks. |
(2) | Earnings per common share for 2011 has been adjusted for the October 31, 2011 1-for-2 reverse stock split. |
26
Item 7. | Management’s Discussion and Analysis of Financial Condition and Results of Operations. |
You should read the following discussion of our financial condition and results of operations in conjunction with our consolidated financial statements and the related notes included herein (Item 8). The Private Securities Litigation Reform Act of 1995 provides a “safe harbor” for forward-looking statements made by or on behalf of the Company. This section covers the current performance and outlook of the Company. The forward-looking statements contained in this section and in other parts of this document involve risks and uncertainties that may affect the Company’s operations, markets, products, services, prices and other factors as more fully discussed elsewhere and in filings with the SEC. These risks and uncertainties include, but are not limited to, risks and uncertainties associated with the Merger such as: (1) conditions to the closing of the Merger, including, without limitation, the consummation of certain transactions between Shentel and Sprint, may not be satisfied and required regulatory approvals, including, without limitation, FCC approval, may not be obtained; (2) the Merger may involve unexpected costs, liabilities or delays; (3) the risks related to disruption of management’s attention from the Company’s ongoing business operations due to the Merger, (4) the effect of pendency of the Merger on the ability of the Company to retain and hire key personnel and maintain relationships with its customers, suppliers and others with whom it does business, or on its operating results and business generally, (5) the outcome of any legal proceedings related to the Merger; (6) the Company may be adversely affected by other economic, business, and/or competitive factors; (7) the occurrence of any event, change or other circumstances that could give rise to the termination of the Merger Agreement; (8) changes in the legal or regulatory environment; and (9) other risks to consummation of the Merger, including the risk that the Merger will not be consummated within the expected time period or at all. If the Merger is consummated, the Company stockholders will cease to have any equity interest in the Company and will have no right to participate in its earnings and future growth.
Additional factors that may affect the future results of the Company are set forth in Item 1A. Risk Factors of this Annual Report on Form 10-K. Accordingly, there is no assurance that the Company’s expectations will be realized. The Company assumes no obligation to provide revisions to any forward-looking statements should circumstances change, except as otherwise required by applicable laws.
OVERVIEW
General
We are a regional provider of digital wireless communications services to consumers and businesses primarily in Virginia, West Virginia, and certain portions of surrounding states. We offer wireless voice and digital data PCS products and services to retail and business customers under the “NTELOS Wireless” and “FRAWG Wireless” brand names. We conduct our business through NTELOS-branded retail operations, which sell our products and services via direct and indirect distribution channels, and provide network access to other telecommunications carriers, most notably through an arrangement with Sprint Spectrum L.P. (“Sprint Spectrum”), and Sprint Spectrum on behalf of and as an agent for SprintCom, Inc. (“SprintCom”) (Sprint Spectrum and SprintCom collectively, “Sprint”), which arrangement is referred to herein as the “Strategic Network Alliance” or the "SNA".
We operate a 100% CDMA digital PCS network and are actively deploying 4G LTE across our footprint in Virginia, West Virginia, and certain portions of surrounding states with covered POPs of approximately 3.1 million. We believe our strategic focus in the markets we serve, our commitment to personalized local service, contiguous service area and leveraged use of our network via our wholesale contracts provide us with a differentiated competitive position relative to our primary wireless competitors, most of whom are national providers. Our strategic marketing differentiator is based upon an approach of offering each customer The Best Value in Wireless, which we define as a robust nationwide coverage area, simple, flexible wireless rate plans, and popular wireless handsets.
Agreement and Plan of Merger with Shenandoah Telecommunications Company ("Shentel")
On August 10, 2015, we announced that we entered into a definitive agreement to be acquired by Shentel in an all-cash transaction valued at approximately $640 million, including net debt. Our stockholders will receive approximately $208 million in cash, or $9.25 per share and Shentel will assume our debt at closing.
Concurrent with the signing of the Merger Agreement, Shentel entered into a series of agreements with Sprint, including the expansion of Shentel’s “affiliate” relationship with Sprint. This will result in the “nTelos” brand eventually being discontinued after closing and NTELOS’s approximately 300,000 wireless retail customers eventually becoming Sprint-branded customers. Additionally, NTELOS’s retail stores will convert into Sprint-branded stores.
The Merger is subject to customary closing conditions, including the completion of Shentel’s re-affiliation transaction with Sprint, approval of the Merger by the Company’s stockholders and receipt of all necessary regulatory approvals. The Company
27
has already received shareholder approval for the Merger and all necessary approvals from federal and state regulators necessary to complete the Merger, other than approval from the FCC. The Company expects to receive FCC approval late in the first quarter or early in the second quarter of 2016 and that the Merger will close soon thereafter.
For additional information, see Note 1 of the Notes to Consolidated Financial Statements.
Sale of Virginia East Spectrum and Shut Down of Eastern Markets
On December 1, 2014, the Company entered into an agreement to sell its wireless spectrum licenses in its eastern Virginia and Outer Banks of North Carolina markets (“Eastern Markets”) for approximately $56.0 million. The transaction closed on April 15, 2015. The Company entered into lease agreements to continue using the Eastern Markets spectrum licenses for varying terms ranging from the closing date through November 15, 2015. Effective November 15, 2015, we ceased commercial operations and all subscribers had been migrated off our network. As a result of no longer providing service in the Eastern Markets, certain assets, liabilities and results of operations associated with this market are now being reported as discontinued operations. Accordingly, we have recast the prior period results to be comparable with the current discontinued operations presentation.
For additional information, see Note 3 of the Notes to Consolidated Financial Statements.
Towers Sale
As part of a definitive agreement announced in January 2015 to sell up to 103 towers, we closed on 96 towers for approximately $41.0 million. We have closed on one tower in early 2016 with an additional tower expected to close this year. The agreement provides that we enter into long term lease agreements on the towers in our operating footprint.
Market Risks
The telecommunications industry has been, and we believe will continue to be, characterized by several trends, including the rapid development and introduction of new technologies and services, including but not limited to 4G LTE, 5G, voice over WiFi or other technologies. A number of our competitors have deployed next generation technologies that are focused on the provisioning of mobile data services with higher speeds, which increasingly are becoming a critical component of many wireless service provider offerings. We believe our continued success will depend, in part, on our ability to anticipate or adapt to technological changes and to offer, on a timely basis, services, such as higher-speed data services, that meet customer demands.
The retail market for wireless broadband mobile services remains highly competitive. We believe that competition for customers among wireless broadband providers is based on price, service area, network performance, brand awareness and reputation, services and features, handset selection, call quality and customer service. In addition, the market for wireless services has increasingly required that we provide nationwide coverage to our customers, both for voice and data services. We currently rely on roaming agreements, primarily with Sprint and also with other wireless carriers, to provide service in areas not covered by our network. These agreements are subject to renewal and termination rights, and if such agreements are terminated or not renewed, or the rates charged to us increase substantially, we may incur significantly higher costs for roaming service and we may be unable to provide competitive regional and nationwide wireless service to our customers on a cost-effective basis.
As competition increases and technology evolves, federal and state regulation of the telecommunications industry continues to change. We anticipate that this state of regulatory flux will continue in the future as the FCC and state regulators respond to competitive, technological and legislative developments by modifying their existing regulations or adopting new ones. The impact of economic downturns on our customers, including unemployment and disruptions to the credit and financial markets, could cause customers to further reduce spending. Taken together or individually, new or changed regulatory requirements and the possibility of wide ranging changes and reform mandated by the federal and state governments to stimulate economic recovery, could affect the telecommunications industry and may harm our business and restrict the manner in which we operate our business.
We expect postpay competition to continue to be intense and is led by the four largest providers of wireless services dominating the market, who are nationwide in scope and have significantly greater resources than us. We must increasingly target switchers rather than first-time purchasers of wireless services to expand our subscriber base. However, despite the increased competition, we must control churn to help grow our subscriber base. To do so, we continue to use predictive analytics to identify high-risk churn areas within our postpay and prepay customer bases, which leads to proactive communication and retention efforts, resulting in stable customer churn and positive net subscriber additions.
28
We continue to face risks to our competitive “value” position in the postpay market through reduced price nationwide voice, text and data plans offered by competitors such as AT&T, Verizon Wireless, Sprint, T-Mobile and US Cellular. A number of other wireless broadband mobile carriers, resellers and MVNOs are offering, and in the future may offer, service plans similar to, or competitive with, our service plans with more extensive geographic coverage than ours, better brand awareness, lower prices and other differentiating features.
We also expect the competition with prepaid products to remain strong as competitors have targeted the prepaid market as a means to sustain growth and increase market share. A number of large wireless competitors, including Boost and Virgin Mobile (MVNOs operated by Sprint), TracFone’s Straight Talk service, T-Mobile, Net10 and Simple Mobile actively compete for prepay customers in our markets. Many of these competitors have access to big box national retailers that currently are not in our distribution channel. Pricing competition in the prepaid market is intense, with a number of prepaid unlimited nationwide plans being offered for less than $50 per month.
To remain competitive with our prepaid product offerings, we continually monitor our FRAWG Unlimited Wireless prepay product offerings. We offer the FRAWG Unlimited Wireless product in all of our markets. FRAWG is a simple, “no contract,” low cost service that has a minimum number of plans, offers attractive features, including smartphone options and provides regional or national unlimited coverage.
Our ability to grow our customer base and retain current subscribers will depend, in part, on our ability to adapt to changes in pricing plans, continue to improve our network coverage and reliability, and make available service offerings on the latest network technology and devices. At the same time, these competitive factors could cause our churn to increase making it difficult for us to add net subscribers and may put downward pressure on our retail revenue in 2016.
Strategic Network Alliance ("SNA")
We provide PCS services and have contracted to provide LTE Services on a wholesale basis to other wireless communication providers, most notably through the Strategic Network Alliance ("SNA") with Sprint in which the Company is the exclusive PCS/LTE service provider in the Company’s western Virginia and West Virginia service area (“SNA service area”) for all Sprint Code Division Multiple Access (“CDMA”) and LTE wireless customers. In May 2014 the parties entered into an amended agreement to extend the SNA. Pursuant to the terms of the SNA, the Company is required to upgrade its network in the SNA service area to provide LTE Services. As part of the amendment, the Company leases spectrum, on a non-cash basis, from Sprint in order to enhance the PCS/LTE services. The non-cash consideration attributable to the leased spectrum is approximately $4.9 million per year. The lease expense is recognized over the term of the lease and recorded within cost of services, with the offsetting consideration recorded within wholesale and other revenue. Additionally, the amended SNA provides the Company access to Sprint’s nationwide 3G and 4G LTE network at rates that are reciprocal to rates paid by Sprint under the amended SNA. The amended SNA provides that a portion of the amount paid by Sprint thereunder is fixed. The billable fixed fee element of the agreement was reduced pursuant to the amended SNA on August 1, 2015 and again on January 1, 2016. Additional annual reductions will occur on January 1 of each year. The Company accounts for this fixed fee portion of the revenue earned from the SNA revenue on a straight-line basis over the term of the agreement. In addition, these reductions are subject to further upward or downward resets in the fixed fee element. These resets, if any, will be recognized in the period in which it occurs.
The Company generated 37.8%, 41.3% and 46.6% of its revenue from the SNA for the years ended December 31, 2015, 2014 and 2013, respectively.
29
RESULTS OF OPERATIONS – OVERVIEW
Fiscal Year 2015 Results
Operating revenues increased $2.5 million, or 0.7%, to $362.6 million for the year ended December 31, 2015 compared to $360.1 million for the year ended December 31, 2014 driven primarily by an increase in equipment sales, offset by a decrease in retail and wholesale and other revenues. Operating income decreased $6.1 million, or 16.2%, to $31.6 million for the year ended December 31, 2015 compared to $37.7 million the year ended December 31, 2014 reflecting an increase in operating expenses related to the increase in equipment costs and network expenses, offset by corporate expense reductions and gain on sale of assets. Other expense decreased $3.3 million, or 9.8%, to $30.5 million for the year ended December 31, 2015 compared to $33.8 million for the year ended December 31, 2014. Income from continuing operations before income taxes decreased $2.8 million, or 71.8%, to $1.1 million for the year ended December 31, 2015 compared to $3.9 million for the year ended December 31, 2014, for the reasons discussed above.
For further detail regarding our operating results, including explanation of the non-GAAP measure ABPU, see the Other Overview Discussion and Results of Operations – Comparison of Year Ended December 31, 2015 and 2014 below.
Other Overview Discussion
To supplement our financial statements presented in accordance with accounting principles generally accepted in the United States of America (“GAAP”), we reference the non-GAAP measure Average Billings per User ("ABPU") to measure our postpay wireless performance. We use this measure, along with other performance metrics such as subscribers and churn, to gauge operating performance for which our operating managers are responsible and upon which we evaluate their performance.
We believe ABPU provides management useful information concerning the appeal of our rate plans and service offerings and our performance in attracting and retaining high-value customers. ABPU as calculated below may not be similar to ABPU measures of other wireless companies, is not a measurement under GAAP and should be considered in addition to, but not as a substitute for, the information contained in our unaudited condensed consolidated statements of income.
The tables below provide a reconciliation of retail revenues to postpay subscriber revenues used to calculate ABPU for the years ended December 31, 2015, 2014 and 2013.
ABPU
(Dollars in thousands, except ABPU) | 2015 | 2014 | 2013 | ||||||||
Retail Revenue | $ | 168,674 | $ | 177,295 | $ | 172,427 | |||||
Add: EIP billings | 15,685 | 364 | — | ||||||||
Less: prepay service revenues and other | (25,151 | ) | (25,333 | ) | (24,847 | ) | |||||
Total postpay billings | $ | 159,208 | $ | 152,326 | $ | 147,580 | |||||
Average number of postpay subscribers | 228,000 | 212,800 | 201,200 | ||||||||
Postpay ABPU | $58.20 | $59.64 | $61.12 | ||||||||
Operating Revenues
Our revenues are generated from the following categories:
• | Retail – subscriber revenues from network access, data services, and feature services; |
• | Wholesale and other – primarily wholesale revenue from the SNA and roaming revenue from other telecommunications carriers. Other revenues relate to rent from leasing excess tower and building space; and |
• | Equipment sales – sales from devices and accessories to new and existing customers. |
Operating Expenses
Our operating expenses are categorized are follows:
• | Cost of services – includes usage-based access charges, including long distance, roaming charges, and other direct costs incurred in accessing other telecommunications providers’ networks in order to provide telecommunication services to our end-user customers; leased facility expenses for connection to other |
30
carriers, leased spectrum, cell sites and switch locations; and engineering and repairs and maintenance expenses related to property, plant and equipment;
• | Cost of equipment sold – includes device and accessory costs to new and existing customers, |
• | Customer operations – includes marketing, product management, product advertising, selling, billing, customer care, customer retention and bad debt expenses; |
• | Corporate operations – includes taxes other than income; executive, accounting, legal, purchasing, information technology, human resources and other general and administrative expenses, including bonuses and equity-based compensation expense related to stock and option instruments held by certain members of corporate management, and accretion of asset retirement obligations; |
• | Restructuring – includes employee separations, contract terminations and other costs related to the reduction of corporate operating expenses; |
• | Depreciation and amortization – includes depreciable long-lived property, plant and equipment and amortization of intangible assets where applicable; |
• | Gain on sale of assets – includes the gain from the sale of towers and certain intangible assets. |
Other Expense
Other expense includes interest expense on debt instruments, corporate financing costs and debt discounts associated with the repricing and refinancing of our debt instruments and, as appropriate, related charges or amortization of such costs and discounts, changes in the fair value of our interest rate cap and other items such as interest income, interest income from EIP receivables, and fees.
Income Taxes
Income tax expense and the effective tax rate increase or decrease based upon changes in a number of factors, including our pre-tax income or loss, non-controlling interest, state minimum tax assessments, and non-deductible expenses.
Noncontrolling Interests in Losses (Earnings) of Subsidiaries
We own 97% of Virginia PCS Alliance, L.C. (the “VA Alliance”), which provides PCS services to an estimated two million populated area in central and western Virginia. In accordance with the noncontrolling interest requirements in FASB ASC 810-10-45-21, we attribute 3% of VA Alliance net income to these noncontrolling interests. No capital contributions from the minority owners were made during the years ended December 31, 2015 or 2014. The VA Alliance made capital distributions to the minority owners of $0.8 million, $0.8 million and $1.6 million during each of the years ended December 31, 2015, 2014 and 2013.
Loss from Discontinued Operations
Loss from Discontinued Operations includes the financial results, net of taxes, for the Eastern Markets.
RESULTS OF OPERATIONS – COMPARISON OF YEAR ENDED DECEMBER 31, 2015 AND 2014
OPERATING REVENUES
The following table identifies our operating revenues for the years ended December 31, 2015 and 2014:
Year Ended December 31, | ||||||||||||||
(In thousands) | 2015 | 2014 | $ Variance | % Variance | ||||||||||
Retail revenue | $ | 168,674 | $ | 177,295 | $ | (8,621 | ) | (4.9 | )% | |||||
Wholesale and other revenue | 140,121 | 152,783 | (12,662 | ) | (8.3 | )% | ||||||||
Equipment sales | 53,845 | 30,056 | 23,789 | 79.1 | % | |||||||||
Total operating revenues | $ | 362,640 | $ | 360,134 | $ | 2,506 | 0.7 | % | ||||||
Retail Revenue
Retail revenue decreased $8.6 million, or 4.9%, for the year ended December 31, 215 compared to the year ended December 31, 2014. Postpay service revenue decreased $7.8 million as a result of higher adoption rates of lower rate plans as a result of competitive pricing pressures and service plan discounts offered with EIP, partially offset by a higher average subscriber base.
31
Wholesale and Other Revenue
Wholesale and roaming revenues decreased $12.7 million, or 8.3%, for the year ended December 31, 2015 compared to the year ended December 31, 2014, primarily reflecting an $11.7 million decrease in revenue from the SNA. This decrease is primarily the result of the amended terms of the SNA that took effect in May 2014. We expect this year over year trend to continue.
Equipment Sales
Equipment revenues increased $23.8 million, or 79.1%, for the year ended December 31, 2015 compared to the year ended December 31, 2014, reflecting an increase in EIP sales, which began in August 2014.
OPERATING EXPENSES
The following table identifies our total operating expenses for the years ended December 31, 2015 and 2014:
Year Ended December 31, | ||||||||||||||
(In thousands) | 2015 | 2014 | $ Variance | % Variance | ||||||||||
Cost of services | $ | 89,413 | $ | 80,763 | $ | 8,650 | 10.7 | % | ||||||
Costs of equipment sold | 87,753 | 73,044 | 14,709 | 20.1 | % | |||||||||
Customer operations | 68,484 | 74,990 | (6,506 | ) | (8.7 | )% | ||||||||
Corporate operations | 38,951 | 37,388 | 1,563 | 4.2 | % | |||||||||
Restructuring | 2,487 | 982 | 1,505 | 153.3 | % | |||||||||
Depreciation and amortization | 55,102 | 55,225 | (123 | ) | (0.2 | )% | ||||||||
Gain on sale of assets | (11,111 | ) | — | (11,111 | ) | — | % | |||||||
Total operating expenses | $ | 331,079 | $ | 322,392 | $ | 8,687 | 2.7 | % | ||||||
Cost of Services – Cost of services increased $8.7 million, or 10.7%, for the year ended December 31, 2015 compared to the year ended December 31, 2014 due to a $6.0 million increase in cell site expense to support additional capacity for our 4G LTE expansion and a $1.9 million increase in cost of roaming due to increased data usage.
Cost of Equipment Sold – Cost of equipment sold increased $14.7 million, or 20.1%, for the year ended December 31, 2015 compared to the year ended December 31, 2014 primarily due to an increase in equipment costs driven by continued smartphone sales and an increase in subscriber activity.
Customer Operations – Customer operations expense decreased $6.5 million, or 8.7%, for the year ended December 31, 2015 compared to the year ended December 31, 2014 due primarily to cost reductions, offset by increased bad debt expense due to an increase in the volume of our EIP receivables.
Corporate Operations – Corporate operations expense increased $1.6 million, or 4.2%, for the year ended December 31, 2015 compared to the year ended December 31, 2014 driven by costs incurred related to the Merger, offset by a reduction in corporate expenses.
Restructuring – Restructuring expense increased $1.5 million for the year ended December 31, 2015 due primarily to severance charges, contract termination fees and professional fees associated with the reduction of corporate expenses.
Depreciation and Amortization – Depreciation and amortization expenses remained flat compared to the year ended December 31, 2014.
Gain on Sale of Assets - Gain on sale of assets was $11.1 million for the year ended December 31, 2015 due to the sale of tower assets.
OTHER EXPENSE
Interest expense, net was $30.6 million for the year ended December 31, 2015, a decrease of $2.1 million, or 6.4%, compared to $32.7 million for the year ended December 31, 2014. The decrease is due to an increase in capitalized interest of $1.3 million related to network projects and an increase in interest income from EIP receivables, which is imputed at the time of sale and recognized over the financed term.
32
Other income (expense), net increased $1.2 million, to income of $0.1 million for the year ended December 31, 2015 compared to $1.1 million of expense for the year ended December 31, 2014, primarily as a result of a $0.9 million charge in 2014 related to the write off of a proportionate amount of the unamortized deferred issuance costs associated with the January 2014 debt refinancing.
INCOME TAXES
Income tax expense was $2.2 million, with an effective tax rate of 207.9%, for the year ended December 31, 2015, representing the statutory tax rate applied to pre-tax loss and the effects of certain non-deductible compensation, Merger related expenses and recognition of the tax impact of equity-based compensation shortfalls. We expect our recurring non-deductible expenses to relate primarily to certain non-cash share-based compensation. Income taxes for 2014 were $0.7 million with an effective rate of 19.0%.
We have certain Federal prior year unused net operating losses, including certain built-in losses, that are subject to limitations imposed by IRC 382. These prior year NOLs are subject to an adjusted annual maximum limit (the “IRC 382 Limit”) of approximately $8.9 million. Based on the IRC 382 Limit, we expect that $85.4 million of these prior year NOLs will be available for use as follows: $8.9 million per year in 2016 through 2024, $4.9 million in 2025 and $0.4 million in 2026. We also have certain state NOLs that will be available to us substantially similar in timing to the Federal NOLs. We believe that it is more likely than not that our results of future operations will generate sufficient taxable income to realize the deferred tax assets.
LOSS FROM DISCONTINUED OPERATIONS, NET OF TAX
Loss from discontinued operations, net of tax, was $9.9 million for the year ended December 31, 2015, compared to $55.3 million for the year ended December 31, 2014. The decrease of $45.4 million or 82.1% is due to the reduction of an impairment charge of $87.9 million recorded in 2014 for certain property, plant, and equipment and intangible assets related to our Eastern Markets, offset by restructuring charges of $26.8 million in 2015 as part of the wind down of our business in the Eastern Markets.
RESULTS OF OPERATIONS – YEAR ENDED DECEMBER 31, 2014 COMPARED TO 2013
OPERATING REVENUES
The following table identifies our operating revenues for the years ended December 31, 2014 and 2013:
Year Ended December 31, | ||||||||||||||
(In thousands) | 2014 | 2013 | $ Variance | % Variance | ||||||||||
Retail revenue | $ | 177,295 | $ | 172,427 | $ | 4,868 | 2.8 | % | ||||||
Wholesale and other revenue | 152,783 | 172,491 | (19,708 | ) | (11.4 | )% | ||||||||
Equipment sales | 30,056 | 14,848 | 15,208 | 102.4 | % | |||||||||
Total operating revenues | $ | 360,134 | $ | 359,766 | $ | 368 | 0.1 | % | ||||||
Retail Revenue
Retail revenue increased $4.9 million, or 2.8%, for the year ended December 31, 2014 compared to the year ended December 31, 2013 driven by an increase in the average subscriber base, offset by lower rate plans and service plan discounts related to EIP.
Wholesale and Other Revenue - Wholesale and roaming revenues from the SNA decreased $19.7 million, or 11.4%, for the year ended December 31, 2014 compared to the year ended December 31, 2013, primarily reflecting a $18.9 million decrease in revenue from the SNA. Excluding the $9.0 million dispute settlement in 2013, revenue under the SNA decreased $9.9 million, or 5.7%, for the year ended December 31, 2014 compared to the year ended December 31, 2013. This decrease is primarily the result of the amended terms of the SNA that took effect in May 2014.
Equipment Sales
Equipment revenues increased $15.2 million, or 102.4%, for the year ended December 31, 2014 compared to the year ended December 31, 2013, reflecting an increase in EIP sales, which began in August 2014, and an increase in subscriber activity.
33
OPERATING EXPENSES
The following table identifies our total operating expenses for the years ended December 31, 2014 and 2013:
Year Ended December 31, | ||||||||||||||
(In thousands) | 2014 | 2013 | $ Variance | % Variance | ||||||||||
Cost of services | $ | 80,763 | $ | 74,017 | $ | 6,746 | 9.1 | % | ||||||
Costs of equipment sold | 73,044 | 58,481 | 14,563 | 24.9 | % | |||||||||
Customer operations | 74,990 | 71,130 | 3,860 | 5.4 | % | |||||||||
Corporate operations | 37,388 | 36,198 | 1,190 | 3.3 | % | |||||||||
Restructuring | 982 | — | 982 | — | % | |||||||||
Depreciation and amortization | 55,225 | 54,031 | 1,194 | 2.2 | % | |||||||||
Gain on sale of assets | — | (4,442 | ) | 4,442 | — | % | ||||||||
Total operating expenses | $ | 322,392 | $ | 289,415 | $ | 32,977 | 11.4 | % | ||||||
Cost of Services – Cost of services increased $6.7 million, or 9.1%, for the year ended December 31, 2014 compared to the year ended December 31, 2013 due to increases in cell site expense and data roaming expense, as a result of on-going costs to support subscriber and usage growth, and $3.3 million in non-cash spectrum lease expenses related to the amended SNA agreement.
Cost of Equipment Sold – Cost of equipment sold increased $14.6 million, or 24.9%, for the year ended December 31, 2014 compared to the year ended December 31, 2013 due to an increase in equipment costs driven by continued smartphone sales and an increase in subscriber activity.
Customer Operations – Customer operations expense increased $3.9 million, or 5.4%, for the year ended December 31, 2014 compared to the year ended December 31, 2013 due to increases in sales and marketing expenses, salary expense related to supporting a larger customer base and bad debt expense due to an increase in the average balances per account written off for the year ended December 31, 2014 compared to the year ended December 31, 2013.
Corporate Operations – Corporate operations expense increased $1.2 million, or 3.3%, for the year ended December 31, 2014 compared to the year ended December 31, 2013 driven by legal and advisory services related to the debt refinancing and the SNA contract amendment, offset by lower salary and equity compensation charges related to executive separations.
Restructuring - Restructuring expense was $1.0 million for the year ended December 31, 2014 due primarily to severance charges, contract termination fees and professional fees associated with the reduction of corporate expenses.
Depreciation and Amortization – Depreciation and amortization expenses increased $1.2 million, or 2.2%, for the year ended December 31, 2014 compared to the year ended December 31, 2013 primarily due to an increase in depreciable assets placed in service as part of the continued 4G LTE expansion.
Gain on Sale of Assets - Gain on sale of assets consists of a $4.4 million gain for the year ended December 31, 2013 due to the sale of certain intangible assets.
OTHER EXPENSE
Interest expense, net was $32.7 million for the year ended December 31, 2014, an increase of $3.0 million, or 10.1%, compared to $29.7 million for the year ended December 31, 2013. The increase is due to the increased loan amount and a higher blended average effective interest rate associated with the refinanced Amended and Restated Credit Agreement in January 2014.
INCOME TAXES
Income tax expense was $0.7 million, with an effective tax rate of 19.0%, for the year ended December 31, 2014, representing the statutory tax rate applied to pre-tax income and the effects of certain non-deductible compensation and state minimum taxes. We expect our recurring non-deductible expenses to relate primarily to certain non-cash share-based compensation and other non-deductible compensation. Income taxes for 2013 were $16.1 million with an effective rate of 40.5%.
34
INCOME (LOSS) FROM DISCONTINUED OPERATIONS, NET OF TAX
Loss from discontinued operations, net of tax, was $55.3 million for the year ended December 31, 2014. as compared to $3.1 million of income for the year ended December 31, 2013. The increase of $58.4 million was primarily the result of the recognition of an impairment charge recorded in 2014 for certain property, plant and equipment and intangible assets related to our Eastern Markets and charges incurred to wind down the operations.
LIQUIDITY AND CAPITAL RESOURCES
Overview
We historically have funded our working capital requirements, capital expenditures and other payments from cash on hand and net cash provided from operating activities.
As of December 31, 2015, we had $72.7 million of cash, compared to $73.5 million as of December 31, 2014, of which $39.7 million was held in market rate savings accounts (including $9.6 million held by the Company which is not restricted for certain payments by the Amended and Restated Credit Agreement). The remaining balance of $33.0 million was held in non-interest bearing accounts. The commercial bank that held substantially all of our cash at December 31, 2015 has a rating A1 on long term deposits by Moody’s. Our working capital (current assets minus current liabilities) was $106.7 million as of December 31, 2015 compared to $83.8 million as of December 31, 2014.
As of December 31, 2015, we had $612.0 million in aggregate long-term liabilities, consisting of $514.6 million in long-term debt, including capital lease obligations, and approximately $96.6 million in other long-term liabilities primarily consisting of retirement benefits, deferred income taxes and asset retirement obligations from continuing operations and $0.8 million of other long-term liabilities from discontinued operations . Further information regarding long-term debt obligations at December 31, 2015 is provided in Note 9 of the Notes to Consolidated Financial Statements included in this Annual Report on Form 10-K.
We have a Restricted Payments basket under the terms of the Amended and Restated Credit Agreement, which can be used to make Restricted Payments, including dividends and stock repurchases. The Restricted Payments basket increases $6.5 million per quarter, plus an additional quarterly amount for Excess Cash Flow, if any (as defined in the Amended and Restated Credit Agreement) and is decreased by any actual Restricted Payments and by certain investments and debt prepayments made after the date of the Amended and Restated Credit Agreement. For the year ended December 31, 2015 there was no Excess Cash Flow. The balance of the Restricted Payments basket as of December 31, 2015 was $86.1 million.
The Amended and Restated Credit Agreement also permits incremental commitments of up to $125.0 million (the “Incremental Commitments”) of which up to $35.0 million can be in the form of a revolving credit facility. The ability to incur the Incremental Commitments is subject to various restrictions and conditions, including having a Leverage Ratio (as defined in the Amended and Restated Credit Agreement) not in excess of 4.50:1.00 at the time of incurrence (calculated on a pro forma basis). As of December 31, 2015, there were no commitments associated with the Incremental Commitments.
We are a holding company that does not operate any business of our own. As a result, we are dependent on cash dividends and distributions and other transfers from our subsidiaries in order to make dividend payments or to make other distributions to our stockholders, including by means of a stock repurchase. Amounts that can be made available to us to pay cash dividends or repurchase stock are restricted by the Amended and Restated Credit Agreement.
Cash Flows from Operations
The following table summarizes our cash flows from operations for the years ended December 31, 2015, 2014 and 2013, respectively:
Year Ended December 31, | |||||||||||
(In thousands) | 2015 | 2014 | 2013 | ||||||||
Net cash provided by operating activities | $ | 4,151 | $ | 89,488 | $ | 126,404 | |||||
Net cash provided by (used in) investing activities | 1,882 | (106,414 | ) | (80,844 | ) | ||||||
Net cash provided by (used in) financing activities | (6,892 | ) | 2,031 | (33,316 | ) | ||||||
35
Operating Activities
Our cash flows from operating activities for the year ended December 31, 2015 of $4.2 million decreased $85.3 million, or 95.4%, compared to the cash flows from operating activities of $89.5 million for the year ended December 31, 2014. Our operating income, exclusive of non-cash items such as depreciation and amortization and gain on sale of assets, decreased compared to the prior year. Net changes in working capital further decreased cash provided by operating activities. The decrease is primarily due to an increase in cash paid to vendors for contract settlements related to the wind down of our Eastern Markets and an increase in accounts receivable resulting from the timing of cash collections for EIP sales as compared to traditional sales.
For the year ended December 31, 2014, net cash provided by operating activities was $89.5 million, a decrease of $36.9 million, or 29.2%, compared to the cash flows from operating activities of $126.4 million for the year ended December 31, 2013. The decrease was due to a decrease in operating income, excluding the effect of the impairment charge, and cash provided by working capital.
Investing Activities
As we continue to upgrade our network, we invested $95.7 million in capital expenditures for the year ended December 31, 2015. This was lower than the $107.0 million of capital expenditures for the year ended December 31, 2014. Included in the capital spending for the year ended December 31, 2015 was $86.0 million of expenditures for additional capacity to support our projected growth, and $9.7 million to maintain our existing networks and other business needs. These capital expenditures were offset by net proceeds of $97.6 million primarily from the sale of our tower assets and our Eastern Markets spectrum which closed during 2015.
Our cash flows used in investing activities for the year ended December 31, 2014 were $106.4 million. Included in the capital spending for the year ended December 31, 2014 was $90.7 million of expenditures for additional capacity to support our projected growth, and $16.3 million to maintain our existing networks and other business needs.
Our cash flows used in investing activities for the year ended December 31, 2013 were $80.8 million. Included in the capital spending for the year ended December 31, 2013 was $63.1 million of expenditures for additional capacity to support our projected growth, and $17.6 million to maintain our existing networks and other business needs. We deposited $2.2 million into a separate restricted account to serve as collateral for a letter of credit. We received $4.6 million in proceeds related to the sale of intangible assets.
Financing Activities
Net cash used in financing activities for the year ended December 31, 2015 was $6.9 million, which primarily represents the following:
• | $5.4 million in repayments on our long-term debt; |
• | $1.5 million used for capital distributions to noncontrolling interests and payments on capital leases. |
Net cash provided by financing activities for the year ended December 31, 2014 was $2.0 million, which primarily represents the following:
• | $39.5 million net proceeds from the January 2014 debt refinancing; |
• | $3.6 million in debt issuance costs; |
• | $5.3 million in repayments on our long-term debt; |
• | $27.2 million used for common stock cash dividends ($1.26 per share in the aggregate) paid on January 10, 2014, April 11, 2014 and July 11, 2014; and |
• | $1.4 million used for capital distributions to noncontrolling interests and payments on capital leases. |
Net cash used in financing activities for the year ended December 31, 2013 aggregated $33.3 million, which primarily represents the following:
• | $5.0 million in repayments on our long-term debt; |
• | $27.1 million used for common stock cash dividends ($1.26 per share in the aggregate) paid on April 12, 2013, July 12, 2013, October 11, 2013; and |
• | $1.6 million used for capital distributions to noncontrolling interests. |
36
We believe that our current cash balances of $72.7 million and our cash flow from operations will be sufficient to satisfy our foreseeable working capital requirements, capital expenditures, interest costs, required debt principal payments prior to maturity, and stock repurchases, if any, through our stock repurchase plan.
CONTRACTUAL OBLIGATIONS AND COMMERCIAL COMMITMENTS
We have various contractual obligations that are recorded as liabilities in our consolidated financial statements. Other items, such as certain purchase commitments and other executory contracts, which may affect our financial condition, are not recognized as liabilities in our consolidated financial statements, but are required to be disclosed in the footnotes to the financial statements. For example, we are contractually committed to acquire handset equipment and make certain minimum lease payments for the use of property under operating lease agreements.
The following table summarizes our significant contractual obligations and commercial commitments on an undiscounted basis as of December 31, 2015 and the future periods in which such obligations are expected to be settled in cash. In addition, the table reflects the timing of principal payments on outstanding borrowings.
Additional details regarding these obligations are provided in the Notes to Consolidated Financial Statements contained in Part II, Item 8. of this Annual Report on Form 10-K, as referenced in the table:
Payments Due by Period | |||||||||||||||||||
(In thousands) | Total (2) | Less than one year | Two to three years | Four to five years | After five years | ||||||||||||||
Long-term debt obligations (1)(3) | $ | 522,940 | $ | 5,405 | $ | 10,810 | $ | 506,725 | $ | — | |||||||||
Capital lease obligations (3) | 419 | 200 | 219 | — | — | ||||||||||||||
Interest expense (4) | 119,769 | 30,550 | 59,798 | 29,421 | |||||||||||||||
Operating lease obligations (5) | 117,295 | 15,250 | 27,222 | 23,303 | 51,520 | ||||||||||||||
Purchase obligations (6) | 83,432 | 83,432 | — | — | — | ||||||||||||||
$ | 843,855 | $ | 134,837 | $ | 98,049 | $ | 559,449 | $ | 51,520 | ||||||||||
(1) | Represents the Term Loans under the Amended and Restated Credit Agreement. See Note 9 of the Notes to Consolidated Financial Statements included in this Annual Report on Form 10-K for further information. |
(2) | Excludes certain benefit obligation projected payments under our qualified and non-qualified pension and other postretirement benefit plans. See Note 15 of the Notes to Consolidated Financial Statements included in this Annual Report on Form 10-K for further information. |
(3) | Excludes interest. |
(4) | Interest expense related to the long-term debt and capital lease obligations. |
(5) | Represents contractual obligations to make certain minimum lease payments for the use of property under operating lease agreements for administrative office space, retail space, tower space and equipment, certain of which have renewal options. See Note 17 of the Notes to Consolidated Financial Statements included in this Annual Report on Form 10-K for further information. |
(6) | Represents purchase commitments relating to network capital expenditures, handsets and other equipment to support operations. |
OFF BALANCE SHEET ARRANGEMENTS
We do not have any off balance sheet arrangements or financing activities with special purpose entities.
CRITICAL ACCOUNTING POLICIES AND ESTIMATES
The preparation of financial statements in conformity with GAAP requires that management apply accounting policies and make estimates and assumptions about future events and apply judgments that affect results of operations and the amounts of assets and liabilities reported in the financial statements and the related disclosures. We base our estimates, assumptions and judgment on historical experience, current and projected business trends, general economic conditions and other factors that management believes to be relevant at the time our consolidated financial statements are prepared. However, because future events and their effects cannot be determined with certainty, actual results could differ from our estimates and assumptions, and such differences could be material to reported results of operations and financial position.
We believe that the areas described below are the most critical to aid in fully understanding and evaluating our reported financial results, as they require management’s most significant judgments in the application of accounting policy or in making
37
estimates and assumptions that are inherently uncertain and that may change in subsequent periods. Additional discussion of the application of these accounting policies can be found in the Notes to Consolidated Financial Statements. Management has reviewed these critical accounting policies, estimates and assumptions and related disclosures with the Audit Committee of our Board.
Revenue Recognition
The Company recognizes revenue when services are rendered or when products are delivered and functional, as applicable. Certain services of the Company are billed in advance for service performance. In such cases, the Company records a service liability at the time of billing and subsequently recognizes revenue ratably over the service period. The Company bills customers certain transactional taxes on service revenues. These transactional taxes are not included in reported revenues as they are recognized as liabilities at the time customers are billed.
The Company earns retail and wholesale revenues by providing access to and usage of its networks. Retail and certain wholesale revenues are recognized as services are provided. In long term contracts certain fixed elements are required to be recognized on a straight-line basis over the term of the agreement. Revenues for equipment sales are recognized at the point of sale. PCS handset equipment sold with service contracts are generally sold at prices below cost, based on the terms of the service contracts. The Company recognizes the entire cost of the handsets at the time of sale.
On August 15, 2014, the Company launched EIP, which offers customers the option to pay for their devices over 24 months with no service contract. Additionally, after a specified period of time, customers have the right to trade in the original device for a new device and have the remaining unpaid balance satisfied. For customers that elect the EIP option, the Company recognizes revenue at the point of sale for the full retail price of the device, net of the estimated fair value of imputed interest and the estimated loss on trade-in.
The Company evaluates related transactions to determine whether they should be viewed as multiple deliverable arrangements, which impact revenue recognition. Multiple deliverable arrangements are presumed to be bundled transactions and the total consideration is measured and allocated to the separate units based on their relative selling price with certain limitations. The Company has determined that sales of handsets with service contracts related to these sales generated from Company-operated retail stores are multiple deliverable arrangements. Accordingly, substantially all of the nonrefundable activation fee revenues (as well as the associated direct costs) are allocated to the wireless handset and are recognized at the time of the sale based on the fact that the handsets are generally sold below cost and thus appropriately allocated to the point of sale based on the relative selling price evaluation. However, revenue and certain associated direct costs for activations sold at third-party retail locations are deferred and amortized over the estimated life of the customer relationship as the Company is not a principal in the transaction to sell the handset and therefore any activation fees charged are fully attributable to the service revenues.
The Company recognizes revenue in the period that persuasive evidence of an arrangement exists, delivery of the product has occurred or services have been rendered, it is able to determine the amount and when the collection of such amount is considered probable.
Allowance for Doubtful Accounts
The Company maintains an allowance for doubtful accounts for which we evaluate and estimate the collectability, based on a combination of factors including the length of time the receivables are past due, historical results, current and expected trends and changes in credit policies. Management believes the allowance adequately covers all anticipated losses with respect to trade receivables. Actual credit losses could differ from such estimates, which may result in higher costs and expenses in future periods if our estimate of uncollectible accounts is too low, or decreased costs and expenses in future periods if it is too high.
Inventories and Supplies
The Company’s inventories and supplies consist primarily of items held for resale such as PCS devices and accessories. The Company values its inventory at the lower of cost or market. Inventory cost is computed on a currently adjusted standard cost basis (which approximates actual cost on a first-in, first-out basis). Market value is determined by reviewing current replacement cost, marketability and obsolescence.
Long-Lived Asset Recovery
Long-lived assets comprise property, plant and equipment, intangible assets (including goodwill, radio spectrum licenses, customer relationships and trademarks) and long-term deferred charges. Long-lived assets, excluding goodwill and intangible assets with indefinite useful lives, are recorded at cost and reviewed for impairment whenever events or changes in circumstances indicate that the carrying amount should be evaluated pursuant to the subsequent measurement guidance
38
described in FASB ASC 360, Property, Plant and Equipment. Impairment is determined by comparing the carrying value of these long-lived assets to management’s best estimate of future undiscounted cash flows expected to result from the use of the assets. If the carrying value exceeds the estimated undiscounted cash flows, the excess of the asset’s carrying value over the estimated fair value is recorded as an impairment charge.
Depreciation of property, plant and equipment is calculated on a straight-line basis over the estimated useful lives of the assets, which the Company reviews and updates based on historical experiences and future expectations. Buildings are depreciated over a 50-year life and leasehold improvements, which are categorized in land and buildings, are depreciated over the shorter of the estimated useful lives or the remaining lease terms. Network plant and equipment, which includes cell towers and site costs, and switch, cell site and other network equipment, are depreciated over various lives ranging from 5 to 17 years, with a weighted average life of approximately 10 years. Furniture, fixtures and other equipment are depreciated over various lives ranging from 2 to 18 years.
The Company evaluates the appropriateness of estimated useful lives on at least an annual basis. Consideration is given to the trends in technological evolution and the telecommunications industry, the Company’s maintenance practices and the functional condition of long-lived assets in relation to the remaining estimated useful life of the asset. When necessary, adjustments are made to the applicable useful life of an asset class or depreciation is accelerated for assets that have been identified for retirement prior to the expiration of the original useful life.
Goodwill and Indefinite-Lived Intangibles
Goodwill and radio spectrum licenses are considered indefinite-lived intangible assets. Indefinite-lived intangible assets are not subject to amortization but are instead tested for impairment annually, on October 1, or more frequently if an event indicates that the asset might be impaired.
Before employing detailed impairment testing, the Company first evaluates the likelihood of impairment by considering relevant qualitative factors that may have a significant bearing on fair value. If we determine that it is more likely than not that goodwill is impaired, we apply detailed testing methodologies. Otherwise, we conclude that no impairment exists. For detailed testing, the Company uses a two-step process to test for goodwill impairment. Step one requires a determination of the fair value of each of the reporting units and, to the extent that this fair value of the reporting unit exceeds its carrying value (including goodwill), the step two calculation of implied fair value of goodwill is not required and no impairment loss is recognized. In testing for goodwill impairment, the Company utilizes a combination of a discounted cash flow model and an analysis which allocates enterprise value to the reporting units.
The radio spectrum licenses relate primarily to PCS licenses in the markets that we serve. The Company considers a number of valuation methods, including market based and the Greenfield cash flow method, in its impairment testing for these assets.
Income Taxes
Deferred income taxes are provided on an asset and liability method whereby deferred tax assets are recognized for deductible temporary differences and deferred tax liabilities are recognized for taxable temporary differences. Temporary differences are the differences between the reported amounts of assets and liabilities and their tax bases. Deferred tax assets and liabilities are adjusted for the effects of changes in tax laws and rates on the date of enactment. The Company accrues interest and penalties related to unrecognized tax benefits in interest expense and income tax expense, respectively. Further information regarding income taxes, including a detailed rate reconciliation, is provided in Note 14 of the Notes to Consolidated Financial Statements included in this Annual Report on Form 10-K.
Pension Benefits and Retirement Benefits Other Than Pensions
NTELOS Inc. sponsors a non-contributory defined benefit pension plan (“Pension Plan”) covering all employees who meet eligibility requirements and were employed by NTELOS Inc. prior to October 1, 2003. The Pension Plan was closed to NTELOS Inc. employees hired on or after October 1, 2003. Pension benefits vest after five years of plan service and are based on years of service and an average of the five highest consecutive years of compensation subject to certain reductions if the employee retires before reaching age 65 and elects to receive the benefit prior to age 65. Effective December 31, 2012, the Company froze future benefit accruals. In 2014, we adopted updated mortality tables published by the Society of Actuaries that predict increasing life expectancies in the United States.
IRC Sections 412 and 430 and Sections 302 and 303 of the Employee Retirement Income Security Act of 1974, as amended establish minimum funding requirements for defined benefit pension plans. The minimum required contribution is generally equal to the target normal cost plus the shortfall amortization installments for the current plan year and each of the six preceding plan years less any calculated credit balance. If plan assets (less calculated credits) are equal to or exceed the funding
39
target, the minimum required contribution is the target normal cost reduced by the excess funding, but not below zero. The Company’s policy is to make contributions to stay at or above the threshold required in order to prevent benefit restrictions and related additional notice requirements and is intended to provide not only for benefits based on service to date, but also for those expected to be earned in the future. Also, NTELOS Inc. has nonqualified pension plans that are accounted for similar to its Pension Plan.
NTELOS Inc. provides certain health care and life benefits for retired employees that meet eligibility requirements. The Company has two qualified nonpension postretirement benefit plans. The health care plan is contributory, with participants’ contributions adjusted annually. The life insurance plan also is contributory. These obligations, along with all of the pension plans and other postretirement benefit plans, are NTELOS Inc. obligations assumed by the Company. Eligibility for the life insurance plan is restricted to active pension participants age 50-64 as of January 5, 1994. Neither plan is eligible to employees hired after April 1993. The accounting for the plans anticipates that the Company will maintain a consistent level of cost sharing for the benefits with the retirees. The Company’s share of the projected costs of benefits that will be paid after retirement is generally being accrued by charges to expense over the eligible employees’ service periods to the dates they are fully eligible for benefits.
NTELOS Inc. also sponsors a contributory defined contribution plan under IRC Section 401(k) for substantially all employees. The Company’s policy is to match 100% of each participant’s annual contributions for contributions up to 1% of each participant’s annual compensation and 50% of each participant’s annual contributions up to an additional 5% of each participant’s annual compensation. Company contributions vest after two years of service. Effective June 1, 2009, the Company began funding its 401(k) matching contributions in shares of the Company’s common stock. Further information regarding these plans is provided in Note 15 of the Notes to Consolidated Financial Statements included in this Annual Report on Form 10-K.
RECENT ACCOUNTING PRONOUNCEMENTS
Information regarding recent accounting pronouncements is provided in Note 2 of the Notes to Consolidated Financial Statements.
Item 7A. | Quantitative and Qualitative Disclosures About Market Risk. |
In addition to the risks inherent in our operations, we are exposed to certain market risks including the impact of interest rate changes.
Aggregate maturities of long-term debt outstanding under the Amended and Restated Credit Agreement, based on the contractual terms of the instruments, were $522.9 million as of December 31, 2015. Under this facility, the Term Loan bears interest at a rate equal to either 4.75% above the Eurodollar Rate (as defined in the Amended and Restated Credit Agreement) or 3.75% above the Base Rate (as defined in the Amended and Restated Credit Agreement). The Amended and Restated Credit Agreement provides that the Eurodollar Rate shall never be less than 1.00% per annum and the Base Rate shall never be less than 2.00% per annum. We also have other fixed rate, long-term debt in the form of capital leases totaling $0.4 million as of December 31, 2015.
At December 31, 2015, our financial assets included cash of $72.7 million. Securities and investments totaled $1.5 million at December 31, 2015.
The following sensitivity analysis estimates the impact on the fair value of certain financial instruments, which are potentially subject to material market risks, at December 31, 2015, assuming a ten percent increase and a ten percent decrease in the levels of our interest rates:
(In thousands) | Book Value | Fair Value | Estimated fair value assuming noted decrease in market pricing | Estimated fair value assuming noted increase in market pricing | |||||||||||
Secured term loans | $ | 519,820 | $ | 517,710 | $ | 528,721 | $ | 506,964 | |||||||
Capital lease obligations | 521 | 521 | 573 | 468 | |||||||||||
Our Amended and Restated Credit Agreement accrues interest based on the Eurodollar Rate plus an applicable margin (currently 475 bps). LIBOR for purposes of this facility floats when it exceeds the floor of 1.00%. At December 31, 2015, an
40
immediate 10% increase or decrease to LIBOR would not have an effect on our interest expense as the variable LIBOR component would remain below the floor. In addition, at December 31, 2015 we had approximately $39.7 million of cash held in a market rate savings accounts. An immediate 10% increase or decrease to the market interest rate would not have a material effect on our cash flows.
41
Item 8. | Financial Statements and Supplementary Data. |
NTELOS HOLDINGS CORP.
INDEX TO AUDITED CONSOLIDATED FINANCIAL STATEMENTS
42
Report of Independent Registered Public Accounting Firm
The Board of Directors and Stockholders
NTELOS Holdings Corp.:
We have audited the accompanying consolidated balance sheets of NTELOS Holdings Corp. (the Company) as of December 31, 2015 and 2014, and the related consolidated statements of operations, comprehensive income (loss), cash flows, and changes in stockholders’ equity (deficit) for each of the years in the three‑year period ended December 31, 2015. These consolidated financial statements are the responsibility of the Company’s management. Our responsibility is to express an opinion on these consolidated financial statements based on our audits.
We conducted our audits in accordance with the standards of the Public Company Accounting Oversight Board (United States). Those standards require that we plan and perform the audit to obtain reasonable assurance about whether the financial statements are free of material misstatement. An audit includes examining, on a test basis, evidence supporting the amounts and disclosures in the financial statements. An audit also includes assessing the accounting principles used and significant estimates made by management, as well as evaluating the overall financial statement presentation. We believe that our audits provide a reasonable basis for our opinion.
In our opinion, the consolidated financial statements referred to above present fairly, in all material respects, the financial position of NTELOS Holdings Corp. as of December 31, 2015 and 2014, and the results of their operations and their cash flows for each of the years in the three‑year period ended December 31, 2015, in conformity with U.S. generally accepted accounting principles.
As discussed in Note 2 to the financial statements, the Company has changed its method of classification of deferred tax assets and liabilities in the Company’s balance sheet, reclassifying all deferred tax assets and liabilities as noncurrent due to the adoption of Accounting Standards Update No. 2015-17, Balance Sheet Classification of Deferred Taxes. The Company elected to apply this change retrospectively, therefore, all prior period amounts presented have been adjusted to be comparative to the current period presentation.
We also have audited, in accordance with the standards of the Public Company Accounting Oversight Board (United States), the Company’s internal control over financial reporting as of December 31, 2015, based on criteria established in Internal Control - Integrated Framework (2013) issued by the Committee of Sponsoring Organizations of the Treadway Commission (COSO), and our report dated March 11, 2016 expressed an unqualified opinion on the effectiveness of the Company’s internal control over financial reporting.
/s/ KPMG LLP | ||
Richmond, Virginia | ||
March 11, 2016 | ||
43
NTELOS Holdings Corp.
Consolidated Balance Sheets
(In thousands, except par value per share amounts) | December 31, 2015 | December 31, 2014 | |||||
ASSETS | |||||||
Current Assets | |||||||
Cash | $ | 72,687 | $ | 73,546 | |||
Restricted Cash | — | 2,167 | |||||
Accounts receivable, net | 53,021 | 35,177 | |||||
Inventories and supplies, net | 13,345 | 17,978 | |||||
Prepaid expenses | 9,350 | 8,295 | |||||
Tax refund receivable | 24,986 | 3,883 | |||||
Other current assets | 1,132 | 617 | |||||
Other current assets from discontinued operations | 2,121 | 14,763 | |||||
176,642 | 156,426 | ||||||
Assets Held for Sale | 62 | 4,317 | |||||
Restricted Cash | 2,167 | — | |||||
Securities and Investments | 1,522 | 1,522 | |||||
Property, Plant and Equipment, net | 326,260 | 266,054 | |||||
Intangible Assets | |||||||
Goodwill | 63,700 | 63,700 | |||||
Radio spectrum licenses | 44,933 | 44,933 | |||||
Customer relationships and trademarks, net | 4,292 | 5,084 | |||||
Deferred Charges and Other Assets | 18,941 | 16,919 | |||||
Deferred Income Taxes | 2,737 | 3,360 | |||||
Other Noncurrent Assets from Discontinued Operations | 1,733 | 85,402 | |||||
TOTAL ASSETS | $ | 642,989 | $ | 647,717 | |||
LIABILITIES AND STOCKHOLDERS' EQUITY (DEFICIT) | |||||||
Current Liabilities | |||||||
Current portion of long-term debt | $ | 5,605 | $ | 5,728 | |||
Accounts payable | 20,532 | 24,130 | |||||
Advance billings and customer deposits | 12,772 | 10,284 | |||||
Accrued expenses and other current liabilities | 18,003 | 20,255 | |||||
Other current liabilities from discontinued operations | 13,054 | 12,245 | |||||
69,966 | 72,642 | ||||||
Long-Term Debt | 514,634 | 519,491 | |||||
Retirement Benefits | 22,448 | 25,209 | |||||
Deferred Income Taxes | 12,272 | 1,685 | |||||
Other Long-Term Liabilities | 61,860 | 33,913 | |||||
Other Noncurrent Liabilities from Discontinued Operations | 835 | 27,729 | |||||
TOTAL LIABILITIES | 682,015 | 680,669 | |||||
Commitments and Contingencies | |||||||
Equity (Deficit) | |||||||
Preferred stock, par value $.01 per share, authorized 100 shares, none issued | — | — | |||||
Common stock, par value $.01 per share, authorized 55,000 shares; 22,290 shares issued and 22,264 shares outstanding (21,634 shares issued and 21,616 shares outstanding at December 31, 2014) | 214 | 214 | |||||
Additional paid in capital | 32,500 | 28,663 | |||||
Treasury stock, at cost, 27 shares (18 shares at December 31, 2014) | (330 | ) | (285 | ) | |||
Accumulated deficit | (65,840 | ) | (53,634 | ) | |||
Accumulated other comprehensive loss | (7,142 | ) | (9,090 | ) | |||
Total NTELOS Holdings Corp. Stockholders’ Equity (Deficit) | (40,598 | ) | (34,132 | ) | |||
Noncontrolling Interests | 1,572 | 1,180 | |||||
(39,026 | ) | (32,952 | ) | ||||
TOTAL LIABILITIES AND STOCKHOLDERS' EQUITY (DEFICIT) | $ | 642,989 | $ | 647,717 | |||
See accompanying Notes to Consolidated Financial Statements.
44
NTELOS Holdings Corp.
Consolidated Statements of Operations
Year Ended December 31, | |||||||||||
(In thousands, except per share amounts) | 2015 | 2014 | 2013 | ||||||||
Operating Revenues | |||||||||||
Retail revenue | $ | 168,674 | $ | 177,295 | $ | 172,427 | |||||
Wholesale and other revenue | 140,121 | 152,783 | 172,491 | ||||||||
Equipment sales | 53,845 | 30,056 | 14,848 | ||||||||
Operating Revenues | 362,640 | 360,134 | 359,766 | ||||||||
Operating Expenses | |||||||||||
Cost of services | 89,413 | 80,763 | 74,017 | ||||||||
Cost of equipment sold | 87,753 | 73,044 | 58,481 | ||||||||
Customer operations | 68,484 | 74,990 | 71,130 | ||||||||
Corporate operations | 38,951 | 37,388 | 36,198 | ||||||||
Restructuring | 2,487 | 982 | — | ||||||||
Depreciation and amortization | 55,102 | 55,225 | 54,031 | ||||||||
Gain on sale of assets | (11,111 | ) | — | (4,442 | ) | ||||||
331,079 | 322,392 | 289,415 | |||||||||
Operating Income | 31,561 | 37,742 | 70,351 | ||||||||
Other Expense | |||||||||||
Interest expense, net | (30,589 | ) | (32,697 | ) | (29,726 | ) | |||||
Other income (expense) | 80 | (1,115 | ) | (810 | ) | ||||||
(30,509 | ) | (33,812 | ) | (30,536 | ) | ||||||
Income before Income Taxes | 1,052 | 3,930 | 39,815 | ||||||||
Income Tax Expense | 2,187 | 747 | 16,127 | ||||||||
Income (Loss) from Continuing Operations | (1,135 | ) | 3,183 | 23,688 | |||||||
Income (Loss) from Discontinued Operations, Net of Tax | (9,903 | ) | (55,349 | ) | 3,051 | ||||||
Net Income (Loss) | (11,038 | ) | (52,166 | ) | 26,739 | ||||||
Net Income Attributable to Noncontrolling Interests | (1,168 | ) | (1,468 | ) | (2,061 | ) | |||||
Net Income (Loss) Attributable to NTELOS Holdings Corp. | $ | (12,206 | ) | $ | (53,634 | ) | $ | 24,678 | |||
Earnings (Loss) per Share Attributable to NTELOS Holdings Corp. | |||||||||||
Basic earnings (loss) per common share from continuing operations | $ | (0.10 | ) | $ | 0.08 | $ | 1.02 | ||||
Basic earnings (loss) per common share from discontinued operations | (0.47 | ) | (2.62 | ) | 0.15 | ||||||
Basic earnings (loss) per common share | $ | (0.57 | ) | $ | (2.54 | ) | $ | 1.17 | |||
Weighted average shares outstanding – basic | 21,257 | 21,111 | 21,026 | ||||||||
Diluted earnings (loss) per common share from continuing operations | $ | (0.10 | ) | $ | 0.08 | $ | 0.99 | ||||
Diluted earnings (loss) per common share from discontinued operations | (0.47 | ) | (2.62 | ) | 0.14 | ||||||
Diluted earnings (loss) per common share | $ | (0.57 | ) | $ | (2.54 | ) | $ | 1.13 | |||
Weighted average shares outstanding – diluted | 21,257 | 21,111 | 21,826 | ||||||||
Cash Dividends Declared per Share – Common Stock | $ | — | $ | 0.84 | $ | 1.68 | |||||
See accompanying Notes to Consolidated Financial Statements.
45
NTELOS Holdings Corp.
Consolidated Statements of Comprehensive Income (Loss)
Year Ended December 31, | |||||||||||
(In thousands) | 2015 | 2014 | 2013 | ||||||||
Net Income (Loss) Attributable to NTELOS Holdings Corp. | $ | (12,206 | ) | $ | (53,634 | ) | $ | 24,678 | |||
Other Comprehensive Income (Loss): | |||||||||||
Amortization of unrealized loss from defined benefit plans, net of $299, $45 and $167 of deferred income taxes in 2015, 2014 and 2013, respectively | 470 | 71 | 263 | ||||||||
Unrecognized gain/(loss) from defined benefit plans, net of $941 $5,039, and $3,299 of deferred income taxes in 2015, 2014 and 2013, respectively | 1,478 | (7,915 | ) | 5,180 | |||||||
Comprehensive Income (Loss) Attributable to NTELOS Holdings Corp. | (10,258 | ) | (61,478 | ) | 30,121 | ||||||
Comprehensive Income Attributable to Noncontrolling Interests | 1,168 | 1,468 | 2,061 | ||||||||
Comprehensive Income (Loss) | $ | (9,090 | ) | $ | (60,010 | ) | $ | 32,182 | |||
See accompanying Notes to Consolidated Financial Statements.
46
NTELOS Holdings Corp.
Consolidated Statements of Cash Flows
Year Ended December 31, | |||||||||||
(In thousands) | 2015 | 2014 | 2013 | ||||||||
Cash flows from operating activities | |||||||||||
Net income (loss) | $ | (11,038 | ) | $ | (52,166 | ) | $ | 26,739 | |||
Adjustments to reconcile net income (loss) to net cash provided by operating activities | |||||||||||
Depreciation and amortization | 60,103 | 76,459 | 72,944 | ||||||||
Impairment and other charges | 117 | 87,853 | — | ||||||||
Gain on the sale of assets | (16,749 | ) | — | (4,442 | ) | ||||||
Bad debt expense | 20,070 | 15,171 | 15,511 | ||||||||
Deferred income taxes | (5,797 | ) | (33,359 | ) | 16,968 | ||||||
Equity-based compensation | 3,448 | 2,969 | 5,553 | ||||||||
Amortization of loan origination costs and debt discount | 1,683 | 2,477 | 2,814 | ||||||||
Write off unamortized debt issuance costs | 720 | 895 | — | ||||||||
Loss on interest swap derivatives | — | 229 | 656 | ||||||||
Retirement benefits and other | 6,760 | 848 | 1,690 | ||||||||
Changes in operating assets and liabilities | |||||||||||
Accounts receivable | (29,945 | ) | (21,098 | ) | (1,950 | ) | |||||
Inventories and supplies | 4,952 | 5,665 | (14,381 | ) | |||||||
Other current assets | 2,523 | (7,097 | ) | (1,577 | ) | ||||||
Tax refund receivable | (21,103 | ) | (1,272 | ) | — | ||||||
Accounts payable | 2,179 | (444 | ) | 10,232 | |||||||
Other current liabilities | (9,751 | ) | 10,359 | (4,147 | ) | ||||||
Retirement benefit contributions and distributions | (4,021 | ) | 1,999 | (206 | ) | ||||||
Net cash provided by operating activities | 4,151 | 89,488 | 126,404 | ||||||||
Cash flows from investing activities | |||||||||||
Purchases of property, plant and equipment | (95,710 | ) | (107,000 | ) | (80,708 | ) | |||||
Proceeds from the sale of assets | 97,592 | — | 4,644 | ||||||||
Restricted cash pledged for letter of credit | — | — | (2,167 | ) | |||||||
Other, net | — | 586 | (2,613 | ) | |||||||
Net cash provided by (used in) investing activities | 1,882 | (106,414 | ) | (80,844 | ) | ||||||
Cash flows from financing activities | |||||||||||
Proceeds from issuance of long-term debt, net of original issue discount | — | 187,655 | — | ||||||||
Debt issuance and refinancing costs | — | (3,551 | ) | — | |||||||
Repayments on senior secured term loans | (5,405 | ) | (153,477 | ) | (5,000 | ) | |||||
Cash dividends paid on common stock | — | (27,235 | ) | (27,054 | ) | ||||||
Capital distributions to noncontrolling interests | (776 | ) | (798 | ) | (1,561 | ) | |||||
Other, net | (711 | ) | (563 | ) | 299 | ||||||
Net cash provided by (used in) financing activities | (6,892 | ) | 2,031 | (33,316 | ) | ||||||
Increase (decrease) in cash | (859 | ) | (14,895 | ) | 12,244 | ||||||
Cash, beginning of period | 73,546 | 88,441 | 76,197 | ||||||||
Cash, end of period | $ | 72,687 | $ | 73,546 | $ | 88,441 | |||||
See accompanying Notes to Consolidated Financial Statements.
47
NTELOS Holdings Corp.
Consolidated Statements of Changes in Stockholders’ Equity (Deficit)
(In thousands) | Common Shares | Treasury Shares | Common Stock | Additional Paid In Capital | Treasury Stock | Accumulated Deficit | Accumulated Other Comprehensive Loss | Total NTELOS Holdings Corp. Stockholders’ Equity | Noncontrolling Interests | Total Equity | |||||||||||||||||||||||||||
Balance, December 31, 2012 | 21,262 | 1 | $ | 212 | $ | 51,005 | $ | (3 | ) | $ | — | $ | (6,689 | ) | $ | 44,525 | $ | 10 | $ | 44,535 | |||||||||||||||||
Equity-based compensation * | 257 | 8 | 2 | 5,054 | (144 | ) | 4,912 | 4,912 | |||||||||||||||||||||||||||||
Cash dividends declared | (11,597 | ) | (24,678 | ) | (36,275 | ) | (36,275 | ) | |||||||||||||||||||||||||||||
Capital distribution to noncontrolling interests | (1,561 | ) | (1,561 | ) | |||||||||||||||||||||||||||||||||
Net income attributable to NTELOS Holdings Corp. | 24,678 | 24,678 | 24,678 | ||||||||||||||||||||||||||||||||||
Amortization of unrealized loss from defined benefit plans, net of $3,299 of deferred income taxes | 5,180 | 5,180 | 5,180 | ||||||||||||||||||||||||||||||||||
Recognized loss from defined benefit plans, net of $167 of deferred income taxes | 263 | 263 | 263 | ||||||||||||||||||||||||||||||||||
Comprehensive income attributable to noncontrolling interests | 2,061 | 2,061 | |||||||||||||||||||||||||||||||||||
Balance, December 31, 2013 | 21,519 | 9 | $ | 214 | $ | 44,462 | $ | (147 | ) | $ | — | $ | (1,246 | ) | $ | 43,283 | $ | 510 | $ | 43,793 | |||||||||||||||||
(In thousands) | Common Shares | Treasury Shares | Common Stock | Additional Paid In Capital | Treasury Stock | Accumulated Deficit | Accumulated Other Comprehensive Loss | Total NTELOS Holdings Corp. Stockholders’ Equity | Noncontrolling Interests | Total Equity | |||||||||||||||||||||||||||
Balance, December 31, 2013 | 21,519 | 9 | $ | 214 | $ | 44,462 | $ | (147 | ) | $ | — | $ | (1,246 | ) | $ | 43,283 | $ | 510 | $ | 43,793 | |||||||||||||||||
Equity-based compensation * | 97 | 9 | 2,417 | (138 | ) | 2,279 | 2,279 | ||||||||||||||||||||||||||||||
Cash dividends declared | (18,216 | ) | — | (18,216 | ) | (18,216 | ) | ||||||||||||||||||||||||||||||
Capital distribution to noncontrolling interests | (798 | ) | (798 | ) | |||||||||||||||||||||||||||||||||
Net income attributable to NTELOS Holdings Corp. | (53,634 | ) | (53,634 | ) | (53,634 | ) | |||||||||||||||||||||||||||||||
Unrecognized gain from defined benefit plans, net of $5,039 of deferred taxes | (7,915 | ) | (7,915 | ) | (7,915 | ) | |||||||||||||||||||||||||||||||
Amortization of unrealized loss from defined benefit plans, net of $45 of deferred income taxes | 71 | 71 | 71 | ||||||||||||||||||||||||||||||||||
Comprehensive income attributable to noncontrolling interests | 1,468 | 1,468 | |||||||||||||||||||||||||||||||||||
Balance, December 31, 2014 | 21,616 | 18 | $ | 214 | $ | 28,663 | $ | (285 | ) | $ | (53,634 | ) | $ | (9,090 | ) | $ | (34,132 | ) | $ | 1,180 | $ | (32,952 | ) | ||||||||||||||
* | Includes restricted shares issued, employee stock purchase plan issuances, shares issued through 401(k) matching contributions and stock options exercised, and other activity. |
See accompanying Notes to Consolidated Financial Statements.
48
NTELOS Holdings Corp.
Consolidated Statements of Changes in Stockholders’ Equity (Deficit)
(In thousands) | Common Shares | Treasury Shares | Common Stock | Additional Paid In Capital | Treasury Stock | Accumulated Deficit | Accumulated Other Comprehensive Loss | Total NTELOS Holdings Corp. Stockholders’ Equity (Deficit) | Noncontrolling Interests | Total Equity | |||||||||||||||||||||||||||
Balance, December 31, 2014 | 21,616 | 18 | $ | 214 | $ | 28,663 | $ | (285 | ) | $ | (53,634 | ) | $ | (9,090 | ) | $ | (34,132 | ) | $ | 1,180 | $ | (32,952 | ) | ||||||||||||||
Equity-based compensation * | 648 | 9 | 3,837 | (45 | ) | 3,792 | 3,792 | ||||||||||||||||||||||||||||||
Capital distribution to noncontrolling interests | — | (776 | ) | (776 | ) | ||||||||||||||||||||||||||||||||
Net loss attributable to NTELOS Holdings Corp. | (12,206 | ) | (12,206 | ) | (12,206 | ) | |||||||||||||||||||||||||||||||
Unrecognized loss from defined benefit plans, net of $941 of deferred taxes | 1,478 | 1,478 | 1,478 | ||||||||||||||||||||||||||||||||||
Amortization of unrealized loss from defined benefit plans, net of $299 of deferred income taxes | 470 | 470 | 470 | ||||||||||||||||||||||||||||||||||
Comprehensive income attributable to noncontrolling interests | — | 1,168 | 1,168 | ||||||||||||||||||||||||||||||||||
Balance, December 31, 2015 | 22,264 | 27 | $ | 214 | $ | 32,500 | $ | (330 | ) | $ | (65,840 | ) | $ | (7,142 | ) | $ | (40,598 | ) | $ | 1,572 | $ | (39,026 | ) | ||||||||||||||
* | Includes restricted shares issued, employee stock purchase plan issuances, shares issued through 401(k) matching contributions and stock options exercised, and other activity. |
See accompanying Notes to Consolidated Financial Statements.
49
NTELOS Holdings Corp.
Notes to Consolidated Financial Statements
Note 1. Description of Business
NTELOS Holdings Corp. (hereafter referred to as “Holdings Corp.” or the “Company”), through NTELOS Inc., its wholly-owned subsidiary (“NTELOS Inc.”) and its subsidiaries, is a regional provider of digital wireless communications services to consumers and businesses primarily in Virginia, West Virginia and certain portions of surrounding states. The Company’s primary services are wireless voice and data digital personal communications services (“PCS”) provided through NTELOS-branded retail operations and on a wholesale basis to other PCS providers, most notably through an arrangement with Sprint Spectrum L.P. (“Sprint Spectrum”), and Sprint Spectrum on behalf of and as an agent for SprintCom, Inc. (“SprintCom”) (Sprint Spectrum and SprintCom collectively, “Sprint”), which arrangement is referred to herein as the “Strategic Network Alliance” or "SNA." See Note 16 for additional information regarding this arrangement. The Company does not have any independent operations.
Holdings Corp. was formed in January 2005 for the purpose of acquiring NTELOS Inc. On January 18, 2005, Holdings Corp. entered into an agreement with NTELOS Inc. and certain of its stockholders to acquire the common stock of NTELOS Inc. On February 24, 2005, Holdings Corp. purchased 24.9% of NTELOS Inc. common stock and stock warrants. By May 2005, the Company had acquired all of NTELOS Inc.’s common shares, warrants and vested options. During the first quarter of 2006, Holdings Corp. completed an initial public offering of its common stock. Quadrangle Capital Partners LLP and certain of its affiliates (“Quadrangle”), a founding member of Holdings Corp., owns approximately 19% of the Company’s common shares as of December 31, 2015.
On August 10, 2015, the Company entered into an Agreement and Plan of Merger (“Merger Agreement”) with Shenandoah Telecommunications Company, a Virginia corporation (“Shentel”), and Gridiron Merger Sub, Inc., a Delaware corporation and wholly-owned subsidiary of Shentel (“Merger Sub”), pursuant to which, at the effective time of the merger (“Effective Time”), Merger Sub will merge with and into the Company, with the Company surviving the merger as a wholly-owned subsidiary of Shentel (“Merger”).
Subject to the terms and conditions set forth in the Merger Agreement, at the Effective Time, each share of common stock, par value $0.01 per share, of the Company (“Common Stock”) issued and outstanding immediately prior to the Effective Time (excluding (i) any shares of Common Stock that are owned by the Company, Shentel or any of their respective subsidiaries and (ii) any shares of Common Stock that are owned by any Company stockholders who are entitled to exercise, and properly exercise, appraisal rights with respect to such shares of Common Stock pursuant to the General Corporation Law of the State of Delaware) will be canceled and converted automatically into the right to receive $9.25 in cash, without interest.
The completion of the Merger is subject to the satisfaction or waiver of certain conditions, including (i) the approval of the transaction by the Federal Communications Commission (the “FCC”) and applicable state public utility commissions, (ii) the provision of all required notices to applicable state public utility commissions, (iii) the expiration of the applicable waiting period under the Hart-Scott-Rodino Antitrust Improvements Act of 1976 (“HSR Act”), as amended, (iv) the absence of any proceeding, order or law enjoining or prohibiting the Merger or the other transactions contemplated by the Merger Agreement, (v) each party’s material performance of its obligations and compliance with its covenants, (vi) the accuracy of each party’s representations and warranties, subject to customary materiality qualifiers, (vii) the absence of a material adverse effect on the Company and (viii) the consummation of the transactions contemplated by the Master Agreement, dated as of August 10, 2015, between SprintCom, Inc., an affiliate of Sprint Corporation, and Shenandoah Personal Communications, LLC, a wholly-owned subsidiary of Shentel (“Sprint Transactions”). Many of these conditions have already been satisfied, including, without limitation, approval of the merger by the Company’s stockholders, approval by the requisite state regulatory agencies and expiration of the HSR Act waiting period, and other of these conditions will be satisfied at the closing. However, other conditions, including the condition related to FCC approval, have not yet been satisfied. FCC approval is expected late in the first quarter or early in the second quarter of 2016 and the Merger is expected to close soon thereafter.
The Merger Agreement contains certain termination rights for Shentel and the Company, including termination by either party if the Merger is not consummated by June 28, 2016 (as mutually extended). The Merger Agreement further provides that, upon termination of the Merger Agreement under specified circumstances, including in connection with a change of recommendation of the Company board of directors (the “Board”) or the acceptance of a superior proposal by the Board, the Company will pay Shentel a termination fee equal to $8.8 million plus reimbursement of up to $2.5 million in fees, costs and expenses incurred by Shentel in connection with the Merger. The Merger Agreement also provides that, upon termination of the Merger Agreement under specified circumstances, Shentel will pay the Company a termination fee of $25 million or $8.8 million, depending on the specific circumstances, plus reimbursement of up to $2.5 million in fees, costs and expenses incurred by the Company in connection with the Merger.
50
The completion of the Merger is not subject to a financing condition. On December 18, 2015, Shentel entered into a credit agreement with various lenders and CoBank, ACB, as administrative agent (collectively, the “Lenders”), that provides Shentel with senior secured credit facilities, including a revolving credit facility and two term loan facilities. The availability of the credit facilities under the credit agreement is subject to various conditions, including the consummation of the Sprint Transactions and the consummation of the Merger in accordance with the terms and conditions set forth in the Merger Agreement. In addition, the commitments of the Lenders will terminate if the consummation of the Merger does not occur on or prior to June 28, 2016. Under certain conditions, if the Merger Agreement is terminated because of the failure of Shentel to obtain financing, Shentel will pay the Company the termination fee of $25 million plus reimbursement of up to $2.5 million in fees, costs and expenses referenced above.
On August 24, 2015, Mr. Marvin Westen and Mr. Paul Sekerak, each filed a purported class action complaint relating to the merger in the Court of Chancery of the State of Delaware. The Plaintiffs have sued all members of the Board, alleging that the members of the Board breached their fiduciary obligations to the purported class by agreeing to sell the Company for consideration deemed “inadequate” and by agreeing to deal protection terms that allegedly foreclose competing offers. Plaintiffs further allege that Shentel and Merger Sub (or, in the case of Mr. Sekerak, Shentel and the Company) for purportedly aiding and abetting the foregoing breaches. Plaintiffs seek, among other things, injunctive relief preventing consummation of the merger (and/or directing rescission of the transaction, to the extent already implemented), unspecified damages and an award of plaintiff’s expenses and attorneys’ fees. The Company and the members of the Board believe these claims are without merit and intend to defend themselves vigorously.
On December 1, 2014, the Company entered into an agreement to sell its wireless spectrum licenses in its eastern Virginia and Outer Banks of North Carolina markets (“Eastern Markets”) for approximately $56.0 million. The transaction closed on April 15, 2015. The Company entered into lease agreements to continue using the Eastern Markets spectrum licenses for varying terms ranging from the closing date through November 15, 2015. Effective November 15, 2015, the Company ceased commercial operations and all subscribers had been migrated off our network. As a result of no longer providing service in the Eastern Markets, certain assets, liabilities and results of operations associated with this market are now being reported as discontinued operations. Accordingly, we have recast the prior period results to be comparable with the current discontinued operations presentation. See Note 3 for additional information regarding these charges.
Note 2. Significant Accounting Policies and Other Information
Basis of Presentation
The accompanying consolidated financial statements have been prepared in accordance with Generally Accepted Accounting Principles in the United States (“GAAP”).
Use of Estimates
The preparation of consolidated financial statements in conformity with GAAP requires management to make estimates and assumptions that affect the reported amounts of assets and liabilities and disclosure of contingent assets and liabilities at the date of the financial statements and the reported amounts of revenues and expenses during the reporting periods. Actual results may differ from those estimates.
Principles of Consolidation
The consolidated financial statements include the accounts of the Company and all of its wholly-owned subsidiaries and those limited liability corporations where the Company or certain of its subsidiaries, as managing member, exercises control. All significant intercompany accounts and transactions have been eliminated.
Revenue Recognition
The Company recognizes revenue when services are rendered or when products are delivered and functional, as applicable. Certain services of the Company are billed in advance for service performance. In such cases, the Company records a service liability at the time of billing and subsequently recognizes revenue ratably over the service period. The Company bills customers certain transactional taxes on service revenues. These transactional taxes are not included in reported revenues as they are recognized as liabilities at the time customers are billed.
The Company earns retail and wholesale revenues by providing access to and usage of its networks. Retail and certain wholesale revenues are recognized as services are provided. In long term contracts certain fixed elements are required to be recognized on a straight-line basis over the term of the agreement. Revenues for equipment sales are recognized at the point of
51
sale. Wireless handsets and other devices sold with service contracts are generally sold at prices below cost, based on the terms of the service contracts. The Company recognizes the entire cost of the handsets at the time of sale.
The Company offers Equipment Installment Plan ("EIP"), which provides customers the option to pay for their devices over 24 months with no service contract. Additionally, after a specified period of time, customers have the right to trade in the original device for a new device and have the remaining unpaid balance satisfied. For customers that elect the EIP option, the Company recognizes revenue at the point of sale for the full retail price of the device, net of the estimated fair value of imputed interest and the estimated loss on trade-in. See Note 6 for additional information regarding EIP.
The Company evaluates related transactions to determine whether they should be viewed as multiple deliverable arrangements, which impact revenue recognition. Multiple deliverable arrangements are presumed to be bundled transactions and the total consideration is measured and allocated to the separate units based on their relative selling price with certain limitations. The Company has determined that sales of handsets with service contracts related to these sales generated from Company-operated retail stores are multiple deliverable arrangements. Accordingly, substantially all of the nonrefundable activation fee revenues (as well as the associated direct costs) are allocated to the wireless handset and are recognized at the time of the sale, based on the fact that the handsets are generally sold below cost and thus appropriately allocated to the point of sale based on the relative selling price evaluation. However, revenue and certain associated direct costs for activations sold at third-party retail locations are deferred and amortized over the estimated life of the customer relationship as the Company is not a principal in the transaction to sell the handset and therefore any activation fees charged are fully attributable to the service revenues.
The Company recognizes revenue in the period that persuasive evidence of an arrangement exists, delivery of the product has occurred or services have been rendered, it is able to determine the amount and when the collection of such amount is considered probable.
Allowance for Doubtful Accounts
The Company sells its PCS services and devices to individuals and commercial end-users and to other communication carriers. The Company has credit and collection policies to maximize collection of trade receivables and requires deposits on certain sales. The Company maintains an allowance for doubtful accounts based on historical results, current and expected trends and changes in credit policies. Management believes the allowance adequately covers all anticipated losses with respect to trade receivables and EIP sales. Actual credit losses could differ from such estimates. The Company includes bad debt expense in customer operations expense in the consolidated statements of operations.
Changes in the allowance for doubtful accounts for the years ended December 31, 2015, 2014 and 2013 are summarized in the table below:
Year Ended December 31, (3) | |||||||||||
(In thousands) | 2015 | 2014 | 2013 | ||||||||
Balance at beginning of year | $ | 4,608 | $ | 3,903 | $ | 2,934 | |||||
Charged to operating expenses (1) | 12,394 | 9,577 | 8,837 | ||||||||
Deductions (2) | (10,155 | ) | (8,872 | ) | (7,868 | ) | |||||
Balance at end of year | $ | 6,847 | $ | 4,608 | $ | 3,903 | |||||
(1) | Reflects provision for doubtful accounts, recorded in customer operations expense. |
(2) | Reflects uncollectible accounts written off against the allowance, net of recoveries and credits issued to customers. |
(3) | The table excludes provision for doubtful accounts of $7.7 million, $5.6 million and $6.7 million, and allowance for doubtful accounts of $1.5 million, $2.2 million, and $2.6 million recorded as part of discontinued operations for the year ended December 31, 2015, 2014, and 2013, respectively. See Note 3 for additional information regarding discontinued operations. |
52
Accrued Expenses and Other Current Liabilities
Year Ended December 31, | |||||||
(In thousands) | 2015 | 2014 | |||||
Accrued payroll | $ | 5,010 | $ | 6,249 | |||
Accrued taxes | 4,321 | 4,516 | |||||
Other | 8,672 | 9,490 | |||||
Total | $ | 18,003 | $ | 20,255 | |||
Inventories and Supplies
The Company’s inventories and supplies consist primarily of items held for resale such as devices and accessories. The Company values its inventory at the lower of cost or market. Inventory cost is computed on a currently adjusted standard cost basis (which approximates actual cost on a first-in, first-out basis). Market value is determined by reviewing current replacement cost, marketability and obsolescence.
Long-Lived Asset Recovery
Long-lived assets comprise property, plant and equipment, intangible assets (including goodwill, radio spectrum licenses, customer relationships and trademarks) and long-term deferred charges. Long-lived assets, excluding goodwill and intangible assets with indefinite useful lives, are recorded at cost and reviewed for impairment whenever events or changes in circumstances indicate that the carrying amount should be evaluated pursuant to the subsequent measurement guidance described in Financial Accounting Standards Board (“FASB”) Accounting Standards Codification ("ASC") 360, Property, Plant and Equipment. Impairment is determined by comparing the carrying value of these long-lived assets to management’s best estimate of future undiscounted cash flows expected to result from the use of the assets. If the carrying value exceeds the estimated undiscounted cash flows, the excess of the asset’s carrying value over the estimated fair value is recorded as an impairment charge.
Depreciation of property, plant and equipment is calculated on a straight-line basis over the estimated useful lives of the assets, which the Company reviews and updates based on historical experiences and future expectations. Buildings are depreciated over a 50-year life and leasehold improvements, which are categorized in land and buildings, are depreciated over the shorter of the estimated useful lives or the remaining lease terms. Network plant and equipment, which includes cell towers and site costs, and switch, cell site and other network equipment, are depreciated over various lives ranging from 5 to 17 years, with a weighted average life of approximately 10 years. Furniture, fixtures and other equipment are depreciated over various lives ranging from 2 to 18 years.
The Company evaluates the appropriateness of estimated useful lives on at least an annual basis. Consideration is given to the trends in technological evolution and the telecommunications industry, the Company’s maintenance practices and the functional condition of long-lived assets in relation to the remaining estimated useful life of the asset. When necessary, adjustments are made to the applicable useful life of an asset class or depreciation is accelerated for assets that have been identified for retirement prior to the expiration of the original useful life.
Goodwill and Indefinite-Lived Intangibles
Goodwill and radio spectrum licenses are considered indefinite-lived intangible assets. Indefinite-lived intangible assets are not subject to amortization but are instead tested for impairment annually, on October 1, or more frequently if an event indicates that the asset might be impaired.
Before employing detailed impairment testing, the Company first evaluates the likelihood of impairment by considering relevant qualitative factors that may have a significant bearing on fair value. If we determine that it is more likely than not that goodwill is impaired, we apply detailed testing methodologies. Otherwise, we conclude that no impairment exists. For detailed testing, the Company uses a two-step process to test for goodwill impairment. Step one requires a determination of the fair value of each of the reporting units and, to the extent that this fair value of the reporting unit exceeds its carrying value (including goodwill), the step two calculation of implied fair value of goodwill is not required and no impairment loss is recognized. In testing for goodwill impairment, the Company utilizes an analysis which allocates enterprise value to the reporting units.
The radio spectrum licenses relate primarily to PCS licenses in the markets that we serve. The Company considers a number of valuation methods, including market based and the Greenfield cash flow method, in its impairment testing for these assets.
53
Income Taxes
Deferred income taxes are provided on an asset and liability method whereby deferred tax assets are recognized for deductible temporary differences and deferred tax liabilities are recognized for taxable temporary differences. Temporary differences are the differences between the reported amounts of assets and liabilities and their tax bases. Deferred tax assets and liabilities are adjusted for the effects of changes in tax laws and rates on the date of enactment. The Company accrues interest and penalties related to unrecognized tax benefits in interest expense and income tax expense, respectively.
Pension Benefits and Retirement Benefits Other Than Pensions
NTELOS Inc. sponsors a non-contributory defined benefit pension plan (“Pension Plan”) covering all employees who meet eligibility requirements and were employed by NTELOS Inc. prior to October 1, 2003. The Pension Plan was closed to NTELOS Inc. employees hired on or after October 1, 2003. Pension benefits vest after five years of plan service and are based on years of service and an average of the five highest consecutive years of compensation subject to certain reductions if the employee retires before reaching age 65 and elects to receive the benefit prior to age 65. Effective December 31, 2012, the Company froze future benefit accruals. In 2014, we adopted updated mortality tables published by the Society of Actuaries that predict increasing life expectancies in the United States.
IRC Sections 412 and 430 and Sections 302 and 303 of the Employee Retirement Income Security Act of 1974, as amended establish minimum funding requirements for defined benefit pension plans. The minimum required contribution is generally equal to the target normal cost plus the shortfall amortization installments for the current plan year and each of the six preceding plan years less any calculated credit balance. If plan assets (less calculated credits) are equal to or exceed the funding target, the minimum required contribution is the target normal cost reduced by the excess funding, but not below zero. The Company’s policy is to make contributions to stay at or above the threshold required in order to prevent benefit restrictions and related additional notice requirements and is intended to provide not only for benefits based on service to date, but also for those expected to be earned in the future. Also, NTELOS Inc. has nonqualified pension plans that are accounted for similar to its Pension Plan.
NTELOS Inc. provides certain health care and life benefits for retired employees that meet eligibility requirements. The Company has two qualified nonpension postretirement benefit plans. The health care plan is contributory, with participants’ contributions adjusted annually. The life insurance plan also is contributory. These obligations, along with all of the pension plans and other postretirement benefit plans, are NTELOS Inc. obligations assumed by the Company. Eligibility for the life insurance plan is restricted to active pension participants age 50-64 as of January 5, 1994. Neither plan is eligible to employees hired after April 1993. The accounting for the plans anticipates that the Company will maintain a consistent level of cost sharing for the benefits with the retirees. The Company’s share of the projected costs of benefits that will be paid after retirement is generally being accrued by charges to expense over the eligible employees’ service periods to the dates they are fully eligible for benefits.
NTELOS Inc. also sponsors a contributory defined contribution plan under IRC Section 401(k) for substantially all employees. The Company’s policy is to match 100% of each participant’s annual contributions for contributions up to 1% of each participant’s annual compensation and 50% of each participant’s annual contributions up to an additional 5% of each participant’s annual compensation. Company contributions vest after two years of service. Effective June 1, 2009, the Company began funding its 401(k) matching contributions in shares of the Company’s common stock. Further information regarding these plans is provided in Note 15 of the Notes to Consolidated Financial Statements included in this Annual Report on Form 10-K.
Recent Accounting Pronouncements
In April 2014, the Financial Accounting Standards Board (“FASB”) issued Accounting Standards Update (“ASU”) 2014-08, Reporting of Discontinued Operations and Disclosures of Disposals of Components of an Entity, which changes the criteria for determining which disposals can be presented as discontinued operations and modifies related disclosure requirements. The guidance is effective prospectively for fiscal years and interim reporting periods within those years beginning after December 15, 2014, with early adoption permitted for transactions that have not been reported in financial statements previously issued or available for issuance. The standard was effective for the Company's fiscal year beginning January 1, 2015 and has been applied to the November 15, 2015 discontinuation of our Eastern Markets operations and all prior periods have been recast to reflect this adoption. See Note 3 for additional information and required disclosures.
In May 2014, FASB issued ASU 2014-09, Revenue from Contracts with Customers (Topic 606). This ASU provides a framework that replaces the existing revenue recognition guidance and is intended to improve the financial reporting requirements. The guidance is effective for public business entities for fiscal years beginning after December 15, 2017, and
54
interim periods within those years, with early adoption being prohibited. The Company is currently in the process of evaluating the impact of adoption of the ASU on its financial statements.
In August 2014, FASB issued ASU 2014-15, Disclosure of Uncertainties about an Entity’s Ability to Continue as a Going Concern, which requires management to assess an entity’s ability to continue as a going concern and to provide related footnote disclosures in certain circumstances. The guidance is effective for annual reporting periods ending after December 15, 2016, with early adoption permitted. The adoption of this guidance is not expected to have a material effect on the Company’s financial position or results of operations.
In April 2015, FASB issued ASU 2015-03, Simplifying the Presentation of Debt Issuance Costs, which changes the presentation of debt issuance costs in the financial statements. ASU 2015-03 requires an entity to present such costs in the balance sheet as a direct deduction from the related debt liability rather than as an asset. Amortization of the costs will continue to be reported as interest expense. The guidance is effective for annual reporting periods beginning after December 15, 2015, with early adoption permitted. The guidance will be applied retrospectively to each period presented. The Company is currently in the process of evaluating the impact of adoption of the ASU on its financial statements.
In April 2015, FASB issued ASU 2015-05, Customer’s Accounting for Fees Paid in a Cloud Computing Arrangement, which provides additional guidance regarding cloud computing arrangements. The guidance requires registrants to account for a cloud computing arrangement that includes a software license element consistent with the acquisition of other software licenses. Cloud computing arrangement without software licenses are to be accounted for as a service contract. This guidance is effective for fiscal years and interim periods beginning after December 15, 2015. The adoption of this guidance is not expected to have a material effect on the Company’s financial position or results of operations.
In July 2015, FASB issued ASU 2015-11, Inventory: Simplifying the Measurement of Inventory, which changes the measurement principle for inventory from the lower of cost or market to lower of cost and net realizable value. The ASU also eliminates the requirement for these entities to consider replacement cost or net realizable value less an approximately normal profit margin when measuring inventory. This guidance is effective for fiscal years and interim periods beginning after December 15, 2016. The Company is currently in the process of evaluating the impact of adoption of the ASU on its financial statements.
In November 2015, the FASB issued ASU 2015-17, Income Taxes (Topic 740): Balance Sheet Classification of Deferred Taxes, which requires that all deferred tax liabilities and assets be classified as noncurrent in the balance sheet effective for annual periods beginning after December 15, 2016, with early adoption permitted, and may be applied either prospectively or retrospectively. We have adopted this guidance retrospectively as of December 31, 2015. The Consolidated Balance Sheet for the year ended December 31, 2014 has been restated to reflect this change in accounting principle and reclass of $22.8 million of "Deferred income taxes" from current to non-current.
In February 2016, the FASB issued ASU No. 2016-02, Leases, which requires lessees to recognize assets and liabilities for most leases and would change certain aspects of current lease accounting, among other things. The guidance is effective for annual and interim periods beginning after December 15, 2018, with early adoption permitted. The Company is currently in the process of evaluating the impact of adoption of the ASU on its financial statements.
Note 3. Discontinued Operations
On December 1, 2014, the Company entered into an agreement to sell its wireless spectrum licenses in its eastern Virginia and Outer Banks of North Carolina markets (“Eastern Markets”) for approximately $56.0 million. The transaction closed on April 15, 2015. The Company entered into lease agreements to continue using the Eastern Markets spectrum licenses for varying terms ranging from the closing date through November 15, 2015. Effective November 16, 2015, we ceased commercial operations and all subscribers had been migrated off our network. As a result of no longer providing service in the Eastern Markets, certain assets, liabilities and results of operations associated with this market are now being reported as discontinued operations. Accordingly, we have recast the prior period results to be comparable with the current discontinued operations presentation.
During the fourth quarter of fiscal year 2014, as a result of the agreement to sell the Company's wireless spectrum licenses in the Eastern Markets, the Company calculated its fair value to be $57.9 million, the sales price plus the implied value of the non-cash spectrum leaseback. Accordingly, an impairment charge of $29.0 million was recorded during the fourth quarter of 2014. In conjunction with the agreement to sell the wireless spectrum and wind down of its operations in the Eastern Markets, the Company concluded that a triggering event had occurred and assessed the recoverability of its long-lived assets. The Company first assessed the ability to redeploy Eastern Markets property, plant and equipment. For the property, plant and equipment that
55
was deemed not to be redeployable, the Company used market quotes and recorded an impairment charge of $57.0 million during the fourth quarter of 2014 and wrote off abandoned construction in progress and certain other assets of $1.9 million.
In addition, restructuring liabilities have been established for employee separations, lease abandonments, operating lease terminations, and other related costs, Employee separation costs consist of severance to be paid in accordance with the Company’s written severance plan and certain management contracts. Severance payments are expected to be paid through 2016. Contract termination costs include lease abandonment costs for retail stores and other termination costs for contractual obligations for network services. Lease abandonment costs represent future minimum lease obligations, net of estimated sublease income. Contract termination costs are expected to be paid through 2019 absent settlements with vendors. Other costs include legal and advisory fees, which were paid in 2015.
Financial results for the years ended December 31, 2015, 2014 and 2013 reported as Income (loss) from discontinued operations, net of tax on the Condensed Consolidated Statements of Operations are as follows:
Year Ended December 31, | |||||||||||
(In thousands) | 2015 | 2014 | 2013 | ||||||||
Operating Revenues | |||||||||||
Retail Revenue | $ | 49,189 | $ | 112,808 | $ | 119,381 | |||||
Wholesale and other revenue | 3,179 | 1,794 | 2,338 | ||||||||
Equipment sales | 1,340 | 13,098 | 10,397 | ||||||||
Operating Revenues | 53,708 | 127,700 | 132,116 | ||||||||
Operating Expenses | |||||||||||
Cost of services | 28,731 | 37,906 | 33,933 | ||||||||
Cost of equipment sold | 1,199 | 31,427 | 32,574 | ||||||||
Customer operations | 12,574 | 30,784 | 35,104 | ||||||||
Corporate operations | 1,805 | 4,806 | 6,113 | ||||||||
Restructuring | 26,830 | 2,681 | — | ||||||||
Impairment | 117 | 87,853 | — | ||||||||
Depreciation and amortization | 4,999 | 21,235 | 18,913 | ||||||||
Gain on sale of assets | (5,637 | ) | — | — | |||||||
70,618 | 216,692 | 126,637 | |||||||||
Operating Income (Loss) | (16,910 | ) | (88,992 | ) | 5,479 | ||||||
Other Income (Expense) | |||||||||||
Other income (expense), net | 127 | 2 | (11 | ) | |||||||
127 | 2 | (11 | ) | ||||||||
Income (Loss) before Income Taxes | (16,783 | ) | (88,990 | ) | 5,468 | ||||||
Income Taxes (Benefit) | (6,880 | ) | (33,641 | ) | 2,417 | ||||||
Income (Loss) from Discontinued Operations | $ | (9,903 | ) | $ | (55,349 | ) | $ | 3,051 | |||
56
Assets and liabilities presented as discontinued operations as of December 31, 2015 and 2014 are as follows:
(In thousands) | December 31, 2015 | December 31, 2014 | |||||
Current Assets | |||||||
Accounts receivable, net | $ | 1,101 | $ | 9,070 | |||
Inventories and supplies | — | 319 | |||||
Prepaid expenses | 1,002 | 5,248 | |||||
Other current assets | 18 | 126 | |||||
Total current assets from discontinued operations | 2,121 | 14,763 | |||||
Property plant and equipment | — | 23,893 | |||||
Assets held for sale | 1,733 | 59,954 | |||||
Other non-current assets | — | 1,555 | |||||
Total assets from discontinued operations | $ | 3,854 | $ | 100,165 | |||
Current Liabilities | |||||||
Current portion of long-term debt | $ | 55 | $ | 88 | |||
Accounts payable | 6,003 | 411 | |||||
Advance billings and customer deposits | 115 | 4,848 | |||||
Accrued expenses and other current liabilities | 6,881 | 6,898 | |||||
Total current liabilities from discontinued operations | 13,054 | 12,245 | |||||
Long-Term Debt | 46 | 101 | |||||
Other Long-Term Liabilities | 789 | 27,628 | |||||
Total liabilities from discontinued operations | $ | 13,889 | $ | 39,974 | |||
Following is selected operating and investing cash flow activity from discontinued operations included in Condensed Consolidated Statements of Cash Flows:
Year Ended December 31, | |||||||||||
(In thousands) | 2015 | 2014 | 2013 | ||||||||
Depreciation and amortization | $ | 4,999 | $ | 21,235 | $ | 18,913 | |||||
Impairment and other charges | 117 | 87,853 | — | ||||||||
Bad debt expense | 7,676 | 5,594 | 6,671 | ||||||||
Restructuring payments | 26,658 | 230 | — | ||||||||
Proceeds from sale of assets | 62,838 | — | — | ||||||||
Purchases of property, plant, and equipment | 578 | 25,181 | 12,433 | ||||||||
Note 4. Supplemental Financial Information
Cash
The Company’s cash was held in market rate savings accounts and non-interest bearing deposit accounts. The total held in the market rate savings accounts at December 31, 2015 and 2014 was $39.7 million and $28.5 million, respectively. The remaining $33.0 million and $45.0 million of cash at December 31, 2015 and 2014, respectively, was held in non-interest bearing deposit accounts.
Restricted Cash
The Company is eligible to receive up to $5.0 million in connection with its winning bid in the Connect America Fund's Mobility Fund Phase I Auction ("Auction 901"). Pursuant to the terms of Auction 901, the Company was required to obtain a Letter of Credit (“LOC”) for the benefit of the Universal Service Administrative Company (“USAC”) to cover each disbursement plus the amount of the performance default penalty (10% of the total eligible award). USAC may draw upon the LOC in the event the Company fails to demonstrate the required wireless service coverage by the applicable deadline in 2016. The Company obtained the first LOC in the amount of $2.2 million, representing the first disbursement of $1.7 million received in September 2013, plus the performance default penalty of $0.5 million. In accordance with the terms of the LOC, the
57
Company deposited $2.2 million into a separate account at the issuing bank to serve as cash collateral. Such funds will be released when the LOC is terminated without being drawn upon by USAC.
Accounting for Asset Retirement Obligations
An asset retirement obligation is evaluated and recorded as appropriate on assets for which the Company has a legal obligation to retire. The Company records a liability for an asset retirement obligation and the associated asset retirement cost at the time the underlying asset is acquired. Subsequent to the initial measurement of the asset retirement obligation, the obligation is adjusted at the end of each period to reflect the passage of time and changes in the estimated future cash flows underlying the obligation, if any.
The Company enters into long-term leasing arrangements primarily for tower sites and retail store locations. The Company constructs assets at these locations and, in accordance with the terms of many of these agreements, the Company is obligated to restore the premises to their original condition at the conclusion of the agreements, generally at the demand of the other party to these agreements. The Company recognizes the fair value of a liability for an asset retirement obligation and capitalizes that cost as part of the cost basis of the related asset, depreciating it over the useful life of the related asset.
The following table indicates the changes to the Company’s asset retirement obligation liability, which is included in other long-term liabilities, for the years ended December 31, 2015 and 2014:
(In thousands) | 2015 | 2014 | |||||
Asset retirement obligations, beginning | $ | 19,236 | $ | 15,528 | |||
Net increases due to changes in, and timing of estimated future cash flows | 438 | 2,901 | |||||
Accretion of asset retirement obligations | 1,111 | 807 | |||||
Asset retirement obligations, ending | $ | 20,785 | $ | 19,236 | |||
The Company revised cost estimates used to determine the fair value of its asset retirement obligations resulting in an increase in the liability and related assets of $2.8 million at December 31, 2014. The Company recorded an immaterial amount in 2015.
Advertising Costs
The Company expenses advertising costs and marketing production costs as incurred (included within customer operations expense in the consolidated statements of operations). Advertising costs for the years ended December 31, 2015, 2014 and 2013 were $11.9 million, $11.8 million and $10.9 million, respectively.
Note 5. Supplemental Cash Flow Information
The following information is presented as supplementary disclosures for the consolidated statements of cash flows for the years ended December 31, 2015, 2014 and 2013:
Year Ended December 31, | |||||||||||
(In thousands) | 2015 | 2014 | 2013 | ||||||||
Cash payments for: | |||||||||||
Interest (net of amounts capitalized) | $ | 29,422 | $ | 34,891 | $ | 22,693 | |||||
Income taxes | 25,770 | 3,601 | 4,087 | ||||||||
Cash received from income tax refunds | 3,975 | 1,434 | 3,704 | ||||||||
Supplemental investing and financing activities: | |||||||||||
Additions to property, plant and equipment included in accounts payable and other accrued liabilities | 9,324 | 8,509 | 8,272 | ||||||||
Borrowings under capital leases | 67 | 562 | 380 | ||||||||
Dividends declared not paid | — | — | 9,221 | ||||||||
The amount of interest capitalized was $1.3 million, $0.3 million and $0.1 million for the years ended December 31, 2015, 2014 and 2013, respectively.
58
Note 6. Equipment Installment Plan Receivables
EIP subscribers pay for their devices in installments over a 24-month period. At the time of an installment sale, the Company imputes interest on the installment receivable using current market interest rate estimates along with other inputs such as historical and expected credit losses and credit quality of its EIP base. The imputed interest is recorded as a reduction to equipment revenue and as a reduction to the face amount of the related receivable. Interest income is recognized over the term of the installment contract as interest income presented net of interest expense. The Company's imputed interest rate has ranged from approximately 5% to 10%. Additionally, the customer has the right to trade in their original device after a specified period of time for a new device and have the remaining unpaid balance satisfied. This trade-in right is measured at the estimated fair value of the device being traded in based on current trade-in values and the timing of the trade-in. The trade-in right is recorded as a reduction to the equipment revenue at the time of sale with a corresponding increase in liabilities. As of December 31, 2015 and December 31, 2014, the liability associated with this trade-in right was $4.7 million and $1.4 million, respectively, and is reflected in Advanced billings and customer deposits and Other Long-Term Liabilities on the consolidated balance sheets.
There was $4.4 million and $0.4 million of billed EIP receivables included in the Company's subscriber accounts receivable as of December 31, 2015 and 2014, respectively. The following table summarizes the remaining unbilled EIP receivables at December 31, 2015 and 2014:
(In thousands) | December 31, 2015 | December 31, 2014 | |||||
EIP receivables, gross | $ | 37,898 | $ | 13,369 | |||
Deferred interest | (2,764 | ) | (675 | ) | |||
EIP receivables, net of deferred interest | 35,134 | 12,694 | |||||
Allowance for credit losses | (2,324 | ) | (650 | ) | |||
EIP receivables, net | $ | 32,810 | $ | 12,044 | |||
Classified on the consolidated balance sheet as: | |||||||
Accounts receivable, net | $ | 22,291 | $ | 5,252 | |||
Deferred Charges and Other assets | 10,519 | 6,792 | |||||
EIP receivables, net | $ | 32,810 | $ | 12,044 | |||
Note 7. Property, Plant and Equipment
The components of property, plant and equipment, and the related accumulated depreciation, were as follows:
(In thousands) | December 31, 2015 | December 31, 2014 | |||||
Land and buildings | $ | 27,406 | $ | 27,560 | |||
Network plant and equipment | 451,996 | 345,373 | |||||
Furniture, fixtures and other equipment | 95,095 | 88,492 | |||||
574,497 | 461,425 | ||||||
Under construction | 27,577 | 16,859 | |||||
602,074 | 478,284 | ||||||
Less: accumulated depreciation | 275,814 | 212,230 | |||||
Property, plant and equipment, net | $ | 326,260 | $ | 266,054 | |||
Buildings and improvements principally consists of owned general office facilities, retail stores and leasehold improvements. Network, plant and equipment includes switching equipment, cell site towers, site development costs, radio frequency equipment, network software, transport and transmission-related equipment. Furniture, fixtures and other equipment includes internal use software, office equipment, and other primarily consists of furniture, information technology systems, equipment and vehicles, and leased devices. Construction in progress, which is not depreciated until placed in service, primarily includes materials, transmission and related equipment, labor, engineering, site development costs, interest and other costs relating to the
59
construction and development of our network. Depreciation expense relating to property and equipment was $54.3 million, $53.3 million and $51.0 million for the years ended December 31, 2015, 2014 and 2013, respectively.
Note 8. Intangible Assets
Intangible Assets not Subject to Amortization
Goodwill and radio spectrum licenses are not considered amortizable intangible assets. The Company allocates all its goodwill to the markets in western Virginia and West Virginia. The Company tested its goodwill and radio spectrum licenses as of October 1, 2015 and concluded that no impairment existed as of that date.
Intangible Assets Subject to Amortization
Customer relationships and trademarks are considered amortizable intangible assets. At December 31, 2015 and 2014, customer relationships and trademarks were comprised of the following:
December 31, 2015 | December 31, 2014 | ||||||||||||||||||||||||
(In thousands) | Estimated Useful Life | Gross Amount | Accumulated Amortization | Net | Gross Amount | Accumulated Amortization | Net | ||||||||||||||||||
Customer relationship | 17.5 years | $ | 36,900 | $ | (34,630 | ) | $ | 2,270 | $ | 36,900 | $ | (34,305 | ) | $ | 2,595 | ||||||||||
Trademarks | 15 years | 7,000 | (4,978 | ) | 2,022 | 7,000 | (4,511 | ) | 2,489 | ||||||||||||||||
Total | $ | 43,900 | $ | (39,608 | ) | $ | 4,292 | $ | 43,900 | $ | (38,816 | ) | $ | 5,084 | |||||||||||
The Company amortizes its amortizable intangible assets using the straight-line method unless it determines that another systematic method is more appropriate.
The estimated life of amortizable intangible assets is determined from the unique factors specific to each asset and the Company reviews and updates estimated lives based on later events and future expectations. Amortization expense was $0.8 million, $1.9 million, $3.0 million for the years ended December 31, 2015, 2014, and 2013, respectively.
Amortization expense for the next five years is expected to be as follows:
(In thousands) | Customer Relationships | Trademarks | Total | ||||||||
2016 | $ | 324 | $ | 467 | $ | 791 | |||||
2017 | 324 | 467 | 791 | ||||||||
2018 | 324 | 467 | 791 | ||||||||
2019 | 324 | 467 | 791 | ||||||||
2020 | 324 | 154 | 478 | ||||||||
Thereafter | 650 | — | 650 | ||||||||
$ | 2,270 | $ | 2,022 | $ | 4,292 | ||||||
Note 9. Long-Term Debt
As of December 31, 2015 and December 31, 2014, the Company’s outstanding long-term debt consisted of the following:
(In thousands) | December 31, 2015 | December 31, 2014 | |||||
Senior secured term loans, net of unamortized debt discount | $ | 519,820 | $ | 524,504 | |||
Capital lease obligations | 419 | 715 | |||||
520,239 | 525,219 | ||||||
Less: current portion of long-term debt | 5,605 | 5,728 | |||||
Long-term debt | $ | 514,634 | $ | 519,491 | |||
Long-Term Debt, Excluding Capital Lease Obligations
60
On November 9, 2012, NTELOS Inc. entered into an Amended and Restated Credit Agreement (the “Amended and Restated Credit Agreement”), which amended and restated, in its entirety, that certain Credit Agreement dated August 7, 2009 (the “Original Credit Agreement”). The Amended and Restated Credit Agreement provided for (1) a term loan A in the aggregate amount of $150.0 million (the “Term Loan A”); and (2) a term loan B in the aggregate amount of $350.0 million (the “Term Loan B” and, together with the Term Loan A, the “Term Loans”).
On January 31, 2014, the Company completed the refinancing of Term Loan A, which converted the outstanding principal balance of $148.1 million of Term Loan A into Term Loan B, and borrowed an additional $40.0 million under Term Loan B. The additional Term Loan B borrowings bear the same interest rate, maturity and other terms as the Company’s existing Term Loan B borrowings.
The Amended and Restated Credit Agreement provides for a new Term Loan B in the aggregate amount of $533.8 million. The Term Loan B matures in November 2019, with quarterly payments of approximately $1.4 million beginning March 31, 2014 and continuing through September 30, 2019, and the remainder due on November 9, 2019.
The Amended and Restated Credit Agreement also permits incremental commitments of up to $125.0 million (the “Incremental Commitments”) of which up to $35.0 million can be in the form of a revolving credit facility. The ability to incur the Incremental Commitments is subject to various restrictions and conditions, including having a Leverage Ratio (as defined in the Amended and Restated Credit Agreement) not in excess of 4.50:1.00 at the time of incurrence (calculated on a pro forma basis). As of December 31, 2015, there were no commitments associated with the Incremental Commitments.
The Amended and Restated Credit Agreement provided that the Term Loan A be issued at a 1.0% discount ($1.5 million) and bear interest at a rate equal to either 3.5% above the Eurodollar Rate (as defined in the Amended and Restated Credit Agreement) or 2.5% above the Base Rate (as defined in the Amended and Restated Credit Agreement), and the Term Loan B be issued at a 1.0% discount ($3.5 million) and bear interest at a rate equal to either 4.75% above the Eurodollar Rate or 3.75% above the Base Rate. The refinancing provided that the refinanced amount plus the additional borrowing of $40 million be issued at a 0.25% discount ($0.5 million) and bear interest at a rate equal to either 4.75% above the Eurodollar Rate or 3.75% above the Base Rate. The Amended and Restated Credit Agreement provides that the Eurodollar Rate shall never be less than 1.0% per annum and the Base Rate shall never be less than 2.0% per annum.
All loans outstanding under the Amended and Restated Credit Agreement are secured by a first priority pledge of substantially all property and assets of Ntelos Inc. and all material subsidiaries, as guarantors. The Amended and Restated Credit Agreement contains customary affirmative and negative covenants which, among other things, restrict the ability of NTELOS Inc. and its guarantors to incur additional debt, grant liens, make investments, sell assets and make Restricted Payments (as defined in the Amended and Restated Credit Agreement, which include paying dividends).
The Amended and Restated Credit Agreement has a Restricted Payments basket, initially set at $50.0 million, which can be used to make Restricted Payments, including the ability to pay dividends, repurchase stock or advance funds to the Company. This Restricted Payment basket increases by $6.5 million per quarter and decreases by actual Restricted Payments made after the date of the Amended and Restated Credit Agreement and by certain investments and debt prepayments made after the date of the Amended and Restated Credit Agreement.
In addition, the Restricted Payment basket increases by the positive amount, if any, of 50% (or, if the Leverage Ratio as of the most recently ended twelve month period, was less than 2.75:1.0, 75%) of the Excess Cash Flow (as defined in the Amended and Restated Credit Agreement), for the most recently ended fiscal quarter in excess of $10.0 million. NTELOS Inc. may not make Restricted Payments if its Leverage Ratio (calculated on a pro forma basis) is greater than to 4.25:1.00. In addition, this Restricted Payments basket increases by the amount of any mandatory prepayments on the Term Loans to the extent the lenders decline to receive such prepayment. There was no Excess Cash Flow for the quarter ended December 31, 2015. The balance of the Restricted Payments basket as of December 31, 2015 was $86.1 million.
Under the Amended and Restated Credit Agreement, mandatory debt prepayments of 50% of Excess Cash Flow for the most recently ended fiscal year (beginning with the fiscal year ending December 31, 2013) must be made by the 90th day of the following year, if the Leverage Ratio is above 4.50:1.00. Mandatory debt prepayments of 25% of Excess Cash Flow for a fiscal year must be made by the 90th day of the following year, if the Leverage Ratio is equal to or less than 4.50:1.00 but above 3.75:1.00. If NTELOS Inc.’s Leverage Ratio is equal to or less than 3.75:1.00 for a fiscal year, NTELOS Inc. is not required to make an Excess Cash Flow mandatory debt prepayment for that fiscal year. At December 31, 2015, NTELOS Inc.’s Leverage Ratio (as defined under the Amended and Restated Credit Agreement) was 7.65:1.00.
In connection with the refinancing, the Company incurred approximately $3.8 million in creditor and third party fees, of which $3.7 million was deferred and is being amortized to interest expense over the life of the debt using the effective interest method. The Company also deferred $0.5 million in debt discounts related to the new Term Loan B borrowings, which are
61
being accreted to the Term Loan B using the effective interest method over the life of the debt and are reflected in interest expense. Additionally, the Company wrote off a proportionate amount of the unamortized deferred fees and debt discount from the Amended and Restated Credit Agreement totaling $0.5 million and $0.2 million, respectively, which are reflected in other expenses in the consolidated statements of operations. Accretion of these discounts for each of the years ended December 31, 2015 and 2014 was $0.7 million.
The aggregate maturities of long-term debt outstanding at December 31, 2015, excluding capital lease obligations, based on the contractual terms of the instruments are as follows:
(In thousands) | Term Loan | |||
2016 | $ | 5,405 | ||
2017 | 5,405 | |||
2018 | 5,405 | |||
2019 | 506,725 | |||
Total | $ | 522,940 | ||
The Company’s blended average interest rate on its long-term debt was approximately 6.4% and 6.3% for the years ended December 31, 2015 and 2014, respectively.
Capital Lease Obligations
In addition to the long-term debt discussed above, the Company has entered into capital leases on vehicles with original lease terms of four to five years. At December 31, 2015, the carrying value and accumulated depreciation of these assets was $1.9 million and $1.2 million, respectively. The total net present value of the Company’s future minimum lease payments is $0.4 million. As of December 31, 2015, the principal portion of these capital lease obligations is due as follows: $0.2 million in 2016, $0.1 million in 2017 and less than $0.1 million in 2018 and 2019.
Note 10. Restructuring Charges
In 2014, the Company initiated a plan to reduce operating expenses. In conjunction, the Company established restructuring liabilities for employee separations, lease abandonments, operating lease terminations, and other related costs, which are recorded in current liabilities in the Consolidated Balance Sheet. A summary of the restructuring liabilities is presented below:
(In thousands) | Employee Separation | Contract Terminations | Other | Total | |||||||||||||||
Cumulative charges incurred as of December 31, 2015 | $ | 3,063 | $ | 327 | $ | 79 | $ | 3,469 | |||||||||||
Balance as of December 31, 2013 | $ | — | $ | — | $ | — | $ | — | |||||||||||
Charges | 982 | — | — | 982 | |||||||||||||||
Utilization | (32 | ) | — | — | (32 | ) | |||||||||||||
Balances as of December 31, 2014 | $ | 950 | $ | — | $ | — | $ | 950 | |||||||||||
Charges | 2,081 | 327 | 79 | 2,487 | |||||||||||||||
Utilization | (2,671 | ) | (76 | ) | (79 | ) | (2,826 | ) | |||||||||||
Balances as of December 31, 2015 | $ | 360 | $ | 251 | $ | — | $ | 611 | |||||||||||
Employee separation costs for certain corporate employees consist of severance to be paid in accordance with the Company’s written severance plan and certain management contracts. Severance payments are expected to be paid through 2016. Contract termination costs include lease abandonment costs and other termination costs for contractual obligations. Lease abandonment costs represent future minimum lease obligations, net of estimated sublease income. Other costs include legal fees paid during 2015. The Company does not anticipate any additional significant costs to be incurred as part of this restructuring plan.
62
Note 11. Financial Instruments
The Company is exposed to market risks with respect to certain of the financial instruments that it holds. Cash, accounts receivable, accounts payable and accrued liabilities are reflected in the consolidated financial statements at cost, which approximates fair value because of the short-term nature of these instruments. The fair values of other financial instruments are determined using observable market prices. The following is a summary by balance sheet category:
Long-Term Investments
At December 31, 2015 and 2014, the Company had an investment in CoBank, ACB (“CoBank”) of $1.5 million. This investment is primarily related to a required investment under the Original Credit Agreement and declared and unpaid patronage distributions of restricted equity related to the portion of the term loans previously held by CoBank. This investment is carried under the cost method as it is not practicable to estimate fair value. This investment is subject to redemption in accordance with CoBank’s capital recovery plans.
Interest Rate Derivatives
In February 2013, the Company purchased an interest rate cap for $0.9 million with a notional amount of $350.0 million, which caps the three month Eurodollar rate at 1.0% and expired in August 2015. The Company did not designate the interest rate cap agreement as a cash flow hedge for accounting purposes. Therefore, the change in market value of the agreement is recorded as a gain or loss in Other Expense. The Company recorded an immaterial loss for the year ended December 31, 2015 and losses of $0.2 million and $0.7 million for the years ended December 31, 2014 and 2013, respectively.
The following table indicates the difference between face amount, carrying amount and fair value of the Company’s financial instruments at December 31, 2015 and 2014.
Face | Carrying | Fair | |||||||||
(In thousands) | Amount | Amount | Value | ||||||||
December 31, 2015 | |||||||||||
Nonderivatives: | |||||||||||
Financial assets: | |||||||||||
Long-term investments for which it is not practicable to estimate fair value | N/A | $ | 1,522 | N/A | |||||||
Financial liabilities: | |||||||||||
Term Loans | $ | 522,940 | $ | 519,820 | $ | 517,710 | |||||
Capital lease obligations | $ | 419 | $ | 419 | $ | 419 | |||||
December 31, 2014 | |||||||||||
Nonderivatives: | |||||||||||
Long-term investments for which it is not practicable to estimate fair value | N/A | $ | 1,522 | N/A | |||||||
Financial liabilities: | |||||||||||
Term loans | $ | 528,345 | $ | 525,504 | $ | 459,660 | |||||
Capital lease obligations | $ | 904 | $ | 904 | $ | 904 | |||||
Derivative related to debt: | |||||||||||
Interest rate cap asset | $ | 350,000 | * | $ | — | $ | — | ||||
* | Notional amount |
The fair values of the Term Loans under the Amended and Restated Credit Agreement were derived based on bid prices at December 31, 2015 and December 31, 2014, respectively. The fair value of the derivative instrument was based on a quoted market price at December 31, 2014. These instruments are classified within Level 2 of the fair value hierarchy described in ASC 820, Fair Value Measurements and Disclosures.
Note 12. Equity and Earnings Per Share
On August 24, 2009, the Board of Directors authorized management to repurchase up to $40.0 million of the Company’s common stock. The Company may conduct its purchases in the open market, in privately negotiated transactions, through derivative transactions or through purchases made in accordance with Rule 10b5-1 under the Securities Exchange Act of 1934, as amended (the “Exchange Act”). The share repurchase program does not require the Company to acquire any specific number
63
of shares and may be terminated at any time. Through December 31, 2009, the Company had repurchased 523,233 shares for $16.9 million. The Company did not repurchase any of its common shares during fiscal years 2013 through 2015 under the authorization. Additionally, during the fiscal years 2015 and 2014, the Company repurchased approximately $0.1 million of restricted common stock in order to satisfy certain minimum tax withholding obligations in connection with the vesting of restricted stock.
64
The computations of basic and diluted earnings per share for the years ended December 31, 2015, 2014 and 2013 are as follows:
Year Ended December 31, 2015 | |||||||||||
(In thousands) | Continuing Operations | Discontinued Operations | Total | ||||||||
Numerator: | |||||||||||
Net income (loss) attributable to common shares for earnings per share computation | $ | (2,303 | ) | $ | (9,903 | ) | $ | (12,206 | ) | ||
Denominator: | |||||||||||
Total shares outstanding | 22,264 | 22,264 | 22,264 | ||||||||
Less: unvested shares | (949 | ) | (949 | ) | (949 | ) | |||||
Less: effect of calculating weighted average shares | (58 | ) | (58 | ) | (58 | ) | |||||
Denominator for basic earnings per common share – weighted average shares outstanding | 21,257 | 21,257 | 21,257 | ||||||||
Plus: weighted average unvested shares | — | — | — | ||||||||
Plus: common stock equivalents of stock options | — | — | — | ||||||||
Plus: performance stock units | — | — | — | ||||||||
Denominator for diluted earnings per common share – weighted average shares outstanding | 21,257 | 21,257 | 21,257 | ||||||||
Basic earnings (loss) per common share | $ | (0.10 | ) | $ | (0.47 | ) | $ | (0.57 | ) | ||
Diluted earnings (loss) per common share | $ | (0.10 | ) | $ | (0.47 | ) | $ | (0.57 | ) | ||
65
Year Ended December 31, 2014 | |||||||||||
(In thousands) | Continuing Operations | Discontinued Operations | Total | ||||||||
Numerator: | |||||||||||
Net income (loss) attributable to common shares for earnings per share computation | $ | 1,715 | $ | (55,349 | ) | $ | (53,634 | ) | |||
Denominator: | |||||||||||
Total shares outstanding | 21,616 | 21,616 | 21,616 | ||||||||
Less: unvested shares | (463 | ) | (463 | ) | (463 | ) | |||||
Less: effect of calculating weighted average shares | (42 | ) | (42 | ) | (42 | ) | |||||
Denominator for basic earnings per common share – weighted average shares outstanding | 21,111 | 21,111 | 21,111 | ||||||||
Plus: weighted average unvested shares | — | — | — | ||||||||
Plus: common stock equivalents of stock options | — | — | — | ||||||||
Plus: performance stock units | — | — | — | ||||||||
Denominator for diluted earnings per common share – weighted average shares outstanding | 21,111 | 21,111 | 21,111 | ||||||||
Basic earnings (loss) per common share | $ | 0.08 | $ | (2.62 | ) | $ | (2.54 | ) | |||
Diluted earnings (loss) per common share | $ | 0.08 | $ | (2.62 | ) | $ | (2.54 | ) | |||
Year Ended December 31, 2013 | |||||||||||
(In thousands) | Continuing Operations | Discontinued Operations | Total | ||||||||
Numerator: | |||||||||||
Net income (loss) attributable to common shares for earnings per share computation | $ | 21,627 | $ | 3,051 | $ | 24,678 | |||||
Denominator: | |||||||||||
Total shares outstanding | 21,510 | 21,510 | 21,510 | ||||||||
Less: unvested shares | (443 | ) | (443 | ) | (443 | ) | |||||
Less: effect of calculating weighted average shares | (41 | ) | (41 | ) | (41 | ) | |||||
Denominator for basic earnings per common share – weighted average shares outstanding | 21,026 | 21,026 | 21,026 | ||||||||
Plus: weighted average unvested shares | 422 | 422 | 422 | ||||||||
Plus: common stock equivalents of stock options | 285 | 285 | 285 | ||||||||
Plus: performance stock units | 93 | 93 | 93 | ||||||||
Denominator for diluted earnings per common share – weighted average shares outstanding | 21,826 | 21,826 | 21,826 | ||||||||
Basic earnings (loss) per common share | $ | 1.02 | $ | 0.15 | $ | 1.17 | |||||
Diluted earnings (loss) per common share | $ | 0.99 | $ | 0.14 | $ | 1.13 | |||||
In accordance with ASC 260, Earnings Per Share, unvested share-based payment awards that contain rights to receive non-forfeitable dividends or dividend equivalents, whether paid or unpaid, are considered a “participating security” for purposes of computing earnings or loss per common share pursuant to the two-class method. The Company's unvested restricted stock awards have rights to receive non-forfeitable dividends. For the years ended December 31, 2015 and 2014, the Company has calculated basic earnings per share using weighted average shares outstanding and the two-class method and determined there
66
was no significant difference in the per share amounts calculated under the two methods.
For the years ended December 31, 2015, 2014 and 2013, the denominator for diluted earnings per common share excludes approximately 1.6 million shares, 1.6 million shares and 1.8 million shares, respectively, related to stock options that were antidilutive for the respective periods presented. In addition, the performance-based portion of the performance stock units ("PSUs") is excluded from diluted earnings per share until the performance criteria are satisfied.
Note 13. Stock Plans
The Company has employee equity incentive plans (referred to as the “Employee Equity Incentive Plans”) administered by the Compensation Committee of the Company’s board of directors, which permits the grant of long-term incentives to employees, including stock options, stock appreciation rights, restricted stock awards, restricted stock units, performance stock units, incentive awards, other stock-based awards and dividend equivalents. The maximum number of shares of common stock available for awards under the Employee Equity Incentive Plans is 4,025,000. The Company also has a non-employee director equity plan (the “Non-Employee Director Equity Plan”). The total number of shares of common stock originally available for grant under the Non-Employee Director Equity Plan is 200,000. The Non-Employee Director Equity Plan together with the Employee Equity Incentive Plans are referred to as the “Equity Incentive Plans.” Awards under these plans are issuable to employees or non-employee directors as applicable.
During the year ended December 31, 2015, the Company issued 261,503 stock options under the Employee Equity Incentive Plans. No options were issued under the Non-Employee Director Equity Plan during 2015. During the year ended December 31, 2014, the Company issued 347,023 stock options under the Employee Equity Incentive Plans and 27,170 stock options under the Non-Employee Director Equity Plan. The options issued under the Employee Equity Incentive Plans generally vest one-fourth annually beginning one year after the grant date and the options issued under the Non-Employee Director Equity Plan cliff vest on the first anniversary of the grant date.
During the year ended December 31, 2015, the Company issued 415,401 shares of restricted stock under the Employee Equity Incentive Plans and 87,525 shares of restricted stock under the Non-Employee Director Equity Plan. During the year ended December 31, 2014, the Company issued 132,041 shares of restricted stock under the Employee Equity Incentive Plans and 11,338 shares of restricted stock under the Non-Employee Director Equity Plan. The restricted shares granted under the Employee Equity Incentive Plans generally cliff vest on the first or third anniversary of the grant date. The restricted shares granted under the Non-Employee Director Equity Plan cliff vest on the first anniversary of the grant date. Dividend and voting rights applicable to restricted stock are equivalent to the Company’s common stock.
During the year ended December 31, 2015, the Company granted 28,031 performance stock units ("PSUs") under the Employee Equity Incentive Plans to certain key employees. During the year ended December 31, 2014, the Company granted 83,151 performance stock units ("PSUs") under the Employee Equity Incentive Plans to certain key employees. The PSUs cliff vest on the third anniversary of the grant date and are subject to certain performance and market conditions. Each PSU represents the contingent right to receive one share (or more based on maximum achievement) of the Company’s common stock if vesting is satisfied. The PSUs have no voting rights. Dividends, if any, that would have been paid on the underlying shares will be paid as dividend equivalent units on PSUs that vest, on or after the vesting date.
Stock options must be granted under the Equity Incentive Plans at not less than 100% of fair value on the date of grant and have a maximum life of ten years from the date of grant. Stock options and other awards under the Equity Incentive Plans may be exercised in compliance with such requirements as determined by the Compensation Committee.
The Company accounts for share-based employee compensation plans under ASC 718, Stock Compensation. Equity-based compensation expense from share-based equity awards is recorded with an offsetting increase to additional paid in capital on the consolidated balance sheet. For equity awards with only service conditions, the Company recognizes compensation cost on a straight-line basis over the requisite service period for the entire award.
The fair value of each common stock option award granted in 2015, 2014 and 2013 was estimated on the respective grant date using the Black-Scholes option-pricing model and the assumptions noted in the following table. The risk-free rate is based on the zero-coupon U.S. Treasury rate in effect at the time of grant, with a term equal to the expected life of the options. The Company uses its post-February 2006 initial public offering volatility to estimate volatility assumptions for each year. The expected option life represents the period of time that the options granted are expected to be outstanding and is based on historical experience. The expected dividend yield is estimated based on the Company’s historical and expected dividend yields at the date of the grant.
67
2015 | 2014 | 2013 | |||
Risk-free interest rate | 2.0% | 2.4% | 1.3% to 1.5% | ||
Expected volatility | 46.4% | 39.2% to 39.4% | 39.3% to 39.6% | ||
Weighted-average expected volatility | 46.4% | 39.4% | 39.4% | ||
Expected dividend yield | —% | 8.5% to 12.9% | 12.9% to 14.2% | ||
Weighted-average expected dividend yield | —% | 12.6% | 13.5% | ||
Expected term | 5 years | 7 years | 7 years | ||
Total equity-based compensation expense related to all of the Company’s share-based equity awards for the years ended December 31, 2015, 2014 and 2013 and the Company’s 401(k) matching contributions was allocated as follows:
Year Ended December 31, | |||||||||||
(In thousands) | 2015 | 2014 | 2013 | ||||||||
Cost of services | $ | 651 | $ | 593 | $ | 634 | |||||
Customer operations | 615 | 918 | 1,067 | ||||||||
Corporate operations | 2,182 | 1,458 | 3,852 | ||||||||
Equity-based compensation expense | $ | 3,448 | $ | 2,969 | $ | 5,553 | |||||
Future charges for equity-based compensation related to instruments outstanding at December 31, 2015 are estimated to be $1.5 million for 2016, $1.0 million for 2017, $0.2 million in 2018 and less than $0.1 million for 2019.
The summary of the activity and status of the Company’s stock option awards for the year ended December 31, 2015 is as follows:
(In thousands, except per share amounts) | Shares | Weighted Average Exercise Price per Share | Weighted Average Remaining Contractual Term | Aggregate Intrinsic Value | ||||||||
Stock options outstanding at January 1, 2015 | 1,583 | $ | 19.09 | |||||||||
Granted during the period | 261 | 6.00 | ||||||||||
Exercised during the period | 1 | 0.58 | ||||||||||
Forfeited/expired during the period | (298 | ) | 21.13 | |||||||||
Stock options outstanding at December 31, 2015 | 1,547 | $ | 16.50 | 6.5 | $ | — | ||||||
Exercisable at December 31, 2015 | 933 | $ | 20.19 | 5.4 | $ | — | ||||||
Total expected to vest at December 31, 2015 | 552 | $ | 12.10 | |||||||||
The weighted average grant date fair value per share of stock options granted during fiscal years 2015, 2014 and 2013 was $1.72, $1.02 and $0.71, respectively. The total intrinsic value of options exercised during fiscal year 2015 and 2014 was an immaterial amount, with $0.1 million during fiscal year 2013. The total fair value of options that vested during fiscal years 2015, 2014 and 2013 was $0.6 million, $1.5 million and $1.6 million, respectively. As of December 31, 2015, there was approximately $0.5 million of total unrecognized compensation cost related to unvested stock options, which is expected to be recognized over a weighted average period of 2.6 years.
The summary of the activity and status of the Company’s restricted stock awards for the year ended December 31, 2015 is as follows:
(In thousands, except per share amounts) | Shares | Weighted Average Grant Date Fair Value per Share | ||||
Restricted stock awards outstanding at January 1, 2015 | 245 | $ | 14.93 | |||
Granted during the period | 503 | 5.37 | ||||
Vested during the period | (136 | ) | 13.40 | |||
Forfeited during the period | (21 | ) | 11.28 | |||
Restricted stock awards outstanding at December 31, 2015 | 591 | $ | 7.30 | |||
68
As of December 31, 2015, there was $1.9 million of total unrecognized compensation cost related to unvested restricted stock awards, which is expected to be recognized over a weighted average period of 1.9 years. The fair value of the restricted stock award is equal to the market value of common stock on the date of grant.
The summary of the activity and status of the Company’s performance stock unit awards for the year ended December 31, 2015 is as follows:
(In thousands, except per share amounts) | Shares | Weighted Average Grant Fair Value per Share | ||||
Performance stock units outstanding at January 1, 2015 | 99 | $ | 11.24 | |||
Granted during the period | 28 | 7.33 | ||||
Vested during the period | (47 | ) | 12.78 | |||
Forfeited during the period | (10 | ) | 11.22 | |||
Performance stock units outstanding at December 31, 2015 | 70 | $ | 8.62 | |||
At December 31, 2015, there was $0.3 million of total unrecognized compensation cost related to unvested PSUs, which is expected to be recognized over a weighted average period of 1.5 years. The fair value of the PSU is estimated at the grant date using a Monte Carlo simulation model.
In addition to the Equity Incentive Plans discussed above, the Company has an employee stock purchase plan, which commenced in July 2006 with 100,000 shares available. Shares purchased under this plan have been issued from the treasury stock balance. If treasury shares are not available, new common shares have been issued for purchases under this plan. Shares are priced at 85% of the closing price on the last trading day of the month and settlement is done semi-annually. During fiscal years 2015, 2014 and 2013, 7,814 shares, 4,669 shares and 6,183 shares, respectively, were issued under the employee stock purchase plan. Compensation expense associated with the employee stock purchase plan for fiscal years 2015, 2014 and 2013 was immaterial.
Note 14. Income Taxes
The components of income tax expense from continuing operations are as follows for the years ended December 31, 2015, 2014 and 2013:
(In thousands) | 2015 | 2014 | 2013 | ||||||||
Current tax expense: | |||||||||||
Federal | $ | 466 | $ | 508 | $ | 1,159 | |||||
State | 865 | 359 | 560 | ||||||||
1,331 | 867 | 1,719 | |||||||||
Deferred tax expense: | |||||||||||
Federal | 1,452 | 412 | 12,002 | ||||||||
State | (596 | ) | (532 | ) | 2,406 | ||||||
856 | (120 | ) | 14,408 | ||||||||
$ | 2,187 | $ | 747 | $ | 16,127 | ||||||
69
Total income tax expense was different than an amount computed by applying the graduated statutory federal income tax rates to income before taxes. The reasons for the differences are as follows for the years ended December 31, 2015, 2014 and 2013:
(In thousands) | 2015 | 2014 | 2013 | ||||||||
Computed tax expense at statutory federal rate of 35% | $ | 369 | $ | 1,375 | $ | 13,936 | |||||
Nondeductible merger expenses | 1,313 | — | — | ||||||||
Equity-based compensation | 444 | (364 | ) | — | |||||||
Nondeductible compensation | 47 | 87 | 273 | ||||||||
Noncontrolling interests | (409 | ) | (514 | ) | (721 | ) | |||||
State income taxes, net of federal income tax benefit | 175 | 112 | 1,928 | ||||||||
Other | 248 | 51 | 711 | ||||||||
$ | 2,187 | $ | 747 | $ | 16,127 | ||||||
During 2015, the Company recognized $0.4 million of tax expense related to equity-based compensation shortfalls in net income from continuing operations. In 2014, the Company recognized the benefit of $0.4 million of equity-based compensation deductions in continuing operations that previously were not recognizable under ASC 718. In addition, during 2014 and 2013, the Company recognized a tax expense of approximately $1.0 million and $0.7 million, respectively, in stockholders’ equity associated with equity-based compensation. Deferred tax assets are not recognized for net operating loss carry-forwards resulting from excess benefits related to equity compensation. During 2015, 2014 and 2013, the Company recognized a tax expense of $1.2 million, $5.0 million and $3.5 million, respectively, in accumulated other comprehensive loss associated with the adjustments to various employee benefit plan liabilities in accordance with ASC 715.
Income tax expense (benefit) allocated to other items was as follows for the years ended December 31, 2015, 2014 and 2013:
(In thousands) | 2015 | 2014 | 2013 | ||||||||
Discontinued operations | $ | (6,880 | ) | $ | (33,641 | ) | $ | 2,417 | |||
Net deferred income tax assets and liabilities consist of the following components as of December 31, 2015 and 2014:
(In thousands) | 2015 | 2014 | |||||
Deferred income tax assets | |||||||
Retirement benefits other than pension | $ | 1,294 | $ | 1,232 | |||
Pension and related plans | 6,256 | 7,158 | |||||
Net operating loss | 33,908 | 46,264 | |||||
Accrued expenses | 3,746 | 3,548 | |||||
Other | 4,160 | 3,153 | |||||
49,364 | 61,355 | ||||||
Deferred income tax liabilities | |||||||
Property and equipment | 44,234 | 45,011 | |||||
Intangible assets | 883 | 1,009 | |||||
Licenses | 13,782 | 13,660 | |||||
58,899 | 59,680 | ||||||
Deferred income tax asset (liability), net | $ | (9,535 | ) | $ | 1,675 | ||
The Company has certain Federal prior year unused NOLs, including certain built-in losses that are subject to limitations imposed by the Internal Revenue Code of 1986, as amended (“IRC”) Section 382. These prior year NOLs are subject to an adjusted annual maximum limit (the “IRC 382 Limit”) of approximately $8.9 million. Based on the IRC 382 Limit, the Company expects that $85.4 million of these prior year NOLs will be available to the Company as follows: $8.9 million in 2016 through 2024, $4.9 million in 2025 and $0.4 million in 2026. The Company also has certain state NOLs that will be available to the Company substantially similar to the Federal NOLs. The Company believes that it is more likely than not that its results of future operations will generate sufficient taxable income to realize the deferred tax assets.
The Company recognizes interest related to unrecognized income tax benefits (“UTBs”) in interest expense and penalties on UTBs in income tax expense. The Company did not have any UTBs as of December 31, 2015 and 2014.
70
While the Company believes it has adequately provided for all tax positions, amounts asserted by taxing authorities could be greater than its accrued position. Accordingly, additional provisions could be recorded in the future as revised estimates are made or the underlying matters are settled or otherwise resolved. In general, the tax years that remain open and subject to federal and state audit examinations are 2012-2015, respectively.
Note 15. Pension Plans and Other Postretirement Benefits
The Company sponsors several qualified and nonqualified pension plans and other postretirement benefit plans for its employees. The following tables provide a reconciliation of the changes in the qualified plans’ benefit obligations and fair value of assets and a statement of the funded status as of and for the years ended December 31, 2015 and 2014, and the classification of amounts recognized in the consolidated balance sheets:
Defined Benefit Pension Plan | Other Postretirement Benefit Plans | ||||||||||||||
(In thousands) | 2015 | 2014 | 2015 | 2014 | |||||||||||
Change in benefit obligations: | |||||||||||||||
Benefit obligations, beginning of period | $ | 38,282 | $ | 27,774 | $ | 3,111 | $ | 1,980 | |||||||
Service cost | — | — | 47 | 40 | |||||||||||
Interest cost | 1,519 | 1,375 | 126 | 98 | |||||||||||
Actuarial (gain) loss | (4,095 | ) | 10,135 | 56 | 805 | ||||||||||
Benefits paid, net | (1,963 | ) | (1,002 | ) | (119 | ) | (26 | ) | |||||||
Benefit obligations transferred | — | — | — | 214 | |||||||||||
Benefit obligations, end of period | $ | 33,743 | $ | 38,282 | $ | 3,221 | $ | 3,111 | |||||||
Change in plan assets: | |||||||||||||||
Fair value of plan assets, beginning of period | $ | 24,718 | $ | 24,610 | $ | — | $ | — | |||||||
Actual return on plan assets | (127 | ) | 1,148 | — | — | ||||||||||
Employer contributions | — | — | 192 | 102 | |||||||||||
Benefits paid | (2,021 | ) | (1,040 | ) | (192 | ) | (102 | ) | |||||||
Fair value of plan assets, end of period | $ | 22,570 | $ | 24,718 | $ | — | $ | — | |||||||
Funded status: | |||||||||||||||
Total liability, end of period | $ | (11,173 | ) | $ | (13,564 | ) | $ | (3,221 | ) | $ | (3,111 | ) | |||
The accumulated benefit obligation for the defined benefit pension plan at December 31, 2015 and 2014 was $33.7 million and $38.3 million, respectively. The accumulated benefit obligation represents the present value of pension benefits based on service and salary earned to date. The defined benefit plan was frozen for future benefit accruals as of December 31, 2012. Accordingly, the accumulated benefit obligation is equal to the projected benefit obligation.
The following table provides the components of net periodic benefit cost for the plans for the years ended December 31, 2015, 2014 and 2013:
Defined Benefit Pension Plan | Other Postretirement Benefit Plans | ||||||||||||||||||||||
(In thousands) | 2015 | 2014 | 2013 | 2015 | 2014 | 2013 | |||||||||||||||||
Components of net periodic benefit cost: | |||||||||||||||||||||||
Service cost | $ | — | $ | — | $ | — | $ | 47 | $ | 40 | $ | 54 | |||||||||||
Interest cost | 1,519 | 1,375 | 1,325 | 153 | 122 | 78 | |||||||||||||||||
Recognized net actuarial loss | 523 | — | 131 | 192 | 102 | 16 | |||||||||||||||||
Expected return on plan assets | (1,770 | ) | (1,886 | ) | (1,595 | ) | — | — | — | ||||||||||||||
Net periodic benefit cost | $ | 272 | $ | (511 | ) | $ | (139 | ) | $ | 392 | $ | 264 | $ | 148 | |||||||||
Prior service costs are amortized on a straight-line basis over the average remaining service period of active participants. Gains and losses in excess of 10% of the greater of the benefit obligation and the market-related value of assets are amortized over the average remaining service period of active participants.
Unrecognized actuarial (gains)/losses in 2015 were $(2.1) million and $0.1 million for the defined benefit pension plan and the other postretirement benefit plans, respectively. The total amount of unrecognized actuarial (gain)/loss recorded in accumulated
71
other comprehensive loss at December 31, 2015 related to these respective plans was $4.4 million, net of a $(2.7) million deferred tax asset, and $0.7 million, net of a $(0.5) million deferred tax asset.
The total amount reclassified out of accumulated other comprehensive loss related to actuarial losses from the defined benefit plans was $0.2 million, $0.1 million, and $0.3 million for the three years ended December 31, 2015, 2014, and 2013, respectively, all of which has been reclassified to cost of services, customer operations, and corporate operations on the consolidated statement of operations for the respective periods.
The assumptions used in the measurements of the Company’s benefit obligations at December 31, 2015 and 2014 are shown in the following table:
Defined Benefit Pension Plan | Other Postretirement Benefit Plans | ||||||||||
2015 | 2014 | 2015 | 2014 | ||||||||
Discount rate | 4.35 | % | 4.00 | % | 4.35 | % | 4.10 | % | |||
The assumptions used in the measurements of the Company’s net cost for the consolidated statement of operations for the years ended December 31, 2015, 2014 and 2013 are:
Defined Benefit Pension Plan | Other Postretirement Benefit Plans | ||||||||||||||||
2015 | 2014 | 2013 | 2015 | 2014 | 2013 | ||||||||||||
Discount rate | 4.00 | % | 5.00 | % | 4.15 | % | 4.10 | % | 5.00 | % | 4.15 | % | |||||
Expected return on plan assets | 6.75 | % | 7.25 | % | 7.75 | % | — | — | — | ||||||||
Rate of compensation increase | — | — | — | — | — | — | |||||||||||
The Company reviews the assumptions noted in the above table annually or more frequently to reflect anticipated future changes in the underlying economic factors used to determine these assumptions. The discount rates assumed reflect the rate at which the Company could invest in high quality corporate bonds in order to settle future obligations. In doing so, the Company utilizes a Citigroup Pension Discount Curve applied against the Company’s estimated defined benefit payments to derive a blended rate. The Citigroup Pension Discount Curve is derived from over 350 Aa rated corporate bonds. The Company also compares this to a Moody’s ten-year Aa rated bond index for reasonableness.
In 2014, the Company adopted updated mortality tables published by the Society of Actuaries that predict increasing life expectancies in the United States. Additionally, the Company updated the discount rate as discussed above. Mortality and discount rate changes increased the benefit obligations approximately $2.4 million and $7.1 million, respectively, as of December 31, 2014.
For measurement purposes, a 8.0% annual rate of increase in the per capita cost of covered health care benefits was assumed for 2016 for the obligation as of December 31, 2015. The rate was assumed to decrease one-half percent per year to a rate of 5.0% for 2022 and remain at that level thereafter.
Assumed health care cost trend rates may have a significant effect on the amounts reported for the health care plans. The effect of a 1% change on the medical trend rate per future year, while holding all other assumptions constant, to the service and interest cost components of net periodic postretirement health care benefit costs and accumulated postretirement benefit obligation would be a $0.1 million increase and a $0.6 million increase, respectively, for a 1% increase in medical trend rate and a $0.1 million decrease and a $0.5 million decrease, respectively, for a 1% decrease in medical trend rate.
In developing the expected long-term rate of return assumption for the assets of the Defined Benefit Pension Plan, the Company evaluated input from its third-party pension plan administrator, including its review of asset class return expectations and long-term inflation assumptions. The Company also considered the related historical ten-year average asset return at December 31, 2015 as well as considered input from its third-party pension plan asset managers.
The weighted average actual asset allocations by asset category as of December 31, 2015 and the fair value by asset category as of December 31, 2015 and 2014 were as follows:
72
Actual Allocation as of | Fair Value as of December 31, | |||||||||
Asset Category (dollars in thousands) | December 31, 2015 | 2015 | 2014 | |||||||
Large Cap Value | 17 | % | $ | 3,741 | $ | 4,082 | ||||
Large Cap Blend | 10 | % | 2,179 | 2,347 | ||||||
Large Growth | 16 | % | 3,706 | 4,061 | ||||||
Mid Cap Blend | 9 | % | 2,036 | 2,246 | ||||||
Small Cap Blend | 5 | % | 1,088 | 1,348 | ||||||
Foreign Stock – Large Cap | 20 | % | 4,535 | 4,778 | ||||||
Bond | 19 | % | 4,358 | 4,849 | ||||||
Cash and cash equivalents | 4 | % | 927 | 1,007 | ||||||
Total | 100 | % | $ | 22,570 | $ | 24,718 | ||||
The actual and target allocation for plan assets is broadly defined and measured as follows:
Asset Category | Actual Allocation | Target Allocation | |||
Equity securities | 77 | % | 65-75% | ||
Bond securities and cash equivalents | 23 | % | 25-35% | ||
Total | 100 | % | 100 | % | |
It is the Company’s policy to invest pension plan assets in a diversified portfolio consisting of an array of asset classes. The investment risk of the assets is limited by appropriate diversification both within and between asset classes. The assets are primarily invested in investment funds that invest in a broad mix of publicly traded equities, bonds and cash equivalents (and fair value is based on quoted market prices (“Level 1” input)). The allocation between equity and bonds is reset quarterly to the target allocations. Updates to the allocation are considered in the normal course and changes may be made when appropriate. The bond holdings consist of two bond funds split relatively evenly between these funds at December 31, 2015 and 2014. The maximum holdings of any one asset within these funds is under 4% of this fund and thus is well under 1% of the total portfolio. At December 31, 2015, the Company believes that there are no material concentrations of risk within the portfolio of plan assets.
The assumed long-term return noted above is the target long-term return. Overall return, risk adjusted return, and management fees are assessed against a peer group and benchmark indices. There are minimum performance standards that must be attained within the investment portfolio. Reporting on asset performance is provided quarterly and review meetings are held semi-annually. In addition to normal rebalancing to maintain an adequate cash reserve, projected cash flow needs of the plan are reviewed at least annually to ensure liquidity is properly managed.
The Company does not expect to contribute to the pension plan in 2016. The Company expects the net periodic benefit cost for the defined benefit pension plan in 2016 to be $0.3 million and expects the periodic benefit cost for the other postretirement benefit plans in 2016 to be $0.3 million.
The following estimated future pension benefit payments and other postretirement benefit plan payments which reflect expected future service, as appropriate, are expected to be paid in the years indicated:
(In thousands) | Defined Benefit Pension Plan | Other Postretirement Benefit Plans | |||||
2016 | $ | 636 | $ | 87 | |||
2017 | 700 | 106 | |||||
2018 | 720 | 99 | |||||
2019 | 768 | 99 | |||||
2020 | 868 | 100 | |||||
Aggregate of next five years | 6,219 | 746 | |||||
73
Other Benefit Plans
The Company also sponsors a supplemental executive retirement plan. This nonqualified plan, which has no plan assets, was closed to new participants in 2003. The projected benefit obligation of this nonqualified plan was $7.8 million and $8.3 million at December 31, 2015 and 2014, respectively. The total expense recognized related to this plan was $0.3 million for the year ended December 31, 2015 and $0.4 million for the years ended December 31, 2014 and 2013.
The Company recognized $0.1 million of expense from previously unrecognized loss related to the supplemental executive retirement plan for each of the years ended December 31, 2015, 2014 and 2013. Unrecognized actuarial (gain) loss was $(0.3) million and $1.2 million in 2015 and 2014, respectively. The total balance of unrecognized actuarial losses recorded in accumulated other comprehensive loss at December 31, 2015 and 2014 related to this plan was $2.1 million, net of a $1.3 million deferred tax asset, and $2.3 million, net of a $1.5 million deferred tax asset, respectively. The total expense to be recognized in 2016 for the nonqualified pension plan is approximately $0.4 million and the estimated payments are expected to be approximately $0.5 million.
Estimated future benefit payments are expected to be paid in the years indicated: $0.5 million annually for each of the years 2016 through 2020 and $2.5 million in aggregate for the years 2021 through 2025.
The Company also sponsors a contributory defined contribution plan under IRC Section 401(k) for substantially all employees. The Company’s matching contributions to this plan were $1.0 million, $1.2 million and $1.1 million for the years ended December 31, 2015, 2014 and 2013, respectively. The Company’s policy during these periods was to make matching contributions in shares of the Company’s common stock. All of the matching contributions for 2015, 2014 and 2013 represented equity contributions.
Note 16. Strategic Network Alliance
The Company provides PCS services and has contracted to provide LTE Services on a wholesale basis to other wireless communication providers, most notably through the SNA with Sprint in which the Company is the exclusive PCS/LTE service provider in the Company’s western Virginia and West Virginia service area (“SNA service area”) for all Sprint Code Division Multiple Access (“CDMA”) and LTE wireless customers. In May 2014 the parties entered into an amended agreement to extend the SNA. Pursuant to the terms of the SNA, the Company is required to upgrade its network in the SNA service area to provide LTE Services. As part of the amendment, the Company leases spectrum, on a non-cash basis, from Sprint in order to enhance the PCS/LTE services. The non-cash consideration attributable to the leased spectrum is approximately $4.9 million per year. The lease expense is recognized over the term of the lease and recorded within cost of services, with the offsetting consideration recorded within wholesale and other revenue. Additionally, the amended SNA provides the Company access to Sprint’s nationwide 3G and 4G LTE network at rates that are reciprocal to rates paid by Sprint under the amended SNA. The amended SNA provides that a portion of the amount paid by Sprint thereunder is fixed. The billable fixed fee element of the agreement was reduced pursuant to the amended SNA on August 1, 2015 and again on January 1, 2016. Additional annual reductions will occur on January 1 of each year. The Company accounts for this fixed fee portion of the revenue earned from the SNA revenue on a straight line basis over the term of the agreement. In addition, these reductions are subject to further upward or downward resets in the fixed fee element. These resets, if any, will be recognized in the period in which it occurs.
The Company generated 37.8%, 41.3% and 46.6% of its revenue from the SNA for the years ended December 31, 2015, 2014 and 2013, respectively. Revenues under the SNA have an effective minimum amount of $9.3 million per month subject to annual adjustments.
In September 2013 the Company reached a settlement with Sprint over the disputes related to the SNA. The settlement resolved the open disputes under the SNA, including the data rate reset dispute that began in the fourth quarter 2011 and the unrelated historical billing disputes that were asserted by Sprint in the third quarter 2012. In connection with the settlement, the Company recognized an additional $9.6 million in Operating Income, consisting of a $9.0 million increase in revenue (primarily related to a reversal of the previously disclosed accrual) and a $0.6 million decrease in cost of services, for the year ended December 31, 2013.
74
Note 17. Commitments and Contingencies
Commitments
The Company has various contractual obligations such as purchase commitments and other executory contracts, which may affect its financial condition, but are not recognized as liabilities in its consolidated financial statements. The Company is contractually committed to acquire handsets, network equipment and make certain minimum lease payments for the use of property under operating lease agreements for administrative office space, retail space, tower space and equipment, certain of which have renewal options. The leases for retail and tower space have initial lease periods of one to thirty years. These leases, with few exceptions, provide for automatic renewal options and escalations that are either fixed or based on the consumer price index. Any rent abatements, along with rent escalations, are included in the computation of rent expense calculated on a straight-line basis over the lease term.
The Company’s minimum lease term for most leases includes the initial non-cancelable term plus at least one renewal period, as the exercise of the related renewal option or options based on the premise that failure to renew the leases imposes an economic penalty on the Company in such amount that a renewal appears to be reasonably assured. The Company’s cell site leases generally provide for an initial non-cancelable term of 5 to 7 years with three renewal options of 5 years each. For leases with an initial term of 10 years or greater, the Company includes only the initial lease term. Leasehold improvements are depreciated over the shorter of the assets’ useful life or the lease term, including renewal option periods that are reasonably assured.
Rent expense for all operating leases for the years ended December 31, 2015, 2014 and 2013 was $28.5 million, $24.1 million and $23.7 million, respectively. The following table summarizes the Company’s contractual commitments for future minimum lease payments under non-cancelable operating leases, and commercial commitments for network capital expenditures, handset equipment and other materials to support its operations, at December 31, 2015:
Operating | Purchase | ||||||||||
(In thousands) | Leases | Commitments | Total | ||||||||
2016 | $ | 15,250 | $ | 83,432 | $ | 98,682 | |||||
2017 | 14,069 | — | 14,069 | ||||||||
2018 | 13,153 | — | 13,153 | ||||||||
2019 | 12,340 | — | 12,340 | ||||||||
2020 | 10,963 | — | 10,963 | ||||||||
Thereafter | 51,520 | — | 51,520 | ||||||||
$ | 117,295 | $ | 83,432 | $ | 200,727 | ||||||
The Company has assigned certain leases with lease terms expiring on various dates through 2029 to various third parties. Although the Company is not a guarantor under these leases, it remains secondarily liable for the lease payments for which it was responsible as the original lessee. The maximum potential liability for future rental payments the Company could be required to make under these leases at December 31, 2015 was $1.7 million. The Company does not believe it is probable that it would be required to make any lease payments resulting from its secondary liability for these leases therefore, no liability has been recorded.
Reserve for Contingencies
On occasion, the Company makes claims or receives disputes related to its billings to other carriers, including billings under the SNA agreement, for access to the Company’s network. These disputes may involve amounts which, if resolved unfavorably to the Company, could have a material effect on the Company’s financial statements. The Company does not recognize revenue related to such matters until the period that it is reasonably assured of the collection of these claims. In the event that a claim is made related to revenues previously recognized, the Company assesses the validity of the claim and adjusts the amount of revenue recognized to the extent that the claim adjustment is considered probable and reasonably estimable.
The Company periodically disputes network access charges it is assessed by other companies with which the Company interconnects, and is involved in other disputes, claims, either asserted or unasserted, and legal and tax proceedings and filings arising from normal business activities. While the outcome of such matters is currently not determinable, and it is reasonably possible that the cost to resolve such matters could be material, management believes that adequate provision for any probable and reasonably estimable losses has been made in the Company’s unaudited condensed consolidated financial statements.
In addition, on August 24, 2015, Mr. Marvin Westen and Mr. Paul Sekerak, each filed a purported class action complaint relating to the Merger in the Court of Chancery of the State of Delaware. The Company cannot presently determine the
75
ultimate resolution of this matter nor can it reasonably estimate the range of possible losses.
QUARTERLY FINANCIAL SUMMARY
(Unaudited)
Fiscal Year 2015 | |||||||||||||||
First | Second | Third | Fourth | ||||||||||||
(In thousands, except per share amounts) | Quarter | Quarter | Quarter | Quarter | |||||||||||
Operating Revenues | $ | 95,311 | $ | 91,388 | $ | 88,346 | $ | 87,595 | |||||||
Operating Income (Loss) | 19,802 | 9,568 | 2,617 | (426 | ) | ||||||||||
Income (Loss) from Continuing Operations (1) | 7,038 | 1,095 | (4,228 | ) | (5,040 | ) | |||||||||
Income (Loss) from Discontinued Operations | 8,249 | 787 | (4,498 | ) | (14,441 | ) | |||||||||
Net Income (Loss) Attributable to NTELOS Holdings Corp. (1) | 14,796 | 1,610 | (8,963 | ) | (19,649 | ) | |||||||||
Earnings (Loss) per Share Attributable to NTELOS Holdings Corp. (3) | |||||||||||||||
Basic earnings (loss) per common share from continuing operations | $ | 0.29 | $ | 0.04 | $ | (0.21 | ) | $ | (0.24 | ) | |||||
Basic earnings (loss) per common share from discontinued operations | 0.39 | 0.03 | (0.21 | ) | (0.68 | ) | |||||||||
Basic earnings (loss) per common share | $ | 0.68 | $ | 0.07 | $ | (0.42 | ) | $ | (0.92 | ) | |||||
Diluted earnings (loss) per common share from continuing operations | $ | 0.27 | $ | 0.04 | $ | (0.21 | ) | $ | (0.24 | ) | |||||
Diluted earnings (loss) per common share from discontinued operations | 0.37 | 0.03 | (0.21 | ) | (0.68 | ) | |||||||||
Diluted earnings (loss) per common share | $ | 0.64 | $ | 0.07 | $ | (0.42 | ) | $ | (0.92 | ) | |||||
Fiscal Year 2014 | |||||||||||||||
First | Second | Third | Fourth | ||||||||||||
Quarter | Quarter | Quarter | Quarter | ||||||||||||
Operating Revenues | $ | 89,166 | $ | 86,125 | $ | 88,191 | $ | 96,652 | |||||||
Operating Income | 12,635 | 10,232 | 10,064 | 4,811 | |||||||||||
Income (Loss) from Continuing Operations (2) | 2,394 | 1,316 | 1,248 | (1,775 | ) | ||||||||||
Income (Loss) from Discontinued Operations | (672 | ) | (457 | ) | (92 | ) | (54,128 | ) | |||||||
Net Income (Loss) Attributable to NTELOS Holdings Corp. (2) | 1,286 | 484 | 804 | (56,208 | ) | ||||||||||
Earnings (Loss) per Share Attributable to NTELOS Holdings Corp. (3) | |||||||||||||||
Basic earnings (loss) per common share from continuing operations | $ | 0.09 | $ | 0.05 | $ | 0.04 | $ | (0.10 | ) | ||||||
Basic earnings (loss) per common share from discontinued operations | (0.03 | ) | (0.03 | ) | — | (2.56 | ) | ||||||||
Basic earnings (loss) per common share | $ | 0.06 | $ | 0.02 | $ | 0.04 | $ | (2.66 | ) | ||||||
Diluted earnings (loss) per common share from continuing operations | $ | 0.09 | $ | 0.04 | $ | 0.04 | $ | (0.10 | ) | ||||||
Diluted earnings (loss) per common share from discontinued operations | 0.03 | (0.02 | ) | — | (2.56 | ) | |||||||||
Diluted earnings (loss) per common share | $ | 0.06 | $ | 0.02 | $ | 0.04 | $ | (2.66 | ) | ||||||
(1) | Results for the fourth quarter of fiscal year 2015 include decreased retail revenue due to continued adoption of lower rate plans and EIP service plan discounts and increased network costs to support additional capacity for our 4G LTE expansion. |
(2) | Results for the fourth quarter of fiscal year 2014 include increased equipment revenue from EIP and the impairment and restructuring costs associated with the sale of the spectrum and the wind down of our operations in our Eastern Markets. |
(3) | Per share amounts may not agree to annual amounts due to rounding. |
76
Item 9. | Changes in and Disagreements with Accountants on Accounting and Financial Disclosure. |
None.
Item 9A. | Controls and Procedures. |
Conclusion Regarding the Effectiveness of Disclosure Controls and Procedures
Under the supervision and with the participation of our management, including our principal executive officer and principal financial officer, we conducted an evaluation of the effectiveness of the design and operation of our disclosure controls and procedures, as defined in Rules 13a-15(e) and 15d-15(e) under the Exchange Act, as of the end of the period covered by this report. Based on this evaluation, our principal executive officer and our principal financial officer concluded that, as of the end of the period covered by this report, our disclosure controls and procedures are effective to ensure that the information required to be disclosed by us in the reports that we file or submit under the Exchange Act, is recorded, processed, summarized and reported, within the time periods specified in the SEC’s rules and forms, and that such information is accumulated and communicated to our management, including our principal executive officer and our principal financial officer, as appropriate, to allow timely decisions regarding required disclosures. Management’s report on internal control over financial reporting is included below.
The effectiveness of our internal control over financial reporting as of December 31, 2015 has been audited by KPMG LLP, an independent registered public accounting firm, as stated in their report, indicated below.
Management’s Annual Report on Internal Control over Financial Reporting
Our management is responsible for establishing and maintaining adequate internal control over financial reporting as defined in Exchange Act Rule 13a-15(f) and 15d-15(f). Our internal control over financial reporting is a process designed to provide reasonable assurance regarding the reliability of financial reporting and the preparation of financial statements for external purposes in accordance with accounting principles generally accepted in the United States. Our internal control over financial reporting includes those policies and procedures that (i) pertain to the maintenance of records that, in reasonable detail, accurately and fairly reflect the transactions and dispositions of assets; (ii) provide reasonable assurance that transactions are recorded as necessary to permit preparation of financial statements in accordance with accounting principles generally accepted in the United States, and that receipts and expenditures of the Company are being made only in accordance with management’s and our directors’ authorizations; and (iii) provide reasonable assurance regarding prevention or timely detection of unauthorized acquisition, use, or disposition of our assets that could have a material effect on the financial statements.
Under the supervision and with the participation of our management, including our principal executive officer and principal financial officer, we conducted an evaluation of the effectiveness of our internal control over financial reporting as of December 31, 2015. In making this assessment, management used the criteria for effective internal control over financial reporting described in “Internal Control-Integrated Framework (2013)” set forth by the Committee of Sponsoring Organizations of the Treadway Commission (COSO). Based on the assessment, management concluded that, as of December 31, 2015, the Company’s internal control over financial reporting was effective to provide reasonable assurances regarding the reliability of financial reporting and the preparation of financial statements for external purposes in accordance with generally accepted accounting principles in the United States. The conclusion of our principal executive officer and principal financial officer is based on the recognition that there are inherent limitations in all systems of internal control. Because of its inherent limitations, internal control over financial reporting may not prevent or detect misstatements. Also, projections of any evaluation of effectiveness to future periods are subject to the risk that controls may become inadequate because of changes in conditions, or that the degree of compliance with the policies or procedures may deteriorate.
Changes in Internal Control over Financial Reporting
There were no changes in our internal control over financial reporting (as such term is defined in Exchange Act Rule 13a-15(f)) that occurred during the three months ended December 31, 2015 that have materially affected, or are reasonably likely to materially affect, our internal control over financial reporting.
77
Report of Independent Registered Public Accounting Firm
The Board of Directors and Stockholders
NTELOS Holdings Corp.:
We have audited NTELOS Holdings Corp.’s internal control over financial reporting as of December 31, 2015, based on criteria established in Internal Control - Integrated Framework (2013) issued by the Committee of Sponsoring Organizations of the Treadway Commission (COSO). NTELOS Holdings Corp.’s management is responsible for maintaining effective internal control over financial reporting and for its assessment of the effectiveness of internal control over financial reporting, included in the accompanying Management’s Annual Report on Internal Control over Financial Reporting. Our responsibility is to express an opinion on the Company’s internal control over financial reporting based on our audit.
We conducted our audit in accordance with the standards of the Public Company Accounting Oversight Board (United States). Those standards require that we plan and perform the audit to obtain reasonable assurance about whether effective internal control over financial reporting was maintained in all material respects. Our audit included obtaining an understanding of internal control over financial reporting, assessing the risk that a material weakness exists, and testing and evaluating the design and operating effectiveness of internal control based on the assessed risk. Our audit also included performing such other procedures as we considered necessary in the circumstances. We believe that our audit provides a reasonable basis for our opinion.
A company’s internal control over financial reporting is a process designed to provide reasonable assurance regarding the reliability of financial reporting and the preparation of financial statements for external purposes in accordance with generally accepted accounting principles. A company’s internal control over financial reporting includes those policies and procedures that (1) pertain to the maintenance of records that, in reasonable detail, accurately and fairly reflect the transactions and dispositions of the assets of the company; (2) provide reasonable assurance that transactions are recorded as necessary to permit preparation of financial statements in accordance with generally accepted accounting principles, and that receipts and expenditures of the company are being made only in accordance with authorizations of management and directors of the company; and (3) provide reasonable assurance regarding prevention or timely detection of unauthorized acquisition, use, or disposition of the company’s assets that could have a material effect on the financial statements.
Because of its inherent limitations, internal control over financial reporting may not prevent or detect misstatements. Also, projections of any evaluation of effectiveness to future periods are subject to the risk that controls may become inadequate because of changes in conditions, or that the degree of compliance with the policies or procedures may deteriorate.
In our opinion, NTELOS Holdings Corp. maintained, in all material respects, effective internal control over financial reporting as of December 31, 2015, based on criteria established in Internal Control - Integrated Framework (2013) issued by the Committee of Sponsoring Organizations of the Treadway Commission.
We also have audited, in accordance with the standards of the Public Company Accounting Oversight Board (United States), the consolidated balance sheets of NTELOS Holdings Corp. as of December 31, 2015 and 2014, and the related consolidated statements of operations, comprehensive income (loss), cash flows, and changes in stockholders’ equity (deficit) for each of the years in the three-year period ended December 31, 2015, and our report dated March 11, 2016 expressed an unqualified opinion on those consolidated financial statements.
/s/ KPMG LLP |
Richmond, Virginia |
March 11, 2016 |
Item 9B. | Other Information. |
None.
78
PART III
Item 10. | Directors, Executive Officers and Corporate Governance. |
The Board of Directors
The following are the directors of the Company who hold office until the 2016 Annual Meeting of Stockholders and such director's successor has been duly elected and qualified or until the earlier of such director's death, resignation or removal in the manner described in our bylaws.
David A. Chorney, age 39, has been a director since July 2013. Mr. Chorney has been a Vice President of Quadrangle Group LLC since June 2013. Before joining Quadrangle Group LLC, Mr. Chorney was a Vice President at Credit Suisse Group AG in the Technology, Media & Telecom (TMT) group, having joined the investment banking division in New York in 2007. From 2003-2007, he practiced as a corporate attorney at Paul, Weiss, Rifkind, Wharton & Garrison LLP as a member of the firm's Mergers & Acquisitions group.
Mr. Chorney's experience and knowledge of the operations of telecommunications companies, industry trends, financial analysis and accounting, as well as his mergers and acquisitions and capital markets experience, represent key skills that he brings to our Board of Directors.
Rodney D. Dir, age 58, has been a director since October 2011. Mr. Dir has served as the Company's Chief Executive Officer pursuant to multiple Professional Services Agreements since February 2015. Mr. Dir served as the Company's President and Chief Operating Officer pursuant to a Professional Services Agreement from July 2014 until February 2015. Prior to his appointment, Mr. Dir had been the President and Chief Executive Officer of Spectrum Bridge, Inc., a wireless spectrum management company, from May 2011 to February 2014. From 2007 to 2011, he served as the Chief Operating Officer of Firethorn Holdings, Inc., a privately held provider of mobile banking and mobile commerce services, which was acquired by Qualcomm Incorporated as a wholly owned subsidiary in 2007. From 2005 to 2007, he served as the Chief Operating Officer of Cincinnati Bell, Inc., a publicly traded company and provider of telecommunication services. Between 1984 and 2005, Mr. Dir served in various positions having increasing levels of responsibility with various telecom companies, including T-Mobile, Powertel and GTE.
Mr. Dir brings to our Board experience gained from holding senior leadership positions with both publicly traded and privately held companies in the telecommunications industry. His executive experience with the financial and operational aspects of those companies and his deep industry experience is extremely valuable to the Board.
Stephen C. Duggan, age 50, has been a director since November 2012. Mr. Duggan serves as the Vice President & General Manager, Global Business Services of Viacom, Inc., a publicly traded global entertainment company, where he also previously served, from 2012 through 2013, as a Senior Director, Service Management. From 2010-2011, he was President and then President & Chief Executive Officer, of Athlon Sports Communications, Inc., a privately held multi-platform media and sports marketing company. He also served as a director of Athlon Sports until August 2012. Prior to Athlon, he served as the Chief Executive Officer of Alpha Media Group, Inc. from 2008 to 2009, and served as its Chief Operating Officer and Chief Financial Officer earlier in 2008. From 2003 to 2008, Mr. Duggan was the Chief Operating Officer, Chief Financial Officer and Secretary of Publishing Group of America, Inc., and served as its Senior Vice President and Chief Financial Officer from 1999 to 2003. Mr. Duggan served on the Board of Directors and was the Chairman of the Audit Committee of Questex Media Group, Inc., a privately held global business to business communications company, from 2009 to 2014.
Mr. Duggan's operating experience as a chief executive officer in the media sector provides our Board of Directors with valuable perspectives on financial and operational issues in a closely related sector, and his experience as a chief financial officer has given him expertise to serve as the chairman of our Audit Committee and to be one of its financial experts and also provides our Board of Directors additional expertise on financial reporting and corporate finance matters.
Michael Gottdenker, age 51, has been a director since February 2015. Mr. Gottdenker is and has been the Chairman and Chief Executive Officer of Hargray Communications Group since 2007. Mr. Gottdenker is and has been Chairman and Chief Executive Officer of Access Spectrum, LLC since 2001, and previously served as President and Chief Executive Officer of Commonwealth Telephone Enterprises, Inc.; in a variety of executive positions at Revlon Consumer Products Corporation; and as an investment banker in the Corporate Finance and Real Estate Finance departments of Salomon Brothers Inc. Mr. Gottdenker was a member of the Board of Directors of Woodmont Holdings Inc. and its Chief Executive Officer in 2007, when that company filed a voluntary petition under provisions of Chapter 7, title 11 of the United States Code.
79
With his years of experience in the telecommunications industry, Mr. Gottdenker brings valuable operating and sales perspective in the telecom industry that is critical to our Board of Directors in understanding and evaluating our business. Mr. Gottdenker serves on the Compensation Committee of the Board.
Daniel J. Heneghan, age 60, has been a director since February 2006. Mr. Heneghan serves as an advisor to the semiconductor industry. Mr. Heneghan previously held the position of Vice President and Chief Financial Officer of Intersil Corporation, a high-performance analog and mixed-signal integrated circuit company, from its inception in August 1999 until June 2005. From 1980 until 1999, he held various management positions in finance, information technology, purchasing and operations for Harris Corporation, an international communications and information technology company serving government and commercial markets, including the position of Vice President and Controller of Harris Semiconductor Corporation, which he held from 1996 until leaving the company. Mr. Heneghan presently serves on the Board of Directors and Audit Committee of Pixelworks, Inc. Mr. Heneghan also served on the Board of Directors of Freescale Semiconductor, Inc. until December 2015, and on the Board of Directors of Micrel, Inc. until August 2015.
Mr. Heneghan brings to our Board of Directors experience gained from holding senior leadership and board positions with publicly traded companies in the semiconductor industry. His experience as Chief Financial Officer of Intersil Corporation and service on the audit committees of the other public companies has given him financial expertise to serve as one of our Audit Committee financial experts and provides experience that is particularly valuable to his service on the Audit Committee. He has also gained experience in risk management through his past leadership positions, which is essential to both the Audit Committee and the Board of Directors. Mr. Heneghan also serves on the Nominating and Governance Committee.
Michael Huber, age 47, has been a director since April 2005, and has been Chairman of the Board of Directors since December 2009. Since January 2004, Mr. Huber has served as a Managing Principal of Quadrangle Group LLC, a private investment firm, and since January 2010, Mr. Huber also has served as President of Quadrangle. Mr. Huber serves on the Boards of Directors of Data & Audio-Visual Enterprises Holdings Inc., West Corporation, and Tower Vision Mauritius Limited and as a managing member of Access Spectrum LLC and of Hargray Holdings LLC. Mr. Huber is also a member of the Board of Trustees of Macalester College. Mr. Huber served on the Board of Directors of Lumos Networks Corp. until July 2014.
Mr. Huber's leadership position with a private investment firm that focuses on the telecommunications industry provides experience that is valuable in understanding and evaluating our business. His experience working with a number of Quadrangle's portfolio companies, including serving on the Boards of Directors and on the Compensation Committees of a number of telecommunications companies and decision making on executive compensation, is especially valuable to our Board of Directors in guiding the direction of our business and the compensation of our executives. He also has extensive experience in mergers and acquisitions and capital markets activities. Mr. Huber's skills and experience have positioned him to bring experience and industry knowledge to his position of Chairman of the Board and as Chairperson of the Compensation Committee.
Ruth Sommers, age 53, has been a director since October 2014. Ms. Sommers has served as the Chief Operating Officer of David Yurman Enterprises LLC, a privately-held American designer jewelry company, since August 2012. From 2009 to 2013, she was the owner and founder of Noi Solutions LLC, a consulting and full-service agent services firm. From 2008 to 2009, she served as Chief Sourcing and Production Officer of American Eagle Outfitters, Inc., a global specialty retailer of clothing, accessories and personal care products.
Ms. Sommers' retail operational experience and knowledge are key skills that she brings to our Board of Directors. Ms. Sommers serves on the Compensation Committee.
Ellen O'Connor Vos, age 60, has been a director since October 2011. Ms. Vos is, and has been since 1989, the Chief Executive Officer of Grey Healthcare Group, a healthcare advertising and communications company and has been its President and Chief Executive Officer since 1994. Ms. Vos presently serves on the Board of Directors of OptimizeRX Corporation. Previously, she held officer positions with Phase Five Communications, a medical education firm, of which she was also the founder, and with Pfizer Inc. Ms. Vos previously served on the compensation committee of Vogel Farina LLC, a privately held pharmaceutical communications firm, affiliated with Grey Healthcare Group.
Ms. Vos's extensive executive experience and knowledge in the areas of marketing and communications, particularly digital communications, are some of the key skills that she brings to our Board of Directors. Ms. Vos's executive leadership roles have provided her the experience on governance to serve as the Chairperson of the Nominating and Governance Committee. Ms. Vos's executive experience, including her oversight of financial statement preparation at Grey Healthcare Group, makes her a valuable member of the Audit Committee.
There are no familial relationships among our directors and officers.
80
The Executive Officers
Our executive officers serve at the discretion of the Board of Directors, and serve until such officer's successor is appointed and qualified or until his earlier death, resignation or removal. Our executive officers are: Rodney D. Dir, Stebbins B. Chandor Jr., S. Craig Highland, Robert L. McAvoy Jr. and Brian J. O'Neil. The following sets forth biographical information for our executive officers who are not directors. Biographical information for Rodney D. Dir, who is also a director, is provided above.
Stebbins B. Chandor Jr., age 55, has been our Executive Vice President since September 2011, and our Executive Vice President, Chief Financial Officer, Treasurer and Assistant Secretary since October 2011. Mr. Chandor previously served as Executive Vice President and Chief Financial Officer of iPCS, Inc., a publicly traded wireless telecommunications company, from 2004 to 2009. Previously Mr. Chandor served in other executive management positions with iPCS and with Metro One Telecommunications, Inc. From 1985 to 1995, Mr. Chandor served in various corporate finance capacities with BA Securities, Inc., a wholly owned subsidiary of BankAmerica Corporation, and affiliated or predecessor firms.
S. Craig Highland, age 49, has been our Senior Vice President, Finance and Corporate Development and Assistant Treasurer since November 2011. He served as our Vice President, Tax and Corporate Development from 2003 until 2011, Director, Tax Policy and Corporate Development from 2000 through 2003 and as Tax Manager from 1998 to 2000. Prior to joining the Company, Mr. Highland served as a Tax and Audit Manager for McGladrey & Pullen, L.L.P. from 1993 to 1998 and with Erny & Mason, P.C. from 1988 to 1993.
Robert L. McAvoy Jr., age 49, has been our Executive Vice President and Chief Technology Officer since July 2013. He previously served as our Senior Vice President, Engineering and Operations from 2008 to July 2013, Vice President, Engineering and Operations from 2002 to 2008 and as Vice President, Network Operations from 2000 to 2002. Mr. McAvoy served in various management roles with PrimeCo from 1995 until 2000. He previously worked with Bell Atlantic Mobile Systems from 1988 until 1995 in various engineering and operations roles.
Brian J. O'Neil, age 55, has been our Executive Vice President, General Counsel and Secretary since July 2012. He joined the Company in September 2011 as Senior Vice President, General Counsel and Secretary. Previously, Mr. O'Neil served as Senior Vice President, General Counsel and Secretary of iPCS, Inc., a publicly traded wireless telecommunications company, from 2008 to 2010. Mr. O'Neil served in the office of the general counsel at Accenture Ltd (now Accenture plc), a publicly traded, global management consulting, technology services and outsourcing company, from 2001 to 2008. From 1994 until 2001, Mr. O'Neil was a partner in the corporate and securities practice at the law firm of Schwartz Cooper Chartered (now Dykema Gossett PLLC) in Chicago, Illinois, and from 1986 until 1994, he practiced in the corporate finance group at the law firm of Chapman and Cutler LLP in Chicago, Illinois.
Compliance with Section 16(a) of the Exchange Act
Section 16(a) of the Exchange Act requires our directors, executive officers and persons who own beneficially more than 10% of our Common Stock to file reports of ownership and changes in ownership of such stock with the SEC and NASDAQ. These persons are also required by SEC regulations to furnish us with copies of all such forms they file. To our knowledge, based solely on a review of the copies of such reports furnished to us and written representations that no other reports were required, all persons subject to the reporting requirements of Section 16(a) filed the required reports on a timely basis for the year ended December 31, 2015.
Information About our Audit Committee
The Board of Directors has a separately designated standing Audit Committee. The members of the Audit Committee are Messrs. Duggan (Chairperson), and Heneghan and Ms. Vos. The Board of Directors has determined that Messrs. Duggan (Chairperson), and Heneghan are "audit committee financial experts" under the regulations promulgated by the Securities and Exchange Commission (the "SEC"). The Board of Directors has also determined that each of the directors serving on our Audit Committee is "independent" within the meaning of the applicable rules of the SEC and the NASDAQ Listing Rules and financially literate within the meaning of the NASDAQ Listing Rules.
Code of Business Conduct and Ethics
We have also adopted a Code of Business Conduct and Ethics for directors, officers and employees. A copy of this code may be found at the following website, http://ir.ntelos.com/governance-docs.
81
Director Nominations
No material changes have been made to the procedures by which security holders may recommend nominees to our Board.
Item 11. | Executive Compensation. |
EXECUTIVE COMPENSATION
Compensation Discussion and Analysis
Named Executive Officers. For purposes of disclosure in this Annual Report on Form 10-K, the "Named Executive Officers" (or "NEOs") for the year ended December 31, 2015 include the following persons:
• | Rodney D. Dir, our Chief Executive Officer; |
• | Stebbins B. Chandor Jr., our Executive Vice President, Chief Financial Officer, Treasurer and Assistant Secretary; |
• | Brian J. O'Neil, our Executive Vice President, General Counsel and Secretary; |
• | Robert L. McAvoy Jr., our Executive Vice President and Chief Technology Officer; and |
• | S. Craig Highland, our Senior Vice President, Finance and Corporate Development. |
General Philosophy
The objective of our compensation program is to attract, retain and motivate those employees whose judgment, abilities and experience will contribute to our continued success. The program is designed to (1) provide overall competitive pay levels through a mix of base salary, short-term cash incentives and long-term equity compensation and ownership, (2) create proper incentives to align management's cash and equity incentives with the long-term interests of our stockholders, and (3) link compensation to the performance of the Company and the employee. The Compensation Committee of the Board (the "Committee") is responsible for the following:
• | developing, overseeing, and implementing our philosophy with respect to the compensation of executive officers; |
• | determining the compensation and benefits of our executive officers; |
• | reviewing our compensation and benefit plans to ensure that they meet corporate objectives; |
• | selecting compensation consultants and determining the frequency with which they are used; and |
• | administering our stock plans and other incentive compensation plans. |
Results of 2015 Stockholder Advisory Vote on Executive Compensation
We held our annual advisory vote on executive compensation at last year's Annual Meeting of Stockholders, and approximately 96% of the votes cast were in favor of this proposal. The Committee considered this favorable outcome and believes it reflected our stockholders' support of the Committee's decisions and the existing compensation programs for our NEOs. For 2015, the Committee made no material changes in the structure of our NEO compensation programs or compensation philosophy.
Targeted Overall Compensation
We originally entered into a professional services agreement with Mr. Dir that was effective on July 28, 2014 (the "2014 Professional Services Agreement"), pursuant to which Mr. Dir was compensated through January 31, 2015. We subsequently entered into another professional services agreement that was effective on February 1, 2015, (the “2015 Professional Services Agreement,” and collectively with the 2014 Professional Services Agreement, the “Professional Services Agreements”), pursuant to which Mr. Dir was compensated through December 31, 2015. The Professional Services Agreeents are described below in Professional Service Agreements. Each of our other NEOs has an employment agreement with us, as described below in Employment Agreements.
Pursuant to the Professional Services Agreements, Mr. Dir received a base level of compensation, as well as a bonus opportunity and equity-based compensation. The bonus component was based on the achievement of corporate and personal objectives set by the Committee. The bonus component of the 2014 Professional Services Agreement was evaluated as of January 31, 2015, the end of the term of the 2014 Professional Services Agreement, and the bonus component of the 2015 Professional Services Agreement was evaluated as of December 31, 2015, the end of the term of the 2015 Professional Services Agreement. The Company and Mr. Dir entered into a new professional services agreement, effective January 1, 2016 (the "2016
82
Professional Services Agreement"), as described below. The Committee and the Board will review whether to enter into a subsequent agreement with Mr. Dir prior to the termination of the current agreement.
Pursuant to the employment agreements with our other NEOs, each NEO receives a base salary, which is reviewed annually by the Committee. These NEOs are also eligible to participate in the annual short-term incentive plan (referred to as our 2015 Team Incentive Plan (or "TIP"), discussed below in Annual Short-Term Incentive Compensation) with an annual target equal to a specified percentage of base salary. Each of these NEOs has annual corporate and personal goals and objectives, and his performance is evaluated against those goals and objectives to assist in determining his total compensation. Under our compensation structure, the mix of base salary and target short-term incentive compensation varies depending on the employee's level. The Committee also retains the discretion to grant bonuses outside of our TIP. We also have Employee Equity Incentive Plans, discussed below in Long-Term Incentive Compensation, which are used to provide long-term incentives through the issuance of stock options, restricted stock, performance share units ("PSUs"), or other long-term incentives to the NEOs.
In January 2015, the Committee engaged Hay Group, an independent compensation consultant, (the "Consultant"), to perform a study (the "2015 Study") of the compensation of our NEOs benchmarked against comparable senior executives in comparable telecommunications companies (the "Peer Group") and market median information from the Consultant's national compensation database (the "Executive Compensation Report"). The 2015 Study took into account our announced sale of the spectrum covering our Eastern Markets and scheduled shut down of our operations in those markets. The 2015 Study analyzed the base salary, short-term incentives as a percentage of salary, and long-term incentive payouts, and included recommended targets for each of these metrics in order to assist the Committee in determining the appropriate pay-for-performance relationship for each NEO. The 2015 Study also assessed the competitiveness of our historical pay-for-performance incentives. The Committee used the 2015 Study, together with updated data obtained from Equilar Inc. ("Equilar"), a leading provider of executive compensation benchmarking data, in determining 2015 compensation.
After reviewing the Peer Group recommended by the Consultant in the 2015 Study, and reviewing then-current market data obtained from Equilar, the Committee determined that the Peer Group to be used for 2015 for assessing the compensation arrangements of our executive officers would be as set forth in the 2015 Study. The telecommunications companies included in the Peer Group were determined based on a review of revenue, net income, market value of common stock, and number of employees against these same metrics for us, taking into account the anticipated sale of spectrum in and shut down of operations in our eastern Virginia markets.
The Committee approved the use of the following 14 companies as a benchmark for determining our executive officer compensation arrangements for 2015:
• Alaska Communications Systems Group, Inc. • Atlantic Tele-Network, Inc. • CalAmp Corp. • Cbeyond, Inc. • Cincinnati Bell, Inc. • Cogent Communications Group, Inc. • Consolidated Communications Holdings, Inc. | • General Communications, Inc. • Hawaiian Telcom Holdco, Inc. • Inteliquent, Inc. • Iridium Communications Inc. • Shenandoah Telecommunications Company • Spok Holdings, Inc. • Vonage Holdings Corp. |
In addition to base salary and TIP, the NEOs participate in our Amended and Restated Equity Incentive Plan and our 2010 Equity and Cash Incentive Plan (together with the Amended and Restated Equity Incentive Plan, the “Employee Equity Incentive Plans”), and they are entitled to participate in all of our subsidiaries’ employee benefit plans. We also provide other benefits and perquisites, including a monthly automobile allowance offered as a competitive perquisite and a term life insurance policy for each NEO in accordance with his employment agreement.
Committee Process
The Committee designs, evaluates, and approves our executive compensation plans, policies, and programs. In comparing the Company's executive compensation levels to those of its Peer Group, the Committee looked at base salary, cash incentives, other compensation (which includes restricted stock, RSUs, stock options, other types of equity compensation, pensions, and perquisites), and total compensation for 2014 (the most recent year for which information regarding the Peer Group's executive
83
compensation was available). The Committee annually reviews and evaluates the goals and objectives relevant to the compensation of our NEOs and establishes compensation levels and awards accordingly.
The Committee also administers our equity-based compensation plans and deferred compensation plans, and periodically reviews our management "talent" levels and management succession planning.
The Committee is authorized to retain experts, consultants, and other advisors to aid in the discharge of its duties. The Committee reports regularly to the Board of Directors on matters relating to the Committee's responsibilities. The Chairperson of the Committee works in conjunction with our senior management in establishing the agenda for Committee meetings. In addition, the Committee follows regulatory and legislative developments and considers corporate governance best practices in performing its duties.
Deductibility of Compensation
In structuring our compensation programs, we take into account Internal Revenue Code Section 162(m). Under Internal Revenue Code Section 162(m), a limitation is placed on tax deductions of any publicly held corporation for individual compensation to certain executives exceeding $1,000,000 in any taxable year, unless the compensation is performance-based. Although our compensation mix usually results in non-performance-based compensation being below the $1,000,000 threshold, in certain years our executives may have compensation which results in non-deductibility under Internal Revenue Code Section 162(m).
Base Salaries
The 2014 Professional Services Agreement with Mr. Dir, which was effective through January 2015, set forth a base level of compensation at an annualized rate of $400,000. The 2015 Professional Services Agreement with Mr. Dir, which was effective for the remainder of 2015, set forth a base level of compensation of $425,000. The Professional Services Agreements did not provide for any adjustments to the base level of compensation.
With respect to our other NEOs, each such NEO's employment agreement sets forth a base salary, which is subject to annual adjustments as determined by the Committee. The Committee's long-established practice is to adjust compensation (as well as consider current year short-term and long-term incentive grants) for each NEO and all other employees annually in late February or early March, which allows for consideration of the prior year's audited financial results. Annual base salary adjustments, which become effective on the first day of the first pay period ending in April, take into consideration each NEO's performance for the year and are designed to result in an adjusted base salary that is within an acceptable range of the target established by the Committee, which generally represented the median base salary for each NEO's comparable position within the Peer Group.
In March 2015, when determining whether to grant raises to our NEOs, the Committee considered and determined the 2015 annual base salary applicable to each NEO as follows:
2015 | ||||
Named Executive Officer | Base Salary | |||
Stebbins B. Chandor Jr. | $ | 362,457 | ||
Brian J. O'Neil | 309,000 | |||
Robert L. McAvoy Jr. | 280,000 | |||
S. Craig Highland | 199,600 | |||
Annual Short-Term Incentive Compensation
Our practice is to award annual cash incentive payments under our TIP. Participation in the TIP is available to all of our salaried-exempt employees, including our employee NEOs, with a hire date prior to October 1 of the applicable year, except those employees who are covered by a formal sales incentive plan. The TIP award is equal to the product of (1) the individual's eligible base salary earnings for the year, (2) the individual's targeted short-term incentive percentage up to a maximum percentage provided for in the plan (as finally determined based on achievement of individual performance objectives), and (3) our weighted performance achievement percentage. The TIP award gives an eligible participant the potential to receive a lump sum payment on or before March 15th of the following year based on achievement of specified company-wide performance goals and based on achievement of individual performance objectives, which are established at the beginning of the year under circumstances set forth in the annual short-term incentive plan. An eligible employee must achieve at least a
84
minimum overall individual performance rating in order to be eligible for an award under our TIP. The Committee has full discretion to qualify the annual short-term incentive plan, certify that the performance goals have been achieved, terminate the plan, or increase or decrease the funding available to the plan. Additionally, a TIP award may be decreased or an additional TIP award may be authorized by the Committee in its discretion as necessary to support our business needs.
The purpose of the TIP is to focus corporate and individual efforts on the accomplishment of specific financial and operational objectives, and to motivate individual participants to achieve or contribute to these objectives. It also serves to assign an at-risk element to each of our NEO's total compensation based directly on the achievement of desired results.
The Committee determined the 2015 targeted incentive percentages in March 2015 for each of our NEOs by reviewing the median target short-term incentive percentage of the comparable position of the Peer Group. Based on these results, the Committee determined that the current targeted short-term incentive percentages for the executive positions remained competitive; therefore, the 2015 targeted incentive percentages of their eligible base salaries remained unchanged at 60% for Messrs. Chandor, O'Neil, and McAvoy, and 50% for Mr. Highland.
With respect to our weighted performance achievement percentage mentioned above, our performance was measured and weighted based on the following three financial metrics in 2015, as approved by the Committee: (1) Revenues, 30%; (2) Ending Subscribers, 30%; and (3) net income before interest, income taxes, depreciation, and amortization; accretion of asset retirement obligations; separation-related costs; asset impairment charges; and equity-based compensation charges, which we refer to as Adjusted EBITDA, 40%. The Committee selected these metrics after considering the focus on these metrics by the investment community in evaluating the Company and the appropriateness and importance of growth in each of these metrics, as described below.
Adjusted EBITDA is a key metric used by investors to determine if we are generating sufficient cash flows to continue to generate stockholder value, provide liquidity for future growth, and fund any dividends, and the weighting of this metric reflected our continued focus on improving this key metric. We believe Adjusted EBITDA is a meaningful indicator of our performance that provides useful information to investors regarding our financial condition and results of operations. Adjusted EBITDA is a non-GAAP measure commonly used in the communications industry, and by financial analysts and others who follow the industry, to measure operating performance. Adjusted EBITDA should not be construed as an alternative to operating income or cash flows from operating activities (both of which are determined in accordance with Generally Accepted Accounting Principles in the United States) or as a measure of liquidity. We annually reassess the use and weighting of these and other factors.
For the 2015 TIP, the Committee established primary and secondary weighting factors to measure the Company's performance. Our 2015 plan focused primarily on consolidated results, with secondary weighting factors for achievement of individual performance objectives for our NEOs depending on their job function.
The Committee established the target for 100% payout under the 2015 TIP at a level consistent with the 2015 budget. The Committee also set the minimum TIP achievement level to reflect the minimum performance that would result in any TIP payout and the maximum TIP achievement level that would result in a TIP payout at 200% of the targeted achievement level, which was believed to be realizable only upon exceptional over-achievement of our business objectives.
On August 10, 2015, the Company announced that it had entered into the Merger Agreement with Shentel. Given the potential impact of such announcement on the Company’s business, it was determined, as permitted by the TIP, to terminate the performance period as of July 31, 2015, the last full month ending immediately prior to the announcement of the Merger (the “Merger Announcement Measurement Date”). The performance targets used, as contemplated by the TIP for a shortened performance period, were the original month-end budgeted targets through the Merger Announcement Measurement Date. Approximately 58.3% (7/12ths) of the total TIP pool was allocated to payout for certified achievement through the Merger Announcement Measurement Date.
The following table details the minimum, target, and maximum levels that had to be achieved as of the Merger Announcement Measurement Date in order for a 0%, 100%, or 200% payout, respectively, under the 2015 TIP.
Minimum | Target | Maximum | ||||||||||
($ in thousands) | (0% Achievement) | (100% Achievement) | (200% Achievement) | |||||||||
Revenue | $ | 193,390 | $ | 213,390 | $ | 233,390 | ||||||
Adjusted EBITDA | $ | 58,412 | $ | 64,162 | $ | 74,162 | ||||||
Ending Subscribers | 276,998 | 296,998 | 316,998 | |||||||||
85
For the period ending on the Merger Announcement Measurement Date, Revenue and Adjusted EBITDA were $218.0 million and $62.3 million, respectively, and the number of Ending Subscribers was 299,911. This performance resulted in a weighted average performance achievement of 105.6% of these performance goals for the seven-month period ending on the Merger Announcement Measurement Date.
The Committee further determined to pay bonuses to our executives, including our named executive officers, equal to the remaining approximately 41.7% of the 2015 TIP pool, based on factors that the Committee deemed to be especially relevant to our business in light of the Merger announcement for the period after the Merger Announcement Measurement Date through the end of 2015. These factors included maintaining subscriber growth, continued expansion of our 4G LTE network, continued implementation of cost containment initiatives, managing the shut down of our business in the Eastern Markets, and documenting and managing the Merger process.
The blended payout percentage of the certified TIP achievement through Merger Announcement Measurement Date and the other bonuses paid to our executives was 103.3% of the 2015 TIP pool. The individual payouts for each of the NEO’s was as follows:
Named Executive Officer | 2015 TIP & Bonus Payout |
Stebbins B. Chandor Jr. | $213,418 |
Brian J. O'Neil | 182,325 |
Robert L. McAvoy Jr. | 182,221 |
S. Craig Highland | 108,248 |
Long-Term Incentive Compensation
Our Employee Equity Incentive Plans define the incentive arrangements for eligible participants and:
• | authorize the granting of stock options, stock appreciation rights, PSUs, restricted stock, and other incentive awards, all of which may be made subject to the attainment of performance goals established by the Committee; |
• | provide for the enumeration of the business criteria on which an individual's performance goals are to be based; and |
• | establish the maximum share grants or awards (or, in the case of incentive awards, the maximum compensation) that can be paid to a participant in the Employee Equity Incentive Plans. |
The Employee Equity Incentive Plans allow the Committee to award stock options, restricted stock grants, stock appreciation rights, and performance unit awards that are tied to corporate performance because the Committee believes such awards provide an effective means of aligning the interests of management with our stockholders. In 2015, the Committee elected to grant stock options and time-vested restricted stock to our NEOs as the means for providing each of the NEO's long term incentive compensation.
With the exception of certain significant promotions and new hires, we have routinely made these types of awards at a meeting of the Committee held in the first fiscal quarter of each year.
In connection with, and as an inducement to, entering into the 2015 Professional Services Agreement with Mr. Dir, Mr. Dir was awarded 50,000 shares of restricted stock that vested on December 31, 2015. In addition, on March 5, 2015, Mr. Dir was awarded 100,000 options to purchase our Common Stock at a price of $6.00 per share.
In order to determine 2015 LTI targets for our other NEOs, the Committee reviewed each NEO's historic targets, the terms of each NEO's employment, as well as the 2015 Study and updated data from Equilar relative to the Peer Group. After analyzing these benchmarks and factors, the Committee determined that, consistent with past practice, using the ratio of total dollar value of long-term incentive equity awards to base salary that is set forth below would be the most appropriate for determining LTI target value for 2015.
With respect to the qualitative factors discussed above, the Committee took into account the individual responsibilities of each NEO and each NEO's relative experience level. The 2015 LTI target values determined by the Committee for our NEOs (other than Mr. Dir) were the following: $453,071 for Mr. Chandor; $386,250 for Mr. O'Neil; $350,000 for Mr. McAvoy; and
$199,600 for Mr. Highland. The Committee determined that the value of the 2015 equity awards should be divided among
86
restricted stock and stock options. In order to determine the level for each of restricted shares and options granted in March 2015, the Committee divided 80% of the 2015 LTI target value by the average closing stock price of our common stock for the month of February 2015, or $4.79 per share. Accordingly, on March 5, 2015, the Committee approved restricted stock awards for our NEOs, each in the following amounts: 75,670 for Mr. Chandor; 64,509 for Mr. O'Neil; 58,455 for Mr. McAvoy; and 33,336 for Mr. Highland. In order to determine the level of stock options granted on March 5, 2015, the Committee divided 20% of the LTI target value by the Black-Scholes option value, or approximately $1.72. Accordingly, the Committee approved the following stock option awards for the NEOs on March 5, 2015: 52,683 for Mr. Chandor; 44,913 for Mr. O'Neil; 40,698 for Mr. McAvoy; and 23,209 for Mr. Highland. The Committee did not adjust the number of annual LTI equity awards upward or downward based on the closing price of NTELOS common stock on the date of grant; therefore, the dollar value of the LTI grants on the date of grant varied based on changes in the price of NTELOS common stock. The grant date fair value of the annual LTI awards for the NEOs on the March 5, 2015 grant date was: $543,342 for Mr. Chandor; $463,203 for Mr. O'Neil; $419,732 for Mr. McAvoy; and $239,366 for Mr. Highland.
In prior years, the Committee granted performance share units (“PSUs”) to its NEOs. Each outstanding PSU represents the contingent right to receive one share (or more based on maximum achievement) of the Company's common stock if vesting is satisfied. The PSUs have no voting rights. Dividends, if any, that would have been paid on the underlying shares will be paid on vested PSUs on or after the vesting date. These outstanding PSUs become payable upon the Company's achievement of certain performance goals during certain performance periods.
Each outstanding PSU has a three-year performance period, beginning on January 1 of the year in which such PSU was granted and ending on December 31 of the third year, relating to the cumulative total stockholder return for such period ("TSR Performance Goal"). Cumulative total stockholder return equals the percentage increase in the price of a share of common stock, assuming all dividends (paid in cash or other property) are reinvested at the then current market price, between January 1 of the year in which such PSU was granted and December 31 of the third year. The TSR Performance Goal applies to seventy-five percent (75%) of the target number of PSUs for each year. In addition to the TSR Performance Goal, three separate one-year performance periods, each beginning on January 1 and ending on December 31 of each of the calendar years covered by the subject PSU, respectively, to be measured for attainment of performance goals set by the Committee within the first ninety (90) days of each such year ("Annual Operating Goals"). The Annual Operating Goals apply to the remaining twenty-five percent (25%) of the target number of PSUs (one third of the target twenty-five percent (25%) for each calendar year).
Achievement of the TSR Performance Goal component is determined by the Committee following the end of the performance period related thereto. Achievement of the Annual Operating Goals component is determined by the Committee after the conclusion of each respective performance period. Any portion of PSUs that do not vest due to performance below the minimum required level for vesting are forfeited.
The Committee previously set the Annual Operating Goal for calendar year 2015 in respect of all outstanding PSUs as a profitable retail growth metric (defined as the growth in total subscriber revenue minus costs associated with adding new subscribers). On February 29, 2016, the Committee certified the achievement in respect of the Annual Operating Goal for 2015 at 9.9% for all outstanding PSUs and the achievement of the TSR Performance Goal in respect of PSUs granted in 2013 at 0%.
Pursuant to applicable SEC rules, the amounts reflected as stock and option awards in the Summary Compensation Table below include the aggregate grant date fair value of the respective awards granted during the year.
Professional Services Agreements
In order to facilitate an orderly transition following the former Chief Executive Officer’s resignation as President and Chief Executive Officer of the Company on July 27, 2014, the Company entered into the 2014 Professional Services Agreement with Mr. Dir, pursuant to which Mr. Dir was appointed to serve as President and Chief Operating Officer of the Company. The 2014 Professional Services Agreement provided for the following compensation: (i) payment for services at an annualized rate of $400,000; (ii) a bonus target of $150,000 payable after January 31, 2015; (iii) a grant of 12,000 shares of the Company's restricted stock vesting on January 31, 2015; and (iv) a housing and travel allowance. The 2014 Professional Services Agreement also provided for the reimbursement of business expenses and had a term that expired on January 31, 2015.
Effective as of February 1, 2015, the Company and Mr. Dir entered into the 2015 Professional Services Agreement, pursuant to which Mr. Dir was appointed to serve as the Chief Executive Officer of the Company. The Committee and the Board reviewed relevant market data and, following negotiation with Mr. Dir, determined that the following financial terms of the 2015 Professional Services Agreement were appropriate: (i) payment for services at an annualized rate of $425,000; (ii) a bonus target of $300,000, to be awarded at the discretion of the Board after December 31, 2015; (iii) a grant of 50,000 shares
87
of restricted stock, vesting on the earlier of (a) termination of services under the 2015 Professional Services Agreement (other than termination by Mr. Dir without cause or by the Company with cause) or (b) December 31, 2015; and (iv) a housing and travel allowance. The 2015 Professional Services Agreement also provided for a severance payment of $100,000 payable in accordance with the terms thereof, as well as reimbursement of business expenses. On February 29, 2016, the Committee determined that the bonus payable to Mr. Dir was $350,000.
Effective as of January 1, 2016, the Company and Mr. Dir entered into a separate professional services agreement (the "2016 Professional Services Agreement"), pursuant to which Mr. Dir was reappointed to serve as the Chief Executive Officer of the Company. The Committee and the Board reviewed relevant market data and, following negotiation with Mr. Dir, determined that the following financial terms of the 2016 Professional Services Agreement were appropriate: (i) payment for services at an annualized rate of $446,250; (ii) a bonus target of $325,000, which will be awarded at the discretion of the Board at the earlier of the termination of the 2016 Professional Services Agreement following consummation of the Merger and December 31, 2016; (iii) a grant of phantom stock valued at $531,250, and (iv) a housing and travel allowance. The 2016 Professional Services Agreement also provides for a severance payment of $100,000 payable in accordance with the terms thereof, as well as reimbursement of business expenses.
Because Mr. Dir is not an employee of the Company, he does not participate in the Company's 401(k) or health and welfare benefit plans.
Employment Agreements
We entered into employment agreements with each of our NEOs, except Mr. Dir who entered into the Professional Services Agreements and the 2016 Professional Services Agreement described above. The employment agreements for Messrs. Chandor and O'Neil had initial expiration dates of December 31, 2013 and the employment agreement for Messrs. McAvoy and Highland had an initial expiration dates of December 31, 2012. In each case, the employment agreements with our NEOs automatically renew for successive one-year periods pursuant to the terms thereof, unless notice of termination is provided in accordance with the terms thereof. However, if the employment agreement term has less than 24 months remaining upon the occurrence of a "change in control," as such term is defined in the employment agreement, the employment term is automatically extended so that the employment term shall not expire until 24 months following the "change in control." Mr. McAvoy's agreement does not contain an extension in the event of a change of control.
Each of our NEO employment agreements provide that the base salary, TIP participation, and certain other benefits will continue throughout the term of the employment agreements. The initial base salary for each of our NEOs, as provided in his employment agreement, was as follows: $340,000 for Mr. Chandor; $260,000 for Mr. O'Neil; $219,596 for Mr. McAvoy; and $175,000 for Mr. Highland. The initial target TIP percentage payout for each of our NEOs, as provided in his employment agreement, was as follows: 60% for Mr. Chandor; and 50% for Messrs. O'Neil, McAvoy and Highland. Such amounts and percentages have been modified in accordance with the terms of such agreements, as discussed herein.
Each employment agreement provides that if the NEO is terminated by us for any reason other than for "cause" or the NEO terminates his employment for "good reason" (as such terms are defined in the employment agreement), the NEO will receive an amount equal to a percentage of his base salary (50%, except 75% for Mr. McAvoy) payable in at-least monthly installments for a period of 24 months (12 months for Mr. McAvoy). Additionally, the NEO will remain vested in all vested restricted stock and stock options and shall be entitled to receive a ratable portion of the current year's target incentive payment under our TIP plus an amount equal to roughly two times the current year's target incentive payment (one times the current year's target incentive payment for Mr. McAvoy). Each employment agreement also provides that during the 24 months following termination other than for “cause” or the NEO terminates his employment for “good reason” (12 months for Mr. McAvoy), the Company will provide to the executive and his dependents continued participation in all employee welfare benefit plans at no cost to the executive or his dependents and otherwise on the same terms as active employees. If the Company is not permitted to provide participation in any such plans, the Company will reimburse the executive on a net after-tax basis, for the cost of individual coverage for executive and his dependents under a policy or policies that provide benefits (other than disability coverage) not less favorable than the benefits provided under such employee welfare benefit plans.
The employment agreements of Messrs. Chandor and O’Neil also provide that, in the event of termination other than for “cause” or by executive for “good reason” (as such terms are defined in the employment agreements), the executive and his dependents shall be irrevocably entitled to medical benefits not less favorable than the medical benefits provided for under the Company’s Postretirement Medical and Life Insurance Benefits Plan (the “OPEB”), as in effect on initial date of such executive’s employment or upon his termination, whichever is more favorable to the executive, without regard to whether executive or his dependents are eligible to participate in the OPEB. If the Company is unable to provide such medical benefits under the OPEB, or otherwise chooses to do so, it may pay for or procure such coverage under a policy or policies that provide such medical benefits and terms not less favorable that the medical benefits provided under the OPEB as in effect on the initial
88
date of executive’s employment or upon his termination, whichever is more favorable to executive. The Company is responsible to pay 100% of the cost of coverage.
The employment agreements restrict the NEOs from competing, directly or indirectly, with us or soliciting certain of our employees and officers or our affiliates during the term of the employment and for a period of 24 months thereafter (12 months for Mr. McAvoy). In the event that the NEO is terminated by us for any reason other than for "cause" or has resigned for "good reason," then during the non-competition and non-solicitation period and in consideration of his undertakings during such period, the NEO will receive an additional amount equal to a percentage of his base salary (50%, except 25% for Mr. McAvoy) payable at-least monthly for a period of 24 months (12 months for Mr. McAvoy).
Change of Control Payments
The 2016 Professional Services Agreement with Mr. Dir and the employment agreements with our NEOs provide them with change of control protection as described under Change of Control and Severance Arrangements below. We believe that by providing our NEOs with this change of control protection, we allow our senior management to focus on maximizing stockholder value and mitigate the necessity for management's attention to be diverted toward finding new employment in the event a change of control occurs. We also believe our arrangement facilitates the recruitment of talented executives through the provision of guaranteed protection in the event we are acquired shortly after accepting an employment offer.
Severance Arrangements with our NEOs
The 2016 Professional Services Agreement with Mr. Dir and each other NEO's employment agreement provides for severance arrangements upon the occurrence of certain events, as described under Change of Control and Severance Arrangements below. We believe that companies should provide reasonable severance benefits to employees. With respect to our NEOs, these severance benefits should reflect the fact that it may be difficult for executives to find comparable employment within a short period of time. Such arrangements also should economically separate us from the former executive as soon as practicable.
Qualified Retirement Plan
We offered a qualified pension plan (the Revised Retirement Plan for Employees of NTELOS Inc. or the "Pension Plan") for all employees hired before October 1, 2003, to provide an annual retirement benefit. The Pension Plan is funded entirely by Company contributions and there is a five-year cliff vesting period. The accrued benefit is based on the monthly highest average compensation over a consecutive five-year period of employment with us and the NEO's years of benefit service under the Pension Plan. A year of benefit service is a year in which a participant completes at least 1,000 hours of service. Compensation as defined in this plan includes total compensation from us for the year, increased by any pre-tax contributions made under our 401(k) plan and/or (Section 125) cafeteria plan. No more than the IRS maximum allowable compensation, or $250,000 for 2012, is taken into account for Pension Plan purposes. Effective as of December 31, 2012, benefits under the Pension Plan were frozen, effectively eliminating future benefit accruals thereafter. Compensation and service after December 31, 2012 are not reflected in the benefit.
Of the NEOs, only Messrs. McAvoy and Highland are participants in the Pension Plan. Messrs. Dir, Chandor, and O'Neil are not eligible to participate in the Pension Plan.
Compensation Recoupment Policy
In order to further align management's interests with the interests of stockholders and support good governance practices, the Board of Directors implemented a Compensation Recoupment Policy in December 2009. The Compensation Recoupment Policy provides that the Board of Directors has the authority to obtain reimbursement of any portion of any performance-based compensation paid or awarded, whether cash or equity-based, where the payment or award was predicated upon the achievement of certain financial results or metrics that are subsequently the subject of a restatement or correction, from the officers, including NEOs, and from other employees responsible for the restatement or correction.
Perquisites and Other Benefits
We annually review any perquisites that our NEOs are eligible to receive. The Committee reviewed a list of perquisites and their prevalence in the market and determined that no material changes to the perquisites and benefits provided by us to the NEOs would be necessary for 2015. We provide each of our NEOs with a vehicle allowance, which we believe is consistent with the practice of our competitors. We annually review our perquisite offerings to the NEOs and make changes, if necessary, primarily based on prevalence within our Peer Group.
89
In addition to the cash and equity compensation discussed above, we provide our NEOs (other than Mr. Dir who does not receive the following benefit package pursuant to the terms of the Professional Services Agreements and the 2016 Professional Services Agreement) with the same benefit package available to all of our salaried employees. The package includes:
• Health and dental insurance (portion of costs);
• Basic life insurance;
• Long-term disability insurance; and
• Participation in NTELOS Inc.'s Savings and Security Plan (401(k) plan), including Company match.
We also provide the retirement and change of control benefits described above.
Stock Ownership Guidelines
Our Board of Directors implemented stock ownership guidelines for our executive officers initially in August 2006 to emphasize the link between officers and the long-term interests of our stockholders. In August 2011, the Board of Directors revised the stock ownership guidelines so that they generally require that each executive own a minimum number of shares of our Common Stock having a value equal to a multiple of the executive's current base salary (as calculated below). The guidelines were further updated in 2013 to provide for inclusion of PSUs and clarify how PSUs are valued for purposes of computing compliance. The guidelines for our NEOs are as follows: five times annual base salary for our Chief Executive Officer, three times annual base salary for our Executive Vice Presidents, and two times annual base salary for Senior Vice Presidents. The value of the following equity is counted toward compliance with the guidelines: shares owned (e.g., shares obtained upon vesting of restricted stock and PSUs, shares obtained upon option exercise, shares purchased in the open market, shares held in the Company's defined contribution plan, etc.); shared ownership (e.g., shares owned or held in trust by immediate family); unvested restricted stock; unvested and unearned PSUs valued at target or, if earned, at actual achievement, and "in the money" value of unexercised stock options. Each NEO generally has three years from the later of August 31, 2011, and his hire or promotion date to meet the guidelines. Until such time as the executive reaches his or her share ownership guideline, or after falling below the applicable guideline due to a decrease in the value of our Common Stock, the executive will be required to hold 100% of the shares of Common Stock received upon lapse of the restrictions upon restricted stock and upon exercise of stock options (net of any shares utilized or sold to pay or reimburse for tax withholding and/or the exercise price of the option).
The value of the Common Stock is calculated as the average of the closing Common Stock price on NASDAQ for the trading days in the 30-calendar day period immediately preceding any computation. Each executive officer must maintain the minimum value of equity ownership provided in these stock ownership guidelines.
The Committee reviews these stock ownership guidelines periodically and, if changes are deemed appropriate, submits such recommended changes to the Board of Directors for consideration and approval.
Compensation Committee Report
The Compensation Committee has reviewed and discussed the "Compensation Discussion and Analysis" section of this Form 10-K with management and, based on such review and discussion, the Compensation Committee recommends that it be included in this Annual Report on Form 10-K.
Compensation Committee | |
Michael Huber (Chairperson) | |
Michael Gottdenker | |
Ruth Sommers | |
The Compensation Committee Report does not constitute solicitation material and shall not be deemed filed or incorporated by reference into any of our other filings and/or the Securities Act or the Exchange Act, except to the extent that we specifically incorporate this report by reference therein.
Compensation Committee Interlocks and Insider Participation
No current member of the Committee was an employee of the Company during the last fiscal year or an officer of the Company in any prior period. Mr. Dir served on the Committee until his appointment as President and Chief Operating Officer
90
of the Company on July 28, 2014 and resigned from the Committee concurrently with such appointment. There are no Compensation Committee interlocks between us and other entities involving our executive officers and members of the Board of Directors who serve as an executive officer or board member of such other entities.
Summary Compensation Table
Salary | Bonus | Stock Awards | Option Awards | Non-Equity Incentive Plan Compensation | Change in Pension Value and Non- qualified Deferred Compensation Earnings | All Other Compensation | Total | ||||||||||||||||||||||||||||
Name and Principal Position | Year | ($)(1) | ($)(2) | ($)(3) | ($)(4) | ($)(5) | ($)(6) | ($)(7) | ($) | ||||||||||||||||||||||||||
Rodney D. Dir(8) | 2015 | $ | 422,917 | $ | 500,000 | $ | 230,000 | $ | 227,000 | $ | — | $ | — | $ | 42,656 | $ | 1,422,573 | ||||||||||||||||||
Chief Executive Officer | 2014 | 171,972 | — | 151,680 | — | — | — | 33,122 | 356,774 | ||||||||||||||||||||||||||
Stebbins B. Chandor Jr. | 2015 | 363,951 | 86,152 | 423,752 | 119,590 | 127,266 | — | 47,962 | 1,168,673 | ||||||||||||||||||||||||||
EVP, Chief Financial Officer, Treasurer and Assistant Secretary | 2014 | 363,951 | — | 260,066 | 50,742 | 99,820 | — | 26,995 | 801,574 | ||||||||||||||||||||||||||
2013 | 361,252 | — | 350,994 | 78,139 | 193,299 | — | 46,164 | 1,029,848 | |||||||||||||||||||||||||||
Brian J. O'Neil | 2015 | 310,188 | 73,601 | 361,250 | 101,953 | 108,724 | — | 39,409 | 995,125 | ||||||||||||||||||||||||||
Executive Vice President, General Counsel and Secretary | 2014 | 310,188 | — | 221,722 | 43,299 | 85,098 | — | 20,943 | 681,250 | ||||||||||||||||||||||||||
2013 | 307,973 | — | 299,222 | 66,614 | 164,790 | — | 85,040 | 923,639 | |||||||||||||||||||||||||||
Robert L. McAvoy Jr. | 2015 | 281,077 | 73,559 | 327,348 | 92,384 | 108,662 | — | 20,573 | 903,603 | ||||||||||||||||||||||||||
Executive Vice President and Chief Technology Officer | 2014 | 281,077 | 200,900 | 39,199 | 82,141 | 134,813 | 19,452 | 757,582 | |||||||||||||||||||||||||||
2013 | 261,573 | — | 297,144 | 42,192 | 138,549 | — | 9,164 | 748,623 | |||||||||||||||||||||||||||
S. Craig Highland | 2015 | 199,664 | 43,697 | 186,682 | 52,684 | 64,551 | — | 22,314 | 569,592 | ||||||||||||||||||||||||||
Senior Vice President, Finance and Corporate Development | 2014 | 197,406 | 112,873 | 22,025 | 48,074 | 145,986 | 20,491 | 546,855 | |||||||||||||||||||||||||||
2013 | 195,769 | 152,338 | 33,915 | 87,294 | — | 21,707 | 491,023 | ||||||||||||||||||||||||||||
____________________
(1) | Mr. Dir was compensated pursuant to the terms of the Professional Services Agreements. Each of the other NEOs has an employment agreement with us that sets forth his respective minimum base salary, which is subject to annual adjustments as determined by the Committee. The Committee's established practice is to review compensation for each NEO and all other employees during the first quarter of each year, with any adjustments to be effective in April of each year, which allows for consideration of audited financial results and approved short-term and long-term incentive grants. |
During 2015, each of the NEOs, other than Mr. Dir, participated in the NTELOS Inc. Savings and Security Plan (the "401(k) Plan"). The 401(k) Plan allows eligible employees to tax-defer up to 20% of their salary through contributions to their 401(k) Plan up to the IRS maximum of $18,000 for 2015. In addition, employees age 50 or older as of the last day of the calendar year are eligible to contribute up to 100% of their salary for the catch-up contribution, up to the IRS maximum of $6,000 for 2015. The tax-deferred 401(k) contributions for our NEOs were as follows for 2015: $18,000 each for Messrs. McAvoy and Highland; $24,000 each for Messrs. Chandor and O'Neil.
(2) | Mr. Dir received a $150,000 bonus in March 2015 pursuant to the terms of the 2014 Professional Services Agreement, which bonus was earned following the end of the term of the 2014 Professional Services Agreement on January 31, 2015 and was paid in respect of the entire six-month period covered by the 2014 Professional Services Agreement. Mr. Dir received an additional $350,000 in March 2016 pursuant to the terms of the 2015 Professional Services Agreement, |
91
which bonus was earned following the end of the term of the 2015 Professional Services Agreement on December 31, 2015.
The NEOs, other than Mr. Dir, received a bonus in lieu of receiving a TIP payout for the period following the Merger Announcement Measurement Date equal to approximately 41.7% of the TIP pool. For further information on our bonus payout, see "Annual Short-Term Incentive Compensation" in the Compensation Discussion and Analysis.
(3) | The values for each year represent the aggregate grant date fair value of stock awards granted during each respective year computed in accordance with Financial Accounting Standards Board Accounting Standards Codification 718, Share-Based Payment ("ASC 718"). For a discussion of the assumptions used in determining the compensation cost associated with these stock awards, see Note 13 of the Notes to Consolidated Financial Statements. |
(4) | The values for each year presented were computed in accordance with ASC 718 and represent the aggregate grant date fair value related to stock options that were granted to the NEOs during each respective year. For a discussion of the assumptions used in determining the compensation cost associated with option awards, see Note 13 of the Notes to Consolidated Financial Statements. |
(5) | The values for 2015 represent the cash incentive paid to each NEO in connection with our annual short-term incentive plan, based on achievement of specified company-wide performance goals and achievement of individual performance objectives through the Merger Announcement Measurement Date. We attained a weighted average performance achievement of 105.6% of company-wide performance goals for the portion of 2015 through the Merger Announcement Measurement Date. For further information on our annual short-term incentive plan, see "Annual Short-Term Incentive Compensation" in the Compensation Discussion and Analysis. |
(6) | The aggregate change in the actuarial present value of Messrs. McAvoy's and Highland's accumulated benefit under all defined benefit and actuarial pension plans during 2015 was ($20,674) and ($22,951) respectively. All values listed consist entirely of the change in the value of accumulated pension benefits for the qualified and non-qualified pension plans. For the participating NEOs, the values are based on the earliest date at which there is no early retirement reduction. |
(7) | Included in "All Other Compensation" for 2015 are the following elements that exceed $10,000 and perquisites required to be reported: |
Perquisites totaling more than $10,000 in the aggregate for Messrs. Chandor, O'Neil and Highland inclusive of the following:
◦ | automobile allowance offered as a competitive perquisite, which includes a monthly vehicle allowance, gas reimbursement up to 15,000 miles and personal property tax reimbursement ($12,905 for Mr. Chandor, $9,612 for Mr. O'Neil, and $9,756 for Mr. Highland.); |
◦ | travel allowances in the amount of $20,696 for Mr. Chandor and $16,511 for Mr. O'Neil; and |
◦ | premium payments on life insurance policies in accordance with each NEO's employment agreement. |
Also included in "All Other Compensation" for 2015 are payments to Mr. Dir pursuant to the terms of the 2015 Professional Services Agreement in respect of housing and travel allowance and other reimbursed expenses.
(8) | Mr. Dir and the Company entered into the Professional Services Agreements, pursuant to which Mr. Dir served as our President and Chief Operating Officer through January 31, 2015, and then as Chief Executive Officer through December 31, 2015. |
92
Grants of Plan-Based Awards
Estimated Future Payouts Under Non-Equity Incentive Plan Awards(1) | Estimated Future Payouts Under Equity Incentive Plan Awards | All Other Stock Awards: Number of Shares of Stock or units | All Other Option Awards: Number of Securities Underlying Options | Exercise or Base Price of Option Awards | Grant Date Fair Value of Stock and Option Awards | |||||||||||||||||||||||||||||
Named Executive | Grant | Threshold | Target | Maximum | Threshold | Target | Maximum | |||||||||||||||||||||||||||
Officer | Date | ($) | ($) | ($) | (#) | (#) | (#) | (#) | (#) | ($/Share) | ($) | |||||||||||||||||||||||
Rodney D. Dir | 2/5/2015 | — | — | — | — | — | — | 50,000 | — | — | 230,000 | (2) | ||||||||||||||||||||||
3/5/2015 | 100,000 | 6.00 | 227,000 | (2) | ||||||||||||||||||||||||||||||
Stebbins B. Chandor Jr. | 3/5/2015 | — | — | — | — | — | — | 75,670 | — | — | 423,752 | (3) | ||||||||||||||||||||||
3/5/2015 | — | — | — | — | — | — | — | 52,683 | 6.00 | 119,590 | (3) | |||||||||||||||||||||||
3/5/2015 | 63,430 | 126,860 | 507,440 | — | — | — | — | — | — | — | ||||||||||||||||||||||||
Brian J. O'Neil | 3/5/2015 | — | — | — | — | — | — | 64,509 | — | — | 361,250 | (3) | ||||||||||||||||||||||
3/5/2015 | — | — | — | — | — | — | — | 44,913 | 6.00 | 101,953 | (3) | |||||||||||||||||||||||
3/5/2015 | 54,075 | 108,150 | 432,600 | — | — | — | — | — | — | — | ||||||||||||||||||||||||
Robert L. McAvoy Jr. | 3/5/2015 | — | — | — | — | — | — | 58,455 | — | — | 327,348 | (3) | ||||||||||||||||||||||
3/5/2015 | — | — | — | — | — | — | — | 40,698 | 6.00 | 92,384 | (3) | |||||||||||||||||||||||
3/5/2015 | 49,000 | 98,000 | 392,000 | — | — | — | — | — | — | — | ||||||||||||||||||||||||
S. Craig Highland | 3/5/2015 | — | — | — | — | — | — | 33,336 | — | — | 186,682 | (3) | ||||||||||||||||||||||
3/5/2015 | — | — | — | — | — | — | — | 23,209 | 6.00 | 52,684 | (3) | |||||||||||||||||||||||
3/5/2015 | 29,109 | 58,217 | 232,868 | — | — | — | — | — | — | — | ||||||||||||||||||||||||
____________________
(1) | As a result of announcement on August 10, 2015 of the proposed Merger with Shentel, the TIP achievement period was shortened and achievement was determined through July 31, 2015. The Threshold, Target and Maximum amounts shown are based on such shortened performance period. Our weighted average performance achievement percentage for company-wide performance goals in connection with the 2015 TIP under our 2010 Equity and Cash Incentive Plan (the "Equity Plan") was 105.6% for the seven-month period ending July 31, 2015. The Company made the following cash ratable payouts to our NEOs in respect of such achievement: $127,266 for Mr. Chandor; $108,724 for Mr. O'Neil; $108,662 for Mr. McAvoy; and $64,551 for Mr. Highland. The Company paid the 2015 TIP payments in respect of the subject seven-month period to the NEOs on March 2, 2016. For further information on the Company performance achievement percentages for the 2015 TIP, see "Annual Short-Term Incentive Compensation" in the Compensation Discussion and Analysis. |
(2) | The closing price on the date of the grant of the restricted stock award, which also represents the fair value of a share of restricted stock, was $4.60 per share and the Black-Scholes grant date fair value of the option awards was approximately $2.27 per option. |
(3) | The closing stock price on the date of the grant, which also represents the fair value of a share of restricted stock, was $5.60 per share and the Black-Scholes grant date fair value of the option awards was approximately $2.27 per option. |
93
Outstanding Equity Awards at Fiscal Year-End
Option Awards | Stock Awards | |||||||||||||||||||||||
Number of Securities Underlying Unexercised Options (#) | Number of Securities Underlying Unexercised Options (#) | Equity Incentive Plan Awards: Number of Securities Underlying Unexercised Unearned Options | Option Exercise Price | Option Expiration | Number of Shares or Units of Stock That Have Not Vested | Market Value of Shares or Units of Stock That Have Not Vested | Equity Incentive Plan Awards: Number of Unearned Shares, Units or Other Rights That Have Not Vested | Equity Incentive Plan Awards: Market or Payout Value of Unearned Shares, Units or Other Rights That Have Not Vested | ||||||||||||||||
Named Executive Officer | Exercisable | Unexercisable | (#) | ($) | Date | (#) | ($) | (#) | ($) | |||||||||||||||
Rodney D. Dir | 1,116 | 21.15 | 11/11/2021 | |||||||||||||||||||||
6,200 | 20.93 | 1/3/2022 | ||||||||||||||||||||||
8,600 | 11.83 | 1/2/2023 | ||||||||||||||||||||||
5,434 | 19.67 | 1/2/2024 | ||||||||||||||||||||||
100,000 | (1) | 6.00 | 3/5/2025 | |||||||||||||||||||||
Stebbins B. Chandor Jr. | 84,454 | — | 22.52 | 9/9/2021 | — | — | — | — | ||||||||||||||||
55,784 | (2) | 18,595 | (2) | — | 23.25 | 2/27/2022 | — | — | — | — | ||||||||||||||
54,719 | (3) | 54,719 | (3) | — | 12.47 | 3/6/2023 | — | — | — | — | ||||||||||||||
14,366 | (4) | 43,100 | (4) | — | 12.93 | 3/14/2024 | — | — | ||||||||||||||||
52,683 | (1) | 6.00 | 3/5/2025 | |||||||||||||||||||||
13,898 | (6) | 127,028 | ||||||||||||||||||||||
— | — | — | — | — | 11,596 | (7) | 105,987 | — | — | |||||||||||||||
— | — | — | — | — | 75,670 | (8) | 691,624 | — | — | |||||||||||||||
— | — | — | — | — | 359 | (9) | 3,281 | 10,630 | (10) | 97,158 | ||||||||||||||
Brian J. O'Neil | 58,381 | — | 23.07 | 9/2/2021 | — | — | — | — | ||||||||||||||||
35,610 | (2) | 11,871 | (2) | — | 23.25 | 2/27/2022 | — | — | — | — | ||||||||||||||
15,749 | (5) | 5,250 | (5) | — | 20.91 | 7/30/2022 | — | — | — | — | ||||||||||||||
46,648 | (3) | 46,649 | (3) | — | 12.47 | 3/6/2023 | — | — | — | — | ||||||||||||||
12,247 | (4) | 36,744 | (4) | — | 12.93 | 3/14/2024 | — | — | ||||||||||||||||
44,913 | (1) | 6.00 | 3/5/2025 | |||||||||||||||||||||
— | — | — | — | — | 11,848 | (6) | 108,291 | — | — | |||||||||||||||
— | — | — | — | — | 9,886 | (7) | 90,358 | — | — | |||||||||||||||
— | — | — | — | — | 64,509 | (8) | 589,612 | |||||||||||||||||
307 | (9) | 2,806 | 9,062 | (10) | 82,827 | |||||||||||||||||||
Robert L. McAvoy Jr. | 7,290 | — | 22.40 | 3/5/2017 | — | — | — | — | ||||||||||||||||
7,290 | — | 26.32 | 3/3/2018 | — | — | — | — | |||||||||||||||||
7,289 | — | 22.25 | 3/2/2019 | — | — | — | — | |||||||||||||||||
13,927 | — | 21.53 | 3/1/2020 | — | — | — | — | |||||||||||||||||
11,666 | 23.98 | 2/28/2021 | — | — | ||||||||||||||||||||
29,976 | (2) | 9,992 | (2) | — | 23.25 | 2/27/2022 | — | — | ||||||||||||||||
29,546 | (3) | 29,547 | (3) | — | 12.47 | 3/6/2023 | — | — | ||||||||||||||||
11,098 | (4) | 33,295 | (4) | 12.93 | 3/14/2024 | |||||||||||||||||||
40,698 | (1) | 6.00 | 3/5/2025 | |||||||||||||||||||||
7,504 | (6) | 68,587 | ||||||||||||||||||||||
6,595 | (11) | 60,278 | ||||||||||||||||||||||
8,958 | (7) | 81,876 | ||||||||||||||||||||||
58,455 | (8) | 534,279 | ||||||||||||||||||||||
94
278 | (9) | 2,541 | 8,212 | (10) | 75,058 | |||||||||||||||||||
S. Craig Highland | 4,050 | — | — | 22.40 | 3/5/2017 | — | — | — | — | |||||||||||||||
4,050 | — | — | 26.32 | 3/3/2018 | — | — | — | — | ||||||||||||||||
4,050 | — | — | 22.25 | 3/2/2019 | — | — | — | — | ||||||||||||||||
5,505 | — | 21.53 | 3/1/2020 | — | — | — | — | |||||||||||||||||
4,441 | — | 23.98 | 2/28/2021 | — | — | — | — | |||||||||||||||||
8,764 | — | 21.15 | 11/11/2021 | — | — | — | — | |||||||||||||||||
16,887 | (2) | 5,629 | (5) | — | 23.25 | 2/27/2022 | — | — | — | — | ||||||||||||||
23,750 | (3) | 23,750 | (6) | — | 12.47 | 3/6/2023 | — | — | ||||||||||||||||
6,235 | (4) | 18,708 | (7) | — | 12.93 | 3/14/2024 | — | — | ||||||||||||||||
23,209 | (1) | 6.00 | 3/5/2025 | |||||||||||||||||||||
— | — | — | — | — | 6,032 | (6) | 55,132 | — | — | |||||||||||||||
— | — | — | — | — | 5,033 | (7) | 46,002 | — | — | |||||||||||||||
— | — | — | — | — | 33,336 | (8) | 304,691 | — | — | |||||||||||||||
156 | (9) | 1,426 | 4,614 | (10) | 42,172 | |||||||||||||||||||
____________________
(1) | The stock options granted on March 5, 2015 vest as follows: 25% on each of March 4, 2016; March 3, 2017; March 5, 2018; and March 5, 2019 |
(2) | The stock options granted on February 29, 2012 vest as follows: 25% on each of February 28, 2013 and 2014, February 27, 2015 and February 29, 2016. |
(3) | The stock options granted on March 6, 2013 vest as follows: 25% on each of March 6, 2014 and 2015, March 7, 2016 and March 6, 2017. |
(4) | The stock options granted on March 14, 2014 vest as follows: 25% on each of March 16, 2015; March 14, 2016; March 14, 2017; and March 14, 2018. |
(5) | The stock options granted on July 30, 2012 vest as follows: 25% on each of July 30, 2013, 2014, 2015 and 2016. |
(6) | The restricted stock granted on March 6, 2013 as annual long-term incentive awards vest on March 7, 2016. |
(7) | The restricted stock granted on March 14, 2014 as annual long-term incentive awards vest on March 14, 2017. |
(8) | The restricted stock granted on March 5, 2015 as annual long-term incentive awards vest on March 5, 2018. |
(9) | Each earned Performance Stock Unit ("PSU") is settled by delivery of one share of common stock, including accrued reinvested dividends, through the final vesting date. Subject to the terms of the PSU Awards, each PSU will vest upon certification of achievement following completion of Issuer's fiscal year ending December 31, 2016. |
(10) | The PSUs granted on March 14, 2014 vest on December 31, 2016 (based on continued employment). The number of PSUs that may be earned may be increased to a maximum number of 200% of the target number of PSUs set forth above upon maximum achievement of each of the Performance Goals and decreased to a minimum number of zero upon achievement below the minimum required level of each of the Performance Goals. Performance and percentages that fall between the maximum number of PSUs, the target number of PSUs and the threshold number (zero) of PSUs shall be determined using linear interpolation. |
(11) | The restricted stock granted on July 1, 2013 vests on July 1, 2016. |
Option Exercises and Stock Vested
Option Awards | Stock Awards | |||||||||||
Number of Shares Acquired on Exercise | Value Realized on Exercise | Number of Shares Acquired on Vesting | Value Realized on Vesting | |||||||||
Named Executive Officer | (#) | ($) | (#)(1) | ($)(2) | ||||||||
Rodney D. Dir | — | — | 64,019 | 516,160 | ||||||||
Stebbins B. Chandor Jr. | — | — | 12,315 | 67,606 | ||||||||
Brian J. O'Neil | — | — | 10,723 | 61,195 | ||||||||
Robert L. McAvoy Jr. | — | — | 6,623 | 36,377 | ||||||||
S. Craig Highland | — | — | 3,978 | 22,758 | ||||||||
95
____________________
(1) | Represents vested stock for which restrictions lapsed. |
(2) | Value based on the closing price of NTELOS common stock on the day before restrictions lapsed. Vested shares are subject to retention under the Company's stock ownership guidelines. |
Pension Benefits
Number of Years Credited Service | Present Value of Accumulated Benefits(1) | Payments During Last Fiscal Year | |||||||
Named Executive Officer | (#) | ($) | ($) | ||||||
Rodney D. Dir | N/A | N/A | N/A | ||||||
Stebbins B. Chandor Jr. | N/A | N/A | N/A | ||||||
Brian J. O’Neil | N/A | N/A | N/A | ||||||
Robert L. McAvoy Jr. | 13 | 482,048 | — | ||||||
S. Craig Highland | 15 | 541,888 | — | ||||||
(1) | For a discussion of the assumptions used in quantifying the present value of the current accrued benefit under the Pension Plan, see Note 15 of Notes to Consolidated Financial Statements. |
An NEO participating in the Pension Plan may elect early retirement any time after age 55 and the completion of five years of service. As of December 31, 2015, no NEO was eligible for such early retirement. If an NEO retires on or after an early retirement date, but prior to the normal retirement date (age 65 and the completion of five years of service), such NEO will be entitled to receive a monthly benefit commencing on the normal retirement date. If the NEO elects to have the monthly benefit commence prior to his normal retirement date, the monthly benefit will be reduced to reflect the earlier distribution of the benefit. The following schedule outlines the percent of benefit an NEO would receive if the NEO elects to have the monthly benefit commence prior to the normal retirement date:
Percentage That Applies to Base Formula | ||||||||||||
Participants Whose Age and Years of Service Equal at Least 85 | ||||||||||||
Age at Retirement | Percentage That Applies to Covered Compensation | Percentage That Applies to Compensation in Excess of Covered Compensation | Participants with at least 25 Years of Service | All Other Participants | ||||||||
64 | 100.00 | % | 100.00 | % | 100.00 | % | 93.33 | % | ||||
63 | 100.00 | % | 100.00 | % | 100.00 | % | 86.67 | % | ||||
62 | 100.00 | % | 100.00 | % | 100.00 | % | 80.00 | % | ||||
61 | 100.00 | % | 95.00 | % | 73.33 | % | 73.33 | % | ||||
60 | 100.00 | % | 90.00 | % | 66.67 | % | 66.67 | % | ||||
59 | 100.00 | % | 85.00 | % | 63.33 | % | 63.33 | % | ||||
58 | 100.00 | % | 80.00 | % | 60.00 | % | 60.00 | % | ||||
57 | 100.00 | % | 75.00 | % | 56.67 | % | 56.67 | % | ||||
56 | 100.00 | % | 68.80 | % | 53.33 | % | 53.33 | % | ||||
55 | 100.00 | % | 63.20 | % | 50.00 | % | 50.00 | % | ||||
As noted in the above table, if an NEO has completed at least 25 years of benefit service and is at least 62 years of age, there will be no reduction for early retirement. Also noted in the above table, if the sum of the NEO's age and years of benefit service equal 85 or more ("Rule of 85"), there will be no reduction in the benefit up to the average (without indexing) of the taxable wage bases in effect for each calendar year during the 35-year period ending with the last day of the calendar year in
96
which the Participant attains (or will attain) Social Security retirement age ("Covered Compensation"). The present value of accumulated benefits in the Pension Benefits Table above has been computed assuming that Messrs. McAvoy and Highland will retire and the benefits will commence when they meet the Rule of 85 on January 1, 2026 and 2025, respectively.
Change in Control and Severance Arrangements
Change in Control and Severance Arrangements for Mr. Dir
In the event the 2015 Professional Services Agreement had been terminated on December 31, 2015 (other than by the Company for cause or by Mr. Dir without cause), Mr. Dir would have been entitled to: (1) eligibility for a bonus payment of $300,000 to be paid in a lump sum, and (2) a severance payment of $100,000 payable in equal installments over the six months following the termination of the agreement (unless termination is on or after a "Change of Control," as defined below for the other NEOs, in which case the $100,000 will be paid in a lump sum). In addition, 100,000 options to purchase shares of common stock at an exercise price of $6.00 per share would immediately vest and become exercisable. The intrinsic value of such accelerated vesting of options would have totaled $314,000 on December 31, 2015. The total value of such payments (including accelerated vesting) would have been $714,000.
The 2016 Professional Services Agreement may be terminated by the Board of Directors of the Company or Mr. Dir at any time upon thirty days' prior notice. Pursuant to the agreement, Mr. Dir will be entitled to the following payments and benefits in the event the 2016 Professional Services Agreement is terminated prior to December 31, 2016 (other than termination by the Company for cause or by Mr. Dir without cause): (1) eligibility for a bonus payment of $325,000 and (2) a severance payment of $100,000 payable in equal installments over the six months following the termination of the agreement (unless termination is on or after a "Change of Control," as defined below for the other NEOs, in which case the $100,000 will be paid in a lump sum).
Pursuant to terms of Mr. Dir's outstanding equity awards, in the event of his termination of services (other than termination by the Company for cause or by Mr. Dir without cause), Mr. Dir would be entitled to receive accelerated vesting in respect of such awards.
Change in Control Arrangements for NEOs (other than Mr. Dir)
The employment agreements with Messrs. Chandor, O'Neil, and Highland provide that if there is a change in control, the term of such NEO's employment agreement will be extended so that the term will not expire for 24 months from the date of the change in control. Mr. McAvoy's employment agreement does not provide for an automatic extension upon a change of control.
A "change in control" is defined in employment agreements with each of Messrs. Chandor, O'Neil, and Highland to mean any of the following events, except that a change in control does not include any of the events described below that occurs directly or indirectly as a result of or in connection with the Quadrangle Entities and/or their affiliates, related funds and co-investors becoming the "beneficial owner" (as defined in Rule 13d-3 under the Exchange Act), directly or indirectly, of our securities representing more than 51% of the combined voting power of the then-outstanding securities, or our stockholders approve a merger, consolidation or reorganization between us and any other company and such merger, consolidation or reorganization is consummated, and after such merger, consolidation or reorganization of the Quadrangle Entities and/or their respective affiliates, related funds and co-investors acquire more than 51% of the combined voting power of our then-outstanding securities:
• | any person is or becomes the "beneficial owner" (as defined in Rule 13d-3 under the Exchange Act), directly or indirectly, of our securities representing more than 51% of the combined voting power of the then-outstanding securities; |
• | consummation of a merger, consolidation or reorganization between us and any other company, or a sale of all or substantially all our assets (a "Transaction"), other than a Transaction that would result in our voting securities outstanding immediately prior thereto continuing to represent either directly or indirectly more than 51% of the combined voting power of our then-outstanding securities or such surviving or purchasing entity; |
• | our stockholders approve a plan of complete liquidation for us and such liquidation is consummated; |
• | except for the employment agreements of Messrs. Chandor and O'Neil (for which the following does not apply), a sale, transfer, conveyance or other disposition (whether by asset sale, stock sale, merger, combination, spin-off or otherwise) (a "Sale") of a "Material Line of Business" (as defined in each of the respective employment agreements, other than the employment agreements of Messrs. Chandor and O'Neil) (other than any such Sale to the Quadrangle Entities or their affiliates, related funds and co-investors), except that with respect to this provision, there shall only be a "change in control" with respect to an NEO who is employed at such time in such Material Line of Business (whether full or part- |
97
time), and the NEO does not receive an offer for "comparable employment" with the purchaser and the NEO's employment is terminated by us or any of our affiliates no later than six months after the consummation of the Sale of the Material Line of Business. For these purposes, "comparable employment" means that (1) the NEO's base salary and target incentive payments are not reduced in the aggregate; (2) the NEO's job duties and responsibilities are not diminished (but a reduction in our size as the result of a Sale of a Material Line of Business, or the fact that the purchaser is smaller than us, shall not alone constitute a diminution in the NEO's job duties and responsibilities); (3) the NEO is not required to relocate to a facility more than 50 miles from the NEO's principal place of employment at the time of the Sale; and (4) the NEO is provided benefits that are comparable in the aggregate to those provided to the NEO immediately prior to the Sale; or
• | during any period of 12 consecutive months commencing on February 13, 2006, the individuals who constituted our Board of Directors as of February 13, 2006 , and any new director who either (1) was elected by our Board or nominated for election by our stockholders and whose election or nomination was approved by a vote of more than 50% of the directors then still in office who either were directors as of February 13, 2006, or whose election or nomination for election was previously so approved or (2) was appointed to the board pursuant to the designation of Quadrangle Entities, cease for any reason to constitute a majority of the board. |
In the event of the occurrence of both (1) a change in control and (2) a termination of the NEO (other than Mr. Dir) by the Company without cause or by the NEO for good reason in accordance with his employment agreement, and assuming all of these events took place on December 31, 2015, each of such NEOs would have been entitled to the following estimated payments and accelerated vesting:
Name | Cash(1) | Equity(2) | Pension(3) | Perquisites/ Benefits(4) | Total(5) | |||||||||||||||
Stebbins B. Chandor Jr. | $ | 1,372,986 | $ | 1,093,345 | $ | — | $ | 474,055 | $ | 2,940,385 | ||||||||||
Brian J. O’Neil | 1,170,874 | 932,094 | — | 517,778 | 2,620,745 | |||||||||||||||
Robert L. McAvoy Jr. | 630,107 | 875,352 | 461,374 | 33,418 | 2,000,251 | |||||||||||||||
S. Craig Highland | 698,065 | 480,127 | 518,937 | 30,778 | 1,727,907 | |||||||||||||||
____________________
(1)The amounts shown in the cash column are based on assumptions of the compensation and benefit levels in effect on December 31, 2015. Cash severance for each named executive officer comprises of the following amounts: (a) severance payments; (b) non-compete payments; (c) present value of the team incentive payment (referred to as the bonus) for the severance period; and (d) earned and unpaid TIP/bonus payment as of December 31, 2015. The foregoing amounts are further delineated below:
Name | Severance Payments | Non-Compete Payments | Severance Bonus | Earned and Unpaid 2015 TIP/Bonus | ||||
Stebbins B. Chandor Jr. | $362,457 | $362,457 | $434,654 | $213,418 | ||||
Brian J. O’Neil | 309,000 | 309,000 | 370,549 | 182,325 | ||||
Robert L. McAvoy Jr. | 210,000 | 70,000 | 167,886 | 182,221 | ||||
S. Craig Highland | 196,650 | 196,650 | 196,517 | 108,248 | ||||
(2)The equity column calculation includes accelerated vesting of unvested stock options, restricted stock awards and performance share unit awards as of December 31, 2015 as follows:
Name | Unvested Stock Options | Restricted Stock | Performance Share Unit Awards | |||||||||
Stebbins B. Chandor Jr. | $ | 165,425 | $ | 924,639 | $ | 3,281 | ||||||
Brian J. O’Neil | 141,027 | 788,261 | 2,806 | |||||||||
Robert L. McAvoy Jr. | 127,792 | 745,020 | 2,541 | |||||||||
S. Craig Highland | 72,876 | 405,825 | 1,426 | |||||||||
98
(3) | Represents the present value of accrued pension benefits under the Pension Plan, which was frozen on December 31, 2012. Such amounts are payable over time in the form of an annuity. The values shown are based on the earliest date at which there is no early retirement reduction. Of the named executive officers, only Messrs. McAvoy and Highland are participants in the Pension Plan. |
(4) | Represents continued participation in NTELOS’s welfare benefit plans during the termination period and includes the present value of irrevocable post-retirement medical benefits for Messrs. Chandor and O’Neil, pursuant to the terms of their employment agreements. |
(5) | In addition, each NEO will be entitled to payment of the NEO's earned and unpaid base salary to the date of termination, if any. The NEO will also be entitled to unreimbursed business and entertainment expenses in accordance with our policy, and unreimbursed medical, dental and other employee benefit expenses incurred in accordance with our employee benefit plans. Termination also will not divest the NEO of any previously vested benefit or right unless the terms of such vested benefit or right specifically require divestiture where the NEO's employment is terminated |
for cause.
Upon the occurrence of a change in control and such NEO remains employed by us, and assuming the change in control took place on December 31, 2015, each such NEO will continue to be entitled to receive the compensation provided for under the terms of such NEO's employment agreement in accordance with its terms.
Severance Arrangements for NEOs (other than Mr. Dir)
Each NEO's employment agreement provides for severance arrangements upon the occurrence of certain events described below. Each such NEO's employment agreement terminates automatically upon his death. In addition, we may terminate the NEO's employment if he becomes disabled. We may also terminate the NEO's employment for any other reason with or without "cause" (as defined in the employment agreement). The NEO may terminate his employment upon prior written notice of at least 60 days. If the NEO terminates his employment for "good reason" (as defined in the employment agreement), it will be deemed a termination of the NEO's employment without cause by us.
If the NEO's employment is terminated for any reason, the NEO is entitled to receive (1) earned and unpaid base salary to the date of termination; (2) unreimbursed business and entertainment expenses; and (3) unreimbursed medical, dental and other employee benefit expenses to which he is entitled pursuant to the applicable employee benefit plans. If the NEO suffers a disability and his employment is terminated by the Company in connection therewith, the NEO also will be entitled to receive a pro rata portion of his incentive payments from the TIP for that year. If the NEO is terminated, other than for cause, or if he terminates his employment for good reason, the NEO is entitled to receive (1) a percentage of his base salary (50% for Messrs. Chandor, O'Neil, and Highland for 24 months, and 75% for Mr. McAvoy for 12 months); (2) a lump sum, determined on a net present value basis, equal to two times (one times for Messrs. McAvoy and Highland) the full incentive potential under the TIP for the year of the termination; (3) continued participation in the employee welfare benefit plans (other than disability and life insurance) for 24 months; and (4) in the case of Messrs. Chandor or O'Neil, irrevocable post-retirement medical benefits pursuant to the terms of their respective employment agreements. To the extent necessary to comply with Section 409A of the Internal Revenue Code, we will delay termination payments for a period of six months after termination or, if earlier, until the NEO's death, as necessary to avoid any excise tax. After such delay expires, all payments which would have otherwise been required to have been made during such delay period shall be paid to the NEO in one lump sum payment. Thereafter, the percentage of base salary payments will continue for the remainder of the termination period in such periodic installments as were being paid immediately prior to the termination date. If the NEO dies while still an employee, the NEO's surviving spouse or, if none, the NEO's estate is entitled to payment of any earned and unpaid incentive payments under the TIP for that year, and the death benefits under our employee benefit plans will be paid to the NEO's beneficiaries.
In addition, if the NEO is terminated without cause or if he terminates his employment for good reason, the remaining unvested portion of the restricted shares of Common Stock granted to such NEO will vest immediately prior to such NEO's termination date; and the PSUs granted to Messrs. Chandor, O'Neil, McAvoy and Highland on each of March 6, 2013 and March 14, 2014 remain outstanding through the end of the applicable performance period and will become earned and payable with respect to a ratable portion of such outstanding award.
For Messrs. Chandor, O'Neil and Highland, if any benefits payable or to be provided under the employment agreements for such NEOs and any other payments from us or any affiliate would subject such NEO to any excise taxes and penalties imposed on "parachute payments" within the meaning of Section 280G(b)(2) of the Internal Revenue Code, or any similar tax imposed by state or local law, then such payments or benefits will be reduced (but not below $0) if, and only to the extent that, such reduction will allow such NEO to receive a greater net after tax amount than the NEO would receive without such reduction.
99
As part of each such NEO's employment agreement and as consideration for the termination payments described above, during the NEO's employment and for a period of 24 months thereafter (or, in the case of Mr. McAvoy, 12 months thereafter), which we refer to as the non-competition period, the NEO will (1) not compete, directly or indirectly, with us or any subsidiary or (2) solicit certain current and former employees. As consideration for the NEO's non-competition and non-solicitation agreement, the NEO will receive an amount equal to a percentage of his base salary during the non-competition period, but only if we have terminated the NEO without cause, or if the NEO has terminated his employment for good reason. The applicable percentages are 50% for Messrs. Chandor, O'Neil and Highland, and 25% for Mr. McAvoy. If the NEO breaches any of the non-competition or non-solicitation restrictions, the NEO will not receive any further payments and the NEO will repay any payments previously received. The agreements also prohibit the NEOs from using any of our confidential or proprietary information at any time for any reason not connected to their employment with us.
The following table shows the estimated payments and benefits for each NEO under the various employment termination scenarios discussed above assuming the triggering event took place on December 31, 2015, and the price per share of our Common Stock was $9.14 per share, the closing market price as of December 31, 2015.
Named Executive Officer | Termination for Cause(1)(2)(6) | Voluntary Termination(1)(2)(6) | Retirement(1)(2)(6) | Death(3)(6) | Disability(4)(6) | Termination Without Cause or Termination by the NEO for Good Reason(5)(6) | |||||||||||
Stebbins B. Chandor Jr. | $ | — | $ | — | $ | — | $2,278,763 | $3,193,640 | $2,940,385 | ||||||||
Brian J. O'Neil | — | — | — | 1,881,419 | 2,769,826 | 2,620,745 | |||||||||||
Robert L. McAvoy Jr. | 461,374 | 461,374 | 461,374 | 1,904,792 | 3,479,301 | 2,000,251 | |||||||||||
S. Craig Highland | 518,937 | 518,937 | 518,937 | 1,263,815 | 2,558,456 | 1,727,907 | |||||||||||
____________________
(1) | For each named executive officer, the amounts are equal to the voluntary termination scenario because no named executive officer is eligible for retirement (age 65 with the completion of five years of service) or early retirement (age 55 with the completion of five years of service) on December 31, 2015. |
(2) | Includes the present value of accrued pension benefits, if applicable, which amounts shall be payable over time in the form of an annuity. The values shown are based on the earliest date at which there is no early retirement reduction. Of the named executive officers, only Messrs. McAvoy and Highland are participants in the Pension Plan. |
(3)The amounts in this column include the following:
Name | Cash(a) | Equity (b) | Pension/ NQDC (c) | Total | ||||||||||
Stebbins B. Chandor Jr. | $1,185,418 | $1,093,345 | $ | — | $2,278,763 | |||||||||
Brian J. O’Neil | 949,325 | 932,094 | — | 1,881,419 | ||||||||||
Robert L. McAvoy Jr. | 885,221 | 875,352 | 144,219 | 1,904,792 | ||||||||||
S. Craig Highland | 628,898 | 480,127 | 154,790 | 1,263,815 | ||||||||||
100
(a) | The amounts shown in the cash column are based on the following amounts: life insurance payment, which is a liability of the life insurance company, representing one time each named executive officer’s annual salary up to $300,000, for which NTELOS pays the premiums and which is a benefit provided to all full-time employees; executive supplemental life insurance payout in accordance with each of the named executive officer’s employment agreements, which is a liability of the life insurance company; and earned and unpaid (ratable) TIP/Bonus payment as of December 31, 2015. The above amounts do not include supplemental life insurance payment, if applicable, for which each named executive officer paid the full premium and which is a benefit provided to all full-time employees. Supplemental life insurance is a liability of the life insurance company. The foregoing amounts are further delineated below: |
Name | Life Insurance Payments | Supplemental Executive Life Insurance | Earned and Unpaid 2015 TIP/Bonus | ||||||
Stebbins B. Chandor Jr. | $300,000 | $672,000 | $213,418 | ||||||
Brian J. O’Neil | 300,000 | 467,000 | 182,325 | ||||||
Robert L. McAvoy Jr. | 280,000 | 423,000 | 182,221 | ||||||
S. Craig Highland | 196,650 | 324,000 | 108,248 | ||||||
(b)The equity column calculation includes accelerated vesting of unvested stock options, restricted stock awards and performance share unit awards as of December 31, 2015 as follows:
Name | Unvested Stock Options | Restricted Stock | Performance Share Unit Awards | ||||||
Stebbins B. Chandor Jr. | $165,425 | $924,639 | $3,281 | ||||||
Brian J. O’Neil | 141,027 | 788,261 | 2,806 | ||||||
Robert L. McAvoy Jr. | 127,792 | 745,020 | 2,541 | ||||||
S. Craig Highland | 72,876 | 405,825 | 1,426 | ||||||
(c) | The amounts shown in this column represent accrued pension benefits payable to the surviving spouse of the NEO, if applicable, which amounts represent a one-half survivor annuity and assume payments commence on the date which the deceased named executive officer would have attained age 55. Of the named executive officers, only Messrs. McAvoy and Highland are participants in the Pension Plan. |
(4)The amounts in this column include the following:
Name | Cash(a) | Equity (b) | Pension/ NQDC (c) | Total | ||||||
Stebbins B. Chandor Jr. | $2,100,295 | $1,093,345 | $ | — | $3,193,640 | |||||
Brian J. O’Neil | 1,837,732 | 932,094 | — | 2,769,826 | ||||||
Robert L. McAvoy Jr. | 2,142,575 | 875,352 | 461,374 | 3,479,301 | ||||||
S. Craig Highland | 1,559,392 | 480,127 | 518,937 | 2,558,456 | ||||||
101
(a)The amounts shown in the cash column are based on the following amounts: earned and unpaid (ratable) TIP payment as of December 31, 2015; disability incentive payment equal to a ratable portion of the named executive officer’s target TIP of the year in which termination due to disability occurred; and present value of long-term disability coverage until age 65, which is a liability of NTELOS’s long-term disability provider. The net present value of the long-term disability coverage reported in the table reflects the maximum disability payments, and assumes no recovery or mortality. Such value would be reduced by the net present value of social security benefits beginning at age 55. The foregoing amounts are further delineated below:
Name | Disability Bonus | Disability Insurance Payments | Earned and Unpaid 2015 TIP/Bonus | |||
Stebbins B. Chandor Jr. | $215,580 | $1,671,298 | $213,418 | |||
Brian J. O’Neil | 183,785 | 1,471,622 | 182,325 | |||
Robert L. McAvoy Jr. | 166,346 | 1,900,967 | 182,221 | |||
S. Craig Highland | 97,146 | 1,353,998 | 108,248 | |||
(b)The equity column calculation includes accelerated vesting of unvested stock options, restricted stock awards and performance share unit awards as of December 31, 2015 as follows:
Name | Unvested Stock Options | Restricted Stock | Performance Share Unit Awards | |||
Stebbins B. Chandor Jr. | $165,425 | $924,639 | $3,281 | |||
Brian J. O’Neil | 141,027 | 788,261 | 2,806 | |||
Robert L. McAvoy Jr. | 127,792 | 745,020 | 2,541 | |||
S. Craig Highland | 72,876 | 405,825 | 1,426 | |||
(c) | Represents the present value of accrued pension benefits under the Pension Plan, which was frozen on December 31, 2012. Such amounts are payable over time in the form of an annuity. The values shown are based on the earliest date at which there is no early retirement reduction. Of the named executive officers, only Messrs. McAvoy and Highland are participants in the Pension Plan. |
(5)The amounts in this column include the following:
Name | Cash(a) | Equity(b) | Pension(c) | Perquisites/ Benefits(d) | Total | |||||||||||
Stebbins B. Chandor Jr. | $1,372,986 | $1,093,345 | $ | — | $474,055 | $2,957,715 | ||||||||||
Brian J. O’Neil | 1,170,874 | 932,094 | — | 517,778 | 2,635,516 | |||||||||||
Robert L. McAvoy Jr. | 630,107 | 875,352 | 461,374 | 33,418 | 2,000,251 | |||||||||||
S. Craig Highland | 698,065 | 480,127 | 518,937 | 30,778 | 1,727,907 | |||||||||||
(a)The amounts shown in the cash column are based on assumptions of the compensation and benefit levels to be in effect on December 31, 2015. Cash severance for each named executive officer comprises of the following amounts: (a) severance payments; (b) non-compete payments; (c) present value of the team incentive payment (referred to as the bonus) for the severance period; and (d) earned and unpaid TIP/bonus payment as of December 31, 2015. The foregoing amounts are further delineated below:
Name | Severance Payments | Non-Compete Payments | Severance Bonus | Earned and Unpaid 2015 TIP/Bonus | ||||
Stebbins B. Chandor Jr. | $362,457 | $362,457 | $434,654 | $213,418 | ||||
Brian J. O’Neil | 309,000 | 309,000 | 370,549 | 182,325 | ||||
Robert L. McAvoy Jr. | 210,000 | 70,000 | 167,886 | 182,221 | ||||
S. Craig Highland | 196,650 | 196,650 | 196,517 | 108,248 | ||||
102
(b)The equity column calculation includes accelerated vesting of unvested stock options, restricted stock awards and performance share unit awards as of December 31, 2015 as follows:
Name | Unvested Stock Options | Restricted Stock | Performance Share Unit Awards | ||||||
Stebbins B. Chandor Jr. | $165,425 | $924,639 | $3,281 | ||||||
Brian J. O’Neil | 141,027 | 788,261 | 2,806 | ||||||
Robert L. McAvoy Jr. | 127,792 | 745,020 | 2,541 | ||||||
S. Craig Highland | 72,876 | 405,825 | 1,426 | ||||||
(c) | Represents the present value of accrued pension benefits under the Pension Plan, which was frozen on December 31, 2012. Such amounts are payable over time in the form of an annuity. The values shown are based on the earliest date at which there is no early retirement reduction. Of the named executive officers, only Messrs. McAvoy and Highland are participants in the Pension Plan. |
(d) | Represents continued participation in NTELOS’s welfare benefit plans during the termination period and includes the present value of irrevocable post-retirement medical benefits for Messrs. Chandor and O’Neil, pursuant to the terms of their employment agreements. |
(6) | In addition to the payments included above, each named executive officer will be entitled to payment of his earned and unpaid base salary to the date of termination. The named executive officer will also be entitled to unreimbursed business and entertainment expenses in accordance with NTELOS’s policy, and unreimbursed medical, dental and other employee benefit expenses incurred in accordance with NTELOS’s employee benefit plans. Termination also will not divest the named executive officer of any previously vested benefit or right unless the terms of such vested benefit or right specifically require divestiture where the named executive officer’s employment is terminated for cause. |
Director Compensation
The following table presents information relating to total compensation of our directors for the fiscal year ended December 31, 2015.
Fees Earned or Paid in Cash | Stock Awards(1) | Option Awards | Non-Equity Incentive Plan Compensation | Change in Pension Value and Nonqualified Deferred Compensation Earnings | All Other Compensation | Total | |||||||||||||||
Name | ($) | ($) | ($) | ($) | ($) | ($) | ($) | ||||||||||||||
David A. Chorney(2) | — | — | — | — | — | 35,000 | 35,000 | ||||||||||||||
Stephen C. Duggan | 87,500 | 75,001 | (3) | — | — | — | — | 162,501 | |||||||||||||
Michael Gottdenker | 59,587 | 80,377 | (4) | — | — | — | — | 139,964 | |||||||||||||
Daniel J. Heneghan | 78,750 | 75,001 | (3) | — | — | — | — | 153,751 | |||||||||||||
Michael Huber(5) | — | — | — | — | — | — | — | ||||||||||||||
Ruth Sommers | 65,000 | 75,001 | (3) | — | — | — | — | 140,001 | |||||||||||||
Ellen O'Connor Vos | 78,334 | 75,001 | (3) | — | — | — | — | 153,335 | |||||||||||||
(1) | For a discussion of the assumptions used in determining the aggregate grant date fair value associated with our equity awards, see Note 13 of the Notes to Consolidated Financial Statements. The aggregate number of shares of restricted stock outstanding at December 31, 2015 is as follows for each of the non-employee directors: 18,293 for Messrs. Duggan, Heneghan and Mses. Sommers and Vos; and 14,353 for Mr. Gottdenker. The aggregate number of option awards outstanding at December 31, 2015 is as follows for each of the following non-employee directors: 15,468 for Mr. Duggan; 57,080 for Mr. Heneghan; 21,350 for Ms. Vos; and no options awards are outstanding for Ms. Sommers and Mr. Gottdenker. |
103
(2) | As a director designee of the Quadrangle Entities who is an employee of Quadrangle Group LLC, Mr. Chorney does not receive director compensation. Pursuant to a Consulting Agreement between Quadrangle Group LLC and the Company, the Company paid Quadrangle Group LLC for the services of Mr. Chorney relating to his assistance with the Company's wind down of operations in the Eastern Markets and with the refocus on its remaining markets. The agreement provided for a monthly payment of $17,500, plus expenses not to exceed $7,500 per month, and was in place from December 2014 through the end of February 2015. |
(3) | The closing stock price on the date of the grant, January 2, 2015, which represents the fair value of a share of restricted stock, was $4.10 per share. |
(4) | In connection with his appointment to the Board, and in accordance with existing practice for stock grants not made on a fixed schedule, Mr. Gottdenker was awarded a grant of 14,353 shares of restricted stock, representing a ratable portion of a full year director award, computed as follows: 11/12ths of $75,000 divided by the average closing stock price of our common stock for the month preceding the date of the grant (February 2015), or $4.79 per share. The grant date fair value shown in the table represents the number of shares awarded multiplied by the closing stock price on the date of the grant, March 5, 2015, or $5.60 per share. |
(5) | As a director designee of the Quadrangle Entities who is an employee of Quadrangle Group LLC, Mr. Huber does not receive director compensation. |
All non-employee directors (excluding Messrs. Dir, Huber and Chorney) receive an annual retainer of $60,000, payable in equal monthly installments. Additionally, the chairperson of our Audit Committee receives an additional annual retainer of $20,000, and each member of the Audit Committee receives an additional $7,500 annual retainer, each payable in monthly installments; the chairperson of the Nominating and Corporate Governance Committee receives an additional $10,000 annual retainer, and each other member of the Nominating and Corporate Governance Committee receives an additional $3,750 annual retainer, each payable in monthly installments. Members of the Board of Directors and committee members are not entitled to fees for attendance; however, we reimburse each of our non-employee directors for reasonable travel and other expenses incurred in connection with attending Board and Board committee meetings.
During 2015, the following individuals served as non-employee directors: Stephen C. Duggan, Michael Gottdenker (beginning February 5, 2015), Daniel J. Heneghan, Ruth Sommers and Ellen O'Connor Vos. The remaining directors who served in 2015 were Messrs. Chorney and Huber, designees of the Quadrangle Entities. In addition to their director status during 2015, Mr. Duggan was Chairperson of the Audit Committee; Mr. Heneghan was a member of the Audit Committee and the Nominating and Governance Committee; Ms. Vos was chairperson of the Nominating and Governance Committee and a member of the Compensation Committee and Audit Committee; Ms. Sommers was a member of the Compensation Committee; and Mr. Gottdenker was a member of the Compensation Committee, and they were compensated accordingly as disclosed in the table above.
To assist us in attracting and retaining qualified and experienced individuals for service as non-employee directors, each of our non-employee directors, other than Messrs. Chorney and Huber, receives an initial equity award grant and thereafter, commencing on January 1 of the subsequent year, an annual equity award grant. For 2015, these equity award grants included an annual grant of shares of our Common Stock subject to a restriction period ("restricted stock") with an aggregate value equal to $75,000 (with such value to be calculated based on the closing price of our Common Stock on the first trading day of the year), or such lesser award for a particular grant date as the Board of Directors shall determine in its sole discretion.
Pursuant to our Non-Employee Director Equity Plan, we granted each of the aforementioned non-employee directors 18,293 shares of restricted stock with a grant date fair value of $75,001 based on the closing price of our Common Stock of $4.10 per share on the date of grant. These shares of restricted stock vested on the first anniversary of the grant date. In connection with his appointment to the Board, we granted Mr. Gottdenker 14,353 shares of restricted stock on March 5, 2015 with a grant date fair value of $80,377.
We also have a policy to provide, as needed, an ongoing education program for all directors and will pay the program costs and associated travel expenses related to such director education programs.
We do not pay additional compensation to Mr. Dir or to directors who are employee directors for their service as directors but do reimburse Mr. Dir and any employee directors for expenses incurred in attending meetings of the Board of Directors and its committees.
Director Stock Ownership Guidelines
In connection with the amendments to the stock ownership guidelines applicable to our executive officers adopted by the Board of Directors in August 2011, the Board of Directors included an ownership and retention requirement applicable to those directors receiving director compensation. The guidelines generally require that each such director own a minimum number of
104
shares of our Common Stock having a value equal to three times the annual cash retainer for directors (as described above). The value of the following equity is counted toward compliance with the guidelines: shares owned (e.g., shares obtained upon vesting of restricted stock, shares obtained upon option exercise, shares purchased in the open market, shares held in the Company's defined contribution plan, etc.); shared ownership (e.g., shares owned or held in trust by immediate family); unvested restricted stock; and "in the money" value of unexercised stock options. Each director receiving director compensation generally has three years from the later of August 31, 2011 and his or her date of appointment to the Board to meet the guidelines. The value of the Common Stock is calculated as the average of the closing Common Stock price on NASDAQ for the trading days in the 30-calendar day period immediately preceding any computation. Each director must maintain the minimum value of equity ownership provided in these stock ownership guidelines. Once a director meets the applicable ownership guideline based on the closing price at a prior measurement date, he or she is required to continue to comply with such level going forward, or, in the event the director falls below the applicable ownership guideline due solely to a decline in the value of the Company's common stock, hold all Company-granted equity awards until compliance is re-established.
Item 12. | Security Ownership of Certain Beneficial Owners and Management and Related Stockholder Matters. |
BENEFICIAL OWNERSHIP OF COMMON STOCK
The following table sets forth information, as of March 8, 2016 regarding the beneficial ownership of our Common Stock by (1) our directors, (2) our NEOs, (3) stockholders owning more than 5% of our Common Stock and (4) all of our directors and executive officers as a group.
Beneficial ownership is determined under the rules of the SEC and generally includes voting or investment power over securities. Except in cases where community property laws apply or as indicated in the footnotes to this table, we believe that each stockholder identified in the table possesses sole voting and investment power over all shares of Common Stock shown as beneficially owned by the stockholder. Percentage of beneficial ownership is based on 22,257,794 shares of Common Stock outstanding as of March 8, 2016. Shares of Common Stock subject to options that are currently exercisable or exercisable within 60 days of March 8, 2016, are considered outstanding and beneficially owned by the person holding the options for the
105
purposes of computing the percentage ownership of that person, but are not treated as outstanding for the purposes of computing the percentage ownership of any other person. Unless indicated otherwise in the footnotes, the address of each individual listed in the table is c/o NTELOS Holdings Corp., 1154 Shenandoah Village Drive, Waynesboro, Virginia 22980.
Total Common Stock | ||||||
Name and Address of Beneficial Owner | Number | % | ||||
Directors, named executive officers and stockholders owning more than 5%: | ||||||
The Quadrangle Entities(1) | 4,180,837 | 18.78 | % | |||
Renaissance Technologies LLC ("RTC") and Renaissance Technologies Holdings Corporation ("RTHC")(2) | 1,404,400 | 6.31 | % | |||
Michael Huber(3) | 4,180,837 | 18.78 | % | |||
David A. Chorney(3) | 4,180,837 | 18.78 | % | |||
Stephen C. Duggan(4) | 39,095 | * | ||||
Michael Gottdenker | 14,353 | * | ||||
Daniel J. Heneghan(5) | 93,340 | * | ||||
Ruth Sommers | 19,536 | * | ||||
Ellen O'Connor Vos(6) | 47,107 | * | ||||
Rodney D. Dir(7) | 115,814 | * | ||||
Stebbins B. Chandor Jr.(8) | 441,669 | 1.96 | % | |||
Brian J. O'Neil(9) | 347,140 | 1.54 | % | |||
Robert L. McAvoy Jr.(10) | 276,339 | 1.23 | % | |||
S. Craig Highland(11) | 169,641 | * | ||||
All directors and executive officers as a group (12 persons)(12) | 5,744,871 | 24.73 | % | |||
* Less than 1%
(1) | As reported on Amendment No. 5 to Schedule 13D filed by Quadrangle GP Investors LLC and certain related persons on August 13, 2015, includes 967,253 shares of Common Stock owned by Quadrangle Capital Partners LP, 52,851 shares of Common Stock owned by Quadrangle Select Partners LP, 368,835 shares of Common Stock owned by Quadrangle Capital Partners-A LP and 2,791,898 shares of Common Stock owned by Quadrangle NTELOS Holdings II LP. Quadrangle NTELOS Holdings II LP has pledged its interest in 2,781,898 shares of Common Stock to secure repayment of a loan made to it by the Bank of Montreal. The address for the Quadrangle Entities is 1065 Avenue of the Americas, New York, NY 10018. |
(2) | Represents beneficial ownership as of October 9, 2015, according to Schedule 13G filed by Renaissance Technologies LLC ("RTC") and Renaissance Technologies Holdings Corporation ("RTHC") filed by RTC and RTHC on February 12, 2016. RTC and RTHC collectively have sole voting power and sole dispositive power over all of these shares. The address for RTC and RTHC is 800 Third Avenue, New York, New York 10022. |
(3) | Represents 4,180,837 shares beneficially owned by the Quadrangle Entities. Mr. Huber is a Managing Principal and President and Mr. Chorney is a Vice President of Quadrangle Group LLC. Each disclaims beneficial ownership of securities beneficially owned by the Quadrangle Entities. |
(4) | Includes options to purchase 15,468 shares of Common Stock. |
(5) | Includes options to purchase 57,080 shares of Common Stock. |
(6) | Includes options to purchase 21,350 shares of Common Stock. |
(7) | Includes options to purchase 46,350 shares of Common Stock. |
(8) | Includes 87,266 shares of restricted stock and options to purchase 282,814 shares of Common Stock. |
(9) | Includes 71,939 shares of restricted stock, options to purchase 227,306 shares of Common Stock. |
(10) | Includes 74,008 shares of restricted stock and options to purchase 162,719 shares of Common Stock. |
(11) | Includes 38,369 shares of restricted stock and options to purchase 99,174 shares of Common Stock. |
(12) | Includes 271,582 shares of restricted stock and options to purchase 912,261 shares of Common Stock. |
106
Securities Authorized for Issuance under Equity Compensation Plans
The following table sets forth information as of December 31, 2015 concerning the shares of Common Stock which are authorized for issuance under our equity compensation plans.
Plan Category | Number of Securities to be Issued on Exercise of Outstanding Options, Warrants and Rights (a) | Weighted Average Exercise Price of Outstanding Options, Warrants and Rights (b) | Number of Securities Remaining Available for Future Issuance Under Equity Compensation Plans (Excluding Securities Reflected in Column (a)) (c) | |||||||
Equity Compensation Plans Approved by | ||||||||||
Stockholders | ||||||||||
Employee Equity Incentive Plans | 1,431,366 | $ | 16.27 | 1,681,424 | ||||||
Non-Employee Director Equity Plan | 115,248 | $ | 19.26 | 163,865 | ||||||
Employee Stock Purchase Plan | — | — | 55,888 | |||||||
Equity Compensation Plans Not Approved by | ||||||||||
Stockholders | — | — | — | |||||||
Total | 1,546,614 | $ | 16.50 | 1,901,177 | ||||||
Item 13. | Certain Relationships and Related Transactions, and Director Independence. |
Certain Relationships and Related Transactions
Our Board of Directors has adopted a written policy that generally provides that we may enter into a related party transaction only if the Audit Committee shall approve or ratify such transaction in accordance with the guidelines set forth in the policy and if the transaction is on terms comparable to those that could be obtained in arm's length dealings with an unrelated third party, the transaction is approved by the disinterested members of the Board of Directors, or the transaction involves compensation approved by our Compensation Committee.
Our Audit Committee Charter provides that management shall report to the Audit Committee any proposed "related party" transaction that might be considered material to us or the related party, or required to be disclosed by applicable disclosure rules. The Audit Committee shall be responsible for the review and oversight contemplated by NASDAQ with respect to any such reported transactions.
Director Independence
The Board of Directors considers director independence based both on the meaning of the term "independent director" set forth in Rule 5605(a)(2) of the NASDAQ listing standards and on an overall review of transactions and relationships, if any, between the director and the Company. Our Board of Directors is comprised of a majority of independent directors, and all committees of the Board of Directors are comprised only of independent directors. The independent directors of the Board of Directors had the opportunity to meet in executive session following each meeting of the full Board of Directors during 2015.
In March 2016, the Nominating and Governance Committee and the Board of Directors undertook their annual review of director independence. There were no transactions or relationships between any director who is not an employee of the Company or any member of his or her immediate family and the Company for the Committee and the Board of Directors to consider that would be inconsistent with a determination that the nominee is independent.
The Nominating and Governance Committee and the Board of Directors have determined that Messrs. Chorney, Duggan, Gottdenker, Heneghan and Huber and Mses. Vos and Sommers are independent under the NASDAQ listing standards.
107
Item 14. | Principal Accounting Fees and Services. |
Fees
In connection with the audit of the 2015 financial statements, we entered into an engagement agreement with KPMG LLP, which set forth the terms by which KPMG LLP would perform audit services for us. That agreement was subject to alternative dispute resolution procedures and a mutual exclusion of damages other than the prevailing party’s actual and punitive damages.
The following table presents fees for professional services and expenses billed to us by KPMG LLP for the fiscal years ended 2015 and 2014.
Fiscal 2015 | Fiscal 2014 | |||||||
Audit fees | $ | 861,200 | $ | 828,550 | ||||
Audit-related fees | — | — | ||||||
Tax fees | — | — | ||||||
All other fees | — | 1,650 | ||||||
Total | $ | 861,200 | $ | 830,200 | ||||
Audit Fees
Audit fees include fees and expenses paid by us to KPMG LLP in connection with the annual audit of our consolidated financial statements, KPMG LLP’s review of our interim financial statements, KPMG’s review of our Annual Report on Form 10-K and KPMG’s assessment of the effectiveness of the internal controls over our financial reporting. Audit fees also include fees for services that are normally provided by the independent registered public accounting firm in connection with statutory or regulatory filings or engagements, including comfort letters and consents issued in connection with SEC filings.
All Other Fees
All other fees for 2014 are fees related to access to an on-line accounting research tool.
Audit Committee Pre-Approval Policy
The Audit Committee’s policy is that all audit and permitted non-audit services provided by its independent registered public accounting firm shall either be approved before the independent registered public accounting firm is engaged for the particular services or shall be rendered pursuant to pre-approval procedures established by the Audit Committee. Pre-approval spending limits for all services to be performed by the independent registered public accounting firm are established periodically by the Audit Committee, detailed as to the particular service or category of services to be performed and implemented by our financial officers. The term of any pre-approval is 12 months from the date of pre-approval, unless the Audit Committee specifically provides for a different period. Any audit or non-audit service fees that we may incur that fall outside the limits pre-approved by the Audit Committee for a particular service or category of services require separate and specific pre-approval by the Audit Committee prior to the performance of services. For each fiscal year, the Audit Committee may determine the appropriate ratio between the total amount of fees for audit, audit-related, tax and other services. The Audit Committee may revise the list of pre-approved services from time to time. In all pre-approval instances, the Audit Committee will consider whether such services are consistent with the SEC rules on auditor independence.
PART IV
Item 15. | Exhibits, Financial Statement Schedules. |
(1) | Consolidated Financial Statements |
The consolidated financial statements required to be filed in this Annual Report on Form 10-K are listed in Item 8 hereof.
(3) | Exhibits |
The exhibits listed below are filed as part of, or incorporated by reference into, this Annual Report on Form 10-K.
108
Exhibit No. | Description | |
2.1(1) | Agreement and Plan of Merger, dated as of August 10, 2015, by and among Shenandoah Telecommunications Company, Gridiron Merger Sub, Inc. and NTELOS Holdings Corp. | |
3.1(2) | Amended and Restated Certificate of Incorporation of Holdings. | |
3.2(3) | Certificate of Amendment to the Amended and Restated Certificate of Incorporation of Holdings. | |
3.3(1) | Amended and Restated Bylaws of Holdings. | |
4.1(4) | Amended and Restated Stockholders Agreement by and among Holdings and the stockholders listed on the signature pages thereto. | |
4.2(1) | Voting Agreement, dated as of August 10, 2015, by and among Shenandoah Telecommunications Company, Gridiron Merger Sub, Inc., the Quadrangle Stockholders, and NTELOS Holdings Corp. | |
10.1(4)+ | Holdings Amended and Restated Equity Incentive Plan. | |
10.2(5)+ | First Amendment to the NTELOS Holdings Corp. Amended and Restated Equity Incentive Plan. | |
10.3(6)+ | NTELOS Holdings Corp. 2010 Equity and Cash Incentive Plan. | |
10.4(4)+ | Holdings Employee Stock Purchase Plan, as amended. | |
10.5(4)+ | Form of Award Agreement under Holdings Amended and Restated Equity Incentive Plan. | |
10.6(4)+ | Holdings Non-Employee Director Equity Plan. | |
10.7(7) | Second Amendment and Restatement Agreement to the Amended and Restated Credit Agreement, with the Second Amended and Restated Credit Agreement, dated as of January 31, 2014, attached as Exhibit A thereto. | |
10.8(8)++ | Amended and Restated Resale Agreement, dated as of May 1, 2014, by and among West Virginia PCS Alliance, L.C., Virginia PCS Alliance, L.C., NTELOS Inc. and Sprint Spectrum L.P. and its Designated Affiliates. | |
10.9(9)+ | NTELOS Inc. 2005 Executive Supplemental Retirement Plan, as amended and restated December 21, 2006. | |
10.10(10)+ | Form of Stock Option Award Agreement under Holdings Non-Employee Director Equity Plan. | |
10.11(10)+ | Form of Restricted Stock Award Agreement under Holdings Non-Employee Director Equity Plan. | |
10.12(11)+ | Form of Stock Option Grant Award Agreement. | |
10.13(12)+ | Form of Restricted Stock Award Agreement. | |
10.14(13)+ | Form of Executive Stock Option Agreement under NTELOS Holdings Corp. 2010 Equity and Cash Incentive Plan. | |
10.15(13)+ | Form of Executive Restricted Stock Agreement under NTELOS Holdings Corp. 2010 Equity and Cash Incentive Plan. | |
10.16(14)+ | Form of Stock Option Grant Award Agreement. | |
10.17(14)+ | Form of Restricted Stock Award Grant Agreement. | |
10.18(14)+ | Form of Performance Stock Unit Grant Agreement. | |
10.19(15)+ | Employment Agreement, dated December 7, 2010, between NTELOS Holdings Corp. and Robert L. McAvoy, Jr. | |
10.20(16)+ | Employment Agreement, dated July 29, 2011, between NTELOS Holdings Corp. and Stebbins B. Chandor Jr. | |
10.21(15)+ | Employment Agreement, dated August 17, 2011, between NTELOS Holdings Corp. and Brian J. O'Neil. | |
10.22(17)+ | Employment Agreement, dated November 1, 2011, between NTELOS Holdings Corp. and S. Craig Highland | |
10.23(18)+ | Professional Services Agreement between NTELOS Holdings Corp. and Rodney D. Dir, dated as of July 28, 2014. | |
10.24(19)+ | Professional Services Agreement between NTELOS Holdings Corp. and Rodney D. Dir, dated as of February 1, 2015. | |
10.25(20)+ | Professional Services Agreement between NTELOS Holdings Corp. and Rodney D. Dir, dated as of December 21, 2015 | |
10.26(20)+ | Form of Phantom Stock Agreement for Rodney D. Dir. | |
10.27(21)+ | Form of Phantom Stock Agreement for named executive officers. | |
10.28(22) | License Purchase Agreement dated as of December 1, 2014, by and among T-Mobile License LLC, Richmond 20 MHz, LLC and NTELOS Inc. | |
21.1* | Subsidiaries of Holdings. | |
109
23.1* | Consent of KPMG LLP. | |
31.1* | Certificate of the principal executive officer pursuant to Rule 13a-14(a). | |
31.2* | Certificate of the principal financial officer pursuant to Rule 13a-14(a). | |
32.1* | Certificate of the chief executive officer pursuant to 18 U.S.C. Section 1350, as adopted pursuant to Section 906 of the Sarbanes-Oxley Act of 2002. | |
32.2* | Certificate of the chief financial officer pursuant to 18 U.S.C. Section 1350, as adopted pursuant to Section 906 of the Sarbanes-Oxley Act of 2002. | |
101.INS* | XBRL Instance Document. | |
101.SCH* | XBRL Taxonomy Extension Schema Document. | |
101.CAL* | XBRL Taxonomy Extension Calculation Linkbase Document. | |
101.DEF* | XBRL Taxonomy Extension Definition Linkbase Document. | |
101.LAB* | XBRL Taxonomy Extension Label Linkbase Document. | |
101.PRE* | XBRL Taxonomy Extension Presentation Linkbase Document. | |
* | Filed herewith. |
+ | Management contracts and arrangements. |
++ | Confidential treatment has been granted for certain portions of this exhibit pursuant to a confidential treatment order granted by the Securities and Exchange Commission. Such portions have been omitted and filed separately with the Securities and Exchange Commission. |
(1) | Filed as an exhibit to Current Report on Form 8-K filed August 11, 2015. |
(2) | Filed as an exhibit to Current Report on Form 8-K filed May 11, 2011. |
(3) | Filed as an exhibit to Current Report on Form 8-K filed November 4, 2011. |
(4) | Filed as an exhibit to Annual Report on Form 10-K for the year ended December 31, 2005 filed March 28, 2006. |
(5) | Filed as an exhibit to Current Report on Form 8-K filed December 19, 2008. |
(6) | Filed as Annex A to Definitive Proxy Statement on Schedule 14A filed March 15, 2010. |
(7) | Filed as an exhibit to Current Report on Form 8-K filed February 6, 2014 |
(8) | Filed as an exhibit to Quarterly Report on Form 10-Q filed July 29, 2014. |
(9) | Filed as an exhibit to Current Report on Form 8-K filed December 21, 2006. |
(10) | Filed as an exhibit to Annual Report on Form 10-K filed February 26, 2010. |
(11) | Filed as an exhibit to Current Report on Form 8-K filed March 6, 2007. |
(12) | Filed as an exhibit to Current Report on Form 8-K filed March 4, 2008. |
(13) | Filed as an exhibit to Current Report on Form 8-K filed March 6, 2012. |
(14) | Filed as an exhibit to Quarterly Report on Form 10-Q filed May 8, 2013. |
(15) | Filed as an exhibit to Quarterly Report on Form 10-Q filed May 1, 2012. |
(16) | Filed as an exhibit to Current Report on Form 8-K filed August 1, 2011. |
(17) | Filed as an exhibit to Annual Report on Form 10-K/A for the year ended December 31, 2014 filed April 30, 2015. |
(18) | Filed as an exhibit to Current Report on Form 8-K filed July 31, 2014. |
(19) | Filed as an exhibit to Current Report on Form 8-K filed February 5, 2015. |
(20) | Filed as an exhibit to Current Report on Form 8-K filed December 22, 2015. |
(21) | Filed as an exhibit to Current Report on Form 8-K filed March 2, 2016. |
(22) | Filed as an exhibit to Current Report on Form 8-K filed December 2, 2014. |
110
SIGNATURES
Pursuant to the requirements of Section 13 or 15(d) of the Securities Exchange Act of 1934, the registrant has duly caused this Annual Report on Form 10-K to be signed on its behalf by the undersigned, thereunto duly authorized.
NTELOS HOLDINGS CORP. | ||
By: | /s/ Rodney D. Dir | |
Name: | ||
Title: | President and Chief Executive Officer | |
Date: | March 11, 2016 | |
Pursuant to the requirements of the Securities Exchange Act of 1934, this Annual Report on Form 10-K has been signed below by the following persons on behalf of the registrant and in the capacities and on the dates indicated:
Signature | Title | Date | ||
/s/ Rodney D. Dir | President, Chief Executive Officer and Director (principal executive officer) | March 11, 2016 | ||
Rodney D. Dir | ||||
/s/ Stebbins B. Chandor Jr. | Executive Vice President and Chief Financial Officer, Treasurer and Assistant Secretary (principal financial officer) | March 11, 2016 | ||
Stebbins B. Chandor Jr. | ||||
/s/ John Turtora | Vice President and Controller (principal accounting officer) | March 11, 2016 | ||
John Turtora | ||||
/s/ Michael Huber | Chairman of the Board and Director | March 11, 2016 | ||
Michael Huber | ||||
/s/David A. Chorney | Director | March 11, 2016 | ||
David A. Chorney | ||||
/s/ Stephen C. Duggan | Director | March 11, 2016 | ||
Stephen C. Duggan | ||||
/s/ Michael Gottdenker | Director | March 11, 2016 | ||
Michael Gottdenker | ||||
/s/ Daniel J. Heneghan | Director | March 11, 2016 | ||
Daniel J. Heneghan | ||||
/s/ Ruth Sommers | Director | March 11, 2016 | ||
Ruth Sommers | ||||
/s/ Ellen O’Connor Vos | Director | March 11, 2016 | ||
Ellen O’Connor Vos | ||||
111