Attached files
| file | filename |
|---|---|
| EX-21.1 - EXHIBIT 21.1 - NTELOS HOLDINGS CORP. | dex211.htm |
| EX-10.10 - EXHIBIT 10.10 - NTELOS HOLDINGS CORP. | dex1010.htm |
| EX-10.15 - EXHIBIT 10.15 - NTELOS HOLDINGS CORP. | dex1015.htm |
| EX-10.16 - EXHIBIT 10.16 - NTELOS HOLDINGS CORP. | dex1016.htm |
| EX-23.1 - EXHIBIT 23.1 - NTELOS HOLDINGS CORP. | dex231.htm |
| EX-31.1 - EXHIBIT 31.1 - NTELOS HOLDINGS CORP. | dex311.htm |
| EX-32.2 - EXHIBIT 32.2 - NTELOS HOLDINGS CORP. | dex322.htm |
| EX-32.1 - EXHIBIT 32.1 - NTELOS HOLDINGS CORP. | dex321.htm |
| EX-31.2 - EXHIBIT 31.2 - NTELOS HOLDINGS CORP. | dex312.htm |
Table of Contents
UNITED STATES
SECURITIES AND EXCHANGE COMMISSION
Washington, D.C. 20549
FORM 10-K
(Mark One)
| x | ANNUAL REPORT PURSUANT TO SECTION 13 OR 15(d) OF THE SECURITIES EXCHANGE ACT OF 1934 |
For the fiscal year ended December 31, 2009
or
| ¨ | TRANSITION REPORT PURSUANT TO SECTION 13 OR 15(d) OF THE SECURITIES EXCHANGE ACT OF 1934 |
For the transition period from to .
Commission File Number: 000-51798
NTELOS Holdings Corp.
(Exact name of registrant as specified in its charter)
| Delaware | 36-4573125 | |
| (State or other jurisdiction of incorporation or organization) |
(I.R.S. Employer Identification No.) |
401 Spring Lane, Suite 300, PO Box 1990, Waynesboro, Virginia 22980
(Address of principal executive offices) (Zip Code)
(540) 946-3500
(Registrant’s telephone number, including area code)
Securities registered pursuant to Section 12(b) of the Act:
| Title of each class |
Name of each exchange on which registered | |
| Common stock, $0.01 par value | The NASDAQ Stock Market LLC |
Securities registered pursuant to Section 12(g) of the Act:
None
Indicate by check mark if the registrant is a well-known seasoned issuer, as defined in Rule 405 of the Securities Act. x Yes ¨ No
Indicate by check mark if the registrant is not required to file reports pursuant to Section 13 or Section 15(d) of the Act. ¨ Yes x No
Indicate by check mark whether the registrant (1) has filed all reports required to be filed by Section 13 or 15(d) of the Securities Exchange Act of 1934 during the preceding 12 months (or for such shorter period that the registrant was required to file such reports), and (2) has been subject to such filing requirements for the past 90 days. x Yes ¨ No
Indicate by check mark whether the registrant has submitted electronically and posted on its corporate Web site, if any, every Interactive Data File required to be submitted and posted pursuant to Rule 405 of Regulation S-T (§ 232.405 of this chapter) during the preceding 12 months (or for such shorter period that the registrant was required to submit and post such files). ¨ Yes ¨ No
Indicate by check mark if disclosure of delinquent filers pursuant to Item 405 of Regulation S-K (§ 229.405 of this chapter) is not contained herein, and will not be contained, to the best of registrant’s knowledge, in definitive proxy or information statements incorporated by reference in Part III of this Form 10-K or any amendment to this Form 10-K. x
Indicate by check mark whether the registrant is a large accelerated filer, an accelerated filer, a non-accelerated filer or a smaller reporting company. See definitions of “large accelerated filer”, “accelerated filer” and “smaller reporting company” in Rule 12b-2 of the Exchange Act. (Check one):
| Large accelerated filer | x | Accelerated filer | ¨ | |||
| Non-accelerated filer | ¨ (Do not check if a smaller reporting company) | Smaller reporting company | ¨ | |||
Indicate by check mark whether the registrant is a shell company (as defined in Rule 12b-2 of the Act). ¨ Yes x No
The aggregate market value of the voting and non-voting common equity held by non-affiliates of the registrant on June 30, 2009 was $566,385,160 (based on the closing price for shares of the registrant’s common stock as reported on the NASDAQ Global Market on that date). In determining this figure, the registrant has assumed that all of its directors, executive officers and persons beneficially owning more than 10% of the outstanding common stock are affiliates. This assumption shall not be deemed conclusive for any other purpose.
There were 41,460,956 shares of the registrant’s common stock outstanding as of the close of business on February 22, 2010.
DOCUMENTS INCORPORATED BY REFERENCE
| Document |
Incorporated Into | |
| Proxy statement for the 2010 Annual Meeting of Stockholders |
Part III |
Table of Contents
2009 ANNUAL REPORT ON FORM 10-K
TABLE OF CONTENTS
1
Table of Contents
FORWARD-LOOKING STATEMENTS
Any statements contained in this report that are not statements of historical fact, including statements about our beliefs and expectations, are forward-looking statements and should be evaluated as such. The words “anticipates,” “believes,” “expects,” “intends,” “plans,” “estimates,” “targets,” “projects,” “should,” “may,” “will” and similar words and expressions are intended to identify forward-looking statements. These forward-looking statements are contained throughout this report, for example in “Business,” “Risk Factors,” and “Management’s Discussion and Analysis of Financial Condition and Results of Operations.” Such forward-looking statements reflect, among other things, our current expectations, plans and strategies, and anticipated financial results, all of which are subject to known and unknown risks, uncertainties and factors that may cause our actual results to differ materially from those expressed or implied by these forward-looking statements. Many of these risks are beyond our ability to control or predict. All forward-looking statements attributable to us or persons acting on our behalf are expressly qualified in their entirety by the cautionary statements contained throughout this report. Because of these risks, uncertainties and assumptions, you should not place undue reliance on these forward-looking statements. These risks and other factors include those listed under “Risk Factors” and elsewhere in this report. Furthermore, forward-looking statements speak only as of the date they are made. We do not undertake any obligation to update or review any forward-looking information, whether as a result of new information, future events or otherwise.
| Item 1. | Business. |
Overview
We are a leading provider of wireless and wireline communications services to consumers and businesses primarily in Virginia and West Virginia. Our primary services are wireless digital personal communications services (“PCS”), local and long distance telephone services, high capacity transport, data services for Internet access and wide area networking, and IPTV-based video services.
We have three reportable business segments, which conduct the following principal activities:
| • | Wireless –wireless digital PCS marketed through an NTELOS-branded retail business, including the FRAWG brand, and a wholesale business which primarily relates to an exclusive contract with Sprint Spectrum L.P, an indirect wholly owned subsidiary of Sprint Nextel Corporation (hereinafter collectively referred to as “Sprint Nextel”); |
| • | Rural Local Exchange Carrier (“RLEC”) –wireline communications services offered to residential and business customers in the western Virginia cities of Waynesboro and Covington, and portions of Alleghany, Augusta and Botetourt counties; |
| • | Competitive Wireline –high capacity transport services, data and voice services marketed primarily to business customers through our competitive local exchange carrier (“CLEC”) and Internet Service Provider (“ISP”) operation and wholesale carriers’ carrier operations. |
We group together unallocated corporate related items that do not provide direct benefit to the operating segments and equity-based compensation charges, as well as results from our paging and other communication services businesses, which are not considered separate reportable segments, and refer to them as Other Communication Services (“Other”).
For detailed financial information about our business segments, see Note 4 to the audited consolidated financial statements contained in Part II, Item 8. of this Annual Report on Form 10-K and for a detailed review of our financial performance and results of operations by business segment, see Part II, Item 7. Managements’ Discussion and Analysis of Financial Condition and Results of Operations of this Annual Report on Form 10-K.
We conduct all of our business through our wholly-owned subsidiary NTELOS Inc. and its subsidiaries. Our principal executive offices are located at 401 Spring Lane, Suite 300, Waynesboro, Virginia 22980. The telephone number at that address is (540) 946-3500.
2
Table of Contents
Wireless Business
Overview
Our wireless business operates a 100% CDMA digital PCS network in Virginia, West Virginia, and portions of Pennsylvania, Kentucky, Maryland, Ohio and North Carolina with a total covered population (“POPs”) of 5.6 million people. We began acquiring PCS spectrum in western Virginia and West Virginia in June 1995 and began operations in Virginia in late 1997 and in West Virginia in late 1998. We entered eastern Virginia in 2000. Our coverage in Virginia includes Richmond, Hampton Roads/Norfolk, Roanoke, Lynchburg, Charlottesville, Staunton, Harrisonburg, Covington, Clifton Forge, Winchester, Danville, Tazewell, and Martinsville, as well as our headquarters in Waynesboro. The coverage of our wireless business also includes Charleston, Huntington, Parkersburg, Morgantown, Clarksburg, Fairmont, Beckley, Bluefield, and Lewisburg in West Virginia, Ashland, Kentucky, Portsmouth, Ohio and the Outer Banks of North Carolina. We believe our regional focus and contiguous service area provide us with a differentiated competitive position relative to our primary wireless competitors, most of whom are national providers.
Spectrum Holdings
PCS
We hold licenses for all of the 1900 MHz PCS spectrum used in our network. At December 31, 2009, we operated our CDMA network in 21 basic trading areas with licensed POPs of 7.8 million with an average spectrum depth of 23 MHz. We also hold licenses in eight additional basic trading areas which are currently classified as excess spectrum. The following table shows a breakdown of our 1900 MHz PCS spectrum position.
NTELOS’ Spectrum Position (POPs in thousands)
as of December 31, 2009
| Basic Trading Area |
||||||||||||
| Number |
Name |
PCS Spectrum Block |
Licensed POPs (1) | Covered POPs (1) | MHz | |||||||
| Virginia East |
||||||||||||
| 156 | Fredericksburg, VA | E | 235.4 | 101.8 | 10 | |||||||
| 324 | Norfolk, VA | B | 1,878.7 | 1,644.8 | 20 | |||||||
| 374 | Richmond, VA | B | 1,462.1 | 1,102.0 | 20 | |||||||
| 374 | Richmond, VA – Partitioned Counties | B | 49.0 | (4) | — | 30 | ||||||
| Subtotal | 3,576.2 | 2,848.6 | 19 | (2) | ||||||||
| Virginia West |
||||||||||||
| 75 | Charlottesville, VA | C | 278.4 | 192.2 | 20 | |||||||
| 104 | Danville, VA | B | 162.8 | 111.0 | 30 | |||||||
| 179 | Hagerstown, MD | E/F | 469.2 | 214.3 | 20 | |||||||
| 183 | Harrisonburg, VA | D/E | 166.5 | 112.4 | 20 | |||||||
| 266 | Lynchburg, VA | B | 182.9 | 155.9 | 30 | |||||||
| 284 | Martinsville, VA | B | 89.8 | 63.5 | 30 | |||||||
| 376 | Roanoke, VA | B | 697.0 | 565.5 | 30 | |||||||
| 430 | Staunton, VA | B | 127.7 | 119.7 | 30 | |||||||
| 479 | Winchester, VA | C | 215.2 | 180.0 | 20 | |||||||
| Subtotal | 2,389.5 | 1,714.5 | 25 | (2) | ||||||||
3
Table of Contents
| Basic Trading Area |
|||||||||||
| Number |
Name |
PCS Spectrum Block |
Licensed POPs (1) | Covered POPs (1) | MHz | ||||||
| West Virginia |
|||||||||||
| 35 | Beckley, WV | B | 161.1 | 81.9 | 30 | ||||||
| 48 | Bluefield, WV | B | 155.8 | 78.4 | 30 | ||||||
| 73 | Charleston, WV (3) | A/B | 475.4 | 255.9 | 30 | ||||||
| 82 | Clarksburg, VA | C/E | 192.4 | 97.1 | 20 | ||||||
| 137 | Fairmont, WV | C/F | 56.4 | 41.2 | 40 | ||||||
| 197 | Huntington, WV | B | 367.1 | 231.8 | 30 | ||||||
| 306 | Morgantown, WV | C/F | 112.9 | 74.1 | 25 | ||||||
| 359 | Portsmouth, OH | B | 92.2 | 45.8 | 30 | ||||||
| 342 | Parkersburg, WV-Marietta, OH | C | 178.2 | 97.1 | 30 | ||||||
| Subtotal | 1,791.5 | 1,003.3 | 29 | (2) | |||||||
| Total Operating Spectrum | 7,757.2 | 5,566.4 | 23 | ||||||||
| Excess |
|||||||||||
| 471 | Wheeling, WV | C | 196.4 | N/A | 15 | ||||||
| 474 | Williamson, WV – Pikeville, KY | B | 169.2 | N/A | 30 | ||||||
| 23 | Athens, OH | A | 122.9 | N/A | 15 | ||||||
| 80 | Chillicothe, OH | A | 106.4 | N/A | 15 | ||||||
| 100 | Cumberland, MD | C/D | 165.0 | N/A | 20 | ||||||
| 259 | Logan, WV | B | 35.4 | N/A | 30 | ||||||
| 487 | Zanesville – Cambridge, OH | A | 190.2 | N/A | 15 | ||||||
| 12 | Altoona, PA | C | 221.8 | N/A | 15 | ||||||
| Subtotal | 1,207.3 | 18 | (2) | ||||||||
| Total | 8,964.5 | 5,566.4 | 23 | ||||||||
| (1) | Source: Map Info: Custom Data, Total Population—Current Year and Five Year USA By Block Group: United States, SO215245. For purposes of this disclosure, Covered POPs represents people within the network coverage area. |
| (2) | Weighted average MHz based on licensed POPs. |
| (3) | “A” block excludes Kanawha, Putnam and Fayette counties. |
| (4) | Partitioned POPs not included in subtotal. |
4
Table of Contents
Advanced Wireless Services (“AWS”)
During September 2006, we purchased seven AWS licenses. The AWS spectrum is potentially operable in seven cellular market areas with licensed POPs of 1.4 million, all of which are within our existing PCS licensed markets. This spectrum is intended to be used by mobile devices for mobile data, video and messaging services. The following table presents a breakdown of our AWS spectrum position at December 31, 2009.
| Cellular Market Area |
||||||||
| Number |
Name |
AWS Spectrum Block |
Licensed POPs (in thousands) (1) |
MHz | ||||
| 157 | Roanoke, VA | A | 254.4 | 20 | ||||
| 203 | Lynchburg, VA | A | 183.0 | 20 | ||||
| 683 | Giles, VA | A | 212.9 | 20 | ||||
| 684 | Bedford, VA | A | 205.8 | 20 | ||||
| 256 | Charlottesville, VA | A | 190.1 | 20 | ||||
| 685 | Bath, VA | A | 62.5 | 20 | ||||
| 686 | Highland, VA | A | 263.0 | 20 | ||||
| Total | 1,371.7 | 20 | ||||||
| (1) | Source: Map Info: Custom Data, Population Current Year and Five Year USA By Block Group: U.S., SO215245 |
Other Spectrum
In addition to PCS and AWS spectrum, we hold a wireless communications service (“WCS”) license in Columbus, OH, Broadband Radio Service (“BRS”) licenses in western Virginia (BRS was formerly known as multichannel multipoint distribution service) and local multipoint distribution service (“LMDS”) licenses in portions of Virginia, Kentucky, West Virginia and Maryland. With the exception of our BRS licenses, other spectrum is non-operational.
Wireless Retail Business
Overview
We offer wireless voice and data services to retail customers throughout our service area under the NTELOS brand name and, in certain markets, the FRAWG brand name. We offer customers a variety of postpay and prepay plans. Our “Value” proposition targets value-conscious customers who want solid 3G network service and performance, a broad array of devices including Smartphones, and local customer service at an affordable price. It also focuses on unlimited services that include nationwide coverage through our wholesale relationship with Sprint Nextel. Our local customer service is supported by our two regional call centers and 76 company-owned retail locations. In 2009 we implemented a full service Web portal that greatly enhanced the customer self-care experience. Additional prepay functionality was included in a platform upgrade completed in Q3 2009. This upgrade included improved data pricing options, payment flexibility and online self-care. Advertising and marketing is geared towards attracting customers from other wireless carriers (“switchers”) who want a comparable value at a lower cost. Our focus has been on high-value postpay customers but as the postpay segment continues to mature, we will continue to extend our wireless offerings, such as our offering for high-value prepay prospects.
Certain of our prepay competitors, which include Straight Talk, Boost, Page Plus and Virgin Mobile, launched unlimited nationwide voice and text plans at aggressive price points, impacting our growth potential in subscribers and revenue. These competitors have also significantly increased their points of distribution especially with large “big box” retailers. To remain competitive with our prepaid product offerings, we launched the FRAWG Unlimited Wireless brand in the Richmond and Hampton Roads, Virginia markets late in the second quarter of 2009, and will continue to add value to our overall prepay services in 2010. While FRAWG plans feature competitive price points, our acquisition costs are substantially lower with reduced handset subsidy and selling costs.
5
Table of Contents
Service Offerings
The chart below briefly describes the plans and provides a breakdown of subscribers as of December 31, 2009:
| Product |
Retail Subscribers |
% of Subscribers |
Description | ||||
| Postpay |
306,746 | 70 | % | •3G Nationwide Network
•Affordable plans for families and individuals including Calling Circle functionality
•Broad array of full featured handsets and Smartphones, including such popular brands as Samsung, LG, BlackBerry, Motorola and Android
•Affordable Anytime Upgrades
•1- or 2-Year Service Agreement
•Data service offerings include text and picture messaging, mobile broadband access and access to a wide array of applications, including games, ring tones and other mobile applications
•Online Self Care
•Overage Alerts and Surprise Charge Capping | |||
| Prepay |
131,783 | 30 | % | •Branded FRAWG plans in select markets
•Simple pricing structure with fewer options. Plans include text and data features at higher pricing levels. Pay per minute and day options also available.
•Data service offerings include text and picture messaging, mobile broadband access and access to a wide array of applications, including games, ring tones and other mobile applications
•Online Self Care
•Flexible prepaid payment options include web, credit card, bank draft or cash
•In 2010 we will offer International SMS and a Nationwide unlimited voice option as an add-on to prepay services | |||
6
Table of Contents
| • | Postpay |
| • | Postpay plans continue to be our most popular service offerings and account for approximately 70% of our total wireless customers. Postpay service offerings include UNLIMITED minute plans which offer customers unlimited day, night, and weekend calling from anywhere on our network. This popular family of rate plans may include nationwide long distance and nationwide roaming minutes, and certain plans may be shared for an additional fee. |
| • | Our Nationwide plans account for approximately 52% of our wireless postpay customers. These plans feature nationwide long distance, no roaming charges, low overage charges and shared lines. |
| • | All postpay plans are available with one- or two-year service agreements and most can share up to four lines for an additional monthly service fee. Plans may include nationwide long distance calling, roaming, and a variety of added-value features like Caller ID and integrated voicemail. |
| • | Postpay users can take advantage of all data service offerings such as text and picture messaging, mobile broadband access, and downloading of games, ring tones, and a wide array of other mobile applications. |
| • | Prepay - Pay in advance type plans represent approximately 30% of our total wireless customers and include the following separate categories of plans: |
| • | FRAWG. FRAWG represents approximately 41% of our wireless prepay customers and is positioned as an unlimited voice and text service on our network targeting credit-challenged consumers. Customers pay their monthly charges in advance by web, credit card, bank draft, or cash, thus eliminating credit checks and bad debt exposure. FRAWG customers can also prepay to have access to certain data features such as mobile broadband, text messaging, games and ringtones. FRAWG distribution is largely focused in our Richmond and Hampton Roads markets within direct and indirect channels. It also serves as our prepay product offering in the markets of Parkersburg, WV and Winchester, VA. |
| • | Pay in Advance. Pay in Advance represents approximately 59% of our wireless prepay customers and is positioned as an unlimited voice and text service on our network predominantly in our Virginia West and West Virginia markets targeting credit-challenged consumers. Pay in Advance features and functionality mirror FRAWG with slightly higher rate plans, but lower upfront acquisition and renewal costs. |
| • | Data Services. We extended Smartphone, BlackBerry and Data Card offerings to our prepay customers in Q4 2009 and Q1 2010. In August 2009, we transitioned our prepay billing services from VeriSign to Convergys Information Management Group, Inc. (“Convergys”). The Convergys billing platform gives us new flexibility and capabilities for offering data services to our prepay customers. |
Sales, Marketing and Customer Care
We target “switchers” and customers that are new to wireless by offering competitive plans in both the postpay and prepay segments. With the completion of our 3G network build out and our relationship with Sprint Nextel, we are able to provide services to not only the consumer market, but also to small/medium enterprises as well as the education, municipal and medical markets.
Advertising is focused on driving traffic to our retail locations, indirect agent locations, inside sales representatives and our website. Company-owned distribution is a key component of our wireless growth strategy, with supporting distribution from indirect agent locations which extend our wireless retail points of presence. The focus on company-owned distribution is evidenced by wireless customer acquisitions. In the year ended December 31, 2009, 81% of gross additions were acquired through direct channels and, at December 31, 2009, we had 76 retail point of sale locations. Our direct distribution is supplemented by 120 regional agents in over 300 locations.
Our wireless customer care call centers are located in Waynesboro, Covington and Daleville, Virginia. We operate a single virtual call center, minimizing headcount and supporting uniform customer service across our region. Business operations are supported by an integrated systems infrastructure. We provide customer care and operations representatives with incentives to up-sell additional products and features. Also, we utilize a retention team to focus on either renewing or maintaining our customers.
7
Table of Contents
Our new web portal not only enhances the experience for our customers desiring self care, it also enables a fully integrated shopping cart allowing customers to purchase, add and change services.
Wireless Wholesale Business
We provide digital PCS services on a wholesale basis to other PCS providers, most notably Sprint Nextel through our Strategic Network Alliance. Under the Strategic Network Alliance, we are the exclusive PCS service provider in our western Virginia and West Virginia service area for all Sprint CDMA wireless customers through July 31, 2015, and then subject to automatic three-year extensions unless the notice provisions are exercised. The Strategic Network Alliance covers all Sprint Nextel wireless customers in its western Virginia and West Virginia service area, including the following markets, which we refer to as the “Market”: Charlottesville, Danville, Lynchburg, Martinsville, Roanoke and Staunton-Waynesboro, Virginia; Beckley, Bluefield, Charleston, Clarksburg/Elkins, Fairmont, Huntington and Morgantown, West Virginia; and Ashland, Kentucky. In addition to PCS services, the Strategic Network Alliance gives us exclusivity for all other CDMA services in the Market. We are also the exclusive provider of roaming/travel services in the Market to all Sprint Nextel PCS customers.
Subject to certain limited exceptions, we agreed under the Strategic Network Alliance to achieve Evolution-Data Optimized Revision A technology (“EV-DO”) deployment in 95% of the Market by January 31, 2010 and 98% of the Market by January 31, 2011. We met these build-out requirements during the fourth quarter of 2008, achieving EV-DO build-out of 98% of the network in the Market (85% of our total cell sites).
The Strategic Network Alliance specifies a series of rates for various types of services. The voice rate pricing under the agreement provides for volume discounts in the future to provide incentives for the migration of additional traffic onto the network. The data rate pricing under the agreement reflects the recognition of the significant growth experience in data usage and anticipated growth from the introduction of higher speed data services as a result of the network upgrade. The data rate pricing also provides incentives for the migration of additional traffic onto the network.
Specifically, there are separate rate structures for each of the PCS services to be provided as follows:
| • | voice rate pricing tiers for Sprint Nextel home subscribers within the Market were fixed through July 1, 2008, and then reset semi-annually based on Sprint Nextel’s retail voice revenue yield; |
| • | voice rate pricing for Sprint Nextel subscribers, Mobile Virtual Network Operators (“MVNO”), partners of Sprint Nextel and Sprint Network Managers, who use our network for voice service while traveling in the Market was fixed through July 1, 2008, and then reset semi-annually based on Sprint Nextel’s retail voice revenue yield; |
| • | home data pricing is “per customer” for each Sprint Nextel PCS customer in the Market and the “per customer” amount is based upon 60% of Sprint Nextel’s national 3G and EV-DO data ARPU; and |
| • | data rate for each megabit of data service consumed by Sprint Nextel travel subscribers and all Sprint MVNO customers within the Market was based on a schedule through July 1, 2009, and then reset quarterly thereafter based on Sprint Nextel’s 3G and EV-DO data yield. |
The Strategic Network Alliance also permits our NTELOS-branded customers to access Sprint Nextel’s national wireless network at reciprocal rates as the Sprint Nextel travel rates.
In addition, Sprint Nextel pays us the greater of (i) $9.0 million per calendar month or (ii) any and all monthly usage charges associated with the use of the PCS services by Sprint Nextel customers. Our revenue based on use of services exceeded the $9.0 million minimum for the first six months of 2009. Following the travel data rate reset on July 1, 2009, our monthly calculated revenue from Sprint Nextel was below the $9.0 million minimum and thus we billed and recognized revenue at the $9.0 million minimum stipulated in the contract. Revenue from this contract is projected to remain at that level throughout 2010.
The Strategic Network Alliance provides that the PCS service we provide to Sprint Nextel customers will be of a quality and clarity no worse than what we provide to our retail customers in similar rural markets. We are not required under the Strategic Network Alliance to make any future investment in any subsequent high speed data transfer technology or any other significant network upgrade requested by Sprint Nextel to support its customers unless mutually agreed upon.
The Strategic Network Alliance prohibits Sprint Nextel from directly or indirectly commencing construction of, contracting for or launching its own wireless communications network that provides PCS services provided by us in
8
Table of Contents
the Market until 18 months prior to the termination of the agreement or renewals thereof. Sprint Nextel may construct its own cell sites or take such other action to provide geographic coverage in a portion of a market served by us where Sprint Nextel’s network does not offer coverage, if Sprint Nextel requests that we provide coverage and we decline.
Network Technology
We have deployed 3G EV-DO Rev A to 85% of our total cell sites and 3G 1xRTT CDMA digital PCS technology to all of our cell sites. EV-DO technology provides us with the technical ability to support high-speed mobile wireless data services.
Switching Centers
We employ four Mobile Switching Centers (“MSC”) and five wireless switches. Of the wireless switches, two are in the Virginia East region, one is in the Virginia West region and two are in West Virginia. All MSC facilities are company-owned with the exception of one West Virginia facility, which is leased. The MSCs also house adjunct platforms that enable services including text messaging, voicemail, picture messaging, data services and over-the-air functionality (the ability to download information to the handset via our wireless network).
Cell Sites
As of December 31, 2009, we had 1,247 cell sites in operation, of which 20 were repeaters. We own 107 of these cell sites and lease the remaining 1,140, or 91%. Of our total cell sites, 1,065 are EV-DO capable and the remaining 182 are 1xRTT data capable. Of the leased cell sites, 493, or 43%, are installed on facilities owned by Crown Communications and American Tower. We entered into master lease agreements with Crown Communications in 2000 and 2001. These master lease agreements had initial 5-year lease terms and were renewed for second 5-year lease terms in 2005 and 2006, respectively. We expect to renew the master lease agreements which will expire in 2010 for another 5-year term. Additionally, we entered into a master lease agreement with American Tower in 2001 with an initial lease term of 12 years. These master agreements with Crown Communications and American Tower contain additional options to renew.
Network Performance
We set high network performance standards and continually monitor network quality metrics, including dropped call rates and blocked call rates. For the year ended December 31, 2009, network performance has averaged a dropped call rate of less than 1% and an average bouncing busy hour blocked call rate of less than 0.1%. We currently exceed Sprint Nextel’s network performance standards, as established in the agreement, in the regions underlying the Strategic Network Alliance.
Wireline Business
Overview
The wireline business has evolved from a traditional RLEC into a regional provider of transport, IP, video, voice and data services. Founded in 1897 as the Clifton Forge-Waynesboro Telephone Company, our wireline business and its predecessor organizations have a long history of providing exceptional telephone service in the rural Virginia cities of Waynesboro and Covington, and portions of Alleghany, Augusta and Botetourt counties. We carried that tradition of exceptional service quality to serve competitive territories in Western Virginia, West Virginia, central and western Pennsylvania and portions of Maryland, Ohio and Kentucky. We divide our wireline business into two segments: RLEC and Competitive Wireline.
Our wireline business is supported by an extensive 4,700 route-mile fiber optic network, increased significantly from the 2,200 route-miles we had at December 31, 2008. We utilize the network to backhaul communications traffic for retail services and to serve as a carriers’ carrier network, providing transport services to third parties for long distance, internet, wireless and private network services. Our fiber optic network is connected to and marketed with adjacent fiber optic networks in the mid-Atlantic region. On December 31, 2009, we closed on an agreement to purchase certain fiber optic and network assets and related transport and data service contracts from Allegheny Energy, Inc. The purchase included approximately 2,200 route-miles of fiber, mostly through an Indefeasible Right of Use (“IRU”), located primarily in central and western Pennsylvania and West Virginia, with portions also in Maryland, Kentucky and Ohio. The purchase price for the transaction assets was approximately $27 million. Also in 2009, we purchased an IRU for $4.5 million and we completed a fiber swap agreement, which together added approximately 200 route-miles and allowed us to expand our broadband and high-capacity business communications
9
Table of Contents
services to Culpeper, Madison and Warrenton, Virginia. We also built connecting fiber routes from western Virginia to the Southern portion of West Virginia in order to reach additional markets and provide network diversity in this region.
Wireline Operations
RLEC
Our wireline incumbent local exchange carrier business is conducted through two subsidiaries that qualify as RLECs under the Telecommunications Act. These two RLECs provide wireline communications services to residential and business customers in the western Virginia cities of Waynesboro and Covington, and portions of Alleghany, Augusta and Botetourt counties. As of December 31, 2009, we operated approximately 38,200 RLEC telephone access lines.
Competitive Wireline
The Competitive Wireline segment includes the results of our CLEC, internet and wholesale carriers’ carrier network businesses. The CLEC business was launched in 1998 and was the basis for our competitive broadband business that currently serves 30 areas in Virginia and West Virginia. We market and sell local and long distance, voice and data services almost exclusively to business customers. As of December 31, 2009, we had approximately 49,700 CLEC lines in service, virtually all of which were business lines.
The Competitive Wireline operations are based on an “edge-out” strategy that seeks to take advantage of our fiber network and established back-office systems in order to deliver a high incremental return on investment to our core wireline business. Technicians, vehicles, operations and support systems, network planning and engineering, billing and core network assets are shared between the wireline segments.
In addition to utilizing a successful “edge-out” strategy, our Competitive Wireline business has also benefited from a commitment to an “on-net” access strategy for a true facilities-based approach. We have been careful in our decision to expand the Competitive Wireline network and generally require proven customer demand to dictate such investment choices. In addition to the higher-margin revenues that are characteristic of on-net expansion, we have also been able to deliver other competitive services such as high-bandwidth internet access and Metro Ethernet transport services as a direct result of on-net connectivity growth. Our dedication to the facilities-based strategy, combined with our commitment to customer service, has proven successful in attracting large customers in key vertical markets. Specifically, the education, healthcare, financial, and government sectors have been particularly receptive to our Competitive Wireline business model.
Through our wholesale carriers’ carrier network, we offer other carriers access to our 4,700 route-mile fiber network which provides connectivity to major retail cities. We sell backhaul services to major wireline and wireless carriers including connectivity to cell sites located near our fiber network in our Competitive Wireline and RLEC markets. Through interconnections with other regional fiber networks, we are able to extend our network east to Richmond, Virginia, north to Carlisle, Pennsylvania, and Washington, D.C., and to areas south of Greensboro, North Carolina.
We launched our internet business in Virginia in 1995. Presently, we provide internet services in Virginia, West Virginia and Tennessee. As of December 31, 2009, we had approximately 23,500 broadband access connections, including DSL, dedicated internet access, broadband over fiber, and Metro Ethernet. We also finished the year with over 98% broadband capability in our RLEC markets.
Commencing in late 2007, we began introducing NTELOS video in selected neighborhoods within our two RLEC service areas and in two CLEC neighborhoods. The product offers video entertainment services and provides an alternative to cable and satellite TV. It is delivered via fiber-to-the-home (“FTTH”) which allows us to deliver integrated video, local and long distance telephone services, plus broadband Internet access currently at speeds up to 20 megabits per second. At December 31, 2009, we had approximately 2,000 video customers and passed approximately 9,000 homes with fiber. Revenues from the broadband and video products are included in the Competitive Wireline segment.
10
Table of Contents
Products and Services
We offer a wide variety of voice services to our RLEC and Competitive Wireline customers, including:
| Voice Service |
•Business and residential telephone service | |
| Primary Rate ISDN Services |
•High capacity connections between customers’ PBX equipment and public switched telephone network | |
| Long Distance Service |
•Domestic and international long distance services to RLEC and CLEC customers | |
| Calling Features |
•Call waiting | |
| •Caller ID | ||
| •Voice mail (can be integrated with our wireless PCS service) | ||
In addition to traditional voice services, we provide broadband and data services including:
| High-Speed DSL Access |
•DSL technology enables a customer to receive high-speed internet access through a copper telephone line at speeds of 6 Mbps | |
| Broadband XL |
•High speed internet access over fiber-to-the-home available to residential customers in portions of our RLEC markets at speeds from 10 to 20 Mbps | |
| Video |
•IPTV-based video services with more than 280 channels, including 55 high definition, and video-on-demand and DVR capability | |
| •Available in new subdivisions and overbuild areas within the RLEC and in one area in Lynchburg and Harrisonburg, VA | ||
| •Powered by Microsoft Mediaroom IPTV platform | ||
| Metro Ethernet |
•Ethernet connectivity among multiple locations in the same city or region over our fiber optic network | |
| •Speed ranging from 1.5 Mbps to 1 Gbps | ||
| IP Services |
•IP-enabled product offerings that combine voice and data services over a dedicated broadband facility utilizing VOIP protocols | |
| •Allows customers to dynamically allocate bandwidth to maximize voice and data transmissions | ||
| •Product offerings include Integrated Access, IP Centrex, and IP Trunking | ||
| High-capacity Private Line Service |
•High-capacity, non-switched facilities provided to end users and carriers for voice and data applications | |
| Web Hosting |
•Domain services, collocation agreements and internet marketing services | |
| Local Dial-Up Internet Access |
•Offers multiple e-mail accounts and personal web space | |
Sales, Marketing and Customer Care
We share sales, marketing, and customer care resources to reach the RLEC and Competitive Wireline customer bases. We seek to capitalize on the NTELOS brand name, technology leadership, positive service reputation and local presence of sales and service personnel in our marketing efforts. Our wireline retail presence is located in Waynesboro, Daleville, and Covington, Virginia to allow walk-in payments and provide new services to RLEC customers. Customer care is provided through call centers which are located in Waynesboro and Daleville, Virginia. The call center operation is supported by an integrated systems infrastructure and automated linkages to our billing, operations, and engineering systems. We provide customer care and operations representatives with incentives to up-sell additional products and features and retain current customers that may disconnect services.
11
Table of Contents
We have three areas of focus within the customer base: RLEC residential and small business service, mid-size and larger regional businesses within the RLEC and Competitive edge-out areas, and wholesale transport following a carrier’s carrier strategy for regional and national carriers. In the RLEC residential and small business, we focus our marketing efforts on selling bundles of services and higher revenue-generating services to maximize penetration, average monthly revenues-per-unit-in-service (“ARPU”) and retention. We have an inside sales and customer service team that works to retain customers and offer additional revenue-generating services, including residential and small business voice, broadband and IPTV services. Within that group, a special team of service professionals focus on proactively contacting customers near renewal dates. For mid-size and regional firms, we offer voice, basic and high capacity broadband data services and advanced IP-based services, including Metro Ethernet. We retain account executives to cultivate relationships with these customers to meet their integrated communications needs and provide state of the art communication and network solutions. We strive to drive scale for on-net connectivity to tightly control service quality and maximize the return on our network investments. The wholesale business offers services to regional and national carriers and is supported by a dedicated channel team and the Valley Network Partnership (“ValleyNet”) resources.
Plant and Equipment
Our wireline network includes two Alcatel-Lucent 5ESS digital switches, which provide end-office functions for both the RLEC and Competitive Wireline businesses in Virginia. Our Waynesboro, Virginia switch also acts as an access tandem for our RLEC and Competitive Wireline segments and portions of our wireless and other carriers’ traffic. Another Alcatel-Lucent 5ESS digital switch, located in Charleston, supports the Competitive Wireline business in West Virginia. We have 11 remote switching modules deployed throughout our RLEC territory and two more supporting our competitive areas. VITAL, a company for which we serve as the managing partner, acts as a regional node on VeriSign’s nationwide SS7 network using a pair of Tekelec signal transfer points located on our premises.
We use Alcatel-Lucent, Tellabs, Adtran and Cisco digital loop carriers and Digital Subscriber Line Access Multiplexer throughout our RLEC and Competitive Wireline access network to provide voice and broadband access services. Our centralized network operations center monitors wireline, wireless and data networks on a continuous basis using Harris and Reachview network management systems. We provide native Ethernet data services via our 10Gig core Cisco Systems, Inc. data network and IP-enabled voice services using a soft switch from Cisco Systems, Inc. and feature servers from Broadsoft. We have also deployed a Head-End utilizing a combination of Tandberg, Cisco and Motorola hardware and we utilize Microsoft’s Mediaroom software to deliver IPTV-based video services.
Competition
Many communications services can be provided without incurring a short-run incremental cost for an additional unit of service. As a result, once there are several facilities-based carriers providing a service in a given market, price competition is likely and can be severe. We have experienced price competition, which is expected to continue. In each of our service areas, additional competitors could build facilities. If additional competitors build facilities in our service areas, this price competition may increase significantly.
Wireless
We compete in our territory with four Nationwide carriers, including Sprint Nextel and its affiliates, Verizon Wireless, AT&T Wireless and T Mobile, and reseller/affiliates of some of these companies. These competitors have financial resources, marketing resources, brand awareness, and customer bases significantly greater than ours. Many of these major operators are in the midst of a 3G+ and 4G deployment as demand for higher speeds increase. We expect these competitors will continue to build and upgrade their own networks in areas in which we operate. In January 2010, Verizon Wireless and AT&T Wireless discounted their rates on a nationwide unlimited voice plan. This move creates additional competitive pressure in retaining high-value customers and on our ability to attract switchers. As previously noted in the Wireless overview section, competition in the prepay market space has greatly intensified, particularly with the nationwide unlimited plan offerings with aggressive pricing and a significant increase in points of distribution and advertising. We also face competition from resellers, which provide wireless service to customers but do not hold FCC licenses or own facilities. These competitors include, but are not limited to, Boost, Straight Talk, Page Plus, Virgin Mobile, TracFone, and Net10. Finally, we may see 4G broadband data-only competition from companies like Clearwire. We try to differentiate ourselves from our competitors by offering high value products and plans, high quality network performance and by providing best-in-class customer service and retail support through our local community presence.
12
Table of Contents
Wireline
Several factors have resulted in increased competition in the landline telephone market, including:
| • | expansion of wireless networks and pricing plans which offer very high usage at a fixed cost, resulting in wireless substitution; |
| • | IP-based voice services offered by cable companies; |
| • | technological advances in the transmission of voice, data and video; |
| • | development of fiber optics, wireless data, and IP technology; and |
| • | legislation and regulations, including the Telecommunications Act of 1996, designed to promote competition. |
As the RLEC for Waynesboro, Clifton Forge, Covington and portions of Alleghany, Augusta and Botetourt Counties, Virginia, we are subject to competition from wireless carriers and cable companies. A portion of the residential customers moving into our service area do not purchase landline phone service. Although no CLECs have entered our incumbent markets to compete with us, it is possible that one or more may enter our markets. Voice over Internet Protocol (“VoIP”) based carriers like Vonage could take voice customers from our RLECs using existing broadband connections (such as DSL or cable modem connections). The regulatory environment governing RLEC operations has been, and we believe will likely continue to be, very liberal in its approach to promoting competition and network access.
Our Competitive Wireline operations compete primarily with incumbent local exchange carriers (“ILECs”) and, to a lesser extent, other CLECs or cable operators. We also face competition from potential future market entrants. To maintain the competitive position and grow, we position our self as a leading edge provider with a full portfolio of broadband and IP-based services.
The internet industry is characterized by the absence of significant barriers to entry and the rapid growth in internet usage among customers. As a result, we expect that our competition will increase from market entrants offering high-speed data services, including DSL, cable, and wireless access. Our competition includes:
| • | local, regional and national internet service providers such as AT&T, Level 3, Verizon, Zayo, KDL, Fibernet, Frontier and CenturyLink; |
| • | cable modem services offered by incumbent cable providers such as Comcast, Cox, Shentel and Charter; |
| • | wireless providers offering services based on EV-DO, Worldwide Interoperability for Microwave Access (“Wi-Max”) or other technologies; and |
| • | small local providers in Southside and Southwest Virginia enabled by the Virginia Tobacco Commission investment in fiber optic infrastructure. |
Many of our competitors have financial resources, corporate backing, customer bases, marketing programs and brand names that are greater than ours. Additionally, competitors may charge less than we do for internet services, causing us to reduce, or preventing us from, raising our fees.
Employees
As of December 31, 2009, we employed 1,366 full-time and 41 part-time persons. Of these employees, 71 are covered by a collective bargaining agreement for a portion of our wireline operation. This agreement expires June 30, 2011. We believe that we have good relations with our employees.
Access to Public Filings
We routinely post important information on our website at www.ntelos.com. Information contained on our website is not incorporated by reference into this annual report on Form 10-K. We provide public access to our annual reports on Form 10-K, quarterly reports on Form 10-Q, current reports on Form 8-K, and amendments to these reports filed with the U.S. Securities and Exchange Commission (“SEC”) under the Securities Exchange Act of 1934. These documents may be accessed free of charge on our website at the following address: http://ir.ntelos.com. These reports are available as soon as reasonably practicable after we electronically file such material with, or furnish it to, the SEC.
13
Table of Contents
Regulation
The following summary does not describe all present and proposed federal and state legislation and regulations affecting the telecommunications industry. Some legislation and regulations are currently the subject of judicial proceedings, legislative hearings and administrative proposals which could change the manner in which this industry operates. Neither the outcome of any of these developments, nor their potential impact on us, can be predicted at this time. Regulation can change rapidly in the telecommunications industry, and such changes may have an adverse effect on us in the future. See “Risk Factors” elsewhere in this report.
Regulation Overview
Our communications services are subject to varying degrees of federal, state and local regulation. Under the federal Telecommunications Act, the Federal Communications Commission, or FCC, has jurisdiction over interstate and international common carrier services, over certain aspects of interconnection between carriers, and over the allocation, licensing, and regulation of wireless services. In 1996, Congress enacted the Telecommunications Act of 1996 which amended the Communications Act and mandated significant changes in telecommunications rules and policies to promote competition, ensure nationwide availability of telecommunications services and to streamline regulation of the telecommunications industry to remove regulatory burdens as competition develops.
In addition to FCC regulation, our communications services are regulated to different degrees by state public service commissions and by local authorities. Such local authorities have jurisdiction over public rights-of-way, video franchises, and zoning for antenna structures. The Federal Aviation Administration, or FAA, regulates the location, lighting and construction of antenna structures.
Our wireless and wireline operations are subject to various federal and state laws intended to protect the privacy of customers who subscribe to our services. The FCC has regulations that place restrictions on the permissible uses that we can make of customer-specific information, known as Customer Proprietary Network Information (“CPNI”), received from subscribers, and that govern procedures for release of such information in order to prevent identity theft schemes. The Federal Trade Commission is considering principles governing on-line behavioral marketing and consumer privacy. Congress, federal agencies and states also are considering imposing additional requirements on entities that possess consumer information to protect the privacy of consumers.
Many of the services we offer are unregulated or subject only to minimal regulation. Internet services are not considered to be common carrier services, although the regulatory treatment of certain internet services, including VoIP services, is evolving and still uncertain. To date, the FCC has, among other things, directed providers of certain VoIP services to offer E-911 emergency calling capabilities to their subscribers, applied the requirements of the Communications Assistance for Law Enforcement Act, or CALEA, to these VoIP providers, and determined that the VoIP providers are subject to federal universal service assessments. The FCC has preempted states from exercising entry and related economic regulation of nomadic VoIP providers but the FCC has not preempted state regulation of fixed VoIP service commonly offered by cable operators.
Regulation of the Wireless Communications Industry
Pursuant to 1993 amendments to the Communications Act, cellular, personal communications, advanced wireless, and 700 megahertz services are classified as commercial mobile radio service because they are offered to the public and are interconnected to the public switched telephone network. Consequently, our wireless services are generally classified as commercial mobile radio services, or CMRS, and subject to FCC regulation. The states are preempted from engaging in entry or rate regulation of CMRS, although the states may regulate other terms and conditions of CMRS offerings including customer billing, termination of service arrangements, advertising, certification of operation, use of handsets when driving, service quality, sales practices, and management of customer call records.
The licensing, construction, modification, operation, sale, ownership and interconnection arrangements of wireless communications networks are regulated to varying degrees by the FCC, Congress, state regulatory agencies, the courts and other governmental bodies. Some examples of the kinds of regulation to which we are subject are presented below.
Licensing of PCS Systems. PCS licenses, such as those held by our subsidiaries, were generally originally awarded for specific geographic market areas and for one of six specific spectrum blocks. The geographic license areas utilized included basic trading areas and collections of basic trading areas known as major trading areas, although
14
Table of Contents
geographic partitioning policies have permitted licensees to subdivide and transfer those original licenses into other geographic areas. The spectrum blocks awarded were originally either 30 MHz or 10 MHz licenses, although spectrum disaggregation rules have permitted licensees to subdivide such licenses into smaller spectrum blocks.
All PCS licenses have a 10-year term, at the end of which they must be renewed. The FCC’s rules provide a formal presumption that a PCS license will be renewed, called a “renewal expectancy,” if the PCS licensee (1) has provided substantial service during its past license term, and (2) has substantially complied with applicable FCC rules and policies and the Communications Act. The FCC defines substantial service as service which is sound, favorable and substantially above a level of mediocre service that might only minimally warrant renewal. If a licensee does not receive a renewal expectancy, then the FCC will accept competing applications for the license renewal period and, subject to a comparative hearing, may award the license to another party. Between 2005 and 2009, we applied for and were granted renewal of our 25 PCS licenses.
Under existing law, no more than 20% of an FCC PCS licensee’s capital stock may be owned, directly or indirectly, or voted by non-U.S. citizens or their representatives, by a foreign government or its representatives or by a foreign corporation. If an FCC PCS licensee is controlled by another entity, as is the case with our ownership structure, up to 25% of that entity’s capital stock may be owned or voted by non-U.S. citizens or their representatives, by a foreign government or its representatives or by a foreign corporation. Foreign ownership above the 25% holding company level may be allowed should the FCC find such higher levels not inconsistent with the public interest. The FCC has ruled that higher levels of foreign ownership in CMRS licensees, even up to 100%, are presumptively consistent with the public interest with respect to investors from certain nations. If our foreign ownership were to exceed the permitted level, the FCC could revoke our wireless licenses, although we could seek a declaratory ruling from the FCC allowing the foreign ownership or take other actions to reduce our foreign ownership percentage in order to avoid the loss of our licenses. We have no knowledge of any present foreign ownership in violation of these restrictions.
PCS Construction Requirements. All PCS licensees must satisfy build-out deadlines and geographic coverage requirements within five and/or ten years after the license grant date. Under the FCC’s original rules, these initial requirements are met for 10 MHz licenses when adequate service is offered to at least one-quarter of the population of the licensed area, or the licensee provides substantial service, within five years, and for 30 MHz licenses when adequate service is offered to at least one-third of the population within five years and two-thirds of the population within ten years. The FCC’s policies have now been modified, however, and 30 MHz licensees are permitted to make a demonstration of substantial service to meet the ten year build-out requirement. Failure to comply with these coverage requirements could cause the revocation or non-renewal of a provider’s wireless licenses or the imposition of fines and/or other sanctions.
Transfer and Assignment of PCS Licenses. The Communications Act and FCC rules require the FCC’s prior approval of the assignment or transfer of control of a license for a PCS system, with limited exceptions, and the FCC may prohibit or impose conditions on assignments and transfers of control of licenses. Non-controlling interests in an entity that holds an FCC license generally may be bought or sold without FCC approval. Although we cannot be certain that the FCC will approve or act in a timely fashion upon any future requests for approval of assignment or transfer of control applications that we file, we have no reason to believe that the FCC would not approve or grant such requests or applications in due course. In the course of such review, we further note that the FCC engages in a case-by-case competitive review of transactions that involve the consolidation of spectrum licenses. Because an FCC license is necessary to lawfully provide PCS service, if the FCC were not to approve any such filing, our business plans would be adversely affected.
AWS Licenses. In 2006, we acquired additional licenses in an auction conducted by the FCC for Advanced Wireless Services, or AWS, spectrum in the 1710-1755 MHz and 2110-2155 MHz bands. The FCC regulations applicable to these licenses are generally similar to those applied to our PCS licenses, although our AWS licenses have a longer, 15 year, term and are not subject to any construction requirements other than the requirement that we be providing substantial service at renewal. Like other auctioned AWS licenses, the licenses acquired by us are subject to the rights of certain incumbents, including Federal government systems and microwave radio users. For the most part, Federal government users will transition their operations out of the band through a multiyear process funded through proceeds from the auction itself. The non-government users would have to be relocated by us if our AWS deployments would interfere, and we may incur cost-sharing obligations even if we deploy services on our AWS spectrum after the links are relocated.
15
Table of Contents
911 Services. The FCC requires CMRS carriers to make available emergency 911 services to subscribers, including enhanced emergency 911 services that provide the caller’s telephone number and detailed location information to emergency responders, as well as a requirement that emergency 911 services be made available to users with speech or hearing disabilities. Our obligations to implement these services occur in phases and on a market-by-market basis as emergency service providers request the implementation of enhanced emergency 911 services in their locales.
On September 11, 2007, the FCC adopted an order mandating that wireless E911 location accuracy be measured on the public safety answering point (“PSAP”) level, but deferred effectiveness of the mandate for five years while requiring interim milestones. The interim milestones cover increasingly smaller geographic areas. The Rural Cellular Association and T-Mobile appealed this FCC Order. On March 25, 2008, the United States Court of Appeals for the District of Columbia Circuit (“Court”) stayed the Location Accuracy Order. On July 31, 2008, the FCC asked the U.S. Court of Appeals for the District of Columbia to vacate and remand the order to the FCC and, on September 17, 2008, the court granted the FCC’s request. On September 22, 2008, the FCC sought comments on a new proposal for E911 accuracy requirements for both handset-based and network-based technologies to achieve E911 accuracy compliance at the county-level. That proposal was filed by the Association of Public-Safety Communications Officials and the National Emergency Number Association, Verizon Wireless, Sprint Nextel Corporation, and AT&T. In connection with separate transactions approved by the FCC in 2008, Verizon Wireless and Sprint Nextel made voluntary commitments to implement these proposed accuracy standards. The FCC has yet to make a general decision about this proposal and in November of 2009, asked interested parties to update the record in this proceeding.
Local Number Portability. FCC rules also require that local exchange carriers and most CMRS providers, including PCS providers, allow customers to change service providers without changing telephone numbers. For CMRS providers, this mandate is referred to as wireless local number portability, or WLNP. The FCC also has adopted rules governing the porting of wireline telephone numbers to wireless carriers and vice versa. Number portability makes it easier for customers to switch among carriers.
Reciprocal Compensation. In the absence of the agreement of both parties for a “bill and keep” arrangement, FCC rules provide that all local exchange carriers must enter into reciprocal compensation arrangements with CMRS carriers for the exchange of local traffic, whereby each carrier compensates the other for terminating local traffic originating on the other carrier’s network. As a CMRS provider, we are required to pay reciprocal compensation under such arrangements to a wireline local exchange carrier that transports and terminates a local call that originated on our network. Similarly, we are entitled to receive reciprocal compensation when we transport and terminate a local call that originated on a wireline local exchange network. We negotiate interconnection arrangements for our network with major ILECs and smaller RLECs. Negotiated interconnection agreements are subject to state approval. If an agreement cannot be reached, parties to interconnection negotiations can submit outstanding disputes to state authorities or the FCC, as appropriate, for arbitration. The FCC’s interconnection rules and rulings, as well as state arbitration proceedings, will directly impact the nature and costs of facilities necessary for the interconnection of our network with other telecommunications networks. They will also determine the amount of revenue we receive for terminating calls originating on the networks of local exchange carriers and other telecommunications carriers. The FCC is currently considering changes to the local exchange-CMRS interconnection and other so-called intercarrier compensation schemes, and the outcome of such proceedings may affect the manner in which we are charged or compensated for the exchange of traffic.
Universal Service. Pursuant to the Communications Act, all telecommunications carriers that provide interstate and/or international telecommunications services, including CMRS providers, are required to make an “equitable and non-discriminatory contribution” to support the cost of federal universal service programs (Universal Service Fund or USF). Providers of interconnected VOIP services must also contribute. These programs are designed to achieve a variety of public interest goals, including affordable telephone service nationwide, as well as subsidizing telecommunications services for schools and libraries. Contributions are calculated on the basis of each carrier’s interstate and international retail telecommunications revenue. The FCC is currently examining the way in which it collects carrier contributions to the USF, including a proposal to base collections on the number of telephone numbers or network connections in use by each carrier. An assessment mechanism based on numbers or network connections could increase the contributions to the USF by wireless and local exchange carriers, while reducing contributions from long distance service providers.
NTELOS’s wireless operations receive funding from the federal USF in Virginia, West Virginia, and Kentucky. On May 1, 2008, the FCC placed an interim cap on the amount of USF funding distributed in each state to competitive providers as a group, including CMRS carriers and CLECs. USF funding to competitive providers in each state is now capped at the level of support that such carriers as a group received in that state during March 2008.
16
Table of Contents
CALEA. The Communications Assistance for Law Enforcement of 1994, or CALEA, requires all telecommunications carriers, including wireless carriers, to ensure that their equipment is capable of permitting the government, pursuant to a court order or other lawful authorization, to intercept any wire and electronic communications carried by the carrier to or from its subscribers. CALEA remains subject to FCC implementation proceedings. Compliance with the requirements of CALEA, further FBI requests, and the FCC’s rules could impose significant additional direct and/or indirect costs on us and other wireless carriers.
Roaming. In 2007, the FCC adopted a requirement that wireless carriers permit other wireless carriers’ customers to “roam” on their systems. This requirement does not, however, apply in markets in which the carrier seeking to roam holds an FCC license even if such carrier has yet to build out its network in such a market. Pursuant to petitions filed by several smaller wireless carriers, the FCC is reconsidering this “in-market” roaming exception. The FCC has sought additional comment on the possibility of extending this requirement to data roaming which is not connected to the public switched network, such as wireless broadband Internet access.
Tower Siting. Under the Communications Act, state and local authorities maintain authority over the zoning of sites where our antennas are located. They are permitted to manage public rights of way and they can require fair and reasonable compensation for use of such rights of way. These authorities, however, may not legally discriminate against or prohibit our services through their use of zoning authority. Wireless networks also are subject to certain FCC and FAA regulations regarding the location, marking, lighting and construction of transmitter towers and antennas and are subject to regulation under the National Environmental Policy Act (“NEPA”), the National Historic Preservation Act, and various environmental regulations. Compliance with these provisions could impose additional direct and/or indirect costs on us and other licensees. The FCC’s rules require antenna structure owners to notify the FAA of structures that may require marking or lighting, and there are specific restrictions applicable to antennas placed near airports. FCC regulations implementing NEPA place responsibility on each applicant to investigate any potential environmental effects of a proposed operation, including health effects relating to radio frequency emissions, and impacts on endangered species such as certain migratory birds, and to disclose any significant effects on the environment to the agency prior to commencing construction. In the event that the FCC determines that a proposed tower would have a significant environmental impact, the FCC would require preparation of an environmental impact statement. In some jurisdictions, local laws, zoning or land-use regulations may impose similar requirements.
Miscellaneous. We also are subject or potentially subject to number pooling rules; rules governing billing; technical coordination of frequency usage with adjacent carriers ; height and power restrictions on our wireless transmission facilities; and rules requiring us to offer equipment and services that are hearing aid compatible and accessible to and usable by persons with disabilities. Some of these requirements pose technical and operational challenges to which we, and the industry as a whole, have not yet developed clear solutions. We are unable to predict how they may affect our business, financial condition or results of operations. In addition, a number of states and localities have banned, or are considering banning or restricting, the use of wireless phones while driving a motor vehicle. Texting while driving in Virginia was prohibited as of July 1, 2009.
Regulation of the Wireline Communications Industry
Federal Regulation of Interconnection and Interexchange Services
The Communications Act requires all common carriers to interconnect on a non-discriminatory basis with other carriers, imposes additional requirements on wireline local exchange carriers, and imposes even more comprehensive requirements on the largest ILECs. The large ILECs are required to provide to our CLECs and other competitors physical collocation to allow competitors to place qualifying equipment in ILEC central offices; to unbundle some of their services at wholesale “forward looking” rates, permit resale of some of their services, provide access to poles, ducts, conduits and rights-of-way, and to establish reciprocal compensation for the transport and termination of local traffic. In order to obtain access to an ILEC network, a CLEC must negotiate an interconnection agreement or “opt-in” to an existing interconnection agreement. These agreements cover, among other items, reciprocal compensation rates and required UNEs. If the parties cannot agree on the terms of an interconnection agreement, the matter is submitted to the applicable state public utility commission or to the FCC, as appropriate, for binding arbitration. The obligations of the large ILECs to provide these network facilities and services are in flux and could be further altered or removed by new legislation, regulations or court order.
17
Table of Contents
ILEC operating entities that serve fewer than 50,000 lines are defined as “rural telephone companies” under the Communications Act and are exempt from these additional requirements unless and until such exemption is removed by the state regulatory body. Each of our RLEC operations is considered separately and each is currently exempt from the requirements imposed on the largest ILECs. NTELOS Telephone Company, or NTELOS Telephone, is an “average schedule” company for purposes of interstate access charges. NTELOS Telephone participates in the common line pool tariff administered by the National Exchange Carrier Association, or NECA, and therefore charges subscriber line charges computed by NECA, but files its own traffic sensitive (i.e., “per-minute”) tariff to establish access rates applicable to switching and transport of telecommunications traffic. R&B Telephone Company is a “rate-of-return” company for purposes of interstate access charges and participates in NECA’s common line pool and NECA’s traffic sensitive pool.
Access Charges. The FCC regulates the prices that ILECs and CLECs charge for access to their local telephone networks in originating or terminating interstate transmissions for long distance carriers. These access charges are paid by traditional long distance carriers, but are not paid at this time by VoIP providers.
The FCC is considering whether or not to assess access charges on VoIP providers. The FCC has reformed and continues to reform the structure of the federal access charge system. The FCC has an active proceeding addressing access and other intercarrier payments. Intercarrier compensation reform could result in significant decreases in the access charge revenues received by our rural telephone companies. Future reductions in access revenues will directly affect our profitability and cash flows. While we expect that the FCC would allow these changes to occur over some transition period and would permit our rural telephone companies to offset the impact of reduced revenues with increased subscriber line charges and USF payments, it is unknown whether all or only a portion of the access revenues would be so recovered.
Universal Service. Historically, network access charges were set at levels that subsidized the cost of providing local residential service. The Telecommunications Act requires the FCC to identify and remove such historical “implicit subsidies” of local service subsidy from network access rates, to establish an explicit Universal Service Fund to ensure the continuation of service to high-cost, low-income service areas and to develop a mechanism for the arrangements for payments into that fund by all providers of interstate telecommunications. In 1997, the FCC issued its first order implementing these directives and has continued to refine this implementation in subsequent orders since that time for the funding of high-cost service areas and low-income subscribers. Federal universal service programs provide funding for services provided in high-cost areas, for reduced-rate services to low-income consumers, and for discounted communications and Internet services for schools, libraries and rural health care facilities. These programs are funded by contributions from telecommunications carriers and VoIP providers who are interconnected to the network.
Federal universal service fund “high cost” payments are received by our RLECs and support the high cost of operations in rural markets. Under universal service rules adopted by the FCC, the funds may be distributed only to a carrier that is designated as an “Eligible Telecommunications Carrier,” or ETC, by the FCC or a state regulatory commission. Our RLECs have been designated as ETCs. Several wireless carriers have been designated as ETCs in all or part of our RLEC service territory. Under current FCC rules and subject to the cap on USF funding for competitive carriers, competitors also can obtain the same per-line support payments as we do without regard for whether the competitor’s cost structure is similar to our own.
Congress and the FCC from time to time consider major changes to the universal service rules that could affect us. For example, the FCC has sought comment on proposals to impose further caps or reductions on the amount of funding available to ILECs and wireless carriers, and to require all carriers receiving such funds to upgrade their networks to provide high-speed broadband services throughout their service areas. The Federal-State Joint Board on Universal Service, an advisory panel composed of FCC commissioners and state telecommunications regulators, has recommended that the fund be divided into three distinct funds each with a separate distribution mechanism and funding allocation. The three funds would be a Broadband Fund, a Mobility Fund, and a Provider of Last Resort Fund. The FCC has not taken action on that proposal but is still considering various proposals for the reform of the USF and has asked for comments on a proposal to use “reverse auctions” as a means to distribute certain Universal Service funding. These proposals are likely to evolve over time, particularly as a new FCC Chairman and new FCC commissioners take office. As a result, the Company cannot predict the outcome of the FCC’s consideration of these issues.
18
Table of Contents
The FCC, USAC and other authorities have conducted, and in the future are expected to continue to conduct, more extensive audits of USF support recipients, as well as other heightened oversight activities. The impact of these activities on our ILEC and wireless business if any, is uncertain.
Federal Regulation of Internet and DSL. To date, the FCC has treated internet service providers, or ISPs, as enhanced service providers, rather than common carriers. Therefore, ISPs are exempt from most federal and state regulation, including the requirement to pay access charges. We face increasing competition from cable operators and other service providers offering high-speed Internet and VoIP services. As VoIP becomes a more robust and widely available service and operators continue to add more features and functionality, existing competitors could become more formidable and new competitors could enter our markets. In 2006, the FCC expanded the base of USF contributors by extending contributing obligations to providers of interconnected VoIP services. The FCC has also directed providers of certain VoIP services to offer E-911 emergency calling capabilities to their subscribers and applied the requirements of the Communications Assistance for Law Enforcement Act, or CALEA.
Proposals in Congress and at the FCC that would regulate the manner in which providers of high-speed Internet service may manage their networks or utilize data from their customers could affect our ability to manage our network and market IP-based value-added services to our customers. These proposals are sometimes referred to as “Internet regulation” or “net neutrality” proposals. It is uncertain whether any such regulations will be adopted or enforcement actions taken, and if so, what impact they may have on our business.
Net Neutrality. There has been legislative and regulatory interest in adopting so-called “net neutrality” requirements for broadband Internet access providers. The FCC in 2005 adopted a policy statement expressing its view that consumers are entitled to access lawful Internet content and to run applications and use services of their choice, subject to the needs of law enforcement and reasonable network management techniques. In an August 2008 decision, the FCC characterized these net neutrality principles as binding and enforceable and stated that network operators have the burden of proving that their network management techniques are reasonable. In that order, the FCC imposed sanctions on a broadband Internet access provider (Comcast) for managing its network by blocking or degrading certain Internet transmissions and applications in a way that the FCC found was unreasonably discriminatory. This FCC decision is on appeal and the outcome cannot be predicted. Moreover, it is not possible to determine what other broadband network management techniques or related business arrangements may be deemed reasonable or unreasonable in the future. We cannot predict how any future legislative or regulatory decision relating to net neutrality might affect or ability to manage our broadband network or develop new products or services.
State Regulation of RLEC, CLEC and Interexchange Services. Most states require wireline telecommunications providers to obtain authority from state regulatory commissions prior to offering common carrier services. State regulatory commissions generally regulate RLEC rates for intrastate services, including rates for intrastate access services paid by providers of intrastate long distance services. RLECs must file tariffs setting forth the terms, conditions and prices for their intrastate services. Our RLECs are subject to regulation in Virginia by the SCC. Our tariffs are approved by and on file with the SCC for RLEC services in our certificated service territory in and around Waynesboro and Covington, Virginia and in portions of Alleghany, Augusta, and Botetourt Counties, Virginia. In addition, the SCC establishes service quality requirements applicable to RLECs, including ours, and resolves disputes involving intrastate communications services.
Intercarrier compensation includes regulated interstate and intrastate switched access charges that we, other ILECs, CLECs and wireless service providers receive from long distance carriers for the origination and termination of long distance calls and reciprocal compensation that interconnected local carriers pay to each other for terminating interconnected local and wireless calls. On average, intrastate switched access charges, which are currently regulated by state public utility commissions, are generally higher than interstate switched access charges, which are regulated by the FCC, and in turn interstate switched access charges are generally higher on a per-minute basis than are reciprocal compensation rates.
In January of 2010, a bill was introduced in the Virginia House of Delegates that would require ILECs in Virginia, including NTELOS, to set their intrastate access charges at the level of their interstate access charges. Intrastate access charges are an important source of revenues for NTELOS’ operations. If these access charges are reduced quickly and without sufficient substitutes for the lost revenues, this could have a material adverse effect on our financial condition, results of operations and cash flows. A substitute bill that would require less in access charge reductions and would defer to the SCC as to the level and timing of access charge reductions for NTELOS has passed both houses of the Virginia General Assembly and has been sent to the Governor for signature.
19
Table of Contents
In Virginia and West Virginia, CLECs’ intrastate switched access charges are capped at the higher of the CLEC’s interstate switched access charge or the intrastate switched access charge of the ILEC (or the average of all ILECs) providing service in the territory served by the CLEC. If, in a future proceeding, the Virginia SCC were to reduce the level of switched access charges that could be charged by our RLECs, such a reduction could have a significant adverse financial effect on our RLECs depending on the amount of the reduction. See “Risk Factors.”
The Telecommunications Act preempts state statutes and regulations that restrict entry into the telecommunications market. As a result, we can provide the full range of competitive intrastate local and long distance services in all states in which we currently operate and in any states into which we may expand. We are certificated as a CLEC in Virginia, West Virginia, Pennsylvania, Maryland and Tennessee. Although we file tariffs covering our CLEC services, our rates for such CLEC services generally fluctuate based on market conditions.
Local Government Authorizations. Certain governmental authorities require permits to open streets for construction and/or franchises to install or expand facilities. Video franchises are also required for our video services. We obtain such permits and franchises as required.
The 2006 Virginia Cable Act provides for “negotiated” CATV franchises and “ordinance” CATV franchises. All new entrants must first attempt to negotiate a cable franchise with a locality. Should the negotiations not result in the granting of a franchise during a 45-day negotiation period, the applicant can elect to accept a default ordinance cable franchise that authorizes the applicant to begin offering CATV services 75 days after the initial negotiated franchise request, subject to the applicant abiding by certain requirements set forth in the statute. In September of 2006, we obtained a negotiated franchise in Waynesboro and an ordinance franchise in Botetourt County. Augusta County does not have a franchise requirement and, accordingly, we did not need to obtain a franchise prior to offering video services in Augusta County. In October of 2007, we obtained a negotiated franchise in Lynchburg, Virginia for a new mixed-use residential development called Cornerstone. On January 12, 2009, we requested a negotiated franchise in Harrisonburg, Virginia for a residential development called Liberty Square, but Harrisonburg has failed to act on that request.
Retransmission Consent. Local television stations may require that a video provider obtain “retransmission consent” for carriage of the station’s signal, which can enable a popular local television station to obtain concessions from video providers for the right to carry the station’s signal.
| Item 1A. | Risk Factors. |
RISK FACTORS
The following risk factors and other information included in this Form 10-K should be carefully considered. The risks and uncertainties described below are not the only ones we face. Additional risks and uncertainties not presently known to us or that we currently deem immaterial also may adversely impact our business operations. Our business, financial condition or results of operations could be materially adversely affected by any or all of these risks.
Risks Relating to Our Business
The telecommunications industry is generally characterized by rapid development, introduction of new technologies, substantial regulatory changes and intense competition, any of which could cause us to suffer price reductions, customer losses, reduced operating margins and/or loss of market share.
The telecommunications industry has been, and we believe will continue to be, characterized by several trends, including the following:
| • | rapid development and introduction of new technologies and services, such as VoIP, location-based services such as GPS mapping technology and high speed data services, including streaming video, mobile gaming and other applications that use EV-DO, Wi-Max, Long Term Evolution technology (“LTE”), Femtocells or other technologies; |
| • | substantial regulatory change due to the continuing efforts of the FCC to reform intercarrier compensation, to modify USF availability, and to limit availability of UNEs used by CLECs under the Telecommunications Act of 1996; |
| • | increased competition within established markets from current and new market entrants that may provide competing or alternative services; |
20
Table of Contents
| • | an increase in mergers and strategic alliances that allow one telecommunications provider to offer increased services or access to wider geographic markets; and |
| • | the blurring of traditional dividing lines between, and the bundling of, different services, such as local telephone, long distance, wireless, video, data and internet services. |
We expect competition to intensify as a result of new competitors and the development of new technologies, products and services. Some or all of these trends may cause us to have to spend significantly more in capital expenditures than we currently anticipate in order to keep existing, and attract new, customers. Many of our voice and data competitors, such as cable providers, wireless service providers, internet access providers and long distance carriers have brand recognition and financial, personnel, marketing and other resources that are significantly greater than ours. In addition, due to consolidation and strategic alliances within the telecommunications industry, we cannot predict the number of competitors that will emerge, especially as a result of existing or new federal and state regulatory or legislative actions. Such increased competition from existing and new entities could lead to price reductions, loss of customers, reduced operating margins and/or loss of market share.
As competition develops and technology evolves, federal and state regulation of the telecommunications industry continues to change rapidly. We anticipate that this state of regulatory flux will persist in the future, as the FCC and state regulators respond to competitive, technological, and legislative developments by modifying their existing regulations or adopting new ones.
Taken together or individually, new or changed regulatory requirements affecting any or all of the wireless, local, and long distance industries may harm our business and restrict the manner in which we operate our business. The enactment of adverse regulation or regulatory requirements may slow our growth and have a material adverse effect upon our business, results of operations and financial condition. We cannot assure you that changes in current or future regulations adopted by the FCC or state regulators, or other legislative, administrative or judicial initiatives relating to the communications industry, would not have a material adverse effect on our business, results of operations and financial condition. In addition, pending congressional legislative efforts to reform the Communications Act may cause major industry and regulatory changes that are difficult to predict.
Adverse economic conditions may harm our business.
Economic conditions have been deteriorating and may remain depressed for the foreseeable future. Unfavorable economic conditions, including the recession and recent disruptions to the credit and financial markets, could cause customers to slow spending. If demand for our services decreases, our revenues would be adversely affected and churn may increase. In addition, during challenging economic times our customers may face issues gaining timely access to sufficient credit, which may impair the ability of our customers to pay for services they have purchased. Any of the above could have a material effect on our business, financial position, results of operations and cash flows.
We are also susceptible to risks associated with the potential financial instability of the vendors and third parties on which we rely to provide services or to which we outsource certain functions. The same economic conditions that may affect our customers could also adversely affect vendors and third parties and lead to significant increases in prices, reduction in quality or the bankruptcy of our vendors or third parties upon which we rely. Any interruption in the services provided by our vendors or by third parties could adversely affect our business, financial position, results of operating and cash flows.
Our leverage could adversely affect our financial health.
As of December 31, 2009, our total outstanding debt on a consolidated basis, including capital lease obligations, was approximately $628.9 million. Our indebtedness could adversely affect our financial health and business and future operations by, among other things:
| • | making it more difficult for us to satisfy our obligations with respect to our indebtedness; |
| • | increasing our vulnerability to adverse economic and industry conditions by making it more difficult for us to react quickly to changing conditions; |
| • | limiting our ability to obtain any additional financing we may need to operate, develop and expand our business; |
21
Table of Contents
| • | requiring us to dedicate a substantial portion of any cash flows from operations to service our debt, which reduces the funds available for operations and future business opportunities; |
| • | potentially making us more highly leveraged than our competitors, which could potentially decrease our ability to compete in our industry; |
| • | exposing us to risks inherent in interest rate fluctuations because some of our borrowings are at variable rates of interest, which could result in higher interest expense in the event of increases in interest rates; and |
| • | limiting our flexibility in planning for, or reacting to, changes in our business, and the industry in which we operate. |
The ability to make payments on our debt will depend upon our subsidiaries’ future operating performance, which is subject to general economic and competitive conditions and to financial, business and other factors, many of which we cannot control. If the cash flows from our subsidiaries’ operating activities are insufficient to service our debt obligations, we may take actions, such as delaying or reducing capital expenditures, reducing or eliminating our quarterly cash dividend, terminating or reducing the amount of our stock repurchase program, attempting to restructure or refinance our debt, selling assets or operations or seeking additional equity capital. Any or all of these actions may not be sufficient to allow us to service our debt obligations. Further, we may be unable to take any of these actions on satisfactory terms, in a timely manner or at all. The NTELOS Inc. senior secured credit facility limits our subsidiaries’ ability to take several of these actions. Our failure to generate sufficient funds to pay our debts or to successfully undertake any of these actions could, among other things, materially adversely affect our ability to repay our obligations under our indebtedness.
The NTELOS Inc. senior secured credit facility imposes operating and financial restrictions, which may prevent us from capitalizing on business opportunities and taking some corporate actions.
The NTELOS Inc. senior secured credit facility imposes operating and financial restrictions on our subsidiaries. These restrictions generally:
| • | restrict our subsidiaries’ ability to incur additional indebtedness; |
| • | restrict our subsidiaries from entering into transactions with affiliates; |
| • | restrict our subsidiaries’ ability to consolidate, merge or sell all or substantially all of their assets; |
| • | impose financial covenants relating to the business of our subsidiaries, including leverage and interest coverage ratios; |
| • | require our subsidiaries to use a portion of “excess cash flow” (as defined in the agreement) to repay indebtedness if our leverage ratio exceeds specified levels; and |
| • | restrict our subsidiaries’ ability to pay dividends or make advances to us to grant dividends. |
We cannot assure you that those covenants will not adversely affect our ability to pay dividends or repurchase stock, finance our future operations or capital needs or pursue available business opportunities. A breach of any of these covenants could result in a default in respect of the NTELOS Inc. senior secured credit facility. If a default occurs, our indebtedness under the NTELOS Inc. senior secured credit facility could be declared immediately due and payable. As a result of general economic conditions, conditions in the lending markets, the results of our business or for any other reason, we may elect or be required to amend or refinance our indebtedness, at or prior to maturity, or enter into additional agreements for senior indebtedness.
We will require a significant amount of cash, which may not be available to us, to service our debt and fund our other liquidity needs.
Our total debt outstanding, including capital lease obligations, as of December 31, 2009 is $628.9 million. The aggregate maturities of our long-term debt based on the contractual terms of the instruments are $6.9 million in 2010, $6.8 million in 2011, $6.7 million in 2012, $6.5 million in 2013, $6.4 million in 2014 and $601.7 million in 2015. Our ability to make payments on, or to refinance or repay, our debt, fund planned capital expenditures, pay quarterly cash dividends and expand our business will depend largely upon our future operating performance. Our future operating performance is subject to general economic, financial, competitive, legislative and regulatory factors, as well as other factors that are beyond our control. Our business may not generate enough cash flow, or future borrowings may not be available to us under the NTELOS Inc. senior secured credit facility or otherwise, in an amount sufficient to enable us to pay our debt or fund our other liquidity needs.
22
Table of Contents
NTELOS Inc.’s senior secured credit facility could restrict our ability to do some of these things. If we are forced to pursue any of the above options under distressed conditions, our business could be adversely affected.
Wireless Telecommunications
We face substantial competition in the wireless telecommunications industry generally from competitors with substantially greater resources than we have that may be able to offer new technologies services covering a broader geographical area, have exclusive arrangements with handset or software manufacturers, and have lower prices, which could decrease our profitability and cause prices for our services to continue to decline in the future.
We operate in a very competitive environment. Our wireless business faces intense competition from other wireless providers, including Verizon Wireless, T-Mobile, AT&T Wireless, U.S. Cellular and Sprint Nextel, and prepay resellers, including Boost, Straight Talk, Page Plus, Virgin Mobile, TracFone, and Net10. Competition for customers is based principally upon services and features offered, system coverage, technical quality of the wireless system, price, customer service and network capacity. Our ability to compete will depend, in part, on our ability to anticipate and respond to various competitive factors affecting the telecommunications industry. Some of the carriers with which we compete provide wireless services using cellular frequencies in the 800 MHz band and in the future will use 700 MHz frequencies that were recently auctioned by the FCC. These frequencies enjoy propagation advantages over the PCS and AWS spectrum we currently hold, which may cause us to have to spend more capital than our competitors to achieve the same coverage.
Consolidation continues in the wireless industry with the combinations of Verizon and Alltel, Sprint and Nextel, AT&T’s acquisition of 100% ownership of AT&T Wireless as well as its acquisition of Dobson and proposed acquisition of Centennial Cellular, the acquisitions by Verizon Wireless of Rural Cellular and by T-Mobile of Suncom. These and other of our competitors are, or are affiliated with, major communications companies that have substantially greater financial, technical and marketing resources than we have. These competitors may have greater name recognition and more established relationships with a larger base of current and potential customers and, accordingly, we may not be able to compete successfully. Two of our national wireless competitors acquired a significant portion of the 700 MHz spectrum recently auctioned by the FCC. The national wireless carriers in many instances on average have more spectrum in each of our licensed areas than we do. We may not be able to obtain additional spectrum and thus may be unable to offer future developed services which utilize PCS spectrum or offer services developed for other specific spectrum as a result of not having as much spectrum, or as much spectrum in specific bands, as our competitors do. In addition, the national carriers have distribution with “big box” retailers and exclusive partners.
In addition, each of the four largest wireless carriers offers handsets for which that carrier has the exclusive right to provide customers. Recent estimates are that over 50 handset models are under exclusive arrangements with these carriers. We do not have exclusivity for any handset that we provide to our customers and are unable to provide the handsets that are available exclusively from other carriers. We may be unable to attract some new customers, and we may lose existing customers, because of our inability to offer these handsets or to offer these handsets on a timely basis compared to our competitors. Additionally, to the extent there is a shortage issue related to a popular handset model in our lineup, we may not receive the same level of support from the suppliers as carriers with significantly higher buying power.
Over the last three years, the per-minute rate for wireless services has declined. Competition and market saturation may cause the prices for wireless products and services to continue to decline in the future. As per-minute rates continue to decline, our revenues and cash flows may be adversely impacted.
The effect of aggregate penetration of wireless services in all markets, including our markets, has made it increasingly difficult to attract new customers and retain existing ones. While recent consolidation in the wireless industry may reduce the number of carriers in our markets, the carriers resulting from such consolidation will be larger and potentially more effective in their ability to compete with NTELOS. Competition in the wireless prepay market changed dramatically in 2009. Whereas our prepay competitive position was largely uncontested prior to last year, during 2009, a number of large wireless competitors, including Boost, TracFone, Straight Talk, Virgin, T-Mobile and Page Plus, entered the prepaid market. Many of these competitors have access to big box retailers and convenience stores that are unavailable to us. Pricing competition in the prepaid market intensified during the fourth quarter of 2009, with the introduction of a number of prepaid unlimited nationwide plans for less than $50 per month. We also continue to face risks to our competitive “Value” position in the postpay market, including through the introduction in January 2010 of reduced price nationwide unlimited voice plans by competitors such as AT&T,
23
Table of Contents
Verizon and US Cellular. As a result of increased competition, we anticipate that the price per minute for wireless voice services will continue to decline while costs to acquire customers, including, without limitation, handset subsidies and advertising and promotion costs, may increase. Our ability to continue to compete effectively will depend upon our ability to anticipate and respond to changes in technology, customer preferences, new service offerings, demographic trends, economic conditions and competitors’ pricing strategies. Failure to successfully market our products and services or to adequately and timely respond to competitive factors could reduce our market share or adversely affect our revenue or net income. In the current wireless market, our competiveness also depends on our ability to offer nationwide unlimited voice, text and data plans to Switchers as well as our existing customers. NTELOS relies on roaming agreements with other wireless carriers to provide service in areas not covered by our network. These agreements are subject to renewal and termination if certain events occur, including, without limitation, if network standards are not maintained. If NTELOS is unable to maintain or renew these agreements, our ability to continue to provide competitive regional and nationwide wireless service to our customers could be impaired, which, in turn, would have an adverse impact on our wireless operations.
If we experience a high rate of wireless customer turnover or seek to prevent significant customer turnover, our revenues could decline and our costs could increase.
Many wireless providers in the U.S. have experienced and have sought to prevent a high rate of customer turnover. The rate of customer turnover may be the result of several factors, including limited network coverage, reliability issues such as blocked or dropped calls, handset problems, inability to roam onto third-party networks at competitive rates, or at all, price competition and affordability, customer care concerns, wireless number portability requirements that allow customers to keep their wireless phone number when switching between service providers and other competitive factors. In addition, customers could elect to switch to another carrier that has service offerings dependent on newer network technology. We cannot assure you that our strategies to address customer turnover will be successful. If we experience a high rate of wireless customer turnover or seek to prevent significant customer turnover or fail to replace lost customers, our revenues could decline and our costs could increase which could have a material adverse effect on our business, financial condition and operating results.
The loss of our largest customer, Sprint Nextel, or a decrease in its usage may result in lower revenues or higher expenses.
Sprint Nextel accounted for approximately 22% of our operating revenues for the year ended December 31, 2009. If we were to lose Sprint Nextel as a customer or if Sprint Nextel became financially unable to pay our charges, our revenues would decline, which could have a material adverse effect on our business, financial condition and operating results. Additionally, if Sprint Nextel’s current financial condition should worsen in a material manner, our business would suffer material adverse consequences which could include termination or revision of our Strategic Network Alliance. Any migration by Sprint Nextel of customers to non-CDMA technology could result in a decline in the usage of our network by Sprint Nextel and could cause an adverse impact on our business, financial condition and operating results.
Continued decline in Sprint Nextel’s subscriber base could have an adverse effect on its long-term growth, financial condition and strategic direction, which could, in turn, have an adverse effect on our wireless wholesale revenues under the Strategic Network Alliance.
The pricing arrangement under our Strategic Network Alliance with Sprint Nextel may fluctuate which could result in lower revenues or a decline in the historical growth of our wholesale wireless revenues.
Under the Strategic Network Alliance, our wholesale revenues are the greater of $9.0 million per month or the revenues derived based on voice and data usage by Sprint Nextel of our network priced at the applicable rates and terms for each of the services categories. Our actual revenue based on voice and data usage exceeded the $9.0 million per month minimum for the first six months of 2009. Following the travel data rate reset on July 1, 2009, our monthly calculated revenue from Sprint Nextel was below the $9.0 million minimum and thus we billed and recognized revenue at the $9.0 million minimum stipulated in the contract. Revenue from this contract is projected to remain at that level throughout 2010. All of the rate elements generally fluctuate for the periods specified for each service under the agreement under a formula tied to a national wireless retail customer revenue yield and a national retail data revenue yield. Sprint Nextel prices its national calling plans based on its business objectives and it could set price levels or change other characteristics of its plans in a way that may not be economically advantageous for our business or may result in reduction of usage from Sprint Nextel customers. Accordingly, we could remain at the $9.0 million minimum for a period longer than we anticipate which could impact our long term profitability.
24
Table of Contents
If the roaming rates we pay for our customers’ usage of third-party networks increase, our operating results may decline.
Many of our competitors have national networks which enable them to more economically offer roaming and long-distance telephone services to their subscribers. We do not have a national network, and we must pay other carriers a per-minute charge for carrying roaming and long-distance calls made by our subscribers. To remain competitive, we absorb a substantial portion of the roaming and long-distance charges without increasing the prices we charge to our subscribers. We have entered into roaming agreements with other communications providers that govern the roaming rates that we are required to pay. As the wireless industry consolidates, our ability to replicate our roaming service offerings at rates which will make us, or allow us to be, competitive is uncertain at this time and may become more difficult. The roaming agreements do not cover all geographic areas where our customers may seek service when they travel and a number of the roaming agreements may be terminated on relatively short notice and may not be renewed in the future. In addition, we believe the rates we are charged by certain carriers in some instances are higher than the rates they charge to other roaming partners. We may also be unable to continue to receive roaming services in areas in which we hold licenses or lease spectrum after the expiration or termination of our existing roaming agreements. Any future renewal also may not include roaming for data services. In addition, under the terms of our Strategic Network Alliance, we have favorable roaming rates with Sprint Nextel. If these roaming agreements are terminated, the roaming rates that we are charged may increase and, accordingly, our cash flow and operating results may decline.
We may incur significantly higher wireless handset subsidy costs than we anticipate to upgrade existing subscribers.
As our subscriber base grows, and technological innovations occur, more existing subscribers are upgrading to new wireless handsets, especially handsets that offer more applications including data-centric and smart phones. We subsidize a portion of the price of wireless handsets and incur sales commissions on the sale or upgrade of handsets. The cost of handsets increase with an increase in features, functionality, and the number of applications they support. This results in our incurring higher handset subsidies. Furthermore, we generally pay more to purchase handsets than many of our national competitors who buy from manufacturers in large volumes. If more subscribers purchase or upgrade to new wireless handsets than we project, our operating results would be adversely affected during the period of the sale or upgrade.
Our largest competitors and Sprint Nextel may build networks in our markets or use alternative suppliers, which may result in decreased revenues and severe price-based competition.
Our current roaming partners, larger wireless providers and Sprint Nextel ultimately may build their own wireless networks in our service areas or obtain roaming services from alternative sources. In addition to controlling the iDEN network as a result of the acquisition of Nextel Partners, Sprint Nextel controls 10 MHz of spectrum within our service territory in the 1900 MHz PCS band. While the terms of our agreement generally prohibit Sprint Spectrum L.P. from directly or indirectly commencing construction of, contracting for or launching its own CDMA network in the Strategic Network Alliance service area until 18 months prior to termination of the agreement, the initial term of which ends on July 31, 2015, it would adversely affect our revenues and operating results if Sprint Nextel or another wireless provider were to do so. Should this occur, use of our networks would decrease and our roaming and/or wholesale revenues would be adversely affected. Once a digital wireless system is built, there are only marginal costs to carrying an additional call, so a larger number of facility-based competitors in our service areas could stimulate significant price competition, as has occurred in many areas in the U.S., with a resulting reduction in our revenues and operating results.
The loss of our licenses could adversely affect our ability to provide wireless services.
Our wireless licenses are generally valid for ten years from the effective date of the license. Licensees may renew their licenses for additional ten-year periods by filing renewal applications with the FCC. Our wireless licenses expire in various years. The renewal applications are subject to FCC review and potentially public comment to ensure that the licensees meet their licensing requirements and comply with other applicable FCC mandates. We applied for and were granted renewal of 25 of our licenses between 2005 and 2009. We do not have any licenses due for renewal in the next 12 months. If we fail to file for renewal at the appropriate time or fail to meet any regulatory requirements for renewal, we could be denied a license renewal and, accordingly, our ability to provide or continue to provide service in that license area would be adversely affected.
25
Table of Contents
Many of our licenses are subject to interim or final construction requirements. While the licensees have generally met “safe harbor” standards for ensuring such benchmarks are met, we have relied on, and will in the future rely on, “substantial service” thresholds for meeting build-out requirements. In such cases, there is no guarantee that the FCC will find our construction sufficient to meet the applicable construction requirement, in which case the FCC could terminate our license and our ability to continue to provide service in that license area would be adversely affected.
Our failure to comply with regulatory mandates could adversely affect our ability to provide wireless services.
The FCC regulates the licensing, operation, acquisition and sale of the licensed spectrum that is essential to our business. We must comply with regulatory requirements, such as Enhanced 911, or E911, and CALEA and the customer privacy mandates of the Customer Proprietary Network Information (“CPNI”) rules. Failure to comply with these and other regulatory requirements may have an adverse effect on our licenses or operations and could result in sanctions, fines or other penalties.
On September 11, 2007, the FCC adopted an order mandating that wireless E911 location accuracy be measured on the public safety answering point (“PSAP”) level, but deferred effectiveness of the mandate for five years while requiring interim milestones. The interim milestones cover increasingly smaller geographic areas. The Rural Cellular Association and T-Mobile appealed this FCC Order. On March 25, 2008, the United States Court of Appeals for the District of Columbia Circuit (“Court”) stayed the Location Accuracy Order. On July 31, 2008, the FCC asked the U.S. Court of Appeals for the District of Columbia to vacate and remand the order to the FCC and, on September 17, 2008, the court granted the FCC’s request. On September 22, 2008, the FCC sought comments on a new proposal for E911 accuracy requirements for both handset-based and network-based technologies to achieve E911 accuracy compliance at the county-level. That proposal was filed by the Association of Public-Safety Communications Officials and the National Emergency Number Association, Verizon Wireless, Sprint Nextel Corporation, and AT&T. In connection with separate transactions approved by the FCC in 2008, Verizon Wireless and Sprint Nextel made voluntary commitments to implement these proposed accuracy standards. The FCC has yet to make a general decision about this proposal and in November of 2009, asked interested parties to update the record in this proceeding.
The FCC, together with the FAA, also regulates tower marking and lighting. In addition, tower construction is affected by federal, state and local statutes addressing zoning, environmental protection and historic preservation. The FCC adopted significant changes to its rules governing historic preservation review of projects, which makes it more difficult and expensive to deploy antenna facilities. The FCC is also considering changes to its rules regarding environmental protection as related to tower construction, which, if adopted, could make it more difficult to deploy facilities.
Our decision not to participate at this time in the FCC’s new point-to-multipoint emergency alert capabilities program may result in increased churn or slower growth.
In 2006, Congress passed the Warning, Alert, and Response Network Act which required the FCC to adopt technical standards and procedures to enable alerting capability for CMRS providers that voluntarily elect to transmit emergency alerts. The FCC adopted such a program in April of 2008. Under the Warning, Alert, and Response Network Act, a CMRS carrier can elect not to participate in providing such alerting capability and we have made such an election not to participate at this time. As a result of our election not to participate, we may experience slower growth and higher churn if subscribers do not purchase our service or terminate service because we have elected not to provide this capability.
The licensing of additional spectrum by the FCC may adversely affect our ability to compete in providing wireless services.
The FCC, from time to time, auctions additional radio spectrum that may be suitable for services that compete, directly or indirectly, with our wireless offerings. For example, in August and September of 2006, the FCC auctioned an additional 90 MHz of radio spectrum for “Advanced Wireless Services” that can be used for services like our wireless offerings. In early 2008, the FCC conducted an auction of additional wireless service spectrum in the 700 MHz range. We participated in the 2006 auction but decided not to participate in the 2008 auction. We may participate in other future auctions in order to obtain spectrum necessary to increase the capacity of our systems or to allow us to offer new services. The auction of new spectrum may adversely impact our business by creating new competitors, enhancing the ability of our existing competitors to offer services we cannot offer, requiring us to expend additional funds to acquire spectrum necessary for continued growth, or restricting our growth because we cannot acquire additional necessary spectrum.
26
Table of Contents
If we lose the right to install our equipment on wireless cell sites or are unable to renew expiring leases for wireless cell sites on favorable terms or at all, our business and operating results could be adversely impacted.
As of December 31, 2009, 91% of our base stations were installed on leased cell site facilities, with 43% of the leased facilities installed on facilities owned by American Tower and Crown Communications. A large portion of these cell sites are leased from a small number of large cell site companies, including American Tower and Crown Communications, pursuant to master agreements that govern the general terms of our use of that company’s cell sites. If a master agreement with one of these cell site companies were to terminate, or if one of these cell site companies were unable to support our use of its cell sites, we would have to find new sites or rebuild the affected portion of our network. In addition, the concentration of our cell site leases with a limited number of cell site companies could adversely affect our operating results and financial condition if we are unable to renew our expiring leases with these cell site companies either on terms comparable to those we have today or at all. If any of the cell site leasing companies with which we do business were to experience severe financial difficulties, or file for bankruptcy protection, our ability to use cell sites leased from that company could be adversely affected. If a material number of cell sites were no longer available for our use, our financial condition and operating results could be adversely affected.
We cannot predict the effect of technological changes on our business.
The wireless telecommunications industry is experiencing significant technological change. We believe our continued success will depend, in part, on our ability to anticipate or adapt to technological changes and to offer, on a timely basis, services that meet customer demands. We cannot assure you that we will obtain access to new technology on a timely basis or on satisfactory terms, which could have a material adverse effect on our business, financial condition and operating results.
In an effort to keep pace with the industry, over the past two years we have deployed EV-DO at 85% of our cell sites. EV-DO is third generation technology (3G) specifically designed to support faster wireless data rates. EV-DO supports peak data rates of 3.1Mbps on the downlink and 1.8Mbps on the reverse link. As we were deploying EV-DO, operators such as Verizon Wireless and Sprint Nextel were already detailing their plans to deploy next generation technology (fourth generation, or 4G). Verizon Wireless has selected LTE, a form of wireless broadband with significantly higher speeds than EV-DO, as its 4G technology choice and has aggressively started deploying this technology. Verizon Wireless recently announced plans to launch 25 to 30 major markets by the end of 2010 and will likely have more 4G coverage than 3G coverage by the end of 2013. Clearwire, which Sprint Nextel has a substantial investment in, has selected Wi-Max as its 4G technology choice and is currently commercially deploying it, although perhaps not as aggressively as Verizon is deploying LTE. Additionally, femtocells will likely be introduced in the near future. Femtocells are mini-cell sites that are portable and can be located in a home or office, thus improving wireless in-building coverage.
Continued deployment of next generation technology by the competition could cause the technology used on our network to become less competitive. We may not be able to respond to future changes and implement new technology on a timely basis or at an acceptable cost. To the extent that we do not keep pace with technological advances, fail to offer technologies comparable to those of our competitors or fail to respond timely to changes in competitive factors in our industry, we could lose existing customers and experience a decline in revenues and net income. Each of these factors could have a material adverse effect on our business, financial condition and results of operations.
For us to keep pace with these technological changes and remain competitive, we must continue to make significant capital expenditures to our integrated communications system. Customer acceptance of the services that we offer will continually be affected by technology-based differences in our product and service offerings.
In addition, some competitors have announced plans to develop a Wi-Fi or Wi-Max enabled handset. Such a handset would permit subscribers to communicate using voice and data services with their handset using VoIP technology in any area equipped with a wireless internet connection, or hot spot, potentially bypassing our network. The number of hot spots in the U.S. is growing rapidly, with some major cities and urban areas being covered entirely. The availability of VoIP or another alternative technology to our subscribers could greatly reduce the usage of our network, which would have an adverse effect on our financial condition and operating results.
27
Table of Contents
To accommodate next generation of applications and streaming video speeds significantly above that of EV-DO will require significant technological changes to our network and additional spectrum in certain areas. We cannot assure you that we could make these technological changes or gain access to this spectrum at a reasonable cost or at all. Failure to provide these services could have a material adverse effect on our ability to compete with wireless carriers offering these new technologies.
We and our suppliers may be subject to claims of infringement regarding telecommunications technologies that are protected by patents and other intellectual property rights.
In general, we do not manufacture any of the equipment or software used in our telecommunications businesses and we do not own any patents. Instead, we purchase the infrastructure equipment, handsets and software used in our business from third parties and we obtain licenses to use the associated intellectual property. Telecommunications technologies are protected by a wide variety of patents and other intellectual property rights. We and some of our suppliers and service providers may receive assertions and claims from third parties that the products or software utilized by us or our suppliers and service providers infringe on the patents or other intellectual property rights of these third parties. These claims could require us or an infringing supplier or service provider to cease certain activities or to cease selling the relevant products and services. The manufacturers and suppliers that provide us with the equipment and technology we use in our business may agree to indemnify us against possible infringement claims. However, we do not always have such indemnification protections in place and, even if we have such agreements in place, we may not be fully protected against all losses associated with infringement claims. In addition, the manufacturers and suppliers also may require us to indemnify them against infringement claims asserted against them with respect to equipment they sell to us. Whether or not infringement claims are valid or successful, such claims could also adversely affect our business by diverting management attention, involving us in costly and time-consuming litigation, requiring us to enter into royalty or licensing agreements (which may not be available on acceptable terms, or at all), or requiring us to cease certain activities or to cease selling certain products and services to avoid claims of infringement.
Wireline Telecommunications
Our rural local telephone company subsidiaries face substantial competition from competitors that are less heavily regulated than we are, which could increase our expenses or force us to lower prices, causing our revenues and operating results to decline.
As the rural local telephone companies for the western Virginia cities of Waynesboro and Covington, and portions of Alleghany, Augusta and Botetourt Counties, Virginia, we currently compete with a number of different providers, many of which are unregulated or less heavily regulated than we are. Our rural telephone company subsidiaries qualify as rural local telephone companies under the Telecommunications Act and are, therefore, exempt from many of the most burdensome obligations to facilitate the development of competition, such as the obligation to sell unbundled elements of our network to our competitors at “forward-looking” prices that the Telecommunications Act places on larger carriers. Nevertheless, our rural telephone company subsidiaries face significant competition, particularly from competitors that do not need to rely on access to our network to reach their customers. For example, wireless providers and cable companies continue to increase their market share and pose a significant competitive risk to our business. A significant competitive development in 2006 was the acquisition by Comcast of the cable television markets in our service area previously served by Adelphia Communications Corporation. Comcast has introduced wireline digital voice services to its cable customers in Charlottesville and other Virginia markets, including in Waynesboro and Augusta County in May 2008, and it may offer these services in our Botetourt County service area in the future. Shenandoah Telecommunications Company purchased the cable property overlapping our RLEC territory in Clifton Forge and Covington, Virginia. We believe it is likely that Shenandoah will begin providing digital voice and data services to its customers in these markets in the future.
Cable companies and other VoIP providers are able to compete with our rural telephone company subsidiaries even though the “rural exemption” under the Telecommunications Act is in place. If our rural exemption were removed, CLECs could more easily enter our rural telephone company subsidiaries’ markets. Moreover, the regulatory environment governing wireline local operations has been, and we believe will likely continue to be, very liberal in its approach to promoting competition and network access.
Consistent with the experience of other rural telephone companies, our rural telephone company subsidiaries have experienced a reduction in access lines caused by, among other things, customer migration to broadband internet service from dial-up internet service (resulting in a disconnection of “second lines”), wireless competition, cable competition and business customer migration from Centrex services to IP-based and other PBX services using fewer
28
Table of Contents
(lines. As penetration rates of these technologies increase in our markets, our revenues could decline. Our rural telephone company subsidiaries experienced a net loss of 2,900 access lines in the year ended December 31, 2009, or 7.0% of our access lines served at the end of 2008. A continued net loss of access lines would impact our revenues and operating results.
Our rural telephone company subsidiaries are subject to several regulatory regimes and consequently face substantial regulatory burdens and uncertainties.
Many of our competitors are unregulated or less heavily regulated than we are. For example, VoIP technology is used to carry voice communications services over a broadband internet connection. The FCC has ruled that VoIP services are jurisdictionally interstate and that some VoIP arrangements (those not using the Public Switched Telephone Network) are not subject to regulation as telephone services. In 2006, the FCC expanded the base of USF contributions by extending universal service contribution obligations to providers of interconnected VoIP service. The United States Supreme Court upheld the FCC’s ruling that cable broadband internet services are not subject to common carrier telecommunications regulation. In addition, the Virginia State Corporation Commission, or SCC, imposes service quality obligations on our rural telephone company subsidiaries and requires us to adhere to prescribed service quality standards, but many of our competitors are not subject to these standards. These standards measure the performance of various aspects of our business. If we fail to meet these standards, the SCC may impose fines or penalties or take other actions that may impact our revenues or increase our costs.
Regulatory developments at the FCC and the Virginia SCC could reduce revenues that our rural telephone company and CLEC subsidiaries receive from network access charges.
For the year ended December 31, 2009, approximately $31 million of our rural telephone company subsidiaries’ revenues came from network access charges, which are paid to us by long distance carriers for originating and terminating calls in the areas we serve. These revenues are highly profitable for us. The amount of access charge revenues that we receive is based on rates set by the FCC for interstate long distance calls and the SCC for intrastate long distance calls. Such access rates are subject to change. Our federal access charges are periodically reset by the FCC and they were subject to a biennial reset (reduction) on July 1, 2009. The SCC could conduct an access reform proceeding or rate cases and earnings reviews, all of which could result in rate changes.
The FCC has reformed and continues to reform the structure of the federal access charge system. The FCC has an active proceeding addressing access and other intercarrier payments, which reduce the revenues we receive from other carriers. On November 5, 2008, the Federal Communications Commission adopted a Further Notice of Proposed Rulemaking (“November 5th Further Notice”) requesting comment on three alternative proposals for reform of the Universal Service Fund (“USF”) and the intercarrier compensation rules, including both federal and state access charges. It is uncertain whether the FCC will ultimately adopt any of the three proposed plans and what matters will be addressed in any plan that is ultimately adopted. Intercarrier compensation reform could result in significant decreases in the access charge revenues received by our rural telephone companies. While we expect that the FCC would allow these changes to occur over some transition period and would permit our rural telephone companies to offset the impact of reduced revenues with increased subscriber line charges and USF payments, it is unknown whether all or only a portion of the access revenues would be so recovered.
On September 28, 2007, the Virginia SCC issued a final order in a rulemaking docket that capped CLECs’ intrastate switched access charges, including the access charges of our CLECs, at the higher of the CLEC’s interstate switched access charge or the intrastate switched access charge of the ILEC (or the average of all ILECs) providing service in the territory served by the CLEC. The cap took effect at the end of a transition period that began on December 1, 2007 and ended on March 31, 2008. As part of that transition, we reduced our CLEC access rates effective on January 1, 2008 and then again March 31, 2008. These lower rates reduced our CLEC access revenues by a total of $1.2 million in 2008. On April 25, 2008, Verizon filed a petition with the West Virginia Public Service Commission asking that a similar cap on intrastate CLEC access charges be adopted in West Virginia and the Public Service Commission has done so. If, in a future proceeding, the SCC were to reduce the level of switched access charges that could be billed by our RLECs, such a reduction could have a significant adverse financial effect on our RLECs depending on the amount of the reduction. The SCC has ordered that CenturyLink be required to lower its intrastate access rates. The SCC order to reduce these rates does not impact the rates charged by our RLECs.
In January of 2010, a bill was introduced in the Virginia House of Delegates that would require ILECs in Virginia, including NTELOS, to set their intrastate access charges at the level of their interstate access charges. If these access charges are reduced quickly and without sufficient substitutes for the lost revenues, this could have a material adverse effect on our financial condition, results of operations and cash flows. A substitute bill that would require less in access charge reductions and would defer to the SCC as to the level and timing of access charge reductions for NTELOS, has passed both houses of the Virginia General Assembly and has been sent to the Governor for signature.
29
Table of Contents
Currently, VoIP providers generally do not pay us access charges for calls that originate or terminate on our network. Therefore, expanded use of VoIP technology could reduce the access or intercarrier revenues received by rural telephone companies like ours. The FCC is currently considering the extent to which VoIP providers should be obligated to pay, or entitled to receive, access charges, but we cannot predict the timing or ultimate result of this proceeding. If VoIP providers continue not to pay access charges to us, our revenues and operating results could be adversely affected to the extent that users substitute VoIP calls for traditional wireline communications.
Regulatory developments at the FCC could reduce revenues that our rural telephone company subsidiaries and our wireless subsidiaries receive from the Federal Universal Service Fund or other fund allocations.
For the year ended December 31, 2009, we received approximately $4 million in payments from the federal Universal Service Fund in connection with our rural telephone company subsidiaries’ operations. Additionally, we received approximately $3 million (net) from other NECA pool distributions. The FCC is examining its Universal Service Fund rules and may change the amount of Universal Service Fund support available to carriers. The FCC may change its rules and reduce the amount of funding ultimately available to our rural telephone company subsidiaries as noted above. There can be no assurance that we will continue to receive the current level of Universal Service Fund revenues in the future. Loss of Universal Service Fund revenues could adversely affect our operating results.
The FCC is currently considering a recommendation from the Federal-State Joint Board on Universal Service, an advisory panel composed of FCC commissioners and state telecommunications regulators, that the fund be divided into three distinct funds each with a separate distribution mechanism and funding allocation. The three funds would be a Broadband Fund, a Mobility Fund, and a Provider of Last Resort Fund. Under the current rules, our competitors can obtain the same per-line level of federal Universal Service Fund subsidies as we do, without regard for whether their costs of providing service are similar to ours, if either the FCC or the SCC determines that granting these subsidies to competitors would be in the public interest and the competitors offer and advertise certain telephone services as required by the Telecommunications Act. The joint board’s recommendation would eliminate this “identical support” rule. In addition to considering the joint board recommendations, the FCC has asked for comments on a proposal to use “reverse auctions” as a means to distribute certain Universal Service funding. It is not known how these changes, if adopted, may affect us.
NTELOS’s wireless operations receive funding from the federal USF in Virginia, West Virginia, and Kentucky. On May 1, 2008, the FCC placed an interim cap on the amount of USF funding distributed in each state to competitive providers as a group, including CMRS carriers and CLECs. USF funding to competitive providers in each state is now capped at the level of support that such carriers as a group received in that state during March 2008.
The FCC is also currently examining the way in which it collects carrier contributions to the federal Universal Service Fund. Today, as a telecommunications carrier, we contribute a percentage of our interstate revenues to the Universal Service Fund, which supports the delivery of services to high-cost areas and low-income consumers, as well as to schools, libraries and rural health care providers.
Our CLEC operations face substantial competition and uncertainty relating to their interconnection agreements with the ILEC networks covering the CLEC markets we serve.
Our CLEC operations compete primarily with ILECs, including Verizon, Frontier and CenturyLink, and, to a lesser extent, other CLECs, including Level 3, Fibernet, Zayo, KDL, PAETEC and Cox. We will continue to face competition from other current and future market entrants.
We have interconnection agreements with the ILEC networks covering each market in which our CLEC serves. From time to time, we are required to negotiate amendments to, extensions of, or replacements for these agreements. Additionally, we may be required to negotiate new interconnection agreements in order to enter new markets in the future. We may not be able to successfully negotiate amendments to existing agreements, negotiate new interconnection agreements, renew our existing interconnection agreements, opt in to new agreements or successfully arbitrate replacement agreements for interconnection on terms and conditions acceptable to us. Our inability to do so would adversely affect our existing operations and opportunities to expand our CLEC business in existing and new markets. As the FCC modifies, changes and implements rules related to unbundling of ILEC network elements and collocation of competitive facilities at ILEC central offices, we generally have to renegotiate our interconnection agreements to implement those new or modified rules.
30
Table of Contents
Our competitors have substantial business advantages over our CLEC operations, and we may not be able to compete successfully.
The regional Bell operating companies and other large ILECs such as Frontier Communications Corporation (“Frontier”) and CenturyLink dominate the current market for business and consumer telecommunications services and have a virtual monopoly on telephone lines. These companies represent the dominant competition in much of our target service areas, and we expect this competition to intensify. The large ILECs have established brand names and reputations for high quality service in their service areas, possess sufficient capital to upgrade existing and deploy new equipment, own their telephone lines and can bundle digital data services with their existing analog voice services and other services, such as long-distance, wireless and video services, to achieve economies of scale in serving customers. Moreover, the large ILECs are aggressively implementing “win-back” programs to regain access line customers lost to competitors and use bundled services to assist in those programs. We pose a competitive risk to the large ILECs that serve our CLEC markets and, as both our competitors and our suppliers, they have no motivation to respond in a timely manner to our requests or to assist in the enhancement of the services we provide to our CLEC customers.
We face substantial competition in our internet and data services business and face regulatory uncertainty, each of which may adversely affect our business and results of operations.
We currently offer our internet and data services in rural markets and face competition from other internet and data service providers, including cable companies. The internet industry is characterized by the absence of significant barriers to entry and rapid growth in internet usage among customers. As a result, we expect that our competition will increase from market entrants offering high-speed data services, including DSL, cable and wireless access. Our competition includes:
| • | cable modem services offered by cable providers; |
| • | ILECs, such as Verizon, Frontier and CenturyLink in our CLEC territories; and |
| • | local, regional and national ISPs, both wireline and wireless, including Zayo, KDL and Fibernet. |
Many of our competitors have financial resources, corporate backing, customer bases, marketing programs and brand names that are greater than ours. Additionally, competitors may charge less than we do for internet services, causing us to reduce, or preventing us from raising, our fees.
A significant portion of our dial-up internet customer base has transitioned to broadband services. We expect this trend to continue. Where we offer incumbent local exchange service or, to some extent, CLEC services, we have been able to maintain service to some of these customers through DSL services or service bundles. In those areas of our internet coverage area where we provide neither incumbent local exchange service nor CLEC service, we have been unable to retain dial-up internet customers who migrate to broadband services. In 2009 we experienced a 33.8% loss in the number of dial-up internet customers from 2008. Our dial-up internet service revenues for the year ended December 31, 2009 decreased to approximately $2.2 million from approximately $3.0 million for the year ended December 31, 2008.
In connection with our internet access offerings, we could become subject to laws and regulations as they are adopted or applied to the internet. To date, the FCC has treated ISPs as enhanced or information service providers, rather than common carriers, although it has subjected ISPs, such as providers of broadband, to many obligations formerly placed on common carriers, such as the requirements of the Communications Assistance for Law Enforcement Act. As internet services expand, federal, state and local governments may adopt rules and regulations, or apply existing laws and regulations to the internet. The FCC recently issued a decision that harmonizes the regulatory frameworks that apply to broadband access to the internet through telephone and cable providers’ communications networks.
General Matters
We may require additional capital to respond to customer demand and to competition, and if we fail to raise the capital or fail to have continued access to the capital required to build out and operate our planned networks, we may experience a material adverse effect on our business.
We require additional capital to build out and operate our wireless and wireline networks and for general working capital needs. Our aggregate capital expenditures for 2009 were $134.6 million, inclusive of $26.7 million for the purchase of certain fiber optic and network assets and related transport and data service contracts from Allegheny Energy, Inc.
31
Table of Contents
Because of our intensely competitive market, we may be required, including under the terms of the Strategic Network Alliance, to expand the technical requirements of our wireless or wireline network or to build out additional areas within our territories that could result in increased capital expenditures. Any such unplanned capital expenditures may adversely affect our business, financial condition and operating results.
We are subject to numerous surcharges and fees from federal, state and local governments, and the applicability and amount of these fees is subject to great uncertainty.
Telecommunications providers pay a variety of surcharges and fees on their gross revenues from interstate and intrastate services. Interstate fees include federal Universal Service Fund fees and common carrier regulatory fees. In addition, state regulators and local governments impose surcharges, taxes and fees on our services and the applicability of these surcharges and fees to our services is uncertain in many cases and jurisdictions may argue as to whether we have correctly assessed and remitted those monies. The division of our services between interstate services and intrastate services is a matter of interpretation and may in the future be contested by the FCC or state authorities. In addition, periodic revisions by state and federal regulators may increase the surcharges and fees we currently pay. In 2004, the Virginia General Assembly passed legislation that required us to pay state sales taxes on purchases that were previously exempt from those taxes. As a result, we have added a surcharge to our customer bills to recover this increase in our taxes. It also is unknown if our tax burden will be similar to competitors using different technologies to provide similar services.
Virginia legislation that significantly revised the taxation of communications services in Virginia took effect on January 1, 2007. The new law applied a uniform, statewide, sales and use tax to retail communications and video services on a competitively neutral basis. The communications sales and use tax rate is 5%. The sales and use tax is remitted by communications providers to the Virginia Department of Taxation, which administers the distribution of the Communications Sales and Use Tax Trust Fund. The redistribution of taxes and fees from the trust fund to the localities is intended to be revenue neutral and replaces franchise fees and utility taxes set by localities.
The Federal government and many states apply transaction-based taxes to sales of our products and services and to our purchases of telecommunications services from various carriers. It is possible that our transaction-based tax liabilities could change in the future. We may or may not be able to recover some or all of those taxes from our customers.
We rely on a limited number of key suppliers and vendors for timely supply of equipment and services relating to our network infrastructure. If these suppliers or vendors experience problems or favor our competitors, we could fail to obtain sufficient quantities of the products and services we require to operate our businesses successfully.
We depend on a limited number of suppliers and vendors for equipment and services relating to our network infrastructure. If these suppliers experience interruptions or other problems delivering these network components on a timely basis, our subscriber growth and operating results could suffer significantly. Our initial choice of a network infrastructure supplier can, where proprietary technology of the supplier is an integral component of the network, cause us effectively to be locked into one or a few suppliers for key network components. As a result, we have become reliant upon a limited number of network equipment manufacturers, including Alcatel-Lucent, Cisco Systems, Inc. and others. If alternative suppliers and vendors become necessary, we may not be able to obtain satisfactory and timely replacement supplies on economically attractive terms, or at all.
A system failure could cause delays or interruptions of service, which could cause us to lose customers.
To be successful, we must provide our customers reliable network service. Some of the risks to our network and infrastructure include:
| • | physical damage to outside plant facilities; |
| • | power surges or outages; |
| • | software defects; |
| • | human error; |
| • | disruptions beyond our control, including disruptions caused by terrorist activities or severe weather; and |
32
Table of Contents
| • | failures in operational support systems. |
Network disruptions may cause interruptions in service or reduced capacity for customers, either of which could cause us to lose customers and incur expenses.
We are dependent on third-party vendors for our information and billing systems. Any significant disruption in our relationship with these vendors could increase our cost and affect our operating efficiencies.
Sophisticated information and billing systems are vital to our ability to monitor and control costs, bill customers, process customer orders, provide customer service and achieve operating efficiencies. We currently rely on internal systems and third-party vendors to provide all of our information and processing systems. Some of our billing, customer service and management information systems have been developed by third parties and may not perform as anticipated or the third parties may experience interruptions or other problems delivering these systems. In addition, our plans for developing and implementing our information and billing systems rely to some extent on the delivery of products and services by third-party vendors. Our right to use these systems is dependent upon license agreements with third-party vendors. Some of these agreements are cancelable by the vendor, and the cancellation or nonrenewable nature of these agreements could impair our ability to process customer information and/or bill our customers. Since we rely on third-party vendors to provide some of these services, any switch in vendors could be costly and affect operating efficiencies.
If or when we lose a member or members of our senior management, our business may be adversely affected.
The success of our business is largely dependent on our executive officers, as well as on our ability to attract and retain other highly qualified technical and management personnel.
We believe that there is, and will continue to be, intense competition for qualified personnel in the telecommunications industry, and we cannot assure you that we will be able to attract and retain the personnel necessary for the development of our business. The unexpected loss of key personnel or the failure to attract additional personnel as required could have a material adverse effect on our business, financial condition and operating results.
Unauthorized use of, or interference with, our network could disrupt service and increase our costs.
We may incur costs associated with the unauthorized use of our network including administrative and capital costs associated with detecting, monitoring and reducing the incidence of fraud. Fraudulent use of our network may impact interconnection costs, capacity costs, administrative costs, fraud prevention costs and payments to other carriers for fraudulent roaming.
Security breaches related to our physical facilities, computer networks, and informational databases may cause harm to our business and reputation and result in a loss of customers.
Our physical facilities and information systems may be vulnerable to physical break-ins, computer viruses, theft, attacks by hackers, or similar disruptive problems. If hackers gain improper access to our databases, they may be able to steal, publish, delete or modify confidential personal information concerning our subscribers. In addition, misuse of our customer information could result in more substantial harms perpetrated by third parties. This could damage our business and reputation, and result in a loss of customers.
We may not be able to pay dividends on our common stock in the future.
We intend to continue to pay regular quarterly dividends on our common stock. Any decision to declare future dividends will be made at the discretion of the board of directors and will depend on, among other things, our results of operations, cash requirements, investment opportunities, financial condition, contractual restrictions and other factors that our board of directors may deem relevant. We are a holding company that does not operate any business of our own. As a result, we are dependent on cash dividends and distributions and other transfers from our subsidiaries to make dividend payments or to make other distributions to our stockholders, including by means of a stock repurchase. Amounts that can be made available to us to pay cash dividends or repurchase stock are restricted by the NTELOS Inc. Credit Agreement.
33
Table of Contents
Our stock price has historically been volatile and may continue to be volatile.
The trading price of our common stock has been and may continue to be subject to fluctuations. Our stock price may fluctuate in response to a number of events and factors. Events and factors that could cause fluctuations in our stock price may include, among other things:
| • | actual or anticipated variations in quarterly and annual operating results; |
| • | changes in financial estimates by us or changes in financial estimates or recommendations by any securities analysts who might cover our stock; |
| • | conditions or trends in our industry or regulatory changes; |
| • | conditions, trends or changes in the securities marketplace, including trading volumes; |
| • | adverse changes in economic conditions; |
| • | changes in the market valuations of other companies operating in our industry; |
| • | technological innovations by us or our competitors; |
| • | announcements by us or our competitors of significant acquisitions, strategic partnerships, significant contracts or divestitures; |
| • | announcements of investigations, regulatory scrutiny of our operations or lawsuits filed against us; |
| • | changes in general conditions in the United States and global economy, including those resulting from war, incidents of terrorism or responses to such events; |
| • | loss of one or more significant customers, including Sprint Nextel; |
| • | sales of large blocks of our common stock; |
| • | changes in accounting principles; |
| • | additions or departures of key personnel; and |
| • | sales of our common stock, including sales of our common stock by our directors, executive officers or affiliates. |
Quadrangle Capital Partners LLP and certain of its affiliates, collectively “Quadrangle,” continue to have significant influence over our business and could delay, deter or prevent a change of control, change in management or business combination that may not be beneficial to our stockholders and as a result, may depress the market price of our stock.
As of December 31, 2009, Quadrangle beneficially owned 11,306,102 shares of our common stock, or 27.3% of our outstanding common stock. In addition, three of the eight directors that serve on our board of directors are representatives or designees of Quadrangle. By virtue of such stock ownership and representation on the board of directors, including a representative of Quadrangle having been appointed as Chairman of the Board of Directors in December 2009, Quadrangle continues to have a significant influence over day-to-day corporate and management policies and all matters submitted to our stockholders, including the election of the directors, and to exercise significant control over our business, policies and affairs. Quadrangle’s interests as a stockholder may not always coincide with the interests of other stockholders. Additionally, such concentration of voting power could have the effect of delaying, deterring or preventing a change of control, change in management or business combination that might otherwise be beneficial to our stockholders and as a result, may depress the market price of our stock.
Our stock price may decline due to the large number of shares eligible for future sale.
Sales of substantial amounts of our common stock, or the possibility of such sales, may adversely affect the market price of our common stock. These sales may also make it more difficult for us to raise capital through the issuance of equity securities at a time and at a price we deem appropriate.
We have granted the Quadrangle Entities the right to require us to register their shares of our common stock, representing approximately 11.3 million shares of our common stock. Accordingly, the number of shares subject to registration rights is substantial and the sale of these shares and any other shares with tag-along registration rights may have a negative impact on the market price for our common stock.
34
Table of Contents
Provisions in our charter documents and the General Corporation Law of Delaware could discourage potential acquisition proposals, could delay, deter or prevent a change in control and could limit the price certain investors might be willing to pay for our common stock.
Certain provisions of the General Corporation Law of Delaware, the state in which we are organized, and our certificate of incorporation and by-laws may inhibit a change of control not approved by our board of directors or changes in the composition of our board of directors, which could result in the entrenchment of current management. These provisions include:
| • | advance notice requirements for stockholder proposals and director nominations; |
| • | limitations on the ability of stockholders to amend, alter or repeal our by-laws; |
| • | limitations on the removal of directors; |
| • | the inability of the stockholders to act by written consent; and |
| • | the authority of the board of directors to issue, without stockholder approval, preferred stock with such terms as the board of directors may determine and additional shares of our common stock. |
| Item 1B. | Unresolved Staff Comments. |
Not applicable.
| Item 2. | Properties. |
We are headquartered in Waynesboro, Virginia and own offices and facilities in a number of locations within our operating markets. We believe that our current facilities are adequate to meet our needs in our existing markets for the foreseeable future. The table below provides the location, description and approximate square footage of our material owned properties.
| Location |
Property Description |
Approximate Square Footage | ||
| Harrisonburg, VA |
CLEC POP | 2,500 | ||
| Waynesboro, VA |
Retail Store | 4,000 | ||
| Richmond, VA |
Wireless Switch Building | 4,608 | ||
| Norfolk, VA |
Wireless Switch Building | 4,970 | ||
| Troutville, VA |
Wireline Switch and Video Headend Building | 11,400 | ||
| Clifton Forge, VA |
Wireline Switch Building | 12,000 | ||
| Covington, VA |
Wireline Service Center | 13,000 | ||
| Waynesboro, VA |
Wireless Switch Building | 15,000 | ||
| Clifton Forge, VA(1) |
Call Center Building (leased to third party) | 15,620 | ||
| Waynesboro, VA |
Wireline Service Center | 20,000 | ||
| Daleville, VA |
Regional Operations Center | 21,000 | ||
| Covington, VA |
Wireline Switch Building | 30,000 | ||
| Waynesboro, VA |
Corporate Headquarters | 30,000 | ||
| Waynesboro, VA |
Wireline Switch Building | 33,920 | ||
| Waynesboro, VA |
Customer Care Building | 31,000 | ||
| Waynesboro, VA |
Corporate Support Building | 51,000 | ||
| Daleville, VA |
Wireline Service Center | 9,400 |
| (1) | We lease the Clifton Forge building to TransCore, LP. The lease is from April 1, 2006 through March 31, 2011. |
We also lease the following material properties:
| • | Our Charleston, West Virginia regional operations center (wireless and wireline switching) under an Office Lease Agreement with Option to Purchase by and between Eagan Management Company and CFW Communications Company d/b/a NTELOS Inc., dated December 11, 1998. On November 1, 2006, we executed a sublease agreement with GAI Consultants Inc. for approximately 8,000 square feet of this space; and |
35
Table of Contents
| • | Our Daleville, Virginia customer care facility under a Lease Agreement by and between The Layman Family LLC and R&B Communications, Inc., dated May 1, 2000, and First Amendment to Lease Agreement, dated May 30, 2003. |
| Item 3. | Legal Proceedings. |
We are involved in routine litigation in the ordinary course of our business. We do not believe that any pending or threatened litigation of which we are aware will have a material adverse effect on our financial condition, results of operations or cash flows.
| Item 4. | Submission of Matters to a Vote of Security Holders. |
No matter was submitted to a vote of security holders during the fourth quarter of 2009.
| Item 5. | Market for Registrant’s Common Equity, Related Stockholder Matters and Issuer Purchases of Equity Securities. |
Market Information
Our common stock is traded on the NASDAQ Global Market under the symbol “NTLS.” On February 22, 2010, the last reported sale price for our common stock was $16.94 per share.
The following tables set forth the high and low prices per share of our common stock and the cash dividends declared per common share for the four quarters in each of 2008 and 2009, which correspond to our quarterly fiscal periods for financial reporting purposes:
| 2008 | |||||||||
| Stock Price per Share | Cash Dividends Declared per Common Share | ||||||||
| High | Low | ||||||||
| First Quarter |
$ | 30.36 | $ | 18.47 | $ | 0.21 | |||
| Second Quarter |
$ | 29.53 | $ | 23.30 | $ | 0.21 | |||
| Third Quarter |
$ | 32.10 | $ | 22.94 | $ | 0.21 | |||
| Fourth Quarter |
$ | 27.95 | $ | 18.07 | $ | 0.26 | |||
| 2009 | |||||||||
| Stock Price per Share | Cash Dividends Declared per Common Share | ||||||||
| High | Low | ||||||||
| First Quarter |
$ | 24.80 | $ | 16.04 | $ | 0.26 | |||
| Second Quarter |
$ | 20.50 | $ | 13.90 | $ | 0.26 | |||
| Third Quarter |
$ | 19.00 | $ | 13.66 | $ | 0.26 | |||
| Fourth Quarter |
$ | 18.16 | $ | 14.10 | $ | 0.28 | |||
36
Table of Contents
Stock Performance Graph
The following indexed line graph indicates our total return to stockholders from our initial public offering on February 8, 2006 to December 31, 2009, as compared to the total return for the Nasdaq Composite Index and the Nasdaq Telecommunications Index for the same period. The calculations in the graph assume that $100 was invested on February 8, 2006 in our Common Stock and each index and also assume dividend reinvestment.
Cumulative Total Shareholder Return
NTELOS, NASDAQ Stock Market
and Nasdaq Telecommunications Index
(02/8/06 - 12/31/09)
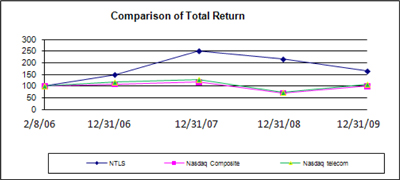
| February 8, 2006 |
December 31, 2006 |
December 31, 2007 |
December 31, 2008 |
December 31, 2009 | |||||||||||
| NTELOS Holdings Corp. |
$ | 100 | $ | 149 | $ | 250 | $ | 215 | $ | 164 | |||||
| NASDAQ Composite Index |
$ | 100 | $ | 107 | $ | 117 | $ | 70 | $ | 100 | |||||
| NASDAQ Telecommunications Index |
$ | 100 | $ | 116 | $ | 127 | $ | 72 | $ | 107 | |||||
Holders
There were approximately 10,500 holders of our common stock on February 18, 2010.
Dividends/Dividend Policy
We intend to continue to pay regular quarterly dividends on our common stock. On February 25, 2010, we declared a dividend to be paid on April 12, 2010 to common stock shareholders of record on March 12, 2010 at a rate of $0.28 per share. Any decision to declare future dividends will be made at the discretion of the board of directors and will depend on, among other things, our results of operations, cash requirements, investment opportunities, financial condition, contractual restrictions and other factors that the board of directors may deem relevant. We are a holding company that does not operate any business of our own. As a result, we are dependent on cash dividends and distributions and other transfers from our subsidiaries to make dividend payments or to make other distributions to our stockholders, including by means of a stock repurchase. Amounts that can be made available to us to pay cash dividends or repurchase stock are restricted by the NTELOS Inc. Credit Agreement.
Purchases of Equity Securities by the Issuer and Affiliated Purchasers
On August 24, 2009, the Company’s board of directors authorized management to repurchase up to $40 million of the Company’s common stock.
37
Table of Contents
The following table provides information with respect to purchases by the Company of shares of its common stock during the fourth quarter of 2009:
| Period |
Total Number of Shares Purchased |
Average Price Paid per Share |
Total Number of Shares Purchased as Part of Publicly Announced Plan |
Approximate Dollar Value of Shares that May Yet Be Purchased Under the Plan | ||||||
| October 1, 2009 – October 31, 2009 |
— | $ | — | — | $ | 38,144,986 | ||||
| November 1, 2009 – November 30, 2009 |
736,275 | $ | 15.89 | 736,275 | $ | 26,420,189 | ||||
| December 1, 2009 – December 31, 2009 |
191,852 | $ | 17.41 | 191,852 | $ | 23,073,534 | ||||
| Total |
928,127 | $ | 16.21 | 928,127 | $ | 23,073,534 | ||||
38
Table of Contents
| Item 6. | Selected Financial Data |
SELECTED HISTORICAL FINANCIAL INFORMATION
| NTELOS Holdings Corp. | NTELOS Inc. January 1, 2005 through May 1, 2005 |
|||||||||||||||||||||||
| (In thousands, except per share amounts) |
Year Ended December 31, 2009 |
Year Ended December 31, 2008 |
Year Ended December 31, 2007 |
Year Ended December 31, 2006 |
January 14, 2005 (inception) through December 31, 2005(1) |
|||||||||||||||||||
| Consolidated Statements of Operations Data |
||||||||||||||||||||||||
| Operating Revenues |
$ | 549,700 | $ | 535,906 | $ | 500,394 | $ | 440,076 | $ | 265,859 | $ | 126,360 | ||||||||||||
| Operating Expenses |
||||||||||||||||||||||||
| Cost of sales and services(2) (exclusive of items shown separately below) |
176,707 | 172,615 | 161,344 | 146,429 | 85,403 | 40,470 | ||||||||||||||||||
| Customer operations(2) |
117,916 | 111,115 | 108,848 | 99,998 | 63,330 | 29,270 | ||||||||||||||||||
| Corporate operations(2) |
32,929 | 32,692 | 32,090 | 34,398 | 22,434 | 8,259 | ||||||||||||||||||
| Depreciation and amortization |
91,657 | 102,940 | 97,061 | 84,921 | 59,103 | 23,799 | ||||||||||||||||||
| Gain on sale of assets |
— | — | — | — | — | (8,742 | ) | |||||||||||||||||
| Accretion of asset retirement obligations |
773 | 989 | 818 | 816 | 489 | 252 | ||||||||||||||||||
| Capital and operational restructuring charges |
— | — | — | — | 183 | 15,403 | ||||||||||||||||||
| Termination of advisory agreements(3) |
— | — | — | 12,941 | — | — | ||||||||||||||||||
| 419,982 | 420,351 | 400,161 | 379,503 | 230,942 | 108,711 | |||||||||||||||||||
| Operating Income |
129,718 | 115,555 | 100,233 | 60,573 | 34,917 | 17,649 | ||||||||||||||||||
| Other Income (Expenses) |
||||||||||||||||||||||||
| Equity share of net loss from NTELOS Inc. |
— | — | — | — | (1,213 | ) | — | |||||||||||||||||
| Interest expense |
(29,570 | ) | (32,417 | ) | (43,021 | ) | (59,850 | ) | (34,338 | ) | (10,839 | ) | ||||||||||||
| Gain (loss) on interest rate swap |
2,100 | (9,531 | ) | (3,527 | ) | (246 | ) | 4,780 | (660 | ) | ||||||||||||||
| Gain on sale of investment |
— | — | — | 1,723 | — | — | ||||||||||||||||||
| Other (expense) income |
(864 | ) | 1,498 | 3,146 | 2,833 | 1,595 | 270 | |||||||||||||||||
| (28,334 | ) | (40,450 | ) | (43,402 | ) | (55,540 | ) | (29,176 | ) | (11,229 | ) | |||||||||||||
| 101,384 | 75,105 | 56,831 | 5,033 | 5,741 | 6,420 | |||||||||||||||||||
| Income Tax Expense |
37,209 | 30,228 | 24,411 | 12,190 | 4,591 | 8,150 | ||||||||||||||||||
| Net Income (Loss) |
64,175 | 44,877 | 32,420 | (7,157 | ) | 1,150 | (1,730 | ) | ||||||||||||||||
| Net (Income) Loss Attributable to Noncontrolling Interests |
(890 | ) | (48 | ) | 33 | (28 | ) | (52 | ) | 13 | ||||||||||||||
| Net Income (Loss) Attributable to NTELOS Holdings Corp. |
63,285 | 44,829 | 32,453 | (7,185 | ) | 1,098 | (1,717 | ) | ||||||||||||||||
| Dividend Distribution Preference on Class B Shares |
— | — | — | (30,000 | ) | — | — | |||||||||||||||||
| Income (Loss) Applicable to Common Shares |
$ | 63,285 | $ | 44,829 | $ | 32,453 | $ | (37,185 | ) | $ | 1,098 | $ | (1,717 | ) | ||||||||||
| Basic and Diluted Earnings (Loss) per Common Share Attributable to NTELOS Holdings Corp. Stockholders: |
||||||||||||||||||||||||
| Income (Loss) per Share – Basic(4) |
$ | 1.50 | $ | 1.07 | $ | 0.78 | $ | (0.95 | ) | $ | 0.05 | N/M | ||||||||||||
| Income (Loss) per Share – Diluted(4) |
$ | 1.50 | $ | 1.06 | $ | 0.77 | $ | (0.95 | ) | $ | 0.05 | N/M | ||||||||||||
| Cash Dividends Declared per Share – Common Stock(4) |
$ | 1.06 | $ | 0.89 | $ | 0.51 | $ | — | N/M | N/M | ||||||||||||||
39
Table of Contents
| (In thousands) |
As of December 31, 2009 |
As of December 31, 2008 |
As of December 31, 2007 |
As of December 31, 2006 |
As of December 31, 2005 | ||||||||||
| Balance Sheet Data: |
|||||||||||||||
| Cash and cash equivalents |
$ | 51,097 | $ | 65,692 | $ | 53,467 | $ | 44,180 | $ | 28,134 | |||||
| Property and equipment, net |
500,975 | 446,473 | 402,904 | 376,772 | 360,142 | ||||||||||
| Total assets |
980,546 | 944,301 | 918,488 | 900,847 | 895,843 | ||||||||||
| Total debt |
628,908 | 607,912 | 614,206 | 626,523 | 759,384 | ||||||||||
| Stockholders’ equity attributable to NTELOS Holdings Corp. |
$ | 176,510 | $ | 164,643 | $ | 171,340 | $ | 151,765 | $ | 1,098 | |||||
| (1) | We acquired 24.9% of the NTELOS Inc. common stock and stock warrants on February 24, 2005. We completed our acquisition of all of NTELOS Inc.’s remaining common stock, warrants and vested options by means of a cash merger on May 2, 2005. We had no operating activities prior to the merger date. From February 24, 2005 through May 1, 2005, we accounted for our investment in NTELOS Inc. under the equity method, resulting in a $1.2 million equity share of net loss from NTELOS Inc. in our consolidated statement of operations for 2005. |
| (2) | We record equity-based compensation expense related to our share-based awards and the Company’s 2009 401(k) matching contributions. The following table shows the allocation of equity-based compensation expense to cost of sales and services, customer operations and corporate operations for the years ended December 31, 2009, 2008, 2007, 2006 and for the period January 14, 2005 (inception) through December 31, 2005. |
| (In thousands) |
Year Ended December 31, 2009 |
Year Ended December 31, 2008 |
Year Ended December 31, 2007 |
Year Ended December 31, 2006 |
January 14, 2005 (inception) through December 31, 2005 | ||||||||||
| Cost of sales and services |
$ | 455 | $ | 277 | $ | 403 | $ | 1,087 | $ | 305 | |||||
| Customer operations |
714 | 458 | 603 | 1,448 | 389 | ||||||||||
| Corporate operations |
2,287 | 1,994 | 3,322 | 10,702 | 3,036 | ||||||||||
| Equity-based compensation expense |
$ | 3,456 | $ | 2,729 | $ | 4,328 | $ | 13,237 | $ | 3,730 | |||||
| (3) | In May 2005, we (through NTELOS Inc.) entered into advisory agreements with CVC Management LLC and Quadrangle Advisors LLC (the “Advisors”) whereby the Advisors agreed to provide advisory and other services to us for a period of ten years for a combined annual advisory fee of $2.0 million payable quarterly at the beginning of each quarter. On February 13, 2006, concurrent with our IPO, we terminated these agreements, paying a $12.9 million termination fee on that date. |
| (4) | Periods designated as “N/M” indicate that the measure is not meaningful, as the capital structure under the predecessor company is not comparable to our current capital structure. |
40
Table of Contents
| Item 7. | Management’s Discussion and Analysis of Financial Condition and Results of Operations. |
You should read the following discussion of our financial condition in conjunction with our consolidated financial statements and the related notes included herein (Item 8). This discussion contains forward looking statements that involve risks and uncertainties. For additional information regarding some of these risks and uncertainties that affect our business and the industry in which we operate, please see “Risk Factors” and “Forward-Looking Statements” elsewhere in this report.
Overview
We are a leading provider of wireless and wireline communications services to consumers and businesses primarily in Virginia and West Virginia. Our primary services are wireless digital personal communications services (“PCS”), local and long distance telephone services, high capacity transport, data services for Internet access and wide area networking and IPTV-based video services.
Our wireless operations are composed of an NTELOS-branded retail business, including the FRAWG brand in certain markets, and a wholesale business which primarily relates to an exclusive contract with Sprint. We believe our regional focus and contiguous service area provide us with a differentiated competitive position relative to our primary wireless competitors, most of whom are national providers. Our wireless revenues accounted for approximately 77%, 77% and 75% of our total revenues in each of the years ended December 31, 2009, 2008 and 2007, respectively. As of December 31, 2009, our wireless retail business had approximately 438,500 NTELOS retail subscribers, representing a 7.9% penetration of our total covered population. In 2008, we commenced an upgrade of our wireless network to Evolution Data Optimized Revision A (“EV-DO”). As of December 31, 2009, 1,065 (or 85.4%) of our total cell sites have been upgraded to EV-DO, and this has completed the number of sites planned for EV-DO upgrade at this point.
We amended our agreement with Sprint Spectrum L.P. during 2007 to act as their exclusive wholesale provider of network services through July 31, 2015. Under this arrangement, which we refer to as the Strategic Network Alliance, we are the exclusive PCS service provider in our western Virginia and West Virginia service area for all Sprint CDMA wireless customers. For the years ended December 31, 2009, 2008 and 2007, we realized wireless wholesale revenues of $118.3 million, $107.2 million and $96.0 million, respectively. Of this total for the years ended December 31, 2009, 2008 and 2007, $112.8 million, $103.6 million and $94.8 million, respectively, related to the Strategic Network Alliance. Following a contractual travel data rate reset on July 1, 2009, our monthly calculated revenue from Sprint Nextel was below the $9.0 million minimum and thus we billed and recognized revenue at the $9.0 million minimum stipulated in the contract. Revenue from this contract is projected to remain at that level throughout 2010.
Our wireline operations include the rural local exchange carrier (“RLEC”) segment and the Competitive Wireline segment. Our wireline operating income margins were 34.2%, 33.3% and 31.5% for the years ended December 31, 2009, 2008 and 2007, respectively.
Founded in 1897, our wireline incumbent local exchange carrier business is conducted through two subsidiaries that qualify as RLECs under the Telecommunications Act. These two RLECs provide wireline communications services to residential and business customers in the western Virginia cities of Waynesboro and Covington, and portions of Alleghany, Augusta and Botetourt counties. As of December 31, 2009, we operated approximately 38,200 RLEC telephone access lines.
Our wireline business is supported by an extensive 4,700 route-mile fiber optic network. We utilize the network to backhaul communications traffic for retail services and to serve as a carriers’ carrier network, providing transport services to third parties for long distance, internet, wireless and private network services. Our fiber optic network is connected to and marketed with adjacent fiber optic networks in the mid-Atlantic region. On December 31, 2009, we closed on an agreement to purchase certain fiber optic and network assets and related transport and data service contracts from Allegheny Energy, Inc. The purchase included approximately 2,200 route-miles of fiber located primarily in central and western Pennsylvania and West Virginia, with portions also in Maryland, Kentucky and Ohio. The purchase price for the transaction assets was approximately $27 million. Also in 2009, we purchased an Indefeasible Right of Use (IRU) for $4.5 million and we completed a fiber swap agreement, which together allowed us to expand our broadband and high-capacity business communications services to Culpeper, Madison and Warrenton, Virginia, adding approximately 200 fiber route-miles to our network.
We leverage our wireline network infrastructure to offer competitive voice and data communication services in Virginia and West Virginia outside our RLEC coverage area through our Competitive Wireline segment. Within our
41
Table of Contents
Competitive Wireline segment, we market and sell local and long distance, voice and data services almost exclusively to business customers through our competitive local exchange carrier (“CLEC”) and Internet Service Provider (“ISP”) operation. As of December 31, 2009, we served customers with approximately 49,700 CLEC access line connections. We also offer broadband services in over 98% of our RLEC service area and as of December 31, 2009, we operated approximately 23,500 broadband access connections in our markets, representing an increase of 4.3% over the connections on December 31, 2008. Commencing in late 2007, we have been introducing NTELOS video in selected neighborhoods within our two RLEC service areas and in two CLEC neighborhoods. The product offers video entertainment services and provides an alternative to cable and satellite TV. It is delivered via fiber-to-the-home (“FTTH”) which allows us to deliver integrated video, local and long distance telephone services, plus broadband Internet access at speeds currently up to 20 megabits per second. At December 31, 2009, we had approximately 2,000 video customers and passed approximately 9,000 homes with fiber. Revenues and operating expenses from the broadband and video products are included in the Competitive Wireline segment.
Many of the market risk factors which affected our results of operations in 2008 affected our results of operations in 2009. Additionally, the impact of overall unfavorable economic conditions and increased competition that we began to experience in the fourth quarter of 2008 and which we experienced throughout 2009 is expected to continue into 2010. The magnitude of the impact from the economy and competition may be greater than we anticipate. If it is, the indefinite-lived asset recoverability testing required as of October 1, 2010 (or earlier testing performed if such an impairment indicator arises) could trigger a revaluation which could result in impairment charges.
In wireless, we made significant network improvements, including our upgrade to EV-DO, network expansion and cell site additions. Additionally, we continued to improve our handset offerings and refined plans and features to improve the customer experience. However, the current economic climate and increased competition contributed to slower than anticipated year over year wireless net subscriber growth (less than 1%) as a result of an increase in customer churn in the second half of 2008 and in 2009. These higher churn levels resulted in net subscriber losses in the second and third quarters of 2009 and almost completely offset gross subscriber additions in the fourth quarter of 2009, resulting in a net subscriber gain of approximately 200 in the fourth quarter of 2009. Elevated churn levels are expected to continue into 2010 although the Company will try to mitigate this by investing in further customer retention programs. We also continue to face risks to our competitive “value” position in the postpay market, including through the introduction in January 2010 of reduced price nationwide unlimited voice plans by competitors such as AT&T, Verizon and US Cellular. We expect postpay competition to continue to be intense as the market gets closer to saturation and carriers focus on taking market share from competitors. We expect competition with prepaid products to intensify as more competitors have targeted this segment as a means to sustain growth and increase market share. Competition in the wireless prepay market changed dramatically in 2009. Whereas our prepay competitive position was largely uncontested prior to last year, during 2009 a number of large wireless competitors, including Boost, TracFone, Straight Talk, Virgin Mobile, T-Mobile and Page Plus, entered the prepaid market. Many of these competitors have access to big box retailers and convenience stores that are unavailable to us. Pricing competition in the prepaid market also intensified during the fourth quarter of 2009, with the introduction of a number of prepaid unlimited nationwide plans for less than $50 per month. To remain competitive with our prepaid product offerings, we launched the FRAWG Unlimited Wireless brand in the Richmond and Hampton Roads, Virginia markets late in the second quarter of 2009. FRAWG provides value-seeking customers prepay wireless plan options without a contract, credit check or activation fee. While plans feature competitive price points, our acquisition costs are substantially lower with reduced handset subsidy and selling costs.
Average monthly revenues per handset/unit in service (“ARPU”) from voice are expected to continue to decline due to competitive pressures and economic conditions. However, we anticipate data ARPU will continue to grow and offset a substantial portion of the decline in voice ARPU. Our wireless network upgrade to EV-DO has helped increase retail data ARPU by $1.80 for the year ended December 31, 2009 over the year ended December 31, 2008. Higher handset subsidy costs as compared to 2008 have been experienced in 2009 and are expected to continue into 2010 due to actual and expected higher mix of smart phones associated with the projected growth in data ARPU. During 2009 smart phone and data card sales represented 28.5% of postpay sales, up from 16.0% in 2008. Data ARPU and data revenue are expected to continue to grow in 2010 due to the continued increase in penetration and usage escalating from our EV-DO deployment; however, this upgrade has resulted in a significant increase in network expenses and data cost of sales, both of which are captured in cost of sales and services. Capital expenditures associated with the EV-DO upgrade decreased in 2009 from 2008 as a large portion of that upgrade was completed in 2008 and the remainder of the planned network upgrade was completed in 2009.
42
Table of Contents
During 2009, we expanded our network footprint by launching our wireless service in additional new markets, including expansion to provide “in-town” coverage in markets which we had previously only provided coverage along key highway routes. Additionally, we have continued to expand and enhance our network coverage and capacity in many of our primary markets, allowing us to offer our customers an improved service area. We have incurred significant initial costs associated with these expansion and improvement activities and we plan to continue to enhance our network as necessary to continue to provide a high quality network experience and minimize in-market roaming costs. We believe that the investments that we have made and continue to make will provide future benefits by enabling us to continue to add new subscribers, retain existing subscribers and generate additional revenues. During 2010, we plan to expand into one additional new local market and plan to increase and improve our points of distribution in our existing markets. As described above, although our net subscriber growth has slowed significantly and was negative in the second and third quarters of 2009, subscribers increased on an annual basis. Also, as our business continues to mature, we expect to increase our cash flows from operations net of capital expenditures.
In the RLEC segment, we experienced access line losses in 2009 and these losses are expected to continue in 2010, impacted by continued cable competition, wireless substitution and the economic climate. These line losses, coupled with mid-year 2009 rate reductions as a result of our biennial tariff filing with the FCC for NTELOS Telephone, contributed to a 3.7% decline in RLEC revenues from 2008. Our primary strategy to respond to this trend is to leverage our strong incumbent market position to increase our revenue by cross-selling additional services to our customer base, and to promote our Competitive Wireline segment strategic products (local services, IPTV-based video services, broadband voice and data services, and high-capacity network access and transport services) and extend our Competitive Wireline segment network to increase the addressable market area. Toward this pursuit, we added more than 25 new potential markets by adding approximately 2,500 fiber route-miles to our network, mostly in the fourth quarter of 2009.
43
Table of Contents
Other Overview Discussion
To supplement our financial statements presented under generally accepted accounting principles (“GAAP”) throughout this document we reference non-GAAP measures, such as ARPU to measure operating performance for which our operating managers are responsible and upon which we evaluate their performance.
ARPU is a telecommunications industry metric that measures service revenues per period divided by the weighted average number of handsets in service during that period. ARPU as defined below may not be similar to ARPU measures of other companies, is not a measurement under GAAP and should be considered in addition to, but not as a substitute for, the information contained in our consolidated statements of operations. We closely monitor the effects of new rate plans and service offerings on ARPU in order to determine their effectiveness. We believe ARPU provides management useful information concerning the appeal of our rate plans and service offerings and our performance in attracting and retaining high-value customers. The table below provides a reconciliation of operating revenue from our wireless segment (Note 4 in our Notes to consolidated financial statements) to subscriber revenues used to calculate average monthly ARPU for the years ended December 31, 2009, 2008 and 2007.
| (dollars in thousands, other than average monthly ARPU data) |
2009 | 2008 | 2007 | |||||||||
| Wireless communications revenues |
$ | 424,678 | $ | 411,951 | $ | 377,761 | ||||||
| Less: equipment revenues from sales to new customers |
(6,379 | ) | (10,698 | ) | (13,797 | ) | ||||||
| Less: equipment revenues from sales to existing customers |
(18,453 | ) | (13,053 | ) | (7,524 | ) | ||||||
| Less: wholesale revenues |
(118,266 | ) | (107,185 | ) | (95,976 | ) | ||||||
| (Less) Plus: other revenues and adjustments |
(574 | ) | (348 | ) | 687 | |||||||
| Wireless gross subscriber revenues |
$ | 281,006 | $ | 280,667 | $ | 261,151 | ||||||
| Average number of subscribers |
440,207 | 423,516 | 388,778 | |||||||||
| Total average monthly ARPU |
$ | 53.20 | $ | 55.23 | $ | 55.98 | ||||||
| Proforma total average monthly ARPU(1) |
$ | 53.20 | $ | 54.67 | $ | 53.66 | ||||||
| Wireless gross subscriber revenues |
$ | 281,006 | $ | 280,667 | $ | 261,151 | ||||||
| Less: wireless voice and other features revenues(2) |
(232,271 | ) | (242,924 | ) | (239,385 | ) | ||||||
| Wireless data revenues(2) |
$ | 48,735 | $ | 37,743 | $ | 21,766 | ||||||
| Average number of subscribers |
440,207 | 423,516 | 388,778 | |||||||||
| Total data average monthly ARPU(2) |
$ | 9.23 | $ | 7.43 | $ | 4.67 | ||||||
| (1) | We entered into a new agreement with more favorable terms to provide handset insurance to wireless subscribers, effective April 1, 2008. Due to the differences in the terms of this new arrangement, revenues for handset insurance are no longer reported on a gross basis, but on a net basis instead. This has led to a reduction in total ARPU from the comparative twelve-month periods in 2008 and 2007. Historical periods will not be restated. The proforma amounts indicated above are calculated on a net basis effective January 1, 2007. |
| (2) | In September of 2007, we launched a new prepay billing platform which enhanced product offerings to customers and allowed us to separately identify certain data revenues previously bundled into blended ARPU, and certain of the underlying plans were modified to offer data services. Accordingly, beginning in the fourth quarter of 2007, this revenue is included in data revenue. Additionally, beginning in the first quarter of 2008, an allocation of certain postpay bundled package revenues representing the portion relating to data was reclassified into data revenue. These items contributed to accelerate 2008 growth in data ARPU over 2007. |
44
Table of Contents
Operating Revenues
Our revenues are generated from the following categories:
| • | wireless PCS, consisting of retail revenues from network access, data services, equipment revenues and feature services; and wholesale revenues from the Strategic Network Alliance and roaming from other carriers; |
| • | RLEC segment revenues, including local service, network access, toll and directory advertising; |
| • | Competitive Wireline segment revenues, including revenues from our key strategic products (local services, broadband voice and data services, high-capacity network access and transport services and IPTV-based video services) and from other Competitive revenues (long distance, dial-up Internet services, switched access and reciprocal compensation); and |
| • | other communications services revenues, including primarily revenues from paging and revenue from leasing excess building space. |
Operating Expenses
Our operating expenses are incurred from the following categories:
| • | cost of sales and services, including digital PCS handset equipment costs which, in keeping with industry practice, particularly with handsets sold with service contracts, we sell to our customers at a price below our cost, and usage-based access charges, including long distance, roaming charges, and other direct costs incurred in accessing other telecommunications providers’ networks in order to provide telecommunication services to our end-user customers, leased facility expenses for connection to other carriers, cell sites and switch locations and engineering and repairs and maintenance expenses related to property, plant and equipment; |
| • | customer operations expenses, including marketing, product management, product advertising, selling, billing, publication of regional telephone directories, customer care, directory services, customer retention and bad debt expenses; |
| • | corporate operations expenses, including taxes other than income, executive, accounting, legal, purchasing, information technology, human resources and other general and administrative expenses, including earned bonuses and equity-based compensation expense related to stock and option instruments held by certain members of corporate management, and charges related to the 2009 and 2008 voluntary early retirement plan (“VERP”), 2009 severance charges related to a workforce reduction and the 2007 secondary offering costs; |
| • | depreciation and amortization, including depreciable long-lived property, plant and equipment, amortization of intangible assets where applicable; and |
| • | accretion of asset retirement obligations (“ARO”). |
Other Income (Expenses)
Our other income (expenses) are generated (incurred) from interest expense on debt instruments, including changes in fair value of our interest rate swap instrument, which was terminated during the August 2009 refinancing, other income, which includes interest income, and gain on sale of investments.
Income Taxes
Our income tax expense and effective tax rate increases or decreases based upon changes in a number of factors, including our pre-tax income or loss, state minimum tax assessments, and non-deductible expenses.
Noncontrolling Interests in Losses (Earnings) of Subsidiaries
We have an RLEC segment partnership that owns certain signaling equipment and provides service to a number of small RLECs and to VeriSign that has a 46.3% noncontrolling interest. Also, our Virginia PCS Alliance, L.C., or the VA Alliance, that provides PCS services to a 2.0 million populated area in central and western Virginia, has a 3% noncontrolling interest.
The VA Alliance has incurred cumulative operating losses since it initiated PCS services in 1997. Prior to the application of the provisions on attributing net income and comprehensive income to the parent and the
45
Table of Contents
noncontrolling interest described in Financial Accounting Standards Board (“FASB”) Accounting Standards Codification (“ASC”) 810-10-45-21, we attributed net income or losses to the noncontrolling interests in the VA Alliance only to the extent of capital contributions from the 3% minority owners as this entity had net cumulative losses in excess of their cumulative capital contributions through December 31, 2009. No capital contributions from the 3% minority owners were made during the years ended December 31, 2009, 2008 or 2007. In accordance with FASB ASC 810-10-45-21 which we adopted on January 1, 2009, we are attributing net income or losses to the noncontrolling interests in the VA Alliance on a prospective basis.
Results of Operations
Year ended December 31, 2009 compared to year ended December 31, 2008
Operating revenues increased $13.8 million, or 2.6%, from 2008 to 2009. Wireless PCS accounted for approximately 92.3% the increase, with growth occurring primarily from wholesale revenues. Wireline contributed the remaining revenue increase primarily from growth in key strategic product revenues in the Competitive Wireline segment, partially offset by a decline in revenue from the RLEC segment.
Operating income increased $14.2 million over 2008. Operating margin increased from 21.6% for the year ended December 31, 2008 to 23.6% for the year ended December 31, 2009. The increase in operating income and the margin expansion for the year are attributable to the fact that operating expenses decreased 0.1% from the comparative year, primarily driven by a decrease in accelerated depreciation as discussed further below.
Net income attributable to NTELOS Holdings Corp. increased $18.5 million, or 41.2%, over 2008. In addition to the $14.2 million increase in operating income, other expenses (net of other income), decreased by $12.1 million primarily relating to the change in interest rate swap which was favorable by $11.6 million, from a loss of $9.5 million in the year ended December 31, 2008 to a gain of $2.1 million in the year ended December 31, 2009. These increases to net income were primarily offset by a $7.0 million increase in income tax expense.
OPERATING REVENUES
The following table identifies our external operating revenues by business segment for the years ended December 31, 2009 and 2008:
| Year Ended December 31, |
|||||||||||||
| Operating Revenues |
2009 | 2008 | $ Variance | % Variance | |||||||||
| (dollars in thousands) | |||||||||||||
| Wireless PCS |
$ | 424,678 | $ | 411,951 | $ | 12,727 | 3.1 | % | |||||
| Wireline |
|||||||||||||
| RLEC |
57,304 | 59,518 | (2,214 | ) | (3.7 | )% | |||||||
| Competitive Wireline |
67,237 | 63,878 | 3,359 | 5.3 | % | ||||||||
| Total wireline |
124,541 | 123,396 | 1,145 | 0.9 | % | ||||||||
| Other |
481 | 559 | (78 | ) | (14.0 | )% | |||||||
| Total |
$ | 549,700 | $ | 535,906 | $ | 13,794 | 2.6 | % | |||||
WIRELESS COMMUNICATIONS REVENUES—Wireless communications revenues increased $12.7 million from 2008 to 2009 due to an increase in our net retail subscriber revenue of $0.4 million, or 0.2%, a $1.1 million, or 4.6%, increase in equipment revenue and an $11.1 million, or 10.3%, increase in wholesale and roaming revenues.
Subscriber revenues reflected net subscriber growth of approximately 3,500 subscribers, or 0.8%, from approximately 435,000 subscribers as of December 31, 2008 to approximately 438,500 subscribers as of December 31, 2009. Churn with certain prepaid products and a shift to a higher content of prepaid as compared to postpay gross subscriber additions reduced subscriber revenue growth. Data revenue increased $10.9 million, but was mostly offset by a decline in voice revenues brought about by competitive pricing reductions and economic conditions which contributed to subscribers changing to or purchasing lower priced plans, the mix shift noted above and an increase in the number of prepay subscribers who suspend service for a period of time. Underlying the 43.7% growth in data revenue was the technology upgrade to EV-DO (deployed to 85.4% of our cell sites as of December 31, 2009), and an increased sales emphasis on smart phones and other data-centric handsets coupled with
46
Table of Contents
a broader array of data packages and increased sales of data cards. Total data ARPU for all prepay and postpay products was $9.23 for the year ended December 31, 2009 compared to $7.43 for the year ended December 31, 2008, an increase of 24.2%, reflecting the increased take-rate on data packages and increased usage rates.
Growth in data ARPU has partially offset declines in voice ARPU, leading to blended ARPU of $53.20 for 2009 as compared to $55.23 for 2008, a $2.03 decrease. Pro forma of the handset insurance reporting change (see footnote 1 to the ARPU reconciliation table above), blended ARPU decreased $1.47.
In response to competitive pressures, we launched the FRAWG Unlimited Wireless brand in the Richmond and Hampton Roads, Virginia markets late in the second quarter of 2009. FRAWG provides prepay wireless options at lower, competitive price points (along with reduced subsidy and sales costs to us). For the second half of 2009, the launch of FRAWG contributed to a higher mix of prepay sales at lower ARPU levels than the traditionally higher ARPU postpay rate plans, albeit at a lower net subsidy cost from the prepay sales. The launch of FRAWG, coupled with the current economic environment and competitive pricing, could result in further declines in voice related ARPU which we anticipate will be partially offset by growth in data ARPU.
The increase in wholesale and roaming revenue was driven by a $9.2 million, or 8.9% increase in revenue from the Strategic Network Alliance. Additionally, roaming revenues from other carriers grew $1.9 million over the comparative year. The revenue increase from the Strategic Network Alliance is reflective of the significant growth in data usage which was billable at substantially higher contractual preset rates in the prior year and up until the July 1, 2009 contractual travel data rate reset. Following the travel data rate reset, our monthly calculated revenue from Sprint Nextel was below the $9.0 million minimum and thus we billed and recognized revenue at the $9.0 million minimum stipulated in the contract. Revenue from this contract is projected to remain at that level throughout 2010. Accordingly, due to the first half of 2009 wholesale revenues being above the $9.0 million minimum per month, we would expect a decline of approximately $4.8 million in 2010 if wholesale revenue remains at the $9.0 million per month minimum as expected. Also, roaming revenues from other carriers may decline in 2010 as a result of industry consolidation of carriers with complementary networks or from other roaming arrangements which may not be favorable to us.
Our wholesale revenues derived from the Strategic Network Alliance are primarily from the voice usage by Sprint and Sprint affiliate customers who live in the Strategic Network Alliance service area (“home minutes of use”), those customers of Sprint who use our network for voice services while traveling through the Strategic Network Alliance service area (“travel minutes of use”) and data usage by Sprint customers who live in or travel through the Strategic Network Alliance service area. We added 41 cell sites within this wholesale service area from December 31, 2008 to December 31, 2009, improving existing service and extending this coverage area.
The Strategic Network Alliance extends through July 31, 2015 and is subject to automatic three-year extensions unless certain notice provisions are exercised. The agreement prohibits Sprint from directly or indirectly commencing construction of, contracting for or launching its own wireless communications network in the agreement territory until a maximum of 18 months prior to the end of the agreement. The agreement specifies a series of usage rates for various types of services. The voice rate pricing under the agreement was fixed through July 1, 2008, but provides for volume discounts based on Sprint’s voice revenue yield on that date and thereafter semi-annually to provide incentives for the migration of additional traffic onto the network. Data rates for Sprint in-market home subscribers are on a per subscriber basis. The data rate for Sprint customers that are traveling through the territory and use the network is on a per kilobyte basis. This rate is reset quarterly. The Strategic Network Alliance also permits our NTELOS-branded customers to access Sprint’s national wireless network at reciprocal rates as the Sprint travel rates.
WIRELINE COMMUNICATIONS REVENUES—Wireline communications revenues increased $1.1 million, or 0.9%, over the comparative year, with revenues from strategic products increasing $3.6 million, or 6.8%, primarily offset by a $2.2 million, or 3.7%, decrease in RLEC revenues.
| • | RLEC Revenues. RLEC revenues decreased $2.2 million from the prior year primarily due to decreased access and local service revenues as a result of a 7.0% decrease in access lines, partially offset by a 5.6% increase in carrier access minutes due primarily to growth in usage by wireless carriers. On July 1, 2009, our interstate access rates were subject to a biennial reset (reduction). This rate reset coupled with network grooming by our customers resulted in an annual reduction in revenue of approximately $2.4 million. |
Access lines totaled approximately 38,200 as of December 31, 2009 and 41,100 as of December 31, 2008. This access line loss is reflective of residential wireless substitution, the effect of current economic conditions on
47
Table of Contents
businesses, the introduction of competitive voice service offerings from Comcast, which commenced in May 2008 in one of our three RLEC markets, and the conversion of Centrex lines to PBX trunks. We expect that the competitive voice service competition will primarily be for residential customers. We expect to encounter additional voice competition in the first quarter of 2010 which could result in greater line losses than experienced in 2008 and 2009.
| • | Competitive Wireline Revenues. Competitive Wireline revenue for 2009 increased $3.4 million over 2008 due to growth in strategic products. Broadband voice and data services include broadband over fiber, dedicated Internet access, DSL, integrated access and Metro Ethernet. Revenues from these services increased $2.7 million, or 13.9%. Additionally, revenues from IPTV-based video services increased $0.7 million to $1.2 million driven by growth in customers. |
OPERATING EXPENSES
The following table identifies our operating expenses by business segment, consistent with the table presenting operating revenues above, for the years ended December 31, 2009 and 2008:
| Year Ended December 31, |
|||||||||||||
| Operating Expenses |
2009 | 2008 | $ Variance | % Variance | |||||||||
| (dollars in thousands) | |||||||||||||
| Wireless PCS |
$ | 262,886 | $ | 252,499 | $ | 10,387 | 4.1 | % | |||||
| Wireline |
|||||||||||||
| RLEC |
14,403 | 15,793 | (1,390 | ) | (8.8 | )% | |||||||
| Competitive Wireline |
38,545 | 38,567 | (22 | ) | (0.1 | )% | |||||||
| Total wireline |
52,948 | 54,360 | (1,412 | ) | (2.6 | )% | |||||||
| Other |
6,726 | 5,853 | 873 | 14.9 | % | ||||||||
| Operating expenses, before equity-based compensation charges, charges from voluntary early retirement and workforce reduction plans, depreciation and amortization and accretion of asset retirement obligations |
322,560 | 312,712 | 9,848 | 3.1 | % | ||||||||
| Equity-based compensation |
3,456 | 2,729 | 727 | 26.6 | % | ||||||||
| Voluntary early retirement and workforce reduction plans |
1,536 | 981 | 555 | 56.6 | % | ||||||||
| Depreciation and amortization |
91,657 | 102,940 | (11,283 | ) | (11.0 | )% | |||||||
| Accretion of asset retirement obligations |
773 | 989 | (216 | ) | (21.8 | )% | |||||||
| Total operating expenses |
$ | 419,982 | $ | 420,351 | $ | (369 | ) | (0.1 | )% | ||||
OPERATING EXPENSES—The following describes our operating expenses by segment and on a basis consistent with our financial statement presentation.
The discussion below relates to our operating expenses by segment before equity-based compensation charges, charges from our voluntary early retirement and workforce reduction plans, depreciation and amortization and accretion of asset retirement obligations:
| • | Wireless Communications – The operating expense increase in wireless communications over the comparative year was primarily due to increased costs of maintaining our network, combined with increases in selling and customer care expenses. Specifically, cell site and network access expenses increased $5.2 million related to additional access connectivity to support high-speed data over the EV-DO network, strong growth in data usage by subscribers and our increased subscriber base, and related to a 5.4% increase in the number of cell sites as of December 31, 2009 over December 31, 2008. Bad debt expense increased $5.1 million over the comparative year due to an increase in involuntary churn |
48
Table of Contents
| particularly with lower credit class customers and the impact of the economy and retention costs increased $1.4 million over the comparative year due to an increase in the volume and cost of handset swaps and upgrades driven from promotional pricing. Advertising expense increased $2.2 million related to heavier advertising in response to competitive pressure and to promote the FRAWG unlimited prepay offering launched in the second quarter of 2009. |
In addition to the above, compensation, benefits and employee sales commissions increased a total of $1.3 million over the comparative year primarily due to inflationary wage increases, an increase in pension expense (as a result of lower pension plan asset values as of December 31, 2008 due to a significant decline in 2008 of the fair value of plan assets) and an increase in the number of gross additions from the comparative year. Other notable increases were contracted services, bank charges and license fees and royalties, which collectively increased $1.0 million over prior year. Partially offsetting these increases were decreases in other general and administrative expenses of $1.6 million, with a decline in performance-based compensation partially offset by normal increases in other expenses. Agent sales commissions also decreased $2.0 million from the comparative year due to a decrease in sales generated from third-party agents and the lower selling costs related to the FRAWG product.
The increase in wireless communications operating expenses for 2009 is partially offset by a decrease in cost of sales (“COS”) of $2.4 million from 2008. This decrease in COS was primarily driven by a decrease in roaming costs of $3.4 million as a result of in-network roaming savings associated with continued cell site expansion and lower roaming rates from our roaming partners. Also, handset insurance COS decreased $3.0 million from prior year related to the April 1, 2008 reporting change discussed in the Other Overview Discussion section above. Partially offsetting these decreases was an increase in equipment COS of $2.3 million over the prior year due to an increase in subscriber additions and an increase in handset sales to our handset insurance provider. Revenue from handset sales to new and existing customers has risen in 2009 over 2008 due to the increase in selection of smart phones and other data-centric handsets coupled with more data product offerings and capabilities and attractive handset pricing intended to attract new customers and encourage existing customers to renew their contracts. This also led to a $2.0 million increase in data COS.
We expect COS expenses to grow in 2010 as our customer base grows, roaming volume from national and unlimited plans increases, sales of smart phones and data cards continue to represent a significantly higher percentage of total sales than in the prior year and usage of data features increases. This will be partially offset by a higher content of FRAWG product sales which generally carry lower equipment COS. With the significant increase in data volume we will see a decrease in data unit rates. We also anticipate to reduce networking costs in certain areas related to a capital investment that will result in network facility sharing related to EV-DO voice and data and thus allow us to eliminate duplicate facilities in certain areas.
| • | Wireline Communications – The decrease in wireline operating expenses noted in the table above is primarily attributable to decreases in general and administrative costs from lower performance-based compensation expenses. These decreases were partially offset by an increase in access expense, other compensation and benefits and repair and maintenance expenses. |
| • | Other – The increase in other operating expenses is primarily attributable to the recognition in the first quarter of 2009 of a $1.0 million signing bonus paid to our new President and Chief Operating Officer in consideration of compensation foregone by him by departing his previous employer before 2009 vesting dates. |
COST OF SALES AND SERVICES—Cost of sales and services increased $4.1 million, or 2.4%, from 2008 to 2009. Cell site and network access costs increased $4.8 million over 2008 primarily related to an increase in the number of cell sites over December 31, 2008 and additional access connectivity to support high-speed data over the EV-DO network, increased data usage and our increased subscriber base, as described above. Other notable increases were repairs and maintenance, materials and supplies, and other expenses incurred in the provisioning of service, which increased $3.3 million collectively. These increases were primarily offset by a $1.6 million decrease in performance-based compensation expense due to the Company not achieving the minimum financial targets to earn a bonus in 2009.
Also included in cost of sales and services are variable COS. As discussed above, wireless variable COS decreased $2.4 million from 2008.
49
Table of Contents
CUSTOMER OPERATIONS EXPENSES—Customer operations expenses increased $6.8 million, or 6.1%, from 2008 to 2009. Bad debt expense increased $5.2 million over 2008, reflecting a worsening of receivables aging and an increase in the amount of accounts written off. Advertising expenses increased $1.9 million over 2008 related to an increase in promotions to combat the increase in competitive pressures and to promote the recently launched FRAWG unlimited prepay offering. Also, as discussed in the wireless communications section above, retention costs increased $1.4 million over 2008. Partially offsetting these increases was a $1.4 million decrease in performance-based compensation expense due to the Company not achieving the minimum financial targets to earn a bonus under this plan in 2009. All other selling and marketing related expenses collectively decreased $0.4 million from 2008 primarily due to a decrease in third party agent commissions.
CORPORATE OPERATIONS EXPENSES—Corporate operations expense decreased $0.2 million, or 0.7%, from 2008 to 2009. This decrease includes a decrease of $1.0 million related to charges in 2008 for a voluntary early retirement offered to select employees in the wireline division. These charges primarily represent an enhanced pension benefit offered to the 22 employees who accepted the early retirement offer. Additionally, performance-based compensation expense decreased $2.8 million from 2008 due to the Company not achieving the minimum financial targets to earn a bonus under this plan in 2009. If the Company meets its performance-based compensation plan objectives in 2010, we would expect to pay incentive bonuses for fiscal year 2010, thus increasing the expense in 2010. Partially offsetting these decreases was a charge of $1.0 million in 2009 representing the signing bonus for our new President and Chief Operating Officer who was hired in March 2009 (discussed in Other above). Also included in the results for 2009 were charges of $1.5 million relating to a voluntary early retirement plan and severance related to a workforce reduction and charges of $0.5 million relating to a bonus for our President and Chief Operating Officer who was promoted to Chief Executive Officer and President in December 2009, and compensation related to a retirement agreement for our former Chief Executive Officer. The decrease was also partially offset by increases in professional fees, license fees and royalties and contracted services in 2009 over 2008.
DEPRECIATION AND AMORTIZATION EXPENSES—Depreciation and amortization expenses decreased $11.3 million, or 11.0%, from 2008 to 2009. This decrease is primarily attributable to a decrease in accelerated depreciation of $13.9 million from 2008 primarily related to 3G-1xRTT and other equipment scheduled to be replaced earlier than originally anticipated in connection with the EV-DO upgrade discussed below, which was 98% complete in the service area covered by the Strategic Network Alliance by December 31, 2008 and fully completed by June 30, 2009 in all areas planned for upgrade at this time (85.4% of total cell sites).
Amortization expense decreased $0.4 million from 2008 due to the scheduled completion of amortization for a customer list intangible asset after the first quarter of 2008. Offsetting this, normal depreciation increased $3.0 million over 2008 due to the $99.8 million increase in the average depreciable base, with significant investments in property, plant and equipment during 2008 and 2009, as further discussed in the liquidity and capital resources section below.
ACCRETION OF ASSET RETIREMENT OBLIGATIONS—Accretion of asset retirement obligations is recorded in order to accrete the estimated asset retirement obligation over the life of the related asset up to its future expected settlement cost. This charge decreased approximately $0.2 million from 2008.
OTHER INCOME (EXPENSES)
Interest expense on debt instruments decreased $2.8 million, or 8.8%, from 2008 to 2009 due primarily to the precipitous drop in LIBOR rates and a lower debt balance from January to August 2009 due to $4.7 million of debt repayments from September 30, 2008 to August 7, 2009 at which time the debt was refinanced (see further discussion in the liquidity and capital resource section that follows). From August 7, 2009 to December 31, 2009, the senior credit facility was increased by over $30 million and the interest rate increased to 5.75% from an average rate that was over 100 basis points lower through the date of refinancing.
Gain (loss) on interest rate swap instrument(s) increased $11.6 million year over year, from a $9.5 million loss in 2008 to a $2.1 million gain in 2009. In August 2009, NTELOS Inc. terminated the interest rate swap agreement that commenced in September 2008 with a termination payment of $9.3 million, inclusive of $2.3 million of accrued unpaid interest. This swap agreement was not designated as an interest rate hedge instrument for accounting purposes and, therefore, the changes in the fair value of the swap agreements until the termination date were recorded currently as gain (loss) on interest rate swap.
50
Table of Contents
Other income (expenses) includes $0.8 million in the 2009 related to the write-off of deferred fees associated with our prior senior secured credit facility which was paid in full in connection with the refinancing noted above. The remaining immaterial amounts primarily relate to interest income from cash that declined from the previous periods due to lower investment interest rates and maintaining lower cash balances in interest bearing accounts.
INCOME TAXES
Income tax expense for 2009 was $37.2 million, representing the statutory tax rate applied to pre-tax income and the effects of certain non-deductible compensation, and the recognition of previously unrecognized tax benefits of $3.1 million. We expect our recurring non-deductible expenses to relate primarily to certain non-cash share-based compensation, and other non-deductible compensation. For 2010, the amounts of these charges for equity-based awards outstanding as of December 31, 2009, and other non-deductible compensation are expected to be $0.7 million and $0.3 million, respectively. Income taxes for 2008 were $30.2 million, driven by non-deductible, non-cash equity-based compensation.
We have unused net operating losses (“NOLs”) totaling $168.9 million as of December 31, 2009. These NOLs, along with net unrealized losses existing at the September 2003 bankruptcy emergence date, are subject to an annual utilization limitation of $1.6 million (prior to adjustment for realization of built-in gains that existed as of the 2005 merger, with a maximum limitation of $9.2 million). Based on this limitation and the adjustments required for certain built-in gains realized or to be realized during the five year period immediately following our May 2, 2005 merger, we expect to use NOLs of approximately $143.4 million as follows: $9.2 million per year in 2010 through 2024, $5.1 million in 2025 and $0.8 million in 2026.
Year ended December 31, 2008 compared to year ended December 31, 2007
Operating revenues increased $35.5 million, or 7.1%, from 2007 to 2008. Wireless PCS accounted for 96.3% of the increase, with growth occurring from subscriber revenues, wholesale revenues and equipment sales. Wireline contributed the remaining revenue increase primarily from growth in key strategic product revenues in the Competitive Wireline segment, partially offset by declines in other revenues from the Competitive Wireline segment and RLEC revenues.
Operating income increased $15.3 million over the comparative year, from $100.2 million for 2007 to $115.6 million for 2008. Operating margin increased from 20.0% for 2007 to 21.6% for 2008.
Net income increased $12.4 million over 2007. In addition to the $15.3 million increase in operating income, interest expense decreased $10.6 million. These changes, which served to increase net income, were partially offset by an increase in the loss on the fair value of swap instruments of $6.0 million and an increase in income tax expense of $5.8 million.
OPERATING REVENUES
The following table identifies our external operating revenues on a business segment basis for the years ended December 31, 2008 and 2007:
| Year Ended December 31, |
|||||||||||||
| Operating Revenues |
2008 | 2007 | $ Variance | % Variance | |||||||||
| (dollars in thousands) | |||||||||||||
| Wireless PCS |
$ | 411,951 | $ | 377,761 | $ | 34,190 | 9.1 | % | |||||
| Wireline |
|||||||||||||
| RLEC |
59,518 | 61,458 | (1,940 | ) | (3.2 | )% | |||||||
| Competitive Wireline |
63,878 | 60,467 | 3,411 | 5.6 | % | ||||||||
| Total wireline |
123,396 | 121,925 | 1,471 | 1.2 | % | ||||||||
| Other |
559 | 708 | (149 | ) | (21.0 | )% | |||||||
| Total |
$ | 535,906 | $ | 500,394 | $ | 35,512 | 7.1 | % | |||||
WIRELESS COMMUNICATIONS REVENUES—Wireless communications revenues increased $34.2 million from 2007 to 2008 due to an increase in our NTELOS-branded net subscriber revenue of $20.4 million, or 7.9%, an $11.2 million, or 11.7%, increase in wholesale and roaming revenues and an increase in equipment sales revenues of $2.4 million, or 11.4%.
51
Table of Contents
The increase in subscriber revenues reflects increased postpay revenue of $14.3 million, or 7.5%, $8.0 million of which is from growth in data revenues. Underlying this 47.4% growth in data revenue was the technology upgrade to EV-DO (deployed to 70% of our cell sites by year-end), and an increased sales emphasis on smart phones and other data-centric handsets coupled with a richer array of data packages. The total data ARPU for all prepay and postpay products was $7.43 for 2008 compared to $4.67 for 2007, an increase of 59.1%. In addition to this APRU growth, the take rates on data packages and usage rates continues to rapidly expand. Growth in data ARPU has offset declines in voice rates resulting from economic and competitive pressure, leading to blended ARPU of $55.23 for 2008, 1.3% below blended ARPU of $55.98 for 2007. However, pro forma of the handset insurance reporting change (see footnote 1 to the ARPU reconciliation table above), blended ARPU increased 1.9% year over year, from $53.66 in 2007 to $54.67 in 2008. In addition to the data ARPU growth, total subscribers increased from 406,795 at December 31, 2007 to 435,008 at December 31, 2008, a 28,213, or 6.9%, net subscriber growth.
The year-over-year increase in wholesale and roaming revenues was driven by an $8.8 million, or 9.3%, increase in revenue from the Strategic Network Alliance. Additionally, roaming revenues from other carriers grew $2.4 million.
WIRELINE COMMUNICATIONS REVENUES—Wireline communications revenues increased $1.5 million, or 1.2%, with revenues from strategic products increasing $5.9 million, or 12.8%, and revenues from RLEC and other revenues from the Competitive Wireline segment decreasing $1.9 million and $2.5 million, respectively.
| • | RLEC Revenues. RLEC revenues, which include local service, network access, toll service, directory advertising and calling feature revenues from our RLEC customers, decreased 3.2% primarily due to the decrease in local service revenues and access revenues as a result of a 5.5% decrease in access lines, which is discussed in further detail below. Access lines totaled approximately 41,100 as of December 31, 2008 and 43,500 as of December 31, 2007. In addition to the impact from access line loss, the interstate access rate per minute declined more than 14% primarily attributable to a biennial reset of RLEC interstate access rates on July 1, 2007, impacting both end user access and tandem switching access. Also, National Exchange Carrier Association (NECA) settlement rates declined, primarily related to the access line loss. Partially offsetting these factors was a 3.5% increase in carrier access minutes due primarily to growth in usage by wireless carriers. |
The access line loss noted above is reflective of residential wireless substitution, second line losses and the introduction of competitive voice service offerings from Comcast, which commenced in May 2008 in one of our three RLEC markets.
| • | Competitive Wireline Revenues. Competitive Wireline revenue for 2008 increased $3.4 million over 2007, with the growth in strategic products being offset by the decline in other revenues as noted above. Revenues from broadband voice and data services increased $3.4 million, or 21.4%. Additionally, revenues from private line, carrier access and transport services increased $1.9 million, or 12.4%. Dial-up internet customers continue to decline, resulting in a revenue decline of $0.8 million, to $3.0 million for 2008, and switched access, reciprocal compensation and other miscellaneous revenue declined $1.9 million, to $4.0 million for 2008. |
On September 28, 2007, the Virginia State Corporation Commission issued a final order in a rulemaking docket that capped CLECs’ intrastate switched access charges, including the access charges of our CLECs, at the higher of the CLEC’s interstate switched access charges or the intrastate switched access charges of the ILEC (or the average of all ILECs) providing service in the geographic area served by the CLEC. The cap took effect at the end of a transition period that began on December 1, 2007 and ended on March 31, 2008. As part of that transition, we reduced our CLEC access rates effective on December 1, 2007 and again on April 1, 2008. These lower rates reduced our CLEC access revenues by a total of $1.2 million in 2008.
52
Table of Contents
OPERATING EXPENSES
The following table identifies our operating expenses on a business segment basis, consistent with the table presenting operating revenues above, for the years ended December 31, 2008 and 2007:
| Year Ended December 31, |
|||||||||||||
| Operating Expenses |
2008 | 2007 | $ Variance | % Variance | |||||||||
| (dollars in thousands) | |||||||||||||
| Wireless PCS |
$ | 252,499 | $ | 235,575 | $ | 16,924 | 7.2 | % | |||||
| Wireline |
|||||||||||||
| RLEC |
15,793 | 17,033 | (1,240 | ) | (7.3 | )% | |||||||
| Competitive Wireline |
38,567 | 39,561 | (994 | ) | (2.5 | )% | |||||||
| Total wireline |
54,360 | 56,594 | (2,234 | ) | (3.9 | )% | |||||||
| Other |
5,853 | 5,215 | 638 | 12.2 | % | ||||||||
| Operating expenses, before equity-based compensation charges, voluntary early retirement plan charges, secondary offering costs, depreciation and amortization and accretion of asset retirement obligations |
312,712 | 297,384 | 15,328 | 5.2 | % | ||||||||
| Equity-based compensation |
2,729 | 4,328 | (1,599 | ) | (36.9 | )% | |||||||
| Voluntary early retirement charges |
981 | — | 981 | N/M | |||||||||
| Secondary offering costs |
— | 570 | (570 | ) | 100.0 | % | |||||||
| Depreciation and amortization |
102,940 | 97,061 | 5,879 | 6.1 | % | ||||||||
| Accretion of asset retirement obligations |
989 | 818 | 171 | 20.9 | % | ||||||||
| Total operating expenses |
$ | 420,351 | $ | 400,161 | $ | 20,190 | 5.0 | % | |||||
OPERATING EXPENSES—The following describes our operating expenses by segment and on a basis consistent with our financial statement presentation.
The discussion below relates to our operating expenses by segment before equity-based compensation charges, voluntary early retirement plan charges, secondary offering costs, depreciation and amortization and accretion of asset retirement obligations:
| • | Wireless Communications – Of the increase in wireless communications operating expenses noted in the table above, variable cost of sales and services (“COS”) accounted for $4.4 million due primarily to the increase in sales to existing subscribers that upgrade and extend their contract period. This was more prolific in 2008 due to the increase in selection of smart phones and other data-centric handsets coupled with more data product offerings and capabilities. Also, we entered into a new handset insurance contract whereby we sold $1.2 million of equipment to the insurance provider. Increases in roaming and data COS were partially offset by a reduction in handset insurance COS related to the April 1, 2008 reporting change discussed in the Other Overview Discussion section above. |
We expect continued growth in COS expenses as our customer base grows, sales of national plans increase, sales of smart phones continue to represent a significantly higher percentage of total sales than in the prior year and usage of data features increases.
The remaining operating expense increase in wireless communications over the comparative period was due to increased costs of maintaining our network, combined with direct and indirect costs of sales and services expenses. Specifically, cell site and network access expenses increased $6.1 million year over year related to additional access connectivity to support high-speed data over the EV-DO network and to support our increased subscriber base, and a 15.6% increase in the number of cell sites as of December 31, 2008 over December 31, 2007. Finally, customer retention and advertising expense increased $1.0 million year over year and operating taxes and regulatory fees increased a total of $3.7 million (see further discussion below under corporate operations expenses).
53
Table of Contents
| • | Wireline Communications – The decrease in wireline operating expenses noted in the table above is partially attributable to a $0.6 million decrease in bad debt expense from 2007 primarily due to improved accounts receivable turnover and aging. Also, compensation expenses decreased $0.7 million, most of which is attributable to savings realized during the second half of 2008 related to the voluntary early retirement plan described below, and a $1.0 million decrease in allocated corporate expenses as a result of an increased percentage of corporate expenses attributable to the significantly faster growing wireless segment. Finally, network access and other network related expenses were flat from prior year due to ongoing network grooming and shifting of traffic to our network versus leased network facilities. |
| • | Other – The increase in other operating expenses is primarily attributable to unallocated accounting and other professional services performed in early 2008 associated with the year-end 2007 professional expenses related to our first year of compliance with section 404 of the Sarbanes-Oxley Act and executive recruiting expenses. |
COST OF SALES AND SERVICES—Cost of sales and services increased $11.3 million, or 7.0%, from 2007 to 2008. As discussed above, wireless variable cost of sales and services increased $4.4 million year over year and cell site and network access expenses increased $6.1 million related to cell site expansion and the capacity increase related to the network upgrade to EV-DO. The portion of this increase related to the EV-DO upgrade ($3.5 million) results in our adding additional access expenses for every cell site upgraded.
Equipment cost of sales increased $4.3 million in 2008 over 2007 due to the increase in subscriber additions, the increase in exchanges and sales to existing customers, and the increase in handset sales to our handset insurance provider. Roaming COS increased $5.0 million year over year primarily to an increased mix of national plans and other plans which contain more roaming minutes, partially offset by in-network roaming savings related to continued cell site expansion. The percentage of subscribers with a national plan increased from 32.8% as of December 31, 2007 to 35.9% as of December 31, 2008. Data COS increased $1.1 million in 2008 over 2007 consistent with increased data usage and revenues. These and other increases in wireless cost of sales and services were offset by an $8.2 million decrease in handset insurance cost of sales from 2007 primarily related to a change in the reporting of handset insurance from a gross to a net basis effective April 1, 2008 (see footnote 1 to the ARPU reconciliation table above).
As noted above, wireline network access and other network related expenses were flat due to improved utilization, efficiency and on-network traffic. This is a result of grooming provision configuration enhanced by our commitment over the last three years to invest in our network to move traffic from leased to owned facilities and in improve margins and control service quality.
CUSTOMER OPERATIONS EXPENSES—Customer operations expenses increased $2.3 million, or 2.1%, from 2007 to 2008. Wireless retention and advertising expenses increased $1.0 million related to an increase in promotional pricing needed to combat the increase in competitive and economic pressures experienced in 2008. Compensation and benefits expenses increased $2.2 million associated with inflationary growth in wages and an increase in personnel to support subscriber growth. The remaining increases in 2008 over 2007 primarily relate to contracted services, rent expense, postage and our phonebook directory. Offsetting these increases were decreases in bad debt expense of $1.2 million due to improvement in accounts receivable aging and collections forecasts at December 31, 2008 versus the prior year-end. Also, wireless selling expenses decreased $1.1 million due to the decrease in sales through the higher-cost third-party agent channel.
CORPORATE OPERATIONS EXPENSES—Corporate operations expenses increased $0.6 million, or 1.9%, from 2007 to 2008. The results for 2008 contain $1.0 million of charges related to a voluntary early retirement plan offered to a select number of wireline employees. These charges primarily represent an enhanced pension benefit offered to the 22 employees who accepted the early retirement offer. Regulatory fees increased $0.9 million and operating taxes increased $2.9 million. In 2007, we resolved a tax dispute which resulted in a $1.2 million operating tax recovery related to a favorable ruling from tax authorities. Additionally, in 2007 we resolved other operating tax matters which favorably impacted 2007 operating tax expense. Finally, 2008 operating taxes increased related to the increase in assets and revenues and other items which are the basis from which these taxes are calculated. Offsetting these increases was a decrease of $0.6 million relating to legal, accounting and other expenses associated with the secondary stock offering completed in the first quarter of 2007, a $2.6 million decrease in compensation expense due to a decrease in performance-based compensation expense and a $1.3 million decrease in equity-based compensation. Equity-based compensation expense decreased as a result of the final vesting of the majority of our former Class A shares in the second quarter of 2008.
54
Table of Contents
DEPRECIATION AND AMORTIZATION EXPENSES—Depreciation and amortization expenses increased $5.9 million, or 6.1%, from 2007 to 2008. This increase is primarily attributable to an increase in accelerated depreciation of $3.5 million related to 3G-1xRTT and other equipment scheduled to be replaced earlier than originally anticipated related to the EV-DO upgrade discussed below and a $1.4 million impairment charge recorded in 2008 related to certain C block PCS spectrum. The spectrum impairment charge reflects the reduction in value of the remaining C block PCS spectrum not in service in two markets to their current estimated net realizable value. In addition to this, normal depreciation increased $2.6 million due to the $97.8 million increase in the average depreciable base, with significant investments in property, plant and equipment during 2007 and 2008, as further discussed in the liquidity and capital resource section below. Partially offsetting this was a $1.7 million decrease in amortization expense from 2007 related to the change in the remaining useful life of the intangible asset associated with the Strategic Network Alliance with Sprint Nextel due to the extension of the contract period-end to July 2015.
As discussed above in the “wireless communications revenue” section, we have upgraded a majority of our coverage areas with EV-DO. During 2007 and 2008, we have recorded $18.3 million and $21.9 million, respectively, in accelerated depreciation primarily on the 3G-1xRTT assets as they have been disposed of or are planned for disposal prior to their previously planned useful lives.
ACCRETION OF ASSET RETIREMENT OBLIGATIONS—Accretion of asset retirement obligations is recorded in order to accrete the estimated asset retirement obligation over the life of the related asset up to its future expected settlement cost. This charge increased $0.2 million in 2008 over 2007 primarily due to cell site expansion.
OTHER INCOME (EXPENSES)—Interest expense on debt instruments decreased $10.6 million, or 24.6%, from 2007 to 2008 due primarily to the precipitous drop in LIBOR rates and a lower debt balance due to $12.5 million of debt repayment during 2007 and $6.3 million of scheduled debt repayments in 2008.
Loss on interest rate swap instrument(s) increased $6.0 million from 2007 to 2008. In February 2008, NTELOS Inc. entered into a new, 18 month interest rate swap agreement which commenced in September 2008 to replace the previous interest rate swap. These swap agreements were not designated as interest rate hedge instruments for accounting purposes and, therefore, the changes in the fair value of the swap agreements were recorded as gain (loss) on interest rate swap. The $9.5 million loss on interest rate swap recorded in 2008 related primarily to the sharp downturn during the fourth quarter in projected LIBOR rates over the remaining life of the swap agreement. The $3.5 million loss recorded in 2007 was a result of the underlying instruments having a fair value of a $3.9 million asset at the end of 2006 compared to a fair value of a $0.3 million asset at December 31, 2007 (included in the securities and investments section of the Consolidated Balance Sheets). The current swap agreement had a fair value of a $9.2 million liability which is included in the long-term liabilities section of the Consolidated Balance Sheets.
Other income primarily relates to interest income from cash and cash equivalents. It declined $1.6 million from 2007 to 2008 due to significantly lower short-term investment interest rates partially offset by a higher average cash and cash equivalent balance in the current versus the prior year.
INCOME TAXES—Income tax expense for the year ended December 31, 2008 was $30.2 million, representing the statutory tax rate applied to pre-tax income and the effects of non-deductible, non-cash stock based compensation. Income tax expense for the year ended December 31, 2007 was $24.4 million. The primary permanent differences relate to the effects of non-deductible, non-cash stock based compensation, state minimum taxes, and non-deductible secondary offering transaction costs.
55
Table of Contents
Quarterly Results
The following table sets forth selected unaudited consolidated quarterly statement of operations data for the four quarters in 2008 and 2009. This unaudited information has been prepared on substantially the same basis as our consolidated financial statements appearing elsewhere in this report and includes all adjustments (consisting of normal recurring adjustments) we believe necessary for a fair statement of the unaudited consolidated quarterly data. The unaudited consolidated quarterly statement of operations data should be read together with the consolidated financial statements and related notes thereto included elsewhere in this report. The results for any quarter are not necessarily indicative of results for any future period, and you should not rely on them as such.
Subsequent to the filing of our Annual Report on Form 10-K for the year ended December 31, 2008, we discovered an error related to the billing information we used for billing services to Sprint under our Strategic Network Alliance agreement (see Note 3 to the audited consolidated financial statements contained in Part II, Item 8. of our Annual Report on Form 10-K contained herein). The effect of recording this immaterial correction in the fiscal 2008 quarterly periods is included in the following table. There was no impact to the previously reported results for the first quarter of 2008.
| (In thousands except per share amounts) |
For the Quarter Ended December 31, 2008 |
For the Quarter Ended September 30, 2008 |
For the Quarter Ended June 30, 2008 | |||||||||||||||
| As Reported |
As Revised |
As Reported |
As Revised |
As Reported |
As Revised | |||||||||||||
| Operating revenues |
$ | 140,587 | $ | 137,778 | $ | 135,985 | $ | 135,074 | $ | 131,015 | $ | 130,805 | ||||||
| Operating income |
31,489 | 28,680 | 31,823 | 30,912 | 30,029 | 29,819 | ||||||||||||
| Income tax expense |
4,450 | 3,337 | 8,714 | 8,354 | 12,565 | 12,482 | ||||||||||||
| Net income |
$ | 6,442 | $ | 4,746 | $ | 12,968 | $ | 12,417 | $ | 19,271 | $ | 19,144 | ||||||
| Basic and diluted earnings per common share attributable to NTELOS Holdings Corp. stockholders: |
||||||||||||||||||
| Income per share – basic |
$ | 0.15 | $ | 0.11 | $ | 0.31 | $ | 0.29 | $ | 0.46 | $ | 0.46 | ||||||
| Income per share – diluted |
$ | 0.15 | $ | 0.11 | $ | 0.31 | $ | 0.29 | $ | 0.46 | $ | 0.45 | ||||||
56
Table of Contents
| Summary Operating Results (Unaudited) (In thousands, except per share amounts) |
December 31, 2009 |
September 30, 2009 |
June 30, 2009 |
March 31, 2009 |
December 31, 2008 |
September 30, 2008 |
June 30, 2008 |
March 31, 2008 |
||||||||||||||||||||||||
| Operating Revenues |
||||||||||||||||||||||||||||||||
| Wireless PCS operations |
$ | 102,388 | $ | 104,226 | $ | 108,858 | $ | 109,206 | $ | 106,194 | $ | 103,894 | $ | 99,950 | $ | 101,913 | ||||||||||||||||
| Wireline operations |
||||||||||||||||||||||||||||||||
| RLEC |
13,761 | 14,395 | 14,458 | 14,690 | 15,083 | 15,078 | 14,922 | 14,435 | ||||||||||||||||||||||||
| Competitive Wireline |
17,083 | 16,944 | 16,567 | 16,643 | 16,363 | 15,979 | 15,790 | 15,746 | ||||||||||||||||||||||||
| Wireline total |
30,844 | 31,339 | 31,025 | 31,333 | 31,446 | 31,057 | 30,712 | 30,181 | ||||||||||||||||||||||||
| Other operations |
117 | 121 | 118 | 125 | 138 | 123 | 143 | 155 | ||||||||||||||||||||||||
| Total Operating Revenues |
133,349 | 135,686 | 140,001 | 140,664 | 137,778 | 135,074 | 130,805 | 132,249 | ||||||||||||||||||||||||
| Operating Expenses |
||||||||||||||||||||||||||||||||
| Wireless PCS operations |
66,523 | 65,106 | 64,842 | 66,415 | 68,507 | 63,285 | 58,718 | 61,989 | ||||||||||||||||||||||||
| Wireline operations |
||||||||||||||||||||||||||||||||
| RLEC |
3,611 | 3,326 | 3,725 | 3,741 | 4,050 | 4,009 | 3,884 | 3,850 | ||||||||||||||||||||||||
| Competitive Wireline |
9,416 | 9,446 | 9,834 | 9,849 | 9,940 | 9,920 | 9,413 | 9,294 | ||||||||||||||||||||||||
| Wireline total |
13,027 | 12,772 | 13,559 | 13,590 | 13,990 | 13,929 | 13,297 | 13,144 | ||||||||||||||||||||||||
| Other operations |
1,685 | 1,170 | 1,313 | 2,558 | 1,610 | 1,470 | 1,203 | 1,570 | ||||||||||||||||||||||||
| Operating expenses, before depreciation and amortization, accretion of asset retirement obligations, equity-based compensation charges and charges from voluntary early retirement and workforce reduction plans |
81,235 | 79,048 | 79,714 | 82,563 | 84,107 | 78,684 | 73,218 | 76,703 | ||||||||||||||||||||||||
| Depreciation and amortization |
22,730 | 22,678 | 23,091 | 23,158 | 24,325 | 24,789 | 25,812 | 28,014 | ||||||||||||||||||||||||
| Accretion of asset retirement obligations |
(187 | ) | 399 | 285 | 276 | 244 | 249 | 268 | 228 | |||||||||||||||||||||||
| Equity-based compensation |
184 | 707 | 1,522 | 1,043 | 422 | 434 | 713 | 1,160 | ||||||||||||||||||||||||
| Voluntary early retirement and workforce reduction plans |
1,536 | — | — | — | — | 6 | 975 | — | ||||||||||||||||||||||||
| Total Operating Expenses |
105,498 | 102,832 | 104,612 | 107,040 | 109,098 | 104,162 | 100,986 | 106,105 | ||||||||||||||||||||||||
| Operating Income |
27,851 | 32,854 | 35,389 | 33,624 | 28,680 | 30,912 | 29,819 | 26,144 | ||||||||||||||||||||||||
| Other Income (Expenses) |
||||||||||||||||||||||||||||||||
| Interest expense |
(9,123 | ) | (8,657 | ) | (6,484 | ) | (5,306 | ) | (7,806 | ) | (7,756 | ) | (8,040 | ) | (8,815 | ) | ||||||||||||||||
| (Loss) gain on interest rate swap |
— | 662 | 510 | 928 | (13,427 | ) | (2,403 | ) | 9,478 | (3,179 | ) | |||||||||||||||||||||
| Other income (expense) |
69 | (876 | ) | (132 | ) | 75 | 627 | 44 | 383 | 444 | ||||||||||||||||||||||
| (9,054 | ) | (8,871 | ) | (6,106 | ) | (4,303 | ) | (20,606 | ) | (10,115 | ) | 1,821 | (11,550 | ) | ||||||||||||||||||
| 18,797 | 23,983 | 29,283 | 29,321 | 8,074 | 20,797 | 31,640 | 14,594 | |||||||||||||||||||||||||
| Income Tax Expense |
4,299 | 9,517 | 11,706 | 11,687 | 3,337 | 8,354 | 12,482 | 6,055 | ||||||||||||||||||||||||
| Net Income |
14,498 | 14,466 | 17,577 | 17,634 | 4,737 | 12,443 | 19,158 | 8,539 | ||||||||||||||||||||||||
| Net Income (Loss) Attributable to Noncontrolling Interests |
(221 | ) | (196 | ) | (241 | ) | (232 | ) | 9 | (26 | ) | (14 | ) | (17 | ) | |||||||||||||||||
| Net Income Attributable to NTELOS Holdings Corp. |
$ | 14,277 | $ | 14,270 | $ | 17,336 | $ | 17,402 | $ | 4,746 | $ | 12,417 | $ | 19,144 | $ | 8,522 | ||||||||||||||||
| Basic and Diluted Earnings per Common Share Attributable to NTELOS Holdings Corp. Stockholders: |
||||||||||||||||||||||||||||||||
| Income per share - basic |
$ | 0.34 | $ | 0.34 | $ | 0.41 | $ | 0.41 | $ | 0.11 | $ | 0.29 | $ | 0.46 | $ | 0.20 | ||||||||||||||||
| Income per share - diluted |
$ | 0.34 | $ | 0.34 | $ | 0.41 | $ | 0.41 | $ | 0.11 | $ | 0.29 | $ | 0.45 | $ | 0.20 | ||||||||||||||||
| Weighted average shares outstanding – basic |
41,757 | 42,161 | 42,173 | 42,155 | 42,150 | 42,137 | 41,960 | 41,670 | ||||||||||||||||||||||||
| Weighted average shares outstanding – diluted |
42,009 | 42,414 | 42,448 | 42,331 | 42,296 | 42,313 | 42,291 | 42,232 | ||||||||||||||||||||||||
| Cash Dividends Declared per Share – Common Stock |
$ | 0.28 | $ | 0.26 | $ | 0.26 | $ | 0.26 | $ | 0.26 | $ | 0.21 | $ | 0.21 | $ | 0.21 | ||||||||||||||||
57
Table of Contents
Liquidity and Capital Resources
For the years ended December 31, 2009 and 2008, we funded our working capital requirements, capital expenditures, stock repurchases, cash dividend payments and our asset purchase agreement with Allegheny Energy, Inc. from cash on hand and net cash provided from operating activities. We believe our cash generated from operating segments will continue to fund our working capital requirements, capital expenditures, higher interest cost following our debt refinancing, stock repurchases through our previously announced repurchase plan, cash dividends and required debt principal payments prior to maturity.
As of December 31, 2009, we had $727.1 million in aggregate long term liabilities, consisting of $622.0 million in outstanding long-term debt ($628.9 million including the current portion and net of a $6.4 million discount) and approximately $105.1 million in other long-term liabilities. Our credit agreement also includes a revolving credit facility of $35 million (the “Revolving Credit Facility”), which is available for our working capital requirements and other general corporate purposes.
In addition to the long-term debt from the credit agreement, we also enter into capital leases on vehicles used in our operations with lease terms of four to five years. At December 31, 2009, the net present value of these future minimum lease payments was $1.5 million. The aggregate maturities of our long-term debt, excluding capital lease obligations, based on the contractual terms of the instruments are $6.4 million per year in 2010 through 2014 and $601.7 million in 2015.
We have a restricted payment basket under the terms of the credit agreement which can be used to make certain restricted payments, including the ability to pay dividends and repurchase stock. In connection with the August 2009 debt refinancing, the restricted payment basket was reset at $50 million. The restricted payment basket is increased by $10.0 million per quarter (beginning in the first quarter of 2010) plus an additional quarterly amount for calculated excess cash flow (which was zero for the quarter ended December 31, 2009 due to the asset purchase from Allegheny Energy, Inc. noted above) based on the definition in the credit agreement, and is decreased by any actual restricted payments. During the year ended December 31, 2009, we repurchased shares of our own common stock for approximately $16.9 million which reduced the restricted payment basket and, as previously noted, we may repurchase an additional $23.1 million of our common stock up to a total of $40 million through our repurchase plan announced on August 24, 2009. The balance of the basket as of December 31, 2009 was $33.1 million
We are a holding company that does not operate any business of our own. As a result, we are dependent on cash dividends and distributions and other transfers from our subsidiaries to make dividend payments or repurchase our common stock. Amounts that can be made available to us to pay cash dividends or repurchase stock are restricted by the NTELOS Inc. Credit Agreement.
Under the credit agreement, NTELOS Inc. is also bound by certain financial covenants. Noncompliance with any one or more of the debt covenants may have an adverse effect on our financial condition or liquidity in the event such noncompliance cannot be cured or should we be unable to obtain a waiver from the lenders of the NTELOS Inc. senior secured credit facilities. As of December 31, 2009, we are in compliance with all of our debt covenants, and our ratios at December 31, 2009 are as follows:
| Actual | Covenant Requirement at December 31, 2009 | |||
| Total debt outstanding to EBITDA (as defined in the credit agreement) |
2.77 | Not more than 4.00 | ||
| Minimum interest coverage ratio |
7.80 | Not less than 3.00 |
During the year ended December 31, 2009, net cash provided by operating activities was approximately $182.6 million. Net income during this period was $63.3 million. We recognized $136.8 million of depreciation, amortization, deferred taxes and other non-cash charges (net). Total net changes in operating assets and liabilities used $17.5 million. The principal changes in operating assets and liabilities from December 31, 2008 to December 31, 2009 were as follows: accounts receivable decreased by $1.8 million primarily due to an increase in the allowance for doubtful accounts; inventories and supplies decreased $0.2 million; other current assets increased $0.5 million; changes in income taxes totaled $5.5 million due to net estimated tax payments compared to current tax accruals; accounts payable decreased $1.5 million; and other current liabilities decreased $2.0 million primarily related to incentive plan bonus accrual at December 31, 2008. Retirement benefit payments for 2009 were approximately $9.9 million which includes a $9.0 million pension plan funding.
58
Table of Contents
During the year ended December 31, 2008, net cash provided by operating activities was approximately $185.3 million. Net income during this period was $44.8 million. We recognized $141.6 million of depreciation, amortization, deferred taxes and other non-cash charges (net). Total net changes in operating assets and liabilities used $1.1 million. The principal changes in operating assets and liabilities from December 31, 2007 to December 31, 2008 were as follows: accounts receivable increased by $2.0 million; inventories and supplies increased $3.4 million driven by an increase in demand and thus inventory on hand of higher-priced handsets; other current assets decreased $0.7 million; income tax receivable decreased $10.3 million due primarily to the receipt of a $10.3 million tax refund (as discussed later in this section); accounts payable increased $0.1 million; and other current liabilities decreased $0.7 million. Retirement benefit payments for 2008 were approximately $6.2 million which includes a $5.4 million pension plan funding.
During the year ended December 31, 2007, net cash provided by operating activities was approximately $143.9 million. Net income during this period was $32.5 million. We recognized $131.9 million of depreciation, amortization, deferred taxes and other non-cash charges (net). Total net changes in operating assets and liabilities used $20.5 million. The principal changes in operating assets and liabilities from December 31, 2006 to December 31, 2007 were as follows: accounts receivable increased by $7.1 million due to increased revenues of 14%; inventories and supplies increased $2.2 million driven by an increase in demand and thus inventory on hand of higher-priced handsets and increases due to attractive volume purchase incentives; other current assets increased $1.9 million largely related to increases in prepaid maintenance contracts; income tax receivable increased by $11.6 million, representing excess estimated payments resulting after favorable resolution of certain NOL limitation calculations; accounts payable increased by $6.3 million; and other current liabilities increased $2.9 million due primarily to increased advance billings and accrued compensation primarily related to an increase in unpaid annual incentive compensation. Retirement benefit payments for 2007 were approximately $6.9 million which includes a $6.0 million pension plan funding.
Our cash flows used in investing activities for year ended December 31, 2009 were approximately $134.6 million. Of this total, $26.7 million was used to acquire certain fiber optic and network assets and related transport and data service contracts from Allegheny Energy, Inc. The remaining $107.9 million was used for the purchase of property and equipment comprised of (i) approximately $50.7 million related to our wireless business, including approximately $3.0 million of incremental capital expenditures related to our network upgrade to EV-DO, approximately $13.2 million of continued network coverage expansion and enhancements within our coverage area, approximately $31.5 million of expenditures for additional capacity to support our projected growth in our NTELOS-branded subscribers and increased voice and data usage by existing subscribers and growth in voice and data usage under the Strategic Network Alliance, and approximately $3.0 million to support our existing networks and other business needs, (ii) approximately $37.3 million for the actual and projected growth of our high capacity transport, voice and data offerings and new fiber deployments within and contiguous to our existing competitive segment service areas, for fiber deployment in the RLEC territory related to an infrastructure upgrade to offer, among other services, enhanced broadband services and IPTV-based video services, and other facility upgrades and routine capital outlays supporting our wireline segments, and (iii) approximately $19.8 million related primarily to information technology inclusive of $7.9 million for our new prepaid service billing platform implemented in third quarter 2009 and for web portal applications to enhance the customer on-line buying, payment and account management experiences.
Our cash flows used in investing activities for the year ended December 31, 2008 were approximately $132.4 million used for the purchase of property and equipment comprised of (i) approximately $88.4 million related to our wireless business, including approximately $37.5 million of incremental capital expenditures related to our network upgrade to EV-DO, approximately $19.1 million of continued network coverage expansion and enhancements within our coverage area, approximately $23.0 million of expenditures for additional capacity to support our projected growth in our NTELOS-branded subscribers and increased usage by existing subscribers and growth in voice and data usage under the Strategic Network Alliance, and approximately $8.8 million to maintain and support our existing networks and other business needs, (ii) approximately $35.1 million for routine capital outlays and facility upgrades supporting our RLEC operations, for the actual and projected growth of our Competitive Wireline voice and data offerings, and for fiber deployment in the RLEC territory related to an infrastructure upgrade to offer, among other services, an enhanced broadband service offering and an IPTV-based video service offering, and (iii) approximately $9.0 million related to information technology and corporate expenditures to enhance and maintain the back office support systems.
59
Table of Contents
Our cash flows used in investing activities for the year ended December 31, 2007 were approximately $109.6 million used for the purchase of property and equipment comprised of (i) approximately $77.6 million related to our wireless business, including approximately $24.7 million of incremental capital expenditures related to our network upgrade to EV-DO, approximately $16.1 million of continued network coverage expansion and enhancements within our coverage area, approximately $24.2 million of expenditures for additional capacity to support our projected growth in our NTELOS-branded subscribers and increased usage by existing subscribers and growth in voice and data usage under the Strategic Network Alliance, and approximately $12.6 million to maintain and support our existing networks and other business needs, (ii) approximately $24.6 million for routine capital outlays and facility upgrades supporting our RLEC operations, for the actual and projected growth of our Competitive Wireline voice and data offerings, and for fiber deployment in the RLEC territory related to an infrastructure upgrade to offer, among other services, an enhanced broadband service offering which commenced in the fourth quarter of 2006 and the third quarter 2007 launch of a new IPTV-based video service offering, and (iii) approximately $7.4 million related to information technology and corporate expenditures to enhance and maintain the back office support systems.
We currently expect capital expenditures for 2010 to be in the range of $78 million to $87 million. Our capital expenditures associated with our wireless business will be primarily for additional capacity needs, continued network coverage expansion and for coverage enhancements within our coverage area. Our wireline capital expenditures will be targeted to provide normal network facility upgrades for our RLEC operations, to support the projected growth of our Competitive Wireline voice and data offerings, including strategic fiber builds, and fiber deployment in the RLEC territory related to an infrastructure upgrade to offer, among other services, continued deployment of fiber to the home and growth in IPTV-based video subscribers. Finally, we will make additional investments in web portal and other enhancements and upgrades to our information technology systems in support of growth and new service offerings and applications.
Net cash used in financing activities for the year ended December 31, 2009 aggregated $62.6 million, which primarily represents the following:
| • | $628.7 million in proceeds from the issuance of long-term debt, net of original issue discount; |
| • | $11.5 million in debt issuance costs; |
| • | $608.1 million used to repay our first lien term loan; |
| • | $9.3 million used to terminate our interest rate swap, inclusive of $2.3 million of accrued unpaid interest; |
| • | $44.0 million used for common stock cash dividends ($1.04 per share in the aggregate) paid on January 12, 2009, April 13, 2009, July 13, 2009 and October 13, 2009; |
| • | $16.9 million used for the repurchase of our common stock; |
| • | $1.4 million used for capital distributions to noncontrolling interests; |
| • | $0.7 million used to acquire a noncontrolling interest in the VA Alliance; and |
| • | $0.7 million proceeds and tax benefits primarily related to the exercise of stock options and net borrowings under capital leases. |
Net cash used in financing activities for the year ended December 31, 2008 aggregated $40.7 million, which primarily represents the following:
| • | $6.3 million in payments on our senior secured term loan; |
| • | a total of $35.4 million for common stock cash dividends ($0.84 per share in the aggregate) paid on January 10, 2008, April 11, 2008, July 11, 2008 and October 10, 2008; and |
| • | $1.0 million proceeds and tax benefits primarily related to the exercise of stock options. |
Net cash used in financing activities for the year ended December 31, 2007 aggregated $25.1 million, which primarily represents the following:
| • | $12.5 million in payments on our senior secured term loan; |
| • | a total of $12.6 million for two common stock cash dividends ($0.15 per share) made on July 12, 2007 and October 11, 2007; |
60
Table of Contents
| • | $0.9 million in debt issuance costs; and |
| • | $0.8 million proceeds and tax benefits primarily related to the exercise of stock options. |
As of December 31, 2009, we had approximately $51.1 million in cash and working capital (current assets minus current liabilities) of approximately $41.3 million. As of December 31, 2008, we had approximately $65.7 million in cash and working capital of approximately $49.7 million. Of the cash on hand on December 31, 2009, $47.2 million was held by NTELOS Inc. and its subsidiaries which are subject to usage restrictions pursuant to the credit agreement.
We paid dividends totaling $11.0 million, or $0.26 per share, in each of the four quarters of 2009. On November 3, 2009, the board of directors declared a dividend in the amount of $0.28 per share which was paid on January 12, 2010 to stockholders of record on December 14, 2009 and totaled $11.6 million. On February 25, 2010, the board of directors declared a dividend in the amount of $0.28 per share to be paid on April 12, 2010 to stockholders of record on March 12, 2010. We intend to continue to pay regular quarterly dividends on our common stock. Any decision to declare future dividends will be made at the discretion of the board of directors and will depend on, among other things, our results of operations, cash requirements, investment opportunities, financial condition, contractual restrictions and other factors that the board of directors may deem relevant. We are a holding company that does not operate any business of our own. As a result, we are dependent on cash dividends and distributions and other transfers from our subsidiaries to make dividend payments or to make other distributions to our stockholders, including by means of a stock repurchase. Amounts that can be made available to us to pay cash dividends or repurchase stock are restricted by the NTELOS Inc. Credit Agreement (as discussed earlier in this section).
We believe that our current cash balances of $51.1 million and our cash flow from operations will be sufficient to satisfy our foreseeable working capital requirements, capital expenditures, cash dividend payments and stock repurchases through our stock repurchase plan discussed above for the next 24 months. If our growth opportunities result in unforeseeable capital expenditures, we may need to access our $35 million revolving credit facility and could seek additional financing in the future.
Contractual Obligations and Commercial Commitments
We have contractual obligations and commercial commitments that may affect our financial condition. The following table summarizes our significant contractual obligations and commercial commitments as of December 31, 2009:
| Payments Due by Period | |||||||||||||||
| (In thousands) |
Total(2) | Less than one year |
Two to three years |
Four to five years |
After five years | ||||||||||
| Long-term debt obligations (1),(3) |
$ | 633,413 | $ | 6,350 | $ | 12,700 | $ | 12,700 | $ | 601,663 | |||||
| Capital lease obligations (3) |
1,464 | 526 | 726 | 212 | — | ||||||||||
| Operating lease obligations |
164,943 | 26,332 | 41,599 | 40,891 | 56,121 | ||||||||||
| Purchase obligations |
$ | 17,197 | $ | 17,197 | $ | — | $ | — | $ | — | |||||
| (1) | Represents the first-lien term loan facility. See Note 5 to our audited consolidated financial statements contained in Part II, Item 8. of our Annual Report on Form 10-K contained herein. |
| (2) | Excludes certain benefit obligation projected payments under our qualified and non-qualified pension and other post retirement benefit plans. See Note 11 to our audited consolidated financial statements contained in Part II, Item 8. of our Annual Report filed on Form 10-K contained herein. |
| (3) | Excludes interest. |
Off Balance Sheet Arrangements
We do not have any off balance sheet arrangements or financing activities with special purpose entities.
61
Table of Contents
Critical Accounting Policies and Estimates
The fundamental objective of financial reporting is to provide useful information that allows a reader to comprehend our business activities. To aid in that understanding, management has identified our critical accounting policies for discussion herein. These policies have the potential to have a more significant impact on our financial statements, either because of the significance of the financial statement item to which they relate, or because they require judgment and estimation due to the uncertainty involved in measuring, at a specific point in time, events which are continuous in nature.
Principles of Consolidation
The consolidated financial statements include the accounts of the Company, NTELOS Inc. and all of its wholly-owned subsidiaries and those limited liability corporations where NTELOS Inc. or certain of its subsidiaries, as managing member, exercises control. All significant intercompany accounts and transactions have been eliminated.
Revenue Recognition Policies
The Company recognizes revenue when services are rendered or when products are delivered, installed and functional, as applicable. Certain services of the Company require payment in advance of service performance. In such cases, the Company records a service liability at the time of billing and subsequently recognizes revenue ratably over the service period. The Company bills customers certain transactional taxes on service revenues. These transactional taxes are not included in reported revenues as they are recognized as liabilities at the time customers are billed.
The Company earns revenue by providing access to and usage of its networks in both its wireline and wireless divisions. Local service and airtime revenues are recognized as services are provided. Wholesale revenues are earned by providing switched access and other switched and dedicated services, including wireless roamer management, to other carriers. Revenues for equipment sales are recognized at the point of sale. PCS handset equipment sold with service contracts are generally sold at prices below cost, based on the terms of the service contracts. The Company recognizes the entire cost of the handsets at the time of sale.
The Company evaluates related transactions to determine whether they should be viewed as multiple deliverable arrangements, which impact revenue recognition. Multiple deliverable arrangements are presumed to be bundled transactions and the total consideration is measured and allocated to the separate units based on their relative fair value with certain limitations. The Company has determined that sales of handsets with service contracts related to these sales generated from Company owned retail stores are multiple deliverable arrangements. Accordingly, substantially all of the nonrefundable activation fee revenues (as well as the associated direct costs) are recognized at the time the related wireless handset is sold based on the fact that the handsets are generally sold below cost and on the relative fair value evaluation. However, revenue and certain associated direct costs for activations sold at third party retail locations are deferred and amortized over the estimated life of the customer relationship as the Company is not a principal in the transaction to sell the handset and, therefore, any activation fees charged are fully attributable to the service revenues. Nonrefundable activation fee revenue and certain associated direct costs for transactions in segments other than wireless are deferred as they are not associated with multiple deliverable arrangements but are directly associated with the underlying service being provided over the applicable coverage period. In all cases, the direct activation costs exceed the related activation revenues. When deferral is appropriate, the Company defers these direct activation costs up to but not in excess of the related deferred revenue.
The Company periodically makes claims for recovery of access charges on certain minutes of use terminated by the Company on behalf of other carriers. The Company recognizes revenue in the period that it is able to estimate the amount and when the collection of such amount is considered probable.
Trade Accounts Receivable
The Company sells its services to residential and commercial end-users and to other communication carriers primarily in Virginia and West Virginia. The Company has credit and collection policies to maximize collection of trade receivables and requires deposits on certain sales. The Company maintains an allowance for doubtful accounts based on historical results, current and expected trends and changes in credit policies. Management believes the allowance adequately covers all anticipated losses with respect to trade receivables. Actual credit losses could differ from such estimates. The Company includes bad debt expense in customer operations expense in the consolidated statements of operations.
62
Table of Contents
Inventories and Supplies
The Company’s inventories and supplies consist primarily of items held for resale such as PCS handsets and accessories. The Company values its inventory at the lower of cost or market. Inventory cost is computed on a currently adjusted standard cost basis (which approximates actual cost on a first-in, first-out basis). Market value is determined by reviewing current replacement cost, marketability and obsolescence.
Long-lived Asset Recovery
Long-lived assets include property, plant and equipment, radio spectrum licenses, long-term deferred charges, goodwill and intangible assets to be held and used. Long-lived assets, excluding intangible assets with indefinite useful lives, are reviewed for impairment whenever events or changes in circumstances indicate that the carrying amount should be addressed pursuant to the subsequent measurement guidance described in FASB ASC 360-10-35. Impairment is determined by comparing the carrying value of these long-lived assets to management’s best estimate of future undiscounted cash flows expected to result from the use of the assets. If the carrying value exceeds the estimated undiscounted cash flows, the excess of carrying value over the estimated fair value is recorded as an impairment charge.
Depreciation of property, plant and equipment is calculated on a straight-line basis over the estimated useful lives of the assets, which the Company reviews and updates based on historical experiences and future expectations. Buildings are depreciated over a 50-year life and leasehold improvements, which are categorized in land and buildings, are depreciated over the shorter of the estimated useful lives or the remaining lease terms. Network plant and equipment are depreciated over various lives from 3 to 50 years, with a weighted average life of approximately 11 years. Furniture, fixtures and other equipment are depreciated over various lives from 2 to 24 years.
Goodwill and Indefinite-Lived Intangibles
Goodwill, franchise rights and radio spectrum licenses are considered indefinite-lived intangible assets. Indefinite-lived intangible assets are not subject to amortization but are instead tested for impairment annually or more frequently if an event indicates that the asset might be impaired. The Company assesses the recoverability of indefinite-lived assets annually on October 1 and whenever adverse events or changes in circumstances indicate that impairment may have occurred.
Pension Benefits and Retirement Benefits Other Than Pensions
NTELOS Inc. sponsors a non-contributory defined benefit pension plan (“Pension Plan”) covering all employees who meet eligibility requirements and were employed by NTELOS Inc. prior to October 1, 2003. The Pension Plan was closed to NTELOS Inc. employees hired on or after October 1, 2003. Pension benefits vest after five years of plan service and are based on years of service and an average of the five highest consecutive years of compensation subject to certain reductions if the employee retires before reaching age 65 and elects to receive the benefit prior to age 65.
Sections 412 and 430 of the Internal Revenue Code and ERISA Sections 302 and 303 establish minimum funding requirements for defined benefit pension plans. The minimum required contribution is generally equal to the target
normal cost plus the shortfall amortization installments for the current plan year and each of the six preceding plan years less any calculated credit balance. If plan assets (less calculated credits) are equal to or exceed the funding target, the minimum required contribution is the target normal cost reduced by the excess funding, but not below zero. The Company’s policy is to make contributions to stay at or above the threshold required in order to prevent benefit restrictions and related additional notice requirements and is intended to provide not only for benefits based on service to date, but also for those expected to be earned in the future. Also, NTELOS Inc. has nonqualified pension plans that are accounted for similar to its Pension Plan.
NTELOS Inc. provides certain health care and life benefits for retired employees that meet eligibility requirements. Employees hired after April 1993 are not eligible for these benefits. The Company’s share of the projected costs of benefits that will be paid after retirement is generally being accrued by charges to expense over the eligible employees’ service periods to the dates they are fully eligible for benefits.
NTELOS Inc. also sponsors a contributory defined contribution plan under Internal Revenue Code Section 401(k) for substantially all employees. The Company’s policy is to match 100% of each participant’s annual contributions for contributions up to 1% of each participant’s annual compensation and 50% of each participant’s annual contributions up to an additional 5% of each participant’s annual compensation. Company contributions vest after two years of service. Effective June 1, 2009, the Company began funding its 401(k) matching contributions in shares of the Company’s common stock.
63
Table of Contents
Income Taxes
Deferred income taxes are provided on an asset and liability method whereby deferred tax assets are recognized for deductible temporary differences and deferred tax liabilities are recognized for taxable temporary differences. Temporary differences are the differences between the reported amounts of assets and liabilities and their tax bases. Deferred tax assets and liabilities are adjusted for the effects of changes in tax laws and rates on the date of enactment. The Company accrues interest and penalties related to unrecognized tax benefits in interest expense and income tax expense, respectively.
Recent Accounting Pronouncements
The FASB issued FASB ASC 820, Fair Value Measurements and Disclosures, in September 2006. FASB ASC 820 defines fair value, establishes a framework for the measurement of fair value, and requires certain disclosures about fair value measurements. FASB ASC 820 does not require any new fair value measures. FASB ASC 820 was effective for fair value measures already required or permitted by other standards for fiscal years beginning after November 15, 2007 and we adopted FASB ASC 820 beginning on January 1, 2008. However, the effective date of FASB ASC 820 as it relates to fair value measurement requirements for nonfinancial assets and liabilities that are not re-measured at fair value on a recurring basis was deferred to fiscal years beginning after November 15, 2008. FASB ASC 820 is required to be applied prospectively, except for certain financial instruments. The effect of adoption was immaterial to us and resulted in expanded disclosures regarding our interest rate swap.
In December 2007, the FASB issued new guidance for business combinations through FASB ASC 805. SFAS No. 141R requires most identifiable assets, liabilities, noncontrolling interests and goodwill acquired in a business combination to be recorded at “full fair value.” Statement 141R applies to all business combinations, including combinations among mutual entities and combinations by contract alone. Under SFAS No. 141R, all business combinations will be accounted for by applying the acquisition method. Statement 141R is effective for periods beginning on or after December 15, 2008. The Company has applied the provisions of SFAS No. 141R to the December 2009 purchase of certain fiber optic and network assets and related transport and data service contracts from Allegheny Energy, Inc.
In December 2007, the FASB issued new guidance for noncontrolling interests in consolidated financial statements through FASB ASC 810. Under FASB ASC Subtopic 810-10-65, noncontrolling interests (previously referred to as minority interests) are required to be treated as a separate component of equity, not as a liability or other item outside of permanent equity. FASB ASC 810 also applies to the accounting for noncontrolling interests and transactions with noncontrolling interest holders in the consolidated financial statements. We have adopted the transition guidance in FASB ASC Subtopic 810-10-65 effective January 1, 2009 and have recast comparative period information to classify noncontrolling interests in equity. Additionally, we are now attributing net income or losses to the noncontrolling interests in the VA Alliance, which have cumulative losses in excess of their cumulative capital contributions.
In March 2008, the FASB issued disclosure requirements for derivative instruments and hedging activities under FASB ASC 815. FASB ASC Subtopic 815-10-50 requires companies with derivative instruments to disclose information about how and why a company uses derivative instruments, how derivative instruments and related hedged items are accounted for under topic 815, and how derivative instruments and related hedged items affect a company’s financial position, financial performance and cash flows. The Statement expands the current disclosure framework. We have adopted these disclosure requirements in 2009.
In May 2009, the FASB issued new recognition requirements for subsequent events through FASB ASC 855. FASB ASC Subtopic 855-10-25 requires management to evaluate subsequent events through the date the financial statements are either issued or are available to be issued. We have adopted the requirements of FASB ASC Subtopic 855-10-25 (Note 2 in our Notes to consolidated financial statements).
In June 2009, the FASB issued SFAS No. 168, The FASB Accounting Standards CodificationTM and the Hierarchy of Generally Accepted Accounting Principles—a replacement of FASB Statement No. 162. The FASB’s Accounting Standards Codification became the exclusive authoritative reference for nongovernmental U.S. GAAP for use in financial statements issued for interim and annual periods ending after September 15, 2009, except for SEC rules and interpretive releases, which are also authoritative GAAP for SEC registrants. We have adopted SFAS No. 168 as of September 30, 2009 and have begun citing the Codification in our financial statements as of and for the period ended September 30, 2009.
64
Table of Contents
In April 2008, the FASB issued subsequent measurement guidance for the determination of the useful life of intangible assets under FASB ASC Subtopic 350-30-35. Under this guidance, companies estimating the useful life of a recognized intangible asset must consider their historical experience in renewing or extending similar arrangements or, in the absence of historical experience, must consider assumptions that market participants would use about renewal or extension as adjusted for entity-specific factors. The guidance is restricted to estimating the useful life of recognized intangible assets; it contains no guidance on how to measure or amortize them or account for the costs of renewals. FASB ASC Subtopic 350-30-50 also adds disclosures to those already required by FASB ASC 350. We have adopted these requirements effective January 1, 2009, including the additional disclosure requirements relating to costs incurred to renew or extend the term of a recognized intangible asset (Note 2 in our Notes to consolidated financial statements), and we will apply the provisions of FASB ASC 350 prospectively to intangible assets acquired or renewed after the effective date of FASB ASC 350.
In June 2008, the FASB issued guidance for determining whether instruments granted in share-based payment transactions are participating securities under FASB ASC Subtopic 260-10-45. FASB ASC Subtopic 260-10-45 requires unvested share-based payments that entitle employees to receive nonrefundable dividends to also be considered participating securities. The impact of this guidance was immaterial to our calculation of earnings per share.
In December 2008, the FASB issued additional disclosure requirements for an employers’ disclosures about plan assets of a defined benefit pension or other postretirement plan through FASB ASC Subtopic 715-20-50. This subtopic requires employers of public and nonpublic entities to disclose more information about how investment allocation decisions are made, more information about major categories of plan assets, including concentrations of risk and fair-value measurements, and the fair-value techniques and inputs used to measure plan assets. We adopted the provisions of this standard for our year end 2009 reporting disclosures (Note 11 in our Notes to consolidated financial statements). Upon initial application, the disclosures are not required for earlier periods that are presented for comparative purposes.
In October 2009, the FASB issued Accounting Standards Update (“ASU”) 2009-13, Multiple-Deliverable Revenue Arrangements. ASU 2009-13 amends FASB ASC Subtopic 605-25, Revenue Recognition – Multiple-Element Arrangements, to eliminate the requirement that all undelivered elements have vendor-specific objective evidence (“VSOE”) or third-party evidence (“TPE”) before an entity can recognize the portion of an overall arrangement fee that is attributable to items that already have been delivered. In the absence of VSOE or TPE of the standalone selling price for one or more delivered or undelivered elements in a multiple-element arrangement, entities will be required to estimate the selling prices of those elements. The overall arrangement fee will be allocated to each element (both delivered and undelivered items) based on their relative selling prices, regardless of whether those selling prices are evidenced by VSOE or TPE or are based on the entity’s estimated selling price. Application of the “residual method” of allocating an overall arrangement fee between delivered and undelivered elements will no longer be permitted upon adoption of ASU 2009-13. Additionally, the new guidance will require entities to disclose more information about their multiple-element revenue arrangements. ASU 2009-13 will be effective prospectively for revenue arrangements entered into or materially modified in fiscal years beginning on or after June 15, 2010. The Company is currently assessing the impact of ASU 2009-13 on its consolidated financial statements and disclosures.
| Item 7A. | Quantitative and Qualitative Disclosures About Market Risk. |
We are exposed to market risks primarily related to interest rates. As of December 31, 2009, $627.4 million was outstanding under the first lien term loan. As of December 31, 2009, NTELOS Inc. had a leverage ratio of 2.77:1.00 and an interest coverage ratio of 7.80:1.00, both of which are favorable to any future covenant requirement. This facility bears interest at 3.75% above either the Eurodollar rate or 2.00%, whichever is greater, or 2.75% above either the Federal Funds rate or 3.00%, whichever is greater. We have other fixed rate, long-term debt in the form of capital leases totaling $1.5 million as of December 31, 2009.
In connection with the refinancing in August 2009, we terminated our $600 million interest rate swap agreement. The fixed rate payments due under the swap agreement were calculated at a per annum rate of 2.66%. Our swap counterparty’s variable rate payments were based on three month U.S. Dollar LIBOR. Interest rate differentials paid or received under the swap agreement were recognized for GAAP purposes over the three month maturity periods as adjustments to our interest expense.
65
Table of Contents
We have interest rate risk on borrowings under the first lien term loan and we could be exposed to loss. The August 2009 Credit Facility requires that we enter into a hedge agreement by May 4, 2010 for a minimum notional amount of $320 million to manage our exposure to interest rate movements by converting a portion of our long-term debt from variable to fixed rates.
At December 31, 2009, our financial assets included cash of $51.1 million. Other securities and investments totaled $1.0 million at December 31, 2009.
The following sensitivity analysis indicates the impact at December 31, 2009, on the fair value of certain financial instruments, which are potentially subject to material market risks, assuming a ten percent increase and a ten percent decrease in the levels of our interest rates:
| (In thousands) |
Book Value | Fair Value | Estimated fair value assuming noted decrease in market pricing |
Estimated fair value assuming noted increase in market pricing | ||||||||
| First lien term loan |
$ | 627,444 | $ | 630,993 | $ | 648,706 | $ | 613,843 | ||||
| Capital lease obligations |
1,464 | 1,464 | 1,610 | 1,318 | ||||||||
A ten percent increase or decrease in interest rates would result in a change of $1.3 million in interest expense for 2010, computed using the 2% LIBOR floor stipulated in our senior credit facility. Interest on our senior credit facility is calculated at the higher of LIBOR rate or 2% plus 3.75%. Actual LIBOR rates at December 31, 2009 were well below 2% and thus, a 10% change in the actual LIBOR rate from the rate at December 31, 2009 would result in no change in interest expense in 2010.
66
Table of Contents
| Item 8. | Financial Statements and Supplementary Data. |
NTELOS HOLDINGS CORP.
INDEX TO CONSOLIDATED FINANCIAL STATEMENTS
| Audited Consolidated Financial Statements | Page | |
| NTELOS Holdings Corp. |
||
| 68 | ||
| Consolidated Balance Sheets as of December 31, 2009 and 2008 |
69 | |
| Consolidated Statements of Operations for the years ended December 31, 2009, 2008 and 2007 |
71 | |
| Consolidated Statements of Cash Flows for the years ended December 31, 2009, 2008 and 2007 |
72 | |
| Consolidated Statements of Equity for the years ended December 31, 2009, 2008 and 2007 |
73 | |
| 76 | ||
67
Table of Contents
Report of Independent Registered Public Accounting Firm
The Board of Directors and Stockholders
NTELOS Holdings Corp.:
We have audited the accompanying consolidated balance sheets of NTELOS Holdings Corp. (the Company) as of December 31, 2009 and 2008, and the related consolidated statements of operations, cash flows, and equity for each of the years in the three-year period ended December 31, 2009. These consolidated financial statements are the responsibility of the Company’s management. Our responsibility is to express an opinion on these consolidated financial statements based on our audits.
We conducted our audits in accordance with the standards of the Public Company Accounting Oversight Board (United States). Those standards require that we plan and perform the audit to obtain reasonable assurance about whether the financial statements are free of material misstatement. An audit includes examining, on a test basis, evidence supporting the amounts and disclosures in the financial statements. An audit also includes assessing the accounting principles used and significant estimates made by management, as well as evaluating the overall financial statement presentation. We believe that our audits provide a reasonable basis for our opinion.
In our opinion, the consolidated financial statements referred to above present fairly, in all material respects, the financial position of NTELOS Holdings Corp. as of December 31, 2009 and 2008, and the results of their operations and their cash flows for each of the years in the three-year period ended December 31, 2009, in conformity with U.S. generally accepted accounting principles.
We also have audited, in accordance with the standards of the Public Company Accounting Oversight Board (United States), the Company’s internal control over financial reporting as of December 31, 2009, based on criteria established in Internal Control – Integrated Framework issued by the Committee of Sponsoring Organizations of the Treadway Commission (COSO), and our report dated February 26, 2010 expressed an unqualified opinion on the effectiveness of the Company’s internal control over financial reporting.
/s/ KPMG LLP
Richmond, Virginia
February 26, 2010
68
Table of Contents
NTELOS Holdings Corp.
| (In thousands) |
December 31, 2009 |
December 31, 2008 | ||||
| Assets |
||||||
| Current Assets |
||||||
| Cash |
$ | 51,097 | $ | 65,692 | ||
| Accounts receivable, net of allowance of $18,028 ($14,365 in 2008) |
45,767 | 47,518 | ||||
| Inventories and supplies |
10,870 | 11,107 | ||||
| Other receivables |
1,705 | 2,561 | ||||
| Income tax receivable |
4,368 | 718 | ||||
| Prepaid expenses and other |
10,196 | 8,843 | ||||
| 124,003 | 136,439 | |||||
| Securities and Investments |
1,023 | 762 | ||||
| Property, Plant and Equipment |
||||||
| Land and buildings |
43,331 | 42,589 | ||||
| Network plant and equipment |
622,404 | 567,466 | ||||
| Furniture, fixtures and other equipment |
75,620 | 62,946 | ||||
| Total in service |
741,355 | 673,001 | ||||
| Under construction |
14,008 | 14,550 | ||||
| 755,363 | 687,551 | |||||
| Less accumulated depreciation |
254,388 | 241,078 | ||||
| 500,975 | 446,473 | |||||
| Other Assets |
||||||
| Goodwill |
113,041 | 118,448 | ||||
| Franchise rights |
32,000 | 32,000 | ||||
| Other intangibles, less accumulated amortization of $60,299 ($48,899 in 2008) |
64,360 | 74,151 | ||||
| Radio spectrum licenses in service |
115,449 | 115,449 | ||||
| Radio spectrum licenses not in service |
16,850 | 16,931 | ||||
| Deferred charges and other assets |
12,845 | 3,648 | ||||
| 354,545 | 360,627 | |||||
| $ | 980,546 | $ | 944,301 | |||
See accompanying Notes to Consolidated Financial Statements.
69
Table of Contents
Consolidated Balance Sheets
NTELOS Holdings Corp.
| (In thousands, except par value per share amounts) |
December 31, 2009 |
December 31, 2008 |
||||||
| Liabilities and Equity |
||||||||
| Current Liabilities |
||||||||
| Current portion of long-term debt |
$ | 6,876 | $ | 6,739 | ||||
| Accounts payable |
30,756 | 31,645 | ||||||
| Dividends payable |
11,604 | 10,968 | ||||||
| Advance billings and customer deposits |
20,006 | 19,772 | ||||||
| Accrued compensation |
5,583 | 10,119 | ||||||
| Accrued operating taxes |
3,070 | 3,439 | ||||||
| Other accrued liabilities |
4,832 | 4,077 | ||||||
| 82,727 | 86,759 | |||||||
| Long-term Liabilities |
||||||||
| Long-term debt |
622,032 | 601,173 | ||||||
| Retirement benefits |
41,287 | 55,613 | ||||||
| Deferred income taxes |
35,437 | 1,024 | ||||||
| Interest rate swap |
— | 9,184 | ||||||
| Other long-term liabilities |
22,818 | 21,834 | ||||||
| Income tax payable |
136 | 3,595 | ||||||
| 721,710 | 692,423 | |||||||
| Commitments and Contingencies |
||||||||
| Equity |
||||||||
| Preferred stock, par value $.01 per share, authorized 100 shares, none issued |
— | — | ||||||
| Common stock, par value $.01 per share, authorized 55,000 shares; 42,486 shares issued and 41,431 shares outstanding (42,184 shares issued and outstanding in 2008) |
425 | 422 | ||||||
| Additional paid in capital |
169,887 | 166,210 | ||||||
| Treasury stock, 1,055 shares at cost |
(16,927 | ) | — | |||||
| Retained earnings (Note 3) |
32,129 | 13,449 | ||||||
| Accumulated other comprehensive loss |
(9,004 | ) | (15,438 | ) | ||||
| Total NTELOS Holdings Corp. Stockholders’ Equity |
176,510 | 164,643 | ||||||
| Noncontrolling interests |
(401 | ) | 476 | |||||
| 176,109 | 165,119 | |||||||
| $ | 980,546 | $ | 944,301 | |||||
See accompanying Notes to Consolidated Financial Statements.
70
Table of Contents
Consolidated Statements of Operations
NTELOS Holdings Corp.
| (In thousands, except per share amounts) |
Year Ended December 31, 2009 |
Year Ended December 31, 2008 |
Year Ended December 31, 2007 |
|||||||||
| Operating Revenues |
$ | 549,700 | $ | 535,906 | $ | 500,394 | ||||||
| Operating Expenses |
||||||||||||
| Cost of sales and services (exclusive of items shown separately below) |
176,707 | 172,615 | 161,344 | |||||||||
| Customer operations |
117,916 | 111,115 | 108,848 | |||||||||
| Corporate operations |
32,929 | 32,692 | 32,090 | |||||||||
| Depreciation and amortization |
91,657 | 102,940 | 97,061 | |||||||||
| Accretion of asset retirement obligations |
773 | 989 | 818 | |||||||||
| 419,982 | 420,351 | 400,161 | ||||||||||
| Operating Income |
129,718 | 115,555 | 100,233 | |||||||||
| Other Income (Expenses) |
||||||||||||
| Interest expense |
(29,570 | ) | (32,417 | ) | (43,021 | ) | ||||||
| Gain (loss) on interest rate swap |
2,100 | (9,531 | ) | (3,527 | ) | |||||||
| Other (expense) income, net |
(864 | ) | 1,498 | 3,146 | ||||||||
| (28,334 | ) | (40,450 | ) | (43,402 | ) | |||||||
| 101,384 | 75,105 | 56,831 | ||||||||||
| Income Tax Expense |
37,209 | 30,228 | 24,411 | |||||||||
| Net Income |
64,175 | 44,877 | 32,420 | |||||||||
| Net (Income) Loss Attributable to Noncontrolling Interests |
(890 | ) | (48 | ) | 33 | |||||||
| Net Income Attributable to NTELOS Holdings Corp. |
$ | 63,285 | $ | 44,829 | $ | 32,453 | ||||||
| Basic and Diluted Earnings per Common Share Attributable to NTELOS Holdings Corp. Stockholders: |
||||||||||||
| Income per share – basic |
$ | 1.50 | $ | 1.07 | $ | 0.78 | ||||||
| Income per share – diluted |
$ | 1.50 | $ | 1.06 | $ | 0.77 | ||||||
| Weighted average shares outstanding – basic |
42,061 | 41,980 | 41,487 | |||||||||
| Weighted average shares outstanding – diluted |
42,300 | 42,284 | 42,315 | |||||||||
| Cash Dividends Declared per Share – Common Stock |
$ | 1.06 | $ | 0.89 | $ | 0.51 | ||||||
See accompanying Notes to Consolidated Financial Statements.
71
Table of Contents
Consolidated Statements of Cash Flows
NTELOS Holdings Corp.
| (In thousands) |
Year Ended December 31, 2009 |
Year Ended December 31, 2008 |
Year Ended December 31, 2007 |
|||||||||
| Cash flows from operating activities |
||||||||||||
| Net income attributable to NTELOS Holdings Corp. |
$ | 63,285 | $ | 44,829 | $ | 32,453 | ||||||
| Adjustments to reconcile net income to net cash provided by operating activities: |
||||||||||||
| Depreciation |
80,257 | 91,190 | 83,583 | |||||||||
| Amortization |
11,400 | 11,750 | 13,478 | |||||||||
| Accretion of asset retirement obligations |
773 | 989 | 818 | |||||||||
| Deferred income taxes |
34,169 | 19,193 | 21,779 | |||||||||
| (Gain) loss on interest rate swap instrument |
(2,100 | ) | 9,531 | 3,527 | ||||||||
| Equity-based compensation expense |
3,456 | 2,729 | 4,328 | |||||||||
| Amortization of loan origination costs and debt discount |
1,294 | 378 | 343 | |||||||||
| Write off unamortized debt issuance costs related to first lien term loan |
781 | — | — | |||||||||
| Noncontrolling interests |
890 | 48 | (33 | ) | ||||||||
| Retirement benefits and other |
5,863 | 5,779 | 4,119 | |||||||||
| Changes in assets and liabilities from operations: |
||||||||||||
| Decrease (increase) in accounts receivable |
1,751 | (1,975 | ) | (7,147 | ) | |||||||
| Decrease (increase) in inventories and supplies |
237 | (3,414 | ) | (2,222 | ) | |||||||
| (Increase) decrease in other current assets |
(497 | ) | 724 | (1,867 | ) | |||||||
| Changes in income taxes |
(5,478 | ) | 10,275 | (11,551 | ) | |||||||
| (Decrease) increase in accounts payable |
(1,509 | ) | 120 | 6,316 | ||||||||
| (Decrease) increase in other current liabilities |
(2,037 | ) | (650 | ) | 2,902 | |||||||
| Retirement benefit contributions and distributions |
(9,930 | ) | (6,151 | ) | (6,887 | ) | ||||||
| Net cash provided by operating activities |
182,605 | 185,345 | 143,939 | |||||||||
| Cash flows from investing activities |
||||||||||||
| Purchases of property, plant and equipment |
(107,891 | ) | (132,491 | ) | (109,604 | ) | ||||||
| Acquisition of assets from Allegheny Energy, Inc. |
(26,708 | ) | — | — | ||||||||
| Other |
— | 51 | 7 | |||||||||
| Net cash used in investing activities |
(134,599 | ) | (132,440 | ) | (109,597 | ) | ||||||
| Cash flows from financing activities |
||||||||||||
| Proceeds from issuance of long-term debt, net of original issue discount |
628,650 | — | — | |||||||||
| Debt issuance costs |
(11,538 | ) | — | (930 | ) | |||||||
| Repayments on senior secured term loans |
(608,073 | ) | (6,287 | ) | (12,464 | ) | ||||||
| Termination payment of interest rate swap |
(9,342 | ) | — | — | ||||||||
| Cash dividends paid on common stock |
(43,968 | ) | (35,384 | ) | (12,610 | ) | ||||||
| Repurchase of common stock |
(16,927 | ) | — | — | ||||||||
| Capital distributions to noncontrolling interests |
(1,412 | ) | — | — | ||||||||
| Acquisition of noncontrolling interest in Virginia PCS Alliance, L.C. |
(653 | ) | — | — | ||||||||
| Other |
662 | 991 | 949 | |||||||||
| Net cash used in financing activities |
(62,601 | ) | (40,680 | ) | (25,055 | ) | ||||||
| (Decrease) increase in cash |
(14,595 | ) | 12,225 | 9,287 | ||||||||
| Cash: |
||||||||||||
| Beginning of period |
65,692 | 53,467 | 44,180 | |||||||||
| End of period |
$ | 51,097 | $ | 65,692 | $ | 53,467 | ||||||
See accompanying Notes to Consolidated Financial Statements.
72
Table of Contents
Consolidated Statements of Equity
NTELOS Holdings Corp.
| (In thousands, except per share amounts) |
Common Shares |
Common Stock |
Additional Paid-in Capital |
Retained Earnings (Accumulated Deficit) |
Accumulated Other Comprehensive (Loss) Income |
Total NTELOS Holdings Corp. Stockholders’ Equity |
Noncontrolling Interests |
Total Equity | |||||||||||||||||||
| Balance, December 31, 2006 |
41,965 | $ | 420 | $ | 156,956 | $ | (6,087 | ) | $ | 476 | $ | 151,765 | $ | 457 | $ | 152,222 | |||||||||||
| Adjustment for the adoption of provisions relating to accounting for uncertainty in income taxes included in FASB ASC 740 |
1,680 | 1,680 | 1,680 | ||||||||||||||||||||||||
| Equity-based compensation |
4,328 | 4,328 | 4,328 | ||||||||||||||||||||||||
| Expiration of former Class A common stock repurchase rights |
219 | 219 | 219 | ||||||||||||||||||||||||
| Excess tax deduction related to equity-based compensation recorded for non-qualified stock option exercises |
444 | 444 | 444 | ||||||||||||||||||||||||
| Shares issued through the Employee Stock Purchase Plan and stock options exercised |
98 | 1 | 357 | 358 | 358 | ||||||||||||||||||||||
| Cash dividends declared ($0.51 per share) |
(21,443 | ) | (21,443 | ) | (21,443 | ) | |||||||||||||||||||||
| Comprehensive Income: |
|||||||||||||||||||||||||||
| Net income attributable to NTELOS Holdings Corp. |
32,453 | ||||||||||||||||||||||||||
| Amortization of actuarial loss from a defined benefit plan, net of $36 of deferred income tax benefit |
56 | ||||||||||||||||||||||||||
| Unrecognized gain from defined benefit plans, net of $942 of deferred income taxes |
1,480 | ||||||||||||||||||||||||||
| Comprehensive income attributable to NTELOS Holdings Corp. |
33,989 | ||||||||||||||||||||||||||
| Comprehensive loss attributable to noncontrolling interests |
(29 | ) | |||||||||||||||||||||||||
| Total Comprehensive Income |
33,960 | ||||||||||||||||||||||||||
| Balance, December 31, 2007 |
42,063 | $ | 421 | $ | 162,304 | $ | 6,603 | $ | 2,012 | $ | 171,340 | $ | 428 | $ | 171,768 | ||||||||||||
See accompanying Notes to Consolidated Financial Statements.
73
Table of Contents
Consolidated Statements of Equity
NTELOS Holdings Corp.
Continued
| (In thousands, except per share amounts) |
Common Shares |
Common Stock |
Additional Paid-in Capital |
Retained Earnings (Accumulated Deficit) |
Accumulated Other Comprehensive (Loss) Income |
Total NTELOS Holdings Corp. Stockholders’ Equity |
Noncontrolling Interests |
Total Equity | |||||||||||||||||||
| Balance, December 31, 2007 |
42,063 | $ | 421 | $ | 162,304 | $ | 6,603 | $ | 2,012 | $ | 171,340 | $ | 428 | $ | 171,768 | ||||||||||||
| Effects of changing the retirement plan measurement date pursuant to the provisions included in FASB ASC 715-30-35-62 |
|||||||||||||||||||||||||||
| Net periodic benefit cost for October 1 – December 31, 2007, net of $287 of deferred income taxes |
(464 | ) | 14 | (450 | ) | (450 | ) | ||||||||||||||||||||
| Equity-based compensation |
2,729 | 2,729 | 2,729 | ||||||||||||||||||||||||
| Expiration of former Class A common stock repurchase rights |
181 | 181 | 181 | ||||||||||||||||||||||||
| Excess tax deduction related to equity-based compensation recorded for non-qualified stock option exercises |
439 | 439 | 439 | ||||||||||||||||||||||||
| Restricted shares issued, shares issued through the Employee Stock Purchase Plan and stock options exercised |
121 | 1 | 557 | 558 | 558 | ||||||||||||||||||||||
| Cash dividends declared ($0.89 per share) |
(37,519 | ) | (37,519 | ) | (37,519 | ) | |||||||||||||||||||||
| Comprehensive Income: |
|||||||||||||||||||||||||||
| Net income attributable to NTELOS Holdings Corp. |
44,829 | ||||||||||||||||||||||||||
| Unrecognized loss from defined benefit plans, net of $11,118 of deferred income taxes |
(17,464 | ) | |||||||||||||||||||||||||
| Comprehensive income attributable to NTELOS Holdings Corp. |
27,365 | ||||||||||||||||||||||||||
| Comprehensive income attributable to noncontrolling interests |
48 | ||||||||||||||||||||||||||
| Total Comprehensive Income |
27,413 | ||||||||||||||||||||||||||
| Balance, December 31, 2008 |
42,184 | $ | 422 | $ | 166,210 | $ | 13,449 | $ | (15,438 | ) | $ | 164,643 | $ | 476 | $ | 165,119 | |||||||||||
See accompanying Notes to Consolidated Financial Statements.
74
Table of Contents
Consolidated Statements of Equity
NTELOS Holdings Corp.
Continued
| (In thousands, except per share amounts) |
Common Shares |
Treasury Shares |
Common Stock |
Additional Paid-in Capital |
Treasury Stock |
Retained Earnings |
Accumulated Other Comprehensive Loss |
Total NTELOS Holdings Corp. Stockholders’ Equity |
Noncontrolling Interests |
Total Equity | ||||||||||||||||||||||||||
| Balance, December 31, 2008 |
42,184 | — | $ | 422 | $ | 166,210 | $ | — | $ | 13,449 | $ | (15,438 | ) | $ | 164,643 | $ | 476 | $ | 165,119 | |||||||||||||||||
| Equity-based compensation |
2,671 | 2,671 | 2,671 | |||||||||||||||||||||||||||||||||
| Acquisition of noncontrolling interest in Virginia PCS Alliance, L.C. |
(298 | ) | (298 | ) | (355 | ) | (653 | ) | ||||||||||||||||||||||||||||
| Excess tax deduction related to equity-based compensation recorded for non-qualified stock option exercises |
75 | 75 | 75 | |||||||||||||||||||||||||||||||||
| Restricted shares issued, shares issued through the employee stock purchase plan, shares issued through 401(k) matching contributions and stock options exercised |
302 | 3 | 1,210 | 1,213 | 1,213 | |||||||||||||||||||||||||||||||
| Expiration of former Class A common stock repurchase rights |
19 | 19 | 19 | |||||||||||||||||||||||||||||||||
| Repurchase of common stock |
(1,046 | ) | (16,927 | ) | (16,927 | ) | (16,927 | ) | ||||||||||||||||||||||||||||
| Unvested restricted stock forfeitures |
(9 | ) | — | — | ||||||||||||||||||||||||||||||||
| Cash dividends declared ($1.06 per share) |
(44,605 | ) | (44,605 | ) | (44,605 | ) | ||||||||||||||||||||||||||||||
| Capital distribution to noncontrolling interests |
— | (1,412 | ) | (1,412 | ) | |||||||||||||||||||||||||||||||
| Comprehensive Income: |
||||||||||||||||||||||||||||||||||||
| Net income attributable to NTELOS Holdings Corp. |
63,285 | |||||||||||||||||||||||||||||||||||
| Amortization of unrealized loss from defined benefit plans, net of $497 of deferred income taxes |
781 | |||||||||||||||||||||||||||||||||||
| Unrecognized gain (net) from defined benefit plans, net of $3,589 of deferred income taxes |
5,653 | |||||||||||||||||||||||||||||||||||
| Comprehensive income attributable to NTELOS Holdings Corp. |
69,719 | |||||||||||||||||||||||||||||||||||
| Comprehensive income attributable to noncontrolling interests |
890 | |||||||||||||||||||||||||||||||||||
| Total Comprehensive Income |
70,609 | |||||||||||||||||||||||||||||||||||
| Balance, December 31, 2009 |
42,486 | (1,055 | ) | $ | 425 | $ | 169,887 | $ | (16,927 | ) | $ | 32,129 | $ | (9,004 | ) | $ | 176,510 | $ | (401 | ) | $ | 176,109 | ||||||||||||||
See accompanying Notes to Consolidated Financial Statements.
75
Table of Contents
Notes to Consolidated Financial Statements
NTELOS Holdings Corp.
Note 1. Organization
NTELOS Holdings Corp. (hereafter referred to as “Holdings Corp.” or the “Company”), through NTELOS Inc. and its subsidiaries, is an integrated communications provider that offers a broad range of products and services to businesses, telecommunications carriers and residential customers in Virginia, West Virginia and surrounding states. The Company’s primary services are wireless digital personal communications services (“PCS”), local and long distance telephone services, high capacity transport, data services for Internet access and wide area networking, and IPTV-based video services. Holdings Corp. does not have any independent operations.
Holdings Corp. was formed in January 2005 for the purpose of acquiring NTELOS Inc. On January 18, 2005, Holdings Corp. entered into an agreement with NTELOS Inc. and certain of its shareholders to acquire the common stock of NTELOS Inc. On February 24, 2005, Holdings Corp. purchased 24.9% of NTELOS Inc. common stock and stock warrants. By May 2005, the Company had acquired all of NTELOS Inc.’s common shares, warrants and vested options. During the first quarter of 2006, Holdings Corp. completed an initial public offering (the “IPO”) of 15,375,000 shares of its common stock at a price of $12.00 per share. Quadrangle Capital Partners LLP and certain of its affiliates, collectively “Quadrangle,” a founding member of Holdings Corp., owned approximately 27% of its common shares as of December 31, 2009.
On December 31, 2009, the Company closed on an agreement to purchase certain fiber optic and network assets and related transport and data service contracts from Allegheny Energy, Inc. for approximately $27 million. The purchase includes approximately 2,200 route-miles of fiber principally through Indefeasible Rights to Use (“IRUs”) located primarily in central and western Pennsylvania and West Virginia, with portions also in Maryland, Kentucky and Ohio. These IRUs have a 20 year life. The Company has initially allocated the purchase price as follows: $25.5 million to IRU’s and other equipment, $1.6 million to customer intangible and $0.4 million to current liabilities. The Company estimates the total annual revenue from the transport and data service contracts will be approximately $7 million. The Company believes the purchase price approximates the fair value of the net assets recorded and therefore has not recorded any goodwill or gain on the transaction. The Company will finalize purchase accounting on this transaction in 2010.
Note 2. Significant Accounting Policies
Accounting Estimates
The preparation of consolidated financial statements in conformity with accounting principles generally accepted in the United States of America requires management to make estimates and assumptions that affect the reported amounts of assets and liabilities and disclosure of contingent assets and liabilities at the date of the financial statements and the reported amounts of revenues and expenses during the reporting periods. Actual results could differ from those estimates.
Financial Statement Classification
Certain amounts in the prior year financial statements have been reclassified, with no effect on net income, to conform to current year presentation. On its consolidated balance sheets, the Company reclassified noncontrolling interests to equity in accordance with the transition provisions of FASB ASC 810-65, which the Company adopted on January 1, 2009.
Principles of Consolidation
The consolidated financial statements include the accounts of the Company, NTELOS Inc. and all of its wholly-owned subsidiaries and those limited liability corporations where NTELOS Inc. or certain of its subsidiaries, as managing member, exercises control. All significant intercompany accounts and transactions have been eliminated.
Revenue Recognition
The Company recognizes revenue when services are rendered or when products are delivered, installed and functional, as applicable. Certain services of the Company require payment in advance of service performance. In
76
Table of Contents
Notes to Consolidated Financial Statements—(Continued)
NTELOS Holdings Corp.
such cases, the Company records a service liability at the time of billing and subsequently recognizes revenue ratably over the service period. The Company bills customers certain transactional taxes on service revenues. These transactional taxes are not included in reported revenues as they are recognized as liabilities at the time customers are billed.
The Company earns revenue by providing access to and usage of its networks in both its wireline and wireless divisions. Local service and airtime revenues are recognized as services are provided. Wholesale revenues are earned by providing switched access and other switched and dedicated services, including wireless roamer management, to other carriers. Revenues for equipment sales are recognized at the point of sale. PCS handset equipment sold with service contracts are generally sold at prices below cost, based on the terms of the service contracts. The Company recognizes the entire cost of the handsets at the time of sale.
The Company evaluates related transactions to determine whether they should be viewed as multiple deliverable arrangements, which impact revenue recognition. Multiple deliverable arrangements are presumed to be bundled transactions and the total consideration is measured and allocated to the separate units based on their relative fair value with certain limitations. The Company has determined that sales of handsets with service contracts related to these sales generated from Company owned retail stores are multiple deliverable arrangements. Accordingly, substantially all of the nonrefundable activation fee revenues (as well as the associated direct costs) are recognized at the time the related wireless handset is sold based on the fact that the handsets are generally sold below cost and on the relative fair value evaluation. However, revenue and certain associated direct costs for activations sold at third party retail locations are deferred and amortized over the estimated life of the customer relationship as the Company is not a principal in the transaction to sell the handset and therefore any activation fees charged are fully attributable to the service revenues. Nonrefundable activation fee revenue and certain associated direct costs for transactions in segments other than wireless are deferred as they are not associated with multiple deliverable arrangements but are directly associated with the underlying service being provided over the applicable coverage period. In all cases, the direct activation costs exceed the related activation revenues. When deferral is appropriate, the Company defers these direct activation costs up to but not in excess of the related deferred revenue.
The Company periodically makes claims for recovery of access charges on certain minutes of use terminated by the Company on behalf of other carriers. The Company recognizes revenue in the period that it is able to estimate the amount and when the collection of such amount is considered probable.
Cash and Cash Equivalents
The Company considers its investment in all highly liquid debt instruments with an original maturity of three months or less to be cash equivalents. The Company places its temporary cash investments with high credit quality financial institutions with a maturity date of not greater than 90 days from acquisition and all are investments held by commercial banks. At times, such investments may be in excess of the FDIC insurance limit. The commercial bank that holds significantly all of the Company’s cash at December 31, 2009 has maintained a high rating by Standard & Poor’s and Moody’s. At December 31, 2009 and 2008, the Company did not have any cash equivalents.
The Company’s cash was held in a market rate savings account and non-interest bearing deposit accounts. The total held in the market rate savings account at December 31, 2009 and 2008 was $5.8 million and $64.2 million, respectively. The remaining $45.2 million of cash at December 31, 2009 was held in non-interest bearing deposit accounts which are fully insured by the FDIC. Total interest income related to cash was $0.1 million, $1.6 million and $3.2 million for the years ended December 31, 2009, 2008 and 2007, respectively.
Trade Accounts Receivable
The Company sells its services to residential and commercial end-users and to other communication carriers primarily in Virginia and West Virginia. The Company has credit and collection policies to maximize collection of trade receivables and requires deposits on certain sales. The Company maintains an allowance for doubtful accounts based on historical results, current and expected trends and changes in credit policies. Management believes the allowance adequately covers all anticipated losses with respect to trade receivables. Actual credit losses could differ from such estimates. The Company includes bad debt expense in customer operations expense in the consolidated statements of operations. Bad debt expense for the years ended December 31, 2009, 2008 and 2007 was $13.0 million, $7.8 million and $8.9 million, respectively. The Company’s allowance for doubtful accounts was $18.0 million, $14.4 million and $14.0 million as of December 31, 2009, 2008 and 2007, respectively.
77
Table of Contents
Notes to Consolidated Financial Statements—(Continued)
NTELOS Holdings Corp.
Property, Plant and Equipment and Other Long-Lived Assets
Long-lived assets include property, plant and equipment, radio spectrum licenses, long-term deferred charges, goodwill and intangible assets to be held and used. Long-lived assets, excluding goodwill and intangible assets with indefinite useful lives, are recorded at cost and are reviewed for impairment whenever events or changes in circumstances indicate that the carrying amount should be addressed pursuant to the subsequent measurement guidance described in FASB ASC 360-10-35. Impairment is determined by comparing the carrying value of these long-lived assets to management’s best estimate of future undiscounted cash flows expected to result from the use of the assets. If the carrying value exceeds the estimated undiscounted cash flows, the excess of carrying value over the estimated fair value is recorded as an impairment charge. The Company believes that no impairment indicators exist as of December 31, 2009 that would require it to perform impairment testing.
Depreciation of property, plant and equipment is calculated on a straight-line basis over the estimated useful lives of the assets, which the Company reviews and updates based on historical experiences and future expectations. Buildings are depreciated over a 50-year life and leasehold improvements, which are categorized in land and buildings, are depreciated over the shorter of the estimated useful lives or the remaining lease terms. Network plant and equipment are depreciated over various lives from 3 to 50 years, with a weighted average life of approximately 11 years. Furniture, fixtures and other equipment are depreciated over various lives from 2 to 24 years.
During the year ended December 31, 2009, the Company recorded approximately $4.0 million ($2.4 million net of tax or $0.06 per common share) of accelerated depreciation related to equipment that has been or is scheduled to be replaced or redeployed in connection with the Company’s EV-DO network upgrade pursuant to the terms of the Amended and Restated Resale Agreement with Sprint Spectrum L.P., an indirect wholly-owned subsidiary of Sprint Nextel Corporation (hereinafter collectively referred to as “Sprint”), and based on the Company’s upgrade of a substantial portion of its current service coverage areas outside its wholesale territory which was completed in 2009. During the year ended December 31, 2008, the Company recorded $18.8 million ($11.5 million net of tax or $0.27 per common share) of accelerated depreciation primarily related to this EV-DO network upgrade. The total net book value of the related equipment subject to early retirement was approximately $80 million as of August 1, 2007 (just prior to the commencement of the upgrade project) and is approximately $16.2 million as of December 31, 2009. This remaining legacy equipment will or has been redeployed to low volume areas of the network and the Company anticipates that it will be replaced within the next three years.
In 2009 and 2008, the Company recorded retirements of certain property, plant and equipment, including assets replaced during the Company’s upgrade to EV-DO. The cost basis of the retired assets was $66.8 million for 2009 and $39.5 million for 2008 and the related accumulated depreciation was $64.9 million in 2009 and $38.6 million in 2008. The net book value of these retirements was recorded in depreciation and amortization expense on the Company’s consolidated statement of operations and amounted to $1.9 million for 2009 and $0.9 million for 2008.
Goodwill, franchise rights and radio spectrum licenses are considered indefinite-lived intangible assets. Indefinite-lived intangible assets are not subject to amortization but are instead tested for impairment annually or more frequently if an event indicates that the asset might be impaired. The Company assesses the recoverability of indefinite-lived assets annually on October 1 and whenever adverse events or changes in circumstances indicate that impairment may have occurred.
Based on the Company’s evaluation of fair value of its franchise rights and radio spectrum licenses, which are the Company’s only indefinite-lived intangible assets, no impairment existed as of October 1, 2009. Additionally, the Company tested goodwill for impairment at October 1, 2009 and determined that it was not impaired. Subsequent to October 1, 2009, the Company believes there have been no events or circumstances to cause management to further evaluate the carrying amount of these assets.
78
Table of Contents
Notes to Consolidated Financial Statements—(Continued)
NTELOS Holdings Corp.
The following table presents the activity in goodwill for the years ended December 31, 2009 and 2008.
| (In thousands) |
Year Ended December 31, 2009 |
Year Ended December 31, 2008 |
||||||
| Goodwill, beginning |
$ | 118,448 | $ | 127,637 | ||||
| Adjustment to wireless segment deferred tax liability established in purchase accounting |
(5,407 | ) | — | |||||
| Section 382 deferred tax pre-acquisition adjustment |
— | (9,279 | ) | |||||
| Other valuation adjustment |
— | 90 | ||||||
| Goodwill, ending |
$ | 113,041 | $ | 118,448 | ||||
Intangibles with a finite life are classified as other intangibles on the consolidated balance sheets. At December 31, 2009 and 2008, other intangibles were comprised of the following:
| (Dollars in thousands) |
2009 | 2008 | ||||||||||||
| Estimated Life |
Gross Amount |
Accumulated Amortization |
Gross Amount |
Accumulated Amortization | ||||||||||
| Customer relationships |
3 to 15 yrs. |
$ | 115,009 | $ | 57,291 | $ | 113,400 | $ | 46,535 | |||||
| Trademarks |
14 to 15 yrs. |
9,650 | 3,008 | 9,650 | 2,364 | |||||||||
| Total |
$ | 124,659 | $ | 60,299 | $ | 123,050 | $ | 48,899 | ||||||
The Company attributed $1.6 million of the $27 million asset purchase from Allegheny Energy, Inc. (Note 1) to customer relationships, which is being amortized over a period of five years. The Company amortizes its finite-lived intangible assets using the straight-line method. The Company capitalizes costs incurred to renew or extend the term of a recognized intangible asset and amortizes such costs over the remaining life of the asset. No such costs were incurred during the year ended December 31, 2009 or 2008. Amortization expense for the year ended December 31, 2009, 2008 and 2007 was $11.4 million, $11.8 million and $13.5 million, respectively.
Amortization expense for the next five years is expected to be as follows:
| (In thousands) |
Customer Relationships |
Trademarks | Total | ||||||
| 2010 |
$ | 11,068 | $ | 645 | $ | 11,713 | |||
| 2011 |
11,068 | 645 | 11,713 | ||||||
| 2012 |
10,411 | 645 | 11,056 | ||||||
| 2013 |
10,082 | 645 | 10,727 | ||||||
| 2014 |
$ | 10,082 | $ | 645 | $ | 10,727 | |||
Accounting for Asset Retirement Obligations
An asset retirement obligation is evaluated and recorded as appropriate on assets for which the Company has a legal obligation to retire. The Company records a liability for an asset retirement obligation and the associated asset retirement cost at the time an asset is acquired where a legal obligation to retire the asset exits. Subsequent to the initial measurement of the asset retirement obligation, the obligation is adjusted at the end of each period to reflect the passage of time and changes in the estimated future cash flows underlying the obligation.
The Company enters into long-term leasing arrangements primarily for tower sites and retail store locations in its wireless segment. Additionally, in its wireline operations, the Company enters into various facility co-location agreements and is subject to locality franchise ordinances. In both cases, the Company constructs assets at these locations and, in accordance with the terms of many of these agreements, the Company is obligated to restore the premises to their original condition at the conclusion of the agreements, generally at the demand of the other party to these agreements. The Company recognizes the fair value of a liability for an asset retirement obligation and capitalizes that cost as part of the cost basis of the related asset, depreciating it over the useful life of the related asset.
79
Table of Contents
Notes to Consolidated Financial Statements—(Continued)
NTELOS Holdings Corp.
Included in certain of the franchise ordinances under which the RLECs and CLECs operate are clauses that require the removal of the RLEC’s and CLEC’s equipment at the termination of the franchise agreement. The Company has not recognized an ARO for these liabilities as the removal of the equipment is not estimable due to an indeterminable end date and the fact that the equipment is part of the public switched telephone network and it is not reasonable to assume the jurisdictions would require its removal.
The following table indicates the changes to the Company’s asset retirement obligation liability, which is included in other long-term liabilities:
| (In thousands) |
Year Ended December 31, 2009 |
Year Ended December 31, 2008 | ||||
| Asset retirement obligations, beginning |
$ | 12,817 | $ | 10,948 | ||
| Additional asset retirement obligations recorded, net |
626 | 880 | ||||
| Accretion of asset retirement obligations |
773 | 989 | ||||
| Asset retirement obligations, ending |
$ | 14,216 | $ | 12,817 | ||
Inventories and Supplies
The Company’s inventories and supplies consist primarily of items held for resale such as PCS handsets and accessories, and wireline business phones and accessories. The Company values its inventory at the lower of cost or market. Inventory cost is computed on a currently adjusted standard cost basis (which approximates actual cost on a first-in, first-out basis). Market value is determined by reviewing current replacement cost, marketability and obsolescence.
Deferred Financing Costs
Deferred financing costs are amortized using the effective interest method over a period equal to the term of the related debt instrument.
Advertising Costs
The Company expenses advertising costs and marketing production costs as incurred (included within customer operations expenses in the consolidated statements of operations). Advertising expense for the year ended December 31, 2009, 2008 and 2007 was $14.5 million, $12.6 million and $12.5 million, respectively.
Pension Benefits and Retirement Benefits Other Than Pensions
NTELOS Inc. sponsors a non-contributory defined benefit pension plan (“Pension Plan”) covering all employees who meet eligibility requirements and were employed by NTELOS Inc. prior to October 1, 2003. The Pension Plan was closed to NTELOS Inc. employees hired on or after October 1, 2003. Pension benefits vest after five years of plan service and are based on years of service and an average of the five highest consecutive years of compensation subject to certain reductions if the employee retires before reaching age 65 and elects to receive the benefit prior to age 65.
Sections 412 and 430 of the Internal Revenue Code and ERISA Sections 302 and 303 establish minimum funding requirements for defined benefit pension plans. The minimum required contribution is generally equal to the target normal cost plus the shortfall amortization installments for the current plan year and each of the six preceding plan years less any calculated credit balance. If plan assets (less calculated credits) are equal to or exceed the funding target, the minimum required contribution is the target normal cost reduced by the excess funding, but not below zero. The Company’s policy is to make contributions to stay at or above the threshold required in order to prevent benefit restrictions and related additional notice requirements and is intended to provide not only for benefits based on service to date, but also for those expected to be earned in the future. Also, NTELOS Inc. has nonqualified pension plans that are accounted for similar to its Pension Plan.
NTELOS Inc. provides certain health care and life benefits for retired employees that meet eligibility requirements. The Company has two qualified nonpension postretirement benefit plans. The health care plan is contributory, with participants’ contributions adjusted annually. The life insurance plan is also contributory. These obligations, along with all of the pension plans and other post retirement benefit plans, are NTELOS Inc. obligations assumed by the Company. Eligibility for the life insurance plan is restricted to active pension participants age 50-64 as of January 5, 1994. Neither plan is eligible to employees hired after April 1993. The accounting for the plans anticipates that the
80
Table of Contents
Notes to Consolidated Financial Statements—(Continued)
NTELOS Holdings Corp.
Company will maintain a consistent level of cost sharing for the benefits with the retirees. The Company’s share of the projected costs of benefits that will be paid after retirement is generally being accrued by charges to expense over the eligible employees’ service periods to the dates they are fully eligible for benefits.
NTELOS Inc. also sponsors a contributory defined contribution plan under Internal Revenue Code Section 401(k) for substantially all employees. The Company’s policy is to match 100% of each participant’s annual contributions for contributions up to 1% of each participant’s annual compensation and 50% of each participant’s annual contributions up to an additional 5% of each participant’s annual compensation. Company contributions vest after two years of service. Effective June 1, 2009, the Company began funding its 401(k) matching contributions in shares of the Company’s common stock. For the year ended December 31, 2009, equity-based compensation expense of $0.8 million has been recorded for these matching contributions, with an offsetting increase to additional paid-in capital on the consolidated balance sheet.
Operating Leases
The Company has operating leases for administrative office space, retail space, tower space, and equipment, certain of which have renewal options. The leases for retail and tower space have initial lease periods of one to thirty years. These leases are associated with the operation of wireless digital PCS services primarily in Virginia and West Virginia. These leases, with few exceptions, provide for automatic renewal options and escalations that are either fixed or based on the consumer price index. Any rent abatements, along with rent escalations, are included in the computation of rent expense calculated on a straight-line basis over the lease term. The Company’s minimum lease term for most leases includes the initial non-cancelable term plus at least one renewal period, as the exercise of the related renewal option or options is reasonably assured. The Company’s cell site leases generally provide for an initial non-cancelable term of 5 to 7 years with up to 5 renewal options of 5 years each. Leasehold improvements are depreciated over the shorter of the assets’ useful life or the lease term, including renewal option periods that are reasonably assured.
Income Taxes
Deferred income taxes are provided on an asset and liability method whereby deferred tax assets are recognized for deductible temporary differences and deferred tax liabilities are recognized for taxable temporary differences. Temporary differences are the differences between the reported amounts of assets and liabilities and their tax bases. Deferred tax assets and liabilities are adjusted for the effects of changes in tax laws and rates on the date of enactment. The Company accrues interest and penalties related to unrecognized tax benefits in interest expense and income tax expense, respectively.
Share-based Compensation
The Company accounts for share-based employee compensation plans under FASB ASC 718, Stock Compensation. Equity-based compensation expense from share-based equity awards is recorded with an offsetting increase to additional paid-in capital on the consolidated balance sheet. For equity awards with only service conditions, the Company recognizes compensation cost on a straight-line basis over the requisite service period for the entire award.
The fair value of the common stock options granted in 2009, 2008 and 2007 were estimated at the respective measurement date using the Black-Scholes option-pricing model with assumptions related to risk-free interest rate, expected volatility, dividend yield and expected terms (Note 9).
81
Table of Contents
Notes to Consolidated Financial Statements—(Continued)
NTELOS Holdings Corp.
Total equity-based compensation expense related to all of the Company’s share-based awards for the years ended December 31, 2009, 2008 and 2007 (Note 9) and the Company’s 401(k) matching contributions for 2009 was allocated as follows:
| (In thousands) |
Year Ended December 31, 2009 |
Year Ended December 31, 2008 |
Year Ended December 31, 2007 | ||||||
| Cost of sales and services |
$ | 455 | $ | 277 | $ | 403 | |||
| Customer operations |
714 | 458 | 603 | ||||||
| Corporate operations |
2,287 | 1,994 | 3,322 | ||||||
| Equity-based compensation expense |
$ | 3,456 | $ | 2,729 | $ | 4,328 | |||
Future charges for equity-based compensation related to instruments outstanding at December 31, 2009 for the years 2010 through 2013 are estimated to be $2.7 million, $2.1 million, $1.3 million, and $0.3 million, respectively.
Fair Value Of Financial Instruments
Cash, accounts receivable, accounts payable and accrued liabilities are reflected in the consolidated financial statements at cost which approximates fair value because of the short-term maturity of these instruments. The fair values of other financial instruments are based on quoted market prices or discounted cash flows based on current market conditions.
Derivatives and Hedging Activities
In 2008, the Company adopted the fair value measurement guidance provided in FASB ASC 820. This standard defines fair value, establishes a framework for the measurement of fair value, and enhances disclosures about fair value measurements. The effect of adoption was not significant. The Company accounted for its interest rate swap instrument outstanding on December 31, 2008 under the provisions of FASB ASC 815, which requires that this instrument be recorded at fair value on its consolidated balance sheets, and follows the disclosure requirements set forth in FASB ASC 815. The fair value of the instrument was based on a value quoted from the counterparty to the instrument. The Company corroborated this valuation using the net present value of future cash flows method based on a three-month LIBOR forward curve and considered credit worthiness of the counterparty in assessing fair value. The Company’s valuation techniques for this instrument are considered to be level two fair value measurements within the fair value hierarchy described in FASB ASC 820. The Company recorded the derivative as either an asset or liability on the Company’s consolidated balance sheet. Changes in the fair values of derivative instruments were recognized in earnings (Note 7).
Treasury Stock
On August 24, 2009, the Company’s board of directors authorized management to repurchase up to $40 million of the Company’s common stock (Note 8). Shares of common stock repurchased by the Company are recorded at cost as treasury stock and result in a reduction of stockholders’ equity. The Company may reissue treasury shares as part of its shareholder approved stock-based compensation programs.
Subsequent Events
The Company has evaluated subsequent events through the time these financial statements were issued on February 26, 2010.
Note 3. Correction of Immaterial Error
Subsequent to the Company’s filing of its Annual Report on Form 10-K for the year ended December 31, 2008, the Company discovered that a portion of network usage by Sprint customers under the Company’s Strategic Network Alliance agreement had been incorrectly classified in the Company’s billing process. The Company assessed the materiality in accordance with Staff Accounting Bulletin No. 108 (“SAB 108”) and determined that the error was immaterial to previously reported amounts contained in its periodic reports and, accordingly, the Company would correct this error through a revision to the applicable prior year amounts in subsequent periodic filings.
82
Table of Contents
Notes to Consolidated Financial Statements—(Continued)
NTELOS Holdings Corp.
The effect of recording this immaterial correction in the consolidated statement of operations for the year ended December 31, 2008 was a reduction to wireless wholesale revenue of $3.9 million ($2.4 million net of tax and $0.05 per share). The effect of recording this immaterial correction in the consolidated balance sheet at December 31, 2008 is included in the following table. The Company and Sprint Nextel executed a settlement and release agreement in first quarter 2010 finalizing this matter.
| (In thousands) |
As of December 31, 2008 | |||||
| As Reported | As Revised | |||||
| Accounts receivable(1) |
$ | 51,448 | $ | 47,518 | ||
| Deferred tax liability |
2,580 | 1,024 | ||||
| Retained earnings |
15,823 | 13,449 | ||||
| Total equity |
$ | 167,493 | $ | 165,119 | ||
| (1) | The accounts receivable balance as of December 31, 2008 has been adjusted to reflect an increase of $0.2 million, with no effect on net income, to conform to current year presentation (Note 2). |
Note 4. Disclosures About Segments of an Enterprise and Related Information
The Company manages its business with separate products and services into three segments as described below.
Wireless PCS: The Company’s wireless PCS business carries digital phones and services, marketed in retail stores, inside sales representatives, on our website and business-to-business channels throughout much of Virginia and West Virginia. The Company’s wireless PCS segment operates in three primary markets: Virginia East, Virginia West and West Virginia. The Virginia East market covers a populated area of 3.6 million people primarily in the Richmond and Hampton Roads areas of Virginia through Richmond 20MHz, LLC, a wholly owned subsidiary. The Virginia West market currently serves a populated area of 2.4 million people in central and western Virginia primarily through the Virginia PCS Alliance, L.C. (“VA Alliance”), a 97% majority owned Limited Liability Company. The West Virginia market is served by West Virginia PCS Alliance, L.C. (“WV Alliance”), a wholly owned Limited Liability Company, and currently covers a populated area of 1.8 million people primarily in West Virginia, but extending to parts of eastern Kentucky, southwestern Virginia and eastern Ohio. In addition to the markets indicated above, the Company has licenses, which are not currently active, that cover a populated area of approximately 1.2 million people.
In addition to the end-user customer business, the Company provides roaming services to other PCS providers and has a Strategic Network Alliance with Sprint Nextel, which West Virginia PCS Alliance, L.C., Virginia PCS Alliance, L.C. and NTELOS Inc. entered into in June 2004 and which was amended in July 2007. Revenue from this wholesale service agreement for the year ended December 31, 2009, 2008 and 2007 was $112.8 million, $103.6 million and $94.8 million, respectively.
RLEC: The Company has two RLEC businesses subject to the regulations of the State Corporation Commission of Virginia. These businesses serve several areas in western Virginia, are fully integrated and are managed as one consolidated operation. Our primary services are voice services and broadband Internet access. In addition, approximately 8,200 homes in our RLEC service area have fiber to the home and have access to IPTV-based video services and broadband Internet access with speeds up to 20Mbps. Revenues and operating expenses related to video and broadband Internet are reported in the Competitive Wireline segment.
Competitive Wireline: In addition to the RLEC services, the Company directly or indirectly owns approximately 4,700 route-miles of fiber optic network which it utilizes to provide high capacity transport, data services and broadband Internet access. As discussed in Note 1, the Company significantly expanded its network through the acquisition of approximately 2,200 miles of fiber from Allegheny Energy, Inc. on December 31, 2009. The Competitive Wireline segment offers services in 30 geographic markets as well as transport services to retail and carrier customers across the network that reaches portions of Virginia, West Virginia, southwestern Pennsylvania, Maryland, and Ohio. The Competitive Wireline segment focuses on providing “on-net” fiber-based services, including integrated voice and data service, Metro Ethernet, dedicated high speed Internet access and carrier transport services. To further extend the reach, the Company’s network is connected to the Valley Network Partnership, a partnership of three nonaffiliated communications companies that have interconnected their networks
83
Table of Contents
Notes to Consolidated Financial Statements—(Continued)
NTELOS Holdings Corp.
reaching a ten-state mid-Atlantic region, stretching from Pennsylvania to Florida. As noted in the RLEC section above, revenue and operating expenses from services sold in the RLEC service areas that relate to unregulated services, such as integrated access, DSL, broadband over fiber and video, are reported in the Competitive Wireline segment.
The Company refers to its paging and communications services operations, neither of which are considered separate reportable segments, and unallocated corporate related items that do not provide direct benefit to the operating segments as Other Communications Services (“Other”). Total unallocated corporate operating expenses for the years ended December 31, 2009, 2008 and 2007 were $6.0 million, $5.1 million and $4.5 million, respectively. Additionally, the “Other” segment included equity-based compensation of $2.8 million, $2.7 million and $4.3 million for the years ended December 31, 2009, 2008 and 2007, respectively, related to equity awards for all employees receiving such awards and 2009 401(k) matching contributions for Other segment employees. The Company also incurred and did not allocate $0.6 million of secondary offering costs in 2007.
Operating expenses which provide a direct benefit to the operating segments is allocated based on estimations of the relative benefit or based on the relative size of a segment to the total of the three segments. Total corporate expenses (excluding depreciation expense) allocated to the segments were $22.3 million, $24.8 million and $25.5 million for the year ended December 31, 2009, 2008 and 2007, respectively. Additionally, depreciation expense related to corporate assets is allocated to the operating segments and was $7.9 million, $6.0 million and $4.2 million for the year ended December 31, 2009, 2008 and 2007, respectively.
Revenues from Sprint Nextel accounted for 22.4%, 21.5% and 21.6% of the Company’s total revenue for the year ended December 31, 2009, 2008 and 2007, respectively. Revenue from Sprint Nextel was derived from a wireless PCS wholesale contract and RLEC and Competitive Wireline segments’ network access.
Summarized financial information concerning the Company’s reportable segments is shown in the following table.
| (In thousands) |
Wireless PCS |
RLEC | Competitive Wireline |
Other | Eliminations | Total | ||||||||||||||
| As of and for the year ended December 31, 2009 | ||||||||||||||||||||
| Operating revenues |
$ | 424,678 | $ | 57,304 | $ | 67,237 | $ | 481 | $ | — | $ | 549,700 | ||||||||
| Intersegment revenues(1) |
272 | 6,420 | 4,686 | 25 | (11,403 | ) | — | |||||||||||||
| Operating income (loss) |
96,464 | 27,694 | 14,944 | (9,384 | ) | — | 129,718 | |||||||||||||
| Depreciation and amortization |
62,906 | 14,940 | 13,654 | 157 | — | 91,657 | ||||||||||||||
| Accretion of asset retirement obligations |
704 | 20 | 58 | (9 | ) | — | 773 | |||||||||||||
| Equity-based compensation charges |
387 | 188 | 36 | 2,845 | — | 3,456 | ||||||||||||||
| Voluntary early retirement and workforce reduction plans (2) |
1,331 | 59 | — | 146 | — | 1,536 | ||||||||||||||
| Capital expenditures |
50,747 | 11,316 | 26,023 | 19,805 | — | 107,891 | ||||||||||||||
| Acquisition of assets from Allegheny Energy, Inc. |
— | — | 26,708 | — | — | 26,708 | ||||||||||||||
| Goodwill |
63,700 | 33,438 | 15,903 | — | — | 113,041 | ||||||||||||||
| Total segment assets |
$ | 518,961 | $ | 189,844 | $ | 153,358 | $ | 1,116 | $ | — | $ | 863,279 | ||||||||
| Corporate assets |
117,267 | |||||||||||||||||||
| Total assets |
$ | 980,546 | ||||||||||||||||||
| (1) | Intersegment revenues consist primarily of telecommunications services such as local exchange services, inter-city and local transport of voice and data traffic, and leasing of various network elements. Intersegment revenues are primarily recorded at tariff and prevailing market rates. |
84
Table of Contents
Notes to Consolidated Financial Statements—(Continued)
NTELOS Holdings Corp.
| (2) | In the fourth quarter of 2009, the Company recorded charges of $1.5 million related to a workforce reduction, comprised primarily of $1.2 million of severance costs and $0.3 million of pension expense related to costs associated with a voluntary early retirement plan accepted by certain employees of the wireless segment. These charges are in included in corporate operations expense on the consolidated statement of operations. |
| (In thousands) |
Wireless PCS |
RLEC | Competitive Wireline |
Other | Eliminations | Total | ||||||||||||||
| As of and for the year ended December 31, 2008 |
||||||||||||||||||||
| Operating revenues |
$ | 411,951 | $ | 59,518 | $ | 63,878 | $ | 559 | $ | — | $ | 535,906 | ||||||||
| Intersegment revenues(1) |
226 | 6,297 | 4,384 | 34 | (10,941 | ) | — | |||||||||||||
| Operating income (loss) |
84,756 | 28,661 | 12,402 | (10,264 | ) | — | 115,555 | |||||||||||||
| Depreciation and amortization(2) |
73,780 | 14,449 | 12,468 | 2,243 | — | 102,940 | ||||||||||||||
| Accretion of asset retirement obligations |
916 | 18 | 57 | (2 | ) | — | 989 | |||||||||||||
| Equity-based compensation charges |
— | — | — | 2,729 | — | 2,729 | ||||||||||||||
| Voluntary early retirement plan charges (3) |
— | 597 | 384 | — | — | 981 | ||||||||||||||
| Capital expenditures |
88,357 | 13,384 | 21,745 | 9,005 | — | 132,491 | ||||||||||||||
| Goodwill |
69,107 | 33,438 | 15,903 | — | — | 118,448 | ||||||||||||||
| Total segment assets |
$ | 531,873 | $ | 193,117 | $ | 111,683 | $ | 1,083 | $ | — | $ | 837,756 | ||||||||
| Corporate assets |
106,545 | |||||||||||||||||||
| Total assets |
$ | 944,301 | ||||||||||||||||||
| (In thousands) |
Wireless PCS |
RLEC | Competitive Wireline |
Other | Eliminations | Total | ||||||||||||||
| For the year ended December 31, 2007 |
||||||||||||||||||||
| Operating revenues |
$ | 377,761 | $ | 61,458 | $ | 60,467 | $ | 708 | $ | — | $ | 500,394 | ||||||||
| Intersegment revenues(1) |
188 | 5,685 | 3,617 | 42 | (9,532 | ) | — | |||||||||||||
| Operating income (loss) |
71,398 | 30,249 | 8,097 | (9,511 | ) | — | 100,233 | |||||||||||||
| Depreciation and amortization |
70,052 | 14,160 | 12,754 | 95 | — | 97,061 | ||||||||||||||
| Accretion of asset retirement obligations |
736 | 16 | 55 | 11 | — | 818 | ||||||||||||||
| Equity-based compensation charges |
— | — | — | 4,328 | — | 4,328 | ||||||||||||||
| Secondary offering costs |
— | — | — | 570 | — | 570 | ||||||||||||||
| Capital expenditures |
$ | 77,640 | $ | 9,318 | $ | 15,314 | $ | 7,332 | $ | — | $ | 109,604 | ||||||||
| (1) | Intersegment revenues consist primarily of telecommunications services such as local exchange services, inter-city and local transport of voice and data traffic, and leasing of various network elements. Intersegment revenues are primarily recorded at tariff and prevailing market rates. |
| (2) | Depreciation and amortization for the other segment for the year ended December 31, 2008 contains a $1.4 million impairment charge relating to radio spectrum licenses not in service. |
| (3) | In the second quarter of 2008, the Company recorded $1.0 million of voluntary early retirement charges, comprised primarily of $0.9 million of pension expense related to a pension enhancement pursuant to the voluntary early retirement plan accepted by certain employees of the wireline segments. These charges are in included in corporate operations expense on the consolidated statement of operations. |
85
Table of Contents
Notes to Consolidated Financial Statements—(Continued)
NTELOS Holdings Corp.
Note 5. Long-Term Debt
As of December 31, 2009 and 2008, the Company’s outstanding long-term debt consisted of the following:
| (In thousands) |
December 31, 2009 |
December 31, 2008 | ||||
| First lien term loan |
$ | 627,444 | $ | 606,486 | ||
| Capital lease obligations |
1,464 | 1,426 | ||||
| 628,908 | 607,912 | |||||
| Less: current portion of long-term debt |
6,876 | 6,739 | ||||
| Long-term debt |
$ | 622,032 | $ | 601,173 | ||
Long-term debt, excluding capital lease obligations
On August 7, 2009, the Company refinanced the existing first lien term loan with $670 million of new senior secured credit facilities comprised of a $35 million revolving credit facility and a $635 million term loan. The first lien term loan was issued at a 1% discount for net proceeds of $628.7 million. The Company used the net proceeds to repay its outstanding $603.3 million first lien term loan, to pay closing costs of approximately $12.0 million and to pay $9.3 million to terminate its interest rate swap agreement. The remaining $4.0 million is available for general corporate uses. The new first lien term loan matures in August 2015 with quarterly payments of $1.6 million and the remainder due at maturity. The first lien term loan bears interest at 3.75% above either the Eurodollar rate or 2.0%, whichever is greater. The first lien term loan also includes various restrictions and conditions including covenants relating to leverage and interest coverage ratio requirements. At December 31, 2009, NTELOS Inc.’s leverage ratio (as defined under the credit agreement) was 2.77:1.00 and its interest coverage ratio (as defined) was 7.80:1.00. The credit agreement requires that the leverage ratio not exceed 4.00:1.00 and that the interest coverage ratio not be less than 3.00:1.00. The new $35 million revolving credit facility, which expires in 2014, remains undrawn.
The new senior secured credit facilities are secured by a first priority pledge of substantially all property and assets of NTELOS Inc. and all material subsidiaries, as guarantors, excluding the RLECs. The First Lien Term Loan includes various restrictions and conditions including covenants relating to leverage and interest coverage ratio requirements.
The first lien term loan has a restricted payment basket which can be used to make certain restricted payments, as defined under the credit agreement, including the ability to pay dividends, repurchase stock or advance funds to the Company. Under the new credit agreement, the restricted payment basket was initially set at $50.0 million and was $33.1 million as of December 31, 2009. The restricted payment basket is increased by $10.0 million on the first day of each quarter plus an additional quarterly amount for calculated excess cash flow based on the definition in the credit agreement, and is decreased by any actual restricted payments, including dividend payments and stock repurchases. Because of the acquisition of assets from Allegheny Energy Inc. for approximately $27 million (see Note 1), which is included as a reduction in the excess cash calculation, there was no excess cash addition to the restricted payment basket for the quarter ended December 31, 2009.
The previous first lien term loan was scheduled to mature in August 2011, with quarterly balloon principal payments commencing on December 31, 2010, and bore interest at 2.25% above the Eurodollar rate.
In connection with the refinancing of the first lien term loan described above, the Company deferred issuance costs of approximately $11.5 million which are being amortized to interest expense over the life of the debt using the effective interest method. Amortization of these costs during the period August 7, 2009 through December 31, 2009 was $0.7 million. In association with the refinancing, the Company also wrote off $0.8 million of unamortized deferred issuance costs relating to the previous first lien term loan that are included in other expense on the consolidated statement of operations.
The first lien term loan was recorded net of a 1% discount ($6.4 million) of the debt issuance. The discount is being accreted to interest expense using the effective interest method over the life of the debt and is reflected in interest expense in the consolidated statement of operations. Accretion for the period August 7, 2009 through December 31, 2009 was $0.4 million.
86
Table of Contents
Notes to Consolidated Financial Statements—(Continued)
NTELOS Holdings Corp.
The aggregate maturities of long-term debt outstanding at December 31, 2009, excluding capital lease obligations, based on the contractual terms of the instruments are $6.4 million per year in 2010 through 2014 and $601.7 million in 2015.
The Company’s blended average interest rate on its long-term debt as of December 31, 2009 and 2008 was approximately 4.8% and 5.4%, respectively.
Capital lease obligations
In addition to the long-term debt discussed above, the Company has entered into capital leases on vehicles used in its operations with lease terms of four to five years. At December 31, 2009, the carrying value and accumulated depreciation of these assets was $3.4 million and $1.6 million, respectively, and the net present value of these future minimum lease payments is $1.5 million. As of December 31, 2009, the principal portion of these obligations are due as follows: $0.5 million in 2010, $0.4 million in 2011, $0.3 million in 2012, $0.2 million in 2013 and less than $0.1 million thereafter.
Note 6. Supplementary Disclosures of Cash Flow Information
The following information is presented as supplementary disclosures for the consolidated statements of cash flows for the periods indicated below.
| (In thousands) |
Year Ended December 31, 2009 |
Year Ended December 31, 2008 |
Year Ended December 31, 2007 | ||||||
| Cash payments for: |
|||||||||
| Interest (net of amounts capitalized) |
$ | 29,255 | $ | 32,241 | $ | 42,982 | |||
| Income taxes |
8,040 | 11,389 | 14,385 | ||||||
| Cash received from income tax refunds |
3 | 10,358 | — | ||||||
| Supplemental financing activities: |
|||||||||
| Dividend declared not paid |
$ | 11,604 | $ | 10,968 | $ | 8,833 | |||
Interest payments in the above table are net of $5.1 million interest paid and $0.6 million and $3.9 million net interest received on the interest rate swap agreements for the year ended December 31, 2009, 2008 and 2007, respectively. The amount of interest capitalized in the years ending December 31, 2009, 2008 and 2007 was $0.3 million, $0.7 million and $0.6 million, respectively.
Note 7. Financial Instruments
The Company is exposed to market risks with respect to certain of the financial instruments that it holds. The following is a summary by balance sheet category:
Cash
The carrying amount approximates fair value because of the short-term maturity of those instruments.
Long-Term Investments
At December 31, 2009 and 2008, the Company had an investment in CoBank, ACB (“CoBank”) of $0.9 million and $0.6 million, respectively, and miscellaneous other investments. All of the investments are carried under the cost method at December 31, 2009 and 2008.
Interest Rate Swaps
The August 2009 Credit Facility requires that the Company enter into a hedge agreement by May 4, 2010 for a minimum notional amount of $320 million to manage its exposure to interest rate movements by converting a portion of its long-term debt from variable to fixed rates.
In connection with the aforementioned refinancing, the Company paid $9.3 million, inclusive of $2.3 million of accrued unpaid interest, to terminate its interest rate swap agreement which otherwise would have matured on March 1, 2010. The payment was based on the current market value. The interest rate swap had a notional amount of $600 million with fixed interest rate payments at a per annum rate of 2.66% and variable rate payments based on the three-month U.S. Dollar LIBOR.
87
Table of Contents
Notes to Consolidated Financial Statements—(Continued)
NTELOS Holdings Corp.
NTELOS Inc. was also a party to an interest rate swap agreement that ended in February 2008 with a notional amount of $312.5 million. Fixed interest rate payments were at a per annum rate of 4.1066% and variable rate payments were based on three-month U.S. Dollar LIBOR.
The Company did not designate either of these swap agreements as cash flow hedges for accounting purposes and, therefore, recorded the changes in market value of the swap agreements as gain or loss on interest rate swap instrument for the applicable periods.
The following table indicates the difference between face amount, carrying amount and fair value of the Company’s financial instruments at December 31, 2009 and 2008.
| Financial Instruments (In thousands) |
Face Amount |
Carrying Amount |
Fair Value |
|||||||||
| December 31, 2009 |
||||||||||||
| Nonderivatives: |
||||||||||||
| Financial assets: |
||||||||||||
| Cash |
$ | 51,097 | $ | 51,097 | $ | 51,097 | ||||||
| Long-term investments for which it is not practicable to estimate fair value |
N/A | 1,023 | 1,023 | |||||||||
| Financial liabilities: |
||||||||||||
| Senior credit facility |
633,413 | 627,444 | 630,993 | |||||||||
| Capital lease obligations |
$ | 1,464 | $ | 1,464 | $ | 1,464 | ||||||
| December 31, 2008 |
||||||||||||
| Nonderivatives: |
||||||||||||
| Financial assets: |
||||||||||||
| Cash |
$ | 65,692 | $ | 65,692 | $ | 65,692 | ||||||
| Long-term investments for which it is not practicable to estimate fair value |
N/A | 762 | 762 | |||||||||
| Financial liabilities: |
||||||||||||
| Senior credit facility |
606,486 | 606,486 | 507,428 | |||||||||
| Capital lease obligations |
1,426 | 1,426 | 1,426 | |||||||||
| Derivatives relating to debt: |
||||||||||||
| Interest rate swaps – liability |
$ | 600,000 | * | $ | (9,184 | ) | $ | (9,184 | ) | |||
| * | Notional amount |
Of the long-term investments for which it is not practicable to estimate fair value in the table above, $0.9 million and $0.6 million as of December 31, 2009 and 2008, respectively, represent the Company’s investment in CoBank. This investment is primarily related to patronage distributions of restricted equity and is a required investment related to the portion of the first lien term loan held by CoBank. This investment is carried under the cost method.
The fair value of the senior credit facility was derived based on quoted trading price obtained from the administrative agent at December 31, 2009 and 2008 as applicable. The fair value of the derivative instrument was based on a value quoted from the counterparty to the instrument. The Company’s valuation technique for these instruments is considered to be level two fair value measurements within the fair value hierarchy described in FASB ASC 820.
Note 8. Stockholders’ Equity
On February 25, 2010, the Company’s board of directors declared a quarterly dividend on its common stock in the amount of $0.28 per share, which is to be paid on April 12, 2010 to stockholders of record on March 12, 2010.
88
Table of Contents
Notes to Consolidated Financial Statements—(Continued)
NTELOS Holdings Corp.
On August 24, 2009, the Board of Directors authorized management to repurchase up to $40 million of the Company’s common stock. The Company may conduct its purchases in the open market, in privately negotiated transactions, through derivative transactions or through purchases made in accordance with Rule 10b5-1 under the Securities Exchange Act of 1934. The share repurchase program does not require the Company to acquire any specific number of shares and may be terminated at any time. During 2009, the Company repurchased 1,046,467 of its common shares for a total of $16.9 million at an average cost of $16.14 per share.
The computations of basic and diluted earnings per share for the years ended December 31, 2009, 2008 and 2007 are as follows:
| (In thousands) |
2009 | 2008 | 2007 | |||||||||
| Numerator: |
||||||||||||
| Income (loss) applicable to common shares for earnings-per-share computation |
$ | 63,285 | $ | 44,829 | $ | 32,453 | ||||||
| Denominator: |
||||||||||||
| Total shares outstanding |
41,431 | 42,184 | 42,063 | |||||||||
| Less: unvested shares |
(158 | ) | (34 | ) | (394 | ) | ||||||
| Plus (less): effect of calculating weighted average shares |
788 | (170 | ) | (182 | ) | |||||||
| Denominator for basic earnings per common share - weighted average shares outstanding |
42,061 | 41,980 | 41,487 | |||||||||
| Plus: weighted average unvested shares |
158 | 156 | 527 | |||||||||
| Plus: common stock equivalents of stock options exercised |
66 | 148 | 301 | |||||||||
| Plus: contingently issuable shares |
15 | — | — | |||||||||
| Denominator for diluted earnings per common share – weighted average shares outstanding |
42,300 | 42,284 | 42,315 | |||||||||
Note 9. Stock Plans
The Company has an Equity Incentive Plan administered by the Compensation Committee of the Company’s board of directors, which permits the grant of long-term incentives to employees, including stock options, stock appreciation rights, restricted stock awards, restricted stock units and incentive awards. The maximum number of shares of common stock available for awards under the Equity Incentive Plan is 4,050,000. The Company also has a non-employee director equity plan (the “Non-Employee Director Equity Plan”). The total number of shares of common stock available for grant under the Non-Employee Director Equity Plan is 400,000. These two plans are together referred to as the “Equity Incentive Plans.” Awards under these plans are issuable to employees or non-employee directors as applicable.
During the year ended December 31, 2009, the Company issued 797,897 stock options under the Equity Incentive Plan and 43,000 stock options under the Non-Employee Director Equity Plan. The options issued under the Equity Incentive Plan vest one-fourth annually beginning one year after the grant date and the options issued under the Non-Employee Director Equity Plan vest quarterly over the year immediately following the grant date. No options expired during the period. Additionally, during the year ended December 31, 2009, the Company issued 218,495 shares of restricted stock under the Equity Incentive Plan, primarily to officers. These restricted shares vest over one, two or three years, or cliff vest after three years. Dividend rights applicable to restricted stock are equivalent to the Company’s common stock.
Stock options must be granted under the Equity Incentive Plans at not less than 100% of fair value on the date of grant and have a maximum life of ten years from the date of grant. Options and other awards under the Equity Incentive Plans may be exercised in compliance with such requirements as determined by a committee of the board of directors. All options outstanding were issued at a strike price equal to or greater than the fair value on the date of grant.
89
Table of Contents
Notes to Consolidated Financial Statements—(Continued)
NTELOS Holdings Corp.
Effective in 2010, upon the exercise of stock options or upon the grant of restricted stock under the Equity Incentive Plans, shares are expected to be issued from the treasury stock balance, if any. If no treasury shares are available for issuance, new common shares are expected to be issued.
The fair value of each option award is estimated on the grant date using the Black-Scholes option-pricing model and the assumptions noted in the following table. The risk-free rate is based on the zero-coupon U.S. Treasury rate in effect at the time of grant, with a term equal to the expected life of the options. The Company uses its post-February 2006 initial public offering volatility to estimate volatility assumptions for each year. The expected option life represents the period of time that the options granted are expected to be outstanding and is also based on historical experience. The expected dividend yield is estimated based on the Company’s historical and expected dividend yields at the date of the grant.
| 2009 | 2008 | 2007 | ||||
| Risk-free interest rate |
2.4% to 3.5% | 3.3% to 3.8% | 4.1% to 4.7% | |||
| Expected volatility |
42.2% to 43.4% | 31.2% to 34.4% | 31.1% to 33.2% | |||
| Weighted-average expected volatility |
42.4% | 34.0% | 32.3% | |||
| Expected dividend yield |
4.2% to 6.4% | 2.9% to 4.9% | 0% to 2.9% | |||
| Weighted-average expected dividend yield |
5.9% | 3.8% | 0.1% | |||
| Expected term |
7 years | 5 to 7 years | 5 to 7 years |
The summary of the activity and status of the Equity Incentive Plans for the year ended December 31, 2009 is as follows:
| (In thousands, except per share amounts) |
Shares | Weighted Average Exercise Price per Share |
Weighted- Average Remaining Contractual Term |
Aggregate Intrinsic Value | |||||||
| Stock options outstanding at January 1, 2009 |
861 | $ | 18.34 | ||||||||
| Granted during the period |
841 | 18.03 | |||||||||
| Exercised during the period |
(40 | ) | 11.08 | ||||||||
| Forfeited during the period |
(206 | ) | 20.52 | ||||||||
| Outstanding at December 31, 2009 |
1,456 | $ | 18.06 | 8.5 years | $ | — | |||||
| Exercisable at December 31, 2009 |
345 | $ | 17.07 | 7.1 years | $ | 255 | |||||
| Total expected to vest at December 31, 2009(1) |
1,205 | $ | 17.89 | $ | — | ||||||
| (1) | The total number of shares expected to vest as of December 31, 2009 includes shares that have already vested, but have not yet been exercised. |
90
Table of Contents
Notes to Consolidated Financial Statements—(Continued)
NTELOS Holdings Corp.
The weighted-average grant date fair value per share of stock options granted during 2009, 2008 and 2007 was $4.29, $5.63 and $7.42, respectively. The total intrinsic value of options exercised during 2009, 2008 and 2007 was $0.3 million, $1.7 million and $2.5 million, respectively. The total fair value of options that vested during 2009, 2008 and 2007 was $1.7 million, $1.6 million and $1.1 million, respectively.
The summary of the activity and status of the Company’s restricted stock awards for the year ended December 31, 2009 is as follows:
| (In thousands, except per share amounts) |
Shares | Weighted Average Grant Date Fair Value per Share | ||||
| Restricted stock outstanding at January 1, 2009 |
29 | $ | 21.45 | |||
| Granted during the period |
218 | 17.79 | ||||
| Vested during the period |
(1 | ) | 21.36 | |||
| Forfeited during the period |
(13 | ) | 19.07 | |||
| Restricted stock outstanding at December 31, 2009 |
233 | $ | 18.14 | |||
As of December 31, 2009, there was $2.7 million of total unrecognized compensation cost related to unvested restricted stock awards, which is expected to be recognized over a weighted-average period of 2.3 years. The fair value of the restricted stock is equal to the market value of common stock on the date of grant.
In addition to the Equity Incentive Plans discussed above, the Company has an employee stock purchase plan which commenced in July 2006 with 200,000 shares available. Effective in 2010, shares purchased under this plan will be issued from the treasury stock balance. If treasury shares are not available, new common shares will be issued for purchases under this plan. Shares are priced at 85% of the closing price on the last trading day of the month and settle on the second business day of the following month. During the 2009, 2008 and 2007, 7,154 shares, 6,126 shares and 5,756 shares, respectively, were issued under the employee stock purchase plan. Compensation expense associated with the employee stock purchase plan was not material in 2009, 2008 or 2007.
Note 10. Income Taxes
The components of income tax expense are as follows for the years ended December 31, 2009, 2008 and 2007:
| (In thousands) |
December 31, 2009 |
December 31, 2008 |
December 31, 2007 | ||||||
| Current tax expense: |
|||||||||
| Federal |
$ | 1,284 | $ | 7,468 | $ | 1,469 | |||
| State |
1,756 | 3,567 | 1,163 | ||||||
| 3,040 | 11,035 | 2,632 | |||||||
| Deferred tax expense: |
|||||||||
| Federal |
29,613 | 17,704 | 18,130 | ||||||
| State |
4,556 | 1,489 | 3,649 | ||||||
| 34,169 | 19,193 | 21,779 | |||||||
| $ | 37,209 | $ | 30,228 | $ | 24,411 | ||||
91
Table of Contents
Notes to Consolidated Financial Statements—(Continued)
NTELOS Holdings Corp.
Total income tax expense was different than an amount computed by applying the graduated statutory federal income tax rates to income before taxes. The reasons for the differences are as follows for the years ended December 31, 2009, 2008 and 2007:
| (In thousands) |
December 31, 2009 |
December 31, 2008 |
December 31, 2007 | |||||||
| Computed tax expense at statutory federal rate of 35% |
$ | 35,484 | $ | 26,287 | $ | 19,891 | ||||
| Nondeductible compensation |
482 | 631 | 1,173 | |||||||
| Nondeductible offering cost |
— | — | 199 | |||||||
| FASB ASC 740 tax contingencies |
(2,800 | ) | — | — | ||||||
| State income taxes, net of federal income tax benefit |
4,103 | 3,287 | 3,128 | |||||||
| Other |
(60 | ) | 23 | 20 | ||||||
| $ | 37,209 | $ | 30,228 | $ | 24,411 | |||||
During 2009, 2008, and 2007, the Company recognized a tax benefit of approximately $0.1 million, $0.4 million and $0.4 million, respectively, in stockholders’ equity associated with the excess tax benefit realized by the Company relating to stock compensation plans. During 2009, 2008 and 2007, the Company recognized a tax cost (benefit) of $4.1 million, $(11.1) million and $1.0 million, respectively, in accumulated other comprehensive income associated with the adjustments to various employee benefit plan liabilities in accordance with this standard. In addition, as more fully discussed in Note 11, the Company recognized a $(0.3) million tax benefit in 2008 related to the change in the measurement date for the defined benefit pension plan, the other postretirement benefit plans and the supplement executive retirement plan.
Net deferred income tax assets and liabilities consist of the following components at December 31:
| (In thousands) |
2009 | 2008 | ||||
| Deferred income tax assets: |
||||||
| Retirement benefits other than pension |
$ | 4,581 | $ | 5,308 | ||
| Pension |
7,127 | 12,811 | ||||
| Net operating loss |
55,797 | 59,363 | ||||
| Licenses |
— | 4,585 | ||||
| Debt issuance and discount |
1,396 | 1,964 | ||||
| Accrued expenses |
8,332 | 7,366 | ||||
| Interest rate swap |
— | 3,572 | ||||
| Other |
1,077 | 1,387 | ||||
| 78,310 | 96,356 | |||||
| Deferred income tax liabilities: |
||||||
| Property and equipment |
69,880 | 49,677 | ||||
| Intangibles |
39,616 | 47,703 | ||||
| Licenses |
4,251 | — | ||||
| 113,747 | 97,380 | |||||
| Net deferred income tax liability |
$ | 35,437 | $ | 1,024 | ||
The Company has unused net operating losses (“NOLs”) totaling $168.9 million as of December 31, 2009. These NOLs, along with net unrealized losses existing at the September 2003 bankruptcy emergence date, are subject to an annual utilization limitation of $1.6 million (prior to adjustment for realization of built-in gains that existed as of the 2005 merger, with a maximum limitation of $9.2 million). Based on this limitation and the adjustments required for certain built-in gains realized or to be realized during the five year period immediately following the Company’s May 2, 2005 merger, the Company expects to use NOLs of approximately $143.4 million as follows: $9.2 million per year in 2010 through 2024, $5.1 million in 2025 and $0.8 million in 2026.
92
Table of Contents
Notes to Consolidated Financial Statements—(Continued)
NTELOS Holdings Corp.
The Company recognizes interest related to unrecognized income tax benefits (“UTBs”) in interest expense and penalties on UTBs in income tax expense. A reconciliation of the change in the UTB balance from January 1, 2008 to December 31, 2009 is as follows:
| (In thousands) |
December 31, 2009 |
December 31, 2008 | |||||
| Balance at beginning of the year |
$ | 3,112 | $ | 3,112 | |||
| Additions for tax positions related to the current year |
136 | — | |||||
| Reductions for tax positions related to prior years |
(3,112 | ) | — | ||||
| $ | 136 | $ | 3,112 | ||||
In the fourth quarter of 2009, the Company concluded a federal tax examination on a “No Change” basis for the year in which a UTB originated. As a result, a UTB of $3.1 million was recognized at the conclusion of the examination. Additionally, accrued interest of $0.7 million relating to the UTB was recognized as a reduction in interest expense.
While the Company believes it has adequately provided for all tax positions, amounts asserted by taxing authorities could be greater than its accrued position. Accordingly, additional provisions could be recorded in the future as revised estimates are made or the underlying matters are settled or otherwise resolved. In general, the tax years that remain open and subject to federal and state audit examinations are 2008-2009 and 2006-2009, respectively.
Note 11. Pension Plans and Other Postretirement Benefits
The Company sponsors several qualified and nonqualified pension plans and other postretirement benefit plans (“OPEBs”) for its employees (Note 2). The following tables provide a reconciliation of the changes in the qualified plans’ benefit obligations and fair value of assets and a statement of the funded status as of and for the years ended December 31, 2009 and 2008, and the classification of amounts recognized in the consolidated balance sheets:
| Defined Benefit Pension Plan |
Other Postretirement Benefit Plans |
|||||||||||||||
| (In thousands) |
2009 | 2008 | 2009 | 2008 | ||||||||||||
| Change in benefit obligations: |
||||||||||||||||
| Benefit obligations, beginning of period |
$ | 63,354 | $ | 51,523 | $ | 13,691 | $ | 11,127 | ||||||||
| Measurement date change |
— | 1,472 | — | 59 | ||||||||||||
| Service cost |
2,921 | 2,745 | 126 | 126 | ||||||||||||
| Interest cost |
3,597 | 3,144 | 773 | 678 | ||||||||||||
| Actuarial (gain) loss |
(1,334 | ) | 5,662 | (2,216 | ) | 2,053 | ||||||||||
| Benefits paid, net |
(2,574 | ) | (2,814 | ) | (516 | ) | (352 | ) | ||||||||
| Special termination benefit |
295 | 859 | — | — | ||||||||||||
| Curtailment loss |
— | 763 | — | — | ||||||||||||
| Benefit obligations, end of period |
66,259 | 63,354 | 11,858 | 13,691 | ||||||||||||
| Change in plan assets: |
||||||||||||||||
| Fair value of plan assets, beginning of period |
29,135 | 41,948 | — | — | ||||||||||||
| Actual return on plan assets |
10,306 | (15,419 | ) | — | — | |||||||||||
| Employer contributions |
9,000 | 5,420 | 516 | 352 | ||||||||||||
| Benefits paid |
(2,574 | ) | (2,814 | ) | (516 | ) | (352 | ) | ||||||||
| Fair value of plan assets, end of period |
45,866 | 29,135 | — | — | ||||||||||||
| Funded status: |
||||||||||||||||
| Liability at December 31, |
$ | (20,393 | ) | $ | (34,219 | ) | $ | (11,858 | ) | $ | (13,691 | ) | ||||
The accumulated benefit obligation for the defined benefit pension plan at December 31, 2009 and 2008 was $57.6 million and $55.3 million, respectively. The accumulated benefit obligation represents the present value of pension
93
Table of Contents
Notes to Consolidated Financial Statements—(Continued)
NTELOS Holdings Corp.
benefits based on service and salary earned to date. The benefit obligation indicated in the table above is the projected benefit obligation which represents the present value of pension benefits taking into account projected future service and salary increases. The Company has classified the projected amount to be paid in 2010 and 2009 of $1.6 million and $1.1 million, respectively, related to the other postretirement benefit plans and the nonqualified pension plans (discussed below) in current liabilities under the caption “other accrued liabilities” on the Company’s consolidated balance sheets at December 31, 2009 and 2008.
The following table provides the components of net periodic benefit cost for the plans for the year ended December 31, 2009, 2008 and 2007:
| Defined Benefit Pension Plan | Other Postretirement Benefit Plans | ||||||||||||||||||||
| (In thousands) |
2009 | 2008 | 2007 | 2009 | 2008 | 2007 | |||||||||||||||
| Components of net periodic benefit cost: |
|||||||||||||||||||||
| Service cost |
$ | 2,921 | $ | 2,745 | $ | 2,796 | $ | 126 | $ | 126 | $ | 140 | |||||||||
| Interest cost |
3,597 | 3,144 | 2,739 | 773 | 678 | 628 | |||||||||||||||
| Recognized net actuarial loss |
1,152 | — | — | 69 | — | — | |||||||||||||||
| Expected return on plan assets |
(3,032 | ) | (3,827 | ) | (2,994 | ) | — | — | — | ||||||||||||
| Net periodic benefit cost |
$ | 4,638 | $ | 2,062 | $ | 2,541 | $ | 968 | $ | 804 | $ | 768 | |||||||||
| Additional charges due to: Special termination benefit |
$ | 295 | $ | 859 | $ | — | $ | — | $ | — | $ | — | |||||||||
Prior service costs are amortized on a straight-line basis over the average remaining service period of active participants. Gains and losses in excess of 10% of the greater of the benefit obligation and the market-related value of assets are amortized over the average remaining service period of active participants.
The special termination benefit recorded in 2009 and 2008 related to a pension enhancement pursuant to a voluntary early retirement plan accepted by certain employees of the wireless segment in 2009 and the wireline segments in 2008. The special termination benefit represents the effect of this enhancement on the accumulated benefit obligation for the related employees. Additionally, the arrangement in 2008 resulted in a change to certain future pension assumptions specific to these employees, the effect of which was a $0.8 million curtailment loss ($0.5 million net of tax) recorded as a reduction to the unrecognized gain from defined benefit plans in accumulated other comprehensive income.
Unrecognized actuarial gains in 2009 in addition to the special termination benefit noted above were $8.6 million, net of a $3.3 million deferred tax liability, and $2.2 million, net of a $0.9 million deferred tax liability, for the defined benefit pension plan and the other postretirement benefit plans, respectively. The total amount of unrecognized actuarial losses (gains) recorded in accumulated other comprehensive income at December 31, 2009 related to these respective plans was $7.5 million, net of a $4.8 million deferred tax asset, and $(0.2) million, net of a $0.1 million deferred tax liability.
In accordance with the requirements of FASB ASC 715-30-35, the Company began measuring its plan assets and liabilities on December 31st in 2008. Prior to 2008, the Company measured applicable assets and liabilities of these plans on September 30th of each year. This change resulted in an increase to the defined benefit pension plan of $0.5 million, net of a $0.2 million deferred tax asset, and an increase of $0.1 million in other postretirement benefit plans pension, with the offset to retained earnings, for the portion of the net periodic benefit cost relating to the period between September 30, 2007 and December 31, 2007. The effects of this change are reported in the consolidated statement of equity for the year ended December 31, 2008.
The assumptions used in the measurements of the Company’s benefit obligations at December 31, 2009 and 2008 are shown in the following table:
| Defined Benefit Pension Plan |
Other Postretirement Benefit Plans |
|||||||||||
| 2009 | 2008 | 2009 | 2008 | |||||||||
| Discount rate |
5.95 | % | 5.80 | % | 5.95 | % | 5.80 | % | ||||
| Rate of compensation increase |
3.00 | % | 3.00 | % | — | % | — | % | ||||
94
Table of Contents
Notes to Consolidated Financial Statements—(Continued)
NTELOS Holdings Corp.
The assumptions used in the measurements of the Company’s net cost for the consolidated statement of operations for the year ended December 31, 2009, 2008 and 2007 are:
| Defined Benefit Pension Plan | Other Postretirement Benefit Plans | |||||||||||||||||
| 2009 | 2008 | 2007 | 2009 | 2008 | 2007 | |||||||||||||
| Discount rate |
5.80 | % | 6.25 | % | 5.80 | % | 5.80 | % | 6.25 | % | 5.80 | % | ||||||
| Expected return on plan assets |
8.50 | % | 8.50 | % | 8.50 | % | — | % | — | % | — | % | ||||||
| Rate of compensation increase |
3.00 | % | 3.50 | % | 3.50 | % | — | % | — | % | — | % | ||||||
The Company reviews the assumptions noted in the above table annually or more frequently to reflect anticipated future changes in the underlying economic factors used to determine these assumptions. The discount rates assumed reflect the rate at which the Company could invest in high quality corporate bonds in order to settle future obligations. In doing so, the Company utilizes a Citigroup spot rate index applied against the Company’s estimated defined benefit payments to derive a blended rate. The Citigroup spot rate index is derived from over 350 Aa corporate bonds. Due to the impact of certain market conditions on investment grade bond rates, this index has excluded a number of bond funds as outliers as of December 31, 2009 and 2008 in order to reflect the general trend on high-quality bonds. The Company also compares this to a Moody’s ten year Aa bond index for reasonableness.
For measurement purposes, an 8.5% annual rate of increase in the per capita cost of covered health care benefits was assumed for 2010 for the obligation as of December 31, 2009. The rate was assumed to decrease one-half percent per year to a rate of 5.0% for 2017 and remain at that level thereafter.
Assumed health care cost trend rates have a significant effect on the amounts reported for the health care plans. The effect to the net periodic postretirement health care benefit cost and obligation of a 1% change on the medical trend rate per future year, while holding all other assumptions constant, would be a $0.1 million increase and a $1.5 million increase, respectively, for a 1% increase in medical trend rate and a $0.1 million decrease and a $1.2 million decrease, respectively, for a 1% decrease in medical trend rate.
In developing the expected long-term rate of return assumption for the assets of the Defined Benefit Pension Plan, the Company evaluated input from its third party pension plan asset managers, including their review of asset class return expectations and long-term inflation assumptions. The Company also considered the related historical ten-year average asset return at December 31, 2009.
As of December 31, 2009, the weighted average actual asset allocations were as follows:
| Asset Category |
Actual Allocation |
||
| Large Cap Value |
51 | % | |
| Mid Cap Blend |
7 | % | |
| Small Cap Blend |
8 | % | |
| Foreign Stock - Large Cap |
10 | % | |
| Bond |
21 | % | |
| Cash and cash equivalents |
3 | % | |
| Total |
100 | % | |
The actual and target allocation for plan assets is broadly defined and measured as follows:
| Asset Category |
Actual Allocation |
Target Allocation |
||||
| Equity securities |
76 | % | 75 | % | ||
| Bond securities and cash equivalents |
24 | % | 25 | % | ||
| Total |
100 | % | 100 | % | ||
It is the Company’s policy to invest pension plan assets in a diversified portfolio consisting of an array of asset classes. The investment risk of the assets is limited by appropriate diversification both within and between asset classes. The assets are primarily invested in investment funds that invest in a broad mix of publicly traded equities, bonds and cash equivalents (and fair value is based on quoted market prices (“level 1” input)). The allocation between equity and bonds is reset quarterly to the target allocations. Updates to the allocation are considered in the normal course and changes may be made when appropriate.
95
Table of Contents
Notes to Consolidated Financial Statements—(Continued)
NTELOS Holdings Corp.
The assumed long term return noted above is the target long term return. Overall return, risk adjusted return, and management fees are assessed against a peer group and benchmark indices. There are minimum performance standards that must be attained within the investment portfolio. Reporting on asset performance is provided quarterly and review meetings are held semi-annually. In addition to normal rebalancing to maintain an adequate cash reserve, projected cash flow needs of the plan are reviewed at least annually to ensure liquidity is properly managed.
The Company expects to contribute $9.0 million to the pension plan in the first quarter of 2010. The Company expects the net periodic benefit cost for the defined benefit pension plan and the other postretirement benefit plans in 2010 to be $2.7 million ($0.4 million of which represents amortization of actuarial losses) and $0.8 million, respectively.
The following estimated future pension benefit payments and other postretirement benefit plan payments which reflect expected future service, as appropriate, are expected to be paid in the years indicated:
| Year |
Defined Benefit Pension Plan |
Other Postretirement Benefit Plans | ||||
| 2010 |
$ | 2,741 | $ | 665 | ||
| 2011 |
2,754 | 698 | ||||
| 2012 |
2,829 | 710 | ||||
| 2013 |
2,900 | 705 | ||||
| 2014 |
2,997 | 708 | ||||
| 2015-2019 |
$ | 19,421 | $ | 3,923 | ||
Other Benefit Plans
The Company also sponsors a supplemental executive retirement plan and certain other nonqualified defined benefit pension plans assumed by NTELOS Inc. in a prior merger. The accumulated benefit obligation of the Company’s nonqualified pension plans were $10.5 million and $8.6 million at December 31, 2009 and 2008, respectively. The total expense recognized related to these plans was $0.8 million for the year ended December 31, 2009, $0.8 million for the year ended December 31, 2008 and $0.9 million for the year ended December 31, 2007.
These nonqualified plans have no plan assets and are also closed to new participants.
The Company recognized $0.1 million of expense from previously unrecognized loss related to the supplemental executive retirement plan for each of the years ended December 31, 2009 and 2008. Unrecognized actuarial loss was $1.6 million in 2009 and unrecognized actuarial gain was less than $0.1 million in 2008. The total balance of unrecognized actuarial losses recorded in accumulated other comprehensive income at December 31, 2009 and 2008 related to these plans was $1.6 million, net of a $1.0 million deferred tax asset), and $0.7 million, net of a $0.5 million deferred tax asset, respectively. The total expense to be recognized in 2010 for all nonqualified pension plans is approximately $0.9 million and the estimated payments are expected to be approximately $1.0 million.
The Company also sponsors a defined contribution 401(k) plan. The Company’s matching contributions to this plan were $1.4 million for the year ended December 31, 2009, $1.5 million for the year ended December 31, 2008 and $1.3 million for the year ended December 31, 2007. Of the $1.4 million of matching contributions for 2009, $0.6 million represented cash contributions and $0.8 million represented equity contributions (Note 2).
Note 12. Commitments and Contingencies
Operating Leases
Rental expense for all operating leases for the year ended December 31, 2009, 2008 and 2007 was $29.1 million, $28.5 million and $25.2 million, respectively. The total amount committed under these lease agreements at December 31, 2009 is: $26.3 million in 2010, $21.5 million in 2011, $20.1 million in 2012, $19.6 million in 2013, $21.3 million in 2014 and $56.1 million for the years thereafter.
96
Table of Contents
Notes to Consolidated Financial Statements—(Continued)
NTELOS Holdings Corp.
Other Commitments and Contingencies
The Company periodically makes claims or receives disputes related to our billings to other carriers for access to our network. The Company does not recognize revenue related to such matters until the period that it is reliably assured of the collection of these claims.
The Company periodically disputes network access charges that we are assessed by other companies that we interconnect with and are involved in other disputes and legal and tax proceedings and filings arising from normal business activities. While the outcome of such matters is currently not determinable, management does not expect that the ultimate costs to resolve such matters will have a material adverse effect on the Company’s consolidated financial position, results of operations or cash flows, and believes that adequate provision for any probable and estimable losses has been made in the Company’s consolidated financial statements.
The Company has other purchase commitments relating to capital expenditures totaling $17.2 million as of December 31, 2009, which are expected to be satisfied during 2010.
97
Table of Contents
| Item 9. | Changes in and Disagreements With Accountants on Accounting and Financial Disclosure. |
None.
| Item 9A. | Controls and Procedures. |
Conclusion Regarding the Effectiveness of Disclosure Controls and Procedures
Under the supervision and with the participation of our management, including our principal executive officer and principal financial officer, we conducted an evaluation of the effectiveness of the design and operation of our disclosure controls and procedures, as defined in Rules 13a-15(e) and 15d-15(e) under the Securities Exchange Act of 1934, as amended (the “Exchange Act”), as of the end of the period covered by this report. Based on this evaluation, our principal executive officer and our principal financial officer concluded that, as of the end of the period covered by this report, our disclosure controls and procedures are effective to ensure that the information required to be disclosed by us in the reports that we file or submit under the Exchange Act, is recorded, processed, summarized and reported, within the time periods specified in the SEC’s rules and forms, and that such information is accumulated and communicated to our management, including our principal executive officer and our principal financial officer, as appropriate, to allow timely decisions regarding required disclosures. Management’s report on internal control over financial reporting is included below.
The effectiveness of our internal control over financial reporting as of December 31, 2009 has been audited by KPMG LLP, an independent registered public accounting firm, as stated in their report, indicated below.
Management’s Annual Report on Internal Control over Financial Reporting
Our management is responsible for establishing and maintaining adequate internal control over financial reporting as defined in Exchange Act Rule 13a-15(f) and 15d-15(f). Our internal control over financial reporting is a process designed to provide reasonable assurance regarding the reliability of financial reporting and the preparation of financial statements for external purposes in accordance with accounting principles generally accepted in the United States. Our internal control over financial reporting includes those policies and procedures that (i) pertain to the maintenance of records that, in reasonable detail, accurately and fairly reflect the transactions and dispositions of assets; (ii) provide reasonable assurance that transactions are recorded as necessary to permit preparation of financial statements in accordance with accounting principles generally accepted in the United States, and that receipts and expenditures of the Company are being made only in accordance with management’s and our directors’ authorizations; and (iii) provide reasonable assurance regarding prevention or timely detection of unauthorized acquisition, use, or disposition of the our assets that could have a material effect on the financial statements.
Under the supervision and with the participation of our management, including our principal executive officer and principal financial officer, we conducted an evaluation of the effectiveness of our internal control over financial reporting as of December 31, 2009. In making this assessment, management used the criteria for effective internal control over financial reporting described in “Internal Control-Integrated Framework” set forth by the Committee of Sponsoring Organizations of the Treadway Commission (COSO). Based on the assessment, management concluded that, as of December 31, 2009, the Company’s internal control over financial reporting was effective to provide reasonable assurances regarding the reliability of financial reporting and the preparation of financial statements for external purposes in accordance with generally accepted accounting principles in the Unites States. The conclusion of our principal executive officer and principal financial officer is based on the recognition that there are inherent limitations in all systems of internal control. Because of its inherent limitations, internal control over financial reporting may not prevent or detect misstatements. Also, projections of any evaluation of effectiveness to future periods are subject to the risk that controls may become inadequate because of changes in conditions, or that the degree of compliance with the policies or procedures may deteriorate.
Changes in Internal Control Over Financial Reporting
There were no changes in our internal control over financial reporting (as such term is defined in Exchange Act Rule 13a-15(f)) that occurred during the three months ended December 31, 2009 that have materially affected, or are reasonably likely to materially affect, our internal control over financial reporting.
98
Table of Contents
Report of Independent Registered Public Accounting Firm
The Board of Directors and Stockholders
NTELOS Holdings Corp.:
We have audited NTELOS Holdings Corp.’s internal control over financial reporting as of December 31, 2009, based on criteria established in Internal Control – Integrated Framework issued by the Committee of Sponsoring Organizations of the Treadway Commission (COSO). NTELOS Holdings Corp.’s management is responsible for maintaining effective internal control over financial reporting and for its assessment of the effectiveness of internal control over financial reporting, included in the accompanying Management’s Annual Report on Internal Control over Financial Reporting. Our responsibility is to express an opinion on the Company’s internal control over financial reporting based on our audit.
We conducted our audit in accordance with the standards of the Public Company Accounting Oversight Board (United States). Those standards require that we plan and perform the audit to obtain reasonable assurance about whether effective internal control over financial reporting was maintained in all material respects. Our audit included obtaining an understanding of internal control over financial reporting, assessing the risk that a material weakness exists, and testing and evaluating the design and operating effectiveness of internal control based on the assessed risk. Our audit also included performing such other procedures as we considered necessary in the circumstances. We believe that our audit provides a reasonable basis for our opinion.
A company’s internal control over financial reporting is a process designed to provide reasonable assurance regarding the reliability of financial reporting and the preparation of financial statements for external purposes in accordance with generally accepted accounting principles. A company’s internal control over financial reporting includes those policies and procedures that (1) pertain to the maintenance of records that, in reasonable detail, accurately and fairly reflect the transactions and dispositions of the assets of the company; (2) provide reasonable assurance that transactions are recorded as necessary to permit preparation of financial statements in accordance with generally accepted accounting principles, and that receipts and expenditures of the company are being made only in accordance with authorizations of management and directors of the company; and (3) provide reasonable assurance regarding prevention or timely detection of unauthorized acquisition, use, or disposition of the company’s assets that could have a material effect on the financial statements.
Because of its inherent limitations, internal control over financial reporting may not prevent or detect misstatements. In addition, projections of any evaluation of effectiveness to future periods are subject to the risk that controls may become inadequate because of changes in conditions, or that the degree of compliance with the policies or procedures may deteriorate.
In our opinion, NTELOS Holdings Corp. maintained, in all material respects, effective internal control over financial reporting as of December 31, 2009, based on criteria established in Internal Control – Integrated Framework issued by the Committee of Sponsoring Organizations of the Treadway Commission.
We also have audited, in accordance with the standards of the Public Company Accounting Oversight Board (United States), the consolidated balance sheets of NTELOS Holdings Corp. as of December 31, 2009 and 2008, and the related consolidated statements of operations, cash flows, and equity for each of the years in the three-year period ended December 31, 2009, and our report dated February 26, 2010 expressed an unqualified opinion on those consolidated financial statements.
/s/ KPMG LLP
Richmond, Virginia
February 26, 2010
| Item 9B. | Other Information. |
None.
99
Table of Contents
| Item 10. | Directors, Executive Officers and Corporate Governance. |
The information required by this item is incorporated herein by reference from the registrant’s definitive Proxy Statement for the Annual Meeting of Stockholders to be held on May 6, 2010 to be filed with the Commission pursuant to Regulation 14A.
The Company has adopted a Code of Business Conduct and Ethics pursuant to section 406 of the Sarbanes-Oxley Act. A copy of our Code of Business Conduct and Ethics is publicly available on our Company website at http://www.ir-site.com/images/library/ntelos/CodeofConduct-Board_10-2006.pdf. The information contained on our website is not incorporated by reference into this Report on Form 10-K.
| Item 11. | Executive Compensation. |
The information required by this item is incorporated herein by reference from the registrant’s definitive Proxy Statement for the Annual Meeting of Stockholders.
| Item 12. | Security Ownership of Certain Beneficial Owners and Management and Related Stockholder Matters. |
Securities Authorized for Issuance Under Equity Compensation Plans
The following table sets forth information as of December 31, 2009 concerning the shares of Common Stock which are authorized for issuance under our equity compensation plans.
| Plan Category |
Number of Securities to be Issued on Exercise of Outstanding Options, Warrants and Rights (a) |
Weighted Average Exercise Price of Outstanding Options, Warrants and Rights (b) |
Number of Securities Remaining Available for Future Issuance Under Equity Compensation Plans (Excluding Securities Reflected in Column (a)) (c) | ||||
| Equity Compensation Plans Approved by Stockholders |
|||||||
| Equity Incentive Plan |
1,361,759 | $ | 17.65 | 572,826 | |||
| Non-Employee Director Equity Plan |
94,600 | 23.94 | 296,800 | ||||
| Employee Stock Purchase Plan |
— | — | 177,933 | ||||
| Equity Compensation Plans Not Approved by Stockholders |
— | — | — | ||||
| Total |
1,456,359 | $ | 18.06 | 1,047,559 | |||
All other information required by this item is incorporated herein by reference from the registrant’s definitive Proxy Statement for the Annual Meeting of Stockholders.
| Item 13. | Certain Relationships and Related Transactions, and Director Independence. |
The information required by this item is incorporated herein by reference from the registrant’s definitive Proxy Statement for the Annual Meeting of Stockholders.
| Item 14. | Principal Accountant Fees and Services. |
The information required by this item is incorporated herein by reference from the registrant’s definitive Proxy Statement for the Annual Meeting of Stockholders.
100
Table of Contents
| Item 15. | Exhibits, Financial Statement Schedules. |
(a) The following documents are filed as a part of this Annual Report on Form 10-K:
(1) Consolidated Financial Statements
The consolidated financial statements required to be filed in the Annual Report on Form 10-K are listed in Item 8 hereof.
(3) Exhibits
The exhibits listed below and on the accompanying Index to Exhibits immediately following the signature page hereto are filed as part of, or incorporated by reference into, this Report on Form 10-K.
101
Table of Contents
EXHIBIT INDEX
| Exhibit |
Description | |
| 3.1(1) | Amended and Restated Certificate of Incorporation of Holdings. | |
| 3.2(1) | Amended and Restated By-laws of Holdings. | |
| 4.3(1) | Amended and Restated Shareholders Agreement by and among Holdings and the shareholders listed on the signature pages thereto. | |
| 10.1(1) | Holdings Amended and Restated Equity Incentive Plan. | |
| 10.2(1) | Holdings Employee Stock Purchase Plan, as amended. | |
| 10.3(1) | Form of Award Agreement under Holdings Amended and Restated Equity Incentive Plan. | |
| 10.4(1) | Holdings Non-Employee Director Equity Plan. | |
| 10.5(2) | Credit Agreement, dated as of August 7, 2009. | |
| 10.6(3) | Retirement Agreement, dated December 17, 2009, between NTELOS Holdings Corp. and James S. Quarforth. | |
| 10.7(3) | Amended and Restated Employment Agreement, dated December 17, 2009, between NTELOS Holdings Corp. and James A. Hyde. | |
| 10.8(4) | Amended and Restated Employment Agreement, dated as of December 18, 2008, between NTELOS Inc. and Michael B. Moneymaker. | |
| 10.9(4) | Amended and Restated Employment Agreement, dated as of December 18, 2008, between NTELOS Inc. and Frank C. Guido. | |
| 10.10* | Amended and Restated Employment Agreement, dated as of July 1, 2009, between NTELOS Inc. and Frank L. Berry. | |
| 10.11(4) | Amended and Restated Employment Agreement, dated as of December 18, 2008, between NTELOS Inc. and Mary McDermott. | |
| 10.12(5) | First Amendment to the NTELOS Holdings Corp. Amended and Restated Equity Incentive Plan. | |
| 10.13(6) | Resale Agreement, dated as of July 31, 2007, and effective as of July 1, 2007, by and among the West Virginia PCS Alliance, L.C., Virginia PCS Alliance, L.C., NTELOS Inc. and Sprint Spectrum L.P. and Sprint Spectrum on behalf of and as an agent for SprintCom, Inc., a Kansas corporation. | |
| 10.14(7) | NTELOS Inc. 2005 Executive Supplemental Retirement Plan, as amended and restated December 21, 2006. | |
| 10.15* | Form of Stock Option Award Agreement under Holdings Non-Employee Director Equity Plan. | |
| 10.16* | Form of Restricted Stock Award Agreement under Holdings Non-Employee Director Equity Plan. | |
| 10.17(8) | Form of Stock Option Award Agreement. | |
| 10.18(9) | Form of Restricted Stock Award Agreement. | |
| 21.1* | Subsidiaries of Holdings. | |
| 23.1* | Consent of KPMG LLP. | |
| 31.1* | Certificate of James A. Hyde, Chief Executive Officer and President pursuant to Rule 13a-14(a). | |
| 31.2* | Certificate of Michael B. Moneymaker, Executive Vice President and Chief Financial Officer, Treasurer and Secretary pursuant to Rule 13a-14(a). | |
| 32.1* | Certificate of James A. Hyde, Chief Executive Officer and President pursuant to 18 U.S.C., Section 1350, as adopted pursuant to Section 906 of the Sarbanes-Oxley Act of 2002. | |
| 32.2* | Certificate of Michael B. Moneymaker, Executive Vice President and Chief Financial Officer, Treasurer and Secretary pursuant to 18 U.S.C., Section 1350, as adopted pursuant to Section 906 of the Sarbanes-Oxley Act of 2002. | |
| * | Filed herewith. |
| (1) | Filed as an exhibit to Annual Report on Form 10-K for the year ended December 31, 2005 filed March 28, 2006. |
| (2) | Filed as an exhibit to Current Report on Form 8-K filed August 7, 2009. |
| (3) | Filed as an exhibit to Current Report on Form 8-K filed December 17, 2009. |
| (4) | Filed as an exhibit to Annual Report on Form 10-K for the year ended December 31, 2008 filed February 27, 2009. |
| (5) | Filed as an exhibit to Current Report on Form 8-K filed December 19, 2008. |
| (6) | Filed as an exhibit to Current Report on Form 8-K filed August 2, 2007. |
| (7) | Filed as an exhibit to Current Report on Form 8-K filed December 21, 2006. |
| (8) | Filed as an exhibit to Current Report on Form 8-K filed March 6, 2007. |
| (9) | Filed as an exhibit to Current Report on Form 8-K filed March 4, 2008. |
102
Table of Contents
Pursuant to the requirements of Section 13 or 15(d) of the Securities Exchange Act of 1934, the registrant has duly caused this report on Annual Report on Form 10-K to be signed on its behalf by the undersigned thereunto duly authorized.
| NTELOS HOLDINGS CORP. | ||
| By: | /S/ JAMES A. HYDE | |
| Name: | James A. Hyde | |
| Title: | Chief Executive Officer and President | |
Pursuant to the requirements of the Securities Exchange Act of 1934, this report on Annual Report on Form 10-K has been signed below by the following persons on behalf of the registrant and in the capacities and on the dates indicated:
| Signature |
Title |
Date | ||
| /S/ JAMES A. HYDE |
Chief Executive Officer and President | February 26, 2010 | ||
| James A. Hyde | (principal executive officer) | |||
| /S/ MICHAEL B. MONEYMAKER |
Executive Vice President, Chief Financial Officer, Treasurer and Secretary |
February 26, 2010 | ||
| Michael B. Moneymaker | (principal financial and accounting officer) | |||
| /S/ TIMOTHY BILTZ |
Director | February 26, 2010 | ||
| Timothy Biltz | ||||
| /S/ DANIEL FINE |
Director | February 26, 2010 | ||
| Daniel Fine | ||||
| /S/ ROBERT GUTH |
Director | February 26, 2010 | ||
| Robert Guth | ||||
| /S/ DANIEL HENEGHAN |
Director | February 26, 2010 | ||
| Daniel Heneghan | ||||
| /S/ MICHAEL HUBER |
Director | February 26, 2010 | ||
| Michael Huber | ||||
| /S/ JULIA NORTH |
Director | February 26, 2010 | ||
| Julia North | ||||
| /S/ JERRY VAUGHN |
Director | February 26, 2010 | ||
| Jerry Vaughn | ||||