Attached files
| file | filename |
|---|---|
| EX-21.1 - EXHIBIT 21.1 - NTELOS HOLDINGS CORP. | exhibit2111.htm |
| EX-23.1 - EXHIBIT 23.1 - NTELOS HOLDINGS CORP. | exhibit2311.htm |
| EX-32.1 - EXHIBIT 32.1 - NTELOS HOLDINGS CORP. | exhibit3211.htm |
| EX-31.2 - EXHIBIT 31.2 - NTELOS HOLDINGS CORP. | exhibit3121.htm |
| EX-31.1 - EXHIBIT 31.1 - NTELOS HOLDINGS CORP. | exhibit3111.htm |
| EX-32.2 - EXHIBIT 32.2 - NTELOS HOLDINGS CORP. | exhibit3221.htm |
| EXCEL - IDEA: XBRL DOCUMENT - NTELOS HOLDINGS CORP. | Financial_Report.xls |
UNITED STATES
SECURITIES AND EXCHANGE COMMISSION
Washington, D.C. 20549
FORM 10-K
(Mark One)
ý | ANNUAL REPORT PURSUANT TO SECTION 13 OR 15(d) OF THE SECURITIES EXCHANGE ACT OF 1934 |
For the fiscal year ended December 31, 2014
or
¨ | TRANSITION REPORT PURSUANT TO SECTION 13 OR 15(d) OF THE SECURITIES EXCHANGE ACT OF 1934 |
For the transition period from to
Commission File Number: 000-51798
NTELOS Holdings Corp.
(Exact name of registrant as specified in its charter)
Delaware | 36-4573125 | |
(State or other jurisdiction of incorporation or organization) | (I.R.S. Employer Identification No.) | |
1154 Shenandoah Village Drive, Waynesboro, Virginia 22980
(Address of principal executive offices) (Zip Code)
(540) 946-3500
(Registrant’s telephone number, including area code)
Securities registered pursuant to Section 12(b) of the Act:
Title of each class | Name of each exchange on which registered | |
Common stock, $0.01 par value | The NASDAQ Stock Market LLC | |
Securities registered pursuant to Section 12(g) of the Act: None |
Indicate by check mark if the registrant is a well-known seasoned issuer, as defined in Rule 405 of the Securities Act. ¨ Yes ý No
Indicate by check mark if the registrant is not required to file reports pursuant to Section 13 or Section 15(d) of the Act. ¨ Yes ý No
Indicate by check mark whether the registrant (1) has filed all reports required to be filed by Section 13 or 15(d) of the Securities Exchange Act of 1934 during the preceding 12 months (or for such shorter period that the registrant was required to file such reports), and (2) has been subject to such filing requirements for the past 90 days. ý Yes ¨ No
Indicate by check mark whether the registrant has submitted electronically and posted on its corporate Web site, if any, every Interactive Data File required to be submitted and posted pursuant to Rule 405 of Regulation S-T (§ 232.405 of this chapter) during the preceding 12 months (or for such shorter period that the registrant was required to submit and post such files). ý Yes ¨ No
Indicate by check mark if disclosure of delinquent filers pursuant to Item 405 of Regulation S-K (§ 229.405 of this chapter) is not contained herein, and will not be contained, to the best of registrant’s knowledge, in definitive proxy or information statements incorporated by reference in Part III of this Form 10-K or any amendment to this Form 10-K. ý
Indicate by check mark whether the registrant is a large accelerated filer, an accelerated filer, a non-accelerated filer or a smaller reporting company. See definitions of “large accelerated filer,” “accelerated filer” and “smaller reporting company” in Rule 12b-2 of the Exchange Act.
Large accelerated filer | ¨ | Accelerated filer | ý | |||
Non-accelerated filer | ¨ (Do not check if a smaller reporting company) | Smaller reporting company | ¨ | |||
Indicate by check mark whether the registrant is a shell company (as defined in Rule 12b-2 of the Exchange Act). ¨ Yes ý No
The aggregate market value of the voting and non-voting common equity held by non-affiliates of the registrant on June 30, 2014 was $212.2 million (based on the closing price for shares of the registrant’s common stock as reported on the NASDAQ Global Market on that date). In determining this figure, the registrant has assumed that all of its directors, executive officers and persons beneficially owning more than 10% of the outstanding common stock are affiliates. This assumption shall not be deemed conclusive for any other purpose.
There were 21,788,154 shares of the registrant’s common stock outstanding as of the close of business on February 23, 2015.
DOCUMENTS INCORORATED BY REFERENCE
Document | Incorporated Into | |
Proxy statement for the 2015 Annual Meeting of Stockholders | Part III | |
NTELOS HOLDINGS CORP.
TABLE OF CONTENTS
Page No. | ||
Item 1. | ||
Item 1A. | ||
Item 1B. | ||
Item 2. | ||
Item 3. | ||
Item 4. | ||
Item 5. | ||
Item 6. | ||
Item 7. | ||
Item 7A. | ||
Item 8. | ||
Item 9. | ||
Item 9A. | ||
Item 9B. | ||
Item 10. | ||
Item 11. | ||
Item 12. | ||
Item 13. | ||
Item 14. | ||
Item 15. | ||
GLOSSARY OF TERMS AND ABBREVIATIONS
3G | Third Generation of Mobile Telephony Standards | |
4G | Fourth Generation of Mobile Telecommunication Standards | |
Amended and Restated Credit Agreement | Amendment No.6, dated November 9, 2012, of the Original Credit Agreement and as further amended and restated as of January 31, 2014 | |
ARPA | Average Monthly Revenue per Account | |
ARPU | Average Monthly Revenue per User | |
ASC | Accounting Standards Codification | |
ASU | Accounting Standards Update | |
AWS | Advanced Wireless Services | |
CALEA | Communications Assistance for Law Enforcement Act of 1994 | |
CDMA | Code Division Multiple Access | |
CMRS | Commercial Mobile Radio Service | |
Communications Act | Communications Act of 1934, as amended | |
Congress | United States Congress | |
EIP | Equipment Installment Plan | |
Exchange Act | Securities Exchange Act of 1934, as amended | |
FAA | Federal Aviation Administration | |
FASB | Financial Accounting Standards Board | |
FCC | Federal Communications Commission | |
FTC | Federal Trade Commission | |
GAAP | Generally Accepted Accounting Principles in the United States | |
GHz | Gigahertz | |
IRC | Internal Revenue Code of 1986, as amended | |
IRS | Internal Revenue Service | |
LEC | Local Exchange Carrier | |
LIBOR | London Interbank Offered Rate | |
LTE | Long-Term Evolution Wireless Technology | |
Lumos Networks | Lumos Networks Corp. | |
MHz | Megahertz | |
MLA | Master License Agreement | |
MSC | Mobile Switching Center | |
MVNO | Mobile Virtual Network Operator | |
NASDAQ | NASDAQ Stock Market LLC | |
NEPA | National Environmental Policy Act | |
NOL | Net Operating Loss | |
NPRM | Notice of Proposed Rule Making | |
Original Credit Agreement | Credit Agreement dated August 7, 2009 | |
PCS | Personal Communications Services | |
POPs | Population | |
PSAP | Public Safety Answering Point | |
Quadrangle | Quadrangle Capital Partners LLP and certain of its affiliates | |
SEC | United States Securities and Exchange Commission | |
SNA | Strategic Network Alliance | |
SprintCom | SprintCom, Inc., a Kansas corporation | |
Sprint Spectrum | Sprint Spectrum L.P., a Delaware limited partnership | |
USF | Universal Service Fund | |
UTB | Unrecognized Income Tax Benefit | |
VoIP | Voice over Internet Protocol | |
1
PART I
In this Annual Report on Form 10-K, we use the terms “NTELOS,” “we,” the “Company,” “our” and “us” to refer to NTELOS Holdings Corp. and its subsidiaries.
Available Information
Our website address is www.ntelos.com. We use our website as a channel of distribution for company information. We make available free of charge on the Investor Relations section of our website (http://ir.ntelos.com) our Annual Report on Form 10-K, Quarterly Reports on Form 10-Q, Current Reports on Form 8-K, and all amendments to those reports as soon as reasonably practicable after such material is electronically filed with or furnished to the SEC pursuant to Section 13(a) or 15(d) of the Exchange Act. We also make available through our website other reports filed with or furnished to the SEC under the Exchange Act, including our proxy statements and reports filed by officers and directors under Section 16(a) of the Exchange Act, as well as our Code of Business Conduct and Ethics. Financial and other material information regarding the Company is routinely posted on and accessible at http://ir.ntelos.com. We do not intend for information contained in our website to be part of this Annual Report on Form 10-K. Any materials we file with the SEC may be read and copied at the SEC’s Public Reference Room at 100 F Street, NE, Washington, DC, 20549. Information on the operation of the Public Reference Room may be obtained by calling the SEC at 1-800-SEC-0330. The SEC maintains an Internet site (http://www.sec.gov) that contains reports, proxy and information statements and other information regarding issuers that file electronically with the SEC.
Item 1. | Business. |
General
We are a leading regional provider of digital wireless communications services to consumers and businesses primarily in Virginia and West Virginia, as well as parts of Maryland, North Carolina, Pennsylvania, Ohio and Kentucky. We offer wireless voice and digital data PCS products and services to retail and business customers under the “NTELOS Wireless” and “FRAWG Wireless” brand names. We conduct our business through NTELOS-branded retail operations, which sell our products and services via direct and indirect distribution channels, and provide network access to other telecommunications carriers, most notably through an arrangement with Sprint Spectrum L.P. (“Sprint Spectrum”), and Sprint Spectrum on behalf of and as an agent for SprintCom, Inc. (“SprintCom”) (Sprint Spectrum and SprintCom collectively, “Sprint”), which arrangement is referred to herein as the “Strategic Network Alliance” or the "SNA".
We conduct all of our business through our wholly-owned subsidiary NTELOS Inc. and its subsidiaries. Our principal executive offices are located at 1154 Shenandoah Village Drive, Waynesboro, Virginia 22980. The telephone number at that address is (540) 946-3500.
For a detailed review of our financial condition and results of operations, see Part II, Item 7. Management’s Discussion and Analysis of Financial Condition and Results of Operations of this Annual Report on Form 10-K.
Sale of Virginia East Spectrum and Wind Down of Eastern Markets
On December 2, 2014, we announced that we would focus our business operations exclusively in our Western Markets, as defined in the table below, where we have experienced strong operating performance, have a favorable competitive position for our branded retail offering and where we benefit operationally and financially from our SNA with Sprint. In connection with this refocus, we entered into an agreement, on December 1, 2014, to sell our 1900 MHz PCS wireless spectrum licenses in our eastern Virginia and Outer Banks of North Carolina markets (“Eastern Markets”), including Richmond and Hampton Roads/Norfolk, to T-Mobile License LLC (“T-Mobile”) for $56.0 million. The transaction is subject to customary closing conditions, including final regulatory approval by the Federal Communications Commission ("FCC"), and is expected to close in April of 2015. In addition, we will wind down our network and retail operations in our Eastern Markets over the next year, including transitioning our subscribers to another carrier under an agency agreement. In order to facilitate the wind down of our Eastern Markets wireless operations, upon the closing of the transactions under the purchase agreement, we will enter into a lease agreement with T-Mobile pursuant to which we will be able to continue using the Eastern Market licenses for varying terms ranging from the closing date through November 15, 2015, subject to possible adjustment if the closing occurs after April 15, 2015. For additional information, see Note 1 of the Notes to Consolidated Financial Statements.
2
Our Business
Overview
We operate a 100% CDMA digital PCS network and are actively deploying fourth generation mobile communications standards / Long Term Evolution wireless technology (“4G LTE”) across our footprint in Virginia, West Virginia, and portions of Pennsylvania, Kentucky, Maryland, Ohio and North Carolina with covered POPs of approximately 6.0 million, 3.1 million in our Western Markets. We believe our strategic focus in our Western Markets, commitment to personalized local service, contiguous service area and leveraged use of our network via our wholesale contracts provide us with a differentiated competitive position relative to our primary wireless competitors, most of whom are national providers. Our strategic marketing differentiator is based upon an approach of offering each customer The Best Value in Wireless, which we define as a robust nationwide coverage area, simple, flexible wireless rate plans, and popular wireless devices.
Our coverage includes the markets listed in the table below.
Region | Covered POPs | Customers | Territories |
Western Markets | 3.1 million | 282,100 | Virginia: Charlottesville, Clifton Forge, Covington, Danville, Harrisonburg, Lynchburg, Martinsville, Roanoke, Staunton, Tazewell, Waynesboro, Winchester. West Virginia: Beckley, Bluefield, Charleston, Clarksburg, Fairmont, Huntington, Lewisburg, Morgantown, Parkersburg. Other: Cumberland, MD, Hagerstown, MD, Ashland, KY, Portsmouth, OH, Chambersburg, PA. |
Eastern Markets (1) | 2.9 million | 166,800 | Virginia: Fredericksburg, Hampton Roads/Norfolk, Richmond. North Carolina: Outer Banks. |
Total | 6.0 million | 448,900 | |
(1) Markets included in the Eastern Markets licenses sale
Spectrum Holdings
We utilize radio spectrum licensed to us by the FCC to provide our wireless broadband mobile services to our customers. The FCC has allocated spectrum in a variety of different spectrum blocks, bandwidths and geographic license areas, and we and many of our competitors utilize a combination of spectrum in the various bands to provide wireless services. We also hold licenses in seven additional basic trading areas, which currently are considered excess spectrum. We hold licenses for all of the 1900 MHz PCS spectrum used in our network. We also hold AWS and other spectrum in several of our markets that is currently not deployed and is intended to be used by mobile devices for voice, data, video and messaging services. In addition, the SNA with Sprint provides 800 MHz, 1900 MHz and 2.5 GHz spectrum to us in the SNA territory.
Retail Operations
Our customers can choose from a variety of high-speed, dependable postpay and prepay services. Our “value” proposition targets value-conscious consumers who want high-speed network service and performance, a broad array of devices and smartphones, and local customer service. It also focuses on unlimited services that include nationwide coverage through our wholesale relationship with Sprint and other roaming partners.
We currently offer approximately 37 devices across 11 brands, including Apple iPhone, Motorola, LG, Samsung and HTC products, and offer our customers smartphone operating systems such as Android and iOS. All devices are available for both postpay and prepay/no-contract services. We have also added improved communication to customers with expanded email, text and outbound calling campaigns utilizing customer relationship management platforms and predictive analytics. These initiatives support our commitment to deliver superior customer value and the best possible wireless experience. Our customer service is supported by our call centers, and our direct and indirect distribution channel which is comprised of 45 company-operated direct retail locations, 351 indirect retail distribution locations, and an additional 473 third-party payment centers. In our Western Markets, our distribution channel consists of 38 company-operated direct retail locations, 134 indirect retail distribution locations, and 348 third-party payment centers. We also offer an interactive web presence, which provides customers with access to their account, auto-pay billing service, account monitoring services such as overage text alerts and other customer care support. Advertising and marketing is geared towards enhancing brand consideration and attracting customers from other wireless carriers (“switchers”) who want comparable features and national coverage at a better value. Our primary focus has been on high-value postpay customers, data users and the higher end of the prepay market.
3
Our Postpaid offering, nControl, includes various voice, messaging, and data usage options that provide maximum flexibility and customization. Additionally, these plans have a customizable structure for families and individuals with multiple devices, with different levels of monthly device pricing for smartphones, data cards, and feature phones. In August 2014, we began offering our customers the ability to purchase devices under equipment installment plans (“EIP”). This offering allows the customer to purchase a device with zero down, provides discounts on service plans and provides the ability to upgrade more frequently than traditional plans. We have seen significant adoption rates by new and existing customers under the EIP program. We continue our deployment of our 4G LTE network, expanding our high-speed footprint into Parkersburg, Hagerstown, Harrisonburg and Winchester. We completed our build out of Beckley, Bluefield, Waynesboro and Staunton in Q4 2013.
We also market FRAWG Wireless, a no contract service intended to attract consumers who choose a prepay service option. FRAWG Wireless is a simple service offering that has a minimum number of plans, offers attractive features and provides national or regional coverage. This “no contract” option generally has a higher retail price on the device and offers a variety of competitive rate plans. Our acquisition costs per prepay customer are substantially lower than for a postpay customer due to generally lower handset, selling and advertising costs.
Service Offerings
The table below briefly describes our postpay and prepay plans and provides a breakdown of subscribers as of December 31, 2014:
Retail Subscribers | |||||
Product | Western Markets | % of Subscribers in Market | Eastern Markets | % of Subscribers in Market | Total |
Postpay | 220,100 | 78% | 90,000 | 54% | 310,100 |
Prepay | 62,000 | 22% | 76,800 | 46% | 138,800 |
Total | 282,100 | 166,800 | 448,900 | ||
Product | Description | ||
Postpay | • | Branded as NTELOS Wireless | |
• | High-speed, dependable coverage | ||
• | 1- or 2-Year service agreements that can share up to twelve lines for an additional fee | ||
• | 2 Year Equipment Installment Plan | ||
• | Usage based and unlimited plans that offer customers voice, text and data services, consisting of text and picture messaging, mobile broadband access through hotspots, and access to a variety of applications. | ||
• | Plans are offered for individuals and families and include long distance calling, caller ID, three-way calling and voicemail | ||
• | Broad array of full featured handsets and smartphones, including popular brands such as Apple, Samsung, LG, Motorola and HTC | ||
Prepay | • | Branded as FRAWG Wireless | |
• | Usage based and unlimited nationwide voice, text and data services | ||
• | Prepackaged version of FRAWG Wireless includes a handset and a month of service in a “grab and go” package that can be found at convenience stores and neighborhood retailers | ||
• | Monthly charges are paid in advance using most accepted forms of payment via web, handset app, interactive voice response, phone or in person | ||
• | Other data service offerings consist of text and picture messaging, mobile broadband access and mobile hotspots, and access to a variety of applications, including games, ring tones and other mobile applications | ||
4
Sales, Marketing and Customer Care
With U.S. wireless penetration exceeding 100%, we primarily target switchers as well as customers interested in high speed, dependable coverage, by offering competitive plans in both the postpay and prepay markets. With our high-speed dependable network, we provide services to not only the consumer market, but also to small/medium sized enterprises and the education, municipal and medical vertical markets.
Marketing efforts are focused on building brand consideration and driving value-conscious consumers to our company-operated direct retail locations, indirect agent locations, inside sales associates and e-commerce. The Company uses a blended media strategy that includes print, broadcast, direct mail, billboard, digital and social media to reach potential customers. Messaging is focused primarily on our value proposition which features comparable savings for dependable coverage and popular handsets at affordable prices. We also have added features and improved communication to customers with expanded email, text and outbound calling campaigns utilizing predictive analytics. These initiatives support our commitment to deliver superior customer value and the best possible wireless experience.
We continue to be committed to improving our distribution strategy with respect to both postpay and prepay service offerings. We have focused resources on enhancing our direct distribution channel by refining our store locations, appearance and customer service experience. We also enhanced our selling process with improvements in activation speeds, competitive rate plan analytics and retail store leader training.
Our direct distribution is supplemented by two master agents and two NTELOS-branded dealers. Our master agent program allows us to recruit experienced master agents, introduce the “Exclusive Retail Partner program” that we believe enhances our brand positioning with additional branded retail locations, and recruit experienced multi-unit retailers.
We operate as a single virtual call center, minimizing headcount and providing uniform customer service across our region. We provide customer care representatives with incentives to sell additional products and features. We utilize a loyalty/retention team to focus on renewing or responding to our customers. Business operations are supported by an integrated systems infrastructure which allows for consistent customer interactions. Our web presence enhances the experience for our customers desiring self care services and it also enables a fully integrated shopping cart. In addition, we measure customer satisfaction through transactional net promoter score reporting in both retail and customer care touch points.
Wholesale Operations
We provide wireless digital PCS services on a wholesale basis to other PCS providers, most notably through the SNA with Sprint in which we are the exclusive wholesale provider of wireless services in our western Virginia and West Virginia service area for all Sprint CDMA and LTE wireless customers. In May 2014 the parties entered into an amended agreement to extend the SNA through at least December 2022. Pursuant to the terms of the SNA, we are required to upgrade our network in the SNA service area to provide LTE services. As part of the amendment, we lease spectrum, on a non-cash basis, from Sprint in order to enhance the PCS/LTE services. The non-cash consideration attributable to the leased spectrum is approximately $4.9 million per year. The lease expense is recognized over the term of the lease and recorded within cost of sales and services, with the offsetting consideration recorded within wholesale and other revenue. Additionally, the amended SNA provides us access to Sprint’s nationwide 3G and 4G LTE network at rates that are reciprocal to rates paid by Sprint under the amended SNA. The amended SNA provides that a portion of the amount paid by Sprint thereunder is fixed. The fixed fee element of the amended SNA is subject to contractual reductions on August 1, 2015 and annually thereafter starting on January 1, 2016 that will result in a decrease of payments for the fixed fee element. We account for this fixed fee portion of the revenue earned from the SNA revenue on a straight line basis over the term of the agreement. In addition, these reductions are subject to further upward or downward resets in the fixed fee element. These resets, if any, will be recognized in the period in which it occurs.
Fixed Wireless Broadband Trial
In October 2013 we executed an agreement with a wholly-owned subsidiary of DISH Network Corporation (“DISH”) to co-develop a fixed wireless broadband service. We announced the launch of the trial network in July 2014, which brought the pilot program to portions of the following markets: Roanoke, Staunton, Waynesboro and Charlottesville, Virginia covering approximately 400,000 residents. The business and technical evaluation of the pilot program is ongoing.
Network Technology
As of December 31, 2014, we had 1,453 cell sites in operation and we owned 122 of these cell sites and leased the remaining 1,331 cell sites (approximately 92%). Of the leased cell sites, 614 (approximately 46%) are installed on structures controlled by two tower companies, Crown Communications and American Tower. The MLA with Crown Communications commenced in 2000 and 2001 with an initial 5-year term with three optional 5-year renewal terms and was renewed for the second of three 5-
5
year lease renewal terms in 2010 and 2011. Additionally, we entered into a MLA with American Tower in 2001 with an initial lease term of 12 years and three optional 5-year renewal terms. The MLA with American Tower was renewed for the first of three 5-year lease renewal terms in 2013. In January 2015, we announced that we entered into a definitive agreement to sell up to 103 towers for approximately $41.0 million. The agreement provides that we will enter into long term lease agreements on the sold towers that are located in our Western Markets. For additional information, see Note 17 of the Notes to Consolidated Financial Statements.
We are continuing to make network improvements, particularly within our existing service coverage areas, which includes upgrading our network to 4G LTE. We launched 4G LTE in several markets in the fourth quarter of 2013 and continued the deployment during 2014. At December 31, 2014, we had approximately 3.2 million LTE Covered POPs, or 54% of our total 6.0 million covered POPs.
Switching Centers
We employ three MSCs, one is located in the Virginia East region, which will close as part of the wind down of the Eastern Markets, one is in the Virginia West region and one is in West Virginia. All MSC facilities are company-owned with the exception of one West Virginia facility, which is leased. The MSCs house all of our core switching and routing equipment that is used for processing voice calls and data services. The MSCs also house adjunct platforms that enable services including text messaging, voicemail, picture messaging, and over-the-air functionality (the ability to download information to the handset via our wireless network).
Network Performance
We set high network performance standards and continually monitor network quality metrics, including dropped call rates and blocked call rates. We currently exceed Sprint’s network performance standards, as established in the SNA, in the regions underlying the SNA.
Competition
The retail market for wireless broadband mobile services is highly competitive. We compete directly with other facilities and non-facilities based wireless broadband mobile and fixed service providers, wireline, internet, cable, satellite and other communications service providers. We believe that competition for customers among wireless broadband providers is based on price, service area, brand awareness and reputation, services and features, handset selection, call quality and customer service. In 2014, we saw continued emphasis by our postpay competitors on selling bundled services, which include voice, text and LTE data, as well as expanding unlimited nationwide services, often at reduced prices. Our value proposition in the postpay market competes with several nationwide and regional carriers including AT&T, Sprint, Verizon, T-Mobile and U.S. Cellular, as well as a number of reseller/affiliates of some or all of these companies. These competitors have financial resources, marketing resources, brand awareness, equipment availability, and customer bases significantly greater than ours. We expect postpay competition to continue to be intense as carriers focus on taking market share from competitors.
Competition in the prepay market space has continued to intensify, particularly with aggressively-priced, nationwide, unlimited plan offerings by our competitors. In addition, our competitors continue to significantly increase their points of distribution and advertising. These competitors have access to a large number of points of distribution, including large big box retailers. We also face competition from companies that resell prepay wireless service to customers but do not hold FCC licenses or own their own networks, referred to as MVNOs. These competitors include, but are not limited to Boost, Straight Talk, Virgin Mobile, TracFone, Simple Mobile and Net10. We differentiate ourselves from our competitors by offering high value products and plans, dependable high-speed nationwide services and by providing local customer service and retail support coupled with a strong commitment to the community.
Employees
As of December 31, 2014, we had approximately 854 employees. None of our employees are covered by a collective bargaining agreement or represented by an employee union. We believe that we have good relations with our employees.
Regulation
The following summary does not describe all present and proposed federal, state and local legislation and regulations affecting the telecommunications industry. Some legislation and regulations are currently the subject of judicial proceedings, legislative hearings and administrative proposals which could change the manner in which this industry operates. Neither the outcome of any of these developments, nor their potential impact on us, can be predicted at this time. Regulation can change rapidly in the telecommunications industry, and such changes may have an adverse effect on us in the future. See “Risk Factors” described in Item 1A. of this Annual Report on Form 10-K.
6
Overview
Our communications services are subject to varying degrees of federal, state and local regulation. Under the federal Communications Act, as amended, the FCC has jurisdiction over interstate and international common carrier services, over certain aspects of interconnection between carriers, and over the allocation, licensing, and regulation of wireless services. In 1996, Congress enacted the Telecommunications Act of 1996, which amended the Communications Act and mandated significant changes in telecommunications rules and policies to promote competition, ensure nationwide availability of telecommunications services and to streamline regulation of the telecommunications industry to remove regulatory burdens as competition develops.
In addition to FCC regulation, our communications services are regulated to different degrees by state public service commissions and by local authorities. Such local authorities have jurisdiction over public rights of way, video franchises, and zoning for antenna structures. The FAA regulates the location, lighting and construction of antenna structures. We also are subject to various other federal laws and regulations, including privacy, antitrust, environmental, labor, wage, health and safety, personal information laws and regulations as set forth by the FTC, the Environmental Protection Agency, the Occupational Safety and Health Administration and state and local regulatory agencies and legislative bodies.
Our wireless operations are subject to various federal and state laws intended to protect the privacy of customers who subscribe to our services. The FCC has regulations that place restrictions on the permissible uses that we can make of customer-specific information, known as Customer Proprietary Network Information, received from subscribers and that govern procedures for release of such information. On November 1, 2008, the FTC’s “Red Flag” rules went into effect and the FTC began to enforce those rules on December 31, 2010. Among other requirements, the Red Flag rules require companies to develop and implement written Identity Theft Prevention programs. The FTC is considering additional regulations governing on-line behavioral marketing and consumer privacy. Congress, federal agencies and states also are considering imposing additional requirements on entities that possess consumer information to protect the privacy of consumers. In February 2013, the President of the United States issued an executive order which establishes additional measures for the voluntary sharing of cyber security information, requires certain critical industry participants to adopt certain cyber security measures, and potentially may limit participation in government contracts to companies which have adopted certain cyber security measures.
Many of the services we offer are unregulated or subject only to minimal regulation. Internet services are not considered to be common carrier services, although the regulatory treatment of certain internet services, including VoIP services, is evolving and still uncertain. To date, the FCC has, among other things, directed providers of certain VoIP services to offer Enhanced 911 (“E-911”) emergency calling capabilities to their subscribers, applied the requirements of CALEA to these VoIP providers, and determined that the VoIP providers are subject to federal universal service assessments. The FCC has preempted states from exercising entry and related economic regulation of nomadic VoIP providers, but the FCC has not preempted state regulation of fixed VoIP service commonly offered by cable operators.
Regulation of the Wireless Communications Industry
Pursuant to 1993 CMRS amendments to the Communications Act, certain service providers over cellular, personal communications, advanced wireless, and 700 MHz spectrum are classified as commercial mobile radio services because they are offered to the public and are interconnected to the public switched telephone network. Consequently, our wireless services are generally classified as CMRS and are subject to FCC regulation. The states are preempted from engaging in entry or rate regulation of CMRS, although the states may regulate other terms and conditions of CMRS offerings including customer billing, termination of service arrangements, advertising, certification of operation, use of handsets when driving, service quality, sales practices, and management of customer call records.
The licensing, construction, modification, operation, sale, ownership and interconnection arrangements of wireless communications networks are regulated to varying degrees by the FCC, Congress, state regulatory agencies, the courts and other governmental bodies. Some examples of the kinds of regulation to which we are subject are presented below. A failure to maintain compliance with the Communications Act and/or the FCC’s rules could subject us to fines, forfeitures, license revocations, license conditions or other penalties.
Licensing of PCS Systems
In general, PCS licenses, such as those held by our subsidiaries, were originally awarded for specific geographic market areas and for one of six specific spectrum blocks. The geographic license areas utilized included basic trading areas and collections of basic trading areas known as major trading areas, although geographic partitioning policies have permitted licensees to subdivide and transfer those original licenses into other geographic areas. The spectrum blocks awarded were originally either 30 MHz or 10 MHz licenses, although spectrum disaggregation rules have permitted licensees to subdivide such licenses into smaller spectrum blocks.
7
All PCS licenses have a 10-year term, at the end of which they must be renewed. Between 2005 and 2009, we applied for and were granted renewal of all of our PCS licenses.
PCS Construction Requirements
All PCS licensees must satisfy build-out deadlines and geographic coverage requirements within five and/or ten years after the license grant date. Under the FCC’s original rules, these initial requirements are met for 10 MHz licenses when adequate service is offered to at least one-quarter of the population of the licensed area, or the licensee provides substantial service, within five years, and for 30 MHz licenses when adequate service is offered to at least one-third of the population within five years and two-thirds of the population within ten years. The FCC’s policies have now been modified, however, and 30 MHz licensees are permitted to make a demonstration of substantial service to meet the ten year build-out requirement. Failure to comply with these coverage requirements could cause the revocation or non-renewal of a provider’s wireless licenses or the imposition of fines and/or other sanctions.
AWS Licenses
In 2006, we acquired additional licenses in an auction conducted by the FCC for AWS spectrum in the 1710-1755 MHz and 2110-2155 MHz bands. The FCC regulations applicable to these licenses are generally similar to those applied to our PCS licenses, although our AWS licenses have a longer term (15 years) and are not subject to any construction requirements other than the requirement that we provide substantial service at renewal. Like other auctioned AWS licenses, the licenses we acquire are subject to the rights of certain incumbents, including Federal government systems and microwave radio users. For the most part, Federal government users will transition their operations out of the band through a multiyear process funded through proceeds from the auction itself. The non-government users would have to be relocated by us if our AWS deployments would interfere, and we may incur cost-sharing obligations even if we deploy services on our AWS spectrum after the links are relocated.
The FCC’s rules provide a formal presumption that PCS and AWS licenses will be renewed, called a “renewal expectancy,” if the licensee (1) has provided substantial service during its past license term, and (2) has substantially complied with applicable FCC rules and policies and the Communications Act. The FCC defines substantial service as service which is sound, favorable and substantially above a level of mediocre service that might only minimally warrant renewal. If a licensee does not receive a renewal expectancy, then the FCC will accept competing applications for the license renewal period and, subject to a comparative hearing, may award the license to another party. In 2011, the FCC released an NPRM proposing to establish more consistent requirements for renewal of licenses, uniform policies governing discontinuances of service, and to clarify certain construction obligations across all of the wireless service bands. The proposed changes to the applicable renewal and discontinuance of service requirements may be applied to existing licenses that will be renewed in the future. We are unable to predict with any certainty the likely timing or outcome of this wireless renewal standards proceeding.
Transfer and Assignment of PCS and AWS Licenses
The Communications Act and FCC rules require the FCC’s prior approval of the assignment or transfer of control of a license for a PCS or AWS system, with limited exceptions, and the FCC may prohibit or impose conditions on assignments and transfers of control of licenses. Non-controlling interests in an entity that holds an FCC license generally may be bought or sold without FCC approval. Although we cannot be certain that the FCC will approve or act in a timely fashion upon any future requests for approval of assignment or transfer of control applications that we file, we have no reason to believe that the FCC would not approve or grant such requests or applications in due course. In the course of such review, we further note that the FCC engages in a case-by-case competitive review of transactions that involve the consolidation of spectrum licenses. Because an FCC license is necessary to lawfully provide PCS and/or AWS service, if the FCC were not to approve any such filing, our business plans would be adversely affected. The FCC in June 2014 adopted an Order which updated the spectrum screen that the FCC uses in order to conduct its competitive review of proposed secondary market transactions. The FCC’s Order continued the FCC’s policy of conducting case-by-case analysis of a combined entity's spectrum screen holdings for proposed transactions, revised its existing spectrum screen to reflect the current suitability and availability of spectrum for mobile wireless services, and adopted certain limitations with respect to the purchase and transfer of 600 MHz spectrum. Various parties have filed petitions for reconsideration of this FCC Order, and we are unable to predict with any certainty the likely timing or outcome of these petitions. On December 1, 2014 we entered into an agreement to sell our 1900 MHz PCS wireless spectrum in our Eastern Markets to T-Mobile. This transaction is pending FCC approval. For additional information, see Note 1 of the Notes to Consolidated Financial Statments.
Foreign Ownership
Under existing law, no more than 20% of an FCC CMRS licensee’s capital stock may be owned, directly or indirectly, or voted by non-U.S. citizens or their representatives, by a foreign government or its representatives or by a foreign corporation. If an
8
FCC CMRS licensee is controlled by another entity, as is the case with our ownership structure, up to 25% of that entity’s capital stock may be owned or voted by non-U.S. citizens or their representatives, by a foreign government or its representatives or by a foreign corporation. Foreign ownership above the 25% holding company level may be allowed should the FCC find such higher levels not inconsistent with the public interest. The FCC has ruled that higher levels of foreign ownership in CMRS licensees, even up to 100%, are presumptively consistent with the public interest with respect to investors from certain nations who are members of the World Trade Organization. If our foreign ownership were to exceed the permitted level, the FCC could revoke our wireless licenses, although we could seek a declaratory ruling from the FCC allowing the foreign ownership or take other actions to reduce our foreign ownership percentage in order to avoid the loss of our licenses. We have no knowledge of any present foreign ownership in violation of these restrictions. In 2013, the FCC streamlined its policies and procedures for reviewing foreign ownership of U.S. companies with common carrier licenses, such as ourselves, under the Communications Act.
E-911 Services
The FCC requires CMRS carriers to make available basic 911 and E-911 emergency services to subscribers that provide the caller’s telephone number and detailed location information to emergency responders, and to make available 911 emergency services to users with speech or hearing disabilities. Our obligations to implement these services occur in phases and on a market-by-market basis as emergency service providers request the implementation of E-911 services in their locales. In January 2011, FCC rules took effect that require us and other carriers using handset-based technologies for E-911 location purposes to eventually transmit, within 50 meters, the location of the caller in 67% of calls made in the carrier’s choice of either a county or a PSAP area and to transmit, within 150 meters, the location of the caller in 80% of the calls made in either such county or PSAP area. Carriers have two years from the effective date of the new rules to implement these requirements and may exclude 15% of counties or PSAP heavily forested areas. These rules reflect a general consensus between the wireless industry and the public safety community. The FCC also has issued an NPRM seeking comment on potential future modifications and enhancements to the current rules, including additional rules regarding location accuracy. In 2013, the FCC adopted rules requiring wireless carriers, such as ourselves, and certain other text messaging service providers to send an automatic ‘bounce-back’ text message to consumers who try to text 911 where text-to-911 is not available, indicating the unavailability of such services. In August 2014, the FCC required all wireless carriers, such as ourselves, as well as other providers of interconnected text messaging applications, to be capable of supporting text-to-911 service by December 31, 2014, and to provide such service to requesting PSAPs by June 30, 2015 or six months after a request from a PSAP, whichever is later. The FCC has also sought further comment regarding additional regulations pertaining to the provision of text-to-911 service.
Local Number Portability
FCC rules also require that local exchange carriers and most CMRS providers, including PCS and AWS providers, allow customers to change service providers without changing telephone numbers. For CMRS providers, this mandate is referred to as wireless local number portability. In addition, the FCC has adopted rules governing the porting of wireline telephone numbers to wireless carriers and vice versa. Number portability makes it easier for customers to switch among carriers.
Reciprocal Compensation
FCC rules provide that all telecommunications carriers are obligated, upon reasonable request, to interconnect directly or indirectly with the facilities and networks of other telecommunications carriers. All LECs also must, upon request, enter into mutual or reciprocal compensation arrangements with CMRS carriers for the exchange of local traffic. As a CMRS provider, we are required to pay reciprocal compensation under such arrangements to a wireline LEC that transports and terminates a local call that originated on our network. Under the revised intercarrier compensation regime adopted by the FCC in October 2011, where there is no pre-existing agreement between a CMRS carrier and a LEC for the exchange of local traffic, such traffic between CMRS providers and most LECs is to be compensated pursuant to a default bill-and-keep regime. We negotiate interconnection agreements for our network with major incumbent LECs and smaller rural LECs. Negotiated interconnection agreements are subject to state approval. If an agreement cannot be reached, parties to interconnection negotiations can submit outstanding disputes to state authorities or the FCC, as appropriate, for arbitration. The FCC’s interconnection rules and rulings, as well as state arbitration proceedings, will directly impact the nature and costs of facilities necessary for the interconnection of our network with other telecommunications networks. They also will determine the amount of revenue we receive for terminating calls originating on the networks of LECs and other telecommunications carriers. The FCC’s new intercarrier compensation rules may affect the manner in which we are charged or compensated for the exchange of traffic. The FCC’s overhaul of the rules governing intercarrier compensation currently are subject to a petition before the United States Supreme Court, as well as various petitions for reconsideration before the FCC. We cannot predict with any certainty the likely timing or outcome of such petitions.
9
Universal Service
Pursuant to the Communications Act, all telecommunications carriers that provide interstate and/or international telecommunications services, including CMRS providers, are required to make an “equitable and non-discriminatory contribution” to support the cost of federal universal service programs. In addition, providers of interconnected VoIP services must contribute. These programs are designed to achieve a variety of public interest goals, including affordable telephone service nationwide, as well as subsidizing telecommunications services for schools and libraries. Contributions are calculated on the basis of each carrier’s interstate and international retail telecommunications revenue. The FCC is currently examining the way in which it collects carrier contributions to the USF, including a proposal to base collections on the number of telephone numbers or network connections in use by each carrier. An assessment mechanism based on numbers or network connections could increase the contributions to the USF by wireless and local exchange carriers, while reducing contributions from long distance service providers.
We receive funding from the federal USF in Virginia, West Virginia and Kentucky. In 2011, the FCC adopted wide ranging revisions to its universal service distribution rules. We cannot predict with any certainty the effect any such revisions will have on our business or on our ability to collect USF funds in the future. The FCC’s overhaul of the rules governing the distribution of USF currently are subject to a petition before the United States Supreme Court, as well as various petitions for reconsideration before the FCC. We cannot predict with any certainty the likely timing or outcome of such petitions.
Universal Service Mobility Fund Support
In October 2011, the FCC released an Order reforming the USF program, which previously has provided support to carriers seeking to offer telecommunications service in high-cost areas and to low-income households. As part of these reforms, the FCC announced that beginning in June 2012 it will phase out existing Universal Service support at a rate of 20% per year over the next five years. It also created two new replacement funds, the Connect America Fund and the Mobility Fund, both of which allow for the provisioning of USF funds for broadband services, in addition to voice services. The new funds are intended to provide targeted financial support to areas that are unserved or underserved by voice and broadband service providers and will be initiated during the phase out of USF support. In addition, the FCC is seeking further comment on a number of additional issues regarding the implementation of its USF overhaul.
During this five year phase-out period, the FCC will begin to distribute funds through new mechanisms associated with the Connect America Fund and the Mobility Fund. In July 2012, the FCC initiated the application process for the Mobility Fund I program, a reverse auction for a one-time distribution of up to $300 million intended to stimulate 3G and 4G wireless coverage in unserved and underserved geographic areas. These funds will be distributed to winning bidders who commit to comply with certain FCC construction and other requirements associated with the distribution of such funds.
West Virginia PCS Alliance, L.C., our subsidiary, participated in the Mobility Fund I reverse auction on September 27, 2012. On October 3, 2012, the FCC announced that we had bid successfully for approximately $5.0 million of Mobility Fund I support. In June 2013, the FCC authorized Mobility Fund Support for our winning bid, which allowed for the first disbursement of funds to us, in the amount of approximately $1.7 million. These funds will allow us to expand our voice and broadband networks in certain geographic areas in order to offer either 3G or 4G coverage.
CALEA
CALEA requires all telecommunications carriers, including wireless carriers, to ensure that their equipment is capable of permitting the government, pursuant to a court order or other lawful authorization, to intercept any wire and electronic communications carried by the carrier to or from its subscribers. CALEA remains subject to FCC implementation proceedings. Compliance with the requirements of CALEA, further FBI requests, and the FCC’s rules could impose significant additional direct and/or indirect costs on us and other wireless carriers.
Roaming
In 2007, the FCC adopted a requirement that CMRS carriers permit other CMRS carriers’ customers to “roam” on their systems, holding that automatic in-market voice roaming is a common carrier service obligation for such carriers and that CMRS carriers must provide certain automatic voice roaming services to other CMRS carriers upon reasonable request and on a just, reasonable and nondiscriminatory basis. In an order adopted in April 2010, the FCC extended this requirement for automatic voice roaming to apply in markets in which the carrier seeking to roam holds an FCC license even if such carrier has yet to build out its network in such a market. In 2011, the FCC found that the automatic roaming obligation should be extended to non-CMRS services, such as wireless Internet access services, which is an information service. The FCC found that automatic data roaming shall be offered by providers of such services to requesting carriers on a commercially reasonable basis, when technologically compatible and economically feasible.
10
Tower Siting
Under the Communications Act, state and local authorities maintain authority over the zoning of sites where our antennas are located. They are permitted to manage public rights of way and they can require fair and reasonable compensation for use of such rights of way. These authorities, however, may not legally discriminate against or prohibit our services through their use of zoning authority. The FCC adopted rules that are intended to expedite siting decisions by state and local authorities, but the rules currently are subject to appeal before the United States Supreme Court. Wireless networks also are subject to certain FCC and FAA regulations regarding the location, marking, lighting and construction of transmitter towers and antennas and are subject to regulation under the NEPA, the National Historic Preservation Act, and various environmental regulations. Compliance with these provisions could impose additional direct and/or indirect costs on us and other licensees. The FCC’s rules require antenna structure owners to notify the FAA of structures that may require marking or lighting, and there are specific restrictions applicable to antennas placed near airports. FCC regulations implementing NEPA place responsibility on each applicant to investigate any potential environmental effects of a proposed operation, including health effects relating to radio frequency emissions, and impacts on endangered species such as certain migratory birds, and to disclose any significant effects on the environment to the agency prior to commencing construction. In the event that the FCC determines that a proposed tower would have a significant environmental impact, the FCC would require preparation of an environmental impact statement. In some jurisdictions, local laws, zoning or land-use regulations may impose similar requirements.
Network Neutrality Regulations
In December 2010, the FCC adopted network neutrality regulations that apply to broadband wireless Internet access services, including those offered by us. The transparency rule, which applies to both fixed and mobile wireless Internet access service providers, requires providers to make available relevant information regarding network management practices to the consumers who purchase their services and to content, application and service providers who seek access to a carrier’s network. Mobile wireless broadband Internet providers also would not be able to block consumers from accessing lawful websites, nor block applications that compete with the provider’s voice or video telephony services, subject to a reasonable network management exception. In early 2014, the Court of Appeals for the District of Columbia vacated all of the network neutrality regulations as currently constituted, with the exception of the transparency rule, which remains in effect, as exceeding the FCC’s authority. The FCC, has sought comment on the adoption of additional network neutrality rules that would be consistent with the Court's ruling. In doing so, the FCC has noted that it is considering the application of stricter regulations on wireless providers than it adopted in 2010, as well as the potential reclassification of broadband Internet access as a Title II services. The FCC also noted that it is committed to the principles of network neutrality and would be vigilant in monitoring carrier actions. We cannot predict with any certainty the likely timing or outcome of any FCC action.
Miscellaneous
We also are subject or potentially subject to numerous regulatory requirements, including, paying regulatory fees; number administration; number pooling rules; rules governing billing; cramming; technical coordination of frequency usage with adjacent carriers; height and power restrictions on our wireless transmission facilities; rules regarding radio frequency limits; outage reporting rules; and rules requiring us to offer equipment and services that are hearing aid compatible and accessible to and usable by persons with disabilities. Some of these requirements pose technical and operational challenges to which we, and the industry as a whole, have not yet developed clear solutions. We are unable to predict how they may affect our business, financial condition or results of operations. A number of wireless providers have been investigated by both the FTC and FCC for, and paid significant fines in connection with, the provision of unauthorized premium text messaging services, a practice known as cramming. Both the FTC and FCC have warned wireless carriers that they will be vigilant in prosecuting such practices. In addition, a number of states and localities have banned, or are considering banning or restricting, the use of wireless phones while driving a motor vehicle. Texting while driving in Virginia is prohibited. West Virginia prohibits text messaging and use of handheld cell phones while driving, although use of hands-free devices is allowed.
11
Item 1A. | Risk Factors. |
RISK FACTORS
The following risk factors and other information included in this Annual Report on Form 10-K should be carefully considered. The risks and uncertainties described below are not the only ones we face. Additional risks and uncertainties not presently known to us or that we currently deem immaterial also may adversely impact our business operations. Our business, financial condition or results of operations could be materially adversely affected by any or all of these risks.
Increased competition and new market entrants in the wireless industry could materially adversely affect our business, financial condition and operating results.
Competition in the wireless industry is currently intense and is expected to continue to be intense. Our competition is led by the four largest nationwide providers of wireless services dominating the market. Our competition in the markets we serve have significantly greater resources than us, which could put us at a disadvantage in such things as product offerings, pricing, and roaming services. Additionally, new entrants have recently announced their intentions to compete for wireless subscribers, including cable companies and Google, potentially further increasing the competitive landscape. Our ability to effectively compete in this highly competitive market could adversely affect our business, financial condition and operating results.
If we are unable to attract and retain subscribers, our financial performance could be materially adversely affected.
We are primarily in the business of selling wireless communications services to subscribers, and our success in that business is based on our ability to attract new subscribers and retain current subscribers. Our business strategy to attract and retain subscribers historically has been to differentiate our regional brand relative to our primary competitors, most of whom are national providers, based on offering our customers savings and service. Although attracting new subscribers and retaining existing subscribers are both important to the financial viability of our business, there is an added focus on customer retention because the costs of adding a new subscriber, including but not limited to commissions, equipment subsidies and other sales incentives, are significantly higher than the costs associated with retaining an existing subscriber.
If our business strategy is unsuccessful and we are unable to differentiate our products and services from those offered by our competitors, we may have difficulty attracting new customers and retaining current subscribers, which could adversely affect our business, financial condition and operating results due to reduced revenues and higher operating costs.
The telecommunications industry is generally characterized by rapid development and technological innovations, which could increase our operating costs and diminish our ability to attract and retain subscribers, and have an adverse effect on our business, financial condition and operating results.
The telecommunications industry has been, and we believe will continue to be, characterized by several trends, including the rapid development and introduction of new technologies and services, including but not limited to 4G LTE, voice over WiFi or other technologies. A number of our competitors have deployed next generation technologies that are focused on the provisioning of mobile data services with higher speeds, which increasingly are becoming a critical component of many wireless service provider offerings. We believe our continued success will depend, in part, on our ability to anticipate or adapt to technological changes, to complete our 4G network upgrade plan, and to offer, on a timely basis, services that meet customer demands.
As new technologies are developed and deployed by competitors in our service area, some of our subscribers may select other providers’ offerings based on price, capabilities and personal preferences. We may not be able to respond to future changes and obtain access to new technologies on a timely basis or at an acceptable cost. To accommodate the next generation of applications and streaming video speeds significantly above that of our current technology will require substantial technological changes to our network and may require additional spectrum in certain markets. The development of these new technologies, products and services may cause us to incur considerably more in capital expenditures and incremental operating costs than we have anticipated. To the extent that we do not keep pace with technological advances, fail to offer technologies comparable to those of our competitors or fail to respond timely to changes in competitive factors in our industry, we could lose existing customers and experience a decline in revenues and net income. Each of these factors could have a material adverse effect on our business, financial condition and results of operations.
The loss of our largest wholesale customer, Sprint, could materially adversely affect our business, financial condition and operating results.
For the year ended December 31, 2014, we generated approximately 30.5% of our revenues and approximately 41.3% of our revenues in our Western Markets from the SNA with Sprint. In May 2014 the parties reached an amended agreement to extend
12
the SNA through December 2022. If we were to lose Sprint as a customer, including as a result of termination of the SNA as a result of our failure to upgrade to 4G LTE in accordance with the terms therein, or if we were unable to recognize the benefits under the SNA agreement, such as preferred device pricing and nationwide 4G LTE roaming, or if Sprint were to become financially unable to pay our charges, our business, financial condition and operating results would suffer material adverse consequences due to lost revenues and decreased cash flows.
The pricing arrangements under our SNA with Sprint may fluctuate and there could be a decrease in the usage of our networks by Sprint customers, either of which could result in a decline in our wholesale revenues.
Under the SNA, our wholesale revenues are based on usage of our network by Sprint’s customers. In May 2014 the parties reached an amended agreement to extend the SNA through December 2022. The billable fixed fee element of the new agreement is subject to contractual reductions on August 1, 2015 and annually thereafter starting on January 1, 2016 that will result in a decrease of payments for the fixed fee element. Sprint could make changes to its subscriber contracts and national calling plans that could result in a decline in its overall subscriber base or Sprint may choose to manage its customers or distribution in our territories differently or take steps that reduce customer data or voice usage of our network. Additionally, we could experience migration by Sprint of its customers to non-CDMA technology, such as WiFi offloading or see a decline in the usage of our network by Sprint if we are unable to meet their customer demand for data services or fail to successfully design, build and deploy new technologies and services. If any or all of such events were to occur, or if, for any other reason, fewer Sprint customers were using our network or we experience lower usage of our network by Sprint, we could experience reduced revenues from Sprint.
Under the SNA, there are provisions, including rate reset provisions, which could, and have, resulted in disputes from time to time. There is a dispute resolution process provided in the agreement which historically the parties have used in order to resolve open disputes. However, there can be no assurance that any future disputes will be resolved to our satisfaction and it is possible that the dispute resolution process might yield a result that would potentially lower Sprint’s payment obligations, which could have a material adverse effect on our business, financial condition and operating results.
Our largest competitors may build networks in our markets or use alternative suppliers, which may result in decreased revenues and severe price-based competition.
The national carriers are investing substantial capital to deploy the necessary equipment to deliver 4G LTE and other enhanced services, and our current roaming partners, larger wireless providers may build or expand their own wireless networks in our service areas or obtain roaming services from alternative sources. Additionally, if any current or potential roaming partner or new alternative facilities-based provider were to launch or expand networks in our markets, we could experience increased price competition and potential loss of roaming business, which would adversely affect our revenues and operating results.
Our inability to obtain or gain access to additional spectrum in the future, including the licensing of additional spectrum by the FCC, would adversely affect our ability to compete in providing wireless services.
We may need to acquire or gain access to additional spectrum in the future in order to continue our customer growth, maintain our quality of service, meet increasing customer data usage demands and deploy new technologies. The wireless industry in general is experiencing a radio spectrum shortage and there is no assurance that any additional spectrum will be made available by Congress or the FCC, through auction or otherwise, on a timely basis, on terms and conditions or under service rules that we consider suitable for our commercial uses. Any additional spectrum made available from the FCC or from third parties may not be compatible with our existing spectrum, may not be readily usable as a result of the lack of technical standards of that spectrum, or we may not be able to acquire such spectrum at a reasonable cost or at all. Furthermore, the continued aggregation of spectrum by the largest nationwide carriers who, in the past, generally have been disinclined to divest or lease spectrum in secondary market transactions, may reduce our ability to obtain or gain access to additional spectrum from other carriers. Each of these factors would have a material adverse effect on our business, financial condition and results of operations.
If suppliers or vendors, including Apple, experience problems or favor our competitors, we could fail to obtain sufficient quantities of devices and accessories, or the products and services we require to operate our network successfully.
We depend on a limited number of key suppliers and vendors, including Apple, Samsung and others, for devices and accessories. Due to the scale of our operations, we may have difficulty obtaining specific types of devices, applications and content in a timely manner, or at all. The lack of availability to us of some of the latest and most popular devices, applications, and content, whether as a result of exclusive dealings, volume discounting, or otherwise, could put us at a significant competitive disadvantage and could make it more difficult for us to attract and retain our customers, especially as our competitors continue to aggressively offer device promotions with increased features, functionality and applications.
13
Apple devices represent approximately 30.8% of all devices sold by us. Our current contract with Apple ends in April 2015. If we are unable to renew our contract at reasonable rates or renew at all, our ability to attract and retain subscribers would be materially impacted.
We also rely on a limited number of network equipment manufacturers, including Alcatel-Lucent, Cisco Systems, Inc. and others, related to our network infrastructure. If these suppliers experience manufacturing delays, interruptions or other problems delivering equipment and network components on a timely basis, our revenue and operating results could suffer significantly. Our initial choice of a network infrastructure supplier can, where proprietary technology of the supplier is an integral component of the network, cause us effectively to be locked into one or a few suppliers for key network components. If these companies experience financial or other problems, alternative suppliers and vendors may become necessary and we may not be able to obtain satisfactory and timely replacement supplies on economically attractive terms, or at all.
We may incur significantly higher wireless device and other costs than we anticipate in attracting new and retaining current subscribers.
Subscribers are purchasing data-centric devices and smartphones, including the iPhone, as technological innovations occur. The cost of these multi-functional devices continues to increase as the number of features and applications they support increase. In addition, we believe we generally pay more, on average, to purchase devices than many of our national competitors, who buy from manufacturers in larger volumes. As more subscribers purchase or upgrade to new data-centric devices and smartphones, our business, financial condition and operating results could be adversely affected during the period of the sale or upgrade.
The loss of or inability to obtain or maintain voice and/or data roaming agreements, including for 4G LTE data roaming, at cost-effective rates or at all could have a material adverse effect on our business.
We rely on roaming agreements, primarily with Sprint and also with other wireless carriers, to provide nationwide coverage. These agreements are subject to renewal and termination rights, and if such agreements are terminated or not renewed, or the rates charged to us increase substantially, we may be required to pay significant amounts of money for roaming service and we may be unable to provide competitive regional and nationwide wireless service to our customers on a cost-effective basis. If we are unable to meet our customers’ expectations for nationwide coverage for the services they want, including 4G LTE data roaming, it could reduce the number of new customers we add to our services and may increase our customer churn. In addition, many of our roaming partners are changing their technology from 3G to 4G LTE which may impact our ability to maintain 3G roaming for our customers with 3G only devices. Any inability to retain or obtain such roaming agreements, 3G and 4G LTE, at cost-effective rates may limit our ability to compete effectively for subscribers, which could materially adversely affect our business, financial condition and operating results.
Future regulatory changes also may affect our ability to enter into new or maintain existing roaming agreements on competitive terms. We have encountered substantial difficulty attempting to negotiate what we believe are reasonable roaming rates for data services with a number of national carriers. We believe this is a result of the continuing consolidation that has occurred within the telecommunications industry, which has resulted in substantial amounts of spectrum being amassed by a few industry participants. We believe that the rates charged by the largest carriers for voice and data roaming services are higher than the rates such carriers charge to other roaming partners and resellers, and in most cases higher than they charge their retail customers, and that such carriers, due to their nationwide networks, do not have the necessary incentives to provide both voice and data roaming on reasonable terms and conditions. If we are unable to negotiate reasonable voice and data roaming rates, and in the absence of regulatory action to prevent the warehousing and effective blocking of access to the use of spectrum at reasonable roaming rates, we may be unable to provide nationwide roaming services to our customers on a cost-effective basis, which could have a material adverse effect on our business.
We offer customers the ability to purchase devices under an EIP with discounted postpaid service rates and the ability to upgrade more frequently than traditional postpaid contracts, which could result in higher churn, higher bad debt expense and higher retention expense, which could materially adversely affect our business, financial condition and operating results.
In August 2014, we started offering EIP which differ from the traditional subsidized postpaid plans. These plans do not require a customer to sign a two year service agreement to obtain postpaid service, but allow the customer to finance their device over 24 months, receive a discount on the postpaid service and allow for more frequent upgrades than traditional plans. As a result of limited experience with EIP, we do not know the behavior of the customers with these plans. We could experience reduced revenues from higher churn, increased costs from additional upgrades, increased credit risk and bad debt expense, and increased marketing efforts to retain customers. In addition, allowing these customers to pay for their device over 24 months will have a negative impact on working capital. If our EIP offering strategy is ineffective, our financial condition and operating results could be materially adversely affected.
14
We rely on indirect distribution channels to sell our products and services and are concentrated with two primary third party dealers. If we are unable to attract, incentivize and retain these third-party dealers, our revenues could decline and our costs could increase.
Our indirect distribution channel generates approximately 41% of our gross adds. Additionally, two primary third-parties dealers represent approximately 76% of our total indirect gross adds. These two dealers along with the other dealers maintain approximately 351 indirect distribution retail locations, many of which are not exclusive dealers, which means that these dealers may sell other third-party products and services in direct competition with us. As more of our competitors use third-party dealers to sell their products and services, competition for dealers intensifies and larger wireless carriers may be able to switch our two primary indirect distribution dealers, as well as the other smaller dealers, to their products and services by presenting more lucrative commissions and other benefits, due to a wider variety of products and services offered by these competitors. Additionally, due to dealer mismanagement, industry trends, macro-economic developments, or other reasons, our indirect distribution agents may experience problems and may be unable to continue their operations or grow their operations. As a result, we may have difficulty attracting and retaining dealers and any inability to do so could have a negative effect on our ability to attract and obtain customers, which could have an adverse impact on our business. Additionally, a number of dealers that sell our products and services operate a significant number of separate locations. The loss of one or more of such dealers could have a material adverse impact on our business.
We will require a significant amount of cash to service our debt in future years and fund our other business needs, and may require additional capital to upgrade and operate our business, which may not be available to us on acceptable terms or at all.
Our ability to make payments on, or to refinance or repay, our debt, and to fund capital expenditures will depend largely upon our ability in the future to generate cash flows from operations, including from our wholesale relationship with Sprint, and to raise additional funds, including through the offering of equity or debt securities. Our future operating performance is subject to general economic, financial, competitive, legislative and regulatory factors, as well as other factors that are beyond our control. Our business may not generate enough cash flow, or future borrowings may not be available to us under the NTELOS Inc. Amended and Restated Credit Agreement or otherwise, in an amount sufficient to enable us to pay our debts or fund our other liquidity needs, including any unanticipated capital expenditures. Any failure to pay our debts or fund our liquidity needs could materially adversely affect our business, financial condition and results of operations.
Our substantial level of indebtedness could adversely affect our financial health and ability to compete.
As of December 31, 2014, our total outstanding debt, including capital lease obligations, was approximately $529.2 million. The significant amount of cash required to service our contractual obligations could substantially limit our resources for alternative capital needs by, among other things:
• | limiting our ability to obtain any additional financing we may need to operate, develop and expand our business; |
• | requiring us to dedicate a substantial portion of any cash flows from operations to service our debt, which reduces the funds available for operations and future business opportunities, potentially decreasing our ability to effectively compete in our industry; and |
• | exposing us to risks inherent in interest rate fluctuations because our borrowings have variable interest rates, which could result in higher interest expense if interest rates rise. |
The ability to make payments on our debt will depend upon our subsidiaries’ future operating performance, which is subject to general economic and competitive conditions and to financial, business and other factors, many of which we cannot control. If the cash flows from our subsidiaries’ operating activities are insufficient to service our debt obligations, we may take actions, such as delaying or reducing capital expenditures, reducing or terminating the amount of our stock repurchase program, attempting to restructure or refinance our debt, selling assets or operations or seeking additional equity capital. Any or all of these actions may not be sufficient to allow us to service our debt obligations. Further, we may be unable to take any of these actions on satisfactory terms, in a timely manner or at all. The NTELOS Inc. Amended and Restated Credit Agreement limits our subsidiaries’ ability to take several of these actions. Our failure to generate sufficient funds to pay our debts or to successfully undertake any of these actions could lead to our inability to repay our obligations under our indebtedness which, in turn, could have a material adverse effect on our business, financial condition and results of operations.
15
The NTELOS Inc. Amended and Restated Credit Agreement imposes operating covenants and restrictions, which may prevent us from capitalizing on business opportunities and taking some corporate actions.
The NTELOS Inc. Amended and Restated Credit Agreement imposes operating covenants and restrictions on our subsidiaries. These covenants and restrictions generally:
• | restrict our subsidiaries’ ability to incur additional indebtedness; |
• | restrict our subsidiaries from entering into transactions with affiliates; |
• | restrict our subsidiaries’ ability to consolidate, merge or sell all or substantially all of their assets; |
• | require our subsidiaries to use a portion of “Excess Cash Flow” (as defined in the agreement) to repay indebtedness if our leverage ratio exceeds specified levels; and |
• | restrict our subsidiaries’ ability to pay dividends or make advances to us to grant dividends. |
These covenants and restrictions could adversely affect our ability to pay dividends or repurchase stock, finance our future operations or capital needs or pursue available business opportunities. A breach of any of these covenants and restrictions could result in a default in respect of the NTELOS Inc. Amended and Restated Credit Agreement. If a default occurs, our indebtedness under the NTELOS Inc. Amended and Restated Credit Agreement could be declared immediately due and payable, which could have a material effect on our business, financial position, results of operations and cash flows.
If interest rates increase, our net income could be negatively affected.
We are exposed to certain market risks including the impact of interest rate changes, due to our substantial level of indebtedness. If interest rates for our long-term debt increase, our future cash interest expense could be negatively affected, which could have a material adverse effect on our business, financial condition, operating results and cash flows. See Part II, Item 7A. Quantitative and Qualitative Disclosures About Market Risk of this Annual Report on Form 10-K for more specific information related to our exposure to changes in interest rates.
Failure to maintain our credit ratings could adversely affect our liquidity, capital position, future borrowing costs and access to capital markets.
Our credit risk is evaluated by independent rating agencies, which could downgrade our credit ratings in the future. Any downgrade could affect our ability to raise money in the future or increase the cost of new borrowings. There can be no assurance that we will be able to maintain our current credit ratings, and any actual or anticipated changes or downgrades in our credit ratings, including any announcement that our ratings are under review for a downgrade, may further impact us in a similar manner and may have a negative impact on our liquidity, capital position and access to capital markets.
Acquisitions, dispositions, investments and other strategic transactions could result in operating difficulties, dilution and distractions from our core business.
In the past, we have entered, and may in the future enter, into strategic transactions, including strategic supply and service agreements and acquisitions/dispostions of other assets and businesses. Any such transactions can be risky, may require a disproportionate amount of our management and financial resources and may create unforeseen operating difficulties or expenditures.
The anticipated benefits of any of our strategic transactions may never materialize. Future investments, acquisitions or dispositions, or similar arrangements could result in dilutive issuances of our equity securities, the incurrence of debt, contingent liabilities or amortization expenses, any of which could harm our financial condition. Any such transactions may require us to obtain additional equity or debt financing, which may not be available on favorable terms, or at all.
Our success depends on our ability to attract and retain qualified management and other personnel.
Our business is led by a small number of key executive officers, and directed by a core group of senior level financial and operational management, technical and sales personnel (“qualified personnel”). We believe that our future success depends in substantial part on our continued ability to attract and retain highly knowledgeable qualified personnel. We believe that competition for highly qualified personnel is intense, and there can be no assurance that we will be successful in attracting and retaining other highly qualified personnel in the future sufficient to support our continued growth. We have experienced occasional difficulties in recruiting qualified personnel and there can be no assurance that we will not experience such difficulties in the future. In addition, at this time, the exercise price of a substantial portion of our stock options is above, and in some cases significantly above, the current trading prices of our common stock, which we believe negatively impacts our
16
retention of qualified personnel. The departure of, or our inability to attract or retain, highly qualified personnel could have a material adverse effect on our business, financial condition and operating results.
If we lose the right to install our equipment on wireless cell sites or are unable to renew expiring leases for wireless cell sites on favorable terms or at all, our business and operating results could be adversely impacted.
As of December 31, 2014, approximately 92% of our cell sites were installed on leased facilities, with approximately 46% of the leased facilities installed on facilities owned by two tower companies, American Tower and Crown Communications, pursuant to license agreements, lease agreements, master lease agreements or master license agreements that govern the general terms of our use of that company’s facilities. If a license agreement, lease agreement, master lease agreement or master license agreement with one of these tower companies were to terminate, or if one of these tower companies were unable to support our use of its facilities, we would have to find new sites or rebuild the affected portion of our network. In addition, the concentration of our cell site leases with a limited number of tower companies could adversely affect our operating results and financial condition if we are unable to renew our expiring leases with these tower companies either on terms comparable to those we have today or at all. If any of the tower companies with which we do business were to experience severe financial difficulties, or file for bankruptcy protection, our ability to use facilities leased from that company could be adversely affected. If a material number of cell sites were no longer available for our use, our financial condition and operating results could be adversely affected.
A change or disruption in our system infrastructure, including those from our third-party vendors, or our systems’ ability to support changes in technologies and services expected by customers, could materially adversely affect our business.
Sophisticated information and billing systems are vital to our ability to monitor and control costs, bill customers, process customer orders, provide customer service, capture financial data and achieve operating efficiencies. We currently rely on internal systems and third-party vendors to provide all of our information and processing systems. A disruption in our systems could be caused by aging systems and software, improperly installed new or upgraded business intelligence tools, performance issues experienced from our third party vendors, and dependency on licensing agreements. Additionally, our systems may not be able to support new technologies or changes to add and retain customers. In the event of any such disruption or inability to support technologies or expectations, we may not be able to conduct business in the normal course, which could cause a loss of customers and revenue and incur significant costs to repair or replace such systems.
In addition, we may, in the future, migrate our internal billing and point of sale systems to new third-party systems. Our inability to successfully migrate customers to new billing systems could result in billing delays and negative impacts to sales and customer service. These factors could have materially adversely affect our business.
A disruption to our operations or those of other companies critical to our network operations could cause delays or interruptions of service, which could cause us to lose revenues and incur expenses.
To be successful, we must provide our customers reliable network service. Some of the risks to our network and infrastructure include:
• | physical damage to outside plant facilities including third-party locations and network providers; |
• | power surges or outages; |
• | software defects; |
• | human error; |
• | disruptions beyond our control, including disruptions caused by terrorist activities or severe weather; and |
• | failures in operational support systems. |
Network disruptions may cause interruptions in service or reduced capacity for customers, either of which could cause us to lose revenues and incur expenses.
Unauthorized use of, or interference with, our network could disrupt service and increase our costs.
We may incur costs associated with the unauthorized use of our network including administrative and capital costs associated with detecting, monitoring and reducing the incidence of fraud. Fraudulent use of our network may impact interconnection costs, capacity costs, administrative costs, fraud prevention costs and payments to other carriers for fraudulent roaming.
17
Security breaches related to our physical facilities, and cyber-attacks or other breaches to our corporate and customer facing networks, informational databases, and third party vendors may cause harm to our business and reputation and result in a loss of customers.
Our physical facilities and information systems may be vulnerable to physical break-ins, cyber-attacks, computer viruses, theft, or similar disruptive problems that pose risk to our ability to sustain service levels and ensure data security. If hackers gain improper access to our databases, they may be able to steal, publish, delete or modify confidential personal information concerning our subscribers. In addition, misuse of our customer information could result in more substantial harm perpetrated by third parties. We maintain technical and administrative controls to reduce the risk of security breaches. However, we do experience cyber-attacks of varying degrees on a regular basis, none of which have been a material security breach. If we were to suffer a security breach, it could damage our business and reputation, and result in a loss of customers and increase in our costs.
We and our suppliers may be subject to claims of infringement regarding telecommunications technologies that are protected by patents and other intellectual property rights.
In general, we do not manufacture any of the equipment or software used in our telecommunications businesses and we do not own any patents. Instead, we purchase the infrastructure equipment, handsets and software used in our business from third parties and we obtain licenses to use the associated intellectual property. Telecommunications technologies are protected by a wide variety of patents and other intellectual property rights. We and some of our suppliers and service providers may receive assertions and claims from third parties that the products or software utilized by us or our suppliers and service providers infringe on the patents or other intellectual property rights of these third parties. These claims could require us or an infringing supplier or service provider to cease certain activities or to cease selling the relevant products and services. The manufacturers and suppliers that provide us with the equipment and technology we use in our business may agree to indemnify us against possible infringement claims. However, we do not always have such indemnification protections in place and, even if we have such agreements in place, we may not be fully protected against all losses associated with infringement claims. In addition, the manufacturers and suppliers also may require us to indemnify them against infringement claims asserted against them with respect to equipment they sell to us. Whether or not infringement claims are valid or successful, such claims could adversely affect our business by diverting management attention, involving us in costly and time-consuming litigation, requiring us to enter into royalty or licensing agreements (which may not be available on acceptable terms, or at all), or requiring us to cease certain activities or to cease selling certain products and services to avoid claims of infringement.
If our long-lived or indefinite lived assets become impaired, it would materially adversely affect impact our operating results.
We test long-lived assets and intangibles subject to amortization for impairment when events and circumstances warrant. We test goodwill and other indefinite-lived intangible assets for impairment annually or whenever events or changes in circumstances warrant. Factors that may be considered a change in circumstances include declines in stock price, market capitalization, financial performance, or expectation of selling or disposing of an asset group or reporting unit. We are required to record a significant charge to earnings during the period in which any impairment was determined, negatively impacting our results of operations. As further described in Notes 6 and 7 of the Notes to Consolidated Financial Statements, the Company has recorded the impairment charge on certain of its long-lived and indefinite-lived assets.
The impact of economic downturns or other conditions leading to a decline in consumer discretionary spending may harm our business and materially adversely impact our operating results.
The impact of economic downturns on our customers, including unemployment and disruptions to the credit and financial markets, could cause customers to reduce spending. If demand for our services decreases, deactivations might increase and our revenues could be affected. In addition, during challenging economic times our customers may face issues gaining timely access to sufficient credit, which could impair their ability to pay for services they have purchased and lead to greater expense for uncollectible customer balances. Any of the above could have a material adverse effect on our business, financial position, results of operations and cash flows.
We also are susceptible to risks associated with the potential financial instability of the vendors and third parties on which we rely to provide services or to which we outsource certain functions. The same economic conditions that may affect our customers could negatively affect such vendors and third parties and lead to significant increases in prices, reduction in quality or the bankruptcy of our vendors or third parties upon which we rely. Any interruption in the services provided by our vendors or by such third parties could adversely affect our business, financial position, results of operations and cash flows.
18
The loss of our licenses could adversely affect our ability to provide wireless services.
Our wireless licenses are generally valid for ten years from the effective date of the license. Licensees may renew their licenses for additional ten-year periods by filing renewal applications with the FCC. Our wireless licenses expire in various years. The renewal applications are subject to FCC review and potentially public comment to ensure that the licensees meet their licensing requirements and comply with other applicable FCC mandates. If we fail to file for renewal at the appropriate time or fail to meet any regulatory requirements for renewal, we could be denied a license renewal and, accordingly, our ability to provide or continue to provide service in that license area would be adversely affected.
Additionally, many of our licenses are subject to interim or final construction requirements. While the licensees have generally met “safe harbor” standards for ensuring such benchmarks are met, we have relied on, and will in the future rely on, “substantial service” thresholds for meeting build-out requirements. In such cases, there is no guarantee that the FCC will find our construction sufficient to meet the applicable construction requirement, in which case the FCC could terminate our license and our ability to continue to provide service in that license area would be adversely affected.
The telecommunications industry is subject to legislative changes or regulatory requirements, which could affect our ability to compete and offer services.
As competition develops and technology evolves, federal and state regulation of the telecommunications industry continues to change. We anticipate that this state of regulatory flux will continue in the future as the FCC and state regulators respond to competitive, technological and legislative developments by modifying their existing regulations or adopting new ones. A number of recent actions indicate that the FCC will be proactive and potentially increase the regulatory requirements of wireless service providers. At this time, pending congressional legislative efforts to reform the Communications Act may cause major industry and regulatory changes that are difficult to predict. Taken together or individually, new or changed regulatory requirements affecting the telecommunications industry may harm our business and restrict the manner in which we operate our business. The enactment of adverse regulation or regulatory requirements may slow our growth and have a material adverse effect upon our business, results of operations and financial condition.
Our failure to comply with regulatory mandates could adversely affect our ability to provide wireless services.
The FCC regulates the licensing, operation, acquisition and sale of the licensed spectrum that is essential to our business. We must comply with a number of regulatory requirements, including, but not limited to, E-911, CALEA and the customer privacy mandates of the Customer Proprietary Network Information rules. We also must comply with regulations pertaining to the winning bid of our subsidiary in Mobility Fund Phase I. The FCC has taken an expansive view with respect to the scope of its authority over wireless carriers, which may lead to increased regulation of such carriers in the future. In addition, we must pay a variety of federal and state surcharges and fees on our gross revenues derived by interstate and intrastate services, the amount of which may be subject to review and revision in the future. Failure to comply with these and other regulatory requirements may have an adverse effect on our licenses or operations and could result in sanctions, fines or other penalties.
On January 18, 2011, FCC rules took effect that require us and other carriers using handset-based technologies for E-911 location purposes to eventually transmit, within 50 meters, the location of the caller in 67% of calls made in the carrier’s choice of either a county or a PSAP area and to transmit, within 150 meters, the location of the caller in 80% of the calls made in either such county or PSAP area. The carriers have two years from the effective date of the new rules to implement these requirements and carriers may exclude 15% of counties or PSAP heavily forested areas. These rules reflect a general consensus between the wireless industry and the public safety community. The FCC also has issued an NPRM seeking comment on potential future modifications and enhancements to the current rules. In addition, the FCC, in December 2010, adopted net neutrality rules for mobile broadband Internet providers in which such providers are required to (1) make available relevant information regarding network management practices to the consumers who purchase their services, and to content, application and service providers who seek access to a carrier’s network and (2) refrain from blocking consumers from accessing lawful websites or applications that compete with the provider’s voice or video telephony services, subject to a reasonable network management exception. In early 2014, the Court of Appeals for the District of Columbia vacated all of the network neutrality regulations as currently constituted, with the exception of the transparency rule, which remains in effect, as exceeding the FCC’s authority. The FCC has sought comment on the adoption of additional network neutrality rules that would be consistent with the Court's ruling. In doing so, the FCC has noted that it is considering the application of stricter regulations on wireless providers than it adopted in 2010, as well as the potential reclassification of broadband Internet access as a Title II service. The FCC also noted that it is committed to the principles of network neutrality and would be vigilant in monitoring carrier actions. We cannot predict with any certainty the likely timing or outcome of any FCC action. The FCC, together with the FAA, also regulates tower marking and lighting. In addition, tower construction is affected by federal, state and local statutes addressing zoning, environmental protection and historic preservation. The FCC adopted significant changes to its rules governing historic preservation review of projects, which makes it more difficult and expensive to deploy antenna facilities, and is considering
19
changes to its rules regarding environmental protection as related to tower construction, which, if adopted, could make it more difficult to deploy facilities.
Failure to maintain effective internal controls in accordance with Section 404 of the Sarbanes-Oxley Act could result in a loss of investor confidence regarding our financial statements or may have a material adverse effect our business.
In accordance with Section 404 of the Sarbanes-Oxley Act, we along with our independent registered public accounting firm are required to report on the effectiveness of our internal control over financial reporting. Failure to design and maintain effective internal controls could constitute a material weakness which could result in inaccurate financial statements, inaccurate disclosures or failure to prevent fraud. If we were unable to conclude that we have effective internal controls, investor confidence regarding our financial statements and our business could be materially adversely affected.
Unanticipated changes in our tax provisions, the adoption of new tax legislation or exposure to additional tax liabilities could affect our profitability.
We are required to make judgments in order to estimate our obligations to taxing authorities. These tax obligations include income, real estate, sales and use and employment-related taxes and ongoing appeals issues related to these tax matters. These judgments include reserves for potential adverse outcomes regarding tax positions that have been taken that may be subject to challenge by the tax authorities. We also estimate our ability to utilize tax benefits, including those in the form of NOL carry-forwards and tax credits. See Note 13 of the Notes to Consolidated Financial Statements for additional information on our taxes.
We are subject to ongoing tax audits in various jurisdictions. Tax authorities may disagree with our judgments or other matters and assess additional taxes. We regularly assess the likely outcomes of these audits in order to determine the appropriateness of our tax provision and reserves. However, there can be no assurance that we will accurately predict the outcomes of these audits, and the amounts ultimately paid upon resolution of audits could be materially different from the amounts previously included in our income tax expense or operating taxes, and therefore could have a material impact on our net income and cash flows.
In addition, our effective tax rate in the future could be adversely affected by changes in tax laws and the discovery of new information in the course of our tax return preparation process. President Obama’s administration has announced proposals for other U.S. tax legislation that, if adopted, could adversely affect our tax rate. There are other tax proposals that have been introduced, that are being considered, or that have been enacted by Congress that could affect our tax rate or our tax liabilities. Any of these changes could affect our net income and cash flows.
Our inability to complete the sale of the Spectrum or our inability to effectively manage the wind down of the operations in the affected markets and reduce corporate expenses, could materially adversely affect our business, financial condition and results of operations.
On December 1, 2014, we agreed to sell our 1900 MHz PCS wireless spectrum licenses in our Eastern Markets to T-Mobile License LLC. The closing of the purchase and sale of the Eastern Markets licenses is subject to customary closing conditions, including, without limitation, the final approval of the transaction by the FCC. The transaction also contains customary representations, warranties and covenants with regard to the parties and the Eastern Markets licenses, as well as certain customary termination rights and indemnification provisions.
As part of the plan to sell, we must effectively manage the wind down of our operations in the Eastern Markets, including the reduction of direct costs and expenses, the reduction and transition of subscribers, the decommissioning of our network, and obtaining favorable operating lease termination settlements. In addition, we must effectively reduce our corporate overhead structure to realize the financial benefits of the sale and ultimate wind down of the Eastern Markets.
Our inability to manage the wind down process or complete the sale timely, could negatively adversely affect our business, financial condition and operating results.
20
If the spin-off of Lumos Networks does not qualify as a tax-free transaction, tax could be imposed on both our stockholders and us.
In connection with the Lumos Networks spin-off, we received a private letter ruling from the IRS stating that the spin-off qualifies for tax-free treatment under Sections 355 and 361 of the IRC. In addition, we obtained an opinion of counsel from Troutman Sanders LLP that the spin-off so qualifies. The IRS ruling and the opinion rely on certain representations, assumptions and undertakings, including those relating to the past and future conduct of Lumos Networks and our business. The IRS letter ruling does not address all the issues that are relevant to determining whether the spin-off qualifies for tax-free treatment. The IRS could determine that the spin-off should be treated as a taxable transaction if it determines that any representations, assumptions or undertakings that were included in the request for the private letter ruling are false or have been violated, or if it disagrees with the conclusions in the opinion that are not covered by the IRS private letter ruling.
If the spin-off fails to qualify for tax-free treatment, we would be subject to tax on gain, if any, as if we had sold the common stock of Lumos Networks in a taxable sale for its fair market value. In addition, if the spin-off fails to qualify for tax-free treatment, each of our stockholders that received stock of Lumos Networks from us would be treated as if the stockholder had received a distribution equal to the fair market value of Lumos Network stock that was distributed to the stockholder, which generally would be taxed as a dividend to the extent of the stockholder’s pro rata share of our current and accumulated earnings and profits and then treated as a non-taxable return of capital to the extent of the stockholder’s basis in our common stock and finally as capital gain from the sale or exchange of our common stock. Furthermore, even if the spin-off were otherwise to qualify for tax-free treatment under Sections 355 and 361 of the IRC, it may be taxable to us (but not to our stockholders) under Section 355(e) of the IRC, if the spin-off was later deemed to be part of a plan (or series of related transactions) pursuant to which one or more persons acquire, directly or indirectly, stock representing a 50% or greater interest in us or Lumos Networks. For this purpose, any acquisitions of our stock or of Lumos Network’s common stock within the period beginning two years before the spin-off and ending two years after the spin-off are presumed to be part of such a plan, although we or Lumos Networks may be able to rebut that presumption.
Increases in our costs of providing benefits under the Company’s defined benefit pension and other postretirement benefit plans could negatively impact our results of operations and cash flows.
The measurement of the plan obligations and costs of providing benefits under our defined benefit pension and other postretirement benefit plans involves various factors, including the development of valuation assumptions and accounting policy elections. We are required to make assumptions and estimates that include the discount rate applied to benefit obligations, the long-term expected rate of return on plan assets, the anticipated rate of increase of health care costs, our expected level of contributions to the plans, the incidence of mortality, the expected remaining service period of plan participants, the level of compensation and rate of compensation increases, employee age, length of service, and the long-term expected investment rate credited to employees of certain plans, among other factors. See Note 14 of the Notes to Consolidated Financial Statements for additional information regarding the accounting for the defined benefit pension and other postretirement benefit plans. If our benefit plans’ costs increase, due to adverse changes in the U.S. securities markets, resulting in worse-than-assumed investment returns and discount rates, and adverse medial cost trends, our financial condition and operating results could be adversely affected
Our stock price has historically been volatile and may continue to be volatile and may not reflect our actual operations and performance.
The trading price of our common stock has been and may continue to be subject to fluctuations. Our stock price may fluctuate in response to a number of events and factors unrelated to our performance, some of which are beyond our control, including, but not limited to:
• | actual or anticipated variations in our quarterly and annual operating results or those of our competitors, including announcements of subscribers and churn rates; |
• | changes in financial estimates by us or changes in financial estimates or recommendations by any securities analysts who might cover our stock; |
• | speculation in the media or investment community about, or actual changes in, our current or future relationship with Sprint; |
• | actual or anticipated changes in Sprint’s business, financial condition and operating results; |
• | changes in general or industry specific market conditions, trends or governmental regulations and approvals; |
• | conditions, trends or changes in the securities marketplace or stock market performance in the United States, including trading volumes; |
21
• | adverse changes in economic conditions, including the cost and availability or perceived availability of additional capital and market perceptions relating to our access to this capital; |
• | changes in the market valuations of other companies operating in our industry; |
• | significant or sustained changes to our market capitalization; |
• | technological innovations by us or our competitors, including the availability of 4G LTE; |
• | announcements by us or our competitors of acquisitions, strategic partnerships, significant contracts or divestitures; |
• | announcements of investigations, regulatory scrutiny of our operations or lawsuits filed against us; |
• | changes in domestic and global economic and political factors, including those resulting from war, incidents of terrorism or responses to such events; |
• | approval and timing of Eastern Markets’ spectrum sale and our ability to realize the expected proceeds, cost savings and other benefits associated with the sale and wind down of the markets; |
• | changes in accounting principles; |
• | additions or departures of key personnel; and |
• | sales of large blocks of our common stock, including sales of our common stock by our directors, executive officers or affiliates. |
Stock price volatility and sustained decreases in our share price could subject our stockholders to losses and us to takeover bids or lead to action by the NASDAQ. For these reasons, investors should not rely on recent or historical trends to predict future stock prices, financial condition, results of operations or cash flows.
Quadrangle continues to have significant influence over our business and could delay, deter or prevent a change of control, change in management or business combination that may not be beneficial to our stockholders and as a result, may depress the market price of our stock.
As of December 31, 2014, Quadrangle beneficially owned approximately 4.2 million shares of our common stock, or approximately 20% of our outstanding common stock. In addition, three of the eight directors that serve on our board of directors are representatives or designees of Quadrangle. By virtue of such stock ownership and representation on the board of directors, including a representative of Quadrangle being Chairman of the Board of Directors, Quadrangle continues to have the ability to influence corporate and management policies and all matters submitted to our stockholders, including the election of the directors, and to exercise significant control over our business, policies and affairs. Quadrangle’s interests as a stockholder may not always coincide with the interests of other stockholders. Additionally, such concentration of voting power could have the effect of delaying, deterring or preventing a change of control, change in management or business combination that might otherwise be beneficial to our stockholders and, as a result, may depress the market price of our stock.
Our stock price may decline due to the large number of shares registered for future sale.
Sales of substantial amounts of our common stock, or the possibility of such sales, may adversely affect the market price of our common stock. These sales also may make it more difficult for us to raise capital through the issuance of equity securities at a time and at a price we deem appropriate. We previously granted Quadrangle the right to require us to register their shares of our common stock, representing approximately 5.7 million shares of our common stock. In June 2012, we filed a shelf registration statement with the SEC, which became effective in August 2012, in which we registered for resale the shares owned by Quadrangle pursuant to the registration rights agreed to in the Shareholders Agreement among the Company and Quadrangle. In November 2013, Quadrangle sold 1.5 million shares in a secondary offering. The number of shares registered continues to be substantial and the sale of these shares and any other shares with tag-along registration rights in secondary offerings while the registration statement remains effective may have a negative impact on the market price of our common stock.
Provisions in our charter documents and the General Corporation Law of Delaware could discourage potential acquisition proposals, could delay, deter or prevent a change in control and could limit the price certain investors might be willing to pay for our common stock.
Certain provisions of the General Corporation Law of Delaware, the state in which we are organized, and our certificate of incorporation and by-laws may inhibit a change of control not approved by our board of directors or changes in the composition of our board of directors, which could result in the entrenchment of current management. These provisions include:
22
• | advance notice requirements for stockholder proposals and director nominations; |
• | limitations on the ability of stockholders to amend, alter or repeal our by-laws; |
• | limitations on the removal of directors; |
• | the inability of the stockholders to act by written consent; and |
• | the authority of the board of directors to issue, without stockholder approval, preferred stock with such terms as the board of directors may determine and additional shares of our common stock. |
Item 1B. | Unresolved Staff Comments. |
None.
Item 2. | Properties. |
We are headquartered in Waynesboro, Virginia and own offices and facilities in a number of locations within our operating markets. We believe that our current facilities are adequate to meet our needs in our existing markets for the foreseeable future. The table below provides the location, description and approximate square footage of our material owned properties.
Location | Property Description | Approximate Square Footage | |
Waynesboro, VA | Corporate Headquarters Building | 51,000 | |
Waynesboro, VA | Customer Care Building | 31,000 | |
Waynesboro, VA | Wireless Switch Building | 17,000 | |
Waynesboro, VA | Retail Store | 4,000 | |
Clifton Forge, VA | Commercial Rental Property | 15,600 | |
Norfolk, VA | Wireless Switch Building | 4,900 | |
Richmond, VA | Wireless Switch Building | 4,600 | |
As of December 31, 2014 we owned 122 cell sites and leased more than 1,300 cell sites of which approximately 46% are installed on structures controlled by two tower companies, Crown Communications and American Tower. The MLA with Crown Communications commenced in 2000 and 2001 with an initial 5-year term with three optional 5-year renewal terms and was renewed for the second of three 5-year lease renewal terms in 2010 and 2011. Additionally, we entered into a master lease agreement with American Tower in 2001 with an initial lease term of 12 years. The American Tower master lease agreement contains three automatic 5-year renewal terms. The master lease agreement with American Tower was renewed for the first of three 5-year lease renewal terms in 2013. In January 2015 we entered into a definitive agreement to sell most of our owned towers. These towers will be immediately leased back. For additional information, see Note 17 of the Notes to Consolidated Financial Statements.
We also lease properties from third parties associated with our retail stores located throughout our operating markets, two warehouses located in Charleston, WV and Waynesboro, VA, two additional customer care facilities located in Covington, VA and Daleville, VA, and three regional operations centers with one located in Charleston, WV and two located in Richmond, VA.
Item 3. | Legal Proceedings. |
We are involved in routine litigation in the ordinary course of our business. We do not believe that any pending or threatened litigation of which we are aware will have a material adverse effect on our financial condition, results of operations or cash flows.
Item 4. | Mine Safety Disclosures. |
Not applicable.
23
PART II
Item 5. | Market for Registrant’s Common Equity, Related Stockholder Matters and Issuer Purchases of Equity Securities. |
Market Information
Our common stock trades on the NASDAQ Global Select Market under the symbol “NTLS.” On February 23, 2015, the last reported sale price for our common stock was $4.81 per share.
The following table sets forth, for the periods indicated, the high and low closing prices per share of our common stock and the cash dividends declared per common share.
Fiscal Year 2014 | Fiscal Year 2013 | ||||||||||||||||||||||||||||||
Fourth Quarter | Third Quarter | Second Quarter | First Quarter | Fourth Quarter | Third Quarter | Second Quarter | First Quarter | ||||||||||||||||||||||||
High price | $ | 11.07 | $ | 13.61 | $ | 15.10 | $ | 21.40 | $ | 23.03 | $ | 20.47 | $ | 16.72 | $ | 13.89 | |||||||||||||||
Low price | 3.85 | 10.44 | 11.20 | 12.40 | 17.48 | 14.59 | 12.75 | 11.68 | |||||||||||||||||||||||
Dividends declared | — | — | 0.42 | 0.42 | 0.42 | 0.42 | 0.42 | 0.42 | |||||||||||||||||||||||
Stock Performance Graph
The following indexed line graph indicates our cumulative total return to stockholders from December 31, 2009 to December 31, 2014, as compared to the total return for the NASDAQ Composite Index and the NASDAQ Telecommunications Index for the same period. The calculations in the graph assume that $100 was invested on December 31, 2009 in our common stock and in each index. The calculations assume cash dividend reinvestment and reinvestment of $15.86, the opening price of Lumos Networks common stock on November 1, 2011, one share of which was distributed by the Company for each share of NTLS common stock outstanding following the 1-for-2 reverse split, all of which occurred after the market close on October 31, 2011.
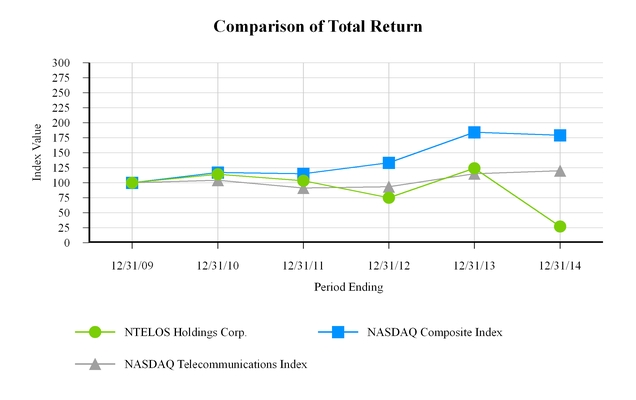
24
December 31, 2009 | December 31, 2010 | December 31, 2011 | December 31, 2012 | December 31, 2013 | December 31, 2014 | ||||||||||||||||||
NTELOS Holdings Corp. | $ | 100 | $ | 114 | $ | 103 | $ | 75 | $ | 124 | $ | 27 | |||||||||||
NASDAQ Composite Index | 100 | 117 | 115 | 113 | 184 | 179 | |||||||||||||||||
NASDAQ Telecommunications Index | 100 | 104 | 91 | 93 | 115 | 120 | |||||||||||||||||
Holders
There were approximately 132 registered holders and 7,100 beneficial holders of our common stock on February 23, 2015.
Dividends/Dividend Policy
On May 22, 2014, the board of directors, in order to support our LTE network expansion and wholesale and retail growth initiatives, eliminated the quarterly dividend. Any decision to declare future dividends will be made at the discretion of the board of directors and will depend on, among other things, our results of operations, cash requirements, investment opportunities, financial condition, contractual restrictions and other factors that the board of directors may deem relevant. We are a holding company that does not operate any business of our own. As a result, we are dependent on cash dividends and distributions and other transfers from our subsidiaries to make dividend payments or to make other distributions to our stockholders, including by means of a stock repurchase. Amounts available to us to pay cash dividends or repurchase stock are restricted by the NTELOS Inc. Amended and Restated Credit Agreement.
Purchases of Equity Securities by the Issuer and Affiliated Purchasers
In August 2009, the Company’s board of directors authorized management to repurchase up to $40.0 million of the Company’s common stock. The Company did not purchase any shares of its common stock during the years ended December 31, 2014 and 2013 under the authorization. The approximate dollar value of shares that may yet be purchased under the plan was $23.1 million as of December 31, 2014. During the fiscal years 2014 and 2013, the Company repurchased $0.1 million of restricted common stock in order to satisfy certain minimum tax withholding obligations in connection with the vesting of restricted stock. Amounts available to us to repurchase stock are restricted by the NTELOS Inc. Amended and Restated Credit Agreement.
25
Item 6. | Selected Financial Data. |
SELECTED HISTORICAL FINANCIAL INFORMATION
Year Ended December 31, | |||||||||||||||||||
(In thousands, except per share amounts) | 2014 | 2013 | 2012 | 2011 | 2010 | ||||||||||||||
Consolidated Statements of Operations Data | |||||||||||||||||||
Operating revenues | $ | 487,834 | $ | 491,882 | $ | 453,989 | $ | 422,629 | $ | 406,793 | |||||||||
Operating expenses (1) | 539,084 | 416,046 | 390,847 | 356,375 | 331,911 | ||||||||||||||
Operating income (loss) | (51,250 | ) | 75,836 | 63,142 | 66,254 | 74,882 | |||||||||||||
Other expenses | (33,810 | ) | (30,553 | ) | (30,138 | ) | (26,451 | ) | (25,288 | ) | |||||||||
Income (loss) from continuing operations before income taxes | (85,060 | ) | 45,283 | 33,004 | 39,803 | 49,594 | |||||||||||||
Income tax expense (benefit) | (32,894 | ) | 18,544 | 12,676 | 16,363 | 20,251 | |||||||||||||
Income (loss) from continuing operations | (52,166 | ) | 26,739 | 20,328 | 23,440 | 29,343 | |||||||||||||
Discontinued operations, net | — | — | — | (45,386 | ) | 16,882 | |||||||||||||
Net income (loss) | (52,166 | ) | 26,739 | 20,328 | (21,946 | ) | 46,225 | ||||||||||||
Net income attributable to noncontrolling interests | (1,468 | ) | (2,061 | ) | (1,941 | ) | (1,769 | ) | (1,417 | ) | |||||||||
Net income (loss) attributable to NTELOS Holdings Corp. | $ | (53,634 | ) | $ | 24,678 | $ | 18,387 | $ | (23,715 | ) | $ | 44,808 | |||||||
Earnings (Loss) per Share Attributable to NTELOS Holdings Corp. (2) | |||||||||||||||||||
Basic | |||||||||||||||||||
Continuing operations | $ | (2.54 | ) | $ | 1.17 | $ | 0.88 | $ | 1.04 | $ | 1.35 | ||||||||
Discontinued operations | — | — | — | (2.18 | ) | 0.82 | |||||||||||||
Total | $ | (2.54 | ) | $ | 1.17 | $ | 0.88 | $ | (1.14 | ) | $ | 2.17 | |||||||
Diluted | |||||||||||||||||||
Continuing operations | $ | (2.54 | ) | $ | 1.13 | $ | 0.86 | $ | 1.02 | $ | 1.34 | ||||||||
Discontinued operations | — | — | — | (2.13 | ) | 0.81 | |||||||||||||
Total | $ | (2.54 | ) | $ | 1.13 | $ | 0.86 | $ | (1.11 | ) | $ | 2.15 | |||||||
Cash Dividends Declared per Share – Common Stock | $ | 0.84 | $ | 1.68 | $ | 1.68 | $ | 2.10 | $ | 2.24 | |||||||||
As of December 31, | |||||||||||||||||||
(In thousands) | 2014 | 2013 | 2012 | 2011 | 2010 | ||||||||||||||
Balance Sheet Data (3) | |||||||||||||||||||
Cash | $ | 73,546 | $ | 88,441 | $ | 76,197 | $ | 59,950 | $ | 15,676 | |||||||||
Property, Plant and Equipment, net | 289,947 | 319,376 | 303,103 | 288,368 | 566,949 | ||||||||||||||
Total Assets | 668,548 | 716,251 | 680,114 | 632,658 | 1,149,445 | ||||||||||||||
Total Debt | 525,408 | 490,366 | 494,079 | 458,409 | 749,093 | ||||||||||||||
Total NTELOS Holdings Corp. Stockholders’ Equity (Deficit) | (34,132 | ) | 43,283 | 44,525 | 51,584 | 179,539 | |||||||||||||
(1) | 2014 includes $87.9 million in impairment and other charges related to the write down of certain assets in our Eastern Markets and $3.7 million of restructuring expense due to the wind down of the business. |
(2) | Earnings per common share for 2011 and 2010 have been adjusted for the October 31, 2011 1-for-2 reverse stock split. |
(3) | Balance sheet data in this table for 2010 has not been revised for discontinued operations. |
26
Item 7. | Management’s Discussion and Analysis of Financial Condition and Results of Operations. |
You should read the following discussion of our financial condition and results of operations in conjunction with our consolidated financial statements and the related notes included herein (Item 8). The Private Securities Litigation Reform Act of 1995 provides a “safe harbor” for forward-looking statements made by or on behalf of the Company. This section covers the current performance and outlook of the Company. The forward-looking statements contained in this section and in other parts of this document involve risks and uncertainties that may affect the Company’s operations, markets, products, services, prices and other factors as more fully discussed elsewhere and in filings with the SEC. These risks and uncertainties include, but are not limited to, economic, competitive, legal, governmental and technological factors set forth under Item 1A. Risk Factors of this Annual Report on Form 10-K. Accordingly, there is no assurance that the Company’s expectations will be realized. The Company assumes no obligation to provide revisions to any forward-looking statements should circumstances change, except as otherwise required by applicable laws.
OVERVIEW
General
We are a leading regional provider of digital wireless communications services to consumers and businesses primarily in Virginia and West Virginia, as well as parts of Maryland, North Carolina, Pennsylvania, Ohio and Kentucky. We offer wireless voice and digital data PCS products and services to retail and business customers under the “NTELOS Wireless” and “FRAWG Wireless” brand names. We conduct our business through NTELOS-branded retail operations, which sell our products and services via direct and indirect distribution channels, and provide network access to other telecommunications carriers, most notably through an arrangement with Sprint Spectrum L.P. (“Sprint Spectrum”), and Sprint Spectrum on behalf of and as an agent for SprintCom, Inc. (“SprintCom”) (Sprint Spectrum and SprintCom collectively, “Sprint”), which arrangement is referred to herein as the “Strategic Network Alliance” or the "SNA".
We operate a 100% CDMA digital PCS network and are actively deploying 4G LTE across our footprint in Virginia, West Virginia, and portions of Pennsylvania, Kentucky, Maryland, Ohio and North Carolina with covered POPs of approximately 6.0 million, 3.1 million in our Western Markets. We believe our strategic focus in our Western Markets, commitment to personalized local service, contiguous service area and leveraged use of our network via our wholesale contracts provide us with a differentiated competitive position relative to our primary wireless competitors, most of whom are national providers. Our strategic marketing differentiator is based upon an approach of offering each customer The Best Value in Wireless, which we define as a robust nationwide coverage area, simple, flexible wireless rate plans, and popular wireless handsets.
Sale of Virginia East Spectrum and Wind Down of Eastern Markets
On December 2, 2014, we announced that we would focus our business operations exclusively in our Western Markets, where we have experienced strong operating performance, have a favorable competitive position for our branded retail offering and where we benefit operationally and financially from our SNA with Sprint. In connection with this refocus, we entered into an agreement, on December 1, 2014, to sell our 1900 MHz PCS wireless spectrum licenses in our Eastern Markets to T-Mobile for $56.0 million. The transaction is subject to customary closing conditions, including final regulatory approval by the FCC, and is expected to close in April of 2015.
In conjunction with the spectrum sale, we will wind down our network and retail operations in our Eastern Markets over the next year, including transitioning our subscribers to another carrier under an agency agreement, and reduce related corporate operating expenses. This initiative resulted in impairment charges of $86.0 million, abandonment of assets of $1.9 million and restructuring charges of $3.7 million for one time employee separation charges, contract termination fees for retail leases and network cost commitments, and other fees. We expect to incur additional restructuring charges in 2015 of between $50.0 million and $60.0 million as we continue to wind down our operations in our Eastern Markets and reduce corporate operating expenses. For additional information, see Note 9 of the Notes to Consolidated Financial Statements.
Towers Sale
In January 2015, we announced that we entered into a definitive agreement to sell up to 103 towers for approximately $41.0 million. The agreement provides that we will enter into long term lease agreements on the sold towers that are located in our Western Markets. The transaction is expected to close in multiple installments during calendar year 2015, the first of which occurred on February 17, 2015 and consisted of 85 towers with proceeds to us of approximately $35.0 million. The inclusion of towers in any closing is subject to final due diligence and other customary closing conditions.
27
Market Risks
The telecommunications industry has been, and we believe will continue to be, characterized by several trends, including the rapid development and introduction of new technologies and services, including but not limited to 4G LTE, voice over WiFi or other technologies. A number of our competitors have deployed next generation technologies that are focused on the provisioning of mobile data services with higher speeds, which increasingly are becoming a critical component of many wireless service provider offerings. We believe our continued success will depend, in part, on our ability to anticipate or adapt to technological changes and to offer, on a timely basis, services, such as higher-speed data services, that meet customer demands.
The retail market for wireless broadband mobile services remains highly competitive. We believe that competition for customers among wireless broadband providers is based on price, service area, network performance, brand awareness and reputation, services and features, handset selection, call quality and customer service. In addition, the market for wireless services has increasingly required that we provide nationwide coverage to our customers, both for voice and data services. We currently rely on roaming agreements, primarily with Sprint and also with other wireless carriers, to provide service in areas not covered by our network. These agreements are subject to renewal and termination rights, and if such agreements are terminated or not renewed, or the rates charged to us increase substantially, we may incur significantly higher costs for roaming service and we may be unable to provide competitive regional and nationwide wireless service to our customers on a cost-effective basis.
As competition increases and technology evolves, federal and state regulation of the telecommunications industry continues to change. We anticipate that this state of regulatory flux will continue in the future as the FCC and state regulators respond to competitive, technological and legislative developments by modifying their existing regulations or adopting new ones. The impact of economic downturns on our customers, including unemployment and disruptions to the credit and financial markets, could cause customers to further reduce spending. Taken together or individually, new or changed regulatory requirements and the possibility of wide ranging changes and reform mandated by the federal and state governments to stimulate economic recovery, could affect the telecommunications industry and may harm our business and restrict the manner in which we operate our business.
We expect postpay competition to continue to be intense and is led by the four largest providers of wireless services dominating the market, who are nationwide in scope and have significantly greater resources than us. We must increasingly target switchers rather than first-time purchasers of wireless services to expand our subscriber base. However, despite the increased competition, we must control churn to help grow our subscriber base. To do so, we continue to use predictive analytics to identify high-risk churn areas within our postpay and prepay customer bases, which leads to proactive communication and retention efforts, resulting in stable customer churn and positive net subscriber additions.
We continue to face risks to our competitive “value” position in the postpay market through reduced price nationwide voice, text and data plans offered by competitors such as AT&T, Verizon Wireless, Sprint, T-Mobile and US Cellular. A number of other wireless broadband mobile carriers, resellers and MVNOs are offering, and in the future may offer, service plans similar to, or competitive with, our service plans with more extensive geographic coverage than ours, better brand awareness, lower prices and other differentiating features.
We also expect the competition with prepaid products to remain strong as competitors have targeted the prepaid market as a means to sustain growth and increase market share. A number of large wireless competitors, including Boost and Virgin Mobile (MVNOs operated by Sprint), TracFone’s Straight Talk service, T-Mobile, Net10 and Simple Mobile actively compete for prepay customers in our markets. Many of these competitors have access to big box national retailers that currently are not in our distribution channel. Pricing competition in the prepaid market is intense, with a number of prepaid unlimited nationwide plans being offered for less than $50 per month.
To remain competitive with our prepaid product offerings, we continually monitor our FRAWG Unlimited Wireless prepay product offerings. We offer the FRAWG Unlimited Wireless product in all of our markets. FRAWG is a simple, “no contract,” low cost service that has a minimum number of plans, offers attractive features, including smartphone options and provides regional or national unlimited coverage. Acquisition costs are substantially lower than postpay with the reduced handset subsidy and lower selling and advertising costs. Our prepaid strategic focus is to target the higher end of the prepaid market by offering more feature rich plans and devices that appeal to smartphone customers. This strategy resulted in a 83% smartphone take rate during the year ended December 31, 2014 and an ending smartphone prepay penetration of 69%.
To increase gross subscriber additions and to better serve and retain our customers, we are focused on refining our distribution strategy with respect to both postpay and prepay sales. We continued enhancing our indirect distribution channel using master agents and exclusive dealers and improving the quality of the indirect locations.
28
Our ability to grow our customer base and retain current subscribers will depend, in part, on our ability to adapt to changes in pricing plans, continue to improve our network coverage and reliability, and make available service offerings on the latest network technology and devices. At the same time, these competitive factors could cause our churn to increase making it difficult for us to add net subscribers and may put downward pressure on our retail revenue in 2015.
Strategic Network Alliance ("SNA")
We have an agreement with Sprint under the SNA in which we are the exclusive wholesale provider of wireless services in our western Virginia and West Virginia service area to Sprint for all Sprint CDMA and LTE wireless customers. In May 2014 the parties entered into an amended agreement to extend the SNA through at least December 2022. Pursuant to the terms of the SNA, we are required to upgrade our network in the SNA service area to provide LTE Services. As part of the amendment, we lease spectrum, on a non-cash basis, from Sprint in order to enhance the PCS/LTE services. The non-cash consideration attributable to the leased spectrum is approximately $4.9 million per year. The lease expense is recognized over the term of the lease and recorded within cost of sales and services, with the offsetting consideration recorded within wholesale and other revenue. Additionally, the amended SNA provides us access to Sprint’s nationwide 3G and 4G LTE network at rates that are reciprocal to rates paid by Sprint under the amended SNA. The amended SNA provides that a portion of the amount paid by Sprint thereunder is fixed. The fixed fee element of the amended SNA is subject to contractual reductions on August 1, 2015 and annually thereafter starting on January 1, 2016 that will result in a decrease of payments for the fixed fee element. We account for this fixed fee portion of the revenue earned from the SNA revenue on a straight line basis over the term of the agreement. In addition, these reductions are subject to further upward or downward resets in the fixed fee element. These resets, if any, will be recognized in the period in which it occurs.
RESULTS OF OPERATIONS – OVERVIEW
Fiscal Year 2014 Results
Operating revenues decreased $4.1 million, or 0.8%, to $487.8 million for the year ended December 31, 2014 compared to $491.9 million for the year ended December 31, 2013 driven by a $16.2 million increase in retail revenues and a $20.3 million decrease in wholesale and other revenues. Operating income (loss) decreased $127.1 million, or 167.6%, to $(51.3) million for the year ended December 31, 2014 compared to $75.8 million the year ended December 31, 2013 reflecting the decrease in operating revenue, the increase in operating expenses related to the increase in equipment costs and network expenses in 2014 and impairment charges related to the agreement to sell wireless spectrum and the wind down of operations in our Eastern Markets. Other expense increased $3.3 million, or 10.7%, to $33.8 million for the year ended December 31, 2014 compared to $30.6 million for the year ended December 31, 2013, primarily due to an increase in the interest expense of $3.0 million due to the increased loan amount and a higher blended average effective interest rate associated with the January 2014 debt refinancing. Income (loss) from continuing operations before income taxes decreased $130.4 million, or 287.9%, to $(85.1) million for the year ended December 31, 2014 compared to $45.3 million for the year ended December 31, 2013, for the reasons discussed above.
For further detail regarding our operating results, including explanation of the non-GAAP measure ARPA, see the Other Overview Discussion and Results of Operations – Comparison of Year Ended December 31, 2014 and 2013 below.
Other Overview Discussion
To supplement our financial statements presented in accordance with accounting principles generally accepted in the United States of America (“GAAP”), we reference the non-GAAP measure Average Revenue per Account ("ARPA") to measure our postpay wireless performance. We use this measure, along with other performance metrics such as subscribers and churn, to gauge operating performance for which our operating managers are responsible and upon which we evaluate their performance.
Our postpay service plan, nControl, introduced in late 2013, is customizable for families and individuals with multiple devices and facilitates the sharing of data, minutes and SMS allowances among these devices. As our customers continue to adopt these plans and add smartphone devices, we focus on ARPA as a leading metric for postpay service revenue. We closely monitor the effects of new rate plans and service offerings on ARPA in order to determine their effectiveness. We believe ARPA provides management useful information concerning the appeal of our rate plans and service offerings and our performance in attracting and retaining high-value customers. ARPA as calculated below may not be similar to ARPA measures of other wireless companies, is not a measurement under GAAP and should be considered in addition to, but not as a substitute for, the information contained in our unaudited condensed consolidated statements of operations.
29
The table below provides a reconciliation of operating revenues to postpay subscriber revenues used to calculate ARPA for the years ended December 31, 2014, 2013 and 2012.
(Dollars in thousands, except ARPA) | 2014 | 2013 | 2012 | ||||||||
Operating revenues | $ | 487,834 | $ | 491,882 | $ | 453,989 | |||||
Less: prepay service revenues | (63,203 | ) | (65,300 | ) | (58,036 | ) | |||||
Less: equipment revenues | (43,154 | ) | (25,245 | ) | (30,078 | ) | |||||
Less: wholesale and other adjustments | (153,014 | ) | (172,754 | ) | (165,765 | ) | |||||
Postpay service revenues | $ | 228,463 | $ | 228,583 | $ | 200,110 | |||||
Account Statistics: | |||||||||||
Postpay ARPA | $ | 135.31 | $ | 134.44 | $ | 117.65 | |||||
Postpay accounts (1) | 143,400 | 141,200 | 142,000 | ||||||||
Postpay subscribers per account (1) | 2.2 | 2.2 | 2.1 | ||||||||
(1) End of period
ARPA increased for the year ended December 31, 2014 as compared to the year ended December 31, 2013 as a result of an increase in smartphone adoption and usage, both driven by our nControl plans and our device line up, offset by competitive pricing pressure and EIP service discounts. We expect ARPA to be under pressure as our competition stays focused on price incentives and due to increased acceptance of EIP with its associated service plan discounts.
Operating Revenues
Our revenues are generated from the following categories:
• | Retail – subscriber revenues from network access, data services, feature services and equipment sales; and |
• | Wholesale and other – primarily wholesale revenue from the SNA and roaming revenue from other telecommunications carriers. Other revenues relate to rent from leasing excess tower and building space. |
Operating Expenses
Our operating expenses are categorized are follows:
• | Cost of sales and services – includes handset equipment costs to new and existing customers, usage-based access charges, including long distance, roaming charges, and other direct costs incurred in accessing other telecommunications providers’ networks in order to provide telecommunication services to our end-user customers; leased facility expenses for connection to other carriers, cell sites and switch locations; and engineering and repairs and maintenance expenses related to property, plant and equipment; |
• | Customer operations – includes marketing, product management, product advertising, selling, billing, customer care, customer retention and bad debt expenses; |
• | Corporate operations – includes taxes other than income; executive, accounting, legal, purchasing, information technology, human resources and other general and administrative expenses, including bonuses and equity-based compensation expense related to stock and option instruments held by certain members of corporate management; accretion of asset retirement obligations; |
• | Restructuring – includes one time separation charges and contract termination fees related to the exit of our Eastern Markets; |
• | Impairment and other charges – includes the write down and abandonment of certain property, plant and equipment and intangible assets related to our Eastern Markets; |
• | Depreciation and amortization – includes depreciable long-lived property, plant and equipment and amortization of intangible assets where applicable; and |
• | Gain on sale of intangible assets - includes the gain from the sale of non-operational wireless spectrum. |
30
Other Expense
Other expense includes interest expense on debt instruments, corporate financing costs and debt discounts associated with the repricing and refinancing of our debt instruments and, as appropriate, related charges or amortization of such costs and discounts, changes in the fair value of our interest rate cap and other items such as interest income and fees.
Income Taxes
Income tax expense and the effective tax rate increase or decrease based upon changes in a number of factors, including our pre-tax income or loss, non-controlling interest, state minimum tax assessments, and non-deductible expenses.
Noncontrolling Interests in Losses (Earnings) of Subsidiaries
We own 97% of Virginia PCS Alliance, L.C. (the “VA Alliance”), which provides PCS services to an estimated two million populated area in central and western Virginia. In accordance with the noncontrolling interest requirements in FASB ASC 810-10-45-21, we attribute 3% of VA Alliance net income to these noncontrolling interests. No capital contributions from the minority owners were made during the years ended December 31, 2014 or 2013. The VA Alliance made capital distributions to the minority owners of $0.8 million, $1.6 million and $1.5 million during each of the years ended December 31, 2014, 2013 and 2012.
RESULTS OF OPERATIONS – COMPARISON OF YEAR ENDED DECEMBER 31, 2014 AND 2013
OPERATING REVENUES
The following table identifies our operating revenues for the years ended December 31, 2014 and 2013:
Year Ended December 31, | ||||||||||||||
(In thousands) | 2014 | 2013 | $ Variance | % Variance | ||||||||||
Retail revenue | $ | 333,257 | $ | 317,054 | $ | 16,203 | 5.1 | % | ||||||
Wholesale and other revenue | 154,577 | 174,828 | (20,251 | ) | (11.6 | )% | ||||||||
Total operating revenues | $ | 487,834 | $ | 491,882 | $ | (4,048 | ) | (0.8 | )% | |||||
Retail Revenue
Retail revenue increased due to higher equipment revenues of $17.9 million, or 70.9%, offset by a decrease in subscriber service revenues of $1.7 million, or 0.6%. The increase in equipment revenue reflected an increase in retail pricing driven by higher end smartphones and the launch of EIP. We expect these trends to continue with the adoption of EIP. The decrease in subscriber service revenues is primarily driven by a decrease in the prepay subscriber base. Ending prepay subscribers, net of an 8,200 subscriber adjustment, decreased approximately 10,900 subscribers, or 7%, to approximately 138,800 subscribers for the year ended December 31, 2014.
Wholesale and Other Revenue
Wholesale and roaming revenues decreased $20.3 million, or 11.6%, for the year ended December 31, 2014 compared to the year ended December 31, 2013, primarily reflecting a $18.9 million decrease in revenue from the SNA. Excluding the $9.0 million dispute settlement in the three months ended September 30, 2013, revenue under the SNA decreased $9.9 million, or 6.2%, for the year ended December 31, 2014 compared to the year ended December 31, 2013. This decrease is primarily the result of the amended terms of the SNA that took affect in May 2014. We expect this year over year trend to continue. Roaming revenues from carriers other than Sprint declined $1.2 million for the year ended December 31, 2014 compared to the year ended December 31, 2013.
31
OPERATING EXPENSES
The following table identifies our total operating expenses for the years ended December 31, 2014 and 2013:
Year Ended December 31, | ||||||||||||||
(In thousands) | 2014 | 2013 | $ Variance | % Variance | ||||||||||
Cost of sales and services | $ | 223,140 | $ | 199,004 | $ | 24,136 | 12.1 | % | ||||||
Customer operations | 105,774 | 106,235 | (461 | ) | (0.4 | )% | ||||||||
Corporate operations | 42,195 | 42,305 | (110 | ) | (0.3 | )% | ||||||||
Restructuring | 3,663 | — | 3,663 | — | % | |||||||||
Impairment and other charges | 87,853 | — | 87,853 | — | % | |||||||||
Depreciation and amortization | 76,459 | 72,944 | 3,515 | 4.8 | % | |||||||||
Gain on sale of intangible assets | — | (4,442 | ) | 4,442 | — | % | ||||||||
Total operating expenses | $ | 539,084 | $ | 416,046 | $ | 123,038 | 29.6 | % | ||||||
Cost of Sales and Services – Cost of sales and services increased $24.1 million, or 12.1%, for the year ended December 31, 2014 compared to the year ended December 31, 2013 due to increases in cell site expenses, data roaming expense and equipment cost of sales totalling $20.2 million, or 11.1%, as a result of on-going costs to support subscriber and usage growth, and $3.3 million in non-cash spectrum lease expenses related to the amended SNA agreement.
Customer Operations – Customer operations expense increased $0.5 million, or 0.4%, for the year ended December 31, 2014 compared to the year ended December 31, 2013 due to an increase in other selling expenses.
Corporate Operations – Corporate operations expense decreased $0.1 million, or 0.3%, for the year ended December 31, 2014 compared to the year ended December 31, 2013 driven by lower salary and equity compensation charges related to executive separations, offset by additional legal and advisory fees related to the debt refinancing and SNA contract amendment.
Restructuring – Restructuring expense increased $3.7 million for the year ended December 31, 2014 due primarily to severance charges, contract termination fees and professional fees associated with the wind down of the business in the Eastern Markets. We will continue to incur restructuring charges in 2015 as we continue the wind down.
Impairment and other charges – Impairment and other charges totaling $87.9 million for the year ended December 31, 2014 relate to the write down and abandonment of property, plant and equipment of $58.9 million and wireless spectrum of $29.0 million in our Eastern Markets due to the wind down of the business.
Depreciation and Amortization – Depreciation and amortization expenses increased $3.5 million, or 4.8% for the year ended December 31, 2014 compared to the year ended December 31, 2013 primarily due to an increase in depreciable assets placed in service.
Gain on Sale of Intangible Assets - Gain on sale of intangible assets consists of a $4.4 million gain for the year ended December 31, 2013 from the sale of non-operational wireless spectrum.
OTHER EXPENSE
Interest expense on debt instruments increased $3.0 million, or 10.1%, to $32.7 million for the year ended December 31, 2014 compared to $29.7 million for the year ended December 31, 2013, due to the increased loan amount and a higher blended average effective interest rate associated with the January 2014 debt refinancing.
Other expense increased $0.3 million, or 37.5%, to $1.1 million for the year ended December 31, 2014 compared to $0.8 million for the year ended December 31, 2013, primarily as a result of a $0.9 million charge related to the write off of a proportionate amount of the unamortized deferred issuance costs associated with the January 2014 debt refinancing.
INCOME TAXES
Income tax benefit was $(32.9) million, with an effective tax rate of 38.7%, for the year ended December 31, 2014, representing the statutory tax rate applied to pre-tax loss and the effects of certain non-deductible compensation and state minimum taxes. We expect our recurring non-deductible expenses to relate primarily to certain non-cash share-based compensation. Income taxes for 2013 were $18.5 million with an effective rate of 41.0%.
32
We expect to incur an NOL in 2014 of approximately $9.2 million primarily resulting from recent changes in allowable bonus depreciation. We also have certain Federal prior year unused net operating losses, including certain built-in losses, that are subject to limitations imposed by IRC 382. These prior year NOLs are subject to an adjusted annual maximum limit (the “IRC 382 Limit”) of approximately $8.9 million. Based on the IRC 382 Limit, we expect that $109.7 million of these prior year NOLs will be available for use as follows: $24.3 million in 2015 (with $15.4 million total anticipated carryover from 2013 and 2014), $8.9 million per year in 2016 through 2024, $4.9 million in 2025 and $0.4 million in 2026. We also have certain state NOLs that will be available to us substantially similar in timing to the Federal NOLs. We believe that it is more likely than not that our results of future operations will generate sufficient taxable income to realize the deferred tax assets.
RESULTS OF OPERATIONS – YEAR ENDED DECEMBER 31, 2013 COMPARED TO 2012
OPERATING REVENUES
The following table identifies our operating revenues for the years ended December 31, 2013 and 2012:
Year Ended December 31, | ||||||||||||||
(In thousands) | 2013 | 2012 | $ Variance | % Variance | ||||||||||
Retail revenue | $ | 317,054 | $ | 285,132 | $ | 31,922 | 11.2 | % | ||||||
Wholesale and other revenue | 174,828 | 168,857 | 5,971 | 3.5 | % | |||||||||
Total operating revenues | $ | 491,882 | $ | 453,989 | $ | 37,893 | 8.3 | % | ||||||
Retail Revenue
Retail revenue increased due to higher subscriber service revenues of $36.7 million, or 14.4%, offset by a decrease in equipment revenues of $4.8 million, or 16.0%. The increase in subscriber service revenues reflects an increase in the average subscriber base and an increase in ARPA. Average subscribers grew approximately 27,900 subscribers, or 6.6%, to an average of approximately 453,300 subscribers for the year ended December 31, 2013 compared to an average of approximately 425,400 subscribers for the year ended December 31, 2012.
Wholesale and Other Revenue
Wholesale and roaming revenues from the SNA increased $5.1 million, or 3.1%, for the year ended December 31, 2013 compared to the year ended December 31, 2012. The increase is primarily the result of the $9.0 million settlement with Sprint, offset by lower voice usage. Roaming revenues from carriers other than Sprint remained relatively consistent for the year ended December 31, 2013 compared to the year ended December 31, 2012.
OPERATING EXPENSES
The following table identifies our total operating expenses for the years ended December 31, 2013 and 2012:
Year Ended December 31, | ||||||||||||||
(In thousands) | 2013 | 2012 | $ Variance | % Variance | ||||||||||
Cost of sales and services | $ | 199,004 | $ | 184,878 | $ | 14,126 | 7.6 | % | ||||||
Customer operations | 106,235 | 98,956 | 7,279 | 7.4 | % | |||||||||
Corporate operations | 42,305 | 43,755 | (1,450 | ) | (3.3 | )% | ||||||||
Depreciation and amortization | 72,944 | 63,258 | 9,686 | 15.3 | % | |||||||||
Gain on sale of intangible assets | (4,442 | ) | — | (4,442 | ) | — | % | |||||||
Total operating expenses | $ | 416,046 | $ | 390,847 | $ | 25,199 | 6.4 | % | ||||||
Cost of Sales and Services – Cost of sales and services increased $14.1 million, or 7.6%, for the year ended December 31, 2013 compared to the year ended December 31, 2012. Equipment costs increased $7.1 million, or 8.5%, reflecting an increase in the number of higher cost smartphone devices sold in 2013 compared to 2012, including the iPhone. Given the continued increase in smartphone penetration and the introduction of more technologically advanced and expensive handsets, we expect handset costs to continue to rise in 2014.
Network access and cell site expenses increased $6.7 million, or 11.4%, reflecting an increase in the number of cell sites as of December 31, 2013 and additional access connectivity to support increased data usage. Roaming expenses increased $2.9 million, or 12.9%, offset by a decrease in air and toll of $2.4 million, or 44.2%, for the year ended December 31, 2013 compared to the year ended December 31, 2012, reflecting the continued growth in subscribers and increased data usage.
33
Customer Operations – Customer operations expense increased $7.3 million, or 7.4%, for the year ended December 31, 2013 compared to the year ended December 31, 2012. Bad debt expense increased $6.1 million, or 64.1%, due primarily to an increase in the average balances per account written off for the year ended December 31, 2013 compared to the year ended December 31, 2012. Also, there were increases in advertising and marketing of $1.5 million, or 8.4%, and commissions of $1.1 million, or 5.3%, offset by a decrease in customer loyalty & retention expense of $0.6 million, or 29.9% and other selling expenses of $0.7 million, or 1.3%, for the year ended December 31, 2013 compared to the year ended December 31, 2012.
Corporate Operations – Corporate operations expense decreased $1.5 million, or 3.3%, for the year ended December 31, 2013 compared to the year ended December 31, 2012. Contracted services increased $2.2 million, or 347.7%, due to a reduction in transition services billed to Lumos Networks as part of the business separation. This increase was offset by reductions in professional fees of $0.8 million, or 28.7%, expenses related to the business separation of $1.3 million, or 77.4%, and other general corporate expenses of $1.1 million, or 3.3%, for the year ended December 31, 2013 compared to the year ended December 31, 2012.
Depreciation and Amortization – Depreciation and amortization expenses increased $9.7 million, or 15.3% for the year ended December 31, 2013 compared to the year ended December 31, 2012 primarily due to $10.3 million in incremental depreciation expense associated with the replacement of certain legacy assets in 2013, and an increase in depreciable assets placed in service.
Gain on Sale of Intangible Assets - Gain on sale of intangible assets consists of a $4.4 million gain for the year ended December 31, 2013 due to the sale of non-operational wireless spectrum.
OTHER EXPENSE
Interest expense on debt instruments increased $6.8 million, or 29.6%, to $29.7 million for the year ended December 31, 2013 compared to $22.9 million for the year ended December 31, 2012, as a result of the increased loan amount and a higher blended average effective interest rate associated with the Amended and Restated Credit Agreement consummated on November 9, 2012. Further information related to the Amended and Restated Credit Agreement is provided in Note 8 of the Notes to Consolidated Financial Statements included in this Annual Report on Form 10-K.
Other expense decreased $6.4 million, or 88.7% to $0.8 million for the year ended December 31, 2013 compared to $7.2 million for the year ended December 31, 2012, primarily reflecting a $6.8 million charge in the fourth quarter of 2012 related to the write off of a proportionate amount of the unamortized deferred issuance costs and debt discount associated with our prior senior secured credit facility, which was refinanced on November 9, 2012.
INCOME TAXES
Income tax expense was $18.5 million, with an effective tax rate of 41.0%, for the year ended December 31, 2013, representing the statutory tax rate applied to pre-tax income and the effects of certain non-deductible compensation and state minimum taxes. We expect our recurring non-deductible expenses to relate primarily to certain non-cash share-based compensation and other non-deductible compensation. Income taxes for 2012 were $12.7 million with an effective rate of 38.4%.
LIQUIDITY AND CAPITAL RESOURCES
Overview
We historically have funded our working capital requirements, capital expenditures and other payments from cash on hand and net cash provided from operating activities.
As of December 31, 2014, we had $73.5 million of cash, compared to $88.4 million as of December 31, 2013, of which $28.5 million was held in market rate savings accounts (including $9.6 million held by the Company which is not restricted for certain payments by the Amended and Restated Credit Agreement). The remaining balance of $45.0 million was held in non-interest bearing accounts. The commercial bank that held substantially all of our cash at December 31, 2014 has a rating A1 on long term deposits by Moody’s. Our working capital (current assets minus current liabilities) was $108.6 million as of December 31, 2014 compared to $104.2 million as of December 31, 2013.
As of December 31, 2014, we had $629.4 million in aggregate long-term liabilities, consisting of $519.6 million in long-term debt, including capital lease obligations, and approximately $109.8 million in other long-term liabilities primarily consisting of retirement benefits, deferred income taxes and asset retirement obligations. Further information regarding long-term debt obligations at December 31, 2014 is provided in Note 8 of the Notes to Consolidated Financial Statements included in this Annual Report on Form 10-K.
34
We have a Restricted Payments basket under the terms of the Amended and Restated Credit Agreement, which can be used to make Restricted Payments, including dividends and stock repurchases. The Restricted Payments basket increases $6.5 million per quarter, plus an additional quarterly amount for Excess Cash Flow, if any (as defined in the Amended and Restated Credit Agreement) and is decreased by any actual Restricted Payments and by certain investments and debt prepayments made after the date of the Amended and Restated Credit Agreement. For the year ended December 31, 2014 there was no Excess Cash Flow. The balance of the Restricted Payments basket as of December 31, 2014 was $60.1 million.
The Amended and Restated Credit Agreement also permits incremental commitments of up to $125.0 million (the “Incremental Commitments”) of which up to $35.0 million can be in the form of a revolving credit facility. The ability to incur the Incremental Commitments is subject to various restrictions and conditions, including having a Leverage Ratio (as defined in the Amended and Restated Credit Agreement) not in excess of 4.50:1.00 at the time of incurrence (calculated on a pro forma basis). As of December 31, 2014, there were no commitments associated with the Incremental Commitments.
We are a holding company that does not operate any business of our own. As a result, we are dependent on cash dividends and distributions and other transfers from our subsidiaries in order to make dividend payments or to make other distributions to our stockholders, including by means of a stock repurchase. Amounts that can be made available to us to pay cash dividends or repurchase stock are restricted by the Amended and Restated Credit Agreement.
Cash Flows from Continuing Operations
The following table summarizes our cash flows from continuing operations for the years ended December 31, 2014, 2013 and 2012, respectively:
Year Ended December 31, | |||||||||||
(In thousands) | 2014 | 2013 | 2012 | ||||||||
Net cash provided by operating activities | $ | 89,488 | $ | 126,404 | $ | 109,017 | |||||
Net cash used in investing activities | (106,414 | ) | (80,844 | ) | (71,633 | ) | |||||
Net cash provided (used in) by financing activities | 2,031 | (33,316 | ) | (21,137 | ) | ||||||
Operating Activities
Our cash flows from operating activities for the year ended December 31, 2014 of $89.5 million decreased $36.9 million, or 29.2%, compared to the cash flows from operating activities of $126.4 million for the year ended December 31, 2013. The decrease is due to a decrease in operating income, excluding the effect of the impairment charge, and cash provided by changes in working capital.
For the year ended December 31, 2013, net cash provided by operating activities was approximately $126.4 million, an increase of $17.4 million, or 15.9%, compared to the cash flows from operating activities of $109.0 million for the year ended December 31, 2012. The increase was due to an increase in operating income and cash provided by changes in working capital. Changes in working capital increased due to the effect of the reversal of the accrual as a result of the settlement with Sprint, timing of payments associated with wholesale receivables, an increase in inventory, reflecting higher inventory levels and cost per device and an increase in accounts payable related to the timing of vendor payments.
Investing Activities
As we continue to expand our network coverage and capacity within our coverage area, we invested $107.0 million in capital expenditures for the year ended December 31, 2014. This was higher than the $80.7 million of capital expenditures for the year ended December 31, 2013. Included in the capital spending for the year ended December 31, 2014 was $91.3 million of expenditures for additional capacity to support our projected growth, and $16.4 million to maintain our existing networks and other business needs.
We currently expect capital expenditures for 2015 to be in the range of $95.0 million to $105.0 million, including approximately $90.0 million to upgrade portions of our network to 4G LTE advanced technologies. Other expected capital expenditures in 2015 include capacity and network coverage expansion, upgrades to our information technology systems in support of growth, and other business needs.
Our cash flows used in investing activities for the year ended December 31, 2013 were $80.8 million. Included in the capital spending for the year ended December 31, 2013 was $63.1 million of expenditures for additional capacity to support our projected growth, and $17.6 million to maintain our existing networks and other business needs. We deposited $2.2 million into
35
a separate restricted account to serve as collateral for a letter of credit. We received $4.6 million in proceeds related to the sale of intangible assets.
Financing Activities
Net cash provided by financing activities for the year ended December 31, 2014 aggregated a net of $2.0 million, which primarily represents the following:
• | $39.5 million net proceeds from the January 2014 debt refinancing; |
• | $3.6 million in debt issuance costs; |
• | $5.3 million in repayments on our long-term debt; |
• | $27.2 million used for common stock cash dividends ($1.26 per share in the aggregate) paid on January 10, 2014, April 11, 2014 and July 11, 2014; and |
• | $0.8 million used for capital distributions to noncontrolling interests. |
Net cash used in financing activities for the year ended December 31, 2013 aggregated $33.3 million, which primarily represents the following:
• | $5.0 million in repayments on our long-term debt; |
• | $27.1 million used for common stock cash dividends ($1.26 per share in the aggregate) paid on April 12, 2013, July 12, 2013, October 11, 2013; and |
• | $1.6 million used for capital distributions to noncontrolling interests. |
On May 22, 2014, the board of directors, in order to support our LTE network expansion and wholesale and retail growth initiatives, eliminated the quarterly dividend. Any decision to declare future dividends will be made at the discretion of the board of directors and will depend on, among other things, our results of operations, cash requirements, investment opportunities, financial condition, contractual restrictions and other factors that the board of directors may deem relevant. We are a holding company that does not operate any business of our own. As a result, we are dependent on cash dividends and distributions and other transfers from our subsidiaries to make dividend payments or to make other distributions to our stockholders, including by means of a stock repurchase. As discussed above, amounts that can be made available to us to pay cash dividends or repurchase stock are restricted by the Amended and Restated Credit Agreement.
We believe that our current cash balances of $73.5 million and our cash flow from operations will be sufficient to satisfy our foreseeable working capital requirements, capital expenditures, interest costs, required debt principal payments prior to maturity, and stock repurchases, if any, through our stock repurchase plan.
CONTRACTUAL OBLIGATIONS AND COMMERCIAL COMMITMENTS
We have various contractual obligations that are recorded as liabilities in our consolidated financial statements. Other items, such as certain purchase commitments and other executory contracts, which may affect our financial condition, are not recognized as liabilities in our consolidated financial statements, but are required to be disclosed in the footnotes to the financial statements. For example, we are contractually committed to acquire handset equipment and make certain minimum lease payments for the use of property under operating lease agreements.
The following table summarizes our significant contractual obligations and commercial commitments on an undiscounted basis as of December 31, 2014 and the future periods in which such obligations are expected to be settled in cash. In addition, the table reflects the timing of principal payments on outstanding borrowings.
36
Additional details regarding these obligations are provided in the Notes to Consolidated Financial Statements contained in Part II, Item 8. of this Annual Report on Form 10-K, as referenced in the table:
Payments Due by Period | |||||||||||||||||||
(In thousands) | Total (2) | Less than one year | Two to three years | Four to five years | After five years | ||||||||||||||
Long-term debt obligations (1)(3) | $ | 528,345 | $ | 5,405 | $ | 10,810 | $ | 512,130 | $ | — | |||||||||
Capital lease obligations (3) | 904 | 411 | 400 | 93 | — | ||||||||||||||
Operating lease obligations (4) | 302,818 | 37,941 | 73,764 | 69,359 | 121,754 | ||||||||||||||
Purchase obligations (5) | 128,092 | 127,132 | 960 | — | — | ||||||||||||||
$ | 960,159 | $ | 170,889 | $ | 85,934 | $ | 581,582 | $ | 121,754 | ||||||||||
(1) | Represents the Term Loans under the Amended and Restated Credit Agreement. See Note 8 of the Notes to Consolidated Financial Statements included in this Annual Report on Form 10-K for further information. |
(2) | Excludes certain benefit obligation projected payments under our qualified and non-qualified pension and other postretirement benefit plans. See Note 14 of the Notes to Consolidated Financial Statements included in this Annual Report on Form 10-K for further information. |
(3) | Excludes interest. |
(4) | Represents contractual obligations to make certain minimum lease payments for the use of property under operating lease agreements for administrative office space, retail space, tower space and equipment, certain of which have renewal options. See Note 16 of the Notes to Consolidated Financial Statements included in this Annual Report on Form 10-K for further information. |
(5) | Represents purchase commitments relating to network capital expenditures, handsets and other equipment to support operations. |
OFF BALANCE SHEET ARRANGEMENTS
We do not have any off balance sheet arrangements or financing activities with special purpose entities.
CRITICAL ACCOUNTING POLICIES AND ESTIMATES
The preparation of financial statements in conformity with GAAP requires that management apply accounting policies and make estimates and assumptions about future events and apply judgments that affect results of operations and the amounts of assets and liabilities reported in the financial statements and the related disclosures. We base our estimates, assumptions and judgment on historical experience, current and projected business trends, general economic conditions and other factors that management believes to be relevant at the time our consolidated financial statements are prepared. However, because future events and their effects cannot be determined with certainty, actual results could differ from our estimates and assumptions, and such differences could be material to reported results of operations and financial position.
We believe that the areas described below are the most critical to aid in fully understanding and evaluating our reported financial results, as they require management’s most significant judgments in the application of accounting policy or in making estimates and assumptions that are inherently uncertain and that may change in subsequent periods. Additional discussion of the application of these accounting policies can be found in the Notes to Consolidated Financial Statements. Management has reviewed these critical accounting policies, estimates and assumptions and related disclosures with the Audit Committee of our Board.
Revenue Recognition
The Company recognizes revenue when services are rendered or when products are delivered and functional, as applicable. Certain services of the Company require payment in advance of service performance. In such cases, the Company records a service liability at the time of billing and subsequently recognizes revenue ratably over the service period. The Company bills customers certain transactional taxes on service revenues. These transactional taxes are not included in reported revenues as they are recognized as liabilities at the time customers are billed.
The Company earns retail and wholesale revenues by providing access to and usage of its networks. Retail and certain wholesale revenues are recognized as services are provided. In long term contracts certain fixed elements are required to be recognized on a straight-line basis over the term of the agreement. Revenues for equipment sales are recognized at the point of sale. PCS handset equipment sold with service contracts are generally sold at prices below cost, based on the terms of the service contracts. The Company recognizes the entire cost of the handsets at the time of sale.
37
On August 15, 2014, the Company launched EIP, which offers customers the option to pay for their devices over 24 months with no service contract. Additionally, after a specified period of time, customers have the right to trade in the original device for a new device and have the remaining unpaid balance satisfied. For customers that elect the EIP option, the Company recognizes revenue at the point of sale for the full retail price of the device, net of the estimated fair value of imputed interest and the estimated loss on trade-in.
The Company evaluates related transactions to determine whether they should be viewed as multiple deliverable arrangements, which impact revenue recognition. Multiple deliverable arrangements are presumed to be bundled transactions and the total consideration is measured and allocated to the separate units based on their relative selling price with certain limitations. The Company has determined that sales of handsets with service contracts related to these sales generated from Company-operated retail stores are multiple deliverable arrangements. Accordingly, substantially all of the nonrefundable activation fee revenues (as well as the associated direct costs) are allocated to the wireless handset and are recognized at the time of the sale based on the fact that the handsets are generally sold well below cost and thus appropriately allocated to the point of sale based on the relative selling price evaluation. However, revenue and certain associated direct costs for activations sold at third-party retail locations are deferred and amortized over the estimated life of the customer relationship as the Company is not a principal in the transaction to sell the handset and therefore any activation fees charged are fully attributable to the service revenues.
The Company recognizes revenue in the period that persuasive evidence of an arrangement exists, delivery of the product has occurred or services have been rendered, it is able to determine the amount and when the collection of such amount is considered probable.
Allowance for Doubtful Accounts
The Company maintains an allowance for doubtful accounts for which we evaluate and estimate the collectability, based on a combination of factors including the length of time the receivables are past due, historical results, current and expected trends and changes in credit policies. Management believes the allowance adequately covers all anticipated losses with respect to trade receivables. Actual credit losses could differ from such estimates, which may result in higher costs and expenses in future periods if our estimate of uncollectible accounts is too low, or decreased costs and expenses in future periods if it is too high.
Inventories and Supplies
The Company’s inventories and supplies consist primarily of items held for resale such as PCS devices and accessories. The Company values its inventory at the lower of cost or market. Inventory cost is computed on a currently adjusted standard cost basis (which approximates actual cost on a first-in, first-out basis). Market value is determined by reviewing current replacement cost, marketability and obsolescence.
Long-Lived Asset Recovery
Long-lived assets comprise property, plant and equipment, intangible assets (including goodwill, radio spectrum licenses, customer relationships and trademarks) and long-term deferred charges. Long-lived assets, excluding goodwill and intangible assets with indefinite useful lives, are recorded at cost and reviewed for impairment whenever events or changes in circumstances indicate that the carrying amount should be evaluated pursuant to the subsequent measurement guidance described in FASB ASC 360, Property, Plant and Equipment. Impairment is determined by comparing the carrying value of these long-lived assets to management’s best estimate of future undiscounted cash flows expected to result from the use of the assets. If the carrying value exceeds the estimated undiscounted cash flows, the excess of the asset’s carrying value over the estimated fair value is recorded as an impairment charge.
Depreciation of property, plant and equipment is calculated on a straight-line basis over the estimated useful lives of the assets, which the Company reviews and updates based on historical experiences and future expectations. Buildings are depreciated over a 50-year life and leasehold improvements, which are categorized in land and buildings, are depreciated over the shorter of the estimated useful lives or the remaining lease terms. Network plant and equipment, which includes cell towers and site costs, and switch, cell site and other network equipment, are depreciated over various lives ranging from 5 to 17 years, with a weighted average life of approximately 10 years. Furniture, fixtures and other equipment are depreciated over various lives ranging from 2 to 18 years.
The Company formally evaluates the appropriateness of estimated useful lives on at least an annual basis. Consideration is given to the trends in technological evolution and the telecommunications industry, the Company’s maintenance practices and the functional condition of long-lived assets in relation to the remaining estimated useful life of the asset. When necessary, adjustments are made to the applicable useful life of an asset class or depreciation is accelerated for assets that have been identified for retirement prior to the expiration of the original useful life.
38
Goodwill and Indefinite-Lived Intangibles
Goodwill and radio spectrum licenses are considered indefinite-lived intangible assets. Indefinite-lived intangible assets are not subject to amortization but are instead tested for impairment annually, on October 1, or more frequently if an event indicates that the asset might be impaired.
Before employing detailed impairment testing, the Company first evaluates the likelihood of impairment by considering relevant qualitative factors that may have a significant bearing on fair value. If we determine that it is more likely than not that goodwill is impaired, we apply detailed testing methodologies. Otherwise, we conclude that no impairment exists. For detailed testing, the Company uses a two-step process to test for goodwill impairment. Step one requires a determination of the fair value of each of the reporting units and, to the extent that this fair value of the reporting unit exceeds its carrying value (including goodwill), the step two calculation of implied fair value of goodwill is not required and no impairment loss is recognized. In testing for goodwill impairment, the Company utilizes a combination of a discounted cash flow model and an analysis which allocates enterprise value to the reporting units.
The radio spectrum licenses relate primarily to PCS licenses in the markets that we serve. The Company considers a number of valuation methods, including market based and the Greenfield cash flow method, in its impairment testing for these assets.
Income Taxes
Deferred income taxes are provided on an asset and liability method whereby deferred tax assets are recognized for deductible temporary differences and deferred tax liabilities are recognized for taxable temporary differences. Temporary differences are the differences between the reported amounts of assets and liabilities and their tax bases. Deferred tax assets and liabilities are adjusted for the effects of changes in tax laws and rates on the date of enactment. The Company accrues interest and penalties related to unrecognized tax benefits in interest expense and income tax expense, respectively. Further information regarding income taxes, including a detailed reconciliation of current year activity, is provided in Note 13 of the Notes to Consolidated Financial Statements included in this Annual Report on Form 10-K.
Pension Benefits and Retirement Benefits Other Than Pensions
NTELOS Inc. sponsors a non-contributory defined benefit pension plan (“Pension Plan”) covering all employees who meet eligibility requirements and were employed by NTELOS Inc. prior to October 1, 2003. The Pension Plan was closed to NTELOS Inc. employees hired on or after October 1, 2003. Pension benefits vest after five years of plan service and are based on years of service and an average of the five highest consecutive years of compensation subject to certain reductions if the employee retires before reaching age 65 and elects to receive the benefit prior to age 65. Effective December 31, 2012, the Company froze future benefit accruals. In 2014, we adopted updated mortality tables published by the Society of Actuaries that predict increasing life expectancies in the United States.
IRC Sections 412 and 430 and Sections 302 and 303 of the Employee Retirement Income Security Act of 1974, as amended establish minimum funding requirements for defined benefit pension plans. The minimum required contribution is generally equal to the target normal cost plus the shortfall amortization installments for the current plan year and each of the six preceding plan years less any calculated credit balance. If plan assets (less calculated credits) are equal to or exceed the funding target, the minimum required contribution is the target normal cost reduced by the excess funding, but not below zero. The Company’s policy is to make contributions to stay at or above the threshold required in order to prevent benefit restrictions and related additional notice requirements and is intended to provide not only for benefits based on service to date, but also for those expected to be earned in the future. Also, NTELOS Inc. has nonqualified pension plans that are accounted for similar to its Pension Plan.
NTELOS Inc. provides certain health care and life benefits for retired employees that meet eligibility requirements. The Company has two qualified nonpension postretirement benefit plans. The health care plan is contributory, with participants’ contributions adjusted annually. The life insurance plan also is contributory. These obligations, along with all of the pension plans and other postretirement benefit plans, are NTELOS Inc. obligations assumed by the Company. Eligibility for the life insurance plan is restricted to active pension participants age 50-64 as of January 5, 1994. Neither plan is eligible to employees hired after April 1993. The accounting for the plans anticipates that the Company will maintain a consistent level of cost sharing for the benefits with the retirees. The Company’s share of the projected costs of benefits that will be paid after retirement is generally being accrued by charges to expense over the eligible employees’ service periods to the dates they are fully eligible for benefits.
NTELOS Inc. also sponsors a contributory defined contribution plan under IRC Section 401(k) for substantially all employees. The Company’s policy is to match 100% of each participant’s annual contributions for contributions up to 1% of each participant’s annual compensation and 50% of each participant’s annual contributions up to an additional 5% of each
39
participant’s annual compensation. Company contributions vest after two years of service. Effective June 1, 2009, the Company began funding its 401(k) matching contributions in shares of the Company’s common stock. Further information regarding these plans is provided in Note 14 of the Notes to Consolidated Financial Statements included in this Annual Report on Form 10-K.
RECENT ACCOUNTING PRONOUNCEMENTS
Information regarding recent accounting pronouncements is provided in Note 2 of the Notes to Consolidated Financial Statements included in this Annual Report on Form 10-K.
Item 7A. | Quantitative and Qualitative Disclosures About Market Risk. |
In addition to the risks inherent in our operations, we are exposed to certain market risks including the impact of interest rate changes.
Aggregate maturities of long-term debt outstanding under the Amended and Restated Credit Agreement, based on the contractual terms of the instruments, were $528.3 million as of December 31, 2014. Under this facility, the Term Loan bears interest at a rate equal to either 4.75% above the Eurodollar Rate (as defined in the Amended and Restated Credit Agreement) or 3.75% above the Base Rate (as defined in the Amended and Restated Credit Agreement). The Amended and Restated Credit Agreement provides that the Eurodollar Rate shall never be less than 1.00% per annum and the Base Rate shall never be less than 2.00% per annum. We also have other fixed rate, long-term debt in the form of capital leases totaling $0.9 million as of December 31, 2014.
In the first quarter of 2013, we purchased an interest rate cap for $0.9 million with a notional amount of $350.0 million. The interest rate cap reduces our exposure to changes in the three-month Eurodollar rate by capping the rate at 1.0%. The interest rate cap agreement expires in August 2015.
At December 31, 2014, our financial assets included cash of $73.5 million. Securities and investments totaled $1.5 million at December 31, 2014.
The following sensitivity analysis estimates the impact on the fair value of certain financial instruments, which are potentially subject to material market risks, at December 31, 2014, assuming a ten percent increase and a ten percent decrease in the levels of our interest rates:
(In thousands) | Book Value | Fair Value | Estimated fair value assuming noted decrease in market pricing | Estimated fair value assuming noted increase in market pricing | |||||||||||
Secured term loans | $ | 524,504 | $ | 459,660 | $ | 476,487 | $ | 440,761 | |||||||
Capital lease obligations | 904 | 904 | 995 | 814 | |||||||||||
Our Amended and Restated Credit Agreement accrues interest based on the Eurodollar Rate plus an applicable margin (currently 475 bps). LIBOR for purposes of this facility floats when it exceeds the floor of 1.00%. At December 31, 2014, an immediate 10% increase or decrease to LIBOR would not currently have an effect on our interest expense as the variable LIBOR component would remain below the floor. In addition, at December 31, 2014 we had approximately $28.5 million of cash held in a market rate savings accounts. An immediate 10% increase or decrease to the market interest rate would not have a material effect on our cash flows.
40
Item 8. | Financial Statements and Supplementary Data. |
NTELOS HOLDINGS CORP.
INDEX TO AUDITED CONSOLIDATED FINANCIAL STATEMENTS
41
Report of Independent Registered Public Accounting Firm
The Board of Directors and Stockholders
NTELOS Holdings Corp.:
We have audited the accompanying consolidated balance sheets of NTELOS Holdings Corp. (the Company) as of December 31, 2014 and 2013, and the related consolidated statements of operations, comprehensive income (loss), cash flows, and changes in stockholders’ equity (deficit) for each of the years in the three-year period ended December 31, 2014. These consolidated financial statements are the responsibility of the Company’s management. Our responsibility is to express an opinion on these consolidated financial statements based on our audits.
We conducted our audits in accordance with the standards of the Public Company Accounting Oversight Board (United States). Those standards require that we plan and perform the audit to obtain reasonable assurance about whether the financial statements are free of material misstatement. An audit includes examining, on a test basis, evidence supporting the amounts and disclosures in the financial statements. An audit also includes assessing the accounting principles used and significant estimates made by management, as well as evaluating the overall financial statement presentation. We believe that our audits provide a reasonable basis for our opinion.
In our opinion, the consolidated financial statements referred to above present fairly, in all material respects, the financial position of NTELOS Holdings Corp. as of December 31, 2014 and 2013, and the results of their operations and their cash flows for each of the years in the three-year period ended December 31, 2014, in conformity with U.S. generally accepted accounting principles.
We also have audited, in accordance with the standards of the Public Company Accounting Oversight Board (United States), the Company’s internal control over financial reporting as of December 31, 2014, based on criteria established in Internal Control – Integrated Framework (1992) issued by the Committee of Sponsoring Organizations of the Treadway Commission (COSO), and our report dated February 26, 2015 expressed an unqualified opinion on the effectiveness of the Company’s internal control over financial reporting.
/s/ KPMG LLP | ||
Richmond, Virginia | ||
February 26, 2015 | ||
42
NTELOS Holdings Corp.
Consolidated Balance Sheets
(In thousands, except par value per share amounts) | December 31, 2014 | December 31, 2013 | |||||
ASSETS | |||||||
Current Assets | |||||||
Cash | $ | 73,546 | $ | 88,441 | |||
Restricted cash | 2,167 | 2,167 | |||||
Accounts receivable, net | 43,668 | 37,741 | |||||
Inventories and supplies | 18,297 | 23,962 | |||||
Deferred income taxes | 24,770 | 10,650 | |||||
Prepaid expenses | 13,543 | 15,891 | |||||
Other current assets | 4,626 | 4,916 | |||||
180,617 | 183,768 | ||||||
Assets Held for Sale | 64,271 | — | |||||
Securities and Investments | 1,522 | 1,499 | |||||
Property, Plant and Equipment, net | 289,947 | 319,376 | |||||
Intangible Assets | |||||||
Goodwill | 63,700 | 63,700 | |||||
Radio spectrum licenses | 44,933 | 131,834 | |||||
Customer relationships and trademarks, net | 5,084 | 6,985 | |||||
Deferred Charges and Other Assets | 18,474 | 9,089 | |||||
TOTAL ASSETS | $ | 668,548 | $ | 716,251 | |||
LIABILITIES AND STOCKHOLDERS' EQUITY (DEFICIT) | |||||||
Current Liabilities | |||||||
Current portion of long-term debt | $ | 5,816 | $ | 5,410 | |||
Accounts payable | 24,541 | 24,748 | |||||
Dividends payable | — | 9,034 | |||||
Advance billings and customer deposits | 14,553 | 14,055 | |||||
Accrued expenses and other current liabilities | 27,153 | 26,344 | |||||
72,063 | 79,591 | ||||||
Long-Term Debt | 519,592 | 484,956 | |||||
Retirement Benefits | 25,209 | 11,995 | |||||
Deferred Income Taxes | 39,620 | 62,893 | |||||
Other Long-Term Liabilities | 45,016 | 33,023 | |||||
629,437 | 592,867 | ||||||
Commitments and Contingencies | |||||||
Equity | |||||||
Preferred stock, par value $.01 per share, authorized 100 shares, none issued | — | — | |||||
Common stock, par value $.01 per share, authorized 55,000 shares; 21,634 shares issued and 21,616 shares outstanding (21,519 shares issued and 21,510 shares outstanding at December 31, 2013) | 214 | 214 | |||||
Additional paid in capital | 28,663 | 44,462 | |||||
Treasury stock, at cost, 18 shares (9 share at December 31, 2013) | (285 | ) | (147 | ) | |||
Accumulated deficit | (53,634 | ) | — | ||||
Accumulated other comprehensive loss | (9,090 | ) | (1,246 | ) | |||
Total NTELOS Holdings Corp. Stockholders’ Equity/(Deficit) | (34,132 | ) | 43,283 | ||||
Noncontrolling Interests | 1,180 | 510 | |||||
(32,952 | ) | 43,793 | |||||
TOTAL LIABILITIES AND STOCKHOLDERS' EQUITY (DEFICIT) | $ | 668,548 | $ | 716,251 | |||
See accompanying Notes to Consolidated Financial Statements.
43
NTELOS Holdings Corp.
Consolidated Statements of Operations
Year Ended December 31, | |||||||||||
(In thousands, except per share amounts) | 2014 | 2013 | 2012 | ||||||||
Operating Revenues | $ | 487,834 | $ | 491,882 | $ | 453,989 | |||||
Operating Expenses | |||||||||||
Cost of sales and services | 223,140 | 199,004 | 184,878 | ||||||||
Customer operations | 105,774 | 106,235 | 98,956 | ||||||||
Corporate operations | 42,195 | 42,305 | 43,755 | ||||||||
Restructuring | 3,663 | — | — | ||||||||
Impairment and other charges | 87,853 | — | — | ||||||||
Depreciation and amortization | 76,459 | 72,944 | 63,258 | ||||||||
Gain on sale of intangible assets | — | (4,442 | ) | — | |||||||
539,084 | 416,046 | 390,847 | |||||||||
Operating Income (Loss) | (51,250 | ) | 75,836 | 63,142 | |||||||
Other Expense | |||||||||||
Interest expense | (32,696 | ) | (29,743 | ) | (22,944 | ) | |||||
Other expense | (1,114 | ) | (810 | ) | (7,194 | ) | |||||
(33,810 | ) | (30,553 | ) | (30,138 | ) | ||||||
Income (Loss) before Income Taxes | (85,060 | ) | 45,283 | 33,004 | |||||||
Income Tax Expense (Benefit) | (32,894 | ) | 18,544 | 12,676 | |||||||
Net Income (Loss) | (52,166 | ) | 26,739 | 20,328 | |||||||
Net Income Attributable to Noncontrolling Interests | (1,468 | ) | (2,061 | ) | (1,941 | ) | |||||
Net Income (Loss) Attributable to NTELOS Holdings Corp. | $ | (53,634 | ) | $ | 24,678 | $ | 18,387 | ||||
Earnings (Loss) per Share Attributable to NTELOS Holdings Corp. | |||||||||||
Basic | $ | (2.54 | ) | $ | 1.17 | $ | 0.88 | ||||
Weighted average shares outstanding – basic | 21,111 | 21,026 | 20,889 | ||||||||
Diluted | $ | (2.54 | ) | $ | 1.13 | $ | 0.86 | ||||
Weighted average shares outstanding – diluted | 21,111 | 21,826 | 21,337 | ||||||||
Cash Dividends Declared per Share – Common Stock | $ | 0.84 | $ | 1.68 | $ | 1.68 | |||||
See accompanying Notes to Consolidated Financial Statements.
44
NTELOS Holdings Corp.
Consolidated Statements of Comprehensive Income (Loss)
Year Ended December 31, | |||||||||||
(In thousands) | 2014 | 2013 | 2012 | ||||||||
Net Income (Loss) Attributable to NTELOS Holdings Corp. | $ | (53,634 | ) | $ | 24,678 | $ | 18,387 | ||||
Other Comprehensive Income (Loss): | |||||||||||
Amortization of unrealized loss from defined benefit plans, net of $45, $167 and $335 of deferred income taxes in 2014, 2013 and 2012, respectively | 71 | 263 | 526 | ||||||||
Unrecognized gain/(loss) from defined benefit plans, net of $5,039, $3,299, and $1,756 of deferred income taxes in 2014, 2013, and 2012, respectively | (7,915 | ) | 5,180 | 2,758 | |||||||
Comprehensive Income (Loss) Attributable to NTELOS Holdings Corp. | (61,478 | ) | 30,121 | 21,671 | |||||||
Comprehensive Income Attributable to Noncontrolling Interests | 1,468 | 2,061 | 1,941 | ||||||||
Comprehensive Income (Loss) | $ | (60,010 | ) | $ | 32,182 | $ | 23,612 | ||||
See accompanying Notes to Consolidated Financial Statements.
45
NTELOS Holdings Corp.
Consolidated Statements of Cash Flows
Year Ended December 31, | |||||||||||
(In thousands) | 2014 | 2013 | 2012 | ||||||||
Cash flows from operating activities | |||||||||||
Net income (loss) | $ | (52,166 | ) | $ | 26,739 | $ | 20,328 | ||||
Adjustments to reconcile net income (loss) to net cash provided by operating activities | |||||||||||
Depreciation and amortization | 76,459 | 72,944 | 63,258 | ||||||||
Impairment and other charges | 87,853 | — | — | ||||||||
Gain on sale of intangible assets | — | (4,442 | ) | — | |||||||
Deferred income taxes | (33,359 | ) | 16,968 | 16,147 | |||||||
Equity-based compensation | 2,969 | 5,553 | 6,029 | ||||||||
Amortization of loan origination costs and debt discount | 2,477 | 2,814 | 3,284 | ||||||||
Write off unamortized debt issuance costs | 895 | — | 6,816 | ||||||||
Loss on interest swap derivatives | 229 | 656 | — | ||||||||
Retirement benefits and other | 848 | 1,690 | 3,642 | ||||||||
Changes in operating assets and liabilities | |||||||||||
Accounts receivable | (5,927 | ) | 13,561 | (15,009 | ) | ||||||
Inventories and supplies | 5,665 | (14,381 | ) | (2,011 | ) | ||||||
Other current assets | (7,097 | ) | (1,577 | ) | (3,464 | ) | |||||
Income taxes | (1,706 | ) | — | (1,668 | ) | ||||||
Accounts payable | (444 | ) | 10,232 | 3,660 | |||||||
Other current liabilities | 10,793 | (4,147 | ) | 12,189 | |||||||
Retirement benefit contributions and distributions | 1,999 | (206 | ) | (4,184 | ) | ||||||
Net cash provided by operating activities | 89,488 | 126,404 | 109,017 | ||||||||
Cash flows from investing activities | |||||||||||
Purchases of property, plant and equipment | (107,000 | ) | (80,708 | ) | (71,760 | ) | |||||
Restricted cash pledged for letter of credit | — | (2,167 | ) | — | |||||||
Proceeds from sale of intangible assets | — | 4,644 | — | ||||||||
Other, net | 586 | (2,613 | ) | 127 | |||||||
Net cash used in investing activities | (106,414 | ) | (80,844 | ) | (71,633 | ) | |||||
Cash flows from financing activities | |||||||||||
Proceeds from issuance of long-term debt, net of original issue discount | 187,655 | — | 495,000 | ||||||||
Debt issuance and refinancing costs | (3,551 | ) | — | (7,464 | ) | ||||||
Repayments on senior secured term loans | (153,477 | ) | (5,000 | ) | (462,087 | ) | |||||
Cash dividends paid on common stock | (27,235 | ) | (27,054 | ) | (44,526 | ) | |||||
Capital distributions to noncontrolling interests | (798 | ) | (1,561 | ) | (1,481 | ) | |||||
Other, net | (563 | ) | 299 | (579 | ) | ||||||
Net cash provided by (used in) financing activities | 2,031 | (33,316 | ) | (21,137 | ) | ||||||
Increase (decrease) in cash | (14,895 | ) | 12,244 | 16,247 | |||||||
Cash, beginning of period | 88,441 | 76,197 | 59,950 | ||||||||
Cash, end of period | $ | 73,546 | $ | 88,441 | $ | 76,197 | |||||
See accompanying Notes to Consolidated Financial Statements.
46
NTELOS Holdings Corp.
Consolidated Statements of Changes in Stockholders’ Equity (Deficit)
(In thousands) | Common Shares | Treasury Shares | Common Stock | Additional Paid In Capital | Treasury Stock | Retained Earnings | Accumulated Other Comprehensive Loss | Total NTELOS Holdings Corp. Stockholders’ Equity | Noncontrolling Interests | Total Equity | |||||||||||||||||||||||||||
Balance, December 31, 2011 | 21,195 | 108 | $ | 212 | $ | 65,591 | $ | (8,228 | ) | $ | 3,982 | $ | (9,973 | ) | $ | 51,584 | $ | (450 | ) | $ | 51,134 | ||||||||||||||||
Equity-based compensation * | 67 | (107 | ) | (2,741 | ) | 8,225 | 5,484 | 5,484 | |||||||||||||||||||||||||||||
Cash dividends declared | (13,255 | ) | (22,369 | ) | (35,624 | ) | (35,624 | ) | |||||||||||||||||||||||||||||
Capital distribution to noncontrolling interests | (1,481 | ) | (1,481 | ) | |||||||||||||||||||||||||||||||||
Net income attributable to NTELOS Holdings Corp. | 18,387 | 18,387 | 18,387 | ||||||||||||||||||||||||||||||||||
Amortization of unrealized loss from defined benefit plans, net of $335 of deferred income taxes | 526 | 526 | 526 | ||||||||||||||||||||||||||||||||||
Recognized loss from defined benefit plans, net of $1,756 of deferred income taxes | 2,758 | 2,758 | 2,758 | ||||||||||||||||||||||||||||||||||
Comprehensive income attributable to noncontrolling interests | 1,941 | 1,941 | |||||||||||||||||||||||||||||||||||
Spin-off of Lumos Networks | 1,410 | 1,410 | 1,410 | ||||||||||||||||||||||||||||||||||
Balance, December 31, 2012 | 21,262 | 1 | $ | 212 | $ | 51,005 | $ | (3 | ) | $ | — | $ | (6,689 | ) | $ | 44,525 | $ | 10 | $ | 44,535 | |||||||||||||||||
(In thousands) | Common Shares | Treasury Shares | Common Stock | Additional Paid In Capital | Treasury Stock | Retained Earnings | Accumulated Other Comprehensive Loss | Total NTELOS Holdings Corp. Stockholders’ Equity | Noncontrolling Interests | Total Equity | |||||||||||||||||||||||||||
Balance, December 31, 2012 | 21,262 | 1 | $ | 212 | $ | 51,005 | $ | (3 | ) | $ | — | $ | (6,689 | ) | $ | 44,525 | $ | 10 | $ | 44,535 | |||||||||||||||||
Equity-based compensation * | 257 | 8 | 2 | 5,054 | (144 | ) | 4,912 | 4,912 | |||||||||||||||||||||||||||||
Cash dividends declared | (11,597 | ) | (24,678 | ) | (36,275 | ) | (36,275 | ) | |||||||||||||||||||||||||||||
Capital distribution to noncontrolling interests | (1,561 | ) | (1,561 | ) | |||||||||||||||||||||||||||||||||
Net income attributable to NTELOS Holdings Corp. | 24,678 | 24,678 | 24,678 | ||||||||||||||||||||||||||||||||||
Unrecognized gain from defined benefit plans, net of $3,299 of deferred taxes | 5,180 | 5,180 | 5,180 | ||||||||||||||||||||||||||||||||||
Amortization of unrealized loss from defined benefit plans, net of $167 of deferred income taxes | 263 | 263 | 263 | ||||||||||||||||||||||||||||||||||
Comprehensive income attributable to noncontrolling interests | 2,061 | 2,061 | |||||||||||||||||||||||||||||||||||
Balance, December 31, 2013 | 21,519 | 9 | $ | 214 | $ | 44,462 | $ | (147 | ) | $ | — | $ | (1,246 | ) | $ | 43,283 | $ | 510 | $ | 43,793 | |||||||||||||||||
* | Includes restricted shares issued, employee stock purchase plan issuances, shares issued through 401(k) matching contributions and stock options exercised, and other activity. |
See accompanying Notes to Consolidated Financial Statements.
47
NTELOS Holdings Corp.
Consolidated Statements of Changes in Stockholders’ Equity (Deficit)
(In thousands) | Common Shares | Treasury Shares | Common Stock | Additional Paid In Capital | Treasury Stock | Retained Deficit | Accumulated Other Comprehensive Loss | Total NTELOS Holdings Corp. Stockholders’ Equity (Deficit) | Noncontrolling Interests | Total Equity | |||||||||||||||||||||||||||
Balance, December 31, 2013 | 21,519 | 9 | $ | 214 | $ | 44,462 | $ | (147 | ) | $ | — | $ | (1,246 | ) | $ | 43,283 | $ | 510 | $ | 43,793 | |||||||||||||||||
Equity-based compensation * | 97 | 9 | 2,417 | (138 | ) | 2,279 | 2,279 | ||||||||||||||||||||||||||||||
Cash dividends declared | (18,216 | ) | — | (18,216 | ) | (18,216 | ) | ||||||||||||||||||||||||||||||
Capital distribution to noncontrolling interests | — | (798 | ) | (798 | ) | ||||||||||||||||||||||||||||||||
Net loss attributable to NTELOS Holdings Corp. | (53,634 | ) | (53,634 | ) | (53,634 | ) | |||||||||||||||||||||||||||||||
Unrecognized loss from defined benefit plans, net of $5,039 of deferred taxes | (7,915 | ) | (7,915 | ) | (7,915 | ) | |||||||||||||||||||||||||||||||
Amortization of unrealized loss from defined benefit plans, net of $45 of deferred income taxes | 71 | 71 | 71 | ||||||||||||||||||||||||||||||||||
Comprehensive income attributable to noncontrolling interests | — | 1,468 | 1,468 | ||||||||||||||||||||||||||||||||||
Balance, December 31, 2014 | 21,616 | 18 | $ | 214 | $ | 28,663 | $ | (285 | ) | $ | (53,634 | ) | $ | (9,090 | ) | $ | (34,132 | ) | $ | 1,180 | $ | (32,952 | ) | ||||||||||||||
* | Includes restricted shares issued, employee stock purchase plan issuances, shares issued through 401(k) matching contributions and stock options exercised, and other activity. |
See accompanying Notes to Consolidated Financial Statements.
48
NTELOS Holdings Corp.
Notes to Consolidated Financial Statements
Note 1. Description of Business
NTELOS Holdings Corp. (hereafter referred to as “Holdings Corp.” or the “Company”), through NTELOS Inc., its wholly-owned subsidiary (“NTELOS Inc.”) and its subsidiaries, is a regional provider of digital wireless communications services to consumers and businesses primarily in Virginia, West Virginia and certain portions of surrounding states. The Company’s primary services are wireless voice and data digital personal communications services (“PCS”) provided through NTELOS-branded retail operations and on a wholesale basis to other PCS providers, most notably through an arrangement with Sprint Spectrum L.P. (“Sprint Spectrum”), and Sprint Spectrum on behalf of and as an agent for SprintCom, Inc. (“SprintCom”) (Sprint Spectrum and SprintCom collectively, “Sprint”), which arrangement is referred to herein as the “Strategic Network Alliance” or "SNA." See Note 15 for additional information regarding this arrangement. The Company does not have any independent operations.
Holdings Corp. was formed in January 2005 for the purpose of acquiring NTELOS Inc. On January 18, 2005, Holdings Corp. entered into an agreement with NTELOS Inc. and certain of its stockholders to acquire the common stock of NTELOS Inc. On February 24, 2005, Holdings Corp. purchased 24.9% of NTELOS Inc. common stock and stock warrants. By May 2005, the Company had acquired all of NTELOS Inc.’s common shares, warrants and vested options. During the first quarter of 2006, Holdings Corp. completed an initial public offering of its common stock. Quadrangle Capital Partners LLP and certain of its affiliates (“Quadrangle”), a founding member of Holdings Corp., owns approximately 20% of the Company’s common shares as of December 31, 2014.
On December 1, 2014, we entered into an agreement to sell our wireless spectrum licenses in our eastern Virginia and Outer Banks of North Carolina markets (“Eastern Markets”) valued at approximately $56.0 million. The agreement is subject to customary closing conditions, including final regulatory approval by the FCC. We plan to operate and generate cash from our Eastern Markets until the later of November 15, 2015 or 90 days after the transfer of the spectrum. In conjunction with the agreement to sell, the Company has taken an impairment charge for wireless spectrum and fixed assets, and has incurred restructuring charges.
Note 2. Significant Accounting Policies and Other Information
Basis of Presentation
The accompanying consolidated financial statements have been prepared in accordance with Generally Accepted Accounting Principles in the United States (“GAAP”).
Use of Estimates
The preparation of consolidated financial statements in conformity with GAAP requires management to make estimates and assumptions that affect the reported amounts of assets and liabilities and disclosure of contingent assets and liabilities at the date of the financial statements and the reported amounts of revenues and expenses during the reporting periods. Actual results may differ from those estimates.
Principles of Consolidation
The consolidated financial statements include the accounts of the Company and all of its wholly-owned subsidiaries and those limited liability corporations where the Company or certain of its subsidiaries, as managing member, exercises control. All significant intercompany accounts and transactions have been eliminated.
Reclassifications
Certain amounts in prior periods have been reclassified to conform to the current period presentation. Effective September 30, 2014, the Company changed the classification of certain costs related to equipment incentives to retain existing customers from customer operations to cost of sales and services to better align our presentation with other wireless carriers. The reclassification resulted in an increase of $32.7 million and $28.4 million in cost of sales and services and a corresponding decrease in customer operations expenses for the years ended December 31, 2013 and 2012, respectively. Additionally, certain information technology costs attributable to supporting billing and internal network and communication services were changed from cost of sales and services to customer operations and corporate operations also to align our presentation with other wireless carriers. The reclassification resulted in a decrease of $12.8 million and $11.4 million in cost of sales and services for the years ended December 31, 2013 and 2012, respectively, and an increase in customer operations expenses of $2.3 million and $2.1 million and an increase in corporate operations expenses of $10.5 million and $9.3 million for the years ended December 31, 2013 and 2012, respectively. Previously reported net income has not been affected by these reclassifications.
49
Revenue Recognition
The Company recognizes revenue when services are rendered or when products are delivered and functional, as applicable. Certain services of the Company require payment in advance of service performance. In such cases, the Company records a service liability at the time of billing and subsequently recognizes revenue ratably over the service period. The Company bills customers certain transactional taxes on service revenues. These transactional taxes are not included in reported revenues as they are recognized as liabilities at the time customers are billed.
The Company earns retail and wholesale revenues by providing access to and usage of its networks. Retail and certain wholesale revenues are recognized as services are provided. In long term contracts certain fixed elements are required to be recognized on a straight-line basis over the term of the agreement. Revenues for equipment sales are recognized at the point of sale. Wireless handsets and other devices sold with service contracts are generally sold at prices below cost, based on the terms of the service contracts. The Company recognizes the entire cost of the handsets at the time of sale.
On August 15, 2014, the Company launched its Equipment Installment Plan ("EIP"), which offers customers the option to pay for their devices over 24 months with no service contract. Additionally, after a specified period of time, customers have the right to trade in the original device for a new device and have the remaining unpaid balance satisfied. For customers that elect the EIP option, the Company recognizes revenue at the point of sale for the full retail price of the device, net of the estimated fair value of imputed interest and the estimated loss on trade-in. See Note 5 for additional information regarding EIP.
The Company evaluates related transactions to determine whether they should be viewed as multiple deliverable arrangements, which impact revenue recognition. Multiple deliverable arrangements are presumed to be bundled transactions and the total consideration is measured and allocated to the separate units based on their relative selling price with certain limitations. The Company has determined that sales of handsets with service contracts related to these sales generated from Company-operated retail stores are multiple deliverable arrangements. Accordingly, substantially all of the nonrefundable activation fee revenues (as well as the associated direct costs) are allocated to the wireless handset and are recognized at the time of the sale, based on the fact that the handsets are generally sold well below cost and thus appropriately allocated to the point of sale based on the relative selling price evaluation. However, revenue and certain associated direct costs for activations sold at third-party retail locations are deferred and amortized over the estimated life of the customer relationship as the Company is not a principal in the transaction to sell the handset and therefore any activation fees charged are fully attributable to the service revenues.
The Company recognizes revenue in the period that persuasive evidence of an arrangement exists, delivery of the product has occurred or services have been rendered, it is able to determine the amount and when the collection of such amount is considered probable.
Allowance for Doubtful Accounts
The Company sells its PCS services to individuals and commercial end-users and to other communication carriers. The Company has credit and collection policies to maximize collection of trade receivables and requires deposits on certain sales. The Company maintains an allowance for doubtful accounts based on historical results, current and expected trends and changes in credit policies. Management believes the allowance adequately covers all anticipated losses with respect to trade receivables. Actual credit losses could differ from such estimates. The Company includes bad debt expense in customer operations expense in the consolidated statements of operations.
Changes in the allowance for doubtful accounts for the years ended December 31, 2014, 2013 and 2012 are summarized in the table below:
Year Ended December 31, | |||||||||||
(In thousands) | 2014 | 2013 | 2012 | ||||||||
Balance at beginning of year | $ | 6,541 | $ | 4,811 | $ | 15,666 | |||||
Charged to operating expenses (1) | 15,172 | 15,511 | 9,453 | ||||||||
Deductions (2) | (13,040 | ) | (13,781 | ) | (20,308 | ) | |||||
Balance at end of year | $ | 8,673 | $ | 6,541 | $ | 4,811 | |||||
(1) | Reflects provision for doubtful accounts, recorded in customer operations expense. |
(2) | Reflects uncollectible accounts written off against the allowance, net of recoveries and credits issued to customers. |
50
Accrued Expenses and Other Current Liabilities
Year Ended December 31, | |||||||
(In thousands) | 2014 | 2013 | |||||
Accrued interest | $ | 85 | $ | 4,584 | |||
Accrued payroll | 6,545 | 5,842 | |||||
Accrued taxes | 5,383 | 4,949 | |||||
Other | 15,140 | 10,969 | |||||
Total | $ | 27,153 | $ | 26,344 | |||
Inventories and Supplies
The Company’s inventories and supplies consist primarily of items held for resale such as devices and accessories. The Company values its inventory at the lower of cost or market. Inventory cost is computed on a currently adjusted standard cost basis (which approximates actual cost on a first-in, first-out basis). Market value is determined by reviewing current replacement cost, marketability and obsolescence.
Long-Lived Asset Recovery
Long-lived assets comprise property, plant and equipment, intangible assets (including goodwill, radio spectrum licenses, customer relationships and trademarks) and long-term deferred charges. Long-lived assets, excluding goodwill and intangible assets with indefinite useful lives, are recorded at cost and reviewed for impairment whenever events or changes in circumstances indicate that the carrying amount should be evaluated pursuant to the subsequent measurement guidance described in Financial Accounting Standards Board (“FASB”) Accounting Standards Codification ("ASC") 360, Property, Plant and Equipment. Impairment is determined by comparing the carrying value of these long-lived assets to management’s best estimate of future undiscounted cash flows expected to result from the use of the assets. If the carrying value exceeds the estimated undiscounted cash flows, the excess of the asset’s carrying value over the estimated fair value is recorded as an impairment charge.
Depreciation of property, plant and equipment is calculated on a straight-line basis over the estimated useful lives of the assets, which the Company reviews and updates based on historical experiences and future expectations. Buildings are depreciated over a 50-year life and leasehold improvements, which are categorized in land and buildings, are depreciated over the shorter of the estimated useful lives or the remaining lease terms. Network plant and equipment, which includes cell towers and site costs, and switch, cell site and other network equipment, are depreciated over various lives ranging from 5 to 17 years, with a weighted average life of approximately 10 years. Furniture, fixtures and other equipment are depreciated over various lives ranging from 2 to 18 years.
The Company formally evaluates the appropriateness of estimated useful lives on at least an annual basis. Consideration is given to the trends in technological evolution and the telecommunications industry, the Company’s maintenance practices and the functional condition of long-lived assets in relation to the remaining estimated useful life of the asset. When necessary, adjustments are made to the applicable useful life of an asset class or depreciation is accelerated for assets that have been identified for retirement prior to the expiration of the original useful life.
Goodwill and Indefinite-Lived Intangibles
Goodwill and radio spectrum licenses are considered indefinite-lived intangible assets. Indefinite-lived intangible assets are not subject to amortization but are instead tested for impairment annually, on October 1, or more frequently if an event indicates that the asset might be impaired.
Before employing detailed impairment testing, the Company first evaluates the likelihood of impairment by considering relevant qualitative factors that may have a significant bearing on fair value. If we determine that it is more likely than not that goodwill is impaired, we apply detailed testing methodologies. Otherwise, we conclude that no impairment exists. For detailed testing, the Company uses a two-step process to test for goodwill impairment. Step one requires a determination of the fair value of each of the reporting units and, to the extent that this fair value of the reporting unit exceeds its carrying value (including goodwill), the step two calculation of implied fair value of goodwill is not required and no impairment loss is recognized. In testing for goodwill impairment, the Company utilizes an analysis which allocates enterprise value to the reporting units.
51
The radio spectrum licenses relate primarily to PCS licenses in the markets that we serve. The Company considers a number of valuation methods, including market based and the Greenfield cash flow method, in its impairment testing for these assets.
Income Taxes
Deferred income taxes are provided on an asset and liability method whereby deferred tax assets are recognized for deductible temporary differences and deferred tax liabilities are recognized for taxable temporary differences. Temporary differences are the differences between the reported amounts of assets and liabilities and their tax bases. Deferred tax assets and liabilities are adjusted for the effects of changes in tax laws and rates on the date of enactment. The Company accrues interest and penalties related to unrecognized tax benefits in interest expense and income tax expense, respectively.
Recent Accounting Pronouncements
In April 2014, the FASB issued Accounting Standards Update (“ASU”) 2014-08, Reporting of Discontinued Operations and Disclosures of Disposals of Components of an Entity, which changes the criteria for determining which disposals can be presented as discontinued operations and modifies related disclosure requirements. The updated guidance defines discontinued operations as a disposal of a component or group of components that is disposed of or is classified as held for sale and represents a strategic shift that has, or will have, a major effect on an entity’s operations and financial results. Additionally, the disclosure requirements for discontinued operations were expanded and new disclosures for individually significant dispositions that do not qualify as discontinued operations are required. The guidance is effective prospectively for fiscal years and interim reporting periods within those years beginning after December 15, 2014, with early adoption permitted for transactions that have not been reported in financial statements previously issued or available for issuance. The standard will be effective for the Company's fiscal year beginning January 1, 2015 and will be applied to relevant future transactions.
In May 2014, FASB issued ASU 2014-09, Revenue from Contracts with Customers (Topic 606). This ASU provides a framework that replaces the existing revenue recognition guidance and is intended to improve the financial reporting requirements. The guidance is effective for public business entities for fiscal years beginning after December 15, 2016, and interim periods within those years, with early adoption being prohibited. The impact of application of this ASU on the Company's financial statements has not been determined.
Note 3. Supplemental Financial Information
Cash
The Company’s cash was held in market rate savings accounts and non-interest bearing deposit accounts. The total held in the market rate savings accounts at December 31, 2014 and 2013 was $28.5 million and $36.5 million, respectively. The remaining $45.0 million and $51.9 million of cash at December 31, 2014 and 2013, respectively, was held in non-interest bearing deposit accounts.
Restricted Cash
The Company is eligible to receive up to $5.0 million in connection with its winning bid in the Connect America Fund's Mobility Fund Phase I Auction ("Auction 901"). Pursuant to the terms of Auction 901, the Company was required to obtain a Letter of Credit (“LOC”) for the benefit of the Universal Service Administrative Company (“USAC”) to cover each disbursement plus the amount of the performance default penalty (10% of the total eligible award). USAC may draw upon the LOC in the event the Company fails to demonstrate the required wireless service coverage by the applicable deadline in 2016. The Company obtained the first LOC in the amount of $2.2 million, representing the first disbursement of $1.7 million received in September 2013, plus the performance default penalty of $0.5 million. In accordance with the terms of the LOC, the Company deposited $2.2 million into a separate account at the issuing bank to serve as cash collateral. Such funds will be released when the LOC is terminated without being drawn upon by USAC.
Accounting for Asset Retirement Obligations
An asset retirement obligation is evaluated and recorded as appropriate on assets for which the Company has a legal obligation to retire. The Company records a liability for an asset retirement obligation and the associated asset retirement cost at the time the underlying asset is acquired. Subsequent to the initial measurement of the asset retirement obligation, the obligation is adjusted at the end of each period to reflect the passage of time and changes in the estimated future cash flows underlying the obligation, if any.
The Company enters into long-term leasing arrangements primarily for tower sites and retail store locations. The Company constructs assets at these locations and, in accordance with the terms of many of these agreements, the Company is obligated to restore the premises to their original condition at the conclusion of the agreements, generally at the demand of the other party to
52
these agreements. The Company recognizes the fair value of a liability for an asset retirement obligation and capitalizes that cost as part of the cost basis of the related asset, depreciating it over the useful life of the related asset.
The following table indicates the changes to the Company’s asset retirement obligation liability, which is included in other long-term liabilities, for the years ended December 31, 2014 and 2013:
(In thousands) | 2014 | 2013 | |||||
Asset retirement obligations, beginning | $ | 22,628 | $ | 16,767 | |||
Net increases due to changes in, and timing of estimated future cash flows | 3,644 | 5,181 | |||||
Accretion of asset retirement obligations | 1,288 | 680 | |||||
Asset retirement obligations, ending | $ | 27,560 | $ | 22,628 | |||
The Company revised cost estimates used to determine the fair value of its asset retirement obligations resulting in an increase in the liability and related assets of $3.5 million and $5.0 million at December 31, 2014 and 2013, respectively.
Sale of Intangible Assets
During the twelve months ended December 31, 2013, the Company completed the sale of certain intangible assets for approximately $4.6 million. This amount, less fees and expenses of sale, is recorded as a gain of $4.4 million during for the twelve months ended December 31, 2013.
Advertising Costs
The Company expenses advertising costs and marketing production costs as incurred (included within customer operations expense in the consolidated statements of operations). Advertising costs for the years ended December 31, 2014, 2013 and 2012 were $19.4 million, $19.2 million and $17.7 million, respectively.
Note 4. Supplemental Cash Flow Information
The following information is presented as supplementary disclosures for the consolidated statements of cash flows for the years ended December 31, 2014, 2013 and 2012:
Year Ended December 31, | |||||||||||
(In thousands) | 2014 | 2013 | 2012 | ||||||||
Cash payments for: | |||||||||||
Interest (net of amounts capitalized) | $ | 34,891 | $ | 22,693 | $ | 19,870 | |||||
Income taxes | 3,601 | 4,087 | 1,761 | ||||||||
Cash received from income tax refunds | 1,434 | 3,704 | 56 | ||||||||
Supplemental investing and financing activities: | |||||||||||
Additions to property, plant and equipment included in accounts payable and other accrued liabilities | 8,509 | 8,272 | 6,127 | ||||||||
Borrowings under capital leases | 562 | 380 | 638 | ||||||||
Dividends declared not paid | — | 9,221 | — | ||||||||
The amount of interest capitalized was $0.3 million, $0.1 million and $0.1 million for the years ended December 31, 2014, 2013 and 2012, respectively.
Note 5. Equipment Installment Plan Receivables
Certain subscribers have the option to pay for their devices in installments over a 24-month period. The carrying value of installment receivables approximates fair value, net of the deferred interest and estimated losses at time of trade-in. At the time of sale, we impute the interest on the installment receivable and record it as a reduction to equipment revenue and as a reduction to the face amount of the related receivable. Interest income is recognized over the term of the installment contract as operating revenue. Short-term installment receivables are recorded in "Accounts receivable, net" and long-term installment receivables are recorded in "Deferred Charges and Other assets" in the consolidated balance sheets.
53
The following table summarizes the EIP receivables for the year ended December 31, 2014:
(In thousands) | December 31, 2014 | ||
EIP receivables, gross | $ | 16,109 | |
Deferred interest | (807 | ) | |
EIP receivables, net of deferred interest | 15,302 | ||
Allowance for trade-in losses | (2,450 | ) | |
EIP receivables, net | $ | 12,852 | |
Classified on the consolidated balance sheet as: | |||
Accounts receivable, net | $ | 5,551 | |
Deferred Charges and Other assets | 8,108 | ||
Advanced billings and customer deposits | (807 | ) | |
EIP receivables, net | $ | 12,852 | |
Note 6. Property, Plant and Equipment
The components of property, plant and equipment, and the related accumulated depreciation, were as follows:
(In thousands) | December 31, 2014 | December 31, 2013 | |||||
Land and buildings | $ | 30,772 | $ | 34,223 | |||
Network plant and equipment | 445,940 | 471,032 | |||||
Furniture, fixtures and other equipment | 91,512 | 103,181 | |||||
568,224 | 608,436 | ||||||
Under construction | 18,213 | 6,430 | |||||
586,437 | 614,866 | ||||||
Less: accumulated depreciation | 296,490 | 295,490 | |||||
Property, plant and equipment, net | $ | 289,947 | $ | 319,376 | |||
During the quarter ended March 31, 2014, the Company revised the estimated useful lives of certain assets in order to better match our depreciation expense with the periods these assets are expected to generate revenue based on planned and historical service periods. The new estimated useful lives were established based on historical service periods and external benchmark data of these assets. The increase in depreciation expense resulting from this change for the three and twelve months ended December 31, 2014 was approximately $0.3 million and $1.3 million, respectively.
During the fourth quarter of fiscal year 2014, as a result of the agreement to sell the wireless spectrum and wind down of its operations in the Eastern Markets, the Company concluded that a triggering event had occurred and assessed the recoverability of its long-lived assets. The Company first assessed the ability to redeploy Eastern Markets property, plant and equipment. For the property, plant and equipment that was deemed not to be redeployable, the Company used market quotes and recorded an impairment charge of $57.0 million during the fourth quarter of 2014. In addition, the Company wrote off abandoned construction in progress and certain other assets of $1.9 million which is included in Impairment and other charges in the Consolidated Statement of Operations.
During the fourth quarter, in conjunction with the plan to sell, and subsequently lease back, most of the Company owned towers in 2015, the Company concluded that a triggering event had occurred and assessed the recoverability of these towers. Since the market value exceeded the carrying value, no impairment charge was incurred. The carrying value of these towers, approximately $6.4 million, was reclassified to Assets Held for Sale in the Company’s Consolidated Balance Sheets. For additional information, see Note 17 of the Notes to Consolidated Financial Statements.
54
Note 7. Intangible Assets
Intangible Assets not Subject to Amortization
Goodwill and radio spectrum licenses are not considered amortizable intangible assets. The Company allocates all its goodwill to the markets in western Virginia and West Virginia. The Company tested its goodwill as of October 1, 2014 and on December 31, 2014 and concluded no impairment exists as of those dates.
In conjunction with the agreement to sell the Company's wireless spectrum licenses in the Eastern Markets (see Note 6), the Company calculated the fair value to be $57.9 million, the sales price plus the implied value of the non-cash spectrum leaseback. Accordingly, an impairment charge of $29.0 million was recorded during the fourth quarter of 2014. In addition, the Company transferred these intangible assets to assets held for sale in the Company’s Balance Sheet.
At December 31, 2014 and 2013, goodwill and radio spectrum licenses were comprised of the following:
December 31, 2014 | December 31, 2013 | |||||||||||||||
(In thousands) | Goodwill | Radio Spectrum Licenses | Goodwill | Radio Spectrum Licenses | ||||||||||||
Balance at beginning of the period | $ | 63,700 | $ | 131,834 | $ | 63,700 | $ | 132,033 | ||||||||
Impairment loss in the period | — | (28,990 | ) | — | — | |||||||||||
Transferred to assets held for sale | — | (57,911 | ) | — | — | |||||||||||
Disposals | — | — | — | (199 | ) | |||||||||||
Total | $ | 63,700 | $ | 44,933 | $ | 63,700 | $ | 131,834 | ||||||||
Intangible Assets Subject to Amortization
Customer relationships and trademarks are considered amortizable intangible assets. At December 31, 2014 and 2013, customer relationships and trademarks were comprised of the following:
December 31, 2014 | December 31, 2013 | ||||||||||||||||||||||||
(In thousands) | Estimated Useful Life | Gross Amount | Accumulated Amortization | Net | Gross Amount | Accumulated Amortization | Net | ||||||||||||||||||
Customer relationship | 17.5 years | $ | 36,900 | $ | (34,305 | ) | $ | 2,595 | $ | 36,900 | $ | (32,871 | ) | $ | 4,029 | ||||||||||
Trademarks | 15 years | 7,000 | (4,511 | ) | 2,489 | 7,000 | (4,044 | ) | 2,956 | ||||||||||||||||
Total | $ | 43,900 | $ | (38,816 | ) | $ | 5,084 | $ | 43,900 | $ | (36,915 | ) | $ | 6,985 | |||||||||||
The Company amortizes its amortizable intangible assets using the straight-line method unless it determines that another systematic method is more appropriate.
The estimated life of amortizable intangible assets is determined from the unique factors specific to each asset and the Company reviews and updates estimated lives based on later events and future expectations. Amortization expense was $1.9 million, $3.0 million, $3.3 million for the years ended December 31, 2014, 2013, and 2012, respectively.
Amortization expense for the next five years is expected to be as follows:
(In thousands) | Customer Relationships | Trademarks | Total | ||||||||
2015 | $ | 324 | $ | 467 | $ | 791 | |||||
2016 | 324 | 467 | 791 | ||||||||
2017 | 324 | 467 | 791 | ||||||||
2018 | 324 | 467 | 791 | ||||||||
2019 | 324 | 467 | 791 | ||||||||
Thereafter | 975 | 154 | 1,129 | ||||||||
$ | 2,595 | $ | 2,489 | $ | 5,084 | ||||||
55
Note 8. Long-Term Debt
As of December 31, 2014 and December 31, 2013, the Company’s outstanding long-term debt consisted of the following:
(In thousands) | December 31, 2014 | December 31, 2013 | |||||
Senior secured term loans, net of unamortized debt discount | $ | 524,504 | $ | 489,441 | |||
Capital lease obligations | 904 | 925 | |||||
525,408 | 490,366 | ||||||
Less: current portion of long-term debt | 5,816 | 5,410 | |||||
Long-term debt | $ | 519,592 | $ | 484,956 | |||
Long-Term Debt, Excluding Capital Lease Obligations
On November 9, 2012, NTELOS Inc. entered into an Amended and Restated Credit Agreement (the “Amended and Restated Credit Agreement”), which amended and restated, in its entirety, that certain Credit Agreement dated August 7, 2009 (the “Original Credit Agreement”). The Amended and Restated Credit Agreement provided for (1) a term loan A in the aggregate amount of $150.0 million (the “Term Loan A”); and (2) a term loan B in the aggregate amount of $350.0 million (the “Term Loan B” and, together with the Term Loan A, the “Term Loans”).
On January 31, 2014, the Company completed the refinancing of Term Loan A, which converted the outstanding principal balance of $148.1 million of Term Loan A into Term Loan B, and borrowed an additional $40.0 million under Term Loan B. The additional Term Loan B borrowings bear the same interest rate, maturity and other terms as the Company’s existing Term Loan B borrowings.
The Amended and Restated Credit Agreement provides for a new Term Loan B in the aggregate amount of $533.8 million.The Term Loan B matures in November 2019, with quarterly payments of approximately $1.4 million beginning March 31, 2014 and continuing through September 30, 2019, and the remainder due on November 9, 2019.
The Amended and Restated Credit Agreement also permits incremental commitments of up to $125.0 million (the “Incremental Commitments”) of which up to $35.0 million can be in the form of a revolving credit facility. The ability to incur the Incremental Commitments is subject to various restrictions and conditions, including having a Leverage Ratio (as defined in the Amended and Restated Credit Agreement) not in excess of 4.50:1.00 at the time of incurrence (calculated on a pro forma basis). As of December 31, 2014, there were no commitments associated with the Incremental Commitments.
The Amended and Restated Credit Agreement provided that the Term Loan A be issued at a 1.0% discount ($1.5 million) and bear interest at a rate equal to either 3.5% above the Eurodollar Rate (as defined in the Amended and Restated Credit Agreement) or 2.5% above the Base Rate (as defined in the Amended and Restated Credit Agreement), and the Term Loan B be issued at a 1.0% discount ($3.5 million) and bear interest at a rate equal to either 4.75% above the Eurodollar Rate or 3.75% above the Base Rate. The refinancing provided that the refinanced amount plus the additional borrowing of $40 million be issued at a 0.25% discount ($0.5 million) and bear interest at a rate equal to either 4.75% above the Eurodollar Rate or 3.75% above the Base Rate. The Amended and Restated Credit Agreement provides that the Eurodollar Rate shall never be less than 1.0% per annum and the Base Rate shall never be less than 2.0% per annum.
All loans outstanding under the Amended and Restated Credit Agreement are secured by a first priority pledge of substantially all property and assets of Ntelos Inc. and all material subsidiaries, as guarantors. The Amended and Restated Credit Agreement contains customary affirmative and negative covenants which, among other things, restrict the ability of NTELOS Inc. and its guarantors to incur additional debt, grant liens, make investments, sell assets and make Restricted Payments (as defined in the Amended and Restated Credit Agreement, which include paying dividends).
The Amended and Restated Credit Agreement has a Restricted Payments basket, initially set at $50.0 million, which can be used to make Restricted Payments, including the ability to pay dividends, repurchase stock or advance funds to the Company. This Restricted Payment basket increases by $6.5 million per quarter and decreases by actual Restricted Payments made after the date of the Amended and Restated Credit Agreement and by certain investments and debt prepayments made after the date of the Amended and Restated Credit Agreement.
In addition, the Restricted Payment basket increases by the positive amount, if any, of 50% (or, if the Leverage Ratio as of the most recently ended twelve month period, was less than 2.75:1.0, 75%) of the Excess Cash Flow (as defined in the Amended and Restated Credit Agreement), for the most recently ended fiscal quarter in excess of $10.0 million. NTELOS Inc. may not make Restricted Payments if its Leverage Ratio (calculated on a pro forma basis) is greater than to 4.25:1.00. In addition, this Restricted Payments basket increases by the amount of any mandatory prepayments on the Term Loans to the extent the lenders
56
decline to receive such prepayment. There was no Excess Cash Flow for the quarter ended December 31, 2014. The balance of the Restricted Payments basket as of December 31, 2014 was $60.1 million.
Under the Amended and Restated Credit Agreement, mandatory debt prepayments of 50% of Excess Cash Flow for the most recently ended fiscal year (beginning with the fiscal year ending December 31, 2013) must be made by the 90th day of the following year, if the Leverage Ratio is above 4.50:1.00. Mandatory debt prepayments of 25% of Excess Cash Flow for a fiscal year must be made by the 90th day of the following year, if the Leverage Ratio is equal to or less than 4.50:1.00 but above 3.75:1.00. If NTELOS Inc.’s Leverage Ratio is equal to or less than 3.75:1.00 for a fiscal year, NTELOS Inc. is not required to make an Excess Cash Flow mandatory debt prepayment for that fiscal year. At December 31, 2014, NTELOS Inc.’s Leverage Ratio (as defined under the Amended and Restated Credit Agreement) was 4.31:1.00.
In connection with the refinancing, the Company incurred approximately $3.8 million in creditor and third party fees, of which $3.7 million was deferred and is being amortized to interest expense over the life of the debt using the effective interest method. The Company also deferred $0.5 million in debt discounts related to the new Term Loan B borrowings, which are being accreted to the Term Loan B using the effective interest method over the life of the debt and are reflected in interest expense. Additionally, the Company wrote off a proportionate amount of the unamortized deferred fees and debt discount from the Amended and Restated Credit Agreement totaling $0.5 million and $0.2 million, respectively, which are reflected in other expenses in the consolidated statements of operations. Accretion of these discounts for each of the years ended December 31, 2014 and 2013 was $0.7 million and $0.9 million, respectively.
The aggregate maturities of long-term debt outstanding at December 31, 2014, excluding capital lease obligations, based on the contractual terms of the instruments are as follows:
(In thousands) | Term Loan | |||
2015 | $ | 5,405 | ||
2016 | 5,405 | |||
2017 | 5,405 | |||
2018 | 5,405 | |||
2019 | 506,725 | |||
Total | $ | 528,345 | ||
The Company’s blended average interest rate on its long-term debt was approximately 6.3% and 6.1% for the years ended December 31, 2014 and 2013, respectively.
Capital Lease Obligations
In addition to the long-term debt discussed above, the Company has entered into capital leases on vehicles with original lease terms of four to five years. At December 31, 2014, the carrying value and accumulated depreciation of these assets was $2.6 million and $1.4 million, respectively. The total net present value of the Company’s future minimum lease payments is $0.9 million. As of December 31, 2014, the principal portion of these capital lease obligations is due as follows: $0.4 million in 2015, $0.3 million in 2016, $0.1 million in 2017 and 2018 and less than $0.1 million in 2019.
57
Note 9. Restructuring Charges
In December 2014, the Company announced its intention to sell its wireless spectrum and wind down its operations in the Eastern Markets, and to reduce related corporate operating expenses during fiscal year 2015. In conjunction, as of December 31, 2014 , restructuring liabilities have been established for employee separations, lease abandonments, operating lease terminations, and other related costs, which are recorded in current liabilities in the Consolidated Balance Sheet. A summary of the restructuring liabilities is presented below:
(In thousands) | Employee Separation | Contract Terminations | Other | Total | |||||||||||||||
Expected period of Recognition | 2014-2015 | 2014-2015 | 2014-2015 | ||||||||||||||||
Projected Range at Completion | $2,000 - $4,000 | $40,000 - $45,000 | $8,000 - $11,000 | $50,000 - $60,000 | |||||||||||||||
Balance as of December 31, 2013 | $ | — | $ | — | $ | — | $ | — | |||||||||||
Charges | 1,580 | 990 | 1,093 | 3,663 | |||||||||||||||
Utilization | (84 | ) | (111 | ) | (68 | ) | (263 | ) | |||||||||||
Balances as of December 31, 2014 | $ | 1,496 | $ | 879 | $ | 1,025 | $ | 3,400 | |||||||||||
Employee separation costs for certain Eastern Market and corporate employees of $1.6 million consist of severance to be paid in accordance with the Company’s written severance plan and certain management contracts. Severance payments are expected to be paid through 2015. Contract termination costs of $1.0 million include lease abandonment costs for retail stores in our Eastern Markets and other termination costs for contractual obligations for network services. Lease abandonment costs represent future minimum lease obligations, net of estimated sublease income. Contract termination costs are expected to be paid through 2019 absent any settlements with vendors. Other costs of $1.1 million include legal and advisory fees. These amounts are expected to be paid during 2015.
Note 10. Financial Instruments
The Company is exposed to market risks with respect to certain of the financial instruments that it holds. Cash, accounts receivable, accounts payable and accrued liabilities are reflected in the consolidated financial statements at cost, which approximates fair value because of the short-term nature of these instruments. The fair values of other financial instruments are determined using observable market prices or using a valuation model, which is based on a conventional discounted cash flow methodology and utilizes assumptions of current market conditions. The following is a summary by balance sheet category:
Long-Term Investments
At December 31, 2014 and 2013, the Company had an investment in CoBank, ACB (“CoBank”) of $1.5 million. This investment is primarily related to a required investment under the Original Credit Agreement and declared and unpaid patronage distributions of restricted equity related to the portion of the term loans previously held by CoBank. This investment is carried under the cost method as it is not practicable to estimate fair value. This investment is subject to redemption in accordance with CoBank’s capital recovery plans.
Interest Rate Derivatives
In February 2013, the Company purchased an interest rate cap for $0.9 million with a notional amount of $350.0 million, which caps the three month Eurodollar rate at 1.0% and expires in August 2015. The Company did not designate the interest rate cap agreement as a cash flow hedge for accounting purposes. Therefore, the change in market value of the agreement is recorded as a gain or loss in Other Expense. The Company recorded losses of $0.2 million and $0.7 million for the years ended December 31, 2014 and 2013, respectively and an immaterial loss on the previous interest rate cap for the year ended December 31, 2012.
58
The following table indicates the difference between face amount, carrying amount and fair value of the Company’s financial instruments at December 31, 2014 and 2013.
Face | Carrying | Fair | |||||||||
(In thousands) | Amount | Amount | Value | ||||||||
December 31, 2014 | |||||||||||
Nonderivatives: | |||||||||||
Financial assets: | |||||||||||
Cash | $ | 73,546 | $ | 73,546 | $ | 73,546 | |||||
Restricted cash | 2,167 | 2,167 | 2,167 | ||||||||
Long-term investments for which it is not practicable to estimate fair value | N/A | 1,522 | N/A | ||||||||
Financial liabilities: | |||||||||||
Term Loans | 528,345 | 525,504 | 459,660 | ||||||||
Capital lease obligations | 904 | 904 | 904 | ||||||||
Derivative related to debt: | |||||||||||
Interest rate cap asset | 350,000 | * | — | — | |||||||
December 31, 2013 | |||||||||||
Nonderivatives: | |||||||||||
Financial assets: | |||||||||||
Cash | $ | 88,441 | $ | 88,441 | $ | 88,441 | |||||
Restricted cash | 2,167 | 2,167 | 2,167 | ||||||||
Long-term investments for which it is not practicable to estimate fair value | N/A | 1,499 | N/A | ||||||||
Financial liabilities: | |||||||||||
Term loans | 493,750 | 489,441 | 495,848 | ||||||||
Capital lease obligations | 925 | 925 | 925 | ||||||||
Derivative related to debt: | |||||||||||
Interest rate cap asset | 350,000 | 229 | 229 | ||||||||
* | Notional amount |
The fair values of the Term Loans under the Amended and Restated Credit Agreement were derived based on bid prices at December 31, 2014 and December 31, 2013, respectively. The fair value of the derivative instrument was based on a quoted market price at December 31, 2014 and December 31, 2013, respectively. These instruments are classified within Level 2 of the fair value hierarchy described in ASC 820, Fair Value Measurements and Disclosures.
Note 11. Equity and Earnings Per Share
On August 24, 2009, the Board of Directors authorized management to repurchase up to $40.0 million of the Company’s common stock. The Company may conduct its purchases in the open market, in privately negotiated transactions, through derivative transactions or through purchases made in accordance with Rule 10b5-1 under the Securities Exchange Act of 1934, as amended (the “Exchange Act”). The share repurchase program does not require the Company to acquire any specific number of shares and may be terminated at any time. Through December 31, 2009, the Company had repurchased 523,233 shares for $16.9 million. The Company did not repurchase any of its common shares during fiscal years 2012 through 2014 under the authorization. Additionally, during the fiscal years 2014 and 2013, the Company repurchased $0.1 million of restricted common stock in order to satisfy certain minimum tax withholding obligations in connection with the vesting of restricted stock.
59
The computations of basic and diluted earnings per share for the years ended December 31, 2014, 2013 and 2012 are as follows:
(In thousands) | 2014 | 2013 | 2012 | ||||||||
Numerator: | |||||||||||
Net income (loss) applicable to common shares for earnings per share computation | $ | (53,634 | ) | $ | 24,678 | $ | 18,387 | ||||
Denominator: | |||||||||||
Total shares outstanding | 21,616 | 21,510 | 21,261 | ||||||||
Less: unvested shares | (463 | ) | (443 | ) | (332 | ) | |||||
Less: effect of calculating weighted average shares | (42 | ) | (41 | ) | (40 | ) | |||||
Denominator for basic earnings per common share – weighted average shares outstanding | 21,111 | 21,026 | 20,889 | ||||||||
Plus: weighted average unvested shares | — | 422 | 322 | ||||||||
Plus: common stock equivalents of stock options | — | 285 | 126 | ||||||||
Plus: performance stock units | — | 93 | — | ||||||||
Denominator for diluted earnings per common share – weighted average shares outstanding | 21,111 | 21,826 | 21,337 | ||||||||
In accordance with ASC 260, Earnings Per Share, unvested share-based payment awards that contain rights to receive non-forfeitable dividends or dividend equivalents, whether paid or unpaid, are considered a “participating security” for purposes of computing earnings or loss per common share pursuant to the two-class method. The Company's unvested restricted stock awards have rights to receive non-forfeitable dividends. For the years ended December 31, 2014 and 2013, the Company has calculated basic earnings per share using weighted average shares outstanding and the two-class method and determined there was no significant difference in the per share amounts calculated under the two methods.
For the years ended December 31, 2014, 2013 and 2012, the denominator for diluted earnings per common share excludes approximately 1.6 million shares, 1.8 million shares and 1.8 million shares, respectively, related to stock options that were antidilutive for the respective periods presented. In addition, the performance-based portion of the performance stock units ("PSUs") is excluded from diluted earnings per share until the performance criteria are satisfied.
Note 12. Stock Plans
The Company has employee equity incentive plans (referred to as the “Employee Equity Incentive Plans”) administered by the Compensation Committee of the Company’s board of directors, which permits the grant of long-term incentives to employees, including stock options, stock appreciation rights, restricted stock awards, restricted stock units, performance stock units, incentive awards, other stock-based awards and dividend equivalents. The maximum number of shares of common stock available for awards under the Employee Equity Incentive Plans is 4,025,000. The Company also has a non-employee director equity plan (the “Non-Employee Director Equity Plan”). The total number of shares of common stock originally available for grant under the Non-Employee Director Equity Plan is 200,000. The Non-Employee Director Equity Plan together with the Employee Equity Incentive Plans are referred to as the “Equity Incentive Plans.” Awards under these plans are issuable to employees or non-employee directors as applicable.
During the year ended December 31, 2014, the Company issued 347,023 stock options under the Employee Equity Incentive Plans and 27,170 stock options under the Non-Employee Director Equity Plan. During the year ended December 31, 2013, the Company issued 751,089 stock options under the Employee Equity Incentive Plans and 43,000 stock options under the Non-Employee Director Equity Plan. The options issued under the Employee Equity Incentive Plans generally vest one-fourth annually beginning one year after the grant date and the options issued under the Non-Employee Director Equity Plan cliff vest on the first anniversary of the grant date.
During the year ended December 31, 2014, the Company issued 132,401 shares of restricted stock under the Employee Equity Incentive Plans and 11,338 shares of restricted stock under the Non-Employee Director Equity Plan. During the year ended December 31, 2013, the Company issued 153,372 shares of restricted stock under the Employee Equity Incentive Plans and 14,455 shares of restricted stock under the Non-Employee Director Equity Plan. The restricted shares granted under the Employee Equity Incentive Plans generally cliff vest on the first or third anniversary of the grant date. The restricted shares
60
granted under the Non-Employee Director Equity Plan cliff vest on the first anniversary of the grant date. Dividend and voting rights applicable to restricted stock are equivalent to the Company’s common stock.
During the year ended December 31, 2014, the Company granted 83,151 performance stock units ("PSUs") under the Employee Equity Incentive Plans to certain key employees. During the year ended December 31, 2013, the Company granted 110,327 performance stock units ("PSUs") under the Employee Equity Incentive Plans to certain key employees. The PSUs cliff vest on the third anniversary of the grant date and are subject to certain performance and market conditions. Each PSU represents the contingent right to receive one share (or more based on maximum achievement) of the Company’s common stock if vesting is satisfied. The PSUs have no voting rights. Dividends, if any, that would have been paid on the underlying shares will be paid as dividend equivalent units on PSUs that vest, on or after the vesting date.
Stock options must be granted under the Equity Incentive Plans at not less than 100% of fair value on the date of grant and have a maximum life of ten years from the date of grant. Stock options and other awards under the Equity Incentive Plans may be exercised in compliance with such requirements as determined by the Compensation Committee.
Effective in 2010, upon the exercise of stock options or upon the grant of restricted stock under the Equity Incentive Plans, shares have been and are expected to continue to be issued from the treasury stock balance, if any. If no treasury shares are available for issuance, new common shares are expected to be issued.
The Company accounts for share-based employee compensation plans under ASC 718, Stock Compensation. Equity-based compensation expense from share-based equity awards is recorded with an offsetting increase to additional paid in capital on the consolidated balance sheet. For equity awards with only service conditions, the Company recognizes compensation cost on a straight-line basis over the requisite service period for the entire award.
The fair value of each common stock option award granted in 2014, 2013 and 2012 was estimated on the respective grant date using the Black-Scholes option-pricing model and the assumptions noted in the following table. The risk-free rate is based on the zero-coupon U.S. Treasury rate in effect at the time of grant, with a term equal to the expected life of the options. The Company uses its post-February 2006 initial public offering volatility to estimate volatility assumptions for each year. The expected option life represents the period of time that the options granted are expected to be outstanding and is based on historical experience. The expected dividend yield is estimated based on the Company’s historical and expected dividend yields at the date of the grant.
2014 | 2013 | 2012 | |||
Risk-free interest rate | 2.4% | 1.3% to 1.5% | 1.0% to 1.7% | ||
Expected volatility | 39.2% to 39.4% | 39.3% to 39.6% | 37.9% to 39.4% | ||
Weighted-average expected volatility | 39.4% | 39.4% | 38.5% | ||
Expected dividend yield | 8.5% to 12.9% | 12.9% to 14.2% | 7.2% to 11.6% | ||
Weighted-average expected dividend yield | 12.6% | 13.5% | 7.7% | ||
Expected term | 7 years | 7 years | 7 years | ||
Total equity-based compensation expense related to all of the Company’s share-based equity awards for the years ended December 31, 2014, 2013 and 2012 and the Company’s 401(k) matching contributions was allocated as follows:
Year Ended December 31, | |||||||||||
(In thousands) | 2014 | 2013 | 2012 | ||||||||
Cost of sales and services | $ | 593 | $ | 634 | $ | 1,199 | |||||
Customer operations | 918 | 1,067 | 1,072 | ||||||||
Corporate operations | 1,458 | 3,852 | 3,758 | ||||||||
Equity-based compensation expense | $ | 2,969 | $ | 5,553 | $ | 6,029 | |||||
Future charges for equity-based compensation related to instruments outstanding at December 31, 2014 are estimated to be $1.3 million for 2015, $0.7 million for 2016 and less than $0.1 million for 2017 and 2018.
61
The summary of the activity and status of the Company’s stock option awards for the year ended December 31, 2014 is as follows:
(In thousands, except per share amounts) | Shares | Weighted Average Exercise Price per Share | Weighted Average Remaining Contractual Term | Aggregate Intrinsic Value | ||||||||
Stock options outstanding at January 1, 2014 | 2,603 | $ | 19.45 | |||||||||
Granted during the period | 374 | 13.42 | ||||||||||
Exercised during the period | — | — | ||||||||||
Forfeited/expired during the period | (1,394 | ) | 18.24 | |||||||||
Stock options outstanding at December 31, 2014 | 1,583 | $ | 19.09 | 4.5 | $ | 4 | ||||||
Exercisable at December 31, 2014 | 576 | $ | 17.99 | 6.0 | $ | 4 | ||||||
Total expected to vest at December 31, 2014 | 1,394 | $ | 18.24 | |||||||||
The weighted average grant date fair value per share of stock options granted during fiscal years 2014, 2013 and 2012 was $1.02, $0.71 and $3.32, respectively. The total intrinsic value of options exercised during fiscal year 2014 was an immaterial amount, with $0.1 million and $0.1 million, during fiscal years 2013 and 2012, respectively. The total fair value of options that vested during fiscal years 2014, 2013 and 2012 was $1.5 million, $1.6 million and $1.2 million, respectively. As of December 31, 2014, there was approximately $0.6 million of total unrecognized compensation cost related to unvested stock options, which is expected to be recognized over a weighted average period of 1.6 years.
The summary of the activity and status of the Company’s restricted stock awards for the year ended December 31, 2014 is as follows:
(In thousands, except per share amounts) | Shares | Weighted Average Grant Date Fair Value per Share | ||||
Restricted stock awards outstanding at January 1, 2014 | 325 | $ | 17.41 | |||
Granted during the period | 144 | 13.35 | ||||
Vested during the period | (89 | ) | 19.93 | |||
Forfeited during the period | (135 | ) | 15.96 | |||
Restricted stock awards outstanding at December 31, 2014 | 245 | $ | 14.93 | |||
As of December 31, 2014, there was $1.4 million of total unrecognized compensation cost related to unvested restricted stock awards, which is expected to be recognized over a weighted average period of 1.7 years. The fair value of the restricted stock award is equal to the market value of common stock on the date of grant.
The summary of the activity and status of the Company’s performance stock unit awards for the year ended December 31, 2014 is as follows:
(In thousands, except per share amounts) | Shares | Weighted Average Grant Fair Value per Share | ||||
Performance stock units outstanding at January 1, 2014 | 110 | $ | 12.79 | |||
Granted during the period | 83 | 9.50 | ||||
Vested during the period | (8 | ) | 12.83 | |||
Forfeited during the period | (86 | ) | 11.39 | |||
Performance stock units outstanding at December 31, 2014 | 99 | $ | 11.24 | |||
At December 31, 2014, there was $0.6 million of total unrecognized compensation cost related to unvested PSUs, which is expected to be recognized over a weighted average period of 1.5 years. The fair value of the PSU is estimated at the grant date using a Monte Carlo simulation model.
In addition to the Equity Incentive Plans discussed above, the Company has an employee stock purchase plan, which commenced in July 2006 with 100,000 shares available. Shares purchased under this plan have been issued from the treasury
62
stock balance. If treasury shares are not available, new common shares have been issued for purchases under this plan. Shares are priced at 85% of the closing price on the last trading day of the month and settle on the second business day of the following month. During fiscal years 2014, 2013 and 2012, 4,669 shares, 6,183 shares and 4,601 shares, respectively, were issued under the employee stock purchase plan. Compensation expense associated with the employee stock purchase plan for fiscal years 2014, 2013 and 2012 was immaterial.
Note 13. Income Taxes
The components of income tax expense from continuing operations are as follows for the years ended December 31, 2014, 2013 and 2012:
(In thousands) | 2014 | 2013 | 2012 | ||||||||
Current tax expense (benefit): | |||||||||||
Federal | $ | — | $ | 589 | $ | (3,390 | ) | ||||
State | 465 | 987 | (81 | ) | |||||||
465 | 1,576 | (3,471 | ) | ||||||||
Deferred tax expense: | |||||||||||
Federal | (28,445 | ) | 13,437 | 14,271 | |||||||
State | (4,914 | ) | 3,531 | 1,876 | |||||||
(33,359 | ) | 16,968 | 16,147 | ||||||||
$ | (32,894 | ) | $ | 18,544 | $ | 12,676 | |||||
Total income tax expense was different than an amount computed by applying the graduated statutory federal income tax rates to income before taxes. The reasons for the differences are as follows for the years ended December 31, 2014, 2013 and 2012:
(In thousands) | 2014 | 2013 | 2012 | ||||||||
Computed tax expense at statutory federal rate of 35% | $ | (29,771 | ) | $ | 15,849 | $ | 11,551 | ||||
Nondeductible compensation | 87 | 273 | 206 | ||||||||
Noncontrolling interests | (514 | ) | (721 | ) | (679 | ) | |||||
State income taxes, net of federal income tax benefit | (2,892 | ) | 2,937 | 1,167 | |||||||
Other | 196 | 206 | 431 | ||||||||
$ | (32,894 | ) | $ | 18,544 | $ | 12,676 | |||||
During 2014, 2013 and 2012, the Company recognized a tax (benefit)/expense of approximately $1.0 million, $0.7 million, and $(0.1) million, respectively, in stockholders’ equity associated with the excess tax benefit realized by the Company for stock compensation plans. Deferred tax assets are not recognized for net operating loss carry-forwards resulting from excess benefits related to equity compensation. As of December 31, 2014, deferred tax assets do not include $0.4 million of excess tax benefits that are a component of the Company's net operating loss carry-forwards. During 2014, 2013 and 2012, the Company recognized a tax expense of $5.0 million, $3.5 million and $2.1 million, respectively, in accumulated other comprehensive loss associated with the adjustments to various employee benefit plan liabilities in accordance with ASC 715.
63
Net deferred income tax assets and liabilities consist of the following components as of December 31, 2014 and 2013:
(In thousands) | 2014 | 2013 | |||||
Deferred income tax assets | |||||||
Retirement benefits other than pension | $ | 1,232 | $ | 778 | |||
Pension and related plans | 7,158 | 3,685 | |||||
Net operating loss | 46,264 | 43,347 | |||||
Accrued expenses | 3,554 | 3,644 | |||||
Other | 5,163 | 4,002 | |||||
63,371 | 55,456 | ||||||
Deferred income tax liabilities | |||||||
Property and equipment | 45,096 | 69,897 | |||||
Intangible assets | 1,009 | 1,567 | |||||
Licenses | 32,116 | 36,235 | |||||
78,221 | 107,699 | ||||||
$ | (14,850 | ) | $ | (52,243 | ) | ||
We expect to incur a Net Operating Loss ("NOL") in 2014 of approximately $9.2 million primarily resulting from recent changes in allowable bonus depreciation. The Company also has certain Federal prior year unused NOLs, including certain built-in losses that are subject to limitations imposed by the Internal Revenue Code of 1986, as amended (“IRC”) Section 382. These prior year NOLs are subject to an adjusted annual maximum limit (the “IRC 382 Limit”) of approximately $8.9 million. Based on the IRC 382 Limit, the Company expects that $109.7 million of these prior year NOLs will be available to the Company as follows: $24.3 million in 2015 (with $15.4 million total anticipated carryover from 2013 and 2014), $8.9 million per year in 2016 through 2024, $4.9 million in 2025 and $0.4 million in 2026. The Company also has certain state NOLs that will be available to the Company substantially similar to the Federal NOLs. The Company believes that it is more likely than not that its results of future operations will generate sufficient taxable income to realize the deferred tax assets.
The Company recognizes interest related to unrecognized income tax benefits (“UTBs”) in interest expense and penalties on UTBs in income tax expense. The Company did not have any UTBs as of December 31, 2014 and 2013.
While the Company believes it has adequately provided for all tax positions, amounts asserted by taxing authorities could be greater than its accrued position. Accordingly, additional provisions could be recorded in the future as revised estimates are made or the underlying matters are settled or otherwise resolved. In general, the tax years that remain open and subject to federal and state audit examinations are 2011-2014 and 2010-2014, respectively.
64
Note 14. Pension Plans and Other Postretirement Benefits
The Company sponsors several qualified and nonqualified pension plans and other postretirement benefit plans for its employees. The following tables provide a reconciliation of the changes in the qualified plans’ benefit obligations and fair value of assets and a statement of the funded status as of and for the years ended December 31, 2014 and 2013, and the classification of amounts recognized in the consolidated balance sheets:
Defined Benefit Pension Plan | Other Postretirement Benefit Plans | ||||||||||||||
(In thousands) | 2014 | 2013 | 2014 | 2013 | |||||||||||
Change in benefit obligations: | |||||||||||||||
Benefit obligations, beginning of period | $ | 27,774 | $ | 32,176 | $ | 1,980 | $ | 2,045 | |||||||
Service cost | — | — | 40 | 54 | |||||||||||
Interest cost | 1,375 | 1,325 | 98 | 84 | |||||||||||
Actuarial (gain) loss | 10,135 | (5,116 | ) | 805 | (187 | ) | |||||||||
Benefits paid, net | (1,002 | ) | (389 | ) | (26 | ) | (16 | ) | |||||||
Benefit obligations transferred | — | (222 | ) | 214 | — | ||||||||||
Benefit obligations, end of period | $ | 38,282 | $ | 27,774 | $ | 3,111 | $ | 1,980 | |||||||
Change in plan assets: | |||||||||||||||
Fair value of plan assets, beginning of period | $ | 24,610 | $ | 20,837 | $ | — | $ | — | |||||||
Actual return on plan assets | 1,148 | 4,255 | — | — | |||||||||||
Employer contributions | — | 32 | 102 | 16 | |||||||||||
Benefits paid | (1,040 | ) | (425 | ) | (102 | ) | (16 | ) | |||||||
Plan assets transferred | — | (89 | ) | — | — | ||||||||||
Fair value of plan assets, end of period | $ | 24,718 | $ | 24,610 | $ | — | $ | — | |||||||
Funded status: | |||||||||||||||
Total liability at December 31, | $ | (13,564 | ) | $ | (3,164 | ) | $ | (3,111 | ) | $ | (1,980 | ) | |||
In connection with the business separation, the Company transferred total assets of $0.5 million and total benefit obligations of $1.0 million between 2012 and 2013 related to Lumos Networks employees into a new defined benefit pension plan adopted by Lumos Networks. In addition, the transfer of the benefit obligation triggered the transfer of $0.2 million of unrealized actuarial loss classified in other comprehensive income between 2012 and 2013. No additional transfers will be required in future periods for either plan.
The accumulated benefit obligation for the defined benefit pension plan at December 31, 2014 and 2013 was $38.3 million and $27.8 million, respectively. The accumulated benefit obligation represents the present value of pension benefits based on service and salary earned to date. As of December 31, 2012, the Company froze future benefit accruals, resulting in a $7.5 million reduction in the Company’s projected benefit obligations due to the curtailment. Accordingly, the accumulated benefit obligation is equal to the projected benefit obligation.
The following table provides the components of net periodic benefit cost for the plans for the years ended December 31, 2014, 2013 and 2012:
Defined Benefit Pension Plan | Other Postretirement Benefit Plans | ||||||||||||||||||||||
(In thousands) | 2014 | 2013 | 2012 | 2014 | 2013 | 2012 | |||||||||||||||||
Components of net periodic benefit cost: | |||||||||||||||||||||||
Service cost | $ | — | $ | — | $ | 1,838 | $ | 40 | $ | 54 | $ | 41 | |||||||||||
Interest cost | 1,375 | 1,325 | 1,489 | 122 | 78 | 88 | |||||||||||||||||
Recognized net actuarial loss | — | 131 | 734 | 102 | 16 | 28 | |||||||||||||||||
Expected return on plan assets | (1,886 | ) | (1,595 | ) | (1,293 | ) | — | — | — | ||||||||||||||
Net periodic benefit cost | $ | (511 | ) | $ | (139 | ) | $ | 2,768 | $ | 264 | $ | 148 | $ | 157 | |||||||||
65
Prior service costs are amortized on a straight-line basis over the average remaining service period of active participants. Gains and losses in excess of 10% of the greater of the benefit obligation and the market-related value of assets are amortized over the average remaining service period of active participants.
Unrecognized actuarial (gains)/losses in 2014 were $10.9 million and $(0.8) million for the defined benefit pension plan and the other postretirement benefit plans, respectively. The total amount of unrecognized actuarial (gain)/loss recorded in accumulated other comprehensive loss at December 31, 2014 related to these respective plans was $6.0 million, net of a $(3.8) million deferred tax asset, and $(0.3) million, net of a $0.2 million deferred tax liability.
The total amount reclassified out of accumulated other comprehensive loss related to actuarial losses from the defined benefit plans was $0.1 million, $0.3 million, and $0.5 million for the three years ended December 31, 2014, 2013, and 2012, respectively, all of which has been reclassified to cost of sales and services, customer operations, and corporate operations on the consolidated statement of operations for the respective periods.
The assumptions used in the measurements of the Company’s benefit obligations at December 31, 2014 and 2013 are shown in the following table:
Defined Benefit Pension Plan | Other Postretirement Benefit Plans | ||||||||||
2014 | 2013 | 2014 | 2013 | ||||||||
Discount rate | 4.00 | % | 5.00 | % | 4.10 | % | 5.00 | % | |||
The assumptions used in the measurements of the Company’s net cost for the consolidated statement of operations for the years ended December 31, 2014, 2013 and 2012 are:
Defined Benefit Pension Plan | Other Postretirement Benefit Plans | ||||||||||||||||
2014 | 2013 | 2012 | 2014 | 2013 | 2012 | ||||||||||||
Discount rate | 5.00 | % | 4.15 | % | 4.45 | % | 5.00 | % | 4.15 | % | 4.45 | % | |||||
Expected return on plan assets | 7.25 | % | 7.75 | % | 7.75 | % | — | — | — | ||||||||
Rate of compensation increase | — | — | 3.00 | % | — | — | — | ||||||||||
The Company reviews the assumptions noted in the above table annually or more frequently to reflect anticipated future changes in the underlying economic factors used to determine these assumptions. The discount rates assumed reflect the rate at which the Company could invest in high quality corporate bonds in order to settle future obligations. In doing so, the Company utilizes a Citigroup Pension Discount Curve applied against the Company’s estimated defined benefit payments to derive a blended rate. The Citigroup Pension Discount Curve is derived from over 350 Aa rated corporate bonds. The Company also compares this to a Moody’s ten-year Aa rated bond index for reasonableness.
In 2014, the Company adopted updated mortality tables published by the Society of Actuaries that predict increasing life expectancies in the United States. Additionally, the Company updated the discount rate as discussed above. Mortality and discount rate changes increased the benefit obligations approximately $2.4 million and $7.1 million, respectively, as of December 31, 2014.
For measurement purposes, a 6.0% annual rate of increase in the per capita cost of covered health care benefits was assumed for 2015 for the obligation as of December 31, 2014. The rate was assumed to decrease one-half percent per year to a rate of 5.0% for 2017 and remain at that level thereafter.
Assumed health care cost trend rates may have a significant effect on the amounts reported for the health care plans. The effect of a 1% change on the medical trend rate per future year, while holding all other assumptions constant, to the service and interest cost components of net periodic postretirement health care benefit costs and accumulated postretirement benefit obligation would be a $0.1 million increase and a $0.7 million increase, respectively, for a 1% increase in medical trend rate and a $0.1 million decrease and a $0.5 million decrease, respectively, for a 1% decrease in medical trend rate.
In developing the expected long-term rate of return assumption for the assets of the Defined Benefit Pension Plan, the Company evaluated input from its third-party pension plan administrator, including its review of asset class return expectations and long-term inflation assumptions. The Company also considered the related historical ten-year average asset return at December 31, 2014 as well as considered input from its third-party pension plan asset managers.
66
The weighted average actual asset allocations by asset category as of December 31, 2014 and the fair value by asset category as of December 31, 2014 and 2013 were as follows:
Actual Allocation as of | Fair Value as of December 31, | |||||||||
Asset Category (dollars in thousands) | December 31, 2014 | 2014 | 2013 | |||||||
Large Cap Value | 17 | % | $ | 4,082 | $ | 8,097 | ||||
Large Cap Blend | 10 | % | 2,347 | 4,022 | ||||||
Large Growth | 16 | % | 4,061 | — | ||||||
Mid Cap Blend | 9 | % | 2,246 | 1,500 | ||||||
Small Cap Blend | 5 | % | 1,348 | 1,005 | ||||||
Foreign Stock – Large Cap | 19 | % | 4,778 | 1,706 | ||||||
Bond | 20 | % | 4,849 | 7,548 | ||||||
Cash and cash equivalents | 4 | % | 1,008 | 732 | ||||||
Total | 100 | % | $ | 24,719 | $ | 24,610 | ||||
The actual and target allocation for plan assets is broadly defined and measured as follows:
Asset Category | Actual Allocation | Target Allocation | |||
Equity securities | 76 | % | 66 | % | |
Bond securities and cash equivalents | 24 | % | 34 | % | |
Total | 100 | % | 100 | % | |
It is the Company’s policy to invest pension plan assets in a diversified portfolio consisting of an array of asset classes. The investment risk of the assets is limited by appropriate diversification both within and between asset classes. The assets are primarily invested in investment funds that invest in a broad mix of publicly traded equities, bonds and cash equivalents (and fair value is based on quoted market prices (“Level 1” input)). The allocation between equity and bonds is reset quarterly to the target allocations. Updates to the allocation are considered in the normal course and changes may be made when appropriate. The bond holdings consist of three bond funds split relatively evenly between these funds at December 31, 2014 and 2013. The maximum holdings of any one asset within these funds is under 4.5% of this fund and thus is well under 1% of the total portfolio. At December 31, 2014, the Company believes that there are no material concentrations of risk within the portfolio of plan assets.
The assumed long-term return noted above is the target long-term return. Overall return, risk adjusted return, and management fees are assessed against a peer group and benchmark indices. There are minimum performance standards that must be attained within the investment portfolio. Reporting on asset performance is provided quarterly and review meetings are held semi-annually. In addition to normal rebalancing to maintain an adequate cash reserve, projected cash flow needs of the plan are reviewed at least annually to ensure liquidity is properly managed.
The Company does not expect to contribute to the pension plan in 2015. The Company expects the net periodic benefit cost for the defined benefit pension plan in 2015 to be $0.3 million and expects the periodic benefit cost for the other postretirement benefit plans in 2015 to be $0.3 million.
67
The following estimated future pension benefit payments and other postretirement benefit plan payments which reflect expected future service, as appropriate, are expected to be paid in the years indicated:
(In thousands) | Defined Benefit Pension Plan | Other Postretirement Benefit Plans | |||||
2015 | $ | 608 | $ | 74 | |||
2016 | 655 | 74 | |||||
2017 | 707 | 85 | |||||
2018 | 768 | 76 | |||||
2019 | 819 | 80 | |||||
Aggregate of next five years | 5,892 | 619 | |||||
Other Benefit Plans
The Company also sponsors a supplemental executive retirement plan. This nonqualified plan, which has no plan assets, was closed to new participants in 2003. The projected benefit obligation of this nonqualified plan was $8.3 million and $7.3 million at December 31, 2014 and 2013, respectively. The total expense recognized related to this plan was $0.4 million for the years ended December 31, 2014, 2013 and 2012.
The Company recognized $0.1 million of expense from previously unrecognized loss related to the supplemental executive retirement plan for each of the years ended December 31, 2014, 2013 and 2012. Unrecognized actuarial (gain) loss was $1.2 million and $(0.6) million in 2014 and 2013, respectively. The total balance of unrecognized actuarial losses recorded in accumulated other comprehensive loss at December 31, 2014 and 2013 related to this plan was $2.3 million, net of a $1.5 million deferred tax asset, and $1.7 million, net of a $1.0 million deferred tax asset, respectively. The total expense to be recognized in 2015 for the nonqualified pension plan is approximately $0.4 million and the estimated payments are expected to be approximately $0.5 million.
Estimated future benefit payments are expected to be paid in the years indicated: $0.5 million annually for each of the years 2015 through 2019 and $2.5 million in aggregate for the years 2020 through 2024.
The Company also sponsors a contributory defined contribution plan under IRC Section 401(k) for substantially all employees. The Company’s matching contributions to this plan were $1.2 million for the year ended December 31, 2014 and $1.1 million for the years ended December 31, 2013 and 2012. The Company’s policy is to make matching contributions in shares of the Company’s common stock. All of the matching contributions for 2014, 2013 and 2012 represented equity contributions.
Note 15. Strategic Network Alliance
The Company provides PCS services and has contracted to provide LTE Services on a wholesale basis to other wireless communication providers, most notably through the SNA with Sprint in which the Company is the exclusive PCS/LTE service provider in the Company’s western Virginia and West Virginia service area (“SNA service area”) for all Sprint Code Division Multiple Access (“CDMA”) and LTE wireless customers. In May 2014 the parties entered into an amended agreement to extend the SNA. Pursuant to the terms of the SNA, the Company is required to upgrade its network in the SNA service area to provide LTE Services. As part of the amendment, the Company leases spectrum, on a non-cash basis, from Sprint in order to enhance the PCS/LTE services. The non-cash consideration attributable to the leased spectrum is approximately $4.9 million per year. The lease expense is recognized over the term of the lease and recorded within cost of sales and services, with the offsetting consideration recorded within wholesale and other revenue. Additionally, the amended SNA provides the Company access to Sprint’s nationwide 3G and 4G LTE network at rates that are reciprocal to rates paid by Sprint under the amended SNA. The amended SNA provides that a portion of the amount paid by Sprint thereunder is fixed. The fixed fee element of the amended SNA is subject to contractual reductions on August 1, 2015 and annually thereafter starting on January 1, 2016 that will result in a decrease of payments for the fixed fee element. The Company accounts for this fixed fee portion of the revenue earned from the SNA revenue on a straight line basis over the term of the agreement. In addition, these reductions are subject to further upward or downward resets in the fixed fee element. These resets, if any, will be recognized in the period in which it occurs.
The Company generated 30.5%, 34.1% and 35.8% of its revenue from the SNA for the years ended December 31, 2014, 2013 and 2012, respectively. Revenues under the SNA have an effective minimum amount of $9.3 million per month subject to annual adjustments.
68
In September 2013 the Company reached a settlement with Sprint over the disputes related to the SNA. The settlement resolved the open disputes under the SNA, including the data rate reset dispute that began in the fourth quarter 2011 and the unrelated historical billing disputes that were asserted by Sprint in the third quarter 2012. In connection with the settlement, the Company recognized an additional $9.6 million in Operating Income, consisting of a $9.0 million increase in revenue (primarily related to a reversal of the previously disclosed accrual) and a $0.6 million decrease in cost of sales and services, for the year ended December 31, 2013.
Note 16. Commitments and Contingencies
Commitments
The Company has various contractual obligations such as purchase commitments and other executory contracts, which may affect its financial condition, but are not recognized as liabilities in its consolidated financial statements. The Company is contractually committed to acquire handsets, network equipment and make certain minimum lease payments for the use of property under operating lease agreements for administrative office space, retail space, tower space and equipment, certain of which have renewal options. The leases for retail and tower space have initial lease periods of one to thirty years. These leases, with few exceptions, provide for automatic renewal options and escalations that are either fixed or based on the consumer price index. Any rent abatements, along with rent escalations, are included in the computation of rent expense calculated on a straight-line basis over the lease term.
The Company’s minimum lease term for most leases includes the initial non-cancelable term plus at least one renewal period, as the exercise of the related renewal option or options based on the premise that failure to renew the leases imposes an economic penalty on the Company in such amount that a renewal appears to be reasonably assured. The Company’s cell site leases generally provide for an initial non-cancelable term of 5 to 7 years with three renewal options of 5 years each. Leasehold improvements are depreciated over the shorter of the assets’ useful life or the lease term, including renewal option periods that are reasonably assured.
Rent expense for all operating leases for the years ended December 31, 2014, 2013 and 2012 was $37.0 million, $35.8 million and $33.2 million, respectively. The following table summarizes the Company’s contractual commitments for future minimum lease payments under non-cancelable operating leases, and commercial commitments for network capital expenditures, handset equipment and other materials to support its operations, at December 31, 2014:
Operating | Purchase | ||||||||||
(In thousands) | Leases | Commitments | Total | ||||||||
2015 | $ | 37,941 | $ | 127,132 | $ | 165,073 | |||||
2016 | 37,379 | 960 | 38,339 | ||||||||
2017 | 36,385 | — | 36,385 | ||||||||
2018 | 35,387 | — | 35,387 | ||||||||
2019 | 33,972 | — | 33,972 | ||||||||
Thereafter | 121,754 | — | 121,754 | ||||||||
$ | 302,818 | $ | 128,092 | $ | 430,910 | ||||||
The Company has assigned certain leases with lease terms expiring on various dates through 2029 to various third parties. Although the Company is not a guarantor under these leases, it remains secondarily liable for the lease payments for which it was responsible as the original lessee. The maximum potential liability for future rental payments the Company could be required to make under these leases at December 31, 2014 was $1.7 million. The Company does not believe it is probable that it would be required to make any lease payments resulting from its secondary liability for these leases therefore, no liability has been recorded.
Reserve for Contingencies
On occasion, the Company makes claims or receives disputes related to its billings to other carriers, including billings under the SNA agreement, for access to the Company’s network. These disputes may involve amounts which, if resolved unfavorably to the Company, could have a material effect on the Company’s financial statements. The Company does not recognize revenue related to such matters until the period that it is reasonably assured of the collection of these claims. In the event that a claim is made related to revenues previously recognized, the Company assesses the validity of the claim and adjusts the amount of revenue recognized to the extent that the claim adjustment is considered probable and reasonably estimable.
The Company periodically disputes network access charges it is assessed by other companies with which the Company interconnects, and is involved in other disputes, claims, either asserted or unasserted, and legal and tax proceedings and filings
69
arising from normal business activities. While the outcome of such matters is currently not determinable, and it is reasonably possible that the cost to resolve such matters could be material, management believes that adequate provision for any probable and reasonably estimable losses has been made in the Company’s unaudited condensed consolidated financial statements.
Note 17. Subsequent Event
In January 20, 2015, the Company entered into a definitive agreement to sell up to 103 towers for approximately $41.0 million. The agreement provides that the Company will enter into long term lease agreements on the sold towers that are located in western Virginia and West Virginia. The transaction is expected to close in multiple installments during calendar year 2015, the first of which occurred on February 17, 2015 and consisted of 85 towers with proceeds to the Company of approximately $35.0 million. The inclusion of towers in any closing is subject to final due diligence and other customary closing conditions.
70
QUARTERLY FINANCIAL SUMMARY
(Unaudited)
Fiscal Year 2014 | |||||||||||||||
First | Second | Third | Fourth | ||||||||||||
(In thousands, except per share amounts) | Quarter | Quarter | Quarter | Quarter | |||||||||||
Operating Revenues | $ | 122,082 | $ | 117,795 | $ | 119,638 | $ | 128,319 | |||||||
Operating Income (Loss) | 11,863 | 9,904 | 10,323 | (83,340 | ) | ||||||||||
Income (Loss) from Continuing Operations (1) | 1,722 | 857 | 1,156 | (55,901 | ) | ||||||||||
Net Income (Loss) Attributable to NTELOS Holdings Corp. (1) | 1,286 | 484 | 804 | (56,208 | ) | ||||||||||
Earnings (Loss) per Share Attributable to NTELOS Holdings Corp. | |||||||||||||||
Basic | $ | 0.06 | $ | 0.02 | $ | 0.04 | $ | (2.66 | ) | ||||||
Diluted | 0.06 | 0.02 | 0.04 | (2.66 | ) | ||||||||||
Fiscal Year 2013 | |||||||||||||||
First | Second | Third | Fourth | ||||||||||||
Quarter | Quarter | Quarter | Quarter | ||||||||||||
Operating Revenues | $ | 119,345 | $ | 119,859 | $ | 130,912 | $ | 121,766 | |||||||
Operating Income | 17,496 | 23,554 | 27,422 | 7,364 | |||||||||||
Income (Loss) from Continuing Operations (2) | 6,022 | 9,927 | 11,171 | (381 | ) | ||||||||||
Net Income (Loss) Attributable to NTELOS Holdings Corp. (2) | 5,493 | 9,386 | 10,583 | (784 | ) | ||||||||||
Earnings (Loss) per Share Attributable to NTELOS Holdings Corp. | |||||||||||||||
Basic | $ | 0.26 | $ | 0.45 | $ | 0.50 | $ | (0.04 | ) | ||||||
Diluted | 0.25 | 0.43 | 0.48 | (0.04 | ) | ||||||||||
(1) | Results for the fourth quarter of fiscal year 2014 include increased equipment revenue from EIP and the impairment and restructuring costs associated with the sale of the spectrum and the wind down of our operations in our Eastern Markets. |
(2) | Results for the fourth quarter of fiscal year 2013 included increased equipment cost of approximately $8.0 million for new sales activations and upgrades for existing customers due to seasonality and the launch of the new iPhones combined with the nControl rate plans during the fourth quarter. |
71
Item 9. | Changes in and Disagreements with Accountants on Accounting and Financial Disclosure. |
None.
Item 9A. | Controls and Procedures. |
Conclusion Regarding the Effectiveness of Disclosure Controls and Procedures
Under the supervision and with the participation of our management, including our principal executive officer and principal financial officer, we conducted an evaluation of the effectiveness of the design and operation of our disclosure controls and procedures, as defined in Rules 13a-15(e) and 15d-15(e) under the Exchange Act, as of the end of the period covered by this report. Based on this evaluation, our principal executive officer and our principal financial officer concluded that, as of the end of the period covered by this report, our disclosure controls and procedures are effective to ensure that the information required to be disclosed by us in the reports that we file or submit under the Exchange Act, is recorded, processed, summarized and reported, within the time periods specified in the SEC’s rules and forms, and that such information is accumulated and communicated to our management, including our principal executive officer and our principal financial officer, as appropriate, to allow timely decisions regarding required disclosures. Management’s report on internal control over financial reporting is included below.
The effectiveness of our internal control over financial reporting as of December 31, 2014 has been audited by KPMG LLP, an independent registered public accounting firm, as stated in their report, indicated below.
Management’s Annual Report on Internal Control over Financial Reporting
Our management is responsible for establishing and maintaining adequate internal control over financial reporting as defined in Exchange Act Rule 13a-15(f) and 15d-15(f). Our internal control over financial reporting is a process designed to provide reasonable assurance regarding the reliability of financial reporting and the preparation of financial statements for external purposes in accordance with accounting principles generally accepted in the United States. Our internal control over financial reporting includes those policies and procedures that (i) pertain to the maintenance of records that, in reasonable detail, accurately and fairly reflect the transactions and dispositions of assets; (ii) provide reasonable assurance that transactions are recorded as necessary to permit preparation of financial statements in accordance with accounting principles generally accepted in the United States, and that receipts and expenditures of the Company are being made only in accordance with management’s and our directors’ authorizations; and (iii) provide reasonable assurance regarding prevention or timely detection of unauthorized acquisition, use, or disposition of the our assets that could have a material effect on the financial statements.
Under the supervision and with the participation of our management, including our principal executive officer and principal financial officer, we conducted an evaluation of the effectiveness of our internal control over financial reporting as of December 31, 2014. In making this assessment, management used the criteria for effective internal control over financial reporting described in “Internal Control-Integrated Framework” set forth by the Committee of Sponsoring Organizations of the Treadway Commission (COSO). Based on the assessment, management concluded that, as of December 31, 2014, the Company’s internal control over financial reporting was effective to provide reasonable assurances regarding the reliability of financial reporting and the preparation of financial statements for external purposes in accordance with generally accepted accounting principles in the Unites States. The conclusion of our principal executive officer and principal financial officer is based on the recognition that there are inherent limitations in all systems of internal control. Because of its inherent limitations, internal control over financial reporting may not prevent or detect misstatements. Also, projections of any evaluation of effectiveness to future periods are subject to the risk that controls may become inadequate because of changes in conditions, or that the degree of compliance with the policies or procedures may deteriorate.
Changes in Internal Control over Financial Reporting
There were no changes in our internal control over financial reporting (as such term is defined in Exchange Act Rule 13a-15(f)) that occurred during the three months ended December 31, 2014 that have materially affected, or are reasonably likely to materially affect, our internal control over financial reporting.
72
Report of Independent Registered Public Accounting Firm
The Board of Directors and Stockholders
NTELOS Holdings Corp.:
We have audited NTELOS Holdings Corp.’s internal control over financial reporting as of December 31, 2014, based on criteria established in Internal Control – Integrated Framework (1992) issued by the Committee of Sponsoring Organizations of the Treadway Commission (COSO). NTELOS Holdings Corp.’s management is responsible for maintaining effective internal control over financial reporting and for its assessment of the effectiveness of internal control over financial reporting, included in the accompanying Management’s Annual Report on Internal Control over Financial Reporting. Our responsibility is to express an opinion on the Company’s internal control over financial reporting based on our audit.
We conducted our audit in accordance with the standards of the Public Company Accounting Oversight Board (United States). Those standards require that we plan and perform the audit to obtain reasonable assurance about whether effective internal control over financial reporting was maintained in all material respects. Our audit included obtaining an understanding of internal control over financial reporting, assessing the risk that a material weakness exists, and testing and evaluating the design and operating effectiveness of internal control based on the assessed risk. Our audit also included performing such other procedures as we considered necessary in the circumstances. We believe that our audit provides a reasonable basis for our opinion.
A company’s internal control over financial reporting is a process designed to provide reasonable assurance regarding the reliability of financial reporting and the preparation of financial statements for external purposes in accordance with generally accepted accounting principles. A company’s internal control over financial reporting includes those policies and procedures that (1) pertain to the maintenance of records that, in reasonable detail, accurately and fairly reflect the transactions and dispositions of the assets of the company; (2) provide reasonable assurance that transactions are recorded as necessary to permit preparation of financial statements in accordance with generally accepted accounting principles, and that receipts and expenditures of the company are being made only in accordance with authorizations of management and directors of the company; and (3) provide reasonable assurance regarding prevention or timely detection of unauthorized acquisition, use, or disposition of the company’s assets that could have a material effect on the financial statements.
Because of its inherent limitations, internal control over financial reporting may not prevent or detect misstatements. In addition, projections of any evaluation of effectiveness to future periods are subject to the risk that controls may become inadequate because of changes in conditions, or that the degree of compliance with the policies or procedures may deteriorate.
In our opinion, NTELOS Holdings Corp. maintained, in all material respects, effective internal control over financial reporting as of December 31, 2014, based on criteria established in Internal Control – Integrated Framework (1992) issued by the Committee of Sponsoring Organizations of the Treadway Commission.
We also have audited, in accordance with the standards of the Public Company Accounting Oversight Board (United States), the consolidated balance sheets of NTELOS Holdings Corp. as of December 31, 2014 and 2013, and the related consolidated statements of operations, comprehensive income (loss), cash flows, and changes in stockholders’ equity (deficit) for each of the years in the three-year period ended December 31, 2014, and our report dated February 26, 2015 expressed an unqualified opinion on those consolidated financial statements.
/s/ KPMG LLP |
Richmond, Virginia |
February 26, 2015 |
Item 9B. | Other Information. |
None.
73
PART III
Item 10. | Directors, Executive Officers and Corporate Governance. |
The information required by this item is incorporated herein by reference from the registrant’s definitive Proxy Statement for the Annual Meeting of Stockholders to be filed with the Commission pursuant to Regulation 14A.
The Company has adopted a Code of Business Conduct and Ethics pursuant to section 406 of the Sarbanes-Oxley Act. A copy of our Code of Business Conduct and Ethics is publicly available on our Company website at http://ir.ntelos.com/governance-docs. The information contained on our website is not incorporated by reference into this Annual Report on Form 10-K.
Item 11. | Executive Compensation. |
The information required by this item is incorporated herein by reference from the registrant’s definitive Proxy Statement for the Annual Meeting of Stockholders.
Item 12. | Security Ownership of Certain Beneficial Owners and Management and Related Stockholder Matters. |
The information required by this item is incorporated herein by reference from the registrant’s definitive Proxy Statement for the Annual Meeting of Stockholders.
Item 13. | Certain Relationships and Related Transactions, and Director Independence. |
The information required by this item is incorporated herein by reference from the registrant’s definitive Proxy Statement for the Annual Meeting of Stockholders.
Item 14. | Principal Accounting Fees and Services. |
The information required by this item is incorporated herein by reference from the registrant’s definitive Proxy Statement for the Annual Meeting of Stockholders.
PART IV
Item 15. | Exhibits, Financial Statement Schedules. |
(a) | The following documents are filed as a part of this Annual Report on Form 10-K: |
(1) | Consolidated Financial Statements |
The consolidated financial statements required to be filed in this Annual Report on Form 10-K are listed in Item 8 hereof.
(3) | Exhibits |
The exhibits listed below are filed as part of, or incorporated by reference into, this Annual Report on Form 10-K.
74
Exhibit No. | Description | |
3.1(2) | Amended and Restated Certificate of Incorporation of Holdings. | |
3.2(1) | Certificate of Amendment to the Amended and Restated Certificate of Incorporation of Holdings. | |
3.3(3) | Amended and Restated By-laws of Holdings. | |
4.1(3) | Amended and Restated Shareholders Agreement by and among Holdings and the stockholders listed on the signature pages thereto. | |
10.1(3)+ | Holdings Amended and Restated Equity Incentive Plan. | |
10.2(4)+ | First Amendment to the NTELOS Holdings Corp. Amended and Restated Equity Incentive Plan. | |
10.3(5)+ | NTELOS Holdings Corp. 2010 Equity and Cash Incentive Plan. | |
10.4(3)+ | Holdings Employee Stock Purchase Plan, as amended. | |
10.5(3)+ | Form of Award Agreement under Holdings Amended and Restated Equity Incentive Plan. | |
10.6(3)+ | Holdings Non-Employee Director Equity Plan. | |
10.7(6) | Second Amendment and Restatement Agreement to the Amended and Restated Credit Agreement, with the Second Amended and Restated Credit Agreement, dated as of January 31, 2014, attached as Exhibit A thereto. | |
10.8(7)++ | Amended and Restated Resale Agreement, dated as of May 1, 2014, by and among West Virginia PCS Alliance, L.C., Virginia PCS Alliance, L.C., NTELOS Inc. and Sprint Spectrum L.P. and its Designated Affiliates. | |
10.9(8)+ | NTELOS Inc. 2005 Executive Supplemental Retirement Plan, as amended and restated December 21, 2006. | |
10.10(9)+ | Form of Stock Option Award Agreement under Holdings Non-Employee Director Equity Plan. | |
10.11(9)+ | Form of Restricted Stock Award Agreement under Holdings Non-Employee Director Equity Plan. | |
10.12(10)+ | Form of Stock Option Grant Award Agreement. | |
10.13(11)+ | Form of Restricted Stock Award Agreement. | |
10.14(12)+ | Form of Restricted Stock Grant Award, dated December 7, 2010 for James A. Hyde. | |
10.15(12)+ | Form of Restricted Stock Grant Award, dated December 7, 2010 for Conrad J. Hunter. | |
10.16(12)+ | Form of Separation Incentive Restricted Stock Grant Award, dated December 7, 2010 for James A. Hyde. | |
10.17(13)+ | Form of Executive Stock Option Agreement under NTELOS Holdings Corp. 2010 Equity and Cash Incentive Plan. | |
10.18(13)+ | Form of Executive Restricted Stock Agreement under NTELOS Holdings Corp. 2010 Equity and Cash Incentive Plan. | |
10.19(14)+ | Form of Stock Option Grant Award Agreement. | |
10.20(14)+ | Form of Restricted Stock Award Grant Agreement | |
10.21(14)+ | Form of Performance Stock Unit Grant Agreement | |
10.22(12)+ | Employment Agreement, dated December 7, 2010, between NTELOS Holdings Corp. and James A. Hyde. | |
10.23(15)+ | Letter Agreement between NTELOS Holdings Corp. and James A. Hyde, dated July 28, 2014. | |
10.24(12)+ | Employment Agreement, dated December 7, 2010, between NTELOS Holdings Corp. and Conrad J. Hunter. | |
10.25(16)+ | Agreement, dated March 13, 2014, between NTELOS Holdings Corp. and Conrad J. Hunter. | |
10.26(17)+ | Employment Agreement, dated December 7, 2010, between NTELOS Holdings Corp. and Robert L. McAvoy, Jr. | |
10.27(18)+ | Employment Agreement, dated July 29, 2011, between NTELOS Holdings Corp. and Stebbins B. Chandor Jr. | |
10.28(17)+ | Employment Agreement, dated August 17, 2011, between NTELOS Holdings Corp. and Brian J. O’Neil. | |
10.29(15)+ | Professional Services Agreement between NTELOS Holdings Corp. and Rodney D. Dir, dated as of July 28, 2014. | |
10.30(19)+ | Professional Services Agreement between NTELOS Holdings Corp. and Rodney D. Dir, dated as of February 1, 2015. | |
10.31(20) | License Purchase Agreement dated as of December 1, 2014, by and among T-Mobile License LLC, Richmond 20 MHz, LLC and NTELOS Inc. | |
21.1* | Subsidiaries of Holdings. | |
23.1* | Consent of KPMG LLP. | |
31.1* | Certificate of the principal executive officer pursuant to Rule 13a-14(a). | |
31.2* | Certificate of the principal financial officer pursuant to Rule 13a-14(a). | |
75
32.1* | Certificate of the chief executive officer pursuant to 18 U.S.C. Section 1350, as adopted pursuant to Section 906 of the Sarbanes-Oxley Act of 2002. | |
32.2* | Certificate of the chief financial officer pursuant to 18 U.S.C. Section 1350, as adopted pursuant to Section 906 of the Sarbanes-Oxley Act of 2002. | |
101.INS* | XBRL Instance Document. | |
101.SCH* | XBRL Taxonomy Extension Schema Document. | |
101.CAL* | XBRL Taxonomy Extension Calculation Linkbase Document. | |
101.DEF* | XBRL Taxonomy Extension Definition Linkbase Document. | |
101.LAB* | XBRL Taxonomy Extension Label Linkbase Document. | |
101.PRE* | XBRL Taxonomy Extension Presentation Linkbase Document. | |
* | Filed herewith. |
+ | Management contracts and arrangements. |
++ | Confidential treatment has been granted for certain portions of this exhibit pursuant to a confidential treatment order granted by the Securities and Exchange Commission. Such portions have been omitted and filed separately with the Securities and Exchange Commission. |
(1) | Filed as an exhibit to Current Report on Form 8-K filed November 4, 2011. |
(2) | Filed as an exhibit to Current Report on Form 8-K filed May 11, 2011. |
(3) | Filed as an exhibit to Annual Report on Form 10-K for the year ended December 31, 2005 filed March 28, 2006. |
(4) | Filed as an exhibit to Current Report on Form 8-K filed December 19, 2008. |
(5) | Filed as Annex A to Definitive Proxy Statement on Schedule 14A filed March 15, 2010 |
(6) | Filed as an exhibit to Current Report on Form 8-K filed February 6, 2014 |
(7) | Filed as an exhibit to Quarterly Report on Form 10-Q filed July 29, 2014. |
(8) | Filed as an exhibit to Current Report on Form 8-K filed December 21, 2006. |
(9) | Filed as an exhibit to Annual Report on Form 10-K filed February 26, 2010. |
(10) | Filed as an exhibit to Current Report on Form 8-K filed March 6, 2007. |
(11) | Filed as an exhibit to Current Report on Form 8-K filed March 4, 2008. |
(12) | Filed as an exhibit to Current Report on Form 8-K filed December 9, 2010. |
(13) | Filed as an exhibit to Current Report on Form 8-K filed March 6, 2012. |
(14) | Filed as an exhibit to Quarterly Report on Form 10-Q filed May 8, 2013. |
(15) | Filed as an exhibit to Current Report on Form 8-K filed July 31, 2014. |
(16) | Filed as an exhibit to Quarterly Report on Form 10-Q filed May 7, 2014. |
(17) | Filed as an exhibit to Quarterly Report on Form 10-Q filed May 1, 2012. |
(18) | Filed as an exhibit to Current Report on Form 8-K filed August 1, 2011 |
(19) | Filed as an exhibit to Current Report on Form 8-K filed February 5, 2015. |
(20) | Filed as an exhibit to Current Report on Form 8-K filed December 2, 2014. |
76
SIGNATURES
Pursuant to the requirements of Section 13 or 15(d) of the Securities Exchange Act of 1934, the registrant has duly caused this Annual Report on Form 10-K to be signed on its behalf by the undersigned, thereunto duly authorized.
NTELOS HOLDINGS CORP. | ||
By: | /s/ Rodney D. Dir | |
Name: | ||
Title: | President and Chief Executive Officer | |
Date: | February 26, 2015 | |
Pursuant to the requirements of the Securities Exchange Act of 1934, this Annual Report on Form 10-K has been signed below by the following persons on behalf of the registrant and in the capacities and on the dates indicated:
Signature | Title | Date | ||
/s/ Rodney D. Dir | President, Chief Executive Officer and Director (principal executive officer) | February 26, 2015 | ||
Rodney D. Dir | ||||
/s/ Stebbins B. Chandor Jr. | Executive Vice President and Chief Financial Officer, Treasurer and Assistant Secretary (principal financial officer) | February 26, 2015 | ||
Stebbins B. Chandor Jr. | ||||
/s/ John Turtora | Vice President and Controller (principal accounting officer) | February 26, 2015 | ||
John Turtora | ||||
/s/ Michael Huber | Chairman of the Board and Director | February 26, 2015 | ||
Michael Huber | ||||
/s/David A. Chorney | Director | February 26, 2015 | ||
David A. Chorney | ||||
/s/ Stephen C. Duggan | Director | February 26, 2015 | ||
Stephen C. Duggan | ||||
/s/ Michael Gottdenker | Director | February 26, 2015 | ||
Michael Gottdenker | ||||
/s/ Daniel J. Heneghan | Director | February 26, 2015 | ||
Daniel J. Heneghan | ||||
/s/ Ruth Sommers | Director | February 26, 2015 | ||
Ruth Sommers | ||||
/s/ Ellen O’Connor Vos | Director | February 26, 2015 | ||
Ellen O’Connor Vos | ||||
77