Attached files
| file | filename |
|---|---|
| EX-12.1 - EXHIBIT 12.1 - Otter Tail Corp | t1600062_ex12-1.htm |
| EX-24.A - EXHIBIT 24.A - Otter Tail Corp | t1600062_ex24-a.htm |
| EX-31.2 - EXHIBIT 31.2 - Otter Tail Corp | t1600062_ex31-2.htm |
| EX-23.A - EXHIBIT 23.A - Otter Tail Corp | t1600062_ex23-a.htm |
| EX-21.A - EXHIBIT 21.A - Otter Tail Corp | t1600062_ex21-a.htm |
| EX-32.2 - EXHIBIT 32.2 - Otter Tail Corp | t1600062_ex32-2.htm |
| EX-32.1 - EXHIBIT 32.1 - Otter Tail Corp | t1600062_ex32-1.htm |
| EX-10.R6 - EXHIBIT 10.R6 - Otter Tail Corp | t1600062_ex10-r6.htm |
| EX-31.1 - EXHIBIT 31.1 - Otter Tail Corp | t1600062_ex31-1.htm |
UNITED STATES SECURITIES AND EXCHANGE COMMISSION
Washington, D.C. 20549
FORM 10-K
(Mark One)
| x | Annual Report pursuant to Section 13 or 15(d) of the Securities Exchange Act of 1934 |
For the fiscal year ended December 31, 2015
| ¨ | Transition Report pursuant to Section 13 or 15(d) of the Securities Exchange Act of 1934 |
For the transition period from _______to_______
Commission File Number 0-53713
OTTER TAIL CORPORATION
(Exact name of registrant as specified in its charter)
| MINNESOTA | 27-0383995 |
| (State or other jurisdiction of incorporation or organization) | (I.R.S. Employer Identification No.) |
| 215 SOUTH CASCADE STREET, BOX 496, FERGUS FALLS, MINNESOTA | 56538-0496 |
| (Address of principal executive offices) | (Zip Code) |
Registrant's telephone number, including area code: 866-410-8780
Securities registered pursuant to Section 12(b) of the Act:
| Title of each class | Name of each exchange on which registered | |||
| COMMON SHARES, par value $5.00 per share | The NASDAQ Stock Market LLC | |||
Securities registered pursuant to Section 12(g) of the Act: None
Indicate by check mark if the registrant is a well-known seasoned issuer, as defined in Rule 405 of the Securities Act. (Yes x No ¨)
Indicate by check mark if the registrant is not required to file reports pursuant to Section 13 or Section 15(d) of the Act. (Yes ¨ No x)
Indicate by check mark whether the registrant (1) has filed all reports required to be filed by Section 13 or 15(d) of the Securities Exchange Act of 1934 during the preceding 12 months (or for such shorter period that the registrant was required to file such reports), and (2) has been subject to such filing requirements for the past 90 days. (Yes x No ¨)
Indicate by check mark whether the registrant has submitted electronically and posted on its corporate Web site, if any, every Interactive Data File required to be submitted and posted pursuant to Rule 405 of Regulation S-T during the preceding 12 months (or for such shorter period that the registrant was required to submit and post such files). (Yes x No ¨)
Indicate by check mark if disclosure of delinquent filers pursuant to Item 405 of Regulation S-K is not contained herein and will not be contained, to the best of the registrant's knowledge, in definitive proxy or information statements incorporated by reference in Part III of this Form 10-K or any amendment to this Form 10-K. x
Indicate by check mark whether the registrant is a large accelerated filer, an accelerated filer, a non-accelerated filer or a smaller reporting company. See the definitions of “large accelerated filer,” “accelerated filer” and “smaller reporting company” in Rule 12b-2 of the Exchange Act. (Check one):
| Large Accelerated Filer x | Accelerated Filer ¨ |
| Non-Accelerated Filer ¨ | Smaller Reporting Company ¨ |
| (Do not check if a smaller reporting company) |
Indicate by check mark whether the registrant is a shell company (as defined in Rule 12b-2 of the Exchange Act). (Yes ¨ No x )
The aggregate market value of common stock held by non-affiliates, computed by reference to the last sales price on June 30, 2015 was $962,858,128.
Indicate the number of shares outstanding of each of the registrant's classes of common stock, as of the latest practicable date: 38,002,593 Common Shares ($5 par value) as of February 12, 2016.
Documents Incorporated by Reference:
Proxy Statement for the 2016 Annual Meeting-Portions incorporated by reference into Part III
OTTER TAIL CORPORATION
FORM 10-K TABLE OF CONTENTS
| 1 |
The following abbreviations or acronyms are used in the text. References in this report to “the Company”, “we”, “us” and “our” are to Otter Tail Corporation.
| AFUDC | Allowance for Funds Used During Construction |
| AQCS | Air Quality Control System |
| ARO | Accumulated Asset Retirement Obligation |
| ASC | Accounting Standards Codification |
| ASC 606 | ASC Topic 606 – Revenue from Contracts with Customers |
| ASC 718 | ASC Topic 718 – Compensation—Stock Compensation |
| ASC 740 | ASC Topic 740 – Income Taxes |
| ASC 815 | ASC Topic 815 – Derivatives and Hedging |
| ASC 820 | ASC Topic 820 – Fair Value Measurement |
| ASC 980 | ASC Topic 980 – Regulated Operations |
| ASM | Ancillary Services Market |
| ASU | Accounting Standards Update |
| Aviva | Aviva Sports, Inc. |
| BACT | Best-Available Control Technology |
| BART | Best-Available Retrofit Technology |
| Brookings Project | Brookings-Southeast Twin Cities 345 kV Project |
| BTD | BTD Manufacturing, Inc. |
| BTD – Illinois | Miller Welding & Iron Works, Inc. |
| CAA | Clean Air Act |
| CapX2020 | Capacity Expansion 2020 |
| CCMC | Coyote Creek Mining Company, L.L.C. |
| CCR | Coal Combustion Residuals |
| CIP | Conservation Improvement Program |
| CO2 | carbon dioxide |
| CON | Certificate of Need |
| CPEC | Central Power Electric Cooperative |
| CPP | Clean Power Plan |
| CSAPR | Cross-State Air Pollution Rule |
| CWIP | Construction Work in Progress |
| DENR | Department of Environment and Natural Resources |
| DMS | DMS Health Technologies, Inc. |
| DRR | Data Requirement Rule |
| ECR | Environmental Cost Recovery |
| EEI | Edison Electric Institute |
| EEP | Energy Efficiency Plan |
| EPA | Environmental Protection Agency |
| ERCOT | Electric Reliability Council of Texas |
| ESSRP | Executive Survivor and Supplemental Retirement Plan |
| Fargo Project | Fargo-Monticello 345 kV Project |
| FASB | Financial Accounting Standards Board |
| FCA | Fuel Clause Adjustment |
| FERC | Federal Energy Regulatory Commission |
| Foley | Foley Company |
| GAAP | Generally Accepted Accounting Principles in the United States |
| GHG | Greenhouse Gas |
| Impulse | Impulse Manufacturing, Inc. |
| IRP | Integrated Resource Plan |
| JPMorgan | JPMorgan Chase Bank, N.A. |
| JPMS | J.P. Morgan Securities LLC |
| kV | kiloVolt |
| kW | kiloWatt |
| kwh | kilowatt-hour |
| LSA | Lignite Sales Agreement |
| MAPP | Mid-Continent Area Power Pool |
| MATS | Mercury and Air Toxics Standards |
| 2 |
| MDU | MDU Resources Group, Inc. |
| MISO | Midcontinent Independent System Operator, Inc. |
| MISO Tariff | MISO Open Access Transmission, Energy and Operating Reserve Markets Tariff |
| MNCIP | Minnesota Conservation Improvement Program |
| MNDOC | Minnesota Department of Commerce |
| MNRRA | Minnesota Renewable Resource Adjustment |
| MPCA | Minnesota Pollution Control Agency |
| MPUC | Minnesota Public Utilities Commission |
| MRO | Midwest Reliability Organization |
| MVP | Multi-Value Project |
| MW | megawatts |
| NAAQS | National Ambient Air Quality Standards |
| NERC | North American Electric Reliability Corporation |
| NAEMA | North American Energy Marketers Association |
| NDDOH | North Dakota Department of Health |
| NDPSC | North Dakota Public Service Commission |
| NDRRA | North Dakota Renewable Resource Adjustment |
| NICF | Notice of Intent to Construct Facilities |
| NPDES | National Pollutant Discharge Elimination System |
| Northern Pipe | Northern Pipe Products, Inc. |
| NOx | Nitrogen Oxide |
| NSP MN | Northern States Power - Minnesota |
| NSPS | New Source Performance Standards |
| NYMEX | New York Mercantile Exchange |
| OTP | Otter Tail Power Company |
| PACE | Partnership in Assisting Community Expansion |
| PCOR | Plains CO2 Reduction Partnership |
| PEM | Power and Energy Market |
| PPB | Parts Per Billion |
| PS | Polystyrene |
| PSD | Prevention of Significant Deterioration |
| PTC | Production Tax Credit |
| PVC | Polyvinyl Chloride |
| RBOB | Reformulated Blendstock for Oxygenate Blending |
| RCRA | Resource Conservation and Recovery Act |
| REC | Renewable Energy Credits |
| ROE | Return on Equity |
| RRA | Renewable Resource Adjustment |
| RTO Adder | Incentive of additional 50-basis points for Regional Transmission Organization participation |
| SDPUC | South Dakota Public Utilities Commission |
| SEC | Securities and Exchange Commission |
| SF6 | Sulfur Hexaflouride |
| SIP | State Implementation Plan |
| SO2 | Sulfur Dioxide |
| SPP | Southwest Power Pool |
| Standex | Standex International Corporation |
| T.O. Plastics | T.O. Plastics, Inc. |
| TCR | Transmission Cost Recovery |
| Varistar | Varistar Corporation |
| VIC | Voluntary Investigation and Cleanup |
| VIE | Variable Interest Entity |
| Vinyltech | Vinyltech Corporation |
| Wylie | E.W. Wylie Corporation |
| 3 |
| Item 1. | BUSINESS |
(a) General Development of Business
Otter Tail Power Company was incorporated in 1907 under the laws of the State of Minnesota. In 2001, the name was changed to “Otter Tail Corporation” to more accurately represent the broader scope of consolidated operations and the name Otter Tail Power Company (OTP) was retained for use by the electric utility. On July 1, 2009, Otter Tail Corporation completed a holding company reorganization whereby OTP, which had previously been operated as a division of Otter Tail Corporation, became a wholly owned subsidiary of the new parent holding company named Otter Tail Corporation (the Company). The new parent holding company was incorporated in June 2009 under the laws of the State of Minnesota in connection with the holding company reorganization. The Company’s executive offices are located at 215 South Cascade Street, P.O. Box 496, Fergus Falls, Minnesota 56538-0496 and 4334 18th Avenue SW, Suite 200, P.O. Box 9156, Fargo, North Dakota 58106-9156. The Company’s telephone number is (866) 410-8780.
The Company makes available free of charge at its website (www.ottertail.com) its annual reports on Form 10-K, quarterly reports on Form 10-Q, current reports on Form 8-K, Forms 3, 4 and 5 filed on behalf of directors and executive officers and any amendments to these reports filed or furnished pursuant to Section 13(a) or 15(d) of the Securities Exchange Act of 1934, as soon as reasonably practicable after such material is electronically filed with or furnished to the Securities and Exchange Commission (SEC). Information on the Company’s website is not deemed to be incorporated by reference into this Annual Report on Form 10-K.
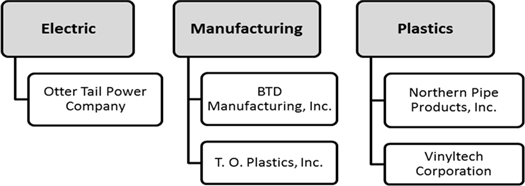
Otter Tail Corporation and its subsidiaries conduct business primarily in the United States. The Company had approximately 2,005 full-time employees in its continuing operations at December 31, 2015. The Company’s businesses have been classified in three segments to be consistent with its business strategy and the reporting and review process used by the Company’s chief operating decision maker. The three segments are Electric, Manufacturing and Plastics.
Over the last five years, the Company sold several businesses in execution of an announced strategy to realign its business portfolio to reduce its risk profile and dedicate a greater portion of its resources toward electric utility operations. In 2011, the Company sold Idaho Pacific Holdings, Inc., its Food Ingredient Processing business, and E.W. Wylie Corporation, its trucking company, which was included in its former Wind Energy segment. In January 2012, the Company sold the assets of Aviva Sports, Inc., a recreational equipment manufacturer. In February 2012, the Company sold DMS Health Technologies, Inc., its former Health Services segment business. In November 2012, the Company completed the sale of the assets of the Company’s wind tower company, and exited the wind tower manufacturing business. On February 8, 2013 the Company sold substantially all the assets of its dock and boatlift company. On February 28, 2015 the Company sold the assets of AEV, Inc., its former energy and electrical construction contractor headquartered in Moorhead, Minnesota, and on April 30, 2015 the Company sold Foley Company, its former water, wastewater, power and industrial construction contractor headquartered in Kansas City, Missouri. With the sale of these two companies in 2015 the Company eliminated its Construction segment.
On September 1, 2015 the Company acquired the assets of Impulse Manufacturing Inc. (Impulse) of Dawsonville, Georgia for $30.8 million in cash, subject to a post-closing adjustment. Impulse, a full-service metal fabricator located 30 miles north of Atlanta, Georgia, recorded revenues of $27 million in 2014. Impulse offers a wide range of metal fabrication services ranging from simple laser cutting services and high volume stamping to complex weldments and assemblies for metal fabrication buyers and original equipment manufacturers. The newly acquired business will operate under the name BTD-Georgia.
The chart below indicates the companies included in each of the Company’s reporting segments.
| 4 |
| · | Electric includes the production, transmission, distribution and sale of electric energy in Minnesota, North Dakota and South Dakota by OTP. In addition, OTP is a participant in the Midcontinent Independent System Operator, Inc. (MISO) markets. OTP’s operations have been the Company’s primary business since 1907. |
| · | Manufacturing consists of businesses in the following manufacturing activities: contract machining, metal parts stamping, fabrication and painting, and production of material and handling trays and horticultural containers. These businesses have manufacturing facilities in Georgia, Illinois and Minnesota and sell products primarily in the United States. |
| · | Plastics consists of businesses producing polyvinyl chloride (PVC) pipe at plants in North Dakota and Arizona. The PVC pipe is sold primarily in the upper Midwest and Southwest regions of the United States. |
OTP is a wholly owned subsidiary of the Company. The Company’s manufacturing and plastic pipe businesses are owned by its wholly owned subsidiary, Varistar Corporation (Varistar). The Company’s corporate operating costs include items such as corporate staff and overhead costs, the results of the Company’s captive insurance company and other items excluded from the measurement of operating segment performance that are not allocated to its subsidiary companies. Corporate assets consist primarily of cash, prepaid expenses, investments and fixed assets. Corporate is not an operating segment. Rather, it is added to operating segment totals to reconcile to totals on the Company’s consolidated financial statements.
The Company has lowered its overall risk by investing in rate base growth opportunities in its Electric segment and divesting certain nonelectric operating companies that no longer fit the Company’s portfolio criteria. This strategy has provided a more predictable earnings stream, improved the Company’s credit quality and preserved its ability to fund the dividend. The Company’s goal is to deliver annual growth in earnings per share between four to seven percent over the next several years, using 2013 non-GAAP earnings as the base for measurement. The growth is expected to come from the substantial increase in the Company’s regulated utility rate base and from planned increased earnings from existing capacity already in place at the Company’s manufacturing and plastic pipe businesses, as well as the 2015 acquisition of BTD-Georgia and the facilities expansion and addition of paint services at BTD’s Minnesota facilities, which will be completed in 2016. The Company will continue to review its business portfolio to see where additional opportunities exist to improve its risk profile, improve credit metrics and generate additional sources of cash to support the growth opportunities in its electric utility. The Company will also evaluate opportunities to allocate capital to potential acquisitions in its Manufacturing segment. Over time, the Company expects the electric utility business will provide approximately 75% to 85% of its overall earnings. The Company expects its manufacturing and plastic pipe businesses will provide 15% to 25% of its earnings, and will continue to be a fundamental part of its strategy. The actual mix of earnings from continuing operations in 2015 was 83% from the electric utility and 17% from the manufacturing and plastic pipe businesses, including unallocated corporate costs.
In evaluating its portfolio of operating companies, the Company looks for the following characteristics:
| · | A threshold level of net earnings and a return on invested capital in excess of the Company’s weighted average cost of capital within three years of the acquisition. |
| · | Is manufacturing centric with a sustainable competitive advantage. |
| · | An ability to quickly adapt to changing economic cycles. |
| · | A strong management team committed to operational excellence. |
For a discussion of the Company's results of operations, see "Management's Discussion and Analysis of Financial Condition and Results of Operations," on pages 36 through 59 of this Annual Report on Form 10-K.
(b) Financial Information about Industry Segments
The Company is engaged in businesses classified into three segments: Electric, Manufacturing and Plastics. Financial information about the Company's segments and geographic areas is included in note 2 of "Notes to Consolidated Financial Statements" on pages 76 through 79 of this Annual Report on Form 10-K.
| 5 |
(c) Narrative Description of Business
ELECTRIC
General
Electric includes OTP which is headquartered in Fergus Falls, Minnesota, and provides electricity to more than 130,000 customers in a service area encompassing 70,000 square miles of western Minnesota, eastern North Dakota and northeastern South Dakota. The Company derived 52%, 51% and 50% of its consolidated operating revenues and 80%, 76% and 66% of its consolidated operating income from the Electric segment for the years ended December 31, 2015, 2014 and 2013, respectively.
The breakdown of retail electric revenues by state is as follows:
| State | 2015 | 2014 | ||||||
| Minnesota | 50.4 | % | 49.5 | % | ||||
| North Dakota | 40.6 | 41.6 | ||||||
| South Dakota | 9.0 | 8.9 | ||||||
| Total | 100.0 | % | 100.0 | % | ||||
The territory served by OTP is predominantly agricultural. The aggregate population of OTP’s retail electric service area is approximately 230,000. In this service area of 421 communities and adjacent rural areas and farms, approximately 126,000 people live in communities having a population of more than 1,000, according to the 2010 census. The only communities served which have a population in excess of 10,000 are Jamestown, North Dakota (15,427); Bemidji, Minnesota (13,431); and Fergus Falls, Minnesota (13,138). As of December 31, 2015 OTP served 131,149 customers. Although there are relatively few large customers, sales to commercial and industrial customers are significant.
The following table provides a breakdown of electric revenues by customer category. All other sources include gross wholesale sales from utility generation, net revenue from energy trading activity and sales to municipalities.
| Customer Category | 2015 | 2014 | ||||||
| Commercial | 35.4 | % | 37.3 | % | ||||
| Residential | 32.1 | 32.3 | ||||||
| Industrial | 29.9 | 25.3 | ||||||
| All Other Sources | 2.6 | 5.1 | ||||||
| Total | 100.0 | % | 100.0 | % | ||||
Wholesale electric energy kilowatt-hour (kwh) sales were 2.5% of total kwh sales for 2015 and 5.8% for 2014. Wholesale electric energy kwh sales decreased by 61.1% between the years while revenue per kwh sold decreased by 220.9%. Activity in the short-term energy market is subject to change based on a number of factors and it is difficult to predict the quantity of wholesale power sales or prices for wholesale power in the future.
Capacity and Demand
As of December 31, 2015 OTP’s owned net-plant dependable kilowatt (kW) capacity was:
| Baseload Plants | |||||
| Big Stone Plant | 254,800 | kW | |||
| Coyote Station | 151,000 | ||||
| Hoot Lake Plant | 140,500 | ||||
| Total Baseload Net Plant | 546,300 | kW | |||
| Combustion Turbine and Small Diesel Units | 108,500 | kW | |||
| Hydroelectric Facilities | 2,500 | kW | |||
| Owned Wind Facilities (rated at nameplate) | |||||
| Luverne Wind Farm (33 turbines) | 49,500 | kW | |||
| Ashtabula Wind Center (32 turbines) | 48,000 | ||||
| Langdon Wind Center (27 turbines) | 40,500 | ||||
| Total Owned Wind Facilities | 138,000 | kW | |||
The baseload net plant capacity for Big Stone Plant and Coyote Station constitutes OTP’s ownership percentages of 53.9% and 35%, respectively. OTP owns 100% of the Hoot Lake Plant. During 2015, about 47% of OTP’s retail kwh sales were supplied from OTP generating plants with the balance supplied by purchased power.
| 6 |
In addition to the owned facilities described above, OTP had the following purchased power agreements in place on December 31, 2015:
| Purchased Wind Power Agreements (rated at nameplate and greater than 2,000 kW) | |||||
| Ashtabula Wind III | 62,400 | kW | |||
| Edgeley | 21,000 | ||||
| Langdon | 19,500 | ||||
| Total Purchased Wind | 102,900 | kW | |||
| Purchase of Capacity (in excess of 1 year and 500 kW) | |||||
| Purchase: Great River Energy1 | 100,000 | kW | |||
1100,000 kW through May 2017, 25,000 kW June 2017 – May 2019, and 50,000 kW June 2019 – May 2021.
OTP has a direct control load management system which provides some flexibility to OTP to effect reductions of peak load. OTP also offers rates to customers which encourage off-peak usage.
OTP’s capacity requirement is based on MISO Module E requirements. OTP is required to have sufficient Zonal Resource Credits to meet its monthly weather normalized forecast demand, plus a reserve obligation. OTP met its MISO obligation for the 2015-2016 MISO planning year. OTP generating capacity combined with additional capacity under purchased power agreements (as described above) and load management control capabilities is expected to meet 2016 system demand and MISO reserve requirements.
Fuel Supply
Coal is the principal fuel burned at the Big Stone, Coyote and Hoot Lake generating plants. Coyote Station, a mine-mouth facility, burns North Dakota lignite coal. Hoot Lake Plant and Big Stone Plant burn western subbituminous coal.
The following table shows the sources of energy used to generate OTP’s net output of electricity for 2015 and 2014:
| 2015 | 2014 | |||||||||||||||
| Sources | Net kwhs Generated (Thousands) | % of Total kwhs Generated | Net kwhs Generated (Thousands) | % of Total kwhs Generated | ||||||||||||
| Subbituminous Coal | 1,132,335 | 49.1 | % | 2,011,002 | 57.3 | % | ||||||||||
| Lignite Coal | 662,450 | 28.7 | 933,036 | 26.6 | ||||||||||||
| Wind and Hydro | 493,276 | 21.4 | 523,280 | 14.9 | ||||||||||||
| Natural Gas and Oil | 17,907 | 0.8 | 44,105 | 1.2 | ||||||||||||
| Total | 2,305,968 | 100.0 | % | 3,511,423 | 100.0 | % | ||||||||||
OTP has the following primary coal supply agreements:
| Plant | Coal Supplier | Type of Coal | Expiration Date |
| Big Stone Plant | Alpha Coal Sales Company, LLC | Wyoming subbituminous | December 31, 2017 |
| Big Stone Plant | Peabody COALSALES, LLC | Wyoming subbituminous | December 31, 2017 |
| Coyote Station | Dakota Westmoreland Corporation | North Dakota lignite | May 4, 2016 |
| Coyote Station | Coyote Creek Mining Company, L.L.C. | North Dakota lignite | December 31, 2040 |
| Hoot Lake Plant | Cloud Peak Energy Resources LLC | Montana subbituminous | December 31, 2023 |
OTP’s anticipated coal needs for Big Stone are secured under contract through December 2017.
The contract with Dakota Westmoreland Corporation expires on May 4, 2016. In October 2012, the Coyote Station owners, including OTP, entered into a lignite sales agreement (LSA) with Coyote Creek Mining Company, L.L.C. (CCMC), a subsidiary of The North American Coal Corporation, for the purchase of coal to meet the coal supply requirements of Coyote Station for the period beginning in May 2016 and ending in December 2040. The price per ton to be paid by the Coyote Station owners under the LSA will reflect the cost of production, along with an agreed profit and capital charge. The LSA provides for the Coyote Station owners to purchase the membership interests in CCMC in the event of certain early termination events and also at the end of the term of the LSA.
OTP’s coal supply requirements for Hoot Lake Plant are secured under contract through December 2023.
| 7 |
It is OTP’s practice to maintain a minimum 30-day inventory (at full output) of coal at the Big Stone Plant, a 17-day inventory at Coyote Station and 32 days of inventory at Hoot Lake Plant.
Railroad transportation services to the Big Stone Plant and Hoot Lake Plant are provided under a common carrier rate by the BNSF Railway. The common carrier rate is subject to a mileage-based methodology to assess a fuel surcharge. The basis for the fuel surcharge is the U.S. average price of retail on-highway diesel fuel. No coal transportation agreement is needed for Coyote Station due to its location next to a coal mine.
The average cost of fuel consumed (including handling charges to the plant sites) per million British Thermal Units for the years 2015, 2014, and 2013 was $2.281, $2.036, and $2.031, respectively.
General Regulation
OTP is subject to regulation of rates and other matters in each of the three states in which it operates and by the federal government for certain interstate operations.
A breakdown of electric rate regulation by each jurisdiction is as follows:
| 2015 | 2014 | |||||||||||||||||
| Rates | Regulation | % of Electric Revenues | % of kwh Sales | % of Electric Revenues | % of kwh Sales | |||||||||||||
| MN Retail Sales | MN Public Utilities Commission | 47.2 | % | 52.0 | % | 44.9 | % | 46.8 | % | |||||||||
| ND Retail Sales | ND Public Service Commission | 38.0 | 38.7 | 37.8 | 38.8 | |||||||||||||
| SD Retail Sales | SD Public Utilities Commission | 8.5 | 9.3 | 8.1 | 8.6 | |||||||||||||
| Transmission & Wholesale | Federal Energy Regulatory Commission | 6.3 | -- | 9.2 | 5.8 | |||||||||||||
| Total | 100.0 | % | 100.0 | % | 100.0 | % | 100.0 | % | ||||||||||
OTP operates under approved retail electric tariffs in all three states it serves. OTP has an obligation to serve any customer requesting service within its assigned service territory. The pattern of electric usage can vary dramatically during a 24-hour period and from season to season. OTP’s tariffs are designed to recover the costs of providing electric service. To the extent that peak usage can be reduced or shifted to periods of lower usage, the cost to serve all customers is reduced. In order to shift usage from peak times, OTP has approved tariffs in all three states for residential demand control, general service time of use and time of day, real-time pricing, and controlled and interruptible service. Each of these specialized rates is designed to improve efficient use of OTP resources, while giving customers more control over their electric bill. OTP also has approved tariffs in its three service territories which allow qualifying customers to release and sell energy back to OTP when wholesale energy prices make such transactions desirable.
With a few minor exceptions, OTP’s electric retail rate schedules provide for adjustments in rates based on the cost of fuel delivered to OTP’s generating plants, as well as for adjustments based on the cost of electric energy purchased by OTP. OTP also credits certain margins from wholesale sales to the fuel and purchased power adjustment. The adjustments for fuel and purchased power costs are presently based on a two month moving average in Minnesota and by the Federal Energy Regulatory Commission (FERC), a three month moving average in South Dakota and a four month moving average in North Dakota. These adjustments are applied to the next billing period after becoming applicable. These adjustments also include an over or under recovery mechanism, which is calculated on an annual basis in Minnesota and on a monthly basis in North Dakota and South Dakota.
Below are descriptions of OTP’s major capital expenditure projects that have had, or will have, a significant impact on OTP’s revenue requirements, rates and alternative revenue recovery mechanisms, followed by summaries of the material regulations of each jurisdiction applicable to OTP’s electric operations, as well as any specific electric rate proceedings during the last three years with the Minnesota Public Utilities Commission (MPUC), the North Dakota Public Service Commission (NDPSC), the South Dakota Public Utilities Commission (SDPUC) and the FERC. The Company’s manufacturing and plastic pipe businesses are not subject to direct regulation by any of these agencies.
| 8 |
Major Capital Expenditure Projects
The Big Stone South – Brookings MVP and CapX2020 Project—This 345 kiloVolt (kV) transmission line, currently under construction, will extend approximately 70 miles between a proposed substation near Big Stone City, South Dakota and the Brookings County Substation near Brookings, South Dakota. OTP and Northern States Power – MN (NSP MN), a subsidiary of Xcel Energy Inc., jointly developed this project. MISO approved this project as a Multi-Value Project (MVP) under the MISO Open Access Transmission, Energy and Operating Reserve Markets Tariff (MISO Tariff) in December 2011. MVPs are designed to enable the region to comply with energy policy mandates and to address reliability and economic issues affecting multiple areas within the MISO region. The cost allocation is designed to ensure the costs of transmission projects with regional benefits are properly assigned to those who benefit. A Notice of Intent to Construct Facilities (NICF) was filed with the SDPUC on February 29, 2012. The SDPUC approved the certification for the northern portion of the route on April 9, 2013 and granted approval of a route permit for the southern portion of the line on February 18, 2014. On August 1, 2014 OTP and NSP MN entered into agreements to construct the project. This line is expected to be in service in fall 2017. Construction began on this line in the third quarter of 2015. OTP’s total capital investment in this project is expected to be approximately $97 million, which includes certain assets that will be owned 100% by OTP.
The Big Stone South – Ellendale MVP—This is a proposed 345 kV transmission line that will extend 160 to 170 miles between a proposed substation near Big Stone City, South Dakota and a proposed substation near Ellendale, North Dakota. OTP is jointly developing this project with Montana-Dakota Utilities Co., a division of MDU Resources Group, Inc. (MDU). MISO approved this project as an MVP under the MISO Tariff in December 2011. OTP and MDU jointly filed an NICF with the SDPUC in March of 2012. On August 25, 2013 the NDPSC granted Certificates of Public Convenience and Necessity to OTP and MDU for ten miles of the proposed line to be built in North Dakota. On July 10, 2014 the NDPSC approved a Certificate of Corridor Compatibility and a route permit for the North Dakota section of the proposed line. On August 22, 2014 the SDPUC issued an order approving the route permit for the South Dakota section of the proposed line. A route permit amendment to shift a portion of the route in North Dakota was approved by the NDPSC on December 16, 2015. On June 12, 2015 OTP and MDU entered into agreements to construct the project. This project is expected to be completed in 2019. OTP’s total capital investment in this project is expected to be approximately $153 million, which includes certain assets that will be owned 100% by OTP.
Capacity Expansion 2020 (CapX2020) Transmission Line Projects—CapX2020 is a joint initiative of eleven investor-owned, cooperative, and municipal utilities in Minnesota and the surrounding region to upgrade and expand the electric transmission grid to ensure continued reliable and affordable service.
Fargo–Monticello 345 kV CapX2020 Project (the Fargo Project)—OTP has invested approximately $81 million and has a 14.2% ownership interest in the jointly-owned assets of this 240-mile transmission line, and owns 100% of certain assets of the project. The final phase of this project was energized on April 2, 2015.
Brookings–Southeast Twin Cities 345 kV CapX2020 Project (the Brookings Project)—OTP has invested approximately $26 million and has a 4.8% ownership interest in this 250-mile transmission line. The MISO granted unconditional approval of the Brookings Project as an MVP under the MISO Tariff in December 2011. The final segments of this line were energized on March 26, 2015.
Recovery of OTP’s major transmission investments is through the MISO Tariff (several as MVPs) and, currently, Minnesota, North Dakota and South Dakota Transmission Cost Recovery (TCR) Riders.
Big Stone Plant Air Quality Control System (AQCS)—The South Dakota Department of Environmental and Natural Resources determined the Big Stone Plant is subject to Best-Available Retrofit Technology (BART) requirements of the Clean Air Act (CAA), based on air dispersion modeling indicating that Big Stone Plant’s emissions reasonably contribute to visibility impairment in national parks and wilderness areas in Minnesota, North Dakota, South Dakota and Michigan. OTP completed construction and testing of the BART-compliant AQCS at Big Stone Plant in the fourth quarter of 2015 and placed the AQCS into commercial operation on December 29, 2015. The capitalized cost of the project as of December 31, 2015 was approximately $367 million (OTP’s 53.9% share was approximately $198 million).
Big Stone II Project—On June 30, 2005 OTP and a coalition of six other electric providers entered into several agreements for the development of a second electric generating unit, named Big Stone II, at the site of the existing Big Stone Plant near Milbank, South Dakota. On September 11, 2009 OTP announced its withdrawal—both as a participating utility and as the project’s lead developer—from Big Stone II. On November 2, 2009, the remaining Big Stone II participants announced the cancellation of the Big Stone II project. Recovery in Minnesota, North Dakota and South Dakota of amounts OTP had invested in the Big Stone II project at the time of its withdrawal is discussed below under the respective jurisdictional sections of this report.
| 9 |
Minnesota
Under the Minnesota Public Utilities Act, OTP is subject to the jurisdiction of the MPUC with respect to rates, issuance of securities, depreciation rates, public utility services, construction of major utility facilities, establishment of exclusive assigned service areas, contracts and arrangements with subsidiaries and other affiliated interests, and other matters. The MPUC has the authority to assess the need for large energy facilities and to issue or deny certificates of need, after public hearings, within one year of an application to construct such a facility.
Pursuant to the Minnesota Power Plant Siting Act, the MPUC has authority to select or designate sites in Minnesota for new electric power generating plants (50,000 kW or more) and routes for transmission lines (100 kV or more) in an orderly manner compatible with environmental preservation and the efficient use of resources, and to certify such sites and routes as to environmental compatibility after an environmental impact study has been conducted by the Minnesota Department of Commerce (MNDOC) and the Office of Administrative Hearings has conducted contested case hearings.
The Minnesota Division of Energy Resources, part of the MNDOC, is responsible for investigating all matters subject to the jurisdiction of the MNDOC or the MPUC, and for the enforcement of MPUC orders. Among other things, the MNDOC is authorized to collect and analyze data on energy including the consumption of energy, develop recommendations as to energy policies for the governor and the legislature of Minnesota and evaluate policies governing the establishment of rates and prices for energy as related to energy conservation. The MNDOC also has the power, in the event of energy shortage or for a long-term basis, to prepare and adopt regulations to conserve and allocate energy.
2010 General Rate Case—OTP’s most recent general rate increase in Minnesota of approximately $5.0 million, or 1.6%, was granted by the MPUC in an order issued on April 25, 2011 and effective October 1, 2011. Pursuant to the order, OTP’s allowed rate of return on rate base was set at 8.61%, and its allowed rate of return on equity was set at 10.74%.
2016 General Rate Case
On February 16, 2016 OTP filed a request with the MPUC for an increase in revenue recoverable under general rates in Minnesota. In its filing, OTP requested an increase in annual revenue of approximately $19.3 million, or 9.8%, based on an allowed rate of return on rate base of 8.07% and an allowed rate of return on equity of 10.4%, based on an equity ratio of 52.5% of total capital. Through this rate case proceeding, OTP is proposing to recover, in base rates, revenue currently subject to recovery under Minnesota TCR and Environmental Cost Recovery (ECR) riders.
Integrated Resource Plan (IRP)—Minnesota law requires utilities to submit to the MPUC for approval a 15-year advance IRP. A resource plan is a set of resource options a utility could use to meet the service needs of its customers over a forecast period, including an explanation of the utility’s supply and demand circumstances, and the extent to which each resource option would be used to meet those service needs. The MPUC’s findings of fact and conclusions regarding resource plans shall be considered prima facie evidence, subject to rebuttal, in Certificate of Need (CON) hearings, rate reviews and other proceedings. Typically, the filings are submitted every two years.
In the MPUC order approving the 2011-2025 IRP in February 2012, OTP was required to submit a base-load diversification study specifically focused on evaluating retirement and repower options for the Hoot Lake Plant. In an order dated March 25, 2013 the MPUC approved OTP’s recommendations that Hoot Lake Plant add pollution-control equipment at a cost of approximately $10.0 million to comply with United States Environmental Protection Agency’s (EPA) mercury and air toxics standards by 2015 and discontinue burning coal by May 31, 2021.
On December 2, 2013 OTP filed its 2014-2028 IRP with the MPUC. Copies of the 2014-2028 IRP were provided to both the NDPSC and SDPUC. On December 5, 2014 the MPUC issued an order approving OTP’s 2014-2028 IRP filing, which included the following items:
| · | Authorization to add up to 300 megawatts (MW) of wind between 2017 and 2021 if it is cost effective and does not negatively impact OTP’s electric system operation. |
| · | Construction of solar generation sufficient to comply with the Minnesota Solar Energy Standard by 2020. |
| · | Confirmation of a 1.5% energy savings goal, as filed in OTP’s triennial Minnesota Conservation Improvement Program (MNCIP) plan. |
| · | Authorization to obtain 200 MW, subject to need, of intermediate natural gas generation in the 2019-2021 timeframe. |
On June 29, 2015 OTP requested the MPUC grant a six-month extension to June 1, 2016 for filing its 2016-2030 IRP to allow OTP time to model compliance with final rules on proposed standards of performance for carbon dioxide (CO2) emissions from fossil fuel-fired power plants published by the EPA on October 23, 2015 and to incorporate planned wind and natural gas-fired generation additions. On September 14, 2015 the MPUC granted OTP’s request for a six-month extension.
| 10 |
Renewable Energy Standards, Conservation, Renewable Resource Riders—Minnesota law favors conservation over the addition of new resources. In addition, Minnesota law requires the use of renewable resources where new supplies are needed, unless the utility proves that a renewable energy facility is not in the public interest. An existing environmental externality law requires the MPUC, to the extent practicable, to quantify the environmental costs associated with each method of electricity generation, and to use such monetized values in evaluating generation resources. The MPUC must disallow any nonrenewable rate base additions (whether within or outside of the state) or any related rate recovery, and may not approve any nonrenewable energy facility in an IRP, unless the utility proves that a renewable energy facility is not in the public interest. The state has prioritized the acceptability of new generation with wind and solar ranked first and coal and nuclear ranked fifth, the lowest ranking. The MPUC’s current estimate of the range of costs of future CO2 regulation to be used in modeling analyses for resource plans is $9 to $34/ton of CO2 commencing in 2019. The MPUC is required to annually update these estimates.
Minnesota has a renewable energy standard which requires OTP to generate or procure sufficient renewable generation such that the following percentages of total retail electric sales to Minnesota customers come from qualifying renewable sources: 17% by 2016; 20% by 2020 and 25% by 2025. In addition, Minnesota law requires 1.5% of total Minnesota electric sales by public utilities to be supplied by solar energy by 2020. Under certain circumstances and after consideration of costs and reliability issues, the MPUC may modify or delay implementation of the standards. OTP has acquired sufficient renewable resources to currently comply with Minnesota renewable energy standards. OTP is evaluating potential options for maintaining compliance and meeting the solar energy standard. OTP’s projected capital expenditures include $56 million for a solar project in 2019. OTP’s compliance with the Minnesota renewable energy standard will be measured through the Midwest Renewable Energy Tracking System.
Under the Next Generation Energy Act of 2007, an automatic adjustment mechanism was established to allow Minnesota electric utilities to recover investments and costs incurred to satisfy the requirements of the renewable energy standard. The MPUC is authorized to approve a rate schedule rider to enable utilities to recover the costs of qualifying renewable energy projects that supply renewable energy to Minnesota customers. Cost recovery for qualifying renewable energy projects can be authorized outside of a rate case proceeding, provided that such renewable projects have received previous MPUC approval. Renewable resource costs eligible for recovery may include return on investment, depreciation, operation and maintenance costs, taxes, renewable energy delivery costs and other related expenses.
The costs for three major wind farms previously approved by the MPUC for recovery through OTP’s Minnesota Renewable Resource Adjustment (MNRRA) were moved to base rates as of October 1, 2011 under the MPUC’s April 25, 2011 general rate case order with the exception of the remaining balance of the MNRRA regulatory asset. OTP continued to collect the remaining regulatory asset balance through April 30, 2013, when the balance was near zero. On April 4, 2013 the MPUC authorized that any remaining unrecovered balance be retained as a regulatory asset to be recovered in OTP’s next general rate case.
Minnesota Conservation Improvement Programs—Under Minnesota law, every regulated public utility that furnishes electric service must make annual investments and expenditures in energy conservation improvements, or make a contribution to the state's energy and conservation account, in an amount equal to at least 1.5% of its gross operating revenues from service provided in Minnesota.
The MNDOC may require a utility to make investments and expenditures in energy conservation improvements whenever it finds that the improvement will result in energy savings at a total cost to the utility less than the cost to the utility to produce or purchase an equivalent amount of a new supply of energy. Such MNDOC orders can be appealed to the MPUC. Investments made pursuant to such orders generally are recoverable costs in rate cases, even though ownership of the improvement may belong to the property owner rather than the utility. OTP recovers conservation related costs not included in base rates under the MNCIP through the use of an annual recovery mechanism approved by the MPUC.
In December 2012, the MPUC ordered a change in the MNCIP cost recovery methodology used by OTP from a percentage of a customer’s bill to an amount per kwh consumed. On January 1, 2013 OTP’s MNCIP surcharge decreased from 3.8% of the customer’s bill to $0.00142 per kwh, which equates to approximately 1.9% of a customer’s bill. On October 10, 2013 the MPUC approved OTP’s 2012 financial incentive request for $2.7 million as well as its request for an updated surcharge rate to be implemented on November 1, 2013. OTP recognized $3.9 million in MNCIP financial incentives in 2013 related to the results of its conservation improvement programs in Minnesota in 2013. On September 26, 2014 the MPUC approved OTP’s 2013 financial incentive request for $4.0 million, an updated surcharge rate to be effective October 1, 2014, as well as a change to the carrying charge to be equal to the short term cost of debt set in OTP’s most recent general rate case.
| 11 |
OTP recognized a financial incentive for 2014 of $3.0 million due, in part, to the MPUC lowering the MNCIP financial incentive from approximately $0.09 per kwh saved for 2013-2015 to $0.07 per kwh saved for 2014-2016. Additionally, OTP saved approximately 2 million less kwhs in 2014 compared with 2013 under conservation improvement programs in Minnesota. On July 9, 2015 the MPUC granted approval of OTP’s 2014 financial incentive of $3.0 million along with an updated surcharge with an effective date of October 1, 2015. Based on results from the 2015 MNCIP program year, OTP has recognized a financial incentive of $4.2 million. The 2015 MNCIP program resulted in approximately a 39% increase in energy savings compared to 2014 program results.
Transmission Cost Recovery Rider—The Minnesota Public Utilities Act (the Act) provides a mechanism for automatic adjustment outside of a general rate proceeding to recover the costs of new transmission facilities that have been previously approved by the MPUC in a CON proceeding, certified by the MPUC as a Minnesota priority transmission project, made to transmit the electricity generated from renewable generation sources ultimately used to provide service to the utility's retail customers, or exempt from the requirement to obtain a Minnesota CON. The MPUC may also authorize cost recovery via such TCR riders for charges incurred by a utility under a federally approved tariff that accrue from other transmission owners’ regionally planned transmission projects that have been determined by the MISO to benefit the utility or integrated transmission system. The Act also authorizes TCR riders to recover the costs of new transmission facilities approved by the regulatory commission of the state in which the new transmission facilities are to be constructed, to the extent approval is required by the laws of that state, and determined by the MISO to benefit the utility or integrated transmission system. Such TCR riders allow a return on investment at the level approved in a utility’s last general rate case. Additionally, following approval of the rate schedule, the MPUC may approve annual rate adjustments filed pursuant to the rate schedule.
MISO regional cost allocation allows OTP to recover some of the costs of its transmission investment from other MISO customers. On March 26, 2012 the MPUC approved an update to OTP’s Minnesota TCR rider along with an all-in method for MISO regional cost allocations in which OTP’s retail customers would be responsible for the entire investment OTP made in transmission facilities that qualify for regional cost allocation under the MISO Tariff, with an offsetting credit for revenues received from other MISO utilities under the MISO Tariff for projects included in the TCR. OTP’s updated Minnesota TCR rider went into effect April 1, 2012.
OTP filed an annual update to its Minnesota TCR rider on February 7, 2013 to include three new projects as well as updated costs associated with existing projects. In a written order issued on March 10, 2014, the MPUC approved OTP’s 2013 TCR rider update but found capitalized internal costs, costs in excess of CON estimates and a carrying charge ineligible for recovery through the TCR rider. These items were removed from OTP’s Minnesota TCR rider effective March 1, 2014. OTP will be allowed to seek recovery of the capitalized internal costs and costs in excess of CON estimates in a future rate case. In response to the MPUC’s approval of OTP’s annual TCR update, OTP submitted a compliance filing in April 2014 reflecting the TCR rider revenue requirements changes relating to the MPUC’s ruling and requesting no rate change be implemented at the time. The MPUC approved OTP’s compliance filing on June 19, 2014. On February 18, 2015 the MPUC approved OTP’s 2014 TCR rider annual update with an effective date of March 1, 2015. OTP filed an annual update to its Minnesota TCR rider on September 30, 2015 requesting revenue recovery of approximately $7.2 million with a proposed effective date of April 1, 2016. A supplemental filing to the update was made on December 21, 2015 to address an issue surrounding the proration of accumulated deferred income taxes.
Environmental Cost Recovery (ECR) Rider—On December 18, 2013 the MPUC granted approval of OTP’s Minnesota ECR rider for recovery of OTP’s Minnesota jurisdictional share of the revenue requirements of its investment in the Big Stone Plant AQCS effective January 1, 2014. The ECR rider recoverable revenue requirements include a current return on the project’s Construction Work in Progress (CWIP) balance at the level approved in OTP’s most recent general rate case. OTP filed its 2014 annual update on July 31, 2014, requesting a $4.1 million annual increase in the rider from $6.1 million to $10.2 million. The MPUC approved OTP’s ECR rider annual update request on November 24, 2014, effective December 1, 2014. Because the effective date was two months behind the anticipated implementation date for the updated rate and a portion of the requested increase had been collected under the initial rate, the approved updated rate is based on a revenue requirement of $9.8 million. OTP filed its 2015 annual update on July 31, 2015, with a request to keep the same rate in place. On December 21, 2015 OTP filed a supplemental filing with updated financial information.
Reagent Costs and Emission Allowances—On July 31, 2014 OTP filed a request with the MPUC to revise its Fuel Clause Adjustment (FCA) rider in Minnesota to include recovery of reagent and emission allowance costs. On March 12, 2015 the MPUC denied OTP’s request to revise its FCA rider to include recovery of these costs. These costs will be reviewed in OTP’s 2016 general rate case in Minnesota and considered for recovery either through the FCA rider or general rates. These costs are currently being expensed as incurred.
Big Stone II Project Cost Recovery—OTP requested recovery of the Minnesota portion of its Big Stone II development costs over a five-year period as part of its general rate case filed in Minnesota on April 2, 2010. In a written order issued on April 25, 2011, the MPUC authorized recovery of the Minnesota portion of Big Stone II generation development costs from Minnesota ratepayers over a 60-month recovery period which began on October 1, 2011. The amount of Big Stone II
| 12 |
generation costs incurred by OTP that were deemed recoverable from Minnesota ratepayers as part of the rates established in that proceeding was $3.2 million. Because OTP was not allowed to earn a return on these deferred costs over the 60-month recovery period, the recoverable amount of $3.2 million was discounted to its present value of $2.8 million using OTP’s incremental borrowing rate, in accordance with ASC Topic 980, Regulated Operations (ASC 980) accounting requirements. Transmission-related project costs of $3.2 million remained in CWIP as active project costs at the time of the order.
Approximately $0.4 million of the total Minnesota jurisdictional share of Big Stone II transmission costs were transferred to the Big Stone South - Brookings MVP transmission line project in the first quarter of 2013. The remaining transmission costs, along with accumulated allowance for equity funds used during construction (AFUDC), were transferred from CWIP to a regulatory asset account in May 2013, based on recovery granted in the April 25, 2011 order. Because OTP was not allowed to earn a return on these deferred costs over their anticipated recovery period, the recoverable amount of approximately $3.5 million was discounted to its present value using OTP’s incremental borrowing rate. In May 2013, OTP recorded a charge of $0.7 million related to the discount in accordance with ASC 980 accounting requirements. In June 2014, OTP recorded an additional discount of $0.3 million to reflect changes in the end date of the anticipated recovery period from September 2020 to December 2022. In accordance with ASC 980, OTP continues to monitor the assumptions used in the discounting of the Minnesota Big Stone II Transmission costs. A reversal of $0.2 million of the discount previously recorded was made in December 2015 to reflect updated information.
Capital Structure Petition—Minnesota law requires an annual filing of a capital structure petition with the MPUC. In this filing the MPUC reviews and approves the capital structure for OTP. Once the petition is approved, OTP may issue securities without further petition or approval, provided the issuance is consistent with the purposes and amounts set forth in the approved capital structure petition. The MPUC approved OTP’s most recent capital structure petition on July 10, 2015, which is in effect until the MPUC issues a new capital structure order for 2016. OTP is required to file its 2016 capital structure petition no later than May 1, 2016.
North Dakota
OTP is subject to the jurisdiction of the NDPSC with respect to rates, services, certain issuances of securities, construction of major utility facilities and other matters. The NDPSC periodically performs audits of gas and electric utilities over which it has rate setting jurisdiction to determine the reasonableness of overall rate levels. In the past, these audits have occasionally resulted in settlement agreements adjusting rate levels for OTP.
The North Dakota Energy Conversion and Transmission Facility Siting Act grants the NDPSC the authority to approve sites in North Dakota for large electric generating facilities and high voltage transmission lines. This Act is similar to the Minnesota Power Plant Siting Act described above and applies to proposed wind energy electric power generating plants exceeding 500 kW of electricity, non-wind energy electric power generating plants exceeding 50,000 kW and transmission lines with a design in excess of 115 kV. OTP is required to submit a ten-year plan to the NDPSC biennially.
The NDPSC reserves the right to review the issuance of stocks, bonds, notes and other evidence of indebtedness of a public utility. However, the issuance by a public utility of securities registered with the SEC is expressly exempted from review by the NDPSC under North Dakota state law.
General Rates—OTP’s most recent general rate increase in North Dakota of $3.6 million, or approximately 3.0%, was granted by the NDPSC in an order issued on November 25, 2009 and effective December 2009. Pursuant to the order, OTP’s allowed rate of return on rate base was set at 8.62%, and its allowed rate of return on equity was set at 10.75%.
Renewable Resource Adjustment—OTP has a North Dakota Renewable Resource Adjustment (NDRRA) which enables OTP to recover the North Dakota share of its investments in renewable energy facilities it owns in North Dakota. This rider allows OTP to recover costs associated with new renewable energy projects as they are completed with a return on investment at the level approved in OTP's most recent general rate case. On March 21, 2012 the NDPSC approved an update to OTP’s NDRRA effective April 1, 2012. The updated NDRRA recovered $9.9 million over the period April 1, 2012 through March 31, 2013. On December 28, 2012 OTP submitted an annual update to the NDRRA with a proposed effective date of April 1, 2013. The update resulted in a rate reduction, so the NDPSC did not issue an order suspending the rate change. Consequently, pursuant to statute, OTP was allowed to implement updated rates effective April 1, 2013 with the NDPSC granting subsequent approval of the updated rates on July 10, 2013. The NDPSC approved OTP’s 2013 annual update to the NDRRA on March 12, 2014 with an effective date of April 1, 2014, which resulted in a 13.5% reduction in the NDRRA rate. The NDPSC approved OTP’s 2014 annual update to the NDRRA, including a change in rate design from an amount per kwh consumed to a percentage of a customer’s bill, on March 25, 2015 with an effective date of April 1, 2015. In each instance the NDRRA rates have been based on a return on investment at the rate of return approved in OTP’s last general rate case. OTP submitted its 2015 annual update to the NDRRA rider rate on December 31, 2015 with a requested implementation date of April 1, 2016.
| 13 |
Transmission Cost Recovery Rider—North Dakota law provides a mechanism for automatic adjustment outside of a general rate proceeding to recover jurisdictional capital and operating costs incurred by a public utility for new or modified electric transmission facilities. For qualifying projects, the law authorizes a current return on CWIP and a return on investment at the level approved in the utility's most recent general rate case. On August 31, 2012 OTP filed its annual update to the North Dakota TCR rider rate to reflect updated cost information associated with projects currently in the rider, as well as proposing to include costs associated with ten additional projects for recovery within the rider. The NDPSC approved the annual update on December 12, 2012 with an effective date of January 1, 2013. The NDPSC approved OTP’s 2013 annual update to its TCR rider rate on December 30, 2013 with an effective date of January 1, 2014. The NDPSC approved OTP’s 2014 annual update to its TCR rider rate on December 17, 2014 with an effective date of January 1, 2015. On August 31, 2015 OTP filed its 2015 annual update to its North Dakota TCR rider rate requesting recovery of approximately $10.2 million for 2016 compared with $8.5 million for 2015, including costs assessed by the MISO as well as new costs from the Southwest Power Pool (SPP) that OTP will incur beginning January 1, 2016. These new costs are associated with OTP’s load connected to the transmission system of Central Power Electric Cooperative (CPEC) that will become subject to SPP transmission-related charges when CPEC transmission assets are added to the SPP. The NDPSC approved OTP’s 2015 annual update to its TCR rider rate on December 16, 2015 with an effective date of January 1, 2016.
Environmental Cost Recovery Rider— On February 8, 2013 OTP filed a request with the NDPSC for an ECR rider to recover OTP’s North Dakota jurisdictional share of the revenue requirements associated with its investment in the Big Stone Plant AQCS. On December 18, 2013 the NDPSC approved OTP’s North Dakota ECR rider based on revenue requirements through the 2013 calendar year and thereafter, with rates effective for bills rendered on or after January 1, 2014. The ECR provides for a current return on CWIP and a return on investment at the level approved in OTP’s most recent general rate case. On March 31, 2014 OTP filed an annual update to its North Dakota ECR rider rate. The update included a request to increase the ECR rider rate from 4.319% of base rates to 7.531% of base rates. The NDPSC approved OTP’s 2014 ECR rider annual update request on July 10, 2014 with an August 1, 2014 implementation date. On March 31, 2015 OTP filed its annual update to the ECR. This update included a request to increase the ECR rider rate from 7.531% of base rates to 9.193% of base rates. The NDPSC approved the annual update on June 17, 2015 with an effective date of July 1, 2015, along with the approval of recovery of OTP’s North Dakota jurisdictional share of Hoot Lake Plant Mercury and Air Toxic Standards (MATS) project costs.
Reagent Costs and Emission Allowances—On July 31, 2014 OTP filed a request with the NDPSC to revise its FCA rider in North Dakota to include recovery of new reagent and emission allowance costs. On February 25, 2015 the NDPSC approved recovery of these costs through modification of the ECR rider, instead of recovery through the FCA as OTP had proposed. The ECR rider reagent and emissions allowance charge became effective May 1, 2015.
Big Stone II Project—In an order issued June 25, 2010, the NDPSC authorized recovery of Big Stone II development costs from North Dakota ratepayers. The North Dakota’s jurisdictional share of Big Stone II generation costs incurred by OTP was $4.1 million. OTP included in its total recovery amount a carrying charge of approximately $0.3 million on the North Dakota share of Big Stone II generation costs based on OTP’s average 2009 AFUDC rate of 7.65%. Because OTP would not earn a return on these deferred costs over the 36-month recovery period, the recoverable amount of $4.3 million was discounted to its then present value of $3.9 million using OTP’s incremental borrowing rate, in accordance with ASC 980 accounting requirements. The North Dakota portion of Big Stone II generation costs was recovered over a 36-month period which began on August 1, 2010.
The North Dakota jurisdictional share of Big Stone II costs incurred by OTP related to transmission was $1.1 million. Approximately $0.3 million of the total North Dakota jurisdictional share of Big Stone II transmission costs were transferred to the Big Stone South - Brookings MVP during the first quarter of 2013. On July 30, 2013 the NDPSC approved OTP’s request to continue the Big Stone II cost recovery rates for an additional eight months through March 31, 2014 to recover the remaining North Dakota share of Big Stone II transmission-related costs plus accrued AFUDC totaling $1.0 million. As of April 1, 2014 North Dakota customer’s bills no longer include a charge for the North Dakota share of Big Stone II costs.
South Dakota
Under the South Dakota Public Utilities Act, OTP is subject to the jurisdiction of the SDPUC with respect to rates, public utility services, construction of major utility facilities, establishment of assigned service areas and other matters. Under the South Dakota Energy Facility Permit Act, the SDPUC has the authority to approve sites in South Dakota for large energy conversion facilities (100,000 kW or more) and transmission lines with a design of 115 kV or more.
2010 General Rate Case—OTP’s most recent general rate increase in South Dakota of approximately $643,000 or approximately 2.32% was granted by the SDPUC in an order issued on April 21, 2011 and effective with bills rendered on and after June 1, 2011. Pursuant to the order, OTP’s allowed rate of return on rate base was set at 8.50%.
| 14 |
Transmission Cost Recovery Rider—South Dakota law provides a mechanism for automatic adjustment outside of a general rate proceeding to recover jurisdictional capital and operating costs incurred by a public utility for new or modified electric transmission facilities. The SDPUC approved OTP’s 2012 annual update to its South Dakota TCR on April 23, 2013 with an effective date of May 1, 2013. The SDPUC approved OTP’s 2013 annual update on February 18, 2014 with an effective date of March 1, 2014. The SDPUC approved OTP’s 2014 annual update on February 13, 2015 with an effective date of March 1, 2015. OTP filed its 2015 annual update on October 30, 2015 with a proposed effective date of March 1, 2016. A supplemental filing was made on February 3, 2016 to true-up the filing to include the impact of bonus depreciation elected for 2015, the inclusion of a deferred tax asset relating to a net operating loss and the proration of accumulated deferred income taxes.
Environmental Cost Recovery Rider—On November 25, 2014 the SDPUC approved OTP’s ECR rider request to recover OTP’s South Dakota jurisdictional share of revenue requirements associated with its investment in the Big Stone Plant AQCS and Hoot Lake Plant MATS projects, with an effective date of December 1, 2014. On August 31, 2015 OTP filed its annual update to the South Dakota ECR requesting recovery of approximately $2.7 million in annual revenue. The SDPUC approved the request in their order dated October 15, 2015 with an effective date of November 1, 2015.
Reagent Costs and Emission Allowances—On August 1, 2014 OTP filed a request with the SDPUC to revise its FCA rider in South Dakota to include recovery of reagent and emission allowance costs. On September 16, 2014 the SDPUC approved OTP’s request to include recovery of these costs in its South Dakota FCA rider.
Big Stone II Project—OTP requested recovery of the South Dakota portion of its Big Stone II development costs over a five-year period as part of its general rate case filed in South Dakota on August 20, 2010. In the first quarter of 2011, the SDPUC approved recovery of the South Dakota portion of Big Stone II generation development costs totaling approximately $1.0 million from South Dakota ratepayers over a ten-year period beginning in February 2011 with the implementation of interim rates. OTP is allowed to earn a return on the amount subject to recovery over the ten-year recovery period. Therefore, the South Dakota settlement amount is not discounted. OTP transferred the South Dakota portion of the remaining Big Stone II transmission costs to CWIP, with such costs subject to AFUDC and recovery in future FERC-approved MISO rates or retail rates. On July 31, 2012 the SDPUC approved the transfer of the Big Stone II transmission route permits to OTP.
A portion of the Big Stone II transmission costs were transferred out of CWIP in February 2013 to be included within the Big Stone South - Brookings MVP. On March 28, 2013 OTP filed a petition with the SDPUC requesting deferred accounting for the remaining unrecovered Big Stone II transmission costs until OTP’s next South Dakota general rate case. The petition was approved by the SDPUC on April 23, 2013 and in May 2013 OTP transferred the remaining $0.2 million South Dakota jurisdictional portion of unrecovered Big Stone II transmission costs plus accumulated AFUDC from CWIP to the Big Stone II Unrecovered Project Costs – South Dakota regulatory asset accounts.
Energy Efficiency Plan (EEP)—The SDPUC has encouraged all investor-owned utilities in South Dakota to be part of an Energy Efficiency Partnership to significantly reduce energy use. The plan is being implemented with program costs, carrying costs and a financial incentive being recovered through an approved rider.
On June 18, 2013 the SDPUC approved OTP’s request for a 2012 financial incentive of $84,000 along with an increased surcharge adjustment that became effective July 1, 2013. On November 5, 2013, the SDPUC approved OTP’s EEP updates for 2014-2015. On December 3, 2013, the SDPUC voted to amend the approval previously given and require OTP to come before the Commission if the overall plan budget would exceed 10%, rather than the previously approved 30%.
On May 1, 2014 OTP filed a request with the SDPUC for approval of updates to its EEP based on 2013 results. On August 26, 2014 the SDPUC issued a written order approving the maximum available incentive payment limited to 30% of the budget amount provided in the EEP, or $84,000. In addition to the incentive payment approval, the SDPUC approved OTP’s proposal to leave the South Dakota Energy Efficiency Adjustment Rider at $0.00103/kwh.
On May 1, 2015 OTP filed its 2014 South Dakota EEP Status Report, financial incentive and surcharge adjustment along with a request for approval of an incentive of $105,000 and EEP surcharge increase to $0.00152/kwh. On July 14, 2015 the SDPUC issued a written order approving OTP’s 2014 EEP Status Report, incentive and surcharge increases. Based on 2015 program results, OTP has recognized $105,000 in revenue for the 2015 EEP financial incentive.
FERC
Wholesale power sales and transmission rates are subject to the jurisdiction of the FERC under the Federal Power Act of 1935, as amended. The FERC is an independent agency with jurisdiction over rates for wholesale electricity sales, transmission and sale of electric energy in interstate commerce, interconnection of facilities, and accounting policies and practices. Filed rates are effective after a one day suspension period, subject to ultimate approval by the FERC.
| 15 |
Multi-Value Transmission Projects—On December 16, 2010 the FERC approved the cost allocation for a new classification of projects in the MISO region called MVPs. MVPs are designed to enable the region to comply with energy policy mandates and to address reliability and economic issues affecting multiple transmission zones within the MISO region. The cost allocation is designed to ensure that the costs of transmission projects with regional benefits are properly assigned to those who benefit. On October 20, 2011 the FERC reaffirmed the MVP cost allocation on rehearing.
Effective January 1, 2012, the FERC authorized OTP to recover 100% of prudently incurred CWIP and Abandoned Plant Recovery on two projects approved by MISO as MVPs in MISO’s 2011 Transmission Expansion Plan: the Big Stone South – Brookings MVP and the Big Stone South – Ellendale MVP.
On November 12, 2013 a group of industrial customers and other stakeholders filed a complaint with the FERC seeking to reduce the return on equity (ROE) component of the transmission rates that MISO transmission owners, including OTP, may collect under the MISO Tariff. The complainants are seeking to reduce the current 12.38% ROE used in MISO’s transmission rates to a proposed 9.15%. A group of MISO transmission owners have filed responses to the complaint, defending the current ROE and seeking dismissal of the complaint. On October 16, 2014 the FERC issued an order finding that the current MISO ROE may be unjust and unreasonable and setting the issue for hearing, subject to the outcome of settlement discussion. Settlement discussions did not resolve the dispute and the FERC set the proceeding to a Track II Hearing which occurred in August 2015. An initial decision by the presiding administrative law judge was issued on December 22, 2015 finding that the MISO transmission owners’ ROE should be 10.32%. The FERC decision is anticipated in the fall of 2016. On November 6, 2014 a group of MISO transmission owners, including OTP, filed for a FERC incentive of an additional 50-basis points for Regional Transmission Organization participation (RTO Adder). On January 5, 2015 the FERC granted the request, deferring collection of the RTO Adder until the resolution of the ROE complaint proceeding.
On February 12, 2015 another group of stakeholders filed a complaint with the FERC seeking to reduce the ROE component of the transmission rates that MISO transmission owners, including OTP, may collect under the MISO Tariff from the current 12.38% to a proposed 8.67%. A group of MISO transmission owners have filed responses to the complaint, defending the current ROE and seeking dismissal of the complaint. The initial decision by the presiding administrative law judge is scheduled to be issued in the summer of 2016. A FERC decision is not expected until 2017.
NAEMA
OTP is a member of the North American Energy Marketers Association
(NAEMA) which is an independent, non-profit trade association representing entities involved in the marketing of energy or in
providing services to the energy industry. NAEMA has over 150 members with operations in 48 states and Canada. NAEMA was formed
as a successor organization of the Power and Energy Market (PEM) of the Mid-Continent Area Power Pool (MAPP) in recognition that
PEM had outgrown the MAPP region. Power pool sales are conducted continuously through NAEMA in accordance with schedules filed
by NAEMA with the FERC.
North American Electric Reliability Corporation (NERC)
NERC is an international regulatory authority, subject to oversight by the FERC and governmental authorities in Canada, whose mission is to assure the reliability of the bulk power system in North America. As an owner and operator within the bulk power system, OTP is required to comply with NERC reliability standards, including cybersecurity. In November of 2014, the FERC approved NERC’s critical infrastructure and protection standards.
Midwest Reliability Organization (MRO)
OTP is a member of the MRO. The MRO is a non-profit organization dedicated to ensuring the reliability and security of the bulk power system in the north central region of North America, including parts of both the United States and Canada. MRO began operations in 2005 and is one of eight regional entities in North America operating under authority from regulators in the United States and Canada through a delegation agreement with the NERC. The MRO is responsible for: (1) developing and implementing reliability standards, (2) enforcing compliance with those standards, (3) providing seasonal and long-term assessments of the bulk power system’s ability to meet demand for electricity, and (4) providing an appeals and dispute resolution process.
The MRO region covers roughly one million square miles spanning the provinces of Saskatchewan and Manitoba, the states of North Dakota, Minnesota, Nebraska and the majority of the territory in the states of South Dakota, Iowa and Wisconsin. The region includes more than 130 organizations that are involved in the production and delivery of power to more than 20 million people. These organizations include municipal utilities, cooperatives, investor-owned utilities, a federal power marketing agency, Canadian Crown Corporations, independent power producers and others who have interests in the reliability of the bulk power system. MRO assumed the reliability functions of the MAPP and Mid-America Interconnected Network, both former voluntary regional reliability councils.
| 16 |
MISO
OTP is a member of the MISO. As the transmission provider and security coordinator for the region, the MISO seeks to optimize the efficiency of the interconnected system, provide regional solutions to regional planning needs and minimize risk to reliability through its security coordination, long-term regional planning, market monitoring, scheduling and tariff administration functions. The MISO covers a broad region containing all or parts of 15 states and the Canadian province of Manitoba. The MISO has operational control of OTP’s transmission facilities above 100 kV, but OTP continues to own and maintain its transmission assets.
Through the MISO Energy Markets, MISO seeks to develop options for energy supply, increase utilization of transmission assets, optimize the use of energy resources across a wider region and provide greater visibility of data. MISO aims to facilitate a more cost-effective and efficient use of the wholesale bulk electric system.
The MISO Ancillary Services Market (ASM) facilitates the provision of Regulation, Spinning Reserve and Supplemental Reserves. The ASM integrates the procurement and use of regulation and contingency reserves with the existing Energy Market. OTP has actively participated in the market since its commencement.
Other
OTP is subject to various federal laws, including the Public Utility Regulatory Policies Act of 1978 and the Energy Policy Act of 1992 (which are intended to promote the conservation of energy and the development and use of alternative energy sources) and the Energy Policy Act of 2005.
Competition, Deregulation and Legislation
Electric sales are subject to competition in some areas from municipally owned systems, rural electric cooperatives and, in certain respects, from on-site generators and cogenerators. Electricity also competes with other forms of energy. The degree of competition may vary from time to time depending on relative costs and supplies of other forms of energy.
The Company believes OTP is well positioned to be successful in a competitive environment. A comparison of OTP’s electric retail rates to the rates of other investor-owned utilities, cooperatives and municipals in the states OTP serves indicates OTP’s rates are competitive.
Legislative and regulatory activity could affect operations in the future. OTP cannot predict the timing or substance of any future legislation or regulation. The Company does not expect retail competition to come to the states of Minnesota, North Dakota or South Dakota in the foreseeable future. There has been no legislative action regarding electric retail choice in any of the states where OTP operates. The Minnesota legislature has in the past considered legislation that, if passed, would have limited the Company’s ability to maintain and grow its nonelectric businesses.
OTP is unable to predict the impact on its operations resulting from future regulatory activities, from future legislation or from future taxes that may be imposed on the source or use of energy.
Environmental Regulation
Impact of Environmental Laws—OTP’s existing generating plants are subject to stringent federal and state standards and regulations regarding, among other things, air, water and solid waste pollution. In the five years ended December 31, 2015 OTP invested approximately $214 million in environmental control facilities. The 2016 and 2017 construction budgets include approximately $3 million and $2 million, respectively, for environmental equipment for existing facilities.
Air Quality - Criteria Pollutants—Pursuant to the CAA, the EPA has promulgated national primary and secondary standards for certain air pollutants.
The primary fuels burned by OTP’s steam generating plants are North Dakota lignite coal and western subbituminous coal. Electrostatic precipitators have been installed at the principal units at the Hoot Lake Plant. Hoot Lake Plant Unit 1, which is the smallest of the three coal-fired units at Hoot Lake Plant, was retired as of December 31, 2005. The Hoot Lake Plant is currently operating within all presently applicable federal and state air quality and emission standards.
The South Dakota Department of Environment and Natural Resources (DENR) issued a Title V Operating Permit to the Big Stone Plant on June 9, 2009, allowing for operation. The Big Stone Plant continues to operate under Title V permit provisions. The Big Stone Plant is currently operating within all presently applicable federal and state air quality and emission standards.
| 17 |
The Coyote Station is equipped with sulfur dioxide (SO2) removal equipment. The removal equipment—referred to as a dry scrubber—consists of a spray dryer, followed by a fabric filter, and is designed to desulfurize hot gases from the stack. The fabric filter collects spray dryer residue along with the fly ash. The Coyote Station is currently operating within all presently applicable federal and state air quality and emission standards.
The CAA, in addressing acid deposition, imposed requirements on power plants in an effort to reduce national emissions of SO2 and nitrogen oxides (NOx).
The national Acid Rain Program SO2 emission reduction goals are achieved through a market based system under which power plants are allocated "emissions allowances" that require plants to either reduce their SO2 emissions or acquire allowances from others to achieve compliance. Each allowance is an authorization to emit one ton of SO2. SO2 emission requirements are currently being met by all of OTP’s generating facilities without the need to acquire additional allowances for compliance with the acid deposition provisions of the CAA.
The national Acid Rain Program NOx emission reduction goals are achieved by imposing mandatory emissions standards on individual sources. All of OTP’s generating facilities met the NOx standards during 2015.
On July 8, 2011 the EPA released the final Cross-State Air Pollution Rule (CSAPR). The rule requires SO2 and NOx emission reductions in 23 primarily eastern states in order to allow downwind states to achieve national ambient air quality standards (NAAQS). A number of states and industry representatives challenged the rule. On December 30, 2011 the U.S. Court of Appeals for the D.C. Circuit granted motions to stay CSAPR pending the court's resolution of the petitions for review. The D.C. Circuit issued an order on August 21, 2012 vacating CSAPR. The United States sought Supreme Court review of the D.C. Circuit’s decision vacating CSAPR, and the Supreme Court granted review. On April 29, 2014 the U.S. Supreme Court issued its opinion, reversing the August 21, 2012 decision of the D.C. Circuit that had vacated CSAPR. CSAPR was remanded to the D.C. Circuit for further proceedings where, on July 26, 2014, the United States moved to lift the previously–entered stay. The EPA's motion asked the D.C. Circuit to implement CSAPR's Phase 1 emission budgets beginning January 1, 2015 for the annual SO2 and NOx programs with stricter Phase 2 budgets beginning in 2017. The D.C. Circuit granted the EPA’s motion on October 23, 2014. On December 3, 2014 the EPA issued an interim final rule that tolls the original CSAPR deadlines by three years, such that the CSAPR program began in 2015. Remaining arguments to CSAPR were heard before the D.C. Circuit on February 25, 2015, and on July 28, 2015 the D.C. Circuit remanded certain states emissions budgets back to EPA, but rejected all remaining challenges to the rule.
The CSAPR rule applies to OTP’s Solway gas peaking plant and the Hoot Lake coal-fired plant in Minnesota. Hoot Lake Plant may be required to purchase SO2 allowances to continue operating at historical levels. Minnesota is considered a Group 2 state for SO2 compliance along with Alabama, Georgia, Kansas, Nebraska, South Carolina and Texas. Any SO2 allowances that need to be obtained for Hoot Lake Plant will need to be from an entity in a Group 2 state. However, due to reduced dispatch of Hoot Lake Plant in 2015 and early 2016 due to power market conditions, and a decline in Group 2 SO2 allowance prices throughout 2015, the impact of the CSAPR rule is anticipated to be minimal.
On December 3, 2015 the EPA proposed an update to the CSAPR addressing the D.C. Circuit remand and to address interstate emission transport with respect to the more recent 2008 ozone NAAQS. The proposed updated controls do not apply to Minnesota, North Dakota and South Dakota.
On October 1, 2015 the EPA announced that it has tightened the primary and secondary NAAQS for ozone from 75 parts per billion (ppb) to 70 ppb. This is at the upper end of the range of which the EPA had proposed, which was 65 to 70 ppb. The EPA plans to use 2014-2016 air quality data to make final determinations of whether areas are in attainment with the new standard by October 1, 2017. It appears that the states in which OTP operates will not have any nonattainment areas at the 70 ppb level. Nonattainment areas are required to meet the standard in the 2020 to 2037 timeframe, with deadlines depending on the severity of an area's ozone problem. During the fourth quarter of 2015 several parties filed petitions for review in the D.C. Circuit challenging the rule and that litigation is now pending.
In June 2010, the EPA established a new primary NAAQS for SO2 at a level of 75 ppb on a 1-hour average. Designations for this standard are proceeding under several different pathways. For certain large sources as defined by 2012 emissions, including Big Stone and Coyote, the EPA entered into a consent decree with the Sierra Club/NRDC on March 2, 2015 that requires the EPA to promulgate final designations near those sources by July 2, 2016. The EPA will primarily use modeling analyses submitted by States and stakeholders to determine designations. Numerous other sources, including Hoot Lake Plant, are covered by the EPA's final Data Requirements Rule (DRR) that was finalized in August of 2015. The DRR will require states to provide either modeling or monitoring data to adequately characterize SO2 emissions surrounding those sources. Under the modeling pathway for the DRR, states are required to submit results to the EPA by January 13, 2017.
| 18 |
Air Quality – Hazardous Air Pollutants—On December 16, 2011 the EPA signed a final rule to reduce mercury and other air toxics emissions from power plants known as the MATS rule. The final rule became effective on April 16, 2012, and plants had until April 16, 2015 to comply. However, the EPA encouraged state permitting authorities to broadly grant a one-year compliance extension to plants that need additional time to install controls. The DENR granted Big Stone Plant a one-year compliance extension in August 2013. The EPA is also providing a pathway for reliability-critical units to obtain an additional year to achieve compliance; however, the EPA has indicated that it believes there will be few, if any situations, in which this pathway is needed. OTP's affected units are meeting the requirements by installing the AQCS system at Big Stone, by upgrading the electrostatic precipitators on Hoot Lake Units 2 and 3, and by installing activated carbon injection on all units. Emissions monitoring equipment and/or stack testing is being used to verify compliance with the standards. Numerous petitions were filed in the United States Court of Appeals for the D.C. Circuit challenging the MATS rule. On April 15, 2014 the Court denied all petitions for review. Certain parties filed petitions for certiorari with the U.S. Supreme Court. On November 25, 2014 the U.S. Supreme Court granted certiorari limited to the single question of whether the EPA unreasonably refused to consider costs in determining whether it is appropriate to regulate hazardous air pollutants emitted by electric utilities. On June 29, 2015, the U.S. Supreme Court found that the EPA unreasonably refused to consider cost - including the cost of compliance - before deciding whether the MATS regulation was appropriate and necessary. The case was remanded to the D.C. Circuit for further proceedings, and on December 15, 2015 the Court decided to remand MATS to the EPA to address the Supreme Court decision, but not to vacate the rule during the remand. In the remand order, the Court noted that the EPA has said that it is on track to issue a revised "appropriate and necessary" finding by April 15, 2016. Because no stay of the rule was obtained, MATS continues to govern pending resolution of the remand. On December 1, 2015 the EPA proposed a supplemental finding that included a consideration of costs that supported an “appropriate and necessary” finding and has committed to issuing its revised finding by April 15, 2016.
Air Quality – EPA New Source Review Enforcement Initiative—In 1998 the EPA announced its New Source Review Enforcement Initiative targeting coal-fired utilities, petroleum refineries, pulp and paper mills and other industries for alleged violations of the EPA’s New Source Review rules. These rules require owners or operators that construct new major sources or make major modifications to existing sources to obtain permits and install air pollution control equipment at affected facilities. Pursuant to the Initiative, the EPA is attempting to determine if emission sources violated certain provisions of the CAA by making major modifications to their facilities without installing state-of-the-art pollution controls. OTP has not received any recent requests from the EPA, pursuant to Section 114(a) of the CAA, to provide information relative to past operation and capital construction projects at its coal-fired plants
Air Quality – Regional Haze Program—The EPA promulgated the Regional Haze Rule in 1999, and on June 15, 2005 the EPA provided final guidelines for conducting BART determinations under the rule. The Regional Haze Rule requires emissions reductions from BART-eligible sources that are deemed to contribute to visibility impairment in Class I air quality areas. Big Stone Plant is BART eligible, and the South Dakota DENR determined that the plant is subject to emission reduction requirements based on the modeled contribution of the plant emissions to visibility impairment in downwind Class I air quality areas. Based on the South Dakota DENR's BART determination and the final South Dakota Regional Haze State Implementation Plan (SIP) approved by the EPA on March 29, 2012, Big Stone was required to install Selective Catalytic Reduction and separated over-fire air to reduce NOx emissions, dry flue gas desulfurization to reduce SO2 emissions, and a new baghouse for particulate matter control. The deadline for Big Stone Plant to install and operate the BART compliant air quality control system was as expeditiously as practicable, but not later than five years after the EPA’s final approval of May 29, 2012. The AQCS equipment was placed into commercial operation on December 29, 2015.
The North Dakota Regional Haze SIP requires that Coyote Station reduce its NOx emissions. On March 14, 2011 the North Dakota Department of Health (NDDOH) issued a construction permit to Coyote Station requiring installation of control equipment to limit its NOx emissions to 0.5 pounds per million Btu as calculated on a 30-day rolling average basis beginning on July 1, 2018. The project is planned for installation during a spring 2016 outage. On March 1, 2012 the EPA signed a final rule for partial approval of the North Dakota SIP that included the NOx emission rate permit conditions for Coyote Station as proposed by the NDDOH. The rule became effective on May 7, 2012.
Air Quality – Greenhouse Gas (GHG) Regulation—Combustion of fossil fuels for the generation of electricity is a considerable stationary source of CO2 emissions in the United States and globally. OTP is an owner or part-owner of three baseload, coal-fired electricity generating plants and three fuel-oil or natural gas-fired combustion turbine peaking plants with a combined net dependable capacity of 656 MW. In 2015 these plants emitted approximately 2.2 million tons of CO2.
In April 2007, the U.S. Supreme Court issued a decision that determined that the EPA has authority to regulate CO2 and other GHGs from automobiles as “air pollutants” under the CAA. The EPA thereafter conducted a rulemaking to determine whether GHG emissions contribute to climate change “which may reasonably be anticipated to endanger public health or welfare.” While this case addressed a provision of the CAA related to emissions from motor vehicles, a parallel provision of the CAA applies to stationary sources such as electric generators; according to the EPA, that parallel provision would be automatically triggered once the EPA began regulating motor vehicle GHG emissions. The first step in the EPA rulemaking process was the publication of an endangerment finding in the December 15, 2009 Federal Register where the EPA found
| 19 |
that CO2 and five other GHGs – methane, nitrous oxide, hydrofluorocarbons, perfluorocarbons and sulfur hexafluoride – threaten public health and the environment.
The EPA’s endangerment findings did not in and of themselves impose any emission reduction requirements but rather authorized the EPA to finalize the GHG standards for new light-duty vehicles as part of the joint rulemaking with the Department of Transportation. These standards applied to motor vehicles as of January 2011, which the EPA determined made GHGs “subject to regulation” under the CAA. According to the EPA, this triggered the Prevention of Significant Deterioration (PSD) and Title V operating permits programs for stationary sources of GHGs.
On June 6, 2010 the EPA published a final “tailoring rule” that phases in application of its PSD and Title V programs to GHG emission sources, including power plants. The PSD program applies to existing sources if there is a physical change or change in the method of operation of the facility that results in a significant net emissions increase of any pollutant. As a result, PSD does not apply on a set timeline as is the case with other regulatory programs, but is triggered depending on what activities take place at a major source. If triggered, the owner or operator of an affected facility must undergo a review which requires, among other things, the identification and implementation of best-available control technology (BACT) for the regulated air pollutants for which there is a significant net emissions increase, and an analysis of the ambient air quality impacts of the facility.
In June 2012 the United States Court of Appeals for the D.C. Circuit upheld most of the EPA’s rules regarding the regulation of GHGs under the CAA, including the tailoring rule. However, in October 2013 the U.S. Supreme Court granted a petition for a writ of certiorari to review the question of whether the regulation of new motor vehicle GHG emissions does in fact automatically trigger PSD and Title V regulation of GHGs for stationary sources. On June 23, 2014 the U.S. Supreme Court issued its decision that, in summary, held the EPA exceeded its statutory authority and may not require a PSD or Title V permit based solely on GHG emissions. However, the U.S. Supreme Court also said the EPA could continue to require that PSD permits for sources otherwise subject to PSD based on emissions of conventional pollutants, contain limitations on GHG emissions based on the application of BACT. The EPA revised its regulations to implement this ruling. OTP does not anticipate making modifications that would trigger PSD requirements at any of its facilities or undertaking construction of a new unit that might trigger PSD.
The EPA developed New Source Performance Standards (NSPS) for GHGs from new and existing fossil fuel-fired electric generating units. On October 23, 2015 the EPA published the final NSPS under section 111(b) of the CAA that requires certain new units (as well as modified and reconstructed units) to meet CO2 emission standards. New natural gas combustion turbines are required to meet a standard of 1,000 lbs of CO2 per gross megawatt hour averaged over a 12 month period if they meet the definition of a baseload unit. New natural gas combined cycle units are anticipated to fit into this category. Simple cycle combustion turbines are regulated in a non-baseload category that is required to meet a heat input based standard that can be met by burning clean fuels such as natural gas.
The EPA also published GHG performance standards for existing sources under CAA Section 111(d) (111(d) Standard). A 111(d) Standard, unlike those set under CAA Section 111(b), applies to existing sources of a pollutant. Under Section 111(d), the EPA promulgates emission guidelines, and the states are then given a period of time to develop plans to implement the standard. The EPA reviews each state-developed standard and then approves it if the state’s plan comports with the federal emission guidelines; if the state does not submit a plan or the EPA finds that the plan is inadequate, the EPA will prescribe a plan for that state.
For both new and existing sources, the EPA must develop a “standard of performance,” which is defined as:
…a standard for emissions of air pollutants which reflects the degree of emission limitation achievable through the application of the best system of emission reduction which (taking into account the cost of achieving such reduction and any non-air quality health and environmental impact and energy requirements) the [EPA] Administrator determines has been adequately demonstrated.
For existing sources, Section 111(d) also requires the EPA to consider, “among other factors, remaining useful lives of the sources in the category of sources to which such standard applies.”
On June 18, 2014 the EPA published proposed Section 111(d) emission guidelines for existing fossil fuel-fired power plants, termed the Clean Power Plan (CPP). The CPP proposed state-specific rate-based goals for CO2 emissions from the power sector, as well as guidelines for states to follow in developing plans to achieve the goals. An interim goal was proposed to be achieved on average over the ten year period of 2020-2029, and a final goal in 2030 and each year thereafter. The EPA used a formula that relies on four building blocks to determine the state-specific goal: (1) a six percent heat rate improvement at each coal plant, (2) increased reliance on natural gas combined cycle units, (3) a renewable energy target, and (4) demand side energy efficiency savings. Specific to OTP, EPA's proposed formula created substantially different targets for North Dakota, South Dakota, and Minnesota, primarily due to the EPA's second building block that envisioned redispatching natural gas combined cycle units to a 70% capacity factor.
| 20 |
On October 23, 2015 the EPA published the final CPP. The final rule delayed the start of the interim goal period to 2022 and used a different formula to calculate state goals that resulted in a narrower range of state-specific targets. The EPA formula relied on only three building blocks in the final rule: (1) a heat rate improvement at each coal plant, (2) increased reliance on natural gas combined cycle units, and (3) increased deployment of renewable energy. These building blocks were applied to each grid interconnection that resulted in final national uniform emission rate standards of 1,305 pounds of CO2 per net megawatt hour for coal plants and 771 pounds of CO2 per net megawatt hour for natural gas combined cycle plants. These uniform rates were applied on a weighted average basis to the affected units of each state, resulting in a much narrower range of goals in the final rule as compared to the proposed rule. The EPA then translated the rate goals into mass based goals that can be applied to existing sources, or if a state chooses, a mass based goal that applies to both existing sources and new sources. States must submit a final implementation plan or a request for a two year extension by September 6, 2016, with final plans due by September 6, 2018. OTP is actively reviewing how the CPP might impact its operations and is actively engaged with our state stakeholders in the plan development process in the relevant states.
A number of states, utilities, and trade groups have filed petitions for review with the D.C. Circuit seeking to overturn the rule, and also moved to stay the rule. On January 14, 2016 the D.C. Circuit denied the stay motions, but expedited briefing so that briefing would be concluded in April and oral argument would occur in June 2016. Numerous petitioners then sought an emergency stay in the U.S. Supreme Court. On February 9, 2016 the U.S. Supreme Court granted a stay of the CPP pending disposition of the petitions for review in the D.C. Circuit and disposition of a petition for a writ of certiorari seeking review by the U.S. Supreme Court, if such a writ is sought. It is possible the D.C. Circuit may rule on the merits of the CPP in late 2016 or early 2017. If, and when, review will occur at the U.S. Supreme Court is not known at this time.
Also on October 23, 2015, the EPA proposed model trading rules along with the proposed federal plan for states that do not have a fully approved state plan. The EPA proposed both a rate-based trading plan and a mass-based trading plan for the federal plan. The EPA indicated it intends to finalize a single plan type, but accepted comments on this concept as well as several other aspects. A state program that adheres to the model trading rule provisions specified in the rulemaking would be presumptively approvable. The EPA intends to finalize the model trading rules in summer 2016 but will not issue a federal plan until it has formally determined a state has failed to comply with a deadline for plan submission.
Several states and regional organizations have or will develop state-specific or regional legislative initiatives to reduce GHG emissions through mandatory programs. In 2007, the state of Minnesota passed legislation regarding renewable energy portfolio standards that requires retail electricity providers to obtain 25% of the electric energy sold to Minnesota customers from renewable sources by the year 2025. Additionally, in 2013 the state of Minnesota passed a provision that requires public utilities to generate or procure sufficient electricity generated by solar energy to serve its retail electricity customers in Minnesota so that by the end of 2020, at least 1.5% of the utility's total retail electric sales to retail customers in Minnesota is generated by solar energy. The Minnesota legislature set a January 1, 2008 deadline for the MPUC to establish an estimate of the likely range of costs of future CO2 regulation on electricity generation. The legislation also set state targets for reducing fossil fuel use, included goals for reducing the state's output of GHGs, and restricted importing electricity that would contribute to statewide power sector CO2 emission. The MPUC, in its order dated December 21, 2007, established an estimate of future CO2 regulation costs at between $4/ton and $30/ton emitted in 2012 and after. Annual updates of the range are required. For 2015 the range is $9-$34/ton, and the applicable effective date to begin using CO2 costs in resource planning decisions is 2019. Minnesota opened a new docket to investigate the environmental and socioeconomic costs of externalities associated with electricity generation. A final ruling in that case is not expected until late in 2016.
The states of North Dakota and South Dakota currently have no proposed or pending legislation related to the regulation of GHG emissions, but North Dakota and South Dakota have 10% renewable energy objectives. OTP currently has sufficient renewable generation to meet the renewable energy objectives in both North Dakota and South Dakota.
While the eventual outcome of proposed and pending climate change legislation and GHG regulation is unknown, OTP is taking steps to reduce its carbon footprint and mitigate levels of CO2 emitted in the process of generating electricity for its customers through the following initiatives:
| · | Supply efficiency and reliability: OTP’s efforts to increase plant efficiency and add renewable energy to its resource mix have reduced its CO2 intensity. Between 1985 and 2015 OTP decreased its overall system average CO2 emissions intensity by approximately 38%. Further reductions are expected with the anticipated replacement of Hoot Lake Plant generation likely with natural gas in the 2020 timeframe. |
| · | Conservation: Since 1992 OTP has helped its customers conserve nearly 71 MW of demand and nearly 3.1 million cumulative megawatt-hours of electricity, which is roughly equivalent to the amount of electricity that 258,000 average homes would use in a year. OTP continues to educate customers about energy efficiency and demand-side management and to work with regulators to develop new programs. OTP’s 2014-2028 IRP calls for an additional 106 MW of conservation and demand-side management impacts by 2028. |
| 21 |
| · | Renewable energy: Since 2002, OTP’s customers have been able to purchase 100% of their electricity from wind generation through OTP’s Tail Winds program. OTP has access to 102.9 MW of wind powered generation under power purchase agreements and owns 138 MW of wind powered generation. |
| · | Other: OTP is a participating member of the EPA’s sulfur hexafluoride (SF6) Emission Reduction Partnership for Electric Power Systems program, which proactively is targeting a reduction in emissions of SF6, a potent GHG. SF6 has a global-warming potential 23,900 times that of CO2. Methane has a global-warming potential over 20 times that of CO2. OTP participates in carbon sequestration research through the Plains CO2 Reduction (PCOR) Partnership through the University of North Dakota’s Energy and Environmental Research Center. The PCOR Partnership is a collaborative effort of approximately 100 public and private sector stakeholders working toward a better understanding of the technical and economic feasibility of capturing and storing anthropogenic CO2 emissions from stationary sources in central North America. |
In late 2009, two federal circuit courts of appeal reversed dismissals of suits seeking federal common law liability for GHG emissions and remanded them to district court for trial. OTP was not a party to any of these suits, and does not have an indication that it will be the subject of such a lawsuit. The circuit court opinions, however, opened utility companies and other GHG emitters to these actions, which had previously been dismissed by the district courts as non-justiciable based on the political question doctrine. In 2010, the U.S. Supreme Court took review of one of these cases, while declining review of another. On June 20, 2011, the Supreme Court ruled unanimously that states cannot invoke federal common law to force utilities to cut GHG emissions, which was in agreement with the position of utilities and the EPA.
While the future financial impact of any proposed or pending climate change legislation, litigation, or regulation of GHG emissions is unknown at this time, any capital and operating costs incurred for additional pollution control equipment or CO2 emission reduction measures, such as the cost of sequestration or purchasing allowances, or offset credits, or the imposition of a carbon tax or cap and trade program at the state or federal level could materially adversely affect the Company’s future results of operations, cash flows, and possibly financial condition, unless such costs could be recovered through regulated rates and/or future market prices for energy.
Water Quality—The Federal Water Pollution Control Act Amendments of 1972, and amendments thereto, provide for, among other things, the imposition of effluent limitations to regulate discharges of pollutants, including thermal discharges, into the waters of the United States, and the EPA has established effluent guidelines for the steam electric power generating industry. Discharges must also comply with state water quality standards.
Effluent limits specific to Hoot Lake Plant and Coyote Station are incorporated into their National Pollutant Discharge Elimination System (NPDES) permits. Big Stone Plant is a zero discharge facility and therefore does not have a NPDES permit. The EPA announced its decision to proceed with further possible revisions to steam effluent guidelines on September 15, 2009, and published a proposed rulemaking on June 7, 2013. On November 3, 2015 the EPA published the final rule that sets technology-based effluent limitations on certain types of discharges. Generally, the final rule establishes new requirements for wastewater streams from wet flue gas desulfurization, fly ash transport, and bottom ash transport. This includes zero discharge requirements for fly ash and bottom ash transport water. OTP’s facilities either utilize dry ash handling or use transport water in a closed loop manner, and therefore OTP anticipates minimal impact from the rule.
On May 9, 2014 the EPA Administrator signed a final rule implementing Section 316(b) of the Clean Water Act establishing standards for cooling water intake structures for certain existing facilities. The final rule includes seven compliance options, plus a potential "de minimis" option that is not well defined. Although the impact of the Hoot Lake Plant intake structure has been extensively evaluated in two separate studies both of which showed minimal impact, OTP will need to have state agency discussions during the renewal of the Hoot Lake Plant NPDES permit to determine the appropriate path forward. Coyote Station will also need to provide various studies with their next NPDES permit renewal application, but minimal impact is anticipated since Coyote already uses closed-cycle cooling.
OTP has all federal and state water permits presently necessary for the operation of the Coyote Station, the Big Stone Plant and the Hoot Lake Plant. OTP owns five small dams on the Otter Tail River, which are subject to FERC licensing requirements. A license for all five dams was issued on December 5, 1991. Total nameplate rating (manufacturer’s expected output) of the five dams is 3,450 kW.
Solid Waste—Permits for disposal of ash and other solid wastes have been issued for the Coyote Station, the Big Stone Plant and the Hoot Lake Plant.
On December 19, 2014 the EPA announced a final rule regulating coal combustion residuals (CCR) under the Resource Conservation and Recovery Act (RCRA) regulating the disposal of coal ash generated from the combustion of coal by electric utilities under Subtitle D’s nonhazardous provisions. The final rule was published on April 17, 2015. The rule requires OTP to complete certain actions, such as installing additional groundwater monitoring wells and investigating whether existing surface impoundments meet defined location restrictions, in order to determine whether existing surface
| 22 |
impoundments should be retired or retrofitted with liners. OTP has not yet completed its actions, therefore, the cost impact of this rule will not be known until those actions are completed. Existing landfill cells can continue to operate as designed, but future expansions will require composite liner and leachate collection systems. Congress has sought to pass and is still considering legislation to modify the rule. Petitions for judicial review of the rule are currently pending in the D.C. Circuit Court. Thus, the future financial impact of this rule is unknown at this time.
At the request of the Minnesota Pollution Control Agency (MPCA), OTP has an ongoing investigation at its former, closed Hoot Lake Plant ash disposal sites. The MPCA continues to monitor site activities under its Voluntary Investigation and Cleanup (VIC) Program. OTP provided a revised focus feasibility study for remediation alternatives to the MPCA in October 2004. OTP and the MPCA have reached an agreement identifying the remediation technology and OTP completed the projects in 2006. The effectiveness of the remediation is under ongoing evaluation. OTP completed additional projects in 2014 and 2015 that removed the ash from two entire VIC areas and placed it in OTP’s permitted disposal area.
The EPA has promulgated various solid and hazardous waste regulations and guidelines pursuant to, among other laws, the RCRA, the Solid Waste Disposal Act Amendments of 1980 and the Hazardous and Solid Waste Amendments of 1984, which provide for, among other things, the comprehensive control of various solid and hazardous wastes from generation to final disposal. The states of Minnesota, North Dakota and South Dakota have also adopted rules and regulations pertaining to solid and hazardous waste. To date, OTP has incurred no significant costs as a result of these laws. The future total impact on OTP of the various solid and hazardous waste statutes and regulations enacted by the federal government or the states of Minnesota, North Dakota and South Dakota now or in the future is unknown at this time.
In 1980, the United States enacted the Comprehensive Environmental Response, Compensation and Liability Act, commonly known as CERCLA or the Federal Superfund law, which was reauthorized and amended in 1986. In 1983, Minnesota adopted the Minnesota Environmental Response and Liability Act, commonly known as the Minnesota Superfund law. In 1988, South Dakota enacted the Regulated Substance Discharges Act, commonly known as the South Dakota Superfund law. In 1989, North Dakota enacted the Environmental Emergency Cost Recovery Act. Among other requirements, the federal and state acts establish environmental response funds to pay for remedial actions associated with the release or threatened release of certain regulated substances into the environment. These federal and state Superfund laws also establish liability for cleanup costs and damage to the environment resulting from such release or threatened release of regulated substances. The Minnesota Superfund law also creates liability for personal injury and economic loss under certain circumstances. OTP has not incurred any significant costs to date related to these laws. OTP is not presently named as a potentially responsible party under the federal or state Superfund laws.
Capital Expenditures
OTP is continually expanding, replacing and improving its electric facilities. During 2015, approximately $136 million in cash was invested for additions and replacements to its electric utility properties. During the five years ended December 31, 2015 gross electric property additions, including construction work in progress, were approximately $610 million and gross retirements were approximately $86 million. OTP estimates that during the five-year period 2016-2020 it will invest approximately $858 million for electric construction, which includes $213 million for MVP transmission projects, $162 million for natural gas-fired generation to replace Hoot Lake Plant capacity and $190 million for renewable wind and solar energy generation projects. The remainder of the 2016-2020 anticipated capital expenditures is for asset replacements, additions and improvements across OTP’s generation, transmission, distribution and general plant. See “Management’s Discussion and Analysis of Financial Condition and Results of Operations - Capital Requirements” section for further discussion.
Franchises
At December 31, 2015 OTP had franchises to operate as an electric utility in substantially all of the incorporated municipalities it serves. All franchises are nonexclusive and generally were obtained for 20-year terms, with varying expiration dates. No franchises are required to serve unincorporated communities in any of the three states that OTP serves. OTP believes that its franchises will be renewed prior to expiration.
Employees
At December 31, 2015 OTP had 651 equivalent full-time employees. A total of 394 OTP employees are represented by local unions of the International Brotherhood of Electrical Workers under two separate contracts expiring in the fall of 2016 and 2017. OTP has not experienced any strike, work stoppage or strike vote, and considers its present relations with employees to be good.
| 23 |
MANUFACTURING
General
Manufacturing consists of businesses engaged in the following activities: contract machining, metal parts stamping, fabrication and painting, and production of material handling trays and horticultural containers.
The Company derived 28%, 27% and 28% of its consolidated operating revenues and 9%, 17% and 22% of its consolidated operating income from the Manufacturing segment for the years ended December 31, 2015, 2014 and 2013, respectively. Following is a brief description of each of these businesses:
BTD Manufacturing, Inc. (BTD), with headquarters located in Detroit Lakes, Minnesota, is a metal stamping and tool and die manufacturer that provides its services mainly to customers in the Midwest. BTD stamps, fabricates, welds, paints and laser cuts metal components according to manufacturers’ specifications primarily for the recreational vehicle, agricultural, oil and gas, lawn and garden, industrial equipment, health and fitness and enclosure industries in its facilities in Detroit Lakes and Lakeville, Minnesota, Washington, Illinois and Dawsonville, Georgia. BTD’s Illinois facility also manufactures and fabricates parts for off-road equipment, mining machinery, oil fields and offshore oil rigs, wind industry components, broadcast antennae and farm equipment, and serves several major equipment manufacturers in the Peoria, Illinois area and nationwide, including Caterpillar, Komatsu and Gardner Denver.
On September 1, 2015 Miller Welding and Iron Works, Inc. (BTD-Illinois), a wholly owned subsidiary of BTD, acquired the assets of Impulse Manufacturing Inc. (Impulse) of Dawsonville, Georgia for $30.8 million in cash, subject to a post-closing adjustment. The newly acquired business now operates under the name BTD-Georgia. BTD-Georgia, a full-service metal fabricator located 30 miles north of Atlanta, Georgia, recorded revenues of $27 million in 2014. BTD-Georgia offers a wide range of metal fabrication services ranging from simple laser cutting services and high volume stamping to complex weldments and assemblies for metal fabrication buyers and original equipment manufacturers.
T.O. Plastics, Inc. (T.O. Plastics), located in Otsego and Clearwater, Minnesota, manufactures and sells thermoformed products for the horticulture industry throughout the United States. In addition, T.O. Plastics produces products such as clamshell packing, blister packs, returnable pallets and handling trays for shipping and storing odd-shaped or difficult-to-handle parts for customers in the consumer products, food packaging, electronics, industrial and medical industries, among others. T.O. Plastics’ Otsego thermoforming facility has an AIB International compliance rating for producing food-contact packaging materials in its operations.
Product Distribution
The principal method for distribution of the manufacturing companies’ products is by direct shipment to the customer by common carrier ground transportation. No single customer or product of the Company’s manufacturing companies accounts for over 10% of the Company’s consolidated revenue.
Competition
The various markets in which the Manufacturing segment entities compete are characterized by intense competition from both foreign and domestic manufacturers. These markets have many established manufacturers with broader product lines, greater distribution capabilities, greater capital resources, excess capacity, labor advantages and larger marketing, research and development staffs and facilities than the Company’s manufacturing entities.
The Company believes the principal competitive factors in its Manufacturing segment are product performance, quality, price, technical innovation, cost effectiveness, customer service and breadth of product line. The Company’s manufacturing entities intend to continue to compete on the basis of high-performance products, innovative production technologies, cost-effective manufacturing techniques, close customer relations and support, and increasing product offerings.
Raw Materials Supply
The companies in the Manufacturing segment use raw materials in the products they manufacture, including steel, aluminum and polystyrene and other plastics resins. Both pricing increases and availability of these raw materials are concerns of companies in the Manufacturing segment. The companies in the Manufacturing segment attempt to pass increases in the costs of these raw materials on to their customers. Increases in the costs of raw materials that cannot be passed on to customers could have a negative effect on profit margins in the Manufacturing segment. Additionally, a certain amount of residual material, scrap, is a by-product of many of the manufacturing and production processes used by the Company’s manufacturing companies. Declines in commodity prices for these scrap materials due to weakened demand or excess supply
| 24 |
can negatively impact the profitability of the Company’s manufacturing companies as it reduces their ability to mitigate the cost associated with excess material.
Backlog
The Manufacturing segment has backlog in place to support 2016 revenues of approximately $134 million compared with $140 million one year ago.
Capital Expenditures
Capital expenditures in the Manufacturing segment typically include additional investments in new manufacturing equipment or expenditures to replace worn-out manufacturing equipment. Capital expenditures may also be made for the purchase of land and buildings for plant expansion and for investments in management information systems. During 2015, cash expenditures for capital additions in the Manufacturing segment were approximately $20 million. Total capital expenditures for the Manufacturing segment during the five-year period 2016-2020 are estimated to be approximately $97 million.
Employees
At December 31, 2015 the Manufacturing segment had 1,153 full-time employees. There were 1,026 full-time employees at BTD and its subsidiaries and 127 full-time employees at T.O. Plastics as of December 31, 2015.
PLASTICS
General
Plastics consists of businesses producing PVC pipe at plants in North Dakota and Arizona. The Company derived 20%, 22% and 22% of its consolidated operating revenues and 19%, 20% and 25% of its consolidated operating income from the Plastics segment for the years ended December 31, 2015, 2014 and 2013, respectively. Following is a brief description of these businesses:
Northern Pipe Products, Inc. (Northern Pipe), located in Fargo, North Dakota, manufactures and sells PVC pipe for municipal water, rural water, wastewater, storm drainage systems and other uses in the northern, midwestern, south-central and western regions of the United States as well as central and western Canada.
Vinyltech Corporation (Vinyltech), located in Phoenix, Arizona, manufactures and sells PVC pipe for municipal water, wastewater, water reclamation systems and other uses in the western and south-central regions of the United States.
Together these companies have the current capacity to produce approximately 300 million pounds of PVC pipe annually.
Customers
PVC pipe products are marketed through a combination of independent sales representatives, company salespersons and customer service representatives. Customers for the PVC pipe products consist primarily of wholesalers and distributors throughout the northern, midwestern, south-central and western United States. The principal method for distribution of the PVC pipe companies’ products is by common carrier ground transportation. No single customer of the PVC pipe companies accounts for over 10% of the Company’s consolidated revenue.
Competition
The plastic pipe industry is fragmented and competitive, due to the number of producers, the small number of raw material suppliers and the fungible nature of the product. Due to shipping costs, competition is usually regional, instead of national, in scope. The principal areas of competition are a combination of price, service, warranty, and product performance. Northern Pipe and Vinyltech compete not only against other plastic pipe manufacturers, but also ductile iron, steel, concrete and clay pipe producers. Pricing pressure will continue to affect operating margins in the future.
Northern Pipe and Vinyltech intend to continue to compete on the basis of their high quality products, cost-effective production techniques and close customer relations and support.
| 25 |
Manufacturing and Resin Supply
PVC pipe is manufactured through a process known as extrusion. During the production process, PVC compound (a dry powder-like substance) is introduced into an extrusion machine, where it is heated to a molten state and then forced through a sizing apparatus to produce the pipe. The newly extruded pipe is then pulled through a series of water cooling tanks, marked to identify the type of pipe and cut to finished lengths. Warehouse and outdoor storage facilities are used to store the finished product. Inventory is shipped from storage to distributors and customers by common carrier.
The PVC resins are acquired in bulk and shipped to point of use by rail car. There are a limited number of third party vendors that supply the PVC resin used by Northern Pipe and Vinyltech. Two vendors provided approximately 96% and 98% of total resin purchases in 2015 and 2014, respectively. The supply of PVC resin may also be limited primarily due to manufacturing capacity and the limited availability of raw material components. A majority of U.S. resin production plants are located in the Gulf Coast region, which is subject to risk of damage to the plants and potential shutdown of resin production because of exposure to hurricanes that occur in that part of the United States. The loss of a key vendor, or any interruption or delay in the supply of PVC resin, could disrupt the ability of the Plastics segment to manufacture products, cause customers to cancel orders or require incurrence of additional expenses to obtain PVC resin from alternative sources, if such sources were available. Both Northern Pipe and Vinyltech believe they have good relationships with their key raw material vendors.
Due to the commodity nature of PVC resin and PVC pipe and the dynamic supply and demand factors worldwide, historically the markets for both PVC resin and PVC pipe have been very cyclical with significant fluctuations in prices and gross margins.
Capital Expenditures
Capital expenditures in the Plastics segment typically include investments in extrusion machines, land and buildings and management information systems. During 2015, cash expenditures for capital additions in the Plastics segment were approximately $4 million. Total capital expenditures for the five-year period 2016-2020 are estimated to be approximately $17 million to replace existing equipment.
Employees
At December 31, 2015 the Plastics segment had 155 full-time employees. Northern Pipe had 90 full-time employees and Vinyltech had 65 full-time employees as of December 31, 2015.
RISK FACTORS AND CAUTIONARY STATEMENTS
Our businesses are subject to various risks and uncertainties. Any of the risks described below or elsewhere in this Annual Report on Form 10-K or in our other SEC filings could materially adversely affect our business, financial condition and results of operations.
GENERAL
Federal and state environmental regulation could require us to incur substantial capital expenditures and increased operating costs.
We are subject to federal, state and local environmental laws and regulations relating to air quality, water quality, waste management, natural resources and health safety. These laws and regulations regulate the modification and operation of existing facilities, the construction and operation of new facilities and the proper storage, handling, cleanup and disposal of hazardous waste and toxic substances. Compliance with these legal requirements requires us to commit significant resources and funds toward environmental monitoring, installation and operation of pollution control equipment, payment of emission fees and securing environmental permits. Obtaining environmental permits can entail significant expense and cause substantial construction delays. Failure to comply with environmental laws and regulations, even if caused by factors beyond our control, may result in civil or criminal liabilities, penalties and fines.
Existing environmental laws or regulations may be revised and new laws or regulations may be adopted or become applicable to us. Revised or additional regulations, which result in increased compliance costs or additional operating restrictions, particularly if those costs are not fully recoverable from customers, could have a material effect on our results of operations.
| 26 |
Volatile financial markets and changes in our debt ratings could restrict our ability to access capital and increase borrowing costs and pension plan and postretirement health care expenses.
We rely on access to both short- and long-term capital markets as a source of liquidity for capital requirements not satisfied by cash flows from operations. If we are unable to access capital at competitive rates, our ability to implement our business plans may be adversely affected. Market disruptions or a downgrade of our credit ratings may increase the cost of borrowing or adversely affect our ability to access one or more financial markets.
Disruptions, uncertainty or volatility in the financial markets can also adversely impact our results of operations, the ability of customers to finance purchases of goods and services, and our financial condition, as well as exert downward pressure on stock prices and/or limit our ability to sustain our current common stock dividend level.
Changes in the U.S. capital markets could also have significant effects on our pension plan. Our pension income or expense is affected by factors including the market performance of the assets in the master pension trust maintained for the pension plan for some of our employees, the weighted average asset allocation and long-term rate of return of our pension plan assets, the discount rate used to determine the service and interest cost components of our net periodic pension cost and assumed rates of increase in our employees’ future compensation. If our pension plan assets do not achieve positive rates of return, or if our estimates and assumed rates are not accurate, our earnings may decrease because net periodic pension costs would rise and we could be required to provide additional funds to cover our obligations to employees under the pension plan.
A discretionary contribution of $10.0 million was made to our defined benefit pension plan in January 2016. We could be required to contribute additional capital to the pension plan in the future if the market value of pension plan assets significantly declines, plan assets do not earn in line with our long-term rate of return assumptions or relief under the Pension Protection Act is no longer granted.
Any significant impairment of our goodwill would cause a decrease in our asset values and a reduction in our net operating income.
We had approximately $39.7 million of goodwill recorded on our consolidated balance sheet as of December 31, 2015. We have recorded goodwill for businesses in our Manufacturing and Plastics business segments. If we make changes in our business strategy or if market or other conditions adversely affect operations in any of these businesses, we may be forced to record an impairment charge, which would lead to decreased assets and a reduction in net operating performance. Goodwill is tested for impairment annually or whenever events or changes in circumstances indicate impairment may have occurred. If the testing performed indicates that impairment has occurred, we are required to record an impairment charge for the difference between the carrying amount of the goodwill and the implied fair value of the goodwill in the period the determination is made. The testing of goodwill for impairment requires us to make significant estimates about our future performance and cash flows, as well as other assumptions. These estimates can be affected by numerous factors, including changes in economic, industry or market conditions, changes in business operations, future business operating performance, changes in competition or changes in technologies. Any changes in key assumptions, or actual performance compared with key assumptions, about our business and its future prospects or other assumptions could affect the fair value of one or more business segments, which may result in an impairment charge.
Declines in projected operating cash flows at any of our reporting units may result in goodwill impairments that could adversely affect our results of operations and financial position, as well as financing agreement covenants. An assessment of the carrying amounts of the goodwill of our reporting units reported under continuing operations as of December 31, 2015 indicated the fair values are substantially in excess of their respective book values and not impaired.
The inability of our subsidiaries to provide sufficient earnings and cash flows to allow us to meet our financial obligations and debt covenants and pay dividends to our shareholders could have an adverse effect on the Company.
Otter Tail Corporation is a holding company with no significant operations of its own. The primary source of funds for payment of our financial obligations and dividends to our shareholders is from cash provided by our subsidiary companies. Our ability to meet our financial obligations and pay dividends on our common stock principally depends on the actual and projected earnings, cash flows, capital requirements and general financial position of our subsidiary companies, as well as regulatory factors, financial covenants, general business conditions and other matters.
Under our $150 million revolving credit agreement we may not permit the ratio of our Interest-bearing Debt to Total Capitalization to be greater than 0.60 to 1.00. OTP may not permit the ratio of its Interest-bearing Debt to Total Capitalization to be greater than 0.60 to 1.00 under its $170 million revolving credit agreement. Both credit agreements contain restrictions on the payment of cash dividends on a default or event of default. As of December 31, 2015 we were in compliance with the debt covenants.
| 27 |
Under the Federal Power Act, a public utility may not pay dividends from any funds properly included in a capital account. What constitutes “funds properly included in a capital account” is undefined in the Federal Power Act or the related regulations; however, FERC has consistently interpreted the provision to allow dividends to be paid as long as (1) the source of the dividends is clearly disclosed, (2) the dividend is not excessive and (3) there is no self-dealing on the part of corporate officials. The MPUC indirectly limits the amount of dividends OTP can pay to us by requiring an equity-to-total-capitalization ratio between 46.9% and 57.3%. OTP’s equity-to-total-capitalization ratio was 51.6% as of December 31, 2015.
While these restrictions are not expected to affect our ability to pay dividends at the current level in the foreseeable future, there is no assurance that adverse financial results would not reduce or eliminate our ability to pay dividends. Our dividend payout ratio has exceeded our earnings (losses) in two of the last five years.
We rely on our information systems to conduct our business, and failure to protect these systems against security breaches or cyber-attacks could adversely affect our business and results of operations. Additionally, if these systems fail or become unavailable for any significant period of time, our business could be harmed.
Our electric utility company, OTP, owns electric transmission and generation facilities subject to mandatory and enforceable standards advanced by the NERC. These bulk electric system facilities provide the framework for the electrical infrastructure of OTP’s service territory and interconnected systems, the operation of which is dependent on information technology systems. Further, the information systems that operate OTP’s electric system are interconnected to external networks. Parties that wish to disrupt the U.S. bulk power system or OTP’s operations could view OTP’s computer systems, software or networks as attractive targets for cyber-attack.
All of our businesses require us to collect and maintain sensitive customer data, as well as confidential employee and shareholder information, which is subject to electronic theft or loss. We also use third-party vendors to electronically process certain of our business transactions. The efficient operation of our business is dependent on computer hardware and software systems. Information systems, both ours and those of third-party information processors, are vulnerable to security breach by computer hackers and cyber terrorists.
A successful cyber-attack on the systems that control our generation, transmission, distribution or other assets could severely disrupt business operations, preventing us from serving customers or collecting revenues. The breach of certain business systems could affect our ability to correctly record, process and report financial information and transactions. A major cyber incident could result in significant expenses to investigate and repair security breaches or system damage and could lead to litigation, fines, other remedial action, heightened regulatory scrutiny and damage to our reputation. In addition, the misappropriation, corruption or loss of personally identifiable information and other confidential data could lead to significant breach notification expenses and mitigation expenses such as credit monitoring. We have cybersecurity insurance related to a breach event covering expenses for notification, credit monitoring, investigation, crisis management, public relations and legal advice. The policy also provides coverage for regulatory action defense including fines and penalties, potential payment card industry fines and penalties and costs related to cyber extortion. We also maintain property and casualty insurance that may cover certain physical damage or third party injuries caused by potential cybersecurity incidents. However, damage and claims arising from such incidents may not be covered or may exceed the amount of any insurance available.
OTP is subject to mandatory cybersecurity regulatory requirements. OTP implements the NERC standards for operating its transmission and generation assets and stays abreast of best practices within business and the utility industry to protect its computers and computer controlled systems from outside attack. We rely on industry accepted security measures and technology to securely maintain confidential and proprietary information maintained on our information systems. In an effort to reduce the likelihood and severity of cyber intrusions, we have cybersecurity processes and controls designed to protect and preserve the confidentiality, integrity and availability of data and systems. However, all these measures and technology may not adequately prevent security breaches or cyber-attacks. In addition, the unavailability of the information systems or failure of these systems to perform as anticipated for any reason could disrupt our business and could result in decreased performance and increased overhead costs, causing our business and results of operations to suffer. Any significant interruption or failure of our information systems or any significant breach of security due to cyber-attacks, hacking or internal security breaches could adversely affect our business and results of operations.
Economic conditions could negatively impact our businesses.
Our businesses are affected by local, national and worldwide economic conditions. Tightening of credit in financial markets could adversely affect the ability of customers to finance purchases of our goods and services, resulting in decreased orders, cancelled or deferred orders, slower payment cycles, and increased bad debt and customer bankruptcies. Our businesses may also be adversely affected by decreases in the general level of economic activity, such as decreases in business and consumer
| 28 |
spending. A decline in the level of economic activity and uncertainty regarding energy and commodity prices could adversely affect our results of operations and our future growth.
If we are unable to achieve the organic growth we expect, our financial performance may be adversely affected.
We expect much of our growth in the next few years will come from major capital investment at existing companies. To achieve the organic growth we expect, we will have to have access to the capital markets, be successful with capital expansion programs related to organic growth, develop new products and services, expand our markets and increase efficiencies in our businesses. Competitive and economic factors could adversely affect our ability to do this. If we are unable to achieve and sustain consistent organic growth, we will be less likely to meet our revenue growth targets, which, together with any resulting impact on our net income growth, may adversely affect the market price of our common shares.
Our plans to grow and realign our business mix through capital projects, acquisitions and dispositions may not be successful, which could result in poor financial performance.
As part of our business strategy, we intend to increase capital expenditures in our existing businesses and to continually assess our mix of businesses and potential strategic acquisitions or dispositions. There are risks associated with capital expenditures including not being granted timely or full recovery of rate base additions in our regulated utility business and the inability to recover the cost of capital additions due to an economic downturn, lack of markets for new products, competition from producers of lower cost or alternative products, product defects or loss of customers. We may not be able to identify appropriate acquisition candidates or successfully negotiate, finance or integrate acquisitions. Future acquisitions could involve numerous risks including: difficulties in integrating the operations, services, products and personnel of the acquired business; and the potential loss of key employees, customers and suppliers of the acquired business. If we are unable to successfully manage these risks, we could face reductions in net income in future periods.
We may, from time to time, sell assets to provide capital to fund investments in our electric utility business or for other corporate purposes, which could result in the recognition of a loss on the sale of any assets sold and other potential liabilities. The sale of any of our businesses also exposes us to additional risks associated with indemnification obligations under the applicable sales agreements and any related disputes.
As part of our business strategy, we continually assess our business portfolio to determine if our operating companies continue to meet our portfolio criteria. A loss on the sale of a business would be recognized if a company is sold for less than its book value.
In certain transactions we retain obligations that have arisen, or subsequently arise, out of our conduct of the business prior to the sale. These obligations are sometimes direct or, in other cases, take the form of an indemnification obligation to the buyer. These obligations include such things as warranty, environmental, and the collection of certain receivables. Unforeseen costs related to these obligations could result in future losses related to the business sold.
Significant warranty claims and remediation costs in excess of amounts normally reserved for such items could adversely affect our results of operations and financial condition.
Depending on the specific product or service, we may provide certain warranty terms against manufacturing defects and certain materials. We reserve for warranty claims based on industry experience and estimates made by management. For some of our products we have limited history on which to base our warranty estimate. Our assumptions could be materially different from any actual claim and could exceed reserve balances.
Expenses associated with remediation activities of our former wind tower manufacturer, could be substantial. The potential exists for multiple claims based on one defect repeated throughout the production process or for claims where the cost to repair or replace the defective part is highly disproportionate to the original cost of the part. If we are required to cover remediation expenses in addition to our regular warranty coverage, we could be required to accrue additional expenses and experience additional unplanned cash expenditures which could adversely affect our consolidated results of operations and financial condition.
We are subject to risks associated with energy markets.
Our businesses are subject to the risks associated with energy markets, including market supply and increasing energy prices. If we are faced with shortages in market supply, we may be unable to fulfill our contractual obligations to our retail, wholesale and other customers at previously anticipated costs. This could force us to obtain alternative energy or fuel supplies at higher costs or suffer increased liability for unfulfilled contractual obligations. Any significantly higher than expected energy or fuel costs would negatively affect our financial performance.
| 29 |
We are subject to risks and uncertainties related to the timing of recovery of deferred tax assets which could have a negative impact on our net income in future periods.
If taxable income is not generated in future periods in certain tax jurisdictions the recovery of deferred taxes related to accumulated tax benefits may be delayed and we may be required to record a reserve related to the uncertainty of the timing of recovery of deferred tax assets related to accumulated taxable losses in those tax jurisdictions. This would have a negative impact on the Company’s net income in the period the reserve is recorded.
ELECTRIC
We may experience fluctuations in revenues and expenses related to our electric operations, which may cause our financial results to fluctuate and could impair our ability to make distributions to shareholders or scheduled payments on our debt obligations, or to meet covenants under our borrowing agreements.
A number of factors, many of which are beyond our control, may contribute to fluctuations in our revenues and expenses from electric operations, causing our net income to fluctuate from period to period. These risks include fluctuations in the volume and price of sales of electricity to customers or other utilities, which may be affected by factors such as mergers and acquisitions of other utilities, geographic location of other utilities, transmission costs (including increased costs related to operations of regional transmission organizations), changes in the manner in which wholesale power is sold and purchased, unplanned interruptions at OTP’s generating plants, the effects of regulation and legislation, demographic changes in OTP’s customer base and changes in OTP’s customer demand or load growth. Electric wholesale margins have been significantly and adversely affected by increased efficiencies in the MISO market. Other risks include weather conditions or changes in weather patterns (including severe weather that could result in damage to OTP’s assets), fuel and purchased power costs and the rate of economic growth or decline in OTP’s service areas. A decrease in revenues or an increase in expenses related to our electric operations may reduce the amount of funds available for our existing and future businesses, which could result in increased financing requirements, impair our ability to make expected distributions to shareholders or impair our ability to make scheduled payments on our debt obligations, or to meet covenants under our borrowing agreements.
Actions by the regulators of our electric operations could result in rate reductions, lower revenues and earnings or delays in recovering capital expenditures.
We are subject to federal and state legislation, government regulations and regulatory actions that may have a negative impact on our business and results of operations. The electric rates that OTP is allowed to charge for its electric services are one of the most important items influencing our financial position, results of operations and liquidity. The rates that OTP charges its electric customers are subject to review and determination by state public utility commissions in Minnesota, North Dakota and South Dakota. OTP is also regulated by the FERC. Our ability to obtain rate adjustments to maintain reasonable rates of return depends on regulatory action under applicable statutes and regulations and we cannot provide assurance that rate adjustments will be obtained or reasonable authorized rates of return on capital will be earned. OTP will file rate cases with, or seek cost recovery authorization from, federal and state regulatory authorities. An adverse decision by one or more regulatory commissions concerning the level or method of determining electric utility rates, the authorized returns on equity, implementation of enforceable federal reliability standards or other regulatory matters, permitted business activities (such as ownership or operation of nonelectric businesses) or any prolonged delay in rendering a decision in a rate or other proceeding (including with respect to the recovery of capital expenditures in rates) could result in lower revenues and net income.
OTP’s operations are subject to an extensive legal and regulatory framework under federal and state laws as well as regulations imposed by other organizations that may have a negative impact on our business and results of operations.
We are subject to an extensive legal and regulatory framework imposed under federal and state law and regulatory agencies, including FERC and NERC. We could be subject to potential financial penalties for compliance violations. In addition, energy policy initiatives at the state or federal level could increase incentives for distributed generation, municipal utility ownership, or local initiatives could introduce generation or distribution requirements, that could change the current integrated utility model. Our transmission systems and electric generation facilities are subject to the NERC mandatory reliability standards, including cybersecurity standards. If a serious reliability incident did occur, it could have a material effect on our operations or financial results. Some states have the authority to impose substantial penalties in the event of non-compliance. We attempt to mitigate the risk of regulatory penalties through formal training. However, there is no guarantee our compliance program will be sufficient to ensure against violations.
| 30 |
These laws and regulations significantly influence our operations and may affect our ability to recover costs from our customers. We are required to have numerous permits, licenses, approvals and certificates from the agencies and other organizations that regulate our business. We believe we have obtained the necessary approvals for our existing operations and that our business is conducted in accordance with applicable laws; however, we are unable to predict the impact on our operating results from the future regulatory activities of any of these agencies and other organizations. Changes in regulations or the imposition of additional regulations could have a material adverse impact on our results of operations.
OTP’s electric generating facilities are subject to operational risks that could result in unscheduled plant outages, unanticipated operation and maintenance expenses and increased power purchase costs.
Operation of electric generating facilities involves risks which can adversely affect energy output and efficiency levels. Most of OTP’s generating capacity is coal-fired. OTP relies on a limited number of suppliers of coal, making it vulnerable to increased prices for fuel as existing contracts expire or in the event of unanticipated interruptions in fuel supply. OTP is a captive rail shipper of the BNSF Railway for shipments of coal to its Big Stone and Hoot Lake plants, making it vulnerable to increased prices for coal transportation from a sole supplier and disruptions in coal deliveries due to rail line congestion and constraints on the rail lines between the coal source mines and the plants. Higher fuel prices result in higher electric rates for OTP’s retail customers through fuel clause adjustments and could make it less competitive in wholesale electric markets. Operational risks also include facility shutdowns due to breakdown or failure of equipment or processes, labor disputes, operator error and catastrophic events such as fires, explosions, floods, intentional acts of destruction or other similar occurrences affecting OTP’s electric generating facilities. The loss of a major generating facility would require OTP to find other sources of supply, if available, and expose it to higher purchased power costs.
Changes to regulation of generating plant emissions, including but not limited to CO2 emissions, could affect our operating costs and the costs of supplying electricity to our customers.
Existing or new laws or regulations passed or issued by federal or state authorities addressing climate change or reductions of GHG emissions, such as mandated levels of renewable generation, mandatory reductions in CO2 emission levels, taxes on CO2 emissions or cap and trade regimes, could require us to incur significant new costs, which could negatively impact our net income, financial position and operating cash flows if such costs cannot be recovered through rates granted by ratemaking authorities in the states where OTP provides service or through increased market prices for electricity. Debate continues in Congress on the direction and scope of U.S. policy on climate change and regulation of GHGs. Congress has considered but has not adopted GHG legislation which would require a reduction in GHG emissions and there is no legislation under active consideration at this time. The likelihood of any federal mandatory CO2 emissions reduction program being adopted by Congress in the near future, and the specific requirements of any such program, are uncertain.
In 2014, the EPA published proposed standards of performance for CO2 emissions from new fossil fuel-fired power plants, proposed CO2 emission guidelines for existing fossil fuel-fired power plants and proposed CO2 standards of performance for CO2 emissions from reconstructed and modified fossil fuel-fired power plants, essentially requiring that such plants install updated control technology when constructing, modifying or reconstructing to reduce their emissions. The EPA published final rules for each of these proposals on October 23, 2015. On February 9, 2016 the U.S. Supreme Court granted a stay of the CO2 emission guidelines for existing fossil fuel-fired power plants, pending disposition of petitions for review in the D.C. Circuit and disposition of a petition for a writ of certiorari seeking review by the U.S. Supreme Court, if such a writ is sought. For existing sources, under the EPA final rules, states were required to develop and submit plans, either individually or with other states, spelling out how they will achieve the individualized, reduced CO2 emission rates that the EPA has identified. Those state plans were due by September 6, 2016, or at a minimum states were required to make an initial submittal by that date in order to receive a two-year extension, such that final state plans were due by September 6, 2018. OTP is participating in state planning activities along with other stakeholders. Currently, we do not know what type of plans states might adopt, the components of those plans or how those plans might specifically impact our operations. In addition, the rules are subject to pending judicial challenges, and consequently, uncertainty regarding the status of the rules will likely continue for some time. OTP is assessing the potential impact of the EPA’s final rules on existing affected sources of CO2 emissions at OTP. The final outcome of this rulemaking process could have a material adverse impact on our business and financial results.
MANUFACTURING
Competition from foreign and domestic manufacturers, the price and availability of raw materials, prices and supply of scrap or recyclable material and general economic conditions could affect the revenues and earnings of our manufacturing businesses.
Our manufacturing businesses are subject to intense risks associated with competition from foreign and domestic manufacturers, many of whom have broader product lines, greater distribution capabilities, greater capital resources, larger marketing, research and development staffs and facilities and other capabilities that may place downward pressure on margins and profitability. The companies in our Manufacturing segment use a variety of raw materials in the products they
| 31 |
manufacture, including steel, aluminum and polystyrene and other plastics resins. Costs for these items can fluctuate significantly. If our manufacturing businesses are not able to pass on cost increases to their customers, it could have a negative effect on profit margins in our Manufacturing segment. Additionally, a certain amount of residual material, scrap, is a by-product of many of the manufacturing and production processes used by our manufacturing companies. Declines in commodity prices for these scrap materials due to weakened demand or excess supply, can negatively impact the profitability of our manufacturing companies as it reduces their ability to mitigate the cost associated with excess material.
Each of our manufacturing companies has significant customers and concentrated sales to such customers. If our relationships with significant customers should change materially, it would be difficult to immediately and profitably replace lost sales.
PLASTICS
Our plastics operations are highly dependent on a limited number of vendors for PVC resin and a limited supply of PVC resin. The loss of a key vendor, or any interruption or delay in the supply of PVC resin, could result in reduced sales or increased costs for our plastics business.
We rely on a limited number of vendors to supply the PVC resin used in our plastics business. Two vendors accounted for approximately 96% of our total purchases of PVC resin in 2015 and approximately 98% of our total purchases of PVC resin in 2014. In addition, the supply of PVC resin may be limited primarily due to manufacturing capacity and the limited availability of raw material components. A majority of U.S. resin production plants are located in the Gulf Coast region, which may increase the risk of a shortage of resin in the event of a hurricane or other natural disaster in that region. The loss of a key vendor or any interruption or delay in the availability or supply of PVC resin could disrupt our ability to deliver our plastic products, cause customers to cancel orders or require us to incur additional expenses to obtain PVC resin from alternative sources, if such sources are available.
We compete against a large number of other manufacturers of PVC pipe and manufacturers of alternative products. Customers may not distinguish our products from those of our competitors.
The plastic pipe industry is fragmented and competitive due to the number of producers and the fungible nature of the product. We compete not only against other plastic pipe manufacturers, but also against ductile iron, steel, concrete and clay pipe manufacturers. Due to shipping costs, competition is usually regional instead of national in scope, and the principal areas of competition are a combination of price, service, warranty, and product performance. Our inability to compete effectively in each of these areas and to distinguish our plastic pipe products from competing products may adversely affect the financial performance of our plastics business.
Reductions in PVC resin prices can negatively affect our plastics business.
The PVC pipe industry is highly sensitive to commodity raw material pricing volatility. Historically, when resin prices are rising or stable, margins and sales volume have been higher and when resin prices are falling, sales volumes and margins have been lower. Reductions in PVC resin prices could negatively affect PVC pipe prices, profit margins on PVC pipe sales and the value of our finished goods inventory.
Certain PVC resin producers in the United States have announced approximately 900 million pounds of resin production capacity additions to support the global market for PVC resin. These capacity additions are expected to come on line by the end of 2016. Should this capacity not be used to support the resin export market, vendors may take steps to have it absorbed in the U.S. resin market. If this occurs, our Plastics segment financial results could be adversely impacted by PVC resin pricing strategies implemented by U.S. producers to get this capacity absorbed in the U.S. PVC resin market.
| Item 1B. | UNRESOLVED STAFF COMMENTS |
None.
| Item 2. | PROPERTIES |
The Coyote Station, which commenced operation in 1981, is a 414,000 kW (nameplate rating) mine-mouth plant located in the lignite coal fields near Beulah, North Dakota and is jointly owned by OTP, Northern Municipal Power Agency, Montana-Dakota Utilities Co. and Northwestern Public Service Company. OTP is the operating agent of the Coyote Station and owns 35% of the plant.
| 32 |
OTP, jointly with Northwestern Public Service Company and Montana-Dakota Utilities Co., owns the 414,000 kW (nameplate rating) Big Stone Plant in northeastern South Dakota which commenced operation in 1975. OTP is the operating agent of Big Stone Plant and owns 53.9% of the plant.
Located near Fergus Falls, Minnesota, the Hoot Lake Plant is comprised of three separate generating units. The oldest Hoot Lake Plant generating unit, constructed in 1948 (7,500 kW nameplate rating), was retired on December 31, 2005. A second unit was added in 1959 (53,500 kW nameplate rating) and a third unit was added in 1964 (75,000 kW nameplate rating) and modified in 1988 to provide cycling capability, allowing this unit to be more efficiently brought online from a standby mode. The two generating units in operation have a combined nameplate rating of 128,500 kW.
OTP owns 27 wind turbines at the Langdon, North Dakota Wind Energy Center with a nameplate rating of 40,500 kW, 32 wind turbines at the Ashtabula Wind Energy Center located in Barnes County, North Dakota with a nameplate rating of 48,000 kW and 33 wind turbines at the Luverne Wind Farm located in Steele County, North Dakota with a nameplate rating of 49,500 kW.
As of December 31, 2015 OTP’s transmission facilities, which are interconnected with lines of other public utilities, consisted of 535 miles of 345 kV lines; 479 miles of 230 kV lines; 876 pole miles of 115 kV lines; and 3,972 miles of lower voltage lines, principally 41.6 kV. OTP owns the uprated portion of 48 pole miles of the 345 kV lines, with Minnkota Power Cooperative retaining title to the original 230 kV construction, and OTP owns an undivided interest in the remaining 345 kV line miles. OTP is a joint owner, with other regional utilities, in transmission lines with the following ownership interests: 14.8% in the 70 mile Bemidji-Grand Rapids 230 kV line, approximately 14.2% of 242 pole miles of energized line in the Fargo-Monticello 345 kV project and approximately 4.8% of 255 pole miles of energized line in the Brookings to Southeast Twin Cities 345 kV project.
In addition to the properties mentioned above, all of which are utilized by the Electric segment, the Company owns and has investments in offices and service buildings utilized by each of its manufacturing and plastic pipe companies. The Company’s subsidiaries own facilities and equipment used in: the manufacture of PVC pipe, thermoformed products, heavy metal fabricated products, metal parts stamping, fabricating, painting and contract machining.
Management of the Company believes the facilities and equipment described above are adequate for the Company's present businesses.
| Item 3. | LEGAL PROCEEDINGS |
The Company is the subject of various pending or threatened legal actions and proceedings in the ordinary course of its business. Such matters are subject to many uncertainties and to outcomes that are not predictable with assurance. The Company records a liability in its consolidated financial statements for costs related to claims, including future legal costs, settlements and judgments, where it has assessed that a loss is probable and an amount can be reasonably estimated. The Company believes the final resolution of currently pending or threatened legal and regulatory actions and proceedings, either individually or in the aggregate, will not have a material adverse effect on the Company’s consolidated financial position, results of operations or cash flows.
| Item 3A. | EXECUTIVE OFFICERS OF THE REGISTRANT (AS OF FEBRUARY 29, 2016) |
Set forth below is a summary of the principal occupations and business experience during the past five years of the executive officers as defined by rules of the SEC. Each of the executive officers, excluding John Abbott, has been employed by the Company for more than five years in an executive or management position either with the Company or its wholly owned subsidiary, Otter Tail Power Company.
| NAME AND AGE | DATES ELECTED TO OFFICE |
PRESENT POSITION AND BUSINESS EXPERIENCE | |
| Charles S. MacFarlane (51) | 4/13/15 | Present: | President and Chief Executive Officer |
| George A. Koeck (63) | 4/10/00 | Present: | Senior Vice President, General Counsel and Corporate Secretary |
| Kevin G. Moug (56) | 4/9/01 | Present: | Chief Financial Officer and Senior Vice President |
| Timothy J. Rogelstad (49) | 4/14/14 | Present: | Senior Vice President, Electric Platform |
| John Abbott (57) | 2/11/15 | Present: | Senior Vice President, Manufacturing Platform |
| 33 |
On April 13, 2015 Mr. MacFarlane was elected as the Company’s President and Chief Executive Officer and as member of the Company’s board of directors effective with the retirement of Edward J. McIntyre as Chief Executive Officer of the Company and as a member of the Company’s board of directors. On February 5, 2014 the Company’s board of directors appointed Mr. MacFarlane, then President and Chief Executive Officer of OTP and Senior Vice President, Electric Platform of the Company, to the role of President and Chief Operating Officer of the Company, effective April 14, 2014. Mr. MacFarlane joined OTP in 2001 and had served as its President from 2003 to 2014 and its Chief Executive Officer from 2007 to 2014. He served as Senior Vice President, Electric platform of the Company from 2012 to 2014. Prior to joining OTP, Mr. MacFarlane served as Director of Electric Distribution Planning and Engineering for Xcel Energy Inc.’s multi-state service territory. He was also Director of Delivery Construction and Field Operations for Northern States Power Company prior to its merger with New Centuries Energy and becoming Xcel Energy.
On April 14, 2014 Timothy J. Rogelstad was appointed to succeed Mr. MacFarlane as President of OTP and Senior Vice President, Electric Platform of the Company. Mr. Rogelstad joined OTP in June 1989 as an engineer in the System Engineering Department and served as Supervisor, Transmission Planning, and Manager, Delivery Planning, before being named Vice President, Asset Management, in 2012. In the role of Vice President, Asset Management at OTP, he was in charge of OTP’s Delivery Planning, Delivery Maintenance, Delivery Engineering, System Operations, and Project Management Departments. Mr. Rogelstad is a registered professional engineer in the three states where OTP serves, Minnesota, North Dakota, and South Dakota.
On February 5, 2015 John Abbott was selected to serve as Senior Vice President, Manufacturing Platform, and President of Varistar. For the past eight years Mr. Abbott has served as an officer and group vice president at Standex International Corporation (Standex), a group of restaurant equipment companies. During the past five years, Mr. Abbott served as Group Vice President, Food Service Equipment Group at Standex. In this role, Mr. Abbott was responsible for all strategic and operational aspects of the Food Service Equipment business. Prior to working at Standex, Mr. Abbott was with Pentair for 20 years, rising from product manager to president and global business unit leader of its water filtration division.
The term of office for each of the executive officers is one year and any executive officer elected may be removed by the vote of the board of directors at any time during the term. There are no family relationships between any of the executive officers or directors.
| Item 4. | Mine Safety Disclosures |
Not Applicable.
| 34 |
| Item 5. | MARKET FOR THE REGISTRANT'S COMMON EQUITY, RELATED STOCKHOLDER MATTERS AND ISSUER PURCHASES OF EQUITY SECURITIES |
The Company’s common stock is traded on the NASDAQ Global Select Market under the NASDAQ symbol “OTTR”. The information required by this Item can be found on Page 36 of this Annual Report on Form 10-K under the heading “Selected Financial Data,” on Page 95 under the heading “Retained Earnings and Dividend Restriction” and on Page 116 under the heading “Supplementary Financial Information.” The Company does not have a publicly announced stock repurchase program. The Company did not repurchase any equity securities during the three months ended December 31, 2015.
PERFORMANCE GRAPH
COMPARISON OF FIVE-YEAR CUMULATIVE TOTAL RETURN
This graph compares the cumulative total shareholder return on the Company’s common shares for the last five fiscal years with the cumulative return of The NASDAQ Stock Market Index and the Edison Electric Institute (EEI) Index over the same period (assuming the investment of $100 in each vehicle on December 31, 2010, and reinvestment of all dividends).
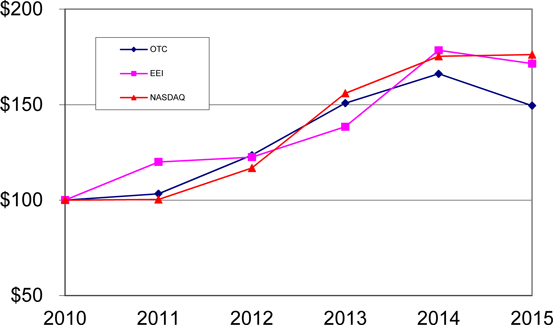
| 2010 | 2011 | 2012 | 2013 | 2014 | 2015 | |||||||||||||||||||
| OTC | $ | 100.00 | $ | 103.33 | $ | 123.51 | $ | 150.77 | $ | 166.14 | $ | 149.44 | ||||||||||||
| EEI | $ | 100.00 | $ | 119.99 | $ | 122.49 | $ | 138.43 | $ | 178.45 | $ | 171.48 | ||||||||||||
| NASDAQ | $ | 100.00 | $ | 100.31 | $ | 116.79 | $ | 155.90 | $ | 175.33 | $ | 176.17 | ||||||||||||
| 35 |
| Item 6. | SELECTED FINANCIAL DATA |
| (thousands, except number of shareholders and per-share data) | 2015 | 2014 | 2013 | 2012 | 2011 | |||||||||||||||
| Revenues | ||||||||||||||||||||
| Electric | $ | 407,131 | $ | 407,743 | $ | 373,540 | $ | 350,765 | $ | 342,727 | ||||||||||
| Manufacturing | 215,011 | 219,583 | 204,997 | 208,965 | 189,459 | |||||||||||||||
| Plastics | 157,758 | 172,050 | 164,957 | 150,517 | 123,669 | |||||||||||||||
| Intersegment Eliminations | (96 | ) | (114 | ) | (80 | ) | (82 | ) | (174 | ) | ||||||||||
| Total Operating Revenues | $ | 779,804 | $ | 799,262 | $ | 743,414 | $ | 710,165 | $ | 655,681 | ||||||||||
| Net Income from Continuing Operations | $ | 58,589 | $ | 56,883 | $ | 48,595 | $ | 46,034 | $ | 36,546 | ||||||||||
| Net Income (Loss) from Discontinued Operations | 756 | 840 | 2,270 | (51,307 | ) | (49,789 | ) | |||||||||||||
| Net Income (Loss) | $ | 59,345 | $ | 57,723 | $ | 50,865 | $ | (5,273 | ) | $ | (13,243 | ) | ||||||||
| Operating Cash Flow from Continuing Operations | $ | 131,540 | $ | 125,769 | $ | 142,408 | $ | 155,026 | $ | 94,008 | ||||||||||
| Operating Cash Flow - Continuing and Discontinued Operations | 117,540 | 112,474 | 147,781 | 233,547 | 104,383 | |||||||||||||||
| Capital Expenditures - Continuing Operations | 160,084 | 163,582 | 159,833 | 114,186 | 64,715 | |||||||||||||||
| Total Assets (1) | 1,820,904 | 1,740,699 | 1,560,567 | 1,571,373 | 1,692,211 | |||||||||||||||
| Long-Term Debt | 445,945 | 498,489 | 389,589 | 421,680 | 471,915 | |||||||||||||||
| Basic Earnings Per Share - Continuing Operations (2) | 1.56 | 1.56 | 1.33 | 1.25 | 1.00 | |||||||||||||||
| Basic Earnings (Loss) Per Share - Total (2) | 1.58 | 1.58 | 1.39 | (0.17 | ) | (0.40 | ) | |||||||||||||
| Diluted Earnings Per Share - Continuing Operations (2) | 1.56 | 1.55 | 1.33 | 1.25 | 0.99 | |||||||||||||||
| Diluted Earnings (Loss) Per Share - Total (2) | 1.58 | 1.57 | 1.39 | (0.17 | ) | (0.40 | ) | |||||||||||||
| Return on Average Common Equity (3) | 10.1 | % | 10.4 | % | 9.5 | % | (1.1 | )% | (2.3 | )% | ||||||||||
| Dividends Declared Per Common Share | 1.23 | 1.21 | 1.19 | 1.19 | 1.19 | |||||||||||||||
| Dividend Payout Ratio | 78 | % | 77 | % | 86 | % | — | — | ||||||||||||
| Common Shares Outstanding - Year End | 37,857 | 37,218 | 36,272 | 36,168 | 36,102 | |||||||||||||||
| Number of Common Shareholders (4) | 14,062 | 14,134 | 14,252 | 14,584 | 14,687 | |||||||||||||||
(1) 2011-2014 restated in 2015 to reflect the netting of current deferred income tax assets with long-term deferred income tax liabilities on adoption of Accounting Standards Update 2015-17.
(2) Based on average number of shares outstanding.
(3) Earnings available for common shares divided by the 13-month average of month-end common equity balances.
(4) Holders of record at year end.
| Item 7. | MANAGEMENT'S DISCUSSION AND ANALYSIS OF FINANCIAL CONDITION AND RESULTS OF OPERATIONS |
Overview
Otter Tail Corporation and its subsidiaries form a diverse group of businesses with operations classified into three segments: Electric, Manufacturing and Plastics. Our primary financial goals are to maximize earnings and cash flows and to allocate capital profitably toward growth opportunities that will increase shareholder value. Meeting these objectives enables us to preserve and enhance our financial capability by maintaining desired capitalization ratios and a strong interest coverage position and preserving investment grade credit ratings on outstanding securities, which, in the form of lower interest rates, benefits both our customers and shareholders.
Our strategy is to continue to grow our largest business, the regulated electric utility, which will lower our overall risk, create a more predictable earnings stream, improve our credit quality and preserve our ability to fund the dividend. Over time, we expect the electric utility business will provide approximately 75% to 85% of our overall earnings. We expect our manufacturing and plastic pipe businesses will provide 15% to 25% of our earnings, and will continue to be a fundamental part of our strategy. The actual mix of earnings from continuing operations in 2015, 2014 and 2013 was 83%, 77% and 80%, respectively, from our electric utility business and 17%, 23% and 20%, respectively, from our manufacturing and plastic pipe businesses, including unallocated corporate costs.
Reliable utility performance along with rate base investment opportunities over the next five years will provide us with a strong base of revenues, earnings and cash flows. We also look to our manufacturing and plastic pipe companies to provide organic growth as well. Organic, internal growth comes from new products and services, market expansion and increased efficiencies. We expect much of our growth in these businesses in the next few years will come from utilizing expanded plant capacity from capital investments made in previous years. We will also evaluate opportunities to allocate capital to potential acquisitions in our Manufacturing segment. We are a committed long-term owner and therefore we do not acquire companies in pursuit of short-term gains. However, we will divest operating companies that no longer fit into our strategy and risk profile over the long term.
| 36 |
We have taken steps to realign our portfolio of businesses and refocus our capital investment in the electric utility. Over the last five years we sold several businesses in execution of our announced strategy. In 2011, we sold Idaho Pacific Holdings, Inc., our Food Ingredient Processing business, and E.W. Wylie Corporation (Wylie), our trucking company, which was included in our former Wind Energy segment. In January 2012, we sold the assets of Aviva Sports, Inc. (Aviva), a recreational equipment manufacturer. In February 2012, the Company sold DMS Health Technologies, Inc. (DMS), our former Health Services segment business. In November 2012, we completed the sale of the assets of our wind tower manufacturing business. On February 8, 2013 we sold substantially all the assets of our dock and boatlift company. On February 28, 2015 we sold the assets of AEV, Inc., our former energy and electrical construction contractor headquartered in Moorhead, Minnesota, and on April 30, 2015 we sold Foley Company (Foley), our former water, wastewater, power and industrial construction contractor headquartered in Kansas City, Missouri. With the sale of these two companies in 2015 the Company eliminated its Construction segment.
On September 1, 2015 Miller Welding & Iron Works, Inc. (BTD-Illinois), a wholly owned subsidiary of BTD Manufacturing, Inc. (BTD), acquired the assets of Impulse Manufacturing, Inc. (Impulse) of Dawsonville, Georgia for $30.8 million in cash, subject to a post-closing adjustment. Impulse, a full-service, high-tech metal fabricator located 30 miles north of Atlanta, Georgia, recorded revenues of $27 million in 2014. Impulse offers a wide range of metal fabrication services ranging from simple laser cutting services and high volume stamping to complex weldments and assemblies for metal fabrication buyers and original equipment manufacturers. The newly acquired business will operate under the name BTD-Georgia.
In evaluating our portfolio of operating companies, we look for the following characteristics:
| · | A threshold level of net earnings and a return on invested capital in excess of our weighted average cost of capital within three years of the acquisition. |
| · | Is manufacturing centric with a sustainable competitive advantage. |
| · | An ability to quickly adapt to changing economic cycles. |
| · | A strong management team committed to operational excellence. |
Major growth strategies and initiatives in our future include:
| · | Planned capital budget expenditures of up to $972 million for the years 2016 through 2020, of which $858 million are for capital projects at Otter Tail Power Company (OTP), including $213 million for transmission projects designated by the Midcontinent Independent System Operator, Inc. (MISO) as Multi-Value Projects (MVPs), $162 million for natural gas-fired generation to replace Hoot Lake Plant capacity and $190 million for renewable wind and solar energy generation assets. The remainder of OTP’s 2016-2020 anticipated capital expenditures is for asset replacements, additions and improvements across OTP’s generation, transmission, distribution and general plant. See “Capital Requirements” section for further discussion. |
| · | Continued investigation and evaluation of organic growth opportunities and evaluation of opportunities to allocate capital to potential acquisitions in our Manufacturing segment. |
In 2015:
| · | Our net cash from continuing operations was $131.5 million. |
| · | We raised net proceeds of $13.8 million from the issuance of 382,882 shares of common stock through our stock plans and the sale of 133,197 shares of common stock through our At-the-Market offering program. |
| · | Our Electric segment net income increased 10.7% to $48.4 million from $43.7 million in 2014. |
| · | The five-year extension of bonus depreciation in December 2015 likely impacted Otter Tail Corporation more than other companies in the sector due to the unusually large amount of utility plant placed in service in 2015 as a result of the Big Stone Plant AQCS and transmission projects being completed. This resulted in a consolidated net operating loss for tax purposes, which caused us to lose the Domestic Production Activities Deduction (Section 199). The tax law change also included a permanent reinstatement of the research and development tax credit. Together the changes in the tax law resulted in a $0.03 reduction in our 2015 diluted earnings per share. |
| · | Our Plastics segment net income was unchanged between the years at $12.1 million in both 2015 and 2014. |
| · | Our Manufacturing segment net income decreased 54.6% to $4.2 million from $9.4 million in 2014. Manufacturing segment net income in 2015 was negatively impacted by lower sales to manufacturers of oil and gas exploration and extraction, agricultural and recreational equipment and lower scrap metal prices. |
| 37 |
The following table summarizes our consolidated results of operations for the years ended December 31:
| (in thousands) | 2015 | 2014 | ||||||
| Operating Revenues: | ||||||||
| Electric | $ | 407,039 | $ | 407,629 | ||||
| Manufacturing | 215,011 | 219,583 | ||||||
| Plastics | 157,754 | 172,050 | ||||||
| Total Operating Revenues | $ | 779,804 | $ | 799,262 | ||||
| Net Income (Loss) From Continuing Operations: | ||||||||
| Electric | $ | 48,370 | $ | 43,684 | ||||
| Manufacturing | 4,247 | 9,361 | ||||||
| Plastics | 12,108 | 12,085 | ||||||
| Corporate | (6,136 | ) | (8,247 | ) | ||||
| Total Net Income From Continuing Operations: | $ | 58,589 | $ | 56,883 | ||||
Revenues decreased in each of our business segments in 2015 compared with 2014, but most significantly in our Plastics segment, where revenues were down $14.3 million (8.3%) mainly due to lower polyvinyl chloride (PVC) pipe prices driven by lower raw material costs, but also due to a 1.4% decrease in pounds of PVC pipe sold. Manufacturing segment revenues decreased $4.6 million, reflecting a $6.6 million decrease in BTD revenues, offset by a $2.0 million increase in revenues at T.O. Plastics, Inc. (T.O. Plastics). Excluding $8.8 million in revenues from BTD-Georgia, acquired in September 2015, BTD’s revenue from Illinois and Minnesota operations were down $15.4 million in 2015 compared with 2014 mainly due to reductions in sales to manufacturers of equipment used in oil and gas exploration and extraction and farming, and reductions in revenue from the sale of scrap metal. Numerous offsetting factors contributed to a $0.6 million net decrease in Electric segment revenues between the years.
The $1.7 million increase in net income from continuing operations in 2015 compared with 2014 reflects the following:
| · | A $4.7 million increase in Electric segment net income due to increased transmission tariff and retail rider revenues and significant reductions in fuel and other operating expenses. |
| · | A $5.1 million decrease in Manufacturing and Plastics segments net income mainly due to lower sales and profits at BTD. |
| · | A $2.1 million net-of-tax decrease in Corporate operating expenses primarily reflects the impact of the $1.8 million in net-of-tax airplane lease expense and exit costs incurred in 2014. |
Following is a more detailed analysis of our operating results by business segment for the years ended December 31, 2015, 2014 and 2013, followed by a discussion of our financial position at the end of 2015 and our outlook for 2016.
Results of Operations
This discussion and analysis should be read in conjunction with our consolidated financial statements and related notes. See note 2 to consolidated financial statements for a complete description of our lines of business, locations of operations and principal products and services.
Intersegment Eliminations—Amounts presented in the following segment tables for 2015, 2014 and 2013 operating revenues, cost of goods sold and other nonelectric operating expenses will not agree with amounts presented in the consolidated statements of income due to the elimination of intersegment transactions. The amounts of intersegment eliminations by income statement line item are listed below:
| Intersegment Eliminations (in thousands) | 2015 | 2014 | 2013 | |||||||||
| Operating Revenues: | ||||||||||||
| Electric | $ | 92 | $ | 114 | $ | 78 | ||||||
| Product Sales | 4 | — | 2 | |||||||||
| Cost of Products Sold | 9 | 45 | 10 | |||||||||
| Other Nonelectric Expenses | 87 | 69 | 70 | |||||||||
| 38 |
Electric
The following table summarizes the results of operations for our Electric segment for the years ended December 31:
| (in thousands) | 2015 | % change | 2014 | % change | 2013 | |||||||||||||||
| Retail Sales Revenues | $ | 364,614 | 1 | $ | 361,100 | 10 | $ | 328,758 | ||||||||||||
| Wholesale Revenues – Company Generation | 2,499 | (78 | ) | 11,160 | (25 | ) | 14,846 | |||||||||||||
| Net Revenue – Energy Trading Activity | 186 | (82 | ) | 1,031 | (36 | ) | 1,615 | |||||||||||||
| Other Revenues | 39,832 | 16 | 34,452 | 22 | 28,321 | |||||||||||||||
| Total Operating Revenues | $ | 407,131 | — | $ | 407,743 | 9 | $ | 373,540 | ||||||||||||
| Production Fuel | 42,744 | (36 | ) | 67,216 | (6 | ) | 71,248 | |||||||||||||
| Purchased Power – System Use | 78,150 | 19 | 65,848 | 27 | 52,006 | |||||||||||||||
| Other Operation and Maintenance Expenses | 140,768 | (1 | ) | 141,936 | 6 | 133,395 | ||||||||||||||
| Depreciation and Amortization | 44,786 | 2 | 44,076 | 2 | 43,125 | |||||||||||||||
| Property Taxes | 13,512 | 7 | 12,607 | 11 | 11,311 | |||||||||||||||
| Operating Income | $ | 87,171 | 15 | $ | 76,060 | 22 | $ | 62,455 | ||||||||||||
| Electric kilowatt-hour (kwh) Sales (in thousands) | ||||||||||||||||||||
| Retail kwh Sales | 4,593,604 | (2 | ) | 4,695,062 | 5 | 4,487,541 | ||||||||||||||
| Wholesale kwh Sales – Company Generation | 107,510 | (61 | ) | 273,454 | (42 | ) | 471,474 | |||||||||||||
| Wholesale kwh Sales – Purchased Power Resold | 5,547 | (68 | ) | 17,303 | (90 | ) | 172,404 | |||||||||||||
| Heating Degree Days | 5,633 | (22 | ) | 7,205 | (2 | ) | 7,344 | |||||||||||||
| Cooling Degree Days | 483 | 32 | 367 | (28 | ) | 510 | ||||||||||||||
2015 Compared with 2014
Retail sales revenue increased $3.5 million mainly as a result of:
| · | An $8.7 million increase in Environmental Cost Recovery (ECR) rider revenues related to earning a return in North Dakota and Minnesota on increasing amounts invested in the air quality control system (AQCS) at Big Stone Plant, earning a return on the Hoot Lake Plant Mercury and Air Toxics Standards (MATS) project in North Dakota beginning in 2015, and the initiation of an ECR rider in South Dakota in December 2014 to recover costs and earn a return on amounts invested in the Big Stone Plant AQCS and Hoot Lake Plant MATS projects. |
| · | A $3.1 million increase in revenues recoverable under Conservation Improvement Programs (CIP) riders related to an increase in CIP incentives awarded for 2014 program results as well as increases in CIP accruals for 2015 program incentives and recoverable expenditures. |
| · | A $3.1 million increase in revenue from higher sales to pipeline customers. |
| · | A $0.9 million increase in North Dakota Renewable Resource Adjustment (RRA) rider revenues. |
offset by:
| · | A $4.8 million decrease in revenues related to 2.2% decrease in retail kwh sales mainly resulting from milder weather in 2015, evidenced by heating-degree days that were 21.8% lower than in 2014 and 88.2% of normal. Weather impacted diluted earnings per share negatively by approximately $0.08 per share in 2015 compared with 2014 and approximately $0.05 per share compared with weather normalized sales for 2015. |
| · | A $4.0 million decrease in revenues from the recovery of fuel and purchased power costs due to the 2.2% decrease in retail kwh sales and a 3.0% decrease in the combined cost of fuel and purchased power per kwh purchased and generated. |
| · | A $3.0 million decrease in revenues due to lower sales to residential customers in North Dakota and Minnesota and lower sales to commercial customers in North Dakota. |
| · | A $0.4 million reduction in Big Stone II cost recovery rider revenues in North Dakota as the North Dakota share of costs were fully recovered by March 31, 2014. |
Wholesale electric revenues from company-owned generation decreased $8.7 million as a result of a 60.7% reduction in wholesale kwh sales combined with a 43.0% decrease in revenue per wholesale kwh sold. The decreases in wholesale kwh sales and prices were driven by decreased wholesale market demand resulting from milder weather in 2015. Also, OTP had fewer resources available for selling into the wholesale market. Big Stone Plant was off line from March through July of 2015 for an extended maintenance outage. Coyote Station operated at reduced load in 2015 due to ongoing repairs related to a December 2014 boiler feed pump failure and fire. Hoot Lake Plant was curtailed in 2015 due to low market prices for electricity, which
| 39 |
was a factor contributing to a strategic decision to shut down Hoot Lake Plant’s Unit 3 for preventative maintenance in September 2015. Generation from company-owned wind turbines was down 6.0% from 2014, primarily due to lower average wind speeds in the first half of 2015. The decrease in wholesale prices for electricity was due, in part, to lower prices for natural gas used in the generation of electricity in 2015 compared with 2014.
Net revenue from energy trading activities decreased $0.8 million as a result of OTP discontinuing its trading activities not directly associated with serving retail customers in December 2014 due to a lack of market activity and profitable trading opportunities.
Other electric revenues increased $5.4 million, primarily as a result of an increase in MISO transmission tariff revenues related to increased investment in regional transmission projects including returns on and recovery of Capacity Expansion 2020 (CapX2020) and MISO designated MVP investment costs and operating expenses.
Production fuel costs decreased $24.5 million as a result of a 39.3% decrease in kwhs generated from OTP’s steam-powered and combustion turbine generators primarily due to the factors discussed above. The cost of purchased power to serve retail customers increased $12.3 million due to a 55.7% increase in kwhs purchased, partially offset by a 23.8% decrease in the cost per kwh purchased. The increase in power purchases for retail sales was necessitated by the reduced availability of company-owned generating capacity discussed above. The decreased cost per kwh purchased was driven by lower market demand due to milder weather in 2015 in combination with lower prices for natural gas used in the generation of electricity.
Electric operating and maintenance expenses decreased $1.2 million reflecting:
| · | A $3.0 million net reduction in generation plant operating and maintenance costs between the years as costs incurred in 2014 at Hoot Lake Plant and Coyote Station were more than the maintenance costs incurred at Big Stone Plant in 2015. Although kwh generation decreased for all three plants in 2015, work done on the plants in 2014 was more operating and maintenance in nature while more capitalized projects were completed in 2015. Also, with the plants generating fewer kwhs in 2015, operating costs were lower in 2015. |
| · | A $1.4 million reduction in travel related expenses as a result of increased vehicle usage on capital projects and lower fuel prices. |
| · | A $0.7 million increase in capitalized administrative and general expenses due to more time being spent on capital projects. |
| · | A $0.4 million reduction in the North Dakota share of Big Stone II costs being amortized as the North Dakota share of costs were fully recovered by March 31, 2014. |
| · | An expense of $0.3 million recorded in June 2014 related to OTP not earning a return on the deferred recovery of the Minnesota share of Big Stone II abandoned transmission plant costs. |
offset by:
| · | A $3.8 million increase in MISO transmission tariff charges related to increasing investments by other transmission owners in regional CapX2020 and MISO-designated MVP transmission projects. |
| · | A $0.9 million increase in Minnesota conservation improvement program expenditures and new program implementation costs. |
Depreciation expense increased $0.7 million as a result of increased investment in transmission, distribution and general plant placed in service in 2014 and 2015.
The $0.9 million increase in property tax expense primarily is due to increased property valuations and transmission plant additions in Minnesota.
2014 Compared with 2013
Retail sales revenue increased $32.3 million mainly as a result of:
| · | A $13.4 million increase in Fuel Clause Adjustment revenues and fuel and purchased power costs recovered in base rates driven by increased kwh purchases to meet higher retail kwh sales demand along with higher prices for purchased power. |
| · | A $10.7 million increase in ECR rider revenues related to earning a return in Minnesota, North Dakota and South Dakota on increasing amounts invested in the AQCS under construction at Big Stone Plant. |
| · | A $6.3 million increase in Transmission Cost Recovery rider revenues related to recovering costs and earning returns on increased investments in transmission plant. |
| · | A $5.3 million increase in revenue related to a 4.6% increase in retail kwh sales mainly driven by an increase in sales to pipeline and commercial customers. |
| 40 |
offset by:
| · | A $1.5 million decrease in revenues related to reductions in financial incentives expected under conservation improvement programs. |
| · | A $1.1 million decrease in RRA rider revenues in North Dakota as a result of declining book values of renewable assets due to depreciation and an increase in federal Production Tax Credits (PTCs) used in 2014, which reduce RRA revenue requirements. |
| · | A $1.1 million reduction in Big Stone II cost recovery rider revenues as the North Dakota share of abandoned plant costs were fully recovered as of March 31, 2014. |
Wholesale electric revenues from company-owned generation decreased $3.7 million as a result of a 42.0% reduction in wholesale kwh sales, partially offset by a 29.6% increase in revenue per wholesale kwh sold. The decrease in wholesale kwh sales was the result of having less generation available for sale in the second and third quarters of 2014 as a result of the extended maintenance shutdown of Hoot Lake Plant, which was offline for most of the second and third quarters of 2014, and curtailments in generation at Big Stone Plant to conserve fuel in response to delayed coal shipments in the third quarter of 2014. The increase in wholesale prices was driven by increased wholesale market demand resulting from cold weather in the first quarter of 2014.
Net revenue from energy trading activities, including net marked-to-market gains and losses on forward energy contracts, decreased $0.6 million mainly as a result of decreased trading activity and the incurrence of losses on contracts entered into and settled in the first half of 2014. OTP discontinued its trading activities not directly associated with serving retail customers in December 2014 due to a lack of market activity and profitable trading opportunities.
Other electric operating revenues increased $6.1 million mainly as a result of increases in MISO transmission tariff revenues related to increased investment in regional transmission lines and driven in part by returns on and recovery of CapX2020 and MISO-designated MVP investment costs and operating expenses.
Production fuel costs decreased $4.0 million as a result of an 8.0% decrease in kwhs generated from OTP’s steam-powered and combustion turbine generators. The decrease in kwh generation was mainly due to the extended maintenance shutdown of Hoot Lake Plant in the second and third quarters of 2014 and curtailments in generation at Big Stone Plant to conserve fuel in response to delayed coal shipments in the third quarter of 2014.
The cost of purchased power to serve retail customers increased $13.8 million due to a 19.2% increase in kwhs purchased in combination with a 6.2% increase in cost per kwh purchased. The increase in kwhs purchased was necessitated by the reduced availability of company-owned generation. The increase in cost per kwh purchased was driven by increased wholesale market demand resulting from colder weather in the first quarter of 2014. The level of company-owned generation dedicated to serving retail customers was essentially unchanged in 2014 compared with 2013, despite the reductions in generation at Hoot Lake and Big Stone plants. The reduction in generation from Big Stone Plant was mostly offset by an increase in kwhs generated at Coyote Station, while the reduced availability of Hoot Lake Plant had more of a negative impact on wholesale sales.
Electric operating and maintenance expenses increased $8.5 million as a result of:
| · | A $4.8 million increase in contracted maintenance and material and supplies costs at Hoot Lake Plant related to a scheduled maintenance shutdown which was extended several weeks due to unanticipated maintenance issues encountered during the shutdown. |
| · | A $3.6 million increase in MISO transmission tariff charges related to increasing investments by others in regional CapX2020 and MISO-designated MVP transmission projects. |
| · | A $1.5 million increase in expenditures for transmission line maintenance for vegetation control and preservation of poles. |
| · | A $0.8 million increase in material and supply and contractor costs for other generation plant maintenance. |
| · | A $0.5 million increase in transportation expenses mainly related to a decrease in vehicle usage on capital projects between the years. |
offset by:
| · | A $1.6 million reduction in labor and benefit expenses mainly due to decreases in pension and retirement health benefit costs resulting from higher discount rates on projected benefit obligations. |
| · | A $1.1 million reduction in the amortization of the North Dakota share of Big Stone II costs which were fully recovered as of March 31, 2014. |
The $1.0 million increase in depreciation expense was primarily driven by higher software related costs currently being amortized and increased capital replacement costs on OTP’s wind farms.
| 41 |
The $1.3 million increase in property tax expense is due to higher property valuations for transmission and distribution property in Minnesota and South Dakota.
Manufacturing
The following table summarizes the results of operations for our Manufacturing segment for the years ended December 31:
| (in thousands) | 2015 | % change | 2014 | % change | 2013 | |||||||||||||||
| Operating Revenues | $ | 215,011 | (2 | ) | $ | 219,583 | 7 | $ | 204,997 | |||||||||||
| Cost of Products Sold | 171,956 | 2 | 169,033 | 10 | 154,235 | |||||||||||||||
| Lease Exit Costs | — | — | 2,843 | — | — | |||||||||||||||
| Other Operating Expenses | 21,116 | 3 | 20,497 | 9 | 18,820 | |||||||||||||||
| Depreciation and Amortization | 11,853 | 13 | 10,518 | (6 | ) | 11,194 | ||||||||||||||
| Operating Income | $ | 10,086 | (40 | ) | $ | 16,692 | (20 | ) | $ | 20,748 | ||||||||||
2015 Compared with 2014
The decrease in revenues in our Manufacturing segment in 2015 compared with 2014 relates to the following:
| · | Revenues at BTD decreased $6.6 million (3.5%) due to the following: |
| o | An $8.6 million decrease in sales, mainly to manufacturers of oil and gas exploration and extraction equipment as a result of a reduction in drilling activity related to current low oil prices. |
| o | A $3.2 million decrease in sales of scrap metal due to a reduction in scrap metal prices and a reduction in scrap volume related to lower production and sales volumes between years. |
| o | A $2.1 million decrease in sales to manufacturers of agricultural equipment related to continued softness in the agricultural industry. |
| o | A $1.5 million reduction in tooling revenues. |
| o | Offset by $8.8 million in sales at BTD-Georgia, acquired on September 1, 2015. |
| · | Revenues at T.O. Plastics increased $2.0 million (6.1%) reflecting: |
| o | A $1.4 million increase in sales of horticultural containers. |
| o | A $0.5 million increase in sales of custom products. |
| o | A $0.1 million increase in sales of various other products to industrial customers. |
The increase in cost of products sold in our Manufacturing segment relates to the following:
| · | Cost of products sold at BTD decreased $0.4 million, reflecting an $8.7 million decrease in costs related to decreased sales, offset by $8.3 million in costs incurred at BTD-Georgia from September through December 2015. |
| · | Cost of products sold at T.O. Plastics increased $3.3 million due to increases in material, labor and freight costs related to the increase in sales at T.O. Plastics. |
The $2.8 million reduction in Manufacturing segment operating expenses related to the lease exit costs incurred in 2014, was partially offset by $0.6 million in operating expenses incurred at BTD-Georgia from September through December 2015. Labor and benefit expense increases of $1.0 million at BTD were mostly offset by a $0.9 million reduction in labor and benefit expenses at T.O. Plastics between the years.
Depreciation and amortization expense at BTD-Georgia from September through December 2015 was approximately $1.0 million. A $0.6 million increase in depreciation expense at BTD related to recent asset additions under its Minnesota facilities expansion plan was partially offset by a $0.3 million decrease in depreciation expense at T.O. Plastics as a result of certain assets reaching the end of their depreciable lives.
2014 Compared with 2013
The increase in revenues in our Manufacturing segment in 2014 compared with 2013 relates to the following:
| · | Revenues at BTD increased $19.8 million (11.8%) mainly as a result of increased sales to customers in recreational, lawn and garden and energy-related end markets. |
| · | Revenues at T.O. Plastics decreased $5.2 million (13.6%) mainly due to discontinuing a cost-intensive, low-margin product packing process performed for a customer prior to 2014. |
| 42 |
The increase in cost of products sold in our Manufacturing segment in 2014 compared with 2013 consists of the following:
| · | Cost of products sold at BTD increased $19.3 million as a result of increased material and labor costs related to an increase in sales volume, increased product handling costs and the incurrence of additional tooling costs to repair and refurbish several dies in 2014, which had the effect of reducing BTD’s gross margin percentage despite its increase in sales and gross margin. |
| · | Cost of products sold at T.O. Plastics decreased $4.5 million mainly as a result of decreased material costs related to the product packaging process that was discontinued in 2014. |
The increase in other operating expenses in our Manufacturing segment in 2014 compared with 2013 relates to the following:
| · | Operating expenses at BTD increased $4.2 million in 2014, which includes: |
| o | A loss of $2.8 million related to BTD’s abandonment of leased property and the write-off of associated leasehold improvements in connection with implementation of a facilities realignment and optimization strategy. |
| o | A $0.5 million increase in allocated corporate costs. |
| o | Increases totaling $1.0 million in contracted services, labor and benefit costs and travel expenses, mainly related to an increase in time and external resources devoted to training and talent development. |
| · | Operating expenses at T.O. Plastics increased $0.3 million mainly due to an increase in allocated corporate costs. |
Depreciation expense decreased $0.4 million at BTD and $0.3 million at T.O. Plastics as a result of certain assets reaching the end of their depreciable lives.
Plastics
The following table summarizes the results of operations for our Plastics segment for the years ended December 31:
| (in thousands) | 2015 | % change | 2014 | % change | 2013 | |||||||||||||||
| Operating Revenues | $ | 157,758 | (8 | ) | $ | 172,050 | 4 | $ | 164,957 | |||||||||||
| Cost of Products Sold | 123,085 | (12 | ) | 139,081 | 8 | 129,042 | ||||||||||||||
| Operating Expenses | 9,849 | 6 | 9,292 | 8 | 8,571 | |||||||||||||||
| Depreciation and Amortization | 3,552 | 6 | 3,364 | — | 3,350 | |||||||||||||||
| Operating Income | $ | 21,272 | 5 | $ | 20,313 | (15 | ) | $ | 23,994 | |||||||||||
2015 Compared with 2014
The $14.3 million decrease in Plastics segment revenues is the result of a 7.0% decrease in the price per pound of pipe sold in combination with a 1.4% decrease in pounds of PVC pipe sold. The decrease in sales are due in part to delayed purchases related to falling resin prices and in part to reduced demand in the region of the United States between the Mississippi River and the Rocky Mountain states, especially in Texas where soft markets were exacerbated by severe spring flooding. The $16.0 million decrease in costs of products sold is mainly due to a 10.2% decrease in the cost per pound of pipe sold as a result of lower resin prices. The $0.6 million increase in operating expenses was mainly related to increased wage and benefit costs.
2014 Compared with 2013
The $7.1 million increase in Plastics segment revenue is the result of a 2.4% increase in revenue per pound of PVC pipe sold, combined with a 1.9% increase in pounds of PVC pipe sold. States with significant increases in sales were Minnesota, Illinois, California, Colorado and New Mexico. Cost of products sold increased by $10.0 million due to the increase in sales volume and a 5.8% increase in the cost per pound of pipe sold primarily related to higher PVC resin prices. The increase in resin prices could not be fully recovered through increased pipe prices due to competitive market conditions. The reduction in margins combined with a $0.7 million increase in operating expenses mainly related to an increase in allocated corporate costs resulted in the $3.7 million decline in Plastics segment operating income between the years.
| 43 |
Corporate
Corporate includes items such as corporate staff and overhead costs, the results of our captive insurance company and other items excluded from the measurement of operating segment performance. Corporate is not an operating segment. Rather it is added to operating segment totals to reconcile to totals on our consolidated statements of income.
| (in thousands) | 2015 | % change | 2014 | % change | 2013 | |||||||||||||||
| Airplane Rent and Lease Exit Costs | $ | — | — | $ | 3,012 | — | $ | 595 | ||||||||||||
| Other Operating Expenses | 9,143 | (12 | ) | 10,406 | (14 | ) | 12,158 | |||||||||||||
| Depreciation and Amortization | 172 | 48 | 116 | (44 | ) | 207 | ||||||||||||||
Corporate operating expenses decreased $4.3 million in 2015 compared with 2014 primarily due to:
| · | A $3.0 million reduction in airplane operating lease expense related to the early termination of an airplane lease in the second quarter of 2014, as divestitures had reduced the need for the airplane. The cost to terminate the lease early was approximately $2.5 million or a net-of-tax impact on diluted earnings per share of ($0.04). |
| · | A $0.8 million reduction in insurance costs at our captive insurance company related to lower claims activity in 2015. |
| · | A $0.5 million decrease in labor expense due to a reduction in employees in 2015. |
Corporate operating expenses increased $0.7 million in 2014 compared with 2013 primarily due to:
| · | A $2.4 million increase related to the early termination of an airplane lease in the second quarter of 2014, as divestitures reduced the need for the airplane. |
| · | A $0.2 million increase in expenses, meetings and educational materials related to talent development and leadership training. |
offset by:
| · | A $1.9 million increase in corporate operating expenses allocated to the corporation’s operating segments. |
Consolidated Interest Charges
The $1.5 million increase in interest charges in 2015 compared with 2014 is mainly due to:
| · | A $1.3 million increase in interest expense incurred in January and February of 2015 at OTP related to the February 27, 2014 issuance of $60 million aggregate principal amount of OTP’s 4.68% Series A Senior Unsecured Notes due February 27, 2029 and $90 million aggregate principal amount of OTP’s 5.47% Series B Senior Unsecured Notes due February 27, 2044. |
| · | A $19.6 million increase in the daily average balance of short-term debt outstanding in 2015 compared with 2014 also contributed to the increase in interest expense between the years. |
The $2.7 million increase in interest charges in 2014 compared with 2013 primarily reflects:
| · | A $6.4 million increase in interest expense related to the February 27, 2014 issuance of $60 million aggregate principal amount of OTP’s 4.68% Series A Senior Unsecured Notes due February 27, 2029 and $90 million aggregate principal amount of OTP’s 5.47% Series B Senior Unsecured Notes due February 27, 2044. |
| · | A $0.3 million reduction in capitalized interest due to OTP being granted a return on funds invested in the Big Stone Plant AQCS through ECR riders approved in Minnesota and North Dakota in December 2013, which resulted in the discontinuance of capitalized interest on the Minnesota share of the project and an increase in interest expense between the years. |
offset by:
| · | A $3.7 million reduction in interest expense related to the early retirement of $47.7 million of our 9.0% unsecured notes due December 15, 2016, in November 2013. |
| · | A $0.3 million reduction in interest expense related to the February 27, 2014 repayment of OTP’s $40.9 million unsecured term loan. |
| 44 |
2013 LOSS ON EARLY RETIREMENT OF DEBT
On November 6 and 25, 2013 we purchased, in two separate transactions, approximately $47.7 million of our outstanding $100 million 9.000% Notes due December 15, 2016 (the 2016 Notes). The purchased 2016 Notes were subsequently retired and are no longer outstanding. The price we paid for the purchased 2016 Notes was approximately $59.4 million, which includes the principal amount of the purchased 2016 Notes, plus accrued interest of approximately $1.8 million through the respective purchase dates and a negotiated premium of approximately $9.9 million (which was less than the redemption premium we would have been required to pay under the terms of the 2016 Notes). On repayment, $0.4 million in unamortized debt expense related to the 2016 Notes was immediately recognized as expense along with the $9.9 million negotiated premium. We used cash on hand to fund the purchase of the Purchased 2016 Notes. The amount of the debt retired as a result of these transactions is approximately equivalent to the remaining amount of debt that was associated with the operating companies we divested over the last two years. The retirement of the purchased 2016 Notes reduces pre-tax interest expense by approximately $4.3 million per year for the remaining three-year life of the purchased 2016 Notes. The $10.3 million ($6.2 million net-of-tax) loss on early retirement of debt had a negative impact on 2013 diluted earnings per share of $0.17.
Consolidated OTHER INCOME
The $1.4 million decrease in other income in 2015 compared with 2014, includes:
| · | A $0.8 million gain on the sale of an investment in tax-credit-qualified low income housing rental property in 2014 that was not duplicated in 2015. |
| · | A $0.3 million reduction in other income at OTP related to reductions in allowance for equity funds used in construction (AFUDC) and carrying charges earned on funds invested in Minnesota conservation improvement programs prior to recovery, in alignment with a decrease in short-term borrowing rates. |
| · | A $0.2 million reduction in corporate owned life insurance cash surrender value increases. |
Other income was $3.6 million for 2014 compared with $4.1 million for 2013. The decrease in other income is due to a $0.3 million decrease in AFUDC related to costs incurred in the construction of the new AQCS at OTP's Big Stone Plant, which were subject to AFUDC in 2013 but not in 2014 as returns on amounts invested in this project are now being recovered under ECR riders implemented in North Dakota in 2013 and in Minnesota and South Dakota in 2014, and a $0.2 million reduction in investment income.
Consolidated Income Taxes
Income tax expense - continuing operations was $21.6 million in 2015 compared with $16.6 million in 2014 and $12.5 million in 2013. The following table provides a reconciliation of income tax expense – continuing operations calculated at the federal statutory rate on income from continuing operations before income taxes reported on our consolidated statements of income:
| For the Year Ended December 31, | ||||||||||||
| (in thousands) | 2015 | 2014 | 2013 | |||||||||
| Tax Computed at Federal Statutory Rate – Continuing Operations | $ | 28,081 | $ | 25,704 | $ | 21,389 | ||||||
| Increases (Decreases) in Tax from: | ||||||||||||
| Federal PTCs | (6,962 | ) | (7,517 | ) | (6,612 | ) | ||||||
| State Income Taxes Net of Federal Income Tax Expense (Benefit) | 4,945 | 1,993 | 1,561 | |||||||||
| Differences Reversing in Excess of Federal Rates | (1,143 | ) | (106 | ) | (100 | ) | ||||||
| North Dakota Wind Tax Credit Amortization – Net of Federal Taxes | (850 | ) | (849 | ) | (863 | ) | ||||||
| Investment Tax Credit Amortization | (571 | ) | (597 | ) | (597 | ) | ||||||
| Dividend Received/Paid Deduction | (560 | ) | (622 | ) | (632 | ) | ||||||
| AFUDC - Equity | (426 | ) | (505 | ) | (638 | ) | ||||||
| Corporate Owned Life Insurance | (167 | ) | (354 | ) | (856 | ) | ||||||
| Tax Depreciation - Treasury Grant for Wind Farms | — | (152 | ) | (304 | ) | |||||||
| Section 199 Domestic Production Activities Deduction | — | (1,026 | ) | — | ||||||||
| Permanent and Other Differences | (705 | ) | 588 | 168 | ||||||||
| Total Income Tax Expense – Continuing Operations | $ | 21,642 | $ | 16,557 | $ | 12,516 | ||||||
| Effective Income Tax Rate – Continuing Operations | 27.0 | % | 22.5 | % | 20.5 | % | ||||||
| 45 |
Federal PTCs are recognized as wind energy is generated based on a per kwh rate prescribed in applicable federal statutes. OTP’s kwh generation from its wind turbines eligible for PTCs decreased 7.4% primarily due to lower average wind speed in 2015 compared with 2014. OTP’s kwh generation from its wind turbines eligible for PTCs increased 13.8% in 2014 compared with 2013. North Dakota wind energy credits are based on dollars invested in qualifying facilities and are being recognized on a straight-line basis over 25 years.
DISCONTINUED OPERATIONS
On April 30, 2015 we sold Foley for $12.0 million in cash, plus $6.3 million in adjustments for working capital and other related items received in October 2015, less $1.0 million in selling expenses. On February 28, 2015 we sold the assets of AEV, Inc. for $22.3 million in cash, plus $0.6 million in adjustments for working capital and fixed assets received in October 2015, less $0.8 million in selling expenses. We have recorded a $7.1 million net-of-tax gain on the sale of AEV, Inc. Foley and AEV, Inc were formerly included in our Construction segment.
On February 8, 2013 we completed the sale of substantially all the assets of our dock and boatlift company, formerly included in our Manufacturing segment, for approximately $13.0 million in cash and received a working capital true up of approximately $2.4 million in June 2013.
On January 18, 2012, we sold the assets of Aviva, for $0.3 million in cash. For discontinued operations reporting, Aviva’s results are included in our dock and boatlift company’s consolidated results. On November 30, 2012 we completed the sale of the assets of our wind tower manufacturing business for total proceeds, net of commissions and selling costs, of $18.1 million. This business was the only remaining entity in our former Wind Energy segment. On February 29, 2012 we completed the sale of DMS, our health services company, for $24.0 million in cash net of commissions and selling costs, which was reduced by a $1.7 million working capital settlement paid to the buyer in February 2013. The DMS working capital settlement was estimated to be $1.9 million at the time of the sale. The final settlement resulted in recording a $0.2 million gain on the sale of DMS in the first quarter of 2013. DMS was the only business in our former Health Services segment.
Our Wind Energy, Health Services and Construction segments were eliminated as a result of the sales of our wind tower manufacturing business, DMS, Foley and AEV, Inc. The financial position, results of operations and cash flows of Foley, AEV, Inc., our wind tower manufacturing business, Wylie, our dock and boatlift company and DMS are reported as discontinued operations in our consolidated financial statements. Following are summary presentations of the results of discontinued operations for the years ended December 31, 2015, 2014 and 2013:
| For the Year Ended December 31, 2015 | ||||||||||||||||||||||||
| (in thousands) | Foley | AEV, Inc. | Wind Tower Business | Dock and Boatlift Business | Intercompany Transactions Adjustment | Total | ||||||||||||||||||
| Operating Revenues | $ | 21,625 | $ | 2,998 | $ | — | $ | — | $ | — | $ | 24,623 | ||||||||||||
| Operating Expenses | 26,839 | 4,532 | (462 | ) | 966 | (240 | ) | 31,635 | ||||||||||||||||
| Asset Impairment Charge | 1,000 | — | — | — | — | 1,000 | ||||||||||||||||||
| Interest Expense | 177 | 27 | — | — | (204 | ) | — | |||||||||||||||||
| Other Income (Deductions) | (42 | ) | 2 | 111 | — | (2 | ) | 69 | ||||||||||||||||
| Income Tax (Benefit) Expense | (921 | ) | (638 | ) | 229 | (386 | ) | 177 | (1,539 | ) | ||||||||||||||
| Net (Loss) Income from Operations | (5,512 | ) | (921 | ) | 344 | (580 | ) | 265 | (6,404 | ) | ||||||||||||||
| (Loss) Gain on Disposition Before Taxes | (204 | ) | 11,894 | — | — | — | 11,690 | |||||||||||||||||
| Income Tax (Benefit) Expense on Disposition | (227 | ) | 4,757 | — | — | — | 4,530 | |||||||||||||||||
| Net Gain on Disposition | 23 | 7,137 | — | — | — | 7,160 | ||||||||||||||||||
| Net (Loss) Income | $ | (5,489 | ) | $ | 6,216 | $ | 344 | $ | (580 | ) | $ | 265 | $ | 756 | ||||||||||
| 46 |
| For the Year Ended December 31, 2014 | ||||||||||||||||||||||||
| (in thousands) | Foley | AEV, Inc. | Wind Tower Business | Dock and Boatlift Business | Intercompany Transactions Adjustment | Total | ||||||||||||||||||
| Operating Revenues | $ | 105,333 | $ | 44,527 | $ | — | $ | — | $ | — | $ | 149,860 | ||||||||||||
| Operating Expenses | 100,826 | 40,297 | 19 | (180 | ) | (960 | ) | 140,002 | ||||||||||||||||
| Asset Impairment Charge | 5,605 | — | — | — | — | 5,605 | ||||||||||||||||||
| Interest Expense | 510 | 184 | — | — | (694 | ) | — | |||||||||||||||||
| Other (Deductions) Income | (38 | ) | 304 | — | 277 | (4 | ) | 539 | ||||||||||||||||
| Income Tax Expense (Benefit) | 1,388 | 1,729 | (8 | ) | 183 | 660 | 3,952 | |||||||||||||||||
| Net (Loss) Income | $ | (3,034 | ) | $ | 2,621 | $ | (11 | ) | $ | 274 | $ | 990 | $ | 840 | ||||||||||
| For the Year Ended December 31, 2013 | ||||||||||||||||||||||||||||||||
| (in thousands) | Foley | AEV, Inc. | Wind Tower Business | Wylie | Dock and Boatlift Business | DMS | Intercompany Transactions Adjustment | Total | ||||||||||||||||||||||||
| Operating Revenues | $ | 110,097 | $ | 39,813 | $ | — | $ | — | $ | 2,016 | $ | — | $ | (11 | ) | $ | 151,915 | |||||||||||||||
| Operating Expenses | 109,036 | 38,257 | (988 | ) | 640 | 2,622 | (269 | ) | (11 | ) | 149,287 | |||||||||||||||||||||
| Interest Expense | 249 | 207 | — | — | — | — | (451 | ) | 5 | |||||||||||||||||||||||
| Other Income (Deductions) | 4 | (5 | ) | 412 | — | 67 | — | (5 | ) | 473 | ||||||||||||||||||||||
| Income Tax Expense (Benefit) | 331 | 518 | 370 | (256 | ) | (213 | ) | 108 | 178 | 1,036 | ||||||||||||||||||||||
| Net Income (Loss) from Operations | 485 | 826 | 1,030 | (384 | ) | (326 | ) | 161 | 268 | 2,060 | ||||||||||||||||||||||
| Gain on Disposition Before Taxes | — | — | — | — | 16 | 200 | — | 216 | ||||||||||||||||||||||||
| Income Tax Expense on Disposition | — | — | — | — | 6 | — | — | 6 | ||||||||||||||||||||||||
| Net Gain on Disposition | — | — | — | — | 10 | 200 | — | 210 | ||||||||||||||||||||||||
| Net Income (Loss) | $ | 485 | $ | 826 | $ | 1,030 | $ | (384 | ) | $ | (316 | ) | $ | 361 | $ | 268 | $ | 2,270 | ||||||||||||||
Foley and AEV, Inc. entered into fixed-price construction contracts. Revenues under these contracts were recognized on a percentage-of-completion basis. The method used to determine the progress of completion was based on the ratio of costs incurred to total estimated costs on construction projects. An increase in estimated costs on one large job in progress at Foley in excess of previous period cost estimates resulted in pretax charges of $4.4 million in 2015.
Impact of Inflation
OTP operates under regulatory provisions that allow price changes in fuel and certain purchased power costs to be passed to most retail customers through automatic adjustments to its rate schedules under fuel clause adjustments. Other increases in the cost of electric service must be recovered through timely filings for electric rate increases with the appropriate regulatory agency.
Our Manufacturing and Plastics segments consist entirely of businesses whose revenues are not subject to regulation by ratemaking authorities. Increased operating costs are reflected in product or services pricing with any limitations on price increases determined by the marketplace. Raw material costs, labor costs, fuel and energy costs and interest rates are important components of costs for companies in these segments. Any or all of these components could be impacted by inflation or other pricing pressures, with a possible adverse effect on our profitability, especially where increases in these costs exceed price increases on finished products. In recent years, our operating companies have faced strong inflationary and other pricing pressures with respect to steel, fuel, resin, and health care costs, which have been partially mitigated by pricing adjustments.
Liquidity
The following table presents the status of our lines of credit as of December 31, 2015 and December 31, 2014:
| (in thousands) | Line Limit | In Use on December 31, 2015 | Restricted due to Outstanding Letters of Credit | Available on December 31, 2015 | Available on December 31, 2014 | |||||||||||||||
| Otter Tail Corporation Credit Agreement | $ | 150,000 | $ | 59,666 | $ | — | $ | 90,334 | $ | 138,872 | ||||||||||
| OTP Credit Agreement | 170,000 | 21,006 | 300 | 148,694 | 169,440 | |||||||||||||||
| Total | $ | 320,000 | $ | 80,672 | $ | 300 | $ | 239,028 | $ | 308,312 | ||||||||||
| 47 |
We believe we have the necessary liquidity to effectively conduct business operations for an extended period if needed. Our balance sheet is strong and we are in compliance with our debt covenants. Financial flexibility is provided by operating cash flows, unused lines of credit, strong financial coverages, investment grade credit ratings and alternative financing arrangements such as leasing.
We believe our financial condition is strong and our cash, other liquid assets, operating cash flows, existing lines of credit, access to capital markets and borrowing ability because of investment-grade credit ratings, when taken together, provide adequate resources to fund ongoing operating requirements and future capital expenditures related to expansion of existing businesses and development of new projects. On May 11, 2015 we filed a shelf registration statement with the Securities and Exchange Commission (SEC) under which we may offer for sale, from time to time, either separately or together in any combination, equity, debt or other securities described in the shelf registration statement, which expires on May 11, 2018. On May 11, 2015, we entered into a Distribution Agreement with J.P. Morgan Securities LLC (JPMS) under which we may offer and sell our common shares from time to time through JPMS, as our distribution agent, up to an aggregate sales price of $75 million through an At-the-Market offering program. In the fourth quarter of 2015 we received proceeds of $977,000 net of $12,000 paid to JPMS from the issuance of 37,268 shares under this program.
Equity or debt financing will be required in the period 2016 through 2020 given the expansion plans related to our Electric segment to fund construction of new rate base investments. Also, such financing will be required should we decide to reduce borrowings under our lines of credit or refund or retire early any of our presently outstanding debt, to complete acquisitions or for other corporate purposes. Our operating cash flows and access to capital markets can be impacted by macroeconomic factors outside our control. In addition, our borrowing costs can be impacted by changing interest rates on short-term and long-term debt and ratings assigned to us by independent rating agencies, which in part are based on certain credit measures such as interest coverage and leverage ratios.
Our common stock dividend payments have exceeded our net income (losses) in two of the last five years. The determination of the amount of future cash dividends to be declared and paid will depend on, among other things, our financial condition, improvement in earnings per share, cash flows from operations, the level of our capital expenditures and our future business prospects. As a result of certain statutory limitations or regulatory or financing agreements, restrictions could occur on the amount of distributions allowed to be made by our subsidiaries. See note 8 to consolidated financial statements for more information. The decision to declare a dividend is reviewed quarterly by the board of directors. On January 28, 2016 our board of directors increased the quarterly dividend from $0.3075 to $0.3125 per common share.
2015 Cash Flows Compared with 2014 Cash Flows
Cash provided by operating activities from continuing operations was $131.5 million in 2015 compared with $125.8 million in 2014. Contributing to the $5.7 million increase in cash provided by continuing operations between the periods were:
| · | A $10.0 million decrease in discretionary contributions to the Company’s pension plan. |
| · | A $2.3 million increase in depreciation expense. |
| · | A $1.6 million increase in net income from continuing operations. |
offset by:
| · | $7.2 million in cash used to decrease accounts payable at OTP in 2015 partly related to power purchases and repair services incurred in connection with the boiler pump failure and fire at Coyote station in December 2014. |
In continuing operations, net cash used in investing activities was $193.6 million in 2015 compared with $163.9 million in 2014. The purchase of the assets of BTD-Georgia for $30.8 million on September 1, 2015 was the main factor contributing to the $29.7 million increase in cash used in investing activities of continuing operations between the periods. A $3.4 million decrease in cash used for capital expenditures includes a $13.1 million reduction in capital expenditures at OTP as several major projects were completed and placed in service in 2015, including two CapX2020 transmission line projects and the new AQCS at Big Stone Plant, partially offset by a $9.0 million increase in cash used for capital expenditures in our Manufacturing segment, mainly at BTD as it moves forward with its project to expand and realign its Minnesota production and warehouse facilities.
Investing activities of discontinued operations in 2015 includes cash proceeds, net of selling expenses, of $22.1 million from the sale of AEV, Inc. and $17.3 million from the sale of Foley, partially offset by $1.8 million in cash used in investing activities of discontinued operations, mainly related to the purchase by AEV, Inc. of assets being leased under operating leases prior to the assets being sold.
Net cash provided by financing activities of continuing operations was $38.1 million in 2015 compared with $49.7 million in 2014. Net cash provided by financing activities in 2015 includes $69.8 million in short-term borrowings used to fund a
| 48 |
portion of our capital expenditures and the acquisition of BTD-Georgia. Net cash proceeds of $13.8 million from the issuance of common stock under our At-the-Market offering program and various stock purchase and dividend reinvestment plans were also used to fund a portion of our capital expenditures. See note 6 to the Company’s consolidated financial statements for further information on stock issuances and retirements in 2015. Cash used for common stock dividend payments totaled $46.2 million in 2015.
2014 Cash Flows Compared with 2013 Cash Flows
Cash provided by operating activities of continuing operations was $125.8 million in 2014 compared with $142.4 million in 2013. The major contributing factors to the $16.6 million decrease in cash provided by operating activities between the periods was a $12.2 million increase in cash used for working capital items and a $10.0 million increase in discretionary contributions to our pension plan, offset by an $8.3 million increase in net income from continuing operations. The following major items contributed to the $12.2 million increase in cash used for working capital between the periods:
| · | In the Plastics segment, finished goods and raw materials inventories increased $8.4 million in 2014 compared with an increase of $1.9 million in 2013. The increase in inventories in the Plastic segment in 2014 corresponds with higher resin costs at year-end 2014 compared with year-end 2013 and a buildup of inventory in the fourth quarter of 2014 in anticipation of increasing prices and increasing demand for PVC pipe in early 2015. |
| · | In the Electric segment, accounts payable related to operating activities decreased $0.4 million in 2014 compared to an increase of $6.6 million in 2013 as a result of several significant invoices and accrued liabilities outstanding at year-end 2013. |
Net cash used in discontinued operations of $13.3 million in 2014 reflects a $13.6 million decrease in accounts payable and other current liabilities including billings in excess of cost at Foley in 2014 as advances received on a major project in 2013 were used to pay for project-related costs in 2014.
Net cash used in investing activities of continuing operations was $163.9 million in 2014 compared with $159.5 million in 2013, reflecting a $4.2 million increase in cash used for capital expenditures at BTD, as BTD began work on construction and modification of buildings at its Detroit Lakes and Lakeville, Minnesota locations in conjunction with the implementation of a facilities alignment and optimization strategy.
Net cash provided by financing activities of continuing operations was $49.7 million in 2014 compared with net cash used in financing activities of continuing operations of $49.0 million in 2013. Net cash provided by financing activities of continuing operations in 2014 mainly reflects the issuance by OTP of $150 million in privately placed unsecured notes in two series on February 27, 2014, and the use of a portion of the proceeds of the notes to retire OTP’s $40.9 million unsecured term loan and to repay short-term debt outstanding under the OTP Credit Agreement which was being used to finance OTP’s construction activities. Financing activities in 2014 also reflect: (1) the payment of $44.3 million in common stock dividends, (2) OTP’s repayment of $51.2 million in short-term debt under the OTP Credit Agreement outstanding on December 31, 2013, and (3) the borrowing of $10.9 million under the Otter Tail Corporation Credit Agreement to fund the working capital needs of our manufacturing and plastic pipe companies. Financing cash flows in 2014 also include $25.6 million in net cash proceeds from the issuance of common stock. In 2014, we began issuing common shares to meet the requirements of our dividend reinvestment and share purchase plan, employee stock ownership plan and employee stock purchase plan, rather than purchasing shares in the open market. In the second quarter of 2014, we began issuing common shares under the At-the-Market offering program.

| 49 |
Capital Requirements
We have a capital expenditure program for expanding, upgrading and improving our plants and operating equipment. Typical uses of cash for capital expenditures are investments in electric generation facilities and environmental upgrades, transmission and distribution lines, manufacturing facilities and upgrades, equipment used in the manufacturing process, and computer hardware and information systems. The capital expenditure program is subject to review and is revised in light of changes in demands for energy, technology, environmental laws, regulatory changes, business expansion opportunities, the costs of labor, materials and equipment and our consolidated financial condition.
Cash used for consolidated capital expenditures was $160 million in 2015, $164 million in 2014 and $160 million in 2013. Estimated capital expenditures for 2016 are $175 million. Total capital expenditures for the five-year period 2016 through 2020 are estimated to be approximately $972 million, which includes $213 million for OTP transmission projects designated by the MISO as MVPs, $162 million for natural gas-fired generation to replace Hoot Lake Plant capacity and $190 million for renewable wind and solar energy generation assets.
The breakdown of 2013, 2014 and 2015 actual cash used for capital expenditures and 2016 through 2020 estimated capital expenditures by segment is as follows:
| (in millions) | 2013 | 2014 | 2015 | 2016 | 2017 | 2018 | 2019 | 2020 | Total for 2016-2020 | |||||||||||||||||||||||||||
| Electric | $ | 150 | $ | 149 | $ | 136 | $ | 157 | $ | 140 | $ | 253 | $ | 169 | $ | 139 | $ | 858 | ||||||||||||||||||
| Manufacturing | 7 | 11 | 20 | 14 | 35 | 15 | 17 | 16 | 97 | |||||||||||||||||||||||||||
| Plastics | 3 | 4 | 4 | 4 | 3 | 4 | 3 | 3 | 17 | |||||||||||||||||||||||||||
| Total | $ | 160 | $ | 164 | $ | 160 | $ | 175 | $ | 178 | $ | 272 | $ | 189 | $ | 158 | $ | 972 | ||||||||||||||||||
The following table summarizes our contractual obligations at December 31, 2015 and the effect these obligations are expected to have on our liquidity and cash flow in future periods.
| (in millions) | Total | Less than 1 Year | 1-3 Years | 3-5 Years | More than 5 Years | |||||||||||||||
| Coal Contracts (required minimums) | $ | 724 | $ | 48 | $ | 55 | $ | 46 | $ | 575 | ||||||||||
| Debt Obligations | 579 | 133 | 33 | 1 | 412 | |||||||||||||||
| Interest on Debt Obligations | 336 | 29 | 45 | 44 | 218 | |||||||||||||||
| Capacity and Energy Requirements | 311 | 23 | 45 | 50 | 193 | |||||||||||||||
| Other Purchase Obligations | 90 | 57 | 33 | — | — | |||||||||||||||
| Postretirement Benefit Obligations | 85 | 4 | 9 | 10 | 62 | |||||||||||||||
| Operating Lease Obligations | 43 | 7 | 10 | 7 | 19 | |||||||||||||||
| Total Contractual Cash Obligations | $ | 2,168 | $ | 301 | $ | 230 | $ | 158 | $ | 1,479 | ||||||||||
Postretirement Benefit Obligations include estimated cash expenditures for the payment of retiree medical and life insurance benefits and supplemental pension benefits under our unfunded Executive Survivor and Supplemental Retirement Plan, but do not include amounts to fund our noncontributory funded pension plan, as we are not currently required to make a contribution to that plan.
CAPITAL RESOURCES
Financial flexibility is provided by operating cash flows, unused lines of credit, strong financial coverages, investment grade credit ratings, and alternative financing arrangements such as leasing. Equity or debt financing will be required in the period 2016 through 2020 given the expansion plans related to our Electric segment to fund construction of new rate base and transmission investments, in the event we decide to reduce borrowings under our lines of credit, to refund or retire early any of our presently outstanding debt, to complete acquisitions or for other corporate purposes. There can be no assurance that any additional required financing will be available through bank borrowings, debt or equity financing or otherwise, or that if such financing is available, it will be available on terms acceptable to us. If adequate funds are not available on acceptable terms, our businesses, results of operations and financial condition could be adversely affected.
Under our shelf registration statement filed with the SEC we may offer for sale, from time to time, either separately or together in any combination, equity, debt or other securities described in the shelf registration statement, until May 11, 2018.
| 50 |
Under our At-the-Market offering program, we may offer and sell our common shares from time to time through JPMS, as our distribution agent, up to an aggregate sales price of $75 million. Under the Distribution Agreement with JPMS, we will designate the minimum price and maximum number of shares to be sold through JPMS on any given trading day or over a specified period of trading days, and JPMS will use commercially reasonable efforts to sell such shares on such days, subject to certain conditions. We are not obligated to sell and JPMS is not obligated to buy or sell any of the shares under the Agreement.
Short-Term Debt
The following table presents the status of the Company’s lines of credit as of December 31, 2015 and December 31, 2014:
| (in thousands) | Line Limit | In Use on December 31, 2015 | Restricted due to Outstanding Letters of Credit | Available on December 31, 2015 | Available on December 31, 2014 | |||||||||||||||
| Otter Tail Corporation Credit Agreement | $ | 150,000 | $ | 59,666 | $ | — | $ | 90,334 | $ | 138,872 | ||||||||||
| OTP Credit Agreement | 170,000 | 21,006 | 300 | 148,694 | 169,440 | |||||||||||||||
| Total | $ | 320,000 | $ | 80,672 | $ | 300 | $ | 239,028 | $ | 308,312 | ||||||||||
Under the Otter Tail Corporation Credit Agreement (as defined below), the maximum amount of debt outstanding in 2015 was $80,160,000 on September 15, 2015 and the average daily balance of debt outstanding during 2015 was $42,453,000. The weighted average interest rate paid on debt outstanding under the Otter Tail Corporation Credit Agreement during 2015 was 2.0% compared with 1.9% in 2014. Under the OTP Credit Agreement (as defined below), the maximum amount of debt outstanding in 2015 was $22,864,000 on December 15, 2015 and the average daily balance of debt outstanding during 2015 was $7,876,000. The weighted average interest rate paid on debt outstanding under the OTP Credit Agreement during 2015 was 1.5% compared with 1.4% in 2014. The weighted average interest rate on consolidated short-term debt outstanding on December 31, 2015 was 1.9%.
On October 29, 2012 we entered into a Third Amended and Restated Credit Agreement (the Otter Tail Corporation Credit Agreement), which is an unsecured $150 million revolving credit facility that may be increased to $250 million on the terms and subject to the conditions described in the Otter Tail Corporation Credit Agreement. On October 29, 2015 the Otter Tail Corporation Credit Agreement was amended to extend its expiration date by one year from October 29, 2019 to October 29, 2020. We can draw on this credit facility to refinance certain indebtedness and support our operations and the operations of certain of our subsidiaries. Borrowings under the Otter Tail Corporation Credit Agreement bear interest at LIBOR plus 1.75%, subject to adjustment based on our senior unsecured credit ratings. We are required to pay commitment fees based on the average daily unused amount available to be drawn under the revolving credit facility. The Otter Tail Corporation Credit Agreement contains a number of restrictions on us and the businesses of Varistar and its subsidiaries, including restrictions on our and their ability to merge, sell assets, make investments, create or incur liens on assets, guarantee the obligations of certain other parties and engage in transactions with related parties. The Otter Tail Corporation Credit Agreement also contains affirmative covenants and events of default, and financial covenants as described below under the heading “Financial Covenants.” The Otter Tail Corporation Credit Agreement does not include provisions for the termination of the agreement or the acceleration of repayment of amounts outstanding due to changes in our credit ratings. Our obligations under the Otter Tail Corporation Credit Agreement are guaranteed by certain of our subsidiaries. Outstanding letters of credit issued by us under the Otter Tail Corporation Credit Agreement can reduce the amount available for borrowing under the line by up to $40 million.
On October 29, 2012 OTP entered into a Second Amended and Restated Credit Agreement (the OTP Credit Agreement), providing for an unsecured $170 million revolving credit facility that may be increased to $250 million on the terms and subject to the conditions described in the OTP Credit Agreement. On October 29, 2015 the OTP Credit Agreement was amended to extend its expiration date by one year from October 29, 2019 to October 29, 2020. OTP can draw on this credit facility to support the working capital needs and other capital requirements of its operations, including letters of credit in an aggregate amount not to exceed $50 million outstanding at any time. Borrowings under this line of credit bear interest at LIBOR plus 1.25%, subject to adjustment based on the ratings of OTP’s senior unsecured debt. OTP is required to pay commitment fees based on the average daily unused amount available to be drawn under the revolving credit facility. The OTP Credit Agreement contains a number of restrictions on the business of OTP, including restrictions on its ability to merge, sell assets, make investments, create or incur liens on assets, guarantee the obligations of any other party, and engage in transactions with related parties. The OTP Credit Agreement also contains affirmative covenants and events of default, and financial covenants as described below under the heading “Financial Covenants.” The OTP Credit Agreement does not include provisions for the termination of the agreement or the acceleration of repayment of amounts outstanding due to changes in OTP’s credit ratings. OTP’s obligations under the OTP Credit Agreement are not guaranteed by any other party.
| 51 |
Long-Term Debt
Debt Issuance
On February 5, 2016 we entered into a Term Loan Agreement (the Term Loan Agreement) with the Banks named therein, JPMorgan Chase Bank, N.A. (JPMorgan), as administrative agent, and JPMS, as Lead Arranger and Book Runner. The Term Loan Agreement provides for an unsecured term loan with an aggregate commitment of $50 million that we may use for purposes of funding working capital, capital expenditures and other corporate purposes of the Company and certain of our subsidiaries. Under the Term Loan Agreement, we may, on up to two occasions enter into additional tranches of term loans in minimum increments of $10 million, subject to the consent of the lenders and so long as the aggregate amount of outstanding term loans does not exceed $100 million at any time. Borrowings under the Term Loan Agreement will bear interest at either (1) LIBOR plus 0.90% or (2) the greater of (a) the Prime Rate, (b) the Federal Reserve Bank of New York Rate plus 0.50% and (c) LIBOR multiplied by the Statutory Reserve Rate plus 1%. The applicable interest rate will depend on our election of whether to make the advance a LIBOR advance. The Term Loan Agreement terminates on February 5, 2018.
On February 5, 2016 we borrowed $50 million under the Term Loan Agreement at an interest rate based on the 30 day LIBOR plus 90 basis points and used the proceeds to pay down borrowings under the Otter Tail Corporation Credit Agreement that were used to fund the expansion of BTD’s Minnesota facilities in 2015 and to fund the September 1, 2015 acquisition of BTD-Georgia.
Debt Retirements and Preferred Stock Redemption
On March 1, 2013 OTP entered into a Credit Agreement (the Loan Agreement) with JPMorgan providing for a $40.9 million unsecured term loan (the Term Loan) to OTP originally due on June 1, 2014, which was fully drawn on March 1, 2013. The Loan Agreement was amended on October 29, 2013 to extend the due date on the Term Loan to January 15, 2015. Borrowings under the Loan Agreement bore interest at LIBOR plus 0.875%. On March 1, 2013 OTP utilized approximately $25.1 million of Term Loan proceeds to fund the redemption price for all of the 4.65% Grant County, South Dakota Pollution Control Refunding Revenue Bonds and 4.85% Mercer County, North Dakota Pollution Control Refunding Revenue Bonds outstanding on that date, in each case for which OTP paid debt service. All such bonds had been called for redemption in full on March 1, 2013. Also on March 1, 2013, OTP utilized approximately $15.7 million of Term Loan proceeds to satisfy an intercompany note to us that had a balance and interest rate designed to equate to the balances and dividend rates of our cumulative preferred shares. Those cumulative preferred shares were redeemed on March 1, 2013 for $15.7 million, including $0.2 million in call premiums charged to equity and included with preferred dividends paid and as part of our preferred dividend requirement for the year ended December 31, 2013. On February 27, 2014 OTP used a portion of the proceeds from the issuance of notes under the 2013 Note Purchase Agreement (as defined below) to retire early the Term Loan.
On November 6 and 25, 2013 we purchased, in two separate transactions, $12,933,000 and $34,737,000, respectively, of our outstanding 9.000% notes due 2016 (the 2016 Notes), originally issued in the aggregate principal amount of $100 million. The purchased 2016 Notes were subsequently retired and are no longer outstanding. The remaining $52,330,000 principal amount of 2016 Notes outstanding, unless redeemed early or otherwise repaid, will mature and become due and payable on December 15, 2016. The price paid for the purchased 2016 Notes was $59,404,000, which includes the principal amount of the purchased 2016 Notes, plus accrued interest of $1,845,000 through the respective purchase dates and a negotiated premium of $9,889,000 (which is less than the premium we would have been required to pay to redeem them under the terms of the 2016 Notes). We used cash on hand to fund the purchase of the purchased 2016 Notes. The amount of the debt retired as a result of these transactions is approximately equivalent to the remaining amount of debt that was associated with the operating companies that we have divested over the last two years. The retirement of the purchased 2016 Notes further strengthens our capital structure and reduces our pre-tax interest expense by approximately $4.3 million in both 2014 and 2015 and $4.1 million in 2016. On repayment, $363,000 in unamortized debt expense related to the 2016 Notes was immediately recognized as expense along with the $9,889,000 negotiated premium which, in total, reduced diluted earnings per share by $0.17 in 2013.
2013 Note Purchase Agreement
On August 14, 2013 OTP entered into a Note Purchase Agreement (the 2013 Note Purchase Agreement) with the Purchasers named therein, pursuant to which OTP agreed to issue to the Purchasers, in a private placement transaction, $60 million aggregate principal amount of OTP’s 4.68% Series A Senior Unsecured Notes due February 27, 2029 (the Series A Notes) and $90 million aggregate principal amount of OTP’s 5.47% Series B Senior Unsecured Notes due February 27, 2044 (the Series B Notes and, together with the Series A Notes, the Notes). On February 27, 2014 OTP issued all $150 million aggregate principal amount of the Notes. OTP used a portion of the proceeds of the Notes to retire its $40.9 million term loan under a Credit Agreement with JPMorgan and to repay $82.5 million of short-term debt then outstanding under the OTP Credit Agreement. Remaining proceeds of the Notes were used to fund OTP construction program expenditures.
| 52 |
The 2013 Note Purchase Agreement states that OTP may prepay all or any part of the Notes (in an amount not less than 10% of the aggregate principal amount of the Notes then outstanding in the case of a partial prepayment) at 100% of the principal amount prepaid, together with accrued interest and a make-whole amount, provided that if no default or event of default under the 2013 Note Purchase Agreement exists, any optional prepayment made by OTP of (i) all of the Series A Notes then outstanding on or after November 27, 2028 or (ii) all of the Series B Notes then outstanding on or after November 27, 2043, will be made at 100% of the principal prepaid but without any make-whole amount. In addition, the 2013 Note Purchase Agreement states OTP must offer to prepay all of the outstanding Notes at 100% of the principal amount together with unpaid accrued interest in the event of a change of control of OTP.
The 2013 Note Purchase Agreement contains a number of restrictions on the business of OTP, including restrictions on OTP’s ability to merge, sell assets, create or incur liens on assets, guarantee the obligations of any other party, and engage in transactions with related parties. The 2013 Note Purchase Agreement also contains affirmative covenants and events of default, as well as certain financial covenants as described below under the heading “Financial Covenants.” The 2013 Note Purchase Agreement does not include provisions for the termination of the agreement or the acceleration of repayment of amounts outstanding due to changes in OTP’s credit ratings. The 2013 Note Purchase Agreement includes a “most favored lender” provision generally requiring that in the event OTP’s existing credit agreement or any renewal, extension or replacement thereof, at any time contains any financial covenant or other provision providing for limitations on interest expense and such a covenant is not contained in the 2013 Note Purchase Agreement under substantially similar terms or would be more beneficial to the holders of the Notes than any analogous provision contained in the 2013 Note Purchase Agreement (an “Additional Covenant”), then unless waived by the Required Holders (as defined in the 2013 Note Purchase Agreement), the Additional Covenant will be deemed to be incorporated into the 2013 Note Purchase Agreement. The 2013 Note Purchase Agreement also provides for the amendment, modification or deletion of an Additional Covenant if such Additional Covenant is amended or modified under or deleted from the OTP credit agreement, provided that no default or event of default has occurred and is continuing.
2007 and 2011 Note Purchase Agreements
On December 1, 2011, OTP issued $140 million aggregate principal amount of its 4.63% Senior Unsecured Notes due December 1, 2021 pursuant to a Note Purchase Agreement dated as of July 29, 2011 (2011 Note Purchase Agreement). OTP also has outstanding its $155 million senior unsecured notes issued in four series consisting of $33 million aggregate principal amount of 5.95% Senior Unsecured Notes, Series A, due 2017; $30 million aggregate principal amount of 6.15% Senior Unsecured Notes, Series B, due 2022; $42 million aggregate principal amount of 6.37% Senior Unsecured Notes, Series C, due 2027; and $50 million aggregate principal amount of 6.47% Senior Unsecured Notes, Series D, due 2037 (collectively, the 2007 Notes). The 2007 Notes were issued pursuant to a Note Purchase Agreement dated as of August 20, 2007 (the 2007 Note Purchase Agreement).
The 2011 Note Purchase Agreement and the 2007 Note Purchase Agreement each states that OTP may prepay all or any part of the notes issued thereunder (in an amount not less than 10% of the aggregate principal amount of the notes then outstanding in the case of a partial prepayment) at 100% of the principal amount prepaid, together with accrued interest and a make-whole amount. The 2011 Note Purchase Agreement states in the event of a transfer of utility assets put event, the noteholders thereunder have the right to require OTP to repurchase the notes held by them in full, together with accrued interest and a make-whole amount, on the terms and conditions specified in the 2011 Note Purchase Agreement. The 2011 Note Purchase Agreement and the 2007 Note Purchase Agreement each also states that OTP must offer to prepay all of the outstanding notes issued thereunder at 100% of the principal amount together with unpaid accrued interest in the event of a change of control of OTP. The note purchase agreements contain a number of restrictions on OTP, including restrictions on OTP’s ability to merge, sell assets, create or incur liens on assets, guarantee the obligations of any other party, and engage in transactions with related parties. The note purchase agreements also include affirmative covenants and events of default, and certain financial covenants as described below under the heading “Financial Covenants.”
| 53 |
Financial Covenants
We were in compliance with the financial covenants in our debt agreements as of December 31, 2015.
No Credit or Note Purchase Agreement contains any provisions that would trigger an acceleration of the related debt as a result of changes in the credit rating levels assigned to the related obligor by rating agencies.
Our borrowing agreements are subject to certain financial covenants. Specifically:
| · | Under the Otter Tail Corporation Credit Agreement and the Term Loan Agreement, we may not permit the ratio of our Interest-bearing Debt to Total Capitalization to be greater than 0.60 to 1.00 or permit our Interest and Dividend Coverage Ratio to be less than 1.50 to 1.00 (each measured on a consolidated basis). As of December 31, 2015 our Interest and Dividend Coverage Ratio calculated under the requirements of the Otter Tail Corporation Credit Agreement was 3.64 to 1.00. |
| · | Under the OTP Credit Agreement, OTP may not permit the ratio of its Interest-bearing Debt to Total Capitalization to be greater than 0.60 to 1.00. |
| · | Under the 2007 Note Purchase Agreement and 2011 Note Purchase Agreement, OTP may not permit the ratio of its Consolidated Debt to Total Capitalization to be greater than 0.60 to 1.00 or permit its Interest and Dividend Coverage Ratio to be less than 1.50 to 1.00, in each case as provided in the related borrowing agreement, and OTP may not permit its Priority Debt to exceed 20% of its Total Capitalization, as provided in the related agreement. As of December 31, 2015 OTP’s Interest and Dividend Coverage Ratio and Interest Charges Coverage Ratio, calculated under the requirements of the 2007 Note Purchase Agreement and 2011 Note Purchase Agreement, was 3.64 to 1.00. |
| · | Under the 2013 Note Purchase Agreement, OTP may not permit its Interest-bearing Debt to exceed 60% of Total Capitalization and may not permit its Priority Indebtedness to exceed 20% of its Total Capitalization, each as provided in the 2013 Note Purchase Agreement. |
As of December 31, 2015 our ratio of interest-bearing debt to total capitalization was 0.49 to 1.00 on a consolidated basis and 0.48 to 1.00 for OTP.
Our ratio of earnings to fixed charges from continuing operations reported in Exhibit 12.1 to this Annual Report on Form 10-K, which includes imputed finance costs on operating leases, was 3.4x for 2015 compared to 3.3x for 2014. Our debt interest coverage ratio before taxes, calculated by dividing income before income taxes from continuing operations plus interest charges by interest charges plus capitalized interest, was 3.5x for 2015 compared to 3.4x for 2014. During 2016, we expect these coverage ratios to increase, assuming 2016 net income meets our expectations.
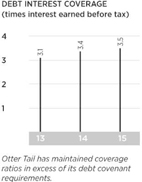
OFf-Balance-Sheet Arrangements
We and our subsidiary companies have outstanding letters of credit totaling $5.5 million, but our line of credit borrowing limits are only restricted by $0.3 million of the outstanding letters of credit. We do not have any other off-balance-sheet arrangements or any relationships with unconsolidated entities or financial partnerships. These entities are often referred to as structured finance special purpose entities or variable interest entities, which are established for the purpose of facilitating off-balance-sheet arrangements or for other contractually narrow or limited purposes. We are not exposed to any financing, liquidity, market or credit risk that could arise if we had such relationships.
| 54 |
2016 BUSINESS OUTLOOK
We anticipate 2016 diluted earnings per share to be in the range of $1.50 to $1.65. This guidance reflects the current mix of businesses owned by us, considers the cyclical nature of some of our businesses and reflects current economic challenges facing our manufacturing platform, as well as our plans and strategies for improving future operating results. We expect capital expenditures for 2016 to be $175 million compared with actual cash used for capital expenditures of $160 million in 2015. Major projects in our planned expenditures for 2016 include investments in two large transmission line projects for the Electric segment, which are expected to positively impact earnings and provide an immediate return on capital.
Segment components of our 2016 earnings per share guidance range compared with 2015 actual earnings are as follows:
| 2015 EPS | 2016 EPS Guidance | |||||||||||
| by Segment | Low | High | ||||||||||
| Electric | $ | 1.29 | $ | 1.29 | $ | 1.32 | ||||||
| Manufacturing | $ | 0.11 | $ | 0.11 | $ | 0.15 | ||||||
| Plastics | $ | 0.32 | $ | 0.26 | $ | 0.30 | ||||||
| Corporate | ($ | 0.16 | ) | ($ | 0.16 | ) | ($ | 0.12 | ) | |||
| Total – Continuing Operations | $ | 1.56 | $ | 1.50 | $ | 1.65 | ||||||
Contributing to our earnings guidance for 2016 are the following items:
| · | We expect 2016 Electric segment net income to be slightly higher than 2015 segment net income based on: |
| o | Normalized weather for 2016. |
| o | Constructive outcome of a rate case filed in Minnesota on February 16, 2016. |
| o | Rider recovery increases, including environmental riders in Minnesota, North Dakota and South Dakota related to the Big Stone AQCS environmental upgrades and transmission riders related to the Electric segments continuing investments in its share of the Multi Value transmission projects in South Dakota. |
| o | Expected increases in sales to pipeline and commercial customers. |
| o | A decrease in pension costs as a result of an increase in the discount rate from 4.35% to 4.76%. |
offset by:
| o | The effect of the 2015 adoption of bonus depreciation for income taxes reducing projected earnings from Electric segment operations by $0.06 per share in 2016. |
| o | Higher depreciation and property tax expense due to large capital projects being put into service. |
| o | Higher short-term interest costs as major construction projects continue to be funded. |
| o | Increased operating expenses associated with reagents and employee expenses. |
| o | Increased transmission expenses associated with termination of historic integrated transmission agreements. |
| · | We expect 2016 net income from our Manufacturing segment to increase over 2015 due to: |
| o | An increase at BTD due to increases in volume as a result of having BTD-Georgia in place for a full year. Full year sales for BTD-Georgia are expected to be $33 million. |
| o | Excluding the full year impact of BTD-Georgia, revenues are expected to grow approximately 7% based on availability of BTD’s new paint line and its expected impact on sales growth. The overall sales growth is tempered by current market conditions facing end markets served by BTD. BTD has significant exposure to the agriculture, oil and gas and recreational vehicle end markets, all of which are forecasted to be down in 2016 compared to 2015. |
| o | Improved margins on parts and tooling sales given improved productivity across all of BTD’s locations as a result of lower expediting costs, costs of quality and maintenance expenses. These increases are expected to be offset by higher facility costs associated with BTD’s expansion of its square footage. |
| o | Scrap revenues, based on current commodity prices for scrap steel, are expected to be down in 2016 compared to 2015 given the excess capacity in the steel industry and the impact of low prices from imported steel. |
| 55 |
| o | A decrease in earnings from T.O. Plastics mainly driven by an expected decrease in operating margins due to a shift in product mix relating to a customer bringing a high margin product into its own manufacturing facilities. |
| o | Backlog for the manufacturing companies of approximately $134 million for 2016 compared with $140 million one year ago. |
| · | We expect 2016 net income from the Plastics segment to be down from 2015. Sales volumes in 2016 are expected to be flat compared with 2015 with lower expected operating margins due to tighter spreads between raw material costs and sales prices, along with higher labor and freight costs. |
| · | Corporate costs are expected to be lower in 2016 compared with 2015 based on lower labor costs and continued cost reduction efforts. |
The following table shows our 2015 capital expenditures and 2016 through 2020 anticipated capital expenditures and electric utility average rate base:
| (in millions) | 2015 | 2016 | 2017 | 2018 | 2019 | 2020 | ||||||||||||||||||
| Capital Expenditures: | ||||||||||||||||||||||||
| Electric Segment: | ||||||||||||||||||||||||
| Transmission | $ | 107 | $ | 96 | $ | 51 | $ | 5 | $ | 7 | ||||||||||||||
| Renewables and Natural Gas Generation | 4 | 3 | 162 | 113 | 81 | |||||||||||||||||||
| Other | 46 | 41 | 40 | 51 | 51 | |||||||||||||||||||
| Total Electric Segment | $ | 136 | $ | 157 | $ | 140 | $ | 253 | $ | 169 | $ | 139 | ||||||||||||
| Manufacturing and Plastics Segments | 24 | 18 | 38 | 19 | 20 | 19 | ||||||||||||||||||
| Total Capital Expenditures | $ | 160 | $ | 175 | $ | 178 | $ | 272 | $ | 189 | $ | 158 | ||||||||||||
| Total Electric Utility Average Rate Base | $ | 1,032 | $ | 1,087 | $ | 1,241 | $ | 1,295 | $ | 1,354 | ||||||||||||||
The updated capital expenditure plan for the 2016-2020 time period calls for $858 million based on the need for additional wind and solar in rate base and the final year of capital spending on the natural gas plant that is expected to replace Hoot Lake Plant when it is retired in 2021. Taking into account the increased capital expenditure plan along with the impact of the recently extended bonus deprecation, our updated compounded annual growth rate in rate base is expected to be 8.0%.
Execution on the currently anticipated electric utility capital expenditure plan is expected to grow rate base and be a key driver in increasing utility earnings over the 2016 through 2020 timeframe.
Our outlook for 2016 is dependent on a variety of factors and is subject to the risks and uncertainties discussed in Item 1A. Risk Factors, and elsewhere in this Annual Report on Form 10-K.
Critical Accounting Policies Involving Significant Estimates
Our significant accounting policies are described in note 1 to our consolidated financial statements. The discussion and analysis of the financial statements and results of operations are based on our consolidated financial statements, which have been prepared in accordance with accounting principles generally accepted in the United States of America. The preparation of these consolidated financial statements requires management to make estimates and judgments that affect the reported amounts of assets, liabilities, revenues and expenses, and related disclosure of contingent assets and liabilities.
We use estimates based on the best information available in recording transactions and balances resulting from business operations. Estimates are used for such items as depreciable lives, asset impairment evaluations, tax provisions, collectability of trade accounts receivable, self-insurance programs, unbilled electric revenues, warranty reserves and actuarially determined benefits costs and liabilities. As better information becomes available or actual amounts are known, estimates are revised. Operating results can be affected by revised estimates. Actual results may differ from these estimates under different assumptions or conditions. Management has discussed the application of these critical accounting policies and the development of these estimates with the Audit Committee of the board of directors. The following critical accounting policies affect the more significant judgments and estimates used in the preparation of our consolidated financial statements.
| 56 |
Pension and Other Postretirement Benefits Obligations and Costs
Pension and postretirement benefit liabilities and expenses for our electric utility and corporate employees are determined by actuaries using assumptions about the discount rate, expected return on plan assets, rate of compensation increase and healthcare cost-trend rates. Further discussion of our pension and postretirement benefit plans and related assumptions is included in note 11 to our consolidated financial statements.
These benefits, for any individual employee, can be earned and related expenses can be recognized and a liability accrued over periods of up to 35 or more years. These benefits can be paid out for up to 40 or more years after an employee retires. Estimates of liabilities and expenses related to these benefits are among our most critical accounting estimates. Although deferral and amortization of fluctuations in actuarially determined benefit obligations and expenses are provided for when actual results on a year-to-year basis deviate from long-range assumptions, compensation increases and healthcare cost increases or a reduction in the discount rate applied from one year to the next can significantly increase our benefit expenses in the year of the change. Also, a reduction in the expected rate of return on pension plan assets in our funded pension plan or realized rates of return on plan assets that are well below assumed rates of return or an increase in the anticipated life expectancy of plan participants could result in significant increases in recognized pension benefit expenses in the year of the change or for many years thereafter because actuarial losses can be amortized over the average remaining service lives of active employees.
The pension benefit cost for 2016 for our noncontributory funded pension plan is expected to be $5.4 million compared to $8.1 million in 2015, reflecting no change in the assumed rate of return on pension plan assets from 7.75% in 2015, and an increase in the estimated discount rate used to determine annual benefit cost accruals from 4.35% in 2015 to 4.76% in 2016. In selecting the discount rate, we consider the yields of fixed income debt securities, which have ratings of “Aa” published by recognized rating agencies, along with bond matching models specific to our plan’s cash flows as a basis to determine the rate.
Subsequent increases or decreases in actual rates of return on plan assets over assumed rates or increases or decreases in the discount rate or rate of increase in future compensation levels could significantly change projected costs. For 2015, all other factors being held constant: a 0.25 increase in the discount rate would have decreased our 2015 pension benefit cost by $952,000; a 0.25 decrease in the discount rate would have increased our 2015 pension benefit cost by $1,020,000; a 0.25 increase in the assumed rate of increase in future compensation levels would have increased our 2015 pension benefit cost by $563,000; a 0.25 decrease in the assumed rate of increase in future compensation levels would have decreased our 2015 pension benefit cost by $550,000; and a 0.25 increase (or decrease) in the expected long-term rate of return on plan assets would have decreased (or increased) our 2015 pension benefit cost by $593,000.
Increases or decreases in the discount rate or in retiree healthcare cost inflation rates could significantly change our projected postretirement healthcare benefit costs. A 0.25 increase in the discount rate would have decreased our 2015 postretirement medical benefit costs by $18,000. A 0.25 decrease in the discount rate would have increased our 2015 postretirement medical benefit costs by $127,000. See note 11 to consolidated financial statements for the cost impact of a change in medical cost inflation rates.
We believe the estimates made for our pension and other postretirement benefits are reasonable based on the information that is known at the point in time the estimates are made. These estimates and assumptions are subject to a number of variables and are subject to change.
Taxation
We are required to make judgments regarding the potential tax effects of various financial transactions and our ongoing operations to estimate our obligations to taxing authorities. These tax obligations include income, real estate and use taxes. These judgments could result in the recognition of a liability for potential adverse outcomes regarding uncertain tax positions that we have taken. While we believe our liability for uncertain tax positions as of December 31, 2015 reflects the most likely probable expected outcome of these tax matters in accordance with the requirements of ASC 740, Income Taxes, the ultimate outcome of such matters could result in additional adjustments to our consolidated financial statements. However, we do not believe such adjustments would be material.
Deferred income taxes are provided for revenue and expenses which are recognized in different periods for income tax and financial reporting purposes. We assess our deferred tax assets for recoverability taking into consideration our historical and anticipated earnings levels, the reversal of other existing temporary differences, available net operating loss carryforwards and available tax planning strategies that could be implemented to realize the deferred tax assets. Based on this assessment, management must evaluate the need for, and amount of, a valuation allowance against our deferred tax assets. As facts and circumstances change, adjustments to the valuation allowance may be required.
| 57 |
Asset Impairment
We are required to test for asset impairment relating to property and equipment whenever events or changes in circumstances indicate that the carrying amount of a long-lived asset may exceed its fair value and not be recoverable. We apply the accounting guidance under ASC 360-10-35, Property, Plant, and Equipment – Subsequent Measurement, in order to determine whether or not an asset is impaired. This standard requires an impairment analysis when indicators of impairment are present. If such indicators are present, the standard requires that if the sum of the future expected cash flows from a company’s asset, undiscounted and without interest charges, is less than the carrying amount, an asset impairment must be recognized in the financial statements. The amount of the impairment is the difference between the fair value of the asset and the carrying amount of the asset.
We believe the accounting estimates related to an asset impairment are critical because: (1) they are highly susceptible to change from period to period, reflecting changing business cycles, (2) require management to make assumptions about future cash flows over future years, and (3) the impact of recognizing an impairment could have a significant effect on operations. Management’s assumptions about future cash flows require significant judgment because actual operating levels have fluctuated in the past and are expected to continue to do so in the future.
As of December 31, 2015 an assessment of the carrying amounts of our long-lived assets and other intangibles indicated these assets were not impaired.
Goodwill Impairment
Goodwill is required to be evaluated annually for impairment, according to ASC 350-20-35, Goodwill – Subsequent Measurement. We perform quantitative goodwill impairment testing annually in the fourth quarter. In addition, the test is performed on an interim basis whenever events or circumstances indicate that the carrying amount of goodwill may not be recoverable. Examples of such events or circumstances may include a significant adverse change in business climate, weakness in an industry in which our reporting units operate or recent significant cash or operating losses with expectations that those losses will continue.
The quantitative goodwill impairment test is a two-step process performed at the reporting unit level. We have determined the reporting units for our goodwill impairment test are our operating segments, or components of an operating segment, that constitute a business for which discrete financial information is available and for which our chief operating decision makers regularly review the operating results. For more information on our operating segments, see note 2 to consolidated financial statements. The first step of the quantitative impairment test involves comparing the fair value of each reporting unit to its carrying value. If the fair value of a reporting unit exceeds its carrying value, the test is complete and no impairment is recorded. If the fair value of a reporting unit is less than its carrying value, step two of the test is performed to determine the amount of impairment loss, if any. The impairment is computed by comparing the implied fair value of the reporting unit’s goodwill to the carrying value of that goodwill. If the carrying value is greater than the implied fair value, an impairment loss must be recorded. At December 31, 2015, the fair value substantially exceeded the carrying value at all our reporting units reported under continuing operations.
Determining the fair value of a reporting unit requires judgment and the use of significant estimates which include assumptions about the reporting unit’s future revenue, profitability and cash flows, amount and timing of estimated capital expenditures, inflation rates, weighted average cost of capital, operational plans, and current and future economic conditions, among others. The fair value of each reporting unit is determined using a weighted combination of income and market approaches. We use a discounted cash flow methodology for our income approach. Under this approach, the discounted cash flow model determines fair value based on the present value of projected cash flows over a specified period and a residual value related to future cash flows beyond the projection period. Both values are discounted using a rate which reflects the best estimate of the weighted average cost of capital at each reporting unit. Under the market approach, we estimate fair value using multiples derived from comparable enterprise value to EBITDA multiples, comparable price earnings ratios, comparable enterprise value to sales multiples and if available, comparable sales transactions for comparative peer companies for each respective reporting unit. These multiples are applied to operating data for each reporting unit to arrive at an indication of fair value. We believe the estimates and assumptions used in our impairment assessments are reasonable and based on available market information, but variations in any of the assumptions could result in materially different calculations of fair value and determinations of whether or not impairment is indicated.
In the fourth quarter of 2014 we entered into negotiations to sell our wholly owned subsidiary, Foley, a mechanical and prime contractor on industrial projects. As a result of impairment indicators during the fourth quarter of 2014 and the first quarter of 2015, we recorded goodwill impairment charges of $5.6 million ($0.15 per share) and $1.0 million ($0.03 per share), respectively. The initial impairment charge was based on the indicated offering price in a signed letter of intent for the purchase of Foley. The subsequent impairment charge was based on an adjustment to the carrying value of Foley in the first quarter of 2015. The goodwill impairment losses are reflected in the results of discontinued operations. An assessment of the carrying amounts of the remaining goodwill of our reporting units reported under continuing operations as of December 31, 2015 indicated the fair values are substantially in excess of their respective book values and not impaired.
| 58 |
acquisition METHOD OF accounting
We account for acquisitions under the requirements of ASC Topic 805, Business Combinations. Under ASC 805 the term “purchase method of accounting” is replaced with “acquisition method of accounting” and requires an acquirer to recognize the assets acquired, the liabilities assumed and any noncontrolling interest in the acquiree at the acquisition date, measured at their fair values as of that date, with limited exceptions.
Acquired assets and liabilities assumed that are subject to critical estimates include property, plant and equipment, intangible assets and inventory. The fair value of property, plant and equipment is based on valuations performed by qualified internal personnel and/or with the assistance of outside appraisers. Fair values assigned to plant and equipment are based on several factors including the age and condition of the equipment, maintenance records of the equipment and auction values for equipment with similar characteristics at the time of purchase. Intangible assets are identified and valued using the guidelines of ASC 805. The fair value of intangible assets is based on estimates including royalty rates, customer attrition rates and estimated cash flows.
While the allocation of purchase price is subject to a high degree of judgment and uncertainty, we do not expect the estimates to vary significantly once an acquisition is complete. We believe our estimates have been reasonable in the past as there have been no significant valuation adjustments to the allocation of purchase price.
Forward-Looking Information – Safe Harbor Statement Under the Private Securities Litigation Reform Act of 1995
This Annual Report on Form 10-K contains forward-looking statements within the meaning of the Private Securities Litigation Reform Act of 1995 (the Act). When used in this Form 10-K and in future filings by the Company with the SEC, in the Company’s press releases and in oral statements, words such as “may,” “will,” “expect,” “anticipate,” “continue,” “estimate,” “project,” “believes” or similar expressions are intended to identify forward-looking statements within the meaning of the Act. Such statements are based on current expectations and assumptions, and entail various risks and uncertainties that could cause actual results to differ materially from those expressed in such forward-looking statements. Such risks and uncertainties include the various factors set forth in Item 1A. Risk Factors of this Annual Report on Form 10-K and in our other SEC filings.
| Item 7A. | QUANTITATIVE AND QUALITATIVE DISCLOSURES ABOUT MARKET RISK |
At December 31, 2015 we had exposure to market risk associated with interest rates because we had $59.7 million in short-term debt outstanding subject to variable interest rates that are indexed to LIBOR plus 1.75% under the Otter Tail Corporation Credit Agreement, and OTP had $21.0 million in short-term debt outstanding subject to variable interest rates indexed to LIBOR plus 1.25% under the OTP Credit Agreement.
All of our consolidated long-term debt outstanding on December 31, 2015 has fixed interest rates. We manage our interest rate risk through the issuance of fixed-rate debt with varying maturities, through economic refunding of debt through optional refundings, limiting the amount of variable interest rate debt, and the utilization of short-term borrowings to allow flexibility in the timing and placement of long-term debt.
We have not used interest rate swaps to manage net exposure to interest rate changes related to our portfolio of borrowings. We maintain a ratio of fixed-rate debt to total debt within a certain range. It is our policy to enter into interest rate transactions and other financial instruments only to the extent considered necessary to meet our stated objectives. We do not enter into interest rate transactions for speculative or trading purposes.
The companies in our Manufacturing segment are exposed to market risk related to changes in commodity prices for steel, aluminum and polystyrene (PS) and other plastics resins. The price and availability of these raw materials could affect the revenues and earnings of our Manufacturing segment.
The plastics companies are exposed to market risk related to changes in commodity prices for PVC resins, the raw material used to manufacture PVC pipe. The PVC pipe industry is highly sensitive to commodity raw material pricing volatility. Historically, when resin prices are rising or stable, sales volume has been higher and when resin prices are falling, sales volume has been lower. Operating income may decline when the supply of PVC pipe increases faster than demand. Due to the commodity nature of PVC resin and the dynamic supply and demand factors worldwide, it is very difficult to predict gross margin percentages or to assume that historical trends will continue.
We have in place an energy risk management policy with a goal to manage, through the use of defined risk management practices, price risk and credit risk associated with wholesale power sales. We have established guidelines and limits to manage credit risk associated with wholesale power and capacity sales. Specific limits are determined by a counterparty’s financial strength. Counterparties with investment grade credit ratings have minimum credit ratings of BBB- (Standard & Poor’s), Baa3 (Moody’s) or BBB- (Fitch). OTP had no exposure at December 31, 2015 to counterparties with investment grade or below investment grade credit ratings with respect to any of its forward energy contracts.
| 59 |
| Item 8. | FINANCIAL STATEMENTS AND SUPPLEMENTARY DATA |
REPORT OF INDEPENDENT REGISTERED PUBLIC ACCOUNTING FIRM
To the Shareholders of
Otter Tail Corporation
We have audited the accompanying consolidated balance sheets and statements of capitalization of Otter Tail Corporation and subsidiaries (the “Company”) as of December 31, 2015 and 2014, and the related consolidated statements of income, comprehensive income, common shareholders’ equity, and cash flows for each of the three years in the period ended December 31, 2015. Our audits also included the financial statement schedule listed in the Index at Item 15. We also have audited the Company’s internal control over financial reporting as of December 31, 2015, based on criteria established in Internal Control — Integrated Framework (2013) issued by the Committee of Sponsoring Organizations of the Treadway Commission. The Company’s management is responsible for these financial statements and financial statement schedule, for maintaining effective internal control over financial reporting, and for its assessment of the effectiveness of internal control over financial reporting, included in the accompanying Management’s Report Regarding Internal Controls Over Financial Reporting. Our responsibility is to express an opinion on these financial statements and financial statement schedule and an opinion on the Company’s internal control over financial reporting based on our audits.
We conducted our audits in accordance with the standards of the Public Company Accounting Oversight Board (United States). Those standards require that we plan and perform the audit to obtain reasonable assurance about whether the financial statements are free of material misstatement and whether effective internal control over financial reporting was maintained in all material respects. Our audits of the financial statements included examining, on a test basis, evidence supporting the amounts and disclosures in the financial statements, assessing the accounting principles used and significant estimates made by management, and evaluating the overall financial statement presentation. Our audit of internal control over financial reporting included obtaining an understanding of internal control over financial reporting, assessing the risk that a material weakness exists, and testing and evaluating the design and operating effectiveness of internal control based on the assessed risk. Our audits also included performing such other procedures as we considered necessary in the circumstances. We believe that our audits provide a reasonable basis for our opinions.
A company’s internal control over financial reporting is a process designed by, or under the supervision of, the company’s principal executive and principal financial officers, or persons performing similar functions, and effected by the company’s board of directors, management, and other personnel to provide reasonable assurance regarding the reliability of financial reporting and the preparation of financial statements for external purposes in accordance with generally accepted accounting principles. A company’s internal control over financial reporting includes those policies and procedures that (1) pertain to the maintenance of records that, in reasonable detail, accurately and fairly reflect the transactions and dispositions of the assets of the company; (2) provide reasonable assurance that transactions are recorded as necessary to permit preparation of financial statements in accordance with generally accepted accounting principles, and that receipts and expenditures of the company are being made only in accordance with authorizations of management and directors of the company; and (3) provide reasonable assurance regarding prevention or timely detection of unauthorized acquisition, use, or disposition of the company’s assets that could have a material effect on the financial statements.
Because of the inherent limitations of internal control over financial reporting, including the possibility of collusion or improper management override of controls, material misstatements due to error or fraud may not be prevented or detected on a timely basis. Also, projections of any evaluation of the effectiveness of the internal control over financial reporting to future periods are subject to the risk that the controls may become inadequate because of changes in conditions, or that the degree of compliance with the policies or procedures may deteriorate.
In our opinion, the consolidated financial statements referred to above present fairly, in all material respects, the financial position of Otter Tail Corporation and subsidiaries as of December 31, 2015 and 2014, and the results of their operations and their cash flows for each of the three years in the period ended December 31, 2015, in conformity with accounting principles generally accepted in the United States of America. Also, in our opinion, such financial statement schedule, when considered in relation to the basic consolidated financial statements taken as a whole, presents fairly, in all material respects, the information set forth therein. Also, in our opinion, the Company maintained, in all material respects, effective internal control over financial reporting as of December 31, 2015, based on the criteria established in Internal Control — Integrated Framework (2013) issued by the Committee of Sponsoring Organizations of the Treadway Commission.
/s/ Deloitte & Touche LLP
Minneapolis, Minnesota
February 29, 2016
| 60 |
See accompanying notes to consolidated financial statements.
| 61 |
| Otter Tail Corporation | ||||||||
| Consolidated Balance Sheets, December 31 | ||||||||
| (in thousands, except share data) | 2015 | 2014 | ||||||
| Liabilities and Equity | ||||||||
| Current Liabilities | ||||||||
| Short-Term Debt | $ | 80,672 | $ | 10,854 | ||||
| Current Maturities of Long-Term Debt | 52,544 | 201 | ||||||
| Accounts Payable | 89,499 | 107,013 | ||||||
| Accrued Salaries and Wages | 16,182 | 19,256 | ||||||
| Accrued Taxes | 14,827 | 13,793 | ||||||
| Derivative Liabilities | 199 | 14,230 | ||||||
| Other Accrued Liabilities | 15,217 | 8,793 | ||||||
| Liabilities of Discontinued Operations | 2,098 | 26,461 | ||||||
| Total Current Liabilities | 271,238 | 200,601 | ||||||
| Pensions Benefit Liability | 104,912 | 102,711 | ||||||
| Other Postretirement Benefits Liability | 48,730 | 53,638 | ||||||
| Other Noncurrent Liabilities | 23,854 | 26,794 | ||||||
| Commitments and Contingencies (note 9) | ||||||||
| Deferred Credits | ||||||||
| Deferred Income Taxes | 207,669 | 181,328 | ||||||
| Deferred Tax Credits | 24,506 | 26,384 | ||||||
| Regulatory Liabilities | 77,432 | 77,013 | ||||||
| Other | 11,595 | 975 | ||||||
| Total Deferred Credits | 321,202 | 285,700 | ||||||
| Capitalization (page 67) | ||||||||
| Long-Term Debt, Net of Current Maturities | 445,945 | 498,489 | ||||||
| Cumulative Preferred Shares – Authorized 1,500,000 Shares Without Par Value; Outstanding – None | — | — | ||||||
| Cumulative Preference Shares – Authorized 1,000,000 Shares Without Par Value; Outstanding – None | — | — | ||||||
| Common Shares, Par Value $5 Per Share–Authorized, 50,000,000 Shares; | ||||||||
| Outstanding, 2015—37,857,186 Shares; 2014—37,218,053 Shares | 189,286 | 186,090 | ||||||
| Premium on Common Shares | 293,610 | 278,436 | ||||||
| Retained Earnings | 126,025 | 112,903 | ||||||
| Accumulated Other Comprehensive Loss | (3,898 | ) | (4,663 | ) | ||||
| Total Common Equity | 605,023 | 572,766 | ||||||
| Total Capitalization | 1,050,968 | 1,071,255 | ||||||
| Total Liabilities and Equity | $ | 1,820,904 | $ | 1,740,699 | ||||
See accompanying notes to consolidated financial statements.
| 62 |
See accompanying notes to consolidated financial statements.
| 63 |
See accompanying notes to consolidated financial statements.
| 64 |
| (a) Accumulated Other Comprehensive Loss on December 31 is comprised of the following: | ||||||||||||
| (in thousands) | 2015 | 2014 | 2013 | |||||||||
| Unrealized (Loss) Gain on Marketable Equity Securities: | ||||||||||||
| Before Tax | $ | (12 | ) | $ | 40 | $ | 73 | |||||
| Tax Effect | 4 | (14 | ) | (26 | ) | |||||||
| Unrealized (Loss) Gain on Marketable Equity Securities – net-of-tax | (8 | ) | 26 | 47 | ||||||||
| Unamortized Actuarial Losses and Prior Service Costs Related to Pension and Postretirement Benefits: | ||||||||||||
| Before Tax | (6,484 | ) | (7,815 | ) | (2,959 | ) | ||||||
| Tax Effect | 2,594 | 3,126 | 1,184 | |||||||||
| Unamortized Actuarial Losses and Prior Service Costs Related to Pension and Postretirement Benefits – net-of-tax | (3,890 | ) | (4,689 | ) | (1,775 | ) | ||||||
| Accumulated Other Comprehensive Loss: | ||||||||||||
| Before Tax | (6,496 | ) | (7,775 | ) | (2,886 | ) | ||||||
| Tax Effect | 2,598 | 3,112 | 1,158 | |||||||||
| Net Accumulated Other Comprehensive Loss | $ | (3,898 | ) | $ | (4,663 | ) | $ | (1,728 | ) | |||
See accompanying notes to consolidated financial statements.
| 65 |
See accompanying notes to consolidated financial statements.
| 66 |
See accompanying notes to consolidated financial statements.
| 67 |
Notes to Consolidated Financial Statements
For the years ended December 31, 2015, 2014 and 2013
1. Summary of Significant Accounting Policies
Principles of Consolidation
The consolidated financial statements of Otter Tail Corporation and its wholly owned subsidiaries (the Company) include the accounts of the following segments: Electric, Manufacturing and Plastics. See note 2 to consolidated financial statements for further descriptions of the Company’s business segments. All intercompany balances and transactions have been eliminated in consolidation except profits on sales to the regulated electric utility company from nonregulated affiliates, which is in accordance with the requirements of Financial Accounting Standards Board (FASB) Accounting Standards Codification (ASC) Topic 980, Regulated Operations (ASC 980).
Regulation and ASC 980
The Company’s regulated electric utility company, Otter Tail Power Company (OTP), accounts for the financial effects of regulation in accordance with ASC 980. This standard allows for the recording of a regulatory asset or liability for costs and revenues that will be collected or refunded through the ratemaking process in the future. In accordance with regulatory treatment, OTP defers utility debt redemption premiums and amortizes such costs over the original life of the reacquired bonds. See note 4 to consolidated financial statements for further discussion.
OTP is subject to various state and federal agency regulations. The accounting policies followed by this business are subject to the Uniform System of Accounts of the Federal Energy Regulatory Commission (FERC). These accounting policies differ in some respects from those used by the Company’s nonelectric businesses.
Plant, Retirements and Depreciation
Utility plant is stated at original cost. The cost of additions includes contracted work, direct labor and materials, allocable overheads and allowance for funds used during construction. The amount of interest capitalized on electric utility plant was $723,000 in 2015, $689,000 in 2014 and $1,002,000 in 2013. The cost of depreciable units of property retired less salvage is charged to accumulated depreciation. Removal costs, when incurred, are charged against the accumulated reserve for estimated removal costs, a regulatory liability. Maintenance, repairs and replacement of minor items of property are charged to operating expenses. The provisions for utility depreciation for financial reporting purposes are made on the straight-line method based on the estimated service lives of the properties (5 to 70 years). Such provisions as a percent of the average balance of depreciable electric utility property were 2.61% in 2015, 2.89% in 2014 and 2.96% in 2013. Gains or losses on group asset dispositions are taken to the accumulated provision for depreciation reserve and impact current and future depreciation rates.
Property and equipment of nonelectric operations are carried at historical cost or at the then-current replacement cost if acquired in a business combination, and are depreciated on a straight-line basis over the assets’ estimated useful lives (3 to 40 years). The cost of additions includes contracted work, direct labor and materials, allocable overheads and capitalized interest. No interest was capitalized on nonelectric plant in 2015, 2014 or 2013. Maintenance and repairs are expensed as incurred. Gains or losses on asset dispositions are included in the determination of operating income.
Recoverability of Long-Lived Assets
The Company reviews its long-lived assets whenever events or changes in circumstances indicate the carrying amount of the assets may not be recoverable. The Company determines potential impairment by comparing the carrying amount of the assets with net cash flows expected to be provided by operating activities of the business or related assets. If the sum of the expected future net cash flows is less than the carrying amount of the assets, the Company would recognize an impairment loss. Such an impairment loss would be measured as the amount by which the carrying amount exceeds the fair value of the asset, where fair value is based on the discounted cash flows expected to be generated by the asset.
Jointly Owned Facilities
OTP is a joint owner in two coal-fired steam-powered electric generation plants: Big Stone Plant near Big Stone City, South Dakota and Coyote Station near Beulah, North Dakota. OTP is also a joint owner, with other regional utilities, in three major in-service transmission lines and two additional major transmission lines under construction. The following table provides OTP’s ownership percentages and amounts included in the Company’s December 31, 2015 and 2014 consolidated balance sheets for OTP’s share of jointly owned assets in each of these jointly owned facilities:
| 68 |
| Jointly Owned Facilities (dollars in thousands) | OTP Ownership Percentage | Electric Plant in Service | Construction Work in Progress | Accumulated Depreciation | Net Plant | |||||||||||||||
| December 31, 2015 | ||||||||||||||||||||
| Big Stone Plant | 53.9 | % | $ | 327,474 | $ | (305 | ) | $ | (57,641 | ) | $ | 269,528 | ||||||||
| Coyote Station | 35.0 | % | 165,497 | 7,405 | (103,822 | ) | 69,080 | |||||||||||||
| Fargo-Monticello 345 kV line | 14.2 | % | 78,272 | — | (2,213 | ) | 76,059 | |||||||||||||
| Brookings-Southeast Twin Cities 345 kV line1 | 4.8 | % | 26,189 | — | (486 | ) | 25,703 | |||||||||||||
| Bemidji-Grand Rapids 230 kV line | 14.8 | % | 16,331 | — | (1,233 | ) | 15,098 | |||||||||||||
| Big Stone South to Brookings 345 kV line1 | 50.0 | % | — | 14,210 | — | 14,210 | ||||||||||||||
| Big Stone South to Ellendale 345 kV line1 | 50.0 | % | — | 8,335 | — | 8,335 | ||||||||||||||
| December 31, 2014 | ||||||||||||||||||||
| Big Stone Plant | 53.9 | % | $ | 143,746 | $ | 160,809 | $ | (86,211 | ) | $ | 218,344 | |||||||||
| Coyote Station | 35.0 | % | 163,824 | 1,725 | (99,364 | ) | 66,185 | |||||||||||||
| Fargo-Monticello 345 kV line | 14.2 | % | 36,240 | 38,165 | (737 | ) | 73,668 | |||||||||||||
| Brookings-Southeast Twin Cities 345 kV line1 | 4.8 | % | 16,077 | 8,143 | (132 | ) | 24,088 | |||||||||||||
| Bemidji-Grand Rapids 230 kV line | 14.8 | % | 16,331 | — | (889 | ) | 15,442 | |||||||||||||
| Big Stone South to Brookings 345 kV line1 | 50.0 | % | — | 6,623 | — | 6,623 | ||||||||||||||
| Big Stone South to Ellendale 345 kV line1 | 50.0 | % | — | 6,232 | — | 6,232 | ||||||||||||||
1Midcontinent Independent System Operator, Inc. (MISO) Multi-Value Project (MVP) designation provides for a return on invested funds while under construction under the MISO Open Access Transmission, Energy and Operating Reserve Markets Tariff (MISO Tariff).
The Company’s share of direct revenue and expenses of the jointly owned facilities is included in operating revenue and expenses in the consolidated statements of income.
Coyote Station Lignite Supply Agreement – Variable Interest Entity—In October 2012, the Coyote Station owners, including OTP, entered into a lignite sales agreement (LSA) with Coyote Creek Mining Company, L.L.C. (CCMC), a subsidiary of The North American Coal Corporation, for the purchase of lignite coal to meet the coal supply requirements of Coyote Station for the period beginning in May 2016 and ending in December 2040. The price per ton to be paid by the Coyote Station owners under the LSA will reflect the cost of production, along with an agreed profit and capital charge. CCMC was formed for the purpose of mining coal to meet the coal fuel supply requirements of Coyote Station from May 2016 through December 2040 and, based on the terms of the LSA, is considered a variable interest entity (VIE) due to the transfer of all operating and economic risk to the Coyote Station owners, as the agreement is structured so that the price of the coal would cover all costs of operations as well as future reclamation costs. The Coyote Station owners are also providing a guarantee of the value of the assets of CCMC as they would be required to buy certain assets at book value should they terminate the contract prior to the end of the contract term and are providing a guarantee of the value of the equity of CCMC in that they are required to buy the entity at the end of the contract term at equity value. Under current accounting standards, the primary beneficiary of a VIE is required to include the assets, liabilities, results of operations and cash flows of the VIE in its consolidated financial statements. No single owner of Coyote Station owns a majority interest in Coyote Station and none, individually, has the power to direct the activities that most significantly impact CCMC. Therefore, none of the owners individually, including OTP, is considered a primary beneficiary of the VIE and the Company is not required to include CCMC in its consolidated financial statements.
Under the LSA, all development period costs of the Coyote Creek coal mine incurred during the development period will be recovered from the Coyote Station owners over the full term of the production period, which commences with the initial delivery of coal to Coyote Station (anticipated in May 2016), by being included in the cost of production. The development fee and the capital charge incurred during the development period will be recovered from the Coyote Station owners over the first 52 months of the production period by being included in the cost of production during those months. The LSA was amended on March 16, 2015 to provide, among other things, that during any period between December 31, 2016 and any subsequent date on which CCMC makes initial delivery of coal, the Coyote Station owners will pay the following costs of production as advance payments for lignite: depreciation and amortization charges on capital assets and CCMC’s obligations under its loans and leases. In addition, if the LSA terminates prior to the expiration of its term or the production period terminates prior to December 31, 2040 and the Coyote Station owners purchase all of the outstanding membership interests of CCMC as required by the LSA, the owners will satisfy, or (if permitted by CCMC’s applicable lender) assume, all of CCMC’s obligations owed to CCMC’s lenders under its loans and leases. The Coyote Station owners have limited rights to assign their rights and obligations under the LSA without the consent of CCMC’s lenders during any period in which CCMC’s obligations to its lenders remain outstanding. OTP’s 35% share of development period costs, development fees and capital charges incurred by CCMC through December 31, 2015 is $56.1 million. In the event the contract is terminated because regulations or legislation render the burning of coal cost prohibitive and the assets worthless, OTP’s maximum exposure to loss as a result of its involvement with CCMC as of December 31, 2015 could be as high as $56.1 million.
| 69 |
Income Taxes
Comprehensive interperiod income tax allocation is used for substantially all book and tax temporary differences. Deferred income taxes arise for all temporary differences between the book and tax basis of assets and liabilities. Deferred taxes are recorded using the tax rates scheduled by tax law to be in effect in the periods when the temporary differences reverse. The Company amortizes investment tax credits over the estimated lives of related property. The Company records income taxes in accordance with ASC Topic 740, Income Taxes, and has recognized in its consolidated financial statements the tax effects of all tax positions that are “more-likely-than-not” to be sustained on audit based solely on the technical merits of those positions as of the balance sheet date. The term “more-likely-than-not” means a likelihood of more than 50%. The Company classifies interest and penalties on tax uncertainties as components of the provision for income taxes. See note 14 to consolidated financial statements regarding the Company’s accounting for uncertain tax positions.
The Company also is required to assess the realizability of its deferred tax assets, taking into consideration the Company’s forecast of future taxable income, the reversal of other existing temporary differences, available net operating loss carryforwards and available tax planning strategies that could be implemented to realize the deferred tax assets. Based on this assessment, management must evaluate the need for, and amount of, valuation allowances against the Company’s deferred tax assets. To the extent facts and circumstances change in the future, adjustments to the valuation allowance may be required.
Revenue Recognition
Due to the diverse business operations of the Company, revenue recognition depends on the product produced and sold or service performed. The Company recognizes revenue when the earnings process is complete, evidenced by an agreement with the customer, there has been delivery and acceptance, the price is fixed or determinable and collectability is reasonably assured. In cases where significant obligations remain after delivery, revenue recognition is deferred until such obligations are fulfilled. Provisions for sales returns and warranty costs are recorded at the time of the sale based on historical information and current trends. In the case of derivative instruments, such as OTP’s forward energy contracts, marked-to-market and realized gains and losses are recognized on a net basis in revenue in accordance with ASC Topic 815, Derivatives and Hedging (ASC 815). Gains and losses on forward energy contracts subject to regulatory treatment, if any, have been deferred and recognized on a net basis in revenue in the period realized.
For the Company’s operating companies recognizing revenue on certain products when shipped, those operating companies have no further obligation to provide services related to such product. The shipping terms used in these instances are FOB shipping point.
Customer electricity use is metered and bills are rendered monthly. Revenue is accrued for electricity consumed but not yet billed. Rate schedules applicable to substantially all customers include a fuel clause adjustment, under which the rates are adjusted to reflect changes in average cost of fuels and purchased power, and a surcharge for recovery of conservation-related expenses. Revenue is recognized for fuel and purchased power costs incurred in excess of amounts recovered in base rates but not yet billed through the fuel clause adjustment, for conservation program incentives and bonuses earned but not yet billed and for renewable resource, transmission-related and environmental incurred costs and investment returns approved for recovery through riders.
Revenues on wholesale electricity sales from Company-owned generating units are recognized when energy is delivered. For shared use of transmission facilities with certain regional transmission cooperatives, revenues are estimated. Bills are rendered based on anticipated usage and settlements are made later based on actual usage. Estimated revenues may be adjusted prior to settlement, or at the time of settlement, to reflect actual usage.
Under ASC 815, OTP accounts for forward energy contracts as derivatives subject to mark-to-market accounting unless those contracts meet the definition of a capacity contract or are not subject to unplanned netting, then OTP accounts for the contracts under the normal purchases and sales exception to mark-to-market accounting.
Manufacturing and Plastics operating revenues are recorded when products are shipped.
Warranty Reserves
Certain products previously sold by the Company carried one to fifteen year warranties. Although the Company engaged in extensive product quality programs and processes, the Company’s warranty obligations have been and may in the future be affected by product failure rates, repair or field replacement costs and additional development costs incurred in correcting product failures. The warranty reserve balances as of December 31, 2015 and December 31, 2014 relate entirely to products that were produced by entities the Company no longer owns prior to the Company selling the assets of those companies. The warranty reserve balance is included in liabilities of discontinued operations. See note 16 to consolidated financial statements.
| 70 |
Shipping and Handling Costs
The Company includes revenues received for shipping and handling in operating revenues. Expenses paid for shipping and handling are recorded as part of cost of goods sold.
Use of Estimates
The Company uses estimates based on the best information available in recording transactions and balances resulting from business operations. As better information becomes available (or actual amounts are known), the recorded estimates are revised. Consequently, operating results can be affected by revisions to prior accounting estimates.
Cash Equivalents
The Company considers all highly liquid debt instruments purchased with maturity of 90 days or less to be cash equivalents.
Investments
The following table provides a breakdown of the Company’s investments at December 31:
| (in thousands) | 2015 | 2014 | ||||||
| Cost Method: | ||||||||
| Economic Development Loan Pools | $ | 81 | $ | 174 | ||||
| Other | 2,088 | 129 | ||||||
| Equity Method – Affordable Housing and Other Partnerships | 22 | 265 | ||||||
| Marketable Securities Classified as Available-for-Sale | 8,093 | 8,014 | ||||||
| Total Investments | $ | 10,284 | $ | 8,582 | ||||
| Less: Aevenia, Inc. (AEV, Inc.) Escrow Funds Reported Under Other Current Assets | (1,500 | ) | — | |||||
| Foley Company (Foley) Escrow Funds Reported Under Other Current Assets | (500 | ) | — | |||||
| Investments | $ | 8,284 | $ | 8,582 | ||||
The Company’s marketable securities classified as available-for-sale are held for insurance purposes and are reflected at their fair values on December 31, 2015. See further discussion below.
Fair Value Measurements
The Company follows ASC Topic 820, Fair Value Measurements and Disclosures (ASC 820), for recurring fair value measurements. ASC 820 provides a single definition of fair value, requires enhanced disclosures about assets and liabilities measured at fair value and establishes a hierarchal framework for disclosing the observability of the inputs utilized in measuring assets and liabilities at fair value. The three levels defined by the hierarchy and examples of each level are as follows:
Level 1 – Quoted prices are available in active markets for identical assets or liabilities as of the reported date. The types of assets and liabilities included in Level 1 are highly liquid and actively traded instruments with quoted prices, such as equities listed by the New York Stock Exchange and commodity derivative contracts listed on the New York Mercantile Exchange (NYMEX).
Level 2 – Pricing inputs are other than quoted prices in active markets, but are either directly or indirectly observable as of the reported date. The types of assets and liabilities included in Level 2 are typically either comparable to actively traded securities or contracts, such as treasury securities with pricing interpolated from recent trades of similar securities, or priced with models using highly observable inputs, such as commodity options priced using observable forward prices and volatilities.
Level 3 – Significant inputs to pricing have little or no observability as of the reporting date. The types of assets and liabilities included in Level 3 are those with inputs requiring significant management judgment or estimation and may include complex and subjective models and forecasts.
| 71 |
The following tables present, for each of the hierarchy levels, the Company’s assets and liabilities that are measured at fair value on a recurring basis as of December 31, 2015 and December 31, 2014:
| December 31, 2015 (in thousands) | Level 1 | Level 2 | Level 3 | |||||||||
| Assets: | ||||||||||||
| Current Assets – Other: | ||||||||||||
| Money Market Escrow Accounts – AEV, Inc. and Foley Company Sales | $ | 2,000 | ||||||||||
| Investments: | ||||||||||||
| Government Corporations and Government-Sponsored Enterprises’ Debt Securities – Held by Captive Insurance Company | $ | 4,235 | ||||||||||
| Corporate Debt Securities – Held by Captive Insurance Company | 3,858 | |||||||||||
| Other Assets: | ||||||||||||
| Money Market and Mutual Funds – Nonqualified Retirement Savings Plan | 196 | |||||||||||
| Total Assets | $ | 2,196 | $ | 8,093 | ||||||||
| Liabilities: | ||||||||||||
| Derivative Liabilities – Forward Gasoline Purchase Contracts | $ | 199 | ||||||||||
| Total Liabilities | $ | 199 | ||||||||||
| December 31, 2014 (in thousands) | Level 1 | Level 2 | Level 3 | |||||||||
| Assets: | ||||||||||||
| Current Assets – Other: | ||||||||||||
| Forward Energy Contracts | $ | 257 | ||||||||||
| Money Market and Mutual Funds – Nonqualified Retirement Savings Plan | $ | 120 | ||||||||||
| Investments: | ||||||||||||
| Corporate and Other Debt Securities – Held by Captive Insurance Company | $ | 6,761 | ||||||||||
| U.S. Government-Sponsored Enterprises’ Debt Securities – Held by Captive Insurance Company | 1,253 | |||||||||||
| Other Assets: | ||||||||||||
| Money Market and Mutual Funds – Nonqualified Retirement Savings Plan | 593 | |||||||||||
| Total Assets | $ | 713 | $ | 8,014 | $ | 257 | ||||||
| Liabilities: | ||||||||||||
| Derivative Liabilities – Forward Gasoline Purchase Contracts | $ | 342 | ||||||||||
| Derivative Liabilities – Forward Energy Contracts | $ | 13,888 | ||||||||||
| Total Liabilities | $ | 342 | $ | 13,888 | ||||||||
The valuation techniques and inputs used for the Level 2 fair value measurements in the table above are as follows:
Forward Gasoline Purchase Contracts – These contracts are priced based on NYMEX quoted prices for Reformulated Blendstock for Oxygenate Blending (RBOB) Gasoline contracts. Prices used for the fair valuation of these contracts are based on NYMEX daily reporting date quoted prices for RBOB contracts with the same settlement periods.
Corporate and Government-Sponsored Enterprises’ Debt Securities Held by the Company’s Captive Insurance Company – Fair values are determined on the basis of valuations provided by a third-party pricing service which utilizes industry accepted valuation models and observable market inputs to determine valuation. Some valuations or model inputs used by the pricing service may be based on broker quotes.
Fair values for OTP’s forward energy contracts with delivery points that are not at an active trading hub included in Level 3 of the fair value hierarchy in the table above as of December 31, 2014, were based on prices indexed to observable prices at an active trading hub. Prices at illiquid trading points are based on a basis spread between that trading point and more liquid trading hub prices. These basis spreads were based on historical spreads. The December 31, 2014 Level 3 forward electric basis spreads ranged from $2.50 to $7.97 per megawatt-hour under the active trading hub price. The weighted average price was $34.95 per megawatt-hour.
In the table above, the fair value of the Level 3 forward energy contracts in derivative asset and derivative liability positions as of December 31, 2014 were related to power purchase contracts where OTP intends to take or has taken physical delivery of the energy under the contract. When OTP takes physical delivery of the energy purchased under these contracts the costs incurred are subject to recovery in base rates and through fuel clause adjustments. Any derivative assets or liabilities and related gains or losses recorded as a result of the fair valuation of these power purchase contracts were not and will not be realized and are 100% offset by regulatory liabilities and assets related to fuel clause adjustment treatment of purchased power costs. Therefore, the net impact of any recorded fair valuation gains or losses related to these contracts on the
| 72 |
Company’s consolidated net income is $0. When energy was or is delivered under these contracts, they were or will be settled at the original contract price and any fair valuation gains or losses and related derivative assets or liabilities recorded over the life of the contracts were or will be reversed along with any offsetting regulatory liabilities or assets. Because of regulatory accounting treatment, any price volatility related to the fair valuation of these contracts had no impact on the Company’s reported consolidated net income for the years ended December 31, 2015 and 2014.
The following table presents changes in Level 3 forward energy contract derivative asset and liability fair valuations for:
| (in thousands) | 2015 | 2014 | ||||||
| Forward Energy Contracts – Fair Values Beginning of Period | $ | (13,631 | ) | $ | (11,341 | ) | ||
| Less: Amounts Reversed on Settlement of Contracts Entered into in Prior Periods | 4,492 | 2,785 | ||||||
| Changes in Fair Value of Contracts Entered into in Prior Periods | (6,470 | ) | 166 | |||||
| Cumulative Fair Value Adjustments of Contracts Entered into in Prior Years at End of Period | (15,609 | ) | (8,390 | ) | ||||
| Net Decrease in Value of Open Contracts Entered into in Current Period | — | (5,241 | ) | |||||
| Reclassification of Derivative Liability Fair Values for Contracts Designated as Normal Purchases effective October 1, 2015 | 15,609 | |||||||
| Forward Energy Contracts – Net Derivative Liability Fair Values End of Period | $ | — | $ | (13,631 | ) | |||
Inventories
The Electric segment inventories are reported at average cost. All other segments’ inventories are stated at the lower of cost (first-in, first-out) or market. Inventories consist of the following at December 31:
| (in thousands) | 2015 | 2014 | ||||||
| Finished Goods | $ | 25,971 | $ | 27,998 | ||||
| Work in Process | 12,821 | 10,628 | ||||||
| Raw Material, Fuel and Supplies | 46,624 | 46,577 | ||||||
| Total Inventories | $ | 85,416 | $ | 85,203 | ||||
Goodwill and Other Intangible Assets
The Company accounts for goodwill and other intangible assets in accordance with the requirements of ASC Topic 350, Intangibles—Goodwill and Other, measuring its goodwill and indefinite-lived intangible assets for impairment annually in the fourth quarter, and more often when events indicate the assets may be impaired. The Company does qualitative assessments of its reporting units with recorded goodwill to determine if it is more likely than not that the fair value of the reporting unit exceeds its book value. The Company also does quantitative assessments of its reporting units with recorded goodwill to determine the fair value of the reporting unit.
In the fourth quarter of 2014 the Company entered into negotiations to sell Foley and, as a result of an impairment indicator, the Company recorded a $5.6 million goodwill impairment charge. This impairment charge was based on the indicated offering price in a signed letter of intent for the purchase of Foley. In the first quarter of 2015, Foley recorded an additional $1.0 million goodwill impairment charge based on adjustments to the carrying value of Foley. The fourth quarter 2014 and first quarter 2015 goodwill impairment losses are reflected in the results of discontinued operations. See note 16 to consolidated financial statements.
On September 1, 2015 Miller Welding & Iron Works, Inc. (BTD-Illinois), a wholly owned subsidiary of BTD Manufacturing, Inc. (BTD), acquired the assets of Impulse Manufacturing, Inc. (Impulse) of Dawsonville, Georgia. The newly acquired business will operate under the name BTD-Georgia. Based on the preliminary purchase price allocation, the difference in the fair value of assets acquired and the price paid for Impulse resulted in acquired goodwill of $8,244,000.
An assessment of the carrying amounts of the remaining goodwill of the Company’s reporting units reported under continuing operations as of December 31, 2015 indicated the fair values are substantially in excess of their respective book values and not impaired.
| 73 |
The following tables summarize changes to goodwill by business segment during 2015 and 2014:
| (in thousands) | Gross Balance December 31, 2014 | Accumulated Impairments | Balance (net of impairments) December 31, 2014 | Adjustments and Additions to Goodwill in 2015 | Balance (net of impairments) December 31, 2015 | |||||||||||||||
| Manufacturing | $ | 12,186 | $ | — | $ | 12,186 | $ | 8,244 | $ | 20,430 | ||||||||||
| Plastics | 19,302 | — | 19,302 | — | 19,302 | |||||||||||||||
| Total | $ | 31,488 | $ | — | $ | 31,488 | $ | 8,244 | $ | 39,732 | ||||||||||
| (in thousands) | Gross Balance December 31, 2013 | Accumulated Impairments | Balance (net of impairments) December 31, 2013 | Adjustments to Goodwill in 2014 | Balance (net of impairments) December 31, 2014 | |||||||||||||||
| Manufacturing | $ | 12,186 | $ | — | $ | 12,186 | $ | — | $ | 12,186 | ||||||||||
| Plastics | 19,302 | — | 19,302 | — | 19,302 | |||||||||||||||
| Total | $ | 31,488 | $ | — | $ | 31,488 | $ | — | $ | 31,488 | ||||||||||
Intangible assets with finite lives are amortized over their estimated useful lives and reviewed for impairment in accordance with requirements under ASC Topic 360-10-35, Property, Plant, and Equipment—Overall—Subsequent Measurement. In the first quarter of 2015, OTP began purchasing emission allowances to apply against sulfur dioxide emissions from its Hoot Lake Plant. The cost of unused emission allowances is included in intangible assets on the Company’s December 31, 2015 balance sheet. With the purchase of Impulse on September 1, 2015, the Company acquired customer relationships valued at $4,870,000 to be amortized over 20 years and the seller entered into a covenant not to compete valued at $620,000 to be amortized over three years.
The following table summarizes the components of the Company’s intangible assets at December 31, 2015 and December 31, 2014:
| 2015 (in thousands) | Gross Carrying Amount | Accumulated Amortization | Net Carrying Amount | Remaining Amortization Periods | ||||||||||
| Amortizable Intangible Assets: | ||||||||||||||
| Customer Relationships | $ | 21,681 | $ | 6,714 | $ | 14,967 | 48-236 months | |||||||
| Covenant not to Compete | 620 | 69 | 551 | 32 months | ||||||||||
| Other Intangible Assets | 639 | 543 | 96 | 9 months | ||||||||||
| Emission Allowances | 59 | NA | 59 | Expensed as used | ||||||||||
| Total | $ | 22,999 | $ | 7,326 | $ | 15,673 | ||||||||
| 2014 (in thousands) | ||||||||||||||
| Amortizable Intangible Assets: | ||||||||||||||
| Customer Relationships | $ | 16,811 | $ | 5,784 | $ | 11,027 | 60-160 months | |||||||
| Other Intangible Assets | 639 | 415 | 224 | 21 months | ||||||||||
| Total | $ | 17,450 | $ | 6,199 | $ | 11,251 | ||||||||
The amortization expense for these intangible assets was:
| (in thousands) | 2015 | 2014 | 2013 | |||||||||
| Amortization Expense – Intangible Assets | $ | 1,127 | $ | 977 | $ | 977 | ||||||
The estimated annual amortization expense for these intangible assets for the next five years is:
| (in thousands) | 2016 | 2017 | 2018 | 2019 | 2020 | |||||||||||||||
| Estimated Amortization Expense – Intangible Assets | $ | 1,395 | $ | 1,299 | $ | 1,230 | $ | 1,093 | $ | 1,059 | ||||||||||
| 74 |
The following table presents a reconciliation of OTP’s emission allowances balance for the year ended December 31, 2015:
| (in thousands) | 2015 | |||
| Emission Allowances Beginning Balance | $ | — | ||
| Allowances Purchased | 168 | |||
| Allowances Used | (109 | ) | ||
| Emission Allowances Ending Balance | $ | 59 | ||
Supplemental Disclosures of Cash Flow Information
| As of December 31, | ||||||||
| (in thousands) | 2015 | 2014 | ||||||
| Noncash Investing Activities: | ||||||||
| Transactions Related to Capital Additions not Settled in Cash | $ | 20,371 | $ | 19,932 | ||||
| (in thousands) | 2015 | 2014 | 2013 | |||||||||
| Cash Paid (Received) During the Year for: | ||||||||||||
| Interest (net of amount capitalized) | $ | 30,512 | $ | 26,364 | $ | 26,789 | ||||||
| Income Taxes | $ | 7,322 | $ | 145 | $ | (453 | ) | |||||
New Accounting Standards
ASU 2014-09—In May 2014, the FASB issued ASU No. 2014-09, Revenue from Contracts with Customers (Topic 606) (ASC 606). ASC 606 is a comprehensive, principles-based accounting standard which amends current revenue recognition guidance with the objective of improving revenue recognition requirements by providing a single comprehensive model to determine the measurement of revenue and the timing of revenue recognition. ASC 606 also requires expanded disclosures to enable users of financial statements to understand the nature, amount, timing and uncertainty of revenue and cash flows arising from contracts with customers.
Amendments to the ASC in ASU 2014-09, as amended, are effective for fiscal years beginning after December 15, 2017. Early adoption is permitted, but not any earlier than January 1, 2017. Application methods permitted are: (1) full retrospective, (2) retrospective using one or more practical expedients and (3) retrospective with the cumulative effect of initial application recognized at the date of initial application. The Company is currently reviewing ASU 2014-09, identifying key impacts to its businesses, reviewing revenue streams and contracts to determine areas where the amendments in ASU 2014-09 will be applicable and evaluating transition options. The Company does not plan to adopt the updated guidance prior to January 1, 2018.
ASU 2015-03—In April 2015, the FASB issued ASU No. 2015-03, Interest—Imputation of Interest (Subtopic 835-30): Simplifying the Presentation of Debt Issuance Costs (ASU 2015-03), which requires debt issuance costs related to a recognized debt liability to be presented in the balance sheet as a direct deduction from the carrying amount of that debt liability, consistent with debt discounts. ASU 2015-03 will become effective for interim and annual reporting periods beginning after December 15, 2015 with early adoption permitted. The Company will apply the updated standards in ASU 2015-03 to its consolidated financial statements beginning in the first quarter of 2016. As of December 31, 2015, the balance of the Company’s consolidated unamortized debt issuance costs related to its outstanding long-term debt was approximately $2.2 million.
ASU 2015-07—In May 2015, the FASB issued ASU No. 2015-07, Fair Value Measurement (Topic 820): Disclosures for Investments in Certain Entities That Calculate Net Asset Value per Share (or Its Equivalent), which eliminates the requirement to categorize within the fair value hierarchy all investments for which fair value is measured using the net asset value per share (NAV) practical expedient. The new standard is effective for reporting periods beginning after December 31, 2015, with early adoption permitted. Once adopted, the update is required to be applied on a retrospective basis for all periods presented. The Company adopted the updates in ASU 2015-07 in December 2015. The adoption of the updates in ASU 2015-07 did not have a material impact on the Company’s consolidated financial statements other than the disclosure and presentation of certain investments of the Company’s pension plan that are measured using the NAV practical expedient.
ASU 2015-11—In July 2015, the FASB issued ASU No. 2015-11, Inventory (Topic 330): Simplifying the Measurement of Inventory, which requires that inventories be measured at the lower of cost or net realizable value instead of the lower of cost or market value. Net realizable value is defined as the estimated selling price in the ordinary course of business, less reasonably predictable costs of completion, disposal, and transportation. The standards update is effective prospectively for fiscal years and interim periods beginning after December 15, 2016, with early adoption permitted. The Company does not expect the adoption of the updated standard to have a material impact on its consolidated financial statements.
| 75 |
ASU 2015-16—In September 2015, the FASB issued ASU No. 2015-16, Business Combinations (Topic 805): Simplifying the Accounting for Measurement-Period Adjustments (ASU 2015-16), which requires that an acquirer recognize adjustments to provisional amounts that are identified during the measurement period in the reporting period in which the adjustment amounts are determined. The amendments in ASU 2015-16 require that the acquirer record, in the same period’s financial statements, the effect on earnings of changes in depreciation, amortization, or other income effects, if any, as a result of the change to the provisional amounts, calculated as if the accounting had been completed at the acquisition date. The amendments in ASU 2015-16 are effective for fiscal years beginning after December 15, 2015, including interim periods within those fiscal years and should be applied prospectively to adjustments to provisional amounts that occur after the effective date, with earlier application permitted for financial statements that have not been issued. The Company elected to adopt the updated standard in the fourth quarter of 2015 in order that it may apply the updates to its recent acquisition of BTD-Georgia, which is still subject to purchase price adjustments related to final settlement. The Company does not expect the adoption of the updated standard to have a material impact on its consolidated financial statements. For 2015, there is no impact. The early adoption of the standard will alleviate the need for prior period adjustments of income, should any potential purchase price adjustments have such an effect. The Company currently expects purchase price adjustments subsequent to December 31, 2015, if any, will result in adjustments to acquired goodwill and not result in adjustments to the Company’s 2015 reported consolidated net income.
ASU 2015-17—In November 2015, the FASB issued ASU No. 2015-17, Income Taxes (Topic 740): Balance Sheet Classification of Deferred Taxes (ASU 2015-17), which simplifies the presentation of deferred income taxes by eliminating the classification of current deferred income tax liabilities and assets and requiring only that deferred tax liabilities and assets be classified as noncurrent in a classified statement of financial position. The amendments in ASU 2015-17 are effective for financial statements issued for annual periods beginning after December 15, 2016 and interim periods within those annual periods, and may be applied either prospectively to all deferred tax liabilities and assets or retrospectively to all periods presented, with early adoption permitted. The Company elected to adopt the updated standard in the fourth quarter of 2015 and has applied the amendments in the update retrospectively to its consolidated financial statements. The effect of applying the guidance in ASU 2015-17 retrospectively to the Company’s December 31, 2014 consolidated balance sheet is shown in the following table:
| (in thousands) | Previously Stated | Adjustments | Restated | |||||||||
| Current Assets | ||||||||||||
| Deferred Income Taxes | $ | 49,482 | $ | (49,482 | ) | $ | — | |||||
| Assets of Discontinued Operations | 48,657 | (1,098 | ) | 47,559 | ||||||||
| Total Current Assets | 307,149 | (50,580 | ) | 256,569 | ||||||||
| Total Assets | 1,791,279 | (50,580 | ) | 1,740,699 | ||||||||
| Current Liabilities | ||||||||||||
| Liabilities of Discontinued Operations | 27,559 | (1,098 | ) | 26,461 | ||||||||
| Total Current Liabilities | 201,699 | (1,098 | ) | 200,601 | ||||||||
| Deferred Credits | ||||||||||||
| Deferred Income Taxes | 230,810 | (49,482 | ) | 181,328 | ||||||||
| Total Deferred Credits | 335,182 | (49,482 | ) | 285,700 | ||||||||
| Total Liabilities and Equity | 1,791,279 | (50,580 | ) | 1,740,699 | ||||||||
2. Business Combinations, Dispositions and Segment Information
Business Combinations
On September 1, 2015 BTD-Illinois, a wholly owned subsidiary of BTD, acquired the assets of Impulse of Dawsonville, Georgia for $30.8 million in cash, subject to a post-closing adjustment. Impulse is a full-service metal fabricator located 30 miles north of Atlanta, Georgia. The newly acquired business offers a wide range of metal fabrication services ranging from simple laser cutting services and high volume stamping to complex weldments and assemblies for metal fabrication buyers and original equipment manufacturers and will operate under the name BTD-Georgia. In addition to serving some of BTD’s existing customers from a location closer to the customers’ manufacturing facilities, this acquisition will provide opportunities for growth in new and existing markets for BTD, and complementing production capabilities will expand the capacity of services offered by BTD. Pro forma results of operations have not been presented for this acquisition because the effect of the acquisition was not material to the Company.
| 76 |
Below is condensed balance sheet information, at the date of the business combination, disclosing the preliminary allocation of the purchase price assigned to each major asset and liability category of BTD-Georgia:
| (in thousands) | ||||
| Assets: | ||||
| Current Assets | $ | 4,906 | ||
| Goodwill | 8,244 | |||
| Other Intangible Assets | 5,490 | |||
| Other Amortizable Assets | 1,380 | |||
| Fixed Assets | 13,649 | |||
| Total Assets | $ | 33,669 | ||
| Liabilities: | ||||
| Current Liabilities | $ | 2,852 | ||
| Lease Obligation | 11 | |||
| Total Liabilities | $ | 2,863 | ||
| Cash Paid | $ | 30,806 | ||
The final purchase price and assignment of asset values is subject to adjustment based on settlement of open items. In 2015, BTD-Georgia recorded revenue of $8.8 million and a net loss of $0.8 million.
The Company acquired no new businesses in 2014 or 2013.
In execution of the Company’s announced strategy of realigning its business portfolio to reduce its risk profile and dedicate a greater portion of its resources toward electric utility operations, the Company sold several of its holdings in recent years. On December 31, 2014 the company was in the process of negotiating the sales of Foley, its mechanical and prime contractor on industrial projects, and AEV, Inc., its electrical design and construction services company, which resulted in the removal of its Construction segment from continuing operations. The sale of Foley closed on April 30, 2015 and the sale of the assets of AEV, Inc. closed on February 28, 2015. The sale of substantially all of the Company’s dock and boatlift company’s assets closed on February 8, 2013.
The results of operations of these disposed businesses are reported as discontinued operations in the Company’s consolidated financial statements as of and for the years ended December 31, 2015, 2014 and 2013, and are summarized in note 16 to consolidated financial statements.
Segment Information
The accounting policies of the segments are described under note 1 – Summary of Significant Accounting Policies. The Company’s business structure currently includes the following three segments: Electric, Manufacturing and Plastics. The chart below indicates the companies included in each segment.
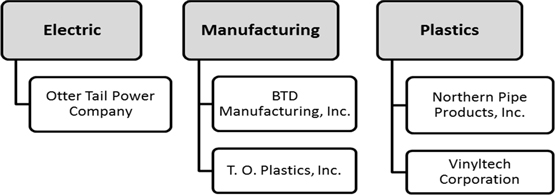
Electric includes the production, transmission, distribution and sale of electric energy in Minnesota, North Dakota and South Dakota by OTP. In addition, OTP is a participant in the Midcontinent Independent System Operator, Inc. (MISO) markets. OTP’s operations have been the Company’s primary business since 1907.
Manufacturing consists of businesses in the following manufacturing activities: contract machining, metal parts stamping, fabrication and painting, and production of material and handling trays and horticultural containers. These businesses have manufacturing facilities in Georgia, Illinois and Minnesota and sell products primarily in the United States.
| 77 |
Plastics consists of businesses producing polyvinyl chloride (PVC) pipe at plants in North Dakota and Arizona. The PVC pipe is sold primarily in the upper Midwest and Southwest regions of the United States.
OTP is a wholly owned subsidiary of the Company. All of the Company’s other businesses are owned by its wholly owned subsidiary, Varistar Corporation (Varistar). The Company’s corporate operating costs include items such as corporate staff and overhead costs, the results of the Company’s captive insurance company and other items excluded from the measurement of operating segment performance. Corporate assets consist primarily of cash, prepaid expenses, investments and fixed assets. Corporate is not an operating segment. Rather, it is added to operating segment totals to reconcile to totals on the Company’s consolidated financial statements.
No single customer accounted for over 10% of the Company’s consolidated revenues in 2015, 2014 or 2013. All of the Company’s long-lived assets are within the United States.
| Percent of Sales Revenue by Country for the Year Ended December 31: | 2015 | 2014 | 2013 | |||||||||
| United States of America | 97.1 | % | 95.9 | % | 97.2 | % | ||||||
| Mexico | 1.2 | % | 3.0 | % | 1.7 | % | ||||||
| Canada | 1.0 | % | 0.9 | % | 1.0 | % | ||||||
| Panama | 0.6 | % | 0.0 | % | 0.0 | % | ||||||
| All Other Countries (none greater than 0.04%) | 0.1 | % | 0.2 | % | 0.1 | % | ||||||
The Company evaluates the performance of its business segments and allocates resources to them based on earnings contribution and return on total invested capital. Information on continuing operations for the business segments for 2015, 2014 and 2013 is presented in the following table:
| (in thousands) | 2015 | 2014 | 2013 | |||||||||
| Operating Revenue | ||||||||||||
| Electric | $ | 407,131 | $ | 407,743 | $ | 373,540 | ||||||
| Manufacturing | 215,011 | 219,583 | 204,997 | |||||||||
| Plastics | 157,758 | 172,050 | 164,957 | |||||||||
| Intersegment Eliminations | (96 | ) | (114 | ) | (80 | ) | ||||||
| Total | $ | 779,804 | $ | 799,262 | $ | 743,414 | ||||||
| Cost of Products Sold | ||||||||||||
| Manufacturing | $ | 171,956 | $ | 169,033 | $ | 154,235 | ||||||
| Plastics | 123,085 | 139,081 | 129,042 | |||||||||
| Intersegment Eliminations | (9 | ) | (45 | ) | (10 | ) | ||||||
| Total | $ | 295,032 | $ | 308,069 | $ | 283,267 | ||||||
| Other Nonelectric Expenses | ||||||||||||
| Manufacturing | $ | 21,115 | $ | 23,340 | $ | 18,820 | ||||||
| Plastics | 9,850 | 9,292 | 8,571 | |||||||||
| Corporate | 9,143 | 13,418 | 12,753 | |||||||||
| Intersegment Eliminations | (87 | ) | (69 | ) | (70 | ) | ||||||
| Total | $ | 40,021 | $ | 45,981 | $ | 40,074 | ||||||
| Depreciation and Amortization | ||||||||||||
| Electric | $ | 44,786 | $ | 44,076 | $ | 43,125 | ||||||
| Manufacturing | 11,853 | 10,518 | 11,194 | |||||||||
| Plastics | 3,552 | 3,364 | 3,350 | |||||||||
| Corporate | 172 | 116 | 207 | |||||||||
| Total | $ | 60,363 | $ | 58,074 | $ | 57,876 | ||||||
| Operating Income (Loss) | ||||||||||||
| Electric | $ | 87,171 | $ | 76,060 | $ | 62,455 | ||||||
| Manufacturing | 10,086 | 16,692 | 20,748 | |||||||||
| Plastics | 21,272 | 20,313 | 23,994 | |||||||||
| Corporate | (9,315 | ) | (13,534 | ) | (12,960 | ) | ||||||
| Total | $ | 109,214 | $ | 99,531 | $ | 94,237 | ||||||
| 78 |
| (in thousands) | 2015 | 2014 | 2013 | |||||||||
| Interest Charges | ||||||||||||
| Electric | $ | 24,371 | $ | 23,322 | $ | 17,461 | ||||||
| Manufacturing | 3,560 | 3,243 | 3,255 | |||||||||
| Plastics | 1,026 | 1,043 | 1,001 | |||||||||
| Corporate and Intersegment Eliminations | 2,203 | 2,040 | 5,257 | |||||||||
| Total | $ | 31,160 | $ | 29,648 | $ | 26,974 | ||||||
| Income Tax Expense (Benefit) – Continuing Operations | ||||||||||||
| Electric | $ | 16,067 | $ | 11,029 | $ | 9,278 | ||||||
| Manufacturing | 2,299 | 4,117 | 6,047 | |||||||||
| Plastics | 8,187 | 7,301 | 9,249 | |||||||||
| Corporate | (4,911 | ) | (5,890 | ) | (12,058 | ) | ||||||
| Total | $ | 21,642 | $ | 16,557 | $ | 12,516 | ||||||
| Earnings Available for Common Shares | ||||||||||||
| Electric | $ | 48,370 | $ | 43,684 | $ | 38,236 | ||||||
| Manufacturing | 4,247 | 9,361 | 11,457 | |||||||||
| Plastics | 12,108 | 12,085 | 13,809 | |||||||||
| Corporate | (6,136 | ) | (8,247 | ) | (15,420 | ) | ||||||
| Discontinued Operations | 756 | 840 | 2,270 | |||||||||
| Total | $ | 59,345 | $ | 57,723 | $ | 50,352 | ||||||
| Capital Expenditures | ||||||||||||
| Electric | $ | 135,572 | $ | 148,719 | $ | 149,467 | ||||||
| Manufacturing | 20,295 | 11,252 | 7,046 | |||||||||
| Plastics | 4,206 | 3,567 | 3,273 | |||||||||
| Corporate | 11 | 44 | 47 | |||||||||
| Total | $ | 160,084 | $ | 163,582 | $ | 159,833 | ||||||
| Identifiable Assets | ||||||||||||
| Electric | $ | 1,522,986 | $ | 1,441,125 | $ | 1,269,125 | ||||||
| Manufacturing | 173,860 | 128,608 | 119,276 | |||||||||
| Plastics | 81,624 | 86,650 | 77,947 | |||||||||
| Corporate | 42,434 | 36,757 | 44,868 | |||||||||
| Assets of Discontinued Operations | — | 47,559 | 49,351 | |||||||||
| Total | $ | 1,820,904 | $ | 1,740,699 | $ | 1,560,567 | ||||||
3. Rate and Regulatory Matters
Below are descriptions of OTP’s major capital expenditure projects and use of reagents and emission allowances that have had, or will have, a significant impact on OTP’s revenue requirements, rates and alternative revenue recovery mechanisms, followed by summaries of specific electric rate or rider proceedings with the Minnesota Public Utilities Commission (MPUC), the North Dakota Public Service Commission (NDPSC), the South Dakota Public Utilities Commission (SDPUC) and the FERC, impacting OTP’s revenues in 2015, 2014 and 2013.
Major Capital Expenditure Projects
Big Stone Plant Air Quality Control System (AQCS)—The South Dakota Department of Environmental and Natural Resources determined the Big Stone Plant is subject to Best-Available Retrofit Technology (BART) requirements of the Clean Air Act, based on air dispersion modeling indicating that Big Stone Plant’s emissions reasonably contribute to visibility impairment in national parks and wilderness areas in Minnesota, North Dakota, South Dakota and Michigan. OTP completed construction and testing of the BART-compliant AQCS at Big Stone Plant in the fourth quarter of 2015 and placed the AQCS into commercial operation on December 29, 2015. The capitalized cost of the project as of December 31, 2015 was approximately $367 million (OTP’s 53.9% share was approximately $198 million).
| 79 |
Fargo–Monticello 345 kiloVolt (kV) Capacity Expansion 2020 (CapX2020) Project (the Fargo Project)—OTP has invested approximately $81.5 million and has a 14.2% ownership interest in the jointly-owned assets of this 240-mile transmission line, and owns 100% of certain assets of the project. The final phase of this project was energized on April 2, 2015.
Brookings–Southeast Twin Cities 345 kV CapX2020 Project (the Brookings Project)—OTP has invested approximately $26.2 million and has a 4.8% ownership interest in this 250-mile transmission line. The MISO granted unconditional approval of the Brookings Project as a Multi-Value Project (MVP) under the MISO Open Access Transmission, Energy and Operating Reserve Markets Tariff (MISO Tariff) in December 2011. MVPs are designed to enable the region to comply with energy policy mandates and to address reliability and economic issues affecting multiple areas within the MISO region. The cost allocation is designed to ensure the costs of transmission projects with regional benefits are properly assigned to those who benefit. The final segments of this line were energized on March 26, 2015.
The Big Stone South – Brookings MVP and CapX2020 Project—This 345 kV transmission line, currently under construction, will extend approximately 70 miles between a proposed substation near Big Stone City, South Dakota and the Brookings County Substation near Brookings, South Dakota. OTP and Northern States Power – MN (NSP MN), a subsidiary of Xcel Energy Inc., jointly developed this project. MISO approved this project as an MVP under the MISO Tariff in December 2011. A Notice of Intent to Construct Facilities (NICF) was filed with the SDPUC on February 29, 2012. The SDPUC approved the certification for the northern portion of the route on April 9, 2013 and granted approval of a route permit for the southern portion of the line on February 18, 2014. On August 1, 2014 OTP and NSP MN entered into agreements to construct the project. This line is expected to be in service in fall 2017. Construction began on this line in the third quarter of 2015.
The Big Stone South – Ellendale MVP—This is a proposed 345 kV transmission line that will extend 160 to 170 miles between a proposed substation near Big Stone City, South Dakota and a proposed substation near Ellendale, North Dakota. OTP is jointly developing this project with Montana-Dakota Utilities Co., a division of MDU Resources Group, Inc. (MDU). MISO approved this project as an MVP under the MISO Tariff in December 2011. OTP and MDU jointly filed an NICF with the SDPUC in March of 2012. On August 25, 2013 the NDPSC granted Certificates of Public Convenience and Necessity to OTP and MDU for ten miles of the proposed line to be built in North Dakota. On July 10, 2014 the NDPSC approved a Certificate of Corridor Compatibility and a route permit for the North Dakota section of the proposed line. On August 22, 2014 the SDPUC issued an order approving the route permit for the South Dakota section of the proposed line. A route permit amendment to shift a portion of the route in North Dakota was approved by the NDPSC on December 16, 2015. On June 12, 2015 OTP and MDU entered into agreements to construct the project. This project is expected to be completed in 2019.
Recovery of OTP’s major transmission investments is through the MISO Tariff (several as MVPs) and, currently, Minnesota, North Dakota and South Dakota Transmission Cost Recovery (TCR) Riders.
Big Stone II Project
On June 30, 2005 OTP and a coalition of six other electric providers entered into several agreements for the development of a second electric generating unit, named Big Stone II, at the site of the existing Big Stone Plant near Milbank, South Dakota. On September 11, 2009 OTP announced its withdrawal—both as a participating utility and as the project’s lead developer—from Big Stone II. On November 2, 2009, the remaining Big Stone II participants announced the cancellation of the Big Stone II project. Recovery in Minnesota, North Dakota and South Dakota of amounts OTP had invested in the Big Stone II project at the time of its withdrawal is discussed below under the respective jurisdictional sections of this report.
Reagent Costs
OTP’s systemwide costs for reagents are expected to increase to approximately $2.2 million annually through May 2021 when Hoot Lake Plant is expected to be retired. The Minnesota, North Dakota and South Dakota share of costs are approximately 50%, 40% and 10%, respectively. Reagent costs were incurred in 2015 when the Big Stone Plant AQCS and Coyote Station and Hoot Lake Plant Mercury and Air Toxics Standards (MATS) projects went into service.
Minnesota
2010 General Rate Case—OTP’s most recent general rate increase in Minnesota of approximately $5.0 million, or 1.6%, was granted by the MPUC in an order issued on April 25, 2011 and effective October 1, 2011. Pursuant to the order, OTP’s allowed rate of return on rate base was set at 8.61%, and its allowed rate of return on equity was set at 10.74%.
| 80 |
2016 General Rate Case
On February 16, 2016 OTP filed a request with the MPUC for an increase in revenue recoverable under general rates in Minnesota. In its filing, OTP requested an increase in annual revenue of approximately $19.3 million, or 9.8%, based on an allowed rate of return on rate base of 8.07% and an allowed rate of return on equity of 10.4%, based on an equity ratio of 52.5% of total capital. Through this rate case proceeding, OTP is proposing to recover, in base rates, revenue currently subject to recovery under Minnesota TCR and Environmental Cost Recovery (ECR) riders.
Renewable Energy Standards, Conservation, Renewable Resource Riders— Minnesota has a renewable energy standard which requires OTP to generate or procure sufficient renewable generation such that the following percentages of total retail electric sales to Minnesota customers come from qualifying renewable sources: 17% by 2016; 20% by 2020 and 25% by 2025. In addition, Minnesota law requires 1.5% of total Minnesota electric sales by public utilities to be supplied by solar energy by 2020. Under certain circumstances and after consideration of costs and reliability issues, the MPUC may modify or delay implementation of the standards. OTP has acquired sufficient renewable resources to currently comply with Minnesota renewable energy standards. OTP is evaluating potential options for maintaining compliance and meeting the solar energy standard. OTP’s compliance with the Minnesota renewable energy standard will be measured through the Midwest Renewable Energy Tracking System.
The MPUC is authorized to approve a rate schedule rider to enable utilities to recover the costs of qualifying renewable energy projects that supply renewable energy to Minnesota customers. Cost recovery for qualifying renewable energy projects can be authorized outside of a rate case proceeding, provided that such renewable projects have received previous MPUC approval. Renewable resource costs eligible for recovery may include return on investment, depreciation, operation and maintenance costs, taxes, renewable energy delivery costs and other related expenses.
The costs for three major wind farms previously approved by the MPUC for recovery through OTP’s Minnesota Renewable Resource Adjustment (MNRRA) were moved to base rates as of October 1, 2011 under the MPUC’s April 25, 2011 general rate case order with the exception of the remaining balance of the MNRRA regulatory asset. OTP continued to collect the remaining regulatory asset balance through April 30, 2013, when the balance was near zero. On April 4, 2013 the MPUC authorized that any remaining unrecovered balance be retained as a regulatory asset to be recovered in OTP’s next general rate case.
Minnesota Conservation Improvement Programs—Under Minnesota law, every regulated public utility that furnishes electric service must make annual investments and expenditures in energy conservation improvements, or make a contribution to the state's energy and conservation account, in an amount equal to at least 1.5% of its gross operating revenues from service provided in Minnesota.
The Minnesota Department of Commerce (MNDOC) may require a utility to make investments and expenditures in energy conservation improvements whenever it finds that the improvement will result in energy savings at a total cost to the utility less than the cost to the utility to produce or purchase an equivalent amount of a new supply of energy. Such MNDOC orders can be appealed to the MPUC. Investments made pursuant to such orders generally are recoverable costs in rate cases, even though ownership of the improvement may belong to the property owner rather than the utility. OTP recovers conservation related costs not included in base rates under the Minnesota Conservation Improvement Program (MNCIP) through the use of an annual recovery mechanism approved by the MPUC.
In December 2012, the MPUC ordered a change in the MNCIP cost recovery methodology used by OTP from a percentage of a customer’s bill to an amount per kwh consumed. On January 1, 2013 OTP’s MNCIP surcharge decreased from 3.8% of the customer’s bill to $0.00142 per kwh, which equates to approximately 1.9% of a customer’s bill. On October 10, 2013 the MPUC approved OTP’s 2012 financial incentive request for $2.7 million as well as its request for an updated surcharge rate to be implemented on November 1, 2013. OTP recognized $3.9 million in MNCIP financial incentives in 2013 related to the results of its conservation improvement programs in Minnesota in 2013. On September 26, 2014 the MPUC approved OTP’s 2013 financial incentive request for $4.0 million, an updated surcharge rate to be effective October 1, 2014, as well as a change to the carrying charge to be equal to the short term cost of debt set in OTP’s most recent general rate case.
OTP recognized a financial incentive for 2014 of $3.0 million due, in part, to the MPUC lowering the MNCIP financial incentive from approximately $0.09 per kwh saved for 2013-2015 to $0.07 per kwh saved for 2014-2016. Additionally, OTP saved approximately 2 million less kwhs in 2014 compared with 2013 under conservation improvement programs in Minnesota. On July 9, 2015 the MPUC granted approval of OTP’s 2014 financial incentive of $3.0 million along with an updated surcharge with an effective date of October 1, 2015. Based on results from the 2015 MNCIP program year, OTP has recognized a financial incentive of $4.2 million. The 2015 MNCIP program resulted in approximately a 39% increase in energy savings compared to 2014 program results.
| 81 |
Transmission Cost Recovery (TCR) Rider—The Minnesota Public Utilities Act (the Act) provides a mechanism for automatic adjustment outside of a general rate proceeding to recover the costs of new transmission facilities that have been previously approved by the MPUC in a Certificate of Need (CON) proceeding, certified by the MPUC as a Minnesota priority transmission project, made to transmit the electricity generated from renewable generation sources ultimately used to provide service to the utility's retail customers, or exempt from the requirement to obtain a Minnesota CON. The MPUC may also authorize cost recovery via such TCR riders for charges incurred by a utility under a federally approved tariff that accrue from other transmission owners’ regionally planned transmission projects that have been determined by the MISO to benefit the utility or integrated transmission system. The Act also authorizes TCR riders to recover the costs of new transmission facilities approved by the regulatory commission of the state in which the new transmission facilities are to be constructed, to the extent approval is required by the laws of that state, and determined by the MISO to benefit the utility or integrated transmission system. Such TCR riders allow a return on investment at the level approved in a utility’s last general rate case. Additionally, following approval of the rate schedule, the MPUC may approve annual rate adjustments filed pursuant to the rate schedule.
MISO regional cost allocation allows OTP to recover some of the costs of its transmission investment from other MISO customers. On March 26, 2012 the MPUC approved an update to OTP’s Minnesota TCR rider along with an all-in method for MISO regional cost allocations in which OTP’s retail customers would be responsible for the entire investment OTP made in transmission facilities that qualify for regional cost allocation under the MISO Tariff, with an offsetting credit for revenues received from other MISO utilities under the MISO Tariff for projects included in the TCR. OTP’s updated Minnesota TCR rider went into effect April 1, 2012.
OTP filed an annual update to its Minnesota TCR rider on February 7, 2013 to include three new projects as well as updated costs associated with existing projects. In a written order issued on March 10, 2014, the MPUC approved OTP’s 2013 TCR rider update but found capitalized internal costs, costs in excess of CON estimates and a carrying charge ineligible for recovery through the TCR rider. These items were removed from OTP’s Minnesota TCR rider effective March 1, 2014. OTP will be allowed to seek recovery of the capitalized internal costs and costs in excess of CON estimates in a future rate case. In response to the MPUC’s approval of OTP’s annual TCR update, OTP submitted a compliance filing in April 2014 reflecting the TCR rider revenue requirements changes relating to the MPUC’s ruling and requesting no rate change be implemented at the time. The MPUC approved OTP’s compliance filing on June 19, 2014. On February 18, 2015 the MPUC approved OTP’s 2014 TCR rider annual update with an effective date of March 1, 2015. OTP filed an annual update to its Minnesota TCR rider on September 30, 2015 requesting revenue recovery of approximately $7.2 million with a proposed effective date of April 1, 2016. A supplemental filing to the update was made on December 21, 2015 to address an issue surrounding the proration of accumulated deferred income taxes.
Environmental Cost Recovery (ECR) Rider—On December 18, 2013 the MPUC granted approval of OTP’s Minnesota ECR rider for recovery of OTP’s Minnesota jurisdictional share of the revenue requirements of its investment in the Big Stone Plant AQCS effective January 1, 2014. The ECR rider recoverable revenue requirements include a current return on the project’s Construction Work in Progress (CWIP) balance at the level approved in OTP’s most recent general rate case. OTP filed its 2014 annual update on July 31, 2014, requesting a $4.1 million annual increase in the rider from $6.1 million to $10.2 million. The MPUC approved OTP’s ECR rider annual update request on November 24, 2014, effective December 1, 2014. Because the effective date was two months behind the anticipated implementation date for the updated rate and a portion of the requested increase had been collected under the initial rate, the approved updated rate is based on a revenue requirement of $9.8 million. OTP filed its 2015 annual update on July 31, 2015, with a request to keep the same rate in place. On December 21, 2015 OTP filed a supplemental filing with updated financial information.
Reagent Costs and Emission Allowances—On July 31, 2014 OTP filed a request with the MPUC to revise its Fuel Clause Adjustment (FCA) rider in Minnesota to include recovery of reagent and emission allowance costs. On March 12, 2015 the MPUC denied OTP’s request to revise its FCA rider to include recovery of these costs. These costs will be reviewed in OTP’s 2016 general rate case in Minnesota and considered for recovery either through the FCA rider or general rates. These costs are currently being expensed as incurred.
Big Stone II Project Cost Recovery—OTP requested recovery of the Minnesota portion of its Big Stone II development costs over a five-year period as part of its general rate case filed in Minnesota on April 2, 2010. In a written order issued on April 25, 2011, the MPUC authorized recovery of the Minnesota portion of Big Stone II generation development costs from Minnesota ratepayers over a 60-month recovery period which began on October 1, 2011. The amount of Big Stone II generation costs incurred by OTP that were deemed recoverable from Minnesota ratepayers as part of the rates established in that proceeding was $3.2 million. Because OTP was not allowed to earn a return on these deferred costs over the 60-month recovery period, the recoverable amount of $3.2 million was discounted to its present value of $2.8 million using OTP’s incremental borrowing rate, in accordance with ASC Topic 980, Regulated Operations (ASC 980) accounting requirements. Transmission-related project costs of $3.2 million remained in CWIP as active project costs at the time of the order.
| 82 |
Approximately $0.4 million of the total Minnesota jurisdictional share of Big Stone II transmission costs were transferred to the Big Stone South - Brookings MVP transmission line project in the first quarter of 2013. The remaining transmission costs, along with accumulated AFUDC, were transferred from CWIP to a regulatory asset account in May 2013, based on recovery granted in the April 25, 2011 order. Because OTP was not allowed to earn a return on these deferred costs over their anticipated recovery period, the recoverable amount of approximately $3.5 million was discounted to its present value using OTP’s incremental borrowing rate. In May 2013, OTP recorded a charge of $0.7 million related to the discount in accordance with ASC 980 accounting requirements. In June 2014, OTP recorded an additional discount of $0.3 million to reflect changes in the end date of the anticipated recovery period from September 2020 to December 2022. In accordance with ASC 980, OTP continues to monitor the assumptions used in the discounting of the Minnesota Big Stone II Transmission costs. A reversal of $0.2 million of the discount previously recorded was made in December 2015 to reflect updated information.
North Dakota
General Rates—OTP’s most recent general rate increase in North Dakota of $3.6 million, or approximately 3.0%, was granted by the NDPSC in an order issued on November 25, 2009 and effective December 2009. Pursuant to the order, OTP’s allowed rate of return on rate base was set at 8.62%, and its allowed rate of return on equity was set at 10.75%.
Renewable Resource Adjustment—OTP has a North Dakota Renewable Resource Adjustment (NDRRA) which enables OTP to recover the North Dakota share of its investments in renewable energy facilities it owns in North Dakota. This rider allows OTP to recover costs associated with new renewable energy projects as they are completed with a return on investment at the level approved in OTP's most recent general rate case. On March 21, 2012 the NDPSC approved an update to OTP’s NDRRA effective April 1, 2012. The updated NDRRA recovered $9.9 million over the period April 1, 2012 through March 31, 2013. On December 28, 2012 OTP submitted an annual update to the NDRRA with a proposed effective date of April 1, 2013. The update resulted in a rate reduction, so the NDPSC did not issue an order suspending the rate change. Consequently, pursuant to statute, OTP was allowed to implement updated rates effective April 1, 2013 with the NDPSC granting subsequent approval of the updated rates on July 10, 2013. The NDPSC approved OTP’s 2013 annual update to the NDRRA on March 12, 2014 with an effective date of April 1, 2014, which resulted in a 13.5% reduction in the NDRRA rate. The NDPSC approved OTP’s 2014 annual update to the NDRRA, including a change in rate design from an amount per kwh consumed to a percentage of a customer’s bill, on March 25, 2015 with an effective date of April 1, 2015. In each instance the NDRRA rates have been based on a return on investment at the rate of return approved in OTP’s last general rate case. OTP submitted its 2015 annual update to the NDRRA rider rate on December 31, 2015 with a requested implementation date of April 1, 2016.
Transmission Cost Recovery Rider—North Dakota law provides a mechanism for automatic adjustment outside of a general rate proceeding to recover jurisdictional capital and operating costs incurred by a public utility for new or modified electric transmission facilities. For qualifying projects, the law authorizes a current return on CWIP and a return on investment at the level approved in the utility's most recent general rate case. On August 31, 2012 OTP filed its annual update to the North Dakota TCR rider rate to reflect updated cost information associated with projects currently in the rider, as well as proposing to include costs associated with ten additional projects for recovery within the rider. The NDPSC approved the annual update on December 12, 2012 with an effective date of January 1, 2013. The NDPSC approved OTP’s 2013 annual update to its TCR rider rate on December 30, 2013 with an effective date of January 1, 2014. The NDPSC approved OTP’s 2014 annual update to its TCR rider rate on December 17, 2014 with an effective date of January 1, 2015. On August 31, 2015 OTP filed its 2015 annual update to its North Dakota TCR rider rate requesting recovery of approximately $10.2 million for 2016 compared with $8.5 million for 2015, including costs assessed by the MISO as well as new costs from the Southwest Power Pool (SPP) that OTP will incur beginning January 1, 2016. These new costs are associated with OTP’s load connected to the transmission system of Central Power Electric Cooperative (CPEC) that will become subject to SPP transmission-related charges when CPEC transmission assets are added to the SPP. The NDPSC approved OTP’s 2015 annual update to its TCR rider rate on December 16, 2015 with an effective date of January 1, 2016.
Environmental Cost Recovery Rider— On February 8, 2013 OTP filed a request with the NDPSC for an ECR rider to recover OTP’s North Dakota jurisdictional share of the revenue requirements associated with its investment in the Big Stone Plant AQCS. On December 18, 2013 the NDPSC approved OTP’s North Dakota ECR rider based on revenue requirements through the 2013 calendar year and thereafter, with rates effective for bills rendered on or after January 1, 2014. The ECR provides for a current return on CWIP and a return on investment at the level approved in OTP’s most recent general rate case. On March 31, 2014 OTP filed an annual update to its North Dakota ECR rider rate. The update included a request to increase the ECR rider rate from 4.319% of base rates to 7.531% of base rates. The NDPSC approved OTP’s 2014 ECR rider annual update request on July 10, 2014 with an August 1, 2014 implementation date. On March 31, 2015 OTP filed its annual update to the ECR. This update included a request to increase the ECR rider rate from 7.531% of base rates to 9.193% of base rates. The NDPSC approved the annual update on June 17, 2015 with an effective date of July 1, 2015, along with the approval of recovery of OTP’s North Dakota jurisdictional share of Hoot Lake Plant MATS project costs.
| 83 |
Reagent Costs and Emission Allowances—On July 31, 2014 OTP filed a request with the NDPSC to revise its FCA rider in North Dakota to include recovery of new reagent and emission allowance costs. On February 25, 2015 the NDPSC approved recovery of these costs through modification of the ECR rider, instead of recovery through the FCA as OTP had proposed. The ECR rider reagent and emissions allowance charge became effective May 1, 2015.
Big Stone II Project—In an order issued June 25, 2010, the NDPSC authorized recovery of Big Stone II development costs from North Dakota ratepayers. The North Dakota’s jurisdictional share of Big Stone II generation costs incurred by OTP was $4.1 million. OTP included in its total recovery amount a carrying charge of approximately $0.3 million on the North Dakota share of Big Stone II generation costs based on OTP’s average 2009 AFUDC rate of 7.65%. Because OTP would not earn a return on these deferred costs over the 36-month recovery period, the recoverable amount of $4.3 million was discounted to its then present value of $3.9 million using OTP’s incremental borrowing rate, in accordance with ASC 980 accounting requirements. The North Dakota portion of Big Stone II generation costs was recovered over a 36-month period which began on August 1, 2010.
The North Dakota jurisdictional share of Big Stone II costs incurred by OTP related to transmission was $1.1 million. Approximately $0.3 million of the total North Dakota jurisdictional share of Big Stone II transmission costs were transferred to the Big Stone South - Brookings MVP during the first quarter of 2013. On July 30, 2013 the NDPSC approved OTP’s request to continue the Big Stone II cost recovery rates for an additional eight months through March 31, 2014 to recover the remaining North Dakota share of Big Stone II transmission-related costs plus accrued AFUDC totaling $1.0 million. As of April 1, 2014 North Dakota customer’s bills no longer include a charge for the North Dakota share of Big Stone II costs.
South Dakota
2010 General Rate Case—OTP’s most recent general rate increase in South Dakota of approximately $643,000 or approximately 2.32% was granted by the SDPUC in an order issued on April 21, 2011 and effective with bills rendered on and after June 1, 2011. Pursuant to the order, OTP’s allowed rate of return on rate base was set at 8.50%.
Transmission Cost Recovery Rider—South Dakota law provides a mechanism for automatic adjustment outside of a general rate proceeding to recover jurisdictional capital and operating costs incurred by a public utility for new or modified electric transmission facilities. The SDPUC approved OTP’s 2012 annual update to its South Dakota TCR on April 23, 2013 with an effective date of May 1, 2013. The SDPUC approved OTP’s 2013 annual update on February 18, 2014 with an effective date of March 1, 2014. The SDPUC approved OTP’s 2014 annual update on February 13, 2015 with an effective date of March 1, 2015. OTP filed its 2015 annual update on October 30, 2015 with a proposed effective date of March 1, 2016. A supplemental filing was made on February 3, 2016 to true-up the filing to include the impact of bonus depreciation elected for 2015, the inclusion of a deferred tax asset relating to a net operating loss and the proration of accumulated deferred income taxes.
Environmental Cost Recovery Rider—On November 25, 2014 the SDPUC approved OTP’s ECR rider request to recover OTP’s South Dakota jurisdictional share of revenue requirements associated with its investment in the Big Stone Plant AQCS and Hoot Lake Plant MATS projects, with an effective date of December 1, 2014. On August 31, 2015 OTP filed its annual update to the South Dakota ECR requesting recovery of approximately $2.7 million in annual revenue. The SDPUC approved the request in their order dated October 15, 2015 with an effective date of November 1, 2015.
Reagent Costs and Emission Allowances—On August 1, 2014 OTP filed a request with the SDPUC to revise its FCA rider in South Dakota to include recovery of reagent and emission allowance costs. On September 16, 2014 the SDPUC approved OTP’s request to include recovery of these costs in its South Dakota FCA rider.
Big Stone II Project—OTP requested recovery of the South Dakota portion of its Big Stone II development costs over a five-year period as part of its general rate case filed in South Dakota on August 20, 2010. In the first quarter of 2011, the SDPUC approved recovery of the South Dakota portion of Big Stone II generation development costs totaling approximately $1.0 million from South Dakota ratepayers over a ten-year period beginning in February 2011 with the implementation of interim rates. OTP is allowed to earn a return on the amount subject to recovery over the ten-year recovery period. Therefore, the South Dakota settlement amount is not discounted. OTP transferred the South Dakota portion of the remaining Big Stone II transmission costs to CWIP, with such costs subject to AFUDC and recovery in future FERC-approved MISO rates or retail rates. On July 31, 2012 the SDPUC approved the transfer of the Big Stone II transmission route permits to OTP.
A portion of the Big Stone II transmission costs were transferred out of CWIP in February 2013 to be included within the Big Stone South - Brookings MVP. On March 28, 2013 OTP filed a petition with the SDPUC requesting deferred accounting for the remaining unrecovered Big Stone II transmission costs until OTP’s next South Dakota general rate case. The petition was approved by the SDPUC on April 23, 2013 and in May 2013 OTP transferred the remaining $0.2 million South Dakota jurisdictional portion of unrecovered Big Stone II transmission costs plus accumulated AFUDC from CWIP to the Big Stone II Unrecovered Project Costs – South Dakota regulatory asset accounts.
| 84 |
Revenues Recorded under Rate Riders
The following table presents revenue recorded by OTP under rate riders in place in Minnesota, North Dakota and South Dakota for the years ended December 31:
| Rate Rider (in thousands) | 2015 | 2014 | 2013 | |||||||||
| Minnesota | ||||||||||||
| Conservation Improvement Program Costs and Incentives1 | $ | 10,724 | $ | 7,757 | $ | 9,329 | ||||||
| Transmission Cost Recovery | 5,202 | 6,275 | 2,947 | |||||||||
| Environmental Cost Recovery | 10,238 | 6,891 | — | |||||||||
| North Dakota | ||||||||||||
| Renewable Resource Adjustment | 8,409 | 7,484 | 8,631 | |||||||||
| Transmission Cost Recovery | 6,609 | 5,794 | 3,202 | |||||||||
| Environmental Cost Recovery | 9,502 | 5,872 | 2,331 | |||||||||
| Big Stone II Project Costs | — | 361 | 1,448 | |||||||||
| South Dakota | ||||||||||||
| Transmission Cost Recovery | 1,290 | 1,207 | 826 | |||||||||
| Environmental Cost Recovery | 1,967 | 234 | — | |||||||||
| Conservation Improvement Program Costs and Incentives | 583 | 435 | 366 | |||||||||
1Includes MNCIP costs recovered in base rates.
FERC
Wholesale power sales and transmission rates are subject to the jurisdiction of the FERC under the Federal Power Act of 1935, as amended. The FERC is an independent agency with jurisdiction over rates for wholesale electricity sales, transmission and sale of electric energy in interstate commerce, interconnection of facilities, and accounting policies and practices. Filed rates are effective after a one day suspension period, subject to ultimate approval by the FERC.
Multi-Value Transmission Projects—On December 16, 2010 the FERC approved the cost allocation for a new classification of projects in the MISO region called MVPs. MVPs are designed to enable the region to comply with energy policy mandates and to address reliability and economic issues affecting multiple transmission zones within the MISO region. The cost allocation is designed to ensure that the costs of transmission projects with regional benefits are properly assigned to those who benefit. On October 20, 2011 the FERC reaffirmed the MVP cost allocation on rehearing.
Effective January 1, 2012 the FERC authorized OTP to recover 100% of prudently incurred CWIP and Abandoned Plant Recovery on two projects approved by MISO as MVPs in MISO’s 2011 Transmission Expansion Plan: the Big Stone South – Brookings MVP and the Big Stone South – Ellendale MVP.
On November 12, 2013 a group of industrial customers and other stakeholders filed a complaint with the FERC seeking to reduce the return on equity (ROE) component of the transmission rates that MISO transmission owners, including OTP, may collect under the MISO Tariff. The complainants are seeking to reduce the current 12.38% ROE used in MISO’s transmission rates to a proposed 9.15%. A group of MISO transmission owners have filed responses to the complaint, defending the current ROE and seeking dismissal of the complaint. On October 16, 2014 the FERC issued an order finding that the current MISO ROE may be unjust and unreasonable and setting the issue for hearing, subject to the outcome of settlement discussion. Settlement discussions did not resolve the dispute and the FERC set the proceeding to a Track II Hearing which occurred in August 2015. An initial decision by the presiding administrative law judge was issued on December 22, 2015 finding that the MISO transmission owners’ ROE should be 10.32%. This order is currently pending exceptions at the FERC. On November 6, 2014 a group of MISO transmission owners, including OTP, filed for a FERC incentive of an additional 50-basis points for Regional Transmission Organization participation (RTO Adder). On January 5, 2015 the FERC granted the request, deferring collection of the RTO Adder until the resolution of the ROE complaint proceeding.
On February 12, 2015 another group of stakeholders filed a complaint with the FERC seeking to reduce the ROE component of the transmission rates that MISO transmission owners, including OTP, may collect under the MISO Tariff from the current 12.38% to a proposed 8.67%. A group of MISO transmission owners have filed responses to the complaint, defending the current ROE and seeking dismissal of the complaint. The FERC issued an order on June 18, 2015 setting the complaint for hearing to begin on February 16, 2016. The initial decision by the presiding administrative law judge is scheduled to be issued in the summer of 2016. A FERC decision is not expected until 2017.
Based on a potential reduction by the FERC in the ROE component of the MISO Tariff, OTP has recorded a $1.1 million liability on its balance sheet as of December 31, 2015, representing OTP’s best estimate of a refund obligation, net of amounts that would be subject to recovery under state jurisdictional TCR riders.
| 85 |
4. Regulatory Assets and Liabilities
As a regulated entity, OTP accounts for the financial effects of regulation in accordance with ASC 980. This accounting standard allows for the recording of a regulatory asset or liability for costs that will be collected or refunded in the future as required under regulation. Additionally, ASC 980-605-25 provides for the recognition of revenues authorized for recovery outside of a general rate case under alternative revenue programs which provide for recovery of costs and incentives or returns on investment in such items as transmission infrastructure, renewable energy resources or conservation initiatives. The following tables indicate the amount of regulatory assets and liabilities recorded on the Company’s consolidated balance sheets:
| December 31, 2015 | Remaining Recovery/ | |||||||||||||
| (in thousands) | Current | Long-Term | Total | Refund Period | ||||||||||
| Regulatory Assets: | ||||||||||||||
| Prior Service Costs and Actuarial Losses on Pensions and Other Postretirement Benefits1 | $ | 7,439 | $ | 99,293 | $ | 106,732 | see below | |||||||
| Deferred Marked-to-Market Losses1 | 4,063 | 10,530 | 14,593 | 60 months | ||||||||||
| Conservation Improvement Program Costs and Incentives2 | 4,411 | 4,266 | 8,677 | 18 months | ||||||||||
| Accumulated ARO Accretion/Depreciation Adjustment1 | — | 5,672 | 5,672 | asset lives | ||||||||||
| Big Stone II Unrecovered Project Costs – Minnesota1 | 942 | 2,620 | 3,562 | 84 months | ||||||||||
| Debt Reacquisition Premiums1 | 351 | 1,539 | 1,890 | 201 months | ||||||||||
| Deferred Income Taxes1 | — | 1,455 | 1,455 | asset lives | ||||||||||
| North Dakota Renewable Resource Rider Accrued Revenues2 | — | 1,266 | 1,266 | 15 months | ||||||||||
| MISO Schedule 26/26A Transmission Cost Recovery Rider True-up2 | 698 | 355 | 1,053 | 24 months | ||||||||||
| Big Stone II Unrecovered Project Costs – South Dakota2 | 100 | 643 | 743 | 89 months | ||||||||||
| Minnesota Transmission Cost Recovery Rider Accrued Revenues2 | 576 | — | 576 | 12 months | ||||||||||
| Minnesota Deferred Rate Case Expenses Subject to Recovery1 | 291 | — | 291 | 12 Months | ||||||||||
| Minnesota Renewable Resource Rider Accrued Revenues2 | — | 68 | 68 | see below | ||||||||||
| South Dakota Transmission Cost Recovery Rider Revenues2 | 33 | — | 33 | 12 months | ||||||||||
| Total Regulatory Assets | $ | 18,904 | $ | 127,707 | $ | 146,611 | ||||||||
| Regulatory Liabilities: | ||||||||||||||
| Accumulated Reserve for Estimated Removal Costs – Net of Salvage | $ | — | $ | 74,948 | $ | 74,948 | asset lives | |||||||
| Refundable Fuel Clause Adjustment Revenues | 1,834 | — | 1,834 | 12 months | ||||||||||
| Revenue for Rate Case Expenses Subject to Refund – Minnesota | — | 1,279 | 1,279 | see below | ||||||||||
| Deferred Income Taxes | — | 1,110 | 1,110 | asset lives | ||||||||||
| Minnesota Environmental Cost Recovery Rider Accrued Refund | 777 | — | 777 | 12 months | ||||||||||
| North Dakota Environmental Cost Recovery Rider Accrued Refund | 321 | — | 321 | 12 months | ||||||||||
| South Dakota Environmental Cost Recovery Rider Accrued Refund | 185 | — | 185 | 12 months | ||||||||||
| North Dakota Transmission Cost Recovery Rider Accrued Refund | 132 | — | 132 | 12 months | ||||||||||
| Deferred Gain on Sale of Utility Property – Minnesota Portion | 5 | 95 | 100 | 216 months | ||||||||||
| North Dakota Renewable Resource Rider Accrued Refund | 68 | — | 68 | 12 months | ||||||||||
| Total Regulatory Liabilities | $ | 3,322 | $ | 77,432 | $ | 80,754 | ||||||||
| Net Regulatory Asset Position | $ | 15,582 | $ | 50,275 | $ | 65,857 | ||||||||
1Costs subject to recovery without a rate of return.
2Amount eligible for recovery under an alternative revenue program which includes an incentive or rate of return.
| 86 |
| December 31, 2014 | Remaining Recovery/ | |||||||||||||
| (in thousands) | Current | Long-Term | Total | Refund Period | ||||||||||
| Regulatory Assets: | ||||||||||||||
| Prior Service Costs and Actuarial Losses on Pensions and Other Postretirement Benefits1 | $ | 7,464 | $ | 101,526 | $ | 108,990 | see below | |||||||
| Deferred Marked-to-Market Losses1 | 4,492 | 9,396 | 13,888 | 72 months | ||||||||||
| Conservation Improvement Program Costs and Incentives2 | 5,843 | 2,500 | 8,343 | 18 months | ||||||||||
| Accumulated ARO Accretion/Depreciation Adjustment1 | — | 5,190 | 5,190 | asset lives | ||||||||||
| Big Stone II Unrecovered Project Costs – Minnesota1 | 592 | 3,207 | 3,799 | 96 months | ||||||||||
| Minnesota Transmission Rider Accrued Revenues2 | 943 | 2,455 | 3,398 | 24 months | ||||||||||
| MISO Schedule 26/26A Transmission Cost Recovery Rider True-up2 | 2,585 | 807 | 3,392 | 24 months | ||||||||||
| Debt Reacquisition Premiums1 | 351 | 1,890 | 2,241 | 213 months | ||||||||||
| Deferred Income Taxes1 | — | 2,086 | 2,086 | asset lives | ||||||||||
| Recoverable Fuel and Purchased Power Costs1 | 1,114 | — | 1,114 | 12 months | ||||||||||
| North Dakota Transmission Rider Accrued Revenues2 | 859 | — | 859 | 12 months | ||||||||||
| Big Stone II Unrecovered Project Costs – South Dakota2 | 100 | 743 | 843 | 101 months | ||||||||||
| North Dakota Environmental Cost Recovery Rider Accrued Revenues2 | 706 | — | 706 | 12 months | ||||||||||
| Minnesota Environmental Cost Recovery Rider Accrued Revenues2 | 186 | — | 186 | 12 months | ||||||||||
| Minnesota Renewable Resource Rider Accrued Revenues2 | — | 68 | 68 | see below | ||||||||||
| South Dakota Environmental Cost Recovery Rider Accrued Revenues2 | 38 | — | 38 | 12 months | ||||||||||
| Total Regulatory Assets | $ | 25,273 | $ | 129,868 | $ | 155,141 | ||||||||
| Regulatory Liabilities: | ||||||||||||||
| Accumulated Reserve for Estimated Removal Costs – Net of Salvage | $ | — | $ | 74,237 | $ | 74,237 | asset lives | |||||||
| Deferred Income Taxes | — | 1,550 | 1,550 | asset lives | ||||||||||
| North Dakota Renewable Resource Rider Accrued Refund | 933 | 85 | 1,018 | 15 months | ||||||||||
| Revenue for Rate Case Expenses Subject to Refund – Minnesota | — | 784 | 784 | see below | ||||||||||
| Deferred Marked-to-Market Gains | — | 257 | 257 | 67 months | ||||||||||
| Big Stone II Over Recovered Project Costs – North Dakota | 147 | — | 147 | 12 months | ||||||||||
| Deferred Gain on Sale of Utility Property – Minnesota Portion | 6 | 100 | 106 | 228 months | ||||||||||
| South Dakota Transmission Rider Accrued Refund | 48 | — | 48 | 12 months | ||||||||||
| South Dakota – Nonasset-Based Margin Sharing Excess | 24 | — | 24 | 12 months | ||||||||||
| Total Regulatory Liabilities | $ | 1,158 | $ | 77,013 | $ | 78,171 | ||||||||
| Net Regulatory Asset Position | $ | 24,115 | $ | 52,855 | $ | 76,970 | ||||||||
1Costs subject to recovery without a rate of return.
2Amount eligible for recovery under an alternative revenue program which includes an incentive or rate of return.
The regulatory asset related to prior service costs and actuarial losses on pensions and other postretirement benefits represents benefit costs and actuarial losses subject to recovery through rates as they are expensed over the remaining service lives of active employees included in the plans. These unrecognized benefit costs and actuarial losses are required to be recognized as components of Accumulated Other Comprehensive Income in equity under ASC Topic 715, Compensation—Retirement Benefits, but are eligible for treatment as regulatory assets based on their probable recovery in future retail electric rates.
All Deferred Marked-to-Market Losses recorded as of December 31, 2015 relate to forward purchases of energy scheduled for delivery through December 2020.
Conservation Improvement Program Costs and Incentives represent mandated conservation expenditures and incentives recoverable through retail electric rates.
The Accumulated Asset Retirement Obligation (ARO) Accretion/Depreciation Adjustment will accrete and be amortized over the lives of property with asset retirement obligations.
Big Stone II Unrecovered Project Costs – Minnesota are the Minnesota share of generation and transmission plant-related costs incurred by OTP related to its participation in the abandoned Big Stone II project.
Debt Reacquisition Premiums are being recovered from OTP customers over the remaining original lives of the reacquired debt issues, the longest of which is 201 months.
| 87 |
The regulatory assets and liabilities related to Deferred Income Taxes result from changes in statutory tax rates accounted for in accordance with ASC Topic 740, Income Taxes.
North Dakota Renewable Resource Rider Accrued Revenues relate to qualifying renewable resource costs incurred to serve North Dakota customers that have not been billed to North Dakota customers as of December 31, 2015.
MISO Schedule 26/26A Transmission Cost Recovery Rider True-up relates to the over/under collection of revenue based on comparison of the expected versus actual construction on eligible projects in the period. The true-up also includes the state jurisdictional portion of MISO Schedule 26/26A for regional transmission cost recovery that was included in the calculation of the state transmission riders and subsequently adjusted to reflect actual billing amounts in the schedule.
Big Stone II Unrecovered Project Costs – South Dakota are the South Dakota share of generation and transmission plant-related costs incurred by OTP related to its participation in the abandoned Big Stone II project.
Minnesota Transmission Cost Recovery Rider Accrued Revenues relate to revenues earned on qualifying transmission system facilities that have not been billed to Minnesota customers as of December 31, 2015.
Minnesota Deferred Rate Case Expenses Subject to Recovery relate to costs incurred in conjunction with OTP’s 2016 rate case in Minnesota that will be subject to recovery after new rates go into effect subsequent to the completion of the rate case.
Minnesota Renewable Resource Rider Accrued Revenues relate to revenues earned on qualifying renewable resource costs incurred to serve Minnesota customers that have not been billed to Minnesota customers. On April 4, 2013 the MPUC approved OTP’s request to set the rider rate to zero effective May 1, 2013 and authorized that any unrecovered balance be retained as a regulatory asset to be recovered in OTP’s next general rate case.
The South Dakota Transmission Cost Recovery Rider Accrued Revenues relate to revenues earned on qualifying transmission system facilities that have not been billed to South Dakota customers as of December 31, 2015.
The Accumulated Reserve for Estimated Removal Costs – Net of Salvage is reduced as actual removal costs, net of salvage revenues, are incurred.
Revenue for Rate Case Expenses Subject to Refund – Minnesota relates to revenues collected under general rates to recover costs related to prior rate case proceedings in excess of the actual costs incurred, which are subject to refund.
The Minnesota Environmental Cost Recovery Rider Accrued Refund relates to amounts collected on the Minnesota share of OTP’s investment in the Big Stone Plant AQCS project that are refundable to Minnesota customers as of December 31, 2015.
The North Dakota Environmental Cost Recovery Rider Accrued Refund relates to amounts collected on the North Dakota share of OTP’s investments in the Big Stone Plant AQCS and Hoot Lake Plant MATS projects that are refundable to North Dakota customers as of December 31, 2015.
The South Dakota Environmental Cost Recovery Rider Accrued Refund relates to amounts collected on the South Dakota share of OTP’s investments in the Big Stone Plant AQCS and Hoot Lake Plant MATS projects that are refundable to South Dakota customers as of December 31, 2015.
The North Dakota Transmission Cost Recovery Rider Accrued Refund relates to amounts collected for qualifying transmission system facilities and operating costs incurred to serve North Dakota customers that are refundable to North Dakota customers as of December 31, 2015.
The North Dakota Renewable Resource Rider Accrued Refund relates to amounts collected for qualifying renewable resource costs incurred to serve North Dakota customers that are refundable to North Dakota customers as of December 31, 2015.
If for any reason OTP ceases to meet the criteria for application of guidance under ASC 980 for all or part of its operations, the regulatory assets and liabilities that no longer meet such criteria would be removed from the consolidated balance sheet and included in the consolidated statement of income as an expense or income item in the period in which the application of guidance under ASC 980 ceases.
| 88 |
5. Forward Contracts Classified as Derivatives
Electricity Contracts
All of OTP’s wholesale purchases and sales of energy under forward contracts that are not designated as normal are accounted for as derivatives subject to mark-to-market accounting. OTP’s objective in entering into forward contracts for the purchase and sale of energy is to meet the energy requirements of its retail customers and to optimize the use of its generating and transmission facilities. OTP’s intent in entering into these contracts is to settle them through the physical delivery of energy when physically possible and economically feasible. Prior to December 2014, OTP also entered into certain contracts for trading purposes with the intent to profit from fluctuations in market prices through the timing of purchases and sales. Effective December 31, 2014 OTP discontinued its trading activities not directly associated with serving retail customers.
OTP’s forward contracts outstanding as of September 30, 2015 and December 31, 2014 for the purchase of electricity were scheduled for delivery at the OTP node. Prices used to value these forward purchases were based on a basis spread between the OTP node and more liquid trading hub prices. These basis spreads were based on historical spreads. The fair value measurements of these forward energy contracts fell into Level 3 of the fair value hierarchy set forth in ASC 820.
Electric operating revenues include wholesale electric sales, the acquisition and settlement of financial transmission rights and transmission congestion rights and daily settlements of virtual transactions in the MISO market and, prior to December 31, 2014, included net unrealized derivative gains on forward energy contracts, the acquisition and settlement of congestion revenue rights options in the Electric Reliability Council of Texas (ERCOT) markets and daily settlements of virtual transactions in the ERCOT, California Independent Transmission System Operator markets and Southwest Power Pool markets broken down as follows for the years ended December 31:
| (in thousands) | 2015 | 2014 | 2013 | |||||||||
| Wholesale Sales - Company-Owned Generation | $ | 2,499 | $ | 11,160 | $ | 14,846 | ||||||
| Revenue from Settled Contracts at Market Prices | 20,545 | 131,952 | 133,238 | |||||||||
| Market Cost of Settled Contracts | (20,359 | ) | (130,908 | ) | (132,055 | ) | ||||||
| Net Margins on Settled Contracts at Market | 186 | 1,044 | 1,183 | |||||||||
| Marked-to-Market Gains on Settled Contracts | — | 263 | 3,039 | |||||||||
| Marked-to-Market Losses on Settled Contracts | — | (276 | ) | (2,722 | ) | |||||||
| Net Marked-to-Market (Losses) Gains on Settled Contracts | — | (13 | ) | 317 | ||||||||
| Unrealized Marked-to-Market Gains on Open Contracts | — | — | 215 | |||||||||
| Unrealized Marked-to-Market Losses on Open Contracts | — | — | (100 | ) | ||||||||
| Net Unrealized Marked-to-Market Gains on Open Contracts | — | — | 115 | |||||||||
| Wholesale Electric Revenue | $ | 2,685 | $ | 12,191 | $ | 16,461 | ||||||
OTP has established guidelines and limits to manage credit risk associated with wholesale power and capacity purchases and sales. Specific limits are determined by a counterparty’s financial strength. Counterparties with investment grade credit ratings have minimum credit ratings of BBB- (Standard & Poor’s), Baa3 (Moody’s) or BBB- (Fitch). OTP had no exposure at December 31, 2015 to counterparties with investment grade or below investment grade credit ratings with respect to any of its forward energy contracts.
Individual counterparty exposures for certain contracts can be offset according to legally enforceable netting arrangements. However, the Company does not net offsetting payables and receivables or derivative assets and liabilities under legally enforceable netting arrangements on the face of its consolidated balance sheet. The following table shows forward contract positions subject to legally enforceable netting arrangements as of December 31:
| (in thousands) | 2015 | 2014 | ||||||
| Derivatives in Gain Positions Subject to Legally Enforceable Netting Arrangements | $ | — | $ | 257 | ||||
| Open Contract Loss Positions Subject to Legally Enforceable Netting Arrangements | (16,070 | ) | (14,230 | ) | ||||
| Net Balance Subject to Legally Enforceable Netting Arrangements | $ | (16,070 | ) | $ | (13,973 | ) | ||
| 89 |
The following table provides a breakdown of OTP’s credit risk standing on forward energy contracts in marked-to-market loss positions as of December 31:
| (in thousands) | 2015 | 2014 | ||||||
| Loss Contracts Covered by Deposited Funds or Letters of Credit | $ | 199 | $ | 45 | ||||
| Contracts Requiring Cash Deposits if OTP’s Credit Falls Below Investment Grade1 | 15,871 | 13,888 | ||||||
| Loss Contracts with No Ratings Triggers or Deposit Requirements | — | 297 | ||||||
| Total Forward Contracts In Excess of Current Market Values | $ | 16,070 | $ | 14,230 | ||||
| 1Certain OTP derivative energy contracts contain provisions that require an investment grade credit rating from each of the major credit rating agencies on OTP’s debt. If OTP’s debt ratings were to fall below investment grade, the counterparties to these forward energy contracts could request the immediate deposit of cash to cover contracts in net liability positions. | ||||||||
| Contracts Requiring Cash Deposits if OTP’s Credit Falls Below Investment Grade | $ | 15,871 | $ | 13,888 | ||||
| Offsetting Gains with Counterparties under Master Netting Agreements | — | (257 | ) | |||||
| Reporting Date Deposit Requirement if Credit Risk Feature Triggered | $ | 15,871 | $ | 13,631 | ||||
6. Common Shares and Earnings per Share
Shelf Registration
On May 11, 2015 the Company filed a shelf registration statement with the U.S. Securities and Exchange Commission (SEC) under which the Company may offer for sale, from time to time, either separately or together in any combination, equity, debt or other securities described in the shelf registration statement, including common shares of the Company.
Common Share Distribution Agreement
On May 11, 2015 the Company entered into a Distribution Agreement with J.P. Morgan Securities LLC (JPMS) under which it may offer and sell its common shares from time to time in an At-the-Market offering program through JPMS, as its distribution agent, up to an aggregate sales price of $75 million.
Under the Distribution Agreement, the Company will designate the minimum price and maximum number of shares to be sold through JPMS on any given trading day or over a specified period of trading days, and JPMS will use commercially reasonable efforts to sell such shares on such days, subject to certain conditions. Sales of the shares, if any, will be made by means of ordinary brokers’ transactions on the NASDAQ Global Select Market at market prices or as otherwise agreed with JPMS. The Company may also agree to sell shares to JPMS, as principal for its own account, on terms agreed by the Company and JPMS in a separate agreement at the time of sale. The Company is not obligated to sell and JPMS is not obligated to buy or sell any of the shares under the Distribution Agreement. The shares, if issued, will be issued pursuant to the Company’s existing shelf registration statement.
2015 Common Stock Activity
Following is a reconciliation of the Company’s common shares outstanding from December 31, 2014 through December 31, 2015:
| Common Shares Outstanding, December 31, 2014 | 37,218,053 | |||
| Issuances: | ||||
| Automatic Dividend Reinvestment and Share Purchase Plan: | ||||
| Dividends Reinvested | 202,307 | |||
| Cash Invested | 100,212 | |||
| Executive Stock Performance Awards (for 2012 grants) | 89,991 | |||
| At-the-Market Offering | 133,197 | |||
| Directors Deferred Compensation | 36,828 | |||
| Employee Stock Purchase Plan: | ||||
| Cash Invested | 42,253 | |||
| Dividends Reinvested | 27,860 | |||
| Employee Stock Ownership Plan | 21,137 | |||
| Restricted Stock Issued to Directors | 15,200 | |||
| Stock Options Exercised | 10,250 | |||
| Vesting of Restricted Stock Units | 11,250 | |||
| Retirements: | ||||
| Shares Withheld for Individual Income Tax Requirements | (51,352 | ) | ||
| Common Shares Outstanding, December 31, 2015 | 37,857,186 |
| 90 |
2014 Stock Incentive Plan
The 2014 Stock Incentive Plan (2014 Incentive Plan), which was approved by the Company’s shareholders in April 2014, provides for the grant of stock options, stock appreciation rights, restricted stock, restricted stock units, performance awards, and other stock and stock-based awards. A total of 1,900,000 common shares were authorized for granting stock awards under the 2014 Incentive Plan, of which 1,500,144 were available for issuance as of December 31, 2015. The 2014 Incentive Plan terminates on December 13, 2023.
Employee Stock Purchase Plan
The 1999 Employee Stock Purchase Plan (Purchase Plan) allows eligible employees to purchase the Company’s common shares at 85% of the market price at the end of each six-month purchase period. On April 16, 2012, the Company’s shareholders approved an amendment to the Purchase Plan, increasing the number of shares available under the Purchase Plan from 900,000 common shares to 1,400,000 common shares and making certain other changes to the terms of the Purchase Plan. Of the 1,400,000 common shares authorized to be issued under the Purchase Plan, 416,215 were available for purchase as of December 31, 2015. At the discretion of the Company, shares purchased under the Purchase Plan can be either new issue shares or shares purchased in the open market. To provide shares for purchases for the Purchase Plan, 42,253 common shares were issued in 2015, 39,222 common shares were issued in 2014 and 43,837 common shares were purchased in the open market in 2013. The shares to be purchased by employees participating in the Purchase Plan were not material to the calculation of diluted earnings per share during the investment period.
Dividend Reinvestment and Share Purchase Plan
The Company’s shelf registration statement filed with the SEC on May 11, 2015, as amended on October 13, 2015, provides for the issuance of up to 1,500,000 common shares under the Company's Automatic Dividend Reinvestment and Share Purchase Plan (the Plan), which permits shares purchased by participants in the Plan to be either new issue common shares or common shares purchased in the open market. In 2015, 302,519 new common shares were issued under the Plan, leaving 1,197,481 common shares available for issuance under the Plan as of December 31, 2015.
Earnings Per Share
The numerator used in the calculation of both basic and diluted earnings per common share is earnings available for common shares with no adjustments in 2015, 2014 and 2013. The denominator used in the calculation of basic earnings per common share is the weighted average number of common shares outstanding during the period excluding nonvested restricted shares granted to the Company’s directors and employees, which are considered contingently returnable and not outstanding for the purpose of calculating basic earnings per share. The denominator used in the calculation of diluted earnings per common share is derived by adjusting basic shares outstanding for the items listed in the following reconciliation of Weighted Average Common Shares Outstanding – Basic to Weighted Average Common Shares Outstanding – Diluted for the following periods:
| 2015 | 2014 | 2013 | ||||||||||
| Weighted Average Common Shares Outstanding – Basic | 37,494,986 | 36,514,397 | 36,151,364 | |||||||||
| Plus Outstanding Share Awards net of Share Reductions for Unrecognized Stock-Based Compensation Expense and Excess Tax Benefits: | ||||||||||||
| Shares Expected to be Awarded for Stock Performance Awards Granted to Executive Officers based on Measurement Period-to-Date Performance | 100,194 | 135,480 | 90,120 | |||||||||
| Underlying Shares Related to Nonvested Restricted Stock Units Granted to Employees | 36,180 | 27,540 | 33,708 | |||||||||
| Nonvested Restricted Shares | 22,848 | 49,998 | 54,479 | |||||||||
| Shares Expected to be Issued Under the Deferred Compensation Program for Directors | 13,488 | 24,048 | 22,999 | |||||||||
| Potentially Dilutive Stock Options | 330 | 1,096 | 2,277 | |||||||||
| Total Dilutive Shares | 173,040 | 238,162 | 203,583 | |||||||||
| Weighted Average Common Shares Outstanding – Diluted | 37,668,026 | 36,752,559 | 36,354,947 | |||||||||
The effect of dilutive shares on earnings per share for the years ended December 31, 2015, 2014 and 2013, resulted in no differences greater than $0.01 between basic and diluted earnings per share in total or from continuing or discontinued operations in any period.
| 91 |
7. Share-Based Payments
Purchase Plan
The Purchase Plan allows employees through payroll withholding to purchase shares of the Company’s common stock at a 15% discount from the average market price on the last day of a six month investment period. Under ASC Topic 718, Compensation—Stock Compensation (ASC 718), the Company is required to record compensation expense related to the 15% discount. The 15% discount resulted in compensation expense of $184,000 in 2015, $175,000 in 2014 and $143,000 in 2013.
Stock Options Granted Under the 1999 Incentive Plan
The Company granted 2,041,500 options for the purchase of the Company’s common stock under the 1999 Stock Incentive Plan (1999 Incentive Plan). The exercise price of the options granted was the average market price of the Company’s common stock on the grant date. Under ASC 718 accounting requirements, compensation expense is recorded based on the estimated fair value of the options on their grant date using a fair-value option pricing model. Under ASC 718 accounting requirements, the fair value of the options granted has been recorded as compensation expense over the requisite service period (the vesting period of the options). The estimated fair value of all options granted under the 1999 Incentive Plan was based on the Black-Scholes option pricing model. There were no options outstanding as of December 31, 2015.
Presented below is a summary of the stock options activity:
| Stock Option Activity | 2015 | 2014 | 2013 | |||||||||||||||||||||
| Options | Average Exercise Price |
Options | Average Exercise Price |
Options | Average Exercise Price |
|||||||||||||||||||
| Outstanding, Beginning of Year | 12,750 | $ | 24.93 | 34,700 | $ | 25.69 | 92,497 | $ | 26.59 | |||||||||||||||
| Granted | — | — | — | |||||||||||||||||||||
| Exercised | 10,250 | 24.93 | 20,800 | 26.11 | 56,109 | 27.12 | ||||||||||||||||||
| Forfeited or Expired | 2,500 | 24.93 | 1,150 | 26.495 | 1,688 | 27.245 | ||||||||||||||||||
| Outstanding, End of Year | — | 12,750 | 24.93 | 34,700 | 25.69 | |||||||||||||||||||
| Exercisable, End of Year | — | 12,750 | 24.93 | 34,700 | 25.69 | |||||||||||||||||||
| Cash Received for Options Exercised | $ | 256,000 | $ | 543,000 | $ | 1,522,000 | ||||||||||||||||||
| Intrinsic Value of Options Exercised | 75,000 | 89,000 | 152,000 | |||||||||||||||||||||
| Fair Value of Options Granted During Year | none granted | none granted | none granted | |||||||||||||||||||||
Restricted Stock Granted to Directors
Under the 1999 Incentive Plan and the 2014 Incentive Plan, restricted shares of the Company’s common stock have been granted to members of the Company’s board of directors as a form of compensation. Under ASC 718 accounting requirements, compensation expense related to restricted shares is based on the fair value of the restricted shares on their grant dates. On April 13, 2015 the Company’s board of directors granted 15,200 shares of restricted stock to the Company’s nonemployee directors. The grant-date fair value of each share of restricted stock granted on April 13, 2015 was $31.775 per share, the average of the high and low market price on the date of grant. The restricted shares granted in 2015 vest 25% per year on April 8 of each year in the period 2016 through 2019 and are eligible for full dividend and voting rights. Restricted shares not vested and dividends on those restricted shares are subject to forfeiture under the terms of the restricted stock award agreement.
Presented below is a summary of the status of directors’ restricted stock awards for the years ended December 31:
| Directors’ Restricted Stock Awards | 2015 | 2014 | 2013 | |||||||||||||||||||||
| Shares | Weighted Average Grant-Date Fair Value |
Shares | Weighted Average Grant-Date Fair Value |
Shares | Weighted Average Grant-Date Fair Value |
|||||||||||||||||||
| Nonvested, Beginning of Year | 38,050 | $ | 27.47 | 42,483 | $ | 25.03 | 56,900 | $ | 21.84 | |||||||||||||||
| Granted | 15,200 | 31.775 | 16,800 | 29.41 | 17,333 | 30.77 | ||||||||||||||||||
| Vested | 15,033 | 25.96 | 21,233 | 24.11 | 29,750 | 21.87 | ||||||||||||||||||
| Forfeited | — | — | 2,000 | 31.03 | ||||||||||||||||||||
| Nonvested, End of Year | 38,217 | 29.78 | 38,050 | 27.47 | 42,483 | 25.03 | ||||||||||||||||||
| Compensation Expense Recognized | $ | 417,000 | $ | 416,000 | $ | 611,000 | ||||||||||||||||||
| Fair Value of Shares Vested in Year | 390,000 | 512,000 | 651,000 | |||||||||||||||||||||
| 92 |
Restricted Stock Granted to Employees
Under the 1999 Incentive Plan and 2014 Incentive Plan, restricted shares of the Company’s common stock have been granted to employees as a form of compensation. Under ASC 718 accounting requirements, compensation expense related to restricted shares is based on the fair value of the restricted shares on their grant dates. No shares of restricted stock were granted to employees in 2015.
Presented below is a summary of the status of employees’ restricted stock awards for the years ended December 31:
| Employees’ Restricted Stock Awards | 2015 | 2014 | 2013 | |||||||||||||||||||||
| Shares | Weighted Average Grant-Date Fair Value |
Shares | Weighted Average Grant-Date Fair Value |
Shares | Weighted Average Grant-Date Fair Value |
|||||||||||||||||||
| Nonvested, Beginning of Year | 45,280 | $ | 27.46 | 48,315 | $ | 25.04 | 47,645 | $ | 21.82 | |||||||||||||||
| Granted | — | 26,700 | 29.41 | 17,000 | 31.03 | |||||||||||||||||||
| Awards Vested | 31,699 | 27.09 | 25,360 | 24.80 | 16,330 | 21.89 | ||||||||||||||||||
| Forfeited | — | 4,375 | 28.03 | — | ||||||||||||||||||||
| Nonvested, End of Year | 13,581 | 28.56 | 45,280 | 27.46 | 48,315 | 25.04 | ||||||||||||||||||
| Compensation Expense Recognized | $ | 359,000 | $ | 998,000 | $ | 427,000 | ||||||||||||||||||
| Fair Value of Awards Vested | 859,000 | 629,000 | 358,000 | |||||||||||||||||||||
Restricted Stock Units Granted to Executive Officers
In 2015 the Company’s board of directors granted the following restricted stock unit awards to the Company’s executive officers under the 2014 Stock Incentive Plan:
| Grant Date | Units Granted | Grant-Date Fair Value per Award | ||||||||
| Restricted Stock Units Vesting 25% per year through February 6, 2019 | February 6, 2015 | 20,900 | $ | 31.675 | ||||||
| Restricted Stock Units Vesting 100% on February 6, 2020 | February 6, 2015 | 6,400 | $ | 31.675 | ||||||
| Restricted Stock Units Vesting 25% per year through February 6, 2019 | April 13, 2015 | 1,800 | $ | 31.775 | ||||||
The vesting of restricted stock units is accelerated in the event of a change in control, disability, death or retirement or, subject to proration on retirement in certain cases. All restricted stock units granted to executive officers are eligible to receive cash payments equal to the amount of dividends or cash distributions that would have been paid on the shares covered by unvested restricted stock awards, subject to forfeiture under the terms of the restricted stock unit award agreements. The grant-date fair value of each restricted stock unit granted to executive officers was the average of the high and low market price per share on the dates of grant.
Presented below is a summary of the status of restricted stock unit awards granted to executive officers for the year ended December 31, 2015:
| Executive Officer Restricted Stock Unit Awards | 2015 | |||||||
| Shares | Weighted Average Grant-Date Fair Value | |||||||
| Nonvested, Beginning of Year | — | |||||||
| Granted | 29,100 | $ | 31.681 | |||||
| Awards Vested | 4,800 | 31.675 | ||||||
| Forfeited | — | — | ||||||
| Nonvested, End of Year | 24,300 | 31.682 | ||||||
| Compensation Expense Recognized | $ | 452,000 | ||||||
| Fair Value of Awards Vested | 152,000 | |||||||
| 93 |
Restricted Stock Units Granted to Employees
In 2015 the following restricted stock unit awards under the 2014 Incentive Plan were granted to key employees of the Company who are not executive officers:
| Grant Date | Units Granted | Grant-Date Fair Value per Award | ||||||||
| Restricted Stock Units Vesting 100% on April 8, 2019 | April 13, 2015 | 11,900 | $ | 27.05 | ||||||
| Restricted Stock Units Vesting 100% on September 1, 2019 | September 30, 2015 | 3,000 | $ | 22.08 | ||||||
| Restricted Stock Units Vesting 100% on April 8, 2019 | December 10, 2015 | 750 | $ | 22.72 | ||||||
The grant-date fair value of each restricted stock unit was based on the average of the high and low market price of the Company’s common stock on the date of grant, discounted for the value of the dividend exclusion over the four-year vesting period. Under the terms of the restricted stock unit award agreements, all outstanding (unvested) restricted stock units held by a retiring grantee vest immediately on normal retirement.
Presented below is a summary of the status of employees’ restricted stock unit awards for the years ended December 31:
| Employees’ Restricted Stock Unit Awards | 2015 | 2014 | 2013 | |||||||||||||||||||||
| Restricted Stock Units |
Weighted Average Grant-Date Fair Value |
Restricted Stock Units |
Weighted Average Grant-Date Fair Value |
Restricted Stock Units |
Weighted Average Grant-Date Fair Value |
|||||||||||||||||||
| Nonvested, Beginning of Year | 45,900 | $ | 21.82 | 56,180 | $ | 19.79 | 60,665 | $ | 18.11 | |||||||||||||||
| Granted | 15,650 | 25.89 | 11,800 | 24.95 | 15,150 | 25.30 | ||||||||||||||||||
| Reinstated | — | 75 | 30.81 | — | ||||||||||||||||||||
| Vested | 12,250 | 19.46 | 14,305 | 18.05 | 17,535 | 18.73 | ||||||||||||||||||
| Forfeited | 2,700 | 22.84 | 7,850 | 18.90 | 2,100 | 19.88 | ||||||||||||||||||
| Nonvested, End of Year | 46,600 | 23.75 | 45,900 | 21.82 | 56,180 | 19.79 | ||||||||||||||||||
| Compensation Expense Recognized | $ | 304,000 | $ | 194,000 | $ | 275,000 | ||||||||||||||||||
| Fair Value of Awards Vested | 238,000 | 258,000 | 328,000 | |||||||||||||||||||||
Stock Performance Awards granted to Executive Officers
Stock performance award agreements have been granted under the 1999 Incentive Plan and the 2014 Incentive Plan for the Company’s executive officers. Under these agreements, the officers could be awarded shares of the Company’s common stock based on the Company’s total shareholder return relative to that of its peer group of companies in the Edison Electric Institute (EEI) Index over a three-year period beginning on January 1 of the year the awards are granted. Awards granted in 2015 also included a performance incentive based on the Company’s average 3-year adjusted return on equity relative to a targeted average 3-year adjusted return on equity. The number of shares earned, if any, will be awarded and issued at the end of each three-year performance measurement period. The participants have no voting or dividend rights under these award agreements until the shares are issued at the end of the performance measurement period. The terms of the outstanding awards dictate that these awards be classified and accounted for as liability awards, in accordance with the requirements of ASC 718, with compensation measured over the performance period based on the fair value of the award at the end of each reporting period subsequent to the grant date.
On February 6, 2015 performance share awards were granted to the Company’s executive officers under the 2014 Incentive Plan for the 2015-2017 performance measurement period. Under the 2015 performance share award agreements the aggregate award for performance at target is 84,300 shares. For target performance the Company’s executive officers would earn an aggregate of 56,200 common shares based on the Company’s total shareholder return relative to the total shareholder return of the companies that comprise the EEI Index over the performance measurement period of January 1, 2015 through December 31, 2017. The Company’s executive officers would also earn an aggregate of 28,100 common shares for achieving the target set for the Company’s 3-year average adjusted return on equity. Actual payment may range from zero to 150% of the target amount, or up to 126,450 common shares.
Under the 2015 performance award agreements, payment and the amount of payment in the event of retirement, resignation for good reason or involuntary termination without cause is to be made at the end of the performance period based on actual performance, subject to proration in certain cases, except that the payment of performance awards granted to certain officers who are parties to executive employment agreements with the Company is to be made at the target amount at the date of any such event. The vesting of these performance award agreements is accelerated and paid at target in the event of a change in control, disability or death (and upon retirement at or after age 62 for certain officers who are parties to executive employment agreements with the Company).
| 94 |
The table below provides a summary of stock performance awards granted and amounts expensed related to the stock performance awards:
| Performance Period | Maximum Shares Subject To Award | Shares Used To Estimate Expense | Expense Recognized in the Year Ended December 31, | Earned Shares | ||||||||||||||||||||
| 2015 | 2014 | 2013 | ||||||||||||||||||||||
| 2015-2017 | 126,450 | 84,300 | $ | 943,000 | ||||||||||||||||||||
| 2014-2016 | 159,450 | 106,300 | (64,000 | ) | $ | 1,422,000 | 32,200 | |||||||||||||||||
| 2013-2015 | 90,600 | 45,300 | (445,000 | ) | 458,000 | $ | 580,000 | 22,500 | ||||||||||||||||
| 2012-2014 | 148,400 | 74,200 | — | 142,000 | 1,686,000 | 89,991 | ||||||||||||||||||
| 2011-2013 | 90,600 | 45,300 | — | — | 412,000 | 48,730 | ||||||||||||||||||
| Total | $ | 434,000 | $ | 2,022,000 | $ | 2,678,000 | 193,421 | |||||||||||||||||
Stock-based payment expense recognized in 2015 for the 2015-2017 performance awards reflects the accelerated recognition of expense for outstanding and unvested awards of executives who are eligible for retirement and whose awards vest on normal retirement, as defined in the performance award agreements, prior to the vesting dates of the awards.
In connection with the resignation of executive officers in May 2014 and March 2012, the following unvested stock performance awards were forfeited: 8,900 granted in 2014, 4,900 granted in 2013, 6,600 granted in 2012 and 3,300 granted in 2011.
The earned shares shown in the table above for the 2014-2016 and 2013-2015 performance periods reflect shares that vested on normal retirement of the Company’s former CEO on July 1, 2015. The issuance and distribution of Otter Tail Corporation common shares was deferred 180 days in accordance with internal revenue code requirements applicable to nonqualified deferred compensation plans. The earned shares were issued in 2016 at a value of $26.35 per share or $1,441,000.
The earned shares shown in the table above for the 2012-2014 performance period reflect shares received in 2015 by active participants in the plan on December 31, 2014, based on the Company achieving a total shareholder return ranking of 21 out of 48 companies in its EEI peer group and a resulting payout at 121.28% of target.
The earned shares shown in the table above for the 2011-2013 performance period include shares received in 2014 by active participants in the plan on December 31, 2013, based on the Company achieving a total shareholder return ranking of 22 out of 49 companies in its EEI peer group and a resulting payout at 117.86% of target. The earned shares shown in the table above for the 2011-2013 performance period also include 26,100 shares received by a participant under an executive employment agreement on resignation in 2011.
As of December 31, 2015 the total remaining unrecognized amount of compensation expense related to stock-based compensation for all of the Company’s stock-based payment programs was approximately $2.9 million (before income taxes), which will be amortized over a weighted average period of 2.4 years.
8. Retained Earnings and Dividend Restriction
The Company is a holding company with no significant operations of its own. The primary source of funds for payments of dividends to the Company’s shareholders is from dividends paid or distributions made by the Company’s subsidiaries. As a result of certain statutory limitations or regulatory or financing agreements, restrictions could occur on the amount of distributions allowed to be made by the Company’s subsidiaries.
Both the Company and OTP credit agreements contain restrictions on the payment of cash dividends upon a default or event of default. An event of default would be considered to have occurred if the Company did not meet certain financial covenants. As of December 31, 2015 the Company was in compliance with the debt covenants. See note 10 to consolidated financial statements for further information on the covenants.
Under the Federal Power Act, a public utility may not pay dividends from any funds properly included in a capital account. What constitutes “funds properly included in a capital account” is undefined in the Federal Power Act or the related regulations; however, FERC has consistently interpreted the provision to allow dividends to be paid as long as (1) the source of the dividends is clearly disclosed, (2) the dividend is not excessive and (3) there is no self-dealing on the part of corporate officials.
The MPUC indirectly limits the amount of dividends OTP can pay to the Company by requiring an equity-to-total-capitalization ratio between 46.9% and 57.3%. OTP’s equity to total capitalization ratio including short-term debt was 51.6% as of December 31, 2015. Total capitalization for OTP cannot currently exceed $1,056,300,000.
| 95 |
9. Commitments and Contingencies of Continuing Operations
Construction and Other Purchase Commitments
At December 31, 2015 OTP had commitments under contracts, including its share of construction program commitments extending into 2019, of approximately $89.6 million.
Electric Utility Capacity and Energy Requirements and Coal and Delivery Contracts
OTP has commitments for the purchase of capacity and energy requirements under agreements extending into 2040. OTP has contracts providing for the purchase and delivery of a significant portion of its current coal requirements. OTP’s current coal purchase agreements, under which OTP is committed to the minimum purchase amounts or to make payments in lieu thereof, expire in 2016, 2017 and 2040. In January 2016, OTP entered into an agreement with Cloud Peak Energy Resources LLC for the purchase of subbituminous coal for Hoot Lake Plant for the period of January 1, 2016 through December 31, 2023. OTP has no fixed minimum purchase requirements under the agreement but all of Hoot Lake Plant’s coal requirements for the period covered must be purchased under this agreement. The dollar amounts of OTP’s estimated purchase requirements under this agreement are excluded from the table below because OTP has not committed to any purchases under the agreement. Fuel clause adjustment mechanisms lessen the risk of loss from market price changes because they provide for recovery of most fuel costs. See table below for schedule of commitments.
Operating Leases
OTP has obligations to make future operating lease payments primarily related to land leases and coal rail-car leases. The Company’s nonelectric companies have obligations to make future operating lease payments primarily related to leases of buildings and manufacturing equipment. Rent expense from continuing operations was $6,447,000, $10,165,000 and $8,560,000 for 2015, 2014 and 2013, respectively.
The amounts of the Company’s construction program and other commitments and commitments under capacity and energy agreements, coal and coal delivery contracts and operating leases for continuing operations as of December 31, 2015, are as follows:
| Construction Program and Other Commitments | Capacity and Energy Requirements | Coal and Freight Purchase Commitments | |||||||||||||||||||||||
| Operating Leases | |||||||||||||||||||||||||
| (in thousands) | OTP | Nonelectric | Total | ||||||||||||||||||||||
| 2016 | $ | 56,683 | $ | 22,821 | $ | 47,821 | $ | 2,485 | $ | 4,475 | $ | 6,960 | |||||||||||||
| 2017 | 27,325 | 22,146 | 31,797 | 1,913 | 3,743 | 5,656 | |||||||||||||||||||
| 2018 | 5,586 | 22,753 | 22,733 | 1,220 | 3,167 | 4,387 | |||||||||||||||||||
| 2019 | 46 | 24,555 | 21,965 | 997 | 2,426 | 3,423 | |||||||||||||||||||
| 2020 | — | 25,401 | 24,482 | 1,009 | 2,256 | 3,265 | |||||||||||||||||||
| Beyond 2020 | — | 193,536 | 574,808 | 9,824 | 8,983 | 18,807 | |||||||||||||||||||
| Total | $ | 89,640 | $ | 311,212 | $ | 723,606 | $ | 17,448 | $ | 25,050 | $ | 42,498 | |||||||||||||
Contingencies
Contingencies, by their nature, relate to uncertainties that require the Company’s management to exercise judgment both in assessing the likelihood a liability has been incurred as well as in estimating the amount of potential loss. The most significant contingencies impacting the Company’s consolidated financial statements are those related to environmental remediation, risks associated with indemnification obligations under divestitures of discontinued operations and litigation matters. Should all of these known items result in liabilities being incurred, the loss could be as high as $2.4 million.
Based on a potential reduction by the FERC in the ROE component of the MISO Tariff, OTP has recorded a $1.1 million liability on its balance sheet as of December 31, 2015, representing OTP’s best estimate of a refund obligation, net of amounts that would be subject to recovery under state jurisdictional TCR riders.
In 2014, the EPA published proposed standards of performance for CO2 emissions from new fossil fuel-fired power plants, proposed CO2 emission guidelines for existing fossil fuel-fired power plants and proposed CO2 standards of performance for CO2 emissions from reconstructed and modified fossil fuel-fired power plants, essentially requiring that such plants install updated control technology when constructing, modifying or reconstructing to reduce their emissions. The EPA published final rules for each of these proposals on October 23, 2015. On February 9, 2016 the U.S. Supreme Court granted a stay of the CO2 emission guidelines for existing fossil fuel-fired power plants, pending disposition of petitions for review in the D.C. Circuit and disposition of a petition for a writ of certiorari seeking review by the U.S. Supreme Court, if such a writ is sought. The rules are subject to pending judicial challenges, and consequently, uncertainty regarding the status of the rules will likely continue for some time. OTP is currently assessing the potential impact of these rules on existing affected sources of CO2 emissions at OTP.
| 96 |
Other
The Company is a party to litigation and regulatory enforcement matters arising in the normal course of business. The Company regularly analyzes current information and, as necessary, provides accruals for liabilities that are probable of occurring and that can be reasonably estimated. The Company believes the effect on its consolidated results of operations, financial position and cash flows, if any, for the disposition of all matters pending as of December 31, 2015 will not be material.
10. Short-Term and Long-Term Borrowings and Preferred Stock Redemption
Short-Term Debt
The following table presents the status of the Company’s lines of credit as of December 31, 2015 and December 31, 2014:
| (in thousands) | Line Limit | In Use on December 31, 2015 | Restricted due to Outstanding Letters of Credit | Available on December 31, 2015 | Available on December 31, 2014 | |||||||||||||||
| Otter Tail Corporation Credit Agreement | $ | 150,000 | $ | 59,666 | $ | — | $ | 90,334 | $ | 138,872 | ||||||||||
| OTP Credit Agreement | 170,000 | 21,006 | 300 | 148,694 | 169,440 | |||||||||||||||
| Total | $ | 320,000 | $ | 80,672 | $ | 300 | $ | 239,028 | $ | 308,312 | ||||||||||
Under the Otter Tail Corporation Credit Agreement (as defined below), the maximum amount of debt outstanding in 2015 was $80,160,000 on September 15, 2015 and the average daily balance of debt outstanding during 2015 was $42,453,000. The weighted average interest rate paid on debt outstanding under the Otter Tail Corporation Credit Agreement during 2015 was 2.0% compared with 1.9% in 2014. Under the OTP Credit Agreement (as defined below), the maximum amount of debt outstanding in 2015 was $22,864,000 on December 15, 2015 and the average daily balance of debt outstanding during 2015 was $7,876,000. The weighted average interest rate paid on debt outstanding under the OTP Credit Agreement during 2015 was 1.5% compared with 1.4% in 2014. The weighted average interest rate on consolidated short-term debt outstanding on December 31, 2015 was 1.9%.
On October 29, 2012 the Company entered into a Third Amended and Restated Credit Agreement (the Otter Tail Corporation Credit Agreement), which is an unsecured $150 million revolving credit facility that may be increased to $250 million on the terms and subject to the conditions described in the Otter Tail Corporation Credit Agreement. On October 29, 2015 the Otter Tail Corporation Credit Agreement was amended to extend its expiration date by one year from October 29, 2019 to October 29, 2020. The Company can draw on this credit facility to refinance certain indebtedness and support its operations and the operations of its subsidiaries. Borrowings under the Otter Tail Corporation Credit Agreement bear interest at LIBOR plus 1.75%, subject to adjustment based on the Company’s senior unsecured credit ratings. The Company is required to pay commitment fees based on the average daily unused amount available to be drawn under the revolving credit facility. The Otter Tail Corporation Credit Agreement contains a number of restrictions on the Company and the businesses of Varistar and its subsidiaries, including restrictions on the Company’s and Varistar’s ability to merge, sell assets, make investments, create or incur liens on assets, guarantee the obligations of certain other parties and engage in transactions with related parties. The Otter Tail Corporation Credit Agreement also contains affirmative covenants and events of default, and financial covenants as described below under the heading “Financial Covenants.” The Otter Tail Corporation Credit Agreement does not include provisions for the termination of the agreement or the acceleration of repayment of amounts outstanding due to changes in the Company’s credit ratings. The Company’s obligations under the Otter Tail Corporation Credit Agreement are guaranteed by certain of the Company’s subsidiaries. Outstanding letters of credit issued by the Company under the Otter Tail Corporation Credit Agreement can reduce the amount available for borrowing under the line by up to $40 million.
On October 29, 2012 OTP entered into a Second Amended and Restated Credit Agreement (the OTP Credit Agreement), providing for an unsecured $170 million revolving credit facility that may be increased to $250 million on the terms and subject to the conditions described in the OTP Credit Agreement. On October 29, 2015 the OTP Credit Agreement was amended to extend its expiration date by one year from October 29, 2019 to October 29, 2020. OTP can draw on this credit facility to support the working capital needs and other capital requirements of its operations, including letters of credit in an aggregate amount not to exceed $50 million outstanding at any time. Borrowings under this line of credit bear interest at LIBOR plus 1.25%, subject to adjustment based on the ratings of OTP’s senior unsecured debt. OTP is required to pay commitment fees based on the average daily unused amount available to be drawn under the revolving credit facility. The OTP Credit Agreement contains a number of restrictions on the business of OTP, including restrictions on its ability to merge, sell assets, make investments, create or incur liens on assets, guarantee the obligations of any other party, and engage in transactions with related parties. The OTP Credit Agreement also contains affirmative covenants and events of default, and financial covenants as described below under the heading “Financial Covenants.” The OTP Credit Agreement does not include provisions for the termination of the agreement or the acceleration of repayment of amounts outstanding due to changes in OTP’s credit ratings. OTP’s obligations under the OTP Credit Agreement are not guaranteed by any other party.
| 97 |
Long-Term Debt Retirements, Preferred Stock Redemption and Debt Issuances
Debt Retirements and Preferred Stock Redemption
On March 1, 2013 OTP entered into a Credit Agreement (the Loan Agreement) with JPMorgan Chase Bank, N.A. (JPMorgan) providing for a $40.9 million unsecured term loan (the Term Loan) to OTP originally due on June 1, 2014, which was fully drawn on March 1, 2013. The Loan Agreement was amended on October 29, 2013 to extend the due date on the Term Loan to January 15, 2015. Borrowings under the Loan Agreement bore interest at LIBOR plus 0.875%. On March 1, 2013 OTP utilized approximately $25.1 million of Term Loan proceeds to fund the redemption price for all of the 4.65% Grant County, South Dakota Pollution Control Refunding Revenue Bonds and 4.85% Mercer County, North Dakota Pollution Control Refunding Revenue Bonds outstanding on that date, in each case for which OTP paid debt service. All such bonds had been called for redemption in full on March 1, 2013. Also on March 1, 2013, OTP utilized approximately $15.7 million of Term Loan proceeds to satisfy an intercompany note to the Company that had a balance and interest rate designed to equate to the balances and dividend rates of the Company’s cumulative preferred shares. Those cumulative preferred shares were redeemed on March 1, 2013 for $15.7 million, including $0.2 million in call premiums charged to equity and included with preferred dividends paid and as part of the Company’s preferred dividend requirement for the year ended December 31, 2013. On February 27, 2014 OTP used a portion of the proceeds from the issuance of notes under the 2013 Note Purchase Agreement (as defined below) to retire early the Term Loan.
On November 6 and 25, 2013 the Company purchased, in two separate transactions, $12,933,000 and $34,737,000, respectively, of its outstanding 9.000% notes due 2016 (the 2016 Notes), originally issued in the aggregate principal amount of $100 million. The purchased 2016 Notes were subsequently retired and are no longer outstanding. The remaining $52,330,000 principal amount of 2016 Notes outstanding, unless redeemed early or otherwise repaid, will mature and become due and payable on December 15, 2016. The price paid for the purchased 2016 Notes was $59,404,000, which includes the principal amount of the purchased 2016 Notes, plus accrued interest of $1,845,000 through the respective purchase dates and a negotiated premium of $9,889,000 (which is less than the premium the Company would have been required to pay to redeem them under the terms of the 2016 Notes). The Company used cash on hand to fund the purchase of the purchased 2016 Notes. The amount of the debt retired as a result of these transactions is approximately equivalent to the remaining amount of debt that was associated with the operating companies the Company divested over the last two years. On repayment, $363,000 in unamortized debt expense related to the 2016 Notes was immediately recognized as expense along with the $9,889,000 negotiated premium which, in total, reduced diluted earnings per share by $0.17 in 2013.
2013 Note Purchase Agreement
On August 14, 2013 OTP entered into a Note Purchase Agreement (the 2013 Note Purchase Agreement) pursuant to which OTP has agreed to issue to the purchasers named therein, in a private placement transaction, $60 million aggregate principal amount of OTP’s 4.68% Series A Senior Unsecured Notes due February 27, 2029 (the Series A Notes) and $90 million aggregate principal amount of OTP’s 5.47% Series B Senior Unsecured Notes due February 27, 2044 (the Series B Notes and, together with the Series A Notes, the Notes). The Notes were issued on February 27, 2014. OTP used a portion of the proceeds of the Notes to retire early the Term Loan as discussed above and to repay OTP’s short-term debt outstanding on February 27, 2014. The remaining proceeds of the Notes were used to pay fees and expenses related to the issuance of the Notes and for other general purposes, including construction program expenditures.
The 2013 Note Purchase Agreement states that OTP may prepay all or any part of the Notes (in an amount not less than 10% of the aggregate principal amount of the Notes then outstanding in the case of a partial prepayment) at 100% of the principal amount prepaid, together with accrued interest and a make-whole amount, provided that if no default or event of default under the 2013 Note Purchase Agreement exists, any optional prepayment made by OTP of (i) all of the Series A Notes then outstanding on or after November 27, 2028 or (ii) all of the Series B Notes then outstanding on or after November 27, 2043, will be made at 100% of the principal prepaid but without any make-whole amount. In addition, the 2013 Note Purchase Agreement states OTP must offer to prepay all of the outstanding Notes at 100% of the principal amount together with unpaid accrued interest in the event of a change of control of OTP.
The 2013 Note Purchase Agreement contains a number of restrictions on the business of OTP, including restrictions on OTP’s ability to merge, sell assets, create or incur liens on assets, guarantee the obligations of any other party, and engage in transactions with related parties. The 2013 Note Purchase Agreement also contains affirmative covenants and events of default, as well as certain financial covenants as described below under the heading “Financial Covenants.” The 2013 Note Purchase Agreement does not include provisions for the termination of the agreement or the acceleration of repayment of amounts outstanding due to changes in OTP’s credit ratings. The 2013 Note Purchase Agreement includes a “most favored lender” provision generally requiring that in the event OTP’s existing credit agreement or any renewal, extension or replacement thereof, at any time contains any financial covenant or other provision providing for limitations on interest expense and such a covenant is not contained in the 2013 Note Purchase Agreement under substantially similar terms or would be more beneficial to the holders of the Notes than any analogous provision contained in the 2013 Note Purchase
| 98 |
Agreement (an “Additional Covenant”), then unless waived by the Required Holders (as defined in the 2013 Note Purchase Agreement), the Additional Covenant will be deemed to be incorporated into the 2013 Note Purchase Agreement. The 2013 Note Purchase Agreement also provides for the amendment, modification or deletion of an Additional Covenant if such Additional Covenant is amended or modified under or deleted from the OTP credit agreement, provided that no default or event of default has occurred and is continuing.
2007 and 2011 Note Purchase Agreements
On December 1, 2011, OTP issued $140 million aggregate principal amount of its 4.63% Senior Unsecured Notes due December 1, 2021 pursuant to a Note Purchase Agreement dated as of July 29, 2011 (the 2011 Note Purchase Agreement). OTP also has outstanding its $155 million senior unsecured notes issued in four series consisting of $33 million aggregate principal amount of 5.95% Senior Unsecured Notes, Series A, due 2017; $30 million aggregate principal amount of 6.15% Senior Unsecured Notes, Series B, due 2022; $42 million aggregate principal amount of 6.37% Senior Unsecured Notes, Series C, due 2027; and $50 million aggregate principal amount of 6.47% Senior Unsecured Notes, Series D, due 2037 (collectively, the 2007 Notes). The 2007 Notes were issued pursuant to a Note Purchase Agreement dated as of August 20, 2007 (the 2007 Note Purchase Agreement).
The 2011 Note Purchase Agreement and the 2007 Note Purchase Agreement each states that OTP may prepay all or any part of the notes issued thereunder (in an amount not less than 10% of the aggregate principal amount of the notes then outstanding in the case of a partial prepayment) at 100% of the principal amount prepaid, together with accrued interest and a make-whole amount. The 2011 Note Purchase Agreement states in the event of a transfer of utility assets put event, the noteholders thereunder have the right to require OTP to repurchase the notes held by them in full, together with accrued interest and a make-whole amount, on the terms and conditions specified in the 2011 Note Purchase Agreement. The 2011 Note Purchase Agreement and the 2007 Note Purchase Agreement each also states that OTP must offer to prepay all of the outstanding notes issued thereunder at 100% of the principal amount together with unpaid accrued interest in the event of a change of control of OTP. The note purchase agreements contain a number of restrictions on OTP, including restrictions on OTP’s ability to merge, sell assets, create or incur liens on assets, guarantee the obligations of any other party, and engage in transactions with related parties. The note purchase agreements also include affirmative covenants and events of default, and certain financial covenants as described below under the heading “Financial Covenants.”
Shelf Registration
On May 11, 2015 the Company filed a shelf registration statement with the SEC under which the Company may offer for sale, from time to time, either separately or together in any combination, equity, debt or other securities described in the shelf registration statement, which expires on May 11, 2018. A similar shelf registration statement filed with the SEC on May 11, 2012, expired on May 11, 2015.
The following tables provide a breakdown of the assignment of the Company’s consolidated short-term and long-term debt outstanding as of December 31, 2015 and December 31, 2014:
| December 31, 2015 (in thousands) | OTP | Otter Tail Corporation | Otter Tail Corporation Consolidated | |||||||||
| Short-Term Debt | $ | 21,006 | $ | 59,666 | $ | 80,672 | ||||||
| Long-Term Debt: | ||||||||||||
| 9.000% Notes, due December 15, 2016 | $ | 52,330 | $ | 52,330 | ||||||||
| Senior Unsecured Notes 5.95%, Series A, due August 20, 2017 | $ | 33,000 | 33,000 | |||||||||
| Senior Unsecured Notes 4.63%, due December 1, 2021 | 140,000 | 140,000 | ||||||||||
| Senior Unsecured Notes 6.15%, Series B, due August 20, 2022 | 30,000 | 30,000 | ||||||||||
| Senior Unsecured Notes 6.37%, Series C, due August 20, 2027 | 42,000 | 42,000 | ||||||||||
| Senior Unsecured Notes 4.68%, Series A, due February 27, 2029 | 60,000 | 60,000 | ||||||||||
| Senior Unsecured Notes 6.47%, Series D, due August 20, 2037 | 50,000 | 50,000 | ||||||||||
| Senior Unsecured Notes 5.47%, Series B, due February 27, 2044 | 90,000 | 90,000 | ||||||||||
| North Dakota Development Note, 3.95%, due April 1, 2018 | 182 | 182 | ||||||||||
| Partnership in Assisting Community Expansion (PACE) Note, 2.54%, due March 18, 2021 | 977 | 977 | ||||||||||
| Total | $ | 445,000 | $ | 53,489 | $ | 498,489 | ||||||
| Less: Current Maturities | 52,544 | 52,544 | ||||||||||
| Total Long-Term Debt | $ | 445,000 | $ | 945 | $ | 445,945 | ||||||
| Total Short-Term and Long-Term Debt (with current maturities) | $ | 466,006 | $ | 113,155 | $ | 579,161 | ||||||
| 99 |
| December 31, 2014 (in thousands) | OTP | Otter Tail Corporation | Otter Tail Corporation Consolidated | |||||||||
| Short-Term Debt | $ | — | $ | 10,854 | $ | 10,854 | ||||||
| Long-Term Debt: | ||||||||||||
| 9.000% Notes, due December 15, 2016 | $ | 52,330 | $ | 52,330 | ||||||||
| Senior Unsecured Notes 5.95%, Series A, due August 20, 2017 | $ | 33,000 | 33,000 | |||||||||
| Senior Unsecured Notes 4.63%, due December 1, 2021 | 140,000 | 140,000 | ||||||||||
| Senior Unsecured Notes 6.15%, Series B, due August 20, 2022 | 30,000 | 30,000 | ||||||||||
| Senior Unsecured Notes 6.37%, Series C, due August 20, 2027 | 42,000 | 42,000 | ||||||||||
| Senior Unsecured Notes 4.68%, Series A, due February 27, 2029 | 60,000 | 60,000 | ||||||||||
| Senior Unsecured Notes 6.47%, Series D, due August 20, 2037 | 50,000 | 50,000 | ||||||||||
| Senior Unsecured Notes 5.47%, Series B, due February 27, 2044 | 90,000 | 90,000 | ||||||||||
| North Dakota Development Note, 3.95%, due April 1, 2018 | 256 | 256 | ||||||||||
| PACE Note, 2.54%, due March 18, 2021 | 1,105 | 1,105 | ||||||||||
| Total | $ | 445,000 | $ | 53,691 | $ | 498,691 | ||||||
| Less: Current Maturities | 201 | 201 | ||||||||||
| Unamortized Debt Discount | 1 | 1 | ||||||||||
| Total Long-Term Debt | $ | 445,000 | $ | 53,489 | $ | 498,489 | ||||||
| Total Short-Term and Long-Term Debt (with current maturities) | $ | 445,000 | $ | 64,544 | $ | 509,544 | ||||||
The aggregate amounts of maturities on bonds outstanding and other long-term obligations at December 31, 2015 for each of the next five years are:
| (in thousands) | 2016 | 2017 | 2018 | 2019 | 2020 | |||||||||||||||
| Aggregate Amounts of Debt Maturities | $ | 52,544 | $ | 33,228 | $ | 187 | $ | 172 | $ | 185 | ||||||||||
Financial Covenants
The Company and OTP were in compliance with the financial covenants in their debt agreements as of December 31, 2015.
No Credit or Note Purchase Agreement contains any provisions that would trigger an acceleration of the related debt as a result of changes in the credit rating levels assigned to the related obligor by rating agencies.
The Company’s and OTP’s borrowing agreements are subject to certain financial covenants. Specifically:
| · | Under the Otter Tail Corporation Credit Agreement, the Company may not permit the ratio of its Interest-bearing Debt to Total Capitalization to be greater than 0.60 to 1.00 or permit its Interest and Dividend Coverage Ratio to be less than 1.50 to 1.00 (each measured on a consolidated basis), as provided in the Otter Tail Corporation Credit Agreement. | |
| · | Under the OTP Credit Agreement and the Loan Agreement (when in effect), OTP may not permit the ratio of its Interest-bearing Debt to Total Capitalization to be greater than 0.60 to 1.00. | |
| · | Under the 2007 Note Purchase Agreement and 2011 Note Purchase Agreement, OTP may not permit the ratio of its Consolidated Debt to Total Capitalization to be greater than 0.60 to 1.00 or permit its Interest and Dividend Coverage Ratio to be less than 1.50 to 1.00, in each case as provided in the related borrowing agreement, and OTP may not permit its Priority Debt to exceed 20% of its Total Capitalization, as provided in the related agreement. | |
| · | Under the 2013 Note Purchase Agreement, OTP may not permit its Interest-bearing Debt to exceed 60% of Total Capitalization and may not permit its Priority Indebtedness to exceed 20% of its Total Capitalization, each as provided in the 2013 Note Purchase Agreement. |
| 100 |
11. Pension Plan and Other Postretirement Benefits
Pension Plan
The Company's noncontributory funded pension plan covers substantially all corporate employees and OTP nonunion employees hired prior to January 1, 2006, and all union employees of OTP hired prior to November 1, 2013, excluding Coyote Station employees. Coyote Station employees hired before January 1, 2009 are covered under the plan. The plan provides 100% vesting after five vesting years of service and for retirement compensation at age 65, with reduced compensation in cases of retirement prior to age 62. The Company reserves the right to discontinue the plan but no change or discontinuance may affect the pensions theretofore vested.
The pension plan has a trustee who is responsible for pension payments to retirees and a separate pension fund manager responsible for managing the plan's assets. An independent actuary assists the Company in performing the necessary actuarial valuations for the plan.
The plan assets consist of common stock and bonds of public companies, U.S. government securities, cash and cash equivalents and alternative investments. None of the plan assets are invested in common stock or debt securities of the Company.
Components of net periodic pension benefit cost:
| (in thousands) | 2015 | 2014 | 2013 | |||||||||
| Service Cost–Benefit Earned During the Period | $ | 6,059 | $ | 4,666 | $ | 5,594 | ||||||
| Interest Cost on Projected Benefit Obligation | 13,344 | 13,111 | 12,123 | |||||||||
| Expected Return on Assets | (18,383 | ) | (16,743 | ) | (14,521 | ) | ||||||
| Amortization of Prior Service Cost: | ||||||||||||
| From Regulatory Asset | 188 | 257 | 333 | |||||||||
| From Other Comprehensive Income1 | 5 | 7 | 9 | |||||||||
| Amortization of Net Actuarial Loss: | ||||||||||||
| From Regulatory Asset | 6,676 | 3,400 | 6,600 | |||||||||
| From Other Comprehensive Income1 | 171 | 83 | 176 | |||||||||
| Net Periodic Pension Cost | $ | 8,060 | $ | 4,781 | $ | 10,314 | ||||||
| 1Corporate cost included in Other Nonelectric Expenses. | ||||||||||||
Weighted average assumptions used to determine net periodic pension cost for the year ended December 31:
| 2015 | 2014 | 2013 | ||||||||||
| Discount Rate | 4.35 | % | 5.30 | % | 4.50 | % | ||||||
| Long-Term Rate of Return on Plan Assets | 7.75 | % | 7.75 | % | 7.75 | % | ||||||
| Rate of Increase in Future Compensation Level | 3.13 | % | 3.13 | % | 3.13 | % | ||||||
The following table presents amounts recognized in the consolidated balance sheets as of December 31:
| (in thousands) | 2015 | 2014 | ||||||
| Regulatory Assets: | ||||||||
| Unrecognized Prior Service Cost | $ | 329 | $ | 518 | ||||
| Unrecognized Actuarial Loss | 101,974 | 97,722 | ||||||
| Total Regulatory Assets | $ | 102,303 | $ | 98,240 | ||||
| Accumulated Other Comprehensive Loss: | ||||||||
| Unrecognized Prior Service Cost | $ | 16 | $ | 21 | ||||
| Unrecognized Actuarial Loss | 820 | 899 | ||||||
| Total Accumulated Other Comprehensive Loss | $ | 836 | $ | 920 | ||||
| Noncurrent Liability | $ | 69,101 | $ | 67,061 | ||||
Funded status as of December 31:
| (in thousands) | 2015 | 2014 | ||||||
| Accumulated Benefit Obligation | $ | (268,387 | ) | $ | (273,903 | ) | ||
| Projected Benefit Obligation | $ | (302,740 | ) | $ | (311,650 | ) | ||
| Fair Value of Plan Assets | 233,639 | 244,589 | ||||||
| Funded Status | $ | (69,101 | ) | $ | (67,061 | ) | ||
| 101 |
The following tables provide a reconciliation of the changes in the fair value of plan assets and the plan’s benefit obligations over the two-year period ended December 31, 2015:
| (in thousands) | 2015 | 2014 | ||||||
| Reconciliation of Fair Value of Plan Assets: | ||||||||
| Fair Value of Plan Assets at January 1 | $ | 244,589 | $ | 213,617 | ||||
| Actual Return on Plan Assets | (9,160 | ) | 21,874 | |||||
| Discretionary Company Contributions | 10,000 | 20,000 | ||||||
| Benefit Payments | (11,790 | ) | (10,902 | ) | ||||
| Fair Value of Plan Assets at December 31 | $ | 233,639 | $ | 244,589 | ||||
| Estimated Asset Return | (3.7 | )% | 9.6 | % | ||||
| Reconciliation of Projected Benefit Obligation: | ||||||||
| Projected Benefit Obligation at January 1 | $ | 311,650 | $ | 254,039 | ||||
| Service Cost | 6,059 | 4,666 | ||||||
| Interest Cost | 13,344 | 13,111 | ||||||
| Benefit Payments | (11,790 | ) | (10,902 | ) | ||||
| Actuarial (Gain) Loss | (16,523 | ) | 50,736 | |||||
| Projected Benefit Obligation at December 31 | $ | 302,740 | $ | 311,650 | ||||
Weighted average assumptions used to determine benefit obligations at December 31:
| 2015 | 2014 | |||||||
| Discount Rate | 4.76 | % | 4.35 | % | ||||
| Rate of Increase in Future Compensation Level | 3.13 | % | 3.13 | % | ||||
The assumed rate of return on pension fund assets used for the determination of 2016 net periodic pension cost is 7.75%. The assumed long-term rate of return on plan assets is based primarily on asset category studies using historical market return and volatility data with forward looking estimates based on existing financial market conditions and forecasts of capital markets. Modest excess return expectations versus some market indices are incorporated into the return projections based on the actively managed structure of the investment programs and their records of achieving such returns historically. The Company reviews its rate of return on plan asset assumptions annually. The assumptions are largely based on the asset category rate-of-return assumptions developed annually with the Company’s pension plan investment advisors, as well as input from actuaries who work with the pension plan.
Market-related value of plan assets—The Company’s expected return on plan assets is determined based on the expected long-term rate of return on plan assets and the market-related value of plan assets.
The Company bases actuarial determination of pension plan expense or income on a market-related valuation of assets, which reduces year-to-year volatility. This market-related valuation calculation recognizes investment gains or losses over a five-year period from the year in which they occur. Investment gains or losses for this purpose are the difference between the expected return calculated using the market-related value of assets and the actual return based on the fair value of assets. Since the market-related valuation calculation recognizes gains or losses over a five-year period, the future value of the market-related assets will be impacted as previously deferred gains or losses are recognized.
| Measurement Dates: | 2015 | 2014 | ||||||
| Net Periodic Pension Cost | January 1, 2015 | January 1, 2014 | ||||||
| End of Year Benefit Obligations | January 1, 2015 projected to December 31, 2015 | January 1, 2014 projected to December 31, 2014 | ||||||
| Market Value of Assets | December 31, 2015 | December 31, 2014 |
The estimated amounts of unrecognized net actuarial losses and prior service costs to be amortized from regulatory assets and accumulated other comprehensive loss into the net periodic pension cost in 2016 are:
| (in thousands) | 2016 | |||
| Decrease in Regulatory Assets: | ||||
| Amortization of Unrecognized Prior Service Cost | $ | 189 | ||
| Amortization of Unrecognized Actuarial Loss | 4,908 | |||
| Decrease in Accumulated Other Comprehensive Loss: | ||||
| Amortization of Unrecognized Prior Service Cost | 5 | |||
| Amortization of Unrecognized Actuarial Loss | 126 | |||
| Total Estimated Amortization | $ | 5,228 | ||
| 102 |
Cash flows—The Company had no minimum funding requirement as of December 31, 2015, but made a discretionary plan contribution of $10,000,000 in January 2016.
The following benefit payments, which reflect expected future service, as appropriate, are expected to be paid out from plan assets:
| (in thousands) | 2016 | 2017 | 2018 | 2019 | 2020 | Years 2021-2025 | ||||||||||||||||||
| $ | 12,568 | $ | 13,178 | $ | 13,950 | $ | 14,644 | $ | 15,501 | $ | 88,979 | |||||||||||||
The following objectives guide the investment strategy of the Company’s pension plan (the Plan):
| · | The assets of the Plan will be invested in accordance with all applicable laws in a manner consistent with fiduciary standards including Employee Retirement Income Security Act standards (if applicable). Specifically: |
| o | The safeguards and diversity that a prudent investor would adhere to must be present in the investment program. |
| o | All transactions undertaken on behalf of the Plan must be in the best interest of plan participants and their beneficiaries. |
| · | The primary objective of the Plan is to provide a source of retirement income for its participants and beneficiaries. |
| · | The near-term primary financial objective of the Plan is to improve the funded status of the Plan. |
| · | A secondary financial objective is to minimize pension funding and expense volatility where possible. |
The asset allocation strategy developed by the Company’s Retirement Plans Administration Committee (the Committee) is based on the current needs of the Plan and the objectives listed above. An asset/liability review is conducted annually or as often as necessary to assess the impact of various asset allocations on funded status and other financial variables. The current needs of the Plan, the overall investment objectives above, the investment preferences and risk tolerance of the Committee and the desired degree of diversification suggest the need for an investment allocation including multiple asset classes.
The asset allocation in the table below contains guideline percentages, at market value, of the total Plan invested in various asset classes. The Permitted Range is a guide and will at times not reflect the actual asset allocation as this will be dictated by market conditions, the independent actions of the Committee and/or Investment Managers and required cash flows to and from the Plan. The Permitted Range anticipates this fluctuation and provides flexibility for the Investment Managers’ portfolios to vary around the target without the need for immediate rebalancing. The Investment Manager will proactively monitor the asset allocation and will direct the purchases and sales to remain within the stated ranges.
The policy of the Plan is to invest assets in accordance with the allocations shown below:
| Permitted Range | ||||||||||||||||
| Asset Class / PBO Funded Status | <100% PBO | 100% PBO | 105% PBO | >=110% PBO | ||||||||||||
| Equity | 30% - 65 | % | 25% - 60 | % | 20% - 55 | % | 15% - 50 | % | ||||||||
| Investment Grade Fixed Income | 35% - 75 | % | 40% - 80 | % | 45% - 85 | % | 50% - 90 | % | ||||||||
| Below Investment Grade Fixed Income* | 0% - 15 | % | 0% - 15 | % | 0% - 15 | % | 0% - 15 | % | ||||||||
| Other** | 0% - 20 | % | 0% - 20 | % | 0% - 20 | % | 0% - 20 | % | ||||||||
* Includes (but not limited to) High Yield Bond Fund and Emerging Markets Debt funds.
** Other category may include cash, alternatives, and/or other investment strategies that may be classified other than equity or fixed income, such as the Dynamic Asset Allocation fund.
The Company’s pension plan asset allocations at December 31, 2015 and 2014, by asset category are as follows:
| Asset Allocation | 2015 | 2014 | ||||||
| Large Capitalization Equity Securities | 21.2 | % | 21.0 | % | ||||
| International Equity Securities | 21.6 | % | 18.9 | % | ||||
| Small and Mid-Capitalization Equity Securities | 8.1 | % | 7.9 | % | ||||
| SEI Dynamic Asset Allocation Fund | 5.6 | % | 5.5 | % | ||||
| Equity Securities | 56.5 | % | 53.3 | % | ||||
| Fixed-Income Securities and Cash | 35.8 | % | 42.7 | % | ||||
| Other - SEI Special Situation Collective Investment Trust | 4.1 | % | 4.0 | % | ||||
| Other – SEI Energy Debt Collective Fund | 3.6 | % | — | |||||
| 100.0 | % | 100.0 | % | |||||
| 103 |
In December 2015, the Company adopted the accounting standards updates in ASU 2015-07, which eliminated the requirement to categorize within the fair value hierarchy all investments for which fair value is measured using the NAV practical expedient.
The following table presents the Company’s pension fund assets measured at fair value and included in Level 1 of the fair value hierarchy and assets measured using the NAV practical expedient to fair valuation as of December 31:
| (in thousands) | 2015 | 2014 | ||||||
| Assets in Level 1 of the Fair Value Hierarchy | $ | 215,676 | $ | 234,788 | ||||
| SEI Special Situation Collective Investment Trust Fund at NAV | 9,621 | 9,801 | ||||||
| SEI Energy Debt Fund at NAV | 8,342 | — | ||||||
| Total Assets | $ | 233,639 | $ | 244,589 | ||||
Fair Value Measurements of Pension Fund Assets
ASC 715, Compensation – Retirement Benefits, requires disclosures about pension plan assets identified by the three levels of the fair value hierarchy established by ASC 820-10-35.
The following table presents, the Company’s pension fund assets measured at fair value and included in Level 1 of the fair value hierarchy as of December 31:
| (in thousands) | 2015 | 2014 | ||||||
| Large Capitalization Equity Securities Mutual Fund | $ | 49,513 | $ | 51,404 | ||||
| International Equity Securities Mutual Funds | 50,504 | 46,287 | ||||||
| Small and Mid-Capitalization Equity Securities Mutual Fund | 18,823 | 19,189 | ||||||
| SEI Dynamic Asset Allocation Mutual Fund | 13,004 | 13,543 | ||||||
| Fixed Income Securities Mutual Funds | 83,830 | 104,360 | ||||||
| Cash Management – Money Market Fund | 2 | 5 | ||||||
| Total Assets | $ | 215,676 | $ | 234,788 | ||||
The investments held by the SEI Special Situation Collective Investment Trust on December 31, 2015 and 2014 consisted of investments primarily in hedge funds that pursue alternative strategies, private equity funds and hybrid funds, as well as investments directly in other securities and financial instruments, with the objective of achieving high returns balanced against an appropriate level of volatility and market exposure over a full market cycle. The NAV of the SEI Special Situations Collective Investment Trust is determined by using the fair value of the portfolio as of the close of business at the end of the year. The fair value of the fund is calculated independently by the fund’s administrator and is reviewed by the Company.
The investments held by the SEI Energy Debt Fund on December 31, 2015 consist mainly of below investment grade high yielding bonds and loans of U.S. energy companies which trade at a discount to fair value. Redemptions are allowed semi-annually with a 95-day notice period, subject to fund director consent and certain gate, holdback and suspension restrictions. Subscriptions are allowed monthly with a three-year lock up on subscriptions. The Company invested $10.0 million in the SEI Energy Debt Fund in July 2015. The fund’s assets are valued in accordance with valuations reported by the fund’s sub-advisor or the fund’s underlying investments or other independent third party sources, although SEI in its discretion may use other valuation methods, subject to compliance with ERISA (as applicable). The fund’s assets are valued as of the close of business on the last business day of each calendar month and are available 30 days after the end of a calendar quarter. On an annual basis, as determined by the investment manager in its sole discretion, an independent valuation agent is retained to provide a valuation of the illiquid assets of the fund and of any other asset of the fund, as determined by the investment manager in its sole discretion. The Company reviews and verifies the reasonableness of the year-end valuations.
Executive Survivor and Supplemental Retirement Plan (ESSRP)
The ESSRP is an unfunded, nonqualified benefit plan for executive officers and certain key management employees. The ESSRP provides defined benefit payments to these employees on their retirements for life or to their beneficiaries on their deaths for a 15-year postretirement period. Life insurance carried on certain plan participants is payable to the Company on the employee's death. There are no plan assets in this nonqualified benefit plan due to the nature of the plan.
| 104 |
Components of net periodic pension benefit cost:
| (in thousands) | 2015 | 2014 | 2013 | |||||||||
| Service Cost–Benefit Earned During the Period | $ | 189 | $ | 51 | $ | 51 | ||||||
| Interest Cost on Projected Benefit Obligation | 1,523 | 1,520 | 1,408 | |||||||||
| Amortization of Prior Service Cost: | ||||||||||||
| From Regulatory Asset | 16 | 22 | 22 | |||||||||
| From Other Comprehensive Income1 | 38 | 51 | 51 | |||||||||
| Amortization of Net Actuarial Loss: | ||||||||||||
| From Regulatory Asset | 334 | 142 | 208 | |||||||||
| From Other Comprehensive Income2 | 602 | 46 | 313 | |||||||||
| Net Periodic Pension Cost | $ | 2,702 | $ | 1,832 | $ | 2,053 | ||||||
| 1Amortization of Prior Service Costs from Other Comprehensive Income Charged to: | ||||||||||||
| Electric Operation and Maintenance Expenses | $ | 15 | $ | 20 | $ | 20 | ||||||
| Other Nonelectric Expenses | 23 | 31 | 31 | |||||||||
| 2Amortization of Net Actuarial Loss from Other Comprehensive Income Charged to: | ||||||||||||
| Electric Operation and Maintenance Expenses | $ | 310 | $ | 132 | $ | 193 | ||||||
| Other Nonelectric Expenses | 292 | (86 | ) | 120 | ||||||||
Weighted average assumptions used to determine net periodic pension cost for the year ended December 31:
| 2015 | 2014 | 2013 | ||||||||||
| Discount Rate | 4.35 | % | 5.30 | % | 4.50 | % | ||||||
| Rate of Increase in Future Compensation Level | 3.15 | % | 3.18 | % | 3.19 | % | ||||||
The following table presents amounts recognized in the consolidated balance sheets as of December 31:
| (in thousands) | 2015 | 2014 | ||||||
| Regulatory Assets: | ||||||||
| Unrecognized Prior Service Cost | $ | 75 | $ | 91 | ||||
| Unrecognized Actuarial Loss | 2,936 | 3,238 | ||||||
| Total Regulatory Assets | $ | 3,011 | $ | 3,329 | ||||
| Projected Benefit Obligation Liability – Net Amount Recognized | $ | (35,811 | ) | $ | (35,650 | ) | ||
| Accumulated Other Comprehensive Loss: | ||||||||
| Unrecognized Prior Service Cost | $ | 172 | $ | 210 | ||||
| Unrecognized Actuarial Loss | 5,815 | 6,881 | ||||||
| Total Accumulated Other Comprehensive Loss | $ | 5,987 | $ | 7,091 | ||||
The following tables provide a reconciliation of the changes in the fair value of plan assets and the plan’s projected benefit obligations over the two-year period ended December 31, 2015 and a statement of the funded status as of December 31 of both years:
| (in thousands) | 2015 | 2014 | ||||||
| Reconciliation of Fair Value of Plan Assets: | ||||||||
| Fair Value of Plan Assets at January 1 | $ | — | $ | — | ||||
| Actual Return on Plan Assets | — | — | ||||||
| Employer Contributions | 1,119 | 1,113 | ||||||
| Benefit Payments | (1,119 | ) | (1,113 | ) | ||||
| Fair Value of Plan Assets at December 31 | $ | — | $ | — | ||||
| Reconciliation of Projected Benefit Obligation: | ||||||||
| Projected Benefit Obligation at January 1 | $ | 35,650 | $ | 29,321 | ||||
| Service Cost | 189 | 51 | ||||||
| Interest Cost | 1,523 | 1,520 | ||||||
| Benefit Payments | (1,119 | ) | (1,113 | ) | ||||
| Plan Amendments | — | — | ||||||
| Actuarial (Gain) Loss | (432 | ) | 5,871 | |||||
| Projected Benefit Obligation at December 31 | $ | 35,811 | $ | 35,650 | ||||
| 105 |
Weighted average assumptions used to determine benefit obligations at December 31:
| 2015 | 2014 | |||||||
| Discount Rate | 4.76 | % | 4.35 | % | ||||
| Rate of Increase in Future Compensation Level | 3.13 | % | 3.15 | % | ||||
The estimated amounts of unrecognized net actuarial losses and prior service costs to be amortized from regulatory assets and accumulated other comprehensive loss into the net periodic pension cost for the ESSRP in 2016 are:
| (in thousands) | 2016 | |||
| Decrease in Regulatory Assets: | ||||
| Amortization of Unrecognized Prior Service Cost | $ | 16 | ||
| Amortization of Unrecognized Actuarial Loss | 293 | |||
| Decrease in Accumulated Other Comprehensive Loss: | ||||
| Amortization of Unrecognized Prior Service Cost | 38 | |||
| Amortization of Unrecognized Actuarial Loss | 446 | |||
| Total Estimated Amortization | $ | 793 | ||
Cash flows—The ESSRP is unfunded and has no assets; contributions are equal to the benefits paid to plan participants. The following benefit payments, which reflect future service, as appropriate, are expected to be paid:
| (in thousands) | 2016 | 2017 | 2018 | 2019 | 2020 | Years 2021-2025 | ||||||||||||||||||
| $ | 1,441 | $ | 1,412 | $ | 1,459 | $ | 1,536 | $ | 1,522 | $ | 12,044 | |||||||||||||
Other Postretirement Benefits
The Company provides a portion of health insurance and life insurance benefits for retired OTP and corporate employees. Substantially all of the Company's electric utility and corporate employees may become eligible for health insurance benefits if they reach age 55 and have 10 years of service. There are no plan assets.
Components of net periodic postretirement benefit cost:
| (in thousands) | 2015 | 2014 | 2013 | |||||||||
| Service Cost–Benefit Earned During the Period | $ | 1,297 | $ | 1,055 | $ | 1,421 | ||||||
| Interest Cost on Projected Benefit Obligation | 2,097 | 2,200 | 2,050 | |||||||||
| Amortization of Prior Service Cost | ||||||||||||
| From Regulatory Asset | 205 | 205 | 205 | |||||||||
| From Other Comprehensive Income1 | 5 | 5 | 5 | |||||||||
| Amortization of Net Actuarial Loss | ||||||||||||
| From Regulatory Asset | — | — | 24 | |||||||||
| From Other Comprehensive Income1 | — | — | 1 | |||||||||
| Net Periodic Postretirement Benefit Cost | $ | 3,604 | $ | 3,465 | $ | 3,706 | ||||||
| Effect of Medicare Part D Subsidy | $ | (1,487 | ) | $ | (948 | ) | $ | (1,806 | ) | |||
| 1Corporate cost included in Other Nonelectric Expenses. | ||||||||||||
Weighted average assumptions used to determine net periodic postretirement benefit cost for the year ended December 31:
| 2015 | 2014 | 2013 | ||||||||||
| Discount Rate | 4.20 | % | 5.10 | % | 4.25 | % | ||||||
| 106 |
The following table presents amounts recognized in the consolidated balance sheets as of December 31:
| (in thousands) | 2015 | 2014 | ||||||
| Regulatory Asset: | ||||||||
| Unrecognized Prior Service Cost | $ | 129 | $ | 335 | ||||
| Unrecognized Net Actuarial Loss | 1,289 | 7,086 | ||||||
| Net Regulatory Asset | $ | 1,418 | $ | 7,421 | ||||
| Projected Benefit Obligation Liability – Net Amount Recognized | $ | (48,730 | ) | $ | (53,638 | ) | ||
| Accumulated Other Comprehensive Loss (Income): | ||||||||
| Unrecognized Prior Service Cost | $ | 8 | $ | 13 | ||||
| Unrecognized Net Actuarial Gain | (347 | ) | (209 | ) | ||||
| Accumulated Other Comprehensive Income | $ | (339 | ) | $ | (196 | ) | ||
The following tables provide a reconciliation of the changes in the fair value of plan assets and the plan’s projected benefit obligations and accrued postretirement benefit cost over the two-year period ended December 31, 2015:
| (in thousands) | 2015 | 2014 | ||||||
| Reconciliation of Fair Value of Plan Assets: | ||||||||
| Fair Value of Plan Assets at January 1 | $ | — | $ | — | ||||
| Actual Return on Plan Assets | — | — | ||||||
| Company Contributions | 2,365 | 2,320 | ||||||
| Benefit Payments (Net of Medicare Part D Subsidy) | (5,324 | ) | (5,017 | ) | ||||
| Participant Premium Payments | 2,959 | 2,697 | ||||||
| Fair Value of Plan Assets at December 31 | $ | — | $ | — | ||||
| Reconciliation of Projected Benefit Obligation: | ||||||||
| Projected Benefit Obligation at January 1 | $ | 53,638 | $ | 45,221 | ||||
| Service Cost (Net of Medicare Part D Subsidy) | 1,297 | 1,055 | ||||||
| Interest Cost (Net of Medicare Part D Subsidy) | 2,097 | 2,200 | ||||||
| Benefit Payments (Net of Medicare Part D Subsidy) | (5,324 | ) | (5,017 | ) | ||||
| Participant Premium Payments | 2,959 | 2,697 | ||||||
| Actuarial (Gain) Loss | (5,937 | ) | 7,482 | |||||
| Projected Benefit Obligation at December 31 | $ | 48,730 | $ | 53,638 | ||||
| Reconciliation of Accrued Postretirement Cost: | ||||||||
| Accrued Postretirement Cost at January 1 | $ | (46,413 | ) | $ | (45,268 | ) | ||
| Expense | (3,604 | ) | (3,465 | ) | ||||
| Net Company Contribution | 2,365 | 2,320 | ||||||
| Accrued Postretirement Cost at December 31 | $ | (47,652 | ) | $ | (46,413 | ) | ||
Weighted average assumptions used to determine benefit obligations at December 31:
| 2015 | 2014 | |||||||
| Discount Rate | 4.57 | % | 4.20 | % | ||||
Assumed healthcare cost-trend rates as of December 31:
| 2015 | 2014 | |||||||
| Healthcare Cost-Trend Rate Assumed for Next Year Pre-65 | 6.16 | % | 6.32 | % | ||||
| Healthcare Cost-Trend Rate Assumed for Next Year Post-65 | 6.43 | % | 6.63 | % | ||||
| Rate to Which the Cost-Trend Rate is Assumed to Decline | 4.50 | % | 5.00 | % | ||||
| Year the Rate Reaches the Ultimate Trend Rate | 2038 | 2025 | ||||||
Assumed healthcare cost-trend rates have a significant effect on the amounts reported for healthcare plans. A one-percentage-point change in assumed healthcare cost-trend rates for 2015 would have the following effects:
| (in thousands) | 1 Point Increase | 1 Point Decrease | ||||||
| Effect on the Postretirement Benefit Obligation | $ | 6,204 | $ | (5,136 | ) | |||
| Effect on Total of Service and Interest Cost | $ | 654 | $ | (509 | ) | |||
| Effect on Expense | $ | 1,355 | $ | (509 | ) | |||
| 107 |
| Measurement Dates: | 2015 | 2014 | ||||||
| Net Periodic Postretirement Benefit Cost | January 1, 2015 | January 1, 2014 | ||||||
| End of Year Benefit Obligations | January 1, 2015 projected to December 31, 2015 | January 1, 2014 projected to December 31, 2014 |
The estimated net amounts of unrecognized prior service cost to be amortized from regulatory assets and accumulated other comprehensive loss into the net periodic postretirement benefit cost in 2016 are:
| (in thousands) | 2016 | |||
| Decrease in Regulatory Assets: | ||||
| Amortization of Unrecognized Prior Service Cost | $ | 134 | ||
| Amortization of Unrecognized Actuarial Loss | — | |||
| Decrease in Accumulated Other Comprehensive Loss: | ||||
| Amortization of Unrecognized Prior Service Cost | 3 | |||
| Amortization of Unrecognized Actuarial Loss | — | |||
| Total Estimated Amortization | $ | 137 | ||
Cash flows—The Company expects to contribute $2.6 million net of expected employee contributions for the payment of retiree medical benefits and Medicare Part D subsidy receipts in 2016. The Company expects to receive a Medicare Part D subsidy from the Federal government of approximately $466,000 in 2016. The following benefit payments, which reflect expected future service, as appropriate, are expected to be paid:
| (in thousands) | 2016 | 2017 | 2018 | 2019 | 2020 | Years 2021-2025 | ||||||||||||||||||
| $ | 2,686 | $ | 2,852 | $ | 2,987 | $ | 3,131 | $ | 3,206 | $ | 16,771 | |||||||||||||
401K Plan
The Company sponsors a 401K plan for the benefit of all corporate and subsidiary company employees. Contributions made to these plans by the Company and its subsidiary companies included in continuing operations totaled $3,602,000 for 2015, $3,171,000 for 2014 and $2,748,000 for 2013.
Employee Stock Ownership Plan
The Company has a stock ownership plan for the benefit of all its electric utility employees. Contributions made by the Company were $674,000 for 2015, $696,000 for 2014 and $705,000 for 2013.
12. Fair Value of Financial Instruments
The following methods and assumptions were used to estimate the fair value of each class of financial instruments for which it is practicable to estimate that value:
Short-Term Debt—The carrying amount approximates fair value because the debt obligations are short-term and the balances outstanding as of December 31, 2015 and December 31, 2014 related to the Otter Tail Corporation Credit Agreement and the OTP Credit Agreement were subject to variable interest rates of LIBOR plus 1.75% and LIBOR plus 1.25%, respectively, which approximate market rates.
Long-Term Debt including Current Maturities—The fair value of the Company's and OTP’s long-term debt is estimated based on the current market indications of rates available to the Company for the issuance of debt. The fair value measurements of the Company’s long-term debt issues fall into level 2 of the fair value hierarchy set forth in ASC 820.
| December 31, 2015 | December 31, 2014 | |||||||||||||||
| (in thousands) | Carrying Amount | Fair Value | Carrying Amount | Fair Value | ||||||||||||
| Short-Term Debt | (80,672 | ) | (80,672 | ) | (10,854 | ) | (10,854 | ) | ||||||||
| Long-Term Debt including Current Maturities | (498,489 | ) | (563,466 | ) | (498,690 | ) | (600,828 | ) | ||||||||
| 108 |
13. Property, Plant and Equipment
| (in thousands) | December 31, 2015 | December 31, 2014 | ||||||
| Electric Plant in Service | ||||||||
| Production | $ | 879,121 | $ | 690,024 | ||||
| Transmission | 391,941 | 323,496 | ||||||
| Distribution | 451,820 | 438,489 | ||||||
| General | 97,881 | 93,103 | ||||||
| Electric Plant in Service | 1,820,763 | 1,545,112 | ||||||
| Construction Work in Progress | 64,117 | 240,170 | ||||||
| Total Gross Electric Plant | 1,884,880 | 1,785,282 | ||||||
| Less Accumulated Depreciation and Amortization | 592,001 | 584,956 | ||||||
| Net Electric Plant | $ | 1,292,879 | $ | 1,200,326 | ||||
| Nonelectric Operations Plant | ||||||||
| Equipment | $ | 155,715 | $ | 135,007 | ||||
| Buildings and Leasehold Improvements | 41,149 | 36,558 | ||||||
| Land | 4,479 | 3,594 | ||||||
| Nonelectric Operations Plant | 201,343 | 175,159 | ||||||
| Construction Work in Progress | 15,495 | 8,507 | ||||||
| Total Gross Nonelectric Plant | 216,838 | 183,666 | ||||||
| Less Accumulated Depreciation and Amortization | 121,903 | 115,462 | ||||||
| Net Nonelectric Operations Plant | $ | 94,935 | $ | 68,204 | ||||
| Net Plant | $ | 1,387,814 | $ | 1,268,530 | ||||
The estimated service lives for rate-regulated properties is 5 to 70 years. For nonelectric property the estimated useful lives are from 3 to 40 years.
| Service Life Range | ||||||||
| (years) | Low | High | ||||||
| Electric Fixed Assets: | ||||||||
| Production Plant | 34 | 62 | ||||||
| Transmission Plant | 40 | 70 | ||||||
| Distribution Plant | 15 | 55 | ||||||
| General Plant | 5 | 70 | ||||||
| Nonelectric Fixed Assets: | ||||||||
| Equipment | 3 | 12 | ||||||
| Buildings and Leasehold Improvements | 7 | 40 | ||||||
| 109 |
14. Income Taxes
The total income tax expense differs from the amount computed by applying the federal income tax rate (35% in 2015, 2014 and 2013) to net income before total income tax expense for the following reasons:
| (in thousands) | 2015 | 2014 | 2013 | |||||||||
| Tax Computed at Federal Statutory Rate – Continuing Operations | $ | 28,081 | $ | 25,704 | $ | 21,389 | ||||||
| Increases (Decreases) in Tax from: | ||||||||||||
| Federal PTCs | (6,962 | ) | (7,517 | ) | (6,612 | ) | ||||||
| State Income Taxes Net of Federal Income Tax Expense | 4,945 | 1,993 | 1,561 | |||||||||
| Differences Reversing in Excess of Federal Rates | (1,143 | ) | (106 | ) | (100 | ) | ||||||
| North Dakota Wind Tax Credit Amortization – Net of Federal Taxes | (850 | ) | (849 | ) | (863 | ) | ||||||
| Investment Tax Credit Amortization | (571 | ) | (597 | ) | (597 | ) | ||||||
| Dividend Received/Paid Deduction | (560 | ) | (622 | ) | (632 | ) | ||||||
| Allowance for Funds Used During Construction - Equity | (426 | ) | (505 | ) | (638 | ) | ||||||
| Corporate Owned Life Insurance | (167 | ) | (354 | ) | (856 | ) | ||||||
| Tax Depreciation - Treasury Grant for Wind Farms | — | (152 | ) | (304 | ) | |||||||
| Section 199 Domestic Production Activities Deduction | — | (1,026 | ) | — | ||||||||
| Permanent and Other Differences | (705 | ) | 588 | 168 | ||||||||
| Total Income Tax Expense – Continuing Operations | $ | 21,642 | $ | 16,557 | $ | 12,516 | ||||||
| Income Tax Expense – Discontinued Operations – U.S. | 2,991 | 3,952 | 1,042 | |||||||||
| Income Tax Expense – Continuing and Discontinued Operations | $ | 24,633 | $ | 20,509 | $ | 13,558 | ||||||
| Overall Effective Federal, State and Foreign Income Tax Rate | 29.3 | % | 26.2 | % | 21.0 | % | ||||||
| Income Tax Expense From Continuing Operations Includes the Following: | ||||||||||||
| Current Federal Income Taxes | $ | 211 | $ | 124 | $ | 146 | ||||||
| Current State Income Taxes | 1 | 5 | 37 | |||||||||
| Deferred Federal Income Taxes | 23,050 | 21,044 | 17,488 | |||||||||
| Deferred State Income Taxes | 6,763 | 4,347 | 2,917 | |||||||||
| Federal PTCs | (6,962 | ) | (7,517 | ) | (6,612 | ) | ||||||
| North Dakota Wind Tax Credit Amortization – Net of Federal Taxes | (850 | ) | (849 | ) | (863 | ) | ||||||
| Investment Tax Credit Amortization | (571 | ) | (597 | ) | (597 | ) | ||||||
| Total | $ | 21,642 | $ | 16,557 | $ | 12,516 | ||||||
| Income Before Income Taxes – U.S. | $ | 83,998 | $ | 78,232 | $ | 63,924 | ||||||
| Income Before Income Taxes – Foreign (Discontinued Operations) | — | — | 499 | |||||||||
| Total Income Before Income Taxes – Continuing and Discontinued Operations | $ | 83,998 | $ | 78,232 | $ | 64,423 | ||||||
The Company's deferred tax assets and liabilities were composed of the following on December 31:
| (in thousands) | 2015 | 2014 | ||||||
| Deferred Tax Assets | ||||||||
| Retirement Benefits Liabilities | $ | 41,958 | $ | 42,706 | ||||
| Benefit Liabilities | 41,788 | 42,479 | ||||||
| Federal PTCs | 39,505 | 30,189 | ||||||
| North Dakota Wind Tax Credits | 32,962 | 32,962 | ||||||
| Cost of Removal | 29,463 | 29,089 | ||||||
| Net Operating Loss Carryforward | 22,824 | 7,842 | ||||||
| Differences Related to Property | 10,177 | 10,505 | ||||||
| Vacation Accrual | 2,500 | 2,154 | ||||||
| Investment Tax Credits | 1,109 | 1,549 | ||||||
| Other | 7,617 | 1,915 | ||||||
| Total Deferred Tax Assets | $ | 229,903 | $ | 201,390 | ||||
| Deferred Tax Liabilities | ||||||||
| Differences Related to Property | $ | (366,234 | ) | $ | (313,959 | ) | ||
| Retirement Benefits Regulatory Asset | (41,958 | ) | (42,706 | ) | ||||
| Excess Tax over Book Pension | (13,775 | ) | (12,928 | ) | ||||
| North Dakota Wind Tax Credits | (3,179 | ) | (2,722 | ) | ||||
| Impact of State Net Operating Losses on Federal Taxes | (1,596 | ) | (2,745 | ) | ||||
| Regulatory Asset | — | (2,087 | ) | |||||
| Other | (10,830 | ) | (5,571 | ) | ||||
| Total Deferred Tax Liabilities | $ | (437,572 | ) | $ | (382,718 | ) | ||
| Deferred Income Taxes | $ | (207,669 | ) | $ | (181,328 | ) | ||
| 110 |
Federal PTCs are earned as wind energy is generated based on a per kwh rate prescribed in applicable federal statutes. OTP’s kwh generation from its wind turbines eligible for PTCs decreased 7.4% primarily due to lower average wind speed in 2015 compared with 2014. North Dakota wind energy credits are based on dollars invested in qualifying facilities and are being recognized on a straight-line basis over 25 years.
Schedule of expiration of tax credits and tax net operating losses available as of December 31, 2015:
| (in thousands) | Amount | 2016 | 2017 | 2027-35 | ||||||||||||
| United States | ||||||||||||||||
| Federal Net Operating Losses | $ | 18,265 | $ | — | $ | — | $ | 18,265 | ||||||||
| Federal Tax Credits | 42,289 | — | — | 42,289 | ||||||||||||
| State Net Operating Losses | 4,559 | — | — | 4,559 | ||||||||||||
| State Tax Credits | 36,266 | 2,339 | 389 | 33,538 | ||||||||||||
The carryforward period on a portion of the North Dakota wind tax credits from the Langdon wind project is five years. OTP has adjusted its deferred tax assets and deferred tax credits by $2.7 million for potential unused North Dakota wind tax credits related to the Langdon wind project.
The following table summarizes the activity related to our unrecognized tax benefits:
| (in thousands) | 2015 | 2014 | 2013 | |||||||||
| Balance on January 1 | $ | 222 | $ | 4,239 | $ | 4,436 | ||||||
| Increases Related to Tax Positions for Prior Years | 236 | 120 | 98 | |||||||||
| Decreases Related to Tax Positions for Prior Years | — | (4,142 | ) | (295 | ) | |||||||
| Increases Related to Tax Positions for Current Year | 10 | 5 | — | |||||||||
| Uncertain Positions Resolved During Year | — | — | — | |||||||||
| Balance on December 31 | $ | 468 | $ | 222 | $ | 4,239 | ||||||
The balance of unrecognized tax benefits as of December 31, 2015 would reduce the Company’s effective tax rate if recognized. The total amount of unrecognized tax benefits as of December 31, 2015 is not expected to change significantly within the next 12 months. The Company classifies interest and penalties on tax uncertainties as components of the provision for income taxes in our consolidated statement of income. There was no amount accrued for interest on tax uncertainties as of December 31, 2015.
The Company and its subsidiaries file a consolidated U.S. federal income tax return and various state income tax returns. As of December 31, 2015, with limited exceptions, the Company is no longer subject to examinations by taxing authorities for tax years prior to 2012 for federal and North Dakota state income taxes and for tax years prior to 2013 for Minnesota state income taxes.
15. Asset Retirement Obligations (AROs)
The Company’s AROs are related to OTP’s coal-fired generation plants and its 92 wind turbines located in North Dakota. The AROs include items such as site restoration, closure of ash pits, and removal of certain structures, generators, asbestos and storage tanks. The Company has legal obligations associated with the retirement of a variety of other long-lived tangible assets used in electric operations where the estimated settlement costs are individually and collectively immaterial. The Company has no assets legally restricted for the settlement of any of its AROs.
On December 19, 2014, the EPA’s rule regulating coal combustion residuals (CCR) went into effect. The final rule regulates CCR as a non-hazardous solid waste under Subtitle D of the Resource Conservation and Recovery Act. In the second quarter of 2015, subsequent to publication of the CCR rule, OTP completed an assessment of its ash handling and storage facilities at Hoot Lake Plant, Coyote Station and Big Stone Plant and determined that it had no immediate obligation under the rules to close or modify any existing ash handling facilities or storage sites but has discontinued the use of one pit at Coyote Station to avoid the potential for future obligations related to this site under the CCR rule. Additionally, OTP identified a slag sluice pond and slag stockpile area at Big Stone Plant that will need to be reclaimed at a future date to comply with the CCR rule. OTP established an ARO liability of approximately $0.5 million for its share of the estimated future costs to reclaim this site. Although identified as a new ARO resulting from the issuance of the CCR rule, the slag sluice pond and slag stockpile are currently in use, so the cost of the new ARO was capitalized. Therefore, the establishment of the ARO will have no impact on current year consolidated operating expenses but will result in an offsetting charge to the removal cost component of the accumulated provision for depreciation on the Company’s consolidated balance sheet. Future reclamation costs, when incurred, will be charged against, and reduce, the accumulated ARO liability.
| 111 |
Reconciliations of carrying amounts of the present value of the Company’s legal AROs, capitalized asset retirement costs and related accumulated depreciation and a summary of settlement activity for the years ended December 31, 2015 and 2014 are presented in the following table:
| (in thousands) | 2015 | 2014 | ||||||
| Asset Retirement Obligations | ||||||||
| Beginning Balance | $ | 7,721 | $ | 5,661 | ||||
| New Obligations Recognized | 451 | — | ||||||
| Adjustments Due to Revisions in Cash Flow Estimates | (424 | ) | 1,582 | |||||
| Accrued Accretion | 336 | 478 | ||||||
| Settlements | — | — | ||||||
| Ending Balance | $ | 8,084 | $ | 7,721 | ||||
| Asset Retirement Costs Capitalized | ||||||||
| Beginning Balance | $ | 3,059 | $ | 1,477 | ||||
| New Obligations Recognized | 451 | — | ||||||
| Adjustments Due to Revisions in Cash Flow Estimates | (424 | ) | 1,582 | |||||
| Settlements | — | — | ||||||
| Ending Balance | $ | 3,086 | $ | 3,059 | ||||
| Accumulated Depreciation - Asset Retirement Costs Capitalized | ||||||||
| Beginning Balance | $ | 527 | $ | 462 | ||||
| New Obligations Recognized | — | — | ||||||
| Adjustments Due to Revisions in Cash Flow Estimates | — | — | ||||||
| Depreciation Expense | 146 | 65 | ||||||
| Settlements | — | — | ||||||
| Ending Balance | $ | 673 | $ | 527 | ||||
| Settlements | None | None | ||||||
| Original Capitalized Asset Retirement Cost - Retired | $ | — | $ | — | ||||
| Accumulated Depreciation | — | — | ||||||
| Asset Retirement Obligation | $ | — | $ | — | ||||
| Settlement Cost | — | — | ||||||
| Gain on Settlement – Deferred Under Regulatory Accounting | $ | — | $ | — | ||||
16. Discontinued Operations
On April 30, 2015 the Company sold Foley for net proceeds of $12.0 million in cash, plus $6.3 million in adjustments for working capital and other related items received in October 2015, less $1.0 million in selling expenses. On February 28, 2015 the Company sold the assets of AEV, Inc. for net proceeds of $22.3 million in cash, plus $0.6 million in adjustments for working capital and fixed assets received in October 2015, less $0.8 million in selling expenses. Foley and AEV, Inc. were formerly included in our Construction segment
On February 8, 2013 the Company completed the sale of substantially all the assets of its dock and boat lift company, formerly included in the Company’s Manufacturing segment, for approximately $13.0 million in cash and received a working capital true up of approximately $2.4 million in June 2013.
On January 18, 2012 the Company sold the assets of Aviva for $0.3 million in cash. For discontinued operations reporting, Aviva’s results are included in the dock and boatlift company’s consolidated results. On November 30, 2012 the Company completed the sale of the assets of its wind tower manufacturing business for total proceeds, net of commissions and selling costs, of $18.1 million. This business was the only remaining entity in the Company’s former Wind Energy segment. On February 29, 2012 the Company completed the sale of DMS, its health services company, for $24.0 million in cash net of commissions and selling costs, which was reduced by a $1.7 million working capital settlement paid to the buyer in February 2013. The DMS working capital settlement was estimated to be $1.9 million at the time of the sale. The final settlement resulted in recording a $0.2 million gain on the sale of DMS in the first quarter of 2013. DMS was the only business in the Company’s former Health Services segment.
| 112 |
The Company’s Wind Energy, Health Services and Construction segments were eliminated as a result of the sales of its wind tower manufacturing business, DMS, Foley and AEV, Inc. The financial position, results of operations and cash flows of Foley, AEV, Inc., the Company’s wind tower manufacturing business, E.W. Wylie Corporation (Wylie), its former trucking company, its dock and boatlift company and DMS are reported as discontinued operations in the Company’s consolidated financial statements. Following are summary presentations of the results of discontinued operations for the years ended December 31, 2015, 2014 and 2013:
| For the Year Ended December 31, 2015 | ||||||||||||||||||||||||
| (in thousands) | Foley | AEV, Inc. | Wind Tower Business | Dock and Boatlift Business | Intercompany Transactions Adjustment | Total | ||||||||||||||||||
| Operating Revenues | $ | 21,625 | $ | 2,998 | $ | — | $ | — | $ | — | $ | 24,623 | ||||||||||||
| Operating Expenses | 26,839 | 4,532 | (462 | ) | 966 | (240 | ) | 31,635 | ||||||||||||||||
| Asset Impairment Charge | 1,000 | — | — | — | — | 1,000 | ||||||||||||||||||
| Interest Expense | 177 | 27 | — | — | (204 | ) | — | |||||||||||||||||
| Other Income (Deductions) | (42 | ) | 2 | 111 | — | (2 | ) | 69 | ||||||||||||||||
| Income Tax (Benefit) Expense | (921 | ) | (638 | ) | 229 | (386 | ) | 177 | (1,539 | ) | ||||||||||||||
| Net (Loss) Income from Operations | (5,512 | ) | (921 | ) | 344 | (580 | ) | 265 | (6,404 | ) | ||||||||||||||
| (Loss) Gain on Disposition Before Taxes | (204 | ) | 11,894 | — | — | — | 11,690 | |||||||||||||||||
| Income Tax (Benefit) Expense on Disposition | (227 | ) | 4,757 | — | — | — | 4,530 | |||||||||||||||||
| Net Gain on Disposition | 23 | 7,137 | — | — | — | 7,160 | ||||||||||||||||||
| Net (Loss) Income | $ | (5,489 | ) | $ | 6,216 | $ | 344 | $ | (580 | ) | $ | 265 | $ | 756 | ||||||||||
| For the Year Ended December 31, 2014 | ||||||||||||||||||||||||
| (in thousands) | Foley | AEV, Inc. | Wind Tower Business | Dock and Boatlift Business | Intercompany Transactions Adjustment | Total | ||||||||||||||||||
| Operating Revenues | $ | 105,333 | $ | 44,527 | $ | — | $ | — | $ | — | $ | 149,860 | ||||||||||||
| Operating Expenses | 100,826 | 40,297 | 19 | (180 | ) | (960 | ) | 140,002 | ||||||||||||||||
| Asset Impairment Charge | 5,605 | — | — | — | — | 5,605 | ||||||||||||||||||
| Interest Expense | 510 | 184 | — | — | (694 | ) | — | |||||||||||||||||
| Other (Deductions) Income | (38 | ) | 304 | — | 277 | (4 | ) | 539 | ||||||||||||||||
| Income Tax Expense (Benefit) | 1,388 | 1,729 | (8 | ) | 183 | 660 | 3,952 | |||||||||||||||||
| Net (Loss) Income | $ | (3,034 | ) | $ | 2,621 | $ | (11 | ) | $ | 274 | $ | 990 | $ | 840 | ||||||||||
| For the Year Ended December 31, 2013 | ||||||||||||||||||||||||||||||||
| (in thousands) | Foley | AEV, Inc. | Wind Tower Business | Wylie | Dock and Boatlift Business | DMS | Intercompany Transactions Adjustment | Total | ||||||||||||||||||||||||
| Operating Revenues | $ | 110,097 | $ | 39,813 | $ | — | $ | — | $ | 2,016 | $ | — | $ | (11 | ) | $ | 151,915 | |||||||||||||||
| Operating Expenses | 109,036 | 38,257 | (988 | ) | 640 | 2,622 | (269 | ) | (11 | ) | 149,287 | |||||||||||||||||||||
| Interest Expense | 249 | 207 | — | — | — | — | (451 | ) | 5 | |||||||||||||||||||||||
| Other Income (Deductions) | 4 | (5 | ) | 412 | — | 67 | — | (5 | ) | 473 | ||||||||||||||||||||||
| Income Tax Expense (Benefit) | 331 | 518 | 370 | (256 | ) | (213 | ) | 108 | 178 | 1,036 | ||||||||||||||||||||||
| Net Income (Loss) from Operations | 485 | 826 | 1,030 | (384 | ) | (326 | ) | 161 | 268 | 2,060 | ||||||||||||||||||||||
| Gain on Disposition Before Taxes | — | — | — | — | 16 | 200 | — | 216 | ||||||||||||||||||||||||
| Income Tax Expense on Disposition | — | — | — | — | 6 | — | — | 6 | ||||||||||||||||||||||||
| Net Gain on Disposition | — | — | — | — | 10 | 200 | — | 210 | ||||||||||||||||||||||||
| Net Income (Loss) | $ | 485 | $ | 826 | $ | 1,030 | $ | (384 | ) | $ | (316 | ) | $ | 361 | $ | 268 | $ | 2,270 | ||||||||||||||
Foley and AEV, Inc. entered into fixed-price construction contracts. Revenues under these contracts were recognized on a percentage-of-completion basis. The method used to determine the progress of completion was based on the ratio of costs incurred to total estimated costs on construction projects. An increase in estimated costs on one large job in progress at Foley in excess of previous period cost estimates resulted in pretax charges of $4.4 million in 2015.
| 113 |
In the fourth quarter of 2014 the Company entered into negotiations to sell Foley and, as a result of an impairment indicator, the Company recorded a $5.6 million goodwill impairment charge. This impairment charge was based on the indicated offering price in a signed letter of intent for the purchase of Foley. In the first quarter of 2015, Foley recorded an additional $1.0 million goodwill impairment charge based on adjustments to the carrying value of Foley. The fourth quarter 2014 and first quarter 2015 goodwill impairment losses are reflected in the results of discontinued operations. Following are summary presentations of the major components of assets and liabilities of discontinued operations as of December 31, 2015 and December 31, 2014:
| December 31, 2015 | ||||||||||||||||||||
| (in thousands) | Foley | AEV, Inc. | Wind Tower Business | Dock and Boatlift Business | Total | |||||||||||||||
| Current Liabilities | $ | — | $ | — | $ | 1,299 | $ | 799 | $ | 2,098 | ||||||||||
| Liabilities of Discontinued Operations | $ | — | $ | — | $ | 1,299 | $ | 799 | $ | 2,098 | ||||||||||
| December 31, 2014 | ||||||||||||||||||||
| (in thousands) | Foley | AEV, Inc. | Wind Tower Business | Dock and Boatlift Business | Total | |||||||||||||||
| Current Assets | $ | 29,303 | $ | 4,773 | $ | — | $ | — | $ | 34,076 | ||||||||||
| Goodwill and Intangibles | 2,814 | — | — | — | 2,814 | |||||||||||||||
| Net Plant | 4,445 | 6,224 | — | — | 10,669 | |||||||||||||||
| Assets of Discontinued Operations | $ | 36,562 | $ | 10,997 | $ | — | $ | — | $ | 47,559 | ||||||||||
| Current Liabilities | $ | 17,114 | $ | 2,916 | $ | 1,840 | $ | 994 | $ | 22,864 | ||||||||||
| Deferred Income Taxes | 1,471 | 2,126 | — | — | 3,597 | |||||||||||||||
| Liabilities of Discontinued Operations | $ | 18,585 | $ | 5,042 | $ | 1,840 | $ | 994 | $ | 26,461 | ||||||||||
The Company elected to adopt the ASC amendments in ASU 2015-17 in the fourth quarter of 2015 and has applied the amendments in the update retrospectively to its consolidated financial statements. See note 1 to consolidated financial statements for additional information. The effect of applying the guidance in ASU 2015-17 retrospectively resulted in adjustments to assets and liabilities of discontinued operations on the Company’s consolidated balance sheet as of December 31, 2014 as shown in the following table:
| (in thousands) | Previously Stated | Adjustments | Restated | |||||||||
| Current Assets | ||||||||||||
| Assets of Discontinued Operations | $ | 48,657 | $ | (1,098 | ) | $ | 47,559 | |||||
| Current Liabilities | ||||||||||||
| Liabilities of Discontinued Operations | 27,559 | (1,098 | ) | 26,461 | ||||||||
Included in current liabilities of discontinued operations are warranty reserves. Details regarding the warranty reserves follow:
| (in thousands) | 2015 | 2014 | ||||||
| Warranty Reserve Balance, Beginning of Year | $ | 2,527 | $ | 3,087 | ||||
| Provision for Warranties Issued During the Year | — | — | ||||||
| Less Settlements Made During the Year | (124 | ) | (372 | ) | ||||
| Decrease in Warranty Estimates for Prior Years | (300 | ) | (188 | ) | ||||
| Warranty Reserve Balance, End of Year | $ | 2,103 | $ | 2,527 | ||||
The warranty reserve balances as of December 31, 2015 and December 31, 2014 relate entirely to products produced by the Company’s former wind tower and dock and boatlift manufacturing companies. Expenses associated with remediation activities of these companies could be substantial. Although the assets of these companies have been sold and their operating results are reported under discontinued operations in the Company’s consolidated statements of income, the Company retains responsibility for warranty claims related to the products they produced prior to the sales of these companies.
For wind towers, the potential exists for multiple claims based on one defect repeated throughout the production process or for claims where the cost to repair or replace the defective part is highly disproportionate to the original cost of the part. For example, if the Company is required to cover remediation expenses in addition to regular warranty coverage, the Company could be required to accrue additional expenses and experience additional unplanned cash expenditures which could adversely affect the Company’s consolidated results of operations and financial condition.
| 114 |
17. Subsequent Events
Stock Incentive Awards
On February 4, 2016 the following stock incentive awards were granted to the Company’s executive officers under the 2014 Incentive Plan:
| Award | Shares/Units Granted | Weighted Average Grant-Date Fair Value per Award | Vesting | |||||||
| Restricted Stock Units Granted to Executive Officers | 22,000 | $ | 28.915 | 25% per year through February 6, 2020 | ||||||
| Stock Performance Awards Granted to Executive Officers | 81,500 | $ | 24.03 | December 31, 2018 | ||||||
The vesting of restricted stock units is accelerated in the event of a change in control, disability, death or retirement or, subject to proration in certain cases. All restricted stock units granted to executive officers are eligible to receive dividend equivalent payments on all unvested awards over the awards respective vesting periods, subject to forfeiture under the terms of the restricted stock unit award agreements. The grant-date fair value of each restricted stock unit was the average of the high and low market price per share on the date of grant.
Under the performance share awards the aggregate award for performance at target is 81,500 shares. For target performance the Company’s executive officers would earn an aggregate of 54,333 common shares based on the Company’s total shareholder return relative to the total shareholder return of the companies that comprise the Edison Electric Institute Index over the performance measurement period of January 1, 2016 through December 31, 2018, with the beginning and ending share values based on the average closing price of a share of the Company’s common stock for the 20 trading days immediately following January 1, 2016 and the average closing price for the 20 trading days immediately preceding January 1, 2019. The Company’s executive officers would also earn an aggregate of 27,167 common shares for achieving the target set for the Company’s 3-year average adjusted return on equity. Actual payment may range from zero to 150% of the target amount, or up to 122,250 common shares. The executive officers have no voting or dividend rights related to these shares until the shares, if any, are issued at the end of the performance measurement period. The terms of these awards are such that the entire award will be classified and accounted for as a liability, as required under ASC 718, and will be measured over the performance period based on the fair value of the award at the end of each reporting period subsequent to the grant date.
Under the 2016 Performance Award Agreements, payment and the amount of payment in the event of retirement, resignation for good reason or involuntary termination without cause is to be made at the end of the performance period based on actual performance, subject to proration in certain cases, except that the payment of performance awards granted to certain officers who are parties to Executive Employment Agreements with the Company is to be made at target at the date of any such event.
The end of the period over which compensation expense is recognized for the above share-based awards for the individual grantees is the shorter of the indicated vesting period for the respective awards or the date the grantee becomes eligible for retirement as defined in their award agreement.
Debt Issuance
On February 5, 2016 the Company entered into a Term Loan Agreement (the Term Loan Agreement) with the Banks named therein, JPMorgan, as administrative agent, and JPMS, as Lead Arranger and Book Runner. The Term Loan Agreement provides for an unsecured term loan with an aggregate commitment of $50 million that the Company may use for purposes of funding working capital, capital expenditures and other corporate purposes of the Company and certain of our subsidiaries. Under the Term Loan Agreement, the Company may, on up to two occasions enter into additional tranches of term loans in minimum increments of $10 million, subject to the consent of the lenders and so long as the aggregate amount of outstanding term loans does not exceed $100 million at any time. Borrowings under the Term Loan Agreement will bear interest at either (1) LIBOR plus 0.90% or (2) the greater of (a) the Prime Rate, (b) the Federal Reserve Bank of New York Rate plus 0.50% and (c) LIBOR multiplied by the Statutory Reserve Rate plus 1%. The applicable interest rate will depend on the Company’s election of whether to make the advance a LIBOR advance. The Term Loan Agreement terminates on February 5, 2018. The Term Loan Agreement contains a number of restrictions on the Company and the businesses of the Company’s wholly owned subsidiary Varistar Corporation and its subsidiaries, including restrictions on the Company’s and Varistar’s ability to merge, sell assets, make investments, create or incur liens on assets, guarantee the obligations of any other party and engage in transactions with related parties. The Term Loan Agreement also contains affirmative covenants and events of default, and the following financial covenants. The Company must not permit the ratio of its Interest-bearing Debt to Total Capitalization to be greater than 0.60 to 1.00 or permit its Interest and Dividend Coverage Ratio to be less than 1.50 to 1.00 (each measured
| 115 |
on a consolidated basis), as provided in the Term Loan Agreement. The Term Loan Agreement does not include provisions for the termination of the agreement or the acceleration of repayment of amounts outstanding due to changes in the Company’s credit ratings. The Company’s obligations under the Term Loan Agreement are guaranteed by certain of the Company’s subsidiaries.
On February 5, 2016 the Company borrowed $50 million under the Term Loan Agreement at an interest rate based on the 30 day LIBOR plus 90 basis points and used the proceeds to pay down borrowings under the Otter Tail Corporation Credit Agreement that were used to fund the expansion of BTD’s Minnesota facilities in 2015 and to fund the September 1, 2015 acquisition of BTD-Georgia.
Supplementary Financial Information
Quarterly Information (not audited)
Because of changes in the number of common shares outstanding and the impact of diluted shares, the sum of the quarterly earnings (loss) per common share may not equal total earnings (loss) per common share.
| Three Months Ended | March 31 | June 30 | September 30 | December 31 | ||||||||||||||||||||||||||||
| (in thousands, except per share data) | 20151 | 2014 | 2015 | 2014 | 2015 | 2014 | 2015 | 20141 | ||||||||||||||||||||||||
| Operating Revenues–Continuing Operations | $ | 202,841 | $ | 214,966 | $ | 188,153 | $ | 194,364 | $ | 200,023 | $ | 196,525 | $ | 188,787 | $ | 193,407 | ||||||||||||||||
| Operating Income–Continuing Operations | $ | 25,025 | $ | 35,401 | $ | 24,800 | $ | 14,752 | $ | 29,626 | $ | 24,522 | $ | 29,763 | $ | 24,856 | ||||||||||||||||
| Net Income (Loss): | ||||||||||||||||||||||||||||||||
| Continuing Operations | $ | 13,781 | $ | 21,779 | $ | 13,657 | $ | 7,886 | $ | 15,709 | $ | 13,172 | $ | 15,442 | $ | 14,046 | ||||||||||||||||
| Discontinued Operations | $ | 4,154 | $ | (349 | ) | $ | (2,221 | ) | $ | 2,107 | $ | (317 | ) | $ | 2,653 | $ | (860 | ) | $ | (3,571 | ) | |||||||||||
| Total Net Income | $ | 17,935 | $ | 21,430 | $ | 11,436 | $ | 9,993 | $ | 15,392 | $ | 15,825 | $ | 14,582 | $ | 10,475 | ||||||||||||||||
| Basic Earnings (Loss) Per Share: | ||||||||||||||||||||||||||||||||
| Continuing Operations | $ | .37 | $ | .60 | $ | .37 | $ | .21 | $ | .42 | $ | .36 | $ | .41 | $ | .38 | ||||||||||||||||
| Discontinued Operations | $ | .11 | $ | (.01 | ) | $ | (.06 | ) | $ | .06 | $ | (.01 | ) | $ | .07 | $ | (.02 | ) | $ | (.10 | ) | |||||||||||
| Total Basic Earnings Per Share | $ | .48 | $ | .59 | $ | .31 | $ | .27 | $ | .41 | $ | .43 | $ | .39 | $ | .28 | ||||||||||||||||
| Diluted Earnings (Loss) Per Share: | ||||||||||||||||||||||||||||||||
| Continuing Operations | $ | .37 | $ | .60 | $ | .36 | $ | .21 | $ | .42 | $ | .36 | $ | .41 | $ | .38 | ||||||||||||||||
| Discontinued Operations | $ | .11 | $ | (.01 | ) | $ | (.06 | ) | $ | .06 | $ | (.01 | ) | $ | .07 | $ | (.02 | ) | $ | (.10 | ) | |||||||||||
| Total Diluted Earnings Per Share | $ | .48 | $ | .59 | $ | .30 | $ | .27 | $ | .41 | $ | .43 | $ | .39 | $ | .28 | ||||||||||||||||
| Dividends Declared Per Common Share | $ | .3075 | $ | .3025 | $ | .3075 | $ | .3025 | $ | .3075 | $ | .3025 | $ | .3075 | $ | .3025 | ||||||||||||||||
| Price Range: | ||||||||||||||||||||||||||||||||
| High | 33.44 | 31.72 | 32.76 | 31.08 | 28.34 | 30.43 | 28.76 | 32.72 | ||||||||||||||||||||||||
| Low | 30.60 | 26.96 | 26.14 | 27.19 | 24.82 | 26.67 | 25.20 | 26.53 | ||||||||||||||||||||||||
| Average Number of Common Shares Outstanding—Basic | 37,243 | 36,240 | 37,433 | 36,410 | 37,575 | 36,596 | 37,728 | 36,811 | ||||||||||||||||||||||||
| Average Number of Common Shares Outstanding—Diluted | 37,498 | 36,432 | 37,653 | 36,653 | 37,795 | 36,839 | 37,868 | 37,049 | ||||||||||||||||||||||||
1 Results include pre-tax goodwill impairment charges of $1.0 million in the first quarter of 2015 and $5.6 million in the fourth quarter of 2014 at Foley in discontinued operations.
Item 9. CHANGES IN AND DISAGREEMENTS WITH ACCOUNTANTS ON ACCOUNTING AND FINANCIAL DISCLOSURE
None.
Item 9A. CONTROLS AND PROCEDURES
Evaluation of Disclosures Controls and Procedures. Under the supervision and with the participation of the Company’s management, including the Chief Executive Officer and the Chief Financial Officer, the Company evaluated the effectiveness of the design and operation of its disclosure controls and procedures (as defined in Rule 13a-15(e) under the Securities Exchange Act of 1934 (the Exchange Act)) as of December 31, 2015, the end of the period covered by this report. Based on that evaluation, the Chief Executive Officer and Chief Financial Officer concluded that the Company’s disclosure controls and procedures were effective as of December 31, 2015.
| 116 |
Changes in Internal Control over Financial Reporting. There were no changes in the Company’s internal control over financial reporting (as defined in Rules 13a-15(f) under the Exchange Act) during the fourth quarter ended December 31, 2015 that have materially affected, or are reasonably likely to materially affect, the Company’s internal control over financial reporting.
Management’s Report Regarding Internal Control Over Financial Reporting. Management is responsible for the preparation and integrity of the consolidated financial statements and representations in this Annual Report on Form 10-K. The consolidated financial statements of the Company have been prepared in conformity with generally accepted accounting principles applied on a consistent basis and include some amounts that are based on informed judgments and best estimates and assumptions of management.
In order to assure the consolidated financial statements are prepared in conformance with generally accepted accounting principles, management is responsible for establishing and maintaining adequate internal control over financial reporting, as such term is defined in Exchange Act Rule 13a-15(f). These internal controls are designed only to provide reasonable assurance, on a cost-effective basis, that transactions are carried out in accordance with management’s authorizations and assets are safeguarded against loss from unauthorized use or disposition.
Management has completed its assessment of the effectiveness of the Company’s internal control over financial reporting as of December 31, 2015. In making this assessment, management used the criteria set forth by the Committee of Sponsoring Organizations of the Treadway Commission in Internal Control - Integrated Framework (2013) to conduct the required assessment of the effectiveness of the Company’s internal control over financial reporting. Based on this assessment, management concluded that, as of December 31, 2015, the Company’s internal control over financial reporting was effective based on those criteria. The Company’s independent registered public accounting firm, Deloitte & Touche LLP, has audited the Company’s consolidated financial statements included in this Annual Report on Form 10-K and issued an attestation report on the Company’s internal control over financial reporting.
Attestation Report of Independent Registered Public Accounting Firm. The attestation report of Deloitte & Touche LLP, the Company’s independent registered public accounting firm, regarding the Company’s internal control over financial reporting is provided on page 60.
None.
Item 10. DIRECTORS, EXECUTIVE OFFICERS AND CORPORATE GOVERNANCE
The information required by this Item regarding Directors is incorporated by reference to the information under “Election of Directors” in the Company's definitive Proxy Statement for the 2016 Annual Meeting. The information regarding executive officers and family relationships is set forth in Item 3A hereto. The information regarding Section 16 reporting is incorporated by reference to the information under “Security Ownership of Directors and Officers - Section 16(a) Beneficial Ownership Reporting Compliance” in the Company’s definitive Proxy Statement for the 2016 Annual Meeting. The information required by this Item regarding the Company’s procedures for recommending nominees to the board of directors is incorporated by reference to the information under “Meetings and Committees of the Board of Directors – Corporate Governance Committee” in the Company’s definitive Proxy Statement for the 2016 Annual Meeting. The information required by this Item in regard to the Audit Committee and the Company’s Audit Committee financial experts is incorporated by reference to the information under “Meetings and Committees of the Board of Directors – Audit Committee” in the Company’s definitive Proxy Statement for the 2016 Annual Meeting.
The Company has adopted a code of conduct that applies to all of its directors, officers (including its principal executive officer, principal financial officer, and its principal accounting officer or controller or person performing similar functions) and employees. The Company’s code of conduct is available on its website at www.ottertail.com. The Company intends to satisfy the disclosure requirements under Item 5.05 of Form 8-K regarding an amendment to, or waiver from, a provision of its code of conduct by posting such information on its website at the address specified above. Information on the Company’s website is not deemed to be incorporated by reference into this Annual Report on Form 10-K.
| 117 |
Item 11. EXECUTIVE COMPENSATION
The information required by this Item is incorporated by reference to the information under “Compensation Discussion and Analysis,” “Report of Compensation Committee,” “Executive Compensation” and “Director Compensation” in the Company's definitive Proxy Statement for the 2016 Annual Meeting.
Item 12. SECURITY OWNERSHIP OF CERTAIN BENEFICIAL OWNERS AND MANAGEMENT AND RELATED STOCKHOLDER MATTERS
The information required by this Item regarding security ownership is incorporated by reference to the information under “Outstanding Voting Shares” and “Security Ownership of Directors and Officers” in the Company’s definitive Proxy Statement for the 2016 Annual Meeting.
EQUITY COMPENSATION PLAN INFORMATION
The following table sets forth information as of December 31, 2015 about the Company’s common stock that may be issued under all of its equity compensation plans:
| Plan Category | Number of securities to be issued upon exercise of outstanding options, warrants and rights (a) | Weighted average exercise price of outstanding options, warrants and rights (b) | Number of securities remaining available for future issuance under equity compensation plans (excluding securities reflected in column (a)) (c) | |||||||||
| Equity compensation plans approved by security holders: | ||||||||||||
| 2014 Stock Incentive Plan | 339,935 (1) | $ | 0.00 | 1,500,144 | (2) | |||||||
| 1999 Stock Incentive Plan | 48,924 (3) | $ | 0.00 | — | (4) | |||||||
| 1999 Employee Stock Purchase Plan | — | N/A | 416,215 | (5) | ||||||||
| Equity compensation plans not approved by security holders | — | — | — | |||||||||
| Total | 388,859 | $ | 0.00 | 1,916,359 | ||||||||
| (1) | Includes 126,450 and 159,450 performance based share awards granted in 2015 and 2014, respectively, 53,700 restricted stock units outstanding as of December 31, 2015, and 335 stock units as part of the director deferred compensation program, and excludes 36,482 shares of restricted stock issued under the 2014 Stock Incentive Plan. | |
| (2) | The 2014 Stock Incentive Plan provides for the issuance of any shares available under the plan in the form of restricted stock, restricted stock units, performance awards and other types of stock-based awards, in addition to the granting of options, warrants or stock appreciation rights. | |
| (3) | Includes 22,500 performance based share awards granted in 2013, 23,000 restricted stock units outstanding as of December 31, 2015, and 3,424 stock units as part of the director deferred compensation program, and excludes 15,316 shares of restricted stock issued under the 1999 Stock Incentive Plan. | |
| (4) | The 1999 Stock Incentive Plan provided for the issuance of any shares available under the plan in the form of restricted stock, restricted stock units, performance awards and other types of stock-based awards, in addition to the granting of options, warrants or stock appreciation rights. The 1999 Stock Incentive Plan expired by its terms on December 13, 2013 and no more awards may be granted thereunder. | |
| (5) | Shares are issued based on employee’s election to participate in the plan. |
Item 13. CERTAIN RELATIONSHIPS AND RELATED TRANSACTIONS, AND DIRECTOR INDEPENDENCE
The information required by this Item is incorporated by reference to the information under “Policy and Procedures Regarding Transactions with Related Persons,” “Election of Directors” and “Meetings and Committees of the Board of Directors” in the Company’s definitive Proxy Statement for the 2016 Annual Meeting.
Item 14. PRINCIPAL ACCOUNTANT FEES AND SERVICES
The information required by this Item is incorporated by reference to the information under “Ratification of Independent Registered Public Accounting Firm - Fees” and “Ratification of Independent Registered Public Accounting Firm – Pre-Approval of Audit/Non-Audit Services Policy” in the Company’s definitive Proxy Statement for the 2016 Annual Meeting.
| 118 |
Item 15. EXHIBITS AND FINANCIAL STATEMENT SCHEDULES
| (a) | List of documents filed as part of this report: |
| 1. | Financial Statements |
| 2. | Financial Statement Schedules |
SCHEDULE 1 - Condensed financial information of registrant
Otter Tail Corporation (PARENT COMPANY)
| Condensed Balance Sheets, December 31 | ||||||||
| (in thousands) | 2015 | 2014 | ||||||
ASSETS | ||||||||
| Current Assets | ||||||||
| Cash and Cash Equivalents | $ | — | $ | — | ||||
| Accounts Receivable | 38 | — | ||||||
| Accounts Receivable from Subsidiaries | 2,311 | 4,651 | ||||||
| Interest Receivable from Subsidiaries | 175 | 191 | ||||||
| Income Taxes Receivable | 4,000 | — | ||||||
| Notes Receivable from Subsidiaries | 5,645 | 13,553 | ||||||
| Other | 1,096 | 1,105 | ||||||
| Total Current Assets | 13,265 | 19,500 | ||||||
| Investments in Subsidiaries | 713,344 | 605,242 | ||||||
| Notes Receivable from Subsidiaries | 72,560 | 52,060 | ||||||
| Deferred Income Taxes | 37,406 | 50,527 | ||||||
| Other Assets | 27,079 | 27,365 | ||||||
| Total Assets | $ | 863,654 | $ | 754,694 | ||||
| Liabilities and Equity | ||||||||
| Current Liabilities | ||||||||
| Short-Term Debt | $ | 59,666 | $ | 10,854 | ||||
| Current Maturities of Long-Term Debt | 52,544 | 201 | ||||||
| Accounts Payable to Subsidiaries | 5,959 | 5,990 | ||||||
| Notes Payable to Subsidiaries | 99,467 | 67,218 | ||||||
| Other | 6,035 | 7,316 | ||||||
| Total Current Liabilities | 223,671 | 91,579 | ||||||
| Other Noncurrent Liabilities | 34,015 | 36,860 | ||||||
| Commitments and Contingencies | ||||||||
| Capitalization | ||||||||
| Long-Term Debt, Net of Current Maturities | 945 | 53,489 | ||||||
| Common Shareholder Equity | 605,023 | 572,766 | ||||||
| Total Capitalization | 605,968 | 626,255 | ||||||
| Total Liabilities and Equity | $ | 863,654 | $ | 754,694 | ||||
| See accompanying notes to condensed financial statements. | ||||||||
| 119 |
| Otter Tail Corporation (PARENT COMPANY) | ||||||||||||
| Condensed Statements of Income—For the Years Ended December 31 | ||||||||||||
| (in thousands) | 2015 | 2014 | 2013 | |||||||||
| Operating Loss | ||||||||||||
| Revenue | $ | — | $ | — | $ | — | ||||||
| Operating Expenses | 10,188 | 12,593 | 14,150 | |||||||||
| Operating Loss | (10,188 | ) | (12,593 | ) | (14,150 | ) | ||||||
| Other Income (Expense) | ||||||||||||
| Equity Income in Earnings of Subsidiaries | 66,067 | 64,926 | 66,468 | |||||||||
| Loss on Early Retirement of Debt | — | — | (10,252 | ) | ||||||||
| Interest Charges | (6,786 | ) | (6,326 | ) | (9,940 | ) | ||||||
| Interest Charges to Subsidiaries | (193 | ) | (117 | ) | (494 | ) | ||||||
| Interest Income from Subsidiaries | 4,786 | 4,980 | 5,318 | |||||||||
| Other Income | 421 | 1,379 | 1,413 | |||||||||
| Total Other Income | 64,295 | 64,842 | 52,513 | |||||||||
| Income Before Income Taxes | 54,107 | 52,249 | 38,363 | |||||||||
| Income Tax Benefit | (5,238 | ) | (5,474 | ) | (12,502 | ) | ||||||
| Total Net Income | 59,345 | 57,723 | 50,865 | |||||||||
| Preferred Dividend Requirement and Other Adjustments | — | — | 513 | |||||||||
| Earnings Available for Common Shares | $ | 59,345 | $ | 57,723 | $ | 50,352 | ||||||
| See accompanying notes to condensed financial statements. | ||||||||||||
| Otter Tail Corporation (PARENT COMPANY) | ||||||||||||
| Condensed Statements of Cash Flows—For the Years Ended December 31 | ||||||||||||
| (in thousands) | 2015 | 2014 | 2013 | |||||||||
| Cash Flows from Operating Activities | ||||||||||||
| Net Cash Provided by Operating Activities | $ | 53,958 | $ | 47,697 | $ | 70,376 | ||||||
| Cash Flows from Investing Activities | ||||||||||||
| (Investment in Subsidiaries) Return of Capital | (88,079 | ) | (44,000 | ) | 150,381 | |||||||
| Debt Issued to Subsidiaries | (12,592 | ) | (7,662 | ) | (141,919 | ) | ||||||
| Cash Used in Investing Activities | (11 | ) | (44 | ) | (37 | ) | ||||||
| Net Cash (Used in) Provided by Investing Activities | (100,682 | ) | (51,706 | ) | 8,425 | |||||||
| Cash Flows from Financing Activities | ||||||||||||
| Change in Checks Written in Excess of Cash | 213 | 215 | — | |||||||||
| Net Short-Term Borrowings | 48,812 | 10,854 | — | |||||||||
| Borrowings from Subsidiaries | 32,249 | 4,656 | — | |||||||||
| Proceeds from Issuance of Common Stock | 14,233 | 26,259 | 1,821 | |||||||||
| Common Stock Issuance Expenses | (451 | ) | (673 | ) | (3 | ) | ||||||
| Payments for Retirement of Capital Stock | (1,596 | ) | (590 | ) | (15,723 | ) | ||||||
| Short-Term and Long-Term Debt Issuance Expenses | (312 | ) | (170 | ) | (238 | ) | ||||||
| Payments for Retirement of Long-Term Debt | (201 | ) | (188 | ) | (47,846 | ) | ||||||
| Premium Paid for Early Retirement of Long-Term Debt | — | — | (9,889 | ) | ||||||||
| Dividends Paid and Other Distributions | (46,223 | ) | (44,261 | ) | (43,818 | ) | ||||||
| Net Cash Provided by (Used in) Financing Activities | 46,724 | (3,898 | ) | (115,696 | ) | |||||||
| Net Change in Cash and Cash Equivalents | — | (7,907 | ) | (36,895 | ) | |||||||
| Cash and Cash Equivalents at Beginning of Period | — | 7,907 | 44,802 | |||||||||
| Cash and Cash Equivalents at End of Period | $ | — | $ | — | $ | 7,907 | ||||||
| See accompanying notes to condensed financial statements. | ||||||||||||
| 120 |
Otter Tail Corporation (Parent Company)
Notes to Condensed Financial Statements
For the years ended December 31, 2015, 2014 and 2013
Incorporated by reference are Otter Tail Corporation’s consolidated statements of comprehensive income and common shareholders’ equity in Part II, Item 8.
Basis of Presentation
The condensed financial information of Otter Tail Corporation is presented to comply with Rule 12-04 of Regulation S-X. The unconsolidated condensed financial statements do not reflect all of the information and notes normally included with financial statements prepared in accordance with GAAP. Therefore, these condensed financial statements should be read with the consolidated financial statements and related notes included in this Annual Report on Form 10-K.
Otter Tail Corporation’s investments in subsidiaries are presented under the equity method of accounting. Under this method, the assets and liabilities of subsidiaries are not consolidated. The investments in net assets of the subsidiaries are recorded in the balance sheets. The income (loss) from operations of the subsidiaries is reported on a net basis as equity income (loss) in earnings of subsidiaries.
Related Party Transactions
As of December 31, 2015:
| (in thousands) | Accounts Receivable | Interest Receivable | Current Notes Receivable | Long-Term Notes Receivable | Accounts Payable | Current Notes Payable | ||||||||||||||||||
| Otter Tail Power Company | $ | 1,928 | $ | — | $ | — | $ | — | $ | 11 | $ | — | ||||||||||||
| Vinyltech Corporation | — | 32 | — | 8,500 | — | 14,844 | ||||||||||||||||||
| Northern Pipe Products, Inc. | — | 8 | — | 3,160 | — | 7,088 | ||||||||||||||||||
| BTD Manufacturing, Inc. | 13 | 107 | 3,924 | 53,500 | — | — | ||||||||||||||||||
| Wind Tower Business | — | — | 1,444 | — | — | — | ||||||||||||||||||
| Dock and Boatlift Business | — | — | 277 | — | — | — | ||||||||||||||||||
| T.O. Plastics, Inc. | — | 28 | — | 7,400 | — | 6,405 | ||||||||||||||||||
| Varistar Corporation | 60 | — | — | — | 5,948 | 71,130 | ||||||||||||||||||
| Otter Tail Assurance Limited | 310 | — | — | — | — | — | ||||||||||||||||||
| $ | 2,311 | $ | 175 | $ | 5,645 | $ | 72,560 | $ | 5,959 | $ | 99,467 | |||||||||||||
As of December 31, 2014:
| (in thousands) | Accounts Receivable | Interest Receivable | Current Notes Receivable | Long-Term Notes Receivable | Accounts Payable | Current Notes Payable | ||||||||||||||||||
| Otter Tail Power Company | $ | 3,599 | $ | — | $ | — | $ | — | $ | 42 | $ | — | ||||||||||||
| Vinyltech Corporation | 2 | 32 | — | 8,500 | — | 13,995 | ||||||||||||||||||
| Northern Pipe Products, Inc. | — | 8 | — | 3,360 | — | 9,233 | ||||||||||||||||||
| BTD Manufacturing, Inc. | 33 | 107 | — | 28,500 | — | 55 | ||||||||||||||||||
| Wind Tower Business | — | — | 1,602 | — | — | — | ||||||||||||||||||
| Dock and Boatlift Business | — | — | — | — | — | 378 | ||||||||||||||||||
| T.O. Plastics, Inc. | — | 28 | — | 7,400 | — | 6,477 | ||||||||||||||||||
| AEV, Inc. | 86 | 7 | — | 1,800 | — | — | ||||||||||||||||||
| Foley Company | 35 | 9 | 11,951 | 2,500 | — | 6,004 | ||||||||||||||||||
| Varistar Corporation | 816 | — | — | — | 5,948 | 31,076 | ||||||||||||||||||
| Otter Tail Assurance Limited | 80 | — | — | — | — | — | ||||||||||||||||||
| $ | 4,651 | $ | 191 | $ | 13,553 | $ | 52,060 | $ | 5,990 | $ | 67,218 | |||||||||||||
Dividends
Dividends paid to Otter Tail Corporation (the Parent) from its subsidiaries were as follows:
| (in thousands) | 2015 | 2014 | 2013 | |||||||||
| Cash Dividends Paid to Parent by Subsidiaries | $ | 46,188 | $ | 44,261 | $ | 91,693 | ||||||
See Otter Tail Corporation’s notes to consolidated financial statements in Part II, Item 8 for other disclosures.
| 121 |
Other schedules are omitted because of the absence of the conditions under which they are required, because the amounts are insignificant or because the information required is included in the financial statements or the notes thereto.
| 3. | Exhibits |
The following Exhibits are filed as part of, or incorporated by reference into, this report.
| Previously Filed | ||||||
| File No. | As Exhibit No. | |||||
| 2-A | 8-K filed 7/1/09 | 2.1 | —Plan of Merger, dated as of June 30, 2009, by and among Otter Tail Corporation (now known as Otter Tail Power Company), Otter Tail Holding Company (now known as Otter Tail Corporation) and Otter Tail Merger Sub Inc. | |||
| 3-A | 8-K filed 7/1/09 | 3.1 | —Restated Articles of Incorporation. | |||
| 3-B | 8-K filed 7/1/09 | 3.2 | —Restated Bylaws. | |||
| 4-A | 8-K filed 8/23/07 | 4.1 | —Note Purchase Agreement, dated as of August 20, 2007. | |||
| 4-A-1 | 8-K filed 12/20/07 | 4.3 | —First Amendment, dated as of December 14, 2007, to Note Purchase Agreement, dated as of August 20, 2007. | |||
| 4-A-2 | 8-K filed 9/15/08 | 4.1 | —Second Amendment, dated as of September 11, 2008, to Note Purchase Agreement, dated as of August 20, 2007. | |||
| 4-A-3 | 8-K filed 7/1/09 | 4.2 | —Third Amendment, dated as of June 26, 2009, to Note Purchase Agreement dated as of August 20, 2007. | |||
| 4-B | 8-K filed 11/2/12 | 4.1 | —Third Amended and Restated Credit Agreement dated as of October 29, 2012 among Otter Tail Corporation, the Banks named therein, Bank of America, N.A. and JPMorgan Chase Bank, N.A., as Co-Syndication Agents, KeyBank National Association, as Documentation Agent, U.S. Bank National Association, as administration agent for the Banks and U.S. Bank National Association, Merrill Lynch, Pierce, Fenner & Smith Incorporated and J.P. Morgan Securities LLC, as Joint Lead Arrangers and Joint Book Runners. | |||
| 4-B-1 | 8-K filed 11/1/13 | 4.1 | —First Amendment to Third Amended and Restated Credit Agreement, dated as of October 29, 2013, among Otter Tail Corporation, U.S. Bank National Association, as Administrative Agent and as a Bank, Bank of America, N.A. and JPMorgan Chase Bank, N.A., each as a Co-Syndication Agent and as a Bank, KeyBank National Association, as Documentation Agent and as a Bank, and Bank of the West and Union Bank, N.A., as Banks. | |||
| 4-B-2 | 8-K filed 11/4/14 | 4.1 | —Second Amendment to Third Amended and Restated Credit Agreement, dated as of November 3, 2014, among Otter Tail Corporation, U.S. Bank National Association, as Administrative Agent and as a Bank, Bank of America, N.A. and JPMorgan Chase Bank, N.A., each as a Co-Syndication Agent and as a Bank, KeyBank National Association, as Documentation Agent and as a Bank, and Bank of the West as a Bank. | |||
| 4-B-3 | 8-K filed 11/3/15 | 4.1 | —Third Amendment to Third Amended and Restated Credit Agreement, dated as of October 29, 2015, among Otter Tail Corporation, U.S. Bank National Association, as Administrative Agent and as a Bank, Bank of America, N.A. and JPMorgan Chase Bank, N.A., each as a Co-Syndication Agent and as a Bank, KeyBank National Association, as Documentation Agent and as a Bank, and Bank of the West as a Bank. | |||
| 122 |
| Previously Filed | ||||||
| File No. | As Exhibit No. | |||||
| 4-C | 8-K filed 11/2/12 | 4.2 | —Second Amended and Restated Credit Agreement dated as of October 29, 2012 among Otter Tail Power Company, the Banks named therein, JPMorgan Chase Bank, N.A. and Bank of America, N.A., as Co-Syndication Agents, KeyBank National Association and CoBank, ACB, as Co-Documentation Agents, U.S. Bank National Association, as administrative agent for the Banks, and U.S. Bank National Association, Merrill Lynch, Pierce, Fenner & Smith Incorporated and J.P. Morgan Securities LLC, as Joint Lead Arrangers and Joint Book Runners. | |||
| 4-C-1 | 8-K filed 11/1/13 | 4.2 | — First Amendment to Second Amended and Restated Credit Agreement, dated as of October 29, 2013, among Otter Tail Power Company, U.S. Bank National Association, as Administrative Agent and as a Bank, Bank of America, N.A. and JPMorgan Chase Bank, N.A., each as a Co-Syndication Agent and as a Bank, KeyBank National Association, as Documentation Agent and as a Bank, CoBank, ACB, as a Co-Documentation Agent and as a Bank, and Wells Fargo Bank, National Association and Union Bank, N.A., as Banks. | |||
| 4-C-2 | 8-K filed 11/4/14 | 4.2 | — Second Amendment to Second Amended and Restated Credit Agreement, dated as of November 3, 2014, among Otter Tail Power Company, U.S. Bank National Association, as Administrative Agent and as a Bank, Bank of America, N.A. and JPMorgan Chase Bank, N.A., each as a Co-Syndication Agent and as a Bank, KeyBank National Association, as Documentation Agent and as a Bank, CoBank, ACB, as a Co-Documentation Agent and as a Bank, and Wells Fargo Bank, National Association as a Bank. | |||
| 4-C-3 | 8-K filed 11/3/15 | 4.2 | — Third Amendment to Second Amended and Restated Credit Agreement, dated as of October 29, 2015, among Otter Tail Power Company, U.S. Bank National Association, as Administrative Agent and as a Bank, Bank of America, N.A. and JPMorgan Chase Bank, N.A., each as a Co-Syndication Agent and as a Bank, KeyBank National Association, as Documentation Agent and as a Bank, CoBank, ACB, as a Co-Documentation Agent and as a Bank, and Wells Fargo Bank, National Association as a Bank. | |||
| 4-D | 8-K filed 8/3/11 | 4.1 | —Note Purchase Agreement, dated as of July 29, 2011, between Otter Tail Power Company and the Purchasers named therein. | |||
| 4-E | 8-K filed 11/18/97 | 4-D-11 | —Indenture (For Unsecured Debt Securities) dated as of November 1, 1997 between the registrant and U.S. Bank National Association (formerly First Trust National Association), as Trustee. | |||
| 4-F-1 | 8-K filed 7/1/09 | 4.1 | —First Supplemental Indenture, dated as of July 1, 2009, to the Indenture (For Unsecured Debt Securities) dated as of November 1, 1997. | |||
| 4-F-2 | 8-K filed 12/4/09 | 4.1 | —Officer’s Certificate and Authentication Order, dated December 4, 2009, for the 9.000% Notes due 2016 (which includes the form of Note) issued pursuant to the Indenture (For Unsecured Debt Securities) dated as of November 1, 1997 and the First Supplemental Indenture thereto, dated as of July 1, 2009. | |||
| 4-G | 8-K filed 8/16/13 | 4.1 | —Note Purchase Agreement dated as of August 14, 2013 between Otter Tail Power Company and the Purchasers named therein. | |||
| 10-A | 2-39794 | 4-C | —Integrated Transmission Agreement, dated August 25, 1967, between Cooperative Power Association and the Company. | |||
| 10-A-1 | 10-K for year ended 12/31/92 | 10-A-1 | —Amendment No. 1, dated as of September 6, 1979, to Integrated Transmission Agreement, dated as of August 25, 1967, between Cooperative Power Association and the Company. | |||
| 10-A-2 | 10-K for year ended 12/31/92 | 10-A-2 | —Amendment No. 2, dated as of November 19, 1986, to Integrated Transmission Agreement between Cooperative Power Association and the Company. | |||
| 123 |
| Previously Filed | ||||||
| File No. | As Exhibit No. | |||||
| 10-C-1 | 2-55813 | 5-E | —Contract dated July 1, 1958, between Central Power Electric Corporation, Inc., and the Company. | |||
| 10-C-2 | 2-55813 | 5-E-1 | —Supplement Seven dated November 21, 1973. (Supplements Nos. One through Six have been superseded and are no longer in effect.) | |||
| 10-C-3 | 2-55813 | 5-E-2 | —Amendment No. 1 dated December 19, 1973, to Supplement Seven. | |||
| 10-C-4 | 10-K for year ended 12/31/91 | 10-C-4 | —Amendment No. 2 dated June 17, 1986, to Supplement Seven. | |||
| 10-C-5 | 10-K for year ended 12/31/92 | 10-C-5 | —Amendment No. 3 dated June 18, 1992, to Supplement Seven. | |||
| 10-C-6 | 10-K for year ended 12/31/93 | 10-C-6 | —Amendment No. 4 dated January 18, 1994 to Supplement Seven. | |||
| 10-D | 2-55813 | 5-F | —Contract dated April 12, 1973, between the Bureau of Reclamation and the Company. | |||
| 10-E-1 | 2-55813 | 5-G | —Contract dated January 8, 1973, between East River Electric Power Cooperative and the Company. | |||
| 10-E-2 | 2-62815 | 5-E-1 | —Supplement One dated February 20, 1978. | |||
| 10-E-3 | 10-K for year ended 12/31/89 | 10-E-3 | —Supplement Two dated June 10, 1983. | |||
| 10-E-4 | 10-K for year ended 12/31/90 | 10-E-4 | —Supplement Three dated June 6, 1985. | |||
| 10-E-5 | 10-K for year ended 12/31/92 | 10-E-5 | —Supplement No. Four, dated as of September 10, 1986. | |||
| 10-E-6 | 10-K for year ended 12/31/92 | 10-E-6 | —Supplement No. Five, dated as of January 7, 1993. | |||
| 10-E-7 | 10-K for year ended 12/31/93 | 10-E-7 | —Supplement No. Six, dated as of December 2, 1993. | |||
| 10-F | 10-K for year ended 12/31/89 | 10-F | —Agreement for Sharing Ownership of Generating Plant by and between the Company, Montana-Dakota Utilities Co., and Northwestern Public Service Company (dated as of January 7, 1970). | |||
| 10-F-1 | 10-K for year ended 12/31/89 | 10-F-1 | —Letter of Intent for purchase of share of Big Stone Plant from Northwestern Public Service Company (dated as of May 8, 1984). | |||
| 10-F-2 | 10-K for year ended 12/31/91 | 10-F-2 | —Supplemental Agreement No. 1 to Agreement for Sharing Ownership of Big Stone Plant (dated as of July 1, 1983). | |||
| 10-F-3 | 10-K for year ended 12/31/91 | 10-F-3 | —Supplemental Agreement No. 2 to Agreement for Sharing Ownership of Big Stone Plant (dated as of March 1, 1985). | |||
| 10-F-4 | 10-K for year ended 12/31/91 | 10-F-4 | —Supplemental Agreement No. 3 to Agreement for Sharing Ownership of Big Stone Plant (dated as of March 31, 1986). | |||
| 10-F-5 | 10-Q for quarter ended 9/30/03 | 10.1 | —Supplemental Agreement No. 4 to Agreement for Sharing Ownership of Big Stone Plant (dated as of April 24, 2003). | |||
| 10-F-6 | 10-K for year ended 12/31/92 | 10-F-5 | —Amendment I to Letter of Intent dated May 8, 1984, for purchase of share of Big Stone Plant. | |||
| 10-G | 10-Q for quarter ended 6/30/04 | 10.3 | —Master Coal Purchase and Sale Agreement by and between the Company, Montana-Dakota Utilities Co., Northwestern Corporation and Kennecott Coal Sales Company-Big Stone Plant (dated as of June 1, 2004). | |||
| 10-H | 2-61043 | 5-H | —Agreement for Sharing Ownership of Coyote Station Generating Unit No. 1 by and between the Company, Minnkota Power Cooperative, Inc., Montana-Dakota Utilities Co., Northwestern Public Service Company and Minnesota Power & Light Company (dated as of July 1, 1977). | |||
| 124 |
| Previously Filed | ||||||
| File No. | As Exhibit No. | |||||
| 10-H-1 | 10-K for year ended 12/31/89 | 10-H-1 | —Supplemental Agreement No. One, dated as of November 30, 1978, to Agreement for Sharing Ownership of Coyote Generating Unit No. 1. | |||
| 10-H-2 | 10-K for year ended 12/31/89 | 10-H-2 | —Supplemental Agreement No. Two, dated as of March 1, 1981, to Agreement for Sharing Ownership of Coyote Generating Unit No. 1 and Amendment No. 2 dated March 1, 1981, to Coyote Plant Coal Agreement. | |||
| 10-H-3 | 10-K for year ended 12/31/89 | 10-H-3 | —Amendment, dated as of July 29, 1983, to Agreement for Sharing Ownership of Coyote Generating Unit No. 1. | |||
| 10-H-4 | 10-K for year ended 12/31/92 | 10-H-4 | —Agreement, dated as of September 5, 1985, containing Amendment No. 3 to Agreement for Sharing Ownership of Coyote Generating Unit No. 1, dated as of July 1, 1977, and Amendment No. 5 to Coyote Plant Coal Agreement, dated as of January 1, 1978. | |||
| 10-H-5 | 10-Q for quarter ended 9/30/01 | 10-A | —Amendment, dated as of June 14, 2001, to Agreement for Sharing Ownership of Coyote Generating Unit No. 1. | |||
| 10-H-6 | 10-Q for quarter ended 9/30/03 | 10.2 | —Amendment, dated as of April 24, 2003, to Agreement for Sharing Ownership of Coyote Generating Unit No. 1. | |||
| 10-I | 2-63744 | 5-I | —Coyote Plant Coal Agreement by and between the Company, Minnkota Power Cooperative, Inc., Montana-Dakota Utilities Co., Northwestern Public Service Company, Minnesota Power & Light Company, and Knife River Coal Mining Company (dated as of January 1, 1978). | |||
| 10-I-1 | 10-K for year ended 12/31/92 | 10-I-1 | —Addendum, dated as of March 10, 1980, to Coyote Plant Coal Agreement. | |||
| 10-I-2 | 10-K for year ended 12/31/92 | 10-I-2 | —Amendment (No. 3), dated as of May 28, 1980, to Coyote Plant Coal Agreement. | |||
| 10-I-3 | 10-K for year ended 12/31/92 | 10-I-3 | —Fourth Amendment, dated as of August 19, 1985, to Coyote Plant Coal Agreement. | |||
| 10-I-4 | 10-Q for quarter ended 6/30/93 | 19-A | —Sixth Amendment, dated as of February 17, 1993, to Coyote Plant Coal Agreement. | |||
| 10-I-5 | 10-K for year ended 12/31/01 | 10-I-5 | —Agreement and Consent to Assignment of the Coyote Plant Coal Agreement. | |||
| 10-J | 10-K for year ended 12/31/12 | 10-J | —Lignite Sales Agreement between Coyote Creek Mining Company, L.L.C. and Otter Tail Power Company, Northern Municipal Power Agency, Montana-Dakota Utilities Co., Northwestern Corporation, dated as of October 10, 2012.** | |||
| 10-J-1 | 8-K filed 1/31/14 | 10.1 | —First Amendment to Lignite Sales Agreement dated as of January 30, 2014 among Otter Tail Power Company, Northern Municipal Power Agency, Montana-Dakota Utilities Co., a division of MDU Resources Group, Inc., NorthWestern Corporation and Coyote Creek Mining Company, L.L.C. | |||
| 10-J-2 | 8-K filed 3/18/15 | 10.1 | —Second Amendment to Lignite Sales Agreement dated as of March 16, 2015 among Otter Tail Power Company, Northern Municipal Power Agency, Montana-Dakota Utilities Co., a division of MDU Resources Group, Inc., NorthWestern Corporation and Coyote Creek Mining Company, L.L.C. | |||
| 10-K | 10-K for year ended 12/31/91 | 10-L | —Integrated Transmission Agreement by and between the Company, Missouri Basin Municipal Power Agency and Western Minnesota Municipal Power Agency (dated as of March 31, 1986). | |||
| 10-K-1 | 10-K for year ended 12/31/88 | 10-L-1 | —Amendment No. 1, dated as of December 28, 1988, to Integrated Transmission Agreement (dated as of March 31, 1986). | |||
| 10-L | 10-Q for quarter ended 6/30/04 | 10.1 | —Master Coal Purchase Agreement by and between the Company and Kennecott Coal Sales Company - Hoot Lake Plant (dated as of December 31, 2001). | |||
| 125 |
| Previously Filed | ||||||
| File No. | As Exhibit No. | |||||
| 10-M | 10-Q for quarter ended 3/31/13 | 10.1 | —General Work Construction Agreement, dated as of February 1, 2013, between Otter Tail Power Company, in its capacity as agent for itself, Northwestern Corporation d/b/a NorthWestern Energy and Montana-Dakota Utilities Co., a division of MDU Resources Group, Inc., and Graycor Industrial Constructors Inc.** | |||
| 10-N | 10-Q/A for quarter ended 6/30/13 | 10.1 | —Wind Energy Purchase Agreement dated May 9, 2013 between Otter Tail Power Company and Ashtabula Wind III, LLC.** | |||
| 10-O-1 | 10-K for year ended 12/31/02 | 10-N-1 | —Deferred Compensation Plan for Directors, as amended.* | |||
| 10-O-1a | 10-K for year ended 12/31/10 | 10-N-1A | —First Amendment of Deferred Compensation Plan for Directors (2003 Restatement), as amended.* | |||
| 10-O-1b | 8-K filed 4/17/14 | 10.5 | —Second Amendment of Deferred Compensation Plan for Directors (2003 Restatement), as amended.* | |||
| 10-O-2 | 8-K filed 2/04/05 | 10.1 | —Executive Survivor and Supplemental Retirement Plan (2005 Restatement).* | |||
| 10-O-2a | 10-K for year ended 12/31/06 | 10-N-2a | —First Amendment of Executive Survivor and Supplemental Retirement Plan (2005 Restatement).* | |||
| 10-O-2b | 10-K for year ended 12/31/10 | 10-N-2B | —Second Amendment of Executive Survivor and Supplemental Retirement Plan (2005 Restatement).* | |||
| 10-O-4 | 10-Q for quarter ended 3/31/02 | 10-B | —Nonqualified Retirement Savings Plan, as amended.* | |||
| 10-O-5 | 10-Q for quarter ended 9/30/11 | 10.1 | —Nonqualified Retirement Plan (2011 Restatement).* | |||
| 10-O-6 | 8-K filed 4/19/12 | 10.1 | —1999 Employee Stock Purchase Plan, As Amended (2012). | |||
| 10-O-7 | 8-K filed 4/13/06 | 10.4 | —1999 Stock Incentive Plan, As Amended (2006). | |||
| 10-O-8 | 8-K filed 4/19/12 | 10.2 | —Form of 2012 Restricted Stock Award Agreement for Executive Officers.* | |||
| 10-O-9 | 8-K filed 4/19/12 | 10.3 | —Form of 2012 Performance Award Agreement.* | |||
| 10-O-10 | 10-K for year ended 12/31/11 | 10-N-11 | —Executive Annual Incentive Plan.* | |||
| 10-O-11 | 8-K filed 4/19/12 | 10.4 | —Form of 2012 Restricted Stock Unit Award Agreement.* | |||
| 10-O-12 | 8-K filed 4/13/06 | 10.1 | —Form of Restricted Stock Award Agreement for Directors.* | |||
| 10-O-13 | 10-K for year ended 12/31/13 | 10-O-12 | —2014 Executive Annual Incentive Plan.* | |||
| 10-O-14 | 333-195337 | 4.1 | —Otter Tail Corporation 2014 Stock Incentive Plan. | |||
| 10-O-15 | 8-K filed 4/17/14 | 10.1 | —Form of 2014 Performance Award Agreement.* | |||
| 10-O-16 | 8-K filed 4/17/14 | 10.2 | —Form of 2014 Restricted Stock Award Agreement for Executive Officers.* | |||
| 10-O-17 | 8-K filed 4/17/14 | 10.3 | —Form of 2014 Restricted Stock Award Agreement for Directors.* | |||
| 10-O-18 | 8-K filed 4/17/14 | 10.4 | —Summary of Non-Employee Director Compensation. | |||
| 10-O-19 | 8-K filed 9/26/14 | 10.1 | —Amendment to 2014 Performance Award Agreement with Edward J. McIntyre.* | |||
| 10-O-20 | 8-K filed 9/26/14 | 10.2 | —Amendment to 2013 Performance Award Agreement with Edward J. McIntyre.* | |||
| 10-O-21 | 8-K filed 2/11/15 | 10.1 | —Form of 2015 Performance Award Agreement (Executives).* | |||
| 10-O-22 | 8-K filed 2/11/15 | 10.2 | —Form of 2015 Performance Award Agreement (Legacy).* | |||
| 10-O-23 | 8-K filed 2/11/15 | 10.3 | —Form of 2015 Restricted Stock Unit Award Agreement (Executives).* | |||
| 10-O-24 | 8-K filed 2/11/15 | 10.4 | —Form of 2015 Restricted Stock Unit Award Agreement (Legacy).* | |||
| 126 |
| Previously Filed | ||||||
| File No. | As Exhibit No. | |||||
| 10-O-25 | 8-K filed 2/11/15 | 10.5 | —Otter Tail Corporation Executive Restoration Plus Plan, as Amended and Restated. | |||
| 10-O-26 | 8-K filed 4/15/15 | 10.2 | —Form of 2015 Restricted Stock Award Agreement for Directors.* | |||
| 10-P-1 | 8-K filed 5/14/12 | 1.1 | —Distribution Agreement dated May 14, 2012, between Otter Tail Corporation and J.P. Morgan Securities LLC. | |||
| 10-P-2 | 8-K filed 5/11/15 | 1.1 | —Distribution Agreement dated May 11, 2015, between Otter Tail Corporation and J.P. Morgan Securities LLC. | |||
| 10-Q-1 | 10-K for year ended 12/31/12 | 10-O-1 | —Executive Employment Agreement, Kevin Moug.* | |||
| 10-Q-2 | 10-K for year ended 12/31/12 | 10-O-2 | —Executive Employment Agreement, George Koeck.* | |||
| 10-R-1 | 10-K for year ended 12/31/10 | 10-Q-3 | —Change in Control Severance Agreement, Kevin G. Moug.* | |||
| 10-R-2 | 10-K for year ended 12/31/10 | 10-Q-4 | —Change in Control Severance Agreement, George Koeck.* | |||
| 10-R-3 | 10-K for year ended 12/31/11 | 10-Q-5 | —Change in Control Severance Agreement, Chuck MacFarlane.* | |||
| 10-R-4 | 10-Q for quarter ended 9/30/14 | 10.3 | —Change in Control Severance Agreement, Timothy Rogelstad.* | |||
| 10-R-5 | 10-Q for quarter ended 9/30/14 | 10.6 | —Change in Control Severance Agreement, Paul Knutson.* | |||
| 10-R-6 | —Change in Control Severance Agreement, John Abbott.* | |||||
| 10-S | 8-K filed 4/15/15 | 10.1 | —Otter Tail Corporation Executive Severance Plan.* | |||
| 10-T | 10-Q for quarter ended 6/30/15 | 10.3 | —Big Stone South – Ellendale Project Ownership Agreement dated as of June 12, 2015 between Otter Tail Power Company, a wholly owned subsidiary of Otter Tail Corporation, and Montana-Dakota Utilities Co., a division of MDU Resources Group, Inc.** | |||
| 12.1 | —Calculation of Ratios of Earnings to Fixed Charges and Preferred Dividends. | |||||
| 21-A | —Subsidiaries of Registrant. | |||||
| 23-A | —Consent of Deloitte & Touche LLP. | |||||
| 24-A | —Powers of Attorney. | |||||
| 31.1 | —Certification of Chief Executive Officer Pursuant to Section 302 of the Sarbanes-Oxley Act of 2002. | |||||
| 31.2 | —Certification of Chief Financial Officer Pursuant to Section 302 of the Sarbanes-Oxley Act of 2002. | |||||
| 32.1 | —Certification of Chief Executive Officer Pursuant to Section 906 of the Sarbanes-Oxley Act of 2002. | |||||
| 32.2 | —Certification of Chief Financial Officer Pursuant to Section 906 of the Sarbanes-Oxley Act of 2002. | |||||
| 127 |
| Previously Filed | ||||||
| File No. | As Exhibit No. | |||||
| 101 | —Financial statements from the Annual Report on Form 10-K of Otter Tail Corporation for the year ended December 31, 2015, formatted in Extensible Business Reporting Language: (i) the Consolidated Balance Sheets, (ii) the Consolidated Statements of Income, (iii) the Consolidated Statements of Comprehensive Income, (iv) the Consolidated Statements of Common Shareholders’ Equity, (v) the Consolidated Statements of Cash Flows, (vi) the Consolidated Statements of Capitalization, (vii) the Notes to Consolidated Financial Statements and (viii) Schedule I. | |||||
*Management contract, compensatory plan or arrangement required to be filed pursuant to Item 601(b)(10)(iii)(A) of Regulation S-K.
**Confidential information has been omitted from this Exhibit and filed separately with the Commission pursuant to a confidential treatment request under Rule 24b-2.
Pursuant to Item 601(b)(4)(iii) of Regulation S-K, copies of certain instruments defining the rights of holders of certain long-term debt of the Company are not filed, and in lieu thereof, the Company agrees to furnish copies thereof to the Securities and Exchange Commission upon request.
| 128 |
Pursuant to the requirements of Section 13 or 15(d) of the Securities Exchange Act of 1934, the registrant has duly caused this report to be signed on its behalf by the undersigned, thereunto duly authorized.
| OTTER TAIL CORPORATION |
| By | /s/ Kevin G. Moug | |
| Kevin G. Moug | ||
| Chief Financial Officer and Senior Vice President | ||
| (authorized officer and principal financial officer) |
| Dated: February 29, 2016 |
Pursuant to the requirements of the Securities Exchange Act of 1934, this report has been signed below by the following persons on behalf of the registrant and in the capacities and on the dates indicated:
Signature and Title
| Charles S. MacFarlane | ) | ||
| Chief Executive Officer | ) | ||
| (principal executive officer) and Director | ) | ||
| ) | |||
| Kevin G. Moug | ) | ||
| Chief Financial Officer and Senior Vice President | ) | ||
| (principal financial and accounting officer) | ) | ||
| ) By | /s/ Charles S. MacFarlane | ||
| Nathan I. Partain | ) | Charles S. MacFarlane | |
| Chairman of the Board and Director | ) | Pro Se and Attorney-in-Fact | |
| ) | Dated February 29, 2016 | ||
| Karen M. Bohn, Director | ) | ||
| ) | |||
| John D. Erickson, Director | ) | ||
| ) | |||
| Steven L. Fritze, Director | ) | ||
| ) | |||
| Kathryn O. Johnson, Director | ) | ||
| ) | |||
| Timothy J. O’Keefe, Director | ) | ||
| ) | |||
| Joyce Nelson Schuette, Director | ) | ||
| ) | |||
| James B. Stake, Director | ) | ||
| 129 |
EXHIBIT INDEX
| Exhibit Number | Description | |
| 10-R-6 | Change in Control Severance Agreement, John Abbott. | |
| 12.1 | Calculation of Ratios of Earnings to Fixed Charges and Preferred Dividends. | |
| 21-A | Subsidiaries of the Registrant. | |
| 23-A | Consent of Deloitte & Touche LLP. | |
| 24-A | Power of Attorney. | |
| 31.1 | Certification of Chief Executive Officer Pursuant to Section 302 of the Sarbanes-Oxley Act of 2002. | |
| 31.2 | Certification of Chief Financial Officer Pursuant to Section 302 of the Sarbanes-Oxley Act of 2002. | |
| 32.1 | Certification of Chief Executive Officer Pursuant to Section 906 of the Sarbanes-Oxley Act of 2002. | |
| 32.2 | Certification of Chief Financial Officer Pursuant to Section 906 of the Sarbanes-Oxley Act of 2002. | |
| 101 | Financial statements from the Annual Report on Form 10-K of Otter Tail Corporation for the year ended December 31, 2015, formatted in Extensible Business Reporting Language: (i) the Consolidated Balance Sheets, (ii) the Consolidated Statements of Income, (iii) the Consolidated Statements of Comprehensive Income, (iv) the Consolidated Statements of Common Shareholders’ Equity, (v) the Consolidated Statements of Cash Flows, (vi) the Consolidated Statements of Capitalization, (vii) the Notes to Condensed Consolidated Financial Statements and (viii) Schedule I. |