Attached files
| file | filename |
|---|---|
| EX-10.32 - EXHIBIT 10.32 - LYDALL INC /DE/ | ldl-201512x31exhibit1032.htm |
| EX-10.34 - EXHIBIT 10.34 - LYDALL INC /DE/ | ldl-201512x31exhibit1034.htm |
| EX-10.31 - EXHIBIT 10.31 - LYDALL INC /DE/ | ldl-201512x31exhibit1031.htm |
| EX-21.1 - EXHIBIT 21.1 - LYDALL INC /DE/ | ldl-201512x31exhibit211.htm |
| EX-23.1 - EXHIBIT 23.1 - LYDALL INC /DE/ | ldl-20151231exhibit231.htm |
| EX-32.1 - EXHIBIT 32.1 - LYDALL INC /DE/ | ldl-20151231exhibit321.htm |
| EX-31.1 - EXHIBIT 31.1 - LYDALL INC /DE/ | ldl-201512x31exhibit311.htm |
| EX-31.2 - EXHIBIT 31.2 - LYDALL INC /DE/ | ldl-20151231exhibit312.htm |
| EX-10.33 - EXHIBIT 10.33 - LYDALL INC /DE/ | ldl-201512x31exhibit1033.htm |
| EX-24.1 - EXHIBIT 24.1 - LYDALL INC /DE/ | ldl-201512x31exhibit241.htm |
UNITED STATES SECURITIES AND EXCHANGE COMMISSION
WASHINGTON, D.C. 20549
Form 10-K
ý ANNUAL REPORT PURSUANT TO SECTION 13 OR 15(d) OF THE SECURITIES EXCHANGE ACT OF 1934
For the Fiscal Year Ended December 31, 2015
OR
o TRANSITION REPORT PURSUANT TO SECTION 13 OR 15(d) OF THE SECURITIES EXCHANGE ACT OF 1934
For the transition period from to
Commission File Number: 1-7665
Lydall, Inc.
(Exact name of registrant as specified in its charter)
Delaware | 06-0865505 | |
(State or Other Jurisdiction of Incorporation or Organization) | (I.R.S. Employer Identification No.) | |
One Colonial Road, Manchester, Connecticut | 06042 | |
(Address of principal executive offices) | (Zip code) | |
Registrant’s telephone number, including area code: (860) 646-1233
Securities registered pursuant to Section 12(b) of the Act:
Title of each class | Name of each exchange on which registered | |
Common Stock, $.01 par value | New York Stock Exchange | |
Securities registered pursuant to Section 12(g) of the Act: None
Indicate by check mark if the registrant is a well-known seasoned issuer, as defined in Rule 405 of the Securities Act. Yes o No ý
Indicate by check mark if the registrant is not required to file reports pursuant to Section 13 or Section 15(d) of the Exchange Act. Yes o No ý
Indicate by check mark whether the registrant (1) has filed all reports required to be filed by Section 13 or 15(d) of the Securities Exchange Act of 1934 during the preceding 12 months (or for such shorter period that the registrant was required to file such reports), and (2) has been subject to such filing requirements for the past 90 days. Yes ý No o
Indicate by check mark whether the registrant has submitted electronically and posted on its corporate Web site, if any, every Interactive Data File required to be submitted and posted pursuant to Rule 405 of Regulation S-T (§232.405 of this chapter) during the preceding 12 months (or for such shorter period that the registrant was required to submit and post such files). Yes ý No o
Indicate by check mark if disclosure of delinquent filers pursuant to Item 405 of Regulation S-K (§229.405 of this chapter) is not contained herein, and will not be contained, to the best of the registrant’s knowledge, in definitive proxy or information statements incorporated by reference in Part III of this Form 10-K or any amendment to this Form 10-K. o
Indicate by check mark whether the registrant is a large accelerated filer, an accelerated filer, a non-accelerated filer, or a smaller reporting company. See definitions of “large accelerated filer”, “accelerated filer” and “smaller reporting company” in Rule 12b-2 of the Exchange Act. (Check one):
Large accelerated filer o | Non-accelerated filer o (Do not check if a smaller reporting company) | Accelerated filer ý | Smaller reporting company o | |||
Indicate by check mark whether the registrant is a shell company (as defined in Rule 12b-2 of the Exchange Act). Yes o No ý
On June 30, 2015, the aggregate market value of the Registrant’s voting stock held by nonaffiliates was $482,323,396 based on the New York Stock Exchange closing price on that date. For purposes of this calculation, the Registrant has assumed that its directors and executive officers are affiliates.
On February 17, 2016, there were 17,115,378 shares of Common Stock outstanding, exclusive of treasury shares.
DOCUMENTS INCORPORATED BY REFERENCE
Part III incorporates information by reference to the definitive Proxy Statement to be distributed in connection with the Registrant’s
Annual Meeting of Stockholders to be held on April 29, 2016.
The exhibit index is located on pages 42 – 44.
INDEX TO ANNUAL REPORT ON FORM 10-K
Year Ended December 31, 2015
Page Number | ||
PART I | ||
PART II | ||
Other Information | ||
PART III | ||
PART IV | ||
The information called for by Items 10, 11, 12, 13 and 14, to the extent not included in this document, is incorporated herein by reference to such information included in the Company’s definitive Proxy Statement to be filed with the Securities and Exchange Commission and distributed in connection with Lydall, Inc.’s 2016 Annual Meeting of Stockholders to be held on April 29, 2016.
i
CAUTIONARY NOTE CONCERNING FORWARD-LOOKING STATEMENTS
Lydall, Inc. and its subsidiaries are hereafter collectively referred to as “Lydall,” the “Company” or the “Registrant.” Lydall and its subsidiaries’ names, abbreviations thereof, logos, and product and service designators are all either the registered or unregistered trademarks or trade names of Lydall and its subsidiaries.
This Annual Report on Form 10-K contains “forward-looking statements” within the meaning of Section 21E of the Securities Exchange Act of 1934, as amended (the “Exchange Act”). Any statements contained in this Annual Report on Form 10-K that are not statements of historical fact may be deemed to be forward-looking statements. All such forward-looking statements are intended to provide management’s current expectations for the future operating and financial performance of the Company based on current assumptions relating to the Company’s business, the economy and future conditions. Forward-looking statements generally can be identified through the use of words such as “believes,” “anticipates,” “may,” “should,” “will,” “plans,” “projects,” “expects,” “expectations,” “estimates,” “forecasts,” “predicts,” “targets,” “prospects,” “strategy,” “signs” and other words of similar meaning in connection with the discussion of future operating or financial performance. Forward-looking statements may include, among other things, statements relating to future sales, earnings, cash flow, results of operations, uses of cash and other measures of financial performance. Because forward-looking statements relate to the future, they are subject to inherent risks, uncertainties and changes in circumstances that are difficult to predict. Accordingly, the Company’s actual results may differ materially from those contemplated by the forward-looking statements. Investors, therefore, are cautioned against relying on any of these forward-looking statements. They are neither statements of historical fact nor guarantees or assurances of future performance. Forward-looking statements in this Annual Report on Form 10-K include, among others, statements relating to:
• | Overall economic and business conditions and the effects on the Company’s markets; |
• | Outlook for the fiscal year 2016; |
• | Expected vehicle production in the North American, European or Asian markets; |
• | Growth opportunities in markets served by the Company; |
• | Expected gross margin, operating margin and working capital improvements from the application of Lean Six Sigma; |
• | Product development and new business opportunities; |
• | Future strategic transactions, including but not limited to: acquisitions, joint ventures, alliances, licensing agreements and divestitures; |
• | Pension plan funding; |
• | Future cash flow and uses of cash; |
• | Future amounts of stock-based compensation expense; |
• | Future earnings and other measurements of financial performance; |
• | Ability to meet cash operating requirements; |
• | Future levels of indebtedness and capital spending; |
• | Ability to meet financial covenants in the Company's revolving credit facility; |
• | Future impact of the variability of interest rates and foreign currency exchange rates; |
• | Expected future impact of recently issued accounting pronouncements upon adoption; |
• | Future effective income tax rates and realization of deferred tax assets; |
• | Estimates of fair values of reporting units and long-lived assets used in assessing goodwill and long-lived assets for possible impairment; and |
• | The expected outcomes of legal proceedings and other contingencies. |
All forward-looking statements are inherently subject to a number of risks and uncertainties that could cause the actual results of the Company to differ materially from those reflected in forward-looking statements made in this Annual Report on Form 10-K, as well as in press releases and other statements made from time to time by the Company’s authorized officers. Such risks and uncertainties include, among others, worldwide economic cycles and political
ii
changes that affect the markets which the Company’s businesses serve, which could have an effect on demand for the Company’s products and impact the Company’s profitability; disruptions in the global credit and financial markets, including diminished liquidity and credit availability; swings in consumer confidence and spending; unstable economic growth; volatility in foreign currency exchange rates; raw material pricing and supply issues; fluctuations in unemployment rates; retention of key employees; increases in fuel prices; and outcomes of legal proceedings, claims and investigations, and with respect to possible violations of German anti-trust laws by employees in the Company's German operation; as well as other risks and uncertainties identified in Part I, Item 1A — Risk Factors of this Annual Report on Form 10-K. The Company does not assume any obligation to update any forward-looking statements, whether as a result of new information, future events or otherwise.
iii
PART I
Item 1. | BUSINESS |
Lydall, Inc. has been incorporated in Delaware since 1987 after originally being incorporated in Connecticut in 1969. The principal executive offices are located in Manchester, Connecticut. The Company designs and manufactures specialty engineered filtration media, industrial thermal insulating solutions, automotive thermal and acoustical barriers for filtration/separation and thermal/acoustical applications.
Lydall serves a number of markets. The Company’s products are primarily sold directly to customers through an internal sales force and distributed via common carrier. The majority of products are sold to original equipment manufacturers and tier-one suppliers. The Company differentiates itself through high-quality, specialty engineered innovative products and exceptional customer service. Lydall has a number of domestic and foreign competitors for its products, most of whom are either privately owned or divisions of larger companies.
The Company’s Annual Reports on Form 10-K, Quarterly Reports on Form 10-Q, Current Reports on Form 8-K and Proxy Statements are made available free of charge through the Investor Relations section of the Company’s Internet website at www.lydall.com after such material is electronically filed with, or furnished to, the Securities and Exchange Commission (the “Commission”) and are also available on the Commission’s website at www.sec.gov. Information found on these websites is not part of this Form 10-K. Additionally, the public may read and copy any materials the Company files with the Commission at the Commission’s Public Reference room located at 100 F Street, N.E., Washington, D.C. 20549. The public may obtain information on the operation of the Public Reference Room by calling the Commission at 1-800-SEC-0330.
SEGMENTS
The Company’s reportable segments are Performance Materials, Industrial Filtration, Thermal/Acoustical Metals, and Thermal/Acoustical Fibers. The Performance Materials segment reports the results of the Filtration, Thermal Insulation and Life Sciences Filtration businesses. The Industrial Filtration segment reports the results of Lydall's industrial non-woven felt media and filter bag business. The Thermal/Acoustical Metals segment reports the results of Lydall’s metal parts and related tooling and the Thermal/Acoustical Fibers segment reports the results of Lydall’s fiber parts and related tooling with both used primarily in automotive applications. Other Products and Services (“OPS”) was Life Sciences Vital Fluids that was divested by Lydall on January 30, 2015. For additional information regarding the Company’s reportable segments, please refer to Note 10 in the Consolidated Financial Statements included in this Annual Report on Form 10-K.
Performance Materials Segment
The Performance Materials segment includes filtration media solutions primarily for air, fluid power, and industrial applications (“Filtration”), thermal insulation solutions for building products, appliances, and energy and industrial markets (“Thermal Insulation”), and air and liquid life science applications (“Life Sciences Filtration”).
Filtration products include LydAir® MG (Micro-Glass) Air Filtration Media, LydAir® MB (Melt Blown) Air Filtration Media, LydAir® SC (Synthetic Composite) Air Filtration Media, and Arioso™ Membrane Composite Media. These products constitute the critical media component of clean-air systems for applications in clean-space, commercial, industrial and residential HVAC, power generation, and industrial processes. The LyPore® Liquid Filtration Media series address a variety of application needs in fluid power including hydraulic filters, air-water and air-oil coalescing, industrial fluid processes and diesel fuel filtration.
Thermal Insulation products are high performance non-woven veils, papers, mats and specialty composites for the building products, appliance, and energy and industrial markets. The Manniglas® Thermal Insulation brand is diverse in its product application ranging from high temperature seals and gaskets in ovens and ranges to specialty veils for HVAC and cavity wall insulation. The appLY® Mat Needled Glass Mats have been developed to expand Lydall’s high temperature technology portfolio for broad application into the appliance market and supplements the Lytherm® Insulation Media product brand, traditionally utilized in the industrial market for kilns and furnaces used in metal processing. Lydall’s Cryotherm® Super-Insulating Media, CRS-Wrap® Super-Insulating Media and Cryo-Lite™ Cryogenic Insulation products are industry standards for state-of-the-art cryogenic insulation designs used by manufacturers of cryogenic equipment for liquid gas storage, piping, and transportation.
1
Life Sciences Filtration products have been developed to meet the requirements of life science applications including biopharmaceutical pre-filtration and clarification, diagnostic and analytical testing, respiratory protection, life protection, medical air filtration, drinking water filtration and high purity process filtration such as that found in food and beverage and medical applications. Lydall also offers Solupor® Membrane specialty microporous membranes that are utilized in various markets and applications including air and liquid filtration and transdermal drug delivery. Solupor® membranes incorporate a unique combination of mechanical strength, chemical inertness, and high porosity in a unique open structure.
Net sales from the Performance Materials segment represented 19.3% of Lydall’s net sales in 2015 compared with 21.6% in 2014 and 28.1% in 2013. Net sales generated by the foreign operations of the Performance Materials segment accounted for 33.9%, 34.2% and 30.1% of segment net sales in 2015, 2014, and 2013, respectively.
Industrial Filtration Segment
The Industrial Filtration segment includes non-woven felt media and filter bags used primarily in industrial air and liquid filtration applications. Non-woven filter media is the most commonly used filter technology to satisfy increasing emission control regulations in a wide range of industries, including power, cement, steel, asphalt, incineration, mining, food, and pharmaceutical. The business also produces non-woven rolled-good media that is used in other commercial applications and media for automotive applications is supplied to the Company's Thermal/Acoustical Fibers segment.
Industrial Filtration segment products include air and liquid filtration media sold under the brand names Fiberlox® high performance filtration felts, Checkstatic™ conductive filtration felts, Microfelt® high efficiency filtration felts, Pleatlox® pleatable filtration felts, Ultratech™ PTFE filtration felts, Powertech® and Powerlox® power generation filtration felts, Microcap® high efficiency liquid filtration felts, Duotech membrane composite filtration felts, along with traditional scrim supported filtration felts. Industrial Filtration also offers extensive finishing and coating capabilities which provide custom engineered properties tailored to meet the most demanding filtration applications. The business leverages a wide range of fiber types and extensive technical capabilities to provide products that meet our customers’ needs across a variety of applications providing both high performance and durability.
Industrial Filtration segment net sales represented 26.5% of the Company's net sales in 2015 and 20.9% in 2014 (from the date of acquisition, February 20, 2014). Net sales generated by foreign operations of the Industrial Filtration segment accounted for 40.9% and 48.8% of segment net sales in 2015 and 2014, respectively.
Thermal/Acoustical Metals Segment
The Thermal/Acoustical Metals segment offers a full range of innovative engineered products for the transportation sector to assist primarily in the reduction of powertrain and road noise as well as thermally shield sensitive components from high heat. Lydall products are found in the underbody (tunnel, fuel tank, exhaust, rear muffler and spare tire) and under hood (engine compartment, turbo charger, and manifolds) of cars, trucks, SUVs, heavy duty trucks and recreational vehicles.
Thermal/Acoustical Metals segment products are formed on production lines capable of combining multiple layers of metal and thermal or acoustical media to provide an engineered thermal and acoustical shielding solution for an array of application areas in the global automotive and truck markets. The flux® product family in Thermal/Acoustical Metals includes several patented products that address applications which include: Direct Exhaust Mount heat shields, which are mounted to high temperature surfaces like exhaust down-pipes, turbochargers or engine manifolds using aluminized and stainless steel with high performance heat insulating materials; Powertrain heat shields that absorb noise; Durable and thermally robust solutions for sensitive plastic components such as fuel tanks that are in proximity to high temperature heat sources.
Thermal/Acoustical Metals segment net sales represented 30.7% of the Company’s net sales in 2015, 30.7% in 2014 and 39.8% in 2013. Net sales generated by foreign operations of the Thermal/Acoustical Metals segment accounted for 54.9%, 58.2% and 59.5% of segment net sales in 2015, 2014 and 2013, respectively.
2
Thermal/Acoustical Fibers Segment
The Thermal/Acoustical Fibers segment offers innovative engineered products to assist primarily in noise, vibration and harshness (NVH) abatement within the transportation sector. Lydall products are found in the interior (dash insulators, cabin flooring), underbody (wheel well, aerodynamic belly pan, fuel tank, exhaust) and under hood (engine compartment) of cars, trucks, SUVs, heavy duty trucks and recreational vehicles.
Thermal/Acoustical Fibers segment products offer thermal and acoustical insulating solutions comprised of organic and inorganic fiber composites for the automotive and truck markets primarily in North America. Lydall’s dBCore® is a lightweight acoustical composite that emphasizes absorption principles over heavy-mass type systems. Lydall’s dBLyte® is a high-performance acoustical barrier with sound absorption and blocking properties and can be used throughout a vehicle’s interior to minimize intrusive noise from an engine compartment and road. Lydall’s ZeroClearance® is an innovative thermal solution that utilizes an adhesive backing for attachment and is used to protect vehicle components from excessive heat. Lydall’s specially engineered products provide a solution that provides weight reduction, superior noise suppression, and increased durability over conventional designs.
Thermal/Acoustical Fibers segment net sales represented 26.5% of the Company’s net sales in 2015, 24.0% in 2014 and 28.7% in 2013. There are no net sales generated by foreign operations, as the Thermal/Acoustical Fibers segment only produces domestically.
The Thermal/Acoustical Metals segment and Thermal/Acoustical Fibers segment operating results include allocations of certain costs shared between the segments.
Other Products and Services (“OPS”)
On January 30, 2015, the Company sold all of the outstanding shares of common stock of its Life Sciences Vital Fluids business for a cash purchase price of $30.1 million. The disposition was completed pursuant to a Stock Purchase and Sale Agreement, dated January 30, 2015, by and among the Company, and the Buyer. The Company recognized an after-tax gain on the sale of this business of approximately $11.8 million in the first quarter of 2015.
The Life Sciences Vital Fluids business offered specialty products for blood filtration devices, blood transfusion single-use containers and the design and manufacture of single-use solutions for cell growth, frozen storage and fluid handling, as well as equipment for bioprocessing applications. OPS net sales were 0.3% of the Company’s net sales in 2015 compared with 3.7% in 2014 and 4.3% in 2013.
GENERAL BUSINESS INFORMATION
Lydall holds a number of patents, trademarks and licenses. While no single patent, trademark or license is critical to the success of Lydall, together these intangible assets are of considerable value to the Company.
Typically, the Company’s business can be slightly stronger in the first half of the calendar year given the timing of customer order patterns and planned customer shutdowns in North America and Europe that typically occur in the third and fourth quarters of each year. Lydall maintains levels of inventory and grants credit terms that are normal within the industries it serves. The Company uses a wide range of raw materials in the manufacturing of its products, including aluminum and other metals to manufacture most of its automotive heat shields and various glass and petroleum derived fibers in its Performance Materials, Industrial Filtration, and Thermal/Acoustical Fibers segments. The majority of raw materials used are generally available from a variety of suppliers.
Sales to Ford Motor Company accounted for 18.2%, 16.5% and 20.0% of Lydall’s net sales in the years ended December 31, 2015, 2014 and 2013, respectively. Sales to Chrysler Group LLC accounted for 10.9% of Lydall's net sales in the year ended December 31, 2013. No other customers accounted for more than 10% of Lydall's net sales in such years.
Foreign and export sales were 44.2% of net sales in 2015, 46.2% in 2014, and 45.2% in 2013. Foreign sales were $179.6 million, $190.0 million, and $128.0 million for the years ended December 31, 2015, 2014 and 2013, respectively. Export sales primarily to Canada, Mexico, Asia and Europe were $52.5 million, $57.6 million, and $52.1 million in 2015, 2014 and 2013, respectively. The decrease in foreign sales during 2015, compared to 2014, was primarily related to foreign currency translation.
3
Foreign operations generated operating income of $6.4 million, $6.2 million, and $5.1 million for the years ended December 31, 2015, 2014 and 2013, respectively. Total foreign assets were $144.2 million, $155.9 million, and $103.0 million at December 31, 2015, 2014 and 2013, respectively. The decrease in foreign assets from 2014 to 2015 was primarily due to foreign currency translation. For further detail regarding revenue and financial information about the Company’s geographic areas, see Note 10 to the Consolidated Financial Statements.
The Company invested $8.5 million in 2015, $9.0 million in 2014, and $7.6 million in 2013, or approximately 2% of net sales in 2015, 2014 and 2013, in research and development to create new products and to improve existing products. All amounts were expensed as incurred. Most of the investment in research and development is application specific. There were no customer-sponsored research and development activities during the past three years.
Backlog at January 31, 2016 was $71.2 million. Lydall’s backlog was $72.2 million at December 31, 2015, $74.8 million at December 31, 2014, and $53.4 million at December 31, 2013. Thermal/Acoustical Metals and Thermal/Acoustical Fibers segment backlog, which comprises the majority of total backlog, may be impacted by various assumptions, including future automotive production volume estimates, changes in program launch timing and changes in customer development plans. The Company believes that global automotive orders for a two month period represent a reasonable timeframe to be deemed as firm orders and included as Thermal/Acoustical Metals and Thermal/Acoustical Fibers segment backlog. There are minimal seasonal aspects to Lydall’s backlog.
No material portion of Lydall’s business is subject to renegotiation of profits or termination of contracts or subcontracts at the election of any governmental body.
Lydall believes that its plants and equipment are in substantial compliance with applicable federal, state and local provisions that have been enacted or adopted regulating the discharge of materials into the environment, or otherwise relating to the protection of the environment.
As of December 31, 2015, Lydall employed approximately 2,100 people. Three unions with contracts expiring on September 30, 2016 represent approximately 60 employees in the United States. All employees at the facilities in France and the Netherlands are covered under a National Collective Bargaining Agreement. Certain salaried and all hourly employees in Germany, the United Kingdom and China are also covered under some form of a National Collective Bargaining Agreement. Lydall considers its employee relationships to be satisfactory.
There are no significant anticipated operating risks related to foreign investment law, expropriation, or availability of material, labor or energy. The foreign and domestic operations attempt to limit foreign currency exchange transaction risk by completing transactions in functional currencies whenever practical or through the use of foreign currency forward exchange contracts when deemed appropriate.
4
Item 1A. | RISK FACTORS |
The reader should carefully review and consider the risk factors discussed below. Any and all of these risk factors could materially affect the Company’s business, financial condition, future results of operations or cash flows and possibly lead to a decline in Lydall’s stock price. The risks, uncertainties and other factors described below constitute all material risk factors known to management as of the date of this report.
Global political or economic changes may negatively impact Lydall’s business - Ongoing instability or changes in a country's or region's economic or political conditions could adversely affect demand for the Company’s products and impact profitability. Among other factors, political conflicts or changes, disruptions in the global credit and financial markets, including diminished liquidity and credit availability, swings in consumer confidence and spending, unstable economic growth and fluctuations in unemployment rates causing economic instability could have a negative impact on the Company’s results of operations, financial condition and liquidity. These factors also make it difficult to accurately forecast and plan future business activities.
The Company’s foreign and export sales were 44.2% of net sales in 2015, 46.2% in 2014, and 45.2% in 2013. If the global economy were to take a significant downturn, depending on the length, duration and severity of such downturn, the Company’s business and financial statements could be adversely affected.
The Company’s Thermal/Acoustical Metals and Thermal/Acoustical Fibers segments are tied primarily to general economic and automotive industry conditions - The Company’s Thermal/Acoustical Metals and Thermal/Acoustical Fibers segments, both of which are suppliers in the automotive market, accounted for 57.1%, 54.7%, and 68.5% of consolidated net sales in 2015, 2014, and 2013, respectively. The segments net sales from products manufactured in North America were 70.6%, 67.4%, and 65.4% in 2015, 2014, and 2013, respectively, with the remainder manufactured in Europe and Asia. These segments are closely tied to general economic and automotive industry conditions as demand for vehicles depends largely on the strength of the economy, employment levels, consumer confidence levels, the availability and cost of credit, the cost of fuel, legislative and regulatory oversight and trade agreements. These factors have had, and could continue to have, a substantial impact on these segments. Adverse developments could reduce demand for new vehicles, causing Lydall’s customers to reduce their vehicle production in North America, Europe and Asia and, as a result, demand for Company products would be adversely affected.
The Company’s quarterly operating results may fluctuate; as a result, the Company may fail to meet or exceed the expectations of research analysts or investors, which could cause Lydall’s stock price to decline - The Company’s quarterly results are subject to significant fluctuations. Operating results have fluctuated as a result of many factors, including size and timing of orders and shipments, loss of significant customers, product mix, technological change, operational efficiencies and inefficiencies, competition, changes in deferred tax asset valuation allowances, strategic initiatives, severance and recruiting charges, asset impairments and general economic conditions. In addition, lower revenues may cause asset utilization to decrease, resulting in the under absorption of the Company’s fixed costs, which could negatively impact gross margins. Additionally, the Company’s gross margins vary among its product groups and have fluctuated from quarter to quarter as a result of shifts in product mix. Any and all of these factors could affect the Company’s business, financial condition, future results of operations or cash flows and possibly lead to a decline in Lydall’s stock price.
Implementation of the Company’s strategic initiatives may not be successful - As part of Lydall’s business strategy, the Company continues to review various strategic and business opportunities to grow the business and to assess the profitability and growth potential for each of its existing businesses. The Company may incur significant professional services expenses associated with the review and potential implementation of strategic business opportunities. The Company cannot predict with certainty whether any recent or future strategic transactions will be beneficial to the Company. Among other things, future performance could be impacted by the Company’s ability to:
• | Identify and effectively complete strategic transactions; |
• | Obtain adequate financing to fund strategic initiatives, which could be difficult to obtain; |
• | Successfully integrate and manage acquired businesses that involve numerous operational and financial risks, including difficulties in the integration of acquired operations, diversion of management's attention from other |
5
business concerns, managing assets in multiple geographic regions and potential loss of key employees and key customers of acquired operations;
• | Improve operating margins through its Lean Six Sigma initiatives which are intended to improve processes and work flow, improve customer service, reduce costs and leverage synergies across the Company; and |
• | Successfully invest and deploy capital investments to support our business and commitments to our customers. |
In order to meet its strategic objectives, the Company may also divest assets and/or businesses. Successfully executing such a strategy depends on various factors, including effectively transferring assets, liabilities, contracts, facilities and employees to any purchaser, identifying and separating the intellectual property to be divested from the intellectual property that the Company wishes to retain, reducing or eliminating fixed costs previously associated with the divested assets or business, and collecting the proceeds from any divestitures.
Any incurrence of additional indebtedness could adversely affect our ability to operate our business, remain in compliance with debt covenants, make payments on our debt, and make it more difficult for Lydall to obtain additional financing in the future - Incurring debt may have an adverse effect on the Company’s financial condition and may limit Lydall’s ability to obtain any necessary financing in the future for working capital, capital expenditures, future acquisitions, debt service requirements or other purposes. Additionally, the Company may not be able to generate sufficient cash flow or otherwise obtain funds necessary to meet the additional debt obligations. Any default under the existing credit facility would likely result in the acceleration of the repayment obligations to the Company's lenders.
The Company may not have adequate cash to fund its operating requirements - The principal source of the Company’s liquidity is operating cash flows. Other significant factors that affect the overall management of liquidity include capital expenditures, investments in businesses, acquisitions, income tax payments, pension funding, share repurchases, outcomes of contingencies and availability of lines of credit and long-term financing. The Company’s liquidity can be impacted by the Company’s ability to:
• | Manage working capital and the level of future profitability. The consolidated cash balance is impacted by capital equipment and inventory investments that may be made in response to changing market conditions; |
• | Satisfy covenants and other obligations under its existing credit facility, which could limit or prohibit Lydall’s ability to borrow funds. Additionally, these debt covenants and other obligations could limit the Company’s ability to make acquisitions, incur additional debt, make investments, or consummate asset sales and obtain additional financing from other sources. |
The Company is subject to the U.S. Foreign Corrupt Practices Act and similar worldwide anti-bribery laws, which impose restrictions on the Company and violations of which may carry substantial fines and penalties and result in criminal sanctions - The U.S. Foreign Corrupt Practices Act and anti-bribery laws in other jurisdictions, including anti-bribery legislation in the United Kingdom, generally prohibit companies and their intermediaries from making improper payments for the purpose of obtaining or retaining business or other commercial advantage. The Company’s policies mandate compliance with these anti-bribery laws, violations of which often carry substantial fines and penalties and could result in criminal sanctions against the Company, Lydall’s officers or employees. The Company cannot assure that its internal control policies and procedures always will protect it from reckless or other inappropriate acts committed by the Company’s affiliates, employees or agents. Violations of these laws, or allegations of such violations, could have a material adverse effect on Lydall’s business, or financial statements and could cause the market price of Lydall’s common stock to decline.
Raw material pricing, supply issues, and disruptions in transportation networks could affect all of the Company’s businesses - The Thermal/Acoustical Metals segment uses aluminum and other metals to manufacture most of its automotive heat shields. The Thermal/Acoustical Fibers and Industrial Filtration segments use various petroleum-derivative fibers in manufacturing products, and the Performance Materials segment uses various glass-derivative fibers in manufacturing products. If the prices of these raw materials, or any other raw materials used in the Company’s businesses increase, the Company may not have the ability to pass incremental cost increases on to its customers. In addition, an interruption in the ability of the Company to source such materials could negatively impact operations and sales.
6
Impairment of the Company’s goodwill or other long-lived assets has required, and may in the future require recording significant charges to earnings - In 2015, the Company determined that its Solutech long-lived asset group was impaired. This was based on reviewing estimated undiscounted cash flows for its asset group, which were less than their carrying value. The asset group, included in the Performance Materials segment, primarily consists of patents and machinery and equipment. The Company recorded an impairment charge of $1.4 million during the fourth quarter of 2015, which represented the difference between the estimated fair value of the asset group compared to the carrying value of the asset group (See Note 5 to the Consolidated Financial Statements). The Company reviews its long-lived assets for impairment when events or changes in circumstances indicate the carrying value may not be recoverable. Goodwill is also tested by the Company for impairment during the fourth quarter of each year. Factors that may be considered a change in circumstances, indicating that the carrying value of goodwill or other long-lived assets may not be recoverable, include, but are not limited to, a decline in the Company’s stock price and market capitalization, reduced future cash flow estimates, and slower growth rates.
Volatility in the securities markets, interest rates, actuarial assumptions and other factors could substantially increase the Company’s costs and funding for its domestic defined benefit pension plan - The Company’s domestic defined benefit pension plan is funded with trust assets invested in a diversified portfolio of securities. Changes in interest rates, mortality rates, investment returns, and the market value of plan assets may affect the funded status and cause volatility in the net periodic benefit cost and future funding requirements of such plan. A significant increase in benefit plan liabilities or future funding requirements could have a negative impact on the Company’s financial statements.
The Company is involved in certain legal proceedings and may become involved in future legal proceedings all of which could give rise to liability - The Company is involved in legal proceedings that, from time to time, may be material. These proceedings may include, without limitation, commercial or contractual disputes, intellectual property matters, personal injury claims, stockholder claims, and employment matters. No assurances can be given that such proceedings and claims will not have a material adverse impact on the Company’s financial statements.
The Company is subject to an investigation by antitrust regulators and developments in these investigations and related matters could have a material adverse effect on Lydall's consolidated financial position, results of operations or liquidity - The Company is subject to a variety of laws and regulations that govern our business both in the United States and internationally, including antitrust laws. Violations of antitrust laws can result in significant penalties being imposed by antitrust authorities. Expenses and fines arising out of or related to these investigations and related claims can also be significant. Lydall Gerhardi GmbH & Co. KG ("Lydall Gerhardi"), which is an indirect wholly-owned subsidiary of the Company and part of the Thermal/Acoustical Metals segment, is cooperating with the German Federal Cartel Office (Bundeskartellamt) in connection with an investigation, initiated in the second quarter of 2014, relating to possible violations of German anti-trust laws by and among certain European automotive heat shield manufacturers, including Lydall Gerhardi. The Company is conducting an internal investigation utilizing outside counsel. In the course of this internal investigation, the Company has discovered instances of inappropriate conduct by certain German employees of Lydall Gerhardi. The Company has disclosed its findings in an application for leniency submitted to the German Federal Cartel Office on July 22, 2014. The Company is continuing its internal investigation and has taken, and will continue to take, remedial actions. The German Federal Cartel Office has wide discretion in fixing the amount of a fine, up to a maximum fine of ten percent (10%) of the Company’s annual revenue of the year preceding the year in which the fine is imposed. The Company believes a loss is probable. However, in light of the uncertainties and variables involved, the Company is unable to estimate either the timing or the amount of the loss associated with this matter. There can be no assurance that this matter will not have a material adverse effect on the Company.
Regulations related to conflict minerals could adversely impact the Company’s business - The Dodd-Frank Wall Street Reform and Consumer Protection Act contains provisions designed to improve transparency and accountability concerning the supply of certain minerals, known as conflict minerals, originating from the Democratic Republic of the Congo (DRC) and adjoining countries. In August 2012, the SEC promulgated disclosure and reporting requirements for companies who use conflict minerals in their products. These requirements may result in changes to the sourcing practices of the Company’s customers which may require the identification and qualification of alternate sourcing for the components of products Lydall manufactures, which could impact the availability of, or cause increases in the price of, materials used in our products. As there may be only a limited number of suppliers offering “conflict free” conflict minerals, there can be no assurance that the Company will be able to obtain necessary conflict free minerals from such suppliers in sufficient quantities or at competitive prices.
Changes in tax rates and exposure to additional income tax liabilities - The Company is subject to risks with respect to changes in tax law and rates, changes in rules related to accounting for income taxes, or adverse outcomes from tax audits that are in process or future tax audits in various jurisdictions in which the Company operates. In addition,
7
certain jurisdictions have statutory rates greater than or less than the United States statutory rate. Changes in the mix and source of earnings between jurisdictions could have a significant impact on the Company’s overall effective tax rate.
Realization of deferred tax assets is not assured - The Company maintains valuation allowances against certain deferred tax assets where realization is not reasonably assured. The Company evaluates the likelihood of the realization of all deferred tax assets and reduces the carrying amount to the extent it believes a portion will not be realized. Changes in these assessments can result in an increase or reduction to valuation allowances on deferred tax assets and could have a significant impact on the Company’s overall effective tax rate.
The Company’s future success depends upon its ability to continue to innovate, improve its existing products, develop and market new products, and identify and enter new markets - Improved performance and growth are partially dependent on improvements to existing products and new product introductions planned for the future. Delays in improving or developing products and long customer qualification cycles may impact the success of new product programs. The degree of success of new product programs could impact the Company’s future results. Developments by other companies of new or improved products, processes or technologies may make our products or proposed products obsolete or less competitive and may negatively impact our net sales. Accordingly, our ability to compete is in part dependent on our ability to continually offer enhanced and improved products that meet the changing requirements of our customers. If we fail to develop new products or enhance existing products, it could have a material adverse effect on our business, financial condition or results of operations.
The Company’s foreign operations expose it to business, economic, political, legal, regulatory and other risks - The Company believes that in order to be competitive and grow its businesses, it needs to maintain significant foreign operations. Foreign sales were $179.6 million, $190.0 million and $128.0 million for the years ended December 31, 2015, 2014, and 2013, respectively. Foreign operations are subject to inherent risks including political and economic conditions in various countries, unexpected changes in regulatory requirements (including tariff regulations and trade restrictions), longer accounts receivable collection cycles and potentially adverse tax consequences. The Company has little control over most of these risks and may be unable to anticipate changes in international economic and political conditions and, therefore, unable to alter its business practices in time to avoid the adverse effect of any of these possible changes.
Foreign currency exchange rate fluctuations and limitations on repatriation of earnings may affect the Company’s results of operations - As a result of the Industrial Filtration acquisition, the Company’s foreign operations expanded substantially and its financial results are more exposed to currency exchange rate fluctuations and an increased proportion of its assets, liabilities and expenses are denominated in non-U.S. dollar currencies. During 2015, there was significant volatility in foreign currencies that impacted the Company, primarily the Euro, Chinese Yuan and British Pound Sterling. The Company’s foreign and domestic operations seek to limit foreign currency exchange transaction risk by completing transactions in functional currencies whenever practical or through the use of foreign currency forward exchange contracts when deemed appropriate. If the Company does not successfully hedge its currency exposure, changes in the rate of exchange between these currencies and the U.S. dollar may negatively impact the Company. Translation of the results of operations and financial condition of its foreign operations into U.S. dollars may be affected by exchange rate fluctuations. Additionally, limitations on the repatriation of earnings, including imposition or increase of withholding and other taxes on remittances, may limit or negatively impact the Company’s ability to redeploy or distribute cash. The Company receives a material portion of its revenue from foreign operations. Foreign operations generated approximately 34.2%, 35.5% and 32.1% of total net sales in 2015, 2014, and 2013, respectively.
The Company’s manufacturing processes are subject to inherent risk - The Company operates a number of manufacturing facilities and relies upon an effective workforce and properly performing machinery and equipment. The workforce may experience a relatively high turnover rate, causing inefficiencies associated with retraining and rehiring. The equipment and systems necessary for such operations may break down, perform poorly or fail, and possibly cause higher manufacturing costs. Manufacturing processes affect the Company’s ability to deliver quality products on a timely basis, and delays in delivering products to customers could result in the Company incurring penalties from customers.
Increases in energy pricing can affect all of the Company’s businesses - Higher energy costs at the Company’s manufacturing plants or higher energy costs passed on from the Company’s vendors could impact the Company’s profitability.
8
The Company’s resources are limited and may impair its ability to capitalize on changes in technology, competition and pricing - The industries in which the Company sells its products are highly competitive and many of the competitors are affiliated with entities that are substantially larger and that have greater financial, technical and marketing resources. The Company’s more limited resources and relatively diverse product mix may limit or impair its ability to capitalize on changes in technology, competition and pricing.
The Company’s products may fail to perform as expected, subjecting it to warranty or other claims from its customers -If such failure results in, or is alleged to result in, bodily injury and/or property damage or other losses, the Company may be subject to product liability lawsuits, U.S. Food and Drug Administration product recalls and other claims, any of which could have a material adverse impact on results of operations and cash flows.
If the Company does not retain its key employees, the Company’s ability to execute its business strategy could be adversely affected - The Company’s success, in part, depends on key managerial, engineering, sales and marketing and technical personnel and its ability to continue to attract and retain additional personnel. The loss of certain key personnel could have a material, adverse effect upon the Company’s business and results of operations. There is no assurance that the Company can retain its key employees or that it can attract competent and effective new or replacement personnel in the future.
The Company’s current reserve levels may not be adequate to cover potential exposures - Estimates and assumptions may affect the reserves that the Company has established to cover uncollectible accounts receivable, excess or obsolete inventory, income tax valuation and fair market value write downs of certain assets and various liabilities. Actual results could differ from those estimates.
The Company is subject to environmental laws and regulations that could increase its expense and affect operating results - The Company is subject to federal, state, local, and foreign environmental, health and safety laws and regulations that affect operations. New and changing environmental laws and regulations may impact the products manufactured and sold to customers. In order to maintain compliance with such laws and regulations, the Company must devote significant resources and maintain and administer adequate policies, procedures and oversight. Should the Company fail to do these things, it could be negatively impacted by lower net sales, fines, legal costs, and clean-up requirements.
The Company may be unable to adequately protect its intellectual property, which may limit its ability to compete effectively - The Company owns intellectual property, including patents and trademarks, which play an important role in helping the Company to maintain its competitive position in a number of markets. The Company is subject to risks with respect to (i) changes in the intellectual property landscape of markets in which it competes; (ii) the potential assertion of intellectual property-related claims against the Company; (iii) the failure to maximize or successfully assert its intellectual property rights; and (iv) significant technological developments by others.
Disruptions may occur to the Company’s operations relating to information technology - The capacity, reliability and security of the Company’s information technology (“IT”) hardware and software infrastructure and the ability to expand and update this infrastructure in response to the Company’s changing needs are important to the operation of the businesses. Also, any inadequacy, interruption, loss of data, integration failure or security failure of the Company’s IT technology could harm its ability to effectively operate its business, which could adversely impact the Company’s results of operations and cash flows.
Increased cybersecurity requirements, vulnerabilities, threats and more sophisticated and targeted computer crime could pose a risk to the Company’s systems, networks, and data - Increased global cybersecurity vulnerabilities, threats and more sophisticated and targeted cyber-related attacks pose a risk to the security of the Company’s systems and networks and the confidentiality, availability and integrity of the Company’s data. While the Company attempts to mitigate these risks by employing a number of measures, including employee training, monitoring and testing, and maintenance of protective systems and contingency plans, the Company remains potentially vulnerable to additional known or unknown threats. The Company also may have access to sensitive, confidential or personal data or information in certain of Lydall’s businesses that is subject to privacy and security laws, regulations and customer-imposed controls. Despite efforts made by the Company to protect sensitive, confidential or personal data or information, the Company may be vulnerable to security breaches, theft, misplaced or lost data, programming errors, employee errors and/or malfeasance that could potentially lead to the compromising of sensitive, confidential or personal data or information. In addition, a cyber-related attack could result in other negative consequences, including damage to the Company’s reputation or competitiveness, remediation or increased protection costs, litigation or regulatory action.
9
The Company could be subject to work stoppages or other business interruptions as a result of its unionized work force - A portion of the Company’s hourly employees are represented by various union locals and covered by collective bargaining agreements. These agreements contain various expiration dates and must be renegotiated upon expiration. Specifically, three union contracts expiring on September 30, 2016 represent approximately 60 employees in the United States. If the Company is unable to negotiate any of its collective bargaining agreements on satisfactory terms prior to expiration, the Company could experience disruptions in its operations which could have a material adverse effect on operations.
The Company could be negatively affected as a result of the actions of activist stockholders - Over the last few years, proxy contests and other forms of stockholder activism have been directed against numerous public companies. The Company could become engaged in a solicitation, or proxy contest, or experience other stockholder activism, in the future. Activist stockholders may advocate for certain governance and strategic changes at the Company. In the event of stockholder activism, particularly with respect to matters which our Board of Directors, in exercising their fiduciary duties, disagree with or have determined not to pursue, our business could be adversely affected because responding to actions by activist stockholders can be costly and time-consuming, disrupting our operations and diverting the attention of management, and perceived uncertainties as to our future direction may result in the loss of potential business opportunities and may make it more difficult to attract and retain qualified personnel, business partners and customers.
10
Item 1B. | UNRESOLVED STAFF COMMENTS |
None.
Item 2. | PROPERTIES |
The principal properties of the Company as of December 31, 2015 are situated at the following locations and have the following characteristics:
Location | Primary Business Segment/General Description | Type of Interest | ||
Hamptonville, North Carolina | Thermal/Acoustical Metals and Fibers – Product Manufacturing | Owned | ||
Yadkinville, North Carolina | Thermal/Acoustical Fibers – Product Manufacturing | Leased | ||
Meinerzhagen, Germany | Thermal/Acoustical Metals – Product Manufacturing | Owned | ||
Saint-Nazaire, France | Thermal/Acoustical Metals – Product Manufacturing | Leased | ||
Taicang, China | Thermal/Acoustical Metals – Product Manufacturing | Leased | ||
Green Island, New York | Performance Materials – Specialty Media Manufacturing | Owned | ||
Rochester, New Hampshire | Performance Materials – Specialty Media Manufacturing | Owned | ||
Saint-Rivalain, France | Performance Materials – Specialty Media Manufacturing | Owned | ||
Geleen, the Netherlands | Performance Materials – Specialty Media Manufacturing | Leased | ||
Heerlen, the Netherlands | Performance Materials – Specialty Media Manufacturing | Leased | ||
Stoke-on-Trent, United Kingdom | Industrial Filtration - Filtration Media Manufacturing | Leased | ||
Rossendale, United Kingdom | Industrial Filtration - Filtration Media Manufacturing | Owned | ||
Bury, United Kingdom | Industrial Filtration - Filtration Media Manufacturing | Leased | ||
Wuxi, China | Industrial Filtration - Filtration Media Manufacturing | Leased | ||
Shanghai, China | Industrial Filtration - Filtration Media Manufacturing | Leased | ||
North Augusta, South Carolina | Industrial Filtration - Filtration Media Manufacturing | Owned | ||
Bethune, South Carolina | Industrial Filtration - Filtration Media Manufacturing | Leased | ||
Manchester, Connecticut | Corporate Office | Owned | ||
For additional information regarding lease obligations, see Note 12 to the Consolidated Financial Statements. The Company considers its properties to be in good operating condition and suitable and adequate for its present needs. In addition to the properties listed above, the Company has several leases for sales offices and warehouses in the United States, Europe and Asia, which the Company believes are immaterial individually and in the aggregate.
11
Item 3. | LEGAL PROCEEDINGS |
The Company is subject to legal proceedings, claims, investigations and inquiries that arise in the ordinary course of business such as, but not limited to, actions with respect to commercial, intellectual property, employment, personal injury, and environmental matters. The Company believes that it has meritorious defenses against the claims currently asserted against it and intends to defend them vigorously. While the outcome of litigation is inherently uncertain and the Company cannot be sure that it will prevail in any of the cases, subject to the matter referenced below, the Company is not aware of any matters pending that are expected to have a material adverse effect on the Company’s business, financial position, results of operations or cash flows.
Lydall Gerhardi GmbH & Co. KG ("Lydall Gerhardi"), which is an indirect wholly-owned subsidiary of the Company and part of the Thermal/Acoustical Metals segment, is cooperating with the German Federal Cartel Office (Bundeskartellamt) in connection with an investigation, initiated in the second quarter of 2014, relating to possible violations of German anti-trust laws by and among certain European automotive heat shield manufacturers, including Lydall Gerhardi.
The Company has been conducting an internal investigation utilizing outside counsel. In the course of this internal investigation, the Company has discovered instances of inappropriate conduct by certain German employees of Lydall Gerhardi. The Company has disclosed its findings in an application for leniency submitted to the German Federal Cartel Office on July 22, 2014. The Company is continuing its internal investigation and has taken, and will continue to take, remedial actions.
The German Federal Cartel Office has wide discretion in fixing the amount of a fine, up to a maximum fine of ten percent (10%) of the Company’s annual revenue of the year preceding the year in which the fine is imposed. The Company believes a loss is probable. However, in light of the uncertainties and variables involved, the Company is unable to estimate either the timing or the amount of the loss associated with this matter. There can be no assurance that this matter will not have a material adverse effect on the Company.
Item 4. | MINE SAFETY DISCLOSURES |
Not applicable.
12
EXECUTIVE OFFICERS OF THE REGISTRANT
The executive officers of Lydall, Inc. or its subsidiaries, together with the offices presently held by them, their business experience since January 1, 2011, and their age as of March 4, 2016, the record date of the Company’s 2016 Annual Meeting, are as follows:
Name | Age | Position and Date of Appointment | Other Business Experience Since 2011 | |||
Dale G. Barnhart | 63 | President, Chief Executive Officer (August 27, 2007) | Not applicable | |||
Scott M. Deakin | 49 | Executive Vice President and Chief Financial Officer (September 8, 2015) | Executive Vice President and Chief Financial Officer, Ensign-Bickford Industries, Inc. (2009 – 2015), a diversified global manufacturer with operating segments that serve the aerospace & defense, life science, specialty chemicals and food & flavoring industries. | |||
Joseph A. Abbruzzi | 57 | President, Industrial Filtration (February 20, 2014); formerly Sr. Vice President, General Manager, Lydall Thermal/Acoustical Fibers (March 14, 2011) | Vice President & General Manager, Guardian Automotive, Glass Division (2007 − 2010), a manufacturer of glass products for commercial, residential, interiors, automotive, energy/solar, and technical glass industries. | |||
William M. Feld | 53 | Vice President, General Manager, Lydall Thermal/Acoustical Fibers (February 24, 2014); formerly Vice President of Operations, Performance Materials (December 10, 2012), formerly Director Engineering, Lydall Thermal/Acoustical Metals (July 11, 2011) | Principle, BNJS Management Group, (2009 - 2011), a consulting group providing expertise relating to start-up, business development, and operations excellence. | |||
William J. Hume | 53 | Senior Vice President, General Manager, Lydall Thermal/Acoustical Metals (August 19, 2014); formerly Senior Vice President, General Manager, Charter Medical Ltd. (January 2, 2012), formerly Director Lean Six Sigma, Lydall, Inc. (September 12, 2011), formerly General Manager, Affinity, a former subsidiary of Lydall,Inc. (March 9, 2009) | Not applicable | |||
James V. Laughlan | 43 | Vice President, Chief Accounting Officer and Treasurer (March 26, 2013); formerly Chief Accounting Officer, Controller and Treasurer (July 27, 2012); formerly Chief Accounting Officer and Controller (March 29, 2010) | Not applicable | |||
Chad A. McDaniel | 42 | Senior Vice President, Chief Administrative Officer, General Counsel and Secretary (May 13, 2015); formerly Vice President, General Counsel and Secretary (May 10, 2013) | Associate General Counsel, United Technologies Corporation (“UTC”), Sikorsky Aircraft division (2012 – 2013), Director; Executive Assistant to the President, UTC Fire & Security division (2010 – 2012); UTC is a manufacturer of high-technology products and services for the global aerospace and building systems industries. | |||
There is no family relationship among any of the Company’s directors or executive officers.
13
Item 5. | MARKET FOR REGISTRANT’S COMMON EQUITY, RELATED STOCKHOLDER MATTERS AND ISSUER PURCHASES OF EQUITY SECURITIES |
PRICE RANGE OF COMMON STOCK AND DIVIDEND HISTORY
The Company’s Common Stock is traded on the New York Stock Exchange (“NYSE”) under the symbol LDL. The table below shows the range of reported sale prices on the NYSE Composite Tape for the Company’s Common Stock for the periods indicated. As of December 31, 2015, 6,289 stockholders of record held 17,140,426 shares of Lydall’s Common Stock, $.01 par value.
High | Low | Close | ||||||||||
2015 | ||||||||||||
First Quarter | $ | 33.10 | $ | 27.19 | $ | 31.72 | ||||||
Second Quarter | 32.75 | 26.13 | 29.56 | |||||||||
Third Quarter | 30.71 | 25.28 | 28.49 | |||||||||
Fourth Quarter | 38.86 | 28.16 | 35.48 | |||||||||
2014 | ||||||||||||
First Quarter | $ | 23.24 | $ | 16.55 | $ | 22.87 | ||||||
Second Quarter | 29.66 | 21.50 | 27.37 | |||||||||
Third Quarter | 31.64 | 24.20 | 27.01 | |||||||||
Fourth Quarter | 33.57 | 25.33 | 32.82 | |||||||||
The Company does not pay a cash dividend on its Common Stock. The Company’s Amended Credit Facility entered into on February 18, 2014, places no restrictions on cash dividend payments, so long as the payments do not place the Company in default.
ISSUER PURCHASES OF EQUITY SECURITIES
In April 2012, the Company’s Board of Directors approved a Stock Repurchase Program (“Repurchase Program”) to mitigate the potentially dilutive effects of stock options and shares of restricted and unrestricted stock granted by the Company. The Repurchase Program was for up to 1.0 million shares of Common Stock and had no expiration date.
As of December 31, 2015, there were no shares remaining available for purchase under the Repurchase Program. During 2015, 267,089 shares were repurchased under the Repurchase Program. The Company acquired 12,935 shares through withholding during 2015, pursuant to provisions in agreements with recipients of restricted stock granted under the Company’s equity compensation plans, which allow the Company to withhold the number of shares having fair value equal to each recipient’s tax withholding due. The following table details the activity for the fourth quarter ended December 31, 2015.
Period | Total Number of Shares Purchased | Average Price Paid per Share | Total Number of Shares Purchased as Part of Publicly Announced Plans or Programs | Maximum Number of Shares That May Yet Be Purchased Under the Plans or Programs | ||||||||
Activity October 1, 2015 - October 31, 2015 | — | — | — | — | ||||||||
Activity November 1, 2015 - November 30, 2015 | 2,027 | $ | 37.74 | — | — | |||||||
Activity December 1, 2015 - December 31, 2015 | 5,991 | $ | 36.74 | — | — | |||||||
Total | 8,018 | — | — | — | ||||||||
14
PERFORMANCE GRAPH
The following performance graph and related information shall not be deemed to be “soliciting material” or “filed” for purposes of Section 18 of the Exchange Act, nor shall such information be incorporated by reference into any filing of Lydall, Inc. under the Exchange Act, except to the extent that the Company specifically incorporates it by reference in such filing.
The following graph compares the cumulative total return on Lydall’s shares over the past five years with the cumulative total return on shares of companies comprising the Standard & Poor’s Smallcap 600 Index and the Russell 2000 Index. Cumulative total return is measured assuming an initial investment of $100 on December 31, 2010, including reinvestment of dividends, if any. Due to the diversity of niche businesses that the Company participates in, it is difficult to identify a reasonable peer group or one industry or line-of-business index for comparison purposes. Thus, Lydall has chosen to compare its performance to the Standard & Poor’s Smallcap 600 Index and to the Russell 2000 Index, which are comprised of issuers with generally similar market capitalizations to that of the Company.
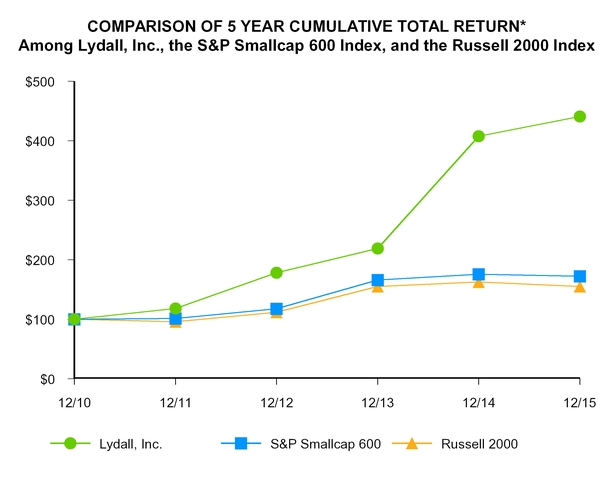
12/31/2010 | 12/31/2011 | 12/31/2012 | 12/31/2013 | 12/31/2014 | 12/31/2015 | |||||||||||||
Lydall, Inc. | 100.00 | 117.89 | 178.14 | 218.88 | 407.70 | 440.75 | ||||||||||||
S&P Smallcap 600 | 100.00 | 101.02 | 117.51 | 166.05 | 175.61 | 172.14 | ||||||||||||
Russell 2000 | 100.00 | 95.82 | 111.49 | 154.78 | 162.35 | 155.18 | ||||||||||||
* | $100 invested on 12/31/10 in stock or index, including reinvestment of dividends. Fiscal year ending December 31. |
15
Item 6. | SELECTED FINANCIAL DATA |
FIVE-YEAR SUMMARY
In thousands except per share amounts and ratio data | 2015 | 2014 | 2013 | 2012 | 2011 | ||||||||||||||
Financial results from continuing operations | |||||||||||||||||||
Net sales | $ | 524,505 | $ | 535,829 | $ | 397,969 | $ | 378,924 | $ | 383,588 | |||||||||
Income from continuing operations | $ | 46,259 | $ | 21,847 | $ | 19,155 | $ | 16,806 | $ | 9,047 | |||||||||
Common stock per share data | |||||||||||||||||||
Basic income from continuing operations | $ | 2.76 | $ | 1.31 | $ | 1.16 | $ | 1.01 | $ | 0.54 | |||||||||
Basic income from discontinued operations | $ | — | $ | — | $ | — | $ | — | $ | 0.28 | |||||||||
Basic net income | $ | 2.76 | $ | 1.31 | $ | 1.16 | $ | 1.01 | $ | 0.82 | |||||||||
Diluted income from continuing operations | $ | 2.71 | $ | 1.28 | $ | 1.14 | $ | 0.99 | $ | 0.54 | |||||||||
Diluted income from discontinued operations | $ | — | $ | — | $ | — | $ | — | $ | 0.28 | |||||||||
Diluted net income | $ | 2.71 | $ | 1.28 | $ | 1.14 | $ | 0.99 | $ | 0.82 | |||||||||
Financial position | |||||||||||||||||||
Total assets | $ | 358,260 | $ | 361,770 | $ | 274,685 | $ | 251,916 | $ | 235,185 | |||||||||
Long-term debt, net of current maturities | $ | 20,156 | $ | 40,315 | $ | 1,051 | $ | 1,646 | $ | 2,261 | |||||||||
Total stockholders’ equity | $ | 245,225 | $ | 212,599 | $ | 200,087 | $ | 174,496 | $ | 160,852 | |||||||||
Property, plant and equipment, net | |||||||||||||||||||
Property, plant and equipment, net | $ | 114,433 | $ | 115,357 | $ | 78,863 | $ | 76,254 | $ | 78,939 | |||||||||
Capital expenditures | $ | 21,555 | $ | 19,001 | $ | 13,826 | $ | 11,404 | $ | 8,884 | |||||||||
Depreciation | $ | 16,386 | $ | 16,659 | $ | 12,109 | $ | 12,784 | $ | 13,625 | |||||||||
Performance and other ratios | |||||||||||||||||||
Gross margin | 23.4 | % | 21.5 | % | 21.4 | % | 20.5 | % | 17.6 | % | |||||||||
Operating margin | 10.0 | % | 6.4 | % | 7.2 | % | 5.6 | % | 4.2 | % | |||||||||
Total debt to total capitalization | 7.7 | % | 16.1 | % | 0.8 | % | 1.4 | % | 2.0 | % | |||||||||
Please read Part II, Item 7 (Management’s Discussion and Analysis of Financial Condition and Results of Operations) of this Annual Report on Form 10-K and the Notes to the Consolidated Financial Statements for specific changes in the Company and its markets that provide context to the above data for the years 2013 through 2015 including, without limitation, discussions concerning (i) how global economic uncertainties have affected the Company’s results; (ii) the impact of the acquisition of Industrial Filtration; (iii) the impact of the disposition of the Life Sciences Vital Fluids business; (iv) the impact of foreign currency translation; (v) asset impairment charges; (vi) pension settlement charges and (vii) the Company’s effective tax rate.
In 2012, changes in the Company that provide context to the above data include the recording of an asset impairment charge of $1.8 million, or $0.07 per diluted share, associated with the abandonment of an ERP project, and the impact of valuation allowance reversal on a foreign tax credit carryover of $3.9 million or $0.23 per diluted share. In 2011, changes in the Company that provide context to the above data include the recording of a pre-tax gain on the sale of a product line of $1.6 million, or $0.10 per diluted share, within the Performance Materials segment, and the impact of disposition of business operations of $4.7 million or $0.28 per diluted share.
16
Item 7. | MANAGEMENT’S DISCUSSION AND ANALYSIS OF FINANCIAL CONDITION AND RESULTS OF OPERATIONS |
Overview and Outlook
Lydall, Inc. and its subsidiaries (collectively, the “Company” or “Lydall”) designs and manufactures specialty engineered non-woven filtration media, industrial thermal insulating solutions, and thermal and acoustical barriers for filtration/separation and heat abatement and sound dampening applications. Lydall principally conducts its business through four reportable segments: Performance Materials, Industrial Filtration, Thermal/Acoustical Metals and Thermal/Acoustical Fibers, with sales globally.
The Performance Materials segment includes filtration media solutions primarily for air, fluid power, and industrial applications (“Filtration”), thermal insulation solutions for building products, appliances, and energy and industrial markets (“Thermal Insulation”), and air and liquid life science applications (“Life Sciences Filtration”).
The Industrial Filtration segment includes non-woven felt media and filter bags used primarily in industrial air and liquid filtration applications. Non-woven filter media is the most commonly used filter technology to satisfy increasing emission control regulations in a wide range of industries, including power, cement, steel, asphalt, incineration, mining, food, and pharmaceutical. The business also produces non-woven rolled-good media that is used in other commercial applications and media for automotive applications is supplied to the Company's Thermal/Acoustical Fibers segment.
The Thermal/Acoustical Metals ("T/A Metals") segment offers a full range of innovative engineered products for the transportation sector to assist primarily in the reduction of powertrain and road noise as well as thermally shield sensitive components from high heat. Lydall products are found in the underbody (tunnel, fuel tank, exhaust, rear muffler and spare tire) and under hood (engine compartment, turbo charger, and manifolds) of cars, trucks, SUVs, heavy duty trucks and recreational vehicles.
The Thermal/Acoustical Fibers ("T/A Fibers") segment offers innovative engineered products to assist primarily in noise vibration and harshness (NVH) abatement within the transportation sector. Lydall products are found in the interior (dash insulators, cabin flooring), underbody (wheel well, aerodynamic belly pan, fuel tank, exhaust) and under hood (engine compartment) of cars, trucks, SUVs, heavy duty trucks and recreational vehicles.
Other Products and Services (“OPS”) was comprised of the Life Sciences Vital Fluids business. Life Sciences Vital Fluids offered specialty products for blood filtration devices, blood transfusion single-use containers and the design and manufacture of single-use solutions for cell growth, frozen storage and fluid handling, as well as equipment for bioprocessing applications. On January 30, 2015, the Company sold all of the outstanding shares of common stock of its Life Sciences Vital Fluids business for a cash purchase price of $30.1 million.
Highlights
Below are financial highlights comparing Lydall’s 2015 results to its 2014 results:
• | Consolidated net sales were $524.5 million in 2015, compared to $535.8 million in 2014, a decrease of $11.3 million, or 2.1%. The change in consolidated net sales is summarized in the following table. |
Components | Change in Net Sales | Percent Change | |||||
Acquisition of Industrial Filtration (February 20, 2014) | $ | 14,992 | 2.8 | % | |||
Parts, volume and pricing change | 15,903 | 3.0 | % | ||||
Change in tooling sales | 2,146 | 0.4 | % | ||||
Divestiture of Life Sciences Vital Fluids (January 30, 2015) | (18,011 | ) | (3.4 | )% | |||
Foreign currency translation | (26,354 | ) | (4.9 | )% | |||
Total | $ | (11,324 | ) | (2.1 | )% | ||
17
• | The change in consolidated net sales attributable to the acquisition of Industrial Filtration relates to the change in net sales in the first quarter of 2015 compared to the partial first quarter of 2014 as the acquisition occurred on February 20, 2014. |
• | Gross margin increased 190 basis points to 23.4% in 2015 compared to 21.5% in 2014. Gross margin improved in the T/A Fibers and Industrial Filtration segments impacting consolidated gross margin by approximately 110 and 50 basis points, respectively, primarily from lower raw material costs, favorable mix of product sales, and improved absorption of fixed costs. T/A Metals and Performance Materials segment gross margins had minimal impact on the change in consolidated gross margin. |
• | Operating income was $52.5 million, or 10.0% of net sales, compared to $34.0 million, or 6.4% of net sales; The change in consolidated operating income is summarized in the following table. |
Components | Change in Operating Income | Percent Change | ||||
Sales/operational | $ | 10,669 | 31.3% | |||
Long-lived asset impairment charge | (1,354 | ) | (4.0)% | |||
Decrease in pension settlement expense | 4,914 | 14.5% | ||||
Acquisition/Divestiture, net | 589 | 1.7% | ||||
Impact of foreign currency translation | (1,861 | ) | (5.5)% | |||
Decrease in sales commission settlement expense | 2,900 | 8.5% | ||||
Decrease in transaction-related expenses | 2,572 | 7.6% | ||||
Total | $ | 18,429 | 54.1% | |||
• | The sales/operational component of the change in Consolidated operating income was primarily attributed to the T/A Fibers segment where operating income increased $7.9 million in 2015 compared to 2014 due to increased net sales and improved gross margin. |
• | Net income was $46.3 million, or $2.71 per diluted share, compared to $21.8 million, or $1.28 per diluted share in 2014. Net income in 2015 included $11.8 million, or $0.69 per diluted share, from the sale of the Life Sciences Vital Fluids business. |
• | Cash generated from operations was $36.1 million in 2015 compared to $41.6 million in 2014. Increased working capital requirements were partially offset by an increase in net income and non-cash adjustments in 2015 compared to 2014. |
Outlook
Entering 2016, the Company sees stable demand for its products at levels consistent with the second half of 2015. Performance Materials demand continues to remain somewhat soft, but orders in the Company's automotive segments remain healthy. The Company is well positioned to execute on its long-term strategy for profitable growth through organic sales growth, geographic expansion, lean initiatives and acquisitions. From a liquidity standpoint, the Company has the ability to fund strategic initiatives that will drive profitable growth.
18
CONSOLIDATED RESULTS OF OPERATIONS
Net Sales
In thousands of dollars | 2015 | Percent Change | 2014 | Percent Change | 2013 | |||||||||||||
Net sales | $ | 524,505 | (2.1 | )% | $ | 535,829 | 34.6 | % | $ | 397,969 | ||||||||
Net sales in 2015 decreased $11.3 million, or 2.1%, compared to 2014 as volume increases in the T/A Fibers, T/A Metals and Industrial Filtration segments were offset by unfavorable foreign currency translation, a divestiture of the Life Sciences Vital Fluids business, and lower net sales from the Performance Materials segment. Foreign currency translation had a negative impact of $26.4 million, or 4.9%, on consolidated net sales in 2015 compared to 2014. Net sales from the divested Life Sciences Vital Fluids business decreased by $18.0 million, in 2015 compared to 2014, as the business was sold on January 30, 2015. The Industrial Filtration segment reported growth in net sales of $26.9 million, or 24.0%, in 2015 compared to 2014, as the Industrial Filtration business was acquired on February 20, 2014. This increase in the Industrial Filtration segment net sales also includes the negative impact of foreign currency translation of $2.3 million, or 2.0%. The T/A Fibers segment parts net sales increased $11.1 million, or 8.9%, in 2015 compared to 2014, and tooling sales decreased $1.0 million in 2015 compared to 2014 due to the timing of new product launches. The T/A Metals segment parts net sales decreased $4.0 million, or 2.8%, in 2015 compared to 2014, including the negative impact of foreign currency translation of $14.7 million, or 10.1%, and tooling sales increased $0.7 million in 2015 compared to 2014, including the negative impact of foreign currency translation of $2.4 million, or 12.8%. The Performance Materials segment net sales decreased by $14.4 million, or 12.4%, in 2015 compared to 2014, including the negative impact of foreign currency translation of $7.0 million, or 6.0%.
Net sales in 2014 increased $137.9 million, or 34.6%, compared to 2013. Foreign currency translation had a minimal impact on net sales in 2014 compared to 2013. The increase in net sales was primarily due to the acquisition of Industrial Filtration. As a result, Industrial Filtration segment net sales of $112.2 million since the date of the acquisition are included in the Company's 2014 consolidated net sales. Pre-acquisition business net sales increased $25.6 million, or 6.4%, compared to 2013. In the T/A Fibers and T/A Metals segments, higher sales volumes resulted in improved parts net sales of $18.6 million, or 17.6%, and $9.3 million, or 6.8%, respectively, compared to 2013. These increases were offset to some extent by lower tooling sales in the T/A Fibers and T/A Metals segments of $4.3 million and $3.4 million, respectively, due to the timing of new product launches. Additionally, net sales increased in the Performance Materials segment by $3.9 million, or 3.5%, and in the Life Sciences Vital Fluids business by $2.5 million, or 14.6%, compared to 2013.
Cost of Sales
In thousands of dollars | 2015 | Percent Change | 2014 | Percent Change | 2013 | |||||||||||||
Cost of sales | $ | 402,008 | (4.5 | )% | $ | 420,851 | 34.6 | % | $ | 312,744 | ||||||||
Cost of sales in 2015 decreased $18.8 million, or 4.5%, compared to 2014. Lower cost of sales from the divested Life Sciences Vital Fluids business, the impact of foreign currency translation, lower raw material costs and labor efficiencies were offset by volume increases in the T/A Fibers, T/A Metals, and Industrial Filtration segments. Foreign currency translation lowered cost of sales in 2015 compared to 2014 by $21.9 million, or 5.2%. Cost of sales decreased $12.5 million in 2015 compared to 2014 as a result of the divested Life Sciences Vital Fluids business which was sold on January 30, 2015. These decreased costs of sales were partially offset by increases in cost of sales of $15.6 million related to increases in sales volume, primarily in the Industrial Filtration and T/A Fibers segments, offset to some extent by lower raw material costs and labor efficiencies, primarily in the Industrial Filtration, T/A Fibers and Performance Materials segments.
Cost of sales in 2014 increased $108.1 million, or 34.6%, compared to 2013. The acquisition of Industrial Filtration in February 2014 contributed to the increase in cost of sales of $96.3 million, or 30.8%, including a purchase accounting adjustment related to inventory step-up of $2.1 million, or 0.7%. The start-up of a manufacturing facility in China by the T/A Metals segment resulted in an increase in cost of sales of $2.5 million, or 0.8%, in 2014 compared to 2013. The remaining increase in cost of sales in 2014 of $9.3 million, or 3.0%, compared to 2013, was due to improved sales volume in all pre-acquisition segments, reduced principally by favorable changes in product mix in the T/A Metals and
19
T/A Fibers segments, and to a lesser extent, lower raw material costs, improved absorption of fixed overhead costs and labor efficiencies primarily in the T/A Fibers segment. Foreign currency translation had a minimal impact on cost of sales in 2014 compared to 2013.
Gross Profit
In thousands of dollars | 2015 | 2014 | 2013 | ||||||||
Gross profit | $ | 122,497 | $ | 114,978 | $ | 85,225 | |||||
Gross margin | 23.4 | % | 21.5 | % | 21.4 | % | |||||
The increase in gross margin by 190 basis points in 2015 compared to 2014 was primarily attributable to improved gross margin in the T/A Fibers segment, which favorably impacted consolidated gross margin by approximately 110 basis points, as a result of lower raw material costs, a favorable mix of product sales and labor efficiencies. Gross margin improved in the Industrial Filtration segment in 2015 compared to 2014 impacting consolidated gross margin by 50 basis points primarily due to the negative impact in 2014 of a $2.1 million, or 40 basis points, inventory purchase accounting adjustment associated with the acquisition. The Life Sciences Vital Fluids business, which was sold in the first quarter of 2015, negatively impacted consolidated gross margin by approximately 25 basis points in 2015 compared to 2014.
The increase in gross margin by 10 basis points in 2014 compared to 2013 was attributable to the pre-acquisition businesses gross margins which increased consolidated gross margin in 2014, mostly offset by the inclusion of Industrial Filtration, since the date of acquisition, which reduced the Company's overall gross margin in 2014 compared to 2013. This increase in the pre-acquisition business gross margin was primarily the result of improved gross margin from the T/A Fibers segment, which positively impacted the Company's overall gross margin, as a result of increased sales of higher margin part sales compared to lower margin tooling sales, improved absorption of fixed costs, lower raw material costs and labor efficiencies. To a lesser extent gross margin also improved in the T/A Metals segment due to a favorable mix of part sales, partially offset by higher aluminum raw material costs, particularly associated with sourcing raw material for the Company's operation in China. Increases in gross margin for the Performance Materials segment and OPS had minimal positive impact on the Company's overall gross margin percentage in 2014 compared to 2013. The Industrial Filtration segment gross margin included the negative impact of a $2.1 million purchase accounting adjustment in cost of sales relating to inventory step-up due to the acquisition.
Selling, Product Development and Administrative Expenses
In thousands of dollars | 2015 | 2014 | 2013 | ||||||||
Selling, product development and administrative expenses | $ | 70,020 | $ | 80,930 | $ | 56,512 | |||||
Percentage of net sales | 13.3 | % | 15.1 | % | 14.2 | % | |||||
Selling, product development and administrative expenses in 2015 decreased by $10.9 million, or 13.5%, compared to 2014. This decrease was due in part to a non-cash pension plan settlement charge of $4.9 million in 2014. Additionally, sales commission expense in 2015 decreased by $3.5 million compared to 2014, primarily related to a $2.9 million commission settlement within the T/A Metals segment, as the Company terminated a long-standing third party commercial sales agreement in the second quarter of 2014. Also contributing to the decreased expenses were transaction related costs of $2.6 million incurred in 2014 related to the Industrial Filtration acquisition and decreased accrued incentive compensation expenses of $1.2 million in 2015 compared to 2014 as fewer targets were achieved in the Company's 2015 annual incentive plan. Selling, product development and administrative expenses also decreased $4.0 million in 2015 as a result of the sale of the Life Sciences Vital Fluids business on January 30, 2015. These decreased expenses were partially offset by a $1.4 million long-lived asset impairment charge in the Performance Materials segment related to intangible assets at the Company's Solutech operation. The Industrial Filtration segment selling, product development and administrative expenses increased $1.9 million in 2015 compared to 2014, primarily due to the inclusion of this business for twelve months in 2015 compared to 2014, as the Industrial Filtration business was acquired on February 20, 2014. Additionally, other selling, product development and administrative expenses associated with pre-acquisition businesses increased in 2015, compared to 2014, related to higher salaries of $0.6 million, higher severance expenses of $0.6 million, recruiting expenses of $0.5 million, and higher product development expenses of $0.6 million in 2015 compared to 2014.
20
Selling, product development and administrative expenses increased by $24.4 million, or 43.2%, in 2014 compared to 2013. Inclusion of the Industrial Filtration segment increased selling, product development and administrative expenses by $9.5 million in 2014 compared to 2013 and transaction related costs, included in corporate office expenses, increased $1.4 million related to the acquisition of Industrial Filtration. Additionally, the increase in selling, product development and administrative expenses in 2014 compared to 2013 was due to a non-cash pension plan settlement charge of $4.9 million, included in corporate office expenses, associated with a voluntary one-time lump sum payment option elected by certain former U.S. employees under the Company's domestic defined benefit pension plan, and a $2.9 million sales commission settlement within the T/A Metals segment as the Company terminated a long-standing commercial sales agreement in 2014. Other selling, product development and administrative expenses associated with pre-acquisition businesses increased in 2014, compared to 2013, related to salaries and benefits of $3.0 million, including $2.0 million of accrued incentive compensation as a result of meeting and exceeding certain operating performance targets in 2014 under an incentive bonus program, professional services of $1.1 million, other administrative costs of $1.3 million and product trial costs of $0.3 million.
Gain on Sale of Business
In thousands of dollars | 2015 | 2014 | 2013 | ||||||||
Gain on sale of business | $ | (18,647 | ) | $ | — | $ | — | ||||
On January 30, 2015, the Company sold all of the outstanding shares of common stock of its Life Sciences Vital Fluids business, reported as Other Products and Services, for a cash purchase price of $30.1 million. The disposition was completed pursuant to a Stock Purchase and Sale Agreement, dated January 30, 2015, by and among the Company, and the buyer. The Company recognized a pre-tax gain on the sale of $18.6 million, reported as non-operating income for the year ended December 31, 2015. Net of income taxes, the Company reported a gain on sale of $11.8 million.
Interest Expense
In thousands of dollars | 2015 | 2014 | 2013 | ||||||||
Interest expense | $ | 755 | $ | 1,093 | $ | 304 | |||||
Weighted average interest rate during the year | 1.3 | % | 1.5 | % | 5.4 | % | |||||
The decrease in interest expense in 2015 compared to 2014 was due to lower average outstanding borrowings under the Company's Amended Credit Facility and lower borrowing rates compared to 2014. Borrowings under the Company's Amended Credit Facility are associated with the acquisition of Industrial Filtration on February 20, 2014.
The increase in interest expense in 2014 compared to 2013 was due to borrowings under the Company's Amended Credit Facility used to finance the acquisition of Industrial Filtration, partially offset by lower average principal balances on capital lease obligations.
Other Income and Expense
In thousands of dollars | 2015 | 2014 | 2013 | ||||||||
Other (income) expense, net | $ | (654 | ) | $ | (701 | ) | $ | 67 | |||
The decrease in other income, net in 2015 compared to 2014 primarily relates to a decrease in foreign currency transaction gains due to the settlement of certain intercompany loans denominated in currencies other than the local functional currency, offset by an increase in foreign currency transaction gains associated with intercompany balances and trade payables and receivables denominated in currencies other than the local functional currency.
The increase in other income, net in 2014 compared to 2013 primarily relates to foreign currency transaction gains associated with intercompany loans denominated in currencies other than the local functional currency. The amounts included in other expense (income), net, in 2013 is primarily related to foreign currency transaction gains and losses and interest income.
21
Income Taxes
2015 | 2014 | 2013 | ||||||
Effective income tax rate | 34.9 | % | 35.1 | % | 32.4 | % | ||
The Company’s effective tax rate for 2015 of 34.9% was positively impacted by a favorable mix of taxable income generated from countries with lower tax rates compared to that of the United States, resulting in a tax benefit of $1.0 million. The Company also recorded a tax benefit of $1.2 million attributable to the Domestic Production Activities Deduction and a tax benefit of $1.1 million related to research and development credits. These favorable adjustments were partially offset by tax expense of $0.9 million related to a net increase in valuation allowance against certain deferred tax assets and by a $0.6 million reduction to state deferred tax assets as a result of state tax law changes that led the Company to deem the asset unrealizable in future periods. The net increase in valuation allowance against certain deferred tax assets of $0.9 million in 2015 was primarily related to tax valuation allowances of $0.8 million recorded against certain net deferred tax assets in the Netherlands and China, as future realization of the assets is not reasonably assured.
In 2014, the effective tax rate of 35.1% was positively impacted by a favorable mix of taxable income generated from countries with lower tax rates compared to that of the United States resulting in a tax benefit of $1.2 million and a tax benefit of $0.9 million attributable to the Domestic Production Activities Deduction. These favorable adjustments were partially offset by tax expense of $0.8 million related to nondeductible transaction costs from the Industrial Filtration acquisition, and a net increase in tax valuation allowances of $0.2 million.
In 2013, the effective tax rate of 32.4% was positively impacted by the release of valuation allowances against state tax credit carryovers of $1.1 million, $0.8 million of benefit relating to Domestic Production Activities Deduction, and a tax benefit of $0.5 million related to the conclusion of certain U.S. federal income tax matters through the year ended December 31, 2009. These favorable tax adjustments were partially offset by an increase in valuation allowance established against a foreign net deferred tax asset. The $1.1 million reversal of valuation allowances against state tax credit carryovers included $0.3 million of state tax credits which offset 2013 state income taxes and $0.8 million expected to benefit future periods.
The Company and its subsidiaries file a consolidated federal income tax return, as well as returns required by various state and foreign jurisdictions. In the normal course of business, the Company is subject to examination by taxing authorities, including such major jurisdictions as the United States, China, France, Germany, Hong Kong, the Netherlands and the United Kingdom. Within the next fiscal year, the Company expects to conclude certain federal income tax matters through the year ended December 31, 2012 and it is reasonably expected that net unrecognized benefits of $0.1 million may be recognized. The total amount of net unrecognized tax benefits that would affect the effective tax rate if recognized was $1.1 million as of December 31, 2015. The Company is no longer subject to U.S. federal examinations for years before 2012, state and local examinations for years before 2011, and non-U.S. income tax examinations for years before 2003.
22
SEGMENT RESULTS
Consolidated Net Sales | For the Years Ended December 31, | ||||||||||
(2) | (3) | ||||||||||
In thousands | 2015 | 2014 | 2013 | ||||||||
Performance Materials Segment: | |||||||||||
Filtration | $ | 62,716 | $ | 71,648 | $ | 64,752 | |||||
Thermal Insulation | 28,311 | 31,404 | 36,929 | ||||||||
Life Sciences Filtration | 10,451 | 12,814 | 10,320 | ||||||||
Performance Materials Segment net sales | 101,478 | 115,866 | 112,001 | ||||||||
Industrial Filtration Segment: | |||||||||||
Industrial Filtration (1) | 139,133 | 112,220 | — | ||||||||
Industrial Filtration Segment net sales | 139,133 | 112,220 | — | ||||||||
Thermal/Acoustical Metals Segment: | |||||||||||
Metal parts | 141,117 | 145,135 | 135,833 | ||||||||
Tooling | 19,815 | 19,130 | 22,573 | ||||||||
Thermal/Acoustical Metals Segment net sales | 160,932 | 164,265 | 158,406 | ||||||||
Thermal/Acoustical Fibers Segment: | |||||||||||
Fiber parts | 135,595 | 124,458 | 105,876 | ||||||||
Tooling | 3,152 | 4,133 | 8,444 | ||||||||
Thermal/Acoustical Fibers Segment net sales | 138,747 | 128,591 | 114,320 | ||||||||
Other Products and Services: | |||||||||||
Life Sciences Vital Fluids | 1,671 | 19,682 | 17,175 | ||||||||
Other Products and Services net sales | 1,671 | 19,682 | 17,175 | ||||||||
Eliminations and Other (1) | (17,456 | ) | (4,795 | ) | (3,933 | ) | |||||
Consolidated Net Sales | $ | 524,505 | $ | 535,829 | $ | 397,969 | |||||
Operating Income | For the Years Ended December 31, | ||||||||||
(2) | (3) | ||||||||||
In thousands | 2015 | 2014 | 2013 | ||||||||
Performance Materials Segment | $ | 6,790 | $ | 9,706 | $ | 9,462 | |||||
Industrial Filtration Segment | 13,431 | 6,412 | — | ||||||||
Thermal/Acoustical Metals Segment | 15,517 | 13,823 | 14,088 | ||||||||
Thermal/Acoustical Fibers Segment | 37,086 | 29,167 | 21,486 | ||||||||
Other Products and Services: | |||||||||||
Life Sciences Vital Fluids | 118 | 1,582 | 778 | ||||||||
Corporate Office Expenses | (20,465 | ) | (26,642 | ) | (17,101 | ) | |||||
Consolidated Operating Income | $ | 52,477 | $ | 34,048 | $ | 28,713 | |||||
(1) | Included in the Industrial Filtration segment and Eliminations and Other is $13.8 million and $1.0 million in intercompany sales to the T/A Fibers segment for the years ended 2015 and 2014, respectively. |
(2) | Other Products and Services reports results for the period preceding the date of disposition of the Life Sciences Vital Fluids business on January 30, 2015. |
(3) | Industrial Filtration segment reports results for the period following the date of acquisition of February 20, 2014 through December 31, 2014. |
23
Performance Materials Segment
Segment net sales decreased $14.4 million, or 12.4%, in 2015 compared to 2014, due to decreased sales volumes of $7.4 million, or 6.4%, and the negative impact of foreign currency translation of $7.0 million, or 6.0%. Filtration product net sales decreased by $8.9 million, or 12.5%, primarily due to unfavorable foreign currency translation and to a lesser extent, lower demand for air filtration products, particularly in Asia and North America. Net sales of thermal insulation products were lower by $3.1 million, or 9.8%, in 2015 compared to 2014 due to lower demand in North America and Asia. Lower insulation product net sales were primarily the result of lower oil prices causing less demand globally for the segment's cryogenic insulation products serving the liquid natural gas market. Net sales of life sciences products were lower by $2.4 million, or 18.4%, in 2015 compared to 2014, due to lower demand for water purification and life protection application products in large part due to the timing of customer orders.
The Performance Materials segment reported operating income of $6.8 million, or 6.7% of net sales in 2015, compared to operating income of $9.7 million, or 8.4% of net sales in 2014. The decrease in operating income was primarily the result of lower gross profit of $2.8 million due to lower segment net sales as well as a long-lived asset impairment charge of $1.4 million, related to intangible assets at the Company's Solutech operation, recorded in selling, product development and administrative expenses. Excluding the impact of the $1.4 million long-lived asset impairment charge, segment selling, product development and administrative expenses decreased $1.3 million in 2015 compared to 2014, primarily related to lower accrued incentive compensation and lower salaries expense. Foreign currency translation had minimal impact on operating income in 2015 compared to 2014.
Segment net sales increased $3.9 million, or 3.5%, in 2014 compared to 2013, due to increased sales volumes and to a lesser extent, the positive impact of foreign currency translation of $0.2 million or 0.2%. An increase in Filtration net sales of $6.9 million, or 10.6%, primarily contributed to the increase in segment net sales due to increased demand for air filtration and fluid power products in North America and Europe. Net sales of Life Sciences Filtration products increased by $2.5 million, or 24.2%, in 2014 compared to 2013, due to increased demand for liquid filtration and water application products. These increases were partially offset by lower net sales of Thermal Insulation products of $5.5 million, or 15.0%, in 2014 compared to 2013, principally due to a decline in sales to a key customer in the HVAC market offset to some extent by increased sales of insulation and automotive filtration products.
The Performance Materials segment reported operating income of $9.7 million, or 8.4% of net sales in 2014, compared to operating income of $9.5 million, or 8.4% of net sales in 2013. During 2014, the impact of higher sales volume and lower material costs resulted in increased gross margin of approximately 50 basis points, which was nearly offset by higher selling, product development and administrative expenses of $1.2 million, or 7.0%, in 2014 compared to 2013. The higher segment selling, product development and administrative expenses were primarily related to increased accrued incentive compensation of $0.9 million as a result of meeting certain operating performance targets in 2014 compared to 2013 when operating performance targets were not met by the business. Also, increases in salaries and benefits expense of $0.3 million and product development trial costs of $0.2 million contributed to the increase in selling, product development and administrative expenses in 2014. These increases were partially offset by lower general administrative expenses of $0.2 million primarily related to lower advertising costs and lower depreciation and amortization expense in 2014 compared to 2013.
Industrial Filtration Segment
Segment net sales increased by $26.9 million, or 24.0% in 2015 compared to 2014, primarily due to a $12.8 million increase in net sales of automotive rolled-good materials to the T/A Fibers segment for use in the T/A Fiber segment manufacturing process. Additionally, segment net sales increased due to the reporting of a full twelve months of segment net sales in 2015 compared to 2014 as the business was acquired on February 20, 2014. Approximately 50% of net sales in this segment were manufactured at Industrial Filtration sites in North America with the remaining net sales split nearly evenly between manufacturing sites in Europe and Asia. Foreign currency translation had a negative impact on segment net sales of $2.3 million, or 2.0%, in 2015 compared to 2014, primarily impacting segment net sales in Europe.
The Industrial Filtration segment reported operating income of $13.4 million, or 9.7% of segment net sales in 2015, compared to operating income of $6.4 million, or 5.7% of segment net sales in 2014. The increase in operating income of $7.0 million in 2015 was due to improved sales volume, due to the reporting of a full quarter of operating income in the first quarter of 2015 compared to the first quarter of 2014 as the business was acquired on February 20, 2014, and a $2.1 million purchase accounting adjustment in cost of sales in 2014 related to inventory step-up. After considering the impact of the inventory step-up adjustment in 2014, the increase in operating margin in 2015 of approximately 190
24
basis points compared to 2014 was primarily related to the sale of automotive rolled-goods to the T/A Fibers segment, lower raw material costs and a favorable mix of product sales. Foreign currency translation had minimal impact on operating income in 2015 compared to 2014.
Segment net sales were $112.2 million from the Acquisition date of February 20, 2014 through December 31, 2014. Approximately 50% of net sales in this segment were manufactured at Industrial Filtration sites in North America with the remaining net sales split nearly evenly between manufacturing sites in Europe and Asia. The Industrial Filtration segment reported operating income of $6.4 million, or 5.7% of net sales from the Acquisition date through December 31, 2014, which included the impact of purchase accounting adjustments in cost of sales related to inventory step-up of $2.1 million negatively impacting operating margin by 180 basis points. There were no comparative results for the year ended December 31, 2013 as the Industrial Filtration segment was created through the Acquisition of that business on February 20, 2014.
Thermal/Acoustical Metals Segment
Segment net sales decreased by $3.3 million, or 2.0%, in 2015 compared to 2014. Foreign currency translation negatively impacted net sales by $17.1 million, or 10.4%, in 2015 compared to 2014. Automotive parts net sales decreased by $4.0 million, or 2.8%, in 2015 compared to 2014, due to unfavorable foreign currency translation of $14.7 million, or 10.1% of net sales. Excluding the negative impact of foreign currency translation, automotive part net sales increased by $10.7 million, or 7.4%, compared to 2014, due to increased demand from customers served by the Company's European and, to a lesser extent, North American and Chinese automotive operations. Tooling net sales increased by $0.7 million, or 3.6%, in 2015 compared to 2014. Excluding the negative impact of foreign currency translation, tooling net sales increased $3.1 million, or 16.3%, due to the timing of new product launches.
The Thermal/Acoustical Metals segment reported 2015 operating income of $15.5 million, or 9.6% of net sales, compared to $13.8 million, or 8.4% of net sales, in 2014. The increase of $1.7 million was due to a decrease in selling, product development and administrative costs of $3.0 million in 2015 compared to 2014. This decrease was primarily related to a $2.9 million commission settlement associated with the 2014 termination of a long-standing third party commercial sales agreement in Europe, and a decrease in professional service expenses of $0.4 million. Partially offsetting the reduction in expenses was foreign currency translation which had a negative impact on operating income of $1.6 million, or 1.0% of net sales in 2015 compared to 2014. Operational inefficiencies at the Company's Chinese facility resulted in a negative impact to operating margin of approximately 120 and 140 basis points in 2015 and 2014, respectively.
Segment net sales increased by $5.9 million, or 3.7%, in 2014 compared to 2013. Foreign currency translation positively impacted net sales by $0.1 million, or 0.1%, in 2014 compared to 2013. Automotive parts net sales increased by $9.3 million, or 6.8%, in 2014 compared to 2013, primarily due to increased demand from customers served by the Company’s North American and European automotive operations and to a lesser extent, parts sales in China as the Company's new manufacturing facility began production in 2014. Market conditions in North America have continued to remain favorable and improved in Europe which led to increased sales volumes. Tooling net sales in 2014 were lower by $3.4 million, or 15.3%, due to timing of new product launches, particularly in Europe.
The Thermal/Acoustical Metals segment reported operating income of $13.8 million, or 8.4% of net sales, in 2014 compared to $14.1 million, or 8.9% of net sales, in 2013. The decrease in operating income was due to an increase in selling, product development and administrative costs of $3.5 million in 2014 compared to 2013. This increase was primarily related to higher sales commission expenses of $1.9 million, largely the result of a $2.9 million commission settlement expense in the second quarter of 2014 associated with the termination of a long-standing commercial sales agreement in Europe. Also, increases in salaries and benefits expense of $0.5 million, professional service expenses of $0.4 million, primarily legal expenses associated with the German Federal Cartel investigation, and other increases in selling expenses contributed to the overall increase in expenses. This increase in selling, general and administrative costs was offset to some extent by an increase in gross profit of $3.2 million, primarily in North America and Europe, due to increased sales volume and a favorable mix of sales of automotive parts. This increased gross profit was offset to some extent by higher production costs, primarily related to sourcing raw material in China as the Company began production operations in 2014.
25
Thermal/Acoustical Fibers Segment
Segment net sales increased by $10.2 million, or 7.9%, in 2015 compared to 2014. Automotive parts net sales increased by $11.1 million, or 8.9%, in 2015 compared to 2014. Higher volumes of parts net sales were primarily due to increased consumer demand for vehicles in North America on Lydall’s existing platforms and new platform awards. Tooling net sales decreased $1.0 million, or 23.7%, in 2015 compared to 2014 due to timing of new product launches. Domestic automobile production increased 2.7% in 2015 compared to 2014.
The Thermal/Acoustical Fibers segment reported 2015 operating income of $37.1 million, or 26.7% of net sales, compared to operating income of $29.2 million, or 22.7%, in 2014. The increase in operating income was primarily attributable to increased parts net sales and gross margin improvement of approximately 400 basis points as a result of lower raw material costs, favorable mix of product sales, improved absorption of fixed costs and labor efficiencies. Segment selling, product development and administrative expenses increased by $0.4 million in 2015 compared to 2014 primarily due to increased salaries and increased product development expenses. Segment selling, product development and administrative expenses as a percentage of net sales was 5.1% in both 2015 and 2014.
Segment net sales increased by $14.3 million, or 12.5%, in 2014 compared to 2013. Automotive parts net sales increased by $18.6 million, or 17.6%, in 2014 compared to 2013. Higher volumes of net sales were primarily due to improved consumer demand for vehicles in North America on Lydall’s existing platforms and new platform awards as well as the timing of certain customer purchases. Tooling net sales decreased $4.3 million, or 51.1%, in 2014 compared to 2013 due to timing of new product launches. Domestic automobile production increased 5.2% in 2014 compared to 2013.
The Thermal/Acoustical Fibers segment reported operating income of $29.2 million, or 22.7% of net sales, in 2014 compared to operating income of $21.5 million, or 18.8%, in 2013. This increase was due to higher net sales and improved gross margin realized from a favorable mix of part sales as well as improved absorption of fixed costs due to higher production levels, lower material costs, and labor efficiencies resulting in gross margin improvement of 360 basis points. Segment selling, product development and administrative expenses increased by $0.4 million in 2014 compared to 2013 primarily due to increased salaries and accrued incentive compensation. However, segment selling, product development and administrative expenses decreased as a percentage of sales to 5.1% in 2014 compared to 5.4% in 2013.
Other Products and Services
On January 30, 2015, the Company sold all of the outstanding shares of common stock of its Life Sciences Vital Fluids business for a cash purchase price of $30.1 million. The disposition was completed pursuant to a Stock Purchase and Sale Agreement, dated January 30, 2015, by and among the Company, and the buyer. The Company recognized a pre-tax gain on the sale of $18.6 million, reported as non-operating income in the first quarter of 2015. Net of income taxes, the Company reported a gain on sale of $11.8 million.
Life Sciences Vital Fluids net sales in 2015 decreased by $18.0 million in 2015 compared to 2014. Life Sciences Vital Fluids reported operating income of $0.1 million, or 7.1% of net sales, in 2015 compared to operating income of $1.6 million, or 8.0% of net sales, in 2014. The decreases in net sales and operating income were due to the sale of this business in the first quarter of 2015.
Life Sciences Vital Fluids net sales increased $2.5 million, or 14.6%, in 2014, compared to 2013, due to higher volumes of bioprocessing and cell therapy product net sales, and to a lesser extent, price increases. Life Sciences Vital Fluids reported operating income of $1.6 million, or 8.0% of net sales, in 2014 compared to $0.8 million, or 4.5% of net sales, in 2013. This increase in operating income was due to a higher net sales, favorable mix of products and improved absorption of fixed costs, partially offset by increased selling and product development and administrative expenses. Contributing to the increase in selling, product development and administrative expenses was an increase in accrued incentive compensation of $0.3 million, as a result of exceeding operating performance targets in 2014 compared to 2013 when operating performance targets were not met by the business, and an asset write off associated with the termination of a product distribution agreement. However, selling, product development and administrative expenses decreased as a percentage of sales to 22.6% in 2014 compared to 23.8% in 2013.
26
Corporate Office Expenses
The decrease in corporate office expenses of $6.2 million in 2015 compared to 2014 was primarily due to a non-cash pension plan settlement charge of $4.9 million in 2014 associated with a voluntary one-time lump sum payment option elected by certain former U.S. employees under the Company's domestic defined benefit pension plan and $2.6 million of transaction related costs incurred in 2014 associated with the Industrial Filtration acquisition on February 20, 2014, including investment banking, legal, and professional accounting fees. Accrued incentive compensation also decreased $0.4 million in 2015 compared to 2014 as fewer targets were achieved in the Company's 2015 annual incentive plan. These decreased costs were offset by increased salaries of $0.7 million, other employee benefits of $0.3 million, recruiting expenses of $0.3 million, and increases in other administrative costs of $0.4 million.
The increase in corporate office expenses of $9.5 million in 2014 compared to 2013 was primarily due to a non-cash pension plan settlement charge of $4.9 million associated with a voluntary one-time lump sum payment option elected by certain former U.S. employees under the Company's domestic defined benefit pension plan and an increase of $1.4 million of transaction related costs associated with the Industrial Filtration acquisition on February 20, 2014, including investment banking, legal, and professional accounting fees. Additionally, other corporate office expenses increased in 2014 compared to 2013 including accrued incentive compensation of $0.8 million, as the Company exceeded bonus targets associated with its 2014 incentive bonus program, non-cash stock based compensation of $0.5 million, salaries and benefits of $0.5 million and depreciation expense of $0.3 million and other administrative expenses of $1.1 million, primarily related to professional services and travel associated with the acquisition of Industrial Filtration.
27
LIQUIDITY AND CAPITAL RESOURCES
For the Year Ended December 31, | ||||||||||||
In thousands except ratio data | 2015 | 2014 | 2013 | |||||||||
Cash and cash equivalents | $ | 75,909 | $ | 62,051 | $ | 75,407 | ||||||
Cash provided by operating activities | $ | 36,110 | $ | 41,628 | $ | 30,280 | ||||||
Cash provided by (used for) investing activities | $ | 7,905 | $ | (93,489 | ) | $ | (13,986 | ) | ||||
Cash (used for) provided by financing activities | $ | (26,707 | ) | $ | 42,549 | $ | (5,617 | ) | ||||
Depreciation and amortization | $ | 17,275 | $ | 17,646 | $ | 12,703 | ||||||
Capital expenditures | $ | (20,645 | ) | $ | (13,971 | ) | $ | (13,826 | ) | |||
Total debt | $ | 20,479 | $ | 40,930 | $ | 1,714 | ||||||
Total capitalization (debt plus equity) | $ | 265,704 | $ | 253,529 | $ | 201,801 | ||||||
Total debt to total capitalization | 7.7 | % | 16.1 | % | 0.8 | % | ||||||
The Company assesses its liquidity in terms of its ability to generate cash to fund operating, investing and financing activities. The principal source of liquidity is operating cash flows. In addition to operating cash flows, other significant factors that affect the overall management of liquidity include capital expenditures, investments in businesses, strategic transactions, income tax payments, debt service payments, outcomes of contingencies and pension funding. The Company manages worldwide cash requirements by considering available funds among domestic and foreign subsidiaries. The Company expects to finance its 2016 operating cash and capital spending requirements from existing cash balances, cash provided by operating activities and through borrowings under its existing credit agreement, as needed.
At December 31, 2015, the Company held $75.9 million in cash and cash equivalents, including $39.3 million in the U.S. with the remaining held by foreign subsidiaries.
Operating Cash Flows
Net cash provided by operating activities in 2015 was $36.1 million compared with $41.6 million in 2014. In 2015, net income and non-cash adjustments were $52.9 million compared to $48.0 million in 2014. Net operating assets and liabilities increased $16.8 million in 2015, compared to an increase in operating assets and liabilities of $6.4 million in 2014. The increase in operating assets and liabilities in 2015 was primarily due to a $4.8 million decrease in benefit plan liabilities resulting from cash contributions to the Company's domestic pension plan as well as a $3.4 million decrease in accrued payroll and other compensation in 2015 mainly due to the timing of payroll and lower accruals related to the Company's annual incentive bonus program. Further contributing to the increase in operating assets and liabilities in 2015 was a $4.9 million decrease in accounts payable primarily due to timing of payments to vendors and higher accounts receivable due to greater sales in the fourth quarter of 2015 compared to the fourth quarter of 2014.
Net cash provided by operating activities in 2014 was $41.6 million compared with $30.3 million in 2013. In 2014, net income and non-cash adjustments were $48.0 million compared to $34.9 million in 2013. Net operating assets and liabilities increased $6.4 million in 2014, compared to an increase in operating assets and liabilities of $4.7 million in 2013. The increase in operating assets and liabilities in 2014 was due to an increase in accounts receivable of $7.2 million primarily due to the addition of the Industrial Filtration segment. Prepaid expenses and other assets and taxes receivable increased $6.4 million in 2014, partially offset by a decrease in inventory $4.5 million in 2014, due to lower inventory days on hand from improvements within the Industrial Filtration business. Further offsetting the increase in operating assets and liabilities in 2014 was a $3.3 million increase in accrued payroll and other compensation mainly due to higher accruals related to the Company's incentive bonus program and health benefits.
28
Investing Cash Flows
Net cash provided by investing activities was $7.9 million in 2015 compared to net cash used of $93.5 million in 2014. In 2015, the Company received $28.6 million in proceeds from the sale of the Life Sciences Vital Fluids business, net of transaction expenses. In 2014, the Company paid $79.4 million, net of cash acquired, for the Industrial Filtration business. Cash outflows for capital expenditures in 2015 were $20.6 million compared to $14.0 million in 2014 primarily related to capital spending in the Company's T/A Fibers and T/A Metals North American manufacturing facilities.
Net cash used for investing activities was $93.5 million in 2014 compared to $14.0 million in 2013, an increase of $79.5 million. This increase was primarily due to cash used for the acquisition of Industrial Filtration of $79.4 million, net of cash acquired. Cash outflows for capital expenditures in 2014 were $14.0 million compared to $13.8 million in 2013.
Financing Cash Flows
In 2015, net cash used for financing activities was $26.7 million compared with net cash provided by financing activities of $42.5 million in 2014. In 2014, the Company borrowed $60.0 million against its amended credit facility to fund the purchase of the Industrial Filtration business. Debt repayments were $20.6 million and $20.7 million in 2015 and 2014, respectively. The Company acquired $8.7 million of its Common Stock through its stock repurchase and equity compensation plans in 2015, compared to $0.7 million in 2014. The Company also received $1.5 million from the exercise of stock options during 2015, compared to $2.5 million during 2014.
In 2014, net cash provided by financing activities was $42.5 million compared with net cash used for financing activities of $5.6 million in 2013. In 2014, the Company borrowed $60.0 million against its amended credit facility to fund the purchase of the Industrial Filtration business and made repayments against those borrowings of $20.0 million. The Company acquired $0.7 million of its Common Stock through its stock repurchase and equity compensation plans in 2014, compared to $6.6 million in 2013. The Company also received $2.5 million from the exercise of stock options during 2014, compared to $1.5 million during 2013.
Financing Arrangements
On February 18, 2014, the Company amended and restated its $35.0 million senior secured domestic revolving credit facility (as further amended May 5, 2015, “Amended Credit Facility”) with a financial institution and two additional lenders, increasing the available borrowing from $35 million to $100 million. The Amended Credit Facility is secured by substantially all of the assets of the Company. The maturity date for the Amended Credit Facility is January 31, 2019, at which time amounts outstanding under the Amended Credit Facility are due and payable. The Company entered into this Amended Credit Facility in part to fund a majority of the purchase price of the Industrial Filtration acquisition.
Under the terms of the Amended Credit Facility, the lenders are providing a $100 million revolving credit facility to the Company, under which the lenders may make revolving loans and issue letters of credit to or for the benefit of the Company and its subsidiaries. The Amended Credit Facility may be increased by an aggregate amount not to exceed $50 million through an accordion feature, subject to specified conditions.
The Amended Credit Facility contains a number of affirmative and negative covenants, including financial and operational covenants. The Company is required to meet a minimum interest coverage ratio. The interest coverage ratio requires that, at the end of each fiscal quarter, the ratio of consolidated EBIT to Consolidated Interest Charges, both as defined in the Amended Credit Facility, may not be less than 2.0 to 1.0 for the immediately preceding 12 month period. In addition, the Company must maintain a Consolidated Leverage Ratio, as defined in the Amended Credit Facility, as of the end of each fiscal quarter of no greater than 3.0 to 1.0. The Company must also meet minimum consolidated EBITDA as of the end of each fiscal quarter for the preceding 12 month period of $30.0 million. The Company was in compliance with all covenants during 2015 and at December 31, 2015.
Interest is charged on borrowings at the Company’s option of either: (i) Base Rate plus the Applicable Rate, or (ii) the Eurodollar Rate plus the Applicable Rate. The Base Rate is a fluctuating rate equal to the highest of (a) the federal funds rate plus 0.50%, (b) the prime rate as set by Bank of America, and (c) the Eurocurrency Rate plus 1.00%. The Eurocurrency Rate means (i) if denominated in LIBOR quoted currency, a fluctuating LIBOR per annum rate equal to the London Interbank Offered Rate; (ii) if denominated in Canadian Dollars, the rate per annum equal to the Canadian Dealer Offered Rate; or (iii) the rate per annum as designated with respect to such alternative currency at the time such alternative currency is approved by the Lenders. The Applicable Rate is determined based on the Company’s
29
Consolidated Leverage Ratio (as defined in the Amended Credit Agreement). The Applicable Rate added to the Base Rate Committed Loans ranges from 15 basis points to 100 basis points, and the Applicable Rate added to Eurocurrency Rate Committed Loans and Letters of Credit ranges from 75 basis points to 175 basis points. The Company pays a quarterly fee ranging from 20 basis points to 30 basis points on the unused portion of the $100 million available under the Amended Credit Agreement. At December 31, 2015, the Company had borrowing availability of $78.1 million under the Amended Credit Facility net of $20.0 million of borrowings outstanding and standby letters of credit outstanding of $1.9 million.
Future Cash Requirements
The Company manages worldwide cash requirements considering available funds among domestic and foreign subsidiaries. The Company expects to fund its operating cash requirements from existing cash balances, cash generated by operations, and through borrowings, as needed, under its existing domestic and foreign credit facilities. The Company continually explores its core markets for suitable acquisitions, joint ventures, alliances and licensing agreements. If completed, such activities would be financed with existing cash balances, cash generated from operations, under the credit facilities described under “Financing Arrangements” above or other forms of financing, as required.
At December 31, 2015, total indebtedness, of which $20.0 million is a revolver loan and $0.5 million is capital leases, was $20.5 million, or 7.7% of the Company’s total capital structure. Cash requirements for 2016 are expected to include the funding of ongoing operations, capital expenditures, payments due on capital and operating leases, pension plan contributions, income tax payments and optional prepayments on the revolver loan. Capital spending for 2016 is expected to be approximately $25 million to $30 million. The funded status of the Company's domestic defined benefit pension plan is dependent upon many factors, including returns on invested assets, levels of market interest rates, mortality rates and levels of contributions to the plan. The Company is not obligated to make any minimum contributions during the 2016 plan year but expects to contribute approximately $3.0 million to $4.0 million to its defined benefit pension plan in 2016.
As discussed in Item 3, Legal Proceedings, Lydall Gerhardi GmbH & Co. KG an indirect wholly-owned subsidiary of the Company, may be subject to fines related to the on-going German Federal Cartel Office (Bundeskartellamt) investigation. There can be no assurance that this matter will not have a material adverse effect on the Company including its future cash requirements.
Contractual Obligations
The following table summarizes the Company’s significant contractual obligations as of December 31, 2015 and the effect of such contractual obligations are expected to have on the Company’s liquidity and cash flows in future periods. For recent financing activity please refer to “Financing Arrangements” above.
Payments Due by Period | |||||||||||||||||||||||||||
In thousands | 2016 | 2017 | 2018 | 2019 | 2020 | After 5 years | Total | ||||||||||||||||||||
Contractual Obligations: | |||||||||||||||||||||||||||
Operating leases | 4,385 | 3,782 | 2,284 | 828 | 526 | 603 | 12,408 | ||||||||||||||||||||
Capital leases* | 326 | 42 | 42 | 42 | 35 | — | 487 | ||||||||||||||||||||
Long-term debt* | 288 | 288 | 288 | 20,024 | — | 20,888 | |||||||||||||||||||||
Total Contractual Obligations | $ | 4,999 | $ | 4,112 | $ | 2,614 | $ | 20,894 | $ | 561 | $ | 603 | $ | 33,783 | |||||||||||||
* | Includes estimated interest payments | |
The Company has a capital lease agreement for the land and building at the St. Nazaire, France operating facility, included in the Thermal/Acoustical Metals segment, requiring monthly principal and interest payments until 2016. The capital lease provides an option for the Company to purchase the land and building at the end of the lease for a nominal amount. Operating leases are primarily related to buildings, office equipment, vehicles and machinery.
With the exception of the revolver loan, the Company’s long-term debt payments and interest rates relating to its capital lease obligations debt were fixed as of December 31, 2015. Refer to Note 6 to the Consolidated Financial Statements
30
for additional discussion on long-term debt. Actual payments may vary significantly from those included in the table above depending on future debt levels, timing of debt repayments and sources of funding utilized.
The Company has no minimum funding requirements under ERISA for the 2016 plan year based on the Company’s pension plan valuations at December 31, 2015. See Note 8 to the Consolidated Financial Statements for additional information regarding the Company’s pension plans.
In addition to the above contractual obligations, the Company utilizes letters of credit in the ordinary course of business for security deposit requirements. Outstanding letters of credit were $1.9 million and $2.3 million at December 31, 2015 and 2014, respectively.
The above table does not reflect net tax contingencies of $1.7 million, the timing of which is uncertain. Refer to Note 11 to the Consolidated Financial Statements for additional discussion on unrecognized tax benefits. Purchase orders or contracts for normal purchases of raw materials and other goods and services are not included in the table above. The Company is not able to determine the aggregate amount of such purchase orders that represent contractual obligations, as purchase orders may represent authorizations to purchase rather than binding agreements. For purposes of this table, contractual obligations for purchase of goods or services are defined as agreements that are enforceable and legally binding on the Company and that specify all significant terms, including: fixed or minimum quantities to be purchased; fixed, minimum or variable price provisions; and the approximate timing of the transactions. The Company does not have significant agreements for the purchase of raw materials or other goods specifying minimum quantities or set prices that exceed expected requirements.
CRITICAL ACCOUNTING ESTIMATES
The preparation of the Company’s Consolidated Financial Statements in accordance with accounting principles generally accepted in the United States of America requires management to make estimates and assumptions that affect the reported amounts of assets and liabilities and disclosure of contingent assets and liabilities as of the date of the financial statements and the reported amounts of revenues and expenses during the reporting periods. Note 1 in Notes to Consolidated Financial Statements describes the significant accounting policies used in the preparation of the Consolidated Financial Statements. The Company’s management is required to make judgments about and estimates of the effect of matters that are inherently uncertain. Actual results could differ from management’s estimates. The most significant areas involving management judgments and estimates are described below.
Goodwill
The Company had goodwill of $16.8 million at December 31, 2015 and $21.9 million at December 31, 2014. Goodwill is not amortized, but rather is subject to impairment tests annually or more frequently when an event occurs or circumstances change that would more likely than not reduce the fair value of a reporting unit below its carrying value. The identification and measurement of goodwill impairment involves the estimation of the fair value of reporting units, including related goodwill. The Company’s reporting units are operating segments or components of operating segments for which discrete financial information is available and segment management regularly reviews the operating results of that reporting unit. The impairment test used for goodwill was a two-step approach. In the first step, the fair value of the reporting unit is compared to its carrying value. If the fair value of the reporting unit exceeds the carrying value of its net assets, goodwill is considered not impaired and no further testing is required. If the carrying value of the net assets exceeds the fair value of the reporting unit, a second step of the impairment test would be performed in order to determine the implied fair value of a reporting unit’s goodwill. Determining the implied fair value of goodwill would require a valuation of the reporting unit’s tangible and intangible assets and liabilities in a manner similar to the allocation of purchase price in a business combination. If the carrying value of the reporting unit’s goodwill exceeds the implied fair value of its goodwill, goodwill is deemed impaired and is written down to the extent of the difference.
During the fourth quarter of 2015, the Company performed its annual impairment analysis of the $12.9 million of goodwill in the Performance Materials reporting unit (PM reporting unit) and $3.9 million of goodwill in Industrial Filtration reporting unit (IF reporting unit).
After considering changes in assumptions used in the Company's most recent quantitative annual testing, including the capital markets environment, economic conditions, industry trends, changes in results of operations, and other factors, the Company concluded it was necessary to perform the two-step impairment test for the PM reporting unit. For 2015, the Company used both the income approach and market approach in performing step one of the impairment analysis to estimate the fair value of the reporting unit. The income approach involved determining the present value
31
of future cash flows from the reporting unit’s projected financial results from 2016 - 2018 and the projected cash flows beyond that three year period computed as the terminal value. The Company believes the income approach was appropriate because it provided a fair value estimate based upon the reporting unit’s expected long-term operations and cash flow performance.
In applying the market approach, valuation multiples were derived from historic operating data of selected guideline companies, which were evaluated and adjusted, if necessary. The valuation multiples were then applied to the appropriate operating data of the reporting unit to arrive at an indication of fair value. The Company believes the market approach was appropriate because it provided a fair value using multiples from companies with operations and economic characteristics similar to its reporting unit.
The Company determined that the PM reporting unit, with $12.9 million of goodwill, had fair value which exceeded its carrying value by greater than 50%, and as a result, step two of the impairment test was not required.
The Company used the qualitative method to analyze the goodwill for the IF reporting unit, which was acquired in February 2014. When considering capital markets environment, economic conditions, industry trends, results of operations, and other factors the Company determined that it is not more likely than not that the fair value of the reporting unit is less than its carrying amount.
In the event that the Company’s operating results in the future do not meet current expectations, management, based upon conditions at the time, would consider taking restructuring or other actions as necessary to maximize profitability. The estimates of fair value of reporting units are based on the best information available as of the date of the assessment, which incorporate management assumptions about expected future cash flows, as well as other factors such as market capitalization and other market information. Future cash flows can be affected by numerous factors including changes in economic, industry or market conditions, changes in the underlying business or products of the reporting unit, changes in competition and changes in technology. Any changes in key assumptions about the business and its prospects, changes in any of the factors discussed above or other factors could affect the fair value of one or more of the reporting units resulting in an impairment charge.
Impairment of Long-Lived Assets
Long-lived assets are reviewed for impairment whenever events or changes in circumstances indicate that the carrying amount of such assets may not be recoverable. Determination of recoverability is based on the Company’s judgment and estimates of undiscounted future cash flows resulting from the use of the assets and their eventual disposition. Measurement of an impairment loss for long-lived assets that management expects to hold and use is based on the fair value of the assets. If the carrying values of the assets are determined to be impaired, then the carrying values are reduced to their estimated fair values. The fair values of the impaired assets are determined based on applying a combination of market approaches, including independent appraisals when appropriate, the income approach, which utilizes cash flow projections, and the cost approach.
During the fourth quarter of 2015, the Company performed an impairment analysis for long-lived assets at the Company’s DSM Solutech B.V. (“Solutech”) operation, included in the Performance Materials segment, as a result of indicators of possible impairment. During 2015, Solutech reported a cash flow loss which was caused by the delay in the commercialization of certain Solutech products to the market place by Solutech’s customers. As a result of these negative cash flows, combined with historical operating losses, and a reduction in the expected amount of future cash flows of Solutech, the Company determined that it was appropriate to test the Solutech asset group for recoverability in the fourth quarter of 2015. Patents, with a remaining useful life of 8 years, and machinery and equipment primarily comprise the carrying value of the asset group of $3.2 million. To determine the recoverability of the Solutech asset group the Company completed an undiscounted cash flow analysis and compared it to the asset group carrying value. This analysis was primarily dependent on the expectations for net sales over the period when the business has technological exclusivity provided by its patents. Future cash flows are dependent on the success of commercialization efforts of Solutech products by OEMs, the quality of Solutech products and technology advancements and management’s ability to manage costs.
The impairment test concluded that the Solutech asset group was not recoverable as the resulting undiscounted cash flows were less than their carrying amount. Accordingly, the Company estimated the fair value of the Solutech long-lived assets to determine the impairment amount. Determining fair value is judgmental in nature and requires the use of significant estimates and assumptions considered to be Level 3 inputs including royalty rates, long-term growth rates and discount rates.
32
To determine the fair value of its patents, the Company used the relief from royalty method, which is a form of the income approach that focused on the level of royalty payments that the user of an intangible asset would have to pay a third party for the use of the asset if it were not owned by the user. Under this approach, revenue associated with the associated technology was projected over the expected remaining useful life of the asset, with a royalty rate applied to the expected revenue. The estimated fair value of the patents was below its carrying value.
To determine the estimated fair value of its machinery and equipment, the Company used the cost approach. Under the cost approach, the determination of fair value considered the replacement cost of the assets with adjustments in value for physical deterioration, functional obsolescence, and economic obsolescence, all Level 3 inputs. The estimated fair value of the machinery and equipment exceeded its carrying value, resulting in no adjustment to the machinery and equipment.
As a result of the Company’s fair value estimates, the Company adjusted the carrying amount of the patents to $0.7 million and recorded an impairment charge of $1.4 million during the quarter ended December 31, 2015. This charge was recorded in the Company’s Performance Materials segment as part of selling, product development and administrative expenses.
Pensions
Pension cost and the related obligations recognized in the Consolidated Financial Statements are determined on an actuarial basis. The determination of such amounts is made in consultation with the Company’s outside actuaries based on information and assumptions provided by the Company. A substantial portion of the Company’s pension amounts relate to its domestic defined benefit pension plan. Pension plans outside the United States were not significant at December 31, 2015. The domestic defined benefit pension plan, which covers certain domestic Lydall employees, is noncontributory and benefits are based on either years of service or eligible compensation paid while a participant is in a plan. The plan has been closed to new employees for several years and benefits under the pension plan are no longer accruing.
A significant element in determining the Company’s pension cost is the expected return on plan assets. Based on a review of market trends, actual returns on plan assets and other factors, including the allocation of the Company’s investment between equity and fixed income funds, the Company’s expected long-term rate of return on plan assets was 7.00% at December 31, 2015, which will be utilized for determining 2016 pension cost. An expected long-term rate of return of 7.25% was used for determining 2015 pension expense and 7.25% and 7.50%, respectively, in determining 2014 and 2013 pension expense. In determining the expected return on plan assets, the Company considers the relative weighting of plan assets, the historical performance of marketable debt and equity securities and economic and other indicators of future performance. Investment management objectives include maintaining an adequate level of diversification to balance market risk and to provide sufficient liquidity for near-term payments of benefits accrued under the plan and to pay the expenses of administration. The investment plan assets are stated at fair value, which is based on quoted market prices in an active market. The expected long-term rate of return on assets is applied to the value of plan assets at the beginning of the year and this produces the expected return on plan assets that is included in the determination of pension cost for that year. The difference between this expected return and the actual return on plan assets is deferred, within certain parameters, as discussed below. The Company continually evaluates its expected long-term rate of return and will adjust such rate as deemed appropriate.
At the end of each year, the Company determines the discount rate to be used to calculate the present value of plan liabilities, as well as the following year’s pension cost. The discount rate is an estimate of the current interest rate at which the pension liabilities could be effectively settled at the end of the year. The Company based its discount rate assumption on an analysis which included the selection of a bond portfolio comprised of high quality fixed income investments whose cash flows would provide for the projected benefit payments of the plan. The discount rate is then developed as the single rate that equates the market value of the bond portfolio to the discounted value of the plan’s benefit payments. At December 31, 2015 and 2014, the Company determined this rate to be 4.56% and 4.16%, respectively. Increases or decreases in the discount rate result in decreases and increases, respectively, in the projected benefit obligation. Actuarial gains, related to the increase in discount rate at December 31, 2015, decreased the pension plan liability $2.4 million and increased other comprehensive income net-of-tax by $1.5 million. The net effect on pension liabilities from changes in the discount rate is deferred within certain parameters, as discussed below.
In 2014, the Society of Actuaries issued an updated set of mortality tables and improvement scale collectively known as RP-2014 and MP-2014, respectively. The Company reviewed the findings and recommendations of these reports with their actuary. Based on that review, the Company elected to utilize the Society of Actuaries' base mortality scale
33
RP-2014 with the BB-2D mortality improvement scale, as the Company believes the BB-2D mortality improvement table more accurately reflects recent rates of mortality improvement since 2006 for the general population compared to the MP-2014 table. Actuarial losses, related to the change in mortality tables at December 31, 2014, increased the pension plan liability $2.4 million and decreased other comprehensive income net-of-tax by $1.5 million.
A one-quarter percentage point change in the assumed long-term rate of return on the Company’s domestic pension plan as of December 31, 2015 would impact the Company’s 2016 pre-tax income by approximately $0.1 million. A one-quarter percentage point decrease in the discount rate on the Company’s domestic pension plan as of December 31, 2015 would have a minimal impact on the Company’s 2016 pre-tax income. The Company reviews these and other assumptions at least annually.
Pension accounting guidance requires that gains or losses be deferred unless the unrecognized net gain or loss at the end of a year exceeds a “corridor” (as defined in the pension accounting guidance). If the deferred gain or loss exceeds the corridor at the end of the year, then the amount in excess of the corridor is amortized over a period equal to the average remaining service period of active employees expected to receive benefits. Since benefit accruals were frozen on certain domestic defined benefit pension plans on June 30, 2006, these plan participants are considered inactive participants. Therefore, the gain/loss amortization for these plans is amortized over the average remaining life expectancy of all plan participants. As of December 31, 2015 and 2014, the net deferred loss exceeded the corridor. Consequently, pension cost for 2016 will include amortization of a portion of the deferred loss in excess of the corridor. The amount of amortization in future years will be dependent on changes in the components of the deferred loss amount, particularly actual return on plan assets in relation to the estimated return on plan assets, as well as future increases or decreases in the discount rate.
For the year ended December 31, 2015, the Company recognized pension expense related to its domestic defined benefit pension plan of $0.6 million as a result of the expected return on assets being lower than the aggregate of interest cost and the amortization of actuarial loss. During 2014, the Company offered a voluntary one-time lump sum payment option to certain former U.S. employees who were vested defined benefit plan participants and not currently receiving monthly payments from the Company's domestic pension plan. This one-time lump sum payout of $10.3 million required a re-measurement of the domestic pension plan and a partial plan settlement charge, which resulted in a non-cash pre-tax loss of $4.9 million in 2014 net periodic pension benefit expense. The non-cash charge was required to accelerate the recognition of a portion of the previously unrecognized actuarial losses in the domestic pension plan.
As discussed above, the Company’s discount rate was 4.56% at December 31, 2015 and will be used for purposes of determining 2016 pension cost. Pension expense for 2016 is expected to be in the range of $0.6 million to $0.7 million. The Company contributed $5.6 million to its domestic defined benefit pension plan during 2015 and expects to contribute approximately $3.0 million to $4.0 million in 2016.
Income Taxes
The Company accounts for income taxes following ASC 740 (Accounting for Income Taxes) recognizing deferred tax assets and liabilities using enacted tax rates for the effect of temporary differences between book and tax basis of recorded assets and liabilities. Deferred tax assets are reduced by a valuation allowance if it is more likely than not that some or all of a deferred tax asset will not be realized.
In assessing the need for a valuation allowance, the Company analyzes historical financial results by jurisdiction and estimates future taxable income, considering the feasibility of ongoing tax planning strategies and the realizable benefit of tax loss carryforwards. Valuation allowances related to deferred tax assets can be impacted by changes in tax law, changes in statutory tax rates and future levels of taxable income. In the event the Company was to determine that it would not be able to realize all or a portion of its deferred tax assets in the future, the Company would reduce such amounts through a charge to income in the period that such determination was made. Conversely, if the Company was to determine that it would be able to realize its deferred tax assets in the future in excess of the net carrying amounts, the Company would decrease the recorded valuation allowance and record an increase to income in the period that such determination was made. (See Note 11)
As of December 31, 2015 the Company has not paid U.S. income taxes on approximately $24.5 million of undistributed earnings of foreign subsidiaries. The Company’s intention is to reinvest these earnings indefinitely or to repatriate the earnings only when it is tax effective to do so. The Company estimates that the amount of tax that would be payable on the undistributed earnings if repatriated to the United States would fall in the range of $1.0 million to $6.0 million,
34
based on current facts, but depending on the timing and extent of the repatriation. This amount may vary in the future due to a variety of factors including future tax law changes, future earnings and statutory taxes paid by foreign subsidiaries, and ongoing tax planning strategies by the Company.
The Company and its subsidiaries file a consolidated federal income tax return, as well as returns required by various state and foreign jurisdictions. In the normal course of business, the Company is subject to examination by taxing authorities, including such major jurisdictions as the United States, China, France, Germany, Hong Kong, the Netherlands and the United Kingdom. Within the next fiscal year, the Company expects to conclude certain federal income tax matters through the year ended December 31, 2012 and it is reasonably expected that net unrecognized benefits of $0.1 million may be recognized. The total amount of net unrecognized tax benefits that would affect the effective tax rate if recognized is $1.1 million as of December 31, 2015. The Company is no longer subject to U.S. federal examinations for years before 2012, state and local examinations for years before 2011, and non-U.S. income tax examinations for years before 2003.
Equity Compensation Plans
The Company accounts for awards of equity instruments under the fair value method of accounting and recognizes such amounts in the Consolidated Statements of Operations. The Company recognizes expense on a straight-line basis over the vesting period of the entire award. Stock-based compensation expense includes the estimated effects of forfeitures and such estimates of forfeitures are adjusted over the requisite service period to the extent actual forfeitures differ, or are expected to differ, from such estimates. The effect of changes in estimated forfeitures is recognized in the period of change and will also impact the amount of expense to be recognized in future periods. The Company estimates the fair value of option grants based on the Black Scholes option-pricing model. Expected volatility and expected term are based on historical information. The Company believes that future volatility and expected term are not likely to materially differ from the Company’s historical stock price volatility and historical exercise data, respectively.
The fair value of each option granted is estimated on the date of grant using the Black-Scholes option-pricing model with the following weighted-average assumptions for the years ended December 31:
2015 | 2014 | 2013 | ||||||
Risk-free interest rate | 1.8 | % | 1.6 | % | 1.7 | % | ||
Expected life | 5.5 years | 5.1 years | 5.2 years | |||||
Expected volatility | 43 | % | 46 | % | 65 | % | ||
Expected dividend yield | — | % | — | % | — | % | ||
Recently Issued Accounting Standards
In July 2015, the FASB issued ASU No. 2015-11, “Inventory" (Topic 330): Simplifying the Measurement of Inventory." This ASU requires an entity to measure inventory at the lower of cost and net realizable value. Net realizable value is the estimated selling prices in the ordinary course of business, less reasonably predictable costs of completion, disposal, and transportation. Subsequent measurement is unchanged for inventory measured using last-in, first-out (“LIFO”) or the retail inventory method. This ASU is effective for fiscal years beginning after December 15, 2016. Early adoption is permitted. This ASU is not expected to have an impact on the Company’s consolidated financial statements and disclosures.
In May 2014, the FASB issued ASU No. 2014-09, “Revenue from Contracts with Customers” (Topic 606). This ASU provides guidance for revenue recognition and affects any entity that either enters into contracts with customers to transfer goods or services or enters into contracts for the transfer of nonfinancial assets and supersedes the revenue recognition requirements in Topic 605, “Revenue Recognition,” and most industry specific guidance. The standard’s core principle is the recognition of revenue when a company transfers promised goods or services to customers in an amount that reflects the consideration to which the company expects to be entitled in exchange for those goods or services. In doing so, companies will need to use more judgment and make more estimates than under the current guidance. These may include identifying performance obligations in the contract, estimating the amount of variable consideration to include in the transaction price and allocating the transaction price to each separate performance obligation. In August 2015, the FASB issued ASU 2015-14, "Revenue from Contracts with Customers (Topic 606): Deferral of the Effective Date", which deferred the effective date of ASU 2014-09 to fiscal years beginning after December 15, 2017, including interim reporting periods within that reporting period. Early adoption is permitted for
35
fiscal years beginning after December 15, 2016. The Company is currently evaluating the method and impact the adoption of ASU 2014-09 will have on the Company’s consolidated financial statements and disclosures.
In November 2015, the FASB issued ASU No. 2015-17, "Income Taxes" (Topic 740): Balance Sheet Classification of Deferred Taxes". This ASU requires an entity to classify all deferred tax assets and liabilities, along with any related valuation allowance, as noncurrent on the balance sheet. The current requirement that deferred tax liabilities and assets of a tax-paying component of an entity be offset and presented as a single amount is not affected by the amendments in this ASU. This ASU is effective for fiscal years beginning after December 15, 2016. Early adoption is permitted. The Company is currently evaluating the method and impact the adoption of ASU 2015-17 will have on the Company’s consolidated financial statements and disclosures.
In January 2016, the FASB issued ASU No. 2016-01, "Financial Instruments - Overall" (Subtopic 825-10): Recognition and Measurement of Financial Assets and Financial Liabilities". This ASU revises an entity’s accounting related to (1) the classification and measurement of investments in equity securities and (2) the presentation of certain fair value changes for financial liabilities measured at fair value. It also amends certain disclosure requirements associated with the fair value of financial instruments. This ASU is effective for fiscal years beginning after December 15, 2017. This ASU is not expected to have a material impact on the Company’s consolidated financial statements and disclosures.
OTHER KEY FINANCIAL ITEMS
Cash and Cash Equivalents — Cash and cash equivalents increased to $75.9 million as of December 31, 2015 compared with $62.1 million as of December 31, 2014. This increase of $13.9 million was primarily due to cash generated from operating activities of $36.1 million and cash generated from investing activities of $7.9 million, which was partially offset by cash used for financing activities of $26.7 million. Investing activities included cash proceeds of $28.6 million associated with the sale of the Life Sciences Vital Fluids business, net of transaction expenses, and $20.6 million was used for capital expenditures. Financing activities were primarily attributed to debt repayments of $20.6 million and the repurchase of $8.7 million in common stock through the Company's stock repurchase and equity compensation plan. Foreign currency translation negatively impacted cash by $3.5 million in 2015.
Accounts Receivable — Accounts receivable, net of the allowance for doubtful receivables, were $82.1 million at December 31, 2015 compared with $84.4 million at December 31, 2014. The decrease of $2.2 million was primarily due to the disposition of the Life Sciences Vital Fluids business and the effect of foreign exchange rate changes, partially offset by increased sales in the fourth quarter of 2015 compared to the fourth quarter of 2014.
Inventories — Inventories were $46.5 million as of December 31, 2015 compared with $51.2 million as of December 31, 2014. Primarily contributing to this decrease was the disposition of the Life Sciences Vital Fluids business and the effect of foreign exchange rate changes.
Goodwill and Other Intangible Assets — Goodwill and other intangible assets decreased to $22.2 million at December 31, 2015 compared to $29.8 million at December 31, 2014. The decrease of $7.6 million was primarily related to the $4.7 million of goodwill associated with the 2015 divestiture of the Life Sciences Vital Fluids business, a $1.4 million impairment of long-lived assets within the Company's Performance Materials segment, and the effect of foreign exchange rate changes.
Accounts Payable — Accounts payable decreased to $42.5 million at December 31, 2015 compared to $49.3 million at December 31, 2014. The decrease of $6.8 million was primarily due to timing of vendor payments within the T/A Metals segments and the effect of foreign exchange rate changes.
Accrued Payroll and other compensation — Accrued payroll and other compensation decreased to $10.2 million at December 31, 2015 compared to $14.6 million at December 31, 2014. The decrease of $4.4 million was primarily due to the timing of payroll and lower accruals related to the Company's annual incentive bonus program.
Benefit Plan Liabilities — Benefit plan liabilities decreased to $14.2 million at December 31, 2015 compared to $19.1 million at December 31, 2014. The decrease of $4.9 million was primarily due to contributions made by the Company to improve the underfunded status of the domestic pension plan.
Capital Expenditures — Capital expenditures were $21.6 million in 2015, $19.0 million in 2014, and $13.8 million in 2013. Capital expenditures for 2016 are expected to be approximately $25 million to $30 million.
36
Total Debt To Total Capitalization — Total debt to total capitalization decreased to 7.7% in 2015 compared with 16.1% in 2014. The decrease was primarily due to payments on long-term debt. At December 31, 2015, the Company had borrowing availability of $78.1 million under its amended credit facility, net of $20.0 million of borrowings outstanding and $1.9 million of letters of credit outstanding.
Stockholders’ Equity — Stockholders’ equity increased to $245.2 million at December 31, 2015 compared to $212.6 million at December 31, 2014. This increase was primarily due to 2015 net income of $46.3 million, and, to a lesser extent, stock issuances, tax benefits on stock awards and stock-based compensation aggregating $5.6 million. Partially offsetting this increase was foreign currency translation adjustments of $10.3 million, pension liability adjustments of $0.1 million and share repurchases of $8.8 million. On a per share basis, calculated as stockholders’ equity divided by shares outstanding at December 31, 2015, stockholders’ equity increased to $14.31 at December 31, 2015 from $12.28 at December 31, 2014.
Off Balance Sheet Arrangements — Other than operating leases, the Company does not have any other material off-balance sheet financing arrangements.
Inflation — Inflation generally affects the Company through its costs of labor, equipment, energy and raw materials. The increased costs of these items have generally been offset by price increases, operating improvements and other cost-saving initiatives. The Company also has certain arrangements in which it can pass through inflation on raw material costs to its customers.
Item 7A. | QUANTITATIVE AND QUALITATIVE DISCLOSURES ABOUT MARKET RISK |
Lydall’s limited market risk exposures relate to changes in foreign currency exchange rates and interest rates.
FOREIGN CURRENCY RISK
On February 20, 2014, the Company acquired the Industrial Filtration business from Andrew Industries Limited as discussed in Note 2, "Acquisitions and Divestitures," of the Consolidated Financial Statements included in this Annual Report on Form 10-K. The Industrial Filtration business has operations in the United Kingdom and China, in addition to the United States. As a result of this acquisition, and combined with the Company’s other foreign operations, the Company’s financial results are affected by factors such as changes in foreign currency exchange rates or economic conditions in the foreign markets where the Company manufactures and distributes its products. The Company’s currency exposure is to the Euro, the Japanese Yen, the Chinese Yuan, the Hong Kong Dollar and the British Pound Sterling. The Company’s foreign and domestic operations attempt to limit foreign currency exchange transaction risk by completing transactions in local functional currencies, whenever practicable. The Company may periodically enter into foreign currency forward exchange contracts to mitigate exposure to foreign currency volatility. In addition, the Company utilizes bank loans and other debt instruments throughout its operations. To mitigate foreign currency risk, such debt is denominated primarily in the functional currency of the operation maintaining the debt.
The Company also has exposure to fluctuations in currency risk on intercompany loans that the Company makes to certain of its subsidiaries. The Company may periodically enter into foreign currency forward contracts which are intended to offset the impact of foreign currency movements on the underlying intercompany loan obligations.
INTEREST RATE RISK
The Company’s interest rate exposure is most sensitive to fluctuations in interest rates in the United States and Europe, which impact interest paid on its debt. In February 2014, the Company borrowed $60.0 million from its Amended Credit Facility to fund the Industrial Filtration acquisition. The Company has debt with variable rates of interest based generally on LIBOR. Increases in interest rates could therefore significantly increase the associated interest payments that the Company is required to make on this debt. From time to time, the Company may enter into interest rate swap agreements to manage interest rate risk. The Company has assessed its exposure to changes in interest rates by analyzing the sensitivity to Lydall’s earnings assuming various changes in market interest rates. Assuming a hypothetical increase of one percentage point in interest rates on the $20.0 million outstanding borrowings as of December 31, 2015, the Company’s net income would decrease by an estimated $0.1 million over a twelve-month period.
37
The weighted average interest rate on long-term debt was 1.3% for the year ended December 31, 2015, compared with 1.5% and 5.4% for the years ended December 31, 2014 and 2013, respectively.
Item 8. | FINANCIAL STATEMENTS AND SUPPLEMENTARY DATA |
The response to this Item is contained under Item 15. “Exhibits, Financial Statement Schedules.”
Item 9. | CHANGES IN AND DISAGREEMENTS WITH ACCOUNTANTS ON ACCOUNTING AND FINANCIAL DISCLOSURE |
None.
Item 9A. | CONTROLS AND PROCEDURES |
Evaluation of Disclosure Controls and Procedures
Under the supervision and with the participation of management, including the Company’s President and Chief Executive Officer and its Executive Vice President and Chief Financial Officer, the Company has, pursuant to Rule 13a-15(b) of the Securities Exchange Act of 1934, as amended (the “Exchange Act”), evaluated the effectiveness of the design and operation of its disclosure controls and procedures (as defined under Rule 13a-15(e) of the Exchange Act). Based upon that evaluation, the Company’s President and Chief Executive Officer and its Executive Vice President and Chief Financial Officer have concluded that, as of December 31, 2015, the Company’s disclosure controls and procedures are effective.
Changes in Internal Controls Over Financial Reporting
There has been no change in the Company’s internal control over financial reporting (as defined in Rule 13a-15(f) of the Exchange Act) that occurred during the fiscal quarter ended December 31, 2015 that has materially affected, or is reasonably likely to materially affect, the Company’s internal control over financial reporting.
Management’s Report on Internal Control Over Financial Reporting
The Company’s management is responsible for establishing and maintaining adequate internal control over financial reporting. Internal control over financial reporting is a process designed to provide reasonable assurance regarding the reliability of financial reporting and the preparation of financial statements for external reporting purposes in accordance with accounting principles generally accepted in the United States of America. Due to its inherent limitations, internal control over financial reporting may not prevent or detect misstatements.
Management has assessed the effectiveness of the Company’s internal control over financial reporting as of December 31, 2015. In making its assessment, management has utilized the criteria set forth by the Committee of Sponsoring Organizations of the Treadway Commission (COSO) in Internal Control - Integrated Framework (2013 Framework). Management concluded that based on its assessment, the Company’s internal control over financial reporting was effective as of December 31, 2015. The effectiveness of the Company's internal control over financial reporting as of December 31, 2015 has been audited by PricewaterhouseCoopers LLP, an independent registered public accounting firm, as stated in their report which appears herein.
Item 9B. | OTHER INFORMATION |
None.
38
PART III
Item 10. | DIRECTORS, EXECUTIVE OFFICERS AND CORPORATE GOVERNANCE |
Information required by this Item is incorporated by reference from the sections entitled “Proposal 1 — Election of Directors,” “Corporate Governance” and “Section 16(a) Beneficial Ownership Reporting Compliance” of the definitive Proxy Statement of Lydall to be filed with the Commission within 120 days of the fiscal year ended December 31, 2015 in connection with the Annual Meeting of Stockholders to be held on April 29, 2016 (the “2016 Proxy Statement”). Information regarding the Executive Officers of the Company is contained in this Annual Report on Form 10-K.
The Company’s Code of Ethics and Business Conduct for all employees and its Code of Ethics for the Chief Executive Officer, Senior Financial Officers and all Accounting and Financial Personnel can be obtained free of charge on the Company’s website under the Corporate Governance section or by contacting the Office of the General Counsel, P.O. Box 151, One Colonial Road, Manchester, CT 06045-0151.
The Company intends to post on its website all disclosures that are required by law or New York Stock Exchange listing standards concerning any amendments to, or waivers from, the provisions of these documents.
Item 11. | EXECUTIVE COMPENSATION |
Information required by this Item is incorporated by reference from the sections entitled “2015 Director Compensation,” “Compensation Discussion and Analysis,” “Executive Compensation Tables,” “Corporate Governance — Compensation Committee Interlocks and Insider Participation” and “Compensation Discussion and Analysis — Compensation Committee Report on Executive Compensation” of the 2016 Proxy Statement.
Item 12. | SECURITY OWNERSHIP OF CERTAIN BENEFICIAL OWNERS AND MANAGEMENT AND RELATED STOCKHOLDER MATTERS |
Certain information required by this Item is incorporated by reference from the section entitled “Securities Ownership of Directors, Certain Officers and 5% Beneficial Owners” of the 2016 Proxy Statement.
The following table provides information about the Company’s Common Stock that may be issued upon exercise of options and rights under all of the Company’s existing equity compensation plans at December 31, 2015. The number of securities remaining available for issuance at December 31, 2015 was 949,731 and includes shares that may be issued as restricted stock, performance shares and other stock awards.
Plan Category | Number of securities to be issued upon exercise of outstanding options, warrants and rights (a) | Weighted average exercise price of outstanding options, warrants and rights (b) | Number of securities remaining available for future issuance under equity compensation plans (excluding securities reflected in column (a)) (c) | ||||||
Equity compensation plans approved by security holders | 806,260 | $ | 11.57 | 949,731 | |||||
Equity compensation plans not approved by security holders | — | — | — | ||||||
Total | 806,260 | $ | 11.57 | 949,731 | |||||
39
Item 13. | CERTAIN RELATIONSHIPS AND RELATED TRANSACTIONS, AND DIRECTOR INDEPENDENCE |
Information required by this Item is incorporated by reference from the sections entitled “Corporate Governance — Independence Determination,” “Related Party Transactions,” and “Compensation Committee Interlocks and Insider Participation” of the 2016 Proxy Statement.
Item 14. | PRINCIPAL ACCOUNTING FEES AND SERVICES |
Information required by this Item is incorporated by reference from the sections entitled “Proposal 3 — Ratification of Appointment of Independent Auditors,” and “Principal Fees and Services” of the 2016 Proxy Statement.
40
PART IV
Item 15. EXHIBITS, FINANCIAL STATEMENT SCHEDULES
Page | |
1. Financial Statements: | |
Consolidated Statements of Operations for the years ended December 31, 2015, 2014, and 2013 | |
Consolidated Statements of Comprehensive Income for the years ended December 31, 2015, 2014, and 2013 | |
Consolidated Balance Sheets at December 31, 2015 and 2014 | |
Consolidated Statements of Cash Flows for the years ended December 31, 2015, 2014, and 2013 | |
Consolidated Statements of Changes in Stockholders’ Equity for each of the three years in the period ended December 31, 2015 | |
2. Financial Statement Schedule: | |
Schedule II — Valuation and Qualifying Accounts for the years ended December 31, 2015, 2014, and 2013 | |
Other schedules for which provision is made in the applicable accounting regulations of the Securities and Exchange Commission are not required under the related instructions, are inapplicable or are presented in “Notes to Consolidated Financial Statements” and therefore have been omitted.
41
a) 3. Exhibits Included Herein or Incorporated by Reference:
2.1 | Sale and Purchase Agreement dated February 20, 2014, by and among the Andrew Industries Limited, Lydall Inc. and Lydall UK Ltd., filed as Exhibit 10.1 to the Registrant’s Form 8-K dated February 24, 2014 and incorporated herein by reference. The Registrant will supplementally furnish any omitted schedules to the Commission upon request. | |
3.1 | Restated Certificate of Incorporation of the Registrant, as amended through the date of filing of this Annual Report on Form 10-K, filed as Exhibit 3.1 to the Registrant’s Quarterly Report on Form 10-Q dated April 30, 2015 and incorporated herein by this reference. | |
3.2 | Bylaws of the Registrant, as amended and restated as of August 1,2015, filed as Exhibit 3.1 to the Registrant’s Form 8-K dated August 5, 2015 and incorporated herein by this reference. | |
4.1 | Certain long-term debt instruments, each representing indebtedness in an amount equal to or less than 10 percent of the Registrant’s total consolidated assets, have not been filed as exhibits to this Annual Report on Form 10-K. The Registrant will file these instruments with the Commission upon request. | |
10.1 | Capital lease agreement between Lydall Thermique Acoustique S.A.S., CMCIC Lease and Natiocredimurs Societe en Nom Collectif, filed as Exhibit 10.5 to the Registrant’s Quarterly Report on Form 10-Q dated November 9, 2004 and incorporated herein by reference. | |
10.2* | Employment Agreement with Dale G. Barnhart dated July 31, 2007, filed as Exhibit 10.1 to the Registrant’s Form 8-K dated August 3, 2007 and incorporated herein by this reference. | |
10.3* | Employment Agreement with Robert K. Julian dated October 3, 2012, filed as Exhibit 10.1 to the Registrant’s Form 8-K dated October 4, 2012 and incorporated herein by this reference. | |
10.4* | Employment Agreement with David H. Williams dated June 27, 2012, filed as Exhibit 10.3 to the Registrant’s Form 10-Q dated August 1, 2012 and incorporated herein by this reference. | |
10.5* | Employment Agreement with Chad A. McDaniel dated May 8, 2013, filed as Exhibit 10.5 to the Registrant's Annual Report on Form 10-K dated March 5, 2014 and incorporated herein by reference. | |
10.6* | Employment Agreement with Joseph A. Abbruzzi dated March 31, 2014, filed as Exhibit 10.6 to the Registrant's Annual Report on Form 10-K dated March 3, 2015 and incorporated herein by reference. | |
10.7* | Employment Agreement with James V. Laughlan dated August 3, 2015, filed as Exhibit 10.1 to the Registrant's Form 8-K dated August 5, 2015 and incorporated herein by reference. | |
10.8* | Employment Agreement with Scott M. Deakin dated August 21, 2015, filed as Exhibit 10.1 to the Registrant's Form 8-K dated August 21, 2015 and incorporated herein by reference. | |
10.9* | Indemnification Agreement with Dale G. Barnhart dated July 31, 2007, filed as Exhibit 10.2 to the Registrant’s Form 8-K dated August 3, 2007 and incorporated herein by this reference. | |
10.10* | Lydall, Inc. Annual Incentive Performance Program effective January 1, 2015, filed as Exhibit 10.35 to the Registrant's Annual Report on Form 10-K dated March 3, 2015 and incorporated herein by reference. | |
10.11 | Form of Indemnification Agreement between Lydall, Inc. and non-employee directors, filed as Exhibit 10.1 to the Registrant’s Form 8-K dated June 19, 2009 and incorporated herein by this reference. | |
10.12* | Amended and Restated Lydall 2003 Stock Incentive Compensation Plan, filed as Exhibit 10.1 to the Registrant’s Quarterly Report on Form 10-Q dated May 2, 2011 and incorporated herein by this reference. | |
10.13* | Lydall 2012 Stock Incentive Plan, filed as Exhibit A to the Registrant’s Definitive Proxy Statement dated March 16, 2012 and incorporated herein by this reference. | |
10.14* | Form of Restricted Share Award Agreement to Non-Employee Directors (Under the Lydall 2012 Stock Incentive Plan), filed as Exhibit 10.9 to the Registrant’s Form 10-Q dated August 1, 2012 and incorporated herein by this reference. | |
10.15* | Form of Non-Qualified/Incentive Stock Option Agreement (Under the Lydall 2012 Stock Incentive Plan) for U.S. employees, filed as Exhibit 10.4 to the Registrant’s Form 10-Q dated August 1, 2012 and incorporated herein by this reference. | |
10.16* | Form of Restricted Stock Award Agreement (Under the Lydall 2012 Stock Incentive Plan) for U.S. Employees, filed as Exhibit 10.8 to the Registrant’s to the Registrant’s Form 10-Q dated August 1, 2012 and incorporated herein by this reference. | |
10.17* | Form of Non-Qualified Stock Option Agreement (Under the Lydall 2012 Stock Incentive Plan) for Netherland employees, filed as Exhibit 10.10 to the Registrant’s Form 10-Q dated August 1, 2012 and incorporated herein by this reference. | |
42
10.18* | Form of Non-Qualified Stock Option Agreement (Under the Lydall 2012 Stock Incentive Plan) for French employees, filed as Exhibit 10.11 to the Registrant’s Form 10-Q dated August 1, 2012 and incorporated herein by this reference. | |
10.19* | Form of Non-Qualified Stock Option Agreement (Under the Lydall 2012 Stock Incentive Plan) for German employees, filed as Exhibit 10.12 to the Registrant’s Form 10-Q dated August 1, 2012 and incorporated herein by this reference. | |
10.20* | Form of Lydall, Inc. Performance Share Award Agreement (Three-Year Period) for U.S. employees, filed as Exhibit 10.18 to the Registrant's Annual Report on Form 10-K dated March 3, 2015 and incorporated herein by reference. | |
10.21* | Form of Lydall, Inc. Performance Share Award Agreement (Three-Year Period) for French employees, filed as Exhibit 10.6 to the Registrant’s Form 10-Q dated August 1, 2012 and incorporated herein by this reference. | |
10.22* | Form of Lydall, Inc. Performance Share Award Agreement (Three-Year Period) for German employees, filed as Exhibit 10.7 to the Registrant’s Form 10-Q dated August 1, 2012 and incorporated herein by this reference. | |
10.23* | Form of Lydall, Inc. Performance Share Award Agreement (One-Year Period), filed as Exhibit 10.3 to the Registrant’s Annual Report on Form 10-K dated February 26, 2010 and incorporated herein by this reference. | |
10.24 | Amended and Restated Credit Agreement, dated February 18, 2014, by and between Lydall, Inc., as borrower, and Bank of America, N.A., as Agent for the Lenders, filed as Exhibit 10.2 to the Registrant’s Form 8-K dated February 24, 2014 and incorporated herein by this reference, as further amended by Amendment No. 1 to the Amended and Restated Credit Agreement, dated May 5, 2015, filed as Exhibit 99.1 to the Registrant's Form 8-K dated May 6, 2015 and incorporated herein by reference. | |
10.25 | Amended and Restated Guaranty Agreement, dated February 18, 2014, by and among Lydall Thermal/Acoustical, Inc., Lydall Filtration/Separation, Inc., Lydall International, Inc., and Bank of America, N.A., filed as Exhibit 10.3 to the Registrant’s Form 8-K dated February 24, 2014 and incorporated herein by reference. | |
10.26 | Amended and Restated Security Agreement, dated February 18, 2014, by and between Lydall, Inc., and Bank of America, N.A., filed as Exhibit 10.4 to the Registrant’s Form 8-K dated February 24, 2014 and incorporated herein by reference, as further amended by that certain Amendment to the Amended and Restated Security Agreements, the Amended and Restated Domain Name Collateral Assignment and Security Agreement and Partial Release dated January 30, 2015, filed as Exhibit 10.34 to the Registrant's Annual Report on From 10-K dated March 3, 2015 and incorporated herein by reference. | |
10.27 | Amended and Restated Security Agreement, dated February 18, 2014, by and between Lydall Thermal/Acoustical, Inc., and Bank of America, N.A., filed as Exhibit 10.5 to the Registrant’s Form 8-K dated February 24, 2014 and incorporated herein by reference, as further amended by that certain Amendment to the Amended and Restated Security Agreements, the Amended and Restated Domain Name Collateral Assignment and Security Agreement and Partial Release dated January 30, 2015, filed as Exhibit 10.34 to the Registrant's Annual Report on From 10-K dated March 3, 2015 and incorporated herein by reference. | |
10.28 | Amended and Restated Security Agreement, dated February 18, 2014, by and between Lydall Filtration/Separation, Inc., and Bank of America, N.A. filed as Exhibit 10.6 to the Registrant’s Form 8-K dated February 24, 2014 and incorporated herein by reference. | |
10.29 | Amended and Restated Security Agreement, dated February 18, 2014, by and between Lydall International, Inc., and Bank of America, N.A., filed as Exhibit 10.7 to the Registrant’s Form 8-K dated February 24, 2014 and incorporated herein by reference. | |
10.30 | Amendment to the Amended and Restated Security Agreements, the Amended and Restated Domain Name Collateral Assignment and Security Agreement and Partial Release dated January 30, 2015 by and among Lydall, Inc., Lydall Thermal/Acoustical, Inc. and Bank of America, filed as Exhibit 10.34 to the Registrant's Annual Report on Form 10-K dated March 3, 2015 and incorporated herein by reference. | |
10.31* | Amendment No. 1 to the Agreement, dated February 24, 2016, between the Company and Chad A. McDaniel, amending that certain Employment Agreement dated May 8, 2013 (see Exhibit 10.5 of this Annual Report on Form 10-K), filed herewith. | |
10.32* | Amendment No. 1 to the Agreement, dated February 24, 2016, between the Company and Joseph A. Abbruzzi, amending that certain Employment Agreement dated March 31, 2014 (see Exhibit 10.6 of this Annual Report on Form 10-K), filed herewith. | |
10.33* | Amendment No. 1 to the Agreement, dated February 24, 2016, between the Company and James V. Laughlan, amending that certain Employment Agreement dated August 3, 2015 (see Exhibit 10.7 of this Annual Report on Form 10-K), filed herewith. | |
43
10.34* | Amendment No. 1 to the Agreement, dated February 24, 2016, between the Company and Scott M. Deakin, amending that certain Employment Agreement dated August 21, 2015 (see Exhibit 10.8 of this Annual Report on Form 10-K), filed herewith. | |
14.1 | Lydall’s Code of Ethics and Business Conduct, as amended, and the supplemental Code of Ethics for the Chief Executive Officer, Senior Financial Officers and All Accounting and Financial Personnel, as amended, each can be accessed on Lydall’s website at www.lydall.com under the Corporate Governance section. | |
21.1 | List of subsidiaries of the Registrant, filed herewith. | |
23.1 | Consent of PricewaterhouseCoopers LLP, filed herewith. | |
24.1 | Power of Attorney, dated February 19, 2016 authorizing Scott M. Deakin to sign this Annual Report on Form 10-K on behalf of each member of the Board of Directors indicated therein, filed herewith. | |
31.1 | Certification Pursuant to Rule 13a-14(a) and Rule 15d-14(a) under the Securities Exchange Act of 1934 as principal executive officer, filed herewith. | |
31.2 | Certification Pursuant to Rule 13a-14(a) and Rule 15d-14(a) under the Securities Exchange Act of 1934 as principal executive officer, filed herewith. | |
32.1 | Certifications Pursuant to 18 U.S.C. Section 1350, as Adopted Pursuant to Section 906 of the Sarbanes-Oxley Act of 2002, furnished herewith. | |
101.INS | XBRL Instance Document | |
101.SCH | XBRL Taxonomy Extension Schema Document | |
101.CAL | XBRL Taxonomy Extension Calculation Linkbase Document | |
101.DEF | XBRL Taxonomy Extension Definition Linkbase Document | |
101.LAB | XBRL Taxonomy Extension Label Linkbase Document | |
101.PRE | XBRL Taxonomy Extension Presentation Linkbase Document | |
* | Management contract or compensatory plan. | |
44
SIGNATURES
Pursuant to the requirements of Section 13 or 15(d) of the Securities Exchange Act of 1934, Lydall, Inc. has duly caused this report to be signed on its behalf by the undersigned, thereunto duly authorized.
LYDALL, INC. | |||
February 24, 2016 | By: | /s/ Scott M. Deakin | |
Scott M. Deakin Executive Vice President and Chief Financial Officer (Principal Financial Officer) | |||
Pursuant to the requirements of the Securities Exchange Act of 1934, this report has been signed below by the following persons on behalf of Lydall, Inc. in the capacities and on the dates indicated.
Signature | Title | Date | ||
/s/ Dale G. Barnhart | President, Chief Executive Officer and Director (Principal Executive Officer) | February 24, 2016 | ||
Dale G. Barnhart | ||||
/s/ Scott M. Deakin | Executive Vice President, Chief Financial Officer (Principal Financial Officer) | February 24, 2016 | ||
Scott M. Deakin | ||||
/s/ James V. Laughlan | Vice President, Chief Accounting Officer, and Treasurer (Principal Accounting Officer) | February 24, 2016 | ||
James V. Laughlan | ||||
/s/ Scott M. Deakin | February 24, 2016 | |||
Scott M. Deakin | ||||
Attorney-in-fact for: | ||||
Kathleen Burdett | Director | |||
W. Leslie Duffy | Chairman of the Board of Directors | |||
Matthew T. Farrell | Director | |||
Marc T. Giles | Director | |||
William D. Gurley | Director | |||
Suzanne Hammett | Director | |||
S. Carl Soderstrom, Jr. | Director | |||
45
Report of Independent Registered Public Accounting Firm
To the Board of Directors and
Stockholders of Lydall, Inc.:
In our opinion, the consolidated financial statements listed in the index appearing under item 15(a)(1) present fairly, in all material respects, the financial position of Lydall, Inc. and its subsidiaries at December 31, 2015 and December 31, 2014, and the results of their operations and their cash flows for each of the three years in the period ended December 31, 2015 in conformity with accounting principles generally accepted in the United States of America. In addition, in our opinion, the financial statement schedule listed in the index appearing under Item 15(a)(2) presents fairly, in all material respects, the information set forth therein when read in conjunction with the related consolidated financial statements. Also in our opinion, the Company maintained, in all material respects, effective internal control over financial reporting as of December 31, 2015, based on criteria established in Internal Control - Integrated Framework 2013 issued by the Committee of Sponsoring Organizations of the Treadway Commission (COSO). The Company's management is responsible for these financial statements and financial statement schedule, for maintaining effective internal control over financial reporting and for its assessment of the effectiveness of internal control over financial reporting, included in Management's Report on Internal Control over Financial Reporting appearing under Item 9A. Our responsibility is to express opinions on these financial statements, on the financial statement schedule, and on the Company's internal control over financial reporting based on our integrated audits. We conducted our audits in accordance with the standards of the Public Company Accounting Oversight Board (United States). Those standards require that we plan and perform the audits to obtain reasonable assurance about whether the financial statements are free of material misstatement and whether effective internal control over financial reporting was maintained in all material respects. Our audits of the financial statements included examining, on a test basis, evidence supporting the amounts and disclosures in the financial statements, assessing the accounting principles used and significant estimates made by management, and evaluating the overall financial statement presentation. Our audit of internal control over financial reporting included obtaining an understanding of internal control over financial reporting, assessing the risk that a material weakness exists, and testing and evaluating the design and operating effectiveness of internal control based on the assessed risk. Our audits also included performing such other procedures as we considered necessary in the circumstances. We believe that our audits provide a reasonable basis for our opinions.
A company’s internal control over financial reporting is a process designed to provide reasonable assurance regarding the reliability of financial reporting and the preparation of financial statements for external purposes in accordance with generally accepted accounting principles. A company’s internal control over financial reporting includes those policies and procedures that (i) pertain to the maintenance of records that, in reasonable detail, accurately and fairly reflect the transactions and dispositions of the assets of the company; (ii) provide reasonable assurance that transactions are recorded as necessary to permit preparation of financial statements in accordance with generally accepted accounting principles, and that receipts and expenditures of the company are being made only in accordance with authorizations of management and directors of the company; and (iii) provide reasonable assurance regarding prevention or timely detection of unauthorized acquisition, use, or disposition of the company’s assets that could have a material effect on the financial statements.
Because of its inherent limitations, internal control over financial reporting may not prevent or detect misstatements. Also, projections of any evaluation of effectiveness to future periods are subject to the risk that controls may become inadequate because of changes in conditions, or that the degree of compliance with the policies or procedures may deteriorate.
/s/ PricewaterhouseCoopers LLP |
PricewaterhouseCoopers LLP |
Hartford, Connecticut |
February 24, 2016 |
F-1
Lydall, Inc.
CONSOLIDATED STATEMENTS OF OPERATIONS
For the years ended December 31, | |||||||||||
In thousands except per share data | 2015 | 2014 | 2013 | ||||||||
Net sales | $ | 524,505 | $ | 535,829 | $ | 397,969 | |||||
Cost of sales | 402,008 | 420,851 | 312,744 | ||||||||
Gross profit | 122,497 | 114,978 | 85,225 | ||||||||
Selling, product development and administrative expenses | 70,020 | 80,930 | 56,512 | ||||||||
Operating income | 52,477 | 34,048 | 28,713 | ||||||||
Gain on sale of business | (18,647 | ) | — | — | |||||||
Interest expense | 755 | 1,093 | 304 | ||||||||
Other (income) expense, net | (654 | ) | (701 | ) | 67 | ||||||
Income before income taxes | 71,023 | 33,656 | 28,342 | ||||||||
Income tax expense | 24,764 | 11,809 | 9,187 | ||||||||
Net income | $ | 46,259 | $ | 21,847 | $ | 19,155 | |||||
Earnings per common share: | |||||||||||
Basic | $ | 2.76 | $ | 1.31 | $ | 1.16 | |||||
Diluted | $ | 2.71 | $ | 1.28 | $ | 1.14 | |||||
Weighted average common shares outstanding | 16,746 | 16,662 | 16,570 | ||||||||
Weighted average common shares and equivalents outstanding | 17,084 | 17,003 | 16,866 | ||||||||
The accompanying notes are an integral part of these Consolidated Financial Statements.
F-2
Lydall, Inc.
CONSOLIDATED STATEMENTS OF COMPREHENSIVE INCOME
For the years ended December 31, | |||||||||||
In thousands | 2015 | 2014 | 2013 | ||||||||
Net income | $ | 46,259 | $ | 21,847 | $ | 19,155 | |||||
Other comprehensive (loss) income: | |||||||||||
Change in pension plans, net of income taxes of $55, $1,595, and $4,028, respectively | (90 | ) | (2,603 | ) | 6,572 | ||||||
Foreign currency translation adjustments | (10,334 | ) | (12,714 | ) | 2,950 | ||||||
Total other comprehensive (loss) income, net of tax | (10,424 | ) | (15,317 | ) | 9,522 | ||||||
Comprehensive income | $ | 35,835 | $ | 6,530 | $ | 28,677 | |||||
The accompanying notes are an integral part of these Consolidated Financial Statements.
F-3
Lydall, Inc.
CONSOLIDATED BALANCE SHEETS
December 31, | |||||||
In thousands of dollars and shares | 2015 | 2014 | |||||
Assets | |||||||
Current assets: | |||||||
Cash and cash equivalents | $ | 75,909 | $ | 62,051 | |||
Accounts receivable, (net of allowance for doubtful receivables of $1,251 and $709, respectively) | 82,149 | 84,366 | |||||
Inventories | 46,530 | 51,241 | |||||
Taxes receivable | 4,194 | 4,539 | |||||
Prepaid expenses and other current assets | 10,521 | 11,109 | |||||
Total current assets | 219,303 | 213,306 | |||||
Property, plant and equipment, net | 114,433 | 115,357 | |||||
Goodwill | 16,841 | 21,943 | |||||
Other intangible assets, net | 5,399 | 7,841 | |||||
Deferred tax assets | 134 | 1,408 | |||||
Other assets, net | 2,150 | 1,915 | |||||
Total assets | $ | 358,260 | $ | 361,770 | |||
Liabilities and Stockholders' Equity | |||||||
Current liabilities: | |||||||
Current portion of long-term debt | $ | 323 | $ | 615 | |||
Accounts payable | 42,470 | 49,325 | |||||
Accrued payroll and other compensation | 10,210 | 14,550 | |||||
Accrued taxes | 1,200 | 1,447 | |||||
Other accrued liabilities | 6,797 | 7,140 | |||||
Total current liabilities | 61,000 | 73,077 | |||||
Long-term debt | 20,156 | 40,315 | |||||
Deferred tax liabilities | 14,997 | 13,867 | |||||
Benefit plan liabilities | 14,222 | 19,142 | |||||
Other long-term liabilities | 2,660 | 2,770 | |||||
Commitments and Contingencies (Note 12) | |||||||
Stockholders’ equity: | |||||||
Preferred stock (par value $0.01 per share; authorized 500,000 shares; none issued or outstanding) (Note 7) | — | — | |||||
Common stock (par value $0.01 per share; authorized 30,000 shares; issued 24,733 and 24,631 shares, respectively) (Note 7) | 247 | 2,463 | |||||
Capital in excess of par value | 76,746 | 68,961 | |||||
Retained earnings | 288,358 | 242,099 | |||||
Accumulated other comprehensive loss | (34,585 | ) | (24,161 | ) | |||
Treasury stock, 7,592 and 7,312 shares of common stock, respectively, at cost | (85,541 | ) | (76,763 | ) | |||
Total stockholders’ equity | 245,225 | 212,599 | |||||
Total liabilities and stockholders’ equity | $ | 358,260 | $ | 361,770 | |||
The accompanying notes are an integral part of these Consolidated Financial Statements.
F-4
Lydall, Inc.
CONSOLIDATED STATEMENTS OF CASH FLOWS
For the years ended December 31, | |||||||||||
In thousands | 2015 | 2014 | 2013 | ||||||||
Cash flows from operating activities: | |||||||||||
Net income | $ | 46,259 | $ | 21,847 | $ | 19,155 | |||||
Adjustments to reconcile net income to net cash provided | |||||||||||
by operating activities: | |||||||||||
Gain on sale of business | (18,647 | ) | — | — | |||||||
Depreciation and amortization | 17,275 | 17,646 | 12,703 | ||||||||
Inventory step-up amortization | — | 2,053 | — | ||||||||
Long-lived asset impairment charge | 1,354 | — | — | ||||||||
Deferred income taxes | 3,585 | (1,477 | ) | 969 | |||||||
Stock based compensation | 2,827 | 2,787 | 1,763 | ||||||||
Pension settlement charge | — | 4,914 | — | ||||||||
Loss on disposition of property, plant and equipment | 288 | 241 | 359 | ||||||||
Accounts receivable | (2,749 | ) | (7,189 | ) | (4,101 | ) | |||||
Inventories | 479 | 4,539 | (3,046 | ) | |||||||
Taxes receivable | 276 | (4,129 | ) | (640 | ) | ||||||
Prepaid expenses and other assets | (1,337 | ) | (2,318 | ) | 161 | ||||||
Accounts payable | (4,886 | ) | 1,167 | (59 | ) | ||||||
Accrued payroll and other compensation | (3,416 | ) | 3,299 | (121 | ) | ||||||
Benefit plan liabilities | (4,778 | ) | (3,563 | ) | (684 | ) | |||||
Other, net | (420 | ) | 1,811 | 3,821 | |||||||
Net cash provided by operating activities | 36,110 | 41,628 | 30,280 | ||||||||
Cash flows from investing activities: | |||||||||||
Business acquisitions, net of cash acquired | — | (79,407 | ) | — | |||||||
Capital expenditures | (20,645 | ) | (13,971 | ) | (13,826 | ) | |||||
Proceeds from sale of business, net | 28,550 | — | — | ||||||||
Acquisition earn out payments | — | (111 | ) | (160 | ) | ||||||
Net cash provided by (used for) investing activities | 7,905 | (93,489 | ) | (13,986 | ) | ||||||
Cash flows from financing activities: | |||||||||||
Proceeds from borrowings | — | 60,000 | — | ||||||||
Debt repayments | (20,571 | ) | (20,646 | ) | (768 | ) | |||||
Common stock issued | 1,521 | 2,457 | 1,497 | ||||||||
Common stock repurchased | (8,701 | ) | (748 | ) | (6,617 | ) | |||||
Excess tax benefit on stock awards | 1,044 | 1,486 | 271 | ||||||||
Net cash (used for) provided by financing activities | (26,707 | ) | 42,549 | (5,617 | ) | ||||||
Effect of exchange rate changes on cash | (3,450 | ) | (4,044 | ) | 1,107 | ||||||
Increase (Decrease) in cash and cash equivalents | 13,858 | (13,356 | ) | 11,784 | |||||||
Cash and cash equivalents at beginning of period | 62,051 | 75,407 | 63,623 | ||||||||
Cash and cash equivalents at end of period | $ | 75,909 | $ | 62,051 | $ | 75,407 | |||||
Supplemental Schedule for Cash Flow Information | |||||||||||
Cash paid during the year for: | |||||||||||
Interest | $ | 632 | $ | 875 | $ | 214 | |||||
Income taxes | $ | 20,180 | $ | 14,679 | $ | 7,227 | |||||
Non-cash capital expenditures of $5.9 million and $5.0 million were included in accounts payable at December 31, 2015 and 2014, respectively.
The accompanying notes are an integral part of these Consolidated Financial Statements.
F-5
Lydall, Inc.
CONSOLIDATED STATEMENTS OF CHANGES IN STOCKHOLDERS’ EQUITY
In thousands of dollars and shares | Common Stock Shares | Common Stock Amount | Capital in Excess of Par Value | Retained Earnings | Accumulated Other Comprehensive (Loss) Income | Treasury Stock | Total Stockholders' Equity | |||||||||||||||||||
Balance at December 31, 2012 | 23,785 | $ | 2,379 | $ | 58,784 | $ | 201,097 | $ | (18,366 | ) | $ | (69,398 | ) | $ | 174,496 | |||||||||||
Net income | 19,155 | 19,155 | ||||||||||||||||||||||||
Other comprehensive income, net of tax | 9,522 | 9,522 | ||||||||||||||||||||||||
Stock repurchased | (6,617 | ) | (6,617 | ) | ||||||||||||||||||||||
Stock issued under employee plans | 297 | 30 | 1,467 | 1,497 | ||||||||||||||||||||||
Excess tax benefit on stock awards | 271 | 271 | ||||||||||||||||||||||||
Stock based compensation expense | 1,511 | 1,511 | ||||||||||||||||||||||||
Stock issued to directors | 16 | 1 | 251 | 252 | ||||||||||||||||||||||
Balance at December 31, 2013 | 24,098 | 2,410 | 62,284 | 220,252 | (8,844 | ) | (76,015 | ) | 200,087 | |||||||||||||||||
Net income | 21,847 | 21,847 | ||||||||||||||||||||||||
Other comprehensive loss, net of tax | (15,317 | ) | (15,317 | ) | ||||||||||||||||||||||
Stock repurchased | (748 | ) | (748 | ) | ||||||||||||||||||||||
Stock issued under employee plans | 524 | 52 | 2,405 | 2,457 | ||||||||||||||||||||||
Excess tax benefit on stock awards | 1,486 | 1,486 | ||||||||||||||||||||||||
Stock based compensation expense | 2,535 | 2,535 | ||||||||||||||||||||||||
Stock issued to directors | 9 | 1 | 251 | 252 | ||||||||||||||||||||||
Balance at December 31, 2014 | 24,631 | 2,463 | 68,961 | 242,099 | (24,161 | ) | (76,763 | ) | 212,599 | |||||||||||||||||
Net Income | 46,259 | 46,259 | ||||||||||||||||||||||||
Other comprehensive loss, net of tax | (10,424 | ) | (10,424 | ) | ||||||||||||||||||||||
Stock repurchased | (8,778 | ) | (8,778 | ) | ||||||||||||||||||||||
Stock issued under employee plans | 91 | (2 | ) | 1,700 | 1,698 | |||||||||||||||||||||
Excess tax benefit on stock awards | 1,044 | 1,044 | ||||||||||||||||||||||||
Stock based compensation expense | 2,477 | 2,477 | ||||||||||||||||||||||||
Stock issued to directors | 10 | 350 | 350 | |||||||||||||||||||||||
Change in par value | (2,214 | ) | 2,214 | — | ||||||||||||||||||||||
Balance at December 31, 2015 | 24,732 | $ | 247 | $ | 76,746 | $ | 288,358 | $ | (34,585 | ) | $ | (85,541 | ) | $ | 245,225 | |||||||||||
The accompanying notes are an integral part of these Consolidated Financial Statements.
F-6
Lydall, Inc.
NOTES TO CONSOLIDATED FINANCIAL STATEMENTS
1. Significant Accounting Policies
Business — Lydall, Inc. and its subsidiaries (collectively, the “Company” or “Lydall”) design and manufacture specialty engineered filtration media, industrial thermal insulating solutions, automotive thermal and acoustical barriers for filtration/separation and thermal/acoustical applications.
On February 20, 2014, the Company acquired certain industrial filtration businesses ("Industrial Filtration") of Andrew Industries Limited, an Altham, United Kingdom based corporation. The Industrial Filtration business serves a global customer base in the manufacture of non-woven felt filtration media and filter bags used primarily in industrial air filtration applications including power, cement, asphalt, incineration, food and pharmaceutical. This business, which strengthened the Company’s position as an industry leading, global provider of filtration and engineered materials products, added complementary and new technologies and diversified the Company’s end markets and geographic base.
Principles of consolidation — The Consolidated Financial Statements include the accounts of Lydall, Inc. and its wholly owned subsidiaries. All intercompany accounts and transactions have been eliminated.
Estimates and assumptions — The preparation of the Company’s Consolidated Financial Statements in conformity with accounting principles generally accepted in the United States of America requires management to make estimates and assumptions that affect the reported amounts of assets and liabilities and the disclosure of contingent assets and liabilities at the financial statement dates and the reported amounts of revenues and expenses during the reporting periods. Actual results could differ from those estimates.
Risks and uncertainties — Worldwide economic cycles and political changes affect the markets that the Company’s businesses serve and affect demand for Lydall’s products and impact profitability. Among other factors, disruptions in the global credit and financial markets, including diminished liquidity and credit availability, swings in consumer confidence and spending, unstable economic growth and fluctuations in unemployment rates has caused economic instability and can have a negative impact on the Company’s results of operations, financial condition and liquidity.
Cash and cash equivalents — Cash and cash equivalents include cash on hand and highly liquid investments with original maturities of three months or less at the date of purchase.
Concentrations of credit risk — Financial instruments that potentially subject the Company to concentrations of credit risk consist principally of cash and cash equivalents and trade accounts receivable. The Company places its cash and cash equivalents in high-quality financial institutions. Concentrations of credit risk with respect to trade accounts receivable are limited by the large number of customers comprising the Company’s customer base and their dispersion across many different industries and geographies. At December 31, 2015, Ford Motor Company ("Ford") represented 13.2% of total accounts receivable. No other customers accounted for more than 10.0% of total accounts receivable at December 31, 2015 and 2014. Foreign and export sales were 44.2% of the Company’s net sales in 2015, 46.2% in 2014, and 45.2% in 2013. Export sales primarily to Canada, Mexico, Asia and Europe were $52.5 million, $57.6 million, and $52.1 million in 2015, 2014, and 2013, respectively. The Company performs ongoing credit evaluations of its customers’ financial condition and generally does not require collateral. Sales to the automotive market, included in the Thermal/Acoustical Metals and Thermal/Acoustical Fibers segments, were 56.6% of the Company’s net sales in 2015, 54.1% in 2014, and 68.5% in 2013. Sales to Ford were 18.2%, 16.5%, and 20.0% of Lydall’s 2015, 2014, and 2013 net sales, respectively. Sales to Chrysler Group LLC ("Chrysler") accounted for 10.9% of Lydall's 2013 net sales. No other customers accounted for more than 10% of total net sales in 2015, 2014, and 2013.
Inventories — Inventories are valued at lower of cost or market, cost being determined using the first-in, first-out (FIFO) cost method. Inventories in excess of requirements for current or anticipated orders have been written down to net realizable value.
Pre-production design and development costs — The Company enters into contractual agreements with certain customers to design and develop molds, dies and tools (collectively, “tooling”). All such tooling contracts relate to parts that the Company will supply to customers under long-term supply agreements. Tooling costs are accumulated in work-
F-7
in process inventory and are charged to operations as the related revenue from the tooling is recognized. Revenue is recognized as tooling is delivered and accepted by the customer. The Company also may progress bill on certain tooling being constructed. These billings are recorded as progress billings (a reduction of the associated work-in-process inventory) until the appropriate revenue recognition criteria have been met.
Periodically, the Company enters into contractually guaranteed reimbursement arrangements as a mechanism to collect amounts due from customers from tooling sales. Under these arrangements, amounts due from tooling sales are collected as parts are delivered over the part supply arrangement, in accordance with the specific terms of the arrangement. The amounts due from the customer in such transactions are recorded in “Prepaid expenses and other current assets, net” or “Other assets, net” based upon the expected term of the reimbursement arrangement.
The following tooling related assets were included in the Consolidated Balance Sheets as of December 31, 2015 and 2014:
December, 31 | |||||||
In thousands | 2015 | 2014 | |||||
Inventories, net of progress billings and reserves | $ | 9,220 | $ | 8,832 | |||
Prepaid expenses and other current assets, net | 266 | 30 | |||||
Total tooling related assets | $ | 9,486 | $ | 8,862 | |||
Amounts included in “Prepaid expenses and other current assets, net” include the short-term portion of receivables due under contractually guaranteed reimbursement arrangements. Included in the inventory balance was an offset for progress billings of $0.3 million and $1.1 million at December 31, 2015 and 2014, respectively. Company owned tooling is recorded in “Property, plant and equipment, net” at December 31, 2015 and December 31, 2014.
Property, plant and equipment — Property, plant, and equipment are stated at cost. Assets held under capital leases are recorded at the lower of the net present value of the minimum lease payments or the fair value of the leased asset at the inception of the lease. Property, plant and equipment, including property, plant and equipment under capital leases, are depreciated over their estimated useful lives using the straight-line method. Leasehold improvements are depreciated on a straight-line basis over the term of the lease or the life of the asset, whichever is shorter. The cost and accumulated depreciation amounts applicable to assets sold or otherwise disposed of are removed from the asset and accumulated depreciation accounts and any net gain or loss is included in the Consolidated Statements of Operations. Expenses for maintenance and repairs are charged to expense as incurred.
Goodwill and other intangible assets — Goodwill represents costs in excess of fair values assigned to the underlying net assets of acquired companies. Goodwill and other intangible assets with indefinite lives are not amortized but are subject to annual impairment tests. All other intangible assets are amortized over their estimated useful lives, which range from 4 to 14 years. In performing impairment tests, the Company considers discounted cash flows and other market factors as best evidence of fair value. There are inherent uncertainties and management judgment required in these analyses.
Valuation of long-lived assets — The Company evaluates the recoverability of long-lived assets, or asset groups, whenever events or changes in circumstances indicate that carrying amounts may not be recoverable. Should such evaluations indicate that the related future undiscounted cash flows are not sufficient to recover the carrying values of the assets, such carrying values would be reduced to fair value and this adjusted carrying value would become the assets’ new cost basis. Fair value is determined primarily using future anticipated cash flows that are directly associated with, and that are expected to arise as a direct result of the use and eventual disposition of the asset, or asset group, as well as market conditions and other factors. There are inherent uncertainties and management judgment required in these analyses.
Employer sponsored benefit plans — The Company recognizes the funded status of its domestic defined benefit pension plan. Net benefit obligations are calculated based on actuarial valuations using key assumptions related to discount rates, mortality rates and expected return on plan assets.
Derivative instruments — Derivative instruments are measured at fair value and recognized as either assets or liabilities on the Consolidated Balance Sheet in either current or non-current other assets or other accrued liabilities or other long-term liabilities depending upon maturity and commitment. For derivative instruments that are designated and qualify as a fair value hedge, the gain or loss on the derivative as well as the offsetting loss or gain on the hedged
F-8
item attributable to the hedged risk are recognized in the Consolidated Statement of Operations. For derivative instruments that are designated and qualify as a cash flow hedge, the effective portion of the gain or loss on the derivative is reported as a component of other comprehensive income and reclassified into earnings in the same period or periods in which the hedge transaction affects earnings. In general, the types of risks being hedged by the Company are related to the variability of future cash flows caused by changes in foreign currency exchange rates and hedging the impact of variability of foreign exchange rates on recorded intercompany assets or liabilities. Lydall’s objective for entering into derivative instruments has always been for risk management purposes. The Company does not engage in derivative instruments for speculative purposes. Lydall has historically not been a party to a significant number of derivative instruments.
Revenue recognition — The Company recognizes revenue (1) once evidence of an arrangement exists; (2) product delivery has occurred; (3) pricing is fixed or determinable; and (4) collection is reasonably assured. The four criteria required to recognize revenue are considered to be met, and the passage of title to the customer occurs, at the respective FOB point and, therefore, revenue is recognized at that time. The Company’s standard sales and shipping terms are FOB shipping point, therefore, substantially all revenue is recognized upon shipment. However, the Company conducts business with certain customers on FOB destination terms and in these instances revenue is recognized upon receipt by the customer. The Company generally does not provide specific customer inspection or acceptance provisions in its sales terms, with the exception of tooling sales discussed in “Pre-production design and development costs” above.
Sales returns and allowances are recorded as identified or communicated by the customer and internally approved. The Company does not provide customers with general rights of return for products sold; however, in limited circumstances, the Company will allow sales returns and allowances from customers if the products sold do not conform to specifications.
Shipping and handling costs consist primarily of costs incurred to deliver products to customers and internal costs related to preparing products for shipment and are recorded in cost of sales. Amounts billed to customers as shipping and handling are classified as revenue.
Research and development — Research and development costs are charged to expense as incurred and amounted to $8.5 million in 2015, $9.0 million in 2014, and $7.6 million in 2013. Research and development costs were primarily comprised of development personnel salaries, prototype material costs and testing and trials of new products.
Earnings per share — Basic earnings per common share are equal to net income divided by the weighted average number of common shares outstanding during the period. Diluted earnings per common share are equal to net income divided by the weighted average number of common shares outstanding during the period, including the effect of stock options and stock awards, if such effect is dilutive.
Income taxes — The provision for income taxes is based upon income reported in the accompanying Consolidated Financial Statements. Deferred income taxes reflect the impact of temporary differences between the amounts of income and expense recognized for financial reporting purposes and such amounts recognized for tax purposes. In the event the Company was to determine that it would not be able to realize all or a portion of its deferred tax assets in the future, the Company would record a valuation allowance through a charge to income in the period that such determination was made. Conversely, if the Company was to determine that it would be able to realize its deferred tax assets in the future in excess of the net carrying amounts, the Company would decrease the recorded valuation allowance and record an increase to income in the period that such determination was made.
Translation of foreign currencies — Assets and liabilities of foreign subsidiaries are translated at exchange rates prevailing on the balance sheet date. Revenues and expenses are translated at average exchange rates prevailing during the period. Any resulting translation gains or losses are reported in other comprehensive income (loss).
Stock options and share grants — The Company accounts for awards of equity instruments under the fair value method of accounting and recognizes such amounts in the Consolidated Statements of Operations. The Company recognizes expense on a straight-line basis over the vesting period of the entire award. Stock-based compensation expense includes the estimated effects of forfeitures, and such estimates of forfeitures are adjusted over the requisite service period to the extent actual forfeitures differ, or are expected to differ, from such estimates. The effect of changes in estimated forfeitures is recognized in the period of change and also impacts the amount of expense to be recognized in future periods. The Company estimates the fair value of option grants based on the Black Scholes option-pricing model. Expected volatility and expected term are based on historical information. The Company believes that its future
F-9
volatility and expected term are not likely to materially differ from the Company’s historical stock price volatility and historical exercise data, respectively. Compensation expense for all restricted stock awards is recorded based on the market value of the stock on the grant date and recognized as expense over the vesting period of the award. Compensation expense for performance-based restricted stock is also impacted by the probability of achieving the performance targets.
Recently Adopted Accounting Standards
Effective January 1, 2015, the Company adopted the Financial Accounting Standards Board ("FASB") Accounting Standards Update ("ASU") No. 2014-08 “Presentation of Financial Statements (Topic 205) and Property, Plant, and Equipment (Topic 360): Reporting Discontinued Operations and Disclosures of Disposals of Components of an Entity." ASU 2014-08 raises the threshold for a disposal to qualify as a discontinued operation and requires new disclosures of both discontinued operations and certain other disposals that do not meet the definition of a discontinued operation. The Company evaluated the impact the adoption of ASU 2014-08 had on the Company's consolidated financial statements and disclosures related to the January 2015 sale of its Life Sciences Vital Fluids business and determined that the sale of this business did not qualify as a discontinued operation.
2. Acquisition and Divestiture
Divestiture
On January 30, 2015, the Company sold all of the outstanding shares of common stock of its Life Sciences Vital Fluids business, reported as Other Products and Services, for a cash purchase price of $30.1 million. The disposition was completed pursuant to a Stock Purchase and Sale Agreement, dated January 30, 2015, by and among the Company, and the buyer. The Company recognized a pre-tax gain on the sale of $18.6 million, reported as non-operating income in the first quarter of 2015. Net of income taxes, the Company reported a gain on sale of $11.8 million.
In accordance with the revised accounting guidance for reporting discontinued operations, the Company did not report Life Sciences Vital Fluids as a discontinued operation as it would not be considered a strategic shift in Lydall's business. Accordingly, the operating results of Life Sciences Vital Fluids are included in the operating results of the Company through the sale date and in all periods presented in 2014.
Acquisition
On February 20, 2014, the Company completed the acquisition of certain industrial filtration businesses of Andrew Industries Limited, an Altham, United Kingdom based corporation. The Industrial Filtration business serves a global customer base in the manufacture of non-woven felt filtration media and filter bags used primarily in industrial air filtration applications including power, cement, asphalt, incineration, food and pharmaceutical. This business, which strengthened the Company’s position as an industry leading, global provider of filtration and engineered materials products, added complementary and new technologies and diversified the Company’s end markets and geographic base. The Company acquired the Industrial Filtration business for $86.9 million in cash (including cash acquired of $7.5 million and a post-closing adjustment payment of $0.2 million to Andrew Industries Limited) and with no debt being acquired. The purchase price was financed with a combination of cash on hand and $60.0 million of borrowings through the Company’s amended $100 million credit facility.
F-10
The following table summarizes the fair values of identifiable assets acquired and liabilities assumed at the date of the acquisition:
In thousands | ||||
Cash | $ | 7,493 | ||
Accounts Receivable | 26,779 | |||
Inventory | 25,046 | |||
Other current assets | 2,894 | |||
Property, plant and equipment | 38,780 | |||
Deferred Taxes | 2,501 | |||
Intangible assets (Note 5) | 5,596 | |||
Goodwill (Note 5) | 3,943 | |||
Total assets acquired | 113,032 | |||
Other liabilities | (18,002 | ) | ||
Deferred taxes | (8,130 | ) | ||
Total liabilities assumed | (26,132 | ) | ||
Net assets acquired | $ | 86,900 | ||
The following table reflects the unaudited pro forma operating results of the Company for years ended December 31, 2014 and December 31, 2013, which give effect to the acquisition of Industrial Filtration as if it had occurred on January 1, 2013. The pro forma information includes the historical financial results of the Company and Industrial Filtration. The pro forma results are not necessarily indicative of the operating results that would have occurred had the acquisition been effective January 1, 2013, nor are they intended to be indicative of results that may occur in the future. The pro forma information does not include the effects of any synergies related to the acquisition.
(Unaudited Pro Forma) | ||||||||
For The Years Ended December 31, | ||||||||
In thousands | 2014 | 2013 | ||||||
Net Sales | $ | 553,345 | $ | 525,134 | ||||
Net Income | $ | 26,302 | $ | 21,500 | ||||
Earnings per share: | ||||||||
Basic | $ | 1.58 | $ | 1.30 | ||||
Diluted | $ | 1.55 | $ | 1.27 | ||||
Pro forma earnings during the year ended December 31, 2014 were adjusted to exclude non-recurring items such as acquisition-related costs of $2.6 million and expense related to the fair value adjustment to inventory of $2.1 million, and to include additional amortization of the acquired Industrial Filtration intangible assets recognized at fair value in purchase accounting as well as additional interest expense associated with borrowings under the Company’s Amended Credit Facility. No amount is included in the pro forma earnings during the year ended December 31, 2014 related to inventory fair value adjustments which would have been recognized in cost of sales as the corresponding inventory would have been completely sold during 2013.
Pro forma earnings during the year ended December 31, 2013 were adjusted to include acquisition-related costs of $2.6 million and expense of $2.6 million related to the amortization of the fair value adjustments to inventory and additional amortization of the acquired Industrial Filtration intangible assets recognized at fair value in purchase accounting as well as $0.9 million of interest expense associated with borrowings under the Company’s Amended Credit Facility. Pro forma earnings during the year ended December 31, 2013 were adjusted to exclude acquisition-related costs of $1.2 million from 2013 which would have been included in the year ended December 31, 2012 if the acquisition had been effective January 1, 2013.
F-11
3. Inventories
Inventories as of December 31, 2015 and 2014 were as follows:
December 31, | |||||||
In thousands | 2015 | 2014 | |||||
Raw materials | $ | 17,128 | $ | 21,248 | |||
Work in process | 14,670 | 15,753 | |||||
Finished goods | 15,048 | 15,348 | |||||
46,846 | 52,349 | ||||||
Less: Progress billings | (316 | ) | (1,108 | ) | |||
Total inventories | $ | 46,530 | $ | 51,241 | |||
Included in work in process is gross tooling inventory of $9.5 million and $9.9 million at December 31, 2015 and 2014, respectively. Tooling inventory, net of progress billings, was $9.2 million and $8.8 million at December 31, 2015 and 2014, respectively.
4. Property, Plant and Equipment, Net
Property, plant and equipment as of December 31, 2015 and 2014 were as follows:
Estimated Useful Lives | December 31, | ||||||||
In thousands | 2015 | 2014 | |||||||
Land | – | $ | 2,636 | $ | 2,773 | ||||
Buildings and improvements | 10-35 years | 55,887 | 56,562 | ||||||
Machinery and equipment | 5-25 years | 195,125 | 197,804 | ||||||
Office equipment | 2-8 years | 30,622 | 31,139 | ||||||
Vehicles | 3-6 years | 864 | 930 | ||||||
Assets under capital leases: | |||||||||
Land | – | 546 | 609 | ||||||
Buildings and improvements | 10-35 years | 4,798 | 5,345 | ||||||
290,478 | 295,162 | ||||||||
Accumulated depreciation | (185,356 | ) | (186,510 | ) | |||||
Accumulated amortization of capital leases | (2,829 | ) | (2,944 | ) | |||||
102,293 | 105,708 | ||||||||
Construction in progress | 12,140 | 9,649 | |||||||
Total property, plant and equipment, net | $ | 114,433 | $ | 115,357 | |||||
Depreciation expense was $16.4 million in 2015, $16.7 million in 2014, and $12.1 million in 2013.
F-12
5. Goodwill and Intangible Assets
Gross and net carrying amounts of goodwill at December 31, 2015 and 2014 were as follows:
In thousands | Performance Materials | Industrial Filtration | Thermal/ Acoustical Metals | Other Products and Services | Totals | ||||||||||||||
Goodwill | $ | 13,340 | $ | 3,943 | $ | 12,160 | $ | 5,787 | $ | 35,230 | |||||||||
Accumulated amortization/impairment | — | — | (12,160 | ) | (1,127 | ) | (13,287 | ) | |||||||||||
Balance at December 31, 2014 | 13,340 | 3,943 | — | 4,660 | 21,943 | ||||||||||||||
Goodwill | 12,898 | 3,943 | 12,160 | — | 29,001 | ||||||||||||||
Accumulated amortization/impairment | — | — | (12,160 | ) | — | (12,160 | ) | ||||||||||||
Balance at December 31, 2015 | $ | 12,898 | $ | 3,943 | $ | — | $ | — | $ | 16,841 | |||||||||
The changes in the carrying amounts of goodwill in 2014 and 2015 were as follows:
In thousands | Performance Materials | Industrial Filtration | Other Products and Services | Totals | |||||||||||
Balance at January 1, 2014 | $ | 13,929 | $ | — | $ | 4,660 | $ | 18,589 | |||||||
Goodwill adjustment | — | 3,943 | — | 3,943 | |||||||||||
Currency translation adjustment | (589 | ) | — | — | (589 | ) | |||||||||
Balance at December 31, 2014 | 13,340 | 3,943 | 4,660 | 21,943 | |||||||||||
Goodwill adjustment | — | — | (4,660 | ) | (4,660 | ) | |||||||||
Currency translation adjustment | (442 | ) | — | — | (442 | ) | |||||||||
Balance at December 31, 2015 | $ | 12,898 | $ | 3,943 | $ | — | $ | 16,841 | |||||||
Goodwill Associated with Acquisitions and Divestitures
The goodwill adjustment in 2015 associated with Other Products and Services of $4.7 million was the result of the sale of the Company's Life Sciences Vital Fluids business on January 30, 2015.
The goodwill associated with the Industrial Filtration segment results from the acquisition of the Industrial Filtration business on February 20, 2014. The amount allocated to goodwill is reflective of the benefits the Company expects to realize from the entrance into new global markets and Industrial Filtration's assembled workforce. None of the recognized goodwill is deductible for income tax purposes.
Goodwill Impairment Testing
During the fourth quarter of 2015, the Company performed its annual impairment analysis of the $12.9 million of goodwill in the Performance Materials reporting unit (PM reporting unit) and $3.9 million in the Industrial Filtration reporting unit (IF reporting unit).
After considering changes in assumptions used in the Company's most recent quantitative annual testing, including the capital markets environment, economic conditions, industry trends, changes in results of operations, and other factors, the Company concluded it was necessary to perform the two-step impairment test for the PM reporting unit. As a result of testing, the Company concluded that the PM reporting unit, with $12.9 million of goodwill, had an estimated fair value which exceeded its carrying value by greater than 50%, and as a result, step two of the impairment test was not required.
The Company used both the income approach and market approach in performing step one of the impairment analysis to estimate the fair value of the reporting unit. The income approach involved determining the present value of future cash flows from the reporting unit’s projected financial results from 2016 - 2018 and the projected cash flows beyond that three year period computed as the terminal value. The Company believes the income approach was appropriate because it provided a fair value estimate based upon the reporting unit’s expected long-term operations and cash flow performance.
F-13
In applying the market approach, valuation multiples were derived from historic operating data of selected guideline companies, which were evaluated and adjusted, if necessary. The valuation multiples were then applied to the appropriate operating data of the reporting unit to arrive at an indication of fair value. The Company believes the market approach was appropriate because it provided a fair value using multiples from companies with operations and economic characteristics similar to its reporting unit.
The Company used the qualitative method to analyze the goodwill for the IF reporting unit, which was acquired in February 2014. When considering capital markets environment, economic conditions, industry trends, results of operations, and other factors the Company determined that it is not more likely than not that the fair value of the reporting unit is less than its carrying amount.
Other Intangible Assets
The table below presents the gross carrying amount and, as applicable, the accumulated amortization of the Company’s acquired intangible assets other than goodwill included in “Other intangible assets, net” in the Consolidated Balance Sheets as of December 31, 2015 and 2014:
December 31, 2015 | December 31, 2014 | |||||||||||||||
In thousands | Gross Carrying Amount | Accumulated Amortization | Gross Carrying Amount | Accumulated Amortization | ||||||||||||
Amortized intangible assets | ||||||||||||||||
License agreements | $ | 771 | $ | (771 | ) | $ | 818 | $ | (818 | ) | ||||||
Technology | 2,500 | (310 | ) | 2,500 | (143 | ) | ||||||||||
Customer Relationships | 2,412 | (411 | ) | 2,477 | (195 | ) | ||||||||||
Patents | 4,137 | (3,272 | ) | 6,037 | (3,274 | ) | ||||||||||
Other | 612 | (269 | ) | 691 | (252 | ) | ||||||||||
Total amortized intangible assets | $ | 10,432 | $ | (5,033 | ) | $ | 12,523 | $ | (4,682 | ) | ||||||
During 2014, the Company recognized $5.6 million of intangible assets as a result of the Industrial Filtration acquisition, including $2.5 million in both technology and customer relationships and $0.6 million in other. As of December 31, 2015, the weighted average useful life of the Industrial Filtration intangible assets was approximately 11 years.
Amortization of all intangible assets for the years ended December 31, 2015, 2014, and 2013 was $0.8 million, $0.9 million, and $0.4 million, respectively. Estimated amortization expense for intangible assets is expected to be $0.6 million for each of the years ending December 31, 2016 through 2018, and $0.5 million for the years ended December 31, 2019 and 2020. As of December 31, 2015, the weighted average useful life of intangible assets was approximately 10 years.
Impairment of Long-Lived Assets
During the fourth quarter of 2015, the Company performed an impairment analysis for long-lived assets at the Company’s DSM Solutech B.V. (“Solutech”) operation, included in the Performance Materials segment, as a result of indicators of possible impairment. During 2015, Solutech reported a cash flow loss which was caused by the delay in commercialization of certain Solutech products to the market place by Solutech’s customers. As a result of these negative cash flows, combined with historical operating losses, and a reduction in the expected amount of future cash flows of Solutech, the Company determined that it was appropriate to test the Solutech asset group for recoverability in the fourth quarter of 2015. Patents, with a remaining useful life of 8 years, and machinery and equipment primarily comprise the carrying value of the asset group of $3.2 million. To determine the recoverability of the Solutech asset group the Company completed an undiscounted cash flow analysis and compared it to the asset group carrying value. This analysis was primarily dependent on the increase in net sales over the period when the business has technological exclusivity provided by its patents. Future cash flows are dependent on the success of commercialization efforts of Solutech products by OEMs, the quality of Solutech products and technology advancements and management’s ability to manage costs.
The impairment test concluded that the Solutech asset group was not recoverable as the resulting undiscounted cash flows were less than their carrying amount. Accordingly, the Company estimated the fair value of the Solutech long-lived assets to determine the impairment amount. Determining fair value is judgmental in nature and requires the use
F-14
of significant estimates and assumptions considered to be Level 3 inputs including royalty rates, long-term growth rates and discount rates.
To determine the fair value of its patents, the Company used the relief from royalty method, which is a form of the income approach, which focused on the level of royalty payments that the user of an intangible asset would have to pay a third party for the use of the asset if it were not owned by the user. Under this approach, revenue associated with the associated technology was projected over the expected remaining useful life of the asset, with a royalty rate applied to the expected revenue. The estimated fair value of the patents was below its carrying value.
To determine the estimated fair value of its machinery and equipment, the Company used the cost approach. Under the cost approach, the determination of fair value considered the replacement cost of the assets with adjustments in value for physical deterioration, functional obsolescence, and economic obsolescence, all Level 3 inputs. The estimated fair value of the machinery and equipment exceeded its carrying value, resulting in no adjustment to the machinery and equipment.
As a result of the Company’s fair value estimates, the Company adjusted the carrying value of the patents to $0.7 million and recorded an impairment charge of $1.4 million during the quarter ended December 31, 2015. This charge was recorded in the Company’s Performance Materials segment as part of selling, product development and administrative expenses.
6. Long-term Debt and Financing Arrangements
On February 18, 2014, the Company amended and restated its $35.0 million senior secured domestic revolving credit facility (as further amended May 5, 2015, “Amended Credit Facility”) with a financial institution and two additional lenders, increasing the available borrowing from $35 million to $100 million. The Amended Credit Facility is secured by substantially all of the assets of the Company. The maturity date for the Amended Credit Facility is January 31, 2019, at which time amounts outstanding under the Amended Credit Facility are due and payable. The Company entered into this Amended Credit Facility in part to fund a majority of the purchase price of the Industrial Filtration acquisition.
Under the terms of the Amended Credit Facility, the lenders are providing a $100 million revolving credit facility to the Company, under which the lenders may make revolving loans and issue letters of credit to or for the benefit of the Company and its subsidiaries. The Amended Credit Facility may be increased by an aggregate amount not to exceed $50 million through an accordion feature, subject to specified conditions.
The Amended Credit Facility contains a number of affirmative and negative covenants, including financial and operational covenants. The Company is required to meet a minimum interest coverage ratio. The interest coverage ratio requires that, at the end of each fiscal quarter, the ratio of consolidated EBIT to Consolidated Interest Charges, both as defined in the Amended Credit Facility, may not be less than 2.0 to 1.0 for the immediately preceding 12 month period. In addition, the Company must maintain a Consolidated Leverage Ratio, as defined in the Amended Credit Facility, as of the end of each fiscal quarter of no greater than 3.0 to 1.0. The Company must also meet minimum consolidated EBITDA as of the end of each fiscal quarter for the preceding 12 month period of $30.0 million. The Company was in compliance with all covenants during 2015 and at December 31, 2015.
Interest is charged on borrowings at the Company’s option of either: (i) Base Rate plus the Applicable Rate, or (ii) the Eurodollar Rate plus the Applicable Rate. The Base Rate is a fluctuating rate equal to the highest of (a) the federal funds rate plus 0.50%, (b) the prime rate as set by Bank of America, and (c) the Eurocurrency Rate plus 1.00%. The Eurocurrency Rate means (i) if denominated in LIBOR quoted currency, a fluctuating LIBOR per annum rate equal to the London Interbank Offered Rate; (ii) if denominated in Canadian Dollars, the rate per annum equal to the Canadian Dealer Offered Rate; or (iii) the rate per annum as designated with respect to such alternative currency at the time such alternative currency is approved by the Lenders. The Applicable Rate is determined based on the Company’s Consolidated Leverage Ratio (as defined in the Amended Credit Agreement). The Applicable Rate added to the Base Rate Committed Loans ranges from 15 basis points to 100 basis points, and the Applicable Rate added to Eurocurrency Rate Committed Loans and Letters of Credit ranges from 75 basis points to 175 basis points. The Company pays a quarterly fee ranging from 20 basis points to 30 basis points on the unused portion of the $100 million available under the Amended Credit Agreement. At December 31, 2015, the Company had borrowing availability of $78.1 million under the Amended Credit Facility net of $20.0 million of borrowings outstanding and standby letters of credit outstanding of $1.9 million.
F-15
The Company has a capital lease agreement for the land and building at the St. Nazaire, France operating facility, included in the Thermal/Acoustical Metals segment, requiring monthly principal and interest payments through 2016. The capital lease provides an option for the Company to purchase the land and building at the end of the lease for a nominal amount.
Total outstanding debt consists of:
December 31, | |||||||||||
In thousands | Effective Rate | Maturity | 2015 | 2014 | |||||||
Revolver Loan, due January 31, 2019 | 1.42% | 2019 | $ | 20,000 | $ | 40,000 | |||||
Capital Lease, land and building, St. Nazaire, France | 5.44% | 2016 | 277 | 893 | |||||||
Capital Lease, manufacturing equipment, Hamptonville, North Carolina | 5.00% | 2017 | 9 | 37 | |||||||
Capital Lease, manufacturing equipment, Hamptonville, North Carolina | 1.65% | 2020 | 193 | — | |||||||
20,479 | 40,930 | ||||||||||
Less portion due within one year | (323 | ) | (615 | ) | |||||||
Total long-term debt | $ | 20,156 | $ | 40,315 | |||||||
As of December 31, 2015, total debt maturing in 2016 was $0.3 million and debt maturing in 2019 was $20.0 million. There was minimal debt maturing in 2017, 2018 and 2020.
The weighted average interest rate on long-term debt was 1.3% for the year ended December 31, 2015, compared with 1.5% and 5.4% for the years ended December 31, 2014 and 2013, respectively.
The fair values of the Company’s long-term debt are determined using discounted cash flows based upon the Company’s estimated current interest cost for similar type borrowings or current market value, which falls under Level 2 of the fair value hierarchy. The carrying values of the long-term debt approximate fair market value.
7. Capital Stock
At the 2015 Annual Meeting of Stockholders in April 2015, the Company's stockholders approved an amendment to the Company's Restated Articles of Incorporation as detailed below:
Preferred Stock — The Company decreased the par value of its preferred stock from $1.00 to $0.01. None of the 500,000 authorized shares have been issued.
Common Stock — The Company decreased the per share par value of its common stock from $0.10 to $0.01. During the second quarter of 2015, the Company reclassified approximately $2.2 million from common stock to capital in excess of par value as a result of the change in par value. As of December 31, 2015, 6,289 Lydall stockholders of record held 17,140,426 shares of Common Stock.
Dividend policy — The Company does not pay a cash dividend on its common stock. The Company’s Amended Credit Facility does not place any restrictions on cash dividend payments, so long as the payments do not place the Company in default.
8. Employer Sponsored Benefit Plan
The Company maintains a domestic defined benefit pension plan, which covers certain domestic Lydall employees, is noncontributory and benefits are based on either years of service or eligible compensation paid while a participant is in a plan. The plan has been closed to new employees for several years and benefits under the pension plan are no longer accruing.
The Company’s funding policy for its domestic defined benefit pension plan is to fund not less than the ERISA minimum funding standard and not more than the maximum amount that can be deducted for federal income tax purposes.
F-16
Plan assets and benefit obligations of the domestic defined benefit pension plan are as follows:
December 31, | |||||||
In thousands | 2015 | 2014 | |||||
Change in benefit obligation: | |||||||
Net benefit obligation at beginning of year | $ | 50,827 | $ | 53,427 | |||
Interest cost | 2,066 | 2,348 | |||||
Actuarial loss (gain) | (2,430 | ) | 7,654 | ||||
Gross benefits paid | (2,382 | ) | (12,602 | ) | |||
Net benefit obligation at end of year | $ | 48,081 | $ | 50,827 | |||
Change in plan assets: | |||||||
Fair value of plan assets at beginning of year | $ | 33,275 | $ | 40,680 | |||
Actual return on plan assets | (1,106 | ) | 945 | ||||
Contributions | 5,626 | 4,252 | |||||
Gross benefits paid | (2,382 | ) | (12,602 | ) | |||
Fair value of plan assets at end of year | $ | 35,413 | $ | 33,275 | |||
Net benefit obligation in excess of plan assets | $ | (12,668 | ) | $ | (17,552 | ) | |
Balance sheet amounts: | |||||||
Noncurrent liabilities | $ | (12,668 | ) | $ | (17,552 | ) | |
Total liabilities | $ | (12,668 | ) | $ | (17,552 | ) | |
Amounts recognized in accumulated other comprehensive income, net of tax consist of: | |||||||
Net actuarial loss | $ | 17,313 | $ | 17,228 | |||
Net amount recognized | $ | 17,313 | $ | 17,228 | |||
At December 31, 2015, in addition to the accrued benefit liability of $12.7 million recognized for the Company’s domestic defined benefit pension plan, the Company also had foreign regulatory labor agreements with an accrued benefit liability of $1.4 million and accumulated other comprehensive loss, net of tax, of $0.4 million. At December 31, 2014, in addition to the accrued benefit liability of $17.6 million recognized for the Company’s domestic defined benefit pension plan, the Company also had an accrued benefit liability of $1.4 million and accumulated other comprehensive loss, net of tax, related to foreign regulatory labor agreements of $0.4 million.
The domestic defined benefit pension plan liability, net of tax, included in other comprehensive income increased by $0.1 million for the year ended December 31, 2015 and increased by $2.4 million for the year ended December 31, 2014. These changes are mainly due to changes in pension assumptions, primarily the discount and mortality rates.
Aggregated information for the domestic defined benefit pension plan with an accumulated benefit obligation in excess of plan assets is provided in the tables below:
December 31, | |||||||
In thousands | 2015 | 2014 | |||||
Projected benefit obligation | $ | 48,081 | $ | 50,827 | |||
Accumulated benefit obligation | $ | 48,081 | $ | 50,827 | |||
Fair value of plan assets | $ | 35,413 | $ | 33,275 | |||
F-17
Components of net periodic benefit cost for the domestic pension plan:
December 31, | |||||||||||
In thousands | 2015 | 2014 | 2013 | ||||||||
Interest cost | $ | 2,066 | $ | 2,348 | $ | 2,453 | |||||
Expected return on plan assets | (2,360 | ) | (2,798 | ) | (2,691 | ) | |||||
Amortization of actuarial net loss | 897 | 725 | 1,069 | ||||||||
Pension settlement cost | — | 4,914 | — | ||||||||
Total net periodic benefit cost | $ | 603 | $ | 5,189 | $ | 831 | |||||
On April 1, 2014, the Company offered a voluntary one-time lump sum payment option to certain former U.S. employees who were vested defined benefit plan participants and not currently receiving monthly payments from the Company's domestic pension plan. The election period for this voluntary offer ended in the second quarter of 2014. Approximately 62% of eligible participants elected to receive a one-time lump sum payout resulting in $10.3 million being paid out of domestic pension plan assets in July 2014. This payout required a re-measurement of the domestic pension plan and a partial plan settlement charge, which resulted in a non-cash pre-tax loss of $4.9 million in net periodic pension benefit expense, which was recorded in selling, product development and administrative expenses in the third quarter of 2014, with an offset to accumulated other comprehensive loss in shareholder’s equity, net of $1.9 million tax benefit. The non-cash charge was required to accelerate the recognition of a portion of the previously unrecognized actuarial losses in the domestic pension plan.
It is estimated that $0.9 million of actuarial net loss will be amortized from accumulated other comprehensive loss into net periodic benefit costs for the domestic pension plan in 2016.
The major assumptions used in determining the year-end benefit obligation and annual net cost for the domestic pension plan are presented in the following table:
Benefit Obligation | Net Cost | |||||||||||||
For the years ended December 31, | 2015 | 2014 | 2015 | 2014 | 2013 | |||||||||
Discount rate | 4.56 | % | 4.16 | % | 4.16 | % | 5.09 | % | 4.16 | % | ||||
Expected return on plan assets | 7.00 | % | 7.25 | % | 7.25 | % | 7.25 | % | 7.50 | % | ||||
The year-end benefit obligation decreased primarily due to an increase in the assumed discount rate from 4.16% as of December 31, 2014 to 4.56% as of December 31, 2015.
In 2014, the Society of Actuaries issued an updated set of mortality tables and improvement scale collectively known as RP-2014 and MP-2014, respectively. The Company reviewed the findings and recommendations of these reports with their actuary. Based on that review, the Company elected to utilize the Society of Actuaries' base mortality scale RP-2014 with the BB-2D mortality improvement scale, as the Company believes the BB-2D mortality improvement table more accurately reflects recent rates of mortality improvement since 2006 for the general population compared to the MP-2014 table. Actuarial losses, related to the change in mortality tables at December 31, 2014, increased the pension plan liability $2.4 million and decreased other comprehensive income net-of-tax by $1.5 million.
Plan Assets
The domestic defined benefit pension plan is administered by an Administrative Committee and an Investment Committee, which are appointed by the Board of Directors. The Investment Committee’s responsibilities are to establish a funding policy for the Lydall Pooled Pension Investment Trust (“the Trust”) and to appoint and oversee the investment advisors responsible for the Trust’s investments. The Investment Committee is a named fiduciary under the plan with respect to management of the Trust’s investments. The assets of the domestic defined benefit pension plan are invested in the Trust for the purpose of investment diversification. In determining the expected return on plan assets, the Investment Committee considers the relative weighting of plan assets, the historical performance of marketable debt and equity securities and economic and other indicators of future performance.
Investment management objectives include maintaining an adequate level of diversification to balance market risk and to provide sufficient liquidity for near-term payments of benefits accrued under the domestic pension plan and to pay
F-18
the expenses of administration. The long-term investment objective of the Trust is to achieve a total return equal to or greater than the Trust’s actuarially assumed rate of return, currently 7.00%. Though it is the intent of the Investment Committee to achieve income and growth, that intent does not include taking extraordinary risks or engaging in investment activities not commonly considered prudent under the standards imposed by ERISA. The Investment Committee defines risk as the probability of not meeting the Trust’s objectives and the probability of not meeting the Trust’s liability requirements. The allowable investments include: exchange-traded stocks, over-the-counter common and preferred stocks, warrants, rights, convertible securities, depository receipts and shares, trust certificates, limited partnership interests, shares of other investment companies, real estate investment trusts and equity participation, obligations of foreign governments, obligations of international agencies, obligations issued by the U.S. government, mortgage related and other asset-backed securities, corporate debt securities, inflation-index bonds issued by corporations, structured notes, delayed funding loans and revolving credit facilities, bank certificates of deposit, debt securities issued by state of local governments, and money market funds. Prohibited investments include: venture capital investments, direct investment in real estate properties, CMO derivatives, hedge funds, Lydall, Inc. securities, and commodities.
The Investment Committee’s target asset allocation seeks to control risk through portfolio diversification and takes into account, among other factors, objectives discussed above, current funding levels, cash flow conditions and economic and industry trends. Equity securities include investments in large-cap and mid/small-cap companies primarily located in the United States, non-U.S. equities, and emerging market equities. Fixed income securities include fixed income mutual bond funds and common and collective funds.
The following table presents the target allocation of pension plan assets for 2016 and the actual allocation of plan assets as of December 31, 2015 and 2014 by major asset category:
Target Allocation | Actual Allocation of Plan Assets December 31, | ||||||
Asset Category | 2016 | 2015 | 2014 | ||||
Equity securities: | |||||||
U.S. Equity | 22% - 60% | 42 | % | 43 | % | ||
Non-U.S. | 15% - 25% | 21 | % | 19 | % | ||
Emerging Markets | 3% - 9% | 6 | % | 6 | % | ||
Fixed income securities: | |||||||
U.S. Bond funds | 12% - 38% | 25 | % | 26 | % | ||
Non-U.S. Bond funds | 2% - 8% | 3 | % | 3 | % | ||
Real estate investment trusts | 0% - 8% | — | % | — | % | ||
Cash and cash equivalents | 0% - 5% | 3 | % | 3 | % | ||
The investments of the Trust are stated at fair value. Fair value is the price that would be received to sell an asset or paid to transfer a liability in an orderly transaction between market participants at the measurement date. The asset’s fair value measurement level within the fair value hierarchy is based on the lowest level of any input that is significant to the fair value measurement. Valuation techniques used need to maximize the use of observable inputs and minimize the use of unobservable inputs. The framework for measuring fair value provides a fair value hierarchy that prioritizes the inputs to valuation techniques used to measure fair value. The hierarchy gives the highest priority to unadjusted quoted prices in active markets for identical assets or liabilities (Level 1 measurements) and the lowest priority to unobservable inputs (Level 3 measurements).
Equity securities, which consist primarily of common stocks, are valued at the closing price reported in the active market in which individual securities are traded. Short-term cash funds, mutual funds, bond funds and real estate investment trusts are valued at the net asset value of shares held by the plan at year end as reported in the active market in which the funds are traded.
The Trust’s purchases and sales of securities are recorded on a trade date basis. Interest income is recorded on the accrual basis. Dividends are recorded on the ex-dividend date.
F-19
The following table sets forth by level, within the fair value hierarchy, the Trust’s assets at fair value as of December 31, 2015 and December 31, 2014:
December 31, 2015 | |||||||||||||||
In thousands | Level 1 | Level 2 | Level 3 | Total | |||||||||||
Equity securities: | |||||||||||||||
U.S. Equity | $ | 14,789 | $ | — | $ | — | $ | 14,789 | |||||||
Non-U.S. | 7,356 | — | — | 7,356 | |||||||||||
Emerging Markets | 2,027 | — | — | 2,027 | |||||||||||
Fixed income securities: | |||||||||||||||
U.S. Bond funds | 8,915 | — | — | 8,915 | |||||||||||
Non-U.S. Bond funds | 1,034 | — | — | 1,034 | |||||||||||
Real estate investment trusts | 195 | — | — | 195 | |||||||||||
Cash and cash equivalents | 1,097 | — | — | 1,097 | |||||||||||
Total Assets at Fair Value | $ | 35,413 | $ | — | $ | — | $ | 35,413 | |||||||
December 31, 2014 | |||||||||||||||
In thousands | Level 1 | Level 2 | Level 3 | Total | |||||||||||
Equity securities: | |||||||||||||||
U.S. Equity | $ | 14,272 | $ | — | $ | — | $ | 14,272 | |||||||
Non-U.S. | 6,432 | — | — | 6,432 | |||||||||||
Emerging Markets | 1,896 | — | — | 1,896 | |||||||||||
Fixed income securities: | |||||||||||||||
U.S. Bond funds | 8,528 | — | — | 8,528 | |||||||||||
Non-U.S. Bond funds | 917 | — | — | 917 | |||||||||||
Real estate investment trusts | 170 | — | — | 170 | |||||||||||
Cash and cash equivalents | 1,060 | — | — | 1,060 | |||||||||||
Total Assets at Fair Value | $ | 33,275 | $ | — | $ | — | $ | 33,275 | |||||||
Estimated Future Contributions and Benefit Payments
The Company expects to contribute approximately $3.0 million to $4.0 million in cash to its domestic defined benefit pension plan in 2016. Estimated future benefit payments for the next 10 years are as follows:
In thousands | 2016 | 2017 | 2018 | 2019 | 2020 | 2020-2024 | |||||||||||||||||
Benefit payments | $ | 2,385 | $ | 2,443 | $ | 2,519 | $ | 2,655 | $ | 2,802 | $ | 14,704 | |||||||||||
Employee Savings Plan
The Company also sponsors a 401(k) Plan. Employer contributions to this plan amounted to $2.3 million in 2015, $2.1 million in 2014, and $1.7 million in 2013. Matching contributions by the Company are made on employee pretax contributions up to five percent of compensation, with the first three percent matched at 100% and the next two percent matched at 50%.
F-20
9. Equity Compensation Plans
As of December 31, 2015, the Company’s equity compensation plans consisted of the 2003 Stock Incentive Compensation Plan (the “2003 Plan”) and the 2012 Stock Incentive Plan (the “2012 Plan” and together with the 2003 Plan, the “Plans”) under which incentive and non-qualified stock options and time and performance based restricted shares have been granted to employees and directors from authorized but unissued shares of common stock or treasury shares. The 2003 Plan is not active, but continues to govern all outstanding awards granted under the plan until the awards themselves are exercised or terminate in accordance with their terms. The 2012 Plan, approved by stockholders on April 27, 2012, authorized 1,750,000 shares of common stock for awards. The 2012 Plan also authorizes an additional 1,200,000 shares of common stock to the extent awards granted under prior stock plans that were outstanding as of April 27, 2012 are forfeited. The 2012 Plan provides for the following type of awards: options, restricted stock, restricted stock units and other stock-based awards.
The Company accounts for the expense of all share-based compensation by measuring the awards at fair value on the date of grant. The Company recognizes expense on a straight-line basis over the vesting period of the entire award. Options issued by the Company under its stock option plans have a term of ten years and generally vest ratably over a period of three to four years. Time-based restricted stock grants are expensed over the vesting period of the award, which is typically two to four years. The number of performance based restricted shares that vest or forfeit depend upon achievement of certain targets during the performance period. Stock-based compensation expense includes the estimated effects of forfeitures. Compensation expense for performance based awards is recorded based upon management’s assessment of the probability of achieving the performance goals and service period and will be adjusted based upon actual achievement. Stock options issued under the current plan must have an exercise price that may not be less than the fair market value of the Company’s Common Stock on the date of grant. The Plans provide for automatic acceleration of vesting in the event of a change in control of the Company. Upon the exercise of a stock option under the Plans, shares are issued from authorized shares or treasury shares held by the Company.
The Company incurred compensation expense of $2.8 million, $2.8 million, and $1.8 million for the years ended December 31, 2015, 2014, and 2013, respectively, for all stock-based compensation plans, including restricted stock awards. No compensation costs were capitalized as part of inventory. The associated tax benefit realized was $1.5 million, $2.5 million, and $1.0 million for the years ended December 31, 2015, 2014, and 2013, respectively.
Stock Options
The fair value of each option granted was estimated on the date of grant using the Black-Scholes option-pricing model with the following weighted-average assumptions for the years ended December 31:
2015 | 2014 | 2013 | ||||||
Risk-free interest rate | 1.8 | % | 1.6 | % | 1.7 | % | ||
Expected life | 5.5 years | 5.1 years | 5.2 years | |||||
Expected volatility | 43 | % | 46 | % | 65 | % | ||
Expected dividend yield | — | % | — | % | — | % | ||
F-21
The following is a summary of the option activity as of December 31, 2015 and changes during the year then ended:
In thousands except per share amounts and years
Shares | Weighted-Average Exercise Price | Weighted- Average Remaining Contractual Term (years) | Aggregate Intrinsic Value | ||||||||
Outstanding at December 31, 2014 | 609 | $ | 14.81 | ||||||||
Granted | 92 | $ | 36.74 | ||||||||
Exercised | (166) | $ | 10.21 | ||||||||
Forfeited/Cancelled | (72) | $ | 19.08 | ||||||||
Outstanding at December 31, 2015 | 463 | $ | 20.15 | 7.2 | $ | 7,213 | |||||
Options exercisable at December 31, 2015 | 241 | $ | 12.37 | 5.6 | $ | 5,569 | |||||
Expected to vest at December 31, 2015 | 209 | $ | 28.55 | 9.0 | $ | 1,556 | |||||
The Company granted 91,900, 131,800, and 75,279 stock options during 2015, 2014, and 2013, respectively. The weighted-average grant-date fair value of options granted during the years 2015, 2014, and 2013 was $15.28, $11.85, and $9.41, respectively. There were 166,175 options exercised in 2015, 277,006 options exercised in 2014, and 158,322 options exercised in 2013. The intrinsic value for options exercised during 2015 was $3.5 million and the associated tax benefit realized from stock options exercised was $1.1 million. The total intrinsic value for options exercised during 2014 was $5.0 million and the associated tax benefit realized from stock options exercised was $1.8 million. The total intrinsic value for options exercised during 2013 was $1.0 million and the associated tax benefit realized from stock options exercised was $0.3 million. The amount of cash received from the exercise of stock options was $1.5 million in 2015, $2.5 million in 2014, and $1.5 million in 2013. At December 31, 2015, the total unrecognized compensation cost related to non-vested stock option awards was approximately $2.0 million, with a weighted average expected amortization period of 3.2 years.
Restricted Stock
The following is a summary of the Company’s unvested restricted shares for the year ended and as of December 31, 2015:
In thousands except per share amounts | |||||
Outstanding Restricted Shares | Shares | Weighted-Average Grant-Date Fair Value | |||
Outstanding at December 31, 2014 | 459 | $ | 19.17 | ||
Granted | 72 | $ | 34.09 | ||
Vested | (41) | $ | 14.69 | ||
Forfeited/Cancelled | (147) | $ | 16.43 | ||
Outstanding at December 31, 2015 | 343 | $ | 24.01 | ||
Expected to vest at December 31, 2015 | 307 | $ | 25.88 | ||
Restricted stock includes both performance-based and time-based awards. Compensation for restricted stock is recorded based on the market value of the stock on the grant date and amortized to expense over the vesting period of the award. The Company granted 38,170, 204,800, and 95,090 shares of performance-based restricted stock during 2015, 2014, and 2013, respectively. The Company granted 33,755 shares of time-based restricted stock in 2015, 48,649 shares in 2014, and 29,480 in 2013. The weighted average fair value per share of restricted stock granted was $34.09, $22.93, and $16.01 during 2015, 2014, and 2013, respectively. During 2015, 2014, and 2013, respectively, there were 147,187, 6,212 and 10,565 shares of restricted stock forfeited. The fair value of awards for which restrictions lapsed during the years ended December 31, 2015, 2014, and 2013 was $1.4 million, $2.2 million, and $1.6 million, respectively. At December 31, 2015, the total unrecognized compensation cost related to non-vested restricted stock awards was approximately $4.0 million, with a weighted average expected amortization period of 2.2 years.
F-22
Stock Repurchase Program
In April 2012, the Company’s Board of Directors approved a stock repurchase program (the “2012 Stock Repurchase Program”) which authorized the Company to repurchase up to 1.0 million shares of its common stock.
The Company repurchased 267,089 shares of its common stock during the year ended December 31, 2015 under the 2012 Stock Repurchase Program. As of December 31, 2015, there were no shares remaining and authorized for repurchase under the 2012 Stock Repurchase Program.
During the year ended December 31, 2015, the Company purchased 12,935 shares of common stock valued at $0.4 million, through withholding, pursuant to provisions in agreements with recipients of restricted stock granted under the Company's equity compensation plans, which allow the Company to withhold the number of shares having fair value equal to each recipient's tax withholding due.
10. Segment Information
On February 20, 2014, the Company acquired the Industrial Filtration business from Andrew Industries Limited, which is being reported as a separate reportable segment since the acquisition date. Segment information is consistent with how management reviews the businesses, makes investing and resource allocation decisions and assesses operating performance.
The Company’s reportable segments are Performance Materials, Industrial Filtration, Thermal/Acoustical Metals, and Thermal/Acoustical Fibers. Other Products and Services (“OPS”) included Life Sciences Vital Fluids, which was sold on January 30, 2015.
Performance Materials Segment
The Performance Materials segment includes filtration media solutions primarily for air, fluid power, and industrial applications (“Filtration”), thermal insulation solutions for building products, appliances, and energy and industrial markets (“Thermal Insulation”), and air and liquid life science applications (“Life Sciences Filtration”).
Filtration products include LydAir® MG (Micro-Glass) Air Filtration Media, LydAir® MB (Melt Blown) Air Filtration Media, LydAir® SC (Synthetic Composite) Air Filtration Media, and Arioso™ Membrane Composite Media. These products constitute the critical media component of clean-air systems for applications in clean-space, commercial, industrial and residential HVAC, power generation, and industrial processes. Lydall has leveraged its extensive technical expertise and applications knowledge into a suite of media products covering the vast liquid filtration landscape across the engine and industrial fields. The LyPore® Liquid Filtration Media series address a variety of application needs in fluid power including hydraulic filters, air-water and air-oil coalescing, industrial fluid processes and diesel fuel filtration.
Thermal Insulation products are high performance non-woven veils, papers, mats and specialty composites for the building products, appliance, and energy and industrial markets. The Manniglas® Thermal Insulation brand is diverse in its product application ranging from high temperature seals and gaskets in ovens and ranges to specialty veils for HVAC and cavity wall insulation. The appLY® Mat Needled Glass Mats have been developed to expand Lydall’s high temperature technology portfolio for broad application into the appliance market and supplements the Lytherm® Insulation Media product brand, traditionally utilized in the industrial market for kilns and furnaces used in metal processing. Lydall’s Cryotherm® Super-Insulating Media, CRS-Wrap® Super-Insulating Media and Cryo-Lite™ Cryogenic Insulation products are industry standards for state-of-the-art cryogenic insulation designs used by manufacturers of cryogenic equipment for liquid gas storage, piping, and transportation.
Life Sciences Filtration products have been developed to meet the requirements of life science applications including biopharmaceutical pre-filtration and clarification, diagnostic and analytical testing, respiratory protection, life protection, medical air filtration, drinking water filtration and high purity process filtration such as that found in food and beverage and medical applications. Lydall also offers Solupor® Membrane specialty microporous membranes that are utilized in various markets and applications including air and liquid filtration and transdermal drug delivery. Solupor® membranes incorporate a unique combination of mechanical strength, chemical inertness, and high porosity in a unique open structure.
F-23
Industrial Filtration Segment
The Industrial Filtration segment includes non-woven felt media and filter bags used primarily in industrial air and liquid filtration applications. Non-woven filter media is the most commonly used filter technology to satisfy increasing emission control regulations in a wide range of industries, including power, cement, steel, asphalt, incineration, mining, food, and pharmaceutical. The business also produces non-woven rolled-good media that is used in other commercial applications and media for automotive applications is supplied to the Company's Thermal/Acoustical Fibers segment.
Industrial Filtration segment products include air and liquid filtration media sold under the brand names Fiberlox® high performance filtration felts, Checkstatic™ conductive filtration felts, Microfelt® high efficiency filtration felts, Pleatlox® pleatable filtration felts, Ultratech™ PTFE filtration felts, Powertech® and Powerlox® power generation filtration felts, Microcap® high efficiency liquid filtration felts, Duotech membrane composite filtration felts, along with traditional scrim supported filtration felts. Industrial Filtration also offers extensive finishing and coating capabilities which provide custom engineered properties tailored to meet the most demanding filtration applications. The business leverages a wide range of fiber types and extensive technical capabilities to provide products that meet our customers’ needs across a variety of applications providing both high performance and durability.
Thermal/Acoustical Metals Segment
The Thermal/Acoustical Metals segment offers a full range of innovative engineered products for the transportation sector to assist primarily in the reduction of powertrain and road noise as well as thermally shield sensitive components from high heat. Lydall products are found in the underbody (tunnel, fuel tank, exhaust, rear muffler and spare tire) and under hood (engine compartment, turbo charger, and manifolds) of cars, trucks, SUVs, heavy duty trucks and recreational vehicles.
Thermal/Acoustical Metals segment products are formed on production lines capable of combining multiple layers of metal and thermal or acoustical media to provide an engineered thermal and acoustical shielding solution for an array of application areas in the global automotive and truck markets. The flux® product family in Thermal/Acoustical Metals includes several patented or IP-rich products that address applications which include: Direct Exhaust Mount heat shields, which are mounted to high temperature surfaces like exhaust down-pipes, turbochargers or engine manifolds using aluminized and stainless steel with high performance heat insulating materials; Powertrain heat shields that absorb noise at the source or are acoustically transparent and do not contribute to the engine’s noise budget; and Durable and thermally robust solutions for sensitive plastic components such as fuel tanks that are in proximity to high temperature heat sources.
Thermal/Acoustical Fibers Segment
The Thermal/Acoustical Fibers segment offers innovative engineered products to assist primarily in noise vibration and harshness (NVH) abatement within the transportation sector. Lydall products are found in the interior (dash insulators, cabin flooring), underbody (wheel well, aerodynamic belly pan, fuel tank, exhaust) and under hood (engine compartment) of cars, trucks, SUVs, heavy duty trucks and recreational vehicles.
Thermal/Acoustical Fibers segment products offer thermal and acoustical insulating solutions comprised of organic and inorganic fiber composites for the automotive and truck markets primarily in North America. Lydall’s dBCore® is a lightweight acoustical composite that emphasizes absorption principles over heavy-mass type systems. Lydall’s dBLyte® is a high-performance acoustical barrier with sound absorption and blocking properties and can be used throughout a vehicle’s interior to minimize intrusive noise from an engine compartment and road. Lydall’s ZeroClearance® is an innovative thermal solution that utilizes an adhesive backing for attachment and is used to protect vehicle components from excessive heat. Lydall’s specially engineered products provide a solution that provides weight reduction, superior noise suppression, and increased durability over conventional designs.
Thermal/Acoustical Metals segment and Thermal/Acoustical Fibers segment operating results include allocations of certain costs shared between the segments.
Other Products and Services
The Life Sciences Vital Fluids business offered specialty products for blood filtration devices, blood transfusion single-use containers and the design and manufacture of single-use solutions for cell growth, frozen storage and fluid handling, as well as equipment for bioprocessing applications.
F-24
On January 30, 2015, the Company sold all of the outstanding shares of common stock of its Life Sciences Vital Fluids business for a cash purchase price of $30.1 million. The disposition was completed pursuant to a Stock Purchase and Sale Agreement, dated January 30, 2015, by and among the Company, and the buyer. The Company recognized an after-tax gain on the sale of this business of approximately $11.8 million in the first quarter of 2015.
Net sales by segment and for OPS, as well as reconciling items, to equal consolidated net sales for the years ended December 31, 2015, 2014, and 2013 were as follows:
Consolidated Net Sales | For the Years Ended December 31, | ||||||||||
(2) | (3) | ||||||||||
In thousands | 2015 | 2014 | 2013 | ||||||||
Performance Materials Segment: | |||||||||||
Filtration | $ | 62,716 | $ | 71,648 | $ | 64,752 | |||||
Thermal Insulation | 28,311 | 31,404 | 36,929 | ||||||||
Life Sciences Filtration | 10,451 | 12,814 | 10,320 | ||||||||
Performance Materials Segment net sales | 101,478 | 115,866 | 112,001 | ||||||||
Industrial Filtration Segment: | |||||||||||
Industrial Filtration (1) | 139,133 | 112,220 | — | ||||||||
Industrial Filtration net sales | 139,133 | 112,220 | — | ||||||||
Thermal/Acoustical Metals Segment: | |||||||||||
Metal parts | 141,117 | 145,135 | 135,833 | ||||||||
Tooling | 19,815 | 19,130 | 22,573 | ||||||||
Thermal/Acoustical Metals Segment net sales | 160,932 | 164,265 | 158,406 | ||||||||
Thermal/Acoustical Fibers Segment: | |||||||||||
Fiber parts | 135,595 | 124,458 | 105,876 | ||||||||
Tooling | 3,152 | 4,133 | 8,444 | ||||||||
Thermal/Acoustical Fibers Segment net sales | 138,747 | 128,591 | 114,320 | ||||||||
Other Products and Services: | |||||||||||
Life Sciences Vital Fluids | 1,671 | 19,682 | 17,175 | ||||||||
Other Products and Services net sales | 1,671 | 19,682 | 17,175 | ||||||||
Eliminations and Other (1) | (17,456 | ) | (4,795 | ) | (3,933 | ) | |||||
Consolidated Net Sales | $ | 524,505 | $ | 535,829 | $ | 397,969 | |||||
(1) | Included in the Industrial Filtration segment and Eliminations and Other is $13.8 million and $1.0 million in intercompany sales to the T/A Fibers segment for the years ended December 31, 2015 and 2014, respectively. |
Operating income by segment and for OPS and Corporate Office Expenses for the years ended December 31, 2015, 2014, and 2013 were as follows:
Operating Income | For the Years Ended December 31, | ||||||||||
(2) | (3) | ||||||||||
In thousands | 2015 | 2014 | 2013 | ||||||||
Performance Materials Segment | $ | 6,790 | $ | 9,706 | $ | 9,462 | |||||
Industrial Filtration Segment | 13,431 | 6,412 | — | ||||||||
Thermal/Acoustical Metals Segment | 15,517 | 13,823 | 14,088 | ||||||||
Thermal/Acoustical Fibers Segment | 37,086 | 29,167 | 21,486 | ||||||||
Other Products and Services: | |||||||||||
Life Sciences Vital Fluids | 118 | 1,582 | 778 | ||||||||
Corporate Office Expenses | (20,465 | ) | (26,642 | ) | (17,101 | ) | |||||
Consolidated Operating Income | $ | 52,477 | $ | 34,048 | $ | 28,713 | |||||
F-25
Operating results in 2015 were negatively impacted by a $1.4 million long-lived asset impairment charge within the Performance Materials segment and unfavorable foreign currency translation of $2.0 million impacting the Performance Materials, T/A Metals and Industrial Filtration segments. Operating results in 2014 were negatively impacted by $2.1 million of purchase accounting adjustments relating to inventory step-up for the Industrial Filtration segment and a $2.9 million sales commission settlement within the T/A Metals segment. Corporate Office Expenses in 2014 were negatively impacted by a $4.9 million non-cash pension plan settlement charge and $2.6 million of transaction related costs. Corporate Office Expenses in 2013 were impacted by $1.2 million of transaction related costs.
Total assets by segment and for OPS and the Corporate Office were as follows at December 31, 2015, 2014, and 2013:
Total Assets | December 31, | ||||||||||
(2) | (3) | ||||||||||
In thousands | 2015 | 2014 | 2013 | ||||||||
Performance Materials Segment | $ | 66,706 | $ | 71,325 | $ | 74,838 | |||||
Industrial Filtration Segment | 89,566 | 100,201 | — | ||||||||
Thermal/Acoustical Metals Segment | 111,195 | 106,210 | 104,908 | ||||||||
Thermal/Acoustical Fibers Segment | 38,881 | 33,109 | 30,176 | ||||||||
Other Products and Services | — | 11,580 | 11,866 | ||||||||
Corporate Office | 51,912 | 39,345 | 52,897 | ||||||||
Total Assets | $ | 358,260 | $ | 361,770 | $ | 274,685 | |||||
Total capital expenditures and depreciation and amortization by segment and for OPS and the Corporate Office for the years ended December 31, 2015, 2014, and 2013 were as follows:
Capital Expenditures | Depreciation and Amortization | ||||||||||||||||||||||
(2) | (3) | (2) | (3) | ||||||||||||||||||||
In thousands | 2015 | 2014 | 2013 | 2015 | 2014 | 2013 | |||||||||||||||||
Performance Materials Segment | $ | 3,519 | $ | 4,124 | $ | 4,604 | $ | 4,499 | $ | 4,654 | $ | 4,667 | |||||||||||
Industrial Filtration Segment | 968 | 1,804 | — | 4,996 | 4,536 | — | |||||||||||||||||
Thermal/Acoustical Metals Segment | 11,494 | 8,544 | 6,027 | 4,233 | 4,578 | 4,777 | |||||||||||||||||
Thermal/Acoustical Fibers Segment | 4,807 | 3,296 | 1,887 | 2,400 | 2,166 | 2,217 | |||||||||||||||||
Other Products and Services | 22 | 574 | 243 | 45 | 804 | 588 | |||||||||||||||||
Corporate Office | 745 | 659 | 1,065 | 1,102 | 908 | 454 | |||||||||||||||||
Total | $ | 21,555 | $ | 19,001 | $ | 13,826 | $ | 17,275 | $ | 17,646 | $ | 12,703 | |||||||||||
(2) | Other Products and Services reports results for the period preceding the date of disposition of the Vital Fluids Life Sciences business on January 30, 2015. |
(3) | Industrial Filtration segment reports results for the period following the date of acquisition of February 20, 2014 through December 31, 2014. |
F-26
Net sales by geographic area for the years ended December 31, 2015, 2014 and 2013 and long-lived asset information by geographic area as of December 31, 2015, 2014, and 2013 were as follows:
Net Sales | Long-Lived Assets | ||||||||||||||||||||||
In thousands | 2015 | 2014 | 2013 | 2015 | 2014 | 2013 | |||||||||||||||||
United States (4),(5) | $ | 344,950 | $ | 345,864 | $ | 269,989 | $ | 76,502 | $ | 72,832 | $ | 48,787 | |||||||||||
France | 47,495 | 52,534 | 47,831 | 12,899 | 13,861 | 16,436 | |||||||||||||||||
Germany | 68,861 | 77,896 | 77,229 | 10,149 | 12,366 | 13,287 | |||||||||||||||||
United Kingdom (5) | 26,598 | 26,387 | — | 6,399 | 7,601 | — | |||||||||||||||||
China (5) | 33,885 | 29,401 | — | 9,953 | 11,225 | — | |||||||||||||||||
Other | 2,716 | 3,747 | 2,920 | 815 | 795 | 1,815 | |||||||||||||||||
Total | $ | 524,505 | $ | 535,829 | $ | 397,969 | $ | 116,717 | $ | 118,680 | $ | 80,325 | |||||||||||
(4) | Other Products and Services reports results for the period preceding the date of disposition of the Vital Fluids Life Sciences business on January 30, 2015. |
(5) | Industrial Filtration segment reports results for the period following the date of acquisition of February 20, 2014 through December 31, 2014. |
Foreign sales are based on the country in which the sales originated (i.e., where the Company’s legal entity is domiciled). Sales to Ford Motor Company in 2015, 2014, and 2013 were $95.4 million, $88.4 million, and $79.7 million, respectively, and accounted for 18.2%, 16.5%, and 20.0% of Lydall’s net sales in the years ended December 31, 2015, 2014, and 2013, respectively. Sales to Chrysler Group LLC in 2013 were $43.5 million and accounted for 10.9% of Lydall's net sales in the year ended 2013. These sales were reported in the Thermal/Acoustical Metal and Thermal/Acoustical Fiber segments. No other customers accounted for more than 10.0% of total net sales in 2015, 2014, and 2013.
11. Income Taxes
The provision for income taxes consists of the following:
For the years ended December 31, | |||||||||||
In thousands | 2015 | 2014 | 2013 | ||||||||
Current: | |||||||||||
Federal | $ | 18,291 | $ | 8,069 | $ | 5,477 | |||||
State | 1,204 | 1,334 | 709 | ||||||||
Foreign | 1,684 | 3,883 | 2,032 | ||||||||
Total Current | 21,179 | 13,286 | 8,218 | ||||||||
Deferred: | |||||||||||
Federal | $ | 1,583 | $ | (42 | ) | $ | 1,609 | ||||
State | 1,696 | (1,626 | ) | (1,144 | ) | ||||||
Foreign | 306 | 191 | 504 | ||||||||
Total Deferred | 3,585 | (1,477 | ) | 969 | |||||||
Provision for income taxes | $ | 24,764 | $ | 11,809 | $ | 9,187 | |||||
F-27
The following is a reconciliation of the difference between the actual provision for income taxes and the provision computed by applying the federal statutory tax rate on earnings:
For the years ended December 31, | ||||||||
2015 | 2014 | 2013 | ||||||
Statutory federal income tax rate | 35.0 | % | 35.0 | % | 35.0 | % | ||
State income taxes | 2.9 | 0.8 | 2.9 | |||||
Valuation allowances for deferred tax assets, including state | 1.3 | 1.3 | (1.8 | ) | ||||
Research and development credits | (1.5 | ) | (0.5 | ) | (1.1 | ) | ||
Capitalized transaction costs | — | 2.0 | — | |||||
Domestic production activities deduction | (1.6 | ) | (2.6 | ) | (2.7 | ) | ||
Foreign income taxed at lower rates | (1.3 | ) | (3.5 | ) | — | |||
Other | 0.1 | 2.6 | 0.1 | |||||
Effective income tax rate | 34.9 | % | 35.1 | % | 32.4 | % | ||
In 2015, the effective tax rate of 34.9% was positively impacted by a favorable mix of taxable income generated from countries with lower tax rates compared to that of the United States, resulting in a tax benefit of $1.0 million. The Company also recorded a tax benefit of $1.2 million attributable to the Domestic Production Activities Deduction and a tax benefit of $1.1 million related to research and development credits. These favorable adjustments were partially offset by tax expense of $0.9 million related to a net increase in valuation allowance against certain deferred tax assets and by a $0.6 million reduction to state deferred tax assets as a result of state tax law changes that led the Company to deem the asset unrealizable in future periods. The net increase in valuation allowance against certain deferred tax assets of $0.9 million in 2015 was primarily related to tax valuation allowances of $0.8 million recorded against certain net deferred tax assets in the Netherlands and China, as future realization of the assets is not reasonably assured.
In 2014, the effective tax rate of 35.1% was positively impacted by a favorable mix of taxable income generated from countries with lower tax rates compared to that of the United States resulting in a tax benefit of $1.2 million and a tax benefit of $0.9 million attributable to the Domestic Production Activities Deduction. These favorable adjustments were partially offset by tax expense of $0.8 million related to nondeductible transaction costs from the Industrial Filtration acquisition, and a net increase in tax valuation allowances of $0.2 million. The other line item above is net of nondeductible expenses and other income and expense items.
In 2013, the effective tax rate of 32.4% was positively impacted by the release of valuation allowances against state tax credit carryovers of $1.1 million, $0.8 million of benefit relating to Domestic Production Activities Deduction, and a tax benefit of $0.5 million related to the conclusion of certain U.S. federal income tax matters through the year ended December 31, 2009. These favorable tax adjustments were partially offset by an increase in valuation allowance established against a foreign net deferred tax asset. The $1.1 million reversal of valuation allowances against state tax credit carryovers included $0.3 million of state tax credits which offset 2013 state income taxes and $0.8 million expected to benefit future periods.
The Company maintains valuation allowances against certain deferred tax assets where realization is not reasonably assured. The Company evaluates the likelihood of the realization of deferred tax assets and reduces the carrying amount to the extent it believes a portion will not be realized. The Company’s effective tax rates in future periods could be affected by earnings being lower or higher than anticipated in countries where tax rates differ from the United States federal rate, the relative impact of permanent tax adjustments on higher or lower earnings from domestic operations, changes in net deferred tax asset valuation allowances, completion of acquisitions or divestitures, changes in tax rates or tax laws and the outcome of tax audits.
F-28
The following schedule presents net current and net long-term deferred tax assets and liabilities by tax jurisdiction as of December 31, 2015 and 2014:
2015 | 2014 | ||||||||||||||
Deferred Tax Assets | Deferred Tax Assets | ||||||||||||||
In thousands | Current | Long-term | Current | Long-term | |||||||||||
Federal | $ | 3,684 | $ | — | $ | 3,399 | $ | — | |||||||
State | 147 | 134 | 711 | 1,408 | |||||||||||
Foreign | 782 | — | 1,504 | — | |||||||||||
Totals | $ | 4,613 | $ | 134 | $ | 5,614 | $ | 1,408 | |||||||
2015 | 2014 | ||||||||||||||
Deferred Tax Liabilities | Deferred Tax Liabilities | ||||||||||||||
In thousands | Current | Long-term | Current | Long-term | |||||||||||
Federal | $ | — | $ | 12,504 | $ | — | $ | 10,562 | |||||||
State | — | — | — | — | |||||||||||
Foreign | — | 2,493 | — | 3,305 | |||||||||||
Totals | $ | — | $ | 14,997 | $ | — | $ | 13,867 | |||||||
Net deferred tax assets (liabilities) consist of the following as of December 31, 2015 and 2014:
December 31, | |||||||
In thousands | 2015 | 2014 | |||||
Deferred tax assets: | |||||||
Accounts receivable | $ | 218 | $ | 211 | |||
Inventories | 741 | 884 | |||||
Net operating loss carryforwards | 4,213 | 4,992 | |||||
Other accrued liabilities | 2,745 | 3,341 | |||||
Pension | 3,684 | 7,295 | |||||
Tax Credits | 1,634 | 1,879 | |||||
Total deferred tax assets | 13,235 | 18,602 | |||||
Deferred tax liabilities: | |||||||
Intangible assets | 4,077 | 6,525 | |||||
Property, plant and equipment | 15,101 | 15,195 | |||||
Total deferred tax liabilities | 19,178 | 21,720 | |||||
Valuation allowance | 4,307 | 3,727 | |||||
Net deferred tax liabilities | $ | (10,250 | ) | $ | (6,845 | ) | |
For the years ended December 31, 2015, 2014 and 2013, income before income taxes was derived from the following sources:
For the years ended December 31, | |||||||||||
In thousands | 2015 | 2014 | 2013 | ||||||||
United States | $ | 64,923 | $ | 27,463 | $ | 23,433 | |||||
Foreign | 6,100 | 6,193 | 4,909 | ||||||||
Total income before income taxes | $ | 71,023 | $ | 33,656 | $ | 28,342 | |||||
At December 31, 2015, the Company had approximately $4.3 million of state net operating loss carryforward which expires in 2035 and 2036. The Company has not recorded a deferred tax asset for this carryforward as the Company anticipates paying a non-income based franchise tax for the foreseeable future in the applicable jurisdiction. In addition, at December 31, 2015, the Company had $2.6 million of state tax credit carry forwards that expire between 2016 and 2031. As of December 31, 2015, the Company has provided a valuation reserve against $2.0 million of its state tax
F-29
credit carryforwards. The Company also has $7.1 million of foreign net operating loss carryovers in China, $0.1 million of foreign net operating loss carryovers in France, $0.4 million of net operating loss carryovers in the United Kingdom and $9.2 million of net operating loss carryovers in the Netherlands. The Netherlands’ net operating losses expire between the years 2017 and 2024 and the China net operating losses expire between the years 2016 and 2020. The Company has recorded a valuation allowance against $9.2 million of its net operating losses in the Netherlands and $3.6 million of its net operating losses in China as future realization is not reasonably assured. The Company evaluates and weighs the positive and negative evidence present at each period. The Company will continue to monitor the realization criteria based on future operating results.
As of December 31, 2015 the Company has not paid U.S. income taxes on approximately $24.5 million of undistributed earnings of foreign subsidiaries. The Company’s intention is to reinvest these earnings indefinitely or to repatriate the earnings only when it is tax effective to do so. The Company estimates that the amount of tax that would be payable on the undistributed earnings if repatriated to the United States would fall in the range of $1.0 million to $6.0 million, based on current facts, but depending on the timing and extent of the repatriation. This amount may vary in the future due to a variety of factors including future tax law changes, future earnings and statutory taxes paid by foreign subsidiaries, and ongoing tax planning strategies by the Company.
The Company and its subsidiaries file a consolidated federal income tax return, as well as returns required by various state and foreign jurisdictions. In the normal course of business, the Company is subject to examination by taxing authorities, including such major jurisdictions as the United States, China, France, Germany, Hong Kong, the Netherlands and the United Kingdom. Within the next fiscal year, the Company expects to conclude certain federal income tax matters through the year ended December 31, 2012 and it is reasonably expected that net unrecognized benefits of $0.1 million may be recognized. The total amount of net unrecognized tax benefits that would affect the effective tax rate if recognized is $1.1 million as of December 31, 2015. The Company is no longer subject to U.S. federal examinations for years before 2012, state and local examinations for years before 2011, and non-U.S. income tax examinations for years before 2003.
A reconciliation of the beginning and ending amount of gross unrecognized tax benefits is as follows:
In thousands | 2015 | 2014 | |||||
Unrecognized tax benefits at beginning of year | $ | 2,272 | $ | 1,864 | |||
Increases relating to positions taken in prior periods | — | 20 | |||||
Increases relating to current period | 49 | 388 | |||||
Decreases due to settlements with tax authorities | (336 | ) | — | ||||
Decreases due to lapse of statute of limitations | (328 | ) | — | ||||
Unrecognized tax benefits at end of year | $ | 1,657 | $ | 2,272 | |||
The Company recognizes the interest accrued and the penalties related to unrecognized tax benefits as a component of tax expense.
12. Commitments and Contingencies
Leases
The Company has operating leases that resulted in expense of $5.1 million in 2015, $6.4 million in 2014, and $4.0 million in 2013. These contracts include building, office equipment, vehicle and machinery leases that require payment of property taxes, insurance, repairs and other operating costs.
The Company has a capital lease agreement for the land and building at the St. Nazaire, France operating facility requiring monthly principal and interest payments until 2016. (See Note 6)
F-30
Approximate future minimum lease payments under noncancelable leases are:
Payments due by period | |||||||||||
In thousands | Operating Lease Payments | Capital Lease Payments | Total | ||||||||
2016 | $ | 4,385 | $ | 326 | $ | 4,711 | |||||
2017 | 3,782 | 42 | 3,824 | ||||||||
2018 | 2,284 | 42 | 2,326 | ||||||||
2019 | 828 | 42 | 870 | ||||||||
2020 | 526 | 35 | 561 | ||||||||
Thereafter | 603 | — | 603 | ||||||||
Total | 12,408 | 487 | 12,895 | ||||||||
Interest on capital leases | — | (11 | ) | (11 | ) | ||||||
Total | $ | 12,408 | $ | 476 | $ | 12,884 | |||||
Commitments and Contingencies
The Company is subject to legal proceedings, claims, investigations and inquiries that arise in the ordinary course of business such as, but not limited to, actions with respect to commercial, intellectual property, employment, personal injury and environmental matters. While the outcome of any matter is inherently uncertain and the Company cannot be sure that it will prevail in any of the cases, subject to the matter referenced below, the Company is not aware of any matters pending that are expected to be material with respect to the Company’s business, financial position, results of operations or cash flows.
Lydall Gerhardi GmbH & Co. KG ("Lydall Gerhardi"), which is an indirect wholly-owned subsidiary of the Company and part of the Thermal/Acoustical Metals segment, is cooperating with the German Federal Cartel Office (Bundeskartellamt) in connection with an investigation, initiated in the second quarter of 2014, relating to possible violations of German anti-trust laws by and among certain European automotive heat shield manufacturers, including Lydall Gerhardi.
The Company has been conducting an internal investigation utilizing outside counsel. In the course of this internal investigation, the Company has discovered instances of inappropriate conduct by certain German employees of Lydall Gerhardi. The Company has disclosed its findings in an application for leniency submitted to the German Federal Cartel Office on July 22, 2014. The Company is continuing its internal investigation and has taken, and will continue to take, remedial actions.
The German Federal Cartel Office has wide discretion in fixing the amount of a fine, up to a maximum fine of ten percent (10%) of the Company’s annual revenue of the year preceding the year in which the fine is imposed. The Company believes a loss is probable. However, in light of the uncertainties and variables involved, the Company is unable to estimate either the timing or the amount of the loss associated with this matter. There can be no assurance that this matter will not have a material adverse effect on the Company.
13. Earnings Per Share
The following table provides a reconciliation of weighted-average shares used to determine basic and diluted earnings per share.
For the years ended December 31, | ||||||||
In thousands | 2015 | 2014 | 2013 | |||||
Basic average common shares outstanding | 16,746 | 16,662 | 16,570 | |||||
Effect of dilutive options and restricted stock awards | 338 | 341 | 296 | |||||
Diluted average common shares outstanding | 17,084 | 17,003 | 16,866 | |||||
F-31
For the years ended December 31, 2015, 2014 and 2013, stock options for 0.1 million, less than 0.1 million, and 0.2 million shares of Common Stock, respectively, were not considered in computing diluted earnings per common share as the stock options were considered anti-dilutive.
14. Quarterly Financial Information (Unaudited)
The following table summarizes quarterly financial results for 2015 and 2014. In management’s opinion, all material adjustments necessary for a fair statement of the information for such quarters have been reflected.
1st Quarter | 2nd Quarter | 3rd Quarter | 4th Quarter | ||||||||||||||||||||||||||||
In thousands except per share data | 2015 | 2014 | 2015 | 2014 | 2015 | 2014 | 2015 | 2014 | |||||||||||||||||||||||
Net sales | $ | 127,306 | $ | 125,226 | $ | 134,561 | $ | 148,793 | $ | 131,240 | $ | 134,227 | $ | 131,398 | $ | 127,583 | |||||||||||||||
Gross profit | $ | 27,700 | $ | 26,199 | $ | 33,889 | $ | 34,653 | $ | 31,691 | $ | 28,564 | $ | 29,217 | $ | 25,562 | |||||||||||||||
Net income | $ | 18,937 | $ | 3,716 | $ | 10,817 | $ | 8,240 | $ | 11,186 | $ | 4,158 | $ | 5,319 | $ | 5,733 | |||||||||||||||
Earnings per common share: | |||||||||||||||||||||||||||||||
Basic | $ | 1.12 | $ | 0.22 | $ | 0.65 | $ | 0.50 | $ | 0.67 | $ | 0.25 | $ | 0.32 | $ | 0.34 | |||||||||||||||
Diluted | $ | 1.11 | $ | 0.22 | $ | 0.64 | $ | 0.49 | $ | 0.66 | $ | 0.24 | $ | 0.31 | $ | 0.34 | |||||||||||||||
The table above includes the quarterly results of Industrial Filtration since the acquisition date of February 20, 2014 and Other Products and Services preceding the disposition date of January 30, 2015.
Net income during the quarter ended March 31, 2015 was positively impacted by an after-tax gain of $11.8 million due to the sale of Life Sciences Vital Fluids. Net income during the quarter ended September 30, 2015 was positively impacted by discrete tax benefits of $1.2 million, related to the completion of a tax credit project and the release of reserves for previously uncertain tax positions. Net income during the quarter ended December 31, 2015 was negatively impacted by a $1.4 million long-lived asset impairment charge related to Solutech and $1.2 million of a discrete income tax charges related to changes in state tax legislation. During the quarter ended December 31, 2015, the Company identified an error in its income tax expense related to a state tax credit carryforward that resulted in the overstatement of net income by $0.4 million for the quarter ended September 30, 2015. The correction of this error was recorded during the quarter ended December 31, 2015 and reduced net income by $0.4 million, or $0.02 per share. The Company evaluated the impact of the error and determined it to be immaterial to both the third and fourth quarters of 2015.
Gross profit during the quarters ended March 31, 2014, June 30, 2014, and September 30, 2014 were negatively impacted by purchase accounting adjustments of $1.3 million, $0.5 million, and $0.2 million, respectively, related to the acquisition of Industrial Filtration. These purchase accounting adjustments reduced net income by $0.9 million, $0.4 million and $0.2 million during the quarters ended March 31, 2014, June 30, 2014 and September 30, 2014, respectively. (See Note 2)
Net income during the quarter ended March 31, 2014 was negatively impacted by $2.2 million of transaction related costs due to the acquisition of Industrial Filtration. Net income during the quarter ended June 30, 2014 was negatively impacted by a $2.0 million sales commission settlement within the T/A Metals segment. Net income during the quarter ended September 30, 2014, was negatively impacted by $3.0 million, related to a non-cash pension plan settlement charge associated with the Company's domestic defined benefit pension plan. (See Note 8)
15. Recently Issued Accounting Standards
In July 2015, the Financial Accounting Standards Board ("FASB") issued Accounting Standards Update ("ASU") No. 2015-11, “Inventory" (Topic 330): Simplifying the Measurement of Inventory." This ASU requires an entity to measure inventory at the lower of cost and net realizable value. Net realizable value is the estimated selling prices in the ordinary course of business, less reasonably predictable costs of completion, disposal, and transportation. Subsequent measurement is unchanged for inventory measured using last-in, first-out (“LIFO”) or the retail inventory method. This ASU is effective for fiscal years beginning after December 15, 2016. Early adoption is permitted. This ASU is not expected to have an impact on the Company’s consolidated financial statements and disclosures.
F-32
In May 2014, the FASB issued ASU No. 2014-09, “Revenue from Contracts with Customers” (Topic 606). This ASU provides guidance for revenue recognition and affects any entity that either enters into contracts with customers to transfer goods or services or enters into contracts for the transfer of nonfinancial assets and supersedes the revenue recognition requirements in Topic 605, “Revenue Recognition,” and most industry specific guidance. The standard’s core principle is the recognition of revenue when a company transfers promised goods or services to customers in an amount that reflects the consideration to which the company expects to be entitled in exchange for those goods or services. In doing so, companies will need to use more judgment and make more estimates than under the current guidance. These may include identifying performance obligations in the contract, estimating the amount of variable consideration to include in the transaction price and allocating the transaction price to each separate performance obligation. In August 2015, the FASB issued ASU 2015-14, "Revenue from Contracts with Customers (Topic 606): Deferral of the Effective Date", which deferred the effective date of ASU 2014-09 to fiscal years beginning after December 15, 2017, including interim reporting periods within that reporting period. Early adoption is permitted for fiscal years beginning after December 15, 2016. The Company is currently evaluating the method and impact the adoption of ASU 2014-09 will have on the Company’s consolidated financial statements and disclosures.
In November 2015, the FASB issued ASU No. 2015-17, "Income Taxes" (Topic 740): Balance Sheet Classification of Deferred Taxes". This ASU requires an entity to classify all deferred tax assets and liabilities, along with any related valuation allowance, as noncurrent on the balance sheet. The current requirement that deferred tax liabilities and assets of a tax-paying component of an entity be offset and presented as a single amount is not affected by the amendments in this ASU. This ASU is effective for fiscal years beginning after December 15, 2016. Early adoption is permitted. The Company is currently evaluating the method and impact the adoption of ASU 2015-17 will have on the Company’s consolidated financial statements and disclosures.
In January 2016, the FASB issued ASU No. 2016-01, "Financial Instruments - Overall" (Subtopic 825-10): Recognition and Measurement of Financial Assets and Financial Liabilities". This ASU revises an entity’s accounting related to (1) the classification and measurement of investments in equity securities and (2) the presentation of certain fair value changes for financial liabilities measured at fair value. It also amends certain disclosure requirements associated with the fair value of financial instruments. This ASU is effective for fiscal years beginning after December 15, 2017. This ASU is not expected to have a material impact on the Company’s consolidated financial statements and disclosures.
F-33
16. Changes in Accumulated Other Comprehensive Income (Loss)
The following table discloses the changes by classification within accumulated other comprehensive income (loss) for the period ended December 31, 2015, 2014 and 2013:
In thousands | Foreign Currency Translation Adjustment | Defined Benefit Pension Adjustment | Total Accumulated Other Comprehensive (Loss) Income | ||||||||
Balance at December 31, 2012 | $ | 3,178 | $ | (21,544 | ) | $ | (18,366 | ) | |||
Other Comprehensive income | 2,950 | 5,909 | (a) | 8,859 | |||||||
Amounts reclassified from accumulated other comprehensive loss | — | 663 | (b) | 663 | |||||||
Balance at December 31, 2013 | $ | 6,128 | $ | (14,972 | ) | $ | (8,844 | ) | |||
Other Comprehensive loss | (12,714 | ) | (6,099 | ) | (a) | (18,813 | ) | ||||
Amounts reclassified from accumulated other comprehensive loss | — | 3,496 | (b) | 3,496 | |||||||
Balance at December 31, 2014 | $ | (6,586 | ) | $ | (17,575 | ) | $ | (24,161 | ) | ||
Other Comprehensive loss | (10,334 | ) | (637 | ) | (a) | (10,971 | ) | ||||
Amounts reclassified from accumulated other comprehensive loss | 547 | (b) | 547 | ||||||||
Balance at December 31, 2015 | $ | (16,920 | ) | $ | (17,665 | ) | $ | (34,585 | ) | ||
(a) Amount represents actuarial (losses) gains arising from the Company’s postretirement benefit obligation. This amount was $(0.6) million, net of $0.4 million tax benefit, for 2015, $(6.1) million, net of a $3.7 million tax benefit, for 2014 and $5.9 million, net of $3.6 million tax expense in 2013. (See Note 8)
(b) Amount represents the amortization of actuarial losses to pension expense arising from the Company’s postretirement benefit obligation. This amount was $0.5 million, net of $0.3 million tax benefit in 2015, $3.5 million, net of $2.1 million tax benefit, which included $3.0 million, net of $1.9 million tax benefit for pension settlement costs in 2014, and $0.7 million, net of $0.4 million tax benefit in 2013. (See Note 8)
F-34
Schedule II
LYDALL, INC.
VALUATION AND QUALIFYING ACCOUNTS
FOR THE YEARS ENDED December 31, 2015, 2014 AND 2013
In thousands | Balance at January 1, | Charges to Costs and Expenses | Charges (Deductions) to Other Accounts | Deductions | Balance at December 31, | ||||||||||||||||
2015 | |||||||||||||||||||||
Allowance for doubtful receivables | $ | 709 | $ | 855 | $ | (53 | ) | 2 | $ | (260 | ) | 1 | $ | 1,251 | |||||||
Tax valuation allowances | 3,727 | 1,615 | (272 | ) | 2 | (763 | ) | 3 | 4,307 | ||||||||||||
2014 | |||||||||||||||||||||
Allowance for doubtful receivables | $ | 480 | $ | 384 | $ | (39 | ) | 2 | $ | (116 | ) | 1 | $ | 709 | |||||||
Tax valuation allowances | 3,315 | 1,120 | 193 | 2,4 | (901 | ) | 3 | 3,727 | |||||||||||||
2013 | |||||||||||||||||||||
Allowance for doubtful receivables | $ | 469 | $ | 60 | $ | 15 | 2 | $ | (64 | ) | 1 | $ | 480 | ||||||||
Tax valuation allowances | 3,587 | 855 | — | (1,127 | ) | 3 | 3,315 | ||||||||||||||
1. | Uncollected receivables written off and recoveries. |
2. | Foreign currency translation and other adjustments. |
3. | Reduction to income tax expense. |
4. | Adjustments relating to the acquisition of Industrial Filtration. |
S-1