Attached files
Table of Contents
UNITED STATES SECURITIES AND EXCHANGE COMMISSION
WASHINGTON, D.C. 20549
Form 10-K
x ANNUAL REPORT PURSUANT TO SECTION 13 OR 15(d) OF THE SECURITIES EXCHANGE ACT OF 1934
For the Fiscal Year Ended December 31, 2009
OR
¨ TRANSITION REPORT PURSUANT TO SECTION 13 OR 15(d) OF THE SECURITIES EXCHANGE ACT OF 1934
For the transition period from to
Commission File Number: 1-7665

Lydall, Inc.
(Exact name of registrant as specified in its charter)
| Delaware |
06-0865505 | |
| (State or Other Jurisdiction of Incorporation or Organization) |
(I.R.S. Employer Identification No.) | |
| One Colonial Road, Manchester, Connecticut |
06042 | |
| (Address of principal executive offices) |
(Zip code) | |
Registrant’s telephone number, including area code: (860) 646-1233
Securities registered pursuant to Section 12(b) of the Act:
| Title of each class |
Name of each exchange on which registered | |
| Common Stock, $.10 par value |
New York Stock Exchange |
Securities registered pursuant to Section 12(g) of the Act: None
Indicate by check mark if the registrant is a well-known seasoned issuer, as defined in Rule 405 of the Securities Act. Yes ¨ No x
Indicate by check mark if the registrant is not required to file reports pursuant to Section 13 or Section 15(d) of the Exchange Act. Yes ¨ No x
Indicate by check mark whether the registrant (1) has filed all reports required to be filed by Section 13 or 15(d) of the Securities Exchange Act of 1934 during the preceding 12 months (or for such shorter period that the registrant was required to file such reports), and (2) has been subject to such filing requirements for the past 90 days. Yes x No ¨
Indicate by check mark whether the registrant has submitted electronically and posted on its corporate Web site, if any, every Interactive Data File required to be submitted and posted pursuant to Rule 405 of Regulation S-T (§232.405 of this chapter) during the preceding 12 months (or for such shorter period that the registrant was required to submit and post such files). Yes ¨ No ¨
Indicate by check mark if disclosure of delinquent filers pursuant to Item 405 of Regulation S-K (§229.405 of this chapter) is not contained herein, and will not be contained, to the best of the registrant’s knowledge, in definitive proxy or information statements incorporated by reference in Part III of this Form 10-K or any amendment to this Form 10-K. ¨
Indicate by check mark whether the registrant is a large accelerated filer, an accelerated filer, a non-accelerated filer, or a smaller reporting company. See definitions of “large accelerated filer”, “accelerated filer” and “smaller reporting company” in Rule 12b-2 of the Exchange Act.
| Large accelerated filer ¨ |
Accelerated filer x | Non-accelerated filer ¨ |
Smaller reporting company ¨ |
Indicate by check mark whether the registrant is a shell company (as defined in Rule 12b-2 of the Exchange Act). Yes ¨ No x
On June 30, 2009, the aggregate market value of the Registrant’s voting stock held by nonaffiliates was $55,950,000 based on the New York Stock Exchange closing price on that date. For purposes of this calculation, the Registrant has assumed that its directors and executive officers are affiliates.
On February 16, 2010, there were 17,096,422 shares of Common Stock outstanding, exclusive of treasury shares.
DOCUMENTS INCORPORATED BY REFERENCE
Part III incorporates information by reference to the definitive Proxy Statement to be distributed in connection with the Registrant’s Annual Meeting of Stockholders to be held on April 28, 2010.
The exhibit index is located on pages 37-39.
Table of Contents
INDEX TO ANNUAL REPORT ON FORM 10-K
Year Ended December 31, 2009
| Page Number | ||||
| Item 1. |
1 | |||
| Item 1A. |
4 | |||
| Item 1B. |
7 | |||
| Item 2. |
7 | |||
| Item 3. |
8 | |||
| Item 4. |
9 | |||
| 10 | ||||
| Item 5. |
11 | |||
| Item 6. |
14 | |||
| Item 7. |
Management’s Discussion and Analysis of Financial Condition and Results of Operations |
15 | ||
| Item 7A. |
34 | |||
| Item 8. |
34 | |||
| Item 9. |
Changes in and Disagreements With Accountants on Accounting and Financial Disclosure |
34 | ||
| Item 9A. |
35 | |||
| Item 9B. |
35 | |||
| PART III |
||||
| Item 10. |
36 | |||
| Item 11. |
36 | |||
| Item 12. |
Security Ownership of Certain Beneficial Owners and Management and Related Stockholder Matters |
36 | ||
| Item 13. |
Certain Relationships and Related Transactions, and Director Independence |
36 | ||
| Item 14. |
36 | |||
| PART IV |
||||
| Item 15. |
37 | |||
| 40 | ||||
The information called for by Items 10, 11, 12, 13 and 14, to the extent not included in this document, is incorporated herein by reference to such information included in the Company’s definitive Proxy Statement to be filed with the Securities and Exchange Commission and distributed in connection with Lydall, Inc.’s 2010 Annual Meeting of Stockholders to be held on April 28, 2010.
Table of Contents
Lydall, Inc. and its subsidiaries are hereafter collectively referred to as “Lydall,” the “Company” or the “Registrant.”
Lydall, Inc. has been incorporated in Delaware since 1987 after originally being incorporated in Connecticut in 1969. The principal executive offices are located in Manchester, Connecticut. The Company’s subsidiaries design and manufacture specialty engineered filtration media, industrial thermal insulating solutions, automotive thermal and acoustical barriers, temperature-control equipment, medical filtration media and devices and biopharmaceutical processing components for demanding thermal/acoustical, filtration/separation and bio/medical applications.
Lydall serves a number of market niches. The Company’s products are primarily sold directly to customers through an internal sales force and external sales representatives and distributed via common carrier. The majority of products are sold to original equipment manufacturers and tier-one suppliers. The Company competes through high-quality, specialty engineered innovative products and exceptional customer service. Lydall has a number of domestic and foreign competitors for its products, most of whom are either privately owned or divisions of larger companies, making it difficult to determine the Company’s share of the markets served.
Thermal/Acoustical segment sales to the automotive market represented 51% of Lydall’s net sales in 2009, 54% in 2008 and 55% in 2007. Sales to Ford Motor Company were $24.1 million, or approximately 10% of Lydall’s 2009 net sales. Sales to Volkswagen were approximately 10% of net sales in 2008. Sales to Chrysler were approximately 10% of net sales in 2008 and 14% of net sales in 2007. No other single customer accounted for more than 10% of the Company’s net sales in 2009, 2008 and 2007.
Foreign and export sales were 50% of net sales in 2009, 53% in 2008 and 48% in 2007. Export sales primarily to Europe, Asia, Mexico and Canada were $28.8 million, $44.0 million and $47.5 million in 2009, 2008 and 2007, respectively. Foreign sales were $96.3 million, $118.5 million and $105.7 million for the years ended December 31, 2009, 2008 and 2007, respectively. The decrease in export sales during 2009 was primarily related to lower export sales to Canada in the Performance Materials and Thermal/Acoustical segments. The decrease in foreign net sales during 2009 was primarily from the Germany automotive facility, included in the Thermal/Acoustical segment, as well as changes in foreign currency translation rates in 2009 compared to 2008.
Foreign operations generated operating income of $1.6 million, $8.3 million and $11.3 million for the years ended December 31, 2009, 2008 and 2007, respectively. Total foreign assets were $96.5 million at December 31, 2009 compared with $98.6 million at December 31, 2008.
The Company’s Annual Reports on Form 10-K, Quarterly Reports on Form 10-Q, Current Reports on Form 8-K and Proxy Statements are made available free of charge through the Investor Relations section of the Company’s Internet website at www.lydall.com after such material is electronically filed with, or furnished to, the Securities and Exchange Commission (the Commission) and are also available on the Commission’s website at www.sec.gov. Additionally, the public may read and copy any materials the Company files with the Commission at the Commission’s Public Reference room located at 100 F Street, N.E., Washington, D.C. 20549. The public may obtain information on the operation of the Public Reference Room by calling the Commission at 1-800-SEC-0330.
The Company’s Code of Ethics and Business Conduct for all employees and its Code of Ethics for the Chief Executive Officer, Senior Financial Officers and All Accounting and Financial Personnel can be obtained free of charge on the Company’s website under the Corporate Governance section or by contacting the Office of the General Counsel, P.O. Box 151, One Colonial Road, Manchester, CT 06045-0151.
SEGMENTS
The Company’s reportable segments are Performance Materials and Thermal/Acoustical. The Thermal/Acoustical segment reports the results of Lydall’s automotive businesses. The Performance Materials segment reports the results of the filtration and industrial thermal insulation businesses. All other businesses are aggregated in Other Products and Services (OPS).
1
Table of Contents
Performance Materials
The Performance Materials segment includes filtration media solutions for air, fluid power, industrial and life science applications and industrial thermal insulation solutions for building products, appliances, and energy and industrial markets.
Lydall air filtration products include LydAir®MG (Micro-Glass), LydAir®MB (Melt Blown), LydAir®SC (Synthetic Composite) and Arioso™ (Membrane Composite) media. These products constitute the critical media component of clean-air systems for applications in clean-space, commercial, industrial and residential HVAC, power generation, industrial processes and protection/respiratory devices. Lydall has leveraged its extensive technical expertise and applications knowledge into a suite of media products covering the vast liquid filtration landscape across the engine and industrial and life science fields. The LyPore® and activated carbon containing ActiPure® media series address a variety of application needs including hydraulic filters, air-water and air-oil coalescing, industrial fluid processes, diesel filtration, biopharmaceutical pre-filtration and clarification, diagnostic tests, and drinking water filtration. The Company also manufactures Lydall Solupor® specialty microporous membranes that are utilized in various markets and applications including batteries, fuel cells and supercapacitors, air and liquid filtration, and transdermal drug delivery. Solupor® membranes are based on ultra-high molecular weight polyethylene and incorporate an uncommon combination of mechanical strength, chemical inertness, and high porosity in a unique open structure.
The industrial thermal insulation business develops unique high performance nonwoven veils, papers, mats and specialty composites for the building products, appliance, and energy and Industrial markets. The Manniglas® brand is diverse in its product application ranging from high temperature seals and gaskets in ovens and ranges to specialty veils for HVAC and cavity wall insulation. appLY™ Mat has been developed to expand Lydall’s high temperature technology portfolio for broad application into the appliance market and supplements the Lytherm™ product brand, traditionally utilized in the industrial market for kilns and furnaces used in metal processing. Lydall’s CryothermTM, CRS-WrapTM and CryoliteTM products are industry standards for state-of-the-art cryogenic insulation designs used by manufacturers of cryogenic equipment for liquid gas storage, piping, and transportation.
Net sales from the Performance Materials segment represented 39.4% of Lydall’s net sales in 2009 compared with 36.5% in 2008 and 33.8% in 2007. Net sales generated by the international operations of the Performance Materials segment accounted for 29.8%, 27.6% and 27.1% of segment net sales in 2009, 2008 and 2007, respectively.
Thermal/Acoustical
The Thermal/Acoustical segment provides solutions to assist in noise and heat abatement into various global markets. Primary targets are the underbody, under hood and interior areas of cars, trucks, SUVs, heavy duty trucks, buses, military and recreational vehicles. Lydall shields an array of areas from heat (thermal) and sound (acoustical) sources, including areas bordering on fuel tanks, exhaust systems, engine compartments, HVAC, and electrical components. Lydall’s patented products including ZeroClearance®, AMS®, dBCore® and LyTherm® are comprised of organic and inorganic fiber composites as well as metal combinations.
Thermal/Acoustical segment net sales represented 51.3% of the Company’s net sales in 2009, 53.5% in 2008 and 55.3% in 2007. Net sales generated by international operations of the Thermal/Acoustical segment accounted for 51.4%, 52.4% and 42.2% of segment net sales in 2009, 2008 and 2007, respectively.
Other Products and Services
The components of OPS are Lydall’s Vital Fluids business and Affinity® temperature control equipment business (Affinity) business.
The Vital Fluids business serves the life science industry offering specialty products for blood transfusion and cell therapy applications as well as Bio-Pak® single-use bioprocessing containers for containment of media, buffers and bulk intermediates used in biotech, pharmaceutical and diagnostic reagent manufacturing processes. Vital Fluids also offers Cell-Freeze®, a medical device used for cryogenic storage of peripheral blood stem cells. Its medical filter materials products are utilized in traditional blood filtration devices such as cardiotomy reservoirs and autotransfusion filters. Other products include specialty blood transfusion products, as well as medical filtration components used for surgical procedures.
2
Table of Contents
The Affinity business designs and manufactures high precision, specialty engineered temperature-control equipment for demanding semiconductor, pharmaceutical, life sciences and industrial applications.
OPS net sales were 9.6% of the Company’s net sales in 2009 compared with 10.4% in 2008 and 11.4% in 2007. There were no significant sales generated outside of the United States for OPS.
GENERAL BUSINESS INFORMATION
Lydall holds a number of patents, trademarks and licenses. While no single patent, trademark or license is critical to the success of Lydall, together these intangible assets are of considerable value to the Company.
The Company’s business is generally not seasonal; however, results of operations are impacted by shutdowns at its European operations and at its North American and European automotive customers that typically occur in the third and fourth quarters of each year. Also, the Company’s automotive businesses were impacted in 2009 by extended shut-downs at certain customers as they reorganized during bankruptcy proceedings. Lydall maintains levels of inventory and grants credit terms that are normal within the industries it serves. The Company uses a wide range of raw materials in the manufacturing of its products. The majority of raw materials used are generally available from a variety of suppliers.
The Company invested $7.9 million in 2009, $8.5 million in 2008 and $8.5 million in 2007, or approximately 3% of net sales for all years, in research and development to develop new products and to improve existing products. All amounts were expensed as incurred. Most of the investment in research and development is application specific. There were no significant customer-sponsored research and development activities during the past three years.
Lydall’s backlog was $44.9 million at December 31, 2009, $33.8 million at December 31, 2008 and $50.6 million at December 31, 2007. Backlog at January 31, 2010 was $51.8 million. The increase in backlog at December 31, 2009 compared with December 31, 2008 was mainly due to marginal improvement in certain markets served by the Company during the fourth quarter of 2009. There are minimal seasonal aspects to Lydall’s backlog as of the end of the Company’s fiscal years.
No material portion of Lydall’s business is subject to renegotiation of profits or termination of contracts or subcontracts at the election of any governmental body.
Lydall believes that its plants and equipment are in substantial compliance with applicable federal, state and local provisions that have been enacted or adopted regulating the discharge of materials into the environment, or otherwise relating to the protection of the environment.
As of December 31, 2009, Lydall employed approximately 1,200 people. Four unions with contracts expiring on March 31, 2012 represent approximately 60 employees in the United States. All employees at the facilities in France and The Netherlands are covered under a National Collective Bargaining Agreement. Certain salaried and all hourly employees in Germany are also covered under a National Collective Bargaining Agreement. Lydall considers its employee relationships to be satisfactory and did not have any actual or threatened work stoppages due to union-related activities in 2009.
There are no significant anticipated operating risks related to foreign investment law, expropriation, or availability of material, labor or energy. The foreign and domestic operations limit foreign currency exchange transaction risk by completing transactions in functional currencies whenever practical or through the use of foreign currency forward exchange contracts when deemed appropriate.
3
Table of Contents
The Company’s financial condition, operating results and cash flows can be impacted by a number of factors, including, but not limited to those described below, any one of which could cause the Company’s actual results to vary materially from recent results or from Lydall’s anticipated future results.
Worldwide Economic Cycles – The Company’s 2009 operating results were negatively impacted by a global economic recession and economic uncertainties. Among other factors, disruptions in the global credit and financial markets, including diminished liquidity and credit availability, declines in consumer confidence and spending, declines in economic growth and increases in unemployment rates have caused economic instability. Worldwide economic cycles, and the effects on the markets in which the Company operates, are difficult to predict. These economic uncertainties affect the Company’s businesses in a number of ways, including the results of operations and liquidity, as well as making it difficult to accurately forecast and plan Lydall’s future business activities. The Company is unable to predict the timing and how the financial results will be impacted as the markets served begin to improve.
Doing Business in the North American and European Automotive Markets – The Company’s Thermal/Acoustical segment accounted for approximately 51% of the Company’s total net sales in 2009. Thermal/Acoustical segment net sales were to the automotive market, of which approximately 49% were to the North American market and 51% to the European market. The automotive products are thermal and acoustical barriers employed both inside and under the body of vehicles. During 2009, North American and European automakers significantly reduced their production of automobiles compared to levels in prior years due to the economic recession and reduced consumer demand for automobiles. Among other factors, the Company’s automotive business could be impacted by:
| • | A further reduction in or dramatic fluctuation of consumer demand for automobiles, further financial difficulties faced by automakers and other automotive customers, including post-bankruptcy financial difficulties for Chrysler and General Motors, labor unrest and supply chain disruptions in the automotive industry. |
| • | The failure of an automaker to timely, or ever, pay the Company amounts owed especially since receivables from automakers often comprise a material portion of overall account receivables. |
| • | Consolidation among automotive parts suppliers and customers impacting the Company’s ability to compete. |
| • | Dependence on sales from large automotive manufacturers that have substantial bargaining power with respect to price and other commercial terms. In the event these customers are able to impose price reductions on Lydall’s products, there can be no assurance that the Company will be able to offset such reduction by commensurate reductions in the Company’s costs. |
| • | The Company’s prices may be “market tested” by its automotive customers as a way for those automotive customers to ensure global competitiveness. This “market testing” of products can put the Company in the position of either reducing prices prospectively on some parts, possibly resulting in reduced gross margin on the affected parts, or hold on pricing and risk the loss of business from the automotive customer. |
| • | The Company could also be negatively impacted by certain automotive customers electing to source a bigger portion of their automotive parts from lower cost countries. |
| • | The Company’s ability to establish a position with Asian automotive manufacturers in North America. |
Quarterly Results – The Company’s quarterly results are subject to significant fluctuations. Operating results may fluctuate as a result of many factors, including size and timing of orders and shipments, loss of significant customers, product mix, technological change, fluctuations in manufacturing yields, competition and general economic conditions. In addition, the extent that revenue and asset utilization increase or decrease, the absorption of the Company’s fixed costs will positively or negatively impact gross margins.
Accounting Estimates – Estimates and assumptions may affect the reserves that the Company has established to cover uncollectible accounts receivable, excess or obsolete inventory, fair market value write downs of certain assets, and various liabilities, and actual results could differ from those estimates.
Debt Covenants and Financing – The Company’s domestic credit facility contains a number of affirmative and negative covenants, including financial covenants. If the Company is not able to satisfy covenants and other obligations under the facility, then the Company’s ability to borrow funds from the facility could be restricted or not available. Moreover, the Company may not be able to obtain additional financing from other sources.
4
Table of Contents
Raw Material Pricing and Supply – Raw material pricing and supply issues affect all of the Company’s businesses and can influence results in the future. The Thermal/Acoustical segment uses aluminum and other metals to manufacture most automotive heat shields. The Thermal/Acoustical and Performance Materials segments use various fibers in manufacturing its products. If the prices of these raw materials increase, the Company may not have the ability to pass incremental cost increases on to its customers, thus negatively impacting Lydall’s financial results. In addition, an interruption in the ability of the Company to source these materials could negatively impact operations and sales.
Energy Pricing – Increases in energy pricing can affect each of the Company’s businesses and can influence results in the future. Higher energy costs at the Company’s manufacturing plants or higher energy costs passed on from the Company’s vendors could impact each businesses profitability.
International Operations – The Company believes that in order to be competitive and grow its businesses, it needs to maintain significant international operations. Foreign sales were $96.3 million, $118.5 million and $105.7 million in 2009, 2008 and 2007, respectively. Operations outside the United States are subject to inherent risks, including political and economic conditions in various countries, unexpected changes in regulatory requirements, longer accounts receivable collection cycles and potentially adverse tax consequences. These factors may have a material adverse effect on the Company’s ability to generate sales outside the United States and, consequently, on its business and results of operations.
The Company is subject to exchange rate fluctuations that are beyond its control. The Company has sales and manufacturing activities in foreign countries. The Company’s primary currency exposure is to the Euro, and to a lesser degree, the Japanese Yen and the British Pound Sterling. The Company’s foreign and domestic operations limit foreign currency exchange transaction risk by completing transactions in functional currencies whenever practical or through the use of foreign currency forward exchange contracts when deemed appropriate. If the Company is not able to successfully hedge its currency exposure, changes in the rate of exchange between these foreign currencies and the U.S. dollar may negatively impact the Company’s results of operations and cash flow. Also, the Company receives a material portion of its revenue from its foreign operations. For each reporting period, the Company translates the results of operations and financial condition of its foreign operations into U.S. dollars. Therefore, the Company’s reported results of operations and financial condition are subject to changes in the exchange relationship between the U.S. dollar and any applicable foreign currency. Such changes affect the Company’s results of operations and assets and liabilities as reported in its financial statements.
New Product Introductions – Improved performance and growth is partially dependent on new product introductions planned for the future. The timing and degree of success of new product programs could materially impact the Company’s future results.
Product Performance – In the event that the Company’s products fail to perform as expected, the Company may be subject to warranty claims from its customers. If such failure results in, or is alleged to result in, bodily injury and/or property damage or other losses, the Company may be subject to product liability lawsuits, product recalls and other claims. These types of claims could have a material impact on results of operations and cash flows should insurance not cover such claims or be an insufficient amount to cover such claims.
Company Size – The industries in which Lydall sells its products are highly competitive and many of the competitors are affiliated with entities which are substantially larger and which have greater financial, technical and marketing resources than the Company possesses. Because of the Company’s size and product mix, Lydall may not be able to capitalize on changes in technology, competition and pricing as fully as its competitors.
Strategic Initiatives – As part of Lydall’s business strategy, the Company continues to review various strategic and business opportunities to grow the business and also reviews its existing businesses to determine whether any of them should be modified or otherwise restructured. In addition, the Company continually explores its core markets for suitable strategic acquisitions, joint ventures, alliances and licensing agreements to supplement growth. Acquisitions place significant demands on the Company’s administrative, operational and financial personnel and systems. Managing acquired operations entails numerous operational and financial risks, including difficulties in the assimilation of acquired operations, diversion of management’s attention from other business concerns, managing assets in multiple geographic regions and potential loss of key employees and key customers of acquired operations. The Company cannot predict with certainty whether any recent or future strategic transactions will be beneficial to the Company.
Restructurings and Cost Reduction Activities – During 2009, the Company implemented workforce reductions and other cost reduction activities at certain businesses to address the slow-down in the markets for their products, including the completion of
5
Table of Contents
the consolidation of the North American automotive operations resulting in the closing of its St. Johnsbury, VT facility. The Company expects this consolidation to lower its operating costs and increase its manufacturing efficiencies. However, the Company cannot assure that as production levels increase this action will not result in unforeseen costs, disruptions in its operations, or other negative events that could result in failing to realize the projected benefits of the consolidation.
Attracting and Retaining Key Employees – The Company’s success, in part, depends on key managerial, engineering, sales and marketing and technical personnel, as well as its ability to continue to attract and retain additional personnel. The loss of certain key personnel could have a material, adverse effect upon the Company’s business and results of operations. There can be no assurance that Lydall can retain its key employees, or that it can attract similar additional employees in the future.
Lean Six Sigma Initiatives – The Company has implemented a Lean Six Sigma program which is aimed at improving processes and work flow, reducing costs and leveraging synergies across the Company to improve operating margins. There can be no assurance that future Lean Six Sigma initiatives will result in improved operating margins.
Environmental Laws and Regulations – The Company is subject to federal, state, local and foreign environmental, and health and safety laws and regulations that affect ongoing operations. In order to maintain compliance with such requirements, Lydall may incur increased capital costs and operating expenses. In addition, new laws and regulations, including legislation and regulation regarding climate change, discovery of previously unknown contamination, or the imposition of new clean-up requirements could require the Company to incur costs or become subject to new or increased liabilities that could have a material impact on results of operations and cash flows.
Intellectual Property – Lydall owns intellectual property, including patents and trademarks, that plays an important role in helping the Company to maintain its competitive position in a number of markets. Changes in the intellectual property landscape of markets in which the Company competes, and the potential assertion of intellectual property-related claims against Lydall, could materially impact the Company. Lydall’s results of operations could also be adversely impacted if the Company does not maximize or successfully assert its intellectual property rights. In addition, significant technological developments by others also could materially and adversely affect the Company’s business and results of operations and financial condition.
Legal Proceedings – The Company is involved in legal proceedings that, from time to time, are significant. These proceedings may include, without limitation, commercial or contractual disputes, intellectual property matters, personal injury claims and employment matters. No assurances can be given that such proceedings and claims will not have a material adverse impact on the Company’s results of operations and cash flows.
Tax Rate Changes – Changes in tax law and rates, changes in rules related to accounting for income taxes, or adverse outcomes from tax audits that regularly are in process in any of the jurisdictions in which the Company operates could also have a significant impact on the Company’s overall effective rate in future periods. In addition, certain jurisdictions have statutory rates greater than or less than the United States statutory rate. As such, changes in the mix and source of earnings between jurisdictions could have a significant impact on the overall effective tax rate in future periods.
Disruptions to the Company’s Operations – The capacity, reliability and security of the Company’s information technology hardware and software infrastructure and the ability to expand and update this infrastructure in response to the Company’s changing needs are important to the operation of the businesses. Any failure or inadequacy in the information technology infrastructure could harm Lydall’s businesses and negatively impact results of operations and cash flows.
Also, a major disruption such as acts of war, terrorist attacks, and the threat of domestic and international terrorist attacks, a natural disaster, global warming, a fire, or labor strikes and work stoppages at any of the Company’s facilities could result in a prolonged interruption of its business. Certain employees in the United States and Germany and all employees in France and The Netherlands are organized and covered by one or more collective bargaining agreements. Widespread work stoppages or a major disruption could have a direct negative impact on the Company’s ability to conduct business, continue production, and on its operating results.
6
Table of Contents
Item 1B. UNRESOLVED STAFF COMMENTS
None
The principal properties of the Company as of December 31, 2009 are situated at the following locations and have the following characteristics:
| Location | Primary Business Segment/General Description | Type of Interest | ||
| Hamptonville, North Carolina |
Thermal/Acoustical – Product Manufacturing |
Owned | ||
| St. Johnsbury, Vermont |
Thermal/Acoustical – Formerly Product Manufacturing |
Leased | ||
| Meinerzhagen, Germany |
Thermal/Acoustical – Product Manufacturing |
Owned | ||
| Saint-Nazaire, France |
Thermal/Acoustical – Product Manufacturing |
Leased | ||
| Green Island, New York |
Performance Materials – Specialty Media Manufacturing |
Owned | ||
| Rochester, New Hampshire |
Performance Materials – Specialty Media Manufacturing |
Owned | ||
| Saint-Rivalain, France |
Performance Materials – Specialty Media Manufacturing |
Owned | ||
| Geleen, The Netherlands |
Performance Materials – Specialty Media Manufacturing |
Leased | ||
| Heerlen, The Netherlands |
Performance Materials – Specialty Media Manufacturing |
Leased | ||
| Winston-Salem, North Carolina |
Other Products and Services – Biomedical Products Manufacturing |
Leased | ||
| Ossipee, New Hampshire |
Other Products and Services – Product Manufacturing |
Owned | ||
| Manchester, Connecticut |
Corporate Office |
Owned |
For information regarding lease obligations, see Note 16 to the Consolidated Financial Statements. Lydall considers its properties to be in good operating condition and suitable and adequate for its present needs. Except for the Company’s St. Johnsbury, VT facility, all properties are being appropriately utilized consistent with experience and demand for the Company’s products. During the second quarter of 2009, the Company completed the consolidation of its St. Johnsbury, VT manufacturing facility into its Hamptonville, NC facility. During the fourth quarter of 2009, the Company ceased operations at the St. Johnsbury, VT facility. As a result, the Company estimated the fair value of the remaining lease payments expected to occur through the third quarter of 2011 and recorded a lease termination charge of $0.7 million in the fourth quarter of 2009. In addition to the properties listed above, the Company has several additional leases for sales offices and warehouses in the United States, Europe and Asia.
7
Table of Contents
A former employee filed suit against Lydall on January 25, 2008, in the Connecticut Superior Court in Hartford, Connecticut, alleging that Lydall breached his employment and stock option agreements and asserting that he is entitled to severance and other benefits pursuant to his employment agreement. He also claimed damages due to alleged harm to his reputation. The initial complaint was subsequently amended to allege violations of the Connecticut Unfair Trade Practices Act (CUTPA) and the Employee Retirement Income Security Act of 1974 (ERISA), as well as the spoliation of evidence. On May 4, 2009, the plaintiff filed a Motion for Default alleging that Lydall repeatedly failed to comply with its discovery obligations and intentionally destroyed records. Lydall filed an objection to the Motion for Default. Although Lydall has objected to it, the Court has not ruled on the Motion for Default. On September 3, 2009, the plaintiff filed a Motion to Cite In Lydall’s former General Counsel as an additional named defendant alleging the deliberate and intentional spoliation of evidence. The Motion to Cite In was granted by the Court on October 7, 2009, and Lydall’s former General Counsel has been added as a party to the action. Lydall filed a Motion to Strike the CUTPA claim on June 24, 2009, and this motion was granted on October 7, 2009. Lydall filed a Motion for Summary Judgment on August 28, 2009, asking the court to dismiss the plaintiff’s case on the basis that he did not file his employment claim prior to the expiration of the one-year statute of limitations set forth in his employment agreement. The Court has not ruled on the Summary Judgment Motion. The plaintiff filed a Fourth Amended Complaint against Lydall and Lydall’s former General Counsel on November 10, 2009, in which the plaintiff asserted causes of action against Lydall for breach of his employment agreement and stock option agreements, violations of ERISA, and spoliation of evidence. The plaintiff also asserted causes of action for spoliation against Lydall’s former General Counsel in that complaint. The Fourth Amended Complaint does not allege a violation of CUTPA. Lydall filed an Answer on January 11, 2010, denying plaintiff’s substantive allegations. Lydall’s Answer contains Special Defenses. Lydall’s former General Counsel also filed an Answer to the Fourth Amended Complaint on January 11, 2010, denying plaintiff’s substantive allegations. Her Answer also contains Special Defenses. In response to a request from Lydall’s former General Counsel for Advancement and Indemnification of legal fees and expenses in connection with this action, Lydall informed its former General Counsel that she is entitled to advancement but that her request for indemnification is premature. The case is currently in the discovery phase and trial is scheduled for January 2012.
On January 29, 2010, the plaintiff filed a Verified Complaint for Advancement and Indemnification in the Delaware Chancery Court seeking advancement of legal fees and expenses he alleges he has incurred in connection with the above-described action and seeking indemnification. The plaintiff is also seeking interest on those amounts. In response to an earlier request from the plaintiff for advancement and indemnification of legal fees and expenses in connection with the above-described action, Lydall had informed him that his Indemnification Agreement with Lydall, Lydall’s Restated Certificate of Incorporation, and Section 145 of the Delaware General Corporation Law do not entitle him to advancement of legal fees and expenses in connection with the above-described action and that his request for indemnification was premature. Lydall’s response to the Verified Complaint for Advancement and Indemnification must be filed with the Chancery Court on or by February 25, 2010.
A suit was filed against a Lydall subsidiary on March 31, 2005, in the Vermont Superior Court by a safety equipment supplier, by and through its alleged assignee, with respect to personal injuries allegedly suffered by the alleged assignee – a non-employee temporary worker. The plaintiff alleges that the Company removed safety equipment that would have prevented the injury. The Vermont Superior Court granted two motions for partial summary judgment filed by Lydall. In December 2007, the plaintiff appealed to the Vermont Supreme Court. The Vermont Supreme court issued an order on September 4, 2009, overturning the lower Court’s grant of summary judgment in the Company’s favor and remanding the case back to the Superior Court for further proceedings. Discovery is ongoing and the Superior Court has instructed the parties to be ready for trial on March 1, 2011.
The Company believes that it has meritorious defenses against each of the above claims and intends to contest them vigorously. While it is not possible to predict or determine the outcomes of the claims or to provide possible ranges of losses that may arise, the Company believes the losses associated with all of these actions will not have a material adverse effect on the Company’s consolidated financial position or liquidity, but could possibly be material to its consolidated results of operations of any one period. As of December 31, 2009, there were no reserves recorded by the Company related to these claims because Lydall believes such claims are without merit.
By letter dated June 13, 2006, Lydall notified a competitor of its potential infringement of one of the Company’s patent protected product lines and advised the company to cease production of its product. On January 24, 2007, the competitor filed a patent declaratory action in Federal Court. Subsequently, the Company filed a patent infringement action on June 8, 2007. The Court held a hearing on May 28, 2008, on the construction of the primary claim of the patent. The Court’s ruling on construction of the claim was not favorable to Lydall. On November 19, 2008, a stipulated order was issued whereby the Company and the competitor agreed to enter judgment in favor of the competitor, which allowed the Company to appeal the Court’s construction ruling. On
8
Table of Contents
December 12, 2008, Lydall filed a Notice of Appeal in the United States Court of Appeals. The Court issued its opinion on September 8, 2009, denying the Company’s appeal. Lydall has not pursued further appeals. The Company expects that certain of Thermal/Acoustical products could be subject to increased competition.
In addition, Lydall is subject to legal proceedings, claims and investigations that arise in the ordinary course of business such as, but not limited to, patent, employment, commercial and environmental matters. Although there can be no assurance, there are no such matters pending that are expected to be material with respect to the Company’s business, results of operations or cash flows.
See Note 16 in the Consolidated Financial Statements for discussion of other contingencies and environmental matters.
Item 4. SUBMISSION OF MATTERS TO A VOTE OF SECURITY HOLDERS
There were no matters submitted to a vote of security holders during the fourth quarter of 2009.
9
Table of Contents
EXECUTIVE OFFICERS OF THE REGISTRANT
The executive officers of Lydall, Inc. or its subsidiaries, together with the offices presently held by them, their business experience since January 1, 2005, and their age as of March 1, 2010, the record date of the Company’s 2010 Annual Meeting, are as follows:
| Name | Age | Title | Other Business Experience Since 2005 | |||
| Dale G. Barnhart |
57 | President, Chief Executive Officer and Director | Chief Executive Officer, Synventive Molding Solutions (until August 2007) | |||
| Erika H. Turner |
54 | Vice President, Chief Financial Officer and Treasurer | Chief Financial Officer, Superior Industries International (February 2008 – November 2009); Chief Financial Officer and Vice President of Finance, Monogram Systems (until February 2008) | |||
| Mona G. Estey |
55 | Vice President, Human Resources | ||||
| Paul G. Igoe |
47 | Vice President, General Counsel and Secretary | Associate General Counsel and Assistant Corporate Secretary, Teradyne, Inc. (until September 2009) | |||
| Peter M. Kurto |
44 | Vice President, Business Development and Investor Relations | Global Marketing Director, Imerys – Filtration Division (August 2006 – September 2008); Intermediates Business Leader, General Electric Co. – Plastics Division (until August 2006) | |||
| Joseph K. Wilsted |
54 | President, Lydall Thermal/Acoustical, Inc., Global Automotive | Senior Vice President Finance and Administration, FormTech Industries LLC (April 2007 – May 2008); Senior Vice President and CFO (January 2006 – March 2007) and Senior Vice President of Operations and Corporate Development (October 2005 – January 2006), The Greenbrier Companies, Inc.; Vice President of Finance and CFO, Bobcat Company (Ingersoll Rand Corporation) (until October 2005) | |||
| Peter V. Ferris |
50 | President, Charter Medical, Ltd.; President, Lydall Industrial Thermal Solutions, Inc; | Vice President of Strategic Marketing and Vice President of Corporate Marketing, Tyco International, Ltd. (until October 2006) | |||
| Kevin T. Longe |
50 | President, Lydall Filtration/Separation, Inc.; President, Lydall Thermal/ Acoustical, Inc., Green Island | ||||
| James V. Laughlan |
37 | Principal Accounting Officer and Controller |
Controller, Top-Flite Golf Company (until October 2005) | |||
10
Table of Contents
Item 5. MARKET FOR REGISTRANT’S COMMON EQUITY, RELATED STOCKHOLDER MATTERS AND ISSUER PURCHASES OF EQUITY SECURITIES
PRICE RANGE OF COMMON STOCK AND DIVIDEND HISTORY
The Company’s Common Stock is traded on the New York Stock Exchange (NYSE) under the symbol LDL. Shares totaling 22,062,283 and 31,124,678 were traded during 2009 and 2008, respectively. The table below shows the range of reported sale prices on the NYSE Composite Tape for the Company’s Common Stock for the periods indicated. As of February 16, 2010, 3,859 stockholders of record held 17,096,422 shares of Lydall’s Common Stock, $.10 par value.
| High | Low | Close | |||||||
| 2009 |
|||||||||
| First Quarter |
$ | 6.07 | $ | 1.93 | $ | 2.97 | |||
| Second Quarter |
4.67 | 2.83 | 3.40 | ||||||
| Third Quarter |
6.00 | 2.82 | 5.26 | ||||||
| Fourth Quarter |
6.54 | 4.45 | 5.21 | ||||||
| 2008 |
|||||||||
| First Quarter |
$ | 11.66 | $ | 8.32 | $ | 11.45 | |||
| Second Quarter |
15.82 | 10.45 | 12.55 | ||||||
| Third Quarter |
16.45 | 8.95 | 9.63 | ||||||
| Fourth Quarter |
9.94 | 2.82 | 5.75 | ||||||
The Company does not pay a cash dividend on its Common Stock, and the Company’s domestic credit facility entered into on March 11, 2009 prohibits the payment of a cash dividend.
The following table provides information about the Company’s Common Stock that may be issued upon exercise of options and rights under all of the Company’s existing equity compensation plans at December 31, 2009. The number of securities remaining available for issuance at December 31, 2009 was 673,451 and includes 369,121 shares that may be issued as restricted stock, performance shares and other stock awards.
| Plan Category | Number of securities to be issued upon exercise of outstanding options, warrants and rights (a) |
Weighted average exercise price of outstanding options, warrants and rights (b) |
Number of securities remaining available for issuance under equity compensation plans (excluding securities reflected in column a) (c) | ||||
| Equity compensation plans approved by security holders |
859,668 | $ | 8.77 | 673,451 | |||
11
Table of Contents
ISSUER PURCHASES OF EQUITY SECURITIES
In August 2003, the Company’s Board of Directors approved a Stock Repurchase Program (Repurchase Program) to mitigate the potentially dilutive effects of stock options and shares of restricted and unrestricted stock granted by the Company. Under the Repurchase Program, shares may be purchased by the Company up to the quantity of shares underlying options and other equity-based awards granted after January 1, 2003 under shareholder approved plans. The Company’s domestic credit facility generally prohibits the Company’s ability to repurchase common stock of the Company, subject to certain stated exceptions.
Should the Company have the ability to engage in repurchase activity in the future, the Company would take advantage of the safe harbor protections afforded by Rule 10b-18 promulgated under the Exchange Act, to engage in future repurchase activity in accordance with the provisions of the Exchange Act. As of December 31, 2009, there were 1,929,456 shares remaining available for purchase under the Repurchase Program. There was no repurchase activity under the Repurchase Program during 2009. Shares acquired by the Company during the quarter ended December 31, 2009 represent shares withheld by the Company pursuant to provisions in agreements with recipients of restricted stock granted under the Company’s equity compensation plans requiring the Company to withhold the number of shares having fair value equal to each recipient’s tax withholding due. The following table details the activity for the fourth quarter ended December 31, 2009.
| Period | Total Number of Shares Purchased |
Average Price per Share |
Total Number of Shares |
Maximum Number of | |||||
| Activity October 1, 2009 - October 31, 2009 |
1,568 | $ | 5.00 | — | 1,492,671 | ||||
| Activity November 1, 2009 - November 30, 2009 |
2,203 | $ | 5.21 | — | 1,522,171 | ||||
| Activity December 1, 2009 - December 31, 2009 |
15,127 | $ | 5.65 | — | 1,929,456 | ||||
| Total |
18,898 | $ | 5.54 | — | 1,929,456 | ||||
Unregistered Sales of Equity Securities and Use of Proceeds
Lydall sponsored an Employee Stock Purchase Plan (the Plan) that provided a method by which participating employees may use voluntary, systematic payroll deductions to purchase shares of Company stock in open-market purchase transactions effectuated by a broker. The Plan included a Company matching contribution feature, pursuant to which the Company contributed an amount equal to 33 and 1/3 cents for each dollar contributed by a participating employee, up to a maximum of $150 per month. The broker accumulated the contributions and purchased shares of Company stock for participants in open market transactions on a monthly basis. The Company received no proceeds from the transactions. Nevertheless, because the Plan included a matching contribution feature, the Company may have been required to register the transactions under the Securities Act of 1933, and for many years, the Company prepared and filed appropriate registration statements on Form S-8. In connection with the preparation and filing of this report on Form 10-K, the Company concluded that a new registration statement should have been filed with respect to the Plan a number of years ago. During the past three years, an aggregate of approximately 150,000 shares of Company stock were acquired by participating employees pursuant to the Plan without having been registered. Because the transactions were not registered, certain Plan participants may have a right to rescind their transactions. Based on Lydall’s current stock price, the Company does not believe that any liability for rescission would be material to the Company’s consolidated financial position, statements of income or cash flows. The Plan has been suspended by the Company.
12
Table of Contents
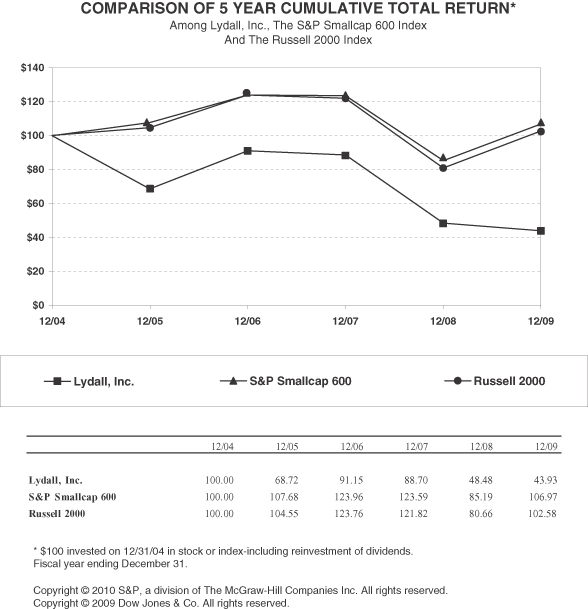
PERFORMANCE GRAPH
The following graph compares the cumulative total return on Lydall’s shares over the past five years with the cumulative total return on shares of companies comprising the Standard & Poor’s SmallCap 600 Index and the Russell 2000 Index. Cumulative total return is measured assuming an initial investment of $100 on December 31, 2004, including reinvestment of dividends. Due to the diversity of niche businesses that the Company participates in, it is difficult to identify a reasonable peer group or one industry or line-of-business index for comparison purposes. Thus, Lydall has chosen to compare its performance to the Standard & Poor’s SmallCap 600 Index and to the Russell 2000 Index.
13
Table of Contents
Item 6. SELECTED FINANCIAL DATA
FIVE-YEAR SUMMARY
| In thousands except per share amounts and ratio data | 2009 | 2008 | 2007 | 2006 | 2005 | |||||||||||||||
| Financial results from continuing operations |
||||||||||||||||||||
| Net sales |
$ | 248,947 | $ | 305,716 | $ | 320,917 | $ | 306,121 | $ | 287,278 | ||||||||||
| (Loss) Income from continuing operations |
(14,158 | ) | (6,088 | ) | 8,558 | 9,094 | 4,471 | |||||||||||||
| Common stock per share data |
||||||||||||||||||||
| Diluted (loss) income from continuing operations |
$ | (.85 | ) | $ | (.37 | ) | $ | .52 | $ | .56 | $ | .28 | ||||||||
| Diluted income from discontinued operations |
$ | — | $ | .06 | $ | .03 | $ | .07 | $ | .06 | ||||||||||
| Cumulative effect of change in accounting principle |
$ | — | $ | — | $ | — | $ | — | $ | (.02 | ) | |||||||||
| Diluted net (loss) income |
$ | (.85 | ) | $ | (.31 | ) | $ | .55 | $ | .63 | $ | .32 | ||||||||
| Financial position |
||||||||||||||||||||
| Total assets |
$ | 224,952 | $ | 235,749 | $ | 258,584 | $ | 241,173 | $ | 248,249 | ||||||||||
| Working capital |
60,810 | 60,466 | 63,506 | 50,610 | 57,705 | |||||||||||||||
| Long-term debt, net of current maturities |
5,220 | 6,699 | 8,377 | 8,914 | 30,256 | |||||||||||||||
| Total stockholders’ equity |
156,808 | 166,145 | 180,453 | 161,217 | 143,229 | |||||||||||||||
| Property, plant and equipment |
||||||||||||||||||||
| Net property, plant and equipment |
$ | 93,884 | $ | 101,889 | $ | 107,332 | $ | 103,469 | $ | 103,458 | ||||||||||
| Capital expenditures |
5,921 | 12,037 | 14,610 | 11,182 | 15,175 | |||||||||||||||
| Depreciation |
14,755 | 15,671 | 15,070 | 15,130 | 15,020 | |||||||||||||||
| Performance and other ratios |
||||||||||||||||||||
| Gross margin |
13.4 | % | 20.6 | % | 22.6 | % | 22.3 | % | 20.7 | % | ||||||||||
| Operating margin |
(7.0 | )% | (3.1 | )% | 4.7 | % | 4.4 | % | 2.1 | % | ||||||||||
| Current ratio |
2.5:1 | 2.7:1 | 2.4:1 | 2.2:1 | 2.4:1 | |||||||||||||||
| Total debt to total capitalization |
4.1 | % | 4.7 | % | 5.2 | % | 5.9 | % | 18.9 | % | ||||||||||
Please read Item 7 (Management’s Discussion and Analysis of Financial Condition and Results of Operations) and the Notes to the Consolidated Financial Statements for specific changes in the Company and the markets that provide context to the above data, including without limitation discussions concerning (i) how global economic uncertainties may affect the Company’s future results; (ii) business combinations and dispositions of business operations that affect the comparability of the data set forth above; and (iii) 2008 impairment charges recorded by the Company associated with goodwill and long-lived assets.
14
Table of Contents
Item 7. MANAGEMENT’S DISCUSSION AND ANALYSIS OF FINANCIAL CONDITION AND RESULTS OF OPERATIONS
CAUTIONARY NOTE CONCERNING FACTORS THAT MAY AFFECT FUTURE RESULTS
This report contains forward-looking statements within the meaning of Section 21E of the Securities Exchange Act of 1934, as amended. In general, any statements contained in this report that are not statements of historical fact may be deemed to be forward-looking statements within the meaning of Section 21E. Investors should be aware that such forward-looking statements are intended to provide management’s current expectations for the future operating and financial performance of the Company based on assumptions believed to be valid at the time. All forward-looking statements involve risks and uncertainties that are difficult to predict. In particular, any statement contained in this Annual Report on Form 10-K, in press releases, written statements or other documents filed with the Securities and Exchange Commission, or in the Company’s communications and discussions with investors and analysts in the normal course of business through meetings, phone calls and conference calls are subject to known and unknown risks, uncertainties and contingencies, many of which are beyond the control of the Company. Without limiting the generality of the foregoing, the words “believes,” “anticipates,” “may,” “plans,” “projects,” “expects,” “estimates,” “forecasts,” “predicts,” “targets,” and other similar expressions are intended to identify forward-looking statements in connection with the discussion of future operating or financial performance. These include, among others, statements relating to:
| • | Overall economic and business conditions and the effects on the markets in which the Company operates |
| • | Future earnings and other measurements of financial performance |
| • | Future cash flow and uses of cash |
| • | Competitive factors in the industries and geographic markets in which the Company competes or may compete |
| • | Significant changes in the North American or European automotive markets |
| • | The cost and availability of raw materials and energy |
| • | Product development and new business opportunities |
| • | Benefits realized from savings and operating efficiency improvements as a result of Lean Six Sigma and operational excellence initiatives |
| • | Estimates of restructuring costs and future savings to the Company |
| • | Future amounts of stock-based compensation expense |
| • | Pension plan assumptions and future expense and funding requirements |
| • | Future levels of indebtedness and capital spending |
| • | The Company’s ability to meet financial covenants in its domestic credit facility |
| • | Future effective income tax rates and realization of deferred tax assets |
| • | The outcome of contingencies |
| • | Future repurchases of the Company’s common stock |
| • | Benefits expected to be realized from recent acquisitions |
| • | Future strategic acquisitions, joint ventures, alliances and licensing agreements |
All forward-looking statements are inherently subject to a number of risks and uncertainties that could cause the actual results of the Company to differ materially from those reflected in forward-looking statements. See Item 1A. Risk Factors for a description of certain identified risks. The occurrence of one or more of these risks, or other unidentified risks, could cause Lydall’s actual results to vary materially from recent results or from the anticipated future results.
Lydall does not undertake to update any forward-looking statement made in this report or that may from time to time be made by or on behalf of the Company.
15
Table of Contents
OVERVIEW AND OUTLOOK
Lydall, Inc. has been incorporated in Delaware since 1987 after originally being incorporated in Connecticut in 1969. The principal executive offices are located in Manchester, CT. The Company’s subsidiaries design and manufacture specialty engineered filtration media, industrial thermal insulating solutions, automotive thermal and acoustical barriers, temperature-control equipment, medical filtration media and devices and biopharmaceutical processing components for demanding thermal/acoustical, filtration/separation and bio/medical applications.
Business Environment Overview
The Company’s 2009 operating results were negatively impacted by a global economic recession and economic uncertainties. Among other factors, disruptions in the global credit and financial markets, including diminished liquidity and credit availability, declines in consumer confidence and spending, declines in economic growth and increases in unemployment rates caused economic instability and significantly lower sales for the Company. Worldwide economic cycles, and the effects on the markets in which the Company operates, are difficult to predict. During the second half of 2009, most of the Company’s businesses experienced marginal improvements in the markets they serve, but the Company is unable to predict the timing and extent to which Lydall’s markets will continue to improve during 2010 and the resulting impact on the Company’s 2010 financial results.
While global economic conditions negatively impacted the Company’s financial results in 2009, the Company took many actions during the year to maintain a strong balance sheet and prepare for the future, including the following:
| • | Managing cash and working capital to improve liquidity. The Company generated $14.1 million in net cash flows from operating activities in 2009, primarily by reducing inventory levels from $40.8 million at December 31, 2008 to $26.6 million at December 31, 2009. Lydall’s cash balance was $22.7 million at December 31, 2009 compared to $13.7 million at December 31, 2008; |
| • | Reducing capital expenditures by $6.1 million in 2009, compared to 2008, while continuing to focus on executing growth strategies and investing in critical product offerings and technologies, including the focus on commercialization of a filtration membrane technology, an investment in needle glass mat equipment and growing the Company’s Vital Fluids bio/medical life science business with a capital investment of $1.6 million in 2009; |
| • | Completing the consolidation of the North American automotive facilities; |
| • | Eliminating costs company-wide through various actions, including reduction in workforce. Overall, selling, product development and administrative expenses were lower by approximately 8% in 2009 compared to 2008; |
| • | Executing a new domestic credit facility in March 2009, that provides the Company with credit availability to fund operations, capital investments and strategic transactions if needed. The Company had no borrowings against the facility at December 31, 2009; |
| • | Continuing Lean Six Sigma and operational excellence initiatives in order to reduce costs, improve performance with customers and leverage synergies across the Company. |
Operational Matters
Performance Materials Segment
The Performance Materials segment is comprised of Lydall’s filtration media solutions for air, fluid power, industrial and life science applications and industrial thermal insulation solutions for building products, appliances, and energy and industrial markets. The Company engages with customers to deliver value-added products for their specific needs to differentiate Lydall’s products from competitors. Lydall’s filtration and industrial thermal insulation businesses are in markets that the Company believes present long-term growth opportunities for Lydall through the introduction of new products, expansion of share in existing markets and penetration of new markets.
Performance Materials net sales represented 39.4% of the Company’s net sales in 2009. Throughout 2009, the filtration and industrial thermal insulation businesses were negatively impacted by global economic conditions resulting in less demand for Lydall’s products compared to 2008. As a result of these conditions, net sales and operating income in 2009 for the Performance Materials segment were $98.0 million and $7.7 million, respectively, compared to net sales and operating income of $111.6 million and $15.5 million, respectively, in 2008.
16
Table of Contents
The Performance Materials businesses experienced marginal improvement in the second half of 2009, compared to the first half of 2009, as net sales improved by approximately 15%. However, net sales in the last half of 2009 still remain below levels prior to the global economic recession. While there has been marginal improvement in certain markets in the last half of 2009, global economic uncertainties continue to affect the markets in which its businesses operate and make the Company’s financial results difficult to predict going into 2010.
In 2010, the segment will continue to focus on commercializing Solupor® membrane technology gained in the Solutech acquisition. The primary focus will be on AriosoTM high performance air filtration composite media. This product line constitutes the media component of advanced clean-air systems for applications in clean-space, commercial, industrial and residential HVAC, power generation, industrial processes, and protection/respiratory devices.
Thermal/Acoustical Segment
The Thermal/Acoustical segment provides solutions to assist in noise and heat abatement in various types of automobiles. Lydall products shield several areas in automobiles from heat (thermal) and sound (acoustical) sources including the underbody, under hood and interior areas.
Segment net sales were $127.8 million, or 51.3%, of the Company’s 2009 net sales, compared to $163.7 million, or 53.5% of Lydall’s 2008 net sales. In 2009, the segment was impacted by significantly less demand for automobiles by consumers in the U.S. and Europe due to the global economic recession and restrictions on available credit for consumer automobile loans. As a result of lower production levels of automobiles, net sales from the Thermal/Acoustical segment were lower by $35.9 million, or 21.9%, in 2009 compared to 2008. According to a published automotive market forecasting service, production in North America and Europe of cars and light trucks in 2009 was lower by approximately 25%, or 8.3 million vehicles, as compared to 2008. In comparison to 2007, production of cars and light trucks in 2009 was lower by approximately 33%, or 12 million vehicles.
Operating loss for the segment in 2009 was $10.1 million compared with an operating loss of $6.1 million in 2008. Operating loss in 2008 was impacted by a goodwill impairment charge of $12.2 million and $1.6 million of restructuring related charges associated with the North American automotive facilities consolidation (NA Auto consolidation) into its Hamptonville, NC operation. In addition to the $35.9 million reduction in net sales in 2009 compared to 2008, the segment results were impacted by restructuring related charges of $5.8 million to complete the NA Auto consolidation. Beginning in the third quarter of 2009, the Company started to benefit from reduced operating costs as a result of the NA Auto consolidation. However, in the fourth quarter of 2009 as the volume of orders from customers increased, the Company incurred incremental ramp-up costs associated with the business transferred from the Company’s Vermont facility. Higher labor costs and other operating costs associated with the performance of certain equipment and tools transferred from Vermont resulted in savings from the consolidation being partially offset by these higher manufacturing costs. The Company expects higher manufacturing costs to persist into the first quarter of 2010, but on an annualized basis, the Company expects to save approximately $3.5 million to $4.0 million in costs as a result of this consolidation.
While overall production of automobiles in the U.S. and Europe was significantly lower in 2009 compared to levels in 2008 and 2007, production of cars and light trucks was higher in the fourth quarter of 2009 compared to the third quarter of 2009 by approximately 11%. This increased production in the fourth quarter contributed to an increase of net sales of automotive parts of $5.3 million, or 19.3%, compared to the third quarter of 2009. While there has been marginal improvement in automobile production in the fourth quarter of 2009, volatile market conditions including dramatic fluctuations in consumer demand for automobiles continue to persist in the automotive market. As a result, global economic uncertainties make the Company’s financial results difficult to predict going into 2010.
In 2010, the segment will also continue the long-term focus on expanding the Company’s position with Asian automotive manufacturers in North America. The Company has been qualified as a supplier to multiple Asian manufacturers, quoted on automotive platforms, received orders and started to ship parts. Other areas of focus for 2010 will include the continued development of thermal/acoustical products for non-automotive applications, including aerospace, appliances and military applications.
Other Products and Services
The components of Other Products and Services (OPS) are Lydall’s Vital Fluids business and Affinity® temperature control equipment business (Affinity) and collectively, OPS net sales represented 9.6% of the Company’s net sales.
17
Table of Contents
The Vital Fluids business, which serves the life science industry, reported net sales of $14.6 million and operating income of $0.2 million in 2009, compared to $16.6 million of net sales and $1.1 million of operating income in 2008. The Company is taking steps to increase its market share in the bioprocessing market. In support of this, the Company is investing approximately $3.2 million, including $1.6 million which was invested in 2009, to increase clean room space capacity and acquire new biodisposable bag manufacturing equipment.
Market conditions in the semiconductor industry continued to negatively impact capital equipment spending by that industry. As a result, Lydall’s Affinity business, which primarily serves the semiconductor industry, reported net sales of $9.2 million and an operating loss of $2.7 million in 2009, compared to net sales of $15.1 million and an operating loss of $7.5 million in 2008. Affinity’s 2008 operating loss included goodwill and long-lived asset impairment charges of $5.2 million.
18
Table of Contents
CONSOLIDATED RESULTS OF OPERATIONS
Net Sales
| (in thousands of dollars) | 2009 | Percent Change |
2008 | Percent Change |
2007 | ||||||||||
| Net sales |
$ | 248,947 | (18.6 | )% | $ | 305,716 | (4.7 | )% | $ | 320,917 | |||||
The decrease in 2009 net sales of $56.8 million, compared with 2008, was primarily the result of lower net sales from the Company’s Thermal/Acoustical segment of $35.9 million, or 21.9%. The Thermal/Acoustical segment is comprised of the Company’s automotive businesses. Lower automotive parts net sales of $36.4 million were partially offset by improved automotive tooling net sales of $0.5 million. Performance Materials’ segment net sales in 2009 decreased by $13.6 million, or 12.2%, compared to 2008, as filtration and industrial thermal insulation product net sales decreased by $4.2 million and $9.4 million, respectively. Net sales of OPS in 2009 decreased by $7.9 million, or 25.0%, compared to 2008, as net sales from the Vital Fluids business decreased by $2.0 million and net sales from the Affinity business decreased by $5.9 million. Foreign currency translation decreased net sales by $4.7 million for the current year, compared with 2008, impacting the Thermal/Acoustical segment by $3.2 million and the Performance Materials segment by $1.5 million.
The decrease in net sales in 2008 of $15.2 million, compared with 2007, was primarily the result of lower net sales from the Thermal/Acoustical segment of $13.7 million, including lower automotive parts net sales of $17.2 million, partially offset by improved automotive tooling net sales of $3.5 million. Also contributing to lower net sales in 2008 was decreased net sales from OPS of $4.9 million. The Vital Fluids business reported increased net sales of $1.9 million in 2008, which was offset by lower net sales from the Company’s Affinity business of $6.8 million. Partially offsetting these decreases were higher Performance Materials segment net sales of $3.0 million in 2008 compared to 2007. Contributing to this increase was higher filtration media net sales of $2.0 million and industrial thermal insulation products of $1.0 million. Foreign currency translation increased net sales by $9.3 million in 2008, compared with 2007, impacting the Thermal/Acoustical segment by $6.8 million and the Performance Materials segment by $2.5 million.
Gross Margin
| (in thousands of dollars) | 2009 | 2008 | 2007 | |||||||||
| Gross margin |
$ | 33,465 | $ | 62,880 | $ | 72,433 | ||||||
| Percentage of sales |
13.4 | % | 20.6 | % | 22.6 | % | ||||||
The decrease in gross margin percentage in 2009 compared to 2008 was primarily caused by lower gross margin percentage from the Thermal/Acoustical segment, and to a lesser extent, from the Performance Materials segment and from OPS, which were all significantly impacted by global economic conditions. A reduction in net sales of $56.8 million, including a decrease in Thermal/Acoustical segment net sales of $35.9 million, resulted in higher per-unit manufacturing costs, as each unit absorbed a greater amount of fixed costs. Also, higher raw material costs in 2009, compared to 2008, contributed to lower gross margin percentage for the Thermal/Acoustical segment. Restructuring related charges of $5.7 million in 2009, associated with the NA Auto consolidation, negatively impacted gross margin percentage by approximately 230 basis points. Partially offsetting the above factors reducing gross margin percentage was savings realized from the Company’s Lean Six Sigma program.
The decrease in gross margin percentage by 200 basis points in 2008 as compared to 2007 was caused by lower gross margin percentage from the Thermal/Acoustical segment. Contributing to this reduction was lower net sales of $13.7 million, which resulted in higher per-unit manufacturing costs due to each unit absorbing a greater amount of fixed costs, as well as increased raw material costs in 2008 as compared to 2007. Also, restructuring related charges of $1.5 million in 2008, associated with the NA Auto consolidation, negatively impacted gross margin percentage by approximately 50 basis points. Gross margin percentage in 2008 for the Performance Materials segment was essentially flat with 2007. OPS gross margin percentage in 2008 was essentially flat with 2007, as improvements in Vital Fluids’ gross margin percentage were offset by reduced gross margin percentage from the Affinity business.
19
Table of Contents
Selling, Product Development and Administrative Expenses
| (in thousands of dollars) | 2009 | 2008 | 2007 | |||||||||
| Selling, product development and administrative expenses |
$ | 50,783 | $ | 54,958 | $ | 57,281 | ||||||
| Percentage of sales |
20.4 | % | 18.0 | % | 17.8 | % | ||||||
Selling, product development and administrative expenses decreased in 2009 by $4.2 million, or $3.5 million when excluding the impact of foreign currency translation, compared to 2008. The inclusion of expenses from the Solutech business, included in the Performance Materials segment and acquired in December 2008, resulted in an additional $2.3 million of selling, product development and administrative expenses in 2009. Including the results of the Solutech business, the overall reduction in selling, product development and administrative expenses in 2009 was primarily due to decreases in salaries and wages expense of $1.1 million, incentive compensation expense of $0.7 million, sales commission expenses of $0.8 million, travel expenses of $0.7 million and bad debt expense of $0.3 million, as well as reductions in other discretionary spending. Partially offsetting these decreases was higher expense of $0.6 million related to the amortization of intangible assets of the Solutech business. Lower salaries and wages expense was due to reductions in workforce from the NA Auto consolidation completed in the first half of 2009, other workforce reduction initiatives, and the December 2008 realignment of management within the Company’s North American and European automotive operations, resulting in lower salaries and wages expense in 2009. Lower incentive compensation expense was due to not meeting targets for the Company’s 2009 bonus plan. Lower sales commission expenses were due to lower net sales in 2009 compared to 2008. Other actions taken to reduce selling, product development and administrative expenses in 2009 compared to 2008 included the suspension of its matching contribution to its sponsored 401(k) plan in May 2009, for all non-union domestic employees. This reduction in expense was essentially offset by an increase in 2009 pension expense of $1.1 million, compared to 2008, related to the Company’s sponsored employee benefit plans. Higher pension expense was primarily impacted by a lower expected rate of return on assets in 2009 compared to 2008, applied to a lower base of assets, and increases in amortization of actuarial losses.
Excluding the impact of foreign currency translation, selling, product development and administrative expenses decreased by $3.3 million, or 5.7%, in 2008 compared to 2007. Contributing to this reduction was lower litigation expense of $1.8 million, recorded primarily in Corporate Office expenses, and lower incentive compensation expense of $1.2 million, as well as reductions in sales commission expense of $0.4 million, employee recruiting and relocation costs of $0.3 million and consulting expenses of $0.4 million. Higher salaries and wages expense of $0.5 million and severance related charges of $0.7 million in 2008, as compared to 2007, partially offset these decreases. Lower litigation expense was primarily related to a matter with a former employee that significantly impacted the Company in 2007. Lower sales commission expense and incentive compensation expense was due to lower sales and profitability in 2008 as compared to 2007. Higher salaries and wages expense was primarily due to annual wage adjustments. Higher severance related charges were primarily related to realigning management within the Company’s North American and European automotive operations by eliminating regional business unit presidents and appointing a global automotive president to better maximize synergies between Lydall’s North American and European automotive operations.
Impairment of Goodwill and Long-Lived Assets
| (in thousands of dollars) | 2009 | 2008 | 2007 | ||||||
| Goodwill impairment |
$ | — | $ | 16,380 | $ | — | |||
| Impairment of long-lived assets |
— | 1,029 | — | ||||||
| Total impairment |
$ | — | $ | 17,409 | $ | — | |||
During the fourth quarter of 2009, the Company performed an annual impairment analysis of the $14.6 million of goodwill in the Performance Materials reporting unit and $4.7 million of goodwill in the Vital Fluids reporting unit, included in OPS. The Company concluded that the fair value of these reporting units exceeded their carrying value of net assets. As a result, there was no impairment of goodwill in 2009.
The results of the Company’s goodwill impairment analysis in the fourth quarter of 2008 indicated that there was no remaining implied fair value attributable to the North American Automotive (NA Auto) or Affinity goodwill. Accordingly, the Company wrote off all of the $12.2 million of NA Auto goodwill and all of the $4.2 million of Affinity goodwill during the fourth quarter of 2008. Also, the Company recorded an impairment of long-lived assets charge of $1.0 million in the fourth quarter of 2008 at the Affinity business.
20
Table of Contents
Beginning in the second half of 2008, the Company’s NA Auto business, included in the Thermal/ Acoustical segment, was impacted by negative economic conditions in the United States, dramatically reducing consumer demand for automobiles in the fourth quarter of 2008. The Company’s automotive parts net sales were lower by approximately 31% in the fourth quarter of 2008 compared to the same quarter of 2007. The Company’s NA Auto customers are primarily domestic automakers who reported financial losses, announced facility closures and other restructuring actions. In addition, during the fourth quarter of 2008, North American automakers announced further expected reductions in automobile production in 2009, as compared to typical annual production levels. Certain of these North American automakers also announced concerns about near-term cash liquidity, which can negatively impact the Company’s profitability and cash flows in future periods.
Also during the fourth quarter of 2008, the Affinity business continued to be significantly impacted by a slow-down in capital equipment spending in the semiconductor industry. Net sales were lower by approximately 50% in the fourth quarter of 2008 as compared to the fourth quarter of 2007. Based on information available to Lydall in the fourth quarter of 2008, the Company anticipated a slower than expected rebound in capital equipment spending, which would continue to negatively impact the Company’s profitability and cash flows throughout 2009.
During the fourth quarter of 2008, the Company completed its required annual goodwill impairment testing. Negative events and changes in circumstances in the fourth quarter of 2008, as discussed above, including greater risk in the markets that the Company’s NA Auto and Affinity businesses serve, indicated a reduction in the future discounted cash flows from those businesses. In addition, during the fourth quarter of 2008 there was a sustained decline in the Lydall’s stock price. As a result of this decline, the Company’s market capitalization fell significantly below the recorded value of its consolidated net assets during the fourth quarter of 2008. The results of the goodwill impairment analysis indicated that there was no remaining implied fair value attributable to the NA Auto or Affinity goodwill. Accordingly, the Company wrote off all of the $12.2 million of NA Auto goodwill and all of the $4.2 million of Affinity goodwill during the fourth quarter of 2008 (See Note 15 to the Consolidated Financial Statements).
In performing the goodwill assessment, the Company used current market capitalization, discounted cash flows and other factors as the best evidence of fair value. The calculation of future cash flows included management estimates and assumptions that were based on the best available information as of the date of the assessment. Future cash flows can be affected by numerous factors including changes in economic, industry or market conditions, changes in the underlying business or products of the reporting unit, changes in competition and changes in technology. There are inherent uncertainties and management judgment required in an analysis of goodwill impairment.
As a result of the Company’s projected undiscounted future cash flows related to certain of its asset groups being less than the carrying value of those asset groups, the Company recorded an impairment charge of $1.0 million in the fourth quarter of 2008 at the Affinity business. The Company also performed an assessment of NA Auto’s long-lived assets for impairment at December 31, 2008. The undiscounted cash flows over the useful life of its primary asset group exceeded the carrying value of the asset group. The Company determined that impairment of NA Auto’s long-lived assets did not exist as of December 31, 2008. See Note 15 to the Consolidated Financial Statements.
Interest Expense
| (in thousands of dollars) | 2009 | 2008 | 2007 | |||||||||
| Interest expense |
$ | 814 | $ | 451 | $ | 490 | ||||||
| Weighted average interest rate during the year |
5.0 | % | 5.2 | % | 5.2 | % | ||||||
The increase in interest expense for 2009 compared to 2008 was primarily due to increased amortization of debt financing costs associated with the Company entering into a domestic credit facility in March, 2009 and increases in unused borrowing fees. The decrease in interest expense in 2008 compared to 2007 was due to lower average debt levels in 2008 compared to 2007.
Other Income and Expense
| (in thousands of dollars) | 2009 | 2008 | 2007 | ||||||
| Other income, net |
$ | 232 | $ | 133 | $ | 140 | |||
The amounts included in other income, net, in all years presented are primarily related to investment income and net foreign currency transaction gains and losses.
21
Table of Contents
Income Taxes from Continuing Operations
| 2009 | 2008 | 2007 | |||||||
| Effective income tax rate |
20.9 | % | 37.9 | % | 42.2 | % |
The Company’s effective tax rate from continuing operations for 2009 was 20.9% compared to 37.9% in 2008 and 42.2% in 2007.
The Company determined it will carry-back its 2009 taxable loss to prior years. As a result, at December 31, 2009, an income tax receivable of $3.2 million was recorded in anticipation of a cash refund expected to be received in 2010. This carry-back allows foreign tax credits previously utilized by the Company to become available for future use. An analysis was performed of the expected future realization of these foreign tax credits before their expiration, and as a result, the Company recorded an income tax charge of $2.5 million in the fourth quarter of 2009 to record a valuation allowance on the available foreign tax credits for which their future realization is not reasonably assured. This income tax charge primarily contributed to the effective tax rate differing from the statutory federal income tax rate in 2009.
As of December 31, 2009, the net amount of unrecognized tax benefits was $0.6 million. The total amount of unrecognized tax benefits that, if recognized, would affect the effective tax rate is $0.6 million. During 2009, the Company reduced its amount of unrecognized tax benefits by $0.5 million due primarily to a tax payment. This payment had no impact on the Company’s effective tax rate in 2009.
The Company’s effective tax rate in 2007 was higher than the federal statutory rate on earnings primarily due to changes in statutory tax rates in Germany, resulting in incremental income tax charges of $0.5 million, the impact from the Extraterritorial Income Program (ETI) phase-out and implementation of the Manufacturer Benefit System (MBS), and adjustments to the Company’s unrecognized tax benefits liability.
For 2010, the Company expects its effective tax rate to be approximately 36% to 38%. The Company is not aware of any items that would cause a significant difference from the statutory tax rate.
Consolidation, Restructuring and Related Charges
In September 2008, the Company announced that it would be closing its St. Johnsbury, VT manufacturing facility and consolidating its North American automotive parts production into the Hamptonville, NC operation. The Company commenced the transfer of equipment and production in the first quarter of 2009 and substantially completed the consolidation during the second quarter of 2009.
In the Thermal/Acoustical segment, the Company recorded pre-tax restructuring and restructuring related charges of $7.4 million over the period of consolidation including pre-tax charges of $1.6 million in 2008 and $5.8 million in 2009, with over 95% recorded in cost of sales during both periods. These restructuring activity expenses primarily included severance related expenses, acceleration of depreciation expense on fixed assets that were not transferred to the Hamptonville, NC facility, and facility exit, moving and set-up expenses of equipment transferred from St. Johnsbury, VT to Hamptonville, NC. During the fourth quarter of 2009, the Company ceased using the right conveyed by the lease of the St. Johnsbury, VT facility. As a result, the Company estimated the fair value of the remaining lease payments expected to occur through the third quarter of 2011 and recorded a lease termination charge of $0.7 million in the fourth quarter of 2009. Total cash outflows were $5.7 million over the period of consolidation, including $5.4 million in 2009. No future restructuring expenses are expected to be incurred related to this consolidation. Other than the remaining lease payments on the St. Johnsbury, VT facility of approximately $0.7 million, to be made ratably through the third quarter of 2011, there are no other material cash payments expected to be made related to this consolidation.
This consolidation is expected to reduce operating costs significantly, increase efficiency and enhance the Company’s competitive position while maintaining essentially the same level of manufacturing capacity. During the second half of 2009, the Company began to benefit from reduced operating costs related to this consolidation. However, in the fourth quarter of 2009 as the volume of orders from customers increased, the Company incurred greater than expected ramp-up costs associated with the business transferred from Vermont. Higher labor costs and other operating costs associated with the performance of certain equipment and tools transferred from Vermont partially offset savings from the restructuring activities. The Company expects higher than normal manufacturing costs to continue through the first quarter of 2010, but on an annualized basis, the Company expects to save approximately $3.5 million to $4.0 million in costs as a result of this consolidation. The Company expects approximately 90% of the savings impacting gross margins and the remainder reducing selling, product development and administrative expenses. Actual results could differ from these estimates.
22
Table of Contents
See Note 8 to the Consolidated Financial Statements for additional discussion of this restructuring.
SEGMENT RESULTS
| Consolidated Net Sales | For the Years Ended December 31, |
|||||||||||
| in thousands | 2009 | 2008 | 2007 | |||||||||
| Performance Materials: |
||||||||||||
| Filtration |
$ | 66,363 | $ | 70,549 | $ | 68,549 | ||||||
| Industrial Thermal Insulation |
31,652 | 41,036 | 40,004 | |||||||||
| Performance Materials Segment net sales |
$ | 98,015 | $ | 111,585 | $ | 108,553 | ||||||
| Thermal/Acoustical: |
||||||||||||
| Automotive parts |
$ | 106,735 | $ | 143,177 | $ | 160,440 | ||||||
| Automotive tooling |
21,058 | 20,523 | 16,998 | |||||||||
| Thermal/Acoustical Segment net sales |
$ | 127,793 | $ | 163,700 | $ | 177,438 | ||||||
| Other Products and Services: |
||||||||||||
| Vital Fluids |
$ | 14,600 | $ | 16,649 | $ | 14,721 | ||||||
| Affinity® temperature control equipment |
9,215 | 15,104 | 21,902 | |||||||||
| Other Products and Services net sales |
$ | 23,815 | $ | 31,753 | $ | 36,623 | ||||||
| Eliminations and Other |
(676 | ) | (1,322 | ) | (1,697 | ) | ||||||
| Consolidated Net Sales |
$ | 248,947 | $ | 305,716 | $ | 320,917 | ||||||
| Operating Income from Continuing Operations | For the Years Ended December 31, |
|||||||||||
| in thousands | 2009 | 2008 | 2007 | |||||||||
| Performance Materials Segment |
$ | 7,675 | $ | 15,543 | $ | 15,468 | ||||||
| Thermal/Acoustical Segment |
(10,126 | ) | (6,101 | ) | 16,548 | |||||||
| Other Products and Services |
(2,497 | ) | (6,388 | ) | (699 | ) | ||||||
| Corporate Office Expenses |
(12,370 | ) | (12,541 | ) | (16,165 | ) | ||||||
| Consolidated Operating Income |
$ | (17,318 | ) | $ | (9,487 | ) | $ | 15,152 | ||||
Performance Materials
Performance Materials segment net sales were $98.0 million in 2009 compared with $111.6 million in 2008. Excluding the impact of foreign currency translation, segment net sales decreased by $12.0 million, or 10.8%, in 2009 compared to 2008. Net sales of filtration products decreased by $2.7 million as many of the air filtration media customers lowered production schedules due to reduced demand for their products. Net sales of industrial thermal insulation products decreased by $9.3 million in 2009 compared to 2008. This decrease was due to reductions in net sales of both energy and industrial products, and to a lesser extent, building and appliance insulation products. Throughout most of 2008, there was strong demand for the Company’s energy and industrial products. However, in 2009, net sales of energy and industrial products decreased by $5.1 million due to lower capital project investments by customers in the electrical and cryogenic markets. Net sales of building and appliance insulation products decreased by $4.2 million in 2009 compared to 2008, as the Company was impacted by lower construction of new homes and commercial buildings in the U.S. in 2009.
The Performance Materials segment reported operating income of $7.7 million in 2009, a decrease of $7.9 million, or 50.6%, compared with 2008. Lower net sales, as well as a higher per-unit manufacturing costs which caused a lower gross margin percentage, contributed to lower operating income in 2009 compared to 2008. Higher per-unit manufacturing costs were caused by lower sales, as each unit absorbed a greater amount of fixed costs. Also, the results at the Solutech operation acquired in December 2008, contributed to the reduction in operating income in 2009 compared to 2008. Selling, product development and administrative expenses were essentially flat in 2009 compared to 2008. Solutech expenses increased by $2.3 million in 2009 compared to 2008 due to the acquisition occurring in December 2008. Offsetting the increase at Solutech was a reduction in expenses at all other Performance Materials segment locations. These reductions included incentive compensation expense of $0.7 million, travel related costs of $0.3 million, sales commissions and advertising costs aggregating to $0.3 million, as well as reductions in other discretionary spending.
23
Table of Contents
Segment net sales increased by $3.0 million in 2008 compared with 2007. Excluding the impact of foreign currency translation, segment net sales increased by $0.5 million in 2008 compared to 2007. Contributing to this increase was higher net sales of industrial thermal insulation products of $1.0 million, partially offset by a decrease of $0.5 million in net sales of filtration media. The increase in industrial thermal insulation product net sales was a result of increased energy and industrial products net sales of $3.1 million, partially offset by lower building and appliance insulation products net sales of $2.1 million. Net sales for energy and industrial products increased due to strong demand in the electrical markets as well as increased net sales to manufacturers of cryogenic equipment for liquid gas storage and transportation. Due to the economic recession in the U.S. impacting the new home and commercial buildings construction markets, the Company’s net sales of building and appliance insulation products decreased during 2008 as compared to 2007. The decrease in filtration media net sales in 2008 was primarily due to a reduction of net sales in the fourth quarter of 2008 of $3.2 million, net of foreign currency translation, as compared to the fourth quarter of 2007. As a result of the global economic downturn, many of the Company’s filtration customers adjusted downward their production schedules and the amount of product purchased from the Company in order to reduce their current levels of inventory.
Excluding the impact of foreign currency translation, operating income for the segment decreased by $0.3 million in 2008 compared with 2007. With a minimal change in net sales in 2008 and gross margin percentage in 2008 being consistent with 2007, the reduction in operating income was caused by higher selling, product development and administrative expenses of $0.3 million. This increase was primarily related to certain expenses associated with the acquisition of DSM Solutech B.V.
Thermal/Acoustical
Thermal/Acoustical segment net sales decreased to $127.8 million in 2009, compared to $163.7 million for 2008. Excluding the impact of foreign currency translation, net sales decreased by $32.7 million, or 20.0%, when compared to 2008. Automotive parts net sales decreased by $33.8 million, partially offset by increased tooling net sales $1.1 million in 2009, compared to 2008. Automotive parts net sales in North America were lower by $17.2 million, or 23.9%, in 2009, while parts net sales in Europe decreased by $16.6 million, or 23.4%, net of foreign currency translation, compared to 2008. In North America and Europe, the Company’s automotive businesses were impacted by global economic conditions resulting in less consumer demand for automobiles. Automotive parts net sales were adversely impacted by lower production on existing platforms, early termination of existing platforms and delays in launches of new platforms. The Company’s NA Auto business was also negatively impacted by the bankruptcy filings of Chrysler and General Motors. In connection with its bankruptcy filing, Chrysler temporarily idled production at most manufacturing plants in the U.S. during a significant portion of the second quarter of 2009 while the company reorganized. Also, General Motors had extended shut-down periods during the second quarter of 2009. The increase in tooling net sales in 2009, compared to 2008, was in North America due to the completion of tooling for future automobile platforms.
Operating loss for the segment was $10.1 million in 2009 compared with an operating loss of $6.1 million in 2008. Approximately $5.8 million, or 57%, of the 2009 operating loss was the result of restructuring related charges associated with the NA Auto consolidation. The increase in operating loss in 2009 was comprised of the following: (i) lower gross margin of $19.9 million in 2009, including higher restructuring related charges of $4.2 million in 2009, (ii) the absence of goodwill impairment charges of $12.2 million recorded in 2008 as it was determined that there was no remaining implied fair value of goodwill attributable to the Company’s NA Auto business, and by (iii) reductions of $3.7 million in selling, product development and administrative expenses. Lower gross margin in 2009 compared to 2008 was due to significantly lower net sales in 2009 than 2008. Also, gross margin percentage in 2009 was lower by approximately 770 basis points than 2008 when excluding the impact of restructuring charges in both periods. Lower net sales resulted in higher per-unit manufacturing costs, as each unit absorbed a greater amount of fixed costs. Contributing to the reduction in selling, product development and administrative expenses of $3.7 million in 2009 compared to 2008 was reductions in: salaries and wages expense of $1.4 million, severance related charges of $0.7 million, sales commission expenses of $0.6 million, bad debt expense of $0.3 million, as well as other reductions in discretionary spending. Reductions in workforce in 2009, due to the NA Auto consolidation and lower production requirements at other automotive businesses, contributed to lower salaries and wages expense. Realignment of management in the global automotive business, in December 2008, contributed to higher severance related charges in 2008 and lower salaries and wages expense in 2009. In addition, lower sales commission expenses were recorded due to lower sales in 2009 compared to 2008.
Thermal/Acoustical segment net sales decreased by $13.7 million in 2008 compared to 2007. Excluding the impact of foreign currency translation, segment net sales decreased by $20.6 million in 2008 compared to 2007. Automotive parts net sales decreased by $22.9 million in 2008, when compared to 2007, partially offset by higher tooling net sales of $2.3 million. Automotive parts net sales in North America were lower by $20.7 million in 2008, while parts net sales in Europe decreased by $2.2 million, net of foreign currency translation, as compared to 2007. In North America, the economic recession resulted in
24
Table of Contents
significantly lower consumer demand for automobiles throughout 2008. As a result, North American parts net sales were adversely impacted by domestic automakers early termination of various automotive platforms, delays in launches of new automobile platforms and lower production on current platforms. Beginning in the fourth quarter of 2008, the Company’s European automotive operations were also impacted by significant reductions in consumer demand for automobiles, resulting in lower net sales for the Company in 2008. The increase in tooling net sales in 2008, as compared to 2007, was due to the completion of tooling for future automobile platforms in Europe.
Excluding the impact of foreign currency translation, the Thermal/Acoustical segment reported an operating loss of $6.8 million in 2008, compared to operating income of $16.5 million in 2007. Approximately $13.8 million of the $23.3 million change in operating results in 2008, compared to 2007, was attributable to goodwill impairment and restructuring charges recorded during the fourth quarter of 2008. The Company recorded a goodwill impairment charge of $12.2 million as it was determined that there was no remaining implied fair value of goodwill attributable to the Company’s NA Auto business. Restructuring charges related to the consolidation of the NA Auto operating facilities were $1.6 million in 2008. The remaining decrease in operating income was due to lower parts net sales and a reduction in gross margin percentage due to higher raw material costs and per-unit manufacturing costs due to each unit absorbing more fixed costs. Net of foreign currency translation, selling, product development and administrative expenses decreased by $0.5 million in 2008, as compared to 2007. Lower incentive compensation expense in 2008 of $0.7 million, lower sales commission expense of $0.6 million, as well as reductions in research and development expense of $0.3 million were partially offset by higher severance related charges of $1.2 million, as compared to 2007. Lower sales commission expense and incentive compensation expense was due to lower sales and profitability in 2008 as compared to 2007. Lower research and development expenses were primarily due to grants received in 2008. The severance related charges were primarily related to realigning management within the Company’s North American and European automotive operations, as well as reductions in workforce at certain operations as a result of lower production requirements. Realigning management included the elimination of regional business unit presidents and the appointment of a global automotive president to better maximize synergies between Lydall’s North American and European automotive operations.
Other Products and Services
The decrease in OPS net sales of $7.9 million in 2009 compared to 2008 was due to decreased volumes of net sales from the Affinity business of $5.9 million and the Vital Fluids business of $2.0 million. The decrease in Affinity net sales during 2009 was attributable to the depressed capital equipment spending in the semiconductor industry that the Company serves. The decrease in net sales of Vital Fluids’ products was primarily attributable to decreased volumes of blood filtration product net sales, and to a lesser extent, bioprocessing net sales, partially offset by higher net sales of blood transfusion products.
OPS operating loss was $2.5 million in 2009 compared to an operating loss of $6.4 million in 2008. The Affinity business reported an operating loss of $2.7 million in 2009 compared to an operating loss of $7.5 million in 2008. Excluding the fourth quarter of 2008 charges related to goodwill impairment of $4.2 million and long-lived asset impairment of $1.0 million, the operating loss at Affinity increased by $0.4 million in 2009 compared to 2008. While net sales decreased by $5.9 million, or 39%, in 2009, compared to 2008, cost reduction activities partially offset the impact of lower net sales on Affinity’s operating results. Also, selling expenses decreased by $0.3 million in 2009, compared to 2008, primarily due to lower net sales. Operating income of $0.2 million reported by the Vital Fluids business in 2009 was lower by $0.9 million compared to 2008. Lower net sales of $2.0 million, and to a lesser extent, changes in product mix, resulted in the decrease in operating income.
The decrease in OPS net sales of $4.9 million in 2008, compared to 2007, was due to decreased net sales from the Affinity business of $6.8 million, partially offset by higher Vital Fluids business net sales of $1.9 million. The decrease in Affinity net sales was attributable to a slow-down in capital equipment spending in the semiconductor industry. The greater Vital Fluids’ products net sales were attributable to increases in volumes of blood transfusion and blood filtration product net sales.
Operating loss from OPS was $6.4 million in 2008, compared to an operating loss of $0.7 million in 2007. The Affinity business reported an operating loss of $7.5 million in 2008. During the fourth quarter of 2008, the Company recorded a goodwill impairment charge of $4.2 million as it was determined that there was no remaining implied fair value of goodwill attributable to the Affinity business. In addition, the Company recorded an impairment charge of $1.0 million in the fourth quarter of 2008 related to Affinity’s long-lived assets. The remaining operating loss of $2.3 million was caused by lower net sales due to the slow-down in capital equipment spending in the semiconductor industry. Operating income for the Vital Fluids business improved by $0.6 million in 2008, as compared to 2007, due to higher net sales and gross margin percentage due to operational efficiency improvements.
25
Table of Contents
Corporate Office Expenses
Corporate office expenses were $12.4 million in 2009 compared to $12.5 million for 2008. Corporate office expenses in 2009 were essentially flat with 2008 due to increases in pension expense associated with the Company’s sponsored defined benefit plans of $0.8 million and severance related charges of $0.3 million offset by reductions in salaries and wages expense, 401(k) company match expense, travel expense, as well as other reductions in discretionary spending. Higher pension expense was primarily impacted by a lower expected rate of return on assets in 2009 compared to 2008, applied to a lower base of assets, and increases in amortization of actuarial losses. Offsetting this were reductions in personnel which contributed to lower salaries expense in 2009 as compared to 2008. The Company’s suspension of its matching contribution to its sponsored 401(k) plan, beginning with the first payroll of May 2009, for all non-union domestic employees caused the lower 401(k) company match expense in 2009 compared to 2008.
LIQUIDITY AND CAPITAL RESOURCES
| For the Year Ended December 31, |
||||||||||||
| (in thousands except ratio data) | 2009 | 2008 | 2007 | |||||||||
| Cash and cash equivalents |
$ | 22,721 | $ | 13,660 | $ | 15,716 | ||||||
| Cash provided by operating activities |
$ | 14,067 | $ | 20,098 | $ | 22,133 | ||||||
| Cash used for investing activities |
$ | (3,649 | ) | $ | (21,234 | ) | $ | (14,610 | ) | |||
| Cash (used for) provided by financing activities |
$ | (1,669 | ) | $ | (262 | ) | $ | 1,231 | ||||
| Depreciation and amortization |
$ | 15,722 | $ | 15,935 | $ | 15,227 | ||||||
| Capital expenditures |
$ | 5,921 | $ | 12,037 | $ | 14,610 | ||||||
| Total debt |
$ | 6,751 | $ | 8,154 | $ | 9,829 | ||||||
| Total capitalization (debt plus equity) |
$ | 163,559 | $ | 174,299 | $ | 190,282 | ||||||
| Total debt to total capitalization |
4 | % | 5 | % | 5 | % | ||||||
The Company assesses its liquidity in terms of its ability to generate cash to fund operating, investing and financing activities. The principal source of liquidity is operating cash flows. In addition to operating cash flows, other significant factors that affect the overall management of liquidity include capital expenditures, investments in businesses, acquisitions, income tax payments, pension funding and availability of lines of credit and long-term financing. The Company manages worldwide cash requirements considering available funds among domestic and foreign subsidiaries.
Operating Cash Flows
Net cash provided by operating activities in 2009 was $14.1 million compared with $20.1 million in 2008. The decrease in cash from operations in 2009 compared to 2008 was primarily due to a net loss of $14.2 million in 2009 compared to a net loss of $5.0 million in 2008, which included a non-cash impairment charge of $17.4 million. The net cash provided by operating activities in 2009 of $14.1 million was primarily caused by a reduction in inventories of $14.7 million and increases in accounts payable of $5.2 million, partially offset by increases of accounts receivable by $4.7 million. The decrease in inventories was due to the Company’s focus on managing working capital and reducing inventory, as well as a decrease in finished goods inventory primarily due to the build up of inventory at December 31, 2008 in preparation for the NA Auto consolidation. The increase in accounts payable was due to better management of payment terms with vendors as well as timing. The increase in accounts receivable in 2009 was primarily due to higher sales in the fourth quarter of 2009 compared to the same period in 2008. The Company also generated $2.4 million of cash in 2009 from the net proceeds of company-owned life insurance policies on certain former executives after making lump-sum payments to terminate its Supplemental Executive Retirement Plan to the former executives.
Investing Cash Flows
Net cash used for investing activities was $3.6 million in 2009 compared with $21.2 million in 2008. In 2009, capital expenditures totaled $5.9 million compared with $12.0 million in 2008. Cash of $2.4 million was transferred back to cash and cash equivalents in 2009 due to the release of restricted cash which was held as security for outstanding letters of credit at December 31, 2008. In 2008, cash used for investing activities included $10.1 million for the acquisition of DSM Solutech B.V.
26
Table of Contents
Financing Cash Flows
In 2009, net cash used for financing activities was $1.7 million compared with net cash used for financing activities of $0.3 million in 2008. Net debt payments and capital lease payments aggregated to $1.6 million in 2009 compared to $1.3 million in 2008. The Company had no borrowings on its domestic credit facility at December 31, 2009 and 2008. There were no proceeds from common stock issuances in 2009 compared with common stock proceeds of $1.1 million in 2008.
Financing Arrangements
On March 11, 2009, the Company and the Company’s domestic subsidiaries, as co-borrowers or guarantors, entered into a $35 million senior secured domestic credit facility (Domestic Credit Facility) with a financial institution (Lender), which replaced the Company’s prior domestic revolving credit facility that expired on February 1, 2009. Subject to and upon the terms and conditions contained in the Domestic Credit Facility, the Lender agreed to make revolving loans to the Company and its domestic subsidiaries from time to time in amounts requested by the Company and its domestic subsidiaries up to the lesser of the Borrowing Base at such time or the maximum credit of $35 million. The Borrowing Base under the Domestic Credit Facility is determined based on certain percentages of eligible domestic accounts receivable, eligible domestic inventories and eligible domestic fixed assets, reduced by applicable reserves. The Company had no borrowings outstanding under the Domestic Credit Facility at December 31, 2009, or any outstanding borrowings under its previous domestic credit facility at December 31, 2008. The Domestic Credit Facility has a term of three years.
Interest is charged on borrowings at the Company’s option of either: (i) the Prime Rate plus the Applicable Margin or (ii) the Eurodollar Rate plus the Applicable Margin. The Prime Rate is a fluctuating rate equal to the higher of the financial institution’s prime rate or the federal funds rate plus .50%. The Eurodollar Rate is a fluctuating LIBOR rate offered for deposits in U.S. dollars. The Applicable Margin added to the Prime Rate ranges from 1.25% to 1.75% and the Applicable Margin added to the Eurodollar Rate ranges from 4.25% to 4.75% depending on the type of collateral that supports the outstanding borrowings. The Company also pays .50% per annum on the average daily unused portion of the Domestic Credit Facility and 4.25% per annum on the daily outstanding balance of letters of credit.
Repayment of amounts due and owing under the Domestic Credit Facility are secured by a lien and security interest in most of the present and future assets of the Company and its domestic subsidiaries, as well as 100% of all of the issued and outstanding shares of capital stock of the Company’s domestic subsidiaries and a pledge of 65% of the issued and outstanding shares of the capital stock of certain of the Company’s foreign subsidiaries. The payment of outstanding principal under the Domestic Credit Facility and accrued interest thereon may be accelerated and become immediately due and payable upon the Company’s default in its payment or other performance obligations or its failure to comply with the financial and other covenants set forth in the loan agreement, subject to any applicable notice requirements and cure periods set forth in the loan agreement.
The loan agreement evidencing the Domestic Credit Facility contains a number of affirmative and negative covenants, including financial covenants. Among others, the Company and its domestic subsidiaries at all times must maintain Excess Availability, as defined in the loan agreement, of not less than $5.0 million. For the period March 31, 2009 to July 31, 2009, the Company was subject to a minimum cash flow requirement determined as of the end of each month during such period. Commencing on August 1, 2009, if the Company’s borrowings under the Domestic Credit Facility exceed $5.0 million, or Excess Availability under the Credit Facility is less than $12.5 million, the Company is required to meet a minimum fixed charge coverage ratio. The fixed charge coverage ratio requires that, at the end of any month, the ratio of consolidated EBITDA to fixed charges may not be less than 1 to 1 for the immediately preceding 12 month period, except that prior to August 31, 2010 compliance with the fixed charge coverage ratio generally shall be measured during the period commencing as of August 1, 2009 and ending as of the last day of the month in the measuring period. Once the Company is required to comply with the fixed charge coverage ratio, Company borrowings must be less than $5.0 million and Excess Availability greater than $12.5 million for each day for sixty consecutive days in order for the Company not to be required to comply with the fixed charge coverage ratio until the next time that borrowings under the Domestic Credit Facility exceed $5.0 million, or Excess Availability under the Credit Facility is less than $12.5 million. At no time during 2009 did the Company’s borrowings under the Domestic Credit Facility exceed $5.0 million or was Excess Availability less than $12.5 million, therefore, the Company was not subject to the minimum cash flow requirement or fixed charge coverage ratio.
The Domestic Credit Facility also generally restricts the Company’s ability to pay a cash dividend on its common stock or repurchase shares of common stock, subject to certain stated exceptions.
At December 31, 2009, the Company’s foreign subsidiaries had various credit arrangements with banks totaling €7.0 million (approximately $10.0 million), including €6 million (approximately $8.6 million) in Germany (German Facility). The German Facility allows for borrowings at an interest rate based on the Euro Overnight Index Average plus a margin of 1.5%. Repayment of
27
Table of Contents
amounts due under the German Facility are secured by the land and manufacturing equipment at the facility in Germany. The expiration of the German Facility is September 30, 2011.
As of December 31, 2009, the Company had unused borrowing capacity of $23.1 million under various credit facilities; all of which was available as of December 31, 2009. The Company was limited to borrowing up to $13.1 million under the Domestic Credit Facility in order to maintain Excess Availability of not less than $5.0 million. At December 31, 2009, the Company’s foreign subsidiaries had various credit arrangements totaling $10.0 million, all of which was available for borrowings. The Company’s foreign subsidiaries had no borrowings outstanding on its credit arrangements at December 31, 2009 and 2008.
The Company utilizes letters of credit in the ordinary course of business to satisfy security deposit requirements. Outstanding letters of credit were $2.5 million as of December 31, 2009 and $5.8 million as of December 31, 2008.
Other than operating leases, the Company does not have any off-balance sheet financing arrangements.
Future Cash Requirements
At December 31, 2009, total indebtedness was $6.8 million, or 4.1% of the Company’s total capital structure. Cash requirements for 2010 are expected to include the funding of ongoing operations, including purchase of raw material, capital expenditures, payments due on capital and operating leases, pension plan contributions, income tax payments and debt service. The Company expects to finance its 2010 operating cash requirements from cash provided by operating activities and through borrowings under its existing credit agreements, as needed.
Capital spending for 2010 is expected to be approximately $9.0 million to $11.0 million. The funded status of the Company’s defined benefit pension plans is dependent upon many factors, including returns on invested assets, levels of market interest rates and levels of contributions to the plans. The Company expects to contribute approximately $1.7 million to its defined benefit pension plans during 2010. The Company continually explores its core markets for suitable acquisitions, joint ventures, alliances and licensing agreements. If completed, such activities would be financed with cash generated from operations, under the credit facility described under “Financing Arrangements” above or other forms of financing, as required. In 2010, the Company expects to receive an income tax refund due to loss carrybacks of approximately $3.2 million.
Worldwide economic cycles, and the effects on the markets in which the Company operates, are difficult to predict. During the second half of 2009, most of the Company’s businesses saw marginal improvement in the markets they serve. However, going into 2010, the Company is unable to predict the timing and extent to which the Company’s markets will improve and the resulting impact on the Company’s 2010 financial results and cash flow requirements.
Contractual Obligations
The following table summarizes the Company’s significant obligations as of December 31, 2009 and the effect such obligations are expected to have on the Company’s liquidity and cash flows in future periods:
| Payments Due by Period | |||||||||||||||||||||
| In thousands | 2010 | 2011 | 2012 | 2013 | 2014 | After 5 years | Total | ||||||||||||||
| Contractual obligations: |
|||||||||||||||||||||
| Pension plan contributions |
$ | 1,665 | $ | — | $ | — | $ | — | $ | — | $ | — | $ | 1,665 | |||||||
| Operating leases |
2,624 | 1,294 | 530 | 352 | 270 | 83 | 5,153 | ||||||||||||||
| Capital leases* |
1,531 | 1,531 | 1,006 | 831 | 731 | 1,097 | 6,727 | ||||||||||||||
| Long-term debt* |
291 | 291 | 291 | 69 | — | — | 942 | ||||||||||||||
| Purchase obligations |
12,626 | 11,055 | — | — | — | — | 23,681 | ||||||||||||||
| Total contractual obligations |
$ | 18,737 | $ | 14,171 | $ | 1,827 | $ | 1,252 | $ | 1,001 | $ | 1,180 | $ | 38,168 | |||||||
| * | includes estimated interest payments |
The above table does not reflect gross unrecognized tax benefits of $0.9 million, the timing of which is uncertain. Refer to Note 14 to the Consolidated Financial Statements for additional discussion on unrecognized tax benefits.
Purchase obligations in the table above are primarily related to contracts to purchase aluminum at various automotive operations ($11.3 million in 2010 and $10.2 million in 2011) and also include guaranteed minimum payments to Transport under a services agreement as part of the sale agreement. The Company’s European automotive operation has an additional purchase obligation of 1,000 metric tons of aluminum beginning in March 2010 through December 2010, which will be based on the London Metal Exchange (LME) September 2009 to February 2010 average rate. Based on LME rates during the period September 2009 to January 2010, the Company estimated this additional aluminum commitment to be approximately $1.9 million to $2.2 million. Purchase orders or contracts for normal purchases of raw materials and other goods and services are not included in the table
28
Table of Contents
above. The Company is not able to determine the aggregate amount of such purchase orders that represent contractual obligations, as purchase orders may represent authorizations to purchase rather than binding agreements. For purposes of this table, contractual obligations for purchase of goods or services are defined as agreements that are enforceable and legally binding on the Company and that specify all significant terms, including: fixed or minimum quantities to be purchased; fixed, minimum or variable price provisions; and the approximate timing of the transactions. The Company does not have significant agreements for the purchase of raw materials or other goods specifying minimum quantities or set prices that exceed expected requirements.
The Company’s long-term debt payments and interest rates for all of the Company’s outstanding debt were fixed as of December 31, 2009. Actual payments may vary significantly from those included in the table above depending on future debt levels, timing of debt repayments and sources of funding utilized.
The Company’s future pension plan contributions relate to the remaining contributions required for the 2009 plan year and the minimum contributions for the 2010 plan year based on the Company’s pension plan valuations at December 31, 2009. See Note 11 to the Consolidated Financial Statements for additional information regarding the Company’s pension plans.
In addition to the above contractual obligations, the Company utilizes letters of credit in the ordinary course of business for security deposit requirements. Outstanding letters of credit were $2.5 million and $5.8 million at December 31, 2009 and 2008, respectively.
CRITICAL ACCOUNTING ESTIMATES
The preparation of the Company’s consolidated financial statements in accordance with accounting principles generally accepted in the United States of America requires management to make estimates and assumptions that affect the reported amounts of assets and liabilities and disclosure of contingent assets and liabilities as of the date of the financial statements and the reported amounts of revenues and expenses during the reporting periods. Note 1 in Notes to Consolidated Financial Statements describes the significant accounting policies used in the preparation of the consolidated financial statements. The Company’s management is required to make judgments about and estimates of the effect of matters that are inherently uncertain. Actual results could differ from management’s estimates. The most significant areas involving management judgments and estimates are described below.
Intangible Assets and Goodwill
Intangible assets consist primarily of goodwill and acquisition-related intangibles. The Company had goodwill of $19.3 million at December 31, 2009 and $19.4 million at December 31, 2008.
Goodwill and other intangible assets determined to have indefinite lives are not amortized, but rather are subject to annual impairment tests or when an event occurs or circumstances change that would more likely than not reduce the fair value of a reporting unit below its carrying value. The identification and measurement of goodwill impairment involves the estimation of the fair value of reporting units, including related goodwill. The Company’s reporting units are operating segments or components of operating segments for which discrete financial information is available and management regularly reviews the operating results of that operating segment or component. Goodwill is tested for impairment using a two-step process. In the first step, the fair value of the reporting unit is compared to its carrying value. If the fair value of the reporting unit exceeds the carrying value of its net assets, goodwill is considered not impaired and no further testing is required. If the carrying value of the net assets exceeds the fair value of the reporting unit, a second step of the impairment test is performed in order to determine the implied fair value of a reporting unit’s goodwill. Determining the implied fair value of goodwill requires a valuation of the reporting unit’s tangible and intangible assets and liabilities in a manner similar to the allocation of purchase price in a business combination. If the carrying value of the reporting unit’s goodwill exceeds the implied fair value of its goodwill, goodwill is deemed impaired and is written down to the extent of the difference.
The estimates of fair value of reporting units are based on the best information available as of the date of the assessment, which incorporate management assumptions about expected future cash flows, as well as other factors such as market capitalization. Future cash flows can be affected by numerous factors including changes in economic, industry or market conditions, changes in the underlying business or products of the reporting unit, changes in competition and changes in technology. Any changes in key assumptions about the business and its prospects, changes in any of the factors discussed above or other factors could affect the fair value of one or more of the reporting units resulting in an impairment charge, which did occur during the fourth quarter of 2008.
29
Table of Contents
During the fourth quarter of 2009, the Company performed its annual impairment analysis of the $14.6 million of goodwill in the Performance Materials reporting unit and $4.7 million of goodwill in the Vital Fluids reporting unit, included in OPS. The Company’s goodwill impairment testing analysis (analysis) included projecting cash flows for the years 2010 – 2014 and discounting those amounts based on appropriate market risks. Based on those projections and other assumption used in the analysis, the Company concluded that the fair value of these reporting units exceeded their carrying value of net assets. As a result, there was no impairment of goodwill.
A one basis point increase in the discount rate used in the analysis would not change the Company’s conclusion for the Vital Fluids and Performance Materials reporting units. Along with a one percentage point increase in the discount rate, the analysis indicated that a reduction in the projected operating income of the Vital Fluids and the Performance Materials reporting units (over the next five years) of approximately 22% and 26%, respectively, would require the Company to perform an additional step to measure the amount of an impairment loss, if any.
During the fourth quarter of 2008, the Company’s NA Auto business, included in the Thermal/Acoustical segment, was severely impacted by significant declines in sales of automobiles as a result of a global economic downturn and increased consumer credit restrictions. The Company’s NA Auto customers are primarily domestic automakers who were reporting financial losses, closing facilities due to reduced manufacturing levels and capacity requirements and announcing other restructuring actions. During the fourth quarter of 2008, three of the largest North American automakers announced further expected reductions in automobile production in 2009, as compared to typical annual production levels. Also, the Affinity business, included in OPS, continued to be impacted by lower net sales and operating losses due to a slow-down in capital equipment spending in the semiconductor industry. These factors, as well as greater risk in the automotive and semiconductor markets that the Company serves, resulted in the fair value of the NA Auto and Affinity reporting units to be lower than their book value. The results of the goodwill impairment analysis indicated that there was no remaining implied fair value attributable to NA Auto or Affinity goodwill. Accordingly, the Company wrote off all of the $12.2 million of NA Auto goodwill and all of the $4.2 million of Affinity goodwill during the fourth quarter of 2008 (See Note 15 to the Consolidated Financial Statements).
Impairment of Long-Lived Assets
Long-lived assets are reviewed for impairment whenever events or changes in circumstances indicate that the carrying amount of such assets may not be recoverable. Determination of recoverability is based on the Company’s judgment and estimates of undiscounted future cash flows resulting from the use of the assets and their eventual disposition. Measurement of an impairment loss for long-lived assets and certain identifiable intangible assets that management expects to hold and use is based on the fair value of the asset.
The carrying values of the assets determined to be impaired are reduced to their estimated fair values. The fair values of the impaired assets are determined based on market conditions, including independent appraisals when appropriate, the income approach which utilizes cash flow projections, and other factors.
The Company determined that long-lived assets at the Affinity business were impaired at December 31, 2008. This was based on reviewing estimated undiscounted cash flows and independent appraisals for its asset group, which indicated that the fair value was less than their carrying value. The Company considered its asset group to be certain assets and liabilities at Affinity, primarily consisting of machinery and equipment, and buildings and improvements. The Company recorded an impairment charge of $1.0 million during the fourth quarter of 2008, which represented the difference between the estimated fair value of the asset group compared to the carrying value of the asset group (See Note 15 to the Consolidated Financial Statements).
Pensions
Pension cost and the related obligations recognized in the consolidated financial statements are determined on an actuarial basis. The determination of such amounts is made in consultation with the Company’s outside actuary based on information and assumptions provided by the Company. A substantial portion of the Company’s pension amounts relate to its defined benefit plans in the United States. Pension plans outside the U.S. are not significant at December 31, 2009.
A significant element in determining the Company’s pension cost is the expected return on plan assets. Based on a review of market trends, actual returns on plan assets and other factors, the Company’s expected long-term rate of return on plan assets of 8.0% will be utilized for determining 2010 pension cost, which is consistent with what was used for calculating 2009 pension
30
Table of Contents
costs. In determining pension cost for 2008 and 2007, the Company used an expected long-term rate of return on plan assets of 8.5%. In determining the expected return on plan assets, the Company considers the relative weighting of plan assets, the historical performance of marketable debt and equity securities and economic and other indicators of future performance. Investment management objectives include maintaining an adequate level of diversification to balance market risk and to provide sufficient liquidity for near-term payments of benefits accrued under the plan and to pay the expenses of administration. The investment plan assets are stated at fair value, which is based on quoted market prices in an active market. The expected long-term rate of return on assets is applied to the value of plan assets at the beginning of the year and this produces the expected return on plan assets that is included in the determination of pension cost for that year. The difference between this expected return and the actual return on plan assets is deferred, within certain parameters, as discussed below. The Company continually evaluates its expected long-term rate of return and will adjust such rate as deemed appropriate.
At the end of each year, the Company determines the discount rate to be used to calculate the present value of plan liabilities, as well as the following year’s pension cost. The discount rate is an estimate of the current interest rate at which the pension liabilities could be effectively settled at the end of the year. At December 31, 2009 and 2008, the Company based its discount rate assumption on a cash flow matching analysis, which matches the future cash outflows of the pension plans to a yield curve comprised of high quality fixed-income investments. Benefit payments are discounted at the rates on the curve and a single discount rate specific to the plans is determined. At December 31, 2009, the Company determined this rate to be 5.96%. Increases or decreases in the discount rate result in decreases and increases, respectively, in the projected benefit obligation. The net effect on pension liabilities from changes in the discount rate is deferred within certain parameters, as discussed below.
Pension accounting guidance requires that gains or losses be deferred unless the unrecognized net gain or loss at the end of a year exceeds a “corridor” (as defined in the pension accounting guidance). If the deferred gain or loss exceeds the corridor at the end of the year, then the amount in excess of the corridor is amortized over a period equal to the average remaining service period of active employees expected to receive benefits. Since benefit accruals were frozen on certain domestic defined benefit plans on June 30, 2006, these plan participants are considered inactive participants. Therefore, the gain/loss amortization for these plans is amortized over the average remaining life expectancy of all plan participants. As of December 31, 2009 and 2008, the net deferred loss exceeded the corridor. Consequently, pension cost for 2010 will include amortization of a portion of the deferred loss in excess of the corridor. The amount of amortization in future years will be dependent on changes in the components of the deferred loss amount, particularly actual return on plan assets in relation to the estimated return on plan assets, as well as future increases or decreases in the discount rate.
For the year ended December 31, 2009, the Company recognized pension expense related to its defined benefit plans in the U.S. of $1.4 million as a result of the expected return on assets being lower than the aggregate of (i) service cost from eligible employees covered under a collective bargaining agreement, (ii) interest cost, (iii) amortization of actuarial loss and prior service cost and (iv) the net impact of pension expense related to curtailments and a settlement aggregating to $0.2 million in 2009. As discussed above, the Company’s discount rate was 5.96% at December 31, 2009 and was used for purposes of determining 2010 pension cost. Pension cost for 2010 is expected to be in the range of $0.8 million to $1.0 million.
The Company contributed $1.4 million to its U.S. defined benefit pension plans during 2009 and expects to contribute approximately $1.7 million in 2010.
Income Taxes
The Company accounts for income taxes recognizing deferred tax assets and liabilities using enacted tax rates for the effect of temporary differences between book and tax bases of recorded assets and liabilities. Deferred tax assets are reduced by a valuation allowance if it is more likely than not that some or all of a deferred tax asset will not be realized.
Deferred tax assets, net of valuation allowance, related to future tax benefits arising from deductible temporary differences and tax carryforwards were $14.4 million and $12.8 million at December 31, 2009 and 2008, respectively. Management believes that the Company’s earnings during the periods when the temporary differences become deductible will be sufficient to realize the related net future income tax benefits. For those jurisdictions where the projected operating results indicate that the ability to realize the future benefits is uncertain or not likely, a valuation allowance has been provided.
In assessing the need for a valuation allowance, the Company estimates future taxable income, considering the feasibility of ongoing tax planning strategies and the realizability of tax loss carryforwards. Valuation allowances related to deferred tax assets
31
Table of Contents
can be impacted by changes in tax law, changes in statutory tax rates and future levels of taxable income. In the event the Company was to determine that it would not be able to realize all or a portion of its deferred tax assets in the future, the Company would reduce such amounts through a charge to income in the period that such determination was made. Conversely, if the Company was to determine that it would be able to realize its deferred tax assets in the future in excess of the net carrying amounts, the Company would decrease the recorded valuation allowance and record an increase to income in the period that such determination was made. See Note 14 to the Consolidated Financial Statements.
The Company and its subsidiaries file a consolidated federal income tax return, as well as returns required by various state and foreign jurisdictions. In the normal course of business the Company is subject to examination by taxing authorities, including such major jurisdictions as the United States, France, Germany and The Netherlands. With few exceptions, the Company is no longer subject to U.S. federal examinations for years before 2008, state and local examinations for years before 2005, and non-U.S. income tax examinations for years before 2003.
In assessing the need for reserves for uncertainties in income taxes recognized, a significant number of estimates and judgments must be made by the Company. The total amount of unrecognized tax benefits that, if recognized, would affect the effective tax rate is $0.6 million as of December 31, 2009.
Unremitted earnings of foreign subsidiaries have been included in the consolidated financial statements without giving effect to the United States taxes that may be payable on the distribution to the United States because it is not anticipated such earnings will be remitted to the United States. If remitted, the additional United States tax liability is not expected to be material.
The Company’s effective tax rates in future periods could be adversely affected by earnings being lower or higher than anticipated in countries where tax rates differ from the United States federal rate, the relative impact of permanent tax adjustments on higher or lower earnings from domestic operations, changes in net deferred tax asset valuation allowances, changes in tax rates or tax laws and the completion of tax audits.
Equity Compensation Plans
The Company accounts for awards of equity instruments under the fair value method of accounting and recognizes such amounts in the statements of operations. The Company recognizes expense on a straight-line basis over the vesting period of the entire award. Stock-based compensation expense includes the estimated effects of forfeitures, and such estimates of forfeitures are adjusted over the requisite service period to the extent actual forfeitures differ, or are expected to differ, from such estimates. The effect of changes in estimated forfeitures is recognized in the period of change and will also impact the amount of expense to be recognized in future periods. The Company estimates the fair value of option grants based on the Black Scholes option-pricing model. Expected volatility and expected term are based on historical information. The Company believes that future volatility and expected term are not likely to materially differ from the Company’s historical stock price volatility and historical exercise data, respectively.
The fair value of each option granted is estimated on the date of grant using the Black-Scholes option-pricing model with the following weighted-average assumptions for the years ended December 31:
| 2009 | 2008 | 2007 | |||||||
| Risk-free interest rate |
2.6 | % | 2.9 | % | 4.4 | % | |||
| Expected life |
5.5 years | 5.6 years | 5.9 years | ||||||
| Expected volatility |
61 | % | 50 | % | 44 | % | |||
| Expected dividend yield |
0 | % | 0 | % | 0 | % |
RECENTLY ISSUED ACCOUNTING STANDARDS
In December 2007, the FASB issued business combinations guidance, which provides revised standards requiring the acquirer to recognize and measure, at fair value on the acquisition date, identifiable assets and goodwill acquired, liabilities assumed, and any non-controlling interest in the acquiree. Transaction and restructuring costs generally will be expensed as incurred. This guidance also provides disclosure requirements to enable users of the financial statements to evaluate the nature and financial effects of the business combination. The Company adopted this guidance on January 1, 2009 and the adoption did not impact the Company’s financial statements.
32
Table of Contents
In December 2007, the FASB issued guidance on noncontrolling interests in Consolidated Financial Statements. This guidance requires that ownership interests in subsidiaries held by parties other than the parent, and the amount of consolidated net income, be clearly identified, labeled, and presented in the consolidated financial statements. It also requires once a subsidiary is deconsolidated, any retained noncontrolling equity investment in the former subsidiary be initially measured at fair value. The adoption of this guidance on January 1, 2009 did not impact the Company’s consolidated financial position, results of operations or cash flows.
On July 1, 2009, the FASB Accounting Standards Codification (ASC) was implemented as the sole source of authoritative GAAP. Pursuant to these provisions, the Company modified its consolidated financial statements by replacing references to former authoritative pronouncements with references to the topics outlined in the ASC. The adoption of this referencing standard did not have an affect on the Company’s consolidated financial position, results of operations, or cash flows.
In May 2009, the FASB issued guidance on subsequent events. This guidance establishes principles and requirements for subsequent events. The guidance sets forth the period after the balance sheet date and the circumstances under which an entity shall evaluate events or transactions for potential recognition or disclosure in the financial statements. This guidance was effective for interim and financial periods ending after June 15, 2009. The adoption of this guidance on June 30, 2009 did not impact the Company’s financial statements.
In October 2009, the FASB issued guidance on revenue recognition. Under this guidance, management is no longer required to obtain vendor-specific objective evidence or third party evidence of fair value for each deliverable in an arrangement with multiple elements, and where evidence is not available the proportion of the selling price attributable to each deliverable may be estimated. This guidance is effective for annual reporting periods beginning after June 15, 2010. The adoption of this guidance is not expected to have a material effect on the Company’s consolidated financial position, results of operations or cash flows.
In January 2010, the FASB issued guidance on improving disclosures about fair value measurements. This guidance requires reporting entities to make new disclosures about recurring or nonrecurring fair-value measurements including significant transfers into and out of Level 1 and Level 2 fair value measurements and information on purchases, sales, issuances, and settlements on a gross basis in the reconciliation of Level 3 fair value measurements. This guidance is effective for annual reporting periods beginning after December 15, 2009, except for Level 3 reconciliation disclosures which are effective for annual periods beginning after December 15, 2010. The adoption of this guidance is not expected to have a material effect on the Company’s consolidated financial position, results of operations or cash flows.
OTHER KEY FINANCIAL ITEMS
Cash and cash equivalents – Cash and cash equivalents increased to $22.7 million as of December 31, 2009 compared with $13.7 million as of December 31, 2008. This increase of $9.0 million was primarily due to cash generated from operating activities of $14.1 million, principally from a reduction in inventories of $14.7 million, which was partially offset by cash used in investing activities of $3.6 million and cash used for financing activities of $1.7 million. Investing activities included $5.9 million used for capital expenditures and $2.4 million provided by the release of restricted cash for security of outstanding letters of credit.
Accounts receivable – Accounts receivable, net of the allowance for doubtful receivables, were $39.8 million at the end of 2009 compared with $34.3 million at the end of 2008. This increase was primarily related to higher net sales in the fourth quarter of 2009 as compared to the same period in 2008.
Inventories – Inventories were $26.6 million as of December 31, 2009 compared with $40.8 million as of December 31, 2008. Raw materials inventory decreased by $7.8 million and work-in-process inventory decreased by $2.5 million which was due to the Company’s focus on managing working capital and reducing inventory, as well as the benefits of Lean Six Sigma. Finished goods inventory decreased $3.9 million primarily due to the build up of inventory at December 31, 2008 in preparation for the consolidation of the NA Auto facilities.
Working capital and current ratio – Working capital at December 31, 2009 was $60.8 million, compared to $60.5 million at December 31, 2008. The ratio of current assets to current liabilities was 2.5:1 and 2.7:1 at December 31, 2009 and 2008, respectively.
33
Table of Contents
Capital expenditures – Capital expenditures were $5.9 million in 2009, $12.0 million in 2008, and $14.6 million in 2007. Capital spending for 2010 is expected to be approximately $9.0 million to $11.0 million.
Total debt to total capitalization – Total debt to total capitalization decreased to 4.1% in 2009 compared with 4.7% in 2008. The decrease was due to the combination of lower debt levels in 2009 as compared with 2008 and stockholders’ equity decreasing by $9.3 million, primarily from the net loss of $14.2 million in 2009.
Stockholders’ equity – Stockholders’ equity decreased to $156.8 million at December 31, 2009 from $166.1 million at December 31, 2008. This decrease was primarily due to a net loss of $14.2 million, partially offset by foreign currency translation adjustments of $1.9 million, pension liability adjustments of $1.7 million and $1.3 million of common stock activity and stock based compensation expense. On a per share basis, stockholders’ equity decreased to $9.17 at December 31, 2009 from $9.93 at December 31, 2008.
Dividend policy – The Company does not pay a cash dividend on its common stock, and the Company’s credit facility entered into on March 11, 2009 prohibits the Company from paying such cash dividend.
Off Balance Sheet Arrangements – Other than operating leases, the Company does not have any other material off-balance sheet financing arrangements.
Item 7A. QUANTITATIVE AND QUALITATIVE DISCLOSURES ABOUT MARKET RISK
Lydall’s significant market risk exposures relate to changes in foreign currency exchange rates and interest rates.
FOREIGN CURRENCY RISK
Lydall has sales and manufacturing activities in foreign countries. As a result, financial results could be affected by factors such as changes in foreign currency exchange rates or economic conditions in the foreign markets where the Company distributes its products. The Company’s primary currency exposure is to the Euro and, to a lesser degree, the Japanese Yen and the British Pound Sterling.
Lydall’s foreign and domestic operations limit foreign currency exchange transaction risk by completing transactions in local functional currencies whenever practicable. In addition, Lydall periodically enters into foreign currency forward exchange contracts to mitigate exposure to foreign currency volatility. Lydall utilizes bank loans and other debt instruments throughout its operations. To mitigate foreign currency risk, such debt is denominated primarily in the functional currency of the operation maintaining the debt.
INTEREST RATE RISK
The Company’s interest rate exposure is most sensitive to fluctuations in interest rates in the United States and Europe, which impact interest paid on its debt. At December 31, 2009, the Company had no loans or borrowings on lines of credit outstanding with variable interest rates, therefore, a 10% change in the weighted average interest rate on the Company’s variable rate debt would not have any impact to the Company’s consolidated financial position, results of operations, or cash flows. During 2008, at no time did the Company have any borrowings with variable interest rates. The weighted average interest rate paid on variable debt was 2.4% in 2009 and 6.2% in 2007.
The weighted average interest rate on long-term debt was 5.0% for the year ended December 31, 2009 compared with 5.2% for the years ended December 31, 2008 and December 31, 2007.
Item 8. FINANCIAL STATEMENTS AND SUPPLEMENTARY DATA
The response to this Item is contained under Item 15 “Exhibits, Financial Statement Schedules.”
Item 9. CHANGES IN AND DISAGREEMENTS WITH ACCOUNTANTS ON ACCOUNTING AND FINANCIAL DISCLOSURE
None
34
Table of Contents
Item 9A. CONTROLS AND PROCEDURES
Evaluation of Disclosure Controls and Procedures
The Company’s management, including the Company’s President and Chief Executive Officer and Vice President, Chief Financial Officer and Treasurer, conducted an evaluation as of December 31, 2009 of the effectiveness of the design and operation of the Company’s disclosure controls and procedures (as defined in Rule 13a-15(e) and Rule 15d-15(e)). Based on that evaluation, the President and Chief Executive Officer and Vice President, Chief Financial Officer and Treasurer concluded that the disclosure controls and procedures were effective in ensuring that all material information required to be disclosed in the reports the Company files and submits under the Securities and Exchange Act of 1934 has been made known to them on a timely basis and that it has been properly recorded, processed, summarized and reported, as required.
PwC LLP, independent registered public accounting firm that audited the consolidated financial statements included in this Annual Report, has issued an attestation report on the Company’s internal control over financial reporting as of December 31, 2009, which appears on page F-2 of this Annual Report on Form 10-K.
Changes in Internal Controls
There have not been any changes in the Company’s internal controls over financial reporting during the Company’s year ended December 31, 2009 that materially affected, or are reasonably likely to materially affect, the Company’s internal controls over financial reporting. See “Management’s Report on Internal Control Over Financial Reporting” on page F-1, which is incorporated by reference to this Item, for further discussion of management’s assessment of internal controls related to Section 404 of the Sarbanes-Oxley Act.
None
35
Table of Contents
Item 10. DIRECTORS, EXECUTIVE OFFICERS AND CORPORATE GOVERNANCE
Information required by this Item is incorporated by reference from the sections entitled “Nominees for Election as Directors” and “Corporate Governance” of the definitive Proxy Statement of Lydall to be filed with the Securities and Exchange Commission in connection with the Annual Meeting of Stockholders to be held on April 28, 2010. Information regarding the Executive Officers of the Company is contained in this Annual Report on Form 10-K.
Item 11. EXECUTIVE COMPENSATION
Information required by this Item is incorporated by reference from the sections entitled “Fiscal Year 2009 Director Compensation,” “Compensation Discussion and Analysis,” “Compensation Committee Report on Executive Compensation,” “Fiscal Year 2009 Summary Compensation Table,” “Grants of Plan-Based Awards For 2009,” “Outstanding Equity Awards at Fiscal Year-End 2009,” “Option Exercises and Stock Vested for 2009,” and “Pension Benefits in 2009” of the definitive Proxy Statement of Lydall to be filed with the Commission in connection with its Annual Meeting of Stockholders to be held on April 28, 2010.
Item 12. SECURITY OWNERSHIP OF CERTAIN BENEFICIAL OWNERS AND MANAGEMENT AND RELATED STOCKHOLDER MATTERS
Information required by this Item is incorporated by reference from the section entitled “Securities Ownership of Directors, Certain Officers and 5 Percent Beneficial Owners” of the definitive Proxy Statement of Lydall to be filed with the Commission in connection with its Annual Meeting of Stockholders to be held on April 28, 2010.
Item 13. CERTAIN RELATIONSHIPS AND RELATED TRANSACTIONS, AND DIRECTOR INDEPENDENCE
Information required by this Item is incorporated by reference from the sections entitled “Independence Determination,” “Related Party Transactions,” and “Compensation Committee Interlocks and Insider Participation” of the definitive Proxy Statement of Lydall to be filed with the Commission in connection with its Annual Meeting of Stockholders to be held on April 28, 2010.
Item 14. PRINCIPAL ACCOUNTING FEES AND SERVICES
Information required by this Item is incorporated by reference from the sections entitled “Ratification of Appointment of Independent Auditors,” and “Principal Fees and Services” of the definitive Proxy Statement of Lydall to be filed with the Commission in connection with its Annual Meeting of Stockholders to be held on April 28, 2010.
36
Table of Contents
Item 15. EXHIBITS, FINANCIAL STATEMENT SCHEDULES
| Page | ||
| Management’s Report on Internal Control Over Financial Reporting |
F-1 | |
| a) 1. Financial Statements: |
||
| F-2 | ||
| Consolidated Statements of Operations for the years ended December 31, 2009, 2008 and 2007 |
F-3 | |
| F-4 | ||
| Consolidated Statements of Cash Flows for the years ended December 31, 2009, 2008 and 2007 |
F-5 | |
| F-6 | ||
| F-7 | ||
| a) 2. Financial Statement Schedule: |
||
| Schedule II – Valuation and Qualifying Accounts for the years ended December 31, 2009, 2008 and 2007 |
F-36 |
Other schedules for which provision is made in the applicable accounting regulations of the Securities and Exchange Commission are not required under the related instructions, are inapplicable or are presented in “Notes to Consolidated Financial Statements” and therefore have been omitted.
37
Table of Contents
a) 3. Exhibits Included Herein or Incorporated by Reference:
| 3.1 | Certificate of Incorporation of the Registrant, as amended through the date of filing of this report, filed as Exhibit 3.1 to the Registrant’s Annual Report on Form 10-K dated March 12, 2004 and incorporated herein by this reference. | |
| 3.2 | Bylaws of the Registrant, as amended and restated as of December 11, 2003, filed as Exhibit 3.2 to the Registrant’s Annual Report on Form 10-K dated March 12, 2004 and incorporated herein by this reference. | |
| 4.1 | Certain long-term debt instruments, each representing indebtedness in an amount equal to less than 10 percent of the Registrant’s total consolidated assets, have not been filed as exhibits to this Annual Report on Form 10-K. The Registrant will file these instruments with the Commission upon request. | |
| 10.2 | Stock Purchase and Sale Agreement between Lydall, Inc., Lydall Transport, Ltd. and LTL Acquisition LLC dated September 1, 2008, filed as Exhibit 10.1 to the Registrant’s Form 8-K dated September 5, 2008 and incorporated herein by this reference. | |
| 10.3 | Capital lease agreement between Lydall Thermique Acoustique S.A.S., CMCIC Lease and Natiocredimurs Societe en Nom Collectif, filed as Exhibit 10.5 to the Registrant’s Quarterly Report on Form 10-Q dated November 9, 2004 and incorporated herein by reference. | |
| 10.4 | Loan and Security Agreement, filed as Exhibit 99.1 to the Registrant’s From 8-K dated March 17, 2009 and incorporated herein by this reference. | |
| 10.5 | Contract for a Consortium Credit in the Amount of €6,000,000, filed as Exhibit 10.2 to the Registrant’s Quarterly Report on Form 10-Q dated November 7, 2003 and incorporated herein by this reference. | |
| 10.6 | Supplement to the Contract for a Consortium Credit in the Amount of €6,000,000, filed as Exhibit 10.2 to the Registrant’s Quarterly Report on Form 10-Q dated November 7, 2007 and incorporated herein by this reference. | |
| 10.7* | Employment Agreement with Dale Barnhart dated July 31, 2007, filed as Exhibit 10.1 to the Registrant’s Form 8-K dated August 3, 2007 and incorporated herein by this reference. | |
| 10.8* | Employment Agreement with Erika H. Turner dated November 2, 2009, filed as Exhibit 10.1 to the Registrant’s Form 8-K dated November 4, 2009 and incorporated herein by this reference. | |
| 10.9* | Resignation of Employment and Retention as Consultant with Thomas P. Smith dated November 3, 2009, filed as Exhibit 10.2 to the Registrant’s Form 8-K dated November 4, 2009 and incorporated herein by this reference. | |
| 10.10* | Employment Agreement and Indemnification Agreement with Thomas P. Smith dated January 10, 2007, filed as Exhibit 10.2 to the Registrant’s Form 8-K dated January 16, 2007 and incorporated herein by this reference. | |
| 10.11* | Employment Agreement with Mona G. Estey dated January 10, 2007, filed as Exhibit 10.14 to the Registrant’s Annual Report on Form 10-K dated March 13, 2007 and incorporated herein by this reference. | |
| 10.12* | Employment Agreement with Mary A. Tremblay dated January 10, 2007, filed as Exhibit 10.15 to the Registrant’s Annual Report on Form 10-K dated March 13, 2007 and incorporated herein by this reference. | |
| 10.13* | Letter of Agreement, dated October 14, 2009, between Lydall, Inc. and Mary A. Tremblay, filed as Exhibit 10.1 to the Registrant’s From 8-K dated October 14, 2009 and incorporated herein by this reference. | |
| 10.14* | Employment Agreement with Peter V. Ferris dated January 29, 2007, filed as Exhibit 10.17 to the Registrant’s Annual Report on Form 10-K dated March 13, 2007 and incorporated herein by this reference. | |
| 10.15* | Amendment to Employment Agreement with Peter V. Ferris dated July 24, 2007, filed as Exhibit 10.1 to the Registrant’s Quarterly Report on Form 10-Q dated August 3, 2007 and incorporated herein by this reference. | |
| 10.16* | Employment Agreement with Joseph Wilsted dated June 26, 2008, filed as Exhibit 10.1 to the Registrant’s Quarterly Report on Form 10-Q dated August 4, 2008 and incorporated herein by this reference. | |
| 10.17* | Employment Agreement with Kevin T. Longe dated January 10, 2007, filed as Exhibit 10.4 to the Registrant’s Form 8-K dated January 16, 2007 and incorporated herein by this reference. | |
| 10.18* | Employment Agreement with Peter Kurto dated September 23, 2008, filed as Exhibit 10.1 to the Registrant’s Quarterly Report on Form 10-Q dated November 3, 2008 and incorporated herein by this reference. | |
| 10.19* | Indemnification Agreement with Dale Barnhart dated July 31, 2007, filed as Exhibit 10.2 to the Registrant’s Form 8-K dated August 3, 2007 and incorporated herein by this reference. | |
| 10.20* | Lydall, Inc. Annual Incentive Performance Bonus Program, filed as Exhibit 10.1 to the Registrant’s Form 8-K dated January 15, 2009 and incorporated herein by this reference. |
38
Table of Contents
| 10.21 | Form of Indemnification Agreement between Lydall, Inc. and non-employee directors, filed as Exhibit 10.1 to the Registrant’s Form 8-K dated June 19, 2009 and incorporated herein by this reference. | |
| 10.22* | Amended and restated, 1992 Stock Incentive Compensation Plan, dated May 14, 1992, amended through March 10, 1999, filed as Exhibit 10.9 to the Registrant’s Annual Report on Form 10-K dated March 21, 2001 and incorporated herein by this reference. | |
| 10.23* | Amended and Restatement of the Lydall 2003 Stock Incentive Compensation Plan, filed as Appendix A to the Company’s Definitive Proxy Statement on March 19, 2009 and incorporated herein by this reference. | |
| 10.24* | Form of Nonqualified Stock Option Agreement (Under the Lydall 2003 Stock Incentive Plan), filed as Exhibit 10.4 to the Registrant’s Form 8-K dated November 4, 2009 and incorporated herein by this reference. | |
| 10.25* | Form of Agreement Covering Annual Nonqualified Stock Option Awards to Outside Directors (Under the Lydall 2003 Stock Incentive Plan), filed as Exhibit 10.6 to the Registrant’s Form 8-K dated November 4, 2009 and incorporated herein by this reference. | |
| 10.26* | Form of Agreement Covering Nonqualified Stock Option Awards to Outside Directors in Lieu of Cash-Based Retirement Benefits (Under the Lydall 2003 Stock Incentive Plan), filed as Exhibit 10.7 to the Registrant’s Quarterly Report on Form 8-K dated November 4, 2009 and incorporated herein by this reference. | |
| 10.27* | Form of Incentive Stock Option Agreement (Under the Lydall 2003 Stock Incentive Plan), filed as Exhibit 10.3 to the Registrant’s Form 8-K dated November 4, 2009 and incorporated herein by this reference. | |
| 10.28* | Form of Restricted Stock Award Agreement (Under the Lydall 2003 Stock Incentive Plan), filed as Exhibit 10.5 to the Registrant’s Form 8-K dated November 4, 2009 and incorporated herein by this reference. | |
| 10.29* | Form of Lydall, Inc. Performance Share Award Agreement, filed as Exhibit 10.2 to the Registrant’s Form 8-K dated January 15, 2009 and incorporated herein by this reference. | |
| 10.30* | Form of Lydall, Inc. Performance Share Award Agreement (One-Year Period), filed herewith. | |
| 10.31 | Rights Agreement, dated as of June 23, 2009, between Lydall, Inc. and American Stock Transfer & Trust Company, LLC, filed as Exhibit 1 to the Registrant’s Form 8-K dated June 25, 2009 and incorporated herein by this reference. | |
| 10.32 | Amendment to Shareholder Rights Agreement, dated as of December 17, 2009, filed as Exhibit 4.01 to the Registrant’s Form 8-K dated December 22, 2009 and incorporated herein by this reference. | |
| 14.1 | Code of Ethics for the Chief Executive Officer, Senior Financial Officers and All Accounting and Financial Personnel, filed as Exhibit 14.1 to the Registrant’s Annual Report on Form 10-K dated March 12, 2004 and incorporated herein by this reference. This document can also be accessed on Lydall’s website at www.lydall.com under the Corporate Governance section. | |
| 21.1 | List of subsidiaries of the Registrant, filed herewith. | |
| 23.1 | Consent of PricewaterhouseCoopers LLP, filed herewith. | |
| 24.1 | Power of Attorney, dated February 24, 2010, authorizing Dale G. Barnhart and/or Erika H. Turner to sign this report on behalf of each member of the Board of Directors indicated therein, filed herewith. | |
| 31.1 | Certification Pursuant to Rule 13a-14(a) and Rule 15d-14(a) under the Securities Exchange Act of 1934, filed herewith. | |
| 31.2 | Certification Pursuant to Rule 13a-14(a) and Rule 15d-14(a) under the Securities Exchange Act of 1934, filed herewith. | |
| 32.1 | Certifications Pursuant to 18 U.S.C. Section 1350, as Adopted Pursuant to Section 906 of the Sarbanes-Oxley Act of 2002, furnished herewith. | |
| * | Management contract or compensatory plan. |
39
Table of Contents
Pursuant to the requirements of Section 13 or 15(d) of the Securities Exchange Act of 1934, Lydall, Inc. has duly caused this report to be signed on its behalf by the undersigned, thereunto duly authorized.
| LYDALL, INC. | ||||||
| February 26, 2010 |
By: | /s/ JAMES V. LAUGHLAN | ||||
| James V. Laughlan Principal Accounting Officer and Controller | ||||||
Pursuant to the requirements of the Securities Exchange Act of 1934, this report has been signed below by the following persons on behalf of Lydall, Inc. in the capacities and on the dates indicated.
| Signature | Title | Date | ||
| /s/ DALE G. BARNHART Dale G. Barnhart |
President, Chief Executive Officer and Director (Principal Executive Officer) |
February 26, 2010 | ||
| /s/ ERIKA H. TURNER Erika H. Turner |
Vice President, Chief Financial Officer and Treasurer (Principal Financial Officer) |
February 26, 2010 | ||
| /s/ JAMES V. LAUGHLAN James V. Laughlan |
Principal Accounting Officer and Controller |
February 26, 2010 | ||
| /s/ ERIKA H. TURNER Erika H. Turner Attorney-in-fact for: |
February 26, 2010 | |||
| Kathleen Burdett |
Director |
|||
| W. Leslie Duffy |
Chairman of the Board of Directors |
|||
| Matthew T. Farrell |
Director |
|||
| Marc T. Giles |
Director |
|||
| William D. Gurley |
Director |
|||
| Suzanne Hammett |
Director |
|||
| S. Carl Soderstrom, Jr. |
Director |
|||
40
Table of Contents
MANAGEMENT’S REPORT ON INTERNAL CONTROL OVER FINANCIAL REPORTING
Management of Lydall is responsible for establishing and maintaining adequate internal control over financial reporting, as such term is defined in Exchange Act Rule 13a-15(f). With the participation of the Chief Executive Officer and the Chief Financial Officer, management conducted an evaluation of the effectiveness of the Company’s internal control over financial reporting as of December 31, 2009 as required by Rule 13a-15(c) under the Securities Exchange Act of 1934. The Company utilized the criteria and framework established by the Committee of Sponsoring Organizations (COSO) of the Treadway Commission in Internal Control – Integrated Framework in performing this assessment. Based on this evaluation, management concluded that the Company’s internal control over financial reporting was effective as of December 31, 2009. Internal control over financial reporting is a process designed to provide reasonable assurance regarding the reliability of financial reporting and the preparation of financial statements for external purposes in accordance with generally accepted accounting principles. Because of its inherent limitations, internal control over financial reporting may not prevent or detect misstatements.
| /s/ DALE G. BARNHART |
/s/ ERIKA H. TURNER | |||
| Dale G. Barnhart President and Chief Executive Officer |
Erika H. Turner Vice President, Chief Financial Officer and Treasurer |
F-1
Table of Contents
REPORT OF INDEPENDENT REGISTERED PUBLIC ACCOUNTING FIRM
To the Board of Directors and
Stockholders of Lydall, Inc.:
In our opinion, the consolidated financial statements listed in the index appearing under item 15(a)(1) present fairly, in all material respects, the financial position of Lydall, Inc and its subsidiaries at December 31, 2009 and December 31, 2008, and the results of their operations and their cash flows for each of the three years in the period ended December 31, 2009 in conformity with accounting principles generally accepted in the United States of America. In addition, in our opinion, the financial statement schedule listed in the index appearing under Item 15(a)(2) presents fairly, in all material respects, the information set forth therein when read in conjunction with the related consolidated financial statements. Also in our opinion, the Company maintained, in all material respects, effective internal control over financial reporting as of December 31, 2009, based on criteria established in Internal Control – Integrated Framework issued by the Committee of Sponsoring Organizations of the Treadway Commission (COSO). The Company’s management is responsible for these financial statements and financial statement schedule, for maintaining effective internal control over financial reporting and for its assessment of the effectiveness of internal control over financial reporting, included in the accompanying Management’s Report on Internal Control Over Financial Reporting. Our responsibility is to express opinions on these financial statements, on the financial statement schedule, and on the Company’s internal control over financial reporting based on our integrated audits. We conducted our audits in accordance with the standards of the Public Company Accounting Oversight Board (United States). Those standards require that we plan and perform the audits to obtain reasonable assurance about whether the financial statements are free of material misstatement and whether effective internal control over financial reporting was maintained in all material respects. Our audits of the financial statements included examining, on a test basis, evidence supporting the amounts and disclosures in the financial statements, assessing the accounting principles used and significant estimates made by management, and evaluating the overall financial statement presentation. Our audit of internal control over financial reporting included obtaining an understanding of internal control over financial reporting, assessing the risk that a material weakness exists, and testing and evaluating the design and operating effectiveness of internal control based on the assessed risk. Our audits also included performing such other procedures as we considered necessary in the circumstances. We believe that our audits provide a reasonable basis for our opinions.
A company’s internal control over financial reporting is a process designed to provide reasonable assurance regarding the reliability of financial reporting and the preparation of financial statements for external purposes in accordance with generally accepted accounting principles. A company’s internal control over financial reporting includes those policies and procedures that (i) pertain to the maintenance of records that, in reasonable detail, accurately and fairly reflect the transactions and dispositions of the assets of the company; (ii) provide reasonable assurance that transactions are recorded as necessary to permit preparation of financial statements in accordance with generally accepted accounting principles, and that receipts and expenditures of the company are being made only in accordance with authorizations of management and directors of the company; and (iii) provide reasonable assurance regarding prevention or timely detection of unauthorized acquisition, use, or disposition of the company’s assets that could have a material effect on the financial statements.
Because of its inherent limitations, internal control over financial reporting may not prevent or detect misstatements. Also, projections of any evaluation of effectiveness to future periods are subject to the risk that controls may become inadequate because of changes in conditions, or that the degree of compliance with the policies or procedures may deteriorate.
| /s/ PRICEWATERHOUSECOOPERS LLP |
| PricewaterhouseCoopers LLP Hartford, Connecticut February 26, 2010 |
F-2
Table of Contents
CONSOLIDATED STATEMENTS OF OPERATIONS
| |
For the years ended December 31, |
| ||||||||||
| In thousands except per share data | 2009 | 2008 | 2007 | |||||||||
| Net sales |
$ | 248,947 | $ | 305,716 | $ | 320,917 | ||||||
| Cost of sales |
215,482 | 242,836 | 248,484 | |||||||||
| Gross margin |
33,465 | 62,880 | 72,433 | |||||||||
| Selling, product development and administrative expenses |
50,783 | 54,958 | 57,281 | |||||||||
| Impairment of goodwill and long-lived assets |
— | 17,409 | — | |||||||||
| Operating (loss) income from continuing operations |
(17,318 | ) | (9,487 | ) | 15,152 | |||||||
| Interest expense |
814 | 451 | 490 | |||||||||
| Other income, net |
(232 | ) | (133 | ) | (140 | ) | ||||||
| (Loss) Income from continuing operations before income taxes |
(17,900 | ) | (9,805 | ) | 14,802 | |||||||
| Income tax (benefit) expense from continuing operations |
(3,742 | ) | (3,717 | ) | 6,244 | |||||||
| (Loss) Income from continuing operations |
(14,158 | ) | (6,088 | ) | 8,558 | |||||||
| Income from discontinued operations, net |
— | 1,052 | 549 | |||||||||
| Net (loss) income |
$ | (14,158 | ) | $ | (5,036 | ) | $ | 9,107 | ||||
| Basic (loss) earnings per common share: |
||||||||||||
| (Loss) Income from continuing operations |
$ | (.85 | ) | $ | (.37 | ) | $ | .53 | ||||
| Income from discontinued operations |
$ | — | $ | .06 | $ | .03 | ||||||
| Net (loss) income |
$ | (.85 | ) | $ | (.31 | ) | $ | .56 | ||||
| Weighted average common shares outstanding |
16,567 | 16,458 | 16,295 | |||||||||
| Diluted (loss) earnings per common share: |
||||||||||||
| (Loss) Income from continuing operations |
$ | (.85 | ) | $ | (.37 | ) | $ | .52 | ||||
| Income from discontinued operations |
$ | — | $ | .06 | $ | .03 | ||||||
| Net (loss) income |
$ | (.85 | ) | $ | (.31 | ) | $ | .55 | ||||
| Weighted average common shares and equivalents outstanding |
16,567 | 16,458 | 16,472 | |||||||||
The accompanying notes are an integral part of these consolidated financial statements.
F-3
Table of Contents
CONSOLIDATED BALANCE SHEETS
| December 31, |
||||||||
| In thousands of dollars and shares | 2009 | 2008 | ||||||
| Assets |
||||||||
| Current assets: |
||||||||
| Cash and cash equivalents |
$ | 22,721 | $ | 13,660 | ||||
| Accounts receivable (net of allowance for doubtful receivables of $1,333 and $1,275, respectively) |
39,766 | 34,297 | ||||||
| Inventories, net |
26,571 | 40,772 | ||||||
| Taxes receivable |
4,651 | 1,992 | ||||||
| Prepaid expenses and other current assets, net |
6,413 | 5,112 | ||||||
| Total current assets |
100,122 | 95,833 | ||||||
| Property, plant and equipment, net |
93,884 | 101,889 | ||||||
| Restricted cash |
— | 2,400 | ||||||
| Goodwill and other intangible assets |
26,403 | 27,099 | ||||||
| Deferred tax assets |
2,771 | 3,126 | ||||||
| Other assets, net |
1,772 | 5,402 | ||||||
| Total assets |
$ | 224,952 | $ | 235,749 | ||||
| Liabilities and Stockholders’ Equity |
||||||||
| Current liabilities: |
||||||||
| Current portion of long-term debt |
$ | 1,531 | $ | 1,455 | ||||
| Accounts payable |
25,959 | 20,507 | ||||||
| Accrued payroll and other compensation |
5,794 | 7,566 | ||||||
| Other accrued liabilities |
6,028 | 5,839 | ||||||
| Total current liabilities |
39,312 | 35,367 | ||||||
| Long-term debt |
5,220 | 6,699 | ||||||
| Deferred tax liabilities |
6,614 | 7,332 | ||||||
| Pension and other long-term liabilities |
16,998 | 20,206 | ||||||
| Commitments and contingencies (Note 16) |
||||||||
| Stockholders’ equity: |
||||||||
| Preferred stock (par value $1.00 per share; authorized 500,000 shares; none issued or outstanding) |
— | — | ||||||
| Common stock (par value $.10 per share; authorized 30,000 shares; issued 23,560 and 23,172 shares, respectively) |
2,356 | 2,317 | ||||||
| Capital in excess of par value |
53,394 | 52,071 | ||||||
| Retained earnings |
169,502 | 183,660 | ||||||
| Accumulated other comprehensive loss |
(3,355 | ) | (6,920 | ) | ||||
| Treasury stock, 6,461 and 6,442 shares of common stock, respectively, at cost |
(65,089 | ) | (64,983 | ) | ||||
| Total stockholders’ equity |
156,808 | 166,145 | ||||||
| Total liabilities and stockholders’ equity |
$ | 224,952 | $ | 235,749 | ||||
The accompanying notes are an integral part of these consolidated financial statements.
F-4
Table of Contents
CONSOLIDATED STATEMENTS OF CASH FLOWS
| For the years ended December 31, |
||||||||||||
| In thousands | 2009 | 2008 | 2007 | |||||||||
| Cash flows from operating activities: | ||||||||||||
| Net (loss) income |
$ | (14,158 | ) | $ | (5,036 | ) | $ | 9,107 | ||||
| Adjustments to reconcile net (loss) income to net cash provided by operating activities: |
||||||||||||
| Gain from discontinued operations, net of tax |
— | (860 | ) | — | ||||||||
| Depreciation and amortization |
15,722 | 15,935 | 15,227 | |||||||||
| Amortization of debt issuance costs |
335 | 15 | 46 | |||||||||
| Deferred income taxes |
(1,073 | ) | (5,379 | ) | 2,814 | |||||||
| Stock based compensation |
1,425 | 903 | 937 | |||||||||
| Loss on disposition of property, plant and equipment, net |
103 | 489 | 267 | |||||||||
| Impairment of goodwill and long-lived assets |
— | 17,409 | — | |||||||||
| Changes in operating assets and liabilities (exclusive of impact of acquisitions): |
||||||||||||
| Accounts receivable |
(4,666 | ) | 12,088 | 120 | ||||||||
| Taxes receivable |
(2,710 | ) | (70 | ) | (720 | ) | ||||||
| Inventories |
14,677 | (3,486 | ) | (4,162 | ) | |||||||
| Prepaid expenses and other assets |
(915 | ) | (1,292 | ) | 1,358 | |||||||
| Accounts payable |
5,188 | (6,658 | ) | 1,746 | ||||||||
| Accrued taxes |
484 | (1,687 | ) | (2,117 | ) | |||||||
| Accrued payroll and other compensation |
(2,022 | ) | (56 | ) | (1,437 | ) | ||||||
| Proceeds from surrender of life insurance policies |
3,830 | — | — | |||||||||
| Supplemental executive retirement settlement payments |
(1,433 | ) | — | — | ||||||||
| Other liabilities, net |
(720 | ) | (2,217 | ) | (1,053 | ) | ||||||
| Net cash provided by operating activities |
14,067 | 20,098 | 22,133 | |||||||||
| Cash flows from investing activities: |
||||||||||||
| Proceeds from sale of operation, net |
— | 3,351 | — | |||||||||
| Acquisitions, net |
(128 | ) | (10,148 | ) | — | |||||||
| Capital expenditures |
(5,921 | ) | (12,037 | ) | (14,610 | ) | ||||||
| Release of (increase in) restricted cash |
2,400 | (2,400 | ) | — | ||||||||
| Net cash used for investing activities |
(3,649 | ) | (21,234 | ) | (14,610 | ) | ||||||
| Cash flows from financing activities: |
||||||||||||
| Debt proceeds |
8,816 | — | 31,251 | |||||||||
| Debt repayments |
(9,092 | ) | (250 | ) | (31,473 | ) | ||||||
| Capital lease payments |
(1,287 | ) | (1,064 | ) | (1,032 | ) | ||||||
| Common stock repurchased |
(106 | ) | (82 | ) | (71 | ) | ||||||
| Common stock issued |
— | 1,134 | 2,556 | |||||||||
| Net cash (used for) provided by financing activities |
(1,669 | ) | (262 | ) | 1,231 | |||||||
| Effect of exchange rate changes on cash |
312 | (658 | ) | 560 | ||||||||
| Increase (decrease) in cash and cash equivalents |
9,061 | (2,056 | ) | 9,314 | ||||||||
| Cash and cash equivalents at beginning of year |
13,660 | 15,716 | 6,402 | |||||||||
| Cash and cash equivalents at end of year |
$ | 22,721 | $ | 13,660 | $ | 15,716 | ||||||
| Supplemental Schedule of Cash Flow Information |
||||||||||||
| Cash paid during the year for: |
||||||||||||
| Interest |
$ | 479 | $ | 451 | $ | 598 | ||||||
| Income taxes |
$ | 842 | $ | 2,448 | $ | 6,597 | ||||||
| Noncash transactions: |
||||||||||||
| Pension liability adjustment |
$ | 2,768 | $ | (14,671 | ) | $ | 2,005 | |||||
The accompanying notes are an integral part of these consolidated financial statements.
F-5
Table of Contents
CONSOLIDATED STATEMENTS OF CHANGES IN STOCKHOLDERS’ EQUITY
| In thousands | Common Shares |
Common Amount |
Capital in Excess of Par Value |
Retained Earnings |
Accumulated Compre- |
Treasury Stock |
Total Stock- holders’ Equity |
||||||||||||||||||
| Balance at December 31, 2006 |
22,676 | $ | 2,268 | $ | 46,639 | $ | 179,911 | $ | (2,771 | ) | $ | (64,830 | ) | $ | 161,217 | ||||||||||
| Net income |
9,107 | 9,107 | |||||||||||||||||||||||
| Other comprehensive income: |
|||||||||||||||||||||||||
| Foreign currency translation adjustments |
5,811 | 5,811 | |||||||||||||||||||||||
| Change in pension plans, net of income taxes of $762 |
1,243 | 1,243 | |||||||||||||||||||||||
| Change in fair value of derivative instrument, net of income tax benefits of $19 |
(31 | ) | (31 | ) | |||||||||||||||||||||
| Comprehensive income |
16,130 | ||||||||||||||||||||||||
| FIN 48 Adjustment |
(322 | ) | (322 | ) | |||||||||||||||||||||
| Stock repurchased |
(71 | ) | (71 | ) | |||||||||||||||||||||
| Stock issued under employee plans |
314 | 32 | 2,362 | 2,394 | |||||||||||||||||||||
| Stock based compensation expense |
937 | 937 | |||||||||||||||||||||||
| Stock issued to Directors |
14 | 1 | 167 | 168 | |||||||||||||||||||||
| Balance at December 31, 2007 |
23,004 | 2,301 | 50,105 | 188,696 | 4,252 | (64,901 | ) | 180,453 | |||||||||||||||||
| Net loss |
(5,036 | ) | (5,036 | ) | |||||||||||||||||||||
| Other comprehensive income: |
|||||||||||||||||||||||||
| Foreign currency translation adjustments |
(2,174 | ) | (2,174 | ) | |||||||||||||||||||||
| Change in pension plans, net of income tax benefit of $5,575 |
(9,096 | ) | (9,096 | ) | |||||||||||||||||||||
| Change in fair value of derivative instrument, net of income taxes of $60 |
98 | 98 | |||||||||||||||||||||||
| Comprehensive loss |
(16,208 | ) | |||||||||||||||||||||||
| Stock repurchased |
(82 | ) | (82 | ) | |||||||||||||||||||||
| Stock issued under employee plans |
136 | 13 | 745 | 758 | |||||||||||||||||||||
| Stock based compensation expense |
972 | 972 | |||||||||||||||||||||||
| Stock issued to Directors |
32 | 3 | 249 | 252 | |||||||||||||||||||||
| Balance at December 31, 2008 |
23,172 | 2,317 | 52,071 | 183,660 | (6,920 | ) | (64,983 | ) | 166,145 | ||||||||||||||||
| Net loss |
(14,158 | ) | (14,158 | ) | |||||||||||||||||||||
| Other comprehensive income: |
|||||||||||||||||||||||||
| Foreign currency translation adjustments |
1,859 | 1,859 | |||||||||||||||||||||||
| Change in pension plans, net of income taxes of $1,052 |
1,716 | 1,716 | |||||||||||||||||||||||
| Change in fair value of derivative instrument, net of income tax benefit of $6 |
(10 | ) | (10 | ) | |||||||||||||||||||||
| Comprehensive loss |
(10,593 | ) | |||||||||||||||||||||||
| Stock repurchased |
(106 | ) | (106 | ) | |||||||||||||||||||||
| Stock issued under employee plans |
326 | 33 | (96 | ) | (63 | ) | |||||||||||||||||||
| Stock based compensation expense |
1,173 | 1,173 | |||||||||||||||||||||||
| Stock issued to Directors |
62 | 6 | 246 | 252 | |||||||||||||||||||||
| Balance at December 31, 2009 |
23,560 | $ | 2,356 | $ | 53,394 | $ | 169,502 | $ | (3,355 | ) | $ | (65,089 | ) | $ | 156,808 | ||||||||||
The accompanying notes are an integral part of these consolidated financial statements.
F-6
Table of Contents
NOTES TO CONSOLIDATED FINANCIAL STATEMENTS
1. Significant Accounting Policies
Business – Lydall, Inc. and its subsidiaries (the “Company” or “Lydall”) design and manufacture specialty engineered automotive thermal and acoustical barriers, filtration media, industrial thermal insulating solutions, temperature-control equipment, medical filtration media and devices and biopharmaceutical processing components for demanding thermal/acoustical, filtration/separation and bio/medical applications.
Principles of consolidation – The consolidated financial statements include the accounts of Lydall, Inc. and its subsidiaries. All significant intercompany accounts and transactions have been eliminated.
Estimates and assumptions – The preparation of the Company’s consolidated financial statements in conformity with accounting principles generally accepted in the United States of America requires management to make estimates and assumptions that affect the reported amounts of assets and liabilities and the disclosure of contingent assets and liabilities at the financial statement dates and the reported amounts of revenues and expenses during the reporting periods. Actual results could differ from those estimates.
Risks and uncertainties – The Company’s 2009 operating results were negatively impacted by a global economic recession and economic uncertainties. Among other factors, disruptions in the global credit and financial markets, including diminished liquidity and credit availability, declines in consumer confidence and spending, declines in economic growth and increases in unemployment rates have caused economic instability. Worldwide economic cycles, and the effects on the markets in which the Company operates, are difficult to predict. These economic uncertainties affect businesses such as the Company’s in a number of ways, including the results of operations and liquidity, as well as making it difficult to accurately forecast and plan future business activities.
Cash and cash equivalents – Cash and cash equivalents include cash on hand and highly liquid investments with original maturities of three months or less at the date of purchase.
Restricted cash – Restricted cash represents balances with financial institutions not immediately available for use by the Company. The Company had no restricted cash as of December 31, 2009 and $2.4 million as of December 31, 2008. The restrictions on the Company’s cash at December 31, 2008 related to outstanding domestic letters of credit, issued during the ordinary course of business, to satisfy security deposit requirements. These domestic letters of credit were secured by the Company’s cash, which was held in a money market account at a financial institution. Restricted cash was reported as a non-current asset of the Company at December 31, 2008.
Concentrations of credit risk – Financial instruments that potentially subject the Company to concentrations of credit risk consist principally of cash and cash equivalents and trade accounts receivable. The Company places its cash and cash equivalents in high-quality financial institutions and instruments with a minimum investment grade rating of BBB or better. Concentrations of credit risk with respect to trade accounts receivable are limited by the large number of customers comprising the Company’s customer base and their dispersion across many different industries and geographies. Foreign and export sales were 50% of the Company’s net sales in 2009, 53% in 2008 and 48% in 2007. Export sales primarily to Europe, Asia, Mexico and Canada were $28.8 million, $44.0 million and $47.5 million in 2009, 2008 and 2007, respectively. The Company performs ongoing credit evaluations of its customers’ financial condition and generally does not require collateral. Sales to the automotive market were approximately 51% of the Company’s net sales in 2009, 54% in 2008 and 55% in 2007. Sales to Ford were approximately 10% of Lydall’s 2009 net sales. Sales to Volkswagen and Chrysler were each approximately 10% of net sales in 2008. Sales to Chrysler were approximately 14% of Lydall’s 2007 net sales. No other customer accounted for more than 10% of total net sales in 2009, 2008 or 2007. At December 31, 2009, Ford Motor Company and Chrysler represented approximately 12% and 10%, respectively, of total accounts receivable. No other customers accounted for more than 10% of total accounts receivable at December 31, 2009 or 2008.
Inventories – Inventories are valued at lower of cost or market, cost being determined using the first-in, first-out (FIFO) cost method. Inventories in excess of requirements for current or anticipated orders have been reserved as appropriate.
F-7
Table of Contents
Pre-production design and development costs – The Company enters into contractual agreements with certain customers to design and develop molds, dies and tools (collectively, “tooling”). All such tooling contracts relate to products that the Company will supply to customers under long-term supply agreements. Tooling costs are accumulated in work-in process inventory and are charged to operations as the related revenue from the tooling is recognized. Revenue is recognized as tooling is delivered and accepted by the customer. The Company also may progress bill on certain tooling being constructed. These billings are recorded as progress billings (a reduction of the associated work-in-process inventory) until the appropriate revenue recognition criteria have been met.
Periodically, the Company enters into contractually guaranteed reimbursement arrangements as a mechanism to collect amounts due from customers from tooling sales. Under these arrangements, amounts due from tooling sales are collected as parts are delivered over the part supply arrangement, in accordance with the specific terms of the arrangement. The amounts due from the customer in such transactions are recorded in “Prepaid expenses and other current assets, net” or “Other assets, net” based upon the expected term of the reimbursement arrangement.
The following tooling related assets were included in the Consolidated Balance Sheets as of December 31, 2009 and 2008:
| |
December 31, | |||||
| In thousands | 2009 | 2008 | ||||
| Inventories, net of progress billings and reserves |
$ | 4,269 | $ | 3,894 | ||
| Prepaid expenses and other current assets, net |
1,224 | 356 | ||||
| Other assets, net |
35 | 315 | ||||
| Total tooling related assets |
$ | 5,528 | $ | 4,565 | ||
Amounts included in “Prepaid expenses and other current assets, net” include the short-term portion of receivables due under contractually guaranteed reimbursement arrangements and amounts included in “Other assets, net” represent the long-term portion of those receivables. Included in the inventory balance was an offset for progress billings of $1.3 million and $0.9 million at December 31, 2009 and 2008, respectively. Company owned tooling is recorded in “Property, plant and equipment, net” and was not material at December 31, 2009 or December 31, 2008.
Property, plant and equipment – Property, plant, and equipment are stated at cost. Assets held under capital leases are recorded at the lower of the net present value of the minimum lease payments or the fair value of the leased asset at the inception of the lease. Property, plant and equipment, including property, plant and equipment under capital leases, are depreciated over their estimated useful lives using the straight-line method. Leasehold improvements are depreciated on a straight-line basis over the term of the lease or the life of the asset, whichever is shorter. The cost and accumulated depreciation amounts applicable to assets sold or otherwise disposed of are removed from the asset and accumulated depreciation accounts and any net gain or loss is included in the Consolidated Statements of Operations. Expenses for maintenance and repairs are charged to expense as incurred.
Goodwill and other intangible assets – Goodwill represents costs in excess of fair values assigned to the underlying net assets of acquired companies, net of accumulated amortization. Goodwill and other intangible assets with indefinite lives are not amortized but are subject to annual impairment tests. All other intangible assets are amortized over their estimated useful lives, which range from 4 to 20 years. In performing impairment tests, the Company considers current market capitalization, discounted cash flows and other factors as best evidence of fair value. There are inherent uncertainties and management judgment required in these analyses. Refer to Note 15 for discussion of impairment charges recorded in the fourth quarter of 2008.
Valuation of long-lived assets – The Company evaluates the recoverability of long-lived assets, or asset groups, whenever events or changes in circumstances indicate that carrying amounts may not be recoverable. Should such evaluations indicate that the related future undiscounted cash flows are not sufficient to recover the carrying values of the assets, such carrying values would be reduced to fair value and this adjusted carrying value would become the assets’ new cost basis. Fair value is determined primarily using future anticipated cash flows that are directly associated with, and that are expected to arise as a direct result of the use and eventual disposition of the asset, or asset group, discounted using an interest rate commensurate with the risk involved, as well as market conditions and other factors. Refer to Note 15 for discussion of impairment charges recorded in the fourth quarter of 2008.
F-8
Table of Contents
Derivative instruments – The Company recognizes derivative instruments as either assets or liabilities on the balance sheet and measures them at fair value. Gains and losses resulting from changes in the fair values of the derivatives are reported in the consolidated statement of operations, or as accumulated other comprehensive income, a separate component of stockholders’ equity, depending of the type of derivative and whether they qualify for hedge accounting. In general, the types of risks being hedged by the Company are related to the variability of future cash flows caused by changes in foreign currency exchange rates and the fair value of recorded intercompany assets or liabilities. The Company does not engage in derivative instruments for speculative purposes.
Employer sponsored benefit plans – The Company recognizes the funded status of its defined benefit plans as well as provides required disclosures. Net benefit obligations are calculated based on actuarial valuations using key assumptions related to discount rates and expected return on plan assets.
Asset retirement obligations – The Company records asset retirement obligation liabilities at fair value in the period in which it occurred if a reasonable estimate of fair value can be made. The Company has conditional legal obligations for certain of the Company’s owned and leased facilities related primarily to building materials and leasehold improvements.
Accrued liabilities for conditional asset retirement obligations as of December 31, 2009 were as follows:
| In thousands | Total | |||
| Balance as of December 31, 2008 |
$ | 582 | ||
| Additions |
92 | |||
| Accretion |
70 | |||
| Payments |
(62 | ) | ||
| Foreign currency translation |
8 | |||
| Balance as of December 31, 2009 |
$ | 690 | ||
Revenue recognition – The Company recognizes revenue (1) once evidence of an arrangement exists; (2) product delivery has occurred; (3) pricing is fixed or determinable; and (4) collection is reasonably assured. The four criteria required to recognize revenue are considered to be met, and the passage of title to the customer occurs, at the respective FOB point and, therefore, revenue is recognized at that time. The Company’s standard sales and shipping terms are FOB shipping point, therefore, substantially all revenue is recognized upon shipment. However, in limited circumstances, the Company conducts business with certain customers on FOB destination terms and in these instances revenue is recognized upon receipt by the customer. The Company generally does not provide specific customer inspection or acceptance provisions in its sales terms, with the exception of tooling sales discussed in “Pre-production design and development costs” above.
Sales returns and allowances are recorded as identified or communicated by the customer and internally approved. The Company does not provide customers with general rights of return for products sold; however, in limited circumstances, the Company will allow sales returns and allowances from customers if the products sold do not conform to specifications.
Shipping and handling costs consist primarily of costs incurred to deliver products to customers and internal costs related to preparing products for shipment and are recorded in cost of sales. Amounts billed to customers as shipping and handling are classified as revenue.
Research and development – Research and development costs are charged to expense as incurred and amounted to $7.9 million in 2009, $8.5 million in 2008 and $8.5 million in 2007. Research and development costs were primarily comprised of development personnel salaries, prototype material costs and testing and trials of new products.
Earnings per share – Basic earnings per common share are equal to net income divided by the weighted average number of common shares outstanding during the period. Diluted earnings per common share are equal to net income divided by the weighted average number of common shares outstanding during the period, including the effect of stock options and stock awards, if such effect is dilutive.
Income taxes – The provision for income taxes is based upon income reported in the accompanying consolidated financial statements. Deferred income taxes reflect the impact of temporary differences between the amounts of income and expense recognized for financial reporting purposes and such amounts recognized for tax purposes.
F-9
Table of Contents
Translation of foreign currencies – Assets and liabilities of foreign subsidiaries are translated at exchange rates prevailing on the balance sheet date. Revenues and expenses are translated at average exchange rates prevailing during the period. Any resulting translation gains or losses are reported in other comprehensive income.
Stock options and share grants – The Company accounts for awards of equity instruments under the fair value method of accounting and recognizes such amounts in the statements of operations. The Company recognizes expense on a straight-line basis over the vesting period of the entire award. Stock-based compensation expense includes the estimated effects of forfeitures, and such estimates of forfeitures are adjusted over the requisite service period to the extent actual forfeitures differ, or are expected to differ, from such estimates. The effect of changes in estimated forfeitures is recognized in the period of change and also impacts the amount of expense to be recognized in future periods. The Company estimates the fair value of option grants based on the Black Scholes option-pricing model. Expected volatility and expected term are based on historical information. The Company believes that its future volatility and expected term are not likely to materially differ from the Company’s historical stock price volatility and historical exercise data, respectively. Compensation expense for restricted stock is recorded based on the market value of the stock on the grant date and recognized as expense over the vesting period of the award.
Reclassification of financial information – Certain prior year components of the consolidated financial statements have been reclassified to be consistent with current year presentation.
In 2008, the Company sold its wholly owned subsidiary, Lydall Transport, Ltd. (Transport). The Consolidated Financial Statements for the year ended December 31, 2007 have been reclassified to reflect Transport as a discontinued operation (See Note 9).
2. Inventories
Inventories as of December 31, 2009 and 2008 were as follows:
| |
December 31, |
| ||||||
| In thousands | 2009 | 2008 | ||||||
| Raw materials |
$ | 9,692 | $ | 17,537 | ||||
| Work in process |
9,063 | 11,080 | ||||||
| Finished goods |
9,108 | 13,032 | ||||||
| 27,863 | 41,649 | |||||||
| Less: Progress billings |
(1,292 | ) | (877 | ) | ||||
| Total inventories |
$ | 26,571 | $ | 40,772 | ||||
Progress billings on tooling inventory were $1.3 million and $0.9 million at December 31, 2009 and 2008, respectively. Total tooling inventory, net of progress billings was $4.3 million and $3.9 million at December 31, 2009 and 2008, respectively.
F-10
Table of Contents
3. Property, Plant and Equipment
Property, plant and equipment as of December 31, 2009 and 2008 were as follows:
| Estimated Useful Lives |
|
December 31, |
| |||||||
| In thousands | 2009 | 2008 | ||||||||
| Land |
— | $ | 2,467 | $ | 2,435 | |||||
| Buildings and improvements |
10-35 years | 47,170 | 43,388 | |||||||
| Machinery and equipment |
5-25 years | 147,225 | 143,163 | |||||||
| Office equipment |
2-8 years | 34,360 | 34,599 | |||||||
| Vehicles |
3-6 years | 650 | 625 | |||||||
| Assets under capital leases: |
||||||||||
| Land |
— | 720 | 703 | |||||||
| Buildings and improvements |
10-35 years | 6,291 | 6,227 | |||||||
| Machinery and Equipment |
5-25 years | 4,288 | 4,184 | |||||||
| 243,171 | 235,324 | |||||||||
| Accumulated depreciation |
(148,299 | ) | (135,769 | ) | ||||||
| Accumulated amortization on capital leases |
(3,562 | ) | (2,813 | ) | ||||||
| 91,310 | 96,742 | |||||||||
| Construction in progress |
2,574 | 5,147 | ||||||||
| Total property, plant and equipment |
$ | 93,884 | $ | 101,889 | ||||||
Depreciation expense was $14.8 million in 2009, $15.7 million in 2008 and $15.1 million in 2007.
4. Goodwill and Intangible Assets
Goodwill was $19.3 million as of December 31, 2009 compared to $19.4 million as of December 31, 2008. As of December 31, 2009, $14.6 million of goodwill was allocated to the Performance Materials segment and $4.7 million was allocated to Other Products and Services (OPS).
During the fourth quarter of 2009, the Company performed its annual impairment analysis of the $14.6 million of goodwill in the Performance Materials reporting unit and $4.7 million of goodwill in the Vital Fluids reporting unit, included in OPS. The Company’s goodwill impairment testing analysis (analysis) included projecting cash flows for the years 2010 – 2014 and discounting those amounts based on appropriate market risks. Based on those projections and other assumptions used in the analysis, the Company concluded that the fair value of these reporting units exceeded their carrying value of net assets. As a result, there was no impairment of goodwill.
Gross and net carrying amounts of goodwill at December 31, 2008 and 2009 are as follows:
| In thousands | Performance Materials |
Thermal/ Acoustical |
Other Products and Services |
Totals | |||||||||||
| Goodwill |
$ | 14,746 | $ | 12,160 | $ | 8,879 | $ | 35,785 | |||||||
| Accumulated impairment losses |
— | (12,160 | ) | (4,219 | ) | (16,379 | ) | ||||||||
| Balance at December 31, 2008 |
$ | 14,746 | $ | — | $ | 4,660 | $ | 19,406 | |||||||
| Goodwill |
14,598 | 12,160 | 8,879 | 35,637 | |||||||||||
| Accumulated impairment losses |
— | (12,160 | ) | (4,219 | ) | (16,379 | ) | ||||||||
| Balance at December 31, 2009 |
$ | 14,598 | $ | — | $ | 4,660 | $ | 19,258 | |||||||
F-11
Table of Contents
The changes in the carrying amounts of goodwill in 2008 and 2009 are as follows:
| In thousands | Performance Materials |
Thermal/ Acoustical |
Other Products and Services |
Totals | ||||||||||||
| Balance at January 1, 2008 |
$ | — | $ | 26,224 | $ | 4,660 | $ | 30,884 | ||||||||
| Operating segment reorganization |
9,845 | (14,064 | ) | 4,219 | — | |||||||||||
| Goodwill acquired |
4,419 | — | — | 4,419 | ||||||||||||
| Goodwill impairment |
— | (12,160 | ) | (4,219 | ) | (16,379 | ) | |||||||||
| Currency translation adjustments |
482 | — | — | 482 | ||||||||||||
| Balance at December 31, 2008 |
$ | 14,746 | $ | — | $ | 4,660 | $ | 19,406 | ||||||||
| Goodwill adjustment |
(243 | ) | — | — | (243 | ) | ||||||||||
| Currency translation adjustments |
95 | — | — | 95 | ||||||||||||
| Balance at December 31, 2009 |
$ | 14,598 | $ | — | $ | 4,660 | $ | 19,258 | ||||||||
The goodwill adjustment in 2009 was related to the acquisition of DSM Solutech B.V. (Solutech) in December 2008. This acquisition was accounted for using the purchase method set forth in the guidance for Business Combinations, whereby the purchase consideration was allocated to the estimated fair values of the assets acquired and liabilities assumed at the effective date of the purchase. The Company made a preliminary allocation of the purchase price of € 8.6 million (or $10.8 million) in the fourth quarter of 2008. This preliminary allocation was subsequently revised during 2009 upon final resolution of certain adjustments to the purchase price detailed in the Sale and Purchase Agreement between the Company and seller, resulting in a reduction of goodwill by approximately $0.2 million.
The table below presents the gross carrying amount and, as applicable, the accumulated amortization of the Company’s acquired intangible assets other than goodwill included in “Goodwill and other intangible assets” in the Consolidated Balance Sheets as of December 31, 2009 and 2008:
| |
December 31, 2009 |
|
|
December 31, 2008 |
| |||||||||
| In thousands | |
Gross Carrying Amount |
|
Accumulated Amortization |
|
|
Gross Carrying Amount |
|
Accumulated Amortization |
| ||||
| Amortized intangible assets: |
||||||||||||||
| License agreements |
$ | 902 | $ | (442 | ) | $ | 889 | $ | (276 | ) | ||||
| Patents |
7,240 | (1,203 | ) | 6,908 | (515 | ) | ||||||||
| Other |
307 | (109 | ) | 319 | (82 | ) | ||||||||
| Total amortized intangible assets |
$ | 8,449 | $ | (1,754 | ) | $ | 8,116 | $ | (873 | ) | ||||
| Unamortized intangible assets: |
||||||||||||||
| Trademarks |
$ | 450 | $ | 450 | ||||||||||
Amortization of intangible assets for the years ended December 31, 2009 and 2008 was $0.9 million and $0.1 million, respectively. This increase in amortization expense was due to the amortization of intangible assets acquired by the Company in the Solutech acquisition in December 2008. Estimated amortization expense for intangible assets is expected to be $0.9 million for the year ending December 31, 2010, $0.8 million for the years ending December 31, 2011 and 2012, and $0.7 million for the years ending December 31, 2013 and 2014.
5. Long-term Debt and Financing Arrangements
On March 11, 2009, the Company and the Company’s domestic subsidiaries, as co-borrowers or guarantors, entered into a $35 million senior secured domestic credit facility (Domestic Credit Facility) with a financial institution (Lender), which replaced the Company’s prior domestic revolving credit facility that expired on February 1, 2009. Subject to and upon the terms and conditions contained in the Domestic Credit Facility, the Lender agreed to make revolving loans to the Company and its domestic subsidiaries from time to time in amounts requested by the Company and its domestic subsidiaries up to the lesser of the Borrowing Base at such time or the maximum credit of $35 million. The Borrowing Base under the Domestic Credit Facility is determined based on certain percentages of eligible domestic accounts receivable, eligible domestic inventories and eligible domestic fixed assets, reduced by applicable reserves. The Company had no borrowings outstanding under the Domestic Credit Facility at December 31, 2009, or any outstanding borrowings under its previous domestic credit facility at December 31, 2008. The Domestic Credit Facility has a term of three years.
F-12
Table of Contents
Interest is charged on borrowings at the Company’s option of either: (i) the Prime Rate plus the Applicable Margin or (ii) the Eurodollar Rate plus the Applicable Margin. The Prime Rate is a fluctuating rate equal to the higher of the financial institution’s prime rate or the federal funds rate plus .50%. The Eurodollar Rate is a fluctuating LIBOR rate offered for deposits in U.S. dollars. The Applicable Margin added to the Prime Rate ranges from 1.25% to 1.75% and the Applicable Margin added to the Eurodollar Rate ranges from 4.25% to 4.75% depending on the type of collateral that supports the outstanding borrowings. The Company also pays .50% per annum on the average daily unused portion of the Domestic Credit Facility and 4.25% per annum on the daily outstanding balance of letters of credit.
Repayment of amounts due and owing under the Domestic Credit Facility are secured by a lien and security interest in most of the present and future domestic assets of the Company and its domestic subsidiaries, as well as 100% of all of the issued and outstanding shares of capital stock of the Company’s domestic subsidiaries and a pledge of 65% of the issued and outstanding shares of the capital stock of certain of the Company’s foreign subsidiaries. The payment of outstanding principal under the Domestic Credit Facility and accrued interest thereon may be accelerated and become immediately due and payable upon the Company’s default in its payment or other performance obligations or its failure to comply with the financial and other covenants set forth in the loan agreement, subject to any applicable notice requirements and cure periods set forth in the loan agreement.
The loan agreement evidencing the Domestic Credit Facility contains a number of affirmative and negative covenants, including financial covenants. Among others, the Company and its domestic subsidiaries at all times must maintain Excess Availability, as defined in the loan agreement, of not less than $5.0 million. For the period March 31, 2009 to July 31, 2009, the Company was subject to a minimum cash flow requirement determined as of the end of each month during such period. Commencing on August 1, 2009, if the borrowings under the Domestic Credit Facility exceed $5.0 million, or Excess Availability under the Credit Facility is less than $12.5 million, the Company is required to meet a minimum fixed charge coverage ratio. The fixed charge coverage ratio requires that, at the end of any month, the ratio of consolidated EBITDA to fixed charges may not be less than 1 to 1 for the immediately preceding 12 month period, except that prior to August 31, 2010 compliance with the fixed charge coverage ratio generally shall be measured during the period commencing as of August 1, 2009 and ending as of the last day of the month in the measuring period. Once the Company is required to comply with the fixed charge coverage ratio, borrowings must be less than $5.0 million and Excess Availability greater than $12.5 million for each day for sixty consecutive days in order for the Company not to be required to comply with the fixed charge coverage ratio until the next time that borrowings under the Domestic Credit Facility exceed $5.0 million, or Excess Availability under the Credit Facility is less than $12.5 million. At no time during 2009 did borrowings under the Domestic Credit Facility exceed $5.0 million or was Excess Availability less than $12.5 million, therefore, the Company was not subject to the minimum cash flow requirement or fixed charge coverage ratio. As of December 31, 2009, Lydall was limited to borrowing up to $13.1 million under the Domestic Credit Facility in order to maintain Excess Availability of not less than $5.0 million. The Domestic Credit Facility also generally restricts the Company’s ability to pay a cash dividend on its common stock or repurchase shares of common stock, subject to certain stated exceptions.
At December 31, 2009, the Company’s foreign subsidiaries had various credit arrangements with banks totaling €7.0 million (approximately $10.0 million), including €6 million (approximately $8.6 million) in Germany (German Facility). The German Facility allows for borrowings at an interest rate based on the Euro Overnight Index Average plus a margin of 1.5%. Repayment of amounts due under the German Facility are secured by the land and manufacturing equipment at the facility in Germany. The expiration of the German Facility is September 30, 2011. The Company’s foreign subsidiaries had no borrowings outstanding on any of its credit arrangements at December 31, 2009 and 2008, and all amounts were available for borrowings.
The Company has a capital lease agreement for a high speed manufacturing line at its German operation. The lease has monthly principal and interest payments until 2012. The lease also contains a purchase option, which provides the Company with the option to purchase the equipment anytime after the fourth year of the lease term for a stated percentage of the original purchase price. In addition, the Company has a capital lease agreement for the land and building at the St. Nazaire, France operating facility requiring monthly principal and interest payments until 2016. The capital lease provides an option for the Company to purchase the land and building at the end of the lease for a nominal amount.
F-13
Table of Contents
Total outstanding debt consists of:
| Effective Rate |
December 31, |
||||||||||||
| In thousands | Maturity | 2009 | 2008 | ||||||||||
| Volksbank Meinerzhagen eG, collateralized by certain real estate |
5.95 | % | 2013 | $ | 855 | $ | 1,061 | ||||||
| City of Winston Salem NC, collateralized by certain fixed assets |
4.00 | % | 2009 | — | 50 | ||||||||
| Capital Lease, manufacturing equipment, Meinerzhagen, Germany |
4.25 | % | 2012 | 1,509 | 2,086 | ||||||||
| Capital Lease, land and building, St. Nazaire, France |
5.44 | % | 2016 | 4,387 | 4,957 | ||||||||
| 6,751 | 8,154 | ||||||||||||
| Less portion due within one year |
(1,531 | ) | (1,455 | ) | |||||||||
| Total long-term debt |
$ | 5,220 | $ | 6,699 | |||||||||
As of December 31, 2009, total debt maturing in 2010, 2011, 2012, 2013 and 2014 was $1.5 million, $1.6 million, $1.1 million, $0.8 million and $0.7 million, respectively. There was $1.1 million of debt outstanding that matures after 2014.
The weighted average interest rate on long-term debt was 5.0% for the year ended December 31, 2009, compared with 5.2% for 2008 and 5.2% for 2007.
6. Financial Instruments and Fair Value Measurements
The Company did not hold any material investments in financial instruments at December 31, 2009 or 2008. No material gains or losses on investments were realized in 2009, 2008 or 2007. For the purpose of computing realized gains and losses, cost is determined on the specific identification basis.
The Company utilizes letters of credit in the ordinary course of business to satisfy security deposit requirements. Outstanding letters of credit were $2.5 million as of December 31, 2009 and $5.8 million as of December 31, 2008. At December 31, 2008, the Company’s domestic letters of credit of $2.4 million were secured by the Company’s cash, which was held in a money market account at a financial institution. This cash held at the financial institution was recorded as restricted cash and a non-current asset of the Company at December 31, 2008.
The Company periodically enters into foreign currency forward exchange contracts to mitigate exposure to foreign currency risk. The fair values of these contracts are not considered material to the Company’s consolidated financial position as of December 31, 2009 and 2008. The Company reassesses the effectiveness of its derivative instruments on an ongoing basis. If it is determined that a derivative instrument has ceased to be highly effective as a hedge, the Company will discontinue hedge accounting prospectively and changes in the fair value of the derivative instrument will then be reported in the current period results of operations.
By nature, all financial instruments involve market and credit risks. The Company enters into derivative and other financial instruments with major investment grade financial institutions and has policies to monitor the credit risk of those counterparties. The Company does not anticipate non-performance by any of its counterparties.
Recently issued accounting guidance defines fair value, establishes a framework for measuring fair value in generally accepted accounting principles and expands disclosures about fair value measurements. The Company adopted this guidance beginning on January 1, 2008, however there was a delayed effective date for all nonfinancial assets and nonfinancial liabilities, except those that are recognized or disclosed at fair value in the financial statements on a recurring basis, until fiscal years beginning after November 15, 2008. The Company adopted the application of the guidance for non-recurring nonfinancial assets and liabilities measured at fair value on January 1, 2009. The application of this guidance for non-recurring nonfinancial assets and liabilities had no effect on the Company’s consolidated financial position, results of operations or cash flows during 2009.
F-14
Table of Contents
The following table provides the assets carried at fair value measured on a recurring basis as of December 31, 2009:
| |
Total Carrying December 31, |
|
Fair Value measurements at December 31, 2009 using | |||||||||
| In thousands |
|
Quoted prices in active markets (Level 1) |
|
Significant other observable inputs (Level 2) |
|
Significant unobservable inputs (Level 3) | ||||||
| Forward exchange contracts |
$ | 662 | $ | — | $ | 662 | $ | — | ||||
The following table provides the assets carried at fair value measured on a recurring basis as of December 31, 2008:
| |
Total Carrying December 31, |
|
Fair Value measurements at December 31, 2008 using | |||||||||
| In thousands |
|
Quoted prices in active markets (Level 1) |
|
Significant other observable inputs (Level 2) |
|
Significant unobservable inputs (Level 3) | ||||||
| Forward exchange contracts |
$ | 453 | $ | — | $ | 453 | $ | — | ||||
Derivative valuations are based on observable inputs to a valuation model including interest rates and foreign currency exchange rates and are classified within Level 2 of the valuation hierarchy.
The carrying amounts and fair values of financial instruments as of December 31, 2009 and 2008 were as follows:
| |
2009 |
|
2008 | |||||||||
| In thousands | |
Carrying Amount |
|
Fair Value |
|
Carrying Amount |
|
Fair Value | ||||
| Financial liabilities: |
||||||||||||
| Current portion of long-term debt |
$ | 1,531 | $ | 1,548 | $ | 1,455 | $ | 1,447 | ||||
| Long-term debt |
$ | 5,220 | $ | 5,303 | $ | 6,699 | $ | 6,597 | ||||
The above fair values were computed based on quoted market rates and discounted future cash flows. The carrying amounts of cash and cash equivalents, accounts receivable and accounts payable approximate fair value as of December 31, 2009 and 2008.
7. Derivative Instruments and Hedging Activities
In March 2008, the authoritative guidance was issued regarding disclosure of derivative instruments and hedging activities. Enhanced disclosures are required about how and why an entity uses derivative instruments, how they are accounted for and how they affect an entity’s financial position, results of operations and cash flows. The Company adopted this guidance on January 1, 2009 and there was no effect on the Company’s consolidated financial position, results of operations or cash flows.
In general, the Company utilizes derivative instruments to reduce its exposure to the effects of the variability of foreign currencies on its financial performance when it believes such action is warranted. Historically, the Company has entered into derivative instruments to hedge either the variability of cash flows of a prospective transaction or the fair value of a recorded intercompany asset or liability. In certain instances, the Company has designated these transactions as hedging instruments. However, whether or not a derivative was designated as being a hedging instrument, Lydall’s objective for entering into the derivative has always been for risk management purposes. The Company does not engage in derivative instruments for speculative purposes. Lydall has historically not been a party to a significant number of derivative instruments.
Derivative instruments are measured at fair value and recognized as either assets or liabilities on the balance sheet in either current or non-current other assets or other accrued liabilities or other long-term liabilities depending upon maturity and commitment. For derivative instruments that are designated and qualify as a fair value hedge, the gain or loss on the derivative as well as the offsetting loss or gain on the hedged item attributable to the hedged risk are recognized in the statement of operations. For derivative instruments that are designated and qualify as a cash flow hedge, the effective portion of the gain or loss on the derivative is reported as a component of other comprehensive income and reclassified into earnings in the same period or periods in which the hedge transaction affects earnings.
F-15
Table of Contents
In December 2008, the Company entered into a foreign currency forward contract, notional amount of €4.5 million, that matures in December 2010. This derivative instrument is accounted for as an economic hedge of an intercompany loan denominated in a foreign currency. During each quarterly period ended in 2009, the Company remeasured this derivative instrument at fair value and recognized the change in fair value in the statement of operations. The Company entered into this derivative instrument to minimize the offsetting impact in the Company’s statement of operations of changes in foreign currency rates impacting the amount of an intercompany loan. The table below discloses the location and amount of gain recognized in the Company’s 2009 statement of operations related to this derivative instrument.
The fair value of derivative instruments at December 31, 2009 is summarized in the following table:
| Asset Derivatives |
Liability Derivatives | |||||||||
| In thousands | Balance Sheet Location |
Fair Value |
Balance Sheet Location |
Fair Value | ||||||
| Derivatives designated as hedging instruments: |
||||||||||
| Foreign exchange contracts |
Other current assets | $ | 32 | Other liabilities | $ | — | ||||
| Derivatives not designated as hedging instruments: |
||||||||||
| Foreign exchange contracts |
Other current assets | $ | 630 | Other liabilities | $ | — | ||||
| Total Derivatives |
$ | 662 | $ | — | ||||||
The effect of derivative instruments not designated as hedging instruments on the consolidated statement of operations for the year ended December 31, 2009:
| In thousands | Location of Gain (Loss) |
Gain Recognized in Earnings | |||
| Foreign exchange contracts |
Other income, net | $ | 225 | ||
| Total |
$ | 225 | |||
The Company includes the gain or loss on the derivative in the same line item as the offsetting gain or loss on the related hedged item. The amounts noted in the tables above for other income, net do not include any adjustments for the impact of deferred income taxes.
The effect of derivative instruments on the consolidated statement of operations designated as cash flow or fair value hedging instruments was immaterial for 2009 and 2008.
8. Restructuring and Related Costs
In September 2008, the Company announced that it would be closing the St. Johnsbury, VT manufacturing facility and consolidating the North American automotive (NA Auto) parts production into its Hamptonville, NC operation. The Company commenced the transfer of equipment and production in the first quarter of 2009 and substantially completed the consolidation during the second quarter of 2009. This consolidation is expected to reduce operating costs significantly, increase efficiency and enhance the Company’s competitive position while maintaining essentially the same level of manufacturing capacity.
In the Thermal/Acoustical segment during 2009 and 2008, the Company recorded pre-tax restructuring and restructuring related charges of $5.8 million and $1.6 million, respectively, with over 95% recorded in cost of sales during both periods. These restructuring activity expenses primarily included severance related expenses, acceleration of depreciation expense on fixed assets that were not transferred to the Hamptonville, NC facility, and facility exit, moving and set-up expenses of equipment transferred from St. Johnsbury, VT to Hamptonville, NC. During the fourth quarter of 2009, the Company ceased using the right conveyed by the lease of the St. Johnsbury, VT facility. As a result, the Company estimated the fair value of the remaining lease payments expected to occur through the third quarter of 2011 and recorded a lease termination charge of $0.7 million. No future restructuring expenses are expected to be incurred by the Company as a result of the consolidation.
F-16
Table of Contents
Actual pre-tax expenses incurred for the restructuring program by type are as follows:
| In thousands | Severance and Related Expenses |
Accelerated Depreciation |
Facility Exit, Set-up |
Total | ||||||||
| Expense incurred during quarter ended: |
||||||||||||
| December 31, 2008 |
$ | 708 | $ | 515 | $ | 344 | $ | 1,567 | ||||
| March 31, 2009 |
525 | 312 | 1,295 | 2,132 | ||||||||
| June 30, 2009 |
731 | 149 | 2,121 | 3,001 | ||||||||
| September 30, 2009 |
— | — | — | — | ||||||||
| December 31, 2009 |
— | — | 658 | 658 | ||||||||
| Total pre-tax expense incurred |
$ | 1,964 | $ | 976 | $ | 4,418 | $ | 7,358 | ||||
Total cash outflows for the restructuring program were $5.4 million and $0.3 million in 2009 and 2008, respectively. Other than the remaining lease payments on the St. Johnsbury, VT facility of approximately $0.7 million, to be made ratably through the third quarter of 2011, there are no other material cash payments expected to be made related to this consolidation.
Accrued severance and related expenses recorded in accrued payroll and other compensation on the consolidated balance sheets were as follows at December 31, 2009 and December 31, 2008:
| In thousands | Total | |||
| Balance as of December 31, 2008 |
$ | 687 | ||
| Pre-tax severance and related charges |
1,256 | |||
| Cash paid |
(1,943 | ) | ||
| Balance as of December 31, 2009 |
$ | — | ||
9. Acquisitions and Divestures
Acquisitions
On December 1, 2008, the Company, through its wholly owned subsidiary Lydall Netherlands B.V., acquired for cash all the outstanding shares in DSM Solutech B.V. (Solutech) from Royal DSM N.V. (the Seller).
Solutech, based in Heerlen, The Netherlands, manufactures micro-porous films – trade name Solupor® – using its proprietary technology. This acquisition supports the Company’s strategy to invest in technologically innovative solutions and provides a new platform for growth into specialty segments currently underserved by the Company’s filtration business and other suppliers. Lydall Solupor® specialty microporous membranes are utilized in various markets and applications including batteries, fuel cells and supercapacitors, air and liquid filtration, and transdermal drug delivery. Solupor® membranes are based on ultra-high molecular weight polyethylene and incorporate an uncommon combination of mechanical strength, chemical inertness, and high porosity in a unique open structure.
This acquisition was accounted for using the purchase method set forth in the guidance for Business Combinations, whereby the purchase consideration was allocated to the estimated fair values of the assets acquired and liabilities assumed at the effective date of the purchase. The Company made a preliminary allocation of the purchase price of €8.6 million (or $10.8 million) in the fourth quarter of 2008. This preliminary allocation was subsequently revised during 2009 upon final resolution of certain adjustments to the purchase price detailed in the Sale and Purchase Agreement between the Company and Seller, resulting in a reduction in the purchase price by approximately $0.4 million.
F-17
Table of Contents
The following table summarizes the fair values of the assets acquired and liabilities assumed as of the acquisition date:
| In thousands | Total | ||
| Assets acquired: |
|||
| Current assets |
$ | 1,771 | |
| Property, plant and equipment |
1,650 | ||
| Goodwill |
4,048 | ||
| Other intangible assets: |
|||
| Trademark and license agreements |
604 | ||
| Patents |
5,599 | ||
| Total other intangible assets |
6,203 | ||
| Total assets acquired |
13,672 | ||
| Liabilities assumed: |
|||
| Accounts payable |
939 | ||
| Accrued payroll and other compensation |
509 | ||
| Deferred tax liabilities |
1,836 | ||
| Total liabilities assumed |
3,284 | ||
| Net assets acquired |
$ | 10,388 | |
Intangible assets acquired of $6.2 million are being amortized over a weighted average useful life of nine years. There will be no amortization of acquired goodwill included within the Performance Materials segment for tax purposes.
Lydall is obligated to pay to the Seller earn-out payments based on the net revenues of Solutech for a period of five years beginning on December 1, 2008 (Contingent Consideration). This Contingent Consideration will equal 4% of Solutech’s net revenues, as defined, during each of the periods. The value of the Contingent Consideration when paid will be added to the original cost of the acquisition and will increase the amount of goodwill previously recorded. During 2009, Contingent Consideration payments were approximately $0.1 million. An estimate of Contingent Consideration to be paid over the five year period cannot be made as it depends on the amount of Solutech net revenues. The maximum amount is unlimited.
The operating results of Solutech are included within the Performance Materials segment in the Company’s consolidated financial statements from the effective date of the acquisition on December 1, 2008. The Company believes that its results of operations for the years ended December 31, 2008 and 2007 would not have been materially different had the acquisition occurred on January 1, 2007.
Divestitures
On September 19, 2008, the Company sold its wholly-owned subsidiary, Transport, for $3.6 million in cash. Transport had operated the Company’s transport, distribution and warehousing businesses that specialized in time-sensitive shipments and warehouse management services primarily serving the paper and printing industries. The cash received was subject to a post-closing balance sheet adjustment based upon the net working capital of Transport as of the closing date. As a result of the net working capital of Transport as of the closing date, the Company received $0.6 million during the fourth quarter of 2008 for total cash received of $4.2 million from the sale. The Company recorded a gain on disposal, net of income taxes, of $0.9 million related to this transaction. The Consolidated Financial Statements have been adjusted to reclassify Transport as a discontinued operation for all periods presented.
As part of the sale agreement, the Company entered into a Services Agreement with Transport. Transport will perform substantially the same freight hauling services for the Company that it performed prior to the sale, for a period of three years from the date of closing. The Company guaranteed that minimum payments under the Services Agreement will be $1.2 million for each year of the three year term. Freight hauling services under this agreement were $1.2 million for the first year term from September 2008 to September 2009 and $0.5 million for October 2009 to December 2009. Freight hauling expenses recorded with this discontinued operation that were previously eliminated as intercompany expenses in consolidation were $1.2 million from January 1, 2008 to the date of sale, and $2.3 million for the year ended December 31, 2007. In accordance with accounting guidance, the Company reviewed the transaction and concluded that the results of Transport should be reported as a discontinued operation.
F-18
Table of Contents
The following table is a summary of the results of the discontinued operation:
| In thousands | 2008 | 2007 | ||||
| Net sales |
$ | 13,621 | $ | 17,977 | ||
| Income before income taxes |
307 | 878 | ||||
| Income tax expense |
115 | 329 | ||||
| Income from discontinued operations |
192 | 549 | ||||
| Gain on sale of discontinued operations, net of tax of $0.5 million |
860 | — | ||||
| Total discontinued operations, net of tax |
$ | 1,052 | $ | 549 | ||
10. Capital Stock
Preferred stock – The Company has authorized Serial Preferred Stock with a par value of $1.00. None of the 500,000 authorized shares have been issued.
Common stock – As of December 31, 2009, 3,851 Lydall stockholders of record held 17,096,872 shares of Common Stock.
Stockholder rights plan – On June 22, 2009, the Company’s Board of Directors adopted a Shareholder Rights Plan under which the Company will issue a dividend of one Right for each outstanding share of the Company’s common stock held by shareholders of record at the close of business on July 6, 2009. Under certain conditions, each Right entitled the holder to purchase one one-thousandth of a Series A Junior Participating Preferred Share of the Company, at a price of $20 per one one-thousandth of a share, subject to adjustment.
On December 17, 2009, the Company amended the Rights Agreement to change the final expiration date from June 22, 2012 to December 17, 2009. Consequently, the Rights Agreement is now terminated.
Dividend policy – The Company does not pay a cash dividend on its common stock, and the Company’s domestic credit facility entered into on March 11, 2009 prohibits the payment of a cash dividend.
11. Employer Sponsored Benefit Plans
As of December 31, 2009, the Company maintains three defined benefit pension plans that cover the majority of domestic Lydall employees. The pension plans are noncontributory and benefits are based on either years of service or eligible compensation paid while a participant is in a plan. Lydall closed the non-union pension plans to new employees hired after December 31, 2005, and effective June 30, 2006, benefits under these pension plans stopped accruing for all eligible employees not covered under a collective bargaining agreement.
On May 4, 2009, the Company completed negotiations on a new collective bargaining agreement with the majority of its domestic union employees. As a result, benefits under the union employee pension plan for such employees stopped accruing effective July 1, 2009. This amendment to the pension plan resulted in a pension curtailment loss of $0.2 million during the second quarter of 2009. The measurement of pension plan liabilities impacted by the amendment was insignificant.
During the second quarter of 2009, the Company terminated its unfunded Supplemental Executive Retirement Plan (SERP), which provided supplemental income payments after retirement to certain former senior executives (participants). The Company made lump-sum payments to the participants of $1.4 million during the second quarter of 2009. The termination of the SERP plan resulted in an immaterial settlement gain during the quarter ended June 30, 2009. While the SERP was unfunded, the Company owned executive life insurance policies on the participants, which the Company surrendered and received proceeds of $3.8 million in the second quarter of 2009. These life insurance policies were previously recorded in other assets, net on the Company’s Consolidated Balance Sheets.
F-19
Table of Contents
The Company’s funding policy for its pension plans is to fund not less than the ERISA minimum funding standard and not more than the maximum amount that can be deducted for federal income tax purposes.
Plan assets and benefit obligations of the domestic defined benefit pension plans are as follows:
| |
December 31, |
| ||||||
| In thousands | 2009 | 2008 | ||||||
| Change in benefit obligation: |
||||||||
| Net benefit obligation at beginning of year |
$ | 43,299 | $ | 41,427 | ||||
| Service cost |
47 | 85 | ||||||
| Interest cost |
2,571 | 2,555 | ||||||
| Actuarial loss |
1,281 | 1,005 | ||||||
| Gross benefits paid |
(2,035 | ) | (1,773 | ) | ||||
| Settlements |
(1,277 | ) | — | |||||
| Net benefit obligation at end of year |
$ | 43,886 | $ | 43,299 | ||||
| Change in plan assets: |
||||||||
| Fair value of plan assets at beginning of year |
$ | 25,897 | $ | 37,558 | ||||
| Actual return on plan assets |
5,084 | (10,720 | ) | |||||
| Contributions |
339 | 832 | ||||||
| Gross benefits paid |
(2,035 | ) | (1,773 | ) | ||||
| Fair value of plan assets at end of year |
$ | 29,285 | $ | 25,897 | ||||
| Net benefit obligation in excess of plan assets |
$ | (14,601 | ) | $ | (17,402 | ) | ||
| Balance sheet amounts: |
||||||||
| Current liabilities |
$ | — | $ | (198 | ) | |||
| Noncurrent liabilities |
(14,601 | ) | (17,204 | ) | ||||
| Total liabilities |
$ | (14,601 | ) | $ | (17,402 | ) | ||
| Amounts recognized in accumulated other comprehensive income, net of tax consist of: |
||||||||
| Net actuarial loss |
$ | 12,835 | $ | 14,326 | ||||
| Prior service cost |
— | 136 | ||||||
| Net amount recognized |
$ | 12,835 | $ | 14,462 | ||||
At December 31, 2009, in addition to the accrued benefit liability of $14.6 million recognized for the Company’s domestic defined benefit pension plans, the Company also has an accrued benefit liability of $0.7 million and an insignificant accumulated other comprehensive loss, net of tax related to foreign regulatory labor agreements.
The pension liability (net of tax) included in other comprehensive income decreased by $1.7 million for the year ended December 31, 2009 and increased $9.1 million for the year ended December 31, 2008.
Aggregated information for domestic defined benefit pension plans with an accumulated benefit obligation in excess of plan assets is provided in the table below:
| |
December 31, | |||||
| In thousands | 2009 | 2008 | ||||
| Projected benefit obligation |
$ | 43,886 | $ | 43,299 | ||
| Accumulated benefit obligation |
$ | 43,886 | $ | 43,299 | ||
| Fair value of plan assets |
$ | 29,285 | $ | 25,897 | ||
F-20
Table of Contents
Components of net periodic benefit cost for domestic pension plans:
| |
For the years ended December 31, |
| ||||||||||
| In thousands | 2009 | 2008 | 2007 | |||||||||
| Service cost |
$ | 47 | $ | 85 | $ | 91 | ||||||
| Interest cost |
2,571 | 2,555 | 2,476 | |||||||||
| Expected return on plan assets |
(2,033 | ) | (3,143 | ) | (3,056 | ) | ||||||
| Curtailment loss |
213 | — | — | |||||||||
| Settlement gain |
(59 | ) | — | — | ||||||||
| Amortization of: |
||||||||||||
| Prior service cost |
7 | 19 | 20 | |||||||||
| Unrecognized actuarial loss |
695 | 170 | 213 | |||||||||
| Total net periodic benefit cost (income) |
$ | 1,441 | $ | (314 | ) | $ | (256 | ) | ||||
The estimated amounts that will be amortized from accumulated other comprehensive loss into net periodic benefit costs for domestic pension plans in 2010 are as follows:
| In thousands | Pension Benefits | ||
| Actuarial loss |
$ | 579 | |
| Prior service cost |
— | ||
| Total |
$ | 579 | |
The major assumptions used in determining the year-end benefit obligation and annual net cost for domestic pension plans are presented in the following table:
| Benefit Obligation |
Net Cost | |||||||||
| For the years ended December 31, | 2009 | 2008 | 2009 | 2008 | 2007 | |||||
| Discount rate |
5.96% | 6.12% | 6.12% | 6.29% | 5.90% | |||||
| Salary scale |
— | — | — | — | — | |||||
| Expected return on plan assets |
8.00% | 8.00% | 8.00% | 8.50% | 8.50% | |||||
Plan Assets
The domestic defined benefit pension plans are administered by an Administrative Committee and an Investment Committee, which are appointed by the Board of Directors of Lydall, Inc. The Investment Committee’s responsibilities are to establish a funding policy for the Lydall Pooled Pension Investment Trust (the Trust) and to appoint and oversee the investment advisor(s) responsible for the Trust’s investments. The Investment Committee is a named fiduciary under the Plan with respect to management of the Trust’s investments. The assets of the domestic pension plans are invested in a Trust for the purpose of investment diversification. In determining the expected return on plan assets, the Investment Committee considers the relative weighting of plan assets, the historical performance of marketable debt and equity securities and economic and other indicators of future performance.
Investment management objectives include maintaining an adequate level of diversification to balance market risk and to provide sufficient liquidity for near-term payments of benefits accrued under the domestic pension plans and to pay the expenses of administration. The long-term investment objective of the Trust is to achieve a total return equal to or greater than the Trust’s actuarially assumed rate of return, currently 8.0%. Though it is the intent of the Investment Committee to achieve income and growth, that intent does not include taking extraordinary risks or engaging in investment activities not commonly considered prudent under the standards imposed by ERISA. The Investment Committee defines risk as the probability of not meeting the Trust’s objectives and the probability of not meeting the Trust’s liability requirements. The allowable investments include: treasury bills, money market funds, STIF funds, commercial paper, banker’s acceptances, repurchase agreements, certificates of deposit, US government securities, corporate notes and bonds, mortgage backed bonds, preferred stock, fixed income securities of foreign governments and corporations, collateralized mortgage obligations, common stocks, convertible notes and bonds, convertible preferred stocks, American Depository Receipts of Non-US companies, stocks of Non-US companies, real estate investment trusts, mutual funds, GIC’s and hedge fund of funds. Prohibited investments include: commodities and futures contracts, private placements, options, limited partnerships, venture-capital investments, real estate properties, CMO derivatives, single strategy hedge funds and Lydall, Inc. securities.
F-21
Table of Contents
The Investment Committee’s target asset allocation will seek to control risk through portfolio diversification and will take into account, among other factors, objectives discussed above, current funding levels, cash flow conditions and economic and industry trends. The target allocations for plan assets are 70% equity securities and 30% fixed income securities. Equity securities include investments in large-cap and small-cap companies primarily located in the United States. Fixed income securities include fixed income mutual bond funds and common and collective funds.
The following table presents the target allocation of pension plan assets for 2010 and the actual allocation of plan assets as of December 31, 2009 and 2008 by major asset category:
| Target Allocation |
Actual Allocation of Plan Assets December 31, | |||||
| Asset Category | 2010 | 2009 | 2008 | |||
| Equity securities – US Large Cap |
35% – 50% | 39% | 38% | |||
| Equity securities – US Small Cap |
10% – 20% | 13% | 10% | |||
| Equity securities – Non-US |
10% – 20% | 17% | 14% | |||
| Fixed income securities |
20% – 40% | 27% | 35% | |||
| Cash and cash equivalents and other |
0% – 5% | 4% | 3% | |||
The investments of the Trust are stated at fair value. Fair value is the price that would be received to sell an asset or paid to transfer a liability in an orderly transaction between market participants at the measurement date. The asset’s fair value measurement level within the fair value hierarchy is based on the lowest level of any input that is significant to the fair value measurement. Valuation techniques used need to maximize the use of observable inputs and minimize the use of unobservable inputs. The framework for measuring fair value provides a fair value hierarchy that prioritizes the inputs to valuation techniques used to measure fair value. The hierarchy gives the highest priority to unadjusted quoted prices in active markets for identical assets or liabilities (level 1 measurements) and the lowest priority to unobservable inputs (level 3 measurements).
Equity securities, which consist primarily of common stocks, are valued at the closing price reported in the active market in which individuals securities are traded. Short-term cash funds and mutual funds are valued at the net asset value of shares held by the Plan at year end as reported in the active market in which the funds are traded. Common and collective trusts are stated at their net unit values as reported by the investment manager of the fund based on their fair value of the underlying assets and liabilities, which are primarily marketable securities with quoted market prices.
The Trust’s purchases and sales of securities are recorded on a trade date basis. Interest income is recorded on the accrual basis. Dividends are recorded on the ex-dividend date.
The following table sets forth by level, within the fair value hierarchy, the Trust’s assets at fair value as of December 31, 2009.
| Level 1 | Level 2 | Level 3 | Total | |||||||||
| Equity securities: |
||||||||||||
| Equity securities – US large cap |
$ | 11,266 | $ | — | $ | — | $ | 11,266 | ||||
| Equity securities – US small cap |
3,786 | — | — | 3,786 | ||||||||
| Equity securities – Non-US |
4,948 | — | — | 4,948 | ||||||||
| Fixed Income securities: |
||||||||||||
| Common and collective trusts |
— | 4,017 | — | 4,017 | ||||||||
| Mutual funds – bonds |
4,029 | — | — | 4,029 | ||||||||
| Cash and cash equivalents |
1,239 | — | — | 1,239 | ||||||||
| Total Assets at Fair Value |
$ | 25,268 | $ | 4,017 | $ | — | $ | 29,285 | ||||
F-22
Table of Contents
Estimated Future Contributions and Benefit Payments
The Company expects to contribute approximately $1.7 million in cash to its domestic defined benefit pension plans in 2010.
Estimated future benefit payments for the next 10 years are as follows:
| In thousands | 2010 | 2011 | 2012 | 2013 | 2014 | 2015-2019 | ||||||||||||
| Benefit payments |
$ | 1,621 | $ | 1,713 | $ | 1,807 | $ | 1,928 | $ | 2,058 | $ | 11,975 | ||||||
Employee Savings Plans
The Company also sponsors an Employee Stock Purchase Plan (ESPP) and a 401(k) Plan. Employer contributions to these plans amounted to $0.6 million in 2009, $2.3 million in 2008 and $2.4 million in 2007. Under the ESPP, the Company contributed an amount equal to 33 and 1/3 cents for each dollar of employee’s payroll deduction up to $150 per month per employee. The ESPP has been suspended by the Company. In response to the continued global economic decline impacting the markets that the Company serves, Lydall suspended its matching contribution to its sponsored 401(k) plan, beginning with the first payroll of May 2009, for all non-union domestic employees. The 401(k) plan matching contribution remained suspended as of December 31, 2009.
12. Equity Compensation Plans
As of December 31, 2009, the Company had two stock option plans – the 1992 Stock Incentive Compensation Plan (1992 Plan) and the 2003 Stock Incentive Compensation Plan (2003 Plan), collectively, the “Plans” – under which incentive and non-qualified stock options and time and performance based restricted shares may be granted to employees and outside directors from authorized but unissued shares of common stock or treasury shares. The 1992 Plan expired in May 2002; however, the 1992 Plan shall continue to govern all outstanding awards under that plan until the awards themselves are exercised or terminate in accordance with their terms. The 2003 Plan authorized 2.5 million share options and restricted shares for employees and outside directors, which includes 1.0 million shares approved in an amendment and restatement of the Lydall 2003 Plan at the Company’s Annual Meeting of Stockholders held on April 24, 2009.
The Company recognizes expense on a straight-line basis over the vesting period of the entire award. Options issued by the Company under its stock option plans have a term of ten years and generally vest ratably over a period of three to four years. Time based restricted stock grants are expensed over the vesting period of the award, which is typically four years. The number of performance based restricted shares that vest or forfeit depend upon achievement of certain targets during the performance period. Stock-based compensation expense includes the estimated effects of forfeitures. Stock options issued under the current plan must have an exercise price that may not be less than the fair market value of the Company’s common stock on the date of grant. The Plans provide for automatic acceleration of vesting in the event of a change in control of the Company.
The Company incurred compensation expense of $1.4 million, $0.9 million and $0.9 million for the years ended December 31, 2009, 2008 and 2007, respectively, for all stock-based compensation plans, including restricted stock awards. No compensation costs were capitalized as part of inventory. The associated tax benefit realized was $0.1 million, $0.2 million and $0.6 million for the years ended December 31, 2009, 2008 and 2007, respectively.
Stock Options
The fair value of each option granted was estimated on the date of grant using the Black-Scholes option-pricing model with the following weighted-average assumptions for the years ended December 31:
| 2009 | 2008 | 2007 | |||||||
| Risk-free interest rate |
2.6 | % | 2.9 | % | 4.4 | % | |||
| Expected life |
5.5 years | 5.6 years | 5.9 years | ||||||
| Expected volatility |
61 | % | 50 | % | 44 | % | |||
| Expected dividend yield |
0 | % | 0 | % | 0 | % |
F-23
Table of Contents
The following is a summary of the option activity as of December 31, 2009 and changes during the year then ended:
| In thousands except per share and term amounts | |||||||||||
| Fixed options | Shares | Weighted- Average Exercise Price |
Weighted- Average Remaining Contractual Term (years) |
Aggregate Intrinsic Value | |||||||
| Outstanding at December 31, 2008 |
832 | $ | 9.72 | ||||||||
| Granted |
173 | $ | 5.29 | ||||||||
| Exercised |
— | $ | — | ||||||||
| Forfeited/Cancelled |
(145 | ) | $ | 10.09 | |||||||
| Outstanding at December 31, 2009 |
860 | $ | 8.77 | 6.4 | $ | 75 | |||||
| Options exercisable at December 31, 2009 |
533 | $ | 9.82 | 4.7 | $ | 11 | |||||
The Company granted 173,000, 114,000, and 135,000 stock options during 2009, 2008 and 2007, respectively. The weighted-average grant-date fair value of options granted during the years 2009, 2008 and 2007 was $2.95, $3.52 and $5.35 respectively. There were no options exercised during the year ended December 31, 2009. The total intrinsic value of options exercised was $0.3 million and $0.9 million during the years ended 2008 and 2007, respectively. The associated tax benefit realized from stock options exercised for the years ended December 31, 2008, and 2007 was $0.1 million and $0.3 million, respectively. For the years ended December 31, 2008 and 2007, the amount of cash received from the exercise of stock options was $0.8 million and $2.1 million, respectively. At December 31, 2009, the total unrecognized compensation cost related to non-vested stock option awards was approximately $0.8 million, with a weighted average expected amortization period of 2.9 years.
Restricted Stock
Compensation for restricted stock is recorded based on the market value of the stock on the grant date and amortized to expense over the vesting period of the award. The Company granted 333,000, 84,000, and 115,000 shares of restricted stock during 2009, 2008 and 2007, respectively. The weighted average fair value per share of restricted stock granted was $5.48, $5.12 and $9.95 during 2009, 2008, and 2007, respectively. During 2009, 2008 and 2007, respectively, there were 13,050 shares, 25,140 shares and 14,750 shares of restricted stock forfeited. The fair value of awards for which restrictions lapsed during the years ended December 31, 2009, 2008, and 2007 was $0.4 million, $0.3 million and $0.8 million, respectively. At December 31, 2009, the total unrecognized compensation cost related to non-vested restricted stock awards was approximately $2.0 million, with a weighted average expected amortization period of 2.9 years.
The following is a summary of the Company’s nonvested restricted shares as of December 31, 2009 and changes during the year ended December 31, 2009:
| In thousands except per share amounts | ||||||
| Nonvested Restricted Shares | Shares | Weighted-Average Grant-Date Fair Value | ||||
| Nonvested at December 31, 2008 |
191 | $ | 7.93 | |||
| Granted |
333 | $ | 5.48 | |||
| Vested |
(64 | ) | $ | 8.37 | ||
| Forfeited |
(13 | ) | $ | 7.01 | ||
| Nonvested at December 31, 2009 |
447 | $ | 6.06 | |||
Stock Repurchase Program
In August 2003, the Company’s Board of Directors approved a Stock Repurchase Program (the Repurchase Program) to mitigate the potentially dilutive effects of stock options and shares of restricted and unrestricted stock granted by the Company. Under the Repurchase Program, shares may be purchased by the Company up to the quantity of shares underlying options and other equity-based awards granted after January 1, 2003 under shareholder approved plans. The terms and conditions of the Company’s domestic credit facility at December 31, 2009 prohibit the Company’s ability to repurchase common stock, subject to certain
F-24
Table of Contents
exceptions. Should Lydall have the ability to engage in repurchase activity in the future, the Company intends to take advantage of the safe harbor protections afforded by Rule 10b-18 promulgated under the Exchange Act, to engage in future repurchase activity in accordance with the provisions of the Exchange Act. As of December 31, 2009, there were 1,929,456 shares remaining available for purchase under the Repurchase Program. There was no repurchase activity under the Repurchase Program during 2009. The 19,304 shares acquired by the Company during the year ended December 31, 2009 represent shares withheld by the Company pursuant to provisions in agreements with recipients of restricted stock granted under the Company’s equity compensation plans requiring the Company to withhold the number of shares having fair value equal to each recipient’s tax withholding due.
13. Segment Information
In September 2008, the Company sold its wholly-owned subsidiary, Transport (See Note 9). This operation had been included within OPS. Transport had operated the Company’s transport, distribution and warehousing businesses that specialized in time-sensitive shipments and warehouse management services primarily serving the paper and printing industries. As a result of the sale, the Consolidated Financial Statements have been adjusted to reclassify Transport as a discontinued operation and the following segment information excludes Transport’s net sales and operating income in 2008 and 2007.
Effective the first quarter of 2008, changes were made to the Company’s internal organizational structure, including the basis upon which management makes operating decisions and assesses performance. Consequently, the Company was required to modify its reportable segments. The Company’s reportable segments are now Thermal/Acoustical and Performance Materials. The Thermal/Acoustical segment reports the results of the Company’s automotive businesses. The Performance Materials segment reports results of the filtration businesses and the industrial thermal insulation business (formerly the passive thermal business and specialty products). All other businesses are aggregated in OPS. OPS is comprised of the Vital Fluids business and Affinity® temperature control equipment business (Affinity) (formerly the active thermal business). The Company also changed allocations of corporate office overhead to certain businesses. The Company restated the corresponding segment information for the year ended December 31, 2007 to reflect changes made to segments in the first quarter of 2008.
Performance Materials Segment
The Performance Materials segment includes filtration media solutions for air, fluid power, industrial and life science applications and industrial thermal insulation solutions for building products, appliances, and energy and industrial markets.
Lydall air filtration products include LydAir®MG (Micro-Glass), LydAir®MB (Melt Blown), LydAir®SC (Synthetic Composite) and Arioso™ (Membrane Composite) media. These products constitute the critical media component of clean-air systems for applications in clean-space, commercial, industrial and residential HVAC, power generation, industrial processes and protection/respiratory devices. Lydall has leveraged its extensive technical expertise and applications knowledge into a suite of media products covering the vast liquid filtration landscape across the Engine and Industrial and Life Science fields. The LyPore® and activated carbon containing ActiPure® media series address a variety of application needs including hydraulic filters, air-water and air-oil coalescing, industrial fluid processes, diesel filtration, biopharmaceutical pre-filtration and clarification, diagnostic tests, and drinking water filtration. The Company also manufactures Lydall Solupor® specialty microporous membranes that are utilized in various markets and applications including batteries, fuel cells and supercapacitors, air and liquid filtration, and transdermal drug delivery. Solupor® membranes are based on ultra-high molecular weight polyethylene and incorporate an uncommon combination of mechanical strength, chemical inertness, and high porosity in a unique open structure.
The industrial thermal insulation business develops unique high performance nonwoven veils, papers, mats and specialty composites for the building products, appliance, and energy and Industrial markets. The Manniglas® brand is diverse in its product application ranging from high temperature seals and gaskets in ovens and ranges to specialty veils for HVAC and cavity wall insulation. appLY™ Mat has been developed to expand Lydall’s high temperature technology portfolio for broad application into the appliance market and supplements the Lytherm™ product brand, traditionally utilized in the Industrial market for kilns and furnaces used in metal processing. Lydall’s CryothermTM, CRS-WrapTM and CryoliteTM products are industry standards for state-of-the-art cryogenic insulation designs used by manufacturers of cryogenic equipment for liquid gas storage, piping, and transportation.
Thermal/Acoustical Segment
The Thermal/Acoustical segment provides solutions to assist in noise and heat abatement into various global markets. Primary targets are the underbody, under hood and interior areas of cars, trucks, SUVs, heavy duty trucks, buses, military and recreational
F-25
Table of Contents
vehicles. Lydall shields an array of areas from heat (thermal) and sound (acoustical) sources, including areas bordering on fuel tanks, exhaust systems, engine compartments, HVAC, and electrical components. Lydall’s patented products including ZeroClearance®, AMS®, dBCore® and LyTherm® are comprised of organic and inorganic fiber composites as well as metal combinations.
Other Products and Services
The components of OPS are Lydall’s Vital Fluids business and Affinity business.
The Vital Fluids business serves the life science industry offering specialty products for blood transfusion and cell therapy applications as well as Bio-Pak® single-use bioprocessing containers for containment of media, buffers and bulk intermediates used in biotech, pharmaceutical and diagnostic reagent manufacturing processes. Vital Fluids also offers Cell-Freeze®, a medical device used for cryogenic storage of peripheral blood stem cells. Its medical filter materials products are utilized in traditional blood filtration devices such as cardiotomy reservoirs and autotransfusion filters. Other products include specialty blood transfusion products, as well as medical filtration components used for surgical procedures.
Lydall’s Affinity business designs and manufactures high precision, specialty engineered temperature-control equipment for demanding semiconductor, pharmaceutical, life sciences and industrial applications.
Net sales by segment and for OPS, as well as reconciling items, to equal to consolidated net sales for the years ended December 31, 2009, 2008, and 2007 were as follows:
| Consolidated Net Sales |
|
For the Years Ended December 31, |
| |||||||||
| In thousands | 2009 | 2008 | 2007 | |||||||||
| Performance Materials: |
||||||||||||
| Filtration |
$ | 66,363 | $ | 70,549 | $ | 68,549 | ||||||
| Industrial Thermal Insulation |
31,652 | 41,036 | 40,004 | |||||||||
| Performance Materials Segment net sales |
$ | 98,015 | $ | 111,585 | $ | 108,553 | ||||||
| Thermal/Acoustical: |
||||||||||||
| Automotive parts |
$ | 106,735 | $ | 143,177 | $ | 160,440 | ||||||
| Automotive tooling |
21,058 | 20,523 | 16,998 | |||||||||
| Thermal/Acoustical Segment net sales |
$ | 127,793 | $ | 163,700 | $ | 177,438 | ||||||
| Other Products and Services: |
||||||||||||
| Vital Fluids |
$ | 14,600 | $ | 16,649 | $ | 14,721 | ||||||
| Affinity® temperature control equipment |
9,215 | 15,104 | 21,902 | |||||||||
| Other Products and Services net sales |
$ | 23,815 | $ | 31,753 | $ | 36,623 | ||||||
| Eliminations and Other |
(676 | ) | (1,322 | ) | (1,697 | ) | ||||||
| Consolidated Net Sales |
$ | 248,947 | $ | 305,716 | $ | 320,917 | ||||||
Operating income (loss) from continuing operations by segment and for OPS and Corporate Office Expenses for the years ended December 31, 2009, 2008, and 2007 were as follows:
| Operating (Loss) Income |
|
For the Years Ended December 31, |
| |||||||||
| In thousands | 2009 | 2008 | 2007 | |||||||||
| Performance Materials Segment |
$ | 7,675 | $ | 15,543 | $ | 15,468 | ||||||
| Thermal/Acoustical Segment |
(10,126 | ) | (6,101 | ) | 16,548 | |||||||
| Other Products and Services |
(2,497 | ) | (6,388 | ) | (699 | ) | ||||||
| Corporate Office Expenses |
(12,370 | ) | (12,541 | ) | (16,165 | ) | ||||||
| Consolidated Operating (Loss) Income |
$ | (17,318 | ) | $ | (9,487 | ) | $ | 15,152 | ||||
Operating results in 2009 for the Thermal/Acoustical segment were impacted by restructuring related charges of $5.8 million. Operating results in 2008 for the Thermal/Acoustical segment were impacted by a goodwill impairment charge of $12.2 million and
F-26
Table of Contents
restructuring related charges of $1.6 million in the fourth quarter of 2008. Operating results for OPS in 2008 were impacted by impairment charges of $5.2 million in the fourth quarter of 2008.
Total assets by segment and for OPS and the Corporate Office were as follows at December 31, 2009 and 2008:
| Total Assets | |
December 31, | ||||
| In thousands | 2009 | 2008 | ||||
| Performance Materials Segment |
$ | 75,192 | $ | 81,330 | ||
| Thermal/Acoustical Segment |
113,868 | 119,009 | ||||
| Other Products and Services |
18,914 | 18,386 | ||||
| Corporate Office |
16,978 | 17,024 | ||||
| Consolidated Total Assets |
$ | 224,952 | $ | 235,749 | ||
Total capital expenditures and depreciation and amortization by segment and for OPS and the Corporate Office for the years ended December 31, 2009, 2008 and 2007 were as follows:
| |
Capital Expenditures |
|
Depreciation & Amortization | |||||||||||||||
| In thousands | 2009 | 2008 | 2007 | 2009 | 2008 | 2007 | ||||||||||||
| Performance Materials Segment |
$ | 2,542 | $ | 5,022 | $ | 3,988 | $ | 5,572 | $ | 4,462 | $ | 4,046 | ||||||
| Thermal/Acoustical Segment |
1,430 | 5,542 | 9,104 | 8,487 | 9,277 | 8,213 | ||||||||||||
| Other Products and Services |
1,935 | 1,383 | 925 | 713 | 905 | 1,088 | ||||||||||||
| Corporate Office |
14 | 90 | 593 | 950 | 1,291 | 1,880 | ||||||||||||
| Consolidated Total |
$ | 5,921 | $ | 12,037 | $ | 14,610 | $ | 15,722 | $ | 15,935 | $ | 15,227 | ||||||
Net sales by geographic area for the years ended December 31, 2009, 2008 and 2007 and long-lived asset information by geographic area as of December 31, 2009 and 2008 are as follows:
| |
Net Sales |
|
Long-Lived Assets | ||||||||||||
| In thousands | 2009 | 2008 | 2007 | 2009 | 2008 | ||||||||||
| United States |
$ | 152,652 | $ | 187,186 | $ | 215,255 | $ | 70,779 | $ | 80,478 | |||||
| France |
37,779 | 45,608 | 44,712 | 22,779 | 24,793 | ||||||||||
| Germany |
53,879 | 71,011 | 59,776 | 18,349 | 20,843 | ||||||||||
| Other |
4,637 | 1,911 | 1,174 | 12,923 | 13,802 | ||||||||||
| Total |
$ | 248,947 | $ | 305,716 | $ | 320,917 | $ | 124,830 | $ | 139,916 | |||||
Foreign sales are based on the country in which the sales originated (i.e., where the legal entity is domiciled).
Sales to Ford Motor Company in 2009 were $24.1 million, sales to Chrysler and Volkswagen in 2008 were $32.4 million and $30.3 million, respectively, and sales to Chrysler in 2007 were $43.8 million. These sales were reported in the Thermal/Acoustical segment. No other customers accounted for more than 10% of total net sales in 2009, 2008, or 2007.
F-27
Table of Contents
14. Income Taxes
The provision for income taxes from continuing operations consists of the following:
|
|
For the years ended December 31, |
| ||||||||||
| In thousands | 2009 | 2008 | 2007 | |||||||||
| Current: |
||||||||||||
| Federal |
$ | (3,440 | ) | $ | 537 | $ | 2,309 | |||||
| State |
209 | 225 | 243 | |||||||||
| Foreign |
561 | 918 | 1,149 | |||||||||
| Total current |
(2,670 | ) | 1,680 | 3,701 | ||||||||
| Deferred: |
||||||||||||
| Federal |
(290 | ) | (5,176 | ) | (1,531 | ) | ||||||
| State |
(475 | ) | (363 | ) | 187 | |||||||
| Foreign |
(307 | ) | 142 | 3,887 | ||||||||
| Total deferred |
(1,072 | ) | (5,397 | ) | 2,543 | |||||||
| Provision for income taxes |
$ | (3,742 | ) | $ | (3,717 | ) | $ | 6,244 | ||||
The following is a reconciliation of the difference between the actual provision for income taxes from continuing operations and the provision computed by applying the federal statutory tax rate on earnings:
| For the years ended December 31, |
| ||||||||
| In thousands | 2009 | 2008 | 2007 | ||||||
| Statutory federal income tax rate |
34.0 | % | 34.0 | % | 34.0 | % | |||
| State income taxes, net of federal tax deduction |
1.1 | 3.2 | 1.2 | ||||||
| Impact of recognition of foreign deferred tax assets |
0.3 | 3.8 | 2.1 | ||||||
| German tax rate change |
— | — | 3.4 | ||||||
| Reserve for tax contingencies |
1.7 | (0.3 | ) | 0.6 | |||||
| Adjustments from tax provision to final returns |
1.0 | 0.5 | (0.6 | ) | |||||
| Valuation allowance for domestic net operating losses and credits |
(14.2 | ) | — | — | |||||
| Surrender of company-owned life insurance policy |
(1.9 | ) | — | — | |||||
| Other |
(1.1 | ) | (3.3 | ) | 1.5 | ||||
| Effective income tax rate |
20.9 | % | 37.9 | % | 42.2 | % | |||
The other line item above includes mainly non-deductible expenditures such as meals and entertainment and stock based compensation expense for incentive stock options and other non-taxable income and expense items.
The Company determined it will carry-back its 2009 taxable loss to prior years. As a result, at December 31, 2009, an income tax receivable of $3.2 million was recorded in anticipation of a cash refund expected to be received in 2010. This carry-back also causes foreign tax credits previously utilized by the Company to become available for future use. An analysis was performed of the expected future use of these foreign tax credits before their expiration, and as a result, the Company recorded an income tax charge of $2.5 million in the fourth quarter of 2009 to record a valuation allowance on the available foreign tax credits for which their future realization is not reasonably assured. This income tax charge primarily contributed to the effective tax rate differing from the statutory federal income tax rate in 2009.
Management also has provided a valuation allowance at the end of 2009, 2008 and 2007 for certain state net operating loss carryforwards and tax credits that management has determined may not be utilized before their expiration. These valuation allowances have been included as a component of 2009, 2008 and 2007 tax expense.
F-28
Table of Contents
The following schedule presents net current and net long-term deferred tax assets and liabilities by tax jurisdiction as of December 31, 2009 and 2008:
| |
2009 |
|
2008 | |||||||||
| |
Deferred Tax Assets |
|
Deferred Tax Assets | |||||||||
| In thousands | Current | Long-term | Current | Long-term | ||||||||
| Federal |
$ | 726 | $ | — | $ | 728 | $ | — | ||||
| State |
158 | 13 | 334 | — | ||||||||
| Foreign |
735 | 2,758 | 863 | 3,126 | ||||||||
| Totals |
$ | 1,619 | $ | 2,771 | $ | 1,925 | $ | 3,126 | ||||
| |
2009 |
|
2008 | |||||||||
| |
Deferred Tax Liabilities |
|
Deferred Tax Liabilities | |||||||||
| In thousands | Current | Long-term | Current | Long-term | ||||||||
| Federal |
$ | — | $ | 5,495 | $ | — | $ | 4,864 | ||||
| State |
— | — | — | 559 | ||||||||
| Foreign |
— | 1,119 | 73 | 1,909 | ||||||||
| Totals |
$ | — | $ | 6,614 | $ | 73 | $ | 7,332 | ||||
The net deferred tax liabilities consist of the following as of December 31, 2009 and 2008:
| |
December 31, | |||||
| In thousands | 2009 | 2008 | ||||
| Deferred tax assets: |
||||||
| Accounts receivable |
$ | 180 | $ | 237 | ||
| Inventories |
717 | 325 | ||||
| Net operating loss carryforwards |
6,865 | 4,650 | ||||
| Other accrued liabilities |
1,332 | 1,680 | ||||
| Pension |
5,784 | 6,001 | ||||
| Tax credits |
4,397 | 1,323 | ||||
| Other, net |
— | 86 | ||||
| Total deferred tax assets |
$ | 19,275 | $ | 14,302 | ||
| Deferred tax liabilities: |
||||||
| Domestic liability of foreign assets |
$ | 2,042 | $ | 3,030 | ||
| Intangible assets |
3,894 | 3,351 | ||||
| Property, plant and equipment |
9,856 | 8,041 | ||||
| Other accrued liabilities |
830 | 697 | ||||
| Total deferred tax liabilities |
16,622 | 15,119 | ||||
| Valuation allowance |
4,877 | 1,537 | ||||
| Net deferred tax liabilities |
$ | 2,224 | $ | 2,354 | ||
For the years ended December 31, 2009, 2008 and 2007, (loss) income from continuing operations before income taxes was derived from the following sources:
|
|
For the years ended December 31, | ||||||||||
| In thousands | 2009 | 2008 | 2007 | ||||||||
| United States |
$ | (17,785 | ) | $ | (13,907 | ) | $ | 6,812 | |||
| Foreign |
(115 | ) | 4,102 | 7,990 | |||||||
| Total (loss) income from continuing operations before income taxes |
$ | (17,900 | ) | $ | (9,805 | ) | $ | 14,802 | |||
F-29
Table of Contents
At December 31, 2009, the Company has approximately $15.9 million of foreign net operating loss carryforwards and approximately $24.0 million of state net operating loss carryforwards. The state net operating loss carryforwards expire between 2010 and 2029. The majority of the foreign net operating loss carryforwards have no expiration. The Company has provided a valuation reserve against $10.0 million of state net operating loss carryforwards.
A valuation allowance related to foreign and state net operating loss carryforwards is required when it is considered more likely than not that all or part of the benefit related to such assets will not be realized. As required, the Company has evaluated and weighed the positive and negative evidence present at each period. In arriving at a conclusion, the Company has given significant weight to future projected earnings and historical earnings prior to this recessionary period, as the recent losses were the result of the current economic environment. The Company has concluded it is more likely than not that the foreign and state net operating loss carryforwards with no valuation reserve will be fully realized and no additional valuation allowance is necessary as of December 31, 2009. The Company will continue to monitor the realization criteria based on future operating results.
In addition, the Company has $2.8 million and $1.6 million of federal and state tax credit carryforwards, respectively. The Company provided a valuation reserve against $2.5 million of federal income tax credits and $1.5 million of state income tax credits.
United States income taxes have not been provided on undistributed earnings of international subsidiaries. It is not practicable to estimate the amount of tax that might be payable. The Company’s intention is to reinvest these earnings permanently or to repatriate the earnings only when it is tax effective to do so. Accordingly, the Company believes that any U.S. tax on repatriated earnings would be substantially offset by U.S. foreign tax credits.
The Company and its subsidiaries file income tax returns in the U.S., various states and foreign jurisdictions. The Company is open to examination by the Internal Revenue Service (IRS) for calendar years 2008 through the present. The Company recently closed an IRS examination for 2006 and 2007. The Company is currently under examination at certain foreign jurisdictions for tax years 2003 to 2006. The Company may be subject to examination in various state and foreign jurisdictions for 2005 through the present.
A reconciliation of the beginning and ending amount of gross unrecognized tax benefits is as follows:
| In thousands | 2009 | 2008 | ||||||
| Unrecognized tax benefits at beginning of year |
$ | 1,722 | $ | 1,716 | ||||
| Decreases relating to positions taken in prior periods |
(454 | ) | — | |||||
| Increases relating to current period |
91 | 91 | ||||||
| Tax settlements paid |
(353 | ) | — | |||||
| Decreases due to lapse of statute of limitations |
(122 | ) | (85 | ) | ||||
| Unrecognized tax benefits at end of year |
$ | 884 | $ | 1,722 | ||||
The above tabular roll forward is presented on a gross basis. The Company has deferred tax assets for state net operating losses currently offset by full valuation allowances that would reduce the gross unrecognized tax benefits balance of $0.9 million at December 31, 2009 by $0.3 million if these state net operating losses were recognized. Any recognition of these deferred state tax assets would have no effect on the effective tax rate of the Company.
The Company recognizes the interest accrued and the penalties related to unrecognized tax benefits as a component of tax expense. The total amount of accrued interest and penalties as of December 31, 2009 was $0.1 million.
15. Impairments of Goodwill and Long-Lived Assets
During the fourth quarter of 2009, the Company performed an annual impairment analysis of the $14.6 million of goodwill in the Performance Materials reporting unit and $4.7 million of goodwill in the Vital Fluids reporting unit, included in OPS. The Company concluded that the fair value of these reporting units exceeded their carrying value of net assets. As a result, there was no impairment of goodwill in 2009.
During the fourth quarter of 2008, the Company performed its annual impairment test of its goodwill. In addition, the Company performed an impairment test on certain of its long-lived assets (principally machinery and equipment, and buildings and
F-30
Table of Contents
improvements) due to events and changes in circumstances during the fourth quarter of 2008 that indicated an impairment might have occurred. As a result of this impairment testing, the Company recorded the following impairment charges during the fourth quarter of 2008:
| In thousands | Thermal Acoustical Segment |
Other Products and Services |
Total | ||||||
| Impairment of goodwill |
$ | 12,160 | $ | 4,219 | $ | 16,379 | |||
| Impairment of long-lived assets |
— | 1,030 | 1,030 | ||||||
| Total impairments |
$ | 12,160 | $ | 5,249 | $ | 17,409 | |||
Goodwill
The results of the Company’s goodwill impairment analysis in the fourth quarter of 2008 indicated that there was no remaining implied fair value attributable to the NA Auto or Affinity goodwill. Accordingly, the Company wrote off all of the $12.2 million of NA Auto goodwill and all of the $4.2 million of Affinity goodwill during the fourth quarter of 2008.
Beginning in the second half of 2008, the Company’s NA Auto business, included in the Thermal Acoustical segment, was impacted by negative economic conditions in the United States, dramatically reducing consumer demand for automobiles in the fourth quarter of 2008. The Company’s automotive parts net sales were lower by approximately 31% in the fourth quarter of 2008 compared to the same quarter of 2007. The Company’s NA Auto customers are primarily domestic automakers who reported financial losses, announced facility closures and other restructuring actions. In addition, during the fourth quarter of 2008, North American automakers announced further expected reductions in automobile production in 2009, as compared to typical annual production levels. Certain of these North American automakers also announced concerns about near-term cash liquidity, which can negatively impact the Company’s profitability and cash flows in future periods.
Also during the fourth quarter of 2008, the Affinity business continued to be significantly impacted by a slow-down in capital equipment spending in the semiconductor industry. Net sales were lower by approximately 50% in the fourth quarter of 2008 as compared to the fourth quarter of 2007. Based on information available to Lydall in the fourth quarter of 2008, the Company anticipated a slower than expected rebound in capital equipment spending, which would continue to negatively impact the Company’s profitability and cash flows throughout 2009.
During the fourth quarter of 2008, the Company completed its required annual goodwill impairment testing. Negative events and changes in circumstances in the fourth quarter of 2008, as discussed above, including greater risk in the markets that the Company’s NA Auto and Affinity businesses serve, indicated a reduction in the future discounted cash flows from those businesses. In addition, during the fourth quarter of 2008 there was a sustained decline in Lydall’s stock price. As a result of this decline, the Company’s market capitalization fell significantly below the recorded value of its consolidated net assets. The results of the Company’s goodwill impairment analysis indicated that there was no remaining implied fair value attributable to NA Auto or Affinity goodwill. Accordingly, the Company wrote off all of the $12.2 million of NA Auto goodwill and all of the $4.2 million of Affinity goodwill during the fourth quarter of 2008.
In performing the goodwill assessment, the Company used current market capitalization, discounted cash flows and other factors as the best evidence of fair value. The calculation of future cash flows includes management estimates and assumptions that are based on the best available information as of the date of the assessment. Future cash flows can be affected by numerous factors including changes in economic, industry or market conditions, changes in the underlying business or products of the reporting unit, changes in competition and changes in technology. There are inherent uncertainties and management judgment required in an analysis of goodwill impairment.
Long-Lived Assets
In connection with the triggering events discussed above for the Affinity business, as well as other events, the Company determined that long-lived assets were impaired by $1.0 million as of December 31, 2008.
The determination that long-lived assets at the Affinity business were impaired at December 31, 2008, was based on reviewing estimated undiscounted cash flows for its asset group, which was less than its carrying value. The Company considered its asset
F-31
Table of Contents
group to be certain assets and liabilities at Affinity, primarily consisting of machinery and equipment, and buildings and improvements. The Company recorded an impairment charge of $1.0 million during the fourth quarter of 2008, which represented the difference between the estimated fair value of the asset group compared to the carrying value of the asset group. The fair values of the impaired assets were determined based on market conditions including independent appraisals, the income approach which utilizes cash flow projections, and other factors.
Due to negative events and changes in circumstances discussed above, the Company performed an assessment of NA Auto’s long-lived assets for impairment. The undiscounted cash flows over the useful life of its primary assets exceeded the carrying value of the asset group. The Company determined that impairment did not exist as of December 31, 2008.
16. Commitments and Contingencies
Leases
The Company has operating leases that resulted in an expense of $4.2 million in 2009, $3.0 million in 2008 and $2.8 million in 2007. These contracts include building, office equipment, vehicle and machinery leases that require payment of property taxes, insurance, repairs and other operating costs.
During the fourth quarter of 2009, the Company ceased using the right conveyed by the lease of the St. Johnsbury, VT facility. As a result, the Company estimated the fair value of the remaining lease payments expected to occur through the third quarter of 2011 and recorded a lease termination charge of $0.7 million (See Note 8).
The Company has a capital lease agreement for a high speed manufacturing line at its German operation. The lease has monthly principal and interest payments until 2012. In addition, the Company has a capital lease agreement for the land and building at the St. Nazaire, France operating facility requiring monthly principal and interest payments until 2016 (See Note 5).
Approximate future minimum lease payments under noncancelable leases are:
| Payments due by Period |
|||||||||||
| In thousands | Operating Lease Payments |
Capital Lease Payments |
Total | ||||||||
| 2010 |
$ | 2,624 | $ | 1,531 | $ | 4,155 | |||||
| 2011 |
1,294 | 1,531 | 2,825 | ||||||||
| 2012 |
530 | 1,006 | 1,536 | ||||||||
| 2013 |
352 | 831 | 1,183 | ||||||||
| 2014 |
270 | 731 | 1,001 | ||||||||
| Thereafter | 83 | 1,097 | 1,180 | ||||||||
| Total |
5,153 | 6,727 | 11,880 | ||||||||
| Interest on capital leases | — | (831 | ) | (831 | ) | ||||||
| Total |
$ | 5,153 | $ | 5,896 | $ | 11,049 | |||||
Commitments and Contingencies
The Company is, from time to time, subject to governmental audits, proceedings and various litigation relating to matters incidental to its business, including product liability and environmental claims. While the outcome of current matters cannot be predicted with certainty, management, after reviewing such matters and consulting with the Company’s internal and external counsel and considering any applicable insurance or indemnification, does not expect any liability that may ultimately be incurred will materially affect the consolidated financial position, results of operations or cash flows of the Company.
A former employee filed suit against Lydall on January 25, 2008, in the Connecticut Superior Court in Hartford, Connecticut, alleging that Lydall breached his employment and stock option agreements and asserting that he is entitled to severance and other benefits pursuant to his employment agreement. He also claimed damages due to alleged harm to his reputation. The initial complaint was subsequently amended to allege violations of the Connecticut Unfair Trade Practices Act (CUTPA) and the Employee Retirement Income Security Act of 1974 (ERISA), as well as the spoliation of evidence. On May 4, 2009, the plaintiff filed a Motion for Default alleging that Lydall repeatedly failed to comply with its discovery obligations and intentionally destroyed records. Lydall filed an objection to the Motion for Default. Although Lydall has objected to it, the Court has not ruled on the Motion for Default. On
F-32
Table of Contents
September 3, 2009, the plaintiff filed a Motion to Cite In Lydall’s former General Counsel as an additional named defendant alleging the deliberate and intentional spoliation of evidence. The Motion to Cite In was granted by the Court on October 7, 2009, and Lydall’s former General Counsel has been added as a party to the action. Lydall filed a Motion to Strike the CUTPA claim on June 24, 2009, and this motion was granted on October 7, 2009. Lydall filed a Motion for Summary Judgment on August 28, 2009, asking the court to dismiss the plaintiff’s case on the basis that he did not file his employment claim prior to the expiration of the one-year statute of limitations set forth in his employment agreement. The Court has not ruled on the Summary Judgment Motion. The plaintiff filed a Fourth Amended Complaint against Lydall and Lydall’s former General Counsel on November 10, 2009, in which the plaintiff asserted causes of action against Lydall for breach of his employment agreement and stock option agreements, violations of ERISA, and spoliation of evidence. The plaintiff also asserted causes of action for spoliation against Lydall’s former General Counsel in that complaint. The Fourth Amended Complaint does not allege a violation of CUTPA. Lydall filed an Answer on January 11, 2010, denying plaintiff’s substantive allegations. Lydall’s Answer contains Special Defenses. Lydall’s former General Counsel also filed an Answer to the Fourth Amended Complaint on January 11, 2010, denying plaintiff’s substantive allegations. Her Answer also contains Special Defenses. In response to a request from Lydall’s former General Counsel for Advancement and Indemnification of legal fees and expenses in connection with this action, Lydall informed its former General Counsel that she is entitled to advancement but that her request for indemnification is premature. The case is currently in the discovery phase and trial is scheduled for January 2012.
On January 29, 2010, the plaintiff filed a Verified Complaint for Advancement and Indemnification in the Delaware Chancery Court seeking advancement of legal fees and expenses he alleges he has incurred in connection with the above-described action and seeking indemnification. The plaintiff is also seeking interest on those amounts. In response to an earlier request from the plaintiff for advancement and indemnification of legal fees and expenses in connection with the above-described action, Lydall had informed him that his Indemnification Agreement with Lydall, Lydall’s Restated Certificate of Incorporation, and Section 145 of the Delaware General Corporation Law do not entitle him to advancement of legal fees and expenses in connection with the above-described action and that his request for indemnification was premature. Lydall’s response to the Verified Complaint for Advancement and Indemnification must be filed with the Chancery Court on or by February 25, 2010.
The Company believes that it has meritorious defenses against each of the above claims and intends to contest them vigorously. While it is not possible to predict or determine the outcomes of the claims or to provide possible ranges of losses that may arise, the Company believes the losses associated with all of these actions will not have a material adverse effect on the Company’s consolidated financial position or liquidity, but could possibly be material to its consolidated results of operations of any one period. As of December 31, 2009, there were no reserves recorded by the Company related to these claims because Lydall believes such claims are without merit.
As of December 31, 2009, the global automotive operation had unconditional purchase obligations to acquire aluminum of approximately $11.3 million and $10.2 million in 2010 and 2011, respectively. The Company’s European automotive business had additional purchase obligations of 1,000 metric tons of aluminum beginning in March 2010 through December 31, 2010, which will be based on the London Metal Exchange (LME) September 2009 to February 2010 average rate. Based on LME rates during the period September 2009 to January 2010, the Company estimated this additional aluminum commitment to be approximately $1.9 million to $2.2 million.
17. Earnings Per Share
The following table provides a reconciliation of weighted-average shares used to determine basic and diluted earnings per share.
| For the years ended December 31, | ||||||
| In thousands | 2009 | 2008 | 2007 | |||
| Basic average common shares outstanding |
16,567 | 16,458 | 16,295 | |||
| Effect of dilutive options and restricted stock awards | — | — | 177 | |||
| Diluted average common shares outstanding | 16,567 | 16,458 | 16,472 | |||
For the years ended December 31, 2009, 2008 and 2007, stock options and restricted stock awards for 1.0 million, 0.5 million and 0.2 million shares of common stock, respectively, were not considered in computing diluted earnings per common share because they were anti-dilutive.
F-33
Table of Contents
18. Comprehensive Income (Loss)
The following table discloses the balance by classification within accumulated other comprehensive income (loss):
| In thousands | Foreign Currency Translation Adjustment |
Unrealized Gain (Loss) on Derivative Instruments |
Pension Liability Adjustment |
Total Accumulated |
||||||||||||
| Balance at January 1, 2007 |
$ | 3,951 | $ | (36 | ) | $ | (6,686 | ) | $ | (2,771 | ) | |||||
| Change year-to-date |
5,811 | (31 | ) | 1,243 | 7,023 | |||||||||||
| Balance at December 31, 2007 |
9,762 | (67 | ) | (5,443 | ) | 4,252 | ||||||||||
| Change year-to-date |
(2,174 | ) | 98 | (9,096 | ) | (11,172 | ) | |||||||||
| Balance at December 31, 2008 |
7,588 | 31 | (14,539 | ) | (6,920 | ) | ||||||||||
| Change year-to-date |
1,859 | (10 | ) | 1,716 | 3,565 | |||||||||||
| Balance at December 31, 2009 |
$ | 9,447 | $ | 21 | $ | (12,823 | ) | $ | (3,355 | ) | ||||||
19. Quarterly Financial Information (Unaudited)
The following table summarizes quarterly financial results for 2009 and 2008. In management’s opinion, all material adjustments necessary to present fairly the information for such quarters have been reflected.
| 1st Quarter |
2nd Quarter |
3rd Quarter |
4th Quarter |
|||||||||||||||||||||||||||
| In thousands except per share data | 2009 | 2008 | 2009 | 2008 | 2009 | 2008 | 2009 | 2008 | ||||||||||||||||||||||
| Net sales |
$ | 54,333 | $ | 89,895 | $ | 55,981 | $ | 83,958 | $ | 66,090 | $ | 71,110 | $ | 72,543 | $ | 60,753 | ||||||||||||||
| Gross margin |
5,993 | 20,845 | 4,170 | 19,174 | 11,387 | 14,876 | 11,915 | 7,985 | ||||||||||||||||||||||
| (Loss) income from continuing operations |
(4,520 | ) | 3,204 | (5,938 | ) | 2,772 | (273 | ) | 1,730 | (3,427 | ) | (13,794 | ) | |||||||||||||||||
| (Loss) income from discontinued operations |
— | (9 | ) | — | 126 | — | 935 | — | — | |||||||||||||||||||||
| Net (loss) income |
$ | (4,520 | ) | $ | 3,195 | $ | (5,938 | ) | $ | 2,898 | $ | (273 | ) | $ | 2,665 | $ | (3,427 | ) | $ | (13,794 | ) | |||||||||
| Basic (loss) earnings per share: |
||||||||||||||||||||||||||||||
| Continuing operations |
$ | (.27 | ) | $ | .20 | $ | (.36 | ) | $ | .17 | $ | (.02 | ) | $ | .10 | $ | (.21 | ) | $ | (.84 | ) | |||||||||
| Discontinued operations |
$ | — | $ | — | $ | — | $ | .01 | $ | — | $ | .06 | $ | — | $ | — | ||||||||||||||
| Net (loss) income |
$ | (.27 | ) | $ | .19 | $ | (.36 | ) | $ | .18 | $ | (.02 | ) | $ | .16 | $ | (.21 | ) | $ | (.84 | ) | |||||||||
| Diluted (loss) earnings per share: |
||||||||||||||||||||||||||||||
| Continuing operations |
$ | (.27 | ) | $ | .20 | $ | (.36 | ) | $ | .17 | $ | (.02 | ) | $ | .10 | $ | (.21 | ) | $ | (.84 | ) | |||||||||
| Discontinued operations |
$ | — | $ | — | $ | — | $ | .01 | $ | — | $ | .06 | $ | — | $ | — | ||||||||||||||
| Net (loss) income |
$ | (.27 | ) | $ | .19 | $ | (.36 | ) | $ | .17 | $ | (.02 | ) | $ | .16 | $ | (.21 | ) | $ | (.84 | ) | |||||||||
Restructuring related charges associated with the NA Auto consolidation were $2.1 million, or $.08 per diluted share, in the first quarter of 2009, $3.0 million, or $.12 per diluted share, in the second quarter of 2009 and $0.7 million, or $.03 per diluted share, in the fourth quarter of 2009 (See Note 8).
During the fourth quarter of 2008, the Company recorded impairment charges related to goodwill and long-lived assets of $17.4 million, or $.66 per diluted share, (See Note 15), and restructuring related charges associated with the NA Auto consolidation of $1.6 million, or $.06 per diluted share, (See Note 8).
20. Recently Issued Accounting Standards
In December 2007, the FASB issued business combinations guidance, which provides revised standards requiring the acquirer to recognize and measure, at fair value on the acquisition date, identifiable assets and goodwill acquired, liabilities assumed, and any non-controlling interest in the acquiree. Transaction and restructuring costs generally will be expensed as incurred. This guidance also provides disclosure requirements to enable users of the financial statements to evaluate the nature and financial effects of the business combination. The Company adopted this guidance on January 1, 2009 and the adoption did not impact the Company’s financial statements.
F-34
Table of Contents
In December 2007, the FASB issued guidance on noncontrolling interests in Consolidated Financial Statements. This guidance requires that ownership interests in subsidiaries held by parties other than the parent, and the amount of consolidated net income, be clearly identified, labeled, and presented in the consolidated financial statements. It also requires once a subsidiary is deconsolidated, any retained noncontrolling equity investment in the former subsidiary be initially measured at fair value. The adoption of this guidance on January 1, 2009 did not impact the Company’s consolidated financial position, results of operations or cash flows.
On July 1, 2009, the FASB Accounting Standards Codification (ASC) was implemented as the sole source of authoritative GAAP. Pursuant to these provisions, the Company modified its consolidated financial statements by replacing references to former authoritative pronouncements with references to the topics outlined in the ASC. The adoption of this referencing standard did not have an affect on the Company’s consolidated financial position, results of operations, or cash flows.
In May 2009, the FASB issued guidance on subsequent events. This guidance establishes principles and requirements for subsequent events. The guidance sets forth the period after the balance sheet date and the circumstances under which an entity shall evaluate events or transactions for potential recognition or disclosure in the financial statements. This guidance was effective for interim and financial periods ending after June 15, 2009. The adoption of this guidance on June 30, 2009 did not impact the Company’s financial statements.
In October 2009, the FASB issued guidance on revenue recognition. Under this guidance, management is no longer required to obtain vendor-specific objective evidence or third party evidence of fair value for each deliverable in an arrangement with multiple elements, and where evidence is not available the proportion of the selling price attributable to each deliverable may be estimated. This guidance is effective for annual reporting periods beginning after June 15, 2010. The adoption of this guidance is not expected to have a material effect on the Company’s consolidated financial position, results of operations or cash flows.
In January 2010, the FASB issued guidance on improving disclosures about fair value measurements. This guidance requires reporting entities to make new disclosures about recurring or nonrecurring fair-value measurements including significant transfers into and out of Level 1 and Level 2 fair value measurements and information on purchases, sales, issuances, and settlements on a gross basis in the reconciliation of Level 3 fair value measurements. This guidance is effective for annual reporting periods beginning after December 15, 2009, except for Level 3 reconciliation disclosures which are effective for annual periods beginning after December 15, 2010. The adoption of this guidance is not expected to have a material effect on the Company’s consolidated financial position, results of operations or cash flows.
F-35
Table of Contents
LYDALL, INC.
VALUATION AND QUALIFYING ACCOUNTS
FOR THE YEARS ENDED DECEMBER 31, 2009, 2008 AND 2007
| In thousands | Balance at January 1, |
Charges to Costs and Expenses |
Charges (Deductions) |
Deductions | Balance at December 31, |
||||||||||||||
| 2009 |
|||||||||||||||||||
| Allowance for doubtful receivables |
$ | 1,275 | $ | 178 | $ | 6 | 2 | $ | (126 | )1 | $ | 1,333 | |||||||
| Allowance for note receivable |
480 | — | — | — | 480 | 4 | |||||||||||||
| Reserve for future tax benefits |
1,537 | 3,369 | 5 | — | (29 | )3 | 4,877 | ||||||||||||
| 2008 |
|||||||||||||||||||
| Allowance for doubtful receivables |
$ | 1,052 | $ | 471 | $ | (21 | )2 | $ | (227 | )1 | $ | 1,275 | |||||||
| Allowance for note receivable |
480 | — | — | — | 480 | 4 | |||||||||||||
| Reserve for future tax benefits |
1,748 | 148 | — | (359 | )3 | 1,537 | |||||||||||||
| 2007 |
|||||||||||||||||||
| Allowance for doubtful receivables |
$ | 1,219 | $ | 258 | $ | 27 | 2 | $ | (452 | )1 | $ | 1,052 | |||||||
| Allowance for note receivable |
480 | — | — | — | 480 | 4 | |||||||||||||
| Reserve for future tax benefits |
1,790 | — | — | (42 | )3 | 1,748 | |||||||||||||
| 1 | Uncollected receivables written off and recoveries. |
| 2 | Foreign currency translation and other adjustments. |
| 3 | Reduction to income tax expense. |
| 4 | A reserve for $0.5 million was recorded during 2004 for the remaining balance of the note receivable associated with the sale of certain assets of the fiberboard operation in 2001, which was included within “Prepaid expenses and other current assets, net” on the Consolidated Balance Sheets as of December 31, 2009 and 2008. |
| 5 | Increases to tax valuation allowances. |
F-36