Attached files
| file | filename |
|---|---|
| 8-K - FORM 8-K - CYS Investments, Inc. | d936057d8k.htm |
 Investment Outlook
June 2015 Kevin E. Grant, CFA Chief Executive Officer and President KBW Mortgage Finance Conference June 2, 2015 Exhibit 99.1 |
 Forward-Looking Statements
This presentation contains forward-looking statements, within the meaning of Section 27A of the Securities Act of 1933, as amended, and Section 21E of the Securities Exchange Act of 1934, as amended, that are based on management’s beliefs and assumptions, current expectations, estimates and projections. Such statements, including information relating to the Company’s expectations for distributions, financing from the Federal Home Loan Bank, availability and cost of financing, liquidity, counterparty risk, hedging, volatility, market conditions, monetary policy, the yield curve, the economy, interest expense, affordability, availability and valuation of housing and mortgages, movements in interest rates, actions by the U.S. Government, the Federal Reserve and other government entities, the performance of the Company’s target assets, the impact of current Federal Reserve voters on certain policies of the Federal Reserve, the policy views of central banks, and the size of the mortgage market are not considered historical facts and are considered forward-looking information under the federal securities laws. This information may contain words such as “believes,” “plans,” “expects,” “intends,” “estimates” or similar expressions. This information is not a guarantee of the Company’s future performance and is subject to risks, uncertainties and other important factors that could cause the Company’s actual performance or achievements to differ materially from those expressed or implied by this forward- looking information and include, without limitation, changes in the market value and yield of our assets, changes in interest rates and the yield curve, net interest margin, return on equity, availability and terms of financing and hedging, the likelihood that proposed legislation is made law and the anticipated impact thereof, actions by the U.S. government or any agency thereof, including the Federal Reserve, and the effects of such actions and various other risks and uncertainties related to our business and the economy, some of which are described in our filings with the SEC. Given these uncertainties, you should not rely on forward-looking information. The Company undertakes no obligations to update any forward-looking information, whether as a result of new information, future events or otherwise. 2 |
 CYS
Overview Focus on Cost
Efficiency Target Assets Agency Residential Mortgage Backed Securities A Real Estate Investment Trust Formed in January 2006 Extensive and Diverse Sources of Financing Financing lines with 48 lenders Swap agreements with 20 counterparties Dividend Policy Self managed: highly scalable Senior Management Kevin Grant, CEO, President, Chairman Frances Spark, CFO Company intends to distribute all or substantially all of its REIT taxable income 3 |
 CYS
Now Has Access to GSE Financing
Access to Reliable, Low-Cost, Same-Day Funding
• Term Range: Overnight to 30 years • Fixed or Floating Rate • Embedded Options Enhances Liquidity Management Diversifies Counterparty Risk Expands REIT Hedging Limitations Provides Financial Flexibility 4 |
 5 Increased borrowing capacity improves liability management. Fixed/Floating rates, amortizing structures, embedded options available out to 30 years.
Lowers hedging costs, expands REIT hedging limitations.
Financing across the curve enables a more closely matched book.
AAA/AA+ Rated, GSE Execution
Enhanced Liquidity
Compelling Economics
Lower Volatility
Counterparty Upgrade
Cincinnati FHLB Membership:
Compelling Economics + Flexibility = Strategic Advantage
Total FHLB Advances
1999 - 2013 3 Month Rates April 2007 - December2009 $ in Millions LIBOR FHLB DNs Treasury |
 Agency MBS Market Continues To See Strong Demand 15 Year: Hedged vs. Unhedged 15 Year Fixed Hedged with Swaps: April 2009 – May 2015 15 Year Hedged (i) 15 Year Unhedged (ii) Borrow Short Invest Long May 29, 2015 Source: Bloomberg. 6 Note: Spreads calculated as: (i) 15 year CC Index = 50% 4 year swap, and (ii) 15 year Current Coupon Index |
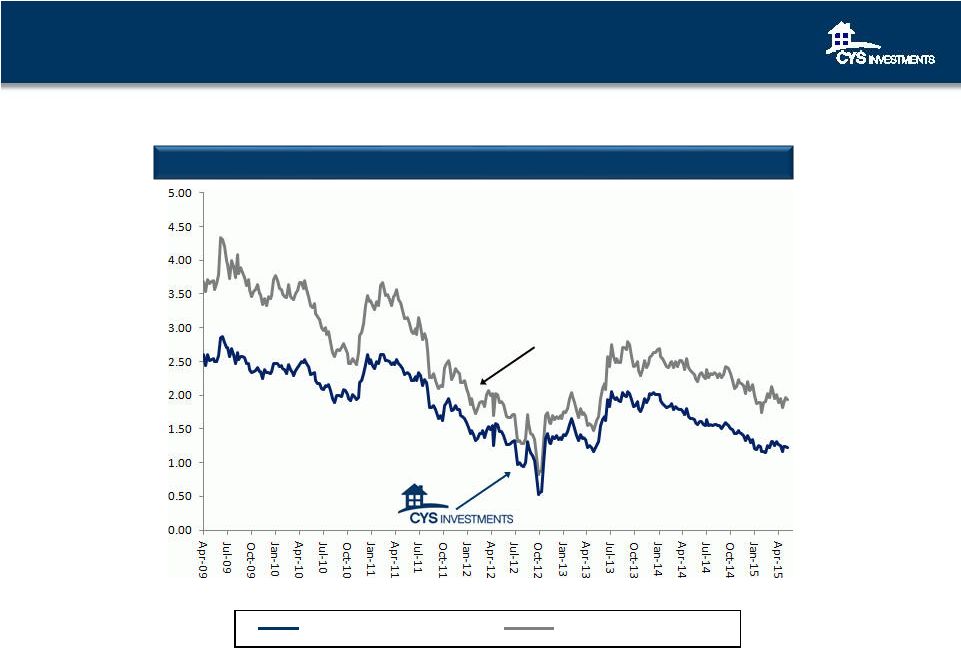
 Agency MBS Market Continues To See Strong Demand 30 Year: Hedged vs. Unhedged Source: Bloomberg 30 Year Fixed Hedged with Swaps: April 2009 - May 2015 30 Year Hedged 30 Year Unhedged May 29, 2015 Borrow Short Invest Long 7 Note: Spread calculated as: (i) 30 year CC Index - 90% 5 year swap
|
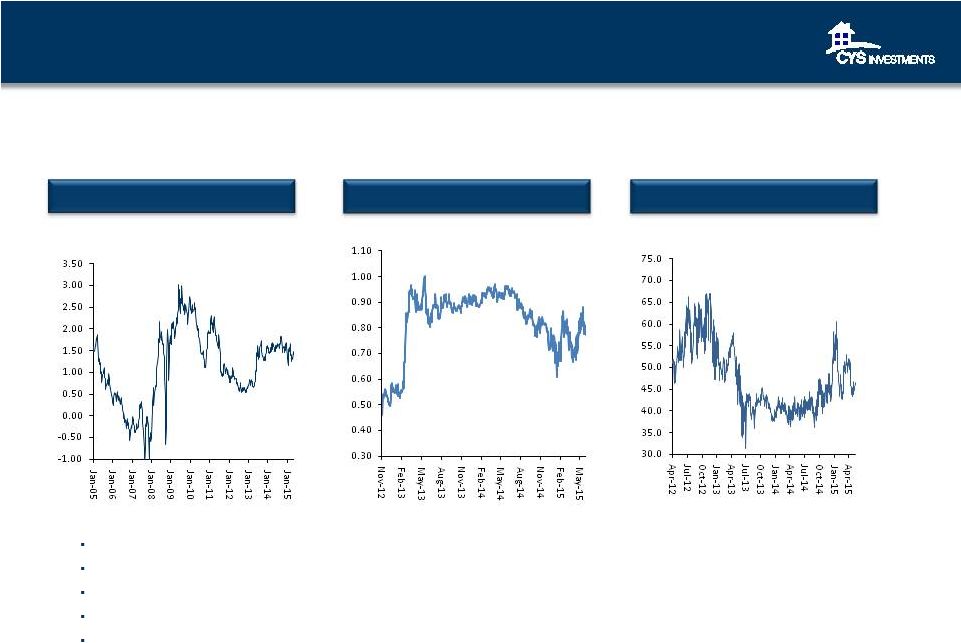 • Volatility in the Cap/Floor Markets Hit a Low in July 2013 30 Yr MBS - 15 Yr MBS Spread 7 Yr Cap/Floor Implied Vol November 2012 – May 2015 April 2012 – May 2015 • 30 Year MBS Have Cheapened Meaningfully Relative to 15 Year MBS 5 Year Swap vs. Fed Funds January 2005 – May 2015 Yield Curve Creates positive carry Very low cost of financing Good ROE Hedge flexibility very important Fed still fighting deflation End of QE Poses New Risks and New Opportunities Source: Bloomberg May 29, 2015 May 29, 2015 May 29, 2015 8 |
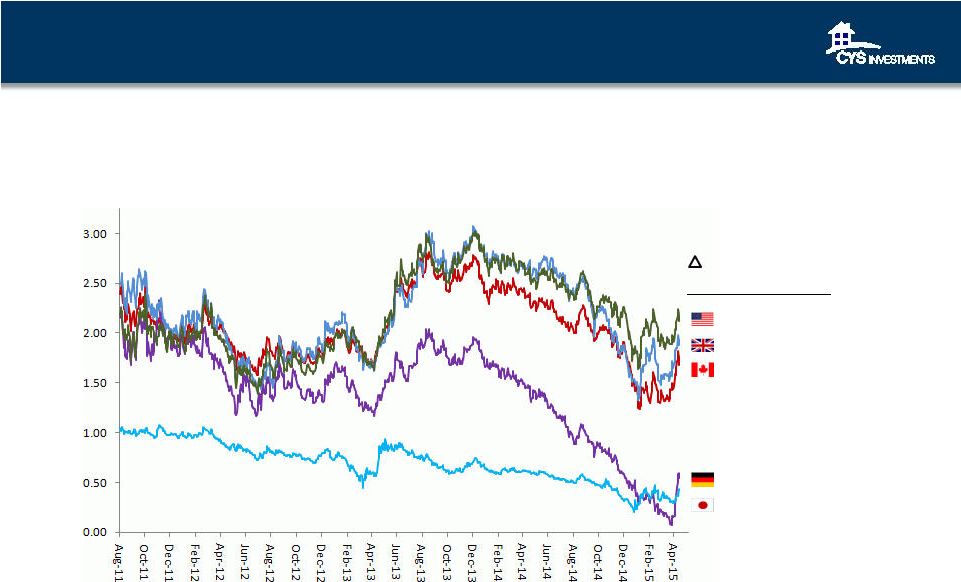 Global Ten Year Yields:
Is U.S. Growth Out of Sync with Rest of World?
Source: Bloomberg, May 29, 2015
GDBR10 (1.646) USGG10YR (0.079) GCAN10YR (0.781) GJGB10 (0.649) GBTPGR10 (0.691) Government Ten Year Yields UK, US, Canada, Germany, Japan August 2011 - May 2015 August 2011 - May 2015 9 |
 Source: Board of Governors of the Federal Reserve, March 2015
Actual Economic Performance:
Sluggish vs. Fed Projections
10 |
 Appropriate Timing
of Policy Firming
• Creates Significant Headwinds for the Economy • Housing Will Struggle • Corporate Interest Expense will rise Overview of FOMC Participants Assessments of Appropriate Monetary Policy Can the Economy Withstand the Implied Path of 10 Year UST? Transition to a Normalized Yield Curve: Will the Fed Push Out - or Pull In - Forward Rate Guidance? Ten Year Treasury August 2011 - May 2015 and Implied Projection +25 -25 % % 2015 2016 2017 1.0 2.0 3.0 4.0 5.0 0.0 1.5 2.5 3.5 4.5 0.5 Appropriate Pace of Policy Firming Target Fed Funds Rate at Year End Longer Run Source: Federal Reserve March 2015 Forecast, Bloomberg, CYS 11 |
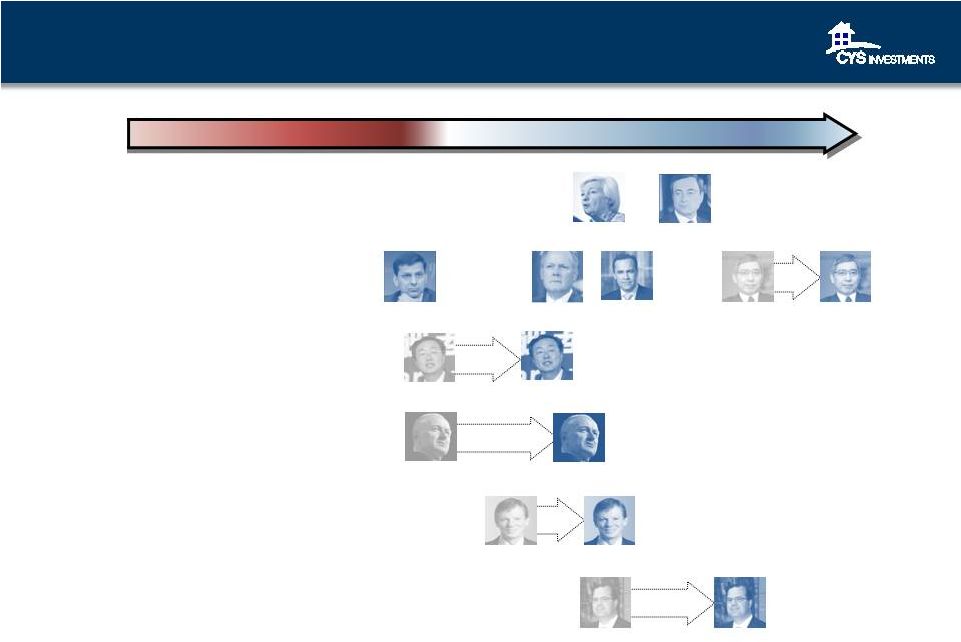
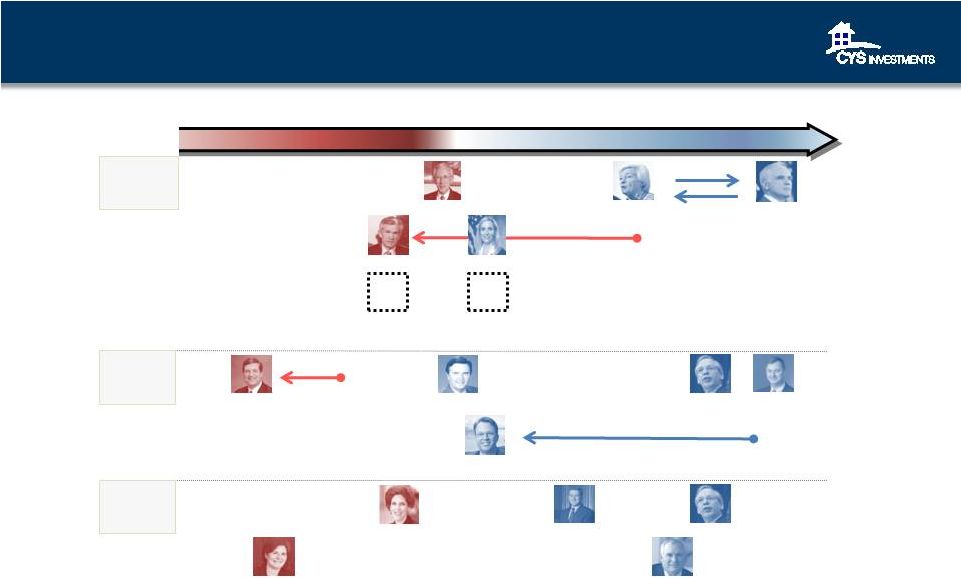 2015-16 Fed Voters:
New Perspectives, Changing Outlooks
Powell Source: federalreserve.gov, Barclays, Macroeconomic Advisers, LLC, Bank of America Merrill Lynch, Bloomberg, Wall Street Journal,
Indiana University, Marketwatch, Thomson Reuters, Federal Reserve Bank of Atlanta, Federal Reserve Bank of Chicago, Federal Reserve Bank of Cleveland, Maryland Consumer Rights Coalition, Boston Globe,
Businessweek, Newsweek, Washington Post, CNBC.
Hawkish Dovish Neutral Yellen Raskin’s Successor Board of Governors Fischer Brainard Tarullo Stein’s Successor San Francisco: Williams 2015 Voters New York: Dudley Chicago: Evans Richmond: Lacker Atlanta: Lockhart 2016 Voters New York: Dudley Cleveland: Mester Boston: Rosengren Kansas City: George St. Louis: Bullard 12 |
 Central Banks: Decidedly More Accommodative - Focus on Global Deflation Risk Draghi EU Hawkish Dovish Neutral Xiaochuan China Xiaochuan China Tombini Brazil Tombini Brazil Australia Stevens Australia Stevens New Zealand Wheeler New Zealand Wheeler Kuroda Japan Canada Poloz Rajan India Kuroda Japan Carney UK Yellin USA 13 |
 GSE/Legislative Reform:
Stuck in the Mud
Source: Barclays, CYS
Legislative Level of GSE Credit Risk Proposal Government Involvement Implication Sharing Status Corker-Warner Bill Introduced 6/25/13 Limited: Only under catastrophic scenarios where losses on a pool of mortgages exceeds 10% Completely wound down over 5 years 10% first-loss piece is sold to private entities Corker-Warner under committee discussion but not yet put to vote. Either may become the front runner from the Senate side but both will likely have private capital in the first loss place with several mechanisms for risk sharing Senate Banking Committee voted in favor of the bill 13-9 on May 15, 2014. Insufficient support to allow the bill to be brought to the Senate floor for debate/vote. Warren, Schumer did not support, unlikely support under new Chair Shelby. Johnson - Crapo Bill Committee Vote 5/15/14 Based on Corker-Warner, limited: only on scenarios where losses on a pool of mortgages exceeds a 10% private loss position. GSE’s wound down over 5 year period, replaced by FMIC. Similar to Corker-Warner, 10% first-loss piece is sold to private entities. PATH Act Hensarling Bill Introduced 7/22/13 Very limited: dissolves the GSEs completely and reduces the scope of the FHA/VA guarantee Placed into receivership and completely liquidated Initially, a 10% risk-sharing program on new GSE and FHA business, although private market securitization is intended eventually to replace GSEs No news. In early 2013, the Path Act seemed to be the clear front- runner on the House side. Passage of bill is highly unlikely. The final housing finance reform, if it happens, could be a compromise between the PATH Act and whatever comes out of the Senate. Delaney-Carney-Himes HR 1491 Introduced 7/10/14 Limited: Ginnie Mae is required to provide an explicit government guarantee once the 5% risk slice is eroded when one of the private monoline insurers defaults GSEs will be slowly wound down and eventually converted into private reinsurers with limited capacities to take on mortgage credit risk 5% first-loss piece on each new Ginnie Mae securitization, as well as a 10% pro-rata risk slice on the top 95% of each Ginnie Mae securitization Re-introduced 3/19/15. Unlikely to be endorsed under Rep. Hensarling or Sen. Shelby leadership. 14 |
 Economic Recovery Below Normal Pace
U.S. Regular Conventional Gas Price
$ per gal Updated: 2015-05-06 Capacity Utilization: Manufacturing Updated: 2015-05-15 Civilian Unemployment Rate Updated: 2015-05-08 CPI-U All Items Updated: 2015-05-22 Total Nonfarm Private Payroll Employment Updated: 2015-05-06 Total Unemployed + All Marginally Attached + Total Employed Part Time for Economic Reasons Updated: 2015-05-08 Source: Federal Reserve Bank of St. Louis 15 |
 Housing Finance Has Not Rebounded
Source: U.S. Census Bureau and National Association of Realtors. St Louis Fed,
www.census.gov Share of Government Guaranteed
Mortgages 1990 –
2013 % Monthly Supply of Homes January 1963- present Home Ownership Rate January 1965- present (%) 16 |
 Mortgage Market Shrinkage Likely to Continue
Residential Mortgage Debt Decline Driven By:
1. Home prices now reset lower 2. Delevering Consumers/Homeowners 3. Psychology of lower leverage 4. Low volume of new and existing home sales 5. All-cash home purchase transactions, and higher downpayments 6. Scheduled principal payments 7. 8. QM Rules Restrictive Single Family Mortgage Origination Volume 2000-2016E Mortgage Debt Outstanding 2007-2014 Source:
http://www.federalreserve.gov/econresdata/releases/mortoutstand/current.htm Source: U.S Department of Housing and Urban Development and Federal Financial Institutions Examination Council. 2014, 2015 and 2016 data
based on the March 2015 estimate of Freddie Mac’s Office of the Chief Economist. 17 High percentage of cash-in refi’s versus cash-out refi’s.
|
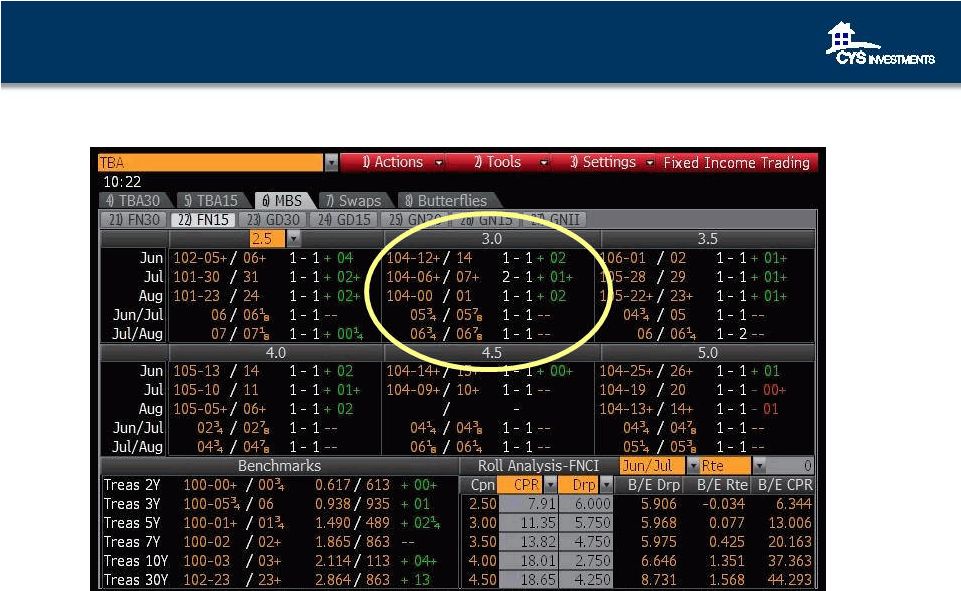 Economics of Forward Purchase
18 Source: Bloomberg, May 29, 2015 |
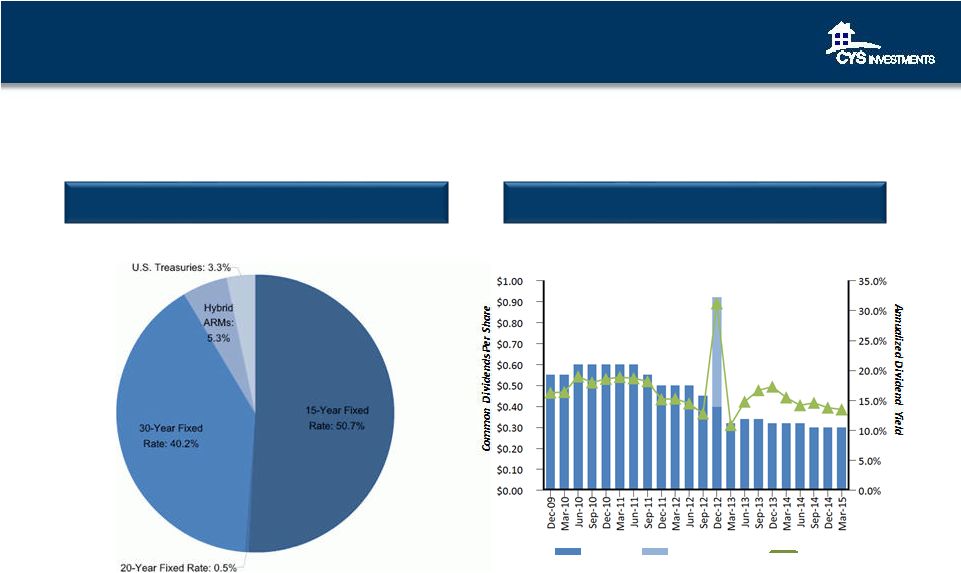 CYS Common Stock Dividends
September 2009 –
March 2015 CYS Agency RMBS and U.S. Treasury Portfolio 1 Portfolio Composition and Dividends 1 As of 3/31/15 2 Annualized dividend yield is calculated using the stock price at the quarter end.
Note: the December 2012 dividend was composed of $0.40 quarterly cash dividend,
and $0.52 special cash dividend. $15.1B Agency RMBS and U.S.
Treasuries Portfolio Dividend
Special Dividend
Annualized Dividend Yield (2) 19 |
 Portfolio Characteristics
As of 3/31/15
(1) To-be-announced (“TBA”) securities are excluded from
this calculation as they do not have a defined weighted-average loan balance or age until mortgages have been assigned to the pool. (2) Constant prepayment rate ("CPR") represents the 3-month CPR of the Company’s Agency RMBS held at March 31, 2015. The
CPR experienced by the Company’s Agency RMBS during the
period may differ. Securities with no prepayment history are excluded from this calculation. (3) Duration measures the market price volatility of financial instruments as interest rates change, using Dollar Value of One
Basis Point, or “DV01”, methodology. We generally
calculate duration using various third-party financial models and empirical data. Different models and methodologies can produce different duration numbers for the same securities. Analytics provided by The
Yield Book® software.
(4) Represents the weighted-average coupon of Agency Hybrid
ARMs. CYS Agency RMBS and U.S. Treasury Portfolio
Characteristics* 20 |
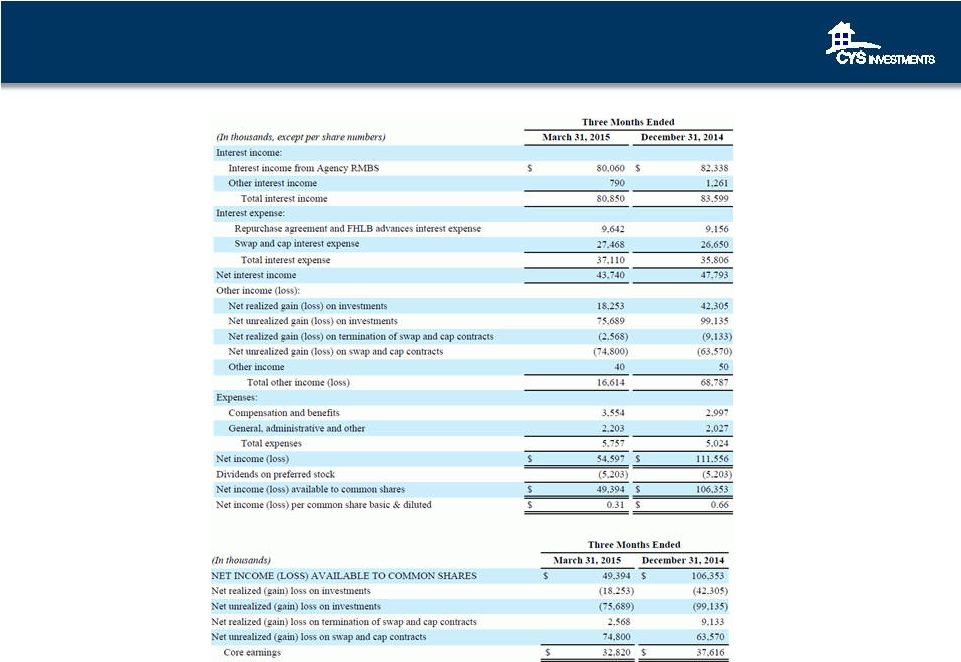 Financial Information
Income Statement
Core Earnings Reconciliation
21 |
 Summary Financial Data
22 The table above includes calculations of the Company’s Agency RMBS and U.S. Treasury Securities portfolio (“Debt
Securities”) 1. The average settled Debt Securities is calculated by averaging the month end
cost basis of settled Debt Securities during the period. 2. The average total Debt Securities is calculated by averaging the month end cost basis of total Debt Securities during the
period. 3. The average repurchase agreements and FHLB advances are calculated by
averaging the month end repurchase agreements and FHLB advances balances during the period. 4. The average Debt Securities liabilities are calculated by adding the average month end repurchase agreements and FHLB advances balances
plus average unsettled Debt Securities during the period. 5. The average stockholders' equity is calculated by averaging the month end stockholders' equity during the period.
6. The average common shares outstanding are calculated by averaging the daily
common shares outstanding during the period.
7. The leverage ratio is calculated by dividing (i) the Company's repurchase
agreements and FHLB advances balances plus payable for securities purchased minus receivable for securities sold by (ii) stockholders' equity. 8. The average yield on Debt Securities for the period is calculated by dividing total interest income by average settled Debt
Securities. 9. The average yield on total Debt Securities including drop income for the
period is calculated by dividing total interest income plus drop income by average total Debt Securities. Drop income was $14.1 million and $12.5 million for the three months ended March 31, 2015 and December 31, 2014, respectively. Drop income is a component of our net realized and
unrealized gain (loss) on investments on our consolidated statements of operations. Drop income is the difference between the spot price and the forward settlement price for the same security on trade date. This difference is
also the economic equivalent of the assumed net interest margin (yield minus financing costs) of the bond from trade date to settlement date. We derive drop income through utilization of forward settling transactions.
10. The average cost of funds for the period is calculated by dividing
repurchase agreement and FHLB advances interest expense by average repurchase agreements and FHLB advances for the period. 11. The average cost of funds and hedge for the period is calculated by dividing interest expense by average repurchase agreements and
FHLB advances. 12. The adjusted average cost of funds and hedge for the period is calculated by dividing total interest expense by average total Debt
Securities liabilities. 13. The interest rate spread net of hedge
for the period is calculated by subtracting average cost of funds and hedge from average yield on settled Debt Securities. 14. The interest rate spread net of hedge including drop income for the period is calculated by subtracting adjusted average cost of funds
and hedge from average yield on total Debt Securities including drop income. 15. The operating expense ratio for the period is calculated by dividing operating expenses by average stockholders' equity.
16. Calculated by change in book value plus dividend distributions on common
stock. *All percentages are annualized except total stockholder return on common
equity. |
 Investment Outlook
June 2015 Kevin E. Grant, CFA Chief Executive Officer and President KBW Mortgage Finance Conference June 2, 2015 |