Attached files
| file | filename |
|---|---|
| EXCEL - IDEA: XBRL DOCUMENT - CYS Investments, Inc. | Financial_Report.xls |
| EX-12.1 - EXHIBIT 12.1 - CYS Investments, Inc. | a20141231ex121.htm |
| EX-31.2 - EXHIBIT 31.2 - CYS Investments, Inc. | a20141231ex312.htm |
| EX-31.1 - EXHIBIT 31.1 - CYS Investments, Inc. | a20141231ex311.htm |
| EX-32.2 - EXHIBIT 32.2 - CYS Investments, Inc. | a20141231ex322.htm |
| EX-32.1 - EXHIBIT 32.1 - CYS Investments, Inc. | a20141231ex321.htm |
| EX-23.1 - EXHIBIT 23.1 - CYS Investments, Inc. | a20141231ex231.htm |
UNITED STATES
SECURITIES AND EXCHANGE COMMISSION
Washington, D.C. 20549
_______________________________________________________________
FORM 10-K
________________________________________________________________
x ANNUAL REPORT PURSUANT TO SECTION 13 OR 15(d) OF THE SECURITIES EXCHANGE ACT OF 1934
For the fiscal year ended December 31, 2014
OR
¨ TRANSITION REPORT PURSUANT TO SECTION 13 OR 15(d) OF THE SECURITIES EXCHANGE ACT OF 1934
For the transition period from to .
Commission file number 001-33740
________________________________________________________________
CYS Investments, Inc.
________________________________________________________________
(Exact name of registrant as specified in its charter)
Maryland | 20-4072657 | |
(State or other jurisdiction of incorporation or organization) | (IRS Employer Identification No.) | |
890 Winter Street, Suite 200 Waltham, Massachusetts | 02451 | |
(Address of principal executive offices) | (Zip Code) | |
(617) 639-0440
(Registrant’s telephone number, including area code)
Securities registered pursuant to Section 12(b) of the Act:
Title of each class | Name of each exchange on which registered | |
Common stock, $0.01 par value | New York Stock Exchange | |
7.75% Series A Cumulative Redeemable Preferred Stock, $25.00 Liquidation Preference | New York Stock Exchange | |
7.50% Series B Cumulative Redeemable Preferred Stock, $25.00 Liquidation Preference | New York Stock Exchange | |
Securities registered pursuant to Section 12(g) of the Act: None
Indicate by check mark if the registrant is a well-known seasoned issuer, as defined in Rule 405 of the Securities Act. Yes x No ¨
Indicate by check mark if the registrant is not required to file reports pursuant to Section 13 or Section 15(d) of the Exchange Act. Yes ¨ No x
Indicate by check mark whether the registrant (1) has filed all reports required to be filed by Section 13 or 15(d) of the Securities Exchange Act of 1934 during the preceding 12 months (or for such shorter period that the registrant was required to file such reports), and (2) has been subject to such filing requirements for the past 90 days. Yes x No ¨
Indicate by check mark whether the registrant has submitted electronically and posted on its corporate Web site, if any, every Interactive Data File required to be submitted and posted pursuant to Rule 405 of Regulation S-T during the preceding 12 months (or for such shorter period that the registrant was required to submit and post such files). Yes x No ¨
Indicate by check mark if disclosure of delinquent filers pursuant to Item 405 of Regulation S-K is not contained herein, and will not be contained, to the best of the registrant’s knowledge, in definitive proxy or information statements incorporated by reference in Part III of this Form 10-K or any amendment to this Form 10-K. x
Indicate by check mark whether the registrant is a large accelerated filer, an accelerated filer, a non-accelerated filer or a smaller reporting company. See the definitions of “large accelerated filer,” “accelerated filer” and “smaller reporting company” in Rule 12b-2 of the Exchange Act. Check one:
Large accelerated filer | x | Accelerated filer | ¨ |
Non-accelerated filer | ¨ (Do not check if a smaller reporting company) | Smaller reporting company | ¨ |
Indicate by check mark whether the registrant is a shell company (as defined in Rule 12b-2 of the Exchange Act). Yes ¨ No x
The aggregate market value of the voting and non-voting common equity held by non-affiliates of the registrant was approximately $1,447,594,625 based on the closing price on the New York Stock Exchange as of June 30, 2014.
Number of the registrant’s common stock outstanding as of January 31, 2015: 161,871,080
DOCUMENTS INCORPORATED BY REFERENCE
Portions of the registrant’s definitive Proxy Statement with respect to its 2015 Annual Meeting of Stockholders to be filed not later than 120 days after the end of the registrant’s fiscal year are incorporated by reference into Part II, Item 5 and III hereof as noted therein.
CYS INVESTMENTS, INC.
INDEX
Item No. | Form 10-K Report Page | |||
PART I | ||||
PART II | ||||
PART III | ||||
PART IV | ||||
PART I
Item 1. Business
In this Annual Report on Form 10-K, we refer to CYS Investments, Inc. as “we,” “us,” “our company,” or “our,” unless we specifically state otherwise or the context indicates otherwise. In addition, the following define certain of the commonly used terms in this report: RMBS refers to whole-pool residential mortgage pass-through securities collateralized by residential mortgage loans; agency securities or Agency RMBS refers to our RMBS that are issued or guaranteed by a federally chartered corporation, such as the Federal National Mortgage Association (“Fannie Mae”) or the Federal Home Loan Mortgage Corporation (“Freddie Mac”), or an agency of the U.S. government, such as the Government National Mortgage Association (“Ginnie Mae”); ARMs refers to adjustable-rate residential mortgage loans that typically have interest rates that adjust monthly to an increment over a specified interest rate index; and Hybrid ARMs refers to hybrid adjustable-rate residential mortgage loans that have interest rates that are fixed for a specified period of time and, thereafter, generally adjust annually to an increment over a specified interest rate index.
Forward Looking Statements
When used in this Annual Report on Form 10-K, in future filings with the Securities and Exchange Commission (“SEC”) or in press releases or other written or oral communications, statements which are not historical in nature, including those containing words such as “believe,” “expect,” “anticipate,” “estimate,” “plan,” “continue,” “intend,” “should,” “may” or similar expressions, are intended to identify “forward-looking statements” within the meaning of Section 27A of the Securities Act of 1933, as amended, and Section 21E of the Securities Exchange Act of 1934, as amended (the "Exchange Act"), and, as such, may involve known and unknown risks, uncertainties and assumptions. The forward-looking statements we make in this Annual Report on Form 10-K include, but are not limited to, statements about the following:
• | the effect of movements in interest rates on our assets and liabilities (including our hedging instruments) and our net income; |
• | our investment, financing and hedging strategies; |
• | the effect of U.S. government actions on interest rates and the housing and credit markets; |
• | the effect of actual or proposed actions of the U.S. Federal Reserve (the "Fed") with respect to monetary policy, interest rates, inflation or unemployment; |
• | the supply of Agency RMBS; |
• | the effect of increased prepayment rates on the value of our assets; |
• | our ability to convert our assets into cash or extend the financing terms related to our assets; |
• | the effect of widening credit spreads or shifts in the yield curve on the value of our assets and investment strategy; |
• | the types of indebtedness we may incur; |
• | our ability to quantify risks based on historical experience; |
• | our ability to be taxed as a real estate investment trust (“REIT”) and to maintain an exemption from registration under the Investment Company Act of 1940, as amended (the “Investment Company Act”); |
• | the tax limitations of capital loss carryforwards and other built in losses; |
• | our assessment of counterparty risk and/or the rise of counterparty defaults; |
• | our ability to meet short-term liquidity requirements with our cash flow from operations and borrowings; |
• | the effect of rising interest rates on unemployment, inflation and mortgage supply and demand; |
• | our liquidity; |
• | our asset valuation policies, and |
• | our dividend distribution policy. |
Forward-looking statements are based on our beliefs, assumptions and expectations of our future performance, taking into account all information currently available to us. These beliefs, assumptions and expectations are subject to risks and uncertainties and can change as a result of many possible events or factors, not all of which are known to us. If a change
1
occurs, our business, financial condition, liquidity and results of operations may vary materially from those expressed in our forward-looking statements. The following factors could cause actual results to vary from our forward-looking statements:
• | the factors referenced in this Annual Report on Form 10-K, including those set forth under the section captioned “Risk Factors;” |
• | changes in our investment, financing and hedging strategies; |
• | the adequacy of our cash flow from operations and borrowings to meet our short-term liquidity requirements; |
• | the liquidity of our portfolio; |
• | unanticipated changes in our industry, interest rates, the credit markets, the general economy or the real estate market; |
• | changes in interest rates and the market value of our Agency RMBS; |
• | changes in the prepayment rates on the mortgage loans underlying our Agency RMBS; |
• | our ability to borrow to finance our assets; |
• | actions by the U.S. government or the Fed that impact the value of our Agency RMBS or interest rates; |
• | changes in government regulations affecting our business; |
• | changes in the U.S. government's credit rating or ability to pay its debts; |
• | our ability to maintain our qualification as a REIT for federal income tax purposes; |
• | our ability to maintain our exemption from registration under the Investment Company Act and the availability of such exemption in the future; and |
• | risks associated with investing in real estate assets, including changes in business conditions and the general economy. |
These and other risks, uncertainties and factors, including those described elsewhere in this report, could cause our actual results to differ materially from those projected in any forward-looking statements we make. All forward-looking statements speak only as of the date on which they are made. New risks and uncertainties arise over time and it is not possible to predict those events or how they may affect us. Except as required by law, we are not obligated to, and do not intend to, update or revise any forward-looking statements, whether as a result of new information, future events or otherwise.
Our Company
We are a specialty finance company created with the objective of achieving consistent risk-adjusted investment income. We have elected to be taxed as a REIT for federal income tax purposes. We were formed as a Maryland corporation on January 3, 2006, commenced operations in February 2006 and completed the initial public offering of our common stock in June 2009. We conduct all of our business through and hold all of our assets in CYS Investments, Inc.
Investment Strategy
We invest in Agency RMBS collateralized by fixed rate single-family residential mortgage loans (primarily 10, 15, 20
or 30 years), ARMs, which have coupon rates that reset monthly, or Hybrid ARMs, which have a coupon rate that is fixed for an
initial period (typically three, five, seven or 10 years) and thereafter resets at regular intervals. In addition, our investment
guidelines permit investments in collateralized mortgage obligations issued by a government agency or government-sponsored
entity that are collateralized by Agency RMBS (“CMOs”), although we had not invested in any CMOs as of December 31,
2014. In addition, we invest in debt securities issued by the U.S. Department of the Treasury (the "U.S. Treasury") or a government-sponsored entity that are not backed by collateral but, in the case of government agencies, are backed by the full faith and credit of the U.S. government ("U.S. Treasuries"), and, in the case of government sponsored entities, are backed by the integrity and creditworthiness of the issuer (“U.S. Agency Debentures”).
We make investment decisions based on various factors, including, but not limited to, relative value, expected cash
yield, supply and demand, costs of hedging, costs of financing, liquidity, expected future interest rate volatility and the overall
shape of the U.S. Treasury and interest rate swap yield curves. We do not attribute any particular quantitative significance to
any of these factors, and the weight given to these factors varies depending on market conditions and economic trends. We believe that this strategy enables us to pay dividends and increase our book value throughout changing interest rate and
credit cycles, and provide attractive long-term returns to investors.
Our investment strategy is designed to:
2
• | maintain an investment portfolio consisting primarily of Agency RMBS that generates risk-adjusted investment income; |
• | manage financing, interest and prepayment rate risks; |
• | capitalize on discrepancies in the relative valuations in the Agency RMBS market; |
• | manage cash flow to provide for regular quarterly distributions to stockholders; |
• | limit credit risk; |
• | minimize the impact that changing interest rates have on our net income and book value, or stockholders' equity; |
• | invest opportunistically in assets within our investment guidelines; |
• | maintain our qualification as a REIT; and |
• | exempt us from the registration requirements of the Investment Company Act. |
Our income is generated primarily from the difference, or net spread, between the interest income we earn on our investment portfolio and the cost of our borrowings and hedging activities. We believe the most prudent approach to generating a positive net spread is to manage our liabilities to mitigate the interest rate risks of our investments. To seek to achieve this result, we employ short-term financing for our Agency RMBS portfolio in combination with interest rate swaps and caps to hedge the interest rate risk associated with the financing of our portfolio. In the future, we may also employ other hedging techniques from time to time, including interest rate floors, collars and Eurodollar and U.S. Treasury futures, to protect against adverse interest rate movements.
Because our investments vary in interest rate, prepayment speed and maturity, the leverage or borrowings that we employ to fund our asset purchases cannot be precisely matched to the terms or performance of our assets. Based on our experience, because our assets are not match funded, changes in interest rates may impact our net income and the market value of our assets. Our approach to managing our investment portfolio is to take a longer term view of assets and liabilities, such that our net income and mark-to-market valuations at the end of a financial reporting period will not significantly influence our strategy of maximizing cash distributions to stockholders and achieving capital appreciation over the long-term.
Investment Sourcing
We source the majority of our investments through relationships with a large and diverse group of financial intermediaries, ranging from major commercial and investment banks to specialty investment dealers and brokerage firms.
Investment Process
Management evaluates each one of our investment opportunities based on its expected risk-adjusted investment income relative to the investment income available from other comparable investments. In addition, management evaluates new opportunities based on their relative expected returns compared to the securities held in our portfolio. The terms of any leverage available to us for use in funding an investment purchase are also taken into consideration, as are any risks posed by illiquidity or correlations with other securities in the portfolio.
The key steps of our investment process are:
• | allocation of our capital to the attractive types of Agency RMBS; |
• | review of asset allocation plan for overall risk management and diversification; |
• | research and selection of individual securities and financing strategies; |
• | active portfolio monitoring within asset classes, together with ongoing risk management and periodic rebalancing, to maximize long-term income with capital stability; and |
• | consideration of the impact on maintaining our REIT qualification and our exemption from registration under the Investment Company Act. |
3
Financing Strategy
We use leverage to finance a portion of our Agency RMBS portfolio and to seek to increase potential returns to our stockholders. Our use of leverage may, however, have the effect of increasing losses when securities in our portfolio decline in value. Generally, we expect our leverage to be between five and 10 times. Given recent actions and guidance provided by the Fed about the future path of the Federal Funds Target Rate ("Fed Funds Rate"), its goal of reducing asset purchases, the heightened interest-rate volatility that these policy changes have created, and may likely continue to create, and current market conditions, we currently expect our leverage to remain in the lower end of this range. Our leverage varies from time to time depending on many factors and conditions, including short-term changes in our book value, and other factors management assesses, analyzes and deems relevant. At December 31, 2014, our leverage ratio, calculated by dividing our (i) borrowings under repurchase agreements ("repo borrowings") balance plus payable for securities purchased minus receivable for securities sold by (ii) stockholders' equity, was approximately 6.44 to 1, down from 6.97 to 1 at December 31, 2013.
We finance our Agency RMBS investments using repo borrowings with a diversified group of broker dealers and commercial and investment banks. Using repo borrowings, we are able to borrow against the value of our assets. Under repurchase agreements, we sell our assets to a counterparty and agree to repurchase the same assets from the counterparty at a price equal to the original sales price plus an interest factor. As a borrower, we are subject to margin calls from counterparties if the value of the collateral that we have posted has declined below the applicable haircut level, which may occur due to prepayments of the mortgages causing the face value of the mortgage pool provided as collateral to the counterparty to decline or when the value of the mortgage pool provided as collateral declines as a result of interest rate movements or spread widening. Currently, the percentage amounts by which the collateral value must exceed the amount borrowed, which we refer to as the haircut, are between 3% and 7%. Our repo borrowings are accounted for as debt for purposes of U.S. generally accepted accounting principles (“GAAP”) and secured by the underlying assets. During the period of a repo borrowing, we are entitled to and receive the principal and interest payments on the related assets.
We maintain formal relationships with multiple counterparties that are broker dealers and commercial and investment banks for the purpose of obtaining financing on favorable terms and to manage counterparty credit risk. As of December 31, 2014, we had repurchase agreements in place with 45 counterparties and indebtedness outstanding with 32 counterparties in an aggregate amount of approximately $11,289.6 million, or approximately 77% of the fair value of our portfolio, and a weighted-average borrowing rate of 0.35%.
In the future, we may utilize other financing techniques, which may include, but not necessarily be limited to, the issuance of common stock, secured or unsecured debt, or preferred stock.
Hedging Strategy
We utilize derivative financial instruments to hedge the interest rate risk associated with the financing of our investment portfolio. Our most common method of financing Agency RMBS is through repo borrowings, which generally have maturities between 30 and 90 days, but may be longer. The weighted-average life of the Agency RMBS we own is generally much longer than the maturities of our repo borrowings. The difference in maturities, in addition to prepayments, adjustable-rate features of ARMs and other potential changes in timing and amount of cash flows, creates potential interest rate risk. We engage in hedging activities intended to manage changes in interest rates that we expect would impair our ability to continue to finance assets we own at favorable rates. Our hedging techniques are also used in an attempt to protect us against declines in the market value of our assets that result from general trends in debt markets. Our hedging methods have historically consisted of interest rate swaps (a contract exchanging a variable rate for a fixed rate, or vice versa), including cancelable interest rate swaps (swaps that may be canceled at one party’s option before expiry), and interest rate caps (a contract protecting against a rise in interest rates above a fixed level). In the future, our hedging methods are likely to continue to consist of interest rate swaps, including cancelable interest rate swaps, and interest rate caps, but may also include interest rate floors (a contract protecting against a decline in interest rates below a fixed level), interest rate collars (a combination of caps and floors), Eurodollar and U.S. Treasury futures and other interest rate and non-interest rate derivative instruments or contracts.
We enter into interest rate swaps to offset the potential adverse effects of rising interest rates on certain repo borrowings. Our repo borrowings generally carry interest rates that correspond to the London Interbank Offered Rate (“LIBOR”) for the borrowing periods. Historically, we have sought to enter into interest rate swaps structured such that we receive payments based on a variable interest rate and make payments based on a fixed interest rate. The variable interest rate on which payments are received is calculated based on various reset mechanisms for LIBOR. Additionally, we have entered into interest rate caps structured such that we receive payments based on a variable interest rate being above a fixed cap interest rate. The variable interest rate on which payments are received on interest rate caps is also calculated based on various reset mechanisms for LIBOR. Our interest rate swaps and caps effectively fix or cap our borrowing costs and are not held for speculative or trading purposes. As of December 31, 2014, we had established interest rate swaps and caps of approximately$10,150.0 million, covering approximately 79% of the aggregate fair value of our investment portfolio, that has been financed under repo borrowings and payable for securities purchased, or covering approximately 90% of our repo borrowings.
4
Our Portfolio
We invest principally in Agency RMBS, which are residential mortgage pass-through securities, the principal and interest of which are guaranteed by Fannie Mae, Freddie Mac or Ginnie Mae. Our current portfolio of Agency RMBS is backed by fixed-rate mortgages and Hybrid ARMs that typically have a fixed coupon for three, five, seven or 10 years, and then pay an adjustable coupon that generally resets annually over a predetermined interest rate index. As of December 31, 2014, our Agency RMBS portfolio consisted of 10.1% forward settling transactions that will be 2015 production when settled; 42.0% 2014 production; 25.4% 2013 production; 11.9% 2012 production; 7.1% 2011 production; 2.1% 2010 production and 0.2% 2009 production. In addition to Agency RMBS, from time-to-time we invest in U.S. Treasuries. As of December 31, 2014, our Agency RMBS and U.S. Treasuries (collectively, "Debt Securities") portfolio consisted of the following:
Face Value | Fair Value | Weighted-Average | ||||||||||||||||||||||
Asset Type | (in thousands) | Cost/Face | Fair Value/Face | Yield(1) | Coupon | CPR(2) | ||||||||||||||||||
15-Year Fixed Rate | $ | 6,986,686 | $ | 7,305,921 | $ | 103.09 | $ | 104.57 | 1.95 | % | 3.15 | % | 8.0 | % | ||||||||||
20-Year Fixed Rate | 67,839 | 74,216 | 102.94 | 109.40 | 1.85 | % | 4.50 | % | 15.5 | % | ||||||||||||||
30-Year Fixed Rate | 4,990,743 | 5,341,699 | 105.56 | 107.03 | 2.30 | % | 4.03 | % | 5.4 | % | ||||||||||||||
Hybrid ARMs(3) | 1,685,685 | 1,730,620 | 103.41 | 102.67 | 1.88 | % | 2.59 | % | 13.6 | % | ||||||||||||||
U.S. Treasuries | 150,000 | 149,051 | 99.72 | 99.37 | 1.63 | % | 1.50 | % | n/a | |||||||||||||||
Total/Weighted-Average | $ | 13,880,953 | $ | 14,601,507 | $ | 103.98 | $ | 105.19 | 2.06 | % | 3.39 | % | 8.1 | % | ||||||||||
___________
(1) | This is a weighted-average forward yield calculated based on the cost basis, coupon and CPR, or “Constant Prepayment Rate” of the securities in the Company's portfolio at December 31, 2014. Because the forward yield is based on a projected CPR and assumes no turnover in the securities in the Company's portfolio, the Company expects the yield it realizes after December 31, 2014 will vary from those included in the table. |
(2) | CPR is a method of expressing the prepayment rate for a mortgage pool that assumes that a constant fraction of the remaining principal is prepaid each month or year. Specifically, the CPR is an annualized version of the prior three month prepayment rate. Securities with no prepayment history are excluded from this calculation. |
(3) | The weighted-average months to reset of our Hybrid ARM portfolio was 59.6 at December 31, 2014. "Months to reset" is the number of months remaining before the fixed rate on a Hybrid ARM becomes a variable rate. At the end of the fixed period, the variable rate will be determined by the margin and the pre-specified caps of the ARM. After the fixed period, 100% of the Hybrid ARMs in the portfolio reset annually. |
We also held $8.0 million of other investments as of December 31, 2014.
Risk Management Strategy
Our board of directors exercises its oversight of risk management in many ways, including overseeing our senior management’s risk-related responsibilities and reviewing management and investment policies and performance against these policies and related benchmarks.
As part of our risk management process, we actively manage the interest rate, liquidity, prepayment and counterparty risks associated with our Agency RMBS portfolio. This process includes monitoring various stress test scenarios on our portfolio. We seek to manage our interest rate risk exposure by entering into various hedging instruments in order to minimize our exposure to potential interest rate mismatches between the interest we earn on our investments and our borrowing costs.
We seek to manage our liquidity risks by monitoring our liquidity position on a daily basis and maintaining a prudent level of leverage based on current market conditions and various other factors, including the health of the financial institutions that lend to us under our repurchase agreements.
We seek to manage our prepayment risk by investing in Agency RMBS with a variety of prepayment characteristics and prepayment protections, as well as by balancing Agency RMBS purchased at a premium with Agency RMBS purchased at a discount, when market conditions permit this.
We seek to manage our counterparty risk by (i) diversifying our exposure across a broad number of counterparties, (ii) limiting our exposure to any one counterparty and (iii) monitoring the financial stability of our counterparties.
Competition
Our success depends, in large part, on our ability to acquire assets at favorable spreads over our borrowing costs. In acquiring Agency RMBS, we compete with other mortgage REITs, specialty finance companies, public and private funds, commercial and investment banks, the Fed, other governmental entities or government sponsored entities, commercial finance companies, and other entities. Our competitors, as well as additional competitors that may emerge in the future, may increase the competition for the acquisition of Agency RMBS, which in turn may result in higher prices and lower yields on our assets.
5
Employees
As of January 31, 2015, we had 16 employees.
Additional Information
We have made available on our website at www.cysinv.com copies of the charters of the committees of our board of directors, our code of business conduct and ethics, our corporate governance guidelines and any materials we file with the SEC. All filings we make with the SEC are also available on our website. Information on our website is not part of this Annual Report on Form 10-K. All reports filed with the SEC may be read and copied at the SEC’s public reference room at 100 F Street, N.E., Washington, D.C. 20549. Further information regarding the operation of the public reference room may be obtained by calling 1 (800) SEC-0330. In addition, all of our reports filed with the SEC can be obtained at the SEC’s website at www.sec.gov.
Item 1A. Risk Factors
Investment in our capital stock involves significant risks. Our business, financial condition, liquidity and results of operations could be materially and adversely affected by these risks. The risk factors set forth below are not all of the risks that may affect us. Some statements in this report, including statements in the following risk factors, constitute forward looking statements. Please refer to the section entitled “Forward Looking Statements.”
Risks Related To Our Business
Increases in interest rates and adverse market conditions may negatively affect the value of our investments and increase the cost of our borrowings, which could result in reduced earnings or losses and reduced cash available for distribution to our stockholders.
We invest indirectly in mortgage loans by purchasing Agency RMBS. Under a normal yield curve, an investment in Agency RMBS will decline in value if interest rates increase. In addition, net interest income could decrease if the yield curve becomes inverted or flat. Fannie Mae, Freddie Mac or Ginnie Mae guarantees of the principal and interest payments related to the Agency RMBS we own do not protect us from declines in market value caused by changes in interest rates. Declines in the market value of our investments may ultimately result in losses to us, which may reduce earnings and negatively affect cash available for distribution to our stockholders.
A significant risk associated with our investment in Agency RMBS is that both long-term and short-term interest rates will increase significantly. If long-term rates were to increase significantly, the market value of our Agency RMBS would decline, and the duration and weighted average life of the investments would increase. We could realize a loss if the securities were sold. At the same time, an increase in short-term interest rates would increase the amount of interest owed on our repo borrowings used to finance the purchase of Agency RMBS, which would decrease cash available for distribution to our stockholders.
Market values of our investments may decline without any general increase in interest rates for a number of reasons, such as increases in defaults, increases in voluntary prepayments for those investments that we have that are subject to prepayment risk and widening of credit spreads. If the market values of our investments were to decline for any reason, the value of your investment could also decline.
We leverage our portfolio investments in Debt Securities, which may adversely affect our return on our investments and may reduce cash available for distribution to our stockholders.
We leverage our portfolio investments in Debt Securities through repo borrowings. Leverage can enhance our potential returns, but can also exacerbate losses. As of December 31, 2014, our leverage ratio (calculated by dividing our (i) repo borrowings balance plus payable for securities purchased minus receivable for securities sold by (ii) stockholders' equity) was approximately 6.44 to 1. Our return on investments and cash available for distribution to our stockholders may be reduced if market conditions cause the cost of our financing to increase relative to the income that can be derived from the assets acquired, which could adversely affect the price of our common stock. In addition, our debt service payments will reduce cash flow available for distribution to stockholders. We may not be able to meet our debt service obligations. To the extent that we cannot meet our debt service obligations, we risk the loss of some or all of our assets to foreclosure or sale to satisfy our debt obligations.
6
An increase in our borrowing costs relative to the interest we receive on our assets may impair our profitability and thus our cash available for distribution to our stockholders.
As our repo borrowings mature, we must either enter into new borrowings or liquidate certain of our investments at times when we might not otherwise choose to do so. Lenders may seek to use a maturity date as an opportune time to demand additional terms or increased collateral requirements that could be adverse to us and harm our operations. An increase in short-term interest rates when we seek new borrowings would reduce the spread between our returns on our assets and the cost of our borrowings. This would reduce the returns on our assets, which might reduce earnings and in turn cash available for distribution to our stockholders. We generally expect that the interest rates tied to our borrowings will adjust more rapidly than the interest rates tied to the assets in which we invest.
Our lenders may require us to provide additional collateral, especially when the market values for our investments decline, which may restrict us from leveraging our assets as fully as desired and reduce our liquidity, earnings and cash available for distribution to our stockholders.
We currently use repo borrowings to finance our investments in Debt Securities. Our repurchase agreements allow the lenders, to varying degrees, to determine a new market value of the collateral to reflect current market conditions. If the market value of the securities pledged or sold by us to a funding source declines, we may be required by the lender to provide additional collateral or pay down a portion of the funds advanced on minimal notice, which is known as a margin call. Posting additional collateral will reduce our liquidity and limit our ability to leverage our assets, which could adversely affect our business. Additionally, in order to satisfy a margin call, we may be required to liquidate assets at a disadvantageous time, which could cause us to incur further losses and adversely affect our results of operations and financial condition, and may impair our ability to maintain our current level of distributions to our stockholders. We receive margin calls from our repo borrowing counterparties from time to time in the ordinary course of business similar to other entities in the specialty finance business. As of December 31, 2014, we had approximately $1,319.7 million, or 66.8% of our stockholders' equity, in Agency RMBS, U.S. Treasuries, cash and cash equivalents available to satisfy future margin calls. In the event we do not have sufficient liquidity to satisfy these margin calls, lending institutions can accelerate our indebtedness, increase our borrowing rates, liquidate our collateral and terminate our ability to borrow. Such a situation would likely result in a rapid deterioration of our financial condition and possibly necessitate a filing for protection under the U.S. Bankruptcy Code.
Hedging against interest rate exposure may not completely insulate us from interest rate risk and may adversely affect our earnings, which could adversely affect our financial condition and results of operations, reducing cash available for distributions to our stockholders.
We engage in certain hedging transactions to limit our exposure to changes in interest rates and therefore may expose ourselves to risks associated with such transactions. We may utilize instruments such as interest rate swaps, caps, collars and floors and Eurodollar and U.S. Treasury futures to seek to hedge the interest rate risk associated with our portfolio. Hedging against a decline in the values of our portfolio positions does not eliminate the possibility of fluctuations in the values of such positions or prevent losses if the values of such positions decline. However, we may establish other hedging positions designed to gain from those same developments, thereby offsetting the decline in the value of such portfolio positions. Such hedging transactions may also limit the opportunity for gain if the values of the portfolio positions should increase. Moreover, it may not be possible to hedge against certain interest rate fluctuations or to hedge effectively at an acceptable price.
While we may enter into such transactions to seek to reduce interest rate risks, unanticipated changes in interest rates may result in weaker overall investment performance than if we had not engaged in any such hedging transactions. In addition, the degree of correlation between price movements of the instruments used in a hedging strategy and price movements in the portfolio positions being hedged may vary. Moreover, for a variety of reasons, we may not seek to establish a perfect correlation between such hedging instruments and the portfolio holdings being hedged. Any such imperfect correlation may prevent us from achieving the intended hedge and expose us to risk of loss.
We currently hedge against interest rate risk. Our hedging activity varies in scope based on the level and volatility of interest rates, the type of portfolio investments held and other changing market conditions. Interest rate hedging may fail to protect or could adversely affect us because, among other things:
• | interest rate hedging can be expensive, particularly during periods of volatile interest rates; |
• | available interest rate hedging may not correspond directly with the interest rate risk for which protection is sought; |
• | the duration of the hedge may not match the duration of the related liability; |
7
• | the credit quality of the hedging counterparty may be downgraded to such an extent that it impairs our ability to sell or assign our side of the hedging transaction; and |
• | the counterparty in the hedging transaction may default on its obligation to pay. |
Our interest rate hedging activity may adversely affect our financial condition and results of operations, which could reduce cash available for distribution to our stockholders and negatively impact our stock price.
Our use of repo borrowings may give our lenders greater rights in the event that either we or any of our lenders file for bankruptcy, which may make it difficult for us to recover our collateral.
Our repo borrowings may qualify for special treatment under the U.S. Bankruptcy Code, giving our lenders the ability to avoid the automatic stay provisions of the U.S. Bankruptcy Code and take possession of and liquidate our collateral under the repurchase agreements without delay if we file for bankruptcy. Furthermore, the special treatment of repurchase agreements under the U.S. Bankruptcy Code may make it difficult for us to recover our pledged assets in the event that any of our lenders file for bankruptcy. Thus, the terms of repurchase agreements expose our pledged assets to risk in the event of a bankruptcy filing by either our lenders or us. In addition, if the lender is a broker or dealer subject to the Securities Investor Protection Act of 1970 or an insured depository institution subject to the Federal Deposit Insurance Act, our ability to exercise our rights to recover our collateral under a repurchase agreement or to be compensated for any damages resulting from the lender’s insolvency may be further limited by those statutes.
Our use of certain hedging transactions may expose us to counterparty risks.
If an interest rate swap counterparty cannot perform under the terms of the interest rate swap, we may not receive payments due under that swap, and thus, we may lose any unrealized gain associated with the interest rate swap. The hedged liability could cease to be hedged by the interest rate swap. Additionally, we may risk the loss of any collateral we have pledged to secure our obligations under the interest rate swap if the counterparty becomes insolvent or files for bankruptcy. Similarly, if an interest rate cap counterparty fails to perform under the terms of the interest rate cap agreement, we may not receive payments due under that agreement that would offset our interest expense. We could then incur a loss for the then remaining fair market value of the interest rate cap.
If the lending institution under one or more of our repo borrowings defaults on its obligation to resell the underlying security back to us at the end of the borrowing term, we will incur a loss on our repurchase transactions.
When we engage in a repo borrowing, we initially sell securities to the transaction counterparty under a master repurchase agreement in exchange for cash from the counterparty. The counterparty is obligated to resell the same securities back to us at the end of the term of the repo borrowing, which typically is 30 to 90 days but may be longer. If the counterparty in a repurchase transaction defaults on its obligation to resell the securities back to us, we will incur a loss on the transaction equal to the amount of the haircut (assuming no change in the value of the securities). Losses incurred on our repurchase transactions would adversely affect our earnings and our cash available for distribution to our stockholders.
If we default on our obligations under our repurchase agreements, we may be unable to establish a suitable replacement facility on acceptable terms or at all.
If we default on one of our obligations under a repurchase agreement, the counterparty may terminate the agreement and cease entering into any other repurchase agreements with us. In that case, we would likely need to establish a replacement repurchase facility with another financial institution in order to continue to leverage our investment portfolio and carry out our investment strategy. We may be unable to establish a suitable replacement repurchase facility on acceptable terms or at all.
Failure to procure adequate funding and capital would adversely affect our results and may, in turn, negatively affect the value of our common stock and our ability to distribute cash to our stockholders.
We depend upon the availability of adequate funding and capital for our operations. To maintain our status as a REIT, we are required to distribute at least 90% of our REIT taxable income annually, determined without regard to the deduction for dividends paid and excluding net capital gain, to our stockholders and therefore are not able to retain our earnings for new investments. We cannot assure you that any, or sufficient, funding or capital will be available to us in the future on terms that are acceptable to us. In the event that we cannot obtain sufficient funding and capital on acceptable terms, there may be a negative impact on the value of our common stock and our ability to make distributions to our stockholders, and our stockholders may lose part or all of their investment.
8
The Fed ending its monthly purchases pursuant to the third round of quantitative easing ("QE3") could continue to impact the market for and value of the Agency RMBS in which we invest, as well as our book value, or stockholders' equity, and net interest margin.
On September 13, 2012, the Fed announced a third round of quantitative easing, or QE3, which was an open-ended program designed to expand the its' holdings of long-term securities by purchasing an additional $40 billion of Agency RMBS per month until key economic indicators, such as the unemployment rate, showed signs of improvement. In December 2012, the Fed announced that it would begin buying $45 billion of long-term Treasury bonds each month. Beginning in early 2014, the Fed gradually reduced its purchases of both Agency RMBS and Treasury bonds, and in October 2014 ended its purchase program under QE3 (although it is still reinvesting principal and interest it receives on the Agency RMBS and U.S. Treasuries held in its portfolio).
It is unclear what effect, if any, the absence of the Fed’s monthly purchases, other than its reinvestment of principal and interest payments it receives for Agency RMBS in its portfolio, will have on the value of the Agency RMBS in which we invest. However, it is possible that the market for such securities, the price of such securities and, as a result, our book value and/or net interest margin could be negatively affected.
Adoption of the Basel III standards and other proposed supplementary regulatory standards may negatively impact our access to financing or affect the terms of our future financing arrangements.
In response to various financial crises and the volatility of financial markets, the Basel Committee on Banking Supervision adopted the Basel III standards several years ago. The final package of Basel III reforms was approved by the G20 leaders in November 2010. In January 2013, the Basel Committee agreed to delay implementation of the Basel III standards and expanded the scope of assets permitted to be included in a bank’s liquidity measurement. In 2014, the Basel Committee announced that it would propose additional changes to capital requirements for banks over the next few years.
U.S. regulators have elected to implement substantially all of the Basel III standards. Financial institutions will have until 2019 to fully comply with the Basel III standards, which could cause an increase in capital requirements for, and could place constraints on, the financial institutions from which we borrow.
In April 2014, U.S. regulators adopted rules requiring enhanced supplementary leverage ratio standards beginning in January 2018, which would impose capital requirements more stringent than those of the Basel III standards for the most systematically significant banking organizations in the U.S. Adoption and implementation of the Basel III standards and the supplemental regulatory standards adopted by U.S. regulators may negatively impact our access to financing or affect the terms of our future financing arrangements.
Clearing facilities or exchanges upon which some of our hedging instruments are cleared may increase margin requirements on our hedging instruments in the event of adverse economic developments.
In response to events having or expected to have adverse economic consequences or which create market uncertainty, clearing facilities or exchanges upon which some of our hedging instruments, such as interest rate swaps, are traded may require us to post additional collateral. In the event that future adverse economic developments or market uncertainty result in increased margin requirements for our hedging instruments, it could materially adversely affect our liquidity position, business, financial condition and results of operations.
Loss of our exemption from regulation under the Investment Company Act would negatively affect the value of shares of our common stock and our ability to distribute cash to our stockholders.
We have operated and intend to continue to operate our business so as to be exempt from registration under the Investment Company Act because we are “primarily engaged in the business of purchasing or otherwise acquiring mortgages and other liens on and interests in real estate.” Specifically, we invest and intend to continue to invest so that at least 55% of the assets that we own on an unconsolidated basis consist of qualifying mortgages and other liens and interests in real estate, which are collectively referred to as “qualifying real estate assets,” and so that at least 80% of the assets we own on an unconsolidated basis consist of real estate related assets (including our qualifying real estate assets). We treat Fannie Mae, Freddie Mac and Ginnie Mae whole-pool residential mortgage pass-through securities issued with respect to an underlying pool of mortgage loans in which we hold all of the certificates issued by the pool as qualifying real estate assets. Although CMOs are real estate related assets, they are not “qualifying real estate assets” for purposes of the Investment Company Act.
9
If we fail to qualify for this exemption, or the SEC determines that companies that invest in RMBS are no longer able to rely on this exemption, we could be required to restructure our activities in a manner that, or at a time when, we would not otherwise choose to do so, or we may be required to register as an investment company under the Investment Company Act, either of which could negatively affect the value of shares of our common stock and our ability to make distributions to our stockholders.
The federal conservatorship of Fannie Mae and Freddie Mac and related efforts, along with any changes in laws and regulations affecting the relationship between Fannie Mae and Freddie Mac and the U.S. government, may adversely affect our business.
The payments we receive on the Agency RMBS in which we invest depend upon a steady stream of payments on the mortgages underlying the securities and are guaranteed by Ginnie Mae, Fannie Mae or Freddie Mac. Ginnie Mae is part of a U.S. government agency and its guarantees are backed by the full faith and credit of the United States. Fannie Mae and Freddie Mac are U.S. government-sponsored entities (“GSEs”), but their guarantees are not backed by the full faith and credit of the United States.
In 2008, shortly after Fannie Mae and Freddie Mac were placed in federal conservatorship, the Secretary of the U.S. Treasury noted that the guarantee structure of Fannie Mae and Freddie Mac required examination and that changes in the structures of the entities were necessary to reduce risk to the financial system. The future roles of Fannie Mae and Freddie Mac, if any, could be significantly reduced and the nature of their guarantees could be eliminated or considerably limited relative to historical measurements. Any changes to the nature of the guarantees provided by Fannie Mae and Freddie Mac, if any, could redefine what constitutes Agency RMBS and could have broad adverse market implications as well as negatively impact us.
The problems faced by Fannie Mae and Freddie Mac resulting in their being placed into federal conservatorship have resulted in proposed legislation to restructure the U.S. housing finance system and the operations of Fannie Mae and Freddie Mac. If federal policy makers decide that the U.S. government’s role in providing liquidity for the residential mortgage market should be reduced or eliminated, each of Fannie Mae and Freddie Mac could be dissolved and the U.S. government could decide to stop providing liquidity support of any kind to the mortgage market. If Fannie Mae or Freddie Mac were eliminated, or their structures were to change radically, we would not be able to acquire Agency RMBS from these companies, which would drastically reduce the amount and type of Agency RMBS available for investment. As of December 31, 2014, substantially all of our investments had the principal and interest guaranteed by either Fannie Mae, Freddie Mac, or Ginnie Mae, or were U.S. Treasuries.
Our income could be negatively affected in a number of ways depending on the manner in which related events unfold. For example, the current credit support provided by the U.S. Treasury to Fannie Mae and Freddie Mac, and any additional credit support it may provide in the future, could have the effect of lowering the interest rate we receive from Agency RMBS, thereby tightening the spread between the interest we earn on our portfolio of targeted investments and our cost of financing that portfolio. A reduction in the supply of Agency RMBS could also increase the prices of Agency RMBS we seek to acquire thereby reducing the spread between the interest we earn on our portfolio of targeted assets and our cost of financing that portfolio.
The effect of these actions taken by the U.S. government remains uncertain. Furthermore, the scope and nature of the actions that the U.S. government will ultimately undertake are unknown and will continue to evolve. Future legislation, if any, could further change the relationship between Fannie Mae and Freddie Mac and the U.S. government, and could also nationalize or eliminate these GSEs entirely. Any law affecting these GSEs, if any, may create market uncertainty and have the effect of reducing the actual or perceived credit quality of securities, either existing or new, issued or guaranteed by Fannie Mae or Freddie Mac. As a result, such laws could increase the risk of loss on investments in Fannie Mae and Freddie Mac Agency RMBS. It is also possible that such laws, if any, could adversely impact the market for such securities and the spreads at which they trade. All of the foregoing could materially adversely affect the pricing, supply, liquidity and value of our target assets and otherwise materially adversely affect our business, operations and financial condition.
We cannot predict the impact, if any, on our earnings or cash available for distributions to our stockholders of the Federal Housing Finance Agency's ("FHFA") proposed revisions to Fannie Mae’s, Freddie Mac’s and Ginnie Mae’s existing infrastructures to align the standards and practices of the three entities.
On February 21, 2012, the FHFA released its Strategic Plan for Enterprise Conservatorships, which set forth three goals for the next phase of the Fannie Mae and Freddie Mac conservatorships. These three goals are: to (i) build a new infrastructure for the secondary mortgage market, (ii) gradually contract Fannie Mae and Freddie Mac’s presence in the marketplace while simplifying and shrinking their operations, and (iii) maintain foreclosure prevention activities and credit availability for new and refinanced mortgages. On October 4, 2012, the FHFA released its white paper entitled Building a New Infrastructure for the Secondary Mortgage Market, which proposes a new infrastructure for Fannie Mae and Freddie Mac that has two basic goals.
10
The first such goal is to replace the current infrastructures of Fannie Mae and Freddie Mac with a common, more efficient infrastructure that aligns the standards and practices of the two entities, beginning with core functions performed by both entities such as issuance, master servicing, bond administration, collateral management and data integration. The FHFA issued a progress report in April 2013 on steps being taken to establish a common securitization platform (“CSP”) for residential mortgage-backed securities reflecting the feedback from a broad cross-section of industry participants. In May 2014, the FHFA issued a progress report on the initiatives outlined in the Strategic Plan for the Enterprise Conservatorships detailing important progress toward the building of a new secondary mortgage market infrastructure. According to the progress report, Fannie Mae and Freddie Mac have made some progress in developing the CSP. While some progress has been made in developing the CSP, the project faces considerable challenges that could undermine its prospects for success, including: (i) the difficulties inherent in developing a large-scale information technology system and (ii) the risks involved with preparing Fannie Mae and Freddie Mac to integrate with the CSP, including modifying internal financial and information systems.
The second goal is to establish an operating framework for Fannie Mae and Freddie Mac that is consistent with the progress of housing finance reform and encourages and accommodates the increased participation of private capital in assuming credit risk associated with the secondary mortgage market.
The FHFA recognizes that there are a number of impediments to their goals which may or may not be surmountable, such as the absence of any significant secondary mortgage market mechanisms beyond Fannie Mae, Freddie Mac and Ginnie Mae, and that their proposals are in the formative stages. As a result, it is unclear if the proposals will be enacted. If such proposals are enacted, it is unclear how closely what is enacted will resemble the proposals from the FHFA White Paper or what the effects of the enactment will be in terms of our book value, earnings or cash available for distribution to our stockholders.
Mortgage loan modification programs and future legislative action may adversely affect the value of, and the returns on, the Agency RMBS in which we invest.
Over the last few years, the U.S. government, through the Federal Housing Administration ("FHA"), the U.S. Treasury and the Federal Deposit Insurance Corporation (“FDIC”), has implemented a variety of programs designed to provide homeowners with assistance in avoiding residential mortgage loan foreclosures. These and any future programs may involve, among other things, the modification of mortgage loans to reduce the principal amount of the loans or the rate of interest payable on the loans, or to extend the payment terms of the loans. It is likely that loan modifications would result in increased prepayments on some Agency RMBS. Prepayment rates could negatively affect the value of our Agency RMBS, which could result in reduced earnings or losses and negatively affect the cash available for distribution to our stockholders,” for information relating to the impact of prepayments on our business. These initiatives, any future loan modification programs and future legislative or regulatory actions, including amendments to the bankruptcy laws, that result in the modification of outstanding mortgage loans may adversely affect the value of, and the returns on, the Agency RMBS, U.S. Treasuries, CMOs and U.S. Agency Debentures in which we may invest.
Prepayment rates could negatively affect the value of our Agency RMBS, which could result in reduced earnings or losses and negatively affect the cash available for distribution to our stockholders.
In the case of residential mortgage loans, there are seldom any restrictions on borrowers’ abilities to prepay their loans. Homeowners tend to prepay mortgage loans faster when applicable mortgage interest rates decline. Consequently, owners of the loans have to reinvest the money received from the prepayments at the lower prevailing interest rates. Conversely, homeowners tend not to prepay mortgage loans when mortgage interest rates remain steady or increase. Consequently, owners of the loans are unable to reinvest money that would have otherwise been received from prepayments at the higher prevailing interest rates. Fannie Mae, Freddie Mac or Ginnie Mae guarantees of principal and interest related to the Agency RMBS we own do not protect us against prepayment risks. This volatility in prepayment rates may affect our ability to maintain targeted amounts of leverage on our Agency RMBS portfolio and may result in reduced earnings or losses for us and negatively affect the cash available for distribution to our stockholders.
Our portfolio investments are recorded at fair value based on market quotations from pricing services and broker dealers. The value of our common stock could be adversely affected if our determinations regarding the fair value of these investments were materially higher than the values that we ultimately realize upon their disposal.
All of our current portfolio investments are, and some of our future portfolio investments will be, in the form of securities that are not publicly traded. The fair value of securities and other investments that are not publicly traded may not be readily determinable. We currently value and will continue to value these investments monthly at fair value as determined by our management based on market quotations from pricing services and brokers/dealers. Because such quotations and valuations are inherently uncertain, they may fluctuate over short periods of time and may be based on estimates, and our determinations of fair
11
value may differ materially from the values that would have been used if a public market for these securities existed. The value of our common stock could be adversely affected if our determinations regarding the fair value of these investments were materially higher than the values that we ultimately realize upon their disposal.
Our forward settling transactions, including “to-be-announced” transactions (“TBAs”), subject us to certain risks, including price risks and counterparty risks.
We purchase a substantial portion of our Agency RMBS through forward settling transactions, including TBAs. In a forward settling transaction, we enter into a forward purchase agreement with a counterparty to purchase either (i) an identified Agency RMBS, or (ii) a TBA , or to-be-issued, Agency RMBS with certain terms. As with any forward purchase contract, the value of the underlying Agency RMBS may decrease between the contract date and the settlement date. Furthermore, a transaction counterparty may fail to deliver the underlying Agency RMBS at the settlement date. If any of the above risks were to occur, our financial condition and results of operations may be materially adversely affected.
We are dependent on our key personnel and the loss of such key personnel could materially adversely affect our business, financial condition and results of operations and our ability to pay distributions to our stockholders.
We are dependent on the efforts of our key officers and employees, including Kevin E. Grant, our Chief Executive Officer, President and Chief Investment Officer. Although we have an employment agreement with him, we cannot assure you that he will remain employed with us. The loss of Mr. Grant’s services could have a material adverse effect on our business, financial condition and results of operations and our ability to pay distributions to our stockholders.
We operate in a highly competitive market for investment opportunities.
A number of entities compete with us to make the types of investments that we make. We compete with other mortgage REITs, specialty finance companies, public and private funds, commercial and investment banks, the Fed, other governmental entities or government sponsored entities, commercial finance companies, and other entities. Many of our competitors are substantially larger and have considerably greater financial, technical and marketing resources than we do. Several other REITs may have investment objectives that overlap with ours, which may create competition for investment opportunities. Some competitors may have a lower cost of funds and access to funding sources that are not available to us. In addition, some of our competitors may have higher risk tolerances or different risk assessments, which could allow them to consider a wider variety of investments and establish more relationships than us. We provide no assurances that the competitive pressures we face will not have a material adverse effect on our business, financial condition and results of operations. Also, as a result of this competition, we may not be able to take advantage of attractive investment opportunities from time to time, and we can offer no assurance that we will be able to identify and make investments that are consistent with our investment objectives.
Our board of directors does not approve each of our investment decisions, and may change our investment guidelines without notice or stockholder consent, which may result in riskier investments.
Our board of directors periodically reviews our investment guidelines, investment portfolio, and potential investment strategies. However, our directors do not pre-approve individual investments leaving management with day to day discretion over the portfolio composition within the investment guidelines. Within those guidelines, management has discretion to significantly change the composition of the portfolio. In addition, in conducting periodic reviews, the directors may rely primarily on information provided to them by our management. Our board of directors has the authority to change our investment guidelines at any time without notice to or consent from our stockholders. In 2008, our board of directors amended our investment guidelines to require that we invest exclusively in Agency RMBS. In 2010, our board of directors modified our investment guidelines to permit investments in CMOs. In 2012, our board of directors amended our investment guidelines to allow us to invest in U.S. Treasuries and U.S. Agency Debentures. To the extent that our investment guidelines change in the future, we may make investments that are different from, and possibly riskier than, the investments described in this Annual Report on Form 10-K. A change in our investment guidelines may increase our exposure to interest rate and real estate market fluctuations.
We may enter into derivative transactions that could expose us to unexpected economic losses in the future.
We may enter into certain derivative transactions, such as swaps, caps and certain options and other custom instruments, which are subject to the risk of non-performance by the counterparty, and risks relating to the creditworthiness of the counterparty. In addition, we are subject to the risk of the failure of any of the exchanges or clearing houses on which we trade. Interest rate swaps and caps can be individually negotiated and structured to include exposure to a variety of different types of investments or market factors. Depending on their structure, swaps and caps may increase or decrease exposure to long-term or short-term interest
12
rates (in the United States or abroad), foreign currency values, mortgage securities, corporate borrowing rates, or other factors such as security prices, baskets of equity securities or inflation rates.
Swaps and caps tend to shift investment exposure from one type of investment to another. Depending on how they are used, swaps and caps may increase or decrease the overall volatility of our portfolio. The most significant factor in the performance of swaps is the change in the specific interest rate, currency, individual equity values or other factors that determine the amounts of payments due to and from us. If a swap calls for payments or collateral transfers by us, we must be prepared to make such payments and transfers when due.
Part of our investment strategy involves entering into derivative transactions that could require us to fund cash payments in the future under certain circumstances, such as the early termination of the derivative transaction caused by any event of default or other early termination event, or the decision by a counterparty to request margin securities it is contractually owed under the terms of the derivative contract. The amount due would be equal to the unrealized loss of the open derivative positions with the respective counterparty and could also include other fees and charges. These potential payments would be contingent liabilities and therefore may not appear on our balance sheet. The economic losses will be reflected in our financial results of operations, and our ability to fund these obligations will depend on our liquidity and access to capital at the time. The need to fund these obligations could adversely impact our financial condition.
Certain hedging instruments are not traded on regulated exchanges, guaranteed by an exchange or its clearing house, or regulated by any U.S. or foreign governmental authorities and involve risks and costs.
The cost of using hedging instruments increases as the as the duration of the hedge increases and in periods of rising and/or volatile interest rates. Despite this, we may increase our hedging duration and/or enter into hedges during periods when interest rates are volatile or rising, and in such cases our hedging costs will increase.
In addition, hedging instruments typically involve risk because certain of them are not currently traded on regulated exchanges, guaranteed by an exchange or its clearing house, or regulated by any U.S. or foreign governmental authorities. Consequently, there are no requirements with respect to record keeping, financial responsibility or segregation of customer funds and positions. Furthermore, the enforceability of agreements underlying derivative transactions may depend on compliance with applicable statutory and commodity and other regulatory requirements and, depending on the identity of the counterparty, applicable international requirements. The business failure of a hedging counterparty with whom we enter into a hedging transaction most likely will result in a default. Default by a party with whom we enter into a hedging transaction may result in the loss of unrealized profits and force us to cover our resale commitments, if any, at the then current market price. In addition, we may not always be able to dispose of or close out a hedging position without the consent of the hedging counterparty, and we may not be able to enter into an offsetting contract to cover our risk. We cannot assure you that a liquid secondary market will exist for hedging instruments purchased or sold, and we may be required to maintain a position until exercise or expiration, which could result in losses.
Failure to obtain and maintain an exemption from being regulated as a commodity pool operator could subject us to additional regulation and compliance requirements and may result in fines and other penalties which could materially adversely affect our business, financial condition and results of operations.
The Dodd-Frank Wall Street Reform and Consumer Protection Act (the “Dodd-Frank Act”) established a comprehensive new regulatory framework for derivative transactions commonly referred to as “swaps.” As a result, any investment fund that trades in swaps may be considered a “commodity pool,” which would cause its operators (and in some cases the fund’s directors) to be regulated as “commodity pool operators” (“CPOs”). Under new rules adopted by the U.S. Commodity Futures Trading Commission (the “CFTC”), those funds that become commodity pools solely because of their use of swaps must register with the National Futures Association (“NFA”). Registration requires compliance with the CFTC’s regulations and the NFA’s rules with respect to capital raising, disclosure, reporting, recordkeeping and other business conduct. However, the CFTC’s Division of Swap Dealer and Intermediary Oversight has issued a no-action letter saying, although it believes that mortgage REITs are properly considered commodity pools, it would not recommend that the CFTC take enforcement action against the operator of a mortgage REIT who does not register as a CPO if, among other things, the mortgage REIT limits the initial margin ("IM") and premiums required to establish its swaps, futures and other commodity interest positions to not more than five percent of its total assets, the mortgage REIT limits the net income derived annually from those commodity interest positions that are not qualifying hedging transactions to less than five percent of its gross income and interests in the mortgage REIT are not marketed to the public as or in a commodity pool or otherwise as or in a vehicle for trading in the commodity futures, commodity options or swaps markets.
We do not currently engage in any speculative derivatives activities or other non-hedging transactions using swaps, futures or options on futures. We do not use these instruments for the purpose of trading in commodity interests, and we do not consider
13
our company or our operations to be a commodity pool as to which CPO registration or compliance is required. We have submitted the required filing to claim the no-action relief afforded by the above-described no-action letter. Consequently, we will be restricted to operating within the parameters discussed in the no-action letter and will not enter into hedging transactions covered by the no-action letter if they would cause us to exceed the limits set forth in the no-action letter.
The CFTC has substantial enforcement power with respect to violations of the laws over which it has jurisdiction, including its anti-fraud and anti-manipulation provisions. For example, the CFTC may suspend or revoke the registration of or the no-action relief afforded to a person who fails to comply with commodities laws and regulations, prohibit such a person from trading or doing business with registered entities, impose civil money penalties, require restitution and seek fines or imprisonment for criminal violations. Additionally, a private right of action exists against those who violate the laws over which the CFTC has jurisdiction or who willfully aid, abet, counsel, induce or procure a violation of those laws. In the event that we fail to comply with statutory requirements relating to derivatives or with the CFTC’s rules thereunder, including the no-action letter described above, we may be subject to significant fines, penalties and other civil or governmental actions or proceedings, any of which could have a materially adverse effect on our business, financial condition and results of operations.
We are highly dependent on communications and information systems operated by third parties, and systems failures could significantly disrupt our business, which may, in turn, negatively affect the market price of our common stock and our ability to pay distributions to our stockholders.reorder
Our business is highly dependent on communications and information systems that allow us to monitor, value, buy, sell, finance and hedge our investments. These systems are primarily operated by third parties and, as a result, we have limited ability to ensure their continued operation. In the event of systems failure or interruption, we will have limited ability to affect the timing and success of systems restoration. Any failure or interruption of our systems could cause delays or other problems in our securities trading activities, including Agency RMBS trading activities, which could have a material adverse effect on our operating results and negatively affect the market price of our common stock and our ability to make distributions to our stockholders
If we issue debt securities or equity securities that are senior to our stock for the purposes of dividend and liquidating distributions, our operations may be restricted, we will be exposed to additional risk and the market price of our common stock could be adverse affected.
If we decide to issue debt securities in the future, it is likely that such securities will be governed by an indenture or other instrument containing covenants restricting our operating flexibility. Additionally, any convertible or exchangeable securities that we issue in the future may have rights, preferences and privileges more favorable than those of our common stock. We have issued and outstanding an aggregate of 3,000,000 shares of our 7.75% Series A Cumulative Redeemable Preferred Stock and 8,000,000 shares of our 7.50% Series B Cumulative Redeemable Preferred Stock. Other classes or series of our preferred stock, if issued, could have a preference on liquidating distributions or a preference on dividend payments that could limit our ability to make a distribution to the holders of our common stock. We, and indirectly our stockholders, will bear the cost of issuing and servicing such securities. Holders of debt securities may be granted specific rights, including but not limited to, the right to hold a perfected security interest in certain of our assets, the right to accelerate payments due under the indenture, rights to restrict dividend payments, and rights to approve the sale of assets. Such additional restrictive covenants, operating restrictions and preferential dividends could have a material adverse effect on our operating results and negatively affect the market price of our common stock and our ability to pay distributions to our stockholders.
A security breach or a cyber-attack could adversely affect our business.
We rely on sophisticated information technology systems, networks and infrastructure in managing our day-to-day business and operations. Despite in-place cyber-security measures, our information technology systems, networks and infrastructure may be vulnerable to deliberate attacks or unintentional events that could interrupt or interfere with their functionality or the confidentiality of our information. Our inability to effectively utilize our information technology systems, networks and infrastructure, and protect our information could adversely affect our business.
CMOs may be subject to greater risks than whole-pool Agency RMBS.
In March 2010, our board of directors amended our investment guidelines to allow us to invest in CMOs. CMOs are securitizations issued by a government agency or a government-sponsored entity that are collateralized by Agency RMBS that are divided into various tranches that have different characteristics (such as different maturities or different coupon payments), and, therefore, may carry greater risk than an investment in whole-pool Agency RMBS. For example, certain CMO tranches, such as interest-only securities, principal-only securities, support securities and securities purchased at a significant premium, are more
14
sensitive to prepayment risks than other tranches or whole-pool Agency RMBS. In addition, the yield on floating interest rate tranches and inverse floating rate tranches are sensitive to changes in the interest rate index used to calculate the coupon on such classes. Although we owned no CMOs in 2014 or 2013, if we were to invest in CMO tranches that were more sensitive to prepayment risks relative to other CMO tranches or whole-pool Agency RMBS, we may increase our portfolio-wide prepayment and interest rate risk.
Risks Related to Our Organization and Structure
Our charter and bylaws contain provisions that may inhibit potential acquisition bids that you and other stockholders may consider favorable, and the market price of our common stock may be lower as a result.
Our charter and bylaws contain provisions that may have an anti-takeover effect and inhibit a change in our board of directors. In order to qualify as a REIT for each taxable year after 2006, not more than 50% of the value of our outstanding capital stock may be owned, directly or constructively, by five or fewer individuals (as defined under the Internal Revenue Code of 1986, as amended (the “Code”), to include natural persons and certain entities) during the second half of any calendar year and our shares must be beneficially owned by 100 or more persons during at least 335 days of a taxable year of twelve months or during a proportionate part of a shorter taxable year. To assist us in meeting these requirements, subject to some exceptions, our charter generally prohibits any stockholder from beneficially or constructively owning more than 9.8% in value or number of shares, whichever is more restrictive, of any class or series of our outstanding capital stock unless an exemption is granted by our board of directors in its sole discretion.
This ownership restriction may:
• | discourage a tender offer or other transactions or a change in the composition of our board of directors or control that might involve a premium price for our shares or otherwise be in the best interests of our stockholders; or |
• | result in shares issued or transferred in violation of such restriction being automatically transferred to a trust for a charitable beneficiary and thereby resulting in a forfeiture of such shares. |
Our charter permits our board of directors to issue common or preferred stock with terms that may discourage a third party from acquiring us. Our charter permits our board of directors to amend our charter, without approval of our stockholders, to increase the total number of authorized shares of stock or the number of shares of any class or series, and to cause the issuance of common or preferred stock, having preferences, conversion or other rights, voting powers, restrictions, limitations as to distributions, qualifications, or terms or conditions of redemption as determined by our board of directors. Thus, our board of directors could authorize the issuance of common or preferred stock with terms and conditions that could have the effect of discouraging a takeover or other transaction in which holders of some or a majority of our shares might receive a premium for their shares over the then-prevailing market price of our shares.
Our charter and bylaws contain other possible anti-takeover provisions.
Our charter and bylaws contain other provisions that may have the effect of delaying, deferring or preventing a change in control of us or the removal of existing directors and, as a result, could prevent our stockholders from being paid a premium for their common stock over the then-prevailing market price.
Certain provisions of Maryland law could inhibit changes in control.
Certain provisions of the Maryland General Corporation Law ( the “MGCL”) may have the effect of inhibiting a third party from making a proposal to acquire us or impeding a change of control under circumstances that otherwise could provide our stockholders with the opportunity to realize a premium over the then-prevailing market price of our common stock, including:
• | “business combination” provisions that, subject to limitations, prohibit certain business combinations between us and an “interested stockholder” (defined generally as any person who beneficially owns 10% or more of the voting power of our shares or an affiliate thereof) for five years after the most recent date on which the stockholder becomes an interested stockholder, and thereafter special stockholder voting requirements on these combinations; and |
• | “control share” provisions that provide that “control shares” of our company (defined as shares which, when aggregated with other shares controlled by the stockholder, entitle the stockholder to exercise one of three increasing ranges of voting power in electing directors) acquired in a “control share acquisition” (defined as the direct or indirect acquisition of ownership or control of “control shares”) have no voting rights except to the extent approved by our |
15
stockholders by the affirmative vote of at least two-thirds of all the votes entitled to be cast on the matter, excluding all interested shares.
We have elected to opt out of these provisions of the MGCL, in the case of the business combination provisions of the MGCL, by resolution of our board of directors, and in the case of the control share provisions of the MGCL, pursuant to a provision in our bylaws. However, our board of directors may by resolution elect to repeal the foregoing opt-outs from the business combination provisions of the MGCL, and we may, by amendment to our bylaws, opt in to the control share provisions of the MGCL in the future.
Our rights and the rights of our stockholders to take action against our directors and officers are limited, which could limit your recourse in the event of actions not in your best interests.
Our charter limits the liability of our directors and officers to us and our stockholders for money damages, except for liability resulting from:
• | actual receipt of an improper benefit or profit in money, property or services; or |
• | a final judgment based upon a finding of active and deliberate dishonesty by the director or officer that was material to the cause of action adjudicated. |
We have entered into indemnification agreements with our directors and executive officers that obligate us to indemnify them to the maximum extent permitted by Maryland law. In addition, our charter authorizes our company to obligate itself to indemnify our present and former directors and officers for actions taken by them in those capacities to the maximum extent permitted by Maryland law. Our bylaws require us, to the maximum extent permitted by Maryland law, to indemnify each present or former director or officer who has been successful in the defense of any proceeding to which he or she is made, or threatened to be made, a party by reason of his or her service to us. In addition, we may be obligated to fund the defense costs incurred by our directors and officers.
We may be subject to adverse legislative or regulatory changes that could reduce the market price of our common stock.
At any time, laws or regulations, or the administrative interpretations of those laws or regulations, that impact our business and Maryland corporations may be amended. In addition, the markets for MBS and derivatives, including swaps, have been the subject of intense scrutiny in recent years. We cannot predict when or if any new law, regulation or administrative interpretation, or any amendment to any existing law, regulation or administrative interpretation, will be adopted or promulgated or will become effective. Additionally, revisions in these laws, regulations or administrative interpretations could cause us to change our investments. We could be adversely affected by any such change in, or any new, law, regulation or administrative interpretation, which could reduce the market price of our common stock.
Tax Risks
Failure to qualify as a REIT would subject us to federal and state income tax, which could adversely affect the value of the shares of our stock and would reduce the cash available for distribution to our stockholders.
We operate in a manner that is intended to cause us to qualify as a REIT for federal income tax purposes. However, the federal income tax laws governing REITs are complex, and interpretations of the federal income tax laws governing qualification as a REIT are limited. Qualifying as a REIT requires us to meet various tests regarding the nature of our assets and our income, the ownership of our outstanding stock, and the amount of our distributions on an ongoing basis.
Our ability to satisfy the asset tests depends upon the characterization and fair market values of our assets, some of which are not susceptible to a precise determination, and for which we will not obtain independent appraisals. Our compliance with the REIT income and quarterly asset requirements also depends upon our ability to successfully manage the composition of our income and assets on an ongoing basis. Although we intend to operate so that we will qualify as a REIT, given the highly complex nature of the rules governing REITs, the ongoing importance of factual determinations, and the possibility of future changes in our circumstances, no assurance can be given that we will so qualify for any particular year.
If we fail to qualify as a REIT in any calendar year, we would be required to pay federal and state income tax, including any applicable alternative minimum tax, on our taxable income at regular corporate rates, and dividends paid to our stockholders would not be deductible by us in computing our taxable income. Further, if we fail to qualify as a REIT, we might need to borrow money or sell assets in order to pay any resulting taxes. Our payment of income tax would decrease the amount of our income
16
available for distribution to our stockholders. Furthermore, if we fail to maintain our qualification as a REIT, we no longer would be required to distribute substantially all of our REIT taxable income to our stockholders. Unless our failure to qualify as a REIT was subject to relief under federal tax laws, we could not re-elect to qualify as a REIT until the fifth calendar year following the year in which we failed to qualify.
Our ability to invest in and dispose of securities through forward settling transactions could be limited by our REIT status, and we could lose our REIT status as a result of these investments.
We purchase a substantial portion of our Agency RMBS through contracts for forward settling transactions, including TBAs. In certain instances, rather than take delivery of the Agency RMBS subject to a contract for a forward settling transaction, we will dispose of the contract for a forward settling transaction through a dollar roll transaction in which we agree to purchase similar securities in the future at a predetermined price or otherwise, which may result in the recognition of income or gains. We account for dollar roll transactions as purchases and sales. The law is unclear regarding whether contracts for forward settling transactions will be qualifying assets for the 75% asset test and whether income and gains from dispositions of contracts for forward settling transactions will be qualifying income for the 75% gross income test.
Until such time as we seek and receive a favorable private letter ruling from the Internal Revenue Service (the “IRS”), or we are advised by counsel that contracts for forward settling transactions should be treated as qualifying assets for purposes of the 75% asset test, we will limit our net investment in contracts for forward settling transactions and any non-qualifying assets to no more than 25% of our assets at the end of any calendar quarter and will limit our investments in contracts for forward settling transactions with a single counterparty to no more than 5% of our total assets at the end of any calendar quarter. Further, until such time as we seek and receive a favorable private letter ruling from the IRS or we are advised by counsel that income and gains from the disposition of contracts for forward settling transactions should be treated as qualifying income for purposes of the 75% gross income test, we will limit our gains from dispositions of contracts for forward settling transactions and any non-qualifying income to no more than 25% of our gross income for each calendar year. Accordingly, our ability to purchase Agency RMBS through contracts for forward settling transactions and to dispose of contracts for forward settling transactions, through dollar roll transactions or otherwise, could be limited.
Moreover, even if we are advised by counsel that contracts for forward settling transactions should be treated as qualifying assets or that income and gains from dispositions of contracts for forward settling transactions should be treated as qualifying income, it is possible that the IRS could successfully take the position that such assets are not qualifying assets and such income is not qualifying income. In that event, we could be subject to a penalty tax or we could fail to qualify as a REIT if (i) the value of our contracts for forward settling transactions, together with our non-qualifying assets for the 75% asset test, exceeded 25% of our gross assets at the end of any calendar quarter or if the value of our investments in contracts for forward settling transactions with a single counterparty exceeded 5% of our total assets at the end of any calendar quarter or (ii) our income and gains from the disposition of contracts for forward settling transactions, together with our non-qualifying income for the 75% gross income test, exceeded 25% of our gross income for any taxable year.
Complying with REIT requirements may cause us to forego otherwise attractive opportunities.
To qualify as a REIT for federal income tax purposes, we must continually satisfy tests concerning, among other things, the sources of our income, the nature and diversification of our assets, the amounts we distribute to our stockholders and the ownership of our stock. In order to meet these tests, we may be required to forego attractive business or investment opportunities. Thus, compliance with the REIT requirements may hinder our ability to operate solely on the basis of maximizing profits.
Liquidation of assets may jeopardize our REIT qualification.
To qualify as a REIT, we must comply with requirements regarding our assets and our sources of income. If we are compelled to liquidate our investments to repay obligations to our lenders, we may be unable to comply with these requirements, ultimately jeopardizing our qualification as a REIT, or we may be subject to a 100% tax on any resultant gain if we sell assets that are treated as dealer property or inventory.
Failure to make required distributions would subject us to tax, which would reduce the cash available for distribution to our stockholders.
In order to qualify as a REIT, an entity must distribute to its stockholders, each calendar year, at least 90% of its REIT taxable income, determined without regard to the deduction for dividends paid and excluding net capital gain. To the extent that a REIT satisfies the 90% distribution requirement, but distributes less than 100% of its taxable income, it will be subject to federal
17
corporate income tax on its undistributed income. In addition, a REIT will incur a 4% nondeductible excise tax on the amount, if any, by which its distributions in any calendar year are less than the sum of:
• | 85% of its REIT ordinary income for that year; |
• | 95% of its REIT capital gain net income for that year; and |
• | 100% of its undistributed taxable income from prior years. |
We intend to continue to make distributions in the future to our stockholders in a manner intended to satisfy the 90% distribution requirement and to avoid both federal corporate income tax and the 4% nondeductible excise tax. However, there is no requirement that taxable REIT subsidiaries (“TRSs”) distribute their after-tax net income to their parent REIT or their stockholders, and if we utilize a TRS, it may determine not to make any distributions to us.
Our taxable income may substantially exceed our net income as determined based on GAAP because, for example, realized capital losses will be deducted in determining our GAAP net income, but may not be deductible in computing our taxable income. In addition, we may invest in assets that generate taxable income in excess of economic income or in advance of the corresponding cash flow from the assets, referred to as phantom income. Although some types of phantom income are excluded in determining the 90% distribution requirement, we will incur corporate income tax and the 4% nondeductible excise tax with respect to any phantom income items if we do not distribute those items on an annual basis. As a result of the foregoing, we may generate less cash flow than taxable income in a particular year. In that event, we may be required to use cash reserves, incur debt or liquidate non-cash assets at rates or times that we regard as unfavorable in order to satisfy the distribution requirement and to avoid federal corporate income tax and the 4% nondeductible excise tax in that year.
We may satisfy the 90% distribution test with taxable distributions of our stock or debt securities. The IRS has issued private letter rulings to other REITs treating certain distributions that are paid partly in cash and partly in stock as dividends that would satisfy the REIT annual distribution requirement and qualify for the dividends paid deduction for federal income tax purposes. Those rulings may be relied upon only by taxpayers to whom they were issued, but we could request a similar ruling from the IRS. In addition, the IRS issued a revenue procedure authorizing publicly traded REITs to make elective cash/stock dividends, but that revenue procedure has expired. Accordingly, it is unclear whether and to what extent we will be able to make taxable dividends payable in cash and stock. Although we have no current intention of paying dividends in our own stock, if in the future we choose to pay dividends in our own stock, our stockholders may be required to pay tax in excess of the cash that they receive.
Complying with REIT requirements may limit our ability to hedge effectively.
The REIT provisions of the Code limit our ability to hedge Agency RMBS and related borrowings. Under these provisions, we must limit our aggregate gross income from non-qualifying hedges, fees, and certain other non-qualifying sources to 5% or less of our annual gross income. As a result, we might in the future have to limit our use of advantageous hedging techniques or implement those hedges through a domestic TRS. This could increase the cost of our hedging activities, because a domestic TRS would be subject to tax on gains, or leave us exposed to greater risks associated with changes in interest rates than we would otherwise want to bear.
Withholding tax may apply to our dividends and, after December 31, 2016, to proceeds of sales in respect of our stock.
U.S. federal withholding tax at a 30% rate will apply to payments of dividends and, after December 31, 2016, to gross proceeds from sales of our stock made to foreign financial institutions (and certain of their affiliates) unless the payee foreign financial institution agrees with the IRS, or in some cases its home country government, among other things, to disclose the identity of certain U.S. persons and U.S.-owned foreign entities with accounts at the institution (or the institution’s affiliates) and to annually report certain information about such accounts. The withholding tax also will apply to payments of dividends and gross proceeds of sales to certain foreign entities that do not disclose the name, address and taxpayer identification number of any substantial U.S.-owners (or certify that they do not have any substantial United States owners).
Thus, if a stockholder holds our shares through a foreign financial institution or foreign corporation or trust, dividends and gross proceeds of sales made after the applicable dates may be subject to a 30% withholding tax. Stockholders that are not United States persons may be subject to withholding tax on our dividends under current law.
The taxation of corporate dividends may adversely affect the value of our stock.
The maximum tax rate applicable to “qualified dividend income” payable to U.S. stockholders that are taxed at individual rates is 20% (plus the 3.8% surtax on net investment income, if applicable). Dividends payable by REITs, however, are generally
18
not eligible for the reduced rates on qualified dividend income. The more favorable rates applicable to regular corporate qualified dividends could cause investors who are taxed at individual rates to perceive investments in REITs to be relatively less attractive than investments in the stocks of non-REIT corporations that pay dividends, which could adversely affect the value of the shares of REITs, including our stock.
The failure of Agency RMBS subject to a repurchase agreement to qualify as real estate assets would adversely affect our ability to qualify as a REIT.
We have entered into sale and repurchase agreements under which we nominally sold certain of our Agency RMBS to a counterparty and simultaneously entered into an agreement to repurchase the sold assets. We believe that we are treated for federal income tax purposes as the owner of the Agency RMBS that are the subject of any such agreement notwithstanding that such agreements may transfer record ownership of such assets to the counterparty during the term of the agreement. It is possible, however, that the IRS could successfully assert that we did not own the Agency RMBS during the term of the sale and repurchase agreement, in which case we could fail to qualify as a REIT.
Even if we remain qualified as a REIT, we may face other tax liabilities that reduce our cash flow.
Even if we remain qualified for taxation as a REIT, we may be subject to certain federal, state and local taxes on our income and assets. Any of these taxes would decrease cash available for distribution to our stockholders.
We may be subject to adverse legislative or regulatory tax changes that could reduce the market price of our common stock.
At any time, the federal income tax laws or regulations governing REITs or the administrative interpretations of those laws or regulations may be amended. We cannot predict when or if any new federal income tax law, regulation or administrative interpretation, or any amendment to any existing federal income tax law, regulation or administrative interpretation, will be adopted or promulgated or will become effective and any such law, regulation or interpretation may take effect retroactively. We and our stockholders could be adversely affected by any such change in, or any new, federal income tax law, regulation or administrative interpretation. Additionally, revisions in federal tax laws and interpretations thereof could cause us to change our investments and commitments and affect the tax considerations of an investment in us.
Item 1B. Unresolved Staff Comments
None.
Item 2. Properties
Our principal executive offices are located in leased space at 890 Winter Street, Suite 200, Waltham, Massachusetts 02451 and the telephone number of our offices is (617) 639-0440.
Item 3. Legal Proceedings
The Company is not currently subject to any material legal proceedings.
Item 4. Mine Safety Disclosures
None.
PART II
Item 5. Market for Registrant’s Common Equity, Related Stockholder Matters and Issuer Purchases of Equity Securities
Market and Dividend Information
Our common stock has been listed and is traded on the New York Stock Exchange (“NYSE”) under the symbol “CYS” since June 12, 2009. We intend to continue to pay quarterly dividends to holders of shares of common stock. Future dividends will be at the discretion of the board of directors and will depend on our earnings and financial condition, maintenance of our REIT qualification, restrictions on making distributions under Maryland law and such other factors as our board of directors deems relevant. The following table presents the high and low sales prices for our common stock as reported by the NYSE and dividends declared for the period from January 1, 2013 to December 31, 2014.
19
High | Low | Common Dividends Declared Per Share | ||||||||||
Quarter Ended March 31, 2013 | $ | 13.08 | $ | 11.58 | $ | 0.32 | ||||||
Quarter Ended June 30, 2013 | 12.50 | 8.81 | 0.34 | |||||||||
Quarter Ended September 30, 2013 | 9.33 | 6.74 | 0.34 | |||||||||
Quarter Ended December 31, 2013 | 8.88 | 7.20 | 0.32 | |||||||||
Quarter Ended March 31, 2014 | 8.92 | 7.41 | 0.32 | |||||||||
Quarter Ended June 30, 2014 | 9.24 | 8.13 | 0.32 | |||||||||
Quarter Ended September 30, 2014 | 9.43 | 8.24 | 0.30 | |||||||||
Quarter Ended December 31, 2014 | 9.28 | 8.34 | 0.30 | |||||||||
Holders of Our Common Stock
As of January 31, 2015, there were 277 record holders of our common stock, including shares held in “street name” by nominees who are record holders.
Issuer Purchases of Equity Securities
The following table summarizes purchases of equity securities during the fourth quarter of fiscal year 2014 by the Company and affiliated purchasers (dollars in thousands except per share amounts):
Period | Total Number of Shares Purchased 1 | Average Price Paid Per Share 1 | Dollar Value of Shares That May Yet Be Purchased 1 | ||||||||
October 1, 2014 - October 31, 2014 | 92,511 | $ | 8.83 | $ | 248,828 | ||||||
November 1, 2014 - November 30, 2014 | 3,100 | 8.87 | 248,800 | ||||||||
December 1, 2014 - December 31, 2014 | 37,138 | 9.01 | 248,465 | ||||||||
Total | 132,749 | $ | 8.88 | ||||||||
____________
1 The Company repurchased shares of its common stock in open-market transactions pursuant to its share repurchase program, authorized by its Board of Directors and publicly announced on July 21, 2014. Pursuant to this authority, the Company may repurchase shares of its common stock up to $250 million in aggregate value. Since July 21, 2014, the Company has repurchased approximately $1.5 million in aggregate value of its common stock, and accordingly, the Company still had approximately $248.5 million remaining authorized to repurchase shares of its common stock as of December 31, 2014.
20
Performance Graph
The following graph and table set forth certain information comparing the yearly percentage change in cumulative total return on our common stock to the cumulative total return of the Standard & Poor’s 500 Composite Stock Price Index (the “S&P 500”) and the FTSE National Association of Real Estate Investment Trusts Mortgage REIT Index (the “FTSE NAREIT MREIT Index”). The comparison is for the period from December 31, 2009 to December 31, 2014 and assumes (i) an investment of $100 on December 31, 2009, and (ii) the reinvestment of all dividends.
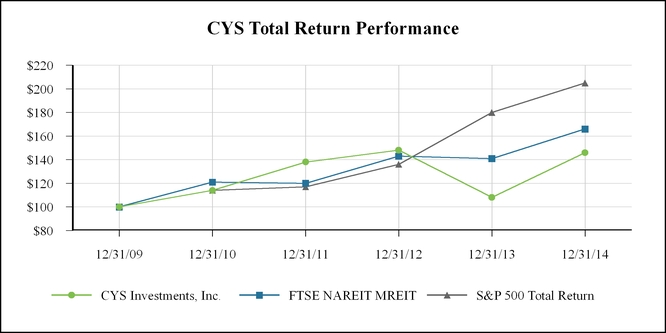
The actual returns shown on the graph above are as follows:
12/31/2009 | 12/31/2010 | 12/31/2011 | 12/31/2012 | 12/31/2013 | 12/31/2014 | |||||||||||||||||||
CYS Investments, Inc. | $ | 100 | $ | 114 | $ | 138 | $ | 148 | $ | 108 | $ | 146 | ||||||||||||
FTSE NAREIT MREIT | 100 | 121 | 120 | 143 | 141 | 166 | ||||||||||||||||||
S&P 500 Total Return | 100 | 114 | 117 | 136 | 180 | 205 | ||||||||||||||||||
The information in the share performance graph and table has been obtained from sources believed to be reliable. The historical information set forth above is not necessarily indicative of future performance. Accordingly, we do not make or endorse any predictions as to future share performance.
Equity Compensation Plans
Information about securities authorized for issuance under our equity compensation plans required for this Item 5 is incorporated by reference from our definitive Proxy Statement to be filed in connection with our 2015 annual meeting of stockholders.
Item 6. Selected Financial Data
The following table presents selected historical financial and operating information. The selected historical income statement and balance sheet data presented below as of and for the years ended December 31, 2014, 2013, 2012, 2011 and 2010 has been derived from our audited financial statements. The “Key Performance Metrics” have been derived from our underlying books and records.
The information presented below is only a summary and does not provide all of the information contained in our historical financial statements, including the related notes. You should read it in conjunction with “Management’s Discussion and Analysis of Financial Condition and Results of Operations,” and our historical financial statements, including the related notes.
21
Year Ended December 31, | |||||||||||||||||||
(In thousands, except per share numbers) | 2014 | 2013 | 2012 | 2011 | 2010 | ||||||||||||||
Income Statement Data: | |||||||||||||||||||
Interest income: | |||||||||||||||||||
Interest income from Agency RMBS | $ | 301,996 | $ | 330,430 | $ | 288,960 | $ | 228,768 | $ | 72,703 | |||||||||
Other interest income | 15,080 | 1,481 | 4,286 | 4,129 | 2,836 | ||||||||||||||
Total interest income | 317,076 | 331,911 | 293,246 | 232,897 | 75,539 | ||||||||||||||
Interest expense: | |||||||||||||||||||
Repurchase agreement interest expense | 33,825 | 52,763 | 44,117 | 18,789 | 5,056 | ||||||||||||||
Swap and cap interest expense | 90,812 | 93,497 | 60,776 | 55,487 | 18,563 | ||||||||||||||
Total interest expense | 124,637 | 146,260 | 104,893 | 74,276 | 23,619 | ||||||||||||||
Net interest income | 192,439 | 185,651 | 188,353 | 158,621 | 51,920 | ||||||||||||||
Other income (loss): | |||||||||||||||||||
Net realized gain (loss) on investments | 132,563 | (595,116 | ) | 203,846 | 35,756 | 6,115 | |||||||||||||
Net unrealized gain (loss) on investments | 233,763 | (314,530 | ) | 23,023 | 225,660 | (4,832 | ) | ||||||||||||
Net realized gain (loss) on termination of swap and cap contracts | (24,460 | ) | 30,775 | — | (4,903 | ) | (36,925 | ) | |||||||||||
Net unrealized gain (loss) on swap and cap contracts | (86,082 | ) | 238,353 | (21,990 | ) | (100,012 | ) | 16,573 | |||||||||||
Other income | 269 | 120 | 80 | — | — | ||||||||||||||
Total other income (loss) | 256,053 | (640,398 | ) | 204,959 | 156,501 | (19,069 | ) | ||||||||||||
Expenses: | |||||||||||||||||||
Compensation and benefits | 14,105 | 12,599 | 12,264 | 7,837 | 1,459 | ||||||||||||||
General, administrative and other | 8,778 | 8,436 | 8,261 | 15,352 | 9,002 | ||||||||||||||
Total expenses | 22,883 | 21,035 | 20,525 | 23,189 | 10,461 | ||||||||||||||
Net income (loss) | $ | 425,609 | $ | (475,782 | ) | $ | 372,787 | $ | 291,933 | $ | 22,390 | ||||||||
Dividend on preferred stock | (20,812 | ) | (15,854 | ) | (2,405 | ) | — | — | |||||||||||
Net income (loss) available to common stockholders | $ | 404,797 | $ | (491,636 | ) | $ | 370,382 | $ | 291,933 | $ | 22,390 | ||||||||
Net income (loss) per common share basic & diluted | $ | 2.50 | $ | (2.90 | ) | $ | 2.64 | $ | 3.66 | $ | 0.73 | ||||||||
Distributions per common share | $ | 1.24 | $ | 1.32 | $ | 2.37 | $ | 2.25 | $ | 2.35 | |||||||||
Key Balance Sheet Metrics | |||||||||||||||||||
Average settled Debt Securities (1) | $ | 12,198,178 | $ | 14,813,725 | $ | 12,391,404 | $ | 7,352,591 | $ | 2,080,889 | |||||||||
Average total Debt Securities (2) | $ | 13,910,227 | $ | 17,806,279 | $ | 16,303,745 | $ | 8,581,091 | $ | 3,065,133 | |||||||||
Average repurchase agreements (3) | $ | 10,559,856 | $ | 12,836,246 | $ | 10,822,005 | $ | 6,519,272 | $ | 1,765,953 | |||||||||
Average Debt Securities liabilities (4) | $ | 12,271,905 | $ | 15,828,800 | $ | 14,734,346 | $ | 7,747,772 | $ | 2,750,197 | |||||||||
Average stockholders' equity (5) | $ | 1,922,938 | $ | 2,145,397 | $ | 1,961,336 | $ | 988,976 | $ | 390,907 | |||||||||
Average common shares outstanding (6) | 161,950 | 170,803 | 140,364 | 79,726 | 29,042 | ||||||||||||||
Leverage ratio (at period end) (7) | 6.44:1 | 6.97:1 | 7.69:1 | 7.74:1 | 8.23:1 | ||||||||||||||
22
Year Ended December 31, | |||||||||||||||||||
(In thousands, except per share numbers) | 2014 | 2013 | 2012 | 2011 | 2010 | ||||||||||||||
Key Performance Metrics | |||||||||||||||||||
Average yield on settled Debt Securities (8) | 2.60 | % | 2.24 | % | 2.37 | % | 3.17 | % | 3.63 | % | |||||||||
Average yield on total Debt Securities including drop income (9) | 2.72 | % | 2.39 | % | 2.40 | % | 3.09 | % | 3.42 | % | |||||||||
Average cost of funds(10) | 0.32 | % | 0.41 | % | 0.41 | % | 0.29 | % | 0.29 | % | |||||||||
Average cost of funds and hedge (11) | 1.18 | % | 1.14 | % | 0.97 | % | 1.14 | % | 1.34 | % | |||||||||
Adjusted average cost of funds and hedge (12) | 1.02 | % | 0.92 | % | 0.71 | % | 0.96 | % | 0.86 | % | |||||||||
Interest rate spread net of hedge (13) | 1.42 | % | 1.10 | % | 1.40 | % | 2.03 | % | 2.29 | % | |||||||||
Interest rate spread net of hedge including drop income (14) | 1.70 | % | 1.47 | % | 1.69 | % | 2.13 | % | 2.56 | % | |||||||||
Operating expense ratio (15) | 1.19 | % | 0.98 | % | 1.05 | % | 2.34 | % | 2.68 | % | |||||||||
Total stockholder return on common equity (16) | 27.06 | % | (20.66 | )% | 20.43 | % | 31.75 | % | 6.68 | % | |||||||||
_________
(1) | Our "Debt Securities" consist of Agency RMBS and U.S. Treasuries. Average settled Debt Securities is calculated by averaging the month-end cost basis of settled Debt Securities during the period. |
(2) | Average total Debt Securities is calculated by averaging the month-end cost basis of total Debt Securities during the period. |
(3) | Average repurchase agreements are calculated by averaging the month-end repo borrowings balance during the period. |
(4) | Average Debt Securities liabilities are calculated by adding average month-end repo borrowings balance plus average unsettled Debt Securities during the period. |
(5) | Average stockholders' equity is calculated by averaging the month-end stockholders' equity during the period. |
(6) | Average common shares outstanding are calculated by averaging the daily common shares outstanding during the period. |
(7) | The leverage ratio is calculated by dividing (i) the Company's repo borrowings balance plus payable for securities purchased minus receivable for securities sold by (ii) stockholders' equity. |
(8) | Average yield on Debt Securities for the period is calculated by dividing total interest income by average settled Debt Securities. |
(9) | Average yield on total Debt Securities including drop income for the period is calculated by dividing total interest income plus drop income by average total Debt Securities. Drop income was $60.7 million, $94.5 million, $97.4 million, $32.3 million and $29.3 million for the years ended December 31, 2014, 2013, 2012, 2011 and 2010, respectively. Drop income is a component of our net realized and unrealized gain (loss) on investments on our statement of operations. Drop income is the difference between the spot price and the forward settlement price for the same security on trade date. This difference is also the economic equivalent of the assumed net interest margin (yield minus financing costs) of the bond from trade date to settlement date. We derive drop income through utilization of forward settling transactions. |
(10) | Average cost of funds for the period is calculated by dividing repurchase agreement interest expense by average repo borrowings for the period. |
(11) | Average cost of funds and hedge for the period is calculated by dividing total interest expense, consisting of repo borrowings interest expense and swap and cap interest expense, by average repurchase agreements. |
(12) | The adjusted average cost of funds and hedge for the period is calculated by dividing total interest expense, consisting of repo borrowings interest expense and swap and cap interest expense, by average Debt Securities liabilities. |
(13) | The interest rate spread net of hedge for the period is calculated by subtracting average cost of funds and hedge from average yield on settled Debt Securities. |
(14) | The interest rate spread net of hedge including drop income for the period is calculated by subtracting adjusted average cost of funds and hedge from average yield on total Debt Securities including drop income. |
(15) | The operating expense ratio for the period is calculated by dividing annualized operating expenses by average stockholders' equity. |
(16) | Calculated by change in book value plus dividend distributions on common stock. |
23
As of December 31, | ||||||||||||||||||||
(in thousands, except per share numbers) | 2014 | 2013 | 2012 | 2011 | 2010 | |||||||||||||||
Balance Sheet Data: | ||||||||||||||||||||
Cash and cash equivalents | $ | 4,323 | $ | 4,992 | $ | 13,882 | $ | 11,508 | $ | 1,510 | ||||||||||
Total assets | 14,895,863 | 14,633,064 | 21,057,496 | 9,518,057 | 6,389,267 | |||||||||||||||
Repurchase agreements | 11,289,559 | 11,206,950 | 13,981,307 | 7,880,814 | 3,443,843 | |||||||||||||||
Stockholders' equity | 1,975,168 | 1,768,656 | 2,402,662 | 1,077,458 | 690,339 | |||||||||||||||
Book value per common share | $ | 10.50 | $ | 9.24 | $ | 13.31 | $ | 13.02 | $ | 11.59 | ||||||||||
Core Earnings
"Core earnings" represents a non-GAAP financial measure and is defined as net income (loss) available to common stockholders excluding net realized gain (loss) on investments, net unrealized gain (loss) on investments, net realized gain (loss) on termination of swaps and caps and net unrealized gain (loss) on swaps and caps. Management uses core earnings to evaluate the effective yield of the portfolio after interest and operating expenses. In addition, management utilizes core earnings as a key metric, in conjunction with other portfolio and market factors, to determine the appropriate leverage and hedging ratios, as well as the overall structure of the portfolio. The Company believes that providing users of the Company's financial information with such measures, in addition to the related GAAP measures, gives investors and stockholders greater transparency and insight into the information used by the Company's management in its financial and operational decision-making.
The primary limitation associated with core earnings as a measure of the Company's financial performance over any period is that it excludes the effects of net realized and unrealized gain (loss) on investments and swaps and caps. In addition, the Company's presentation of core earnings may not be comparable to similarly-titled measures of other companies, which may use different calculations. As a result, core earnings should not be considered a substitute for the Company's GAAP net income (loss) as a measure of its financial performance or any measure of its liquidity under GAAP.
Year Ended December 31, | ||||||||||||||||||||
(in thousands, except per share numbers) | 2014 | 2013 | 2012 | 2011 | 2010 | |||||||||||||||
Non-GAAP Reconciliation: | ||||||||||||||||||||
Net income (loss) available to common stockholders | $ | 404,797 | $ | (491,636 | ) | $ | 370,382 | $ | 291,933 | $ | 22,390 | |||||||||
Net realized (gain) loss on investments | (132,563 | ) | 595,116 | (203,846 | ) | (35,756 | ) | (6,115 | ) | |||||||||||
Net unrealized (gain) loss on investments | (233,763 | ) | 314,530 | (23,023 | ) | (225,660 | ) | 4,832 | ||||||||||||
Net realized (gain) loss on termination of swap and cap contracts | 24,460 | (30,775 | ) | — | 4,903 | 36,925 | ||||||||||||||
Net unrealized (gain) loss on swap and cap contracts | 86,082 | (238,353 | ) | 21,990 | 100,012 | (16,573 | ) | |||||||||||||
Core earnings | $ | 149,013 | $ | 148,882 | $ | 165,503 | $ | 135,432 | $ | 41,459 | ||||||||||
Item 7. Management’s Discussion and Analysis of Financial Condition and Results of Operations
CYS Investments, Inc. (the "Company", "we", "us", and "our,") is a specialty finance company created with the objective of achieving consistent risk-adjusted investment income. Management’s Discussion and Analysis of Financial Condition and Results of Operations (“MD&A”) is intended to provide the reader of the Company’s consolidated financial statements and accompanying notes with a narrative from management to provide its perspective on the business underlying those financial statements and its financial condition and results of operations during the periods presented. The Company’s MD&A is comprised of four sections:
• | Executive Overview |
• | Financial Condition |
• | Results of Operations and |
• | Liquidity and Capital Resources. |
The following discussion should be read in conjunction with our consolidated financial statements and accompanying notes included in Item 8 of this Annual Report on Form 10-K.
24
Executive Overview
We are a specialty finance company created with the objective of achieving consistent risk-adjusted investment income. We seek to achieve this objective by investing on a leveraged basis primarily in Agency RMBS. These investments consist of residential mortgage pass-through securities for which the principal and interest payments are guaranteed by a government-sponsored enterprise, such as Fannie Mae, Freddie Mac, or by a U.S. government agency, such as Ginnie Mae(collectively referred to as "GSEs"). We may also invest in U.S. Treasuries and, in addition, our investment guidelines permit investments in CMOs, or securities issued by a GSE that are not backed by collateral but, in the case of government agencies, are backed by the full faith and credit of the U.S. government, and, in the case of GSEs, are backed by the integrity and creditworthiness of the issuer (“U.S. Agency Debentures”).
We commenced operations in February 2006, and completed our initial public offering in June 2009. Our common stock, our 7.75% Series A Cumulative Redeemable Preferred Stock, $25.00 liquidation preference (the "Series A Preferred Stock"), and our 7.50% Series B Cumulative Redeemable Preferred Stock, $25.00 liquidation preference (the "Series B Preferred Stock"), trade on the New York Stock Exchange under the symbols “CYS,” "CYS PrA" and "CYS PrB," respectively.
We earn income from our investment portfolio, currently comprised principally of Agency RMBS and U.S. Treasuries (collectively, "Debt Securities"). We currently fund our investments solely through repo borrowings and stockholders' equity. We use leverage to seek to enhance our returns, although leverage may also exacerbate losses. Our net interest income is generated primarily from the net spread, or difference, between the interest income we earn on our investment portfolio and the cost of our borrowings and hedging activities. The amount of net interest income we earn on our investments depends in part on our ability to control our financing costs.
While we use hedging to attempt to manage our interest rate risk, we do not hedge all of our exposure to changes in interest rates. Our investments vary in interest rate and maturity compared with the rates and duration of the hedges we employ. As a result, it is not possible to insulate our portfolio from all potential negative consequences associated with changes in interest rates in a manner that will allow us to achieve attractive spreads on our portfolio. Consequently, changes in interest rates, particularly short-term interest rates, may significantly influence our net income.
In addition to investing in issued pools of Agency RMBS, we regularly utilize forward settling transactions, including forward settling purchases of Agency RMBS where the pool is “to-be-announced” (“TBA”). With a TBA, we agree to purchase, for future delivery, Agency RMBS with certain principal and interest terms and certain types of underlying collateral, but the particular Agency RMBS to be delivered is not identified until shortly before the TBA settlement date. For our other forward settling transactions, we agree to purchase, for future delivery, Agency RMBS. However, unlike our TBAs, these forward settling transactions reference an identified Agency RMBS. Given the favorable terms available in 2014 in the TBA dollar roll market and relative lower benefit of holding specified mortgage pools, we generally continued to roll the purchases forward to a later settlement date.
We have elected to be treated as a REIT for U.S. federal income tax purposes, and have complied with, and intend to continue to comply with, the provisions of the Internal Revenue Code of 1986, as amended (the “Internal Revenue Code”), with respect thereto. Accordingly, we generally do not expect to be subject to federal income tax on our REIT taxable income that we currently distribute to our stockholders if certain asset, income and ownership tests and recordkeeping requirements are fulfilled. Even if we maintain our qualification as a REIT, we may be subject to some federal, state and local taxes on our income.
Factors that Affect our Results of Operations and Financial Condition
A variety of industry and economic factors may impact our results of operations and financial condition. These factors include:
• | interest rate trends; |
• | prepayment rates on mortgages underlying our Agency RMBS, and credit trends insofar as they affect prepayment rates; |
• | competition for investments in Agency RMBS; |
• | actions or inactions taken by the U.S. government, including the Fed and the U.S. Treasury; |
• | credit rating downgrades of the United States’ and certain European countries’ sovereign debt; and |
• | other market developments. |
In addition, a variety of factors relating to our business may also impact our results of operations and financial condition. These factors include:
• | our degree of leverage; |
25
• | our access to funding and borrowing capacity; |
• | our borrowing costs; |
• | our hedging activities; |
• | the market value of our investments; and |
• | the REIT requirements and the requirements to qualify for a registration exemption under the Investment Company Act. |
Changes in interest rates may significantly influence our net income and book value, or stockholders' equity.
Our net income may be affected by a difference between actual prepayment rates and our projections. Prepayments on loans and securities may be influenced by changes in market interest rates and homeowners’ ability and desire to refinance their mortgages. To the extent we have acquired assets at a premium or discount to face value, changes in prepayment rates will impact our anticipated yield.
Trends and Recent Market Activity
— Interest Rate, Unemployment and Other Macroeconomic Trends
During 2014, the U.S. fixed income markets steadily reversed the trends experienced in 2013. In 2013, guidance provided by the Fed about the likely path of monetary policy, specifically about the Fed tapering its purchases of U.S. Treasuries and Agency RMBS, had a significant impact on interest rates, and created a steepening in the yield curve. During 2014, the Fed followed its own guidance closely, steadily reducing purchases of Agency RMBS and U.S. Treasuries, and finally ending its asset purchase program, as announced, in October 2014. In this environment, the yield curve flattened considerably over the course of 2014. A key focus of the markets in the second half of 2014 and in early 2015 is the timing of when the Fed might begin to raise its short-term interest rate (the "Fed Funds Rate") and by how much. While there has been some consensus suggesting a first rate rise in mid-2015, this may be be shifting to later in 2015 or 2016 amidst strong counter-currents in the U.S. economy due to the economy absorbing slack in the labor market at a sluggish pace and average wages have generally not risen.
One of the Fed's two mandates, inflation, has consistently tracked lower than the Fed’s 2% target, with the core personal consumption expenditure inflation index at 1.3% for 2014. The recent fall in the price of crude oil provides further, significant downward pressure on inflation. Weakening global economic conditions with moderate deflation appears to be present in Europe and Japan. The statement from the January 2015 Federal Open Market Committee ("FOMC") meeting indicated that the timing and pace of increasing the Fed Funds Rate and tighter monetary policy remain data dependent and will likely be tempered by ongoing concerns about deflationary pressures in Europe and Japan. The FOMC is encouraged that policymakers in Europe and elsewhere will respond with stimulus measures, some of which have begun to occur, and suggested that this could mitigate the risk of these economies dragging down the U.S economy. The Fed's other mandate, unemployment, has presented the Fed with several conflicting considerations. While U.S. unemployment has fallen from 6.7% in December 2013 to 5.8% in December 2014, the current labor force participation rate of 62.7%, essentially unchanged since April 2014, is at the lowest level since 1978. Also, the slow growth in labor supply has meant that the unemployment rate has declined more sharply than the increase in employment. Notably, many of the jobs created recently have been part-time, lower paying jobs with limited benefits and earnings potential. Hourly wages fell 0.2% in December 2014, signaling that personal income is not rising. These developments suggest that the Fed could be more concerned about deflationary risks rather than inflationary risks, and this adds to the uncertainty as to when the Fed might begin raising short-term interest rates and, if so, by how much.
The U.S. economy’s performance in 2014 was mixed and inconsistent through the year. After a decline in first quarter 2014 U.S. real gross domestic product ("GDP") of 2.1% attributed to the severe winter, second quarter 2014 GDP rebounded to 4.6%, and third quarter GDP was 5.0%. However, fourth quarter GDP slowed to 2.6%, and the December 2014 GDP report from the Department of Commerce portrayed an uneven recovery. For 2014 as a whole, GDP expanded 2.4%, only slightly better than the average 2.2% growth of 2010-2013, a moderate pace compared to prior growth periods. During the 1990s, the economy grew an average 3.4% a year. Many economists expect sluggish growth in the current quarter, perhaps to a pace of between 2% and 3%, as turbulence in Europe and Asia threatens to hit manufacturers and cause businesses to retrench.
26
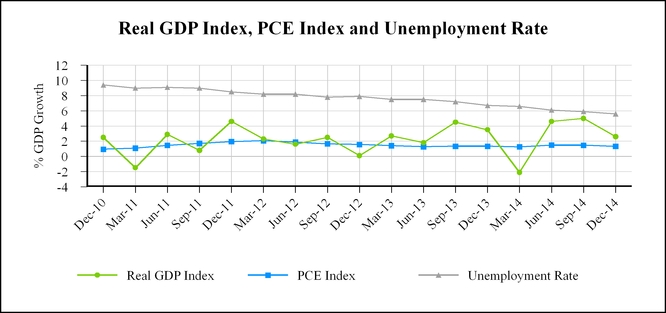
Foreign bond markets are reflecting a different set of circumstances: given the economic deceleration in Europe, Asia, and the emerging markets, government bond yields in developed markets such as Germany and Japan have fallen significantly and are now low relative to those in the U.S. In January 2015, the European Central Bank ("ECB") announced an aggressive bond buying program to stimulate the European Zone economy. U.S. government bond yields are high relative to government bond yields of other industrialized countries, particularly given the negligible inflation risks. For example, at December 31, 2014, 10-year U.S. Treasuries were at 3.17%, while 10-year Federal Republic of Germany bonds yielded 0.46%, fully 171 basis points ("bps") lower than 10-year U.S. Treasuries, and 10-year Japanese government bonds yielded 0.33%, or 184 bps lower than 10-year U.S. Treasuries. Not surprisingly, global demand for higher-yielding U.S. Treasury bonds and U.S. Agency RMBS has been strong. We believe that in some industrialized countries deflation continues to be a bigger threat than inflation, and this has caused some foreign central banks to be highly accommodative. We believe that these forces may give the Fed further pause about raising rates.
Throughout the course of 2014, the short-end of the yield curve steepened and the long-end flattened. When the 10-year and 30-year Treasury rates reached 3.03% and 3.97%, respectively, at December 31, 2013, market consensus was that longer-term rates would be higher in 2014 than in 2013. However, long-term rates have fallen throughout 2014, with the 10-year and 30-year Treasury rates falling 86 and 122 bps to 2.17% and 2.75% at December 31, 2014. The 10-year and 30-year Treasury rates continued to fall in 2015, closing at 2.05% and 2.65%, respectively, at February 13, 2015. Meanwhile, the 2-year and 3-year Treasury rates rose throughout 2014, beginning at 0.39% and 0.76%, respectively, and rising to 0.66% and 1.07%, respectively, by the end of the year. These interest rate movements suggest that the market is pricing in an increase in the Fed Funds Rate in 2015, but continues to be skeptical about durable growth in the longer term. Set forth below are yield curves showing trends from 2012 through 2014 and the four quarters of 2014:
27
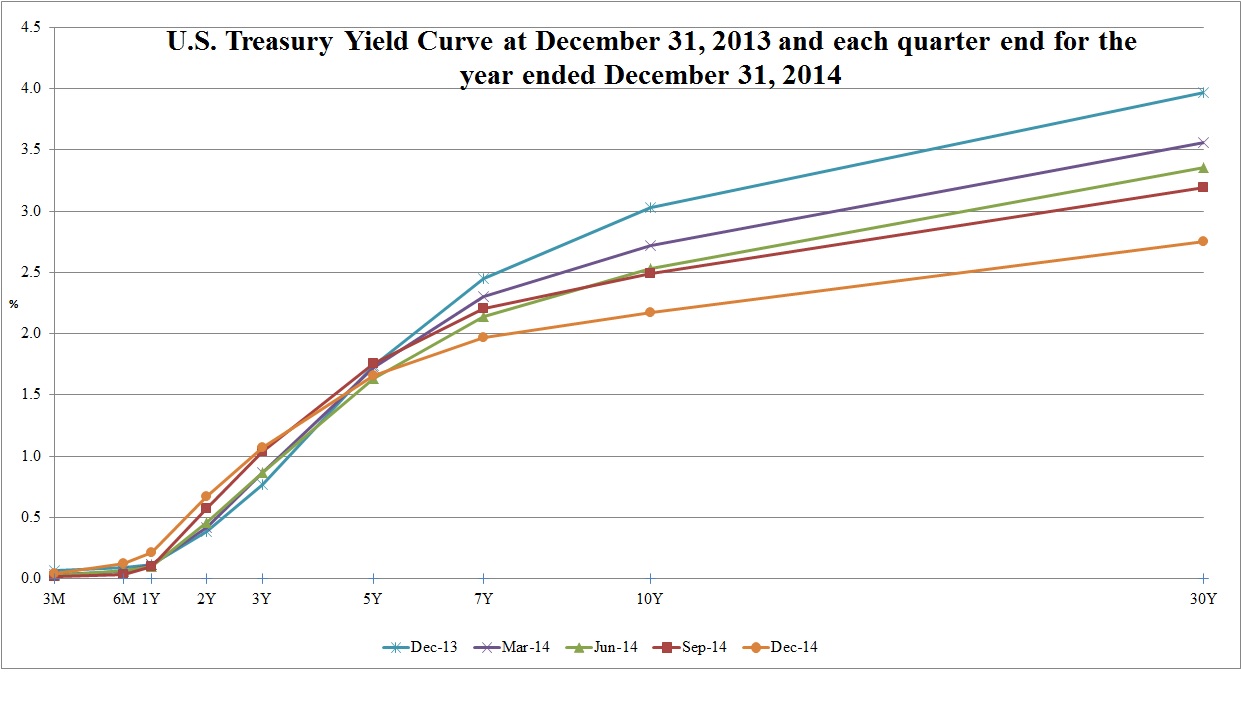
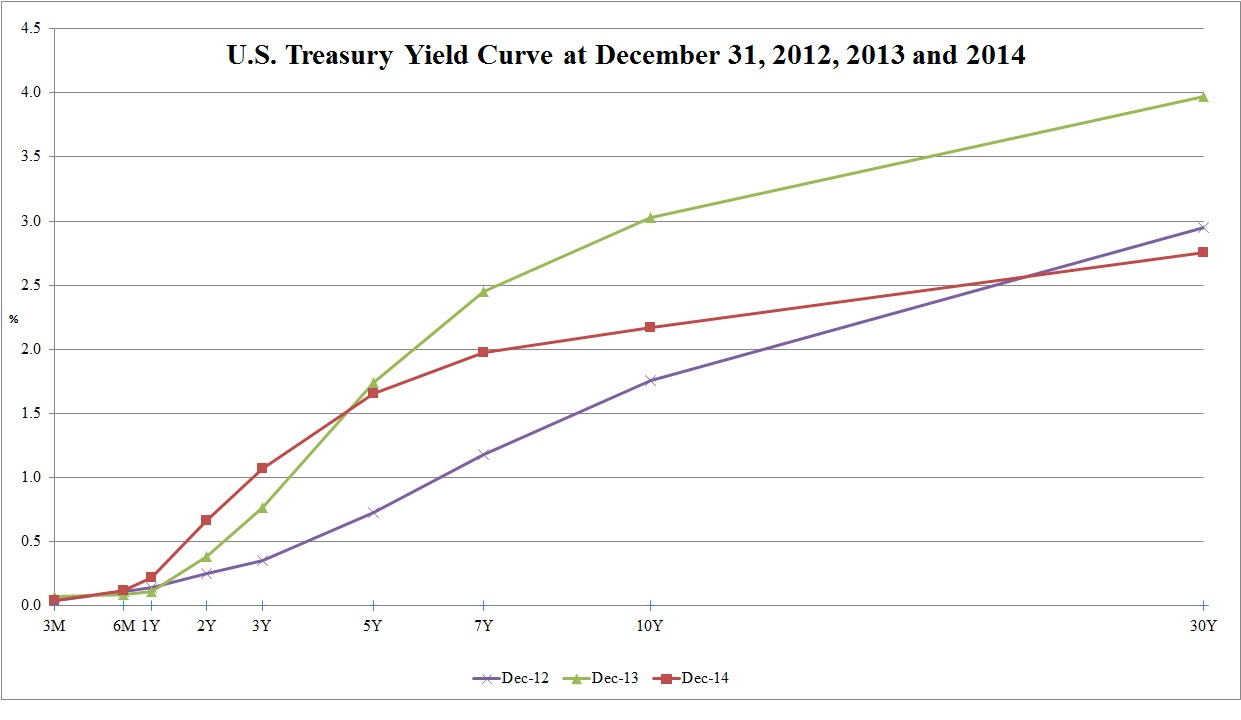
28
— Interest Rate Spreads
The spread between Agency RMBS and interest rate swaps tightened during 2014, with the spread between Fannie Mae 30-year securities and 7-year interest rate swaps tightening 34 bps, and Fannie Mae 15-year and 5-year interest rate swaps tightening 59 bps. In general, this increased our asset values relative to our hedges, but reduced the net interest spread on new investments. Our interest rate spread, net of hedge, was 1.34% at December 31, 2014, compared to 1.42% at December 31, 2013.
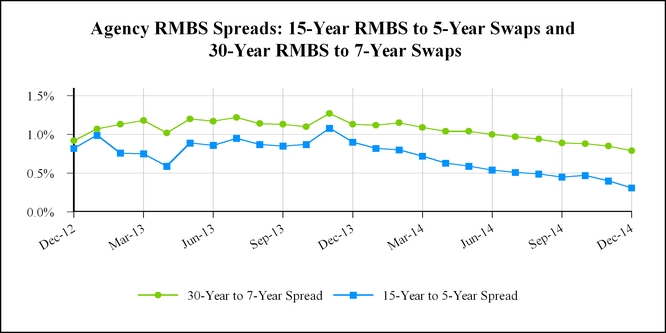
If interest rate spreads in the markets continue to narrow, this will have the effect of limiting our investment and reinvestment opportunities in the short-term. Also, if the long-end of the yield curve continues to flatten while the short-end inches up, we expect that this will have the effect of reducing our yield on new investments. During the twelve months ended December 31, 2014, and December 31, 2013, the weighted-average yield on the Company's Debt Securities was 2.60% and 2.24%, respectively.
The table below shows potential Agency RMBS investments and their respective net interest margins as of January 30, 2015:
Net Interest Margin (1) | 30-Yr. 4.0% | 15-Yr. 3.0% | |||
Asset Yield | 2.67 | % | 1.87 | % | |
Financing Rate | 0.33 | % | 0.33 | % | |
Hedge Cost (2) | 0.66 | % | 0.54 | % | |
Net interest margin | 1.68 | % | 1.00 | % | |
_______________________________________
(1) The examples in this table are for illustrative purposes only and do not reflect our projections or forecasts. Any assumptions and estimates used may not be accurate and cannot be relied upon. Our net interest margin for any given period may differ materially from these examples.
(2) Assumed 7-year and 5-year swap hedge ratio of 50% for the 30-year 4.0% and 50% for the 15-year 3.0%.
We have been able to benefit from a favorable financing environment. While short-term interest rates (2-3 Year Treasuries) increased significantly in 2014, short-term financing rates remained low. The 30-Day LIBOR, 3-Month LIBOR and the Fed Funds Rate remained low throughout 2014, as reflected in the table below. The Company generally borrows in the 30-180 day repo markets, which are highly correlated to LIBOR. The availability of repo borrowings collateralized with our Agency RMBS was generally stable, with interest rates between 0.25% and 0.39% for 30-180 day repo borrowings at December 31, 2014. During 2014, our weighted-average cost of funds was 0.32%, compared to 0.41% in 2013.
29
Date | 30-Day LIBOR | 3-Month LIBOR | Fed Funds Rate | ||||||
December 31, 2014 | 0.171 | % | 0.256 | % | 0.25 | % | |||
September 30, 2014 | 0.157 | % | 0.235 | % | 0.25 | % | |||
June 30, 2014 | 0.155 | % | 0.231 | % | 0.25 | % | |||
March 31, 2014 | 0.152 | % | 0.231 | % | 0.25 | % | |||
December 31, 2013 | 0.168 | % | 0.246 | % | 0.25 | % | |||
September 30, 2013 | 0.179 | % | 0.249 | % | 0.25 | % | |||
June 30, 2013 | 0.195 | % | 0.273 | % | 0.25 | % | |||
March 31, 2013 | 0.204 | % | 0.283 | % | 0.25 | % | |||
December 31, 2012 | 0.209 | % | 0.306 | % | 0.25 | % | |||
— Investing and Reinvestment Environment
The investing and reinvesting environment for Agency RMBS is characterized by tight supply, strong demand and the presence of the Fed still engaged in asset purchases. Home sales and new single-family home construction remain slow due to tight mortgage lending rules coming from the Wall Street Reform and Consumer Protection Act ("Dodd-Frank") legislation and bank conservatism in efforts to prevent future mortgage "put-backs". These factors have resulted in a reduction in mortgage originations in 2014 relative to 2013. One consequence of this is that new Agency RMBS issuance is low. While the Fed officially ended its asset purchase program in October 2014, it still used principal and interest payments it received from its Agency RMBS portfolio to purchase $22 billion in new Agency RMBS in December 2014, as much as it purchased in any other month during 2014. The Fed’s asset purchases continue to dominate the Agency RMBS market, and played a significant role in our limited new investment opportunities in 2014, and may continue to do so in 2015.
The strength in the Agency RMBS market during 2014 compared to 2013 is illustrated in the graph below by the movement in prices of two securities commonly held in our portfolio:
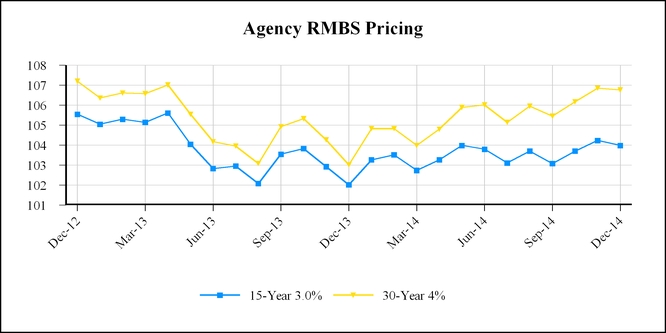
— Agency RMBS Supply and Demand
The supply of Agency RMBS continued to be low in 2014 compared to 2013 and 2012. This limited supply of Agency RMBS has been a factor in the attractive TBA market, as low financing rates and the inability of the GSEs to settle forward transactions has led to the strong TBA market. New Agency RMBS issuance declined steadily throughout 2013 and the first quarter of 2014, and while new Agency RMBS issuance increased slightly in the second and third quarters of 2014, new Agency RMBS supply was flat in the fourth quarter of 2014, and new issuance for the full year of 2014 was significantly below that of 2013, as the chart below demonstrates:
30
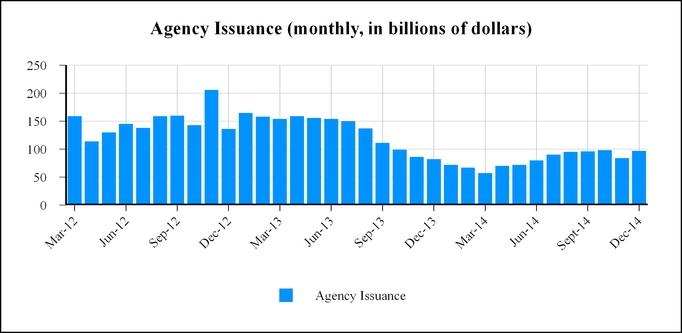
Mortgage rates have generally lagged the longer end of the yield curve, and only when the 10-Year U.S. Treasuries approached and then fell below 2% in early 2015 did 30-year mortgage rates fall below 4%. In general, prepayment rates for Agency RMBS were low in 2014, but in December 2014 prepayments picked up as FNMA 30-year speeds rose to 13.4% constant prepayment rate ("CPR") from 13.0% in November 2014. However, CYS portfolio of Agency RMBS experienced slower prepayments in December 2014, when its CPR was 8.4%. CYS' relatively lower CPR in December 2014 was due to generally newer Agency RMBS issuances in its investment portfolio, as well as generally more favorable prepayment characteristics for its Agency RMBS. While a drop in mortgage rates and a rise in mortgage financing may increase prepayments and improve the Agency RMBS supply outlook in 2015, it would also reduce the yield on the Company's Agency RMBS assets. However, due to the continued tight regulatory environment, we expect prepayments to increase only modestly in 2015, and therefore Agency RMBS supply will likely remain muted.
One of the principal reasons for the Agency RMBS supply shortage is that single-family home mortgage applications and single-family new home sales were flat to slightly down in 2014, and was lower in 2014 than 2013, despite declining mortgage rates. Refinancing activity along with new purchase activities are being held back by a number of dynamics. There is evidence that refinance exhaustion has occurred: many 2012 and earlier borrowers had already refinanced during the record low mortgage rates of 2012. However, as we enter 2015 with 30-year mortgage rates once again below 4%, a new wave of refinancing may be possible. Additionally, we may see a wave of new first-time buyers enter the market, and easing downpayment and mortgage insurance requirements may further promote this. While many young first-time home buyers are burdened by student debt, the current low level of mortgage rates may help affordability. The tight requirements of the Dodd-Frank Ability to Repay ("ATR") and Qualified Mortgage ("QM ") rules make it difficult for lenders to originate new mortgages to all but very high quality consumer credits. Affordability products such as ARMs are very limited, and first-time home buyers have difficulty qualifying under the QM rules.
Investor demand for mortgage-backed securities remains healthy, particularly in the face of the Fed continuing to reinvest the cashflows from its existing balance sheet, which is currently well over $4.5 trillion. While the Fed’s purchases remain focused on 30-year fixed-rate RMBS, other investor interest generally is focused more on shorter-duration assets. It is unclear if increased investor demand will emerge for 30-year RMBS when the Fed ceases or reduces their reinvestment activities. Should the Fed decide to taper its reinvestment activities, the 30-year RMBS may have to cheapen in order to attract demand from investors.
31
— Agency RMBS Market Volatility
During 2014, there was relatively low volatility in the Agency RMBS market. This lack of volatility has occurred principally due to low Agency RMBS supply, Fed Agency RMBS purchases, higher yields, and relatively low prepayment rates. Volatility returned to the bond market noticeably when, on October 15, 2014, a "flash crash" occurred when the 10-year U.S. Treasury rate, which moves inversely to price, plunged 33 basis points to 1.86% before rising to settle at 2.13% by the market's close. With exception of this “flash crash”, implied volatility reached record lows in 2014, net issuance of Agency RMBS was again down, while prepayments were also generally very low, contributing to a benign environment for Agency RMBS. The charts below illustrate both the decline of CPR rates (for both 15- and 30-year mortgages) and the drop in refinancing activity since the beginning of 2013, despite historically low mortgage rates.
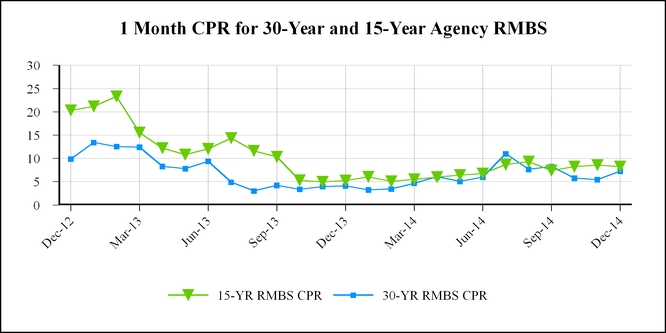
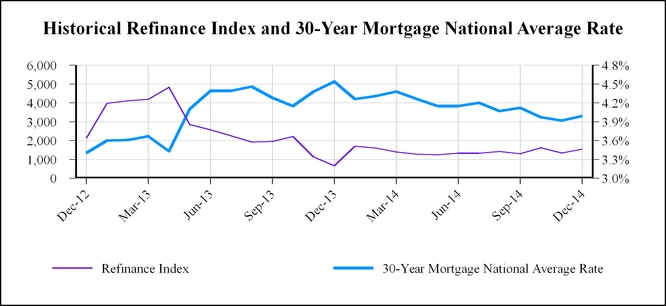
32
It is possible that the future may hold more “flash crashes”. Such sudden plunges in value may be a reality of the new trading environment, where there are fewer traders/trading desks, less trading (yet more automated trading), less market coverage, and therefore less capacity for the markets to operate smoothly. This new trading environment was driven first by the recession and then (and currently) by the new regulatory environment. The legacy of these forces is a diminished capacity for the markets to operate smoothly; therefore, repricing events can be swift and brutal. There is no way to predict whether this low volatility environment will persist in 2015 or beyond, whether there will be more “flash crashes”, or the effect this will have on the Company’s financial condition and results of operations.
— Government Activity
While the regulatory pendulum in the housing and mortgage markets has begun to swing toward a softer approach, ongoing regulatory uncertainty and inconsistency will continue to be a drag on home lending and related securitization activity. Regulators appear to be moving toward providing clarity and relief where possible, and mortgage availability may improve somewhat due to recent changes to the FHFA's representation and warranty rules, and the easing of downpayment and mortgage insurance requirements, however it appears that originators have not received enough protection to risk originating loans that pose greater risks of defaults. Without expanding the credit box to a wider group of borrowers, we believe that opportunities to promote housing recovery through originations will be more muted than hoped.
While housing finance reform will not likely be a top-priority for the incoming Congress, at any rate a clear gulf exists between factions in Congress regarding housing finance reform. The 2014 elections only exacerbated this dynamic, further dampening prospects for legislative action in 2015 and beyond. GSE reform lost momentum in 2014 when a proposed GSE reform bill introduced by Senators Tim Johnson (D-SD) and Mike Crapo (R-ID), the two most senior members of the Senate Banking Committee, failed to secure enough support for the bill to be considered by Congress. The congressional Republican leadership, now controlling both houses of Congress, continues to favor a very different approach, which is generally based on earlier legislation proposed by Senators Bob Corker (R-TN) and Mark Warner (D-VA). As the FHFA and both houses of Congress each discussed and considered separate measures intended to restructure the U.S. housing finance system and the operations of Fannie Mae and Freddie Mac, there was no resolution. We expect debate and discussion to continue in 2015. It is unclear which, if any, of these measures will be enacted and, if any are enacted, what the effects would be. It is possible that the 2016 presidential election may be required for meaningful housing finance debate and reform to occur, while it is also possible that the status quo will prevail for some time to come.
In many respects, federal regulators have not helped in the absence of legislative action. The words and actions of federal regulators overseeing the residential mortgage market have created numerous conflicts, making it difficult for housing finance regulatory policy to be effective. For example, FHFA and U.S. Department of Housing and Urban Development ("HUD") rules to permit easier lending standards and calls for looser credit standards directly conflict with certain rules and regulations under Dodd-Frank, such as ATR and QM. When coupled with costly put-backs to banks the result is stricter, more difficult credit availability for residential consumers. Also, while the market is experiencing historically low mortgage interest rates, due largely to FOMC policy, opportunities to take advantage of these rates are buffeted by high household leverage, underemployment, low wages and limited refinancing opportunities. These are all factors that impact our investment opportunities.
In August 2014, the FHFA issued a request for comment on its proposal to establish a "Single Security" for Agency RMBS, with conformed structures, terms, disclosures and settlement date. Under the plan, the proposed Single Security would leverage the GSEs' existing security structures and would encompass many of the pooling features of the current Fannie Mae MBS and more of the disclosure framework of the current Freddie Mac Participation Certificate ("PC"). The FHFA indicated that the ultimate goal for the new structure is for the legacy MBS and PC securities to be fungible or transferable with the new security. Such a plan would benefit investors in Agency RMBS by simplifying the structures, terms, disclosures and settlement rules for Agency RMBS, and making these securities more comparable for purposes of pricing and transacting.
While the FHFA has pushed with limited success at opening up residential mortgage credit to more participants, the push to increase private capital participation in the mortgage market has been more successful. Starting in 2013, when the first GSE risk-sharing residential securitization was originated, private investors have been taking credit risk on the first losses on mortgage pools, excluding an equity tranche of 30-50 basis points. Investors have purchased close to $400 billion of origination since the first transaction. Although credit standards have remained tight, the ability of the GSEs to transfer credit risk to private market participants is an encouraging sign for the improving health of the U.S. housing finance system.
On balance, federal regulation of the housing finance markets has been inconsistent, and arguably the housing sector of the U.S. economy has not recovered as robustly as other sectors of the economy due to inconsistent policies and programs,
33
coupled with conflicting goals and objectives. Any significant and consistent improvement to the housing investment market will require that the federal government be more consistent and cooperative in pursuing its housing goals and objectives.
— Recent Activity
The trends in interest rates experienced in 2014 continued into early 2015. As of February 13, 2015, 10-Year U.S. Treasuries yielded 2.05% after reaching a low of 1.64% in January 2015. For our business, the continued flattening of the yield curve in 2014 pushed Agency RMBS prices higher. While these events increase the book value of our current investment portfolio, they also reduce the yield available to us on new purchases. It is difficult to predict how significant and sustained an impact these events, coupled with tight lending standards in the residential mortgage markets, will have on Agency RMBS supply and pricing. We are responding to these market conditions by actively managing our portfolio and our hedges. Our goal is to use these market conditions as opportunities to reduce the volatility of our business. For example, in the fourth quarter of 2014, the Company focused its reinvestment activities on 15-year and 30-year Agency RMBS securities rather than ARMs and lower yielding U.S. Treasuries. We also reduced our leverage to 6:44 to 1 and we had liquidity of 66% at the end of the fourth quarter of 2014. Additionally, like many market participants, we believe the Fed will gradually raise short-term interest rates in 2015. We have sought to reduce our exposure to these policy changes by lengthening, and since June 2014 adding one-year cancellation features to, the Company’s new hedges. These efforts have significantly reduced the Company's duration gap from 1.16 at September 30, 2014 to 0.66 at December 31, 2014. Our current duration gap of 0.66 is now much lower than our duration gap of 1.62 at December 31, 2013. We believe that interest rate spreads will narrow in 2015, and as this unfolds our borrowing costs may rise and yields and return on equity may decline.
Financial Condition
As of December 31, 2014 and December 31, 2013, the Debt Securities in our portfolio were purchased at a net premium to their face value due to the average interest rates on these investments being higher than the prevailing market rates at the time of purchase. As of December 31, 2014 and December 31, 2013, we had approximately $552.9 million and $351.5 million, respectively, of unamortized premium included in the cost basis of our investments.
34
Our Debt Securities portfolio consisted of the following assets:
(In thousands) | Weighted-Average | ||||||||||||||||||||||
Coupon | Face Value | Fair Value | Amortized Cost Basis per Face Value | Loan Balance(1) | Loan Age (in months)(1) | 3 Month CPR(1)(2) | Duration(3) | ||||||||||||||||
December 31, 2014 | |||||||||||||||||||||||
15-Year Agency Mortgage Securities | |||||||||||||||||||||||
3.0% | $ | 4,889,226 | $ | 5,089,402 | $ | 102.94 | $ | 272 | 13 | 7.7 | % | 3.74 | |||||||||||
TBA 3.0% | 299,000 | 310,785 | 103.73 | n/a | n/a | n/a | 3.80 | ||||||||||||||||
3.5% | 1,462,563 | 1,547,892 | 103.50 | 234 | 27 | 8.5 | 3.12 | ||||||||||||||||
TBA 3.5% | 125,000 | 132,051 | 105.52 | n/a | n/a | n/a | 3.04 | ||||||||||||||||
4.0% | 183,538 | 196,242 | 101.22 | 175 | 46 | 10.6 | 2.47 | ||||||||||||||||
4.5% | 27,359 | 29,549 | 102.73 | 249 | 59 | 8.9 | 1.73 | ||||||||||||||||
Subtotal | 6,986,686 | 7,305,921 | 103.09 | 261 | 17 | 8.0 | 3.56 | ||||||||||||||||
20-Year Agency Mortgage Securities | |||||||||||||||||||||||
4.5% | 67,839 | 74,216 | 102.94 | 220 | 53 | 15.5 | 1.58 | ||||||||||||||||
30-Year Agency Mortgage Securities | |||||||||||||||||||||||
4.0% | 3,679,782 | 3,936,261 | 105.24 | 287 | 8 | 5.0 | 3.88 | ||||||||||||||||
TBA 4.0% | 974,000 | 1,039,232 | 106.00 | n/a | n/a | n/a | 3.44 | ||||||||||||||||
4.5% | 336,961 | 366,206 | 107.72 | 280 | 28 | 11.9 | 2.08 | ||||||||||||||||
Subtotal | 4,990,743 | 5,341,699 | 105.56 | 286 | 9 | 5.4 | 3.67 | ||||||||||||||||
Hybrid ARMs | |||||||||||||||||||||||
2.6%(4) | 1,685,685 | 1,730,620 | 103.41 | 333 | 29 | 13.6 | 2.93 | ||||||||||||||||
U.S. Treasuries | |||||||||||||||||||||||
1.5% | 150,000 | 149,051 | 99.72 | n/a | n/a | n/a | 4.74 | ||||||||||||||||
Total | $ | 13,880,953 | $ | 14,601,507 | $ | 103.98 | $ | 279 | 16 | 8.1 | % | 3.52 | |||||||||||
December 31, 2013 | |||||||||||||||||||||||
15-Year Agency Mortgage Securities | |||||||||||||||||||||||
3.0% | $ | 4,261,654 | $ | 4,354,365 | $ | 102.64 | $ | 265 | 7 | 3.2 | % | 4.60 | |||||||||||
TBA 3.0% | 732,000 | 747,012 | 102.69 | n/a | n/a | n/a | 4.48 | ||||||||||||||||
3.5% | 1,078,606 | 1,128,285 | 102.50 | 269 | 27 | 9.7 | 3.35 | ||||||||||||||||
4.0% | 229,779 | 243,560 | 101.31 | 175 | 34 | 16.9 | 2.82 | ||||||||||||||||
4.5% | 35,497 | 37,736 | 102.99 | 249 | 47 | 17.8 | 1.99 | ||||||||||||||||
Subtotal | 6,337,536 | 6,510,958 | 102.58 | 262 | 12 | 5.3 | 4.30 | ||||||||||||||||
20-Year Agency Mortgage Securities | |||||||||||||||||||||||
4.5% | 84,730 | 90,795 | 103.07 | 223 | 41 | 16.0 | 2.68 | ||||||||||||||||
30-Year Agency Mortgage Securities | |||||||||||||||||||||||
3.0% | 93,193 | 88,114 | 103.90 | 421 | 14 | 3.9 | 6.72 | ||||||||||||||||
3.5% | 2,300,782 | 2,288,035 | 100.58 | 217 | 8 | 3.0 | 6.98 | ||||||||||||||||
4.0% | 1,775,221 | 1,827,827 | 102.91 | 326 | 5 | 3.4 | 6.39 | ||||||||||||||||
TBA 4.0% | 775,000 | 797,584 | 103.64 | n/a | n/a | n/a | 6.41 | ||||||||||||||||
4.5% | 200,955 | 212,988 | 107.07 | 287 | 32 | 11.7 | 4.33 | ||||||||||||||||
Subtotal | 5,145,151 | 5,214,548 | 102.15 | 269 | 8 | 3.6 | 6.58 | ||||||||||||||||
Hybrid ARMs | |||||||||||||||||||||||
2.6%(4) | 2,007,380 | 2,042,547 | 103.57 | 337 | 19 | 12.6 | 3.91 | ||||||||||||||||
Total | $ | 13,574,797 | $ | 13,858,848 | $ | 102.57 | $ | 277 | 12 | 6.0 | % | 5.10 | |||||||||||
35
__________________
(1) | TBAs are excluded from this calculation as they do not have a defined weighted-average loan balance or age until mortgages have been assigned to the pool. |
(2) | The CPR represents the three-month CPR of the Company’s Agency RMBS held at December 31, 2014 and December 31, 2013. The CPR experienced by the Company during the period may differ. Securities with no prepayment history are excluded from this calculation. |
(3) | Duration essentially measures the market price volatility of financial instruments as interest rates change, using Dollar Value of a Basis Point, or "DV01", methodology. We generally calculate duration using various third-party financial models and empirical data. Different models and methodologies can produce different duration numbers for the same securities. Source: The Yield Book®. |
(4) | Coupon represents the weighted-average coupon of Hybrid ARMs. |
Hedging Instruments
We seek to hedge as much of the interest rate risk we determine is in the best interests of our stockholders. Our policies do not contain specific requirements as to the percentages or amount of interest rate risk we are required to hedge. No assurance can be given that our hedging activities will have the desired beneficial impact on our results of operations or financial condition.
Interest rate hedging may fail to protect or could adversely affect us because, among other things:
• | interest rate hedging can be expensive, particularly during periods of rising and volatile interest rates; |
• | available interest rate hedging may not correspond directly with the interest rate risk for which protection is sought; |
• | due to prepayments on assets and repayments of debt securing such assets, the duration of the hedge may not match the duration of the related liability or asset; |
• | the credit quality of the hedging counterparty may be downgraded to such an extent that it impairs our ability to sell or assign our side of the hedging transaction; and |
• | the hedging counterparty may default on its obligation to pay. |
We engage in interest rate swaps and caps as a means of managing our interest rate risk on forecasted interest expense associated with repo borrowings for the term of the swap and cap contracts. An interest rate swap is a contractual agreement entered into by two counterparties under which each agrees to make periodic payments to the other for an agreed period of time based upon a notional amount of principal. Under the most common form of interest rate swap, commonly known as a fixed-floating interest rate swap, a series of fixed interest rate payments on a notional amount of principal are exchanged for a series of floating interest rate payments on such notional amount. In a simple interest rate cap, one investor pays a premium for a notional principal amount based on a capped interest rate (the “cap rate”). When the floating rate exceeds the cap rate, the investor receives a payment from the cap counterparty equal to the difference between the floating rate and the cap rate on the same notional principal amount for a specified period of time. Alternatively, an investor may receive a premium and pay the difference in cap rate and floating rate. The fair value of interest rate swaps and caps is heavily dependent on the current market fixed rate, the corresponding term structure of floating rates (known as the yield curve), and the expectation of changes in future floating rates. Below is a summary of our interest rate swaps and caps as of December 31, 2014 and December 31, 2013:
Weighted-Average | |||||||||||||||||||
December 31, 2014 | Number of Contracts | Notional (000's) | Rate (1) | Maturity | Duration | Fair Value (000's) | |||||||||||||
Interest Rate Swaps | 18 | $ | 7,650,000 | 1.44 | % | February 2019 | (3.33 | ) | $ | 24,604 | |||||||||
Interest Rate Caps | 5 | 2,500,000 | 1.28 | % | January 2020 | (2.99 | ) | 107,673 | |||||||||||
Total | 23 | 10,150,000 | 1.40 | % | May 2019 | (3.25 | ) | 132,277 | |||||||||||
December 31, 2013 | |||||||||||||||||||
Interest Rate Swaps | 14 | $ | 6,300,000 | 1.17 | % | July 2017 | (3.33 | ) | $ | 31,546 | |||||||||
Interest Rate Caps | 10 | 3,900,000 | 1.40 | % | May 2019 | (2.50 | ) | 234,703 | |||||||||||
Total | 24 | 10,200,000 | 1.26 | % | April 2018 | (3.01 | ) | 266,249 | |||||||||||
____________
(1) For interest rate swaps, rate represents the fixed pay rate. For interest rate caps, rate represents the cap rate.
36
The Company utilizes interest rate swaps and caps to hedge the interest rate risk associated with the financing of its Debt Securities portfolio. As of December 31, 2014, the Company had entered into interest rate swaps with an aggregate notional amount of $7,650.0 million, a weighted-average fixed rate of 1.44%, and a weighted-average expiration of 4.1 years. This compares with interest rate swaps with a notional amount of $6,300.0 million, a weighted-average fixed rate of 1.17%, and a weighted-average expiration of 3.6 years at December 31, 2013. The receive rate on the Company's interest rate swaps is the 3-month London Interbank Offered Rate ("LIBOR"). At December 31, 2014, the Company had entered into interest rate caps with aggregate notional amount of $2,500.0 million, a weighted-average fixed rate of 1.28%, and a weighted-average expiration of 5.0 years. This compares with interest rate caps with a notional amount of $3,900.0 million, a weighted-average fixed rate of 1.40%, and a weighted-average expiration of 5.4 years at December 31, 2013.
In the fourth quarter, the Company terminated one $500 million notional swap with a maturity date of April 2017, replacing it with a seven-year swap cancelable in one year with a maturity date of December 2021, and also replaced a $500 million notional seven-year cancelable swap with another seven-year cancelable swap, with a lower pay rate. At December 31, 2014, the Company had $1,800 million notional seven-year swaps, cancelable at our option, at dates from June 2015 to December 2015, which the Company expects will help it protect its book value if interest rates rise. The Company seeks to reduce its exposure to interest rate risk by expanding and/or lengthening its hedges, and to reduce its pay rate if possible when doing so.
Liabilities
We have entered into repo borrowings to finance a portion of our assets. Repo borrowings are secured by our assets and bear interest at rates that have historically moved in close relationship to LIBOR. At December 31, 2014 and December 31, 2013, we had repo borrowings with 32 and 24 counterparties, respectively, which are summarized below:
December 31, 2014 | Weighted-Average | |||||||||||
Original Days to Maturity | Repurchase Agreements Outstanding (000's) | Percentage of Total | Interest Rate | Remaining Days to Maturity | Original Days to Maturity | |||||||
Agency RMBS | ||||||||||||
≤ 30 Days | $ | 1,608,723 | 14% | 0.35% | 17 | 19 | ||||||
> 30 to ≤ 60 Days | 1,638,947 | 15% | 0.36% | 20 | 38 | |||||||
> 60 Days | 7,893,810 | 70% | 0.36% | 33 | 96 | |||||||
Total | $ | 11,141,480 | 99% | 0.36% | 29 | 76 | ||||||
U.S. Treasuries | ||||||||||||
> 30 to ≤ 60 Days | $ | 148,080 | 1% | (0.27)% | 2 | 32 | ||||||
Total | $ | 11,289,560 | 100% | 0.35% | 28 | 75 | ||||||
December 31, 2013 | Weighted-Average | |||||||||||
Original Days to Maturity | Repurchase Agreements Outstanding (000's) | Percentage of Total | Interest Rate | Remaining Days to Maturity | Original Days to Maturity | |||||||
Agency RMBS | ||||||||||||
≤ 30 Days | $ | 83,917 | 1% | 0.39% | 11 | 22 | ||||||
>30 to ≤ 60 Days | 801,587 | 7% | 0.39% | 13 | 37 | |||||||
> 60 Days | 10,321,446 | 92% | 0.42% | 42 | 99 | |||||||
Total | $ | 11,206,950 | 100% | 0.41% | 40 | 94 | ||||||
In addition, as of December 31, 2014, we had payable for securities purchased, a portion of which will be or, in the case of December 31, 2013, was financed through repo borrowings summarized below (in thousands).
37
December 31, 2014 | ||||||||
Settle Date | Face Value | Payable | ||||||
January 2015 | $ | 1,325,657 | $ | 1,399,441 | ||||
February 2015 | 100,000 | 106,040 | ||||||
$ | 1,425,657 | $ | 1,505,481 | |||||
December 31, 2013 | ||||||||
Settle Date | Face Value | Payable | ||||||
January 2014 | $ | 1,507,000 | $ | 1,566,821 | ||||
Results of Operations
Year Ended December 31, 2014 Compared to the Year Ended December 31, 2013
Net Income
Net income available to common stockholders increased $896.4 million to $404.8 million for the year ended December 31, 2014, compared to a net loss of $(491.6) million for the year ended December 31, 2013. This swing illustrates the broad-based improvement in the values of the Company's investments, but also reflects the realized losses on sales of our investments in the second and third quarters of 2013, as well as the general decrease in the value of the Company's investment portfolio, when the fixed income markets fell due to expectations of the Fed tapering its asset purchase program. The major components of this improvement in net income are detailed below.
Interest Income and Asset Yield
Our principal source of income is the interest income that we earn on our Debt Securities portfolio. Interest income, which consists primarily of interest income on our Debt Securities, decreased by $14.8 million to $317.1 million for the year ended December 31, 2014, as compared to $331.9 million for the year ended December 31, 2013. The most significant factors in this decrease was a smaller investment portfolio, partially offset by an increase in yield on our investments, as shown below (in thousands):
Change in Size | Change in Yield | Change in Size & Yield | |||||||||||
Change in average settled | $ | (2,615,547 | ) | Change in average yield | 0.36 | % | Change in average settled | $ | (2,615,547 | ) | |||
2013 average yield | 2.24 | % | 2013 average settled | 14,813,725 | Change in average yield | 0.36 | % | ||||||
Change | $ | (58,603 | ) | Change | $ | 53,153 | Change | $ | (9,385 | ) | |||
Total change | $ | (14,835 | ) | ||||||||||
Our average settled Debt Securities for the year ended December 31, 2014 were $12,198.2 million, compared to $14,813.7 million for the year ended December 31, 2013. However, interest income did not fall proportionate to this decrease because our annualized yield on average settled Debt Securities for the year ended December 31, 2014 was higher at 2.60%, as compared to 2.24% for the year ended December 31, 2013. The yield on our assets is most directly affected by the stated coupon rate, and the rate of prepayments on our Agency RMBS due to its impact on the amortization of premium on Agency RMBS. Our yield increase was primarily a function of higher average coupon for the Debt Securities in our investment portfolio during 2014 compared to 2013, and the improvement in coupon partially offset the impact of the lower average settled Debt Securities at December 31, 2014 compared to December 31, 2013. In addition, net interest income and yield benefited from lower amortization expense on the portfolio's premiums than in 2013, driven in part by lower prepayments. Our weighted-average coupon as of December 31, 2014 was 3.39%, compared to 3.30% as of December 31, 2013. Our amortization expense was $52.5 million for the year ended December 31, 2014, compared to $115.4 million for the year ended December 31, 2013.
38
Interest Expense and Cost of Funds
Our interest expense for the year ended December 31, 2014, which consists of interest expense from repo borrowings and interest rate swaps and caps, decreased $21.7 million to $124.6 million, compared to $146.3 million for the year ended December 31, 2013. A decline in interest expense from repo borrowings made up $19.0 million of the $21.7 million change in interest expense for the year ended December 31, 2014, and the remainder of the change was made up by a fall in swap and cap interest expense of $2.7 million. Our average repo borrowings decreased to $10,559.9 million for the year ended December 31, 2014, from $12,836.2 million for the year ended December 31, 2013, consistent with the smaller investment portfolio in 2014 as compared to 2013. Also, part of the decline in interest expense from repo borrowings was attributable to a fall in average interest rates on repo borrowings to 0.32% for the year ended December 31, 2014, from 0.41% for the year ended December 31, 2013. As shown below, average repo borrowings outstanding and average interest rates on repo borrowings both declined in 2014 (in thousands):
Change in Size | Change in Rate | Change in Size & Rate | |||||||||||
Change in average outstanding | $ | (2,276,390 | ) | Change in average rate | (0.09 | )% | Change in average outstanding | $ | (2,276,390 | ) | |||
2013 average rate | 0.41 | % | 2013 average outstanding | 12,836,246 | Change in average rate | (0.09 | )% | ||||||
Change | $ | (9,357 | ) | Change | $ | (11,646 | ) | Change | $ | 2,065 | |||
Total change | $ | (18,938 | ) | ||||||||||
Swap and cap interest expense fell by $2.7 million, to $90.8 million in 2014 compared to $93.5 million in 2013. The decline in the interest rate swap and cap expense was attributable primarily to the fall in the average aggregate swap and cap notional amount by $1,970.0 million, to $9,896.2 million in 2014 from $11,866.2 million in 2013, offset by the rise in the average swap and cap rate to 0.92% in 2014 from 0.79% in 2013, as shown in the table below (in thousands):
Change in Size | Change in Rate | Change in Size & Rate | |||||||||||
Change in average notional outstanding | $ | (1,970,000 | ) | Change in average rate | 0.13 | % | Change in average notional outstanding | $ | (1,970,000 | ) | |||
2013 average rate | 0.79 | % | 2013 average notional outstanding | 11,866,154 | Change in average rate | 0.13 | % | ||||||
Change | $ | (15,522 | ) | Change | $ | 15,392 | Change | $ | (2,555 | ) | |||
Total change | $ | (2,685 | ) | ||||||||||
Our annualized weighted-average cost of funds including hedge was 1.18% for the year ended December 31, 2014, as compared to 1.14% for the year ended December 31, 2013. The components of our cost of funds are (i) rates on our repo borrowings, (ii) rates on our interest rate swaps and caps, (iii) the size of our repo borrowings, and (iv) the total notional amount of the interest rate swaps and caps.
Net Interest Income and Drop Income
Our net interest income for the year ended December 31, 2014 was $192.4 million, and our interest rate spread net of hedge was 1.42%. For the year ended December 31, 2013, our net interest income was $185.7 million and our interest rate spread net of hedge was 1.10%. The increase in our interest rate spread net of hedge (yield minus financing and hedging costs) was due to our higher portfolio yield, which was driven by higher coupon rates and lower amortization expense. While the dollar figure of our net interest income is influenced significantly by the size of our portfolio and overall interest rate levels, we believe our interest rate spread net of hedge is an important indicator of our performance.
Drop income is a component of our net realized and unrealized gain (loss) on investments on our consolidated statements of operations and therefore excluded from core earnings. Drop income is the difference between the spot price and the forward settlement price for the same security on the trade date. This difference is also the economic equivalent of the assumed interest rate spread net of hedge of the bond from trade date to settlement date. During the years ended December 31, 2014 and 2013, we generated drop income of approximately $60.7 million and $94.5 million, respectively. The continued high level of drop income was primarily due to continuing large volumes of forward settling transactions from which we derive drop income. During the year ended December 31, 2014, the average balance in the TBA securities portfolio was $1,681.4 million, a decrease of $1,639.3 million compared to the average balance of $3,320.7 million for the year ended December 31, 2013. The decrease in average TBA balance explains the decrease in drop income in 2014. The TBA market became slightly less attractive in 2014 and we settled more cash bonds in the fourth quarter.
39
Gain (Loss) on Investments
During the year ended December 31, 2014, our net realized and unrealized gain (loss) on investments increased by $1,276.0 million to a $366.3 million net gain, compared to a loss of $(909.6) million for the year ended December 31, 2013. This change was driven in part by significant increases in prices of Agency RMBS for the year ended December 31, 2014, compared with decreases in prices of Agency RMBS for the year ended December 31, 2013. For example, during the year ended December 31, 2014, the price of a 30-year 4.0% Agency RMBS increased $3.75, and during the year ended December 31, 2013 it decreased $4.19. In terms of the impact on investment gains in 2014, the price increases for Agency RMBS in 2014 more than offset the impact of the lower average total Debt Securities of $13,910.2 million in 2014 compared to $17,806.3 million in 2013. In addition, in the second and third quarters of 2013, we sold a large amount of Debt Securities in a down market in order to rebalance our portfolio and maintain our leverage, incurring aggregate net losses of $619.1 million in those periods, which significantly impacted our loss on investments for the year ended December 31, 2013.
Gain (Loss) on Derivatives
Our net realized and unrealized gain (loss) on swaps and caps decreased by $379.7 million to a loss of $(110.5) million for the year ended December 31, 2014, compared to a gain of $269.1 million for the year ended December 31, 2013. The realized and unrealized loss in the year ended December 31, 2014 was due principally to an environment of falling interest rates in which swap and cap prices declined, whereas in 2013, with Agency RMBS prices falling in response to higher interest rates, the swaps and caps generally gained value and we recognized gains on our swaps and caps. During the years ended December 31, 2014 and 2013, our average aggregate interest rate swap and cap notional amount was $9,896.2 million and $11,866.2 million, respectively. During the year ended December 31, 2014 5-year and 7-year swap rates decreased by 1 bps and decreased by 44 bps, respectively. During the year ended December 31, 2013 5-year and 7-year swap rates increased by 92 bps and increased by 117 bps, respectively.
Operating Expenses
Operating expenses were $22.9 million and $21.0 million for the years ended December 31, 2014 and 2013, respectively.
Year Ended December 31, 2013 Compared to the Year Ended December 31, 2012
Net Income
Net income available to common stockholders decreased $862.0 million to net loss of $(491.6) million for the year ended December 31, 2013, compared to net income of $370.4 million for the year ended December 31, 2012. The major components of this decrease are detailed below.
Interest Income and Asset Yield
Interest income increased by $38.7 million to $331.9 million for the year ended December 31, 2013, as compared to $293.2 million for the year ended December 31, 2012. The increase in our interest income is due to the increase in the size of our portfolio, partially offset by the decrease in average yield on our investments, as shown below (in thousands):
Change in Size | Change in Yield | Change in Size & Yield | |||||||||||
Change in average settled | $ | 2,422,321 | Change in average yield | (0.13 | )% | Change in average settled | $ | 2,422,321 | |||||
2012 average yield | 2.37 | % | 2012 average settled | 12,391,404 | Change in average yield | (0.13 | )% | ||||||
Change | $ | 57,325 | Change | $ | (15,609 | ) | Change | $ | (3,051 | ) | |||
Total change | $ | 38,665 | |||||||||||
Our average settled Debt Securities for the year ended December 31, 2013 were $14,813.7 million, compared to $12,391.4 million for the year ended December 31, 2012. Our annualized yield on average settled Debt Securities for the year ended December 31, 2013 was 2.24%, as compared to 2.37% for the year ended December 31, 2012, despite a rise in the weighted-average coupon rate in 2013. Our decrease in yield was both a function of higher average coupons in 2013 than 2012, and higher amortization expense in 2013 than 2012. Our weighted-average coupon as of December 31, 2013 was 3.30% compared to 3.10% as of December 31, 2012. Our amortization expense was $115.4 million for the year ended December 31, 2013 and $111.6 million for the year ended December 31, 2012.
Interest Expense and Cost of Funds
Interest expense, which primarily consists of interest expense from repo borrowings and interest rate swaps and caps, increased $41.4 million to $146.3 million for the year ended December 31, 2013, compared to $104.9 million for the year ended December 31, 2012.
40
Our average repo borrowings increased to $12,836.2 million for the year ended December 31, 2013, from $10,822.0 million for the year ended December 31, 2012. Higher interest expense from repo borrowings made up $8.7 million of the $41.4 million change in interest expense for the year ended December 31, 2013, and higher swap and cap interest expense of $32.7 million made up the remainder of the change. As shown below, the change in interest expense from repo borrowings was primarily the result of an increase in the average amount of repo borrowings outstanding during the year ended December 31, 2013 (in thousands):
Change in Size | Change in Rate | Change in Size & Rate | |||||||||||
Change in average outstanding | $ | 2,014,241 | Change in average rate | 0.003 | % | Change in average outstanding | $ | 2,014,241 | |||||
2012 average rate | 0.41 | % | 2012 average outstanding | 10,822,005 | Change in average rate | 0.003 | % | ||||||
Change | $ | 8,211 | Change | $ | 367 | Change | $ | 68 | |||||
Total change | $ | 8,646 | |||||||||||
The remainder of the increase in interest expense, $32.7 million, came from swap and cap interest expense, which rose to $93.5 million in 2013 from $60.8 million in 2012. This increase in interest rate swap and cap expense in 2013 was due largely to an increase in the the average aggregate notional amount of swaps and caps, as well as an increase in weighted-average rates for swaps and caps. During the year ended December 31, 2013, our average interest rate swap and cap notional amount increased by $3,964.6 million to $11,866.2 million from $7,901.5 million in 2012. During the year ended December 31, 2013, 5-year swap rates increased by 92 bps to 1.79% from 0.86% in 2012, and 7-year swap rates increased by 117 bps to 2.48% from 1.31% in 2012.
As shown below, the higher swap and cap interest expense in 2013 was primarily the result of increases in both the average notional outstanding and the average rate at December 31, 2013 (in thousands):
Change in Size | Change in Rate | Change in Size & Rate | |||||||||||
Change in average notional outstanding | $ | 3,964,616 | Change in average rate | 0.02 | % | Change in average notional outstanding | $ | 3,964 | |||||
2012 average rate | 0.77 | % | 2012 average notional outstanding | 7,901,538 | Change in average rate | 0.02 | % | ||||||
Change | $ | 30,494 | Change | $ | 1,483 | Change | $ | 744 | |||||
Total change | $ | 32,721 | |||||||||||
Our annualized weighted-average cost of funds including hedge increased from 0.97% for the year ended December 31, 2012 to 1.14% for the year ended December 31, 2013.
Net Interest Income and Drop Income
Our net interest income for the year ended December 31, 2013 was $185.7 million, and our interest rate spread net of hedge was 1.10%. For the year ended December 31, 2012, our net interest income was $188.4 million and our interest rate spread net of hedge was 1.40%. The decrease in net interest income was primarily due to the decrease in our interest rate spread net of hedge, offset by an increase in the size of the investment portfolio.
During the years ended December 31, 2013 and 2012, we generated drop income of approximately $94.5 million and $97.4 million, respectively. The decrease in drop income in 2013 was generally due to a smaller TBA portfolio in 2013 than in 2012.
Gain (Loss) on Investments
Net realized and unrealized gain (loss) on investments decreased by $1,136.5 million to a net realized and unrealized loss of $(909.6) million for the year ended December 31, 2013, compared to a gain of $226.9 million for the year ended December 31, 2012. The net realized loss increased significantly in 2013 as we sold Agency RMBS in a down market in order to rebalance the portfolio and maintain our leverage ratio during the second and third quarters of 2013. For example, during the year ended December 31, 2013 the price of a 30-year 4.0% Agency RMBS decreased $4.20, and during the year ended December 31, 2012 the price for the same security increased $2.13. In addition, our average settled Debt Securities were approximately $14,813.7 million for the year ended December 31, 2013, $2,422.3 million more than the average settled Debt Securities of $12,391.4 million for the year ended December 31, 2012. This had the effect of magnifying the impact of the Agency RMBS price declines on our overall losses in 2013, as compared to lessening the impact of Agency RMBS price increases on the smaller investment portfolio in 2012.
41
Gain (Loss) on Derivatives
Net realized and unrealized gain on swaps and caps was $269.1 million for the year ended December 31, 2013, compared to a loss of $(22.0) million for the year ended December 31, 2012. In the year ended December 31, 2013, with Agency RMBS prices falling in response to higher interest rates, the swaps generally gained value and we incurred gains on our swaps and caps. The realized and unrealized loss on swaps and caps in the year ended December 31, 2012 was due principally to an environment of falling interest rates and rising Agency RMBS prices during 2012. During the years ended December 31, 2013 and 2012, our average interest rate swap and cap notional amount was $11,866.2 million and $7,901.5 million, respectively. During the years ended December 31, 2013 and 2012, 7-year swap rates increased by 117 bps and decreased by 33 bps, respectively.
Operating Expenses
Operating expenses were $21.0 million and $20.5 million for the years ended December 31, 2013 and 2012, respectively.
Contractual Obligations and Commitments
The following table summarizes our contractual obligations for borrowings under repurchase agreements, interest expense on repurchase agreements and the office lease at December 31, 2014 and 2013 (dollars in thousands).
December 31, 2014 | Within One Year | One to Three Years | Three to Five Years | Total | |||||||||||
Borrowings under repurchase agreements | $ | 11,289,559 | $ | — | $ | — | $ | 11,289,559 | |||||||
Interest expense on borrowings under repurchase agreements, based on rates at December 31, 2014 | 8,448 | — | — | 8,448 | |||||||||||
Long-term operating lease obligation | 262 | 131 | — | 393 | |||||||||||
Total | $ | 11,298,269 | $ | 131 | $ | — | $ | 11,298,400 | |||||||
December 31, 2013 | Within One Year | One to Three Years | Three to Five Years | Total | |||||||||||
Borrowings under repurchase agreements | $ | 11,206,950 | $ | — | $ | — | $ | 11,206,950 | |||||||
Interest expense on borrowings under repurchase agreements, based on rates at December 31, 2013 | 12,202 | — | — | 12,202 | |||||||||||
Long-term operating lease obligation | 293 | 393 | — | 686 | |||||||||||
Total | $ | 11,219,445 | $ | 393 | $ | — | $ | 11,219,838 | |||||||
At December 31, 2014 and December 31, 2013, we had the following interest rate swaps and caps (in thousands):
As of December 31, 2014
Interest Rate Swaps | Weighted-Average | Notional | Fair | ||||||||
Expiration Year | Fixed Pay Rate | Amount | Value | ||||||||
2017 | 0.87 | % | $ | 2,750,000 | $ | 22,580 | |||||
2018 | 1.16 | % | 2,000,000 | 13,760 | |||||||
2019 | 1.75 | % | 800,000 | (3,232 | ) | ||||||
2021 | 2.35 | % | 2,100,000 | (8,505 | ) | ||||||
Total | 1.44 | % | $ | 7,650,000 | $ | 24,603 | |||||
Interest Rate Caps | Weighted-Average | Notional | Fair | ||||||||
Expiration Year | Cap Rate | Amount | Value | ||||||||
2019 | 1.34 | % | $ | 800,000 | $ | 26,996 | |||||
2020 | 1.25 | % | 1,700,000 | 80,678 | |||||||
Total | 1.28 | % | $ | 2,500,000 | $ | 107,674 | |||||
42
As of December 31, 2013
Interest Rate Swaps | Weighted-Average | Notional | Fair | ||||||||
Expiration Year | Fixed Pay Rate | Amount | Value | ||||||||
2015 | 2.15 | % | $ | 500,000 | $ | (10,255 | ) | ||||
2016 | 1.71 | % | 550,000 | (13,780 | ) | ||||||
2017 | 0.94 | % | 3,250,000 | 27,942 | |||||||
2018 | 1.16 | % | 2,000,000 | 27,639 | |||||||
Total | 1.17 | % | $ | 6,300,000 | $ | 31,546 | |||||
Interest Rate Caps | Weighted-Average | Notional | Fair | ||||||||
Expiration Year | Cap Rate | Amount | Value | ||||||||
2015 | 1.40 | % | $ | 500,000 | $ | 309 | |||||
2019 | 1.56 | % | 1,700,000 | 92,376 | |||||||
2020 | 1.25 | % | 1,700,000 | 142,018 | |||||||
Total | 1.40 | % | $ | 3,900,000 | $ | 234,703 | |||||
We enter into certain contracts that contain a variety of indemnification obligations, principally with our brokers and counterparties to interest rate swap and cap contracts and repurchase agreements. The maximum potential future payment amount we could be required to pay under these indemnification obligations is unlimited. We have not incurred any costs to defend lawsuits or settle claims related to these indemnification obligations. As a result, the estimated fair value of these agreements is minimal. Accordingly, we recorded no liabilities for these agreements as of December 31, 2014 and December 31, 2013. In addition, as of December 31, 2014 and December 31, 2013, we had $1,505.5 million and $1,556.8 million of payable for securities purchased, respectively, a portion of which either will be or was financed through repo borrowings. A summary of our payable for securities purchased as of December 31, 2014 and December 31, 2013 is included in the Financial Condition—Liabilities section.
Off-Balance Sheet Arrangements
As of December 31, 2014 and 2013, we did not maintain any relationships with any significant unconsolidated entities or financial partnerships, such as entities often referred to as structured finance, special purpose or variable interest entities, established for the purpose of facilitating off-balance sheet arrangements or other contractually narrow or limited purposes. Further, as of December 31, 2014 and 2013, we had not guaranteed any obligations of unconsolidated entities or entered into any commitment or had any intent to provide funding to any such entities.
Liquidity and Capital Resources
Our primary sources of funds are repo borrowings, equity offerings, asset sales and monthly principal and interest payments on our investment portfolio. Because the level of our borrowings can be adjusted on a daily basis, we believe that the level of cash carried on our balance sheet is significantly less important than the potential liquidity available under our borrowing arrangements. We currently believe that we have sufficient liquidity and capital resources available for the acquisition of additional investments, repayments on borrowings, maintenance of any margin requirements and the payment of cash dividends as required for our continued qualification as a REIT. To qualify as a REIT, we must distribute annually at least 90% of our net taxable income. To the extent that we annually distribute all of our net taxable income in a timely manner, we will generally not be subject to federal and state income taxes. We currently expect to distribute all or substantially all of our taxable income in a timely manner so that we are not subject to federal and state income taxation. This distribution requirement limits our ability to retain earnings and thereby replenish or increase capital from operations.
As of December 31, 2014 and December 31, 2013, we had approximately $1,319.7 million and $1,115.8 million, respectively, in Agency RMBS, U.S. Treasuries and cash available to satisfy future margin calls. We have always been able to maintain sufficient liquidity to meet margin calls, and we have always been able to satisfy a margin call, although no assurance can be given that we will be able to satisfy requests from our lenders to post additional collateral in the future. During the year ended December 31, 2014, we maintained an average liquidity level of 66%, and never less than 55%, of stockholders' equity.
During the year ended December 31, 2014 and 2013, we had average repo borrowings outstanding of $10,559.9 million and $12,836.2 million, respectively, with a weighted-average borrowing rate of 0.32% and 0.41%. The availability of repo borrowing financing was generally stable with interest rates between 0.25% and 0.39% for 30-180 day repo borrowings at December 31, 2014.
43
To limit our exposure to counterparty credit risk, we diversify our funding across multiple counterparties and by counterparty region. As of December 31, 2014 and December 31, 2013, we had master repurchase agreements with 45 and 37 financial institutions, respectively, subject to certain conditions, located throughout North America, Europe and Asia. The table below includes a summary of our repo borrowings funding by number of repo borrowings counterparties and counterparty region as of December 31, 2014 and December 31, 2013:
December 31, 2014 | ||||||
Counterparty Region | Number of Counterparties | Percent of Repurchase Agreement Funding | ||||
North America | 18 | 51.9 | % | |||
Europe | 9 | 30.2 | % | |||
Asia | 5 | 17.9 | % | |||
32 | 100.0 | % | ||||
December 31, 2013 | ||||||
Counterparty Region | Number of Counterparties | Percent of Repurchase Agreement Funding | ||||
North America | 12 | 49.7 | % | |||
Europe | 7 | 29.4 | % | |||
Asia | 5 | 20.9 | % | |||
24 | 100.0 | % | ||||
Our repurchase agreements contain typical provisions and covenants as set forth in the standard master repurchase agreement published by the Securities Industry and Financial Markets Association. Our repurchase agreements generally require us to transfer additional securities to the counterparty in the event the value of the securities then held by the counterparty in the margin account falls below specified levels and contain events of default in cases where we or the counterparty breaches our respective obligations under the agreement.
We receive margin calls from our repurchase agreement counterparties from time to time in the ordinary course of business similar to other entities in the specialty finance business. We receive two types of margin calls under our repurchase agreements. The first type, which are known as “factor calls,” are margin calls that occur each month and relate to the timing difference between the reduction of principal balances of our Agency RMBS, due to monthly principal payments on the underlying mortgages, and the receipt of the corresponding cash. The second type of margin call we may receive is a “valuation call”, which occurs due to market and interest rate movements. Both factor and valuation margin calls occur if the total value of our assets pledged as collateral to our counterparty drops beyond a threshold level, typically between $100,000 and $500,000. Both types of margin calls require a dollar for dollar restoration of the margin shortfall. Conversely, we may initiate margin calls to our counterparties when the value of our assets pledged as collateral with a counterparty increases above the threshold level, thereby increasing our liquidity. All unrestricted cash plus any unpledged securities, are available to satisfy margin calls.
Our collateral is generally valued on the basis of prices provided by recognized bond market sources agreed to by the parties. Inputs to the models used by pricing sources may include, but are not necessarily limited to, reported trades, executable bid and asked prices, broker quotations, prices or yields of securities with similar characteristics, benchmark curves or information pertaining to the issuer, as well as industry and economic events. Our master repurchase agreements contain mostly standard provisions for the valuation of collateral. These agreements typically provide that both the repurchase seller (the borrower) and the repurchase buyer (the lender) value the collateral on a daily basis. Each party uses prices that it obtains from generally recognized pricing sources, or the most recent closing bid quotation from such a source. If the buyer, or the seller, as the case may be, determines that additional collateral is required, it may call for the delivery of such collateral. Under certain of our repurchase agreements, in limited circumstances, such as when a pricing source is not available, our lenders have the right to determine the value of the collateral we have provided to secure our repo borrowings. In instances where we have agreed to permit our lenders to make a determination of the value of such collateral, such lenders are expected to act reasonably and in good faith in making such valuation determinations.
We also pledge collateral for our interest rate swaps, caps, and forward purchase transactions. We will receive margin calls on these transactions when the value of the swap or forward purchase transaction declines or when the value of any collateral pledged falls below a particular threshold level. All unrestricted cash and cash equivalents, plus any unpledged Agency RMBS or U.S. Treasuries, are available to satisfy margin calls.
An event of default or termination event under the standard master repurchase agreement would give our counterparty the option to terminate all repurchase transactions existing with us and make any amount due by us to the counterparty immediately payable.
44
For our short-term (one year or less) and long-term (more than one year) liquidity and capital resource requirements, we also rely on the cash flow from operations, primarily monthly principal and interest payments to be received on our Agency RMBS, as well as any securities offerings authorized by our board of directors. During the years ended December 31, 2014 and 2013, we received $1,333.8 million and $2,427.1 million of principal repayments, respectively, and $315.9 million and $340.3 million of interest payments, respectively. We held cash of $4.3 million and $5.0 million at December 31, 2014 and December 31, 2013, respectively. For the years ended December 31, 2014 and 2013, net cash provided by operating activities was $218.0 million and $310.3 million, respectively.
Based on our current portfolio, leverage rate and available borrowing arrangements, we believe that our cash flow from operations and the utilization of borrowings will be sufficient to enable us to meet anticipated short-term (one year or less) liquidity requirements such as funding our investment activities, funding our distributions to stockholders and for general corporate expenses. However, an increase in prepayment rates substantially above our expectations could cause a temporary liquidity shortfall due to the timing of the necessary margin calls on the financing arrangements and the actual receipt of the cash related to principal paydowns. If our cash resources are at any time insufficient to satisfy our liquidity requirements, we may have to issue debt or additional equity securities or sell Agency RMBS in our portfolio. If required, the sale of Agency RMBS at prices lower than their amortized cost would result in realized losses. We believe that we have additional capacity through repurchase agreements to leverage our equity further should the need for additional short-term (one year or less) liquidity arise.
Our investment portfolio is comprised principally of highly-liquid Agency RMBS and U.S. Treasuries backed by the full faith and credit of the U.S. government. We regularly monitor the creditworthiness of the U.S. government. While the U.S. government has had its credit rating downgraded in recent years by one of the credit rating agencies, we believe it remains one of the most secure creditors in the world as of December 31, 2014. See Note 3, Investments in Securities.
We may increase our capital resources by obtaining long-term credit facilities or making public or private offerings of equity or debt securities. Such financing will depend on market conditions for capital raises and for the investment of any proceeds. If we are unable to renew, replace or expand our sources of financing on substantially similar terms, it may have an adverse effect on our business and results of operations.
From time to time we raise capital through the sale and issuance of our capital stock. On May 23, 2014, we filed an automatically effective shelf registration statement on Form S-3 with the Securities and Exchange Commission. We may offer and sell, from time to time, shares of common stock, preferred stock and debt securities in one or more offerings pursuant to the prospectus that is a part of the registration statement. As of December 31, 2014, we had not issued any shares of common stock, preferred stock or debt securities under the prospectus.
Another vehicle for raising capital is our Direct Share Purchase Program ("DSPP"), through which stockholders may purchase additional shares of common stock by reinvesting some or all of the cash dividends received on shares of common stock. Stockholders may also make optional cash purchases of shares of common stock subject to certain limitations detailed in the plan prospectus. We did not issue any shares under the plan during the year ended December 31, 2014 and 2013. As of December 31, 2014 and 2013, there were approximately 4.1 million shares available for issuance under the DSPP.
Effective May 15, 2014, the Company terminated that certain Equity Distribution Agreement by and between the Company and JMP Securities LLC (“JMP”), dated as of June 7, 2011 (the “JMP Agreement”), in connection with the expiration of the Company’s prior shelf registration statement on Form S-3. Under the JMP Agreement, the Company could offer and sell, from time to time, up to 15.0 million shares of the Company’s common stock through an “at the market” offering program with JMP. The Company sold 11.9 million shares of common stock under the JMP Agreement. For the year ended December 31, 2014 and 2013, the Company did not sell any shares of common stock under the JMP Agreement.
On November 15, 2012, the Company announced that its Board of Directors authorized the repurchase of shares of the Company’s common stock having an aggregate value of up to $250 million. Pursuant to this program, through July 20, 2014, the Company repurchased approximately $115.7 million in aggregate value of its shares of common stock on the open market. On July 21, 2014, the Company announced that its Board of Directors authorized the repurchase of shares of the Company's common stock having an aggregate value of up to $250 million, which included the approximately $134.3 million available for repurchase under the November 2012 authorization. In the fourth quarter of 2014, we repurchased 132,749 shares at a weighted-average purchase price of $8.88, for an aggregate of approximately $1.18 million, and in the third quarter of 2014 repurchased 39,800 shares at a weighted-average purchase price of $8.86, for an aggregate of approximately $0.35 million. Accordingly, the Company still had approximately $248.5 million authorized to repurchase shares of its common stock as of December 31, 2014. See Note 8, Share Capital.
45
Quantitative and Qualitative Disclosures about Short-Term Borrowings
The following table discloses quantitative data about our short-term borrowings under repurchase agreements during the years ended December 31, 2014 and 2013:
Year Ended December 31, | |||||||
(In millions) | 2014 | 2013 | |||||
Outstanding at period end | $ | 11,290 | $ | 11,207 | |||
Weighted average rate at period end | 0.35 | % | 0.41 | % | |||
Average outstanding during period (1) | $ | 10,560 | $ | 12,836 | |||
Weighted average rate during period | 0.32 | % | 0.41 | % | |||
Largest month end balance during period | $ | 11,771 | $ | 14,544 | |||
_______________
(1) | Calculated based on the average month end balance during the period. |
The Company's borrowing ability was generally stable during the years ended December 31, 2014 and 2013. The Company's borrowing rates were lower for the year ended December 31, 2014 compared to the year ended December 31, 2013, due to generally good supply conditions and demand for high quality collateral.
At December 31, 2014 and 2013, the Company had no repo borrowings where the amount at risk with an individual counterparty exceeded 1.6% and 2.3% of stockholders' equity, respectively. At December 31, 2014 and 2013, we had no borrowings with any counterparty that exceeded 5.0% and 6.6% of our total borrowings, respectively.
Inflation
Virtually all of our assets and liabilities are interest rate sensitive in nature. As a result, interest rates and other factors influence our performance far more than inflation. Changes in interest rates do not necessarily correlate with inflation rates or changes in inflation rates. Our financial statements are prepared in accordance with GAAP and our distributions are determined by our board of directors based in part on our REIT taxable income as calculated according to the requirements of the Internal Revenue Code. In each case, our activities and balance sheet are measured with reference to fair value without considering inflation.
Critical Accounting Policies
Our most critical accounting policies require us to make complex and subjective decisions and assessments that could affect our reported assets and liabilities, as well as our reported interest income and expenses. We believe that all of the decisions and assessments upon which our financial statements are based were reasonable at the time made based upon information available to us at that time. We rely on our management’s experience and analysis of historical and current market data in order to arrive at what we believe to be reasonable estimates. See Note 2, Significant Accounting Policies to the financial statements included elsewhere in this Annual Report on Form 10-K for a complete discussion of our significant accounting policies. We have identified our most critical accounting policies to be in the following areas:
Valuation
Agency RBMS and U.S. Treasuries are generally valued on the basis of valuations provided by third party pricing services, as derived from such services’ pricing models. Inputs to the models may include, but are not limited to, reported trades, executable bid and asked prices, broker dealer quotations, prices or yields of securities with similar characteristics, benchmark curves or information pertaining to the issuer, as well as industry and economic events. The pricing services may use a matrix approach, which considers information regarding securities with similar characteristics to determine the valuation for a security.
Interest rate swaps and caps are generally valued using valuations provided by dealer quotations. Such dealer quotations are based on the present value of fixed and projected floating rate cash flows over the term of the swap contract. Future cash flows are discounted to their present value using swap rates provided by electronic data services or brokers.
Investment Company Accounting
Our financial statements are prepared by management in accordance with GAAP. Although we conduct our operations so that we are not required to register as an investment company under the Investment Company Act, for financial reporting purposes, prior to 2014 we were considered an investment company and followed the accounting and reporting specified in ASC 946, Financial Services-Investment Companies. Accordingly, investments in securities were carried at fair value with changes in fair value recorded in the statement of operations. Effective January 1, 2014 we were required to discontinue investment company accounting presentation.
46
Effective January 1, 2014, the Company discontinued its use of investment company accounting under ASC 946. Upon transition, the following changes and elections were made:
(i) | Investments are now presented as available-for-sale securities in accordance with ASC 320 Investments – Debt and Equity Securities, |
(ii) | Management elected the Fair Value Option (“FVO”) under ASC 825 – Financial Instruments for all investments held. As a result of the FVO election, all changes in the fair value of investments held on January 1, 2014 will continue to be recorded in the Company’s consolidated statements of operations, and |
(iii) | The Company elected not to designate its derivatives as hedging instruments in accordance with ASC 815 – Derivatives and Hedging. As a result, all changes in the fair value of derivative instruments held on January 1, 2014 will also continue to be recorded in the Company’s consolidated statement of operations. |
The discontinuation of investment company accounting under ASC 946, and the related accounting elections referred to above resulted in no changes in the Company’s accounting for any financial statement item. However, the presentation of the Company's consolidated financial statements changed principally as follows:
(i) | the schedule of investments has been replaced with the available-for-sale tables in the footnotes (see Note 15, Investment Company Accounting, for the Schedule of Investments for the year ended December 31, 2013), |
(ii) | reformatted the statement of assets and liabilities to a consolidated balance sheet presentation, |
(iii) | reformatted the consolidated statements of operations to include the statement of comprehensive income (loss), as applicable, |
(iv) | removed the statement of changes in net assets and included the consolidated statement of changes in stockholders’ equity (see Note 15, Investment Company Accounting, for the reconciliation of net investment income and net gain (loss) on investments and derivatives for the years ended December 31, 2013 and 2012), and |
(v) | reformatted the statement of cash flows to include an investing section. See Note 2, Significant Accounting Policies. |
Recent Accounting Pronouncements
None.
Item 7A. Quantitative and Qualitative Disclosures about Market Risk
As of December 31, 2014 and 2013, the primary component of our market risk was interest rate risk, as described below. While we do not seek to avoid risk completely, we do believe that risk can be quantified from historical experience and seek to actively manage risk, to earn sufficient compensation to justify taking risks and to maintain capital levels consistent with the risks we undertake. Our board of directors exercises oversight of risk management in many ways, including overseeing our senior management’s risk-related responsibilities and reviewing management and investment policies and performance against these policies and related benchmarks. See Business—Risk Management for a further discussion of our risk mitigation practices.
Interest Rate Risk
We are subject to interest rate risk in connection with our investments in Agency RMBS collateralized by ARMs, Hybrid ARMs and fixed rate mortgage loans and our related debt obligations, which are generally repurchase agreements of limited duration that are periodically refinanced at current market rates. We seek to manage this risk through utilization of derivative contracts, primarily interest rate swap and cap contracts.
Effect on Interest Income, Interest Expense and Net swap and cap interest income (expense). We fund our investments in long-term Agency RMBS collateralized by ARMs, Hybrid ARMs and fixed rate mortgage loans with repo borrowings. During periods of rising interest rates, the borrowing costs associated with those Agency RMBS tend to increase while the income earned on such Agency RMBS (during the fixed rate component of such securities) may remain substantially unchanged. This results in a narrowing of the net interest spread between the related assets and borrowings and may even result in losses.
We are a party to the interest rate swap and cap contracts as of December 31, 2014 and 2013 described in detail under Item 7. “Management’s Discussion and Analysis of Financial Condition and Results of Operations—Contractual Obligations and Commitments” in this Annual Report on Form 10-K.
Hedging techniques are partly based on assumed levels of prepayments of our Agency RMBS. If prepayments are slower or faster than assumed, the life of the Agency RMBS will be longer or shorter, which would reduce the effectiveness of any hedging strategies we may use and may cause losses on such transactions.
Effect on Fair Value. Another component of interest rate risk is the effect changes in interest rates will have on the fair value of our assets. We face the risk that the fair value of our assets will increase or decrease at different rates than those of our liabilities, including our hedging instruments.
47
We primarily assess our interest rate risk by estimating the duration of our assets and the duration of our liabilities. Duration essentially measures the market price volatility of financial instruments as interest rates change. We generally calculate duration using various third-party financial models and empirical data. Different models and methodologies can produce different duration numbers for the same securities.
Extension Risk. We invest in Agency RMBS collateralized by Hybrid ARMs, which have interest rates that are fixed for the first few years of the loan (typically three, five, seven or 10 years) and thereafter reset periodically on the same basis as Agency RMBS collateralized by ARMs. We compute the projected weighted average life of our Agency RMBS collateralized by hybrid ARMs based on assumptions regarding the rate at which the borrowers will prepay the underlying mortgages. In general, when Agency RMBS collateralized by fixed rate or Hybrid ARMs is acquired with borrowings, we may, but are not required to, enter into an interest rate swap contract or other hedging instrument that effectively fixes our borrowing costs for a period close to the anticipated weighted average life of the fixed rate portion of the related Agency RMBS. This strategy is designed to protect us from rising interest rates by fixing our borrowing costs for the duration of the fixed rate period of the collateral underlying the related Agency RMBS.
We have generally structured our swaps to expire in conjunction with the estimated weighted-average life of the fixed period of the mortgages underlying our Agency RMBS portfolio. However, in a rising interest rate environment, the weighted-average life of the fixed rate mortgages underlying our Agency RMBS could extend beyond the term of the swap agreement or other hedging instrument. This could have a negative impact on our results from operations, as borrowing costs would no longer be fixed after the term of the hedging instrument while the income earned on the remaining Agency RMBS would remain fixed for a period of time. This situation may also cause the market value of our Agency RMBS to decline with little or no offsetting gain from the related hedging transactions. In extreme situations, we may be forced to sell assets to maintain adequate liquidity, which could cause us to incur losses.
Interest Rate Cap Risk. Both the ARMs and Hybrid ARMs that collateralize our Agency RMBS are typically subject to periodic and lifetime interest rate caps and floors, which limit the amount by which the security’s interest yield may change during any given period. However, our borrowing costs will not be subject to similar restrictions. Therefore, in a period of increasing interest rates, the interest costs on our borrowings could increase without limitation by caps while the interest rate yields on our Agency RMBS would effectively be limited by caps. This problem will be magnified to the extent that we acquire Agency RMBS that are collateralized by Hybrid ARMs that are not fully indexed. In addition, the underlying mortgages may be subject to periodic payment caps that result in some portion of the interest being deferred and added to the principal outstanding. This could result in our receipt of less cash income on our Agency RMBS than we need in order to pay the interest cost on our related borrowings. These factors could lower our net income or cause a net loss during periods of rising interest rates, which would harm our financial condition, cash flows and results of operations.
Interest Rate Mismatch Risk. We intend to fund a substantial portion of our acquisitions of Agency RMBS with borrowings that, after the effect of hedging, have interest rates based on indices and repricing terms similar to, but of somewhat shorter maturities than, the interest rate indices and repricing terms of the Agency RMBS. Thus, we anticipate that in most cases the interest rate indices and repricing terms of our Agency RMBS and our funding sources will not be identical, thereby creating an interest rate mismatch between assets and liabilities. Therefore, our cost of funds would likely rise or fall more quickly than would our earnings rate on assets. During periods of changing interest rates, such interest rate mismatches could negatively impact our financial condition, cash flows and results of operations. To manage interest rate mismatches, we may utilize the hedging strategies discussed above.
Our analysis of risks is based on management’s experience, estimates, models and assumptions. These analyses rely on models which utilize estimates of fair value and interest rate sensitivity. Actual economic conditions or implementation of investment decisions by our management may produce results that differ significantly from the estimates and assumptions used in our models and the projected results reflected herein.
Prepayment Risk
Prepayments are the full or partial repayment of principal prior to the original contractual maturity of a mortgage loan and typically occur due to refinancing of mortgage loans. Prepayment rates for existing Agency RMBS generally increase when prevailing mortgage interest rates fall. In addition, prepayment rates on Agency RMBS collateralized by ARMs and Hybrid ARMs generally increase when the difference between long-term and short-term interest rates declines or becomes negative. Additionally, we currently own Agency RMBS that were purchased at a premium. The prepayment of such Agency RMBS at a rate faster than anticipated would result in a write-off of any remaining capitalized premium amount.
We seek to manage our prepayment risk by investing in Agency RMBS with a variety of prepayment characteristics, and prepayment protections.
48
Effect on Fair Value and Net Income
Another component of interest rate risk is the effect changes in interest rates will have on the fair value of our assets and our net income exclusive of the effect on fair value. We face the risk that the fair value of our assets and net income exclusive of the effect on fair value will increase or decrease at different rates than that of our liabilities, including our hedging instruments.
We primarily assess our interest rate risk by estimating the duration of our assets and the duration of our liabilities. Duration essentially measures the market price volatility of financial instruments as interest rates change. We generally calculate duration using various financial models and empirical data. Different models and methodologies can produce different duration numbers for the same securities.
The following sensitivity analysis table shows the estimated impact of our interest rate-sensitive investments and repurchase agreement liabilities on the fair value of our assets and our net income, exclusive of the effect of changes in fair value on our net income, at December 31, 2014 and 2013, assuming a static portfolio and that rates instantaneously fall 25, 50 and 75 bps and rise 25, 50 and 75 bps.
December 31, 2014
Change in Interest Rates | Projected Change in Our Net Income | Projected Change in the Fair Value of Our Assets (including hedging instruments)(1) | Projected Change in Stockholders' Equity | ||||||
- 75 basis points | 6.88 | % | (2) | 0.13 | % | 1.09 | % | ||
- 50 basis points | 5.50 | % | (2) | 0.24 | % | 1.91 | % | ||
- 25 basis points | 2.75 | % | (2) | 0.22 | % | 1.71 | % | ||
No Change | — | % | — | % | — | % | |||
+ 25 basis points | (6.88 | )% | (0.31 | )% | (2.30 | )% | |||
+ 50 basis points | (13.75 | )% | (0.73 | )% | (5.47 | )% | |||
+ 75 basis points | (20.63 | )% | (1.22 | )% | (9.10 | )% | |||
December 31, 2013
Change in Interest Rates | Projected Change in Our Net Income | Projected Change in the Fair Value of Our Assets (including hedging instruments)(1) | Projected Change in Stockholders' Equity | ||||||
- 75 basis points | 8.61 | % | (2) | 1.41 | % | 11.27 | % | ||
- 50 basis points | 6.63 | % | (2) | 1.17 | % | 9.34 | % | ||
- 25 basis points | 3.32 | % | (2) | 0.72 | % | 5.75 | % | ||
No Change | — | % | — | % | — | % | |||
+ 25 basis points | (8.29 | )% | (0.76 | )% | (6.08 | )% | |||
+ 50 basis points | (16.58 | )% | (1.54 | )% | (12.30 | )% | |||
+ 75 basis points | (24.87 | )% | (2.32 | )% | (18.52 | )% | |||
_____________
(1) | Analytics provided by The Yield Book® Software |
(2) | Given the low level of interest rates at December 31, 2014 and 2013, we reduced 3-month LIBOR and our repurchase agreement rates by 10, 20 and 25 basis points for the down 25, 50 and 75 basis point net income scenarios, respectively. All other interest rate sensitive instruments were calculated in accordance with the table. |
While the tables above reflect the estimated immediate impact of interest rate increases and decreases on a static portfolio, we rebalance our portfolio from time to time either to take advantage of or minimize the impact of changes in interest rates. Generally, our interest rate swaps reset in the quarter following changes in interest rates. It is important to note that the impact of changing interest rates on fair value and net income can change significantly should interest rates change beyond 75 bps from current levels. Therefore, the volatility in the fair value of our assets could increase significantly should interest rates change beyond 75 bps. In addition, other factors impact the fair value of and net income from our interest rate-sensitive investments and hedging instruments, such as the shape of the yield curve, market expectations as to future interest rate changes and other market conditions. Accordingly, in the event of changes in actual interest rates, the change in the fair value of our assets and our net income would likely differ from that shown above, and such difference might be material and adverse to our stockholders.
49
Risk Management
Our board of directors exercises its oversight of risk management in many ways, including overseeing our senior management’s risk-related responsibilities, including reviewing management policies and performance against these policies and related benchmarks.
As part of our risk management process, we actively manage the interest rate, liquidity, prepayment and counterparty risks associated with our Agency RMBS portfolio. This process includes monitoring various stress test scenarios on our portfolio. We seek to manage our interest rate risk exposure by entering into various hedging instruments in order to minimize our exposure to potential interest rate mismatches between the interest we earn on our investments and our borrowing costs. We seek to manage our liquidity risks by monitoring our liquidity position on a daily basis and maintaining a prudent level of leverage based on current market conditions and various other factors, including the health of the financial institutions that lend to us under our repurchase agreements. We seek to manage our prepayment risk by investing in Agency RMBS with a variety of prepayment characteristics, and prepayment protections, as well as by balancing Agency RMBS purchased at a premium with Agency RMBS purchased at a discount. We seek to manage our counterparty risk by (i) diversifying our exposure across a broad number of counterparties, (ii) limiting our exposure to any one counterparty, and (iii) monitoring the financial stability of our counterparties.
Item 8. Financial Statements and Supplementary Data
INDEX TO FINANCIAL STATEMENTS
FINANCIAL STATEMENTS AS OF DECEMBER 31, 2014 AND 2013, AND FOR THE YEARS ENDED DECEMBER 31, 2014, 2013 AND 2012: | ||
50
REPORT OF INDEPENDENT REGISTERED PUBLIC ACCOUNTING FIRM
To the Board of Directors and Stockholders of
CYS Investments, Inc.
Waltham, MA
We have audited the accompanying consolidated balance sheets of CYS Investments, Inc. (the “Company”) as of December 31, 2014 and 2013, including the schedule of investments as of December 31, 2013, and the related consolidated statements of operations, changes in stockholders equity, and cash flows for each of the three years in the period ended December 31, 2014. These financial statements are the responsibility of the Company's management. Our responsibility is to express an opinion on these financial statements based on our audits.
We conducted our audits in accordance with the standards of the Public Company Accounting Oversight Board (United States). Those standards require that we plan and perform the audit to obtain reasonable assurance about whether the financial statements are free of material misstatement. An audit includes examining, on a test basis, evidence supporting the amounts and disclosures in the financial statements. An audit also includes assessing the accounting principles used and significant estimates made by management, as well as evaluating the overall financial statement presentation. We believe that our audits provide a reasonable basis for our opinion.
In our opinion, such consolidated financial statements present fairly, in all material respects, the financial position of CYS Investments, Inc. as of December 31, 2014 and 2013, and the results of its operations and its cash flows for each of the three years in the period ended December 31, 2014, in conformity with accounting principles generally accepted in the United States of America.
As discussed in Note 2 to the consolidated financial statements, the Company discontinued use of investment company accounting on January 1, 2014.
We have also audited, in accordance with the standards of the Public Company Accounting Oversight Board (United States), the Company's internal control over financial reporting as of December 31, 2014, based on the criteria established in Internal Control - Integrated Framework (2013), issued by the Committee of Sponsoring Organizations of the Treadway Commission and our report dated February 17, 2015 expressed an unqualified opinion on the Company's internal control over financial reporting.
/s/ DELOITTE & TOUCHE LLP
February 17, 2015
Boston, Massachusetts
51
CYS INVESTMENTS, INC.
CONSOLIDATED BALANCE SHEETS
(In thousands, except per share numbers) | December 31, 2014 | December 31, 2013(a) | |||||
Assets: | |||||||
Investments in securities, at fair value (including pledged assets of $11,908,922 and $11,835,975, respectively) | $ | 14,609,532 | $ | 13,865,793 | |||
Derivative assets, at fair value | 148,284 | 295,707 | |||||
Cash and cash equivalents | 4,323 | 4,992 | |||||
Receivable for securities sold and principal repayments | 83,643 | 429,233 | |||||
Interest receivable | 37,894 | 36,731 | |||||
Receivable for cash pledged as collateral | 11,104 | — | |||||
Other assets | 1,083 | 608 | |||||
Total assets | 14,895,863 | 14,633,064 | |||||
Liabilities and stockholders' equity: | |||||||
Liabilities: | |||||||
Repurchase agreements | 11,289,559 | 11,206,950 | |||||
Derivative liabilities, at fair value | 16,007 | 29,458 | |||||
Payable for securities purchased | 1,505,481 | 1,556,821 | |||||
Payable for cash received as collateral | 72,771 | 37,938 | |||||
Distribution payable | 4,410 | 4,410 | |||||
Accrued interest payable (including accrued interest on repurchase agreements of $5,334 and $7,204, respectively) | 27,208 | 24,613 | |||||
Accrued expenses and other liabilities | 5,259 | 4,218 | |||||
Total liabilities | 12,920,695 | 12,864,408 | |||||
Commitments and contingencies (Note 13) | — | — | |||||
Stockholders' equity: | |||||||
Preferred Stock, $25.00 par value, 50,000 shares authorized: | |||||||
7.75% Series A Cumulative Redeemable Preferred Stock, (3,000 and 3,000 shares issued and outstanding, respectively, liquidation preference of $25.00 per share or $75,000 and $75,000 in aggregate, respectively) | $ | 72,369 | $ | 72,369 | |||
7.50% Series B Cumulative Redeemable Preferred Stock, (8,000 and 8,000 shares issued and outstanding, respectively, liquidation preference of $25.00 per share or $200,000 and $200,000 in aggregate, respectively) | 193,531 | 193,531 | |||||
Common Stock, $0.01 par value, 500,000 shares authorized (161,850 and 161,650 shares issued and outstanding, respectively) | 1,618 | 1,616 | |||||
Additional paid in capital | 2,049,152 | 2,046,530 | |||||
Retained earnings (accumulated deficit) | (341,502 | ) | (545,390 | ) | |||
Total stockholders' equity | $ | 1,975,168 | $ | 1,768,656 | |||
Total liabilities and stockholders' equity | $ | 14,895,863 | $ | 14,633,064 | |||
____________
(a) | Previously reported under specialized accounting, ASC 946 – Financial Services – Investment Companies. See Note 2, Significant Accounting Policies, to consolidated financial statements. |
See Notes to consolidated financial statements
52
CYS INVESTMENTS, INC.
CONSOLIDATED STATEMENTS OF OPERATIONS
Year Ended December 31, | |||||||||||
(In thousands, except per share numbers) | 2014 | 2013(a) | 2012(a) | ||||||||
Interest income: | |||||||||||
Interest income from Agency RMBS | $ | 301,996 | $ | 330,430 | $ | 288,960 | |||||
Other interest income | 15,080 | 1,481 | 4,286 | ||||||||
Total interest income | 317,076 | 331,911 | 293,246 | ||||||||
Interest expense: | |||||||||||
Repurchase agreement interest expense | 33,825 | 52,763 | 44,117 | ||||||||
Swap and cap interest expense | 90,812 | 93,497 | 60,776 | ||||||||
Total interest expense | 124,637 | 146,260 | 104,893 | ||||||||
Net interest income | 192,439 | 185,651 | 188,353 | ||||||||
Other income (loss): | |||||||||||
Net realized gain (loss) on investments | 132,563 | (595,116 | ) | 203,846 | |||||||
Net unrealized gain (loss) on investments | 233,763 | (314,530 | ) | 23,023 | |||||||
Net realized gain (loss) on termination of swap and cap contracts | (24,460 | ) | 30,775 | — | |||||||
Net unrealized gain (loss) on swap and cap contracts | (86,082 | ) | 238,353 | (21,990 | ) | ||||||
Other income | 269 | 120 | 80 | ||||||||
Total other income (loss) | 256,053 | (640,398 | ) | 204,959 | |||||||
Expenses: | |||||||||||
Compensation and benefits | 14,105 | 12,599 | 12,264 | ||||||||
General, administrative and other | 8,778 | 8,436 | 8,261 | ||||||||
Total expenses | 22,883 | 21,035 | 20,525 | ||||||||
Net income (loss) | $ | 425,609 | $ | (475,782 | ) | $ | 372,787 | ||||
Dividends on preferred stock | (20,812 | ) | (15,854 | ) | (2,405 | ) | |||||
Net income (loss) available to common stockholders | $ | 404,797 | $ | (491,636 | ) | $ | 370,382 | ||||
Net income (loss) per common share basic & diluted | $ | 2.50 | $ | (2.90 | ) | $ | 2.64 | ||||
____________
(a) | Previously reported under specialized accounting, ASC 946 – Financial Services – Investment Companies. See Note 2, Significant Accounting Policies, to consolidated financial statements. |
See Notes to consolidated financial statements
53
CYS INVESTMENTS, INC.
CONSOLIDATED STATEMENTS OF CHANGES IN STOCKHOLDERS' EQUITY
Cumulative Redeemable Preferred Stock | ||||||||||||||||||||||||
(in thousands) | Series A | Series B | Common Stock Par Value | Additional Paid-in Capital | Retained Earnings (Accumulated Deficit) | Total | ||||||||||||||||||
Balance, December 31, 2011(a) | $ | — | $ | — | $ | 828 | $ | 997,884 | $ | 78,746 | $ | 1,077,458 | ||||||||||||
Net investment income(a) | — | — | — | — | 228,684 | 228,684 | ||||||||||||||||||
Net realized gain (loss) on investments(a) | — | — | — | — | 203,846 | 203,846 | ||||||||||||||||||
Net unrealized gain (loss) on investments(a) | — | — | — | — | 23,023 | 23,023 | ||||||||||||||||||
Net gain (loss) from swap and cap contracts(a) | — | — | — | — | (82,766 | ) | (82,766 | ) | ||||||||||||||||
Issuance of common stock | — | — | 921 | 1,236,339 | — | 1,237,260 | ||||||||||||||||||
Issuance of preferred stock | 72,369 | — | — | — | — | 72,369 | ||||||||||||||||||
Amortization of share based compensation | — | — | — | 2,834 | — | 2,834 | ||||||||||||||||||
Return of capital distributions | — | — | — | 908 | (908 | ) | — | |||||||||||||||||
Repurchase and cancellation of common stock | — | — | — | (453 | ) | — | (453 | ) | ||||||||||||||||
Preferred dividends(b) | — | — | — | — | (2,405 | ) | (2,405 | ) | ||||||||||||||||
Common dividends(e) | — | — | — | — | (357,188 | ) | (357,188 | ) | ||||||||||||||||
Balance, December 31, 2012(a) | $ | 72,369 | $ | — | $ | 1,749 | $ | 2,237,512 | $ | 91,032 | $ | 2,402,662 | ||||||||||||
Net investment income(a) | — | — | — | — | 258,233 | 258,233 | ||||||||||||||||||
Net realized gain (loss) on investments(a) | — | — | — | — | (595,116 | ) | (595,116 | ) | ||||||||||||||||
Net unrealized gain (loss) on investments(a) | — | — | — | — | (314,530 | ) | (314,530 | ) | ||||||||||||||||
Net gain (loss) from swap and cap contracts(a) | — | — | — | — | 175,631 | 175,631 | ||||||||||||||||||
Issuance of common stock | — | — | 3 | (196 | ) | — | (193 | ) | ||||||||||||||||
Issuance of preferred stock | — | 193,531 | — | — | — | 193,531 | ||||||||||||||||||
Amortization of share based compensation | — | — | — | 3,471 | — | 3,471 | ||||||||||||||||||
Return of capital distributions | — | — | — | (78,299 | ) | 1,680 | (76,619 | ) | ||||||||||||||||
Repurchase and cancellation of common stock | — | — | (136 | ) | (115,958 | ) | — | (116,094 | ) | |||||||||||||||
Preferred dividends(c) | — | — | — | — | (15,854 | ) | (15,854 | ) | ||||||||||||||||
Common dividends(e) | — | — | — | — | (146,466 | ) | (146,466 | ) | ||||||||||||||||
Balance, December 31, 2013(a) | $ | 72,369 | $ | 193,531 | $ | 1,616 | $ | 2,046,530 | $ | (545,390 | ) | $ | 1,768,656 | |||||||||||
Net income (loss) | — | — | — | — | 425,609 | 425,609 | ||||||||||||||||||
Issuance of common stock | — | — | 4 | (4 | ) | — | — | |||||||||||||||||
Amortization of share based compensation | — | — | — | 4,514 | — | 4,514 | ||||||||||||||||||
Return of capital distributions | — | — | — | 62 | (62 | ) | — | |||||||||||||||||
Repurchase and cancellation of common stock | — | — | (2 | ) | (1,950 | ) | — | (1,952 | ) | |||||||||||||||
Preferred dividends(d) | — | — | — | — | (20,812 | ) | (20,812 | ) | ||||||||||||||||
Common dividends(e) | — | — | — | — | (200,847 | ) | (200,847 | ) | ||||||||||||||||
Balance, December 31, 2014 | 72,369 | 193,531 | 1,618 | 2,049,152 | (341,502 | ) | 1,975,168 | |||||||||||||||||
54
CONSOLIDATED STATEMENTS OF CHANGES IN STOCKHOLDERS' EQUITY (cont'd)
____________
(a) | Previously reported under specialized accounting, ASC 946 – Financial Services – Investment Companies. See Note 2, Significant Accounting Policies, to consolidated financial statements. |
(b) | Preferred Series A dividends, declared of $0.871875 per share for the year ended December 31, 2012. |
(c) | Preferred Series A and Series B dividends, declared of $1.9375 and $1.328125 per share respectively, for the year ended December 31, 2013. |
(d) | Preferred Series A and Series B dividends, declared of $1.9375 and $1.875 per share respectively, for the year ended December 31, 2014. |
(e) | Common dividends declared of $1.24, $1.32 and $2.37 per share for the years ended December 31, 2014, 2013 and 2012, respectively. |
See Notes to consolidated financial statements
55
CYS INVESTMENTS, INC.
CONSOLIDATED STATEMENTS OF CASH FLOWS
Year Ended December 31, | |||||||||||
(In thousands) | 2014 | 2013(a) | 2012(a) | ||||||||
CASH FLOWS FROM OPERATING ACTIVITIES: | |||||||||||
Net income | $ | 425,609 | $ | (475,782 | ) | $ | 372,787 | ||||
Adjustments to reconcile net income to net cash used in operating activities: | |||||||||||
Amortization of share based compensation | 4,514 | 3,471 | 2,834 | ||||||||
Amortization of premiums and discounts on investment securities | 52,495 | 115,413 | 111,647 | ||||||||
Amortization of premiums on interest rate cap contracts | 20,228 | 24,240 | 12,390 | ||||||||
Net realized (gain) loss on investments | (132,563 | ) | 595,116 | (203,846 | ) | ||||||
Net realized (gain) loss on termination of cap contracts | (6,563 | ) | (37,957 | ) | — | ||||||
Net unrealized (gain) loss on investments | (233,763 | ) | 314,530 | (23,023 | ) | ||||||
Net unrealized (gain) loss on swap and cap contracts | 86,082 | (238,353 | ) | 21,990 | |||||||
Change in assets and liabilities: | |||||||||||
Interest receivable | (1,163 | ) | 9,827 | (18,743 | ) | ||||||
Other assets | (475 | ) | 218 | 264 | |||||||
Accrued interest payable | 2,595 | (4,250 | ) | 13,246 | |||||||
Accrued expenses and other liabilities | 1,041 | 3,783 | (955 | ) | |||||||
Net cash used in operating activities | 218,037 | 310,256 | 288,591 | ||||||||
CASH FLOWS FROM INVESTING ACTIVITIES: | |||||||||||
Purchase of investment securities | (31,870,614 | ) | (44,752,803 | ) | (33,654,947 | ) | |||||
Premium paid on interest rate caps | — | (91,860 | ) | (133,483 | ) | ||||||
Proceeds from disposition of investment securities | 30,106,923 | 48,296,551 | 19,484,757 | ||||||||
Proceeds from termination of interest rate swap and cap contracts | 34,225 | 103,275 | — | ||||||||
Proceeds from paydowns of investment securities | 1,333,783 | 2,427,118 | 2,889,821 | ||||||||
Change in assets and liabilities: | |||||||||||
Receivable for securities sold and principal repayments | 345,590 | (418,890 | ) | (4,793 | ) | ||||||
Payable for securities purchased | (51,340 | ) | (2,958,680 | ) | 4,052,199 | ||||||
Receivable for cash pledged as collateral | (11,104 | ) | — | — | |||||||
Payable for cash received as collateral | 34,833 | 9,028 | 28,910 | ||||||||
Net cash provided by (used in) investing activities | (77,704 | ) | 2,613,739 | (7,337,536 | ) | ||||||
CASH FLOWS FROM FINANCING ACTIVITIES: | |||||||||||
Proceeds from repurchase agreements | 81,669,640 | 115,545,756 | 79,752,751 | ||||||||
Repayments of repurchase agreements | (81,587,031 | ) | (118,320,113 | ) | (73,652,258 | ) | |||||
Net proceeds from issuance of common shares | — | (193 | ) | 1,236,807 | |||||||
Net payments from repurchase of common shares | (1,952 | ) | (116,094 | ) | — | ||||||
Net proceeds from issuance of preferred shares | — | 193,531 | 72,369 | ||||||||
Distributions paid | (221,659 | ) | (235,772 | ) | (358,350 | ) | |||||
Net cash provided by financing activities | (141,002 | ) | (2,932,885 | ) | 7,051,319 | ||||||
Net increase (decrease) in cash and cash equivalents | (669 | ) | (8,890 | ) | 2,374 | ||||||
CASH AND CASH EQUIVALENTS - Beginning of period | 4,992 | 13,882 | 11,508 | ||||||||
CASH AND CASH EQUIVALENTS - End of period | $ | 4,323 | $ | 4,992 | $ | 13,882 | |||||
SUPPLEMENTAL DISCLOSURES OF CASH FLOW INFORMATION: | |||||||||||
Interest paid | $ | 101,814 | $ | 135,920 | $ | 92,322 | |||||
SUPPLEMENTAL DISCLOSURES OF NONCASH FLOW INFORMATION: | |||||||||||
56
CONSOLIDATED STATEMENTS OF CASH FLOWS (cont'd)
Distributions declared, not yet paid | $ | 4,410 | $ | 4,410 | $ | 1,243 | |||||
Reinvestment of distributions on common shares | $ | — | $ | — | $ | 1,294 | |||||
____________
(a) | Previously reported under specialized accounting, ASC 946 – Financial Services – Investment Companies. See Note 2, Significant Accounting Policies, to consolidated financial statements. |
See Notes to consolidated financial statements.
57
CYS INVESTMENTS, INC.
NOTES TO CONSOLIDATED FINANCIAL STATEMENTS
1. ORGANIZATION
CYS Investments, Inc. (the “Company”) was formed as a Maryland corporation on January 3, 2006, and commenced operations on February 10, 2006. The Company has elected to be taxed, and intends to continue to qualify, as a real estate investment trust (“REIT”), and is required to comply with the provisions of the Internal Revenue Code of 1986, as amended (the “Code”), with respect thereto. The Company has primarily purchased residential mortgage-backed securities that are issued and the principal and interest of which are guaranteed by a federally chartered corporation (“Agency RMBS”), such as the Federal National Mortgage Association (“Fannie Mae”) or the Federal Home Loan Mortgage Corporation (“Freddie Mac”), or an agency of the U.S. government such as the Government National Mortgage Association (“Ginnie Mae”), and debt securities issued by the United States Department of Treasury ("U.S. Treasuries"). The Company may also purchase collateralized mortgage obligations issued by a government agency or government-sponsored entity that are collateralized by Agency RMBS ("CMOs"), or securities issued by a government sponsored entity that are not backed by collateral but, in the case of government agencies, are backed by the full faith and credit of the U.S. government, and, in the case of government sponsored entities, are backed by the integrity and creditworthiness of the issuer (“U.S. Agency Debentures”).
The Company’s common stock, Series A Cumulative Redeemable Preferred Stock, $25.00 liquidation preference (the "Series A Preferred Stock"), and Series B Cumulative Redeemable Preferred Stock, $25.00 liquidation preference (the "Series B Preferred Stock"), trade on the New York Stock Exchange under the symbols "CYS," "CYS PrA" and "CYS PrB," respectively.
2. SIGNIFICANT ACCOUNTING POLICIES
Basis of Presentation
The accompanying consolidated financial statements have been prepared in conformity with accounting principles generally accepted in the United States of America (“GAAP”) and the instructions to Securities and Exchange Commission ("SEC") Form 10-K.
The consolidated financial statements include the accounts of the Company and all of its subsidiaries. All intercompany balances and transactions have been eliminated. The consolidated financial statements of the Company have been prepared on the accrual basis of accounting in accordance with GAAP. The preparation of financial statements in conformity with GAAP requires management to make a number of estimates and assumptions that affect the amounts reported in the consolidated financial statements and accompanying footnotes. Actual results could differ from these estimates and the differences may be material.
The Company adopted Financial Accounting Standards Board (“FASB”) Statement of Position (“SOP”) 07-1, Clarification of the Scope of the Audit and Accounting Guide Investment Companies and Accounting by Parent Companies and Equity Method Investors for investments in Investment Companies, prior to its deferral in February 2008. Under SOP 07-1, the Company used financial reporting for investment companies, in accordance with FASB Accounting Standards Codification (“ASC”) 946, Investment Companies. Accounting Standards Update No. 2013-08, which was effective for the Company on January 1, 2014 required, among other things, that entities that adopted SOP 07-1 before the FASB’s indefinite deferral assess whether they continue to be within the scope of ASC 946. The Company determined that REITs are excluded from the scope of ASC 946, and effective January 1, 2014, the Company discontinued use of investment company accounting on a prospective basis.
Reclassification and Presentation
Effective January 1, 2014, the Company discontinued its use of investment company accounting under ASC 946. Upon transition, the following changes and elections were made:
(i) | Investments are now presented as available-for-sale securities in accordance with ASC 320 Investments – Debt and Equity Securities, |
(ii) | Management elected the Fair Value Option (“FVO”) under ASC 825 – Financial Instruments for all investments held. As a result of the FVO election, all changes in the fair value of investments held on January 1, 2014 will continue to be recorded in the Company’s consolidated statements of operations, and |
(iii) | The Company elected not to designate its derivatives as hedging instruments in accordance with ASC 815 – Derivatives and Hedging. As a result, all changes in the fair value of derivative instruments held on January 1, 2014 will also continue to be recorded in the Company’s consolidated statement of operations. |
The discontinuation of investment company accounting under ASC 946, and the related accounting elections referred to above resulted in no changes in the Company’s accounting for any financial statement item. However, the presentation of the Company's consolidated financial statements changed as follows:
58
(i) | the schedule of investments has been replaced with the available-for-sale tables in the footnotes (see Note 15, Investment Company Accounting, for the Schedule of Investments for the year ended December 31, 2013), |
(ii) | reformatted the statement of assets and liabilities to a consolidated balance sheet presentation, |
(iii) | reformatted the consolidated statements of operations to include the statement of comprehensive income (loss), as applicable, |
(iv) | removed the statement of changes in net assets and included the consolidated statement of changes in stockholders’ equity (see Note 15, Investment Company Accounting, for the reconciliation of net investment income and net gain (loss) on investments and derivatives for the years ended December 31, 2013 and 2012), |
(v) | reformatted the statement of cash flows to include an investing section, |
(vi) | changed certain footnotes to reflect conformity with applicable GAAP for non-investment companies, |
(vii) | included summary information on the amortization/accretion of bond premium/discounts, and |
(viii) | removed the financial highlights, as they are no longer required (see Note 15, Investment Company Accounting, for financial highlights for the years ended December 31, 2013 and 2012). |
On January 1, 2014, the Company reclassified its prior period consolidated financial statements to conform to the non-investment company financial statement presentation. This reclassification had no impact on the previously reported income, total assets and liabilities, net cash flows, or stockholders’ equity. On the statement of cash flows, cash from investing activities, which were previously included in cash flows from operating activities, have been separately classified as cash flows from investing activities.
Investments in Securities
The Company's investment securities are accounted for in accordance with ASC 320. The Company has chosen to make a fair value election pursuant to ASC 825 for its securities and, therefore, our investment securities are recorded at fair market value on the consolidated balance sheets. The periodic changes in fair market value are recorded in current period earnings on the consolidated statements of operations as a component of net unrealized gain (loss) on investments. These investments generally meet the requirements to be classified as available-for-sale under ASC 320, which requires the securities to be carried at fair value on the balance sheet. Electing the fair value option permits the Company to record changes in fair value of our investments in the consolidated statements of operations which, in management’s view, more appropriately reflects the results of operations for a particular reporting period as all securities activities will be recorded in a similar manner.
The Company records its transactions in securities on a trade date basis. We record realized gains and losses on securities transactions on an identified cost basis.
Agency RMBS
The Company’s investments in Agency RMBS consist of pass-through certificates backed by fixed-rate, monthly-reset adjustable-rate loans (“ARMs”) and Hybrid ARMs, the principal and interest of which are guaranteed by Fannie Mae, Freddie Mac or Ginnie Mae. Hybrid ARMs have interest rates that have an initial fixed period (typically three, five, seven or 10 years) and thereafter reset at regular intervals in a manner similar to ARMs.
Forward Settling Transactions
The Company engages in forward settling transactions to purchase certain securities. The Company records forward settling transactions on the trade date, and maintains security positions such that sufficient liquid assets will be available to make payment on the settlement date for the securities purchased. The Agency RMBS purchased at the forward settlement date are typically priced at a discount to securities for settlement in the current month. Securities purchased on a forward settling basis are carried at fair value and begin earning interest on the settlement date. Gains or losses may occur on these transactions due to changes in market conditions or the failure of counterparties to perform under the contract. Along with other forward settling transactions, the Company transacts in to-be-announced (“TBA”) securities. As with other forward settling transactions, a seller agrees to issue TBAs at a future date; however, the seller does not specify the particular securities to be delivered. Instead, the Company agrees to accept any security that meets specified terms such as issuer, interest rate and terms of underlying mortgages. The Company records a TBA on the trade date utilizing information associated with the specified terms of the transaction as opposed to the specific mortgages. TBAs are carried at fair value and begin earning interest on the settlement date. Gains or losses may occur due to the fact that the actual underlying mortgages received may be more or less favorable than those anticipated by the Company.
At times, the Company may enter into TBA contracts as a means of investing in and financing Agency RMBS via “dollar roll” transactions. TBA dollar roll transactions involve moving the settlement of a TBA contract out to a later date by entering into an offsetting short position (referred to as a “pair off”), net settling the paired off positions for cash, and simultaneously purchasing a similar TBA contract for a later settlement date. The Company records such pair offs on a gross basis such that there is a sale of the original TBA and a subsequent purchase of a new TBA.
59
Investment Valuation
The Company has a pricing committee responsible for establishing valuation policies and procedures, and reviewing and approving valuations at a monthly pricing meeting. The pricing committee is composed of individuals from the accounting team, the investment team and senior management.
Agency RMBS, U.S. Agency Debentures and U.S. Treasuries are generally valued based on prices provided by third party services, as derived from such services’ pricing models. Inputs to the models may include, but are not limited to, reported trades, executable bid and asked prices, broker quotations, prices or yields of securities with similar characteristics, prepayment rates, benchmark curves or information pertaining to the issuer, as well as industry and economic events. The pricing services may also use a matrix approach, which considers information regarding securities with similar characteristics to determine the valuation for a security.
We generally value interest rate swaps and caps using prices provided by broker quotations. Such broker quotations are based on the present value of fixed and projected floating rate cash flows over the term of the swap contract. Future cash flows are discounted to their present value using swap rates provided by electronic data services or by brokers. No credit valuation adjustments were made in determining the fair value of the Company's interest rate swaps and caps.
The fair value of a long-lived asset, including real estate, is primarily derived internally, and is based on inputs observed from sales transactions of similar assets. We also rely on available industry information about capitalization rates and expected trends in rents and occupancy.
All valuations we receive from third-party pricing services or broker quotes are non-binding. We review all prices. To date, the Company has not adjusted any of the prices received from third party pricing services or brokers. Our pricing review includes comparisons of similar market transactions, alternative third party pricing services and broker quotes, or comparisons to a pricing model. To ensure the proper classification within the fair value hierarchy, the Company reviews the third party pricing services' methodology periodically to understand whether observable or unobservable inputs are being used. See Note 7, Fair Value Measurements, for a discussion of how the Company values its assets.
Interest Income
We record interest income and expense on an accrual basis. We accrue interest income based on the outstanding principal amount of the settled securities in our portfolio and their contractual terms. We amortize premium and discount using the effective interest method, and this net amortization is either accretive to or a reduction of interest income from Agency RMBS in the Company's consolidated statements of operations. The Company does not estimate prepayments when calculating the yield to maturity on Agency RMBS. We record the amount of premium or discount associated with a prepayment through interest income from Agency RMBS on our consolidated statements of operations as it occurs.
Repurchase Agreements
We finance our Agency RMBS and U.S. Treasuries using borrowings under repurchase agreements ("repurchase agreements" or "repo borrowings") with a diversified group of broker dealers and commercial and investment banks. Using repo borrowings, we are able to borrow against the value of our securities, and carry repo borrowings on our books at amortized cost, which approximates their fair market value given their short-term nature (generally 30-180 days). Our repo borrowings are accounted for as debt under GAAP and secured by the underlying assets. The cash we receive when we initially pledge the collateral is less than the value of that collateral, which is referred to as a "haircut." In a repo borrowing, we sell our assets to a counterparty and agree to repurchase the same assets from the counterparty at a price equal to the original sales price plus an interest factor. As a borrower, we are subject to margin calls from counterparties if the value of the collateral that we have posted has declined below the haircut level, which may occur due to prepayments of the mortgages underlying the Agency RMBS causing the face value of the securities to decline or when the value of collateral declines as a result of interest rate movements or spread widening. Conversely, the Company may require the counterparty to post collateral to it when the fair value of the collateral increases. Counterparties have the right to sell or repledge collateral pledged under repurchase agreements; however, they are required to return collateral that is the same or substantially the same to the original collateral. See Note 5, Repurchase Agreements.
Interest Rate Swap and Cap Contracts
The Company uses interest rate swaps and interest rate caps to manage its exposure to market risks, including interest rate risk. The objective of our interest rate risk management strategy is to reduce fluctuations in book value over a range of interest rate scenarios. In particular, the Company attempts to manage the risk of the cost of our variable rate liabilities increasing during a period of rising interest rates.
Historically, we have sought to enter into interest rate swap contracts structured such that we receive payments based on a variable interest rate and make payments based on a fixed interest rate. The variable interest rate on which payments are received is calculated based on various reset mechanisms for LIBOR. Additionally, we have entered into interest rate cap
60
contracts structured such that we receive payments based on a variable interest rate being above a fixed cap interest rate. The variable interest rate on which payments are received on interest rate caps is also calculated based on various reset mechanisms for LIBOR. Our interest rate swap and cap contracts effectively fix or cap a portion of our borrowing cost and are not held for speculative or trading purposes. When the Company terminates a swap or cap, it records a realized gain or loss equal to the difference between the proceeds from (or cost of) the closing transaction and the Company’s cost basis in the contract, if any. The Company reports the periodic payments and amortization of premiums on cap contracts under swap and cap interest expense in the consolidated statements of operations. Swaps involve a risk that interest rates will move contrary to the Company’s expectations, thereby increasing the Company’s payment obligation.
The Company's interest rate swap and cap contracts are subject to master netting arrangements. The Company is exposed to credit loss in the event of non-performance by the counterparty to the swap or cap limited to the fair value of collateral posted in excess of the fair value of the contract in a net liability position and the shortage of the fair value of collateral posted for the contract in a net asset position. As of December 31, 2014 and December 31, 2013, the Company did not anticipate non-performance by any counterparty. Should interest rates move unexpectedly, the Company may not achieve the anticipated benefits of the interest rate swap or cap and may realize a loss.
While the Company’s derivative contracts generally permit for netting or setting off derivative assets and liabilities with the counterparty, the Company reports related assets and liabilities on a gross basis in our consolidated balance sheets. Derivative instruments in a gain position are reported as derivative assets at fair value and derivative instruments in a loss position are reported as derivative liabilities at fair value in our consolidated balance sheets. The Company records changes in fair value of our derivative instruments in net unrealized gain (loss) on swap and cap contracts in our consolidated statements of operations. Cash receipts and payments related to derivative instruments are classified in the Company's consolidated statements of cash flows in accordance with GAAP in both the operating and investing activities sections in the Company’s consolidated statements of cash flows. See Note 4, Investments in Interest Rate Swap and Cap Contracts.
Income Taxes
The Company has elected to be treated as a REIT under the Code. The Company will generally not be subject to federal income tax to the extent that it distributes 90% of its taxable income, determined without regard to the deduction for dividends paid and excluding net capital gain; after application of available tax attributes, within the time limits prescribed by the Code and as long as it satisfies the ongoing REIT requirements including meeting certain asset, income and stock ownership tests.
Earnings Per Share (“EPS”)
The Company computes basic EPS using the two-class method by dividing net income (loss), after adjusting for the impact of unvested stock awards deemed to be participating securities, by the weighted-average number of common shares outstanding calculated excluding unvested stock awards. The Company computes diluted EPS by dividing net income (loss), after adjusting for the impact of unvested stock awards deemed to be participating securities, by the weighted-average number of common shares outstanding calculated excluding unvested stock awards, giving effect to common stock options and warrants, if they are not anti-dilutive. See Note 9, Earnings Per Share for EPS computations.
Recent Accounting Pronouncements
None.
3. INVESTMENTS IN SECURITIES
In accordance with the discontinuation of investment company accounting under ASC 946, the Company was required to add the available-for-sale disclosures into this note. Those disclosures include (i) the table disclosing the amortized cost, gross unrealized gains, gross unrealized losses and fair value of available-for-sale investments, (ii) the table showing the gross gains and gross losses upon the sale of available-for-sale securities, and (iii) the table disclosing the unamortized premium and unamortized discount on available-for-sale securities. See Note 2, Significant Accounting Policies for more information on the impacts of the discontinuation of ASC 946.
61
The available-for-sale portfolio consisted of the following as of December 31, 2014 and December 31, 2013 (in thousands):
December 31, 2014 | ||||||||||||||||
Asset Type | Amortized Cost | Gross Unrealized Loss | Gross Unrealized Gain | Fair Value | ||||||||||||
Fannie Mae Certificates | ||||||||||||||||
Fixed Rate | $ | 11,356,716 | $ | (2,984 | ) | $ | 158,571 | $ | 11,512,303 | |||||||
ARMs | 1,282,065 | (13,144 | ) | 4,449 | 1,273,370 | |||||||||||
Total Fannie Mae | 12,638,781 | (16,128 | ) | 163,020 | 12,785,673 | |||||||||||
Freddie Mac Certificates | ||||||||||||||||
Fixed Rate | 1,183,764 | — | 25,769 | 1,209,533 | ||||||||||||
ARMs | 394,726 | (6,753 | ) | 1,144 | 389,117 | |||||||||||
Total Freddie Mac | 1,578,490 | (6,753 | ) | 26,913 | 1,598,650 | |||||||||||
Ginnie Mae Certificates - ARMs | 66,390 | — | 1,743 | 68,133 | ||||||||||||
U.S. Treasuries | 149,585 | (534 | ) | — | 149,051 | |||||||||||
Other Investments | 6,945 | — | 1,080 | 8,025 | ||||||||||||
Total | $ | 14,440,191 | $ | (23,415 | ) | $ | 192,756 | $ | 14,609,532 | |||||||
December 31, 2013 | ||||||||||||||||
Fannie Mae Certificates | ||||||||||||||||
Fixed Rate | $ | 10,629,503 | $ | (72,295 | ) | $ | 45,660 | $ | 10,602,868 | |||||||
ARMs | 1,439,379 | (27,277 | ) | 2,796 | 1,414,898 | |||||||||||
Total Fannie Mae | 12,068,882 | (99,572 | ) | 48,456 | 12,017,766 | |||||||||||
Freddie Mac Certificates | ||||||||||||||||
Fixed Rate | 1,055,991 | (7,083 | ) | 6,231 | 1,055,139 | |||||||||||
ARMs | 554,395 | (15,701 | ) | 1,334 | 540,028 | |||||||||||
Total Freddie Mac | 1,610,386 | (22,784 | ) | 7,565 | 1,595,167 | |||||||||||
Ginnie Mae Certificates | ||||||||||||||||
Fixed Rate | 158,792 | (500 | ) | — | 158,292 | |||||||||||
ARMs | 85,211 | — | 2,412 | 87,623 | ||||||||||||
Total Ginnie Mae | 244,003 | (500 | ) | 2,412 | 245,915 | |||||||||||
Other Investments | 6,945 | — | — | 6,945 | ||||||||||||
Total | $ | 13,930,216 | $ | (122,856 | ) | $ | 58,433 | $ | 13,865,793 | |||||||
62
The following table presents the gross unrealized loss and fair values of the Company's available-for-sale Agency RMBS by length of time that such securities have been in a continuous unrealized loss position as of December 31, 2014 and December 31, 2013 (in thousands):
Unrealized loss positions for | ||||||||||||||||||||||||
Less than 12 Months | Greater than 12 months | Total | ||||||||||||||||||||||
As of | Fair value | Unrealized loss | Fair value | Unrealized loss | Fair value | Unrealized loss | ||||||||||||||||||
December 31, 2014 | $ | 259,291 | $ | (577 | ) | $ | 1,494,884 | $ | (22,838 | ) | $ | 1,754,175 | $ | (23,415 | ) | |||||||||
December 31, 2013 | $ | 8,415,016 | (107,019 | ) | 408,348 | (15,837 | ) | 8,823,364 | (122,856 | ) | ||||||||||||||
The following table is a summary of our net gain (loss) from the sale of available-for-sale investments for the year ended December 31, 2014 and 2013 (in thousands):
For the year ended December 31, | ||||||||
2014 | 2013 | |||||||
Available-for-sale investments, at cost | $ | 29,974,360 | $ | 48,891,667 | ||||
Proceeds from available-for-sale investments sold | 30,106,923 | 48,296,551 | ||||||
Net gain on sale of available-for-sale investments | 132,563 | (595,116 | ) | |||||
Gross gain on sale of available-for-sale investments | 187,583 | 180,594 | ||||||
Gross loss on sale of available-for-sale investments | (55,020 | ) | (775,710 | ) | ||||
Net gain on sale of available-for-sale investments | $ | 132,563 | $ | (595,116 | ) | |||
The components of the carrying value of available-for-sale securities at December 31, 2014 and December 31, 2013 are presented below. The premium purchase price is due to the average coupon interest rates on these investments being higher than prevailing market rates and, conversely, the discount purchase price is due to the average coupon interest rates on these investments being lower than prevailing market rates.
(in thousands) | December 31, 2014 | December 31, 2013 | ||||||
Principal balance | $ | 13,887,897 | $ | 13,581,742 | ||||
Unamortized premium | 552,869 | 351,476 | ||||||
Unamortized discount | (575 | ) | (3,002 | ) | ||||
Gross unrealized gains | 192,756 | 58,433 | ||||||
Gross unrealized losses | (23,415 | ) | (122,856 | ) | ||||
Fair value | $ | 14,609,532 | $ | 13,865,793 | ||||
As of December 31, 2014, the weighted-average coupon interest rate on the Company's Agency RMBS and U.S. Treasuries was 3.41% and 1.50%, respectively. As of December 31, 2013, the weighted-average coupon interest rate on the Company's Agency RMBS was 3.30%. Actual maturities of Agency RMBS are generally shorter than stated contractual maturities (which range up to 30 years), as they are affected by the contractual lives of the underlying mortgages, periodic payments and prepayments of principal. As of December 31, 2014, the range of final contractual maturity of the Company’s Agency RMBS portfolio was between 2024 and 2045. As of December 31, 2013, the range of final contractual maturity of the Company’s Agency RMBS portfolio was between 2024 and 2044. As of December 31, 2014, the weighted-average contractual maturity of the Company's Agency RMBS portfolio was 2036, and of its U.S. Treasuries was 2019. As of December 31, 2013 the weighted-average contractual maturity of our Agency RMBS portfolio was 2036.
Credit Risk
The Company has minimal exposure to credit losses on its investment securities assets at December 31, 2014 and December 31, 2013 because it owns principally Agency RMBS and U.S. Treasuries. Principal and interest payments on Agency RMBS are guaranteed by Freddie Mac and Fannie Mae, while principal and interest payments on Ginnie Mae RMBS and U.S. Treasuries are backed by the full faith and credit of the U.S. government. In September 2008, both Freddie Mac and Fannie Mae were placed in the conservatorship of the U.S. government. On August 5, 2011, Standard & Poor’s downgraded the U.S. government’s credit rating for the first time to AA+. Fitch Ratings Inc. ("Fitch") announced on October 15, 2013 that it had placed the U.S. government's credit rating on "negative watch"; this negative watch was changed to "stable" on March 21, 2014.
63
As of December 31, 2014, S&P has maintained its AA+ rating for the U.S. government, while Fitch and Moody's rated the U.S. government AAA and Aaa, respectively. Because Fannie Mae and Freddie Mac are in U.S. government conservatorship, the implied credit ratings of Agency RMBS were similarly rated. While the GSE conservatorship, ratings downgrade and ratings watch appear not to have had a significant impact on the fair value of the Agency RMBS or U.S. Treasuries in the Company’s portfolio, these developments raised concerns regarding the credit risk of Agency RMBS and U.S. Treasuries.
4. INVESTMENTS IN INTEREST RATE SWAP AND CAP CONTRACTS
In order to manage its interest rate exposure, the Company enters into interest rate swap and cap contracts. The Company had the following activity in interest rate swap and cap transactions during the years ended December 31, 2014 and 2013 (in thousands):
Year Ended December 31, 2014 | Year Ended December 31, 2013 | |||||||||||||
Trade Date | Transaction | Notional | Trade Date | Transaction | Notional | |||||||||
February 2014 | Terminated | $ | (500,000 | ) | February 2013 | Opened | $ | 1,500,000 | ||||||
April 2014 | Terminated | $ | (1,100,000 | ) | March 2013 | Terminated | (500,000 | ) | ||||||
April 2014 | Opened | $ | 500,000 | March 2013 | Opened | 1,200,000 | ||||||||
May 2014 | Terminated | $ | (300,000 | ) | April 2013 | Opened | 500,000 | |||||||
May 2014 | Opened | $ | 300,000 | May 2013 | Opened | 500,000 | ||||||||
June 2014 | Terminated | $ | (550,000 | ) | May 2013 | Matured | (100,000 | ) | ||||||
June 2014 | Opened | $ | 1,200,000 | June 2013 | Terminated | (700,000 | ) | |||||||
July 2014 | Opened | $ | 400,000 | June 2013 | Matured | (300,000 | ) | |||||||
October 2014 | Opened | $ | 500,000 | July 2013 | Matured | (300,000 | ) | |||||||
October 2014 | Terminated | $ | (500,000 | ) | August 2013 | Terminated | (2,200,000 | ) | ||||||
December 2014 | Opened | $ | 500,000 | August 2013 | Opened | 500,000 | ||||||||
December 2014 | Terminated | $ | (500,000 | ) | November 2013 | Terminated | (940,000 | ) | ||||||
Net Decrease | $ | (50,000 | ) | November 2013 | Opened | 500,000 | ||||||||
December 2013 | Terminated | (350,000 | ) | |||||||||||
Net Decrease | $ | (690,000 | ) | |||||||||||
As of December 31, 2014 and December 31, 2013, the Company pledged Agency RMBS and U.S. Treasuries with a fair value of $60.9 million and $63.0 million, respectively, as collateral on interest rate swap and cap contracts. As of December 31, 2014, the Company had pledged cash of $11.1 million as collateral for its interest rate swap and cap contracts, and none as of December 31, 2013. As of December 31, 2014, the Company had Agency RMBS and U.S. Treasuries of $47.2 million and cash of $72.0 million pledged to it as collateral for its interest rate swap and cap contracts. As of December 31, 2013, the Company had Agency RMBS and U.S. Treasuries of $211.4 million and cash of $37.9 million pledged to it as collateral for its interest rate swap and cap contracts. Below is a summary of our interest rate swap and cap contracts open as of December 31, 2014 and December 31, 2013 (in thousands):
Derivatives not designated as hedging instruments under ASC 815 | ||||||||||
Interest Rate Swap Contracts | Notional Amount | Fair Value | Consolidated Balance Sheets | |||||||
December 31, 2014 | $ | 2,600,000 | $ | (16,007 | ) | Derivative liabilities, at fair value | ||||
December 31, 2014 | 5,050,000 | 40,611 | Derivative assets, at fair value | |||||||
December 31, 2013 | 2,050,000 | (29,458 | ) | Derivative liabilities, at fair value | ||||||
December 31, 2013 | 4,250,000 | 61,004 | Derivative assets, at fair value | |||||||
Interest Rate Cap Contracts | Notional Amount | Fair Value | Consolidated Balance Sheets | |||||||
December 31, 2014 | $ | 2,500,000 | $ | 107,673 | Derivative assets, at fair value | |||||
December 31, 2013 | 3,900,000 | 234,703 | Derivative assets, at fair value | |||||||
64
The following table presents information about the net realized and unrealized gain and loss on swap and cap contracts for the years ended December 31, 2014, 2013 and 2012 on the Company's interest rate swap and cap contracts not designated as hedging instruments under ASC 815 (in thousands):
Gain (Loss) on Derivatives | ||||||||||||||
Year Ended December 31, | ||||||||||||||
Derivative Type | Location of Gain or (Loss) on Derivatives | 2014 | 2013 | 2012 | ||||||||||
Interest rate swaps and caps | Net realized gain (loss) on termination of swap and cap contracts | $ | (24,460 | ) | $ | 30,775 | $ | — | ||||||
Interest rate swaps and caps | Net unrealized gain (loss) on swap and cap contracts | (86,082 | ) | 238,353 | (21,990 | ) | ||||||||
Interest rate swaps and caps | Total recognized in income on derivatives | $ | (110,542 | ) | $ | 269,128 | $ | (21,990 | ) | |||||
5. REPURCHASE AGREEMENTS
The Company leverages its Agency RMBS and U.S. Treasuries through the use of repurchase agreements. Each of the borrowing vehicles used by the Company bears interest at floating rates based on a spread above or below LIBOR. The fair value of repurchase agreements approximates their carrying amount due to the short-term nature of these financial instruments.
Certain information with respect to the Company’s repurchase agreements is summarized in the following tables. Each of the borrowings listed is contractually due in one year or less (dollars in thousands).
December 31, 2014 | |||
Repurchase agreements | $ | 11,289,559 | |
Interest accrued thereon | $ | 5,334 | |
Weighted average borrowing rate | 0.35 | % | |
Weighted average remaining maturity (in days) | 28.2 | ||
Fair value of the collateral(1) | $ | 11,842,427 | |
December 31, 2013 | |||
Repurchase agreements | $ | 11,206,950 | |
Interest accrued thereon | $ | 7,204 | |
Weighted average borrowing rate | 0.41 | % | |
Weighted average remaining maturity (in days) | 39.9 | ||
Fair value of the collateral(1) | $ | 11,760,720 | |
(1) | Collateral for repo borrowings consisted of Debt Securities. |
At December 31, 2014 and 2013, the Company did not have any repurchase agreement borrowing where the amount at risk with an individual counterparty exceeded 1.6% and 2.3% of stockholders' equity, respectively. At December 31, 2014 and 2013, we had no repurchase agreement with any counterparty that exceeded 5.0% and 6.6% of our total borrowings, respectively.
6. PLEDGED ASSETS
Our repurchase agreements and derivative contracts require us to fully collateralize our obligations under the agreements based upon our counterparties' collateral requirements and their determination of the fair value of the securities pledged as collateral, which fluctuates with changes in interest rates, credit quality and liquidity conditions within the investment banking, mortgage finance and real estate industries. In addition, obligations under our derivative agreements will typically vary over time based on similar factors as well as the remaining term of the derivative contract.
Our repurchase agreement and derivative counterparties also apply a "haircut" to our pledged collateral which limits the amount we can borrow against our securities. This haircut reflects the underlying risk of the specific collateral and protects the counterparty against a change in its value. Our agreements do not specify the haircut; rather, haircuts are determined on an individual transaction basis, and typically are between 3% and 7%.
65
Consequently, the use of repurchase agreements and derivative instruments exposes us to credit risk relating to potential losses that could be recognized in the event that our counterparties fail to perform their obligations under such agreements. We minimize this risk by limiting our repurchase agreement and derivative counterparties to major financial institutions with acceptable credit ratings, or to a registered clearinghouse, and we closely monitor our positions with individual counterparties. In the event of a default by a counterparty, we may have difficulty obtaining our assets pledged as collateral to such counterparty and may not receive payments provided for under the terms of our derivative agreements. In the case of centrally cleared instruments, we could be exposed to credit risk if the central clearing agency or a clearing member defaults on its respective obligation to perform under the contract. However, we believe that this risk is minimal due to clearing exchange initial and daily mark-to-market margin requirements, clearinghouse guarantee funds, and other resources that are available in the event of a clearing member default.
Further, each of our International Standard Derivative Association (“ISDA”) agreements contains a cross default provision under which a default under certain of our other indebtedness in excess of a certain threshold causes an event of default under the agreement. Threshold amounts vary by lender. Following an event of default, we could be required to settle our obligations under the agreements. Additionally, under certain of our ISDA master agreements, we could be required to settle our obligations under the agreements if we fail to maintain certain minimum stockholders' equity thresholds or our REIT status or if we fail to comply with limits on our leverage above certain specified levels. As of December 31, 2014, the fair value of additional collateral that could be required to be posted as a result of the credit-risk-related contingent features being triggered was not material to our consolidated financial statements. As of December 31, 2014, our amount at risk with any counterparty related to our repurchase agreements was less than 1.6% of our stockholders' equity, and our amount at risk with any counterparty related to our interest rate swap and cap contracts, excluding centrally cleared swaps, was less than 2.0% of our stockholders' equity.
Our collateral is generally valued on the basis of prices provided by recognized bond market sources agreed to by the parties. Inputs to the models used by pricing sources may include, but are not necessarily limited to, reported trades, executable bid and asked prices, broker quotations, prices or yields of securities with similar characteristics, benchmark curves or information pertaining to the issuer, as well as industry and economic events. Our master repurchase agreements contain mostly standard provisions for the valuation of collateral. These agreements typically provide that both the repurchase seller (the borrower) and the repurchase buyer (the lender) value the collateral on a daily basis. Each party uses a price that it obtains from generally recognized pricing sources, or the most recent closing bid quotation from such a source. If the buyer, or the seller, as the case may be, determines that additional collateral is required, it may call for the delivery of such collateral. Under certain of our repurchase agreements, in limited circumstances, such as when a pricing source is not available, our lenders have the right to determine the value of the collateral we have provided to secure our repo borrowings. In instances where we have agreed to permit our lenders to make a determination of the value of such collateral, such lenders are expected to act reasonably and in good faith in making such valuation determinations.
Assets Pledged to Counterparties
The following tables summarize our assets pledged as collateral under our repurchase agreements and derivative contracts by type, including securities pledged related to securities purchased or sold but not yet settled, as of December 31, 2014 and December 31, 2013 (in thousands):
December 31, 2014 | ||||||||||||||||
Assets Pledged to Counterparties | Repurchase Agreements | Derivative Instruments | Forward Settling Trades (TBAs) | Total | ||||||||||||
Agency RMBS - fair value | $ | 11,697,532 | $ | 42,894 | $ | 1,453 | $ | 11,741,879 | ||||||||
U.S. Treasuries - fair value | 149,051 | 17,992 | — | 167,043 | ||||||||||||
Accrued interest on pledged securities | 31,475 | 168 | 3 | 31,646 | ||||||||||||
Cash | — | 11,104 | — | 11,104 | ||||||||||||
Total | $ | 11,878,058 | $ | 72,158 | $ | 1,456 | $ | 11,951,672 | ||||||||
66
December 31, 2013 | ||||||||||||||||
Assets Pledged to Counterparties | Repurchase Agreements | Derivative Instruments | Forward Settling Trades (TBAs) | Total | ||||||||||||
Agency RMBS - fair value | $ | 11,760,720 | $ | 30,988 | $ | 12,252 | $ | 11,803,960 | ||||||||
U.S. Treasuries - fair value | — | 32,015 | — | 32,015 | ||||||||||||
Accrued interest on pledged securities | 31,539 | 93 | 30 | 31,662 | ||||||||||||
Total | $ | 11,792,259 | $ | 63,096 | $ | 12,282 | $ | 11,867,637 | ||||||||
Assets Pledged from Counterparties
As the estimated fair value of our investment securities pledged as collateral increases due to changes in interest rates or other factors, we may require counterparties to release collateral back to us, which may be in the form of identical securities, similar securities, or cash. As of December 31, 2014 and December 31, 2013, we also had assets pledged to us as collateral under our repurchase agreements, derivative contracts and forward settling trades summarized in the tables below (in thousands):
December 31, 2014 | ||||||||||||||||
Assets Pledged to CYS | Repurchase Agreements | Derivative Instruments | Forward Settling Trades (TBAs) | Total | ||||||||||||
Agency RMBS - fair value | $ | 3,464 | $ | 22,112 | $ | 3,225 | $ | 28,801 | ||||||||
U.S. Treasuries - fair value | 692 | 25,115 | — | 25,807 | ||||||||||||
Accrued interest on pledged securities | 13 | 142 | 9 | 164 | ||||||||||||
Cash | — | 71,980 | 791 | 72,771 | ||||||||||||
Total | $ | 4,169 | $ | 119,349 | $ | 4,025 | $ | 127,543 | ||||||||
December 31, 2013 | ||||||||||||||||
Assets Pledged to CYS | Repurchase Agreements | Derivative Instruments | Forward Settling Trades (TBAs) | Total | ||||||||||||
Agency RMBS - fair value | $ | — | $ | 163,386 | $ | — | $ | 163,386 | ||||||||
U.S. Treasuries - fair value | — | 48,036 | — | 48,036 | ||||||||||||
Accrued interest on pledged securities | — | 542 | — | 542 | ||||||||||||
Cash | — | 37,938 | — | 37,938 | ||||||||||||
Total | $ | — | $ | 249,902 | $ | — | $ | 249,902 | ||||||||
Cash collateral received is recognized in "Cash" with a corresponding amount recognized in "Payable for cash received as collateral" on the accompanying consolidated balance sheets. Securities collateral received from counterparties is disclosed as a component of our liquidity amount in Note 4, Investment in Interest Rate Swap and Cap Contracts.
Cash and Agency RMBS and U.S. Treasuries we pledge as collateral under our derivative contracts are included in "Receivable for cash pledged as collateral" and "Investment in securities, at fair value", respectively, in our consolidated balance sheets.
Offsetting Assets and Liabilities
Certain of our repurchase agreements and derivative transactions are governed by underlying agreements that generally provide for a right of set-off under master netting arrangements (or similar agreements), including in the event of default or in the event of bankruptcy of either party to the transactions. Under GAAP, if the Company has a valid right of set-off, it may offset the related asset and liability and report the net amount. However, the Company reports amounts subject to its Master Repurchase Agreements (“MRA”) and ISDA agreements in the consolidated balance sheets on a gross basis without regard for such rights of offset.
67
At December 31, 2014 and December 31, 2013, the Company's derivative assets and liabilities (by type) are as follows (in thousands):
December 31, 2014 | Assets | Liabilities | ||||||
Interest rate swap contracts | $ | 40,611 | $ | 16,007 | ||||
Interest rate cap contracts | 107,673 | — | ||||||
Total derivative assets and liabilities in the consolidated balance sheet | 148,284 | 16,007 | ||||||
Derivatives not subject to a master netting agreement or similar agreement ("MNA") | 7,008 | 11,579 | ||||||
Total assets and liabilities subject to a MNA | $ | 141,276 | $ | 4,428 | ||||
December 31, 2013 | Assets | Liabilities | ||||||
Interest rate swap contracts | $ | 61,004 | $ | 29,458 | ||||
Interest rate cap contracts | 234,703 | — | ||||||
Total derivative assets and liabilities in the consolidated balance sheet | 295,707 | 29,458 | ||||||
Derivatives not subject to a MNA | 11,188 | 440 | ||||||
Total assets and liabilities subject to a MNA | $ | 284,519 | $ | 29,018 | ||||
Below is a summary of the Company's assets subject to offsetting provisions (in thousands):
Gross Amounts Not Offset in the Consolidated Balance Sheet | ||||||||||||||||||
As of | Description | Amounts of Assets Presented in the Consolidated Balance Sheet | Instruments Available for Offset | Collateral Received(1) | Net Amount(2) | |||||||||||||
December 31, 2014 | Derivative assets | $ | 141,276 | $ | 4,341 | $ | 117,991 | $ | 18,944 | |||||||||
December 31, 2013 | Derivative assets | 284,519 | 9,237 | 244,721 | 30,561 | |||||||||||||
_________________
(1) | Collateral consists of Agency RMBS, U.S. Treasuries and cash. Excess collateral received is not shown for financial reporting purposes. |
(2) | Net amount represents the net amount receivable from the counterparty in the event of the counterparty's default. |
Below is a summary of the Company's liabilities subject to offsetting provisions (in thousands):
Gross Amounts Not Offset in the Consolidated Balance Sheet | ||||||||||||||||||
As of | Description | Amounts of Liabilities Presented in the Consolidated Balance Sheet | Instruments Available for Offset | Collateral Pledged(1) | Net Amount(2) | |||||||||||||
December 31, 2014 | Derivative liabilities | $ | 4,428 | $ | 4,341 | $ | 87 | $ | — | |||||||||
December 31, 2014 | Repurchase agreements | 11,289,559 | — | 11,289,559 | — | |||||||||||||
December 31, 2013 | Derivative liabilities | 29,018 | 9,237 | 19,781 | — | |||||||||||||
December 31, 2013 | Repurchase agreements | 11,206,950 | — | 11,206,950 | — | |||||||||||||
_________________
(1) | Collateral consists of Agency RMBS, U.S. Treasuries and cash. Further detail of collateral pledged on repo borrowings is disclosed in Note 5, Repurchase Agreements. Excess collateral pledged is not shown for financial reporting purposes. |
(2) | Net amount represents the net amount payable to the counterparty in the event of the either party's default. |
7. FAIR VALUE MEASUREMENTS
The Company’s valuation techniques are based on observable and unobservable inputs. Observable inputs reflect readily obtainable data from independent sources, while unobservable inputs reflect the Company’s market assumptions. ASC 820 -- Fair Value Measurements, classifies these inputs into the following hierarchy:
Level 1 Inputs—Quoted prices for identical instruments in active markets.
68
Level 2 Inputs—Quoted prices for similar instruments in active markets; quoted prices for identical or similar instruments in markets that are not active; and model-derived valuations whose inputs are observable or whose significant value drivers are observable.
Level 3 Inputs—Instruments with primarily unobservable value drivers.
Excluded from the tables below are financial instruments carried in our consolidated financial statements at cost basis, which is deemed to approximate fair value, primarily due to the short duration of these instruments, including cash, receivables, payables and repo borrowings with initial terms of one year or less. The fair value of these instruments is determined using Level 2 Inputs. The following tables provide a summary of the Company’s assets and liabilities that are measured at fair value on a recurring basis as of December 31, 2014 and December 31, 2013 (in thousands):
December 31, 2014 | Fair Value Measurements Using | ||||||||||||||
Level 1 | Level 2 | Level 3 | Total | ||||||||||||
Assets | |||||||||||||||
Agency RMBS | $ | — | $ | 14,452,456 | $ | — | $ | 14,452,456 | |||||||
U.S. Treasuries | 149,051 | — | — | 149,051 | |||||||||||
Other Investments | — | — | 8,025 | 8,025 | |||||||||||
Derivative assets | — | 148,284 | — | 148,284 | |||||||||||
Total | $ | 149,051 | $ | 14,600,740 | $ | 8,025 | $ | 14,757,816 | |||||||
Liabilities | |||||||||||||||
Derivative liabilities | $ | — | $ | 16,007 | $ | — | $ | 16,007 | |||||||
December 31, 2013 | Fair Value Measurements Using | ||||||||||||||
Level 1 | Level 2 | Level 3 | Total | ||||||||||||
Assets | |||||||||||||||
Agency RMBS | $ | — | $ | 13,858,848 | $ | — | $ | 13,858,848 | |||||||
Other investments | — | — | 6,945 | 6,945 | |||||||||||
Derivative assets | — | 295,707 | — | 295,707 | |||||||||||
Total | $ | — | $ | 14,154,555 | $ | 6,945 | $ | 14,161,500 | |||||||
Liabilities | |||||||||||||||
Derivative liabilities | $ | — | $ | 29,458 | $ | — | $ | 29,458 | |||||||
Other investments is comprised of real estate assets as of December 31, 2014 and December 31, 2013. The table below presents a reconciliation of changes in other investments classified as Level 3 in the Company’s consolidated financial statements for the years ended December 31, 2014 and 2013:
Level 3 Fair Value Reconciliation
(In thousands) | Year Ended December 31, | ||||||
Other investments | 2014 | 2013 | |||||
Beginning balance Level 3 assets | $ | 6,945 | $ | 19,576 | |||
Cash payments recorded as a reduction of cost basis | — | (324 | ) | ||||
Change in net unrealized gain (loss) | 1,080 | (6,721 | ) | ||||
Gross purchases | — | — | |||||
Gross sales | — | (12,005 | ) | ||||
Net gain (loss) on sales | — | 6,419 | |||||
Transfers into (out of) Level 3 | — | — | |||||
Ending balance Level 3 assets | $ | 8,025 | $ | 6,945 | |||
The fair value of a real estate asset is primarily derived internally, and is based on inputs observed from sales transactions of similar assets. We also rely on available industry information about capitalization rates and expected trends in rents and occupancy. A discussion of the method of fair valuing these assets is included above in Note 2, Significant Accounting Policies — Investments in Securities — Investment Valuation. The significant unobservable input used in the fair
69
value measurement is capitalization rates, which the Company estimated to be between 3% and 6% at December 31, 2014 and December 31, 2013.
8. SHARE CAPITAL
The Company has authorized 500,000,000 shares of common stock having par value of $0.01 per share. As of December 31, 2014 and 2013, the Company had issued and outstanding 161,849,878 and 161,650,114 shares of common stock, respectively.
The Company has authorized 50,000,000 shares of preferred stock having a par value of $0.01 per share. As of December 31, 2014 and 2013, 3,000,000 shares of 7.75% Series A Preferred Stock ($25.00 liquidation preference) were issued and outstanding. As of December 31, 2014, 8,000,000 shares of 7.50% Series B Preferred Stock ($25.00 liquidation preference) were issued and outstanding. The Series A Preferred Stock and Series B Preferred Stock will not be redeemable before August 3, 2017 and April 30, 2018, respectively, except under circumstances where it is necessary to preserve the Company's qualification as a REIT, for federal income tax purposes or the occurrence of a change of control. On or after August 3, 2017 and April 30, 2018, respectively, the Company may, at its option, redeem any or all of the shares of the Series A Preferred Stock and Series B Preferred Stock, respectively, at $25.00 per share plus any accumulated and unpaid dividends to, but not including, the respective redemption date. The Series A Preferred Stock and Series B Preferred Stock have no stated maturity, and are not subject to any sinking fund or mandatory redemption.
The Company’s common and preferred stock transactions during the year ended December 31, 2014 and 2013 are as follows (in thousands):
Year Ended December 31, 2014 | Year Ended December 31, 2013 | ||||||||||||
Common stock | Shares | Amount | Shares | Amount | |||||||||
Common shares sold in public offerings or issued as restricted common stock | 439 | $ | — | 365 | $ | 3,279 | |||||||
Shares repurchased or canceled | (240 | ) | (1,952 | ) | (13,639 | ) | (116,095 | ) | |||||
Net increase | 199 | $ | (1,952 | ) | (13,274 | ) | $ | (112,816 | ) | ||||
Series B Preferred stock | |||||||||||||
Preferred shares sold in public offerings | — | $ | — | 8,000 | $ | 193,531 | |||||||
Equity Offerings
On February 1, 2012, the Company closed a public offering of 28,750,000 shares of its common stock at a public offering price of $13.28 per share for total net proceeds of approximately $377.3 million, after the underwriting discount and commissions and expenses.
On July 16, 2012, the Company closed a public offering of 46,000,000 shares of its common stock at a public offering price of $13.70 per share for total net proceeds of approximately $622.2 million, after the underwriting discount and commissions and expenses.
On August 3, 2012, the Company closed a public offering of 3,000,000 shares of its Series A Preferred Stock, liquidation preference of $25.00 per share, for total net proceeds of approximately $72.4 million, after the underwriting discount and commissions and expenses.
On April 30, 2013, the Company closed a public offering of 8,000,000 shares of its Series B Preferred Stock, liquidation preference of $25.00 per share, for total net proceeds of approximately $193.6 million, after the underwriting discount and commissions and expenses.
Dividend Reinvestment and Direct Stock Purchase Plan (“DSPP”)
The Company sponsors a dividend reinvestment and direct stock purchase plan through which stockholders may purchase additional shares of common stock by reinvesting some or all of the cash dividends received on shares of common stock. Stockholders may also make optional cash purchases of shares of common stock subject to certain limitations detailed in the plan prospectus. For the years ended December 31, 2014 and 2013 the Company did not issue any shares under the DSPP. As of December 31, 2014 and 2013, there were approximately 4.1 million shares, respectively, available for issuance under this plan.
Restricted Common Stock Awards
See Note 11, Stock Options and Restricted Common Stock, for a summary of restricted common stock granted to certain its directors, officers and employees for the years ended December 31, 2014, 2013 and 2012.
70
Equity Placement Program (“EPP”)
Effective May 15, 2014, the Company terminated that certain Equity Distribution Agreement by and between the Company and JMP Securities LLC (“JMP”), dated as of June 7, 2011 (the “JMP Agreement”), in connection with the expiration of the Company’s prior shelf registration statement on Form S-3. Under the JMP Agreement, the Company could offer and sell, from time to time, up to 15.0 million shares of the Company’s common stock through an “at the market” offering program with JMP. For the year ended December 31, 2014 and 2013, the Company did not sell any shares of common stock under the JMP Agreement.
Share Repurchase Program
On November 15, 2012, the Company announced that its Board of Directors authorized the repurchase of shares of the Company’s common stock having an aggregate value of up to $250 million. Pursuant to this program, through July 20, 2014, the Company repurchased approximately $115.7 million in aggregate value of its shares of common stock on the open market. On July 21, 2014, the Company announced that its Board of Directors authorized the repurchase of shares of the Company's common stock having an aggregate value of up to $250 million, which included the approximately $134.3 million available for repurchase under the November 2012 authorization. In the fourth quarter of 2014, we repurchased 132,749 shares at a weighted-average purchase price of $8.88, for an aggregate of approximately $1.18 million, and in the third quarter of 2014 repurchased 39,800 shares at a weighted-average purchase price of $8.86, for an aggregate of approximately $0.35 million. Accordingly, the Company still had approximately $248.5 million authorized to repurchase shares of its common stock as of December 31, 2014.
9. EARNINGS PER SHARE
Components of the computation of basic and diluted EPS under the two-class method were as follows (in thousands, except per share numbers):
Year Ended December 31, | |||||||||||
2014 | 2013 | 2012 | |||||||||
Net income (loss) | $ | 425,609 | $ | (475,782 | ) | $ | 372,787 | ||||
Less dividend on preferred shares | (20,812 | ) | (15,854 | ) | (2,405 | ) | |||||
Net income (loss) available to common stockholders | 404,797 | (491,636 | ) | 370,382 | |||||||
Less dividends paid: | |||||||||||
Common shares | (199,647 | ) | (221,957 | ) | (355,548 | ) | |||||
Unvested shares | (1,200 | ) | (1,128 | ) | (1,640 | ) | |||||
Undistributed earnings (loss) | $ | 203,950 | $ | (714,721 | ) | $ | 13,194 | ||||
Basic weighted average shares outstanding: | |||||||||||
Common shares | 160,991 | 169,967 | 139,651 | ||||||||
Basic earnings (loss) per common share: | |||||||||||
Distributed earnings | $ | 1.24 | $ | 1.31 | $ | 2.55 | |||||
Undistributed earnings | 1.26 | (4.21 | ) | 0.09 | |||||||
Basic earnings (loss) per common share | $ | 2.50 | $ | (2.90 | ) | $ | 2.64 | ||||
Diluted weighted average shares outstanding: | |||||||||||
Common shares | 160,991 | 169,967 | 139,651 | ||||||||
Net effect of dilutive warrants (1) | — | — | — | ||||||||
160,991 | 169,967 | 139,651 | |||||||||
Diluted earnings (loss) per common share: | |||||||||||
Distributed earnings | $ | 1.24 | $ | 1.31 | $ | 2.55 | |||||
Undistributed earnings | 1.26 | (4.21 | ) | 0.09 | |||||||
Diluted earnings (loss) per common share | $ | 2.50 | $ | (2.90 | ) | $ | 2.64 | ||||
__________________
(1) | For the years ended December 31, 2014, 2013 and 2012, the Company had an aggregate of 131 stock options outstanding with a weighted average exercise price of $30.00 that were not included in the calculation of EPS, as their inclusion would have been anti-dilutive. These instruments may have a dilutive impact on future EPS. |
71
10. INCENTIVE COMPENSATION PLANS
The Company has adopted Incentive Compensation Plans in 2014 ("2014 Plan"), 2013 ("2013 Plan"), 2012 ("2012 Plan") and 2011 ("2011 Plan") (collective, the "Bonus Plans"). Pursuant to the Bonus Plans the Company pays discretionary bonus awards (“Bonus Awards”) to eligible employees. The amount of each employee’s Bonus Award is calculated at the discretion of the Compensation Committee of the board of directors (the “Compensation Committee”) after consideration of the Company’s performance and the employee’s bonus target and performance for the applicable fiscal year. The Compensation Committee has discretion to determine the total amount to be awarded, and, subject to certain restrictions under the Bonus Plans, it also has discretion to determine what portion of each award will be paid in cash and what portion of each award will be paid in shares of restricted common stock of the Company. As of December 31, 2014 the Company had 8,039,664 shares remaining under the Bonus Plans.
For the year ended December 31, 2014, the Compensation Committee elected to award the Company’s employees an aggregate of $7.9 million in Bonus Awards under the 2014 Plan. Approximately $4.4 million of the aggregate Bonus Award amount was accrued during the fiscal year ended December 31, 2014. The remaining $3.5 million will be paid in shares of restricted common stock to be granted in 2015, with $3.2 million and $0.3 million vesting over a five-year and three-year period, respectively.
For the year ended December 31, 2013, the Compensation Committee elected to award the Company’s employees an aggregate of $7.3 million in Bonus Awards under the 2013 Plan. Approximately $4.1 million of the aggregate Bonus Award amount was accrued during the fiscal year ended December 31, 2013. The remaining $3.2 million was paid in shares of restricted common stock granted in 2014, with $2.9 million and $0.3 million vesting over a five-year and three-year period, respectively.
For the year ended December 31, 2012, the Compensation Committee elected to award the Company’s employees an aggregate of $8.5 million in Bonus Awards under the 2012 Plan. Approximately $4.6 million of the aggregate Bonus Award amount was paid in cash in 2012 and was accrued during the fiscal year ended December 31, 2012. The remaining $3.9 million was paid in shares of restricted common stock granted in 2013, with $3.7 million and $0.2 million vesting over a five year and three year period, respectively.
11. STOCK OPTIONS AND RESTRICTED COMMON STOCK
On May 10, 2013, the Company's stockholders approved the 2013 Equity Incentive Plan (the "Equity Incentive Plan") that provides for the grant of non-qualified common stock options, stock appreciation rights, restricted common stock and other share based awards. As of December 31, 2014 the Company has only granted restricted common stock pursuant to the Equity Inventive Plan. The Compensation Committee administers the Equity Incentive Plan. Awards under the Equity Incentive Plan may be granted to the Company’s directors, executive officers and employees and other service providers.
The Equity Incentive Plan authorizes a total of 8,500,000 shares that may be used to satisfy awards under the plan. As of December 31, 2014 and December 31, 2013, the remaining shares to be granted under the Equity Incentive Plan were 8,039,664 and 8,474,198, respectively.
Prior to May 10, 2013, the Company had a stock incentive plan (the “2006 Stock Incentive Plan”) in place that provided for the grant of non-qualified common stock options, stock appreciation rights, restricted common stock and other share based awards. Following stockholder approval of the Equity Incentive Plan, the Company could no longer make awards under the 2006 Stock Incentive Plan. Under the 2006 Stock Incentive Plan, the Company only granted qualified common stock options and restricted common stock. The Compensation Committee administered the plan. Awards under the 2006 Stock Incentive Plan were granted to the Company’s directors, executive officers and employees and other service providers.
Restricted common stock granted to non-employee directors prior to January 1, 2014 vests over a one-year period. Effective January 1, 2014, all restricted common stock granted to non-employee directors, including the restricted common stock granted on January 2, 2014, vested at the end of the quarter in which it was granted. A description of the vesting schedules for restricted common stock granted to the Company's executive officers and employees is included in Note 10, Incentive Compensation Plan. The following table summarizes restricted common stock transactions for the years ended December 31, 2014, 2013 and 2012:
72
Years ended December 31, 2012, 2013 and 2014 | Officers and Employees(1) | Directors | Total | ||||||
Unvested Restricted Common Stock as of December 31, 2011 | 544,670 | 28,446 | 573,116 | ||||||
Granted (Weighted average grant date fair value $13.38) | 181,618 | 31,668 | 213,286 | ||||||
Canceled/Forfeited | (38,387 | ) | — | (38,387 | ) | ||||
Vested | (113,781 | ) | (28,446 | ) | (142,227 | ) | |||
Unvested Restricted Common Stock as of December 31, 2012 | 574,120 | 31,668 | 605,788 | ||||||
Granted (Weighted average grant date fair value $11.91) | 319,979 | 44,765 | 364,744 | ||||||
Canceled/Forfeited | (39,034 | ) | — | (39,034 | ) | ||||
Vested | (135,438 | ) | (31,668 | ) | (167,106 | ) | |||
Unvested Restricted Common Stock as of December 31, 2013 | 719,627 | 44,765 | 764,392 | ||||||
Granted (Weighted average grant date fair value $8.54) | 374,634 | 64,781 | 439,415 | ||||||
Canceled/Forfeited | (67,102 | ) | — | (67,102 | ) | ||||
Vested | (206,360 | ) | (90,244 | ) | (296,604 | ) | |||
Unvested Restricted Common Stock as of December 31, 2014 | 820,799 | 19,302 | 840,101 | ||||||
______________
(1) | Include grants to the Company’s executive officers and certain officers and employees of its external manager prior to September 1, 2011. |
Unrecognized compensation cost related to unvested restricted common stock granted as of December 31, 2014 and 2013 was $7.0 million and $8.0 million, respectively, assuming no forfeitures due to the small number of employees and historical employee attrition. The total fair value of restricted common stock awards vested during the years ended December 31, 2014, 2013 and 2012 were $3.0 million, $1.8 million and $2.3 million, respectively, based upon the fair market value of the Company’s common stock on the grant date.
There were no common stock options granted during the years ended December 31, 2014, 2013 and 2012. As of December 31, 2014 and 2013, there were 131,088 options outstanding, all of which were vested and exercisable, with a weighted average exercise price of $30.00, expiration date of February 2016 and fair value of $0.00 per option.
The components of share-based compensation expense for each period were as follows (in thousands):
Year ended December 31, | ||||||||||||
2014 | 2013 | 2012 | ||||||||||
Restricted shares granted to officers and employees(1) | $ | 3,811 | $ | 3,024 | $ | 2,440 | ||||||
Restricted shares granted to certain directors | 703 | 447 | 394 | |||||||||
Total shared based compensation expense | $ | 4,514 | $ | 3,471 | $ | 2,834 | ||||||
_________
(1) | Includes grants to certain officers and employees of the Company’s external manager prior to September 1, 2011. |
12. INCOME TAXES
The Company has elected to be taxed as a REIT under Section 856 of the Code and intends to continue to comply with the provisions of the Code. As a REIT, the Company generally is not subject to federal or state income tax. To maintain its qualification as a REIT, the Company must distribute at least 90% of its REIT taxable income to its stockholders each year and meet certain other tests relating to assets and income. If the Company fails to qualify as a REIT in any taxable year, the Company will be subject to federal income tax on its taxable income at regular corporate rates. The Company may also be subject to certain state and local taxes. Under certain circumstances, even though the Company qualifies as a REIT, federal income and excise taxes may be due on its undistributed taxable income. No provision for income taxes has been provided in the accompanying financial statements because the Company, as a REIT, is not subject to federal or state taxation because it has paid or will pay dividends in amounts that exceed at least 90% of its current year taxable income.
Book to tax differences primarily relate to amortization of realized losses on the termination of swap contracts, share- based compensation expense, and unrealized gain (loss) on investments and interest rate swaps and caps.
The per share tax character of the common, Series A Preferred Stock and Series B Preferred Stock distributions declared to stockholders in 2014 of $1.24, $1.9375 and $1.875, respectively, is estimated to be all ordinary income to the Company's common and preferred stockholders.
73
The estimated federal tax cost and the tax basis components of distributable earnings were as follows (in thousands):
As of December 31, 2014 | ||||
Cost of investments | $ | 14,440,191 | ||
Gross gain | $ | 192,756 | ||
Gross loss | (23,415 | ) | ||
Net unrealized gain (loss) | $ | 169,341 | ||
Undistributed ordinary income | $ | — | ||
Capital loss carryforwards | $ | 469,912 | ||
As of December 31, 2014, the Company's estimated capital loss carryforwards available to offset future realized gains are subject to current and future limitations in accordance with Internal Revenue Code section 382 and expire as follows (in thousands):
December 31, 2018 | 469,912 | |||
Total | $ | 469,912 | ||
As of December 31, 2014 and 2013, the Company had no undistributed taxable income. Tax years from 2010 through 2014 remain open to examination by U.S. federal, state and local, or non-U.S. tax jurisdictions. No income tax provision was recorded for the Company’s open tax years.
13. COMMITMENTS AND CONTINGENCIES
The Company has leased office space for which the term expires on June 30, 2016. The lease has been classified as an operating lease. The rental expense for the year ended December 31, 2014, 2013 and 2012 was $0.3 million, $0.4 million and $0.4 million, respectively. Under this agreement, annual rental payments will be as follows throughout the term of the lease for the years ending December 31 (in thousands):
2015 | 262 | |||
2016 | 131 | |||
$ | 393 | |||
The Company enters into certain contracts that contain a variety of indemnifications, principally with broker dealers. As of December 31, 2014, 2013 and 2012, no claims have been asserted under these indemnification agreements. Accordingly, the Company has no liabilities recorded for these agreements as of December 31, 2014, 2013, and 2012.
14. FINANCIAL INSTRUMENTS WITH OFF-BALANCE SHEET RISK OR CONCENTRATIONS OF CREDIT RISK
In the normal course of its business, the Company trades various financial instruments and enters into various investment activities with off-balance sheet risk, including interest rate swap and cap contracts. These financial instruments contain varying degrees of off-balance sheet risk whereby losses resulting from changes in the fair values of the securities underlying the financial instruments or the Company’s obligations thereunder may ultimately exceed the amount recognized in the statement of assets and liabilities.
The notional amounts of the swap and cap contracts do not represent the Company’s risk of loss due to counterparty nonperformance. The Company’s exposure to credit risk associated with counterparty nonperformance on swap or cap contracts is limited to the difference between the fair value of the swap or cap, plus any accrued interest, minus the fair value of collateral pledge plus any accrued interest. The Company is also subject to credit risk associated with counterparty non- performance on repurchase agreements. The Company’s exposure to credit risk associated with counterparty nonperformance on repurchase agreements is limited to the difference between the borrowings under repurchase agreements plus any accrued interest, minus the fair value of collateral pledge plus any accrued interest. Any counterparty nonperformance of these transactions is not expected to have a material effect on the Company’s financial condition.
The Company’s investments are primarily concentrated in securities that pass through collections of principal and interest from underlying mortgages, and there is a risk that some borrowers on the underlying mortgages will default. Therefore, mortgage-backed securities may bear some exposure to credit losses. However, the Company manages credit risk by primarily holding securities that are either guaranteed by government (or government-sponsored) agencies.
74
The Company bears certain other risks typical in investing in a portfolio of mortgage-backed securities. The principal risks potentially affecting the Company’s financial position, results of operations and cash flows include the risks that: (i) interest rate changes can negatively affect the fair value of the Company’s mortgage-backed securities, (ii) interest rate changes can influence borrowers’ decisions to prepay the mortgages underlying the securities, which can negatively affect both cash flows from, and the fair value of, the securities, and (iii) adverse changes in the fair value of the Company’s mortgage-backed securities and/or the inability of the Company to renew repo borrowings can result in the need to sell securities at inopportune times and incur realized losses.
The Company enters into derivative transactions with counterparties as hedges of interest rate exposure and in the course of investing. In the event of nonperformance by a counterparty, the Company is potentially exposed to losses, although the counterparties to these agreements are primarily major financial institutions with investment grade ratings.
The Company is subject to interest rate risk. Generally, the value of fixed income securities will change inversely with changes in interest rates. As interest rates rise, the market value of fixed income securities tends to decrease. Conversely, as interest rates fall, the market value of fixed income securities tends to increase.
The Company’s principal trading activities are primarily with brokers and other financial institutions located in North America. All securities transactions of the Company are cleared by multiple major securities firms pursuant to customer agreements. At December 31, 2014 and 2013, substantially all the investments in securities and receivable for securities sold are positions with and amounts due from these brokers. The Company had substantially all of its individual counterparty concentrations with these brokers and their affiliates.
15. INVESTMENT COMPANY ACCOUNTING DISCLOSURES
The information in the tables below was required under investment company accounting for which the Company ceased to meet the criteria on January 1, 2014. However, as of December 31, 2013, the Company used investment company financial statement presentation under ASC 946 and the following schedules have been included to comply with ASC 946. See Note 2, Significant Accounting Policies, for more information.
SCHEDULE OF INVESTMENTS DECEMBER 31, 2013 INVESTMENTS IN SECURITIES – UNITED STATES OF AMERICA | |||||||
(in thousands) | Face Amount | Fair Value | |||||
Fixed Income Securities - 784.0% (c) | |||||||
Mortgage Pass-Through Agency RMBS - 783.6% (c) | |||||||
Fannie Mae Pools - 679.5% (c) | |||||||
2.14%, due 2/1/2043 (a)(b) | $ | 87,600 | $ | 87,892 | |||
2.15%, due 10/1/2042 (a)(b) | 40,103 | 40,356 | |||||
2.18%, due 11/1/2042 (a)(b) | 29,015 | 29,160 | |||||
2.25%, due 10/1/2042 - 11/1/2042 (a)(b) | 84,755 | 85,399 | |||||
2.33%, due 11/1/2042 (a)(b) | 63,251 | 64,029 | |||||
2.36%, due 1/1/2043 (a)(b) | 83,235 | 84,181 | |||||
2.40%, due 9/1/2042 - 10/1/2042 (a)(b) | 51,272 | 51,974 | |||||
2.41%, due 11/1/2042 (a)(b) | 62,378 | 63,235 | |||||
2.42%, due 9/1/2042 (a)(b) | 19,388 | 19,677 | |||||
2.43%, due 7/1/2042 - 1/1/2043 (a)(b) | 215,819 | 219,176 | |||||
2.44%, due 6/1/2042 (a)(b) | 45,301 | 46,050 | |||||
2.50%, due 10/1/2042 (a)(b) | 76,110 | 77,442 | |||||
2.52%, due 10/1/2042 (a)(b) | 45,306 | 46,099 | |||||
2.57%, due 8/1/2042 (a)(b) | 29,496 | 30,079 | |||||
2.60%, due 4/1/2042 (a)(b) | 31,018 | 31,707 | |||||
2.70%, due 6/1/2042 (a)(b) | 55,666 | 57,043 | |||||
2.78%, due 4/1/2042 (a)(b) | 133,381 | 137,323 | |||||
2.80%, due 2/1/2042 - 4/1/2042 (a)(b) | 84,553 | 87,096 | |||||
2.81%, due 2/1/2042 (a)(b) | 25,550 | 26,361 | |||||
2.84%, due 12/1/2041 (a)(b) | 43,963 | 45,398 | |||||
75
SCHEDULE OF INVESTMENTS DECEMBER 31, 2013 INVESTMENTS IN SECURITIES – UNITED STATES OF AMERICA | |||||||
(in thousands) | Face Amount | Fair Value | |||||
3.00%, due 2/1/2027 - 2/1/2029 (a) | 4,839,617 | 4,943,083 | |||||
3.00%, due 12/1/2037 (a) | 51,087 | 48,558 | |||||
3.00%, due 10/1/2042 (a) | 42,107 | 39,556 | |||||
3.05%, due 9/1/2041 (a)(b) | 28,001 | 28,987 | |||||
3.24%, due 3/1/2041 (a)(b) | 11,485 | 11,969 | |||||
3.37%, due 5/1/2041 - 8/1/2041 (a)(b) | 34,796 | 36,423 | |||||
3.50%, due 12/1/2025 - 1/1/2029 (a) | 948,463 | 992,515 | |||||
3.50%, due 6/1/2042 - 9/1/2043 (a) | 1,872,351 | 1,862,400 | |||||
3.97%, due 9/1/2039 (a)(b) | 7,363 | 7,842 | |||||
4.00%, due 1/1/2026 - 4/1/2026 (a) | 229,778 | 243,561 | |||||
4.00%, due 7/1/2043 - 2/1/2044 (a) | 2,106,542 | 2,169,411 | |||||
4.50%, due 4/1/2030 - 11/1/2030 (a) | 84,730 | 90,796 | |||||
4.50%, due 11/1/2041 (a) | 200,955 | 212,988 | |||||
Total Fannie Mae Pools | 11,764,435 | 12,017,766 | |||||
Freddie Mac Pools - 90.2% (c) | |||||||
2.20%, due 2/1/2043 (a)(b) | $ | 28,154 | $ | 28,175 | |||
2.22%, due 12/1/2042 (a)(b) | 42,719 | 42,887 | |||||
2.30%, due 11/1/2042 (a)(b) | 88,989 | 89,526 | |||||
2.43%, due 6/1/2042 (a)(b) | $ | 34,581 | $ | 35,224 | |||
2.44%, due 4/1/2043 (a)(b) | 29,699 | 29,220 | |||||
2.46%, due 7/1/2042 (a)(b) | 39,112 | 39,771 | |||||
2.52%, due 11/1/2042 (a)(b) | 36,896 | 37,560 | |||||
2.54%, due 7/1/2042 (a)(b) | 33,904 | 34,563 | |||||
2.55%, due 2/1/2043 (a)(b) | 111,565 | 110,650 | |||||
2.59%, due 3/1/2042 (a)(b) | 29,871 | 30,638 | |||||
2.79%, due 12/1/2041 (a)(b) | 32,352 | 33,276 | |||||
3.31%, due 1/1/2041 (a)(b) | 27,151 | 28,537 | |||||
3.50%, due 4/1/2026 - 2/1/2027 (a) | 130,144 | 135,772 | |||||
3.50%, due 5/1/2043 - 7/1/2043 (a) | 428,429 | 425,633 | |||||
4.00%, due 8/1/2043 - 2/1/2044 (a) | 443,680 | 455,999 | |||||
4.50%, due 12/1/2024 - 5/1/2025 (a) | 35,497 | 37,736 | |||||
Total Freddie Mac Pools | 1,572,743 | 1,595,167 | |||||
Ginnie Mae Pools - 13.9% (c) | |||||||
3.00%, due 10/20/2028 (a) | 154,038 | 158,293 | |||||
3.50%, due 7/20/2040 (a)(b) | 74,931 | 78,517 | |||||
4.00%, due 1/20/2040 (a)(b) | 8,650 | 9,105 | |||||
Total Ginnie Mae Pools | 237,619 | 245,915 | |||||
Total Mortgage Pass-Through Agency RMBS (Cost - $13,923,271) | 13,574,797 | 13,858,848 | |||||
Other Investments - (Cost - $6,945) (d) 0.4% (c) | 6,945 | 6,945 | |||||
Total Investments in Securities (Cost - $13,930,216) | $ | 13,581,742 | $ | 13,865,793 | |||
76
Interest Rate Cap Contracts - 13.3%(c)(e) | ||||||||||
Expiration | Cap Rate | Notional Amount | Fair Value | |||||||
10/15/2015 | 1.43 | % | $ | 300,000 | $ | 164 | ||||
11/8/2015 | 1.36 | % | 200,000 | 145 | ||||||
5/23/2019 | 2.00 | % | 300,000 | 12,853 | ||||||
6/1/2019 | 1.75 | % | 300,000 | 14,679 | ||||||
6/29/2019 | 1.50 | % | 300,000 | 16,539 | ||||||
7/2/2019 | 1.50 | % | 300,000 | 16,970 | ||||||
7/16/2019 | 1.25 | % | 500,000 | 31,335 | ||||||
3/26/2020 | 1.25 | % | 500,000 | 41,322 | ||||||
3/30/2020 | 1.25 | % | 700,000 | 57,785 | ||||||
5/20/2020 | 1.25 | % | 500,000 | 42,911 | ||||||
Total Interest Rate Cap Contracts (Cost, $137,117) | $ | 3,900,000 | $ | 234,703 | ||||||
SCHEDULE OF INVESTMENTS DECEMBER 31, 2013 INVESTMENTS IN SECURITIES – UNITED STATES OF AMERICA | |||
(in thousands) | ||||||||||
Interest Rate Swap Contracts - 1.8%(c)(e) | ||||||||||
Expiration | Pay Rate | Notional Amount | Fair Value | |||||||
2/14/2015 | 2.15 | % | $ | 500,000 | $ | (10,255 | ) | |||
6/2/2016 | 1.94 | % | 300,000 | (9,526 | ) | |||||
12/19/2016 | 1.43 | % | 250,000 | (4,255 | ) | |||||
4/24/2017 | 1.31 | % | 500,000 | (4,982 | ) | |||||
7/13/2017 | 0.86 | % | 750,000 | 6,583 | ||||||
9/6/2017 | 0.77 | % | 250,000 | 3,755 | ||||||
9/6/2017 | 0.77 | % | 500,000 | 7,407 | ||||||
9/6/2017 | 0.77 | % | 250,000 | 3,804 | ||||||
11/7/2017 | 1.11 | % | 500,000 | 3,240 | ||||||
11/29/2017 | 0.87 | % | 500,000 | 8,136 | ||||||
2/21/2018 | 1.02 | % | 500,000 | 7,948 | ||||||
2/27/2018 | 0.96 | % | 500,000 | 9,226 | ||||||
4/25/2018(f) | 1.01 | % | 500,000 | 10,905 | ||||||
8/15/2018 | 1.65 | % | 500,000 | (440 | ) | |||||
Interest Rate Swap Contracts (Cost, $0) | $ | 6,300,000 | $ | 31,546 | ||||||
__________________
(a) | Securities or a portion of the securities are pledged as collateral for repurchase agreements or interest rate swap contracts or forward settling transactions. |
(b) | The coupon rate shown on floating or adjustable rate securities represents the rate at December 31, 2013. |
(c) | Percentage of stockholders' equity. |
(d) | Comprised of investments that were individually less than 1% of stockholders' equity. |
(e) | The Company’s interest rate swap contracts receive a floating rate set quarterly to three month LIBOR. Interest rate caps receive a floating rate quarterly in the amount of three month LIBOR that is in excess of the cap rate. |
(f) | The interest rate swap effective date was April 25, 2014, and it began to accrue any income or expense on that date. |
77
FINANCIAL HIGHLIGHTS
In accordance with financial reporting requirements applicable to investment companies, the Company has included below certain financial highlight information for the years ended December 31, 2013 and 2012:
Per Common Share | ||||||
Year Ended December 31, | ||||||
2013 | 2012 | |||||
Net asset value, beginning of period | $13.31 | $13.02 | ||||
Net income (loss): | ||||||
Net investment income | 1.51 | (a) | 1.63 | (a) | ||
Net gain (loss) from investments and swap and cap contracts | (4.30) | (a) | 1.03 | (a) | ||
Net income (loss) | (2.79) | 2.66 | ||||
Dividends on preferred stock | (0.09) | (a) | (0.02) | (a) | ||
Net income (loss) available to common stockholders | (2.88) | 2.64 | ||||
Capital transactions: | ||||||
Distributions to common stockholders | (0.85) | (2.37) | ||||
Return of capital distributions | (0.47) | 0.00 | ||||
Issuance/Repurchase of common and preferred shares and amortization of share based compensation | 0.13 | (a) | 0.02 | (a) | ||
Net decrease in net asset value from capital transactions | (1.19) | (2.35) | ||||
Net asset value, end of period | $9.24 | $13.31 | ||||
Net asset value total return (%)(b) | (20.66 | )% | 20.43 | % | ||
Market value total return (%) | (27.36 | )% | 7.63 | % | ||
Ratios to Average Net Assets | ||||||
Expenses before interest expense | 0.98 | % | 1.05 | % | ||
Total expenses | 3.44 | % | 3.30 | % | ||
Net investment income | 12.04 | % | 11.66 | % | ||
(a) | Calculated based on average shares outstanding during the period. Average shares outstanding include vested and unvested restricted shares and differs from weighted-average shares outstanding used in calculating EPS. |
(b) | May also be referred to as common book value total return. |
78
The following represents a presentation of the line items used in the Statement of Changes in Net Assets under Investment Company Accounting to the line items currently presented in the Company’s consolidated Statements of Operations under non-Investment Company Accounting for the years ended December 31, 2013 and 2012:
Reconciliation of Net investment income and Net gain (loss) on investments and derivatives | |||||||
Year Ended December 31, | |||||||
(In thousands) | 2013 | 2012 | |||||
Interest income from Agency RMBS | $ | 330,430 | $ | 288,960 | |||
Other interest income | 1,481 | 4,286 | |||||
Repurchase agreement interest expense | (52,763 | ) | (44,117 | ) | |||
Compensation and benefits | (12,599 | ) | (12,264 | ) | |||
General, administrative and other | (8,436 | ) | (8,261 | ) | |||
Other income | 120 | 80 | |||||
Net investment income | 258,233 | 228,684 | |||||
Net realized gain (loss) on investments | (595,116 | ) | 203,846 | ||||
Net unrealized gain (loss) on investments | (314,530 | ) | 23,023 | ||||
Net gain (loss) on investments | (909,646 | ) | 226,869 | ||||
Swap and cap interest expense | (93,497 | ) | (60,776 | ) | |||
Net realized gain (loss) on termination of swap and cap contracts | 30,775 | — | |||||
Net unrealized gain (loss) on swap and cap contracts | 238,353 | (21,990 | ) | ||||
Net gain (loss) from swap and cap contracts | 175,631 | (82,766 | ) | ||||
See Note 2, Significant Accounting Policies.
16. SUBSEQUENT EVENTS
In January 2015, an aggregate of 21,202 shares of restricted common stock were granted to certain directors as a portion of their compensation for serving on the Company’s board of directors.
79
17. SUMMARY OF QUARTERLY RESULTS OF OPERATIONS (UNAUDITED)
Three Months Ended | ||||||||||||||||
(in thousands except per share numbers) | December 31, 2014 | September 30, 2014 | June 30, 2014 | March 31, 2014 | ||||||||||||
Total interest income | $ | 83,599 | $ | 77,132 | $ | 71,978 | $ | 84,367 | ||||||||
Total interest expense | 35,806 | 33,446 | 27,039 | 28,346 | ||||||||||||
Net interest income | 47,793 | 43,686 | 44,939 | 56,021 | ||||||||||||
Other income (loss): | ||||||||||||||||
Net realized gain (loss) on investments | 42,305 | 40,470 | 33,118 | 16,670 | ||||||||||||
Net unrealized gain (loss) on investments | 99,135 | (112,085 | ) | 157,479 | 89,234 | |||||||||||
Net realized gain (loss) on termination of swap and cap contracts | (9,133 | ) | — | (6,004 | ) | (9,323 | ) | |||||||||
Net unrealized gain (loss) on swap and cap contracts | (63,570 | ) | 58,909 | (65,181 | ) | (16,240 | ) | |||||||||
Other income | $ | 50 | $ | 50 | $ | 50 | $ | 119 | ||||||||
Total other income (loss) | $ | 68,787 | $ | (12,656 | ) | $ | 119,462 | $ | 80,460 | |||||||
Total expenses | 5,024 | 6,045 | 6,020 | 5,794 | ||||||||||||
Net income (loss) | 111,556 | 24,985 | 158,381 | 130,687 | ||||||||||||
Dividend on preferred shares | (5,203 | ) | (5,203 | ) | (5,203 | ) | (5,203 | ) | ||||||||
Net income (loss) available to common stockholders | $ | 106,353 | $ | 19,782 | $ | 153,178 | $ | 125,484 | ||||||||
Net income (loss) per common share basic & diluted | $ | 0.66 | $ | 0.12 | $ | 0.95 | $ | 0.78 | ||||||||
Three Months Ended | ||||||||||||||||
(in thousands except per share numbers) | December 31, 2013 | September 30, 2013 | June 30, 2013 | March 31, 2013 | ||||||||||||
Total interest income | $ | 91,743 | $ | 85,599 | $ | 81,511 | $ | 73,061 | ||||||||
Total interest expense | 32,814 | 35,713 | 40,746 | 36,987 | ||||||||||||
Net interest income | 58,929 | 49,886 | 40,765 | 36,074 | ||||||||||||
Other income (loss): | ||||||||||||||||
Net realized gain (loss) on investments | (22,650 | ) | (407,728 | ) | (211,418 | ) | 46,680 | |||||||||
Net unrealized gain (loss) on investments | (167,671 | ) | 423,509 | (444,877 | ) | (125,491 | ) | |||||||||
Net realized gain (loss) on termination of swap and cap contracts | (10,891 | ) | 25,707 | 7,329 | 8,630 | |||||||||||
Net unrealized gain (loss) on swap and cap contracts | 54,633 | (55,243 | ) | 215,546 | 23,417 | |||||||||||
Other income | $ | — | $ | 37 | $ | 40 | $ | 40 | ||||||||
Total other income (loss) | $ | (146,579 | ) | $ | (13,718 | ) | $ | (433,380 | ) | $ | (46,724 | ) | ||||
Total expenses | 4,214 | 5,597 | 5,671 | 5,553 | ||||||||||||
Net income (loss) | (91,864 | ) | 30,571 | (398,286 | ) | (16,203 | ) | |||||||||
Dividend on preferred shares | (5,203 | ) | (5,203 | ) | (3,995 | ) | (1,453 | ) | ||||||||
Net income (loss) available to common stockholders | $ | (97,067 | ) | $ | 25,368 | $ | (402,281 | ) | $ | (17,656 | ) | |||||
Net income (loss) per common share basic & diluted | $ | (0.59 | ) | $ | 0.14 | $ | (2.32 | ) | $ | (0.10 | ) | |||||
Item 9. Changes in and Disagreements with Accountants on Accounting and Financial Disclosure
None.
80
Item 9A. Controls and Procedures
Evaluation of Disclosure Controls and Procedures
Our management, with the participation of our Chief Executive Officer and our Chief Financial Officer, evaluated the effectiveness of our disclosure controls and procedures as of December 31, 2014. The term “disclosure controls and procedures,” as defined in Rules 13a-15(e) and 15d-15(e) under the Exchange Act, means controls and other procedures of a company that are designed to ensure that information required to be disclosed by a company in the reports that it files or submits under the Exchange Act is recorded, processed, summarized and reported, within the time periods specified in the SEC’s rules and forms. Disclosure controls and procedures include, without limitation, controls and procedures designed to ensure that information required to be disclosed by a company in the reports that it files or submits under the Exchange Act is accumulated and communicated to the company’s management, including its principal executive and principal financial officers, as appropriate to allow timely decisions regarding required disclosure. Management recognizes that any controls and procedures, no matter how well designed and operated, can provide only reasonable assurance of achieving their objectives, and management necessarily applies its judgment in evaluating the cost-benefit relationship of possible controls and procedures. Based on the evaluation of our disclosure controls and procedures as of December 31, 2014, our Chief Executive Officer and Chief Financial Officer can provide reasonable assurance that, as of such date, our disclosure controls and procedures were effective.
There have been no changes in our internal controls over financial reporting that occurred during the last fiscal quarter that have materially affected, or are reasonably likely to materially affect, our internal controls over financial reporting.
Management’s Report on Internal Control over Financial Reporting
Management of the Company is responsible for establishing and maintaining adequate internal control over financial reporting. Internal control over financial reporting is defined in Rules 13a-15(f) under the Securities Exchange Act of 1934, as amended, as a process designed by, or under the supervision of, the Company’s principal executive and principal financial officers and effected by the Company’s Board of Directors, management and other personnel to provide reasonable assurance regarding the reliability of financial reporting and the preparation of financial statements for external purposes in accordance with generally accepted accounting principles and includes those policies and procedures that:
• | pertain to the maintenance of records that in reasonable detail accurately and fairly reflect the transactions and dispositions of the assets of the Company; |
• | provide reasonable assurance that transactions are recorded as necessary to permit preparation of financial statements in accordance with generally accepted accounting principles, and that receipts and expenditures of the Company are being made only in accordance with authorizations of management and directors of the Company; and |
• | provide reasonable assurance regarding prevention or timely detection of unauthorized acquisition, use or disposition of the Company’s assets that could have a material effect on the financial statements. |
Because of its inherent limitations, internal control over financial reporting may not prevent or detect misstatements. As a result, even systems determined to be effective can provide only reasonable assurance regarding the preparation and presentation of financial statements. Moreover, projections of any evaluation of effectiveness to future periods are subject to the risks that controls may become inadequate because of changes in conditions or that the degree of compliance with the policies or procedures may deteriorate.
The Company’s management assessed the effectiveness of the Company’s internal control over financial reporting as of December 31, 2014. In making this assessment, the Company’s management used criteria set forth by the 2013 Committee of Sponsoring Organizations of the Treadway Commission (COSO) in Internal Control-Integrated Framework.
Based on management’s assessment, the Company’s management believes that, as of December 31, 2014, the Company’s internal control over financial reporting was effective based on those criteria. The Company’s independent registered public accounting firm, Deloitte & Touche LLP, has issued an attestation report on the Company’s internal control over financial reporting included below.
81
REPORT OF INDEPENDENT REGISTERED PUBLIC ACCOUNTING FIRM
To the Board of Directors and Stockholders of
CYS Investments, Inc.
Waltham, MA
We have audited the internal control over financial reporting of CYS Investments, Inc. (the “Company”) as of December 31, 2014, based on criteria established in Internal Control-Integrated Framework (2013), issued by the Committee of Sponsoring Organizations of the Treadway Commission. The Company's management is responsible for maintaining effective internal control over financial reporting and for its assessment of the effectiveness of internal control over financial reporting, included in the accompanying Management’s Report on Internal Control over Financial Reporting. Our responsibility is to express an opinion on the Company's internal control over financial reporting based on our audit.
We conducted our audit in accordance with the standards of the Public Company Accounting Oversight Board (United States). Those standards require that we plan and perform the audit to obtain reasonable assurance about whether effective internal control over financial reporting was maintained in all material respects. Our audit included obtaining an understanding of internal control over financial reporting, assessing the risk that a material weakness exists, testing and evaluating the design and operating effectiveness of internal control based on the assessed risk, and performing such other procedures as we considered necessary in the circumstances. We believe that our audit provides a reasonable basis for our opinion.
A company's internal control over financial reporting is a process designed by, or under the supervision of, the company's principal executive and principal financial officers, or persons performing similar functions, and effected by the company's board of directors, management, and other personnel to provide reasonable assurance regarding the reliability of financial reporting and the preparation of financial statements for external purposes in accordance with generally accepted accounting principles. A company's internal control over financial reporting includes those policies and procedures that (1) pertain to the maintenance of records that, in reasonable detail, accurately and fairly reflect the transactions and dispositions of the assets of the company; (2) provide reasonable assurance that transactions are recorded as necessary to permit preparation of financial statements in accordance with generally accepted accounting principles, and that receipts and expenditures of the company are being made only in accordance with authorizations of management and directors of the company; and (3) provide reasonable assurance regarding prevention or timely detection of unauthorized acquisition, use, or disposition of the company's assets that could have a material effect on the financial statements.
Because of the inherent limitations of internal control over financial reporting, including the possibility of collusion or improper management override of controls, material misstatements due to error or fraud may not be prevented or detected on a timely basis. Also, projections of any evaluation of the effectiveness of the internal control over financial reporting to future periods are subject to the risk that the controls may become inadequate because of changes in conditions, or that the degree of compliance with the policies or procedures may deteriorate.
In our opinion, the Company maintained, in all material respects, effective internal control over financial reporting as of December 31, 2014, based on the criteria established in Internal Control - Integrated Framework (2013), issued by the Committee of Sponsoring Organizations of the Treadway Commission.
We have also audited, in accordance with the standards of the Public Company Accounting Oversight Board (United States), the consolidated financial statements as of and for the year ended December 31, 2014 of the Company and our report dated February 17, 2015 expressed an unqualified opinion on those financial statements and included an explanatory paragraph regarding the discontinued use of investment company accounting on January 1, 2014.
/s/ DELOITTE & TOUCHE LLP
February 17, 2015
Boston, Massachusetts
82
PART III
Item 10. Directors, Executive Officers and Corporate Governance
The information required by Item 10 is incorporated by reference to our definitive Proxy Statement for our 2015 annual stockholders’ meeting.
Item 11. Executive Compensation
The information required by Item 11 is incorporated by reference to our definitive Proxy Statement for our 2015 annual stockholders’ meeting.
Item 12. Security Ownership of Certain Beneficial Owners and Management and Related Stockholder Matters
The information required by Item 12 is incorporated by reference to our definitive Proxy Statement for our 2015 annual stockholders’ meeting.
Item 13. Certain Relationships and Related Transactions, and Director Independence
The information required by Item 13 is incorporated by reference to our definitive Proxy Statement for our 2015 annual stockholders’ meeting.
Item 14. Principal Accountant Fees and Services
The information required by Item 14 is incorporated by reference to our definitive Proxy Statement for our 2015 annual stockholders’ meeting.
83
PART IV
Item 15. Exhibits and Financial Statement Schedules
(a) Documents filed as part of this report:
1. Financial Statements.
See Index to financial statements, included in Part II, Item 8 of this Annual Report on Form 10-K.
2. Schedules to Financial Statements:
All financial statement schedules not included have been omitted because they are either inapplicable or the information required is provided in our Financial Statements and Notes thereto, included in Part II, Item 8, of this Annual Report on Form 10-K.
3. Exhibits
Exhibit Number | Description of Exhibit | |
3.1(1) | Articles of Amendment and Restatement of CYS Investments, Inc. | |
3.2(2) | Articles of Amendment to the Articles of Amendment and Restatement | |
3.3(2) | Articles of Amendment to the Articles of Amendment and Restatement | |
3.4(3) | Articles of Amendment to the Articles of Amendment and Restatement | |
3.5(4) | Amended and Restated Bylaws of CYS Investments, Inc. | |
3.6(5) | Articles Supplementary of 7.75% Series A Cumulative Redeemable Preferred Stock | |
3.7(6) | Articles Supplementary of 7.50% Series B Cumulative Redeemable Preferred Stock | |
3.8(6) | Articles Supplementary Reclassifying Authorized but unissued Shares of Preferred Stock | |
4.1(3) | Form of Certificate for Common Stock for CYS Investments, Inc. | |
4.2(5) | Form of Certificate for 7.75% Series A Cumulative Redeemable Preferred Stock for CYS Investments, Inc. | |
4.3(6) | Form of Certificate for 7.50% Series B Cumulative Redeemable Preferred Stock for CYS Investments, Inc. | |
10.1(3)† | Employment Agreement, dated September 1, 2011, between the Company and Kevin E. Grant | |
10.2(3)† | Employment Agreement, dated September 1, 2011, between the Company and Frances R. Spark | |
10.3(3)† | Employment Agreement, dated September 1, 2011, between the Company and Richard E. Cleary | |
10.4(3)† | Employment Agreement, dated September 1, 2011, between the Company and Thomas A. Rosenbloom | |
10.5(1)† | 2006 Stock Incentive Plan | |
10.6(6)† | 2013 Equity Incentive Plan | |
10.7(6)† | Form of Restricted Stock Award for Directors | |
10.8(6)† | Forms of Restricted Stock Award for Employees with Employment Agreements | |
10.9(6)† | Form of Restricted Stock Awards for Employees without Employment Agreements | |
10.10(1)† | Form of Stock Option Agreement | |
10.11(1) | Form of Indemnification Agreement | |
84
10.12(7)† | 2014 Incentive Compensation Plan | |
12.1 | Statement re: Computation of Ratio of Earnings to Combined Fixed Charges and Preferred Stock Dividends. | |
21.1 | Subsidiaries of the Registrant | |
23.1 | Consent of Independent Registered Public Accounting Firm | |
31.1 | Certification of Chief Executive Officer pursuant to Section 302 of the Sarbanes—Oxley Act of 2002 | |
31.2 | Certification of Chief Financial Officer pursuant to Section 302 of the Sarbanes—Oxley Act of 2002 | |
32.1 | Certification of Chief Executive Officer pursuant to 18 U.S.C. Section 1350, as adopted pursuant to Section 906 of the Sarbanes—Oxley Act of 2002 | |
32.2 | Certification of Chief Financial Officer pursuant to 18 U.S.C. Section 1350, as adopted pursuant to Section 906 of the Sarbanes—Oxley Act of 2002 | |
101.INS XBRL | Instance Document (9) | |
101.SCH XBRL | Taxonomy Extension Schema Document (9) | |
101.CAL XBRL | Taxonomy Extension Calculation Linkbase Document (9) | |
101.DEF XBRL | Additional Taxonomy Extension Definition Linkbase Document Created (9) | |
101.LAB XBRL | Taxonomy Extension Label Linkbase Document (9) | |
101.PRE XBRL | Taxonomy Extension Presentation Linkbase Document (9) | |
(1) | Incorporated by reference to the Registrant’s Registration Statement on Form S-11 filed with the Securities and Exchange Commission (File No. 333-142236). |
(2) | Incorporated by reference from the Registrant’s Form 10-K filed with the Securities and Exchange Commission on February 10, 2010. |
(3) | Incorporated by reference from the Registrant’s Current Report on Form 8-K filed with the Securities and Exchange Commission on September 1, 2011. |
(4) | Incorporated by reference from the Registrant’s Form 10-K filed with the Securities and Exchange Commission on February 10, 2012. |
(5) | Incorporated by reference from the Registrant's Current Report Form on 8-K filed with the Securities and Exchange Commission on August 2, 2012 |
(6) | Incorporated by reference from the Registrant’s Quarterly Report on Form 10-Q filed with the Securities and Exchange Commission on July 19, 2013. |
(7) | Incorporated by reference from the Registrant's Current Report Form on 8-K filed with the Securities and Exchange Commission on May 15, 2014. |
(8) | Submitted electronically herewith. Attached as Exhibit 101 to this report are the following documents formatted in XBRL (Extensible Business Reporting Language): (i) Statements of Assets and Liabilities at December 31, 2014 and 2013; (ii) Statements of Operations for the years ended December 31, 2014, 2013 and 2012; (iii) Statement of Changes in Net Assets for the years ended December 31, 2014, 2013 and 2012; (iv) Statements of Cash Flows for the years ended December 31, 2014, 2013 and 2012; and (v) Notes to Financial Statements for the year ended December 31, 2014. |
† | Compensatory plan or arrangement. |
85
86
SIGNATURES
Pursuant to the requirements of the Securities Exchange Act of 1934, the registrant has duly caused this report to be signed on its behalf by the undersigned thereunto duly authorized.
CYS INVESTMENTS, INC. | ||
Dated: February 17, 2015 | BY: | /s/ KEVIN E. GRANT |
Kevin E. Grant | ||
Chairman of the Board and Chief Executive Officer | ||
Pursuant to the requirements of the Securities Exchange Act of 1934, this report has been signed below by the following persons on behalf of the registrant and in the capacities and dates indicated.
Signature | Title | Date | ||
/s/ KEVIN E. GRANT | Chief Executive Officer, President; Director; Chairman of the Board (Principal Executive Officer) | February 17, 2015 | ||
Kevin E. Grant | ||||
/s/ FRANCES R. SPARK | Chief Financial Officer and Treasurer (Principal Financial Officer) | February 17, 2015 | ||
Frances R. Spark | ||||
/s/ RYAN R. BRENNEMAN | Chief Accounting Officer (Principal Accounting Officer) | February 17, 2015 | ||
Ryan R. Brenneman | ||||
/s/ TANYA S. BEDER | Director | February 17, 2015 | ||
Tanya S. Beder | ||||
/s/ DOUGLAS CROCKER, II | Director | February 17, 2015 | ||
Douglas Crocker, II | ||||
/s/ KAREN HAMMOND | Director | February 17, 2015 | ||
Karen Hammond | ||||
/s/ JEFFREY P. HUGHES | Director | February 17, 2015 | ||
Jeffrey P. Hughes | ||||
/s/ STEPHEN P. JONAS | Director | February 17, 2015 | ||
Stephen P. Jonas | ||||
/s/ RAYMOND A. REDLINGSHAFER | Director | February 17, 2015 | ||
Raymond A. Redlingshafer | ||||
/s/ DALE A. REISS | Director | February 17, 2015 | ||
Dale A. Reiss | ||||
/s/ JAMES A. STERN | Director | February 17, 2015 | ||
James A. Stern | ||||
/s/ DAVID A. TYSON, PHD | Director | February 17, 2015 | ||
David A. Tyson, PhD | ||||
87
EXHIBIT INDEX
Exhibit Number | Description of Exhibit | |
3.1(1) | Articles of Amendment and Restatement of CYS Investments, Inc. | |
3.2(2) | Articles of Amendment to the Articles of Amendment and Restatement | |
3.3(2) | Articles of Amendment to the Articles of Amendment and Restatement | |
3.4(3) | Articles of Amendment to the Articles of Amendment and Restatement | |
3.5(4) | Amended and Restated Bylaws of CYS Investments, Inc. | |
3.6(5) | Articles Supplementary of 7.75% Series A Cumulative Redeemable Preferred Stock | |
3.7(6) | Articles Supplementary of 7.50% Series B Cumulative Redeemable Preferred Stock | |
3.8(6) | Articles Supplementary Reclassifying Authorized but unissued Shares of Preferred Stock | |
4.1(3) | Form of Certificate for Common Stock for CYS Investments, Inc. | |
4.2(5) | Form of Certificate for 7.75% Series A Cumulative Redeemable Preferred Stock for CYS Investments, Inc. | |
4.3(6) | Form of Certificate for 7.50% Series B Cumulative Redeemable Preferred Stock for CYS Investments, Inc. | |
10.1(3)† | Employment Agreement, dated September 1, 2011, between the Company and Kevin E. Grant | |
10.2(3)† | Employment Agreement, dated September 1, 2011, between the Company and Frances R. Spark | |
10.3(3)† | Employment Agreement, dated September 1, 2011, between the Company and Richard E. Cleary | |
10.4(3)† | Employment Agreement, dated September 1, 2011, between the Company and Thomas A. Rosenbloom | |
10.5(1)† | 2006 Stock Incentive Plan | |
10.6(6)† | 2013 Equity Incentive Plan | |
10.7(6)† | Form of Restricted Stock Award for Directors | |
10.8(6)† | Forms of Restricted Stock Award for Employees with Employment Agreements | |
10.9(6)† | Form of Restricted Stock Awards for Employees without Employment Agreements | |
10.10(1)† | Form of Stock Option Agreement | |
10.11(1) | Form of Indemnification Agreement | |
10.12(7)† | 2014 Incentive Compensation Plan | |
12.1 | Statement re: Computation of Ratio of Earnings to Combined Fixed Charges and Preferred Stock Dividends. | |
21.1 | Subsidiaries of the Registrant | |
23.1 | Consent of Independent Registered Public Accounting Firm | |
31.1 | Certification of Chief Executive Officer pursuant to Section 302 of the Sarbanes—Oxley Act of 2002 | |
31.2 | Certification of Chief Financial Officer pursuant to Section 302 of the Sarbanes—Oxley Act of 2002 | |
32.1 | Certification of Chief Executive Officer pursuant to 18 U.S.C. Section 1350, as adopted pursuant to Section 906 of the Sarbanes—Oxley Act of 2002 | |
88
32.2 | Certification of Chief Financial Officer pursuant to 18 U.S.C. Section 1350, as adopted pursuant to Section 906 of the Sarbanes—Oxley Act of 2002 | |
101.INS XBRL | Instance Document (9) | |
101.SCH XBRL | Taxonomy Extension Schema Document (9) | |
101.CAL XBRL | Taxonomy Extension Calculation Linkbase Document (9) | |
101.DEF XBRL | Additional Taxonomy Extension Definition Linkbase Document Created (9) | |
101.LAB XBRL | Taxonomy Extension Label Linkbase Document (9) | |
101.PRE XBRL | Taxonomy Extension Presentation Linkbase Document (9) | |
(1) | Incorporated by reference to the Registrant’s Registration Statement on Form S-11 filed with the Securities and Exchange Commission (File No. 333-142236). |
(2) | Incorporated by reference from the Registrant’s Form 10-K filed with the Securities and Exchange Commission on February 10, 2010. |
(3) | Incorporated by reference from the Registrant’s Current Report on Form 8-K filed with the Securities and Exchange Commission on September 1, 2011. |
(4) | Incorporated by reference from the Registrant’s Form 10-K filed with the Securities and Exchange Commission on February 10, 2012. |
(5) | Incorporated by reference from the Registrant's Current Report Form on 8-K filed with the Securities and Exchange Commission on August 2, 2012. |
(6) | Incorporated by reference from the Registrant’s Quarterly Report on Form 10-Q filed with the Securities and Exchange Commission on July 19, 2013. |
(7) | Incorporated by reference from the Registrant's Current Report Form on 8-K filed with the Securities and Exchange Commission on May 15, 2014. |
(8) | Submitted electronically herewith. Attached as Exhibit 101 to this report are the following documents formatted in XBRL (Extensible Business Reporting Language): (i) Statements of Assets and Liabilities at December 31, 2014 and 2013; (ii) Statements of Operations for the years ended December 31, 2014, 2013 and 2012; (iii) Statement of Changes in Net Assets for the years ended December 31, 2014, 2013 and 2012; (iv) Statements of Cash Flows for the years ended December 31, 2014, 2013 and 2012; and (v) Notes to Financial Statements for the year ended December 31, 2014. |
† | Compensatory plan or arrangement. |
89