Attached files
| file | filename |
|---|---|
| EX-12.1 - EXHIBIT 12.1 - CYS Investments, Inc. | a20171231ex121.htm |
| EX-32.2 - EXHIBIT 32.2 - CYS Investments, Inc. | a20171231ex322.htm |
| EX-32.1 - EXHIBIT 32.1 - CYS Investments, Inc. | a20171231ex321.htm |
| EX-31.2 - EXHIBIT 31.2 - CYS Investments, Inc. | a20171231ex312.htm |
| EX-31.1 - EXHIBIT 31.1 - CYS Investments, Inc. | a20171231ex311.htm |
| EX-23.1 - EXHIBIT 23.1 - CYS Investments, Inc. | a20171231ex231.htm |
| EX-21.1 - EXHIBIT 21.1 - CYS Investments, Inc. | a20171231ex211.htm |
| EX-10.13 - EXHIBIT 10.13 - CYS Investments, Inc. | a20171231ex1013.htm |
UNITED STATES
SECURITIES AND EXCHANGE COMMISSION
Washington, D.C. 20549
_______________________________________________________________
FORM 10-K
________________________________________________________________
x ANNUAL REPORT PURSUANT TO SECTION 13 OR 15(d) OF THE SECURITIES EXCHANGE ACT OF 1934
For the fiscal year ended December 31, 2017
OR
¨ TRANSITION REPORT PURSUANT TO SECTION 13 OR 15(d) OF THE SECURITIES EXCHANGE ACT OF 1934
For the transition period from to .
Commission file number 001-33740
________________________________________________________________
CYS Investments, Inc.
________________________________________________________________
(Exact name of registrant as specified in its charter)
Maryland | 20-4072657 | |
(State or other jurisdiction of incorporation or organization) | (IRS Employer Identification No.) | |
500 Totten Pond Road, 6th Floor, Waltham, Massachusetts | 02451 | |
(Address of principal executive offices) | (Zip Code) | |
(617) 639-0440
(Registrant's telephone number, including area code)
Securities registered pursuant to Section 12(b) of the Act:
Title of each class | Name of each exchange on which registered | |
Common stock, $0.01 par value | New York Stock Exchange | |
7.75% Series A Cumulative Redeemable Preferred Stock, $25.00 Liquidation Preference | New York Stock Exchange | |
7.50% Series B Cumulative Redeemable Preferred Stock, $25.00 Liquidation Preference | New York Stock Exchange | |
Securities registered pursuant to Section 12(g) of the Act: None
Indicate by check mark if the registrant is a well-known seasoned issuer, as defined in Rule 405 of the Securities Act. Yes x No ¨
Indicate by check mark if the registrant is not required to file reports pursuant to Section 13 or Section 15(d) of the Exchange Act. Yes ¨ No x
Indicate by check mark whether the registrant (1) has filed all reports required to be filed by Section 13 or 15(d) of the Securities Exchange Act of 1934 during the preceding 12 months (or for such shorter period that the registrant was required to file such reports), and (2) has been subject to such filing requirements for the past 90 days. Yes x No ¨
Indicate by check mark whether the registrant has submitted electronically and posted on its corporate Web site, if any, every Interactive Data File required to be submitted and posted pursuant to Rule 405 of Regulation S-T during the preceding 12 months (or for such shorter period that the registrant was required to submit and post such files). Yes x No ¨
Indicate by check mark if disclosure of delinquent filers pursuant to Item 405 of Regulation S-K is not contained herein, and will not be contained, to the best of the registrant's knowledge, in definitive proxy or information statements incorporated by reference in Part III of this Form 10-K or any amendment to this Form 10-K. x
Indicate by check mark whether the registrant is a large accelerated filer, an accelerated filer, a non-accelerated filer or a smaller reporting company. See the definitions of "large accelerated filer," "accelerated filer," "smaller reporting company," and "emerging growth company"in Rule 12b-2 of the Exchange Act. Check one:
Large accelerated filer | x | Accelerated filer | ¨ |
Non-accelerated filer | ¨ (Do not check if a smaller reporting company) | Smaller reporting company | ¨ |
Emerging growth company | ¨ | ||
If an emerging growth company, indicate by check mark if the registrant has elected not to use the extended transition period for complying with any new or revised financial accounting standards provided pursuant to Section 13(a) of the Exchange Act. ¨
Indicate by check mark whether the registrant is a shell company (as defined in Rule 12b-2 of the Exchange Act). Yes ¨ No x
The aggregate market value of the voting and non-voting common equity held by non-affiliates of the registrant was approximately 1,257,483,477 based on the closing price on the New York Stock Exchange as of June 30, 2017.
Number of the registrant's common stock outstanding as of January 31, 2018: 155,028,274
DOCUMENTS INCORPORATED BY REFERENCE
Portions of the registrant's definitive Proxy Statement with respect to its 2018 Annual Meeting of Stockholders to be filed not later than 120 days after the end of the registrant's fiscal year are incorporated by reference into Part II, Item 5 and III hereof as noted therein.
CYS INVESTMENTS, INC.
INDEX
Page | ||
PART I | ||
PART II | ||
PART III | ||
PART IV | ||
PART I
Item 1. Business
In this Annual Report on Form 10-K, we refer to CYS Investments, Inc. as "we," "us," "our company," or "our," unless we specifically state otherwise or the context indicates otherwise.
Please refer to the section titled “Glossary of Terms” located at the end of Part II. Item 7. “Management’s Discussion and Analysis of Financial Condition and Results of Operations” for definitions of some of the commonly used terms in this Annual Report on Form 10-K.
Forward Looking Statements
When used in this Annual Report on Form 10-K, in future filings with the Securities and Exchange Commission ("SEC") or in press releases or other written or oral communications, statements which are not historical in nature, including those containing words such as "believe," "expect," "anticipate," "estimate," "plan," "continue," "intend," "should," "may" or similar expressions, are intended to identify "forward-looking statements" within the meaning of Section 27A of the Securities Act of 1933, as amended, and Section 21E of the Securities Exchange Act of 1934, as amended (the "Exchange Act"), and, as such, may involve known and unknown risks, uncertainties and assumptions. The forward-looking statements we make in this Annual Report on Form 10-K include, but are not limited to, statements about the following:
• | the effect of movements in interest rates on our assets and liabilities (including our hedging instruments) and our net income; |
• | our investment, financing and hedging strategies; |
• | the effect of U.S. government and foreign central bank actions on interest rates and the housing and credit markets, government sponsored entities and the economy; |
• | the effect of actual or proposed actions and anticipated progress announced by the Federal Housing Finance Agency (the "FHFA"), the Federal Housing Administration (the “FHA”) and the Consumer Financial Protection Bureau (the “CFPB”); |
• | the effect of actual or proposed actions of the U.S. Federal Reserve (the "Fed") and the Fed Open Market Committee (the "FOMC") with respect to monetary policy, interest rates, inflation, GDP growth or unemployment; |
• | the supply and availability of Agency Residential Mortgage-Backed Securities ("RMBS"); |
• | the effect of increased prepayment rates on the value of our assets; |
• | our ability to convert our assets into cash and cash equivalents or extend the financing terms related to our assets; |
• | the effect of widening credit spreads or shifts in the yield curve on the value of our assets and investment strategy; |
• | the types of indebtedness we may incur; |
• | our ability to achieve anticipated benefits from interest rate swaps, swaptions and caps; |
• | our ability to quantify risks based on historical experience; |
• | our ability to be taxed as a real estate investment trust ("REIT") and to maintain an exemption from registration under the Investment Company Act of 1940, as amended (the "Investment Company Act"); |
• | the tax limitations of capital loss carryforwards; |
• | our assessment of counterparty risk and/or the rise of counterparty defaults; |
• | our overall liquidity and ability to meet short-term liquidity requirements with our cash flow from operations and borrowings; |
• | the effect of rising interest rates on unemployment, inflation and mortgage supply and demand; |
• | our borrowing costs; |
• | changes in our investment guidelines and the composition of our investment portfolio; |
• | our asset valuation policies; and |
1
• | our dividend distribution policy. |
Forward-looking statements are based on our beliefs, assumptions and expectations of our future performance, taking into account all information currently available to us. These beliefs, assumptions and expectations are subject to risks and uncertainties and can change as a result of many possible events or factors, not all of which are known to us. If a change occurs, our business, financial condition, liquidity and results of operations may vary materially from those expressed in our forward-looking statements. The following describe some, but not all, of the factors that could cause actual results to vary from our forward-looking statements:
• | the factors referenced in this Annual Report on Form 10-K, including those set forth under the section captioned "Risk Factors"; |
• | changes in our investment, financing and hedging strategies; |
• | the adequacy of our cash flow from operations and borrowings to meet our short- and long-term liquidity requirements; |
• | unanticipated changes in our industry, interest rates, the credit markets, the general economy or the real estate market; |
• | changes in interest rates and the market value of our Agency RMBS; |
• | changes in the prepayment rates on the mortgage loans underlying our Agency RMBS; |
• | our ability to borrow to finance our assets; |
• | actions by the U.S. government, the Fed, and other government agencies that impact the value of our Agency RMBS or interest rates; |
• | changes in government regulations affecting our business; |
• | changes in the U.S. government's credit rating or ability to pay its debts; |
• | our ability to maintain our qualification as a REIT for federal income tax purposes; |
• | our ability to maintain our exemption from registration under the Investment Company Act and the availability of such exemption in the future; and |
• | risks associated with investing in real estate assets, including changes in business conditions and the general economy. |
These and other risks, uncertainties and factors, including those described elsewhere in this report, could cause our actual results to differ materially from those projected in any forward-looking statements we make. All forward-looking statements speak only as of the date on which they are made. New risks and uncertainties arise over time and it is not possible to predict those events or how they may affect us. Except as required by law, we are not obligated to, and do not intend to, update or revise any forward-looking statements, whether as a result of new information, future events or otherwise.
Our Company
We are a specialty finance company created with the objective of achieving consistent risk-adjusted investment income. We have elected to be taxed as a REIT for federal income tax purposes. We were formed as a Maryland corporation on January 3, 2006, commenced operations in February 2006 and completed the initial public offering of our common stock in June 2009. We conduct all of our business through and hold all of our assets in CYS Investments, Inc. and its subsidiaries.
Investment Strategy
We invest in Agency RMBS collateralized by fixed rate single-family residential mortgage loans (primarily 15 and 30 years), adjustable-rate mortgages ("ARMs"), which have coupon rates that reset monthly, or Hybrid ARMs, which have a coupon rate that is fixed for an initial period (typically three, five, seven or ten years) and thereafter reset at regular intervals. In addition, our investment guidelines permit investments in collateralized mortgage obligations issued by a government agency or government-sponsored entity that are collateralized by Agency RMBS ("CMOs"), and credit risk transfer securities, such as Structured Agency Credit Risk (“STACR”) debt securities issued by Freddie Mac, Connecticut Avenue Securities ("CAS") issued by Fannie Mae, or similar securities issued or sponsored by a U.S. government-sponsored entity ("GSE") where their cash flows track the credit risk performance of a notional reference pool of mortgage loans. We had no investments in CMOs, STACRs, CAS, or other similar securities as of December 31, 2017 and 2016. In addition, we invest in debt securities issued by the United States Department of the Treasury (the "U.S. Treasury") or a government-sponsored entity that are not backed by collateral but, in the case of government agencies, are backed by the full faith and credit of the U.S. government ("U.S.
2
Treasuries"), and, in the case of government-sponsored entities, are backed by the integrity and creditworthiness of the issuer ("U.S. Agency Debentures").
We make investment decisions based on various factors, including, but not limited to, relative value, expected cash flow yield, supply and demand, costs of financing and hedging, liquidity, expected future interest rate volatility and the overall shape of the U.S. Treasury and interest rate swap yield curves. We do not attribute any particular quantitative significance to any of these factors, and the weight given to these factors varies depending on market conditions and economic trends. We believe that this strategy enables us to pay dividends and manage our book value throughout changing interest rate and credit cycles, and provide attractive long-term returns to investors.
Our investment strategy is designed to:
• | maintain an investment portfolio consisting primarily of Agency RMBS that generates risk-adjusted investment income; |
• | manage financing, interest and prepayment rate risks; |
• | capitalize on discrepancies in the relative valuations in the Agency RMBS market; |
• | manage cash flow to provide for regular quarterly distributions to stockholders; |
• | manage credit risk; |
• | manage the impact that changing interest rates have on our net income and book value, or stockholders' equity; |
• | invest opportunistically in assets within our investment guidelines; |
• | maintain our qualification as a REIT; and |
• | exempt us from the registration requirements of the Investment Company Act. |
Our income is generated primarily from the difference between the interest income we earn on our investment portfolio and the cost of our borrowings and hedging activities, which difference is commonly referred to as net spread. We believe the most prudent approach to generating a positive net spread is to manage our liabilities to mitigate the interest rate risks of our investments. Generally, we seek to employ short-term financing for our Agency RMBS portfolio, and we utilize various hedging instruments, such as interest rate swaps, swaptions and caps to hedge the interest rate risk associated with the short-term financing of our portfolio. In the future, we may employ longer-term financing of our portfolio, and use other hedging techniques from time to time, including interest rate floors, collars and Eurodollar and U.S. Treasury futures, to protect against adverse interest rate movements.
Since our investments vary by interest rate, prepayment speed and maturity, the leverage we employ to fund our asset purchases cannot be precisely matched to the terms or performance of our assets. Based on our experience, because our assets are not match-funded, changes in interest rates may impact our net income and the market value of our assets. Our approach to managing our investment portfolio is to take a longer term view of assets and liabilities, such that our net income and mark-to-market valuations at the end of a financial reporting period will not significantly influence our strategy of maximizing cash distributions to stockholders and achieving capital appreciation over the long-term.
Investment Sourcing
We source the majority of our investments through relationships with a large and diverse group of financial intermediaries, ranging from major commercial and investment banks to specialty investment dealers and brokerage firms.
Investment Process
Management evaluates each of our investment opportunities based on its expected risk-adjusted investment income relative to the investment income available from other comparable investments. Management also evaluates new opportunities based on their relative expected returns compared to the securities held in our portfolio. The terms of any leverage available to us for use in funding an investment purchase are also taken into consideration, as are potential risks posed by illiquidity or correlations with other securities in our portfolio.
The key steps of our investment process are:
• | allocation of our capital to the attractive types of Agency RMBS; |
• | review of our asset allocation plan for overall risk management and diversification; |
• | research and selection of individual securities and financing strategies; |
3
• | active portfolio monitoring within asset classes, together with ongoing risk management and periodic rebalancing, to maximize long-term income with capital stability; and |
• | consideration of the impact on maintaining our REIT qualification and our exemption from registration under the Investment Company Act. |
Financing Strategy
We employ leverage to finance a portion of our Agency RMBS portfolio and seek to increase potential returns to our stockholders. Our use of leverage may, however, have the effect of increasing losses when securities in our portfolio decline in value. Generally, we expect our leverage to be between five and ten times. Taking into account actions and guidance provided by the Board of Governors of the Fed about the future path of the target federal funds rate (the "Federal Funds Rate"), the Fed's goal of reducing asset purchases, the ongoing interest-rate volatility in the mortgage and bond markets, and prevailing global and U.S. economic market conditions, we currently expect our leverage to remain in the middle of this range. At December 31, 2017, our leverage ratio was approximately 7.33:1, up from 7.06:1 at December 31, 2016. We calculate our leverage by dividing (A) the sum of our (i) borrowings under repurchase agreements ("repo borrowings") plus, (ii) advances from the Federal Home Loan Bank of Cincinnati ("FHLBC" and "FHLBC Advances"), (iii) plus payable for securities purchased minus receivable for securities sold, and (iv) plus the net TBA contracts without having the contractual obligation to accept or make delivery ("TBA Derivative") positions by (B) our stockholders' equity.
We finance our Agency RMBS investments using repo borrowings with a diversified group of broker dealers and commercial and investment banks. Utilizing repo borrowings enables us to borrow against the value of our assets. Under repurchase agreements, we sell our assets to a counterparty and agree to repurchase the same assets from the counterparty at a price equal to the original sales price plus an interest factor. When we borrow from a counterparty, we over-collateralize our borrowings by providing the counterparty with an amount of assets equal to an agreed upon percentage over and above the amount financed. This over-collateralized percentage is commonly referred to as a "haircut". As a borrower, we are subject to margin calls from counterparties if the value of the collateral that we have posted has declined below the amount financed, plus the applicable "haircut", which may occur due to prepayments of the mortgages causing the face value of the mortgage pool provided as collateral to the counterparty to decline or when the value of the mortgage pool provided as collateral declines as a result of interest rate movements or spread widening. Currently, the "haircuts" on our repo borrowings are between 0% and 7%. Our repo borrowings are accounted for as debt for purposes of U.S. generally accepted accounting principles ("GAAP") and are secured by the underlying assets. During the period of a repo borrowing, we are entitled to and receive the principal and interest payments on the related assets.
We maintain formal relationships with counterparties that are generally broker dealers and commercial and investment banks for the purpose of obtaining financing on favorable terms and managing counterparty credit risk. As of December 31, 2017, we had agreements in place with 53 counterparties and had outstanding repo borrowings with 37 counterparties for an aggregate of approximately $10.1 billion at a weighted-average borrowing rate of 1.42%.
In March 2015, our wholly-owned captive insurance subsidiary, CYS Insurance Services, LLC ("CYS Insurance"), was granted membership in the Federal Home Loan Bank ("FHLB") system, specifically in the FHLBC. Membership in the FHLBC obligated CYS Insurance to purchase FHLBC membership stock and activity stock, the latter being a percentage of the advances it obtained from the FHLBC. CYS insurance sought both short-term advances and long-term advances (collectively, "FHLBC Advances") from the FHLBC. On January 12, 2016, the FHFA issued a final rule (the "Final Rule") amending its regulations governing FHLB membership criteria for captive insurance companies. The Final Rule defines "insurance company" to exclude "captive insurers". Under this Final Rule, which became effective on February 19, 2016, CYS Insurance's membership in the FHLBC was required to be terminated within one year of the effective date: it was not permitted to secure any new advances, and all FHLBC Advances were required to be repaid no later than February 19, 2017. The Company repaid all outstanding FHLBC Advances prior to September 30, 2016, and CYS Insurance's membership in the FHLBC was terminated on February 19, 2017.
In the future, we may utilize other financing techniques, which may include, but will not necessarily be limited to, the issuance of common or preferred stock, and secured or unsecured debt.
Interest Rate Hedging Strategy
We utilize derivative financial instruments to manage the interest rate risk associated with the financing of our investment portfolio. Our most common method of financing Agency RMBS is through repo borrowings, which generally have maturities between 30 and 180 days, but may be longer. The weighted-average life of the Agency RMBS we own is generally much longer than the maturities of our repo borrowings. The difference in maturities, in addition to prepayments, adjustable-rate features of ARMs and other potential changes in the timing and amount of cash flows, creates risk to the value of the Agency RMBS from changes in the interest rates. We engage in hedging activities in an attempt to manage interest rate changes that might impair our ability to finance assets we own at favorable rates. We employ hedges as a means to attempt to protect
4
the portfolio against declines in the market value of our assets that result from general trends in debt markets. Our hedges have historically consisted of interest rate swaps (a contract exchanging a variable rate for a fixed rate, or vice versa), including cancelable interest rate swaps (swaps that may be canceled at one party's option before expiry), interest rate swaptions (the right to enter into an interest rate swap at a specified notional and rate on a specified future date), and interest rate caps (a contract protecting against a rise in interest rates above a fixed level). In the future, our hedges will likely continue to consist of these types of transactions, but may also include interest rate floors (a contract protecting against a decline in interest rates below a fixed level), interest rate collars (a combination of caps and floors), and Eurodollar and U.S. Treasury futures.
Our repo borrowings generally carry interest rates that correspond to the London Interbank Offered Rate ("LIBOR") for the borrowing periods. Historically, we have sought to enter into interest rate swaps (cancellable and non-cancellable) and swaptions with options to enter into interest rate swaps, structured such that we receive payments based on a variable interest rate and make payments based on a fixed interest rate. The variable interest rate on which payments are received is calculated based on 3-Month LIBOR. Additionally, we have entered into interest rate caps structured such that we receive payments when interest rates exceed a contractual fixed interest rate. Our interest rate swaps and swaptions, to the extent exercised, and caps effectively "fix" or "cap" our borrowing costs to the extent of the corresponding notional amounts and maturity dates and are not held for speculative or trading purposes. As of December 31, 2017, the swap and cap notional was $10.0 billion and covered 98.9% of our repo borrowings, herein referred to as our "hedge ratio". As of December 31, 2016, the swap and cap notional was $9.0 billion and covered 92.3% of our repo borrowings and FHLBC Advances.
Our Portfolio
We invest principally in Agency RMBS. Our current portfolio of Agency RMBS is backed by fixed-rate mortgages and Hybrid ARMs that typically have a fixed coupon for three, five, seven or ten years, and then pay an adjustable coupon that generally resets annually over a predetermined interest rate index.
In addition to Agency RMBS, we invest in U.S. Treasuries. As of December 31, 2017, our Agency RMBS and U.S. Treasuries (collectively, "Debt Securities") portfolio consisted of the following:
Face Value | Fair Value* | Weighted-Average | ||||||||||||||||||||||
Asset Type | (in thousands) | Cost/Face | Fair Value/Face | Yield(1) | Coupon | CPR(2) | ||||||||||||||||||
15-Year Fixed Rate | $ | 2,975,397 | $ | 3,037,625 | $ | 102.26 | $ | 102.09 | 2.42 | % | 3.07 | % | 9.7 | % | ||||||||||
20-Year Fixed Rate | 30,692 | 32,748 | 102.53 | 106.70 | 2.55 | % | 4.50 | % | 23.8 | % | ||||||||||||||
30-Year Fixed Rate | 8,180,601 | 8,479,862 | 103.59 | 103.66 | 2.93 | % | 3.70 | % | 8.7 | % | ||||||||||||||
Hybrid ARMs(3) | 488,665 | 498,630 | 102.43 | 102.04 | 2.51 | % | 3.06 | % | 10.3 | % | ||||||||||||||
Total Agency RMBS | 11,675,355 | 12,048,865 | 103.20 | 103.20 | 2.78 | % | 3.52 | % | 9.2 | % | ||||||||||||||
U.S. Treasuries | 1,050,000 | 1,046,934 | 99.81 | 99.71 | 1.96 | % | 1.85 | % | n/a | |||||||||||||||
Total/Weighted-Average | $ | 12,725,355 | $ | 13,095,799 | $ | 102.92 | $ | 102.91 | 2.71 | % | 3.38 | % | 9.2 | % | ||||||||||
(1) | Represents a forward yield and is calculated based on the cost basis of the security at December 31, 2017. Because the forward yield is based on a projected constant prepayment rate ("CPR") and assumes no turnover in the securities on the Company’s portfolio, the Company expects the yield it realizes after December 31, 2017 will vary from those in the table above. The projected CPR is calculated utilizing Yieldbook® software and may reflect adjustments based on our judgment. |
(2) | Represents the actual experienced CPR for those bonds held at December 31, 2017. CPR is a method of expressing the prepayment rate for a mortgage pool that assumes a constant fraction of the remaining principal is prepaid each month. Specifically, the CPR is an annualized version of the experienced prior three-month prepayment rate. Securities with no prepayment history are excluded from this calculation. |
(3) | The weighted-average months to reset of our Hybrid ARM portfolio was 86.08 at December 31, 2017. Months to reset is the number of months remaining before the fixed rate on a Hybrid ARM becomes a variable rate. At the end of the fixed-rate period, the variable rate will be determined by the margin and pre-specified caps of the Hybrid ARM and will reset thereafter annually. |
* Includes TBA Derivatives comprised of forward purchase and sales with a net fair value of $461.1 million at December 31, 2017.
Below is a summary of our Agency RMBS, as of December 31, 2017 by production year (i.e., year in which underlying mortgages were originated), which includes to-be-announced ("TBA") forward settling transactions:
Underlying Mortgage Production Year | 2018 (1) | 2017 | 2016 | 2015 | 2014 | 2013 | 2012 | 2011 | 2010 | 2009 | Total | ||||||||||
Percentage by Production Year | 12.0% | 39.4% | 24.4% | 2.0% | 8.1% | 8.4% | 0.6% | 3.2% | 1.8% | 0.1% | 100.0% | ||||||||||
(1) | Consists of forward settling transactions that will be 2018 production when settled. |
5
We also held $9.8 million of other investments as of December 31, 2017. Other investments are mainly comprised of our net investment in real estate assets at fair value, inclusive of $3.7 million of corresponding mortgage debt, as of December 31, 2017.
Risk Management Strategy
Our Board of Directors exercises its oversight of risk management primarily through meetings of the Board of Directors and the Audit Committee of the Board of Directors (the "Audit Committee") with management. The Board of Directors is responsible for oversight of our overall risk governance structure, risk management and risk assessment guidelines and policies, the nature and extent of risks we take and our capital, liquidity and financing activities. The Audit Committee is responsible for oversight of the quality and integrity of our financial reporting and internal controls over financial reporting, including independent auditor selection, evaluation, review and oversight of the internal audit function (“Internal Audit”), which is outsourced to an independent third-party that reports directly to the Audit Committee. Internal Audit is responsible for performing our internal audit activities, which includes assessing with management and independently validating key controls over financial reporting.
As part of our risk management process, we actively manage the interest rate, liquidity, prepayment and counterparty risks associated with our Agency RMBS portfolio. This process includes monitoring various stress test scenarios on our portfolio. We endeavor to manage our interest rate risk exposure by entering into various derivative instruments ("hedges") with the expectation of minimizing our exposure to potential interest rate mismatches between the interest we earn on our investments and our borrowing costs.
We seek to manage our liquidity risks by monitoring our liquidity position on a daily basis and maintaining a prudent level of leverage based on current market conditions and various other factors, including the health of the financial institutions that lend to us under our repurchase agreements.
We seek to manage our counterparty risk by (i) diversifying our exposure across a broad number of counterparties, (ii) limiting our exposure to any one counterparty, and (iii) monitoring the financial stability and creditworthiness of our counterparties.
While we hedge to attempt to manage our interest rate risk, we do not hedge all of our exposure to changes in interest rates. Our investments vary in interest rate and maturity compared with the rates and duration of the hedges we employ. As a result, it is not possible to insulate our portfolio from all potential negative consequences associated with changes in interest rates in a manner that will allow us to achieve attractive spreads on our portfolio. Consequently, changes in interest rates, particularly short-term interest rates, may significantly influence our net income.
Competition
Our success depends, in large part, on our ability to acquire assets at favorable spreads over our borrowing costs. In acquiring Agency RMBS, we compete with other mortgage REITs, specialty finance companies, public and private funds, commercial and investment banks, the Fed, other governmental entities or government-sponsored entities, commercial finance companies, and other entities. Competition for these assets may result in higher prices and lower yields on our assets.
Employees
As of January 31, 2018, we had 16 employees.
Additional Information
We have made available on our website at www.cysinv.com copies of the committee charters of our Board of Directors, our code of business conduct and ethics, our corporate governance guidelines and all materials we file with the SEC. Information on our website is not part of this Annual Report on Form 10-K. All reports filed with the SEC may be read and copied at the SEC's public reference room at 100 F Street, N.E., Washington, D.C. 20549. Further information regarding the operation of the public reference room may be obtained by calling 1 (800) SEC-0330. In addition, all of our reports filed with the SEC may be obtained at the SEC's website at www.sec.gov.
Item 1A. Risk Factors
Investment in our stock involves significant risks. Our business, financial condition, liquidity, and results of operations could be materially and adversely affected by these risks. The risk factors set forth below do not encompass all risks that may affect us. Some statements in this report, including statements in the following risk factors, constitute forward looking statements. Please refer to the section entitled ”Forward Looking Statements."
6
Risks Related To Our Business
Increases in interest rates and adverse market conditions may negatively affect the value of our investments and increase the cost of our borrowings, which may result in reduced earnings or losses and reduced cash available for distribution to our stockholders.
We invest indirectly in mortgage loans by purchasing Agency RMBS. Generally, an increase in interest rates will result in a decline in the value of Agency RMBS. In addition, net interest income could decrease as interest rates rise. Fannie Mae, Freddie Mac and Ginnie Mae guarantee the principal and interest payments related to the Agency RMBS we own, but we are not protected from declines in market value of our assets caused by changes in interest rates. Declines in the market value of our assets may result in losses to us, which may reduce earnings and negatively affect cash available for distribution to our stockholders.
A significant risk associated with our investment in Agency RMBS is a simultaneous increase of short and long-term interest rates. If long-term rates were to increase, either unexpectedly, significantly, or in an otherwise volatile manner, then the market value of our Agency RMBS would decline, and the duration and weighted-average life of the investments would increase. We could realize a loss if the securities were sold. At the same time, an increase in short-term interest rates would increase the amount of interest charged on our repo borrowings used to finance the purchase of Agency RMBS, which would decrease cash available for distribution to our stockholders. Under this business model, we are particularly susceptible to the negative effects on the value of our investments when short-term rates increase at a faster pace than long-term rates, or even worse, when short-term rates are higher than long-term rates, which is described as an inverted yield curve. Given the ongoing volatile nature of the U.S. economy and the Fed’s recent and expected 2018 increases in short-term interest rates, no guarantee can be given that the yield curve will not become and/or remain inverted.
The market value of our investments may decline without a general increase in interest rates due to adverse market conditions, including, without limitation, supply and demand for the securities, increases in voluntary prepayments for assets we own that are subject to prepayment risk, and widening of credit spreads, among other reasons. If the market value of our assets were to decline, the value of our stock could also decline.
We leverage our portfolio investments in Debt Securities, which may adversely affect our return on our investments and liquidity.
We leverage our portfolio investments in Debt Securities through repo borrowings, and prior to the Final Rule, FHLBC Advances, TBA transactions, and other secured forms of borrowings. Leverage can enhance our potential returns, but can also exacerbate losses and adversely affect our liquidity.
Our access to financing depends on factors over which we may have little to no control, including:
• | general market conditions; |
• | the lender's view of the quality and value of our assets; |
• | the lender's perception of the credit risk of the Company; |
• | the extent of our liquidity as a result of changes in the market value of our investments and derivatives; and |
• | the market price of our common stock. |
Generally, a weakness or volatility in capital markets, residential mortgage markets, or the U.S. economy generally could adversely impact the factors listed above. In addition, such weakness or volatility could adversely affect one or more of our potential lenders. Should our existing lenders be unwilling or unable to provide us with financing, or increase the costs of such financing, our liquidity could be adversely affected.
An increase in our borrowing costs relative to the interest we receive on our assets may impair our profitability and thus our cash available for distribution to our stockholders.
As our repo borrowings mature, we must either enter into new borrowings or liquidate certain of our investments at times when we might not otherwise choose to do so. Lenders may seek to use a maturity date to demand additional terms or increased collateral requirements, which could have an adverse effect on our financial condition and results of operations. An increase in short-term interest rates when we seek new borrowings would reduce the spread between the yield we earn on our assets and the cost of our borrowings, resulting in a reduction to the returns on our assets, which could reduce earnings and in turn reduce the
7
amount of distributions to our stockholders. We generally expect the interest rates tied to our borrowings will change more rapidly in response to a change in interest rates than the interest rates tied to our assets.
Differences in the stated maturity of our fixed rate assets, or in the timing of interest rate adjustments on our adjustable-rate assets, and our borrowings may adversely affect our profitability.
We rely primarily on short-term and/or variable rate borrowings to acquire fixed-rate securities with long-term maturities. In addition, we may have adjustable-rate assets with interest rates that vary over time based upon changes in an objective index, such as LIBOR or the U.S. Treasury rate. These indices generally reflect short-term interest rates but these assets may not reset in a manner that matches our borrowings.
The relationship between short-term and longer-term interest rates is often referred to as the "yield curve." Ordinarily, short-term interest rates are lower than longer-term interest rates. If short-term interest rates rise disproportionately relative to longer-term interest rates (a "flattening" of the yield curve), our borrowing costs may increase more rapidly than the interest income earned on our assets. Because our investments generally bear interest at longer-term rates than we pay on our borrowings, a flattening of the yield curve would tend to decrease our net interest income and the market value of our investment portfolio. Additionally, to the extent cash flows from investments that return scheduled and unscheduled principal are reinvested, the spread between the yields on the new investments and available borrowing rates may decline, which would likely decrease our net income. It is also possible that short-term interest rates may exceed longer-term interest rates (a yield curve "inversion"), in which event, our borrowing costs may exceed our interest income and we could incur operating losses and our ability to make distributions to our stockholders could be adversely affected.
Our lenders may require us to provide additional collateral, especially when the market value of our assets decline, which may restrict us from leveraging our assets as fully as desired and may adversely affect our financial condition and reduce our liquidity, earnings, and cash available for distribution to our stockholders.
We use repo borrowings and, prior to the January 19, 2016 effective date of the Final Rule, which precluded the Company from securing new FHLBC Advances, FHLBC Advances to finance our investments in Debt Securities. Our repurchase agreements allow the lenders, to varying degrees, to determine the market value of the collateral to reflect current market conditions. If the market value of the securities we pledge or sell to a funding source declines, the lender may require us to provide additional collateral or pay down a portion of the funds advanced with minimal notice, known as a margin call. Posting additional collateral reduces our liquidity and limits our ability to leverage our assets, which could adversely affect our earnings, financial condition and results of operations. Additionally, in order to meet a margin call, we may be required to liquidate assets at a disadvantageous time, which could cause us to incur losses and adversely affect our results of operations and financial condition, and may result in a decline in the level of distributions to our stockholders. Margin calls from repo borrowing counterparties are a regular and ordinary occurrence in our business. As of December 31, 2017, we had approximately $1.0 billion, or 64.6% of our stockholders' equity, in Agency RMBS, U.S. Treasuries, cash and cash equivalents available to satisfy future margin calls. In the event we do not have sufficient liquidity to satisfy these margin calls, lending institutions may accelerate the repayment of our indebtedness, increase our borrowing rates, liquidate our collateral or terminate our ability to borrow. Such a situation would likely result in a deterioration of our financial condition and possibly necessitate a filing for protection under the U.S. Bankruptcy Code.
Hedging against interest rate exposure may not insulate us from interest rate risk and may adversely affect our earnings, financial condition, and results of operations.
We engage in certain hedging transactions in an effort to limit our exposure to the rising cost of financing our borrowings in a rising interest rate environment and to minimize the impact rising rates may have on book value that results from a decrease in the value of our assets. Our hedging positions generally increase in value in a rising rate environment. Our hedging transactions may include, among other instruments, interest rate swaps, including cancellable swaps, swaptions, caps, collars and floors. Depending on market conditions, and their specific terms and conditions, swaps, swaptions and caps may increase or decrease the overall volatility of our portfolio. The most significant factor in the performance and value of swaps and caps is the change in the specific interest rate, and other factors that determine the amounts of payments due to and from us. If a swap calls for payments or collateral transfers by us, we are required to make such payments and transfers when due.
Hedging against changes in interest rates does not eliminate the possibility of fluctuations in book value or prevent losses if the values of our investments decline. In addition, our hedging transactions may limit the gain we experience if the values of our assets should increase. Moreover, it is not always possible to hedge against certain interest rate fluctuations or to hedge effectively at an acceptable price.
8
Further, unanticipated changes in interest rates may result in lower net income than if we had not engaged in any hedging transactions. In addition, correlation between price movements of the instruments used in a hedging strategy and price movements in the portfolio positions being hedged may vary. For a variety of reasons, it is extremely difficult to establish perfect correlation between hedging transactions and the assets being hedged, and, as such, our hedging transactions may not achieve the intended hedge and could expose us to risk of loss.
Our hedging transactions vary in scope based on the level and volatility of interest rates, the type of assets held, our outlook, and other relevant and ever-changing market conditions. Hedging transactions may fail to protect or may adversely affect us due to, among other things:
• | interest rate hedging can be expensive, particularly during periods of volatile interest rates; |
• | available interest rate hedging may not correspond directly with the interest rate risk for which protection is sought; |
• | hedge duration of the hedge may not match the related liability duration; |
• | the credit quality of the hedging counterparty may be downgraded to such an extent that it impairs our ability to sell or assign our side of the hedging transaction; and |
• | the counterparty in the hedging transaction may default on its obligation to pay. |
Our hedging transactions may adversely affect our financial condition and results of operations, which could reduce the amount of our distributions to our stockholders and negatively impact our stock price.
Our hedging transactions require us to make cash payments in the future under certain circumstances, such as the early termination of the hedging transaction caused by any event of default or other early termination event, or the decision by a counterparty to request margin securities it is contractually owed under the terms of the hedging transaction. When a hedging transaction is terminated prior to its maturity date, the amount due would be equal to the unrealized loss of the open derivative positions with the respective counterparty and could also include other fees and charges. Such potential payments would be contingent liabilities and therefore might not appear on our balance sheets. Any economic losses related to unforeseen contingent liabilities will be reflected in our financial results of operations, and our ability to fund these obligations will depend on our liquidity and access to capital at the time. The need to fund these obligations could adversely impact our financial condition.
Failure to procure adequate funding and capital would adversely affect our financial condition, results of operations and our ability to distribute cash to our stockholders, and would, in turn, negatively affect the value of our common stock.
We depend upon the availability of adequate funding and capital for our operations. To maintain our status as a REIT, we are required to distribute at least 90% of our REIT taxable income annually, determined without regard to the deduction for dividends paid and excluding net capital gain, to our stockholders and therefore are not able to retain our earnings for new investments. No assurance can be given that any funding or capital will be available to us in the future on terms that are acceptable to us. In the event that we cannot obtain sufficient funding and capital on acceptable terms, there may be a negative impact on the value of our common stock and our ability to make distributions to our stockholders, and our stockholders may lose part or all of their investment.
Clearing facilities or exchanges through which some of our hedging transactions are cleared may increase margin requirements in the event of adverse economic developments.
In response to events having or expected to have adverse economic consequences or which create market uncertainty, clearing facilities or exchanges upon which some of our hedging transactions, such as interest rate swaps, are traded may require us to post additional collateral. In the event that future adverse economic developments or market uncertainty result in increased margin requirements for our hedging transactions, it could materially adversely affect our financial condition and results of operations.
Our use of repo borrowings may give our lenders greater rights in the event that either we or any of our lenders file for bankruptcy, which may make it difficult for us to recover our collateral.
Our repo borrowings may qualify for special treatment under the U.S. Bankruptcy Code, giving our lenders the ability to avoid the automatic stay provisions of the U.S. Bankruptcy Code and take possession of and liquidate our collateral under the repurchase agreements without delay should we file for bankruptcy. In addition, the special treatment of repurchase agreements under the U.S. Bankruptcy Code may make it difficult for us to recover our pledged assets in the event that any of our lenders file for bankruptcy. Thus, the terms of repurchase agreements expose our pledged assets to risk in the event of a bankruptcy filing by either our lenders or us. In addition, if the lender is a broker or dealer subject to the Securities Investor Protection Act of 1970 or
9
an insured depository institution subject to the Federal Deposit Insurance Act, our ability to exercise our rights to recover our collateral under a repurchase agreement, or to be compensated for any damages resulting from the lender's insolvency, may be further limited by those statutes.
Our use of certain hedging transactions may expose us to counterparty risks.
If a counterparty does not perform under the terms of a hedging transaction, we may not receive payments due thereunder, and thus, we may lose any unrealized gain associated with the hedging transaction. The hedged liability could cease to be hedged by the interest rate swap. Additionally, we risk the loss of any collateral we have pledged to secure our obligations under the interest rate swap if the counterparty becomes insolvent or files for bankruptcy. Similarly, if a counterparty fails to perform under the terms of the hedging transaction, we may not receive payments due thereunder that would offset our interest expense. We could then incur a loss for the then remaining fair market value of the hedging transactions.
If the lending institution under one or more of our repo borrowings defaults on its obligation to resell the underlying security back to us at the end of the borrowing term, we will incur a loss on our repurchase transactions.
When we engage in a repo borrowing, we initially sell securities to the counterparty under a master repurchase agreement in exchange for cash from the counterparty. The counterparty is obligated to resell the same securities back to us at the end of the term of the repo borrowing. If a counterparty in a repurchase transaction defaults on its obligation to resell the securities back to us, we will incur a loss on the transaction equal to the amount of the haircut (assuming no change in the value of the securities). Losses incurred on our repurchase transactions would adversely affect our earnings and the amount of our distributions to our stockholders.
If we default on our obligations under our repurchase agreements, we may be unable to establish a suitable replacement facility on acceptable terms or at all.
If we default on our obligations under a repurchase agreement, the counterparty may terminate the agreement, require repayment of all amounts borrowed thereunder, and cease entering into any new repo borrowings with us. In that case, we would likely need to replace any repo borrowings called by such counterparty with another financial institution in order to maintain the leverage of our investment portfolio and carry out our investment strategy. No assurance can be given that we would be able to establish a suitable replacement repurchase facility on acceptable terms or at all.
Loss of our exemption from regulation under the Investment Company Act would negatively affect the value of our common stock and our distributions to our stockholders.
We have operated and intend to continue to operate our business in order to be exempt from registration under the Investment Company Act because we are "primarily engaged in the business of purchasing or otherwise acquiring mortgages and other liens on and interests in real estate." Specifically, we invest and intend to have at least 55% of the assets that we own on an unconsolidated basis consist of qualifying mortgages and other liens and interests in real estate, which are collectively referred to as "qualifying real estate assets," and at least 80% of the assets we own on an unconsolidated basis consist of real estate related assets (including our qualifying real estate assets). We treat Fannie Mae, Freddie Mac and Ginnie Mae whole-pool residential mortgage pass-through securities issued with respect to an underlying pool of mortgage loans in which we hold all of the certificates issued by the pool as qualifying real estate assets.
If we fail to qualify for exemption under the Investment Company Act, or the SEC determines that companies that invest in RMBS can no longer rely on the exemption described above, we could be required to restructure our activities in a manner that, or at a time when, we would not otherwise choose, or we may be required to register as an investment company under the Investment Company Act, either of which would negatively affect the value of our common stock and the amount of distributions we could make to our stockholders.
The federal conservatorship of Fannie Mae and Freddie Mac and as related efforts, along with any potential or proposed changes in laws and regulations affecting the relationship between Fannie Mae and Freddie Mac and the U.S. government, may adversely affect our business.
The payments we receive on Agency RMBS in which we invest depend upon payments on the mortgages underlying the securities and are guaranteed by Ginnie Mae, Fannie Mae or Freddie Mac. Ginnie Mae is part of a U.S. government agency and its guarantees are backed by the full faith and credit of the United States. Fannie Mae and Freddie Mac are GSEs, but their guarantees are not backed by the full faith and credit of the United States.
10
Since 2008, Fannie Mae and Freddie Mac have been in federal conservatorship. The future roles of Fannie Mae and Freddie Mac, if any, could be significantly reduced and the nature of their guarantees could be eliminated or considerably limited relative to historical standards. Any changes to the nature of the guarantees provided by Fannie Mae and Freddie Mac, if any, could redefine what constitutes Agency RMBS and could have broad adverse market implications, and negatively impact our business and results of operations.
Since Fannie Mae and Freddie Mac were placed into federal conservatorship, there have been numerous proposed legislation to restructure the U.S. housing finance system and the operations of Fannie Mae and Freddie Mac. If any new legislation reduces or eliminates the U.S. government's role in providing liquidity for the residential mortgage market, each of Fannie Mae and Freddie Mac could be dissolved and the U.S. government could decide to stop providing support of any kind to the mortgage market. If Fannie Mae or Freddie Mac were eliminated, or their structures were to change radically, we would not be able to acquire Agency RMBS from these entities, which would drastically reduce the amount and type of Agency RMBS available for investment. As of December 31, 2017, substantially all of our investments had the principal and interest guaranteed by either Fannie Mae, Freddie Mac, or Ginnie Mae, or were U.S. Treasuries.
Our income could be negatively affected in a number of ways depending on the manner in which any restructuring or changes to the U.S. housing finance system or the operations of Fannie Mae and Freddie Mac unfold. For example, the current credit support provided by the U.S. Treasury to Fannie Mae and Freddie Mac, and any additional support it may provide in the future, could have the effect of lowering the interest rate we receive from Agency RMBS, thereby tightening the spread between the interest we earn on our portfolio of targeted investments and our cost of financing that portfolio. A reduction in the supply of Agency RMBS could also increase the prices of Agency RMBS we seek to acquire, thereby reducing the spread between the interest we earn on our portfolio of targeted assets and our cost of financing that portfolio.
The effect of any proposed legislation or other actions taken by the U.S. government remains uncertain and continues to evolve. Future legislation, if any, could further change the relationship between Fannie Mae and Freddie Mac and the U.S. government, and could also nationalize or eliminate these GSEs entirely. Any law affecting the GSEs may create market uncertainty and have the effect of reducing the actual or perceived credit quality of securities, either existing or new, issued or guaranteed by Fannie Mae or Freddie Mac. As a result, such laws could increase the risk of loss on investments in Fannie Mae and Freddie Mac Agency RMBS. It is also possible that such laws, if any, could adversely impact the market for such securities and the spreads at which they trade. All of the foregoing could materially adversely affect the pricing, supply, liquidity and value of our target assets and otherwise materially adversely affect our business, operations and financial condition.
Purchases and sales of Agency RMBS by the Fed may adversely affect the price and return associated with Agency RMBS.
The Fed owns approximately $1.7 trillion of Agency RMBS as of December 31, 2017. The Fed's former policy was to reinvest principal payments from its holdings of Agency RMBS into new Agency RMBS purchases. During its meeting in September 2017, the FOMC directed the Open Market Trading Desk (the "Desk") at the Federal Reserve Bank of New York to initiate, in October 2017, the program to gradually reduce the reinvestment of principal payments from the Fed securities holdings. Specifically, the FOMC directed the Desk to reinvest each month’s principal payments from Treasury securities, agency debt, and Agency RMBS only to the extent that such payments exceed gradually rising caps. The Fed also announced at the September 2017 meeting that it would be reducing its holdings of Treasury bonds and mortgage-backed securities below set reinvestment caps, starting in October.
While we cannot predict the impact of these actions by the Fed on the prices and liquidity of Agency RMBS, we expect that during periods in which the Fed purchases significant volumes of Agency RMBS, yields on Agency RMBS may be lower and refinancing volumes may be higher than would have been absent their large scale purchases. The opposite may occur as the Fed begins to reduce its portfolio of Agency RMBS. As a result, returns on Agency RMBS may be adversely affected. There is also a risk that as the Fed reduces its purchases of Agency RMBS or if it decides to sell some or all of its holdings of Agency RMBS, the pricing of our Agency RMBS portfolio may be adversely affected.
We may be subject to adverse legislative or regulatory changes that could have an adverse effect on our financial condition and results of operations and potentially reduce the market price of our common stock.
Laws, regulations, and the administrative interpretations of laws and regulations that impact our business and Maryland corporations, may be amended at any time. In addition, the markets for Agency RMBS and derivatives, including swaps, have been the subject of intense scrutiny. We cannot predict when or if any new law, regulation or administrative interpretation, or any amendment to any existing law, regulation or administrative interpretation, will be adopted or promulgated, or will become effective.
11
Additionally, revisions in these laws, regulations or administrative interpretations could cause us to make changes in our investments. We could be adversely affected by any such change in, or any new, law, regulation or administrative interpretation, which could reduce the market price of our common stock.
We cannot predict the impact, if any, on our earnings or cash available for distributions to our stockholders of the FHFA's proposed revisions to Fannie Mae's, Freddie Mac's and Ginnie Mae's existing infrastructures to align the standards and practices of these entities.
On February 21, 2012, the FHFA released its Strategic Plan for Enterprise Conservatorships, which set forth three objectives for the next phase of the Fannie Mae and Freddie Mac conservatorships: (i) build a new infrastructure for the secondary mortgage market, (ii) gradually contract Fannie Mae and Freddie Mac's presence in the marketplace while simplifying and shrinking their operations, and (iii) maintain foreclosure prevention activities and credit availability for new and refinanced mortgages. On October 4, 2012, the FHFA released its white paper entitled Building a New Infrastructure for the Secondary Mortgage Market, which proposes a new Fannie Mae and Freddie Mac infrastructure built around two principles.
The first principle is to replace Fannie Mae and Freddie Mac's current infrastructures with a common infrastructure that efficiently aligns the standards and practices of the two entities, beginning with overlapping core functions such as issuance, master servicing, bond administration, collateral management and data integration. The FHFA has taken steps to establish a common securitization platform ("CSP") for RMBS reflecting feedback from a broad cross-section of industry participants. In July 2016, the FHFA released an update on the CSP, detailing progress made in the development of a new infrastructure for the securitization of single-family mortgages by Fannie Mae and Freddie Mac. Developing the CSP is a key goal of FHFA's 2014 Strategic Plan for the Conservatorships of Fannie Mae and Freddie Mac, which details the organizational structure of Common Securitization Solutions, LLC, a joint venture company that was established by Fannie Mae and Freddie Mac to lead the work on this project. In December 2016, the FHFA announced that Release 1 of the CSP was successfully implemented on November 21, 2016. This means that Freddie Mac now uses the CSP for data acceptance, issuance support, and bond administration activities related to current single-class, fixed-rate, mortgage-backed securities. The FHFA announced in March 2017 that Release 2, which involves issuance by Freddie Mac and Fannie Mae of a common, single mortgage-backed security, which will be known as the Uniform Mortgage-Backed Security, is expected to occur in the second quarter of 2019. The second principle is to establish an operating framework for Fannie Mae and Freddie Mac that is consistent with housing finance reform progress that encourages and accommodates increased participation of private capital in assuming credit risk associated with the secondary mortgage market.
The FHFA recognizes challenges faced in these formative stages which may or may not be surmountable, such as the absence of meaningful secondary mortgage market mechanisms beyond Fannie Mae, Freddie Mac and Ginnie Mae. As a result, it is uncertain if the proposals will be enacted, what exactly will be enacted, and how they will be enacted. As a result, we cannot be certain what the effects of the enactment will have on our book value, earnings or cash available for distribution to stockholders. Additionally, leadership of the FHFA is set to be transferred in January of 2019, so the policies and priorities of future leadership are unknown at this juncture.
No assurance can be given that the actions taken by the U.S. government for the purpose of seeking to stimulate the economy will achieve their intended effect or will benefit our business, and further, government or market developments could adversely affect us.
The current administration of the U.S. government has announced that it may implement initiatives intended to stimulate the U.S. economy. To the extent these initiatives do not function as intended or interest rates increase as a result of these initiatives, the pricing, supply, liquidity and value of our assets and the availability of financing on attractive terms may be materially adversely affected.
Adoption of the Basel III standards and other proposed supplementary regulatory standards may negatively impact our access to financing or affect the terms of our future financing arrangements.
In response to financial crises and the volatility of financial markets, the Basel Committee on Banking Supervision adopted the Basel III standards several years ago. The final package of Basel III reforms was approved by the G20 leaders in November 2010. In January 2013, the Basel Committee agreed to delay implementation of the Basel III standards and expanded the scope of assets permitted to be included in a bank's liquidity measurement. In 2014, the Basel Committee announced that it would propose additional changes to capital requirements for banks over the next few years.
12
U.S. regulators have elected to implement substantially all of the Basel III standards. Financial institutions have until 2019 to comply with the Basel III standards, which could cause an increase in capital requirements for, and could place constraints on, the financial institutions from which we borrow.
In April 2014, U.S. regulators adopted rules requiring enhanced supplementary leverage ratio standards that took effect in January 2018, which impose more stringent capital requirements than those of Basel III standards for the most systematically significant banking organizations in the U.S. U.S. regulatory bodies are currently reviewing the U.S. enhanced capital and liquidity standards. We have yet to see how these potentially new standards might change, if at all, and how they may affect our business.
Mortgage loan modification programs and future legislative action may adversely affect the value of, and the returns on, the Agency RMBS in which we invest.
Since 2008, the U.S. government, through the Federal Housing Administration ("FHA"), the U.S. Treasury and the Federal Deposit Insurance Corporation ("FDIC"), has implemented a variety of programs designed to provide homeowners with assistance in avoiding residential mortgage loan foreclosures. These and any future programs may involve, among other things, the modification of mortgage loans to reduce the principal amount of the loans or the rate of interest payable on the loans, or to extend the payment terms of the loans. Loan modifications likely would result in increased prepayments on some Agency RMBS. The rate of prepayment could adversely affect the value of our Agency RMBS, liquidity, and results of operations. These initiatives, any future loan modification programs and future legislative or regulatory actions, including amendments to the bankruptcy laws that result in the modification of outstanding mortgage loans, may adversely affect the value of our investments.
Prepayment rates could negatively affect the value of our Agency RMBS, which could result in reduced earnings or losses and negatively affect the cash available for distribution to our stockholders.
Residential mortgage loan terms seldom place restrictions on borrowers' prepayment. Homeowners tend to prepay mortgage loans when applicable mortgage interest rates decline. Consequently, owners of Agency RMBS must reinvest the capital received from prepayments at lower prevailing interest rates. Conversely, homeowners tend not to prepay mortgage loans when mortgage interest rates remain steady or increase. Fannie Mae, Freddie Mac or Ginnie Mae guarantees of principal and interest related to the Agency RMBS we own do not protect us against prepayment risks. The volatility in prepayment rates may affect our ability to maintain targeted amounts of leverage on our Agency RMBS portfolio and may result in reduced earnings or losses for us and negatively affect the cash available for distribution to our stockholders.
Our portfolio investments are recorded at fair value based on market quotations from pricing services and broker dealers. The price of our common stock could be adversely affected if our determinations regarding the fair value of these investments were materially higher than the values that we ultimately realize upon their disposal.
We value our investments each month at fair value as determined by our management based on market quotations from pricing services and brokers/dealers. If we were to liquidate a particular asset, the realized value may be more or less than the amount at which such asset is valued.
A small portion of our investments may be in the form of securities that are not actively traded. The fair value of securities and other investments that are not actively traded may not be readily determinable. Quotations and valuations for securities that are not actively traded may be based on estimates, and our determinations of fair value may differ materially from the values that would have been used if an active market for these securities existed.
The price of our common stock could be adversely affected if our determinations of the fair value of our investments were materially higher than the price that we realize upon their disposal.
It may be uneconomical to "roll" our TBA dollar roll transactions or we may be unable to meet margin calls on our TBA contracts, which could negatively affect our financial condition and results of operations.
We may utilize TBA dollar roll transactions as a means of investing in and financing Agency RMBS. TBA contracts enable us to purchase or sell, for future delivery, Agency RMBS with certain principal and interest terms and certain types of collateral, but the particular Agency RMBS to be delivered are not identified until shortly before the TBA settlement date. Prior to settlement of the TBA contract we may choose to move the settlement of the securities out to a later date by entering into an offsetting position (referred to as a "pair off"), net settling the paired off positions for cash, and simultaneously purchasing a similar TBA contract for a later settlement date, collectively referred to as a "dollar roll." The Agency RMBS purchased for a forward settlement date under the TBA contract are typically priced at a discount to Agency RMBS for settlement in the current month.
13
This difference (or discount) is referred to as the "price drop." The price drop is the economic equivalent of net interest income earned from carrying the underlying Agency RMBS over the roll period (interest income less implied financing cost) and is commonly referred to as "dollar roll income." Consequently, dollar roll transactions and such forward purchases of Agency RMBS represent a form of off-balance sheet financing and increase our "at risk" leverage.
Under certain market conditions, TBA dollar roll transactions may result in negative carry income whereby the Agency RMBS purchased for a forward settlement date under the TBA contract are priced at a premium to Agency RMBS for settlement in the current month. Additionally, sales of some or all of the Fed's holdings of Agency RMBS or declines in purchases of Agency RMBS by the Fed could adversely impact the dollar roll market. Under such conditions, it may be uneconomical to roll our TBA positions prior to the settlement date and we could have to take physical delivery of the underlying securities and settle our obligations for cash. We may not have sufficient funds or alternative financing sources available to settle such obligations. In addition, pursuant to the margin provisions established by the Mortgage-Backed Securities Division ("MBSD") of the Fixed Income Clearing Corporation, we are subject to margin calls on our TBA contracts. Further, our prime brokerage agreements may require us to post additional margin above the levels established by the MBSD. Negative carry income on TBA dollar roll transactions or failure to procure adequate financing to settle our obligations or meet margin calls under our TBA contracts could result in defaults or force us to sell assets under adverse market conditions and adversely affect our financial condition and results of operations.
Our forward settling transactions, including TBA transactions, subject us to certain risks, including price risks and counterparty risks.
We purchase a substantial portion of our Agency RMBS through forward settling transactions, including TBAs. In a forward settling transaction, we enter into a forward purchase agreement with a counterparty to purchase either (i) an identified Agency RMBS, or (ii) a TBA, or to-be-issued, Agency RMBS with certain terms. As with any forward purchase contract, the value of the underlying Agency RMBS may decrease between the contract date and the settlement date. Furthermore, a transaction counterparty may fail to deliver the underlying Agency RMBS at the settlement date. If any of these risks were to occur, our financial condition and results of operations may be materially adversely affected.
We are dependent on our Chief Executive Officer, President, and Chief Investment Officer, and the loss of this individual could materially adversely affect our business, financial condition and results of operations and our ability to pay distributions to our stockholders.
We depend on the efforts of our key officers and employees, especially Kevin E. Grant, our Chief Executive Officer, President and Chief Investment Officer. Although we have an employment agreement with Mr. Grant, we cannot be certain that he will remain employed with us. The loss of Mr. Grant's services could have a material adverse effect on our business, financial condition and results of operations and our ability to pay distributions to our stockholders.
We operate in a highly competitive market for investment opportunities.
Many enterprises engage in investing in or managing the types of investments that we make including mortgage REITs, specialty finance companies, public and private funds, commercial and investment banks, the Fed, other governmental entities or GSEs, commercial finance companies, and others. Some of these enterprises are substantially larger than we are, have access to greater financial resources, and employ more technical and marketing resources than we do. Several other REITs may have investment objectives that overlap with ours, which may create competition for investment opportunities. Some of these enterprises may have a lower cost of funds and access to funding sources than are available to us. In addition, some of these enterprises may have higher risk tolerances or different risk assessments, which could allow them to consider a wider variety of investments and establish more relationships than us. We can provide no assurances that the competitive pressures we face will not have a material adverse effect on our business, financial condition and results of operations. As a result, we may not be able to take advantage of attractive investment opportunities from time to time, and cannot offer assurance that we will be able to identify and make investments consistent with our investment objectives.
Our Board of Directors does not approve each of our investment decisions, and may change our investment guidelines without notice or stockholder consent, which may result in riskier investments and could materially adversely affect our business, financial condition, results of operations and our ability to pay distributions to our stockholders.
Our Board of Directors periodically reviews our investment guidelines, investment portfolio, and potential investment strategies. However, our directors do not pre-approve individual investments. Management is responsible for day-to-day portfolio composition within our investment guidelines, and within those guidelines, management has discretion to significantly change the composition of the portfolio. In addition, in conducting periodic reviews, the directors may rely primarily on information provided
14
to them by our management. Our Board of Directors has the authority to change our investment guidelines at any time without notice to or consent of our stockholders. To the extent that our investment guidelines change in the future, we may make investments that are different from, and possibly riskier than, the investments described in this Annual Report on Form 10-K. A change in our investment guidelines may increase our exposure to interest rate and real estate market fluctuations.
Certain hedging instruments are not traded on regulated exchanges, guaranteed by an exchange or its clearing-house, or regulated by U.S. or foreign governmental authorities.
The cost of using hedging instruments increases as the period covered by the instrument lengthens and during periods of rising and/or volatile interest rates. Despite this, we may increase our hedging activity, and thus increase our hedging costs, during periods when interest rates are volatile or rising. In these cases, our hedging costs will increase.
In addition, certain hedging transactions involve greater risk because they are not traded on regulated exchanges, guaranteed by an exchange or its clearing-house, or regulated by U.S. or foreign governmental authorities. Consequently, there may be no, or limited, requirements with respect to record keeping, financial responsibility or segregation of customer funds and positions. Furthermore, the enforceability of agreements underlying derivative transactions may depend on compliance with applicable statutory and commodity and other regulatory requirements and, depending on the identity of the counterparty, applicable international requirements. The business failure of a hedging counterparty with whom we enter into a hedging transaction may result in a default. Default by a party with whom we enter into a hedging transaction may result in the loss of unrealized profits and force us to cover our resale commitments, if any, at the then current market price. In addition, we may not always be able to dispose of or close out a hedging transaction without the consent of the hedging counterparty, and we may not be able to enter into an offsetting contract to cover our risk. No assurance can be given that a liquid secondary market will exist for hedging instruments purchased or sold, and we may be required to maintain a position until exercise or expiration, which could result in losses.
We are highly dependent on communications and information systems operated by third parties, and systems failures could significantly disrupt our business, which may, in turn, negatively affect the market price of our common stock and our ability to pay distributions to our stockholders.
Our business is highly dependent on sophisticated communications, information technology systems, networks and infrastructure (our "Systems") that allow us to monitor, value, buy, sell, finance, and hedge our investments, and manage our day-to-day operations. Our Systems are primarily operated by third parties and, as a result, we have limited ability to ensure their continued effective operation. In the event of failure or interruption to any of our Systems, we will have limited ability to affect the timing and success of restoration. Any failure or interruption to any of our Systems could create delays or other problems in our securities trading activities, including Agency RMBS trading activities, which could have a material adverse effect on our operating results and negatively affect the market price of our common stock and our ability to make distributions to our stockholders.
If we issue debt securities or equity securities that are senior to our stock for the purposes of dividend and liquidating distributions, our operations may be restricted, we will be exposed to additional risk and the market price of our common stock could be adversely affected.
If we decide to issue debt securities in the future, it is likely that such securities will be governed by an indenture or other instrument containing covenants restricting our operating flexibility. Additionally, any convertible or exchangeable securities that we issue in the future may have rights, preferences and privileges more favorable than those of our common stock. We have issued and outstanding an aggregate of 3,000,000 shares of our 7.75% Series A Cumulative Redeemable Preferred Stock and 8,000,000 shares of our 7.50% Series B Cumulative Redeemable Preferred Stock. Other classes or series of our preferred stock, if issued, could have a preference on liquidating distributions or a preference on dividend payments that could limit our ability to make a distribution to the holders of our common stock. We, and indirectly our stockholders, will bear the cost of issuing and servicing such securities. Holders of debt securities may be granted specific rights, including, but not limited to, the right to hold a perfected security interest in certain of our assets, the right to accelerate payments due under the indenture, rights to restrict dividend payments and rights to approve the sale of assets. Such additional restrictive covenants, operating restrictions and preferential dividends could have a material adverse effect on our operating results and negatively affect the market price of our common stock and our ability to pay distributions to our stockholders.
A security breach or a cyber-attack could adversely affect our business.
In addition to general cyber-security threats, the business we conduct with our vendors and counterparties exposes us to inherent cyber-security risks. Despite well-established cyber-security and other preventative measures, including training and testing to ensure business continuity, our Systems may be vulnerable to attacks or other events beyond our control that
15
could interrupt or interfere with our business continuity. Should such an attack or event occur, our ability to effectively utilize our Systems, and protect our information would be impaired, and could adversely affect our business.
CMOs may be subject to greater risks than whole-pool Agency RMBS.
Our investment guidelines allow us to invest in CMOs. CMOs are securitizations issued by a government agency or a GSE that are collateralized by Agency RMBS that are divided into various tranches with different characteristics (such as different maturities or different coupon payments), and, therefore, may carry greater risk than an investment in whole-pool Agency RMBS. For example, certain CMO tranches (such as interest-only securities, principal-only securities, support securities and securities purchased at a significant premium) are more sensitive to prepayment risks than other tranches or whole-pool Agency RMBS. In addition, the yield on floating interest rate tranches and inverse floating rate tranches are sensitive to changes in the interest rate index used to calculate the coupon on such classes. Although we have not invested in CMOs to date, if we were to invest in CMO tranches that were more sensitive to prepayment risks relative to other CMO tranches or whole-pool Agency RMBS, we may increase our portfolio-wide prepayment and interest rate risk.
We may invest in securities in the developing Credit risk transfer sector that are subject to mortgage credit risk.
We may invest in securities in the developing Credit risk transfer sector (“CRT Sector”). The CRT Sector is currently comprised of CAS and STACR debt securities, which are risk sharing transactions issued by Fannie Mae and Freddie Mac, respectively. The securities issued in the CRT Sector are designed to synthetically transfer mortgage credit risk from Fannie Mae and Freddie Mac to private investors. Currently, CAS and STACR transactions are structured, unsecured and unguaranteed bonds issued by Fannie Mae and Freddie Mac, respectively, whose principal payments are determined by the delinquency and prepayment experience of a reference pool of mortgages originated and guaranteed by Fannie Mae or Freddie Mac, respectively, in a particular quarter. The holder of these securities is subject to the risk that the borrowers may default on their obligations to make full and timely payments of principal and interest. Investments in securities in the CRT Sector could cause us to incur losses of income from, and/or losses in market value relating to, those assets if there are defaults of principal and/or interest on the pool of mortgages referenced in the transaction.
Failure to obtain and maintain an exemption from being regulated as a commodity pool operator could subject us to additional regulation and compliance requirements and may result in fines and other penalties, which could materially adversely affect our business, financial condition and results of operations.
The Dodd-Frank Wall Street Reform and Consumer Protection Act (the "Dodd-Frank Act") established a comprehensive regulatory framework for derivative transactions commonly referred to as "swaps." As a result, an investment fund that trades in swaps may be considered a "commodity pool," which would cause its operators (and in some cases the fund's directors) to be regulated as "commodity pool operators" ("CPOs"). Under new rules adopted by the U.S. Commodity Futures Trading Commission (the "CFTC"), those funds that become commodity pools solely because of their use of swaps must register with the National Futures Association ("NFA"). Registration requires compliance with the CFTC's regulations and the NFA's rules with respect to capital raising, disclosure, reporting, recordkeeping and other business conduct. However, the CFTC's Division of Swap Dealer and Intermediary Oversight has issued a no-action letter saying, although it believes that mortgage REITs are properly considered commodity pools, it would not recommend that the CFTC take enforcement action against the operator of a mortgage REIT who does not register as a CPO if, among other things, the mortgage REIT limits the initial margin and premiums required to establish its swaps, futures and other commodity interest positions to not more than five percent of its total assets, the mortgage REIT limits the net income derived annually from those commodity interest positions that are not qualifying hedging transactions to less than five percent of its gross income and interests in the mortgage REIT are not marketed to the public as or in a commodity pool or otherwise as or in a vehicle for trading in the commodity futures, commodity options or swaps markets.
We do not currently engage in speculative derivative activities or other non-hedging transactions using swaps, futures or options on futures. We do not use these instruments for the purpose of trading in commodity interests, and we do not consider our Company or our operations to be a commodity pool as to which CPO registration or compliance is required. We have submitted the required filing to claim the no-action relief afforded by the above-described no-action letter. Consequently, we will be restricted to operating within the parameters discussed in the no-action letter and will not enter into hedging transactions covered by the no-action letter if they would cause us to exceed the limits set forth in the no-action letter.
The CFTC has substantial enforcement power with respect to violations of the laws over which it has jurisdiction, including its anti-fraud and anti-manipulation provisions. For example, the CFTC may suspend or revoke the registration of or the no-action relief afforded to a person who fails to comply with commodities laws and regulations, prohibit such a person from trading or doing business with registered entities, impose civil money penalties, require restitution and seek fines or imprisonment for criminal
16
violations. Additionally, a private right of action exists against those who violate the laws over which the CFTC has jurisdiction or who willfully aid, abet, counsel, induce or procure a violation of those laws. In the event that we fail to comply with statutory requirements relating to derivatives or with the CFTC's rules thereunder, including the no-action letter described above, we may be subject to significant fines, penalties and other civil or governmental actions or proceedings, any of which could have a materially adverse effect on our business, financial condition and results of operations.
We may enter into new lines of business, acquire other companies or engage in other strategic initiatives, each of which may result in additional risks and uncertainties in our businesses.
We may pursue growth through acquisitions of other companies or other strategic initiatives that may require approval by our Board of Directors, stockholders, or both. To the extent we pursue strategic investments or acquisitions, undertake other strategic initiatives or consider new lines of business, we will face numerous risks and uncertainties, including risks associated with:
• the availability of suitable opportunities;
• the level of competition from other companies that may have greater financial resources;
• our ability to value potential acquisition opportunities accurately and negotiate acceptable terms for those opportunities;
• the required investment of capital and other resources;
• the lack of availability of financing and, if available, the terms of any financings;
• | the possibility that we have insufficient expertise to engage in such activities profitably or without incurring inappropriate amounts of risk; |
• the diversion of management’s attention from our core businesses;
• assumption of liabilities in any acquired business;
• the disruption of our ongoing businesses;
• the increasing demands on or issues related to combining or integrating operational and management systems and controls;
• compliance with additional regulatory requirements; and
• costs associated with integrating and overseeing the operations of the new businesses.
Entry into certain lines of business may subject us to new laws and regulations with which we are not familiar, or from which we are currently exempt, and may lead to increased litigation and regulatory risk. In addition, if a new business generates insufficient revenues or if we are unable to efficiently manage our expanded operations, our results of operations will be adversely affected. Our strategic initiatives may include joint ventures, in which case we will be subject to additional risks and uncertainties in that we may be dependent upon, and subject to liability, losses or reputational damage relating to, systems, controls and personnel that are not under our control.
Risks Related to Our Organization and Structure
Our charter and bylaws contain certain anti-takeover provisions that may inhibit potential acquisition bids that stockholders may consider favorable.
Our charter and bylaws contain provisions that may have an anti-takeover effect and may have the effect of delaying, deferring or preventing a change in control of us or the removal of existing directors and, as a result, could prevent our stockholders from being paid a premium for their common stock over the then-prevailing market price. In order to qualify as a REIT, not more than 50% of the value of our outstanding capital stock may be owned, directly or constructively, by five or fewer individuals (as defined under the Internal Revenue Code of 1986, as amended (the "Code"), to include natural persons and certain entities) during the second half of any calendar year and our shares must be beneficially owned by 100 or more persons during at least 335 days of a taxable year of twelve months or during a proportionate part of a shorter taxable year. To assist us in meeting these requirements, subject to some exceptions, our charter generally prohibits any stockholder from beneficially or constructively owning more than 9.8% in value or number of shares, whichever is more restrictive, of any class or series of our outstanding capital stock unless an exemption is granted by our Board of Directors in its sole discretion.
This ownership restriction may:
• | discourage a tender offer or other transactions or a change in the composition of our Board of Directors or control that might involve a premium price for our shares or otherwise be in the best interests of our stockholders; or |
• | result in shares issued or transferred in violation of such restriction being automatically transferred to a trust for a charitable beneficiary and thereby resulting in a forfeiture of such shares. |
17
Our charter permits our Board of Directors to issue common or preferred stock with terms that may discourage a third party from acquiring us. Our charter permits our Board of Directors to amend our charter, without approval of our stockholders, to increase the total number of authorized shares of stock or the number of shares of any class or series, and to cause the issuance of common or preferred stock, having preferences, conversion or other rights, voting powers, restrictions, limitations as to distributions, qualifications, or terms or conditions of redemption as determined by our Board of Directors. Thus, our Board of Directors could authorize the issuance of common or preferred stock with terms and conditions that could have the effect of discouraging a takeover or other transaction in which holders of some or a majority of our shares might receive a premium for their shares over the then-prevailing market price of our shares.
Certain provisions of Maryland law could inhibit changes in control.
Certain provisions of the Maryland General Corporation Law ( the "MGCL") may have the effect of inhibiting a third party from making a proposal to acquire us or impeding a change of control under circumstances that otherwise could provide our stockholders with the opportunity to realize a premium over the then-prevailing market price of our common stock, including:
• | "business combination" provisions that, subject to limitations, prohibit certain business combinations between us and an "interested stockholder" (defined generally as any person who beneficially owns 10% or more of the voting power of our shares or an affiliate thereof) for five years after the most recent date on which the stockholder becomes an interested stockholder, and thereafter special stockholder voting requirements on these combinations; and |
• | "control share" provisions that provide that "control shares" of our Company (defined as shares which, when aggregated with other shares controlled by the stockholder, entitle the stockholder to exercise one of three increasing ranges of voting power in electing directors) acquired in a "control share acquisition" (defined as the direct or indirect acquisition of ownership or control of "control shares") have no voting rights except to the extent approved by our stockholders by the affirmative vote of at least two-thirds of all the votes entitled to be cast on the matter, excluding all interested shares. |
We have elected to opt out of these provisions of the MGCL, in the case of the business combination provisions of the MGCL, by resolution of our Board of Directors, and in the case of the control share provisions of the MGCL, pursuant to a provision in our bylaws. However, our Board of Directors may by resolution elect to repeal the foregoing opt-outs from the business combination provisions of the MGCL, and we may, by amendment to our bylaws, opt in to the control share provisions of the MGCL in the future.
Our rights and the rights of our stockholders to take action against our directors and officers are limited, which could limit our stockholders’ recourse in the event of actions not in our stockholders’ best interests.
Our charter limits the liability of our directors and officers to us and our stockholders for money damages, except for liability resulting from:
• | actual receipt of an improper benefit or profit in money, property or services; or |
• | a final judgment based upon a finding of active and deliberate dishonesty by the director or officer that was material to the cause of action adjudicated. |
We have entered into indemnification agreements with our directors and executive officers that obligate us to indemnify them to the maximum extent permitted by Maryland law. In addition, our charter authorizes our company to obligate itself to indemnify our present and former directors and officers for actions taken by them in those capacities to the maximum extent permitted by Maryland law. Our bylaws require us, to the maximum extent permitted by Maryland law, to indemnify each present or former director or officer who has been successful in the defense of any proceeding to which he or she is made, or threatened to be made, a party by reason of his or her service to us. In addition, we may be obligated to fund the defense costs incurred by our directors and officers.
Tax Risks
Our qualification as a REIT involves complying with highly technical and complex provisions of the Code.
Our qualification as a REIT involves the application of highly technical and complex provisions of the Code for which only limited judicial and administrative authorities exist. Even a technical or inadvertent violation could jeopardize our REIT qualification. Our qualification as a REIT will depend on our satisfaction of certain asset, income, organizational, distribution,
18
stockholder ownership and other requirements on a continuing basis. New legislation, court decisions or administrative guidance, in each case possibly with retroactive effect, may make it more difficult or impossible for us to qualify as a REIT. Certain rules applicable to REITs are particularly difficult to interpret or to apply.
Failure to qualify as a REIT would subject us to federal and state income tax at regular corporate rates, which could adversely affect our financial condition and results of operations, reduce the cash available for distribution to our stockholders, and potentially result in a decrease in the value of our common stock.
We operate in a manner that is intended to cause us to qualify as a REIT for federal income tax purposes. The federal income tax laws governing REITs are complex, and interpretations of the federal income tax laws governing qualification as a REIT are limited. Qualifying as a REIT requires us to meet various tests regarding the nature of our assets and our income, the ownership of our outstanding stock, and the amount of our distributions on an ongoing basis.
Our ability to satisfy the asset tests depends upon the characterization and fair market values of our assets, some of which may not be susceptible to a precise valuation, and for which we may not obtain independent appraisals. Our compliance with the REIT income and quarterly asset requirements also depends upon our ability to successfully manage the composition of our income and assets on an ongoing basis. Although we intend to operate so that we will qualify as a REIT, given the highly complex nature of the rules governing REITs, the ongoing importance valuations, and the possibility of future changes in our circumstances, no assurance can be given that we will so qualify for any particular year.
If we fail to qualify as a REIT in any calendar year, we would be required to pay federal and state income tax, including any applicable alternative minimum tax, on our taxable income at regular corporate rates, and dividends paid to our stockholders would not be deductible by us in computing our taxable income. Further, if we fail to qualify as a REIT, we might need to borrow money or sell assets in order to pay any resulting taxes. Our payment of income tax would decrease the amount of our income available for distribution to our stockholders. Furthermore, if we fail to maintain our qualification as a REIT, we no longer would be required to distribute substantially all of our REIT taxable income to our stockholders. Unless our failure to qualify as a REIT was subject to relief under federal tax laws, we could not re-elect to qualify as a REIT until the fifth calendar year following the year in which we failed to qualify.
Our ability to invest in and dispose of securities through forward settling transactions could be limited by our REIT status, and we could lose our REIT status as a result of these investments.
We purchase a material portion of our Agency RMBS through contracts for forward settling transactions, including TBAs. In certain instances, rather than take delivery of the Agency RMBS subject to a contract for a forward settling transaction, we will dispose of the contract for a forward settling transaction through a dollar roll transaction in which we agree to purchase similar securities in the future at a predetermined price or otherwise, which may result in the recognition of income or gains. We account for dollar roll transactions as purchases and sales. The law is unclear regarding whether contracts for forward settling transactions will be qualifying assets for the 75% asset test and whether income and gains from dispositions of contracts for forward settling transactions will be qualifying income for the 75% gross income test.
Until such time as we seek and receive a favorable private letter ruling from the Internal Revenue Service (the "IRS"), or we are advised by counsel that contracts for forward settling transactions should be treated as qualifying assets for purposes of the 75% asset test, we will limit our net investment in contracts for forward settling transactions and any non-qualifying assets to no more than 25% of our assets at the end of any calendar quarter and will limit our investments in contracts for forward settling transactions with a single counterparty to no more than 5% of our total assets at the end of any calendar quarter. Further, until such time as we seek and receive a favorable private letter ruling from the IRS or we are advised by counsel that income and gains from the disposition of contracts for forward settling transactions should be treated as qualifying income for purposes of the 75% gross income test, we will limit our gains from dispositions of contracts for forward settling transactions and any non-qualifying income to no more than 25% of our gross income for each calendar year. Accordingly, our ability to purchase Agency RMBS through contracts for forward settling transactions and to dispose of contracts for forward settling transactions, through dollar roll transactions or otherwise, could be limited.
Moreover, even if we are advised by counsel that contracts for forward settling transactions should be treated as qualifying assets or that income and gains from dispositions of contracts for forward settling transactions should be treated as qualifying income, it is possible that the IRS could successfully take the position that such assets are not qualifying assets and such income is not qualifying income. In that event, we could be subject to a penalty tax or we could fail to qualify as a REIT if (i) the value of our contracts for forward settling transactions, together with our non-qualifying assets for the 75% asset test, exceeded 25% of our gross assets at the end of any calendar quarter or if the value of our investments in contracts for forward settling transactions
19
with a single counterparty exceeded 5% of our total assets at the end of any calendar quarter or (ii) our income and gains from the disposition of contracts for forward settling transactions, together with our non-qualifying income for the 75% gross income test, exceeded 25% of our gross income for any taxable year.
Complying with REIT requirements may cause us to forego otherwise attractive opportunities.
To qualify as a REIT for federal income tax purposes, we must continually satisfy tests concerning, among other things, the sources of our income, the nature and diversification of our assets, the amounts we distribute to our stockholders and the ownership of our stock. In order to meet these tests, we may be required to forego attractive business or investment opportunities. Thus, compliance with the REIT requirements may hinder our ability to operate solely on the basis of maximizing profits.
Liquidation of assets may jeopardize our REIT qualification.
To qualify as a REIT, we must comply with requirements regarding our assets and our sources of income. If we are compelled to liquidate our investments to repay obligations to our lenders, we may be unable to comply with these requirements, ultimately jeopardizing our qualification as a REIT, or we may be subject to a 100% tax on any resultant gain if we sell assets that are treated as dealer property or inventory.
Failure to make required distributions would subject us to tax, which would reduce the cash available for distribution to our stockholders.
In order to qualify as a REIT, an entity must distribute to its stockholders, each calendar year, at least 90% of its REIT taxable income, determined without regard to the deduction for dividends paid and excluding net capital gain. To the extent that a REIT satisfies the 90% distribution requirement, but distributes less than 100% of its taxable income, it will be subject to federal corporate income tax on its undistributed income. In addition, a REIT will incur a 4% nondeductible excise tax on the amount, if any, by which its distributions in any calendar year are less than the sum of:
• | 85% of its REIT ordinary income for that year; |
• | 95% of its REIT capital gain net income for that year; and |
• | 100% of its undistributed taxable income from prior years. |
We intend to continue to make distributions in the future to our stockholders in a manner intended to satisfy the 90% distribution requirement and to avoid both federal corporate income tax and the 4% nondeductible excise tax. However, there is no requirement that taxable REIT subsidiaries ("TRSs") distribute their after-tax net income to their parent REIT or their stockholders, and if we utilize a TRS, it may determine not to make any distributions to us.
Our taxable income may substantially exceed our net income as determined based on GAAP because, for example, realized capital losses will be deducted in determining our GAAP net income, but may not be deductible in computing our taxable income. In addition, we may invest in assets that generate taxable income in excess of economic income or in advance of the corresponding cash flow from the assets, referred to as phantom income. Although some types of phantom income are excluded in determining the 90% distribution requirement, we will incur corporate income tax and the 4% nondeductible excise tax with respect to any phantom income items if we do not distribute those items on an annual basis. As a result of the foregoing, we may generate less cash flow than taxable income in a particular year. In that event, we may be required to use cash reserves, incur debt or liquidate non-cash assets at rates or times that we regard as unfavorable in order to satisfy the distribution requirement and to avoid federal corporate income tax and the 4% nondeductible excise tax in that year.
We may satisfy the 90% distribution test with taxable distributions of our stock or debt securities. On August 11, 2017, the IRS issued Revenue Procedure 2017-45 authorizing elective cash/stock dividends to be made by publicly offered REITs (e.g., REITs that are required to file annual and periodic reports with the SEC under the Exchange Act). Pursuant to Revenue Procedure 2017-45, effective for distributions declared on or after August 11, 2017, the IRS will treat the distribution of stock pursuant to an elective cash/stock dividend as a distribution of property under Section 301 of the Code (e.g., a dividend), as long as at least 20% of the total dividend is available in cash and certain other parameters detailed in the Revenue Procedure are satisfied. Although we have no current intention of paying dividends in our own stock, if in the future we choose to pay dividends in our own stock, our stockholders may be required to pay tax in excess of the cash that they receive.
20
Complying with REIT requirements may limit our ability to hedge effectively.
The REIT provisions of the Code limit our ability to hedge Agency RMBS and related borrowings. Under these provisions, we must limit our aggregate gross income from non-qualifying hedges, fees, and certain other non-qualifying sources to 5% or less of our annual gross income. As a result, we might in the future have to limit our use of advantageous hedging techniques or implement those hedges through a domestic TRS. This could increase the cost of our hedging activities, because a domestic TRS would be subject to tax on gains, or leave us exposed to greater risks associated with changes in interest rates than we would otherwise want to bear.
Legislative, regulatory or administrative changes could adversely affect us or our stockholders.
Legislative, regulatory or administrative changes could be enacted or promulgated at any time, either prospectively or with retroactive effect, and may adversely affect us and/or our stockholders.
The recently-enacted Tax Cuts and Jobs Act (the “TCJA”) makes significant changes to the U.S. federal income tax rules for taxation of individuals and corporations. In the case of individuals, the tax brackets have been adjusted, the top federal income rate has been reduced to 37%, special rules reduce taxation of certain income earned through pass-through entities and reduce the top effective rate applicable to ordinary dividends from REITs to 29.6% (through a 20% deduction for ordinary REIT dividends received) and various deductions have been eliminated or limited, including limiting the deduction for state and local taxes to $10,000 per year. Most of the changes applicable to individuals are temporary and apply only to taxable years beginning after December 31, 2017 and before January 1, 2026. The top corporate income tax rate has been reduced to 21%. There are only minor changes to the REIT rules (other than the 20% deduction applicable to individuals for ordinary REIT dividends received). The TCJA makes numerous other large and small changes to the tax rules that do not affect REITs directly but may affect our stockholders and may indirectly affect us. For example, the TCJA amends the rules for accrual of income so that income is taken into account no later than when it is taken into account on applicable financial statements, even if financial statements take such income into account before it would accrue under the original issue discount rules, market discount rules or other Code rules. Such rule may cause us to recognize income before receiving any corresponding receipt of cash. In addition, the TCJA reduces the limit for individual’s mortgage interest expense to interest on $750,000 of mortgages and does not permit deduction of interest on home equity loans (after grandfathering all existing mortgages). Such change and the reduction in deductions for state and local taxes (including property taxes) may adversely affect the residential mortgage markets in which we invest.
Prospective stockholders are urged to consult with their tax advisors with respect to the status of the TCJA and any other regulatory or administrative developments and proposals and their potential effect on investment in our common stock.
The taxation of corporate dividends may adversely affect the value of our stock.
The maximum tax rate applicable to "qualified dividend income" payable to U.S. stockholders that are taxed at individual rates is 20% (plus the 3.8% surtax on net investment income, if applicable). Dividends payable by REITs, however, are generally not eligible for the reduced rates on qualified dividend income. Rather, under the recently enacted TCJA, REIT dividends constitute “qualified business income” and thus a 20% deduction is available to individual taxpayers with respect to such dividends, resulting in a 29.6% maximum federal tax rate (plus the 3.8% surtax on net investment income, if applicable) for individual U.S. stockholders. Additionally, without further legislative action, the 20% deduction applicable to REIT dividends will expire on January 1, 2026. The more favorable rates applicable to regular corporate qualified dividends could cause investors who are taxed at individual rates to perceive investments in REITs to be relatively less attractive than investments in the stocks of non-REIT corporations that pay dividends, which could adversely affect the value of the shares of REITs, including our stock.
The failure of Agency RMBS subject to a repurchase agreement to qualify as real estate assets would adversely affect our ability to qualify as a REIT.
We have entered into sale and repurchase agreements under which we nominally sold certain of our Agency RMBS to a counterparty and simultaneously entered into an agreement to repurchase the sold assets. We believe that we are treated for federal income tax purposes as the owner of the Agency RMBS that are the subject of any such agreement notwithstanding that such agreements may transfer record ownership of such assets to the counterparty during the term of the agreement. It is possible, however, that the IRS could successfully assert that we did not own the Agency RMBS during the term of the sale and repurchase agreement, in which case we could fail to qualify as a REIT.
21
Even if we remain qualified as a REIT, we may face other tax liabilities that reduce our cash flow.
Even if we remain qualified for federal income taxation as a REIT, we may be subject to certain federal, state and local taxes on our income and assets. Any of these taxes would decrease cash available for distribution to our stockholders.
Item 1B. Unresolved Staff Comments
None.
Item 2. Properties
Our principal executive offices are located at 500 Totten Pond Road, 6th Floor, Waltham, Massachusetts 02451, and the telephone number of our main office is (617) 639-0440. The Company also has an office at 60 Columbus Circle, 20th Floor, New York, New York 10023.
Item 3. Legal Proceedings
The Company is not currently subject to any material legal proceedings.
Item 4. Mine Safety Disclosures
None.
PART II
Item 5. Market for Registrant's Common Equity, Related Stockholder Matters and Issuer Purchases of Equity Securities
Market and Dividend Information
Our common stock has been listed and is traded on the New York Stock Exchange ("NYSE") under the symbol "CYS" since June 12, 2009. We intend to continue to pay quarterly dividends to holders of shares of common stock. Future dividends will be at the discretion of the Board of Directors and will depend on our earnings and financial condition, maintenance of our REIT qualification, restrictions on making distributions under Maryland law and such other factors as our Board of Directors deems relevant. The following table presents the high and low sales prices for our common stock as reported by the NYSE and dividends declared for the period from January 1, 2016 to December 31, 2017.
High | Low | Common Dividends Declared Per Share | ||||||||||
Quarter Ended December 31, 2017 | $ | 8.72 | $ | 7.88 | $ | 0.25 | ||||||
Quarter Ended September 30, 2017 | 8.83 | 8.32 | 0.25 | |||||||||
Quarter Ended June 30, 2017 | 8.92 | 7.95 | 0.25 | |||||||||
Quarter Ended March 31, 2017 | 8.02 | 7.46 | 0.25 | |||||||||
Quarter Ended December 31, 2016 | 8.72 | 7.42 | 0.25 | |||||||||
Quarter Ended September 30, 2016 | 9.15 | 8.39 | 0.25 | |||||||||
Quarter Ended June 30, 2016 | 8.54 | 7.97 | 0.25 | |||||||||
Quarter Ended March 31, 2016 | 8.15 | 6.26 | 0.26 | |||||||||
Holders of Our Common Stock
As of January 31, 2018, there were 298 record holders of our common stock, including shares held in "street name" by nominees who are record holders.
Issuer Purchases of Equity Securities
The following table summarizes purchases of equity securities during the quarter ended December 31, 2017 by the Company and affiliated purchasers (dollars in thousands except per share amounts):
22
Period | Total Number of Shares Purchased (1) | Average Price Paid Per Share | Dollar Value of Shares That May Yet Be Purchased (1) | ||||||||
October 1, 2017 - October 31, 2017 | — | $ | — | $ | 155,502 | ||||||
November 1, 2017 - November 30, 2017 | — | — | 155,502 | ||||||||
December 1, 2017 - December 31, 2017 | — | — | 155,502 | ||||||||
Total | — | $ | — | ||||||||
__________________
(1) | The Company repurchases shares of its common stock in open-market transactions pursuant to its share repurchase program, authorized by its Board of Directors and publicly announced on July 21, 2014. Pursuant to this authority, the Company may repurchase shares of its common stock up to $250 million in aggregate value. Since July 21, 2014, the Company has repurchased approximately $94.5 million in aggregate value of its common stock, and accordingly, the Company was authorized to repurchase approximately $155.5 million in shares of its common stock as of December 31, 2017. |
Performance Graph
The following graph and table set forth certain information comparing the yearly percentage change in cumulative total return on our common stock to the cumulative total return of the Standard & Poor's 500 Composite Stock Price Index (the "S&P 500"), the FTSE NAREIT Mortgage REIT Index ("FNMR") and CYS MREIT Peer Group, an index of selected issuers composed of Annaly Capital Management, Inc, American Capital Agency Corporation, Anworth Mortgage Asset Corporation, Capstead Mortgage Corporation, and Armour Residential REIT, Inc. The comparison is for the period from December 31, 2012 to December 31, 2017 and assumes (i) an investment of $100 on December 31, 2012, and (ii) the reinvestment of all dividends.
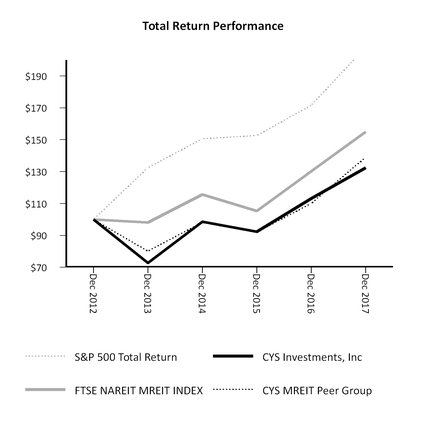
23
During the period from December 31, 2012 to December 31, 2017 the cumulative total return on our common stock was 32.4%. The actual returns shown on the graph above are as follows:
12/31/2012 | 12/31/2013 | 12/31/2014 | 12/31/2015 | 12/31/2016 | 12/31/2017 | |||||||||||||||||||
CYS Investments, Inc. | $ | 100 | $ | 73 | $ | 99 | $ | 92 | $ | 113 | $ | 132 | ||||||||||||
FTSE NAREIT Mortgage REIT Index | 100 | 98 | 116 | 105 | 129 | 155 | ||||||||||||||||||
CYS MREIT Peer Group | 100 | 80 | 98 | 92 | 110 | 139 | ||||||||||||||||||
S&P 500 Total Return | 100 | 132 | 150 | 153 | 171 | 208 | ||||||||||||||||||
The information in the share performance graph and table has been obtained from sources believed to be reliable. The historical information set forth above is not necessarily indicative of future performance. Accordingly, we do not make or endorse any predictions as to future share performance.
Equity Compensation Plans
Information about securities authorized for issuance under our equity compensation plans required for this Item 5 is incorporated by reference from our definitive Proxy Statement to be filed in connection with our 2018 annual meeting of stockholders.
Item 6. Selected Financial Data
The following table presents selected historical financial and operating information. The selected historical income statement and balance sheet data presented below as of and for the years ended December 31, 2017, 2016, 2015, 2014 and 2013 has been derived from our audited consolidated financial statements. The "Key Performance Metrics" have been derived from our underlying books and records.
The information presented below is only a summary and does not provide all of the information contained in our historical financial statements, including the related notes. You should read the information below in conjunction with "Management's Discussion and Analysis of Financial Condition and Results of Operations," and our historical consolidated financial statements, including the related notes.
24
Year Ended December 31, | |||||||||||||||||||
(In thousands, except per share numbers) | 2017 | 2016 | 2015 | 2014** | 2013** | ||||||||||||||
Income Statement Data: | |||||||||||||||||||
Interest income: | |||||||||||||||||||
Agency RMBS | $ | 304,421 | $ | 291,097 | $ | 328,286 | $ | 301,996 | $ | 330,430 | |||||||||
Other | 6,362 | 3,440 | 2,909 | 15,080 | 1,481 | ||||||||||||||
Total interest income | 310,783 | 294,537 | 331,195 | 317,076 | 331,911 | ||||||||||||||
Interest expense: | |||||||||||||||||||
Repurchase agreements | 114,616 | 70,230 | 40,700 | 33,825 | 52,763 | ||||||||||||||
FHLBC Advances | — | 4,049 | 5,429 | — | — | ||||||||||||||
Total interest expense | 114,616 | 74,279 | 46,129 | 33,825 | 52,763 | ||||||||||||||
Net interest income | 196,167 | 220,258 | 285,066 | 283,251 | 279,148 | ||||||||||||||
Other income (loss): | |||||||||||||||||||
Net realized gain (loss) on investments | (114,737 | ) | 19,463 | 13,652 | 132,563 | (595,116 | ) | ||||||||||||
Net unrealized gain (loss) on investments | 94,463 | (132,500 | ) | (129,764 | ) | 233,763 | (314,530 | ) | |||||||||||
Net unrealized gain (loss) on FHLBC Advances | — | (1,299 | ) | 1,299 | — | — | |||||||||||||
Other income | 163 | 1,361 | 867 | 269 | 120 | ||||||||||||||
Net realized and unrealized gain (loss) on investments, FHLBC Advances and other income | (20,111 | ) | (112,975 | ) | (113,946 | ) | 366,595 | (909,526 | ) | ||||||||||
Interest rate hedge expense, net | (29,550 | ) | (55,798 | ) | (100,110 | ) | (90,812 | ) | (93,497 | ) | |||||||||
Net realized and unrealized gain (loss) on derivative instruments | 57,750 | (11,483 | ) | (54,932 | ) | (110,542 | ) | 269,128 | |||||||||||
Net gain (loss) on derivative instruments | 28,200 | (67,281 | ) | (155,042 | ) | (201,354 | ) | 175,631 | |||||||||||
Total other income (loss) | 8,089 | (180,256 | ) | (268,988 | ) | 165,241 | (733,895 | ) | |||||||||||
Expenses: | |||||||||||||||||||
Compensation and benefits | 13,759 | 12,934 | 12,121 | 14,105 | 12,599 | ||||||||||||||
General, administrative and other | 9,236 | 10,677 | 8,722 | 8,778 | 8,436 | ||||||||||||||
Total expenses | 22,995 | 23,611 | 20,843 | 22,883 | 21,035 | ||||||||||||||
Net income (loss) | $ | 181,261 | $ | 16,391 | $ | (4,765 | ) | $ | 425,609 | $ | (475,782 | ) | |||||||
Dividend on preferred stock | (20,812 | ) | (20,812 | ) | (20,813 | ) | (20,812 | ) | (15,854 | ) | |||||||||
Net income (loss) available to common stockholders | $ | 160,449 | $ | (4,421 | ) | $ | (25,578 | ) | $ | 404,797 | $ | (491,636 | ) | ||||||
Net income (loss) per common share basic & diluted | $ | 1.05 | $ | (0.04 | ) | $ | (0.17 | ) | $ | 2.50 | $ | (2.90 | ) | ||||||
Dividends per common share | $ | 1.00 | $ | 1.01 | $ | 1.10 | $ | 1.24 | $ | 1.32 | |||||||||
Key Balance Sheet Metrics | |||||||||||||||||||
Average settled Debt Securities (1) | $ | 11,233,526 | $ | 11,781,920 | $ | 12,962,340 | $ | 12,198,178 | $ | 14,813,725 | |||||||||
Average total Debt Securities (2) | $ | 12,701,093 | $ | 13,212,278 | $ | 14,223,921 | $ | 13,910,227 | $ | 17,806,279 | |||||||||
Average repurchase agreements and FHLBC Advances (3) | $ | 9,697,163 | $ | 10,290,967 | $ | 11,395,383 | $ | 10,559,856 | $ | 12,836,246 | |||||||||
Average Debt Securities liabilities (4) | $ | 11,164,730 | $ | 11,721,325 | $ | 12,656,964 | $ | 12,271,905 | $ | 15,828,800 | |||||||||
Average stockholders' equity (5) | $ | 1,561,583 | $ | 1,704,701 | $ | 1,856,455 | $ | 1,922,938 | $ | 2,145,397 | |||||||||
25
Year Ended December 31, | |||||||||||||||||||
(In thousands, except per share numbers) | 2017 | 2016 | 2015 | 2014** | 2013** | ||||||||||||||
Average common shares outstanding (6) | 152,700 | 151,522 | 156,686 | 161,950 | 170,803 | ||||||||||||||
Leverage ratio (at period end) (7) | 7.33:1 | 7.06:1 | 6.77:1 | 6.44:1 | 6.97:1 | ||||||||||||||
Liquidity as % of stockholders' equity (8) | 65 | % | 61 | % | 66 | % | 67 | % | 63 | % | |||||||||
Hedge ratio (9) | 99 | % | 92 | % | 94 | % | 90 | % | 91 | % | |||||||||
Book value per common share (at period end) (10) | $ | 8.38 | $ | 8.33 | $ | 9.36 | $ | 10.50 | $ | 9.24 | |||||||||
Weighted-average amortized cost of Agency RMBS and U.S. Treasuries (11) | $ | 102.92 | $ | 103.78 | $ | 103.69 | $ | 103.98 | $ | 102.57 | |||||||||
Key Performance Metrics* | |||||||||||||||||||
Average yield on settled Debt Securities (12) | 2.77 | % | 2.50 | % | 2.56 | % | 2.60 | % | 2.24 | % | |||||||||
Average yield on total Debt Securities including Drop Income (13) | 2.68 | % | 2.48 | % | 2.56 | % | 2.72 | % | 2.39 | % | |||||||||
Average cost of funds(14) | 1.18 | % | 0.72 | % | 0.40 | % | 0.32 | % | 0.41 | % | |||||||||
Average cost of funds and hedge (15) | 1.49 | % | 1.26 | % | 1.28 | % | 1.18 | % | 1.14 | % | |||||||||
Adjusted average cost of funds and hedge (16) | 1.29 | % | 1.11 | % | 1.16 | % | 1.02 | % | 0.92 | % | |||||||||
Interest rate spread net of hedge (17) | 1.28 | % | 1.24 | % | 1.28 | % | 1.42 | % | 1.10 | % | |||||||||
Interest rate spread net of hedge including Drop Income (18) | 1.39 | % | 1.37 | % | 1.40 | % | 1.70 | % | 1.47 | % | |||||||||
Operating expense ratio (19) | 1.47 | % | 1.39 | % | 1.12 | % | 1.19 | % | 0.98 | % | |||||||||
Total stockholder return on common equity (20) | 12.61 | % | (0.21 | )% | (0.38 | )% | 27.06 | % | (20.66 | )% | |||||||||
CPR (weighted-average experienced 1-month) (22) | 8.6 | % | 12.1 | % | 10.4 | % | 7.9 | % | 11.6 | % | |||||||||
_________
(1) | The average settled Debt Securities is calculated by averaging the month end cost basis of settled Debt Securities during the period. |
(2) | The average total Debt Securities is calculated by averaging the month end cost basis of total Debt Securities and unsettled Debt Securities (inclusive of TBA Derivatives) during the period. |
(3) | The average repurchase agreements and FHLBC Advances are calculated by averaging the month-end repurchase agreements and FHLBC Advances balances during the period. |
(4) | The average Debt Securities liabilities are calculated by adding the average month-end repurchase agreements and FHLBC Advances balances plus average unsettled Debt Securities (inclusive of TBA Derivatives) during the period. |
(5) | The average stockholders' equity is calculated by averaging the month-end stockholders' equity during the period. |
(6) | The average common shares outstanding is calculated by averaging the daily common shares outstanding during the period. |
(7) | The leverage ratio is calculated by dividing (i) the Company's repurchase agreements and FHLBC Advances balance plus payable for securities purchased minus receivable for securities sold, plus or minus the net TBA Derivatives positions by (ii) stockholders' equity. |
(8) | Liquidity as % of stockholders' equity is calculated by dividing unencumbered liquid assets by stockholders' equity. |
(9) | The hedge ratio for the period is calculated by dividing the combined total Interest Rate Swaps and Interest Rate Caps notional amount by total repurchase agreements and FHLBC Advances balances. |
(10) | Book value per common share is calculated by dividing total stockholders' equity less the liquidation value of preferred stock at period end by common shares outstanding at period end. |
(11) | The weighted-average amortized cost of Agency RMBS and U.S. Treasuries is calculated using the weighted-average amortized cost by security divided by the current face at period end. |
(12) | The average yield on settled Debt Securities for the period is calculated by dividing total interest income by average settled Debt Securities. |
(13) | Average yield on total Debt Securities including Drop Income for the period is calculated by dividing total interest income plus Drop Income by average total Debt Securities. Drop Income was $29.9 million, $32.9 million, $32.6 million, $60.7 million and $94.5 million for the years ended December 31, 2017, 2016, 2015, 2014 and 2013, respectively. Drop Income is a component of our net realized and unrealized gain (loss) on investments and derivative instruments in the Consolidated Statements of Operations. Drop Income is the difference between the spot price and the forward-settlement price for the same security on the trade date. |
(14) | The average cost of funds for the period is calculated by dividing repurchase agreement and FHLBC Advances interest expense by average repurchase agreements and FHLBC Advances for the period. |
26
(15) | The average cost of funds and hedge for the period is calculated by dividing repurchase agreement and FHLBC Advances interest expense and interest rate hedge expense, net by average repurchase agreements and FHLBC Advances. |
(16) | The adjusted average cost of funds and hedge for the period is calculated by dividing repurchase agreement and FHLBC Advances interest expense and interest rate hedge expense, net by average Debt Securities liabilities. |
(17) | The interest rate spread net of hedge for the period is calculated by subtracting average cost of funds and hedge from average yield on settled Debt Securities. |
(18) | The interest rate spread net of hedge including Drop Income for the period is calculated by subtracting adjusted average cost of funds and hedge from average yield on total Debt Securities including Drop Income. |
(19) | The operating expense ratio for the period is calculated by dividing operating expenses by average stockholders' equity. |
(20) | The total stockholder return on common equity is calculated as the change in book value plus dividend distributions on common stock divided by book value at the beginning of the period. |
(21) | CPR represents the weighted-average 1-month CPR of the Company's Agency RMBS during the period. |
* | All percentages are annualized except total stockholder return on common equity. |
** Previously reported under specialized accounting, ASC 946 – Financial Services – Investment Companies. See Notes to consolidated financial statements, Note 2, Significant Accounting Policies, Basis of Presentation.
As of December 31, | ||||||||||||||||||||
(in thousands, except per share numbers) | 2017 | 2016 | 2015 | 2014 | 2013 | |||||||||||||||
Balance Sheet Data: | ||||||||||||||||||||
Investments in securities, at fair value | $ | 12,634,654 | $ | 12,648,731 | $ | 13,027,707 | $ | 14,601,507 | $ | 13,858,848 | ||||||||||
Total assets | 13,145,582 | 13,245,268 | 14,330,704 | 14,895,863 | 14,633,064 | |||||||||||||||
Repurchase agreements and other debt | 10,089,917 | 9,691,544 | 11,086,477 | 11,289,559 | 11,206,950 | |||||||||||||||
Stockholders' equity | 1,574,247 | 1,535,719 | 1,694,614 | 1,975,168 | 1,768,656 | |||||||||||||||
Book value per common share | $ | 8.38 | $ | 8.33 | $ | 9.36 | $ | 10.50 | $ | 9.24 | ||||||||||
Core Earnings
"Core Earnings" represents a non-GAAP financial measure and is defined as net income (loss) available to common stockholders excluding net realized and unrealized gain (loss) on investments and derivative instruments, and net unrealized gain (loss) on FHLBC Advances. Management uses Core Earnings to evaluate the effective yield of the portfolio after interest and operating expenses. The Company believes that providing users of the Company's financial information with such measures, in addition to the related GAAP measures, gives investors and stockholders additional transparency and insight into the information used by the Company's management in its financial and operational decision-making.
The primary limitation associated with Core Earnings as a measure of the Company's financial performance over any period is that it excludes the effects of net realized and unrealized gain (loss) on investments and derivative instruments, and net unrealized gain (loss) on FHLBC Advances. In addition, the Company's presentation of Core Earnings may not be comparable to similarly-titled measures of other companies, which may use different calculations. As a result, Core Earnings should not be considered a substitute for the Company's GAAP net income (loss) as a measure of its financial performance or any measure of its liquidity under GAAP.
Year Ended December 31, | ||||||||||||||||||||
(in thousands, except per share numbers) | 2017 | 2016 | 2015 | 2014 | 2013 | |||||||||||||||
Non-GAAP Reconciliation: | ||||||||||||||||||||
Net income (loss) available to common stockholders | $ | 160,449 | $ | (4,421 | ) | $ | (25,578 | ) | $ | 404,797 | $ | (491,636 | ) | |||||||
Net realized (gain) loss on investments | 114,737 | (19,463 | ) | (13,652 | ) | (132,563 | ) | 595,116 | ||||||||||||
Net unrealized (gain) loss on investments | (94,463 | ) | 132,500 | 129,764 | (233,763 | ) | 314,530 | |||||||||||||
Net realized and unrealized (gain) loss on derivative instruments | (57,750 | ) | 11,483 | 54,932 | 110,542 | (269,128 | ) | |||||||||||||
Net unrealized (gain) loss on FHLBC Advances | — | 1,299 | (1,299 | ) | — | — | ||||||||||||||
Core Earnings | $ | 122,973 | $ | 121,398 | $ | 144,167 | $ | 149,013 | $ | 148,882 | ||||||||||
27
Item 7. Management's Discussion and Analysis of Financial Condition and Results of Operations
CYS Investments, Inc. (the "Company", "we", "us", and "our") is a specialty finance company created with the objective of achieving consistent risk-adjusted investment income. Management's Discussion and Analysis of Financial Condition and Results of Operations ("MD&A") is intended to provide the reader of the Company's consolidated financial statements and accompanying notes with a narrative from management to provide its perspective on the business underlying those financial statements and its financial condition and results of operations during the periods presented. The Company's MD&A is comprised of four sections:
• | Executive Overview, |
• | Financial Condition, |
• | Results of Operations, |
• | Liquidity and Capital Resources, and |
• | Off-Balance Sheet Arrangements |
The following discussion should be read in conjunction with our consolidated financial statements and accompanying notes included in Item 8 of this Annual Report on Form 10-K.
Executive Overview
We are a specialty finance company created with the objective of achieving consistent risk-adjusted investment income. We seek to achieve this objective by investing on a leveraged basis primarily in Agency RMBS. These investments consist of residential mortgage pass-through securities for which the principal and interest payments are guaranteed by a government-sponsored enterprise, such as Fannie Mae, Freddie Mac, or by a U.S. government agency, such as Ginnie Mae(collectively referred to as "GSEs"). We may also invest in U.S. Treasuries, CMOs, STACRS, CAS, or other securities issued by a GSE that are not backed by collateral but, in the case of government agencies, are backed by the full faith and credit of the U.S. government, and, in the case of GSEs, are backed by the integrity and creditworthiness of the issuer ("U.S. Agency Debentures") or credit risk transfer securities, such as Structured Agency Credit Risk (“STACR”) debt securities issued by Freddie Mac, Connecticut Avenue Securities (“CAS”) issued by Fannie Mae, or similar securities issued by a GSE where their cash flows track the credit risk performance of a notional reference pool of mortgage loans.
We commenced operations in February 2006, and completed our initial public offering in June 2009. Our common stock, our 7.75% Series A Cumulative Redeemable Preferred Stock, $25.00 liquidation preference (the "Series A Preferred Stock"), and our 7.50% Series B Cumulative Redeemable Preferred Stock, $25.00 liquidation preference (the "Series B Preferred Stock"), trade on the New York Stock Exchange under the symbols "CYS," "CYS PrA" and "CYS PrB," respectively.
We earn income from our investment portfolio, currently comprised principally of Agency RMBS and U.S. Treasuries (collectively, "Debt Securities"). We finance our investments primarily through borrowings under repurchase agreements ("repo borrowings"), and, prior to the effective date of the Final Rule on January 19, 2016, loans from the Federal Home Loan Bank of Cincinnati ("FHLBC"), which provides short-term and long-term secured loans ("FHLBC Advances") to its members. We use leverage to seek to enhance our returns, although leverage may also exacerbate losses. Our economic net interest income, a non-GAAP measure, described in "Results of Operations" below, is generated primarily from the net spread, or difference, between the interest income we earn on our investment portfolio and the cost of our borrowings and hedging activities. The amount of economic net interest income we earn on our investments depends in part on our ability to control our financing costs, which comprise a significant portion of our operating expenses. Economic Interest Expense is comprised of interest expense, as computed in accordance with GAAP, plus interest rate hedge expense, net, which consists of swap, swaption and cap interest expense used to hedge our cost of funds, a component of net gain (loss) on derivative instruments in the Company’s Consolidated Statements of Operations. The Company uses interest rate swaps (cancellable and non-cancellable), swaptions and caps to manage its exposure to changes in interest rates on its interest bearing liabilities by economically hedging cash flows associated with these borrowings. Presenting the contractual interest payments on interest rate swaps and caps and the amortization of premiums paid on caps and swaptions with the interest paid on interest-bearing liabilities reflects the total contractual interest payments. Economic Interest Expense depicts the economic cost of our financing strategy. Although we leverage our portfolio investments in Debt Securities to seek to enhance our potential returns, leverage also may exacerbate losses.
While we hedge to attempt to manage our interest rate risk, we do not hedge all of our exposure to changes in interest rates. Our investments vary in interest rate and maturity compared with the rates and duration of the hedges we employ. As a result, it is not possible to insulate our portfolio from all potential negative consequences associated with changes in interest
28
rates in a manner that will allow us to achieve attractive spreads on our portfolio. Consequently, changes in interest rates, particularly short-term interest rates, may significantly influence our net income.
In addition to investing in issued pools of Agency RMBS, we regularly utilize forward settling transactions to purchase and sell certain securities, including forward settling purchases and sales of Agency RMBS where the pool is "to-be-announced" ("TBA"). Pursuant to a TBA transaction, we agree to purchase or sell for future delivery, Agency RMBS with certain principal and interest terms and certain types of underlying collateral, but the particular Agency RMBS to be delivered is not specifically identified until shortly before the TBA settlement date. For TBA securities that meet the regular-way securities scope exception from derivative accounting under ASC 815 - Derivatives and Hedging, the Company records TBAs on the trade date utilizing information associated with the specified terms of the transaction. TBAs are carried at fair value and begin earning interest on the settlement date. At times, the Company may enter into TBA Derivatives as a means of investing in and financing Agency RMBS via "dollar roll" transactions. TBA dollar roll transactions are accounted for as a series of derivative transactions. For other forward settling transactions, we agree to purchase or sell, for future delivery, Agency RMBS. However, unlike TBA Derivatives, these forward settling transactions reference an identified Agency RMBS.
In March 2015, our captive insurance subsidiary, CYS Insurance Services, LLC ("CYS Insurance"), was granted membership in the FHLBC and commenced obtaining FHLBC Advances from the FHLBC in the form of secured borrowings. Membership in the FHLBC permitted CYS Insurance to access a variety of products and services offered by the FHLBC, and obligated CYS Insurance to purchase FHLBC membership and activity stock, the latter being a percentage of the advances the Company obtained from the FHLBC. As with our repo borrowings, if the value of any assets pledged to FHLBC as collateral for advances decreased, the FHLBC could require posting of additional collateral. On January 12, 2016, the Federal Housing Finance Agency ("FHFA") issued a final rule (the "Final Rule") amending its regulations governing FHLB membership criteria for captive insurance companies. The Final Rule defines "insurance company" to exclude "captive insurers". Under this Final Rule, which became effective on February 19, 2016, CYS Insurance's membership in the FHLBC was required to be terminated within one year of the effective date, it was not permitted to secure any new advances, and all FHLBC Advances were required to be repaid no later than February 19, 2017. The Company repaid all outstanding FHLBC Advances prior to September 30, 2016, and CYS Insurance's membership in the FHLBC was terminated on February 19, 2017.
We have elected to be treated as a REIT for U.S. federal income tax purposes, and have complied with, and intend to continue to comply with, the provisions of the Code, with respect thereto. Accordingly, we generally do not expect to be subject to federal income tax on our REIT taxable income that we currently distribute to our stockholders if certain asset, income and ownership tests and recordkeeping requirements are fulfilled. Even if we maintain our qualification as a REIT, we may be subject to some federal, state and local taxes on our income.
Factors that Affect our Results of Operations and Financial Condition
A variety of industry and economic factors may impact our results of operations and financial condition. These factors include:
• | interest rate trends; |
• | prepayment rates on mortgages underlying our Agency RMBS, and credit trends insofar as they affect prepayment rates; |
• | competition for investments in Agency RMBS; |
• | actions or inactions taken by the U.S. government, including the Federal Reserve (the "Fed"), the FHFA, the FOMC and the U.S. Treasury; |
• | credit rating downgrades of the United States' and certain European countries' sovereign debt; and |
• | other market developments. |
In addition, a variety of factors relating to our business may also impact our results of operations and financial condition. These factors include:
• | our degree of leverage; |
• | our access to funding and borrowing capacity; |
• | our borrowing costs; |
• | our hedging activities; |
• | the market value of our investments; and |
• | the REIT requirements and the requirements to qualify for a registration exemption under the Investment Company Act. |
29
Changes in interest rates may significantly influence our net income and book value, or stockholders' equity.
Prepayments on loans and securities may be influenced by changes in market interest rates and homeowners' ability and desire to refinance their mortgages. To the extent we have acquired assets at a premium or discount to face value, changes in prepayment rates will impact our anticipated yield.
Trends and Recent Market Activity
Overview
Our business is largely influenced by interest rates and credit conditions principally in the United States, and, to a lesser extent, globally. Changes in trends, and the outlook for, economic growth and inflation, as well as global central bank policies and supply and demand metrics significantly impact short-term and long-term interest rates and the yield curve. Our earnings power benefits from a steep yield curve, and our book value is largely influenced by movements in interest rates, mortgage rates, and swap rates.
We characterize 2017 as a year of relative stability and low volatility, as compared to 2016, which was a year of "surprise" (highlighted by Brexit and the U.S. Presidential election). Longer-term rates were range-bound during 2017 as shorter-term rates began a steady climb during the second half of the year. Markets moved through the Presidential transition as the new U.S. President began to layout a policy agenda and initiated changes in leadership across a number of regulatory and policy positions. Further, prior to her exit as Chair of the Fed, Janet Yellen established a well-defined and clearly communicated plan for both balance sheet normalization and interest rate normalization, which the markets accepted. Jerome (Jay) Powell was nominated and confirmed as the next Fed leader and has been labeled as "Yellen-like" with a perspective leaning toward some modest financial deregulation. Meanwhile, overseas, French and German elections went as expected and the other Central banks maintained their easy monetary policies while hinting that they would follow the Fed’s lead toward modest tightening in the coming years.
Despite success in reducing the overall level of regulation, through most of 2017, the administration struggled to effect legislation intended to stimulate the economy. However, on December 22, 2017, President Trump signed into law H.R. 1, comprehensive tax reform informally titled the Tax Cuts and Jobs Act (the "TCJA" or the "Act"). The markets and many economists believe that the TCJA should boost economic growth in the next few years, but the sustainability of that increase remains open for debate. Higher deficits and inflation are other likely anticipated effects of the legislation that markets and policy-makers, including the Fed, will have to consider. In addition to tax reform, the administration has installed policy leaders who favor financial deregulation and the Senate has introduced a bi-partisan bill that will provide regulatory relief for smaller banks, among other reforms. These actions should help to lift economic growth, at least in the near term.
Record low levels of volatility was a key market theme in 2017. Throughout the year, financial markets continued to follow established trends without much agitation. Equities continued their advance and completed one of their best years in the last fifteen, credit spreads continued to tighten and 10-year U.S. Treasuries traded within their narrowest one-year bands in nearly 50 years. The low volatility environment benefited Agency RMBS, which performed quite well despite a flattening yield curve in 2017.
The Federal Open Market Committee ("FOMC") increased the Federal Funds Rate three separate times in 2017. It was the first year in three that the FOMC met its own expectations on the pace of rate tightening. After introducing its normalization policy in late 2014, the FOMC raised rates by only 25 bps each in 2015 and 2016 after having predicted multiple hikes in each of those years. In 2017, the FOMC raised rates by 25 bps, in March, June and December, and closed the year with the Federal Funds rate in the 1.25-1.50% range, still considerably below its longer-term target of 2.75%. Notably, in September of 2017, the FOMC also announced its balance sheet normalization plan, which it initiated in October of 2017 and which will reach its maximum monthly run-off targets by October of 2018.
As inflation failed to materialize at an expected pace during the year, and with the Fed apparently still committed to normalizing rates on a gradual yet consistent basis, yield curve flattening was one of the few new trends that commenced in 2017. Although longer-maturity 10-year U.S. Treasury yields were range-bound within 2.04%-2.63%, shorter term rates climbed steadily through the later part of the year beginning in mid-September. The yield on 5-year U.S. Treasuries rose 28 bps to end the year at 2.21% and the yield on 10-year U.S. Treasuries fell a modest 3 bps to 2.41% on December 31, 2017. Prices of Agency RMBS followed and 30-year Agency RMBS 3.5% rose from $102.33 at December 31, 2016 to $102.73 at December 31, 2017 while 15-year Agency RMBS 3.0% fell from $102.48 at December 31, 2016 to $101.89 at December 31, 2017.
30
Despite the flattening yield curve, we were able to maintain what we believe to be attractive risk-adjusted returns in 2017 due to several factors. The most significant contributor was the repositioning of our Agency RMBS portfolio that we implemented in late 2016 following the presidential election-induced increase in rates by recycling capital out of 15-year Agency RMBS with a higher cost basis and prepayment characteristics and into 30-year Agency RMBS with a lower cost basis and a more favorable prepayment profile. Low levels of prepayments also supported returns throughout 2017. Additional contributors to our returns in 2017 included Agency RMBS outperformed U.S. Treasury and swap rates. In anticipation of an increase in rates, we significantly expanded our hedge portfolio. In addition, increases in LIBOR rates outpaced our funding rates, contributing to asset yields and better hedge performance. Consequently, we ended the year better hedged and at a lower cost than when we started the year.
We expect 2018 to be a volatile year for interest rates, and we anticipate that Agency RMBS performance will be adversely impacted in a rising rate environment. Markets are still monitoring inflation metrics carefully as the actual rate of inflation has failed to meet the Fed’s targets for the last several years. Additionally, a newly composed FOMC will have to grapple with inflation fluctuations, market reactions and how best to implement monetary policy. The Fed has acknowledged its concern about the lack of reappearance of inflation and has pointed to some ‘transitory’ factors that have contributed to lower-than-targeted inflation levels in 2017. During 2017, Fed officials have increasingly discussed alternatives to their explicit 2% inflation target, which the Fed has consistently had trouble reaching since setting the goal in 2012. Any unanticipated changes in plans for other global central bank participant’s policies could also affect U.S. interest rates. Finally, as balance sheet normalization takes full-effect and markets are faced with significant net supply of U.S. Treasury securities and Agency RMBS, these valuations could be vulnerable.
The Fed is sensitive to the flattening yield curve as reflected in comments by several Fed governors who have noted concerns about inverting the yield curve. We note that the FOMC composition in 2018 is quite different from what it has been in recent years. In 2018, the organization will be led by a new Chair and, once named and confirmed, a new Vice Chair. Additionally, only four voters (Brainard, Dudley, Powell and Quarles) who voted in 2017 will be voting in 2018. Consequently, we could see seven new voting members in 2018. Although it is anticipated that the FOMC will continue to operate on the existing set course, we have yet to see how the new leadership might react to shocks in the economy or financial markets.
Although we continued to take advantage of the forward TBA market throughout 2017, we did so to a lesser extent as this market provided less attractive implied financing rates, also referred to as “specialness”, resulting in a decrease in Drop Income to $29.9 million in 2017 from $32.9 million in 2016.
The charts below illustrate key market and Company-specific interest rate and spread movements for the periods illustrated:
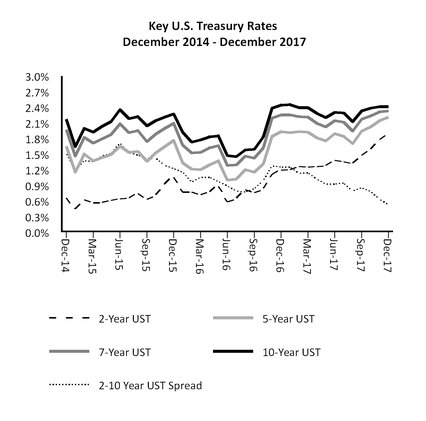
31
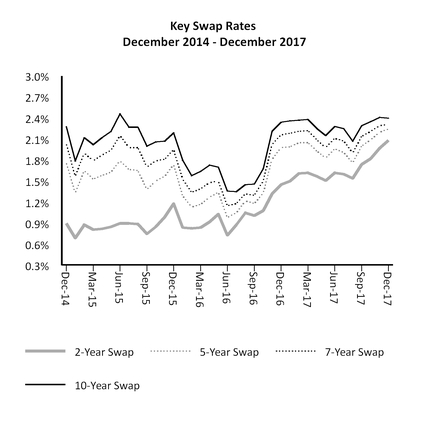
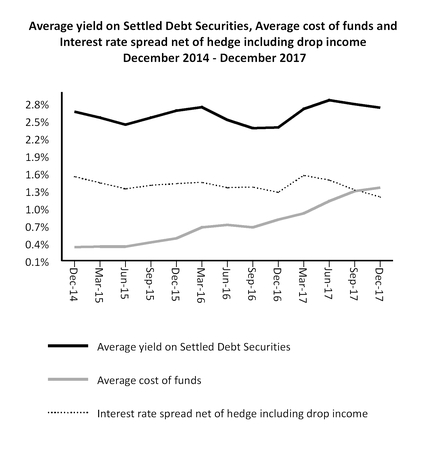
32
- Interest Rates, Unemployment and Other Macroeconomic Trends
A key focus of the bond and equity markets over the past few years has been the timing and magnitude of Fed rate hikes. During 2017, the Fed signaled, and markets accepted, three rate hikes. 2017 was unlike prior years, when markets reacted with more volatility to geopolitical and other news and the Fed held off rate decisions until December of 2015 and 2016 for fear of further roiling markets. Ultimately, the FOMC’s decision to raise rates three times in 2017 reflected continued improvement in labor market conditions and a reasonable confidence that inflation will rise to its 2% objective. The FOMC has indicated another three 25 bps rate hikes in the Federal Funds Rate are likely during 2018; however, we believe that this will remain contingent on inflation and other data as well as market stability.
Set forth below are graphs of yield curves showing trends from 2015 through 2017 and the four quarters of 2017:
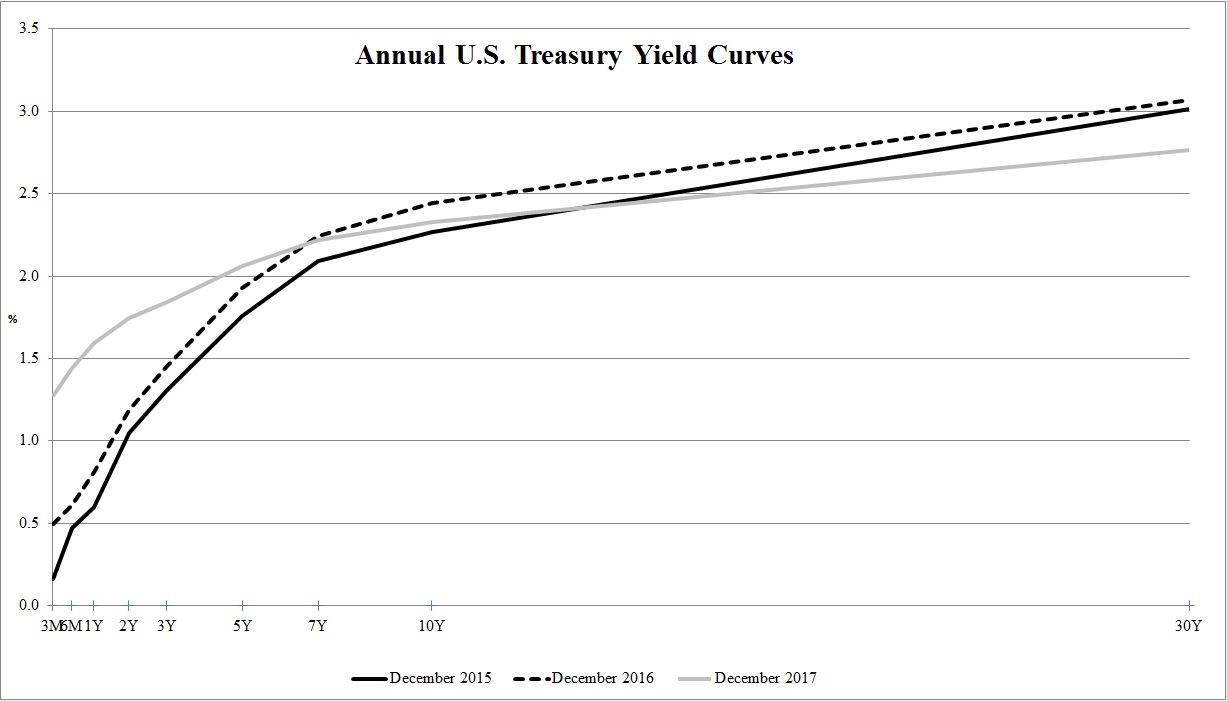
33
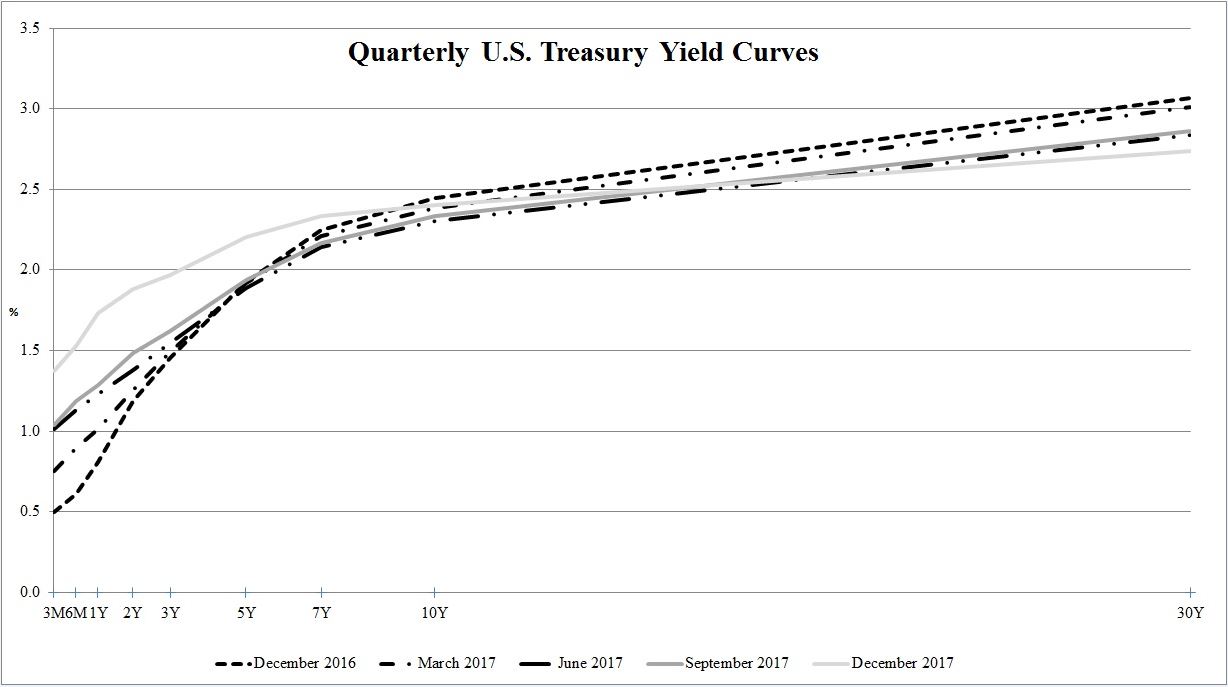
U.S. economic performance improved in 2017 and is projected to improve again in 2018. After generating lackluster growth of sub-2.0% in 2016, we started 2017 with another soft first quarter GDP growth rate of 1.2%. Since then, however, growth has increased to just over 3% in the second and third quarters of 2017 and fourth quarter growth was 2.6%. For 2017 as a whole, GDP growth was 2.3%, better than 2016’s 1.5% growth rate and slightly better than the preceding five-year (2012-2016) average of 2.2%. The consensus estimate for 2018 GDP growth is currently 2.6%, an improvement over 2017 on the back of tax reform, but still a modest pace compared to prior growth periods and considerably lower than during the 1990s when the economy grew an average 3.4% per year.
We have yet to see the effects of the TCJA and other potential fiscal policies that might promote incremental economic growth. At the December 2017 press conference, Chair Yellen noted that most Fed officials have factored in growth and some reduction in unemployment due to tax reform into their economic projections. The FOMC, with a number of new members with their own views, will continue to assess incoming economic data and to adjust their models as the effects of fiscal policies emerge and as new policies are introduced.
Policy issues other than tax reform have yet to be addressed by the presidential administration or Congress. We are expecting some that are relevant to our industry including, but not limited to, the following: review of the Dodd-Frank Act, banking regulations and how reforms may impact our lenders; policies overseen by the Consumer Financial Protection Bureau (“CFPB”) and whether residential mortgage originators may be impacted; the status of the Federal Housing Finance Agency (“FHFA”) and whether any of its rules that impact our sector would be affected; the status and capital structure of the GSEs (i.e., Fannie Mae and Freddie Mac), and several others. Several bills that address mortgage finance reform are expected to be introduced by the Senate and House, respectively, in early 2018. Additionally, with a new leader at the helm, the CFPB is reportedly reviewing QM rules and has the power to define QM. Policy changes here could help widen the credit box for mortgage originators, making mortgages available to a larger group of borrowers. To date, the Senate has introduced a bi-partisan bill that will provide regulatory relief, including qualified mortgage ("QM") relief, for smaller banks, among other reforms. This bill could be enacted into law by the summer of 2018. It's not clear what the details on these potential reforms will be.
34
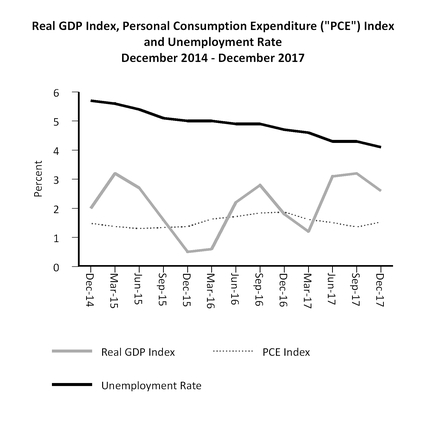
Although monetary policy has been beneficial in returning the economy to, or close to, full employment, the second of the Fed's two mandates, inflation, has consistently tracked lower than its 2% target. The core personal consumption expenditure inflation index was around 1.5% for 2017. This metric has shown signs of an increase several times since the 2008 financial crisis, but these have not proven durable. FOMC members attributed the undershot in inflation in 2017 to "transitory" factors and in her December press conference, Chair Yellen noted that the FOMC expects inflation to increase and stabilize around the 2% target over the next couple of years. She also noted that the FOMC will carefully monitor actual and expected inflation developments and adjust policy as needed to achieve objectives. In the December 2017 FOMC minutes, a few committee participants suggested that further study of potential alternative frameworks for the conduct of monetary policy such as price-level targeting or nominal GDP targeting or looking at ranges of inflation could be useful. We believe inflation will continue to be a key focus area in 2018.
Global growth outlooks for 2018 are brighter than 2017 due to monetary and fiscal stimulus but inflation globally still remains scant. Europe and Japan’s growth outlooks are significantly improved from recent years, but both are expected to maintain their quantitative easing programs through 2018. Markets anticipate that these central banks may taper these programs over the next few years, assuming growth improves and inflation resurfaces. Any changes in foreign central bank policies that surprise markets could cause volatility in U.S. as well as global rates.
- Interest Rate Spreads
The spread between Agency RMBS and interest rate swaps tightened considerably during 2017, as shown in the graph below. The spread between Fannie Mae 30-year securities and 7-year interest rate swaps tightened 28 bps, and Fannie Mae 15-year and 5-year interest rate swaps tightened 23 bps during 2017. In general, this had a positive impact on our asset values relative to our hedges during 2017, especially in the third quarter.
Agency RMBS performed well versus their hedges, as the Agency RMBS spread to swap rates tightened. This occurred even after the Fed’s balance sheet normalization plan announcement, due to: (i) the Fed’s normalization plans having been well-telegraphed and understood by the market; (ii) a plan to commence balance sheet normalization modestly, beginning with an initial $4 billion per month with gradually increasing Agency RMBS paring reaching its $20 billion monthly cap in October 2018; and (iii) the securities were in demand by a wide variety of investors, notably some mortgage REIT investors raising equity and money managers receiving cash inflows, as they offered attractive returns relative to corporate bonds and other credit products.
35
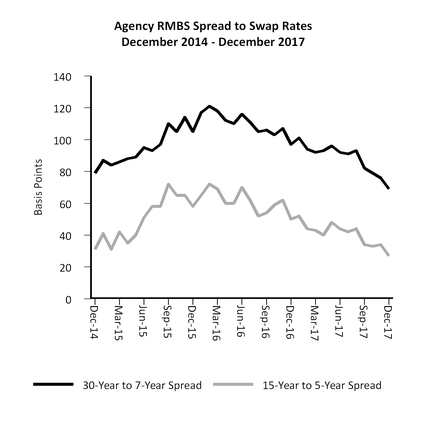
Generally, when spreads between Agency RMBS and swaps narrow, our book value increases, but it also limits our investment and reinvestment opportunities in the short-term. Notably, if the yield curve continues to flatten with the short-end rising, we expect that this may have the effect of reducing our yield on new investments. During the twelve months ended December 31, 2017, and December 31, 2016, the weighted-average yield on the Company's Debt Securities was 2.77% and 2.50%, respectively.
The table below shows generic Agency RMBS investments and their respective net interest margins and related swap and hedge ratio assumptions as of January 12, 2018:
Net Interest Margin (1) | 30-Yr. 3.5% | 30-Yr. 4.0% | 15-Yr. 3.0% | 15-Yr. 3.5% | |||||||
Asset Yield | 3.36 | % | 3.47 | % | 2.86 | % | 2.85 | % | |||
Financing Rate | 1.62 | % | 1.62 | % | 1.62 | % | 1.62 | % | |||
Hedge Cost | 0.44 | % | 0.35 | % | 0.40 | % | 0.33 | % | |||
Net interest margin | 1.30 | % | 1.50 | % | 0.84 | % | 0.90 | % | |||
Key Assumptions | |||||||||||
Swap | 7-Year | 7-Year | 5-Year | 5-Year | |||||||
Hedge Ratio | 50 | % | 40 | % | 50 | % | 40 | % | |||
_______________________________________
(1) The examples in this table are for illustrative purposes only and do not reflect our projections or forecasts. Any assumptions and estimates used may not be accurate and cannot be relied upon. Our net interest margin for any given period may differ materially from these examples.
We benefited from a generally favorable financing environment throughout 2017. Even after three separate 25 bps rate hikes, the Federal Funds Rate remains at low levels. The Company generally borrows in the 30-180 day repo markets, which historically have been highly correlated to LIBOR. Access to repurchase agreements ("Repo Borrowings") collateralized with our Agency RMBS was stable during 2017 and funding capacity was widely available. In addition, prior to the Final Rule, the Company had access to FHLBC Advances.
At December 31, 2017, the interest rates on our Repo Borrowings ranged from 1.07% to 1.64% for 30-90 day repo borrowings, with a weighted-average interest rate of 1.42% and a weighted-average remaining maturity of 51 days. During 2017,
36
our weighted-average cost of funds was 1.18%, compared to 0.72% in 2016, reflecting the higher interest rate environment and the expectation for continued rate hikes.
Date | 1-Month LIBOR | 3-Month LIBOR | 6-Month LIBOR | Federal Funds Rate | ||||||||
December 31, 2017 | 1.564 | % | 1.694 | % | 1.837 | % | 1.50 | % | ||||
September 30, 2017 | 1.232 | % | 1.334 | % | 1.506 | % | 1.25 | % | ||||
June 30, 2017 | 1.224 | % | 1.299 | % | 1.448 | % | 1.25 | % | ||||
March 31, 2017 | 0.983 | % | 1.150 | % | 1.423 | % | 1.00 | % | ||||
December 31, 2016 | 0.772 | % | 0.998 | % | 1.318 | % | 0.75 | % | ||||
September 30, 2016 | 0.531 | % | 0.854 | % | 1.240 | % | 0.50 | % | ||||
June 30, 2016 | 0.465 | % | 0.654 | % | 0.924 | % | 0.50 | % | ||||
March 31, 2016 | 0.437 | % | 0.629 | % | 0.900 | % | 0.50 | % | ||||
December 31, 2015 | 0.430 | % | 0.613 | % | 0.846 | % | 0.50 | % | ||||
For much of the year, debt ceiling dynamics as well as money market reform helped keep repo rates subdued. A notable reduction in U.S. Treasury bill issuance throughout the year, in response to the U.S. debt ceiling requirements, created a relative shortage of short-dated U.S. Treasuries available for the large pool of government money funds looking to invest in short-dated government securities. The money funds turned to Agency RMBS repo, among a short list of other eligible options, which helped to moderate repo rates. During the fourth quarter of 2017, LIBOR rates rose considerably. Year-end funding dynamics (demand for dollar funding by some foreign banks) in addition to expectations of rising short-term rates pushed 3-month LIBOR up 36 bps in the fourth quarter to end the year at 1.69%, the highest level reached since 2008.
In 2017, policymakers announced that LIBOR will be replaced by 2021. The directive was spurred by the fact that banks are uncomfortable contributing to the LIBOR panel given the shortage of underlying transactions on which to base levels and the liability associated with submitting an unfounded level. LIBOR will be replaced with a new Secured Overnight Financing Rate (SOFR), a rate based on U.S. repo trading. The new benchmark rate will be based on overnight Treasury General Collateral ("GC") repo rates. The rate-setting process will be managed and published by the Fed and the Treasury’s Office of Financial Research. Daily publication of the rate will begin in the first half of 2018 and a May 2018 launch is anticipated. Futures trading will begin soon afterward. Many banks believe that it may take four to five years to complete the transition to SOFR, despite the 2021 deadline. We will monitor the emergence of this new rate carefully as it will likely become the new benchmark for hedges and a range of interest rate investments.
- Investing and Reinvestment Environment and Agency RMBS Supply and Demand
In recent years, the investing and reinvesting environment for Agency RMBS has been characterized by tight supply and strong demand led by the Fed’s asset purchase and reinvestment programs. While home sales and new single-family and multi-family home construction continued to improve in 2017 as home prices continued to rise at a measured pace, mortgage lending rules remained constrained due to the Dodd-Frank Act and bank conservatism in efforts to prevent future mortgage "put-backs,” and mortgage availability, particularly to less creditworthy borrowers.
We expect some of the dynamics on the demand side of the equation may begin to change in 2018 as the Fed reduces its purchases of Agency RMBS as part of its balance sheet normalization plan initiated in October 2017. At December 31, 2017, the Fed held a portfolio of approximately $1.7 trillion, or 27%, of the $6.2 trillion Agency RMBS market. According to its plan formally announced in September of 2017, the Fed has set a gradually increasing set of monthly caps, or limits above which U.S. Treasuries and agency securities in its portfolio may be reinvested. Beginning with $4 billion per month in October 2017, the monthly cap on Agency RMBS will increase in increments of $4 billion at three-month intervals over 12 months until it reaches $20 billion per month in October 2018. As a result, a significant amount of new Agency RMBS supply must be absorbed by an investor group that will now largely exclude the Fed, which had been its biggest supporter since the financial crisis. We anticipate this market activity will cause renewed volatility in Agency RMBS markets and a likelihood of spread widening in 2018.
Mortgage interest rates remained at relatively low levels in 2017 versus historical measures. 2017 mortgage originations were lower than 2016 measures and comparable to 2015 gross issuance as the overall level of rates was higher in 2017 relative to 2016 and 2015. Refinancings tend to decline as rates rise. Overall, new Agency RMBS issuances generally remain low compared to 2012 through mid-2013. The limited supply of Agency RMBS continued to be a factor in the TBA market in 2017 as it has in recent years, but we expect this to change as balance sheet normalization takes effect and the Fed becomes less involved in the Agency RMBS market and the supply of mortgage securities available to the market increases.
37
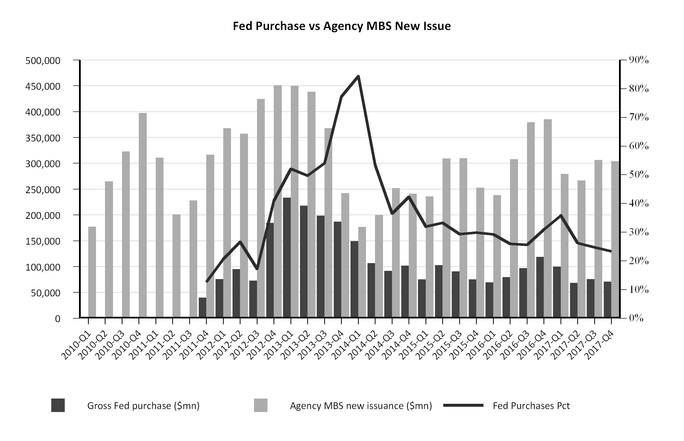
38
Agency RMBS prices remained relatively steady throughout 2017 following the notable post-election decline in late 2016. The graph below illustrates price movements for securities that make up a large concentration of our investment portfolio:
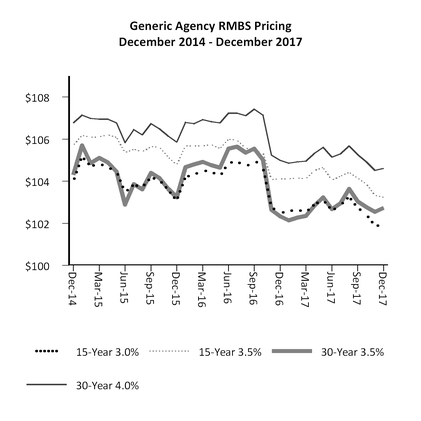
Mortgage rates held relatively steady throughout 2017 with a slight drop to sub-4.0% levels after the first quarter. As a result of the generally higher rate environment relative to 2016, and the fact that we repositioned our Agency RMBS portfolio into higher-coupon new production securities beginning late in 2016 through much of 2017, prepayments in our portfolio proved relatively benign throughout 2017. During 2017, prepayment rates increased modestly in the second half of the year, yet remained at subdued levels, especially for 30-year Agency RMBS. Due to the continued tight regulatory environment, absent any meaningful deregulation in the housing finance sector from the presidential administration, and the slight recent increase in mortgage rates, we expect prepayments to remain relatively subdued in 2018. The following charts shows the actual 1-month prepayment rates on our Agency RMBS the historical refinance index, and the 30-year mortgage national average rate.
39
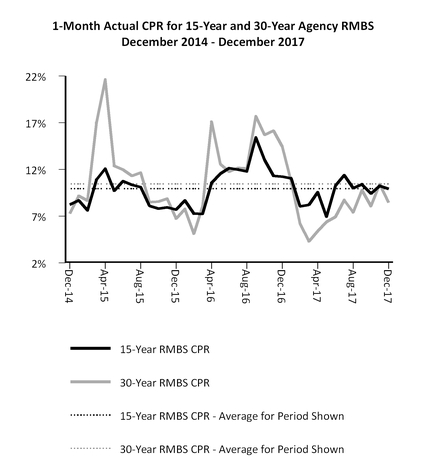
40
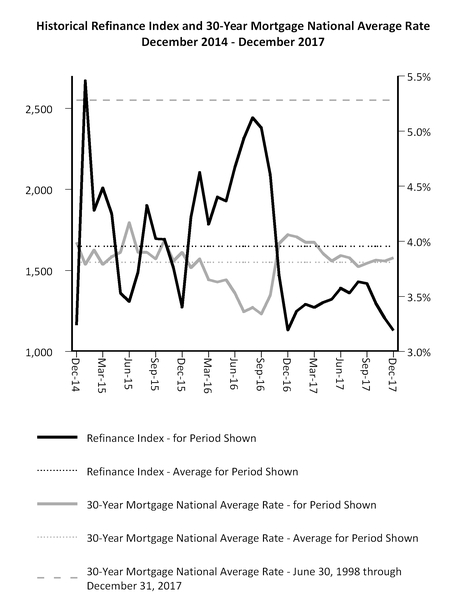
- Government Activity
Ongoing regulatory uncertainty and inconsistency continue to be a drag on home lending and related securitization activity. The presidential administration has made statements of its intentions to reform housing finance, but many potential policy changes will require Congressional action while some may be made through changes in leadership at various regulatory agencies. A review of the Dodd-Frank Act could affect banking regulations, and ultimately, our lenders.
Mortgage availability may somewhat improve due to changes to the FHFA's and FHA’s representation and warranty rules, but originators have not been given sufficient protection to originate loans that pose greater risk of defaults. With a new leader at the helm, the CFPB is reportedly reviewing QM rules, and has the power to define Qualified Mortgages. Policy changes on this front, including easing some QM requirements for lenders, could help expand the pool of potential borrowers for mortgage originators. Given the required coordination of a number of regulatory agencies and the limited headway to date, we continue to believe that opportunities to promote housing recovery through a significant boost in originations may be limited during 2018. We have yet to see any details on potential reforms, however.
Since the financial crisis, the FHFA and both houses of Congress have discussed and considered separate measures to restructure the U.S. housing finance system and the operations of Fannie Mae and Freddie Mac. Although factions in Congress have held divergent views on housing finance reform, these opposing views seem to be converging on some issues. Separate House and bi-partisan Senate bills that address mortgage finance reform are expected to be introduced in early 2018. The Senate version
41
would require restructuring of Fannie and Freddie and allow the entities, stripped of their federal charters, along with new guarantors to issue government-guaranteed mortgage securities, purportedly to use the Common Securitization Platform. The House plan would reportedly build on the Ginnie Mae platform, while Fannie and Freddie would be transitioned to privately owned utilities with private capital that would issue securities with a Ginnie Mae guarantee.
On January 30, 2018, legislation was introduced in the Senate that would permit captive insurance companies that were FHLB members prior to January 19, 2016, like CYS Insurance, to restore their membership in the FHLB. In June 2017, legislation was introduced in the House of Representatives that would permit a captive insurance company that was admitted to the FHLB prior to September 12, 2014 to continue its membership in the FHLB. The Company joined the FHLBC after September 12, 2014, so the House version of the legislation would not permit the Company to rejoin the FHLBC. It is still uncertain whether legislation on FHLB membership will be adopted, and if so, whether it would permit us to rejoin the FHLB.
- CYS Activity in Response to These Trends -
We continue to actively monitor, reposition, and manage our investment portfolio, the structure of our borrowings, and our hedge positions. To illustrate, following the U.S. presidential election and the back-up in interest rates in 2017, we repositioned our investment portfolio, selling lower coupon Agency RMBS and buying higher coupon, current production Agency RMBS, while simultaneously reducing our cost basis. The securities we purchased offered more attractive yields and prepayment protection. The increase in rates also resulted in a decrease in prepayment speeds. Collectively, the decline in prepayment speeds and the investment portfolio repositioning allowed us to keep the dividend unchanged throughout 2017, despite 3 separate 25 bps rate hikes. During the first half of 2017, we continued to sell lower yielding 15-year Agency RMBS, and purchase higher yielding 30-year Agency RMBS resulting in an increase in the average yield and a simultaneous decrease in the weighted average amortized cost of our Debt Securities portfolio. As a result of continually monitoring and repositioning our investment portfolio, coupled with the decline in prepayment speeds resulting from higher levels of prevailing interest rates, we were able to maintain a relatively stable average yield on Debt Securities. The average yield was 2.73% in the fourth quarter of 2017, up slightly from 2.71% recorded in the first quarter of 2017, despite three separate 25 bps hikes in the Federal Funds Rate and a flattening yield curve during 2017. During the second half of the year, we also replaced some of our 15-year Agency RMBS holdings with 3-year U.S. Treasuries as the market provided for "special" financing on U.S. Treasuries in the form of negative interest rates. This repositioning not only lowered our cost of financing, it enhanced our investment portfolio yield and simultaneously reduced the price volatility in our investment portfolio.
The size of our investment portfolio (including gross TBA Derivatives) increased to $13.1 billion (inclusive of TBA Derivative positions with a net fair value of $461.1 million) at December 31, 2017 from $12.3 billion (inclusive of TBA Derivative positions with a net fair value of $308.8 million) at December 31, 2016. Although we continued to take advantage of the TBA market throughout 2017, we did so to a lesser extent as this market provided less "special" pricing, or implied financing rates. As a result, Drop Income decreased to $29.9 million in 2017 from $32.9 million in 2016.
During 2017, we also took advantage of market opportunities to expand and reposition our hedge portfolio in anticipation of an increase in interest rates. At multiple times throughout the year, we opportunistically repositioned the hedge portfolio using a combination of interest rate swaps, cancellable swaps and swaptions. In the aggregate, during the course of 2017, we terminated swaps with a combined notional of $2.5 billion, a weighted-average pay rate of 1.50% and a weighted-average maturity of June 2020, and entered into new swaps with a combined notional of $3.5 billion, a weighted-average pay rate of 2.19%, and a weighted-average maturity of November 2023. We also continued to benefit from an increase in 3-month LIBOR throughout 2017, the receive leg of our swaps, which had the effect of reducing our net swap and cap pay rates during the year. Additionally, most of our interest rate caps became cashflow positive during 2017 as 3-month LIBOR increased to levels that exceeded the respective cap rates. The net effect of repositioning the hedge portfolio and increase in 3-month LIBOR resulted in an expansion of the hedge portfolio and an extension of the duration, in addition to a meaningful reduction in our hedging costs as measured by the net pay rate. The net pay rate on our hedge portfolio was 0.08% at December 31, 2017, down from 0.60% at December 31, 2016.
We also continued to proactively manage our borrowing costs by utilizing our extensive sources of financing and our ability to effectively identify and capitalize on opportunities in our markets. We continually seek to maintain and grow our financing sources, ending 2017 with a broad and diverse group of more than 50 lenders. Our extensive base of available sources of financing, combined with our collective years of experience with these sources, affords us an ability to understand the repo market and limits the possibility of paying a lender off-market rates. In addition, at various times during 2017, we identified and seized opportunities to finance our U.S. Treasuries at significant negative rates, effectively allowing us to maintain attractive asset yield levels, while we reduced book value exposure to rising rates. Lastly, for much of the year, debt ceiling dynamics as well as money market reform helped keep repo rates subdued. A notable reduction in U.S. Treasury bill issuance throughout the year, in response to the U.S. debt ceiling requirements, created a relative shortage of short-dated U.S. Treasuries available for the large pool of government
42
money funds looking to invest in short-dated government securities. The money funds turned to agency RMBS repo, among a short list of other eligible options, and this demand helped to moderate repo rates.
During 2017, our book value per share increased 0.60% to $8.38 at December 31, 2017 from $8.33 at December 31, 2016, after declaring dividends totaling $1.00 per share, and in the face of a flattening yield curve and three separate 25 bps hikes in the Federal Funds Rate. Leverage increased modestly to 7.33:1 from 7.06:1 year-over-year. As of December 31, 2017, we had substantial available liquidity of $1.0 billion, or 64.6% of our equity. We increased the duration and size of our hedge book to $10.0 billion at December 31, 2017 from $9.0 billion at December 31, 2016, which boosted the hedge ratio to 98.9% from 92.3% for the same respective periods.
In summary, during 2017, we benefited from a tailwind of low volatility even as short term rates began to ratchet up during the second half of the year and the yield curve flattened. We continued to transition our portfolio to a heavier weighting in 30-year Agency RMBS from 15-year Agency RMBS. The former set of securities is higher-yielding and should be less sensitive to yield curve flattening. The increase in interested rates led to a decline in prepayments. We also expanded and extended the duration of our hedge portfolio, taking advantage of low rates to strike new hedge positions as the markets presented opportunities. At December 31, 2017, our hedge portfolio was larger and had a longer duration profile than a year ago and should serve us better into a potentially more volatile 2018. Our financing costs remain manageable and our availability of repo financing remains broad and widely available.
Financial Condition
Our Agency RMBS were purchased at a net premium to their face values, generally due to the average interest rates on these investments being higher than the prevailing market rates at the time of purchase. As of December 31, 2017 and December 31, 2016 we had approximately $371.9 million and $452.3 million, respectively, of net unamortized premium included in the cost basis of our investments. Our Debt Securities portfolio, including TBA Derivative positions (with a net fair value of $461.1 million and $(308.8) million at December 31, 2017 and 2016, respectively), consisted of the following assets as of December 31, 2017 and 2016:
43
(dollars in thousands) | Weighted-Average | |||||||||||||||||||
Coupon | Face Value | Fair Value | Amortized Cost Basis per Face Value | Loan Balance(1) | Loan Age (in months)(1) | 3 Month CPR(1)(2) | Duration(3) | |||||||||||||
December 31, 2017 | ||||||||||||||||||||
15-Year Agency RMBS | ||||||||||||||||||||
2.5% | $ | 210,098 | $ | 209,878 | $ | 102.35 | $195 | 14 | 4.3% | 4.15 | ||||||||||
TBA 2.5%* | 120,000 | 119,813 | 99.84 | n/a | n/a | n/a | 3.94 | |||||||||||||
3.0% | 1,985,385 | 2,024,695 | 102.37 | 262 | 28 | 9.0 | 3.28 | |||||||||||||
3.5% | 568,160 | 587,577 | 102.56 | 202 | 67 | 13.0 | 2.74 | |||||||||||||
4.0% | 81,454 | 84,887 | 100.94 | 165 | 82 | 16.8 | 2.52 | |||||||||||||
4.5% | 10,300 | 10,775 | 102.01 | 246 | 95 | 15.7 | 1.96 | |||||||||||||
Subtotal | 2,975,397 | 3,037,625 | 102.26 | 242 | 37 | 9.7 | 3.24 | |||||||||||||
20-Year Agency RMBS | ||||||||||||||||||||
4.5% | 30,692 | 32,748 | 102.53 | 207 | 89 | 23.8 | 2.74 | |||||||||||||
30-Year Agency RMBS | ||||||||||||||||||||
3.0% | 1,534 | 1,557 | 104.39 | 132 | 55 | 0.6 | 5.32 | |||||||||||||
3.5% | 4,120,955 | 4,240,031 | 102.77 | 329 | 9 | 6.4 | 4.14 | |||||||||||||
TBA 3.5%* | 848,000 | 870,663 | 102.58 | n/a | n/a | n/a | 3.80 | |||||||||||||
4.0% | 2,684,319 | 2,815,290 | 104.88 | 298 | 18 | 12.3 | 2.94 | |||||||||||||
TBA 4.0%* | 432,000 | 451,756 | 104.86 | n/a | n/a | n/a | 2.71 | |||||||||||||
4.5% | 93,793 | 100,565 | 106.47 | 267 | 80 | 14.0 | 2.67 | |||||||||||||
Subtotal | 8,180,601 | 8,479,862 | 103.59 | 316 | 14 | 8.7 | 3.62 | |||||||||||||
Hybrid ARMs | ||||||||||||||||||||
3.1%(4) | 488,665 | 498,630 | 102.43 | 323 | 26 | 10.3 | 2.38 | |||||||||||||
Subtotal Agency RMBS | 11,675,355 | 12,048,865 | 103.20 | 295 | 21 | 9.2 | 3.47 | |||||||||||||
U.S. Treasuries | ||||||||||||||||||||
1.9% | 1,050,000 | 1,046,934 | 99.81 | n/a | n/a | n/a | 2.80 | |||||||||||||
Total | $ | 12,725,355 | $ | 13,095,799 | $ | 102.92 | $295 | 21 | 9.2% | 3.41 | ||||||||||
December 31, 2016 | ||||||||||||||||||||
15-Year Agency RMBS | ||||||||||||||||||||
2.5% | $ | 1,046,887 | $ | 1,049,504 | $ | 102.78 | $276 | 4 | 5.4% | 3.94 | ||||||||||
TBA 2.5%(5)* | (400,000 | ) | (400,633 | ) | 99.73 | n/a | n/a | n/a | 3.75 | |||||||||||
3.0% | 2,540,786 | 2,610,678 | 102.68 | 263 | 27 | 13.0 | 3.03 | |||||||||||||
TBA 3.0%* | 200,000 | 205,174 | 102.86 | n/a | n/a | n/a | 2.83 | |||||||||||||
3.5% | 813,323 | 849,549 | 102.98 | 215 | 52 | 14.6 | 2.52 | |||||||||||||
4.0% | 108,173 | 114,207 | 101.03 | 167 | 70 | 14.7 | 2.27 | |||||||||||||
4.5% | 14,439 | 15,256 | 102.23 | 240 | 83 | 19.3 | 1.79 | |||||||||||||
Subtotal | 4,323,608 | 4,443,735 | 103.00 | 255 | 27 | 12.4 | 3.05 | |||||||||||||
20-Year Agency RMBS | ||||||||||||||||||||
4.5% | 39,328 | 42,348 | 102.66 | 209 | 77 | 19.6 | 2.16 | |||||||||||||
30-Year Agency RMBS | ||||||||||||||||||||
3.0% | 1,776 | 1,802 | 104.51 | 130 | 43 | 0.2 | 4.69 | |||||||||||||
3.5% | 4,934,357 | 5,062,330 | 104.48 | 338 | 8 | 9.5 | 4.48 | |||||||||||||
44
(dollars in thousands) | Weighted-Average | |||||||||||||||||||
Coupon | Face Value | Fair Value | Amortized Cost Basis per Face Value | Loan Balance(1) | Loan Age (in months)(1) | 3 Month CPR(1)(2) | Duration(3) | |||||||||||||
TBA 3.5%* | 383,000 | 392,293 | 102.58 | n/a | n/a | n/a | 4.10 | |||||||||||||
4.0% | 1,247,116 | 1,314,969 | 104.93 | 244 | 30 | 22.0 | 3.30 | |||||||||||||
TBA 4.0%* | 500,000 | 524,869 | 104.50 | n/a | n/a | n/a | 2.95 | |||||||||||||
4.5% | 113,274 | 122,361 | 106.63 | 282 | 68 | 21.7 | 2.32 | |||||||||||||
Subtotal | 7,179,523 | 7,418,624 | 104.34 | 319 | 13 | 13.1 | 4.12 | |||||||||||||
Hybrid ARMs | ||||||||||||||||||||
2.8%(4) | 375,745 | 385,502 | 102.74 | 322 | 30 | 21.3 | 2.16 | |||||||||||||
Subtotal Agency RMBS | 11,918,204 | 12,290,209 | 103.80 | 293 | 20 | 13.1 | 3.66 | |||||||||||||
U.S. Treasuries | ||||||||||||||||||||
0.6% | 50,000 | 49,686 | 99.90 | n/a | n/a | n/a | 1.48 | |||||||||||||
Total | $ | 11,968,204 | $ | 12,339,895 | $ | 103.78 | $293 | 20 | 13.1% | 3.66 | ||||||||||
__________________
(1) | TBAs are excluded from this calculation as they do not have a defined weighted-average loan balance or age until mortgages have been assigned to the pool. |
(2) | The Constant Prepayment Rate ("CPR") represents the three-month CPR of the Company's Agency RMBS held at December 31, 2017 and December 31, 2016. The CPR experienced by the Company during the period may differ. Securities with no prepayment history are excluded from this calculation. |
(3) | Duration measures the market price volatility of financial instruments as interest rates change, using Dollar Value of One Basis Point, or "DV01", methodology. We generally calculate duration using various third-party financial models and empirical data. Different models and methodologies can produce different estimates of duration for the same securities. Duration estimates in the table are calculated utilizing Yield Book® software and may reflect adjustments based on our judgment. |
(4) | Coupon represents the weighted-average coupon of Hybrid ARMs. |
(5) | Includes $400.6 million of forward settling transactions at December 31, 2016. |
* | Includes TBA Derivatives with a fair value of $461.1 million and $(308.8) million at December 31, 2017 and 2016, respectively. |
In January 2018, the monthly weighted-average experienced CPR of the Company's Debt Securities declined to 7.5% from 9.0% in December 2017.
Hedging Instruments
We seek to hedge interest rate risk to the extent it is determined to be in the best interests of our stockholders. Our policies do not contain specific requirements as to the percentages or amount of interest rate risk we are required to hedge. No assurance can be given that our hedging activities will have the desired impact on our results of operations or financial condition. None of the Company's derivatives have been designated as hedging instruments for accounting purposes.
Interest rate hedging may fail to have the desired effect or could adversely affect us because, among other things:
• | interest rate hedging can be expensive, particularly during periods of rising and volatile interest rates; |
• | available interest rate hedging may not correspond directly with the interest rate risk we desire to hedge; |
• | due to prepayments on assets and repayments of debt securing such assets, the duration of the hedge may not match the duration of the related liability or asset; |
• | the credit quality of the hedging counterparty may be downgraded to such an extent that it may impair our ability to sell or assign our side of the hedging transaction; and |
• | the hedging counterparty may default on its obligation to pay. |
We engage in interest rate swaps, swaptions and caps as a means of managing our exposure to an increase in interest rates and our cost of financing for the term of the swap, underlying term of the swaption and cap contracts. An interest rate swap is a contractual agreement entered into by two counterparties under which each agrees to make periodic payments to the other for an agreed period of time based upon a notional amount of principal. Under the most common form of interest rate swap, commonly known as a fixed-floating interest rate swap, a series of fixed interest rate payments on a notional amount of
45
principal are exchanged for a series of floating interest rate payments on such notional amount. A swaption is an agreement that provides us, the buyer, with an option to enter into an interest rate swap agreement at a specified notional, term and pay rate on a specified future date. The swaption agreement will specify whether the buyer of the swaption will be a fixed-rate receiver or a fixed-rate payer. In a simple interest rate cap, one investor pays a premium for a notional principal amount based on a capped interest rate (the "cap rate"). When the floating rate exceeds the cap rate, the investor receives a payment from the cap counterparty equal to the difference between the floating rate and the cap rate on the same notional principal amount for a specified period of time. The fair value of interest rate swaps, swaptions and caps is heavily dependent on the current fixed-rate, the corresponding term structure of floating rates (known as the yield curve), and the expectation of changes in future floating rates. Below is a summary of our interest rate swaps and caps as of December 31, 2017 and 2016:
Weighted-Average | ||||||||||||||||||
December 31, 2017 | Number of Contracts | Notional (000's) | Rate | Maturity | Duration | Fair Value (000's) | ||||||||||||
Interest Rate Swaps | 26 | $ | 7,475,000 | 1.59 | % | September 2021 | (3.29 | ) | $ | 120,154 | ||||||||
Interest Rate Caps | 5 | 2,500,000 | 1.28 | % | January 2020 | (1.97 | ) | 39,466 | ||||||||||
Total | 31 | 9,975,000 | 1.51 | % | April 2021 | (2.96 | ) | 159,620 | ||||||||||
December 31, 2016 | ||||||||||||||||||
Interest Rate Swaps | 17 | $ | 6,450,000 | 1.23 | % | January 2020 | (2.72 | ) | $ | 80,608 | ||||||||
Interest Rate Caps | 5 | 2,500,000 | 1.28 | % | January 2020 | (1.94 | ) | 42,532 | ||||||||||
Total | 22 | 8,950,000 | 1.24 | % | January 2020 | (2.50 | ) | 123,140 | ||||||||||
As of December 31, 2017, the Company had entered into interest rate swaps with an aggregate notional amount of $7.5 billion, a weighted-average fixed rate of 1.59%, and a weighted-average expiration of 3.7 years. This compares with interest rate swaps with a notional amount of $6.5 billion, a weighted-average fixed rate of 1.23%, and a weighted-average expiration of 3.0 years at December 31, 2016. The receive rate on the Company's interest rate swaps is 3-month LIBOR. At December 31, 2017, the Company had entered into interest rate caps with an aggregate notional amount of $2.5 billion, a weighted-average fixed rate of 1.28%, and a weighted-average expiration of 2.0 years. This compares with interest rate caps with a notional amount of $2.5 billion, a weighted-average fixed rate of 1.28%, and a weighted-average expiration of 3.0 years at December 31, 2016.
The Company does not consider TBA Derivatives to be hedging instruments.
Liabilities
We finance our assets through repo borrowings and FHLBC Advances (prior to the effective date of the Final Rule on January 19, 2016, which precluded us from securing new advances). Repo borrowings and FHLBC Advances are secured by our assets and generally bear interest rates that have historically moved in close relationship to LIBOR. At December 31, 2017 and 2016, we had repo borrowings with 37 and 35 counterparties, respectively, which are summarized below (dollars in thousands):
December 31, 2017 | Weighted-Average | |||||||||||
Original Days to Maturity by Collateral Type | Repo Borrowings Outstanding | Percentage of Total | Interest Rate | Remaining Days to Maturity | Original Days to Maturity | |||||||
Agency RMBS | ||||||||||||
≤ 30 Days | $ | 423,304 | 4% | 1.68% | 3 | 13 | ||||||
> 30 to ≤ 60 Days | 1,168,124 | 12% | 1.45% | 12 | 53 | |||||||
> 60 Days | 7,477,177 | 74% | 1.45% | 64 | 158 | |||||||
Total | $ | 9,068,605 | 90% | 1.46% | 54 | 138 | ||||||
U.S. Treasuries | ||||||||||||
≤ 30 Days | $ | 1,021,312 | 10% | 1.08% | 16 | 32 | ||||||
Total | $ | 10,089,917 | 100% | 1.42% | 51 | 127 | ||||||
46
December 31, 2016 | Weighted-Average | |||||||||||
Original Days to Maturity by Collateral Type | Repo Borrowings Outstanding | Percentage of Total | Interest Rate | Remaining Days to Maturity | Original Days to Maturity | |||||||
Agency RMBS | ||||||||||||
≤ 30 Days | $ | 651,032 | 7% | 0.83% | 5 | 11 | ||||||
> 30 to ≤ 60 Days | 1,135,428 | 12% | 0.89% | 16 | 45 | |||||||
> 60 Days | 7,905,084 | 81% | 0.90% | 63 | 139 | |||||||
Total | $ | 9,691,544 | 100% | 0.89% | 53 | 119 | ||||||
As of December 31, 2017 and 2016, we had an aggregate payable for securities purchased, a portion of which will be or was financed through repo borrowings as summarized below (in thousands).
December 31, 2017 | ||||||||
Settle Date | Face Value | Payable | ||||||
January 2018 | $ | 950,000 | $ | 982,883 | ||||
February 2018 | 298,664 | 307,922 | ||||||
$ | 1,248,664 | $ | 1,290,805 | |||||
December 31, 2016 | ||||||||
Settle Date | Face Value | Payable | ||||||
January 2017 | $ | 1,376,248 | $ | 1,418,658 | ||||
February 2017 | 450,045 | 463,305 | ||||||
$ | 1,826,293 | $ | 1,881,963 | |||||
Results of Operations
There are limitations associated with the use of our non-GAAP measures of Economic Net Interest Income, Economic Interest Expense, and Core Earnings as measures of the Company’s financial performance over any period. The Company’s presentation of non-GAAP measures may not be comparable to similarly titled measures of other companies, which may use different calculations. As a result, our non-GAAP measures should not be considered a substitute for the Company’s GAAP net income (loss), net interest income (loss), or total interest expense, a measure of our financial performance or any measure of our liquidity under GAAP.
Our Economic Net Interest Income, a non-GAAP measure, is generated primarily from the net spread, or difference, between the interest income we earn on our investment portfolio and the cost of our borrowings and hedging activities. The amount of Economic Net Interest Income we earn on our investments depends in part on our ability to control our financing costs, which comprise a significant portion of our operating expenses. Economic Interest Expense consists of interest expense, as computed in accordance with GAAP, plus interest rate hedge expense, net used to hedge our cost of funds, a component of net gain (loss) on derivative instruments in the Company's Consolidated Statements of Operations. The Company uses interest rate swaps (cancellable and non-cancellable), swaptions, and caps to manage its exposure to changes in interest rates on its interest bearing liabilities by economically hedging cash flows associated with these borrowings. Presenting the contractual interest payments on interest rate swaps and caps, as well as the premium paid to enter into a swaption, with the interest paid on interest-bearing liabilities, reflects the Company's total contractual interest payments. Economic Interest Expense depicts the economic cost of our financing strategy. We present the non-GAAP measures Economic Net Interest Income and Economic Interest Expense to provide an economic measure of our interest income net of borrowing and hedge expense, which management uses to evaluate the Company's investments portfolio. We believe that providing users of our financial information with such measures in addition to the related GAAP measures gives users additional transparency into the information used by our management in its financial and operational decision-making, and that it is meaningful information to consider in addition to the related GAAP measures as these measures reflect the net economic interest income earned and cost of financing and hedging our investment portfolio.
47
The following table provides GAAP measures of net interest income and interest expense and details with respect to reconciling the aforementioned line items on a non-GAAP basis for each respective period.
December 31, 2017 | December 31, 2016 | December 31, 2015 | ||||||||||
Net interest income | $ | 196,167 | $ | 220,258 | $ | 285,066 | ||||||
Interest rate hedge expense, net | 29,550 | 55,798 | 100,110 | |||||||||
Economic net interest income | $ | 166,617 | $ | 164,460 | $ | 184,956 | ||||||
Total interest expense | $ | 114,616 | $ | 74,279 | $ | 46,129 | ||||||
Interest rate hedge expense, net | 29,550 | 55,798 | 100,110 | |||||||||
Economic interest expense | $ | 144,166 | $ | 130,077 | $ | 146,239 | ||||||
From the Company's inception through September 30, 2015, "Swap and cap interest expense" was recognized in "Interest expense", and was a component of "Net interest income" in the Consolidated Statements of Operations. Effective October 1, 2015, "Swap and cap interest expense" is recognized as a component of "Net gain (loss) on derivative instruments" in "Total Other income (loss)" in the Consolidated Statements of Operations. This presentation change was made in order to record income, expenses and changes in the fair value of derivatives in one line item in the financial statements, consistent with common industry practice. As a result of this change, the caption "Net interest income" no longer includes “Swap and cap interest expense”.
Prior to October 1, 2017, "Interest rate hedge expense, net" was referred to as "Swap and cap interest expense" in the Consolidated Statement of Operations. This line item includes the following: (i) net periodic payments made on interest rate swaps and interest rate caps, (ii) the periodic amortization of premiums paid to enter into interest rate caps, and (iii) the periodic amortization of premiums paid to enter into swaptions, less, total payments received in connection with (A) the receive leg of our interest rate swaps, and (B) payments received in connection with interest rate caps. On October 1, 2017, the name was changed to “Interest rate hedge expense, net”, to better reflect the broad nature of items included in this line items, all of which reflect the Company’s net cost of hedging its exposure to interest rates. Prior period financial statement line items have been renamed to conform to the current period presentation.
Year Ended December 31, 2017 Compared to the Year Ended December 31, 2016
Net Income (Loss)
Net income (loss) available to common stockholders increased $164.8 million to a net income of $160.4 million for the year ended December 31, 2017, from a net loss of $(4.4) million for the year ended December 31, 2016. The increase in net income was primarily due to a $92.8 million decrease in net realized and unrealized (loss) on investments, a $69.2 million increase in net realized and unrealized gain on derivative instruments, a $26.2 million decrease in interest rate hedge expense, net and a $16.2 million increase in interest income, partially offset by a $40.3 million increase in total interest expense. The major components of the increase in net income (loss) available to common stockholders during 2017 are detailed below.
The results of our business are generally correlated with changes in the yield curve and interest rates. In general, U.S Treasury rates ended the year at relatively similar levels to where they had started, while swap rates were up with the rest of the shorter end of the yield curve. For example, the 10-year U.S. Treasury rate decreased 3 bps to 2.41% at December 31, 2017 while 5-year swap rates increased 26 bps to 2.24% at December 31, 2017.
Interest Income and Asset Yield
Our principal source of income is the interest income that we earn on our Debt Securities portfolio. Interest income, which consists of interest income on our Debt Securities, increased by $16.2 million to $310.8 million for the year ended December 31, 2017, as compared to $294.5 million for the year ended December 31, 2016. The factors driving this decrease are changes in both the size of our investment securities portfolio and the related yield, as shown below (in thousands):
Change in Size | Change in Yield | Change in Size & Yield | |||||||||||
Change in average settled | $ | (548,394 | ) | Change in average yield | 0.27 | % | Change in average settled | $ | (548,394 | ) | |||
2016 average yield | 2.50 | % | 2016 average settled | 11,781,920 | Change in average yield | 0.27 | % | ||||||
Change | $ | (13,709 | ) | Change | $ | 31,417 | Change | $ | (1,462 | ) | |||
Total change | $ | 16,246 | |||||||||||
Our annualized yield on average settled Debt Securities for the year ended December 31, 2017 was 2.77%, compared to 2.50% for the year ended December 31, 2016. The increase in interest income and average yield during 2017 largely resulted
48
from a decrease in prepayment speeds, partially offset by a decline in average settled Debt Securities. The weighted-average actual experienced CPR for the year ended December 31, 2017 decreased to 8.6% from 12.1% for the year ended December 31, 2016 and amortization expense decreased $28.9 million to $55.2 million for the year ended December 31, 2017, compared to $84.1 million for the year ended December 31, 2016. Our average settled Debt Securities decreased $0.6 billion to $11.2 billion for the year ended December 31, 2017 from $11.8 billion for the year ended December 31, 2016. In addition, our average settled Debt Securities included a larger amount of U.S. Treasuries during 2017, as we seized opportunities to finance U.S. Treasuries at negative rates during 2017.
Economic Net Interest Income
Our Economic Net Interest Income for the year ended December 31, 2017 was $166.6 million, and our interest rate spread net of hedge was 1.28% compared to net interest income of $164.5 million and an interest rate spread net of hedge of 1.24% for the year ended December 31, 2016. The increase in our Economic Net Interest Income was principally due to an increase in the average yield and total interest income, a decrease in interest rate hedge expense, net, largely offset by an increase in total interest expense during the year ended December 31, 2017. While our Economic Net Interest Income is a good measure of our earnings, we believe our interest rate spread net of hedge is an important performance indicator as it reflects the cost of hedging.
Economic Interest Expense and Cost of Funds
Economic Interest Expense for the year ended December 31, 2017, which consisted of interest expense from repo borrowings, FHLBC Advances (solely for 2016) and interest rate hedge expense, net, increased $14.1 million to $144.2 million, from $130.1 million for the year ended December 31, 2016. The increase in Economic Interest Expense was due to an increase in the average cost of funds and a corresponding increase in total interest expense, partially offset by a decrease in average repo borrowings outstanding and a decrease in interest rate hedge expense, net. Interest expense from repo borrowings and FHLBC Advances (solely for 2016) increased by $40.3 million to $114.6 million for the year ended December 31, 2017, from $74.3 million in the prior year as our average cost of funds rose to 1.18% for the year ended December 31, 2017 from 0.72% in the prior year as interest rates on our repo borrowings increased as a result of three separate Fed rate hikes during the year. Our average repo borrowings and FHLBC Advances decreased to $9.7 billion for the year ended December 31, 2017 from $10.3 billion in the prior year, consistent with the decline in the average investment portfolio during the comparable period. The table below illustrates the net result of changes to the average amount of repurchase agreements and FHLBC Advances outstanding and the increase in the cost of funds on interest expense during the year ended December 31, 2017 (dollars in thousands):
Change in Size | Change in Rate | Change in Size & Rate | |||||||||||
Change in average outstanding | $ | (593,804 | ) | Change in average rate | 0.46 | % | Change in average outstanding | $ | (593,804 | ) | |||
2016 average rate | 0.72 | % | 2016 average outstanding | 10,290,967 | Change in average rate | 0.46 | % | ||||||
Change | $ | (4,286 | ) | Change | $ | 47,355 | Change | $ | (2,732 | ) | |||
Total change | $ | 40,337 | |||||||||||
Interest rate hedge expense, net decreased by $26.2 million to $29.6 million for the year ended December 31, 2017 from $55.8 million in the prior year. The decrease in interest rate hedge expense, net was primarily attributable an increase in 3-month LIBOR, the receive-leg on our swaps, over the comparable period. 3-month LIBOR increased from 1.00% at December 31, 2016 to 1.69% at December 31, 2017, driving the decrease in the average swap and cap rate to 0.33% in 2017 from 0.59% in the prior year. We also experienced a $0.4 billion decrease in the average aggregate swap and cap notional amount to $9.1 billion for the year ended December 31, 2017 from $9.5 billion in the prior year, as shown in the table below (in thousands):
Change in Size | Change in Rate | Change in Size & Rate | |||||||||||
Change in average notional outstanding | $ | (436,538 | ) | Change in average rate | (0.26 | )% | Change in average notional outstanding | $ | (436,538 | ) | |||
2016 average rate | 0.59 | % | 2016 average notional outstanding | 9,526,923 | Change in average rate | (0.26 | )% | ||||||
Change | $ | (2,557 | ) | Change | $ | (24,829 | ) | Change | $ | 1,138 | |||
Total change | $ | (26,248 | ) | ||||||||||
Our annualized weighted-average cost of funds and hedge was 1.49% for the year ended December 31, 2017, as compared to 1.26% for the prior year. The components of our cost of funds were (i) rates on our repo borrowings and FHLBC Advances (collectively "Total Outstanding Borrowings"), (ii) rates on our swaps and caps, and premiums paid for caps and swaptions, (iii) the size of our Total Outstanding Borrowings, and (iv) the total notional amount of our swaps, swaptions and caps.
49
Other Income (Loss)
For the year ended December 31, 2017, our total other income (loss) was $8.1 million compared to $(180.3) million in the prior year. The major components of the periodic change in total other income (loss) during 2017 are discussed below.
Net Realized and Unrealized Gain (Loss) on Investments and Drop Income
During the year ended December 31, 2017, our net realized and unrealized (loss) on investments decreased by $92.8 million to a net loss of $(20.3) million from a net loss of $(113.0) million in the prior year. This change was mainly driven by decreases in the prices of Agency RMBS for the years ended December 31, 2017 and 2016, and changes in the yield curve. During the year ended December 31, 2017, the price of a 15-year 3.0% Agency RMBS decreased $0.59 to $101.89, and during the year ended December 31, 2016, the price decreased $0.60 to $102.48. During the year ended December 31, 2017, while the price of a 30-year 3.5% Agency RMBS increased $0.40, the price decreased $0.90 during the year ended December 31, 2016. During 2017, the 10-year U.S. Treasury yield decreased 3 bps, while it increased 17 bps in 2016.
Drop Income is the difference between the spot price and the forward settlement price for the same Agency RMBS on the trade date. This difference is also the economic equivalent of the assumed interest rate spread net of hedge (yield less financing costs) of the Agency RMBS from trade date to settlement date. The Company derives Drop Income through utilization of forward settling transactions of Agency RMBS. During the years ended December 31, 2017 and 2016, we generated Drop Income of approximately $29.9 million and $32.9 million, respectively. The lower Drop Income during the year ended December 31, 2017 was due primarily to lower volumes of forward settling transactions from which we derive Drop Income and less special financing available in the TBA market during 2017 compared to 2016. During the year ended December 31, 2017, the average gross balance in the combined TBA Securities and TBA Derivatives portfolio was $1.36 billion, a $0.04 billion decrease compared to the average gross balance of $1.40 billion in the prior year. Drop Income is a component of our net realized and unrealized gain (loss) on investments and our net realized and unrealized gain (loss) on derivative instruments in the accompanying Consolidated Statement of Operations and is therefore excluded from Core Earnings.
Net Realized and Unrealized Gain (Loss) on Derivative Instruments
Net realized and unrealized gain (loss) on derivative instruments is comprised of interest rate hedge expense, net, which is analyzed as part of Economic Interest Expense above, and net realized and unrealized gain (loss) on derivative instruments. Net realized and unrealized gain (loss) on derivative instruments was $57.8 million (comprised of $52.4 million net realized and unrealized gain on swap and cap contracts, and $5.4 million net realized and unrealized gain on TBA Derivatives) for the year ended December 31, 2017, compared to a loss of $(11.5) million (comprised of $9.1 million net realized and unrealized gain on swap and cap contracts, and $(20.6) million net realized and unrealized loss on TBA Derivatives) for the year ended December 31, 2016. The change in net realized and unrealized gain (loss) on derivative instruments for the year ended December 31, 2017 was due primarily to an increase in swap rates, which caused our swaps and caps to increase in value, coupled with an increase in value of the TBA Derivatives. An increase in swap rates during the year ended December 31, 2016 caused the value of our swaps and caps to increase, largely offset by a decrease in the value of our TBA Derivatives, which stemmed from an increase in long-term bond yields. Our swaps and caps are designed principally to protect us in an environment of increasing interest rates. During the year ended December 31, 2017, 5-year and 7-year swap rates increased by 26 bps and 15 bps, respectively. During the year ended December 31, 2016, 5-year and 7-year swap rates increased by 24 bps and 21 bps, respectively.
Operating Expenses
Operating expenses totaled approximately $23.0 million and $23.6 million for the years ended December 31, 2017 and 2016, respectively representing an expense ratio of 1.47% for 2017, compared to 1.39% for 2016. Excluding non-recurring costs of $1.1 million and $2.6 million in 2017 and 2016, the operating expense ratio was 1.40% and 1.23%, respectively. The increase in the operating expense ratio is primarily attributable to a decrease in average stockholders' equity to $1.56 billion for the year ended December 31, 2017 compared to $1.70 billion during 2016, partially offset by a decrease in operating expenses. The decrease in operating expenses during the comparable period was due primarily to a $1.7 million decrease in income tax expense, partially offset by a $0.7 increase in employee incentive compensation and $0.5 million of accelerated vesting of our prior Chief Financial Officer's restricted stock upon retirement in March 2017.
Year Ended December 31, 2016 Compared to the Year Ended December 31, 2015
Net Income (Loss)
Net income (loss) available to common stockholders increased $21.2 million to a net loss of $(4.4) million for the year ended December 31, 2016, compared to a net loss of $(25.6) million for the year ended December 31, 2015. The increase in net income was primarily due to a decrease in interest rate hedge expense, net of $44.3 million, an increase in net realized and unrealized gain on derivative instruments of $43.4 million and a $3.1 million increase in net realized and unrealized gain (loss) on investments, partially offset by a $36.7 million decrease in interest income and a $28.2 million increase in total interest
50
expense. The major components of the increase in net income (loss) available to common stockholders during 2016, relative to 2015, are detailed below.
As previously noted, the results of our business are generally correlated with changes in the yield curve and interest rates. In general, U.S. Treasury rates and swap rates ended 2016 at relatively similar levels to where they had started. For example, the 10-year U.S. Treasury rate increased 17 bps to 2.44% at December 31, 2016 while 5-year swap rates increased 24 bps to 1.98% at December 31, 2016.
Interest Income and Asset Yield
Our principal source of income is the interest income that we earn on our Debt Securities portfolio. Interest income, which consists of interest income on our Debt Securities, decreased by $36.7 million to $294.5 million for the year ended December 31, 2016, as compared to $331.2 million for the year ended December 31, 2015. The factors driving this decrease are changes both in the size of our investment securities portfolio and the related yield, as shown below (in thousands):
Change in Size | Change in Yield | Change in Size & Yield | |||||||||||
Change in average settled | $ | (1,180,420 | ) | Change in average yield | (0.06 | )% | Change in average settled | $ | (1,180,420 | ) | |||
2015 average yield | 2.56 | % | 2015 average settled | 12,962,340 | Change in average yield | (0.06 | )% | ||||||
Change | $ | (30,160 | ) | Change | $ | (7,149 | ) | Change | $ | 651 | |||
Total change | $ | (36,658 | ) | ||||||||||
Our annualized yield on average settled Debt Securities for the year ended December 31, 2016 was 2.50%, compared to 2.56% for the year ended December 31, 2015. The decrease in average yield during 2016 largely resulted from an increase in prepayment speeds and a decline in average settled Debt Securities. The weighted-average actual experienced CPR for the year ended December 31, 2016 increased to 12.1% from 10.4% for the year ended December 31, 2015, while amortization expense decreased $6.3 million to $84.1 million for the year ended December 31, 2016, compared to $90.4 million for the year ended December 31, 2015. Despite an increase in CPR during 2016, amortization decreased as a result of a $1.2 billion decrease in our average settled Debt Securities to $11.8 billion for the year ended December 31, 2016 from $13.0 billion for the year ended December 31, 2015. In addition, our average settled Debt Securities included a larger amount of U.S. Treasuries during 2016, as we seized opportunities to finance U.S. Treasuries at negative rates.
Economic Net Interest Income
Our Economic Net Interest Income for the year ended December 31, 2016 was $164.5 million, and our interest rate spread net of hedge was 1.24% compared to net interest income of $185.0 million and an interest rate spread net of hedge of 1.28% for the year ended December 31, 2015. The decrease in our Economic Net Interest Income was principally due to a decrease in average settled Debt Securities, a decline in the average yield and an increase in total interest expense, partially offset by a decrease in interest rate hedge expense, net during the year ended December 31, 2016. While our Economic Net Interest Income is a good measure of our earnings, we believe our interest rate spread net of hedge is an important performance indicator as it reflects the cost of hedging.
Economic Interest Expense and Cost of Funds
Economic Interest Expense for the year ended December 31, 2016, which consisted of interest expense from repo borrowings, FHLBC Advances and interest rate hedge expense, net, decreased $16.1 million to $130.1 million, from $146.2 million for the year ended December 31, 2015. The decrease in Economic Interest Expense was due to a decrease in our average repo borrowings and FHLBC Advances and a decrease in interest rate hedge expense, net, offset by an increase in the average cost of funds. Interest expense from repo borrowings and FHLBC Advances increased by $28.2 million to $74.3 million for the year ended December 31, 2016, from $46.1 million in the prior year due to a higher cost of funds. Our weighted-average cost of funds rose to 0.72% for the year ended December 31, 2016 from 0.40% in the prior year as interest rates on our repo borrowings increased during 2016. Our average repo borrowings and FHLBC Advances decreased to $10.3 billion for the year ended December 31, 2016 from $11.4 billion in the prior year, consistent with the decline in the average investment portfolio during 2016 as compared to 2015. The table below illustrates the net result of changes to the average amount of repurchase agreements and FHLBC Advances outstanding and the increase in the cost of funds on interest expense during the year ended December 31, 2016 (dollars in thousands):
51
Change in Size | Change in Rate | Change in Size & Rate | |||||||||||
Change in average outstanding | $ | (1,104,416 | ) | Change in average rate | 0.32 | % | Change in average outstanding | $ | (1,104,416 | ) | |||
2015 average rate | 0.40 | % | 2015 average outstanding | 11,395,383 | Change in average rate | 0.32 | % | ||||||
Change | $ | (4,471 | ) | Change | $ | 36,122 | Change | $ | (3,501 | ) | |||
Total change | $ | 28,150 | |||||||||||
Interest rate hedge expense, net decreased by $44.3 million to $55.8 million for the year ended December 31, 2016 from $100.1 million in the prior year. The decrease in interest rate hedge expense, net was primarily attributable to the decrease in the average swap and cap rate to 0.59% in 2016 from 0.99% in the prior year, and a $0.6 billion decrease in the average aggregate swap and cap notional amount to $9.5 billion for the year ended December 31, 2016 from $10.2 billion in the prior year, as shown in the table below (in thousands):
Change in Size | Change in Rate | Change in Size & Rate | |||||||||||
Change in average notional outstanding | $ | (626,923 | ) | Change in average rate | (0.40 | )% | Change in average notional outstanding | $ | (626,923 | ) | |||
2015 average rate | 0.99 | % | 2015 average notional outstanding | 10,153,846 | Change in average rate | (0.40 | )% | ||||||
Change | $ | (6,181 | ) | Change | $ | (40,640 | ) | Change | $ | 2,509 | |||
Total change | $ | (44,312 | ) | ||||||||||
Our annualized weighted-average cost of funds including hedge was 1.26% for the year ended December 31, 2016, as compared to 1.28% for the prior year. For 2016, the components of our cost of funds were (i) rates on our repo borrowings and FHLBC Advances (collectively "Total Outstanding Borrowings"), (ii) rates on our swaps and caps, and premiums paid for caps and swaptions, (iii) the size of our Total Outstanding Borrowings, and (iv) the total notional amount of our swaps, swaptions and caps.
Other Income (Loss)
For the year ended December 31, 2016, our total other income (loss) was $(180.3) million compared to $(269.0) million in 2015. The major components contributing to the change in total other income (loss) during 2016 are discussed below.
Net Realized and Unrealized Gain (Loss) on Investments and Drop Income
During the year ended December 31, 2016, our net realized and unrealized (loss) on investments decreased by $3.1 million to a net loss of $(113.0) million, compared to a net loss of $(116.1) million in 2015. This change was mainly driven by decreases in prices of Agency RMBS for the years ended December 31, 2016 and 2015. During the year ended December 31, 2016, the price of a 15-year 3.5% Agency RMBS decreased $0.66 to $104.11, and during the year ended December 31, 2015, the price decreased $0.93 to $104.77. During the year ended December 31, 2016, the price of a 30-year 3.5% Agency RMBS decreased $0.90, and during the year ended December 31, 2015 the price decreased $1.07.
The Company derives Drop Income through utilization of forward settling transactions of Agency RMBS. During the years ended December 31, 2016 and 2015, we generated Drop Income of approximately $32.9 million and $32.6 million, respectively. The marginally higher Drop Income during the year ended December 31, 2016 was due primarily to higher volumes of forward settling transactions from which we derive Drop Income. During the year ended December 31, 2016, the average gross balance in the combined TBA Securities and TBA Derivatives portfolio was $1.4 billion, a $0.2 billion increase compared to the average gross balance of $1.2 billion in the prior year.
Net unrealized gain (loss) on long-term FHLBC advances
During the year ended December 31, 2016, the Company repaid $2.1 billion in FHLBC Advances outstanding at December 31, 2015. We held $425.0 million of FHLBC Advances with an initial maturity greater than one year and a weighted-average maturity of 2.8 years at December 31, 2015. For the year ended December 31, 2016 the net unrealized loss on FHLBC Advances was $(1.3) million. The unrealized loss was due primarily to pricing FHLBC Advances with initial maturities greater than one year at par as a result of repaying all outstanding FHLBC Advances prior to September 30, 2016. For the year ended December 31, 2015, the net unrealized gain on FHLBC Advances of $1.3 million was due primarily to rising interest rates in which the value of our long-term liability decreased. 3-year swap rates increased from 1.21% on May 27, 2015 (the date on which the first FHLBC Advance was obtained) to 1.42% at December 31, 2015.
52
Net Realized and Unrealized Gain (Loss) on Derivative Instruments
Net realized and unrealized gain (loss) on derivative instruments is comprised of interest rate hedge expense, net and net realized and unrealized gain (loss) on derivative instruments. Net realized and unrealized gain (loss) on derivative instruments was $(11.5) million (comprised of $9.1 million net realized and unrealized gain on swap and cap contracts, and $(20.6) million net realized and unrealized loss on TBA Derivatives) for the year ended December 31, 2016, compared to a loss of $(54.9) million (comprised entirely of a net realized and unrealized loss on swap and cap contracts) for the year ended December 31, 2015. The change in net realized and unrealized gain (loss) on derivative instruments for the year ended December 31, 2016 was due primarily to an increase in interest rates, which caused our swap and caps to increase in value and was partially offset by a decrease in the value of TBA Derivatives. A decrease in rates during the year ended December 31, 2015 caused a decrease in the value of our derivative instruments. Our swaps and caps are designed principally to protect us in an environment of increasing interest rates. During the year ended December 31, 2016, 5-year and 7-year swap rates increased by 24 bps and 21 bps, respectively. During the year ended December 31, 2015, 5-year and 7-year swap rates decreased by 3 bps and 9 bps, respectively.
Operating Expenses
Operating expenses were $23.6 million and $20.8 million for the years ended December 31, 2016 and 2015, respectively representing an expense ratio of 1.39% for 2016, compared to 1.12% for 2015. The increase in operating expenses during 2016 was due primarily to an increase in compensation and benefits expense due to an increase in headcount, and $2.6 million of non-recurring charges, including a $1.7 million prior period tax charge. Excluding the effects of non-recurring expenses, the operating expense ratio was 1.23% for the year ended December 31, 2016.
Contractual Obligations and Commitments
The following table summarizes our contractual obligations for borrowings under repurchase agreements, interest expense on such borrowings and the office lease at December 31, 2017 and 2016 (dollars in thousands).
December 31, 2017 | Within One Year | One to Three Years | Three to Five Years | Thereafter | Total | ||||||||||||||
Repurchase agreements | $ | 10,089,917 | $ | — | $ | — | $ | — | $ | 10,089,917 | |||||||||
Interest expense on repurchase agreements, based on rates at December 31, 2017 | 50,865 | — | — | — | 50,865 | ||||||||||||||
Long-term operating lease obligation | 363 | 756 | 796 | 203 | 2,118 | ||||||||||||||
Total | $ | 10,141,145 | $ | 756 | $ | 796 | $ | 203 | $ | 10,142,900 | |||||||||
December 31, 2016 | Within One Year | One to Three Years | Three to Five Years | Thereafter | Total | ||||||||||||||
Repurchase agreements and FHLBC Advances | $ | 9,691,544 | $ | — | $ | — | $ | — | $ | 9,691,544 | |||||||||
Interest expense on repurchase agreements and FHLBC Advances, based on rates at December 31, 2016 | 29,154 | — | — | — | 29,154 | ||||||||||||||
Long-term operating lease obligation | 353 | 736 | 776 | 606 | 2,471 | ||||||||||||||
Total | $ | 9,721,051 | $ | 736 | $ | 776 | $ | 606 | $ | 9,723,169 | |||||||||
53
At December 31, 2017 and December 31, 2016, we had the following interest rate swaps and caps (in thousands):
As of December 31, 2017
Interest Rate Swaps | Weighted-Average | |||||||||||||||
Expiration Year | Fixed Pay Rate | Receive Rate | Net Pay Rate | Notional Amount | Fair Value | |||||||||||
2018 | 0.99% | 1.41 | % | (0.42 | )% | $ | 1,000,000 | $ | 1,339 | |||||||
2020 | 1.60% | 1.41 | % | 0.19 | % | 2,250,000 | 33,651 | |||||||||
2021 | 1.21% | 1.40 | % | (0.19 | )% | 1,700,000 | 53,368 | |||||||||
2022 | 2.12% | 1.54 | % | 0.58 | % | 1,500,000 | 8,225 | |||||||||
2024 | 1.88% | 1.50 | % | 0.38 | % | 625,000 | 16,567 | |||||||||
2027 | 2.21% | 1.60 | % | 0.61 | % | 400,000 | 7,004 | |||||||||
Total | 1.59% | 1.45 | % | 0.14 | % | $ | 7,475,000 | $ | 120,154 | |||||||
Interest Rate Caps | Weighted-Average | |||||||||||||||
Expiration Year | Cap Rate | Receive Rate | Net Cap Pay Rate | Notional Amount | Fair Value | |||||||||||
2019 | 1.34% | 0.85 | % | 0.49 | % | $ | 800,000 | $ | 7,681 | |||||||
2020 | 1.25% | 1.61 | % | (0.36 | )% | 1,700,000 | 31,785 | |||||||||
Total | 1.28% | 1.37 | % | (0.09 | )% | $ | 2,500,000 | $ | 39,466 | |||||||
As of December 31, 2016
Interest Rate Swaps | Weighted-Average | |||||||||||||
Expiration Year | Fixed Pay Rate | Receive Rate | Net Pay Rate | Notional Amount | Fair Value | |||||||||
2017 | 0.82% | 0.94% | (0.12)% | $ | 1,000,000 | $ | 2,316 | |||||||
2018 | 1.00% | 0.91% | 0.09% | 1,500,000 | 4,359 | |||||||||
2020 | 1.45% | 0.86% | 0.59% | 1,750,000 | 23,474 | |||||||||
2021 | 1.21% | 0.89% | 0.32% | 1,700,000 | 48,931 | |||||||||
2022 | 1.98% | 0.88% | 1.10% | 500,000 | 1,528 | |||||||||
Total | 1.23% | 0.89% | 0.34% | $ | 6,450,000 | $ | 80,608 | |||||||
Interest Rate Caps | Weighted-Average | Notional | Fair | |||||||||||
Expiration Year | Cap Rate | Receive Rate | Net Cap Pay Rate | Amount | Value | |||||||||
2019 | 1.34% | —% | 1.34% | $ | 800,000 | $ | 8,051 | |||||||
2020 | 1.25% | —% | 1.25% | 1,700,000 | 34,481 | |||||||||
Total | 1.28% | —% | 1.28% | $ | 2,500,000 | $ | 42,532 | |||||||
We enter into contracts that contain a variety of indemnification obligations, principally with our brokers and counterparties to interest rate swap, swaption and cap contracts and repo borrowings. We have not incurred any costs to defend lawsuits or settle claims related to these indemnification obligations. The maximum potential future payment amount we could be required to pay under these indemnification obligations cannot be reasonably estimated. Accordingly, we recorded no liabilities for these agreements as of December 31, 2017 and December 31, 2016. In addition, as of December 31, 2017 and December 31, 2016, we had $1.3 billion and $1.9 billion of payable for securities purchased, respectively, a portion of which either will be or was financed through repo borrowings as it relates solely to amounts outstanding at December 31, 2016.
Off-Balance Sheet Arrangements
As of December 31, 2017 and 2016, we had no relationships with any significant unconsolidated entities or financial partnerships, such as entities often referred to as structured finance, special purpose or variable interest entities, established for the purpose of facilitating off-balance sheet arrangements or other contractually narrow or limited purposes. Further, as of December 31, 2017 and 2016, we had not guaranteed obligations of unconsolidated entities, entered into commitments or had
54
any intent to provide funding to any such entities, other than as discussed in the notes to the Company's consolidated financial statements.
We may seek to obtain other sources of financing depending on market conditions. We may finance the acquisition of Agency RMBS by entering into TBA dollar roll transactions in which we would sell a TBA contract for current month settlement and simultaneously purchase a similar TBA contract for a forward settlement date. Prior to the forward settlement date, we may choose to roll the position out to a later date by entering into an offsetting TBA position, net settling the paired-off positions for cash, and simultaneously entering into a similar TBA contract for a later settlement date. In such transactions, the TBA contract purchased for a forward settlement date is priced at a discount to the TBA contract sold for settlement/pair off in the current month. The discount is the difference between the spot price and the forward settlement price for the same Agency RMBS on trade date and is referred to by the Company as Drop Income. This difference is also the economic equivalent of the assumed net interest spread (yield less financing costs) of the Agency RMBS from trade date to settlement date. Consequently, dollar roll transactions accounted for as TBA Derivatives represent a form of off-balance sheet financing. In evaluating our overall leverage at risk, we consider both our on-balance and off-balance sheet financing.
Liquidity and Capital Resources
Our primary sources of funds are repo borrowings, monthly principal and interest payments on our investment portfolio, asset sales, equity and debt offerings, and prior to the effective date of the Final Rule on January 19, 2016, which precluded us from securing new advances, FHLBC Advances. Because the level of our borrowings can be adjusted on a daily basis, the level of cash and cash equivalents carried on our balance sheet is significantly less important than the potential liquidity available under our borrowing arrangements. We currently believe that we have sufficient liquidity and capital resources available for the acquisition of additional investments, repayments on borrowings, maintenance of margin requirements and the payment of cash dividends required for our continued qualification as a REIT. To qualify as a REIT, we must distribute at least 90% of our net taxable income annually. To the extent that we distribute all of our net taxable income in a timely manner, we will generally not be subject to federal and state income taxes. We currently expect to distribute all or substantially all of our taxable income in a timely manner so that we are not subject to federal and state income taxation. This distribution requirement limits our ability to retain earnings and thereby replenish or increase capital from operations.
As of December 31, 2017 and 2016, we had approximately $1.0 billion and $0.9 billion, respectively, in Agency RMBS, U.S. Treasuries and cash available to satisfy future margin calls. We have consistently maintained sufficient liquidity to meet margin calls, and have historically satisfied all margin calls, although no assurance can be given that we will be able to satisfy margin calls in the future. During the year ended December 31, 2017, we maintained an average liquidity level of 61%, but not less than 53%, of stockholders' equity. The following table presents our unencumbered liquid assets as a percentage of stockholders' equity as of December 31:
Carrying Value as of | ||||||||
Unencumbered Liquid Assets | 2017 | 2016 | ||||||
Cash and cash equivalents | $ | 4,132 | $ | 1,260 | ||||
U.S. Treasuries | 1,529 | 32,494 | ||||||
Agency RMBS | 1,010,634 | 903,548 | ||||||
Unencumbered liquid assets | $ | 1,016,295 | $ | 937,302 | ||||
Unencumbered liquid assets as % of total stockholders' equity | 64.6 | % | 61.0 | % | ||||
As of December 31, 2017, $9.6 million of assets were pledged to the Company under the Master Agreements, of which $8.1 million were pledged by the Company to other counterparties at December 31, 2017. As of December 31, 2016, $34.2 million of assets were pledged to the Company under the Master Agreements, of which $2.7 million were pledged by the Company to other counterparties at December 31, 2016.
During the year ended December 31, 2017 and 2016, we had average repo borrowings and FHLBC Advances (solely for 2016) outstanding of $9.7 billion and $10.3 billion, respectively, with a weighted-average borrowing rate of 1.18% and 0.72%. The availability of repo borrowing financing was generally stable with interest rates between 1.07% and 1.64% for 30-90 day repo borrowings at December 31, 2017.
As a direct result of the Final Rule, prior to September 30, 2016, the Company repaid approximately $2.1 billion of FHLBC Advances with its existing repo counterparties. As with our repo borrowings, if the value of any assets pledged to FHLBC as collateral for advances decreased, the FHLBC could require posting of additional collateral. During 2016, the Company redeemed $42.0 million of FHLBC activity stock in connection with the repayment of FHLBC Advances.
We diversify our funding across multiple counterparties and by counterparty region to limit our exposure to counterparty credit risk. As of December 31, 2017 and December 31, 2016, we had access to a total of 53 and 50 counterparties,
55
respectively, and outstanding borrowings from 37 and 35 counterparties at December 31, 2017 and December 31, 2016, respectively, located throughout North America, Europe and Asia. For the years ended December 31, 2017 and 2016, repo borrowings with any individual counterparty were less than 7.4% and 7.1% of the Total Outstanding Borrowings, respectively. The table below includes a summary of our outstanding repo borrowings by number of counterparties and region as of December 31, 2017 and 2016:
December 31, 2017 | ||||
Counterparty Region | Number of Repo Borrowings Counterparties | Percent of Total Outstanding Borrowings | ||
North America | 23 | 58.8% | ||
Europe | 8 | 20.1% | ||
Asia | 6 | 21.1% | ||
37 | 100.0% | |||
December 31, 2016 | ||||
Counterparty Region | Number of Repo Borrowings Counterparties | Percent of Total Outstanding Borrowings | ||
North America | 22 | 60.4% | ||
Europe | 8 | 22.8% | ||
Asia | 5 | 16.8% | ||
35 | 100.0% | |||
Our repurchase agreements contain standard provisions and covenants as set forth in the standard master repurchase agreement published by the Securities Industry and Financial Markets Association. Our repurchase agreements generally require us to transfer additional securities to the counterparty in the event the value of the securities then held by the counterparty in the margin account falls below specified levels and contain events of default in cases where we or the counterparty breaches our respective obligations under the agreement.
The credit arrangement pursuant to which CYS Insurance maintained FHLBC Advances (the "FHLBC Arrangement") involved observance by CYS Insurance of the rules of FHLBC membership, subject to the FHLBC's credit policy, and was governed by the terms and conditions of a blanket security agreement, and the consent and guaranty of the Company. The FHLBC Arrangement required CYS Insurance to transfer additional securities to the FHLBC in the event the value of the securities then held by the FHLBC fell below specified levels, and contained events of default in cases where we or the FHLBC breached our respective obligations under the FHLBC Arrangement. An event of default or termination event under the FHLBC Arrangement would give the FHLBC the option to terminate all FHLBC Advances existing with us and make any amount due by us to the FHLBC immediately payable.
We receive margin calls from our repurchase agreement counterparties in the ordinary course of business, similar to other special finance entities. We receive two types of margin calls under our repurchase agreements. The first type, which are known as "factor calls," are margin calls that occur each month and relate to the timing difference between the reduction of principal balances of our Agency RMBS due to monthly principal payments on the underlying mortgages, and the receipt of the corresponding cash. The second type of margin call we may receive is a "valuation call", which occurs due to market and interest rate movements. Both factor and valuation margin calls occur if the total value of our assets pledged as collateral to our counterparty drops beyond a threshold level, typically between $100,000 and $500,000 (although no such minimum applied under the FHLBC Arrangement). Both types of margin calls require a dollar for dollar restoration of the margin shortfall. Conversely, we may initiate margin calls to our counterparties when the value of our assets pledged as collateral with a counterparty increases above the threshold level, thereby increasing our liquidity. All unrestricted cash plus any unpledged securities, are available to satisfy margin calls.
Our collateral is generally valued on the basis of prices provided by recognized bond market sources agreed to by the parties. Inputs to the models used by pricing sources may include, but are not necessarily limited to, reported trades, executable bid and asked prices, broker quotations, prices or yields of securities with similar characteristics, benchmark curves or information pertaining to the issuer, as well as industry and economic events. Our master repurchase agreements contain mostly standard provisions for the valuation of collateral. These agreements typically provide that both the repurchase seller (the borrower) and the repurchase buyer (the lender) value the collateral on a daily basis. Each party uses prices that it obtains from generally recognized pricing sources, or the most recent closing bid quotation from such a source. If the buyer, or the seller, as the case may be, determines that additional collateral is required, it may call for the delivery of such collateral. Under certain of our repurchase agreements, in limited circumstances, such as when a pricing source is not available, our lenders have the right to determine the value of the collateral we have provided to secure our repo borrowings. In instances where we have
56
agreed to permit our lenders to make a determination of the value of such collateral, such lenders are expected to act reasonably and in good faith in making such valuation determinations.
We also pledge collateral for our interest rate swaps, swaptions, caps, and forward purchase transactions. We will receive margin calls on these transactions when the value of the swap or forward purchase transaction declines or when the value of any collateral pledged falls below a particular threshold level. All unrestricted cash and cash equivalents, plus any unpledged Agency RMBS or U.S. Treasuries, are available to satisfy margin calls.
An event of default or termination event under the standard master repurchase agreement would give our counterparty the option to terminate all repurchase transactions existing with us and make any amount due by us to the counterparty immediately payable.
For our short-term (less than one year) and long-term (more than one year) liquidity and capital resource requirements, we rely on the cash flow from operations, primarily monthly principal and interest payments to be received on our Agency RMBS. During the years ended December 31, 2017 and 2016, we received $1.36 billion and $1.92 billion of principal repayments, respectively, and $309.7 million and $297.3 million of interest payments, respectively. We held cash of $4.1 million and $1.3 million at December 31, 2017 and December 31, 2016, respectively. For the years ended December 31, 2017 and 2016, net cash provided by operating activities was $249.7 million and $167.9 million, respectively.
Based on our current portfolio, leverage and available borrowing capacity, we believe that our cash flow from operations and the utilization of borrowings will be sufficient to enable us to meet anticipated short-term liquidity requirements such as funding our investment activities, distributions to stockholders and general corporate expenses. However, an increase in prepayment rates substantially above our expectations may cause a temporary liquidity shortfall due to the timing of margin calls and the actual receipt of cash related to principal paydowns. If our cash resources are at any time insufficient to satisfy our liquidity requirements, we may be required to sell Agency RMBS in our portfolio or issue debt or equity securities, subject to market conditions. If required, the sale of Agency RMBS at prices lower than their amortized cost would result in realized losses. We believe that we have additional capacity through repurchase agreements to leverage our equity further should the need for additional short-term liquidity arise.
Our investment portfolio is comprised principally of highly-liquid Agency RMBS and U.S. Treasuries backed by the full faith and credit of the U.S. government. We regularly monitor the creditworthiness of the U.S. government. While the U.S. government has had its credit rating downgraded in recent years by one of the credit rating agencies, we believe it remains one of the most secure creditors in the world as of December 31, 2017.
We may increase our capital resources by obtaining long-term credit facilities or making public or private offerings of equity or debt securities. Such financing will depend on market conditions for capital raises and for the investment of any proceeds. If we are unable to renew, replace or expand our sources of financing on substantially similar terms, it may have an adverse effect on our business and results of operations. On May 22, 2017, we filed an automatically effective shelf registration statement on Form S-3 with the Securities and Exchange Commission. We may offer and sell, from time to time, shares of common stock, preferred stock and debt securities in one or more offerings pursuant to the prospectus that is a part of the registration statement.
Effective May 15, 2014, the Company terminated that certain Equity Distribution Agreement by and between the Company and JMP Securities LLC ("JMP"), dated as of June 7, 2011 (the "JMP Agreement"), in connection with the expiration of the Company's prior shelf registration statement on Form S-3. Under the JMP Agreement, the Company could offer and sell, from time to time, up to 15.0 million shares of the Company's common stock through an "at the market" offering program with JMP. The Company sold 11.9 million shares of common stock under the JMP Agreement. For the years ended December 31, 2016 and 2017, the Company did not sell any shares of common stock under the JMP Agreement.
On August 4, 2017, the Company entered into an equity distribution agreement (the "Equity Distribution Agreement") with JMP Securities LLC whereby the Company may, from time to time, publicly offer and sell up to 20,000,000 shares of the Company’s common stock through at-the-market transactions and/or privately negotiated transactions. For the year ended December 31, 2017, the Company issued 2,951,491 shares under the Equity Distribution Agreement at an average sales price of $8.76 per share, raising approximately $25.5 million of net proceeds after deducting the placement fees and expenses. As of December 31, 2017, 17,048,509 shares of common stock remained available for issuance to be sold under the Equity Distribution Agreement.
Our Dividend Reinvestment and Direct Share Purchase Program ("DRSPP") is another vehicle we may use to raise capital, through which stockholders may purchase additional shares of common stock by reinvesting some or all of the cash dividends received on shares of common stock. On September 15, 2017, the Company renewed its DRSPP, whereby the stockholders may reinvest cash dividends and purchase up to 10,000,000 shares of our common stock. Stockholders may also make optional cash purchases of shares of common stock subject to certain limitations detailed in the plan prospectus. For the year ended December 31, 2017 the Company issued 294,650 shares at an average sales price of $8.77 per share, raising
57
approximately $2.6 million, after deducting placement fees and expenses. For the year ended December 31, 2016 the Company issued 797 shares at an average sales price of $7.66 per share, raising net proceeds of approximately $6 thousand, after deducting placement fees and expenses. As of December 31, 2017 and 2016, there were approximately 9.7 million and 4.1 million shares available for issuance under the DRSPP.
We also repurchase our capital stock from time to time. On November 15, 2012, the Company announced that its Board of Directors authorized the repurchase of shares of the Company's common stock having an aggregate value of up to $250 million. Pursuant to this program, through July 20, 2014 the Company repurchased approximately $115.7 million in aggregate value of its shares of common stock on the open market. On July 21, 2014, the Company announced that its Board of Directors authorized the repurchase of shares of the Company's common stock having an aggregate value of up to $250 million, which included approximately $134.3 million available for repurchase under the November 2012 authorization. Subsequently, during 2014 we repurchased 172,549 shares at a weighted-average purchase price of $8.88 per share, for an aggregate purchase price of approximately $1.5 million. For the year ended December 31, 2016, the Company repurchased 673,166 shares of the Company's common stock at a weighted-average price of $7.85 per share for an aggregate purchase price of approximately $5.3 million. In 2017, we did not repurchase any shares of the Company's common stock. Accordingly, the Company still had approximately $155.5 million authorized to repurchase shares of its common stock as of December 31, 2017 and December 31, 2016, respectively.
Quantitative and Qualitative Disclosures about Short-Term Borrowings
The following table is a summary of quantitative data about our repo borrowings and FHLBC Advances with initial terms less than one year during the years ended December 31, 2017 and 2016:
Quarter Ended | |||||||||||||||
(dollars in thousands) | December 31, 2017 | September 30, 207 | June 30, 2017 | March 31, 2017 | |||||||||||
Outstanding at period end | $ | 10,089,917 | $ | 10,383,226 | $ | 9,370,845 | $ | 9,015,594 | |||||||
Weighted-average rate at period end | 1.42 | % | 1.27 | % | 1.23 | % | 0.98 | % | |||||||
Average outstanding during period | $ | 10,346,783 | $ | 9,820,318 | $ | 9,276,572 | $ | 9,264,522 | |||||||
Weighted-average rate during period | 1.36 | % | 1.30 | % | 1.13 | % | 0.92 | % | |||||||
Largest month-end balance during period | $ | 10,765,304 | $ | 10,383,226 | $ | 9,375,852 | $ | 9,691,544 | |||||||
Quarter Ended | |||||||||||||||
(dollars in thousands) | December 31, 2016 | September 30, 2016 | June 30, 2016 | March 31, 2016 | |||||||||||
Outstanding at period end | $ | 9,691,544 | $ | 9,620,641 | $ | 10,074,501 | $ | 10,306,969 | |||||||
Weighted-average rate at period end | 0.89 | % | 0.77 | % | 0.65 | % | 0.73 | % | |||||||
Average outstanding during period (1) | $ | 9,905,199 | $ | 10,110,551 | $ | 10,025,284 | $ | 10,492,636 | |||||||
Weighted-average rate during period | 0.81 | % | 0.68 | % | 0.69 | % | 0.68 | % | |||||||
Largest month-end balance during period | $ | 10,873,264 | $ | 10,786,947 | $ | 10,363,210 | $ | 11,087,776 | |||||||
(1) | Calculated based on the average month-end balance of repurchase agreements during the period. |
The Company's borrowing ability was generally stable during the years ended December 31, 2017 and 2016. From quarter to quarter, fluctuations occur in our short-term repo borrowings that are fairly tightly correlated with the expansion and contraction of our investment portfolio. Though it varies by quarter, we generally maintain leverage between 6.4:1 and 7.4:1. The Company's borrowing rates were higher during 2017 compared to 2016, as a result of the three separate 25 bps increases in the Federal Funds Rate in 2017.
At December 31, 2017 and 2016, our amount at risk with any individual counterparty related to our repo borrowings or FHLBC Advances was less than 2.3% and 2.6% of stockholders' equity.
Inflation
Our assets and liabilities are sensitive to interest rate and other related factors to a greater degree than inflation. Changes in interest rates do not necessarily correlate with inflation rates or changes in inflation rates. Our financial statements are prepared in accordance with GAAP and our dividend distributions are determined by our Board of Directors based in large part
58
on our REIT taxable income as calculated according to the requirements of the Code. In each case, our activities and balance sheet are measured with reference to fair value without considering inflation.
Critical Accounting Policies
We make complex and subjective decisions and assessments that could affect our reported assets and liabilities, as well as our reported interest income and expenses. We believe that all of the decisions and assessments upon which our financial statements are based were reasonable based upon information available at that time. We rely on our management's experience and analysis of historical and current market data in order to arrive at what we believe to be reasonable estimates. See Note 2, Significant Accounting Policies to the financial statements included in the Financial Statements section of this Annual Report on Form 10-K for a complete discussion of our significant accounting policies. The following has been identified as our most critical accounting policy:
Valuation
Agency RBMS and U.S. Treasuries are generally valued on the basis of valuations provided by highly reputed third party pricing services, derived from such services' pricing models. Inputs to these models may include, but are not limited to, reported trades, executable bid and asked prices, broker dealer quotations, prices or yields of securities with similar characteristics, benchmark curves or information pertaining to the issuer, as well as industry and economic events. The pricing services may utilize a matrix approach, which considers information related to securities with similar characteristics to determine the valuation for a security.
Interest rate swaps, swaptions and caps are generally valued using valuations provided by dealer quotations. Such dealer quotations are based on the present value of fixed and projected floating rate cash flows over the term of the contract. Future cash flows are discounted to their present value using swap rates provided by electronic data services or brokers.
We priced FHLBC Advances daily through a pricing service that employs a discounted cash flow model to value the debt. We periodically validated prices received through this process. Changes in fair market value were recorded in current period earnings on our Consolidated Statement of Operations as a component of net unrealized gain (loss) on FHLBC Advances. Electing the fair value option to value and recognize FHLBC Advances with initial maturities greater than one year permits the Company to record changes in the fair value of our long-term indebtedness along with that of our investments in our Consolidated Statement of Operations, which, in management's view, more appropriately reflects the results of operations for a particular reporting period as all income producing assets and liabilities are treated in a similar manner.
59
Glossary of Terms
Adjustable-Rate Mortgage ("ARM")
An ARM is an adjustable-rate residential mortgage loan that typically has an interest rate that adjusts monthly to an increment over a specified interest rate index.
Advances
Short and long term secured loans provided by the 11 regional FHLBs to their members.
Agency
Refers to a federally chartered corporation, such as the Federal National Mortgage Association, or the Federal Home Loan Mortgage Corporation, or an agency of the U.S. Government, such as the Government National Mortgage Association.
Agency Residential Mortgage-Backed Securities ("RMBS")
Issued residential mortgage-backed securities which have the principal and interest guaranteed by a federally chartered corporation.
Amortization
The process of systematically reducing a recognized asset or liability (e.g., a purchase premium or discount for a debt security) with an offset to earnings.
Basis Point ("bps")
One hundredth of one percent, used in expressing differences in interest rates. One basis point is 0.01% of yield. For example, a bond’s yield that changed from 2.50% to 3.00% would be said to have moved 50 basis points.
Bond
The written evidence of debt, bearing a stated rate or stated rates of interest, or stating a formula for determining that rate, and maturing on a date certain, on which date and upon presentation a fixed sum of money plus interest (usually represented by interest coupons attached to the bond) is payable to the holder or owner. For purposes of computations tied in to “per bond,” a $1,000 increment of an issue is used (no matter what the actual denominations are). Bonds are generally long-term securities with an original maturity of greater than one year.
Broker
Generic name for a securities firm engaged in both buying and selling securities on behalf of customers or its own account.
Caps
An interest rate cap is a series of European interest call options (called caplets), with a particular interest rate, each of which expire on the date the floating loan rate will be reset. At each interest payment date the holder decides whether to exercise or let that particular option expire. In an interest rate cap, the seller agrees to compensate the buyer for the amount by which an underlying short-term rate exceeds a specified rate on a series of dates during the life of the contract. Interest rate caps are used often by borrowers in order to hedge against floating rate risk.
Collateral
Securities, cash or property pledged by a borrower or party to a derivative contract to secure payment of a loan or derivative. If the borrower fails to repay the loan or defaults under the derivative contract, the secured party may take ownership of the collateral.
Collateralized Mortgage Obligation ("CMO")
A multi-class bond backed by a pool of mortgage pass-through securities or mortgage loans.
Commodity Futures Trading Commission ("CFTC")
An independent U.S. federal agency established by the Commodity Futures Trading Commission Act of 1974. The CFTC regulates the swaps, commodity futures and options markets. Its goals include the promotion of competitive and efficient futures markets and the protection of investors against manipulation, abusive trade practices and fraud.
60
Constant Prepayment Rate ("CPR")
The percentage of outstanding mortgage loan principal that prepays in one year, based on annualizing the Single Monthly Mortality, which reflects the outstanding mortgage loan principal that prepays in one month.
Core Earnings
Represents a non-GAAP financial measure and is defined as net income (loss) available to common stockholders excluding net realized and unrealized gain (loss) on investments and derivative instruments, and net unrealized gain (loss) on FHLBC Advances.
Counterparty
One of two entities in a transaction. For example, in the bond market a counterparty can be a broker-dealer, a state or local government or a corporation.
Coupon
The interest rate on a bond that is used to compute the amount of interest due on a periodic basis.
Counterparty Risk
Risk to earnings, capital or business resulting from an obligor’s or counterparty's failure to meet the terms of any contract or otherwise failure to perform as agreed. Counterparty risk is present in lending, investing, funding and hedging activities.
Current Face
The current remaining monthly principal on a mortgage security. Current face is computed by multiplying the original face value of the security by the current principal balance factor.
Dealer
Person or organization that underwrites, trades and sells securities (e.g., a principal market-maker in securities).
Derivative
A financial product that derives its value from the price, price fluctuations and price expectations of an underlying instrument, index or reference pool (e.g. interest rate swaps, interest rate caps and certain TBA Securities).
Discount Price
When the dollar price is below face value, it is said to be selling at a discount.
Drop Income
Drop Income is the difference between the spot price and the forward settlement price for the same security on trade date. This difference is also the economic equivalent of the assumed net interest margin (yield minus financing costs) of the bond from trade date to settlement date.
Duration
The weighted maturity of a fixed-income investment’s cash flows, used in the estimation of the price sensitivity of fixed-income securities for a given change in interest rates.
Economic Interest Expense
Non-GAAP financial measure that is composed of interest expense, as computed in accordance with GAAP, plus interest rate hedge expense, net used to hedge our cost of funds, a component of net gain (loss) on derivative instruments in the Company's Consolidated Statements of Operations.
Economic Net Interest Income
Non-GAAP financial measure that is generated primarily from the net spread, or difference, between the interest income we earn on our investment portfolio and the cost of our borrowings and hedging activities.
Single Monthly Mortality
Percentage of the principal amount of mortgages that are prepaid in a given month.
Face Amount
The par value (i.e., principal or maturity value) of a security appearing on the face of the instrument.
61
Factor Calls
Margin calls under repurchase agreements that occur each month and relate to the timing difference between the reduction of principal balances of our Agency RMBS due to monthly principal prepayments on underlying mortgages, and receipt of the corresponding cash.
Fannie Mae ("FNMA")
Federal National Mortgage Association.
Federal Reserve Bank ("Fed")
The central bank of the United States. The Fed was founded by the U.S. Congress in 1913 to provide the nation with a safe, flexible and stable monetary and financial system.
Federal Funds Rate
In the United States, the Federal Funds Rate is the interest rate at which depository institutions (banks and credit unions) lend reserve balances to other depository institutions overnight, on an uncollateralized basis.
Federal Deposit Insurance Corporation ("FDIC")
An independent agency created by the U.S. Congress to maintain stability and public confidence in the nation's financial system by insuring deposits, examining and supervising financial institutions for safety and soundness and consumer protection, and managing receiverships.
Federal Housing Administration ("FHA")
The Federal Housing Administration, generally known as "FHA", provides mortgage insurance on loans made by FHA-approved lenders throughout the United States and its territories. FHA insures mortgages on single family and multifamily homes including manufactured homes and hospitals.
Federal Home Loan Banks ("FHLB")
U.S. Government-sponsored banks that provide liquidity to member financial institutions to support housing finance and community investment.
Federal Housing Financing Agency ("FHFA")
The FHFA is an independent regulatory agency that oversees vital components of the secondary mortgage market including Fannie Mae, Freddie Mac and the Federal Home Loan Banks.
FHLBC
Federal Home Loan Bank of Cincinnati.
Fixed-Rate Mortgage
A mortgage featuring equal monthly payments, determined at the outset, which remain constant over the life of the mortgage.
Floating Rate
Any interest rate that changes on a periodic basis. The change is usually tied to a specified interest or index, such as the LIBOR interest rate.
Freddie Mac
Federal Home Loan Mortgage Corporation.
GAAP
Accounting principles generally accepted in the United States of America.
Ginnie Mae
Government National Mortgage Association.
Haircut
The amount, expressed as a percentage, by which the collateral value exceeds the amount borrowed. This percentage amount reflects the underlying risk of the specific collateral and protects the counterparty against a change in collateral value.
Hedge
An investment made with the intention of minimizing the impact of adverse movements in interest rates or securities prices.
62
Hedge Ratio
The ratio of swap, swaption and cap notional to repo borrowings and FHLBC Advances.
Hybrid Adjustable-Rate Residential Mortgage ("ARM")
Hybrid adjustable-rate residential mortgage loans that have interest rates that are fixed for a specified period of time and, thereafter, generally adjust annually to an increment over a specified interest or index.
Interest Rate Risk
The risk that an investment's value will change due to a change in the absolute level of interest rates, in the spread between two rates, in the shape of the yield curve or in any other interest rate relationship. As market interest rates rise, the value of current fixed income investment holdings generally declines. Diversifying, deleveraging and hedging techniques are utilized to mitigate this risk. Interest rate risk is a form of market risk.
Interest Rate Swap
A binding agreement between counterparties to exchange periodic interest payments for a specified period of time on some predetermined dollar principal, which is called the notional principal amount. For example, one party will pay fixed and receive a variable rate.
Interest Rate Swaption
A swaption is an agreement that provides us, the buyer, with an option to enter into an interest rate swap agreement at a specified notional, term and pay rate on a specified future date. The swaption agreement will specify whether the buyer of the swaption will be a fixed-rate receiver or a fixed-rate payer.
Investment Company Act
The Investment Company Act of 1940, as amended.
International Swaps and Derivatives Association ("ISDA") Master Agreement
Standardized contract developed by ISDA, under which bilateral derivatives contracts are entered into.
Leverage
The use of borrowed money in our attempt to increase economic returns.
Leverage Ratio
Calculated by dividing (i) the Company's repurchase agreements and FHLBC Advances balance plus payable for
securities purchased, minus receivable for securities sold, plus or minus the net TBA Derivative positions by (ii) stockholders' equity.
London Interbank Offered Rate ("LIBOR")
The rate banks charge each other for short-term Eurodollar loans. LIBOR is frequently used as the base for resetting rates on floating-rate securities and the floating-rate legs of interest rate swaps.
Liquidity Risk
Risk to earnings, capital or business arising from our inability to meet our obligations when they come due without incurring unacceptable losses as a result of an inability to liquidate assets or obtain adequate funding.
Market Risk
Risk to earnings, capital or business resulting in the decline in value of our assets caused by changes in market variables, such as interest rates, which affect the values of our assets and liabilities.
Master Agreement
An agreement between two parties specifying the terms that will govern multiple transactions.
Monetary Policy
Action taken by a Central Bank, like the U.S. Federal Reserve System, to influence the money supply or interest rates.
Mortgage-Backed Security ("MBS")
A security representing a direct interest in a pool of mortgage loans. The pass-through issuer or servicer collects the payments on the loans in the pool and "passes through" the principal and interest to the security holders on a pro rata basis.
63
Net Interest Income
Represents interest income earned on our portfolio investments, less interest expense paid for borrowings.
Notional Amount
A stated principal amount in a derivative contract on which the contract is based.
Original Face
The face value or original principal amount of a security on its issue date.
Over-The-Counter ("OTC") Market
A securities market that is conducted by dealers throughout the country through negotiation of price rather than through the use of an auction system as represented by a stock exchange.
Par
Price equal to the face amount of a bond.
Par Value
The principal amount of a bond or note due at maturity. Also known as par amount.
Pass Through Security
The securitization structure where a GSE or other entity “passes” the amount collected from the borrowers every month to the investor, after deducting fees and expenses.
Pool
A collection of mortgage loans assembled by an originator or master servicer as the basis for a security.
Premium
The amount by which the price of a security exceeds its principal amount. When the dollar price of a bond is above its face value, it is said to be priced at a premium.
Prepayment
The unscheduled partial or complete payment of the principal amount outstanding on a mortgage loan or other debt before it is due.
Prepayment Risk
The risk that falling interest rates will lead to an increase in prepayments of mortgage or other loans, forcing the investor to reinvest at lower prevailing rates.
Principal and Interest
The term used to refer to regularly scheduled payments or prepayments of principal and interest on a mortgage or other security.
Repurchase Agreements or "repo borrowings"
The sale of securities to investors with the agreement to buy them back at a higher price to reflect accrued interest after a specified time period; a form of short-term borrowing. For the party on the other end of the transaction (buying the security and agreeing to sell in the future) it is a reverse repurchase agreement.
Residential Mortgage Backed Securities ("RMBS")
RMBS refers to whole-pool (defined below) residential mortgage pass-through securities collateralized by residential mortgage loans; agency securities or Agency RMBS refers to our RMBS that are issued or guaranteed by a federally chartered corporation, such as "Fannie Mae" or "Freddie Mac", or an agency of the U.S. government, such as "Ginnie Mae".
Securities and Exchange Commission ("SEC")
The Securities and Exchange Commission (SEC) is a government commission created by U.S. Congress with goals of protecting investors, maintaining fair and orderly functioning of securities markets, and facilitating capital formation. The SEC promotes full public disclosure, protects investors against fraudulent and manipulative practices in the market, and monitors corporate takeover actions in the United States.
64
Secondary Market
Ongoing market for bonds previously offered or sold in the primary market.
Settlement Date
The date securities must be delivered and paid for to complete a transaction.
Single Monthly Mortality
Percentage of the principal amount of mortgages that are prepaid in a given month.
TBA Derivatives
TBA contracts with no contractual obligation to accept or make delivery on the settlement date.
To-Be-Announced ("TBA Securities")
A contract for the purchase or sale of a mortgage-backed security to be delivered at a predetermined price, face amount, issuer, coupon and stated maturity on an agreed-upon future date but does not include a specified pool number and number of pools.
Unencumbered Assets
Assets on our balance sheet which have not been pledged as collateral for an existing liability or derivative contract.
U.S. Government-Sponsored Enterprise ("GSE") Obligations
Obligations of Agencies originally established or chartered by the U.S. government to serve public purposes as specified by the U.S. Congress, such as Fannie Mae and Freddie Mac; these obligations are not explicitly guaranteed as to the timely payment of principal and interest by the full faith and credit of the U.S. government.
U.S. Treasury
Debt securities issued by the U.S. Department of the Treasury and backed by the full faith and credit of the U.S. government.
Valuation Calls
Margin calls under repurchase agreements that occur due to market and interest rate movements.
Volatility
A statistical measure of the variance of price or yield over time. Volatility is low if the price does not change very much over a short period of time, and high if there is a greater degree of change.
Weighted-Average Coupon ("WAC")
The weighted-average interest rate of the underlying mortgage loans or pools that serve as collateral for a security, weighted by the size of the principal loan balances.
Weighted-Average Life ("WAL")
The assumed weighted-average amount of time that will elapse from the date of a security’s issuance until each dollar of principal is repaid to the investor. The WAL will change as the security ages and is directly affected by the actual rate at which principal, scheduled and unscheduled, is paid on the loans underlying the MBS.
Whole-pool
Whole pools refer to mortgage certificates where ownership is represented by an undivided interest in entire pools of mortgages.
Yield-to-Maturity
The expected rate of return of a bond if it is held to its maturity date. It is calculated by taking into account the current market price, stated redemption value, coupon payments and time to maturity and assumes all coupons are reinvested at the same rate and is equivalent to the internal rate of return.
65
Item 7A. Quantitative and Qualitative Disclosures about Market Risk
As of December 31, 2017 and 2016, the primary component of our market risk was interest rate risk, as described below. We do not seek to completely avoid risk because we believe that certain risks can be estimated based on historic experience. Accordingly, we manage these risks in an effort to earn the commensurate compensation required to take them and to maintain capital levels consistent with the risks we undertake.
Interest Rate Risk
We are subject to interest rate risk in connection with our investments in Agency RMBS collateralized by fixed rate mortgage loans, ARMs, Hybrid ARMs and our related debt obligations, which are generally repurchase agreements of limited duration that are periodically refinanced at current market rates. We seek to manage this risk through utilization of derivative contracts, primarily interest rate swaps, swaptions and cap contracts.
The interest rate related to Agency RMBS collateralized by fixed rate mortgage loans is fixed. Agency RMBS comprised of ARMs and Hybrid ARMs that collateralize our Agency RMBS are typically subject to periodic and lifetime interest rate caps and floors, which limit the amount by which the security's interest yield may change during any given period. However, our borrowing costs are not subject to similar limitations. Therefore, in a period of increasing interest rates, the interest costs on our borrowings could increase without limitation while the interest rate or yield on our Agency RMBS would be fixed or effectively limited by caps. Relative to fixed-rate Agency RMBS, this problem is minimized to the extent that we acquire Agency RMBS that are collateralized by Hybrid ARMs that are not fully indexed. In addition, adjustable-rate mortgages may be subject to periodic payment caps that result in some portion of the interest being deferred and added to the principal outstanding. This could result in our receipt of less cash on our Agency RMBS than we need in order to pay the interest cost on our related borrowings. These factors could result in a decrease in our net income or cause a net loss during periods of rising interest rates, which could have an adverse effect on our financial condition, cash flows and results of operations.
Effect on Interest Income, Interest Expense and Interest Rate Hedge Expense, Net
We fund our investments with repo borrowings and, prior to the January 19, 2016 effective date of the Final Rule, which precluded us from securing new FHLBC Advances, FHLBC Advances. During periods of rising interest rates, our borrowing costs tend to increase while the income earned on such investments may remain substantially unchanged. This results in a narrowing of the net interest spread between the related assets and borrowings and may even result in losses.
Hedging decisions are partly based on assumed levels of prepayments of our Agency RMBS. If prepayments are slower or faster than assumed, the life or duration of the Agency RMBS will be longer or shorter, and may no longer match the duration of the hedge portfolio, which would reduce the effectiveness of any hedging strategies we may use and may cause losses on such transactions.
Extension Risk
We have generally structured our swaps to expire in conjunction with the estimated weighted-average life of the fixed period of the mortgages underlying our Agency RMBS portfolio. However, in a rising interest rate environment, the weighted-average life of the fixed rate mortgages underlying our Agency RMBS could extend beyond the term of the swap agreement or other hedging instrument. This could have a negative impact on our results from operations, as borrowing costs would no longer be fixed after the term of the hedging instrument while the income earned on the remaining Agency RMBS would remain fixed for a period of time. This situation may also cause the market value of our Agency RMBS to decline with little or no offsetting gain from the related hedging transactions. In extreme situations, we may be forced to sell assets to maintain adequate liquidity, which could cause us to realize losses.
Interest Rate Mismatch Risk
We intend to fund a substantial portion of our acquisitions of Agency RMBS with borrowings that, after the effect of hedging, have interest rates based on indices and repricing terms similar to, but of somewhat shorter maturities than, the interest rate indices and repricing terms of the Agency RMBS. Thus, we anticipate that in most cases the interest rate indices and repricing terms of our Agency RMBS and our funding sources will not be identical, thereby creating an interest rate mismatch between assets and liabilities. Therefore, our cost of funds would likely rise or fall more quickly than the rate of earnings on our assets. During periods of changing interest rates, such interest rate mismatches could adversely affect our financial condition, cash flows and results of operations. To manage interest rate mismatches, we may utilize the hedging strategies discussed above.
Our analysis of risks is based on management's experience, estimates, models and assumptions. These analyses rely on models which utilize estimates of fair value and interest rate sensitivity. Actual economic conditions or implementation of
66
investment decisions by our management may produce results that differ significantly from the estimates and assumptions used in our models and the projected results reflected herein.
Prepayment Risk
Prepayments are the full or partial repayment of principal prior to the original contractual maturity of a mortgage loan. Full repayments typically occur due to refinancing of mortgage loans. Prepayment rates for existing Agency RMBS generally increase when prevailing mortgage interest rates fall. Additionally, the majority of our Agency RMBS were purchased at a premium. The prepayment of such Agency RMBS at a rate faster than anticipated would result in amortization of any remaining unamortized premium faster than expected, which could adversely affect our financial condition and results of operations. The Company seeks to minimize prepayment risk to the extent practical. Through selection of our investments, we balance prepayment risk against other risks and the potential returns of each investment. However, no strategy can completely insulate the Company from prepayment risk.
Effect on Fair Value and Net Income
Another component of interest rate risk is the effect that changes in interest rates will have on the fair value of our assets and net income, exclusive of the effect on fair value. We face the risk that the fair value of our assets and net income, exclusive of the effect on fair value, will increase or decrease at different rates than that of our liabilities, including our hedging instruments.
The following sensitivity analysis table estimates the impact of our interest rate-sensitive investments and repo borrowing liabilities on our net income, fair value of our assets, and change in stockholders' equity, exclusive of the effect of changes in fair value on our net income, at December 31, 2017 and December 31, 2016, assuming a static portfolio and an instantaneous increase and decrease in rates of 25, 50 and 75 bps, except as further described in the footnotes to the following table:
December 31, 2017
Interest Rate Change (bps) | Projected Change in Net Income (1) | Projected Change in the Fair Value of Our Investments (1) | Projected Change in Stockholders' Equity | ||||
- 75 basis points | 55.95 | % | (2) | 0.12% | 1.02% | ||
- 50 basis points | 43.10 | % | (2) | 0.21% | 1.74% | ||
- 25 basis points | 30.25 | % | (2) | 0.18% | 1.54% | ||
+ 25 basis points | (12.16 | )% | (0.34)% | (2.89)% | |||
+ 50 basis points | (24.31 | )% | (0.82)% | (6.93)% | |||
+ 75 basis points | (38.32 | )% | (1.41)% | (11.91)% | |||
December 31, 2016
Interest Rate Change (bps) | Projected Change in Net Income (1) | Projected Change in the Fair Value of Our Investments (1) | Projected Change in Stockholders' Equity | ||||
- 75 basis points | 19.81 | % | (2),(3) | 0.71% | 5.78% | ||
- 50 basis points | 16.23 | % | (2),(3) | 0.63% | 5.13% | ||
- 25 basis points | 12.20 | % | (2),(3) | 0.38% | 3.10% | ||
+ 25 basis points | (10.08 | )% | (0.47)% | (3.83)% | |||
+ 50 basis points | (20.16 | )% | (1.01)% | (8.22)% | |||
+ 75 basis points | (30.24 | )% | (1.63)% | (13.21)% | |||
_____________
(1) | Projected changes in the table are calculated utilizing Yield Book® software and may reflect adjustments based on our judgment. |
(2) | Immediate impact estimated over 12 month period. |
(3) | Given the historically low level of interest rates at December 31, 2016, we reduced 3-month LIBOR and our repo borrowing rates by 10, 20 and 30 bps for the 25, 50, and 75 bps down net income scenarios, respectively. All other interest rate-sensitive instruments were calculated in accordance with the table. |
While these tables above reflect the estimated immediate impact of interest rate increases and decreases on a static portfolio, we rebalance our portfolio from time to time to either take advantage of or minimize the impact of changes in interest rates. Generally, our interest rate swaps reset in the quarter following changes in interest rates. Interest rate changes beyond 75 bps from current levels could have a significant impact on the fair value of our assets and net income. Therefore, the volatility in the fair value of our assets and net income could increase significantly should interest rates change beyond 75 bps. In addition, other factors impact the fair value of and net income from our interest rate-sensitive investments and hedging
67
instruments, such as the shape of the yield curve, market expectations as to future interest rate changes and other market conditions. Accordingly, in the event of changes in actual interest rates, the change in the fair value of our assets and our net income would likely differ from that shown above, and such difference might have a material and adverse effect on our financial condition and results of operations.
Risk Management
Our Board of Directors exercises its oversight of risk management in many ways, including overseeing our senior management's risk-related responsibilities, including reviewing management policies and performance against these policies and related benchmarks.
As part of our risk management process, we actively manage the interest rate, liquidity, prepayment and counterparty risks associated with our Agency RMBS portfolio. This process includes monitoring various stress test scenarios on our portfolio. We seek to manage our interest rate risk exposure by entering into various hedging instruments in order to minimize our exposure to potential interest rate mismatches between the interest we earn on our investments and our borrowing costs. We seek to manage our liquidity risks by monitoring our liquidity position on a daily basis and maintaining a prudent level of leverage based on current market conditions and various other factors, including the health of the financial institutions that lend to us under repurchase agreements. We seek to manage our counterparty risk by (i) diversifying our exposure across a broad number of counterparties, (ii) limiting our exposure to any one counterparty, and (iii) monitoring the financial stability of our counterparties.
Item 8. Financial Statements and Supplementary Data
Our financial statements and the related notes, together with the Report of Independent Registered Public Accounting Firm thereon, are set forth beginning on page F-1 of this Form 10-K.
Item 9. Changes in and Disagreements with Accountants on Accounting and Financial Disclosure
None.
Item 9A. Controls and Procedures
Evaluation of Disclosure Controls and Procedures
Our management, with the participation of our Chief Executive Officer and our Chief Financial Officer, evaluated the effectiveness of our disclosure controls and procedures as of December 31, 2017. The term "disclosure controls and procedures," as defined in Rules 13a-15(e) and 15d-15(e) under the Exchange Act, means controls and other procedures of a company that are designed to ensure that information required to be disclosed by a company in the reports that it files or submits under the Exchange Act is recorded, processed, summarized and reported, within the time periods specified in the SEC's rules and forms. Disclosure controls and procedures include, without limitation, controls and procedures designed to ensure that information required to be disclosed by a company in the reports that it files or submits under the Exchange Act is accumulated and communicated to the company's management, including its principal executive and principal financial officers, as appropriate to allow timely decisions regarding required disclosure. Management recognizes that any controls and procedures, no matter how well designed and operated, can provide only reasonable assurance of achieving their objectives, and management necessarily applies its judgment in evaluating the cost-benefit relationship of possible controls and procedures. Based on the evaluation of our disclosure controls and procedures as of December 31, 2017, our Chief Executive Officer and Chief Financial Officer can provide reasonable assurance that, as of such date, our disclosure controls and procedures were effective.
There have been no changes in our internal controls over financial reporting that occurred during the last fiscal quarter that have materially affected, or are reasonably likely to materially affect, our internal controls over financial reporting.
Management's Report on Internal Control over Financial Reporting
Management of the Company is responsible for establishing and maintaining adequate internal control over financial reporting. Internal control over financial reporting is defined in Rules 13a-15(f) under the Securities Exchange Act of 1934, as amended, as a process designed by, or under the supervision of, the Company's principal executive and principal financial officers and effected by the Company's Board of Directors, management and other personnel to provide reasonable assurance regarding the reliability of financial reporting and the preparation of financial statements for external purposes in accordance with generally accepted accounting principles and includes those policies and procedures that:
• | pertain to the maintenance of records that in reasonable detail accurately and fairly reflect the transactions and dispositions of the assets of the Company; |
68
• | provide reasonable assurance that transactions are recorded as necessary to permit preparation of financial statements in accordance with generally accepted accounting principles, and that receipts and expenditures of the Company are being made only in accordance with authorizations of management and directors of the Company; and |
• | provide reasonable assurance regarding prevention or timely detection of unauthorized acquisition, use or disposition of the Company's assets that could have a material effect on the financial statements. |
Because of its inherent limitations, internal control over financial reporting may not prevent or detect misstatements. As a result, even systems determined to be effective can provide only reasonable assurance regarding the preparation and presentation of financial statements. Moreover, projections of any evaluation of effectiveness to future periods are subject to the risks that controls may become inadequate because of changes in conditions or that the degree of compliance with the policies or procedures may deteriorate.
The Company's management assessed the effectiveness of the Company's internal control over financial reporting as of December 31, 2017. In making this assessment, the Company's management used criteria set forth by the 2013 Committee of Sponsoring Organizations of the Treadway Commission (COSO) in Internal Control-Integrated Framework.
Based on management's assessment, the Company's management believes that, as of December 31, 2017, the Company's internal control over financial reporting was effective based on those criteria. The Company's independent registered public accounting firm, Deloitte & Touche LLP, has issued an attestation report on the Company's internal control over financial reporting included below.
69
REPORT OF INDEPENDENT REGISTERED PUBLIC ACCOUNTING FIRM
To the Board of Directors and Stockholders of
CYS Investments, Inc.
Waltham, MA
Opinion on the Internal Control over Financial Reporting
We have audited the internal control over financial reporting of CYS Investments, Inc. and subsidiaries (the “Company”) as of December 31, 2017, based on criteria established in Internal Control-Integrated Framework (2013) issued by the Committee of Sponsoring Organizations of the Treadway Commission (COSO). In our opinion, the Company maintained, in all material respects, effective internal control over financial reporting as of December 31, 2017, based on the criteria established in Internal Control - Integrated Framework (2013) issued by COSO.
We have also audited, in accordance with the standards of the Public Company Accounting Oversight Board (United States) (PCAOB), the consolidated financial statements as of and for the year ended December 31, 2017 of the Company and our report dated February 15, 2018, expressed an unqualified opinion on the those financial statements.
Basis for Opinion
The Company's management is responsible for maintaining effective internal control over financial reporting and for its assessment of the effectiveness of internal control over financial reporting, included in the accompanying Management’s Report on Internal Control over Financial Reporting. Our responsibility is to express an opinion on the Company's internal control over financial reporting based on our audit. We are a public accounting firm registered with the PCAOB and are required to be independent with respect to the Company in accordance with the U.S. federal securities laws and the applicable rules and regulations of the Securities and Exchange Commission and the PCAOB.
We conducted our audit in accordance with the standards of the PCAOB. Those standards require that we plan and perform the audit to obtain reasonable assurance about whether effective internal control over financial reporting was maintained in all material respects. Our audit included obtaining an understanding of internal control over financial reporting, assessing the risk that a material weakness exists, testing and evaluating the design and operating effectiveness of internal control based on the assessed risk, and performing such other procedures as we considered necessary in the circumstances. We believe that our audit provides a reasonable basis for our opinion.
Definition and Limitations of Internal Control over Financial Reporting
A company's internal control over financial reporting is a process designed to provide reasonable assurance regarding the reliability of financial reporting and the preparation of financial statements for external purposes in accordance with generally accepted accounting principles. A company's internal control over financial reporting includes those policies and procedures that (1) pertain to the maintenance of records that, in reasonable detail, accurately and fairly reflect the transactions and dispositions of the assets of the company; (2) provide reasonable assurance that transactions are recorded as necessary to permit preparation of financial statements in accordance with generally accepted accounting principles, and that receipts and expenditures of the company are being made only in accordance with authorizations of management and directors of the company; and (3) provide reasonable assurance regarding prevention or timely detection of unauthorized acquisition, use, or disposition of the company's assets that could have a material effect on the financial statements.
Because of the inherent limitations, internal control over financial reporting may not prevent or detect misstatements. Also, projections of any evaluation of effectiveness to future periods are subject to the risk that controls may become inadequate because of changes in conditions, or that the degree of compliance with the policies or procedures may deteriorate.
/s/ DELOITTE & TOUCHE LLP
Boston, Massachusetts
February 15, 2018
70
Item 9B. Other Information
ADDITIONAL MATERIAL U.S. FEDERAL INCOME TAX CONSIDERATIONS
The following is a summary of additional material U.S. federal income tax considerations with respect to the ownership of our stock. This summary supplements and should be read together with the discussions under “Material U.S. Federal Income Tax Considerations” and “Additional Material U.S. Federal Income Tax Considerations” in the prospectus dated May 22, 2017 and filed as part of our Registration Statement on Form S-3 (No. 333-218161), the prospectus supplement dated August 4, 2017 and the prospectus supplement dated September 15, 2017.
The Tax Cuts and Jobs Act
Enactment of the TCJA
On December 22, 2017, President Trump signed into law H.R. 1, informally titled the Tax Cuts and Jobs Act (the “TCJA” or the “Act”). The TCJA makes major changes to the Internal Revenue Code of 1986, as amended (the “Code”), including several provisions of the Code that may affect the taxation of REITs and their security holders. The most significant of these provisions are described below. The individual and collective impact of these changes on REITs and their security holders is uncertain, and may not become evident for some period. Prospective investors should consult their tax advisors regarding the implications of the TCJA on their investment.
Revised Individual Tax Rates and Deductions
The TCJA creates seven income tax brackets for individuals ranging from 10% to 37% that generally apply at higher thresholds than current law. For example, the highest 37% rate applies to joint return filer incomes above $600,000, instead of the highest 39.6% rate that applies to incomes above $470,700 under pre-TCJA law. The maximum 20% rate that applies to long-term capital gains and qualified dividend income is unchanged, as is the 3.8% Medicare tax on net investment income (see “Material U.S. Federal Income Tax Considerations - Taxation of Taxable U.S. Stockholders” in the applicable prospectus).
The TCJA also eliminates personal exemptions, but nearly doubles the standard deduction for most individuals (for example, the standard deduction for joint return filers rises from $12,700 in 2017 to $24,000 upon the TCJA’s effectiveness). The TCJA also eliminates many itemized deductions, limits individual deductions for state and local income, property and sales taxes (other than those paid in a trade or business) to $10,000 collectively for joint return filers (with a special provision to prevent 2017 deductions for prepayment of 2018 taxes), and limits the amount of new acquisition indebtedness on principal or second residences for which mortgage interest deductions are available to $750,000. Interest deductions for new home equity debt are eliminated. Charitable deductions are generally preserved. The phaseout of itemized deductions based on income is eliminated.
The TCJA does not eliminate the individual alternative minimum tax, but it raises the exemption and exemption phaseout threshold for application of the tax.
These individual income tax changes are generally effective beginning in 2018, but without further legislation, they will sunset after 2025.
Pass-Through Business Income Tax Rate Lowered through Deduction
Under the TCJA, individuals, trusts, and estates generally may deduct 20% of “qualified business income” (generally, domestic trade or business income other than certain investment items) of a partnership, S corporation, or sole proprietorship. In addition, “qualified REIT dividends” (i.e., REIT dividends other than capital gain dividends and portions of REIT dividends designated as qualified dividend income, which in each case are already eligible for capital gain tax rates) and certain other income items are eligible for the deduction by the taxpayer. The overall deduction is limited to 20% of the sum of the taxpayer’s taxable income (less net capital gain) and certain cooperative dividends, subject to further limitations based on taxable income. In addition, for taxpayers with income above a certain threshold (e.g., $315,000 for joint return filers), the deduction for each trade or business is generally limited to no more than the greater of (i) 50% of the taxpayer’s proportionate share of total wages from a partnership, S corporation or sole proprietorship, or (ii) 25% of the taxpayer’s proportionate share of such total wages plus 2.5% of the unadjusted basis of acquired tangible depreciable property that is used to produce qualified business income and satisfies certain other requirements. The deduction for qualified REIT dividends is not subject to these wage and property basis limits. Consequently, the deduction equates to a maximum 29.6% tax rate on REIT dividends. As with the other individual income tax changes, the deduction provisions are effective beginning in 2018. Without further legislation, the deduction would sunset after 2025.
71
Net Operating Loss Modifications
Net operating loss (“NOL”) provisions are modified by the TCJA. The TCJA limits the NOL deduction to 80% of taxable income (before the deduction). It also generally eliminates NOL carrybacks for individuals and non-REIT corporations (NOL carrybacks did not apply to REITs under prior law), but allows indefinite NOL carryforwards. The new NOL rules apply to losses arising in taxable years beginning in 2018.
Maximum Corporate Tax Rate Lowered to 21%; Elimination of Corporate Alternative Minimum Tax
The TCJA reduces the 35% maximum corporate income tax rate to a maximum 21% corporate rate, and reduces the dividends-received deduction for certain corporate subsidiaries. The reduction of the corporate tax rate to 21% also results in the reduction of the maximum rate of withholding with respect to our distributions to non-U.S. stockholders that are treated as attributable to gains from the sale or exchange of U.S. real property interests from 35% to 21%. The TCJA also permanently eliminates the corporate alternative minimum tax. These provisions are effective beginning in 2018.
Limitations on Interest Deductibility; Real Property Trades or Businesses Can Elect Out Subject to Longer Asset Cost Recovery Periods
The TCJA limits a taxpayer’s net interest expense deduction to 30% of the sum of adjusted taxable income, business interest, and certain other amounts. Adjusted taxable income does not include items of income or expense not allocable to a trade or business, business interest or expense, the new deduction for qualified business income, NOLs, and for years prior to 2022, deductions for depreciation, amortization, or depletion. For partnerships, the interest deduction limit is applied at the partnership level, subject to certain adjustments to the partners for unused deduction limitations at the partnership level. The TCJA allows a real property trade or business to elect out of this interest limit so long as it uses a 40-year recovery period for nonresidential real property, a 30-year recovery period for residential rental property, and a 20-year recovery period for related improvements. For this purpose, a real property trade or business is any real property development, redevelopment, construction, reconstruction, acquisition, conversion, rental, operating, management, leasing, or brokerage trade or business. As a mortgage REIT, we do not believe that our business constitutes a “real property trade or business” within the meaning of the TCJA. However, as a mortgage REIT, we do not believe we will be negatively impacted by the 30% limitation on the deductibility of interest imposed by the TCJA because interest expense may be fully deducted to the extent of interest income under the TCJA. Disallowed interest expense is carried forward indefinitely (subject to special rules for partnerships). The interest deduction limit applies beginning in 2018.
Phantom Income
Under the TCJA, we generally will be required to take certain amounts in income no later than the time such amounts are reflected on certain financial statements. The application of this rule may require the accrual of income with respect to our debt instruments or mortgage-backed securities, such as original issue discount or market discount, earlier than would be the case under the general tax rules, although the precise application of this rule is unclear at this time. This rule generally will be effective for tax years beginning after December 31, 2017 or, for debt instruments or mortgage-backed securities issued with original issue discount, for tax years beginning after December 31, 2018. To the extent that this rule requires the accrual of income earlier than under the general tax rules, it could increase our “phantom income,” which may make it more likely that we could be required to borrow funds or take other action to satisfy the REIT distribution requirements for the taxable year in which this “phantom income” is recognized. We currently do not expect that this rule will have a material impact on the timing of accrual of our income or on the amount of our distribution requirement.
International Provisions: Modified Territorial Tax Regime
The TCJA moves the United States from a worldwide to a modified territorial tax system, with provisions included to prevent corporate base erosion. We currently do not have any foreign subsidiaries or properties, but these provisions could affect any such future subsidiaries or properties.
Other Provisions
The TCJA makes other significant changes to the Code. These changes include provisions limiting the ability to offset dividend and interest income with partnership or S corporation net active business losses. These provisions are effective beginning in 2018, but without further legislation, will sunset after 2025.
72
PART III
Item 10. Directors, Executive Officers and Corporate Governance
The information required by Item 10 is incorporated by reference to our definitive Proxy Statement for our 2018 annual stockholders' meeting.
Item 11. Executive Compensation
The information required by Item 11 is incorporated by reference to our definitive Proxy Statement for our 2018 annual stockholders' meeting.
Item 12. Security Ownership of Certain Beneficial Owners and Management and Related Stockholder Matters
The information required by Item 12 is incorporated by reference to our definitive Proxy Statement for our 2018 annual stockholders' meeting.
Item 13. Certain Relationships and Related Transactions, and Director Independence
The information required by Item 13 is incorporated by reference to our definitive Proxy Statement for our 2018 annual stockholders' meeting.
Item 14. Principal Accountant Fees and Services
The information required by Item 14 is incorporated by reference to our definitive Proxy Statement for our 2018 annual stockholders' meeting.
PART IV
Item 15. Exhibits and Financial Statement Schedules
(a) Documents filed as part of this report:
1. Financial Statements.
See Index to financial statements, included in Part II, Item 8 of this Annual Report on Form 10-K.
2. Schedules to Financial Statements:
All financial statement schedules not included have been omitted because they are either inapplicable or the information required is provided in our Financial Statements and Notes thereto, included in Part II, Item 8, of this Annual Report on Form 10-K.
3. Exhibits
Exhibit Number | Description of Exhibit | |
73
101.INS XBRL | Instance Document (12) | |
101.SCH XBRL | Taxonomy Extension Schema Document (12) | |
101.CAL XBRL | Taxonomy Extension Calculation Linkbase Document (12) | |
101.DEF XBRL | Additional Taxonomy Extension Definition Linkbase Document Created (12) | |
101.LAB XBRL | Taxonomy Extension Label Linkbase Document (12) | |
101.PRE XBRL | Taxonomy Extension Presentation Linkbase Document (12) | |
(1) | Incorporated by reference from the Registrant's Registration Statement on Form S-11 filed with the Securities and Exchange Commission on April 19, 2007 (File No. 333-142236). |
(2) | Incorporated by reference from the Registrant's Form 10-K filed with the Securities and Exchange Commission on February 10, 2010 (File No. 001-33740). |
74
(3) | Incorporated by reference from the Registrant's Current Report on Form 8-K filed with the Securities and Exchange Commission on September 1, 2011 (File No. 001-33740). |
(4) | Incorporated by reference from the Registrant's Quarterly Report on Form 10-Q filed with the Securities and Exchange Commission on October 26, 2017 (File No. 001-33740). |
(5) | Incorporated by reference from the Registrant's Current Report Form on 8-K filed with the Securities and Exchange Commission on August 2, 2012 (File No. 001-33740). |
(6) | Incorporated by reference from the Registrant's Current Report on Form 8-K filed with the Securities and Exchange Commission on April 29, 2013 (File No. 001-33740). |
(7) | Incorporated by reference from the Registrant's Quarterly Report on Form 10-Q filed with the Securities and Exchange Commission on July 19, 2013 (File No. 001-33740). |
(8) | Incorporated by reference from the Registrant's Registration Statement on Form S-11/A filed with the Securities and Exchange Commission on July 3, 2007 (File No. 333-142236). |
(9) | Incorporated by reference from the Registrant's Current Report Form on 8-K filed with the Securities and Exchange Commission on February 18, 2016 (File No. 001-33740). |
(10) | Incorporated by reference from the Registrant's Registration Statement on Form S-11/A filed with the Securities and Exchange Commission on May 8, 2009 (File No. 333-142236). |
(11) | Incorporated by reference from the Registrant's Annual Report on Form 10-K filed with the Securities and Exchange Commission on February 17, 2017 (File No. 001-33740). |
(12) | Submitted electronically herewith. Attached as Exhibit 101 to this report are the following documents formatted in XBRL (Extensible Business Reporting Language): (i) Statements of Assets and Liabilities at December 31, 2017 and 2016; (ii) Statements of Operations for the years ended December 31, 2017, 2016 and 2015; (iii) Statement of Changes in Net Assets for the years ended December 31, 2017, 2016 and 2015; (iv) Statements of Cash Flows for the years ended December 31, 2017, 2016 and 2015; and (v) Notes to Financial Statements for the year ended December 31, 2017. |
† | Compensatory plan or arrangement. |
EXHIBIT INDEX
Exhibit Number | Description of Exhibit | |
75
101.INS XBRL | Instance Document (12) | |
101.SCH XBRL | Taxonomy Extension Schema Document (12) | |
101.CAL XBRL | Taxonomy Extension Calculation Linkbase Document (12) | |
101.DEF XBRL | Additional Taxonomy Extension Definition Linkbase Document Created (12) | |
101.LAB XBRL | Taxonomy Extension Label Linkbase Document (12) | |
101.PRE XBRL | Taxonomy Extension Presentation Linkbase Document (12) | |
(1) | Incorporated by reference from the Registrant's Registration Statement on Form S-11 filed with the Securities and Exchange Commission on April 19, 2007 (File No. 333-142236). |
(2) | Incorporated by reference from the Registrant's Form 10-K filed with the Securities and Exchange Commission on February 10, 2010 (File No. 001-33740). |
(3) | Incorporated by reference from the Registrant's Current Report on Form 8-K filed with the Securities and Exchange Commission on September 1, 2011 (File No. 001-33740). |
76
(4) | Incorporated by reference from the Registrant's Quarterly Report on Form 10-Q filed with the Securities and Exchange Commission on October 26, 2017 (File No. 001-33740). |
(5) | Incorporated by reference from the Registrant's Current Report Form on 8-K filed with the Securities and Exchange Commission on August 2, 2012 (File No. 001-33740). |
(6) | Incorporated by reference from the Registrant's Current Report on Form 8-K filed with the Securities and Exchange Commission on April 29, 2013 (File No. 001-33740). |
(7) | Incorporated by reference from the Registrant's Quarterly Report on Form 10-Q filed with the Securities and Exchange Commission on July 19, 2013 (File No. 001-33740). |
(8) | Incorporated by reference from the Registrant's Registration Statement on Form S-11/A filed with the Securities and Exchange Commission on July 3, 2007 (File No. 333-142236). |
(9) | Incorporated by reference from the Registrant's Current Report Form on 8-K filed with the Securities and Exchange Commission on February 18, 2016 (File No. 001-33740). |
(10) | Incorporated by reference from the Registrant's Registration Statement on Form S-11/A filed with the Securities and Exchange Commission on May 8, 2009 (File No. 333-142236). |
(11) | Incorporated by reference from the Registrant's Annual Report on Form 10-K filed with the Securities and Exchange Commission on February 17, 2017 (File No. 001-33740). |
(12) | Submitted electronically herewith. Attached as Exhibit 101 to this report are the following documents formatted in XBRL (Extensible Business Reporting Language): (i) Statements of Assets and Liabilities at December 31, 2017 and 2016; (ii) Statements of Operations for the years ended December 31, 2017, 2016 and 2015; (iii) Statement of Changes in Net Assets for the years ended December 31, 2017, 2016 and 2015; (iv) Statements of Cash Flows for the years ended December 31, 2017, 2016 and 2015; and (v) Notes to Financial Statements for the year ended December 31, 2017. |
† | Compensatory plan or arrangement. |
77
INDEX TO FINANCIAL STATEMENTS
CYS Investments, Inc. | ||
FINANCIAL STATEMENTS AS OF DECEMBER 31, 2017 AND 2016, AND FOR THE YEARS ENDED DECEMBER 31, 2017, 2016 AND 2015: | ||
F-1
REPORT OF INDEPENDENT REGISTERED PUBLIC ACCOUNTING FIRM
To the Board of Directors and Stockholders of
CYS Investments, Inc.
Waltham, MA
Opinion on the Financial Statements
We have audited the accompanying consolidated balance sheets of CYS Investments, Inc. and subsidiaries (the “Company”) as of December 31, 2017 and 2016, the related consolidated statements of operations, changes in stockholders equity, and cash flows for each of the three years in the period ended December 31, 2017, and the related notes (collectively referred to as the “financial statements”). In our opinion, the financial statements present fairly, in all material respects, the financial position of the Company as of December 31, 2017 and 2016, and the results of its operations and its cash flows for each of the three years in the period ended December 31, 2017, in conformity with accounting principles generally accepted in the United States of America.
We have also audited, in accordance with the standards of the Public Company Accounting Oversight Board (United States) (PCAOB), the Company's internal control over financial reporting as of December 31, 2017, based on the criteria established in Internal Control - Integrated Framework (2013) issued by the Committee of Sponsoring Organizations of the Treadway Commission and our report dated February 15, 2018, expressed an unqualified opinion on the Company’s internal control over financial reporting.
Basis for Opinion
These financial statements are the responsibility of the Company’s management. Our responsibility is to express an opinion on the Company's financial statements based on our audits. We are a public accounting firm registered with the PCAOB and are required to be independent with respect to the Company in accordance with the U.S. federal securities laws and the applicable rules and regulations of the Securities and Exchange Commission and the PCAOB.
We conducted our audits in accordance with the standards of the PCAOB. Those standards require that we plan and perform the audit to obtain reasonable assurance about whether the financial statements are free of material misstatement, whether due to error or fraud. Our audits included performing procedures to assess the risks of material misstatement of the financial statements, whether due to error or fraud, and performing procedures that respond to those risks. Such procedures included examining, on a test basis, evidence regarding the amounts and disclosures in the financial statements. Our audits also included evaluating the accounting principles used and significant estimates made by management, as well as evaluating the overall presentation of the financial statements. We believe that our audits provide a reasonable basis for our opinion.
/s/ DELOITTE & TOUCHE LLP
Boston, Massachusetts
February 15, 2018
We have served as the Company’s auditor since 2006.
F-2
CYS INVESTMENTS, INC.
CONSOLIDATED BALANCE SHEETS
(dollars and shares in thousands)
December 31, 2017 | December 31, 2016 | ||||||
Assets: | |||||||
Cash and cash equivalents | $ | 4,132 | $ | 1,260 | |||
Investments in securities, at fair value: | |||||||
Agency RMBS (including pledged assets of $9,287,317 and $10,233,165, respectively) | 11,587,720 | 12,599,045 | |||||
U.S. Treasury securities (including pledged assets of $1,046,934 and $44,469, respectively) | 1,046,934 | 49,686 | |||||
Receivable for securities sold and principal repayments | 301,398 | 409,849 | |||||
Receivable for cash pledged as collateral | — | 600 | |||||
Interest receivable | 32,890 | 31,825 | |||||
Derivative assets, at fair value | 159,629 | 142,556 | |||||
Other investments | 9,765 | 8,028 | |||||
Other assets | 3,114 | 2,419 | |||||
Total assets | 13,145,582 | 13,245,268 | |||||
Liabilities and stockholders' equity: | |||||||
Liabilities: | |||||||
Repurchase agreements | 10,089,917 | 9,691,544 | |||||
Payable for securities purchased | 1,290,805 | 1,881,963 | |||||
Payable for cash received as collateral | 139,614 | 91,503 | |||||
Accrued interest payable | 41,468 | 27,908 | |||||
Accrued expenses and other liabilities | 4,969 | 6,170 | |||||
Dividends payable | 4,410 | 4,410 | |||||
Derivative liabilities, at fair value | 152 | 6,051 | |||||
Total liabilities | 11,571,335 | 11,709,549 | |||||
Commitments and contingencies (Note 12) | — | — | |||||
Stockholders' equity: | |||||||
Preferred Stock, $0.01 par value, 50,000 shares authorized: | |||||||
7.75% Series A Cumulative Redeemable Preferred Stock, (3,000 shares issued and outstanding, respectively, $75,000 in aggregate liquidation preference) | $ | 72,369 | $ | 72,369 | |||
7.50% Series B Cumulative Redeemable Preferred Stock, (8,000 shares issued and outstanding, respectively, $200,000 in aggregate liquidation preference) | 193,531 | 193,531 | |||||
Common Stock, $0.01 par value, 500,000 shares authorized (155,010 and 151,435 shares issued and outstanding, respectively) | 1,550 | 1,514 | |||||
Additional paid in capital | 1,976,310 | 1,944,908 | |||||
Retained earnings (accumulated deficit) | (669,513 | ) | (676,603 | ) | |||
Total stockholders' equity | $ | 1,574,247 | $ | 1,535,719 | |||
Total liabilities and stockholders' equity | $ | 13,145,582 | $ | 13,245,268 | |||
See Notes to consolidated financial statements
F-3
CYS INVESTMENTS, INC.
CONSOLIDATED STATEMENTS OF OPERATIONS
(dollars in thousands, except per share data)
Years Ended December 31, | |||||||||||
2017 | 2016 | 2015 | |||||||||
Interest income: | |||||||||||
Agency RMBS | $ | 304,421 | $ | 291,097 | $ | 328,286 | |||||
Other | 6,362 | 3,440 | 2,909 | ||||||||
Total interest income | 310,783 | 294,537 | 331,195 | ||||||||
Interest expense: | |||||||||||
Repurchase agreements | 114,616 | 70,230 | 40,700 | ||||||||
FHLBC Advances | — | 4,049 | 5,429 | ||||||||
Total interest expense | 114,616 | 74,279 | 46,129 | ||||||||
Net interest income | 196,167 | 220,258 | 285,066 | ||||||||
Other income (loss): | |||||||||||
Net realized gain (loss) on investments | (114,737 | ) | 19,463 | 13,652 | |||||||
Net unrealized gain (loss) on investments | 94,463 | (132,500 | ) | (129,764 | ) | ||||||
Net unrealized gain (loss) on FHLBC Advances | — | (1,299 | ) | 1,299 | |||||||
Other income | 163 | 1,361 | 867 | ||||||||
Net realized and unrealized gain (loss) on investments, FHLBC Advances and other income | (20,111 | ) | (112,975 | ) | (113,946 | ) | |||||
Interest rate hedge expense, net | (29,550 | ) | (55,798 | ) | (100,110 | ) | |||||
Net realized and unrealized gain (loss) on derivative instruments | 57,750 | (11,483 | ) | (54,932 | ) | ||||||
Net gain (loss) on derivative instruments | 28,200 | (67,281 | ) | (155,042 | ) | ||||||
Total other income (loss) | 8,089 | (180,256 | ) | (268,988 | ) | ||||||
Expenses: | |||||||||||
Compensation and benefits | 13,759 | 12,934 | 12,121 | ||||||||
General, administrative and other | 9,236 | 10,677 | 8,722 | ||||||||
Total expenses | 22,995 | 23,611 | 20,843 | ||||||||
Net income (loss) | $ | 181,261 | $ | 16,391 | $ | (4,765 | ) | ||||
Dividends on preferred stock | (20,812 | ) | (20,812 | ) | (20,813 | ) | |||||
Net income (loss) available to common stockholders | $ | 160,449 | $ | (4,421 | ) | $ | (25,578 | ) | |||
Net income (loss) per common share basic & diluted | $ | 1.05 | $ | (0.04 | ) | $ | (0.17 | ) | |||
See Notes to consolidated financial statements
F-4
CYS INVESTMENTS, INC.
CONSOLIDATED STATEMENTS OF STOCKHOLDERS' EQUITY
(dollars in thousands)
Cumulative Redeemable Preferred Stock | ||||||||||||||||||||||||
Series A | Series B | Common Stock Par Value | Additional Paid-in Capital | Retained Earnings (Accumulated Deficit) | Total | |||||||||||||||||||
Balance, December 31, 2014 | $ | 72,369 | $ | 193,531 | $ | 1,618 | $ | 2,049,152 | $ | (341,502 | ) | $ | 1,975,168 | |||||||||||
Net income (loss) | — | — | — | — | (4,765 | ) | (4,765 | ) | ||||||||||||||||
Issuance of common stock | — | — | 5 | (5 | ) | — | — | |||||||||||||||||
Amortization of share-based compensation | — | — | — | 4,021 | — | 4,021 | ||||||||||||||||||
Return of capital distributions | — | — | — | (18,911 | ) | 18,911 | — | |||||||||||||||||
Repurchase and cancellation of common stock | — | — | (106 | ) | (87,838 | ) | — | (87,944 | ) | |||||||||||||||
Preferred dividends(a) | — | — | — | — | (20,813 | ) | (20,813 | ) | ||||||||||||||||
Common dividends(b) | — | — | — | — | (171,053 | ) | (171,053 | ) | ||||||||||||||||
Balance, December 31, 2015 | $ | 72,369 | $ | 193,531 | $ | 1,517 | $ | 1,946,419 | $ | (519,222 | ) | $ | 1,694,614 | |||||||||||
Net income (loss) | — | — | — | — | 16,391 | 16,391 | ||||||||||||||||||
Issuance of common stock | — | — | 4 | 2 | — | 6 | ||||||||||||||||||
Amortization of share-based compensation | — | — | — | 3,995 | — | 3,995 | ||||||||||||||||||
Repurchase and cancellation of common stock | — | — | (7 | ) | (5,508 | ) | — | (5,515 | ) | |||||||||||||||
Preferred dividends(a) | — | — | — | — | (20,812 | ) | (20,812 | ) | ||||||||||||||||
Common dividends(b) | — | — | — | — | (152,960 | ) | (152,960 | ) | ||||||||||||||||
Balance, December 31, 2016 | $ | 72,369 | $ | 193,531 | $ | 1,514 | $ | 1,944,908 | $ | (676,603 | ) | $ | 1,535,719 | |||||||||||
Net income (loss) | — | — | — | — | 181,261 | 181,261 | ||||||||||||||||||
Issuance of common stock | — | — | 36 | 27,750 | — | 27,786 | ||||||||||||||||||
Amortization of share-based compensation | — | — | — | 3,999 | — | 3,999 | ||||||||||||||||||
Repurchase and cancellation of common stock | — | — | — | (347 | ) | — | (347 | ) | ||||||||||||||||
Preferred dividends(a) | — | — | — | — | (20,812 | ) | (20,812 | ) | ||||||||||||||||
Common dividends(b) | — | — | — | — | (153,359 | ) | (153,359 | ) | ||||||||||||||||
Balance, December 31, 2017 | $ | 72,369 | $ | 193,531 | $ | 1,550 | $ | 1,976,310 | $ | (669,513 | ) | $ | 1,574,247 | |||||||||||
____________
(a) | Preferred Series A and Series B dividends declared of $1.9375 and $1.875 per share, respectively, for the years ended December 31, 2017, 2016 and 2015. |
(b) | Common dividends declared of $1.00, $1.01 and $1.10 per share for the years ended December 31, 2017, 2016 and 2015, respectively. |
See Notes to consolidated financial statements
F-5
CONSOLIDATED STATEMENTS OF CASH FLOWS (cont'd)
CYS INVESTMENTS, INC.
CONSOLIDATED STATEMENTS OF CASH FLOWS
(dollars in thousands)
Years Ended December 31, | |||||||||||
2017 | 2016 | 2015 | |||||||||
Cash flows from operating activities: | |||||||||||
Net income (loss) | $ | 181,261 | $ | 16,391 | $ | (4,765 | ) | ||||
Adjustments to reconcile net income (loss) to net cash provided by (used in) operating activities: | |||||||||||
Amortization of share-based compensation | 3,999 | 3,995 | 4,021 | ||||||||
Amortization of premiums and discounts on investment securities | 55,193 | 84,119 | 90,448 | ||||||||
Amortization of premiums on interest rate cap contracts and swaptions | 18,850 | 17,500 | 17,500 | ||||||||
Net realized (gain) loss on investments | 114,737 | (19,463 | ) | (13,652 | ) | ||||||
Net unrealized (gain) loss on investments | (94,463 | ) | 132,500 | 129,764 | |||||||
Net unrealized (gain) loss on derivative instruments | (40,472 | ) | (67,251 | ) | 28,023 | ||||||
Net unrealized (gain) loss on FHLBC Advances | — | 1,299 | (1,299 | ) | |||||||
Change in assets and liabilities: | |||||||||||
Interest receivable | (1,065 | ) | 2,738 | 3,331 | |||||||
Other assets | (695 | ) | (1,368 | ) | 32 | ||||||
Accrued interest payable | 13,560 | (4,680 | ) | 5,380 | |||||||
Accrued expenses and other liabilities | (1,201 | ) | 2,087 | (1,176 | ) | ||||||
Net cash provided by (used in) operating activities | 249,704 | 167,867 | 257,607 | ||||||||
Cash flows from investing activities: | |||||||||||
Purchase of available-for-sale investment securities | (14,546,945 | ) | (16,211,518 | ) | (22,633,230 | ) | |||||
Purchase of other investments | — | — | (42,003 | ) | |||||||
Premium paid on interest rate caps and swaptions | (1,350 | ) | — | — | |||||||
Proceeds from sale of available-for-sale investment securities | 13,124,139 | 14,475,065 | 22,099,486 | ||||||||
Proceeds from sale of other investments | — | 42,000 | — | ||||||||
Proceeds from paydowns of available-for-sale investment securities | 1,359,679 | 1,918,273 | 1,900,984 | ||||||||
Change in assets and liabilities: | |||||||||||
Receivable for securities sold and principal repayments | 108,451 | 674,995 | (1,001,201 | ) | |||||||
Receivable for cash pledged as collateral | 600 | 21,151 | (10,647 | ) | |||||||
Payable for securities purchased | (591,158 | ) | 405,989 | (29,507 | ) | ||||||
Payable for cash received as collateral | 48,111 | 72,969 | (54,237 | ) | |||||||
Net cash provided by (used in) investing activities | (498,473 | ) | 1,398,924 | 229,645 | |||||||
Cash flows from financing activities: | |||||||||||
Proceeds from repurchase agreements | 147,003,031 | 102,280,487 | 89,890,611 | ||||||||
Repayments of repurchase agreements | (146,604,658 | ) | (101,576,719 | ) | (92,192,394 | ) | |||||
Proceeds from FHLBC Advances | — | 2,175,000 | 31,585,000 | ||||||||
Repayments of FHLBC Advances | — | (4,275,000 | ) | (29,485,000 | ) | ||||||
Net proceeds from issuance of common shares | 27,786 | 6 | — | ||||||||
Net payments for repurchase of common shares | (347 | ) | (5,515 | ) | (87,944 | ) | |||||
Dividends paid | (174,171 | ) | (173,772 | ) | (191,866 | ) | |||||
Net cash provided by (used in) financing activities | 251,641 | (1,575,513 | ) | (481,593 | ) | ||||||
Net increase (decrease) in cash and cash equivalents | 2,872 | (8,722 | ) | 5,659 | |||||||
Cash and cash equivalents - Beginning of period | 1,260 | 9,982 | 4,323 | ||||||||
Cash and cash equivalents - End of period | $ | 4,132 | $ | 1,260 | $ | 9,982 | |||||
Supplemental disclosures of cash flow information: | |||||||||||
F-6
CONSOLIDATED STATEMENTS OF CASH FLOWS (cont'd)
Interest paid (excluding interest paid on interest rate hedges) | $ | 100,678 | $ | 65,492 | $ | 44,080 | |||||
Net interest paid on interest rate hedges | $ | 11,078 | $ | 51,764 | $ | 79,280 | |||||
Income taxes paid | $ | 1,499 | $ | — | $ | — | |||||
Supplemental disclosures of non-cash flow information: | |||||||||||
Dividends declared, not paid | $ | 4,410 | $ | 4,410 | $ | 4,410 | |||||
See Notes to consolidated financial statements
F-7
CYS INVESTMENTS, INC.
NOTES TO CONSOLIDATED FINANCIAL STATEMENTS
1. ORGANIZATION
CYS Investments, Inc. (the "Company", "we", "us" or "our") was formed as a Maryland corporation on January 3, 2006, and commenced operations on February 10, 2006. The Company has elected to be taxed, and intends to continue to qualify, as a real estate investment trust ("REIT"), and is required to comply with the provisions of the Internal Revenue Code of 1986, as amended (the "Code"), with respect thereto. The Company primarily invests in residential mortgage-backed securities that are issued and the principal and interest of which are guaranteed by a federally chartered corporation ("Agency RMBS"), such as the Federal National Mortgage Association ("Fannie Mae") or the Federal Home Loan Mortgage Corporation ("Freddie Mac"), or an agency of the U.S. government such as the Government National Mortgage Association ("Ginnie Mae"), and debt securities issued by the United States Department of Treasury ("U.S. Treasuries"). The Company's investment guidelines provide that the Company may also purchase collateralized mortgage obligations issued by a government agency or government-sponsored entity that are collateralized by Agency RMBS ("CMOs"), credit risk transfer securities, such as Structured Agency Credit Risk ("STACR") securities issued by Freddie Mac, Connecticut Avenue Securities ("CAS") issued by Fannie Mae, or similar securities issued or sponsored by a GSE where their cash flows track the credit risk performance of a notional reference pool of mortgage loans, or securities issued by a government-sponsored entity that are not backed by collateral but, in the case of government agencies, are backed by the full faith and credit of the U.S. government, and, in the case of government-sponsored entities, are backed by the integrity and creditworthiness of the issuer ("U.S. Agency Debentures").
The Company's common stock, Series A Cumulative Redeemable Preferred Stock, $25.00 liquidation preference (the "Series A Preferred Stock"), and Series B Cumulative Redeemable Preferred Stock, $25.00 liquidation preference (the "Series B Preferred Stock"), trade on the New York Stock Exchange under the symbols "CYS," "CYS PrA" and "CYS PrB," respectively.
In March 2015, our wholly-owned captive insurance subsidiary, CYS Insurance Services, LLC ("CYS Insurance"), was granted membership in the Federal Home Loan Bank ("FHLB") system, specifically in the FHLB of Cincinnati ("FHLBC"). Membership in the FHLBC obligated CYS Insurance to purchase FHLBC membership stock and activity stock, the latter being a percentage of the advances it obtained from the FHLBC. CYS Insurance sought both short-term advances ("Short-term FHLBC Advances") and long-term advances ("Long-term FHLBC Advances", and collectively with Short-term FHLBC Advances, "FHLBC Advances") from the FHLBC. On January 12, 2016, the Federal Housing Finance Agency ("FHFA") issued a final rule (the "Final Rule") amending its regulations governing FHLBC Membership criteria for captive insurance companies. Under this Final Rule, which became effective on February 19, 2016, CYS Insurance's membership in the FHLBC was required to be terminated within one year of the effective date, it was not permitted to secure any new advances, and all FHLBC Advances were required to be repaid no later than February 19, 2017. The Company repaid all outstanding FHLBC Advances prior to September 30, 2016, and CYS Insurance's membership in the FHLBC was terminated on February 19, 2017.
2. SIGNIFICANT ACCOUNTING POLICIES
Basis of Presentation
The accompanying consolidated financial statements have been prepared in conformity with accounting principles generally accepted in the United States of America ("GAAP") and the instructions to the Securities and Exchange Commission ("SEC") Form 10-K.
The consolidated financial statements include the accounts of the Company and all of its subsidiaries. All intercompany balances and transactions have been eliminated. The consolidated financial statements of the Company have been prepared on the accrual basis of accounting in accordance with GAAP. The preparation of financial statements in conformity with GAAP requires management to make a number of estimates and assumptions that affect the amounts reported in the consolidated financial statements and accompanying footnotes. Actual results could differ from these estimates and the differences may be material.
The Company adopted Financial Accounting Standards Board ("FASB") Statement of Position ("SOP") 07-1, Clarification of the Scope of the Audit and Accounting Guide Investment Companies and Accounting by Parent Companies and Equity Method Investors for investments in Investment Companies, prior to its deferral in February 2008. Under SOP 07-1, the Company used financial reporting for investment companies, in accordance with FASB Accounting Standards Codification ("ASC") 946, Investment Companies. Accounting Standards Update No. 2013-08, which was effective for the Company on January 1, 2014 required, among other things, that entities that adopted SOP 07-1 before the FASB's indefinite deferral assess whether they continue to be within the scope of ASC 946. The Company determined that REITs are excluded from the scope
F-8
of ASC 946, and effective January 1, 2014, the Company discontinued use of investment company accounting on a prospective basis.
Reclassification and Presentation
From the Company's inception through September 30, 2015, "Swap and cap interest expense" was recognized as a separate component of "Total interest expense" in the Consolidated Statement of Operations. Effective October 1, 2015, Swap and cap interest expense is recognized as a component of "Net gain (loss) on derivative instruments". This reclassification was made in order to record income, expenses and changes in fair value related to derivative instruments in one line item in the Consolidated Statement of Operations, consistent with common industry practice. Prior period balances have been reclassified to conform to the current period presentation.
Prior to January 1, 2016, FHLBC Advances were presented and disclosed separately on the Consolidated Balance Sheet and interest expense on all FHLBC Advances was reported in the aggregate with interest expense on repurchase agreements. Effective January 1, 2016, FHLBC Advances are presented on the balance sheet and disclosed in the aggregate, while interest expense on FHLBC Advances is reported separately from interest expense on repurchase agreements. Prior periods have been reclassified to conform to the current period presentation.
Prior to October 1, 2017, "Interest rate hedge expense, net" was referred to as "Swap and cap interest expense" in the Consolidated Statement of Operations. This line item includes the following: (i) net periodic payments made on interest rate swaps and interest rate caps, (ii) the periodic amortization of premiums paid to enter into interest rate caps, and (iii) the periodic amortization of premiums paid to enter into swaptions, less, total payments received in connection with (A) the receive leg of our interest rate swaps, and (B) payments received in connection with interest rate caps. On October 1, 2017, the name was changed to “Interest rate hedge expense, net”, to better reflect the broad nature of items included in this line item, all of which reflect the Company’s net cost of hedging its exposure to interest rates. Prior period financial statement line items have been renamed to conform to the current period presentation.
Cash and Cash Equivalents
Cash and cash equivalents represent cash held in banks, cash on hand, and liquid investments with original maturities of three months or less. We may have bank balances in excess of federally insured amounts; however, we deposit our cash and cash equivalents with high credit-quality institutions to minimize credit risk exposure. We have not experienced, and do not expect, any losses on our cash or cash equivalents.
Investments in Securities
The Company's investment securities are accounted for in accordance with the Financial Accounting Standards Board's ("FASB") Accounting Standards Codification ("ASC") 320—Investments—Debt and Equity Securities. These investments meet the requirements to be classified as available-for-sale under ASC 320. Therefore, our investment securities are recorded at fair market value on the Consolidated Balance Sheets. The Company has chosen to make a fair value election pursuant to ASC 825—Financial Instruments for its securities. Electing the fair value option requires the Company to record changes in the fair value of investments in the Consolidated Statement of Operations as a component of net unrealized gain (loss) on investments, which in management’s view, more appropriately reflects the results of operations for a particular reporting period as all securities activities will be recorded in a similar manner.
The Company records its security purchase and sale transactions, including forward settling transactions, on a trade date basis. Realized gains and losses on securities transactions are recorded on an identified cost basis.
Agency RMBS
The Company's investments in Agency RMBS consist of pass-through certificates backed by fixed-rate, monthly-reset adjustable-rate loans ("ARMs") and Hybrid ARMs, the principal and interest of which are guaranteed by Fannie Mae, Freddie Mac or Ginnie Mae. Hybrid ARMs have interest rates that have an initial fixed period (typically three, five, seven or 10 years) and thereafter reset at regular intervals in a manner similar to ARMs.
Forward Settling Transactions
The Company engages in forward settling transactions to purchase or sell certain securities. Agency RMBS may include forward contracts for Agency RMBS purchases or sales of specified pools on a to-be-announced basis ("TBA Securities") that meet the regular-way scope exception in ASC 815—Derivatives and Hedging ("ASC 815"), and are recorded on a trade date basis to the extent it is probable that we will take or make timely physical delivery of the related securities. The Company maintains security positions such that sufficiently liquid assets will be available to make payment on the settlement date for securities purchased. The Agency RMBS purchased at the forward settlement date are typically priced at a discount to securities for settlement in the current month. Securities purchased on a forward settling basis are carried at fair value and begin
F-9
earning interest on the settlement date. Gains or losses may occur on these transactions due to changes in market conditions or the failure of counterparties to perform under the contract.
Investment and Derivative Valuation
The Company has a pricing committee responsible for establishing valuation policies and procedures, and reviewing and approving valuations monthly. The pricing committee is composed of individuals from the finance and investment teams and other members of senior management.
Fair Value Measurements
Refer to Note 7, Fair Value Measurements, for the Company's accounting policy for, and details related to, the fair value of the Company's assets and liabilities.
Interest Income and Expense
We record interest income and expense on an accrual basis. We accrue interest income based on the outstanding principal amount of the settled securities in our portfolio and their contractual terms. We amortize premiums and discounts using the effective interest method as prepayments occur, and this net amortization is either a reduction of or accretive to interest income from Agency RMBS in the accompanying Consolidated Statement of Operations. The Company does not estimate prepayments when calculating the yield to maturity on Agency RMBS.
Other Investments
CYS Insurance was a member of the FHLBC. As a condition of its membership in the FHLBC, CYS Insurance was required to maintain FHLBC stock, both for membership and for the level of advances from the FHLBC to CYS Insurance. The Company accounted for its investment in FHLBC stock as a cost method investment in "Other investments" in the accompanying Consolidated Balance Sheets in accordance with ASC 325, Investments - Other. The Company periodically evaluated FHLBC stock for impairment in accordance with ASC 320—Investments—Debt and Equity Securities. Also included in other investments is a net investment in real estate that is recorded at fair value, inclusive of $3.7 million of corresponding mortgage debt, with changes in estimated fair value recognized in the accompanying Consolidated Statements of Operations.
Repurchase Agreements and FHLBC Advances
Prior to the February 19, 2016 Final Rule, which precluded the Company from securing new FHLBC Advances, we entered into FHLBC Advances, some of which had an initial maturity of more than one year that were collateralized by the Company's Debt Securities. The Company chose to make a fair value election pursuant to ASC 825—Financial Instruments for FHLBC Advances with initial terms greater than one year and, therefore, this debt was recorded at fair market value in the accompanying Consolidated Balance Sheets. The unpaid principal balance of FHLBC Advances with initial maturities less than one year generally approximated fair value due to the short-term nature of the instruments. We priced FHLBC Advances with an initial maturity greater than one year daily through a pricing service that used a discounted cash flow model to value the debt, and we periodically validated the prices we received through this process. Changes in the fair market value were recorded in current period earnings in the accompanying Consolidated Statements of Operations as a component of net unrealized gain (loss) on FHLBC Advances. Electing the fair value option permitted the Company to record changes in the fair value of FHLBC Advances along with that of our investments in the Consolidated Statements of Operations which, in management’s view, more appropriately reflect the results of operations for a particular reporting period as all income producing assets and liabilities are recognized in a consistent manner.
Borrowings under repurchase agreements ("repo borrowings") are, and FHLBC Advances were, collateralized by the Company’s Agency RMBS and U.S. Treasuries (collectively, "Debt Securities"). The Company’s repo borrowing counterparties are institutional dealers in fixed income securities and large financial institutions, and CYS Insurance's counterparty for FHLBC Advances was the FHLBC. Collateral pledged on repo borrowings is valued daily, and collateral that was pledged on FHLBC Advances was valued periodically, and our counterparties may require posting of additional collateral when the fair value of pledged collateral declines. Repo borrowing counterparties have, and the FHLBC had, the right to sell or repledge collateral pledged under repo borrowings and FHLBC Advances.
We account for our repo borrowings as short-term indebtedness under ASC 470—Debt; accordingly, these short-term instruments are reflected in our financial statements at their amortized cost, which approximates fair value due to their short-term nature.
Derivative Instruments
Included in Derivative Instruments are interest rate swaps (cancellable and non-cancellable), swaptions, interest rate caps and TBA Derivatives (defined below).
F-10
The Company uses interest rate swaps, swaptions and caps (a "swap", "swaption" or "cap", respectively) to economically hedge a portion of its exposure to market risks, including interest rate and extension risk. The objective of our risk management strategy is to reduce fluctuations in stockholders’ equity over a range of interest rate scenarios. In particular, we attempt to manage the risk of the cost of our variable rate liabilities increasing during a period of rising interest rates.
During the term of a swap or cap, the Company makes and/or receives periodic payments and records unrealized gains or losses as a result of marking the swap or cap to fair value. During the term of a swaption, the Company will record unrealized gains or losses as the difference between the premium paid and the fair value of the swaption. We report the periodic interest payments and interest receipts on swaps (cancellable and non-cancellable) and caps and amortization of premiums on cap and swaption contracts in interest rate hedge expense, net in the accompanying Consolidated Statements of Operations. When the Company terminates a swap, swaption or cap, we record a realized gain or loss equal to the difference between the proceeds from (or the cost of) closing the transaction and the Company's cost basis in the contract, if any. Swaps involve a risk that interest rates will move contrary to the Company’s expectations, thereby increasing the Company’s payment obligation.
The Company's swaps, swaptions and caps may be subject to a master netting arrangement ("MNA"), pursuant to which the Company may be exposed to credit loss in the event of non-performance by the counterparty to the swap, swaption or cap, limited to the fair value of collateral posted in excess of the fair value of the contract in a net liability position and the shortage of the fair value of collateral posted for the contract in a net asset position. The Company has elected, as an accounting policy, to present these arrangements gross, and not on a net basis. As of December 31, 2017 and December 31, 2016, the Company did not anticipate non-performance by any counterparty. Should interest rates move contrary to the Company's expectations, the Company may not achieve the anticipated benefits of the interest rate swap, swaption or cap and may realize a loss.
While the Company's derivative agreements generally permit netting or setting off derivative assets and liabilities with the counterparty, the Company reports derivative assets and liabilities on a gross basis in the accompanying Consolidated Balance Sheets. Derivatives are accounted for in accordance with ASC 815 which requires recognition of all derivatives as either assets or liabilities at fair value in the accompanying Consolidated Balance Sheets with changes in fair value recognized in the accompanying Consolidated Statements of Operations in "Net realized and unrealized gain (loss) on derivative instruments". Cash receipts and payments related to derivative instruments are classified in the accompanying Consolidated Statements of Cash Flows in accordance with GAAP in the operating activities section, while the premium paid on interest rate caps and swaptions, and proceeds from the termination of interest rate caps are recorded in the investing activities section of the accompanying Consolidated Statements of Cash Flows.
The Company enters into TBA dollar roll transactions whereby the Company is not contractually obligated to accept delivery on the settlement date ("TBA Derivatives"). TBA Derivatives are accounted for as a series of derivative transactions. The fair value of TBA Derivatives is based on similar methods used to value Agency RMBS with gains and losses recorded in Net realized and unrealized gains (losses) on derivative instruments in the accompanying Consolidated Statements of Operations. TBA Derivative transactions involve moving the settlement of a TBA contract out to a later date by entering into an offsetting short position (referred to as a "pair off"), net settling the paired off positions for cash, and simultaneously purchasing a similar TBA contract for a later settlement date. The Company records such pair offs on a gross basis such that there is a sale of the original TBA Derivative and a subsequent purchase of a new TBA Derivative.
None of the Company's derivatives have been designated as hedging instruments for accounting purposes. Effective January 1, 2016, the Company recognized all TBAs that do not qualify for the regular-way scope exception under ASC 815 as derivatives.
Income Taxes
The Company has elected to be treated as a REIT under the Code. The Company will generally not be subject to federal income tax to the extent that it distributes 90% of its taxable income after application of available tax provisions, within the time limits prescribed by the Code and as long as the Company satisfies the ongoing REIT requirements, including meeting certain asset, income and stock ownership tests.
Leases
The Company occupies leased office space. The Company’s lease is accounted for in accordance with ASC 840—Leases, and is classified as an operating lease. Rent expense is amortized on a straight-line basis over the lease term and is included in "General, administrative and other expense" in the accompanying Consolidated Statements of Operations.
Stock-based Compensation
The Company applies the provisions of ASC 718-Compensation-Stock Compensation, with regard to its equity incentive plans. ASC 718 covers a wide range of share-based compensation arrangements including stock options, restricted
F-11
stock plans, performance-based awards, stock appreciation rights and employee stock purchase plans. ASC 718 requires that compensation costs relating to stock-based payment transactions be recognized in the consolidated financial statements. Compensation costs related to restricted common shares issued are measured at their estimated fair value at the grant date, and are amortized and expensed over the vesting period on a straight-line basis. The Company estimates the impact of forfeitures to the extent practical, otherwise forfeitures are recognized as they occur.
Earnings Per Share ("EPS")
The Company computes basic EPS using the two-class method by dividing net income (loss), after adjusting for the impact of nonvested stock awards deemed to be participating securities, by the weighted-average number of common shares outstanding, calculated excluding nonvested stock awards. The Company computes diluted EPS by dividing net income (loss), after adjusting for the impact of nonvested stock awards deemed to be participating securities, by the weighted-average number of common shares outstanding, calculated excluding nonvested stock awards, giving effect to common stock options and warrants, if they are dilutive. See Note 9, Earnings Per Share for EPS computations.
Recent Accounting Pronouncements
The following table provides a brief description of recent accounting pronouncements that could potentially impact the Company's consolidated financial statements:
Accounting Standard | Description | Required Date of Adoption | Anticipated Effect on the Financial Statements | |||
ASU 2017-09 Compensation - Stock Compensation (Topic 718); Scope of Modification Accounting | On May 10, 2017, the FASB issued ASU 2017-09, which amends the scope of modification accounting for share-based payment arrangements. The ASU provides guidance on the types of changes to the terms or conditions of share-based payment awards to which an entity would be required to apply modification accounting under ASC 718, (Compensation - Stock Compensation). Specifically, an entity would not apply modification accounting if the fair value, vesting conditions, and classification of the awards are the same immediately before and after the modification. | Effective for annual reporting periods, including interim periods within those annual reporting periods, beginning after December 15, 2017. Early adoption is permitted, including adoption in any interim period. | Not expected to have a significant impact on the consolidated financial statements. | |||
ASU 2017-05 Other Income—Gains and Losses from the Derecognition of Nonfinancial Assets (Subtopic 610-20) Clarifying the Scope of Asset Derecognition Guidance and Accounting for Partial Sales of Nonfinancial Assets | On February 22, 2017, the FASB issued ASU 2017-05, which clarifies the scope of the Board’s recently established guidance on nonfinancial asset derecognition (ASC 610-20) as well as the accounting for partial sales of nonfinancial assets. The ASU conforms the derecognition guidance on nonfinancial assets with the model for transactions in the new revenue standard (ASC 606, as amended). The FASB issued the ASU in response to stockholder feedback indicating that (1) the meaning of the term “in-substance nonfinancial asset” is unclear because the Board’s new revenue standard does not define it and (2) the scope of the guidance on nonfinancial assets is confusing and complex and does not specify how a partial sales transaction should be accounted for or which model entities should apply. | January 1, 2018. The effective date of the new guidance aligns with the requirements in the new revenue standard. If the entity decides to early adopt the ASU’s guidance, it must also early adopt ASC 606-Revenue from Contracts with Customers (and vice versa). | Not expected to have a significant impact on the consolidated financial statements. | |||
F-12
Accounting Standard | Description | Required Date of Adoption | Anticipated Effect on the Financial Statements | |||
ASU 2017-01 Business Combinations (Topic 805) Clarifying the Definition of a Business | On January 5, 2017, the FASB issued ASU 2017-01 to clarify the definition of a business in ASC 805. The FASB issued the ASU in response to stockholder feedback that the definition of a business in ASC 805 is being applied too broadly. In addition, stakeholders said that analyzing transactions under the current definition is difficult and costly. Concerns about the definition of a business were among the primary issues raised in connection with the Financial Accounting Foundation’s post-implementation review report on FASB Statement No. 141(R), Business Combinations (codified in ASC 805). The amendments in the ASU are intended to make application of the guidance more consistent and cost-efficient. Real estate is less likely to be a "business" which will lead to more capitalization of transaction costs-vs-expensing. | January 1, 2018 (early adoption permitted). | Not expected to have a significant impact on the consolidated financial statements. | |||
ASU 2016-15 Statement of Cash Flows (Topic 230) Classification of Certain Cash Receipts and Cash Payments ("ASU 2016-15") (a consensus of the Emerging Issues Task Force) | On August 26, 2016, the FASB issued ASU 2016-15, which amends ASC 230, Statement of Cash Flows ("ASC 230), to add or clarify guidance on the classification of certain cash receipts and payments in the statement of cash flows. ASC 230 lacks consistent principles for evaluating the classification of cash payments and receipts in the statement of cash flows. This has led to diversity in practice and, in certain circumstances, financial statement restatements. Consequently, the FASB issued ASU 2016-15 with the intent of reducing diversity in practice with respect to certain types of cash flows. | January 1, 2018 (early adoption is permitted). Entities must apply the guidance retrospectively to all periods presented but may apply it prospectively if retrospective application would be impracticable. | Not expected to have a significant impact on the consolidated financial statements. | |||
ASU 2016-02 Leases (Topic 842) | The amendments require lessees to recognize a right-of-use asset and a liability to make lease payments in the balance sheets for most leases. The accounting for lessors is largely unchanged. | January 1, 2019 (early adoption permitted). | Not expected to have a significant impact on the consolidated financial statements. | |||
ASU 2016-01 Financial Instruments - Overall (Subtopic 825-10) Recognition and Measurement of Financial Assets and Financial Liabilities | The amendments address certain aspects of recognition, measurement, presentation, and disclosure of financial instruments. | January 1, 2018 (early adoption permitted for a provision related to presentation of instrument-specific credit risk of liabilities accounted for under the fair value option). | Not expected to have a significant impact on the consolidated financial statements. | |||
F-13
3. INVESTMENTS IN SECURITIES
The available-for-sale investments portfolio consisted of the following as of December 31, 2017 and December 31, 2016 (in thousands):
December 31, 2017 | ||||||||||||||||
Asset Type | Amortized Cost | Gross Unrealized Loss | Gross Unrealized Gain | Fair Value | ||||||||||||
Fannie Mae Certificates | ||||||||||||||||
Fixed Rate | $ | 7,117,481 | $ | (20,470 | ) | $ | 23,067 | $ | 7,120,078 | |||||||
ARMs | 273,660 | (2,647 | ) | 1,101 | 272,114 | |||||||||||
Total Fannie Mae | 7,391,141 | (23,117 | ) | 24,168 | 7,392,192 | |||||||||||
Freddie Mac Certificates | ||||||||||||||||
Fixed Rate | 3,968,358 | (11,045 | ) | 10,142 | 3,967,455 | |||||||||||
ARMs | 200,405 | (1,028 | ) | 329 | 199,706 | |||||||||||
Total Freddie Mac | 4,168,763 | (12,073 | ) | 10,471 | 4,167,161 | |||||||||||
Ginnie Mae Certificates | ||||||||||||||||
Fixed Rate | 1,602 | (45 | ) | — | 1,557 | |||||||||||
ARMs | 26,460 | — | 350 | 26,810 | ||||||||||||
Total Ginnie Mae | 28,062 | (45 | ) | 350 | 28,367 | |||||||||||
Total Agency RMBS | 11,587,966 | (35,235 | ) | 34,989 | 11,587,720 | |||||||||||
U.S. Treasuries | 1,047,965 | (1,031 | ) | — | 1,046,934 | |||||||||||
Total | $ | 12,635,931 | $ | (36,266 | ) | $ | 34,989 | $ | 12,634,654 | |||||||
December 31, 2016 | ||||||||||||||||
Fannie Mae Certificates | ||||||||||||||||
Fixed Rate | $ | 9,505,262 | $ | (81,783 | ) | $ | 36,622 | $ | 9,460,101 | |||||||
ARMs | 301,029 | (2,668 | ) | 1,571 | 299,932 | |||||||||||
Total Fannie Mae | 9,806,291 | (84,451 | ) | 38,193 | 9,760,033 | |||||||||||
Freddie Mac Certificates | ||||||||||||||||
Fixed Rate | 2,799,604 | (55,624 | ) | 7,659 | 2,751,639 | |||||||||||
ARMs | 50,641 | (514 | ) | 606 | 50,733 | |||||||||||
Total Freddie Mac | 2,850,245 | (56,138 | ) | 8,265 | 2,802,372 | |||||||||||
Ginnie Mae Certificates | ||||||||||||||||
Fixed Rate | 1,856 | (54 | ) | — | 1,802 | |||||||||||
ARMs | 34,390 | — | 448 | 34,838 | ||||||||||||
Total Ginnie Mae | 36,246 | (54 | ) | 448 | 36,640 | |||||||||||
Total Agency RMBS | 12,692,782 | (140,643 | ) | 46,906 | 12,599,045 | |||||||||||
U.S. Treasuries | 49,952 | (266 | ) | — | 49,686 | |||||||||||
Total | $ | 12,742,734 | $ | (140,909 | ) | $ | 46,906 | $ | 12,648,731 | |||||||
The following table presents the gross unrealized loss and fair values of the Company's available-for-sale investments by length of time that such securities have been in a continuous unrealized loss position as of December 31, 2017 and December 31, 2016 (in thousands):
Unrealized loss positions | ||||||||||||||||||||||||
Less than 12 Months | Greater than 12 months | Total | ||||||||||||||||||||||
As of | Fair value | Unrealized loss | Fair value | Unrealized loss | Fair value | Unrealized loss | ||||||||||||||||||
December 31, 2017 | $ | 7,925,876 | $ | (36,170 | ) | $ | 24,896 | $ | (96 | ) | $ | 7,950,772 | $ | (36,266 | ) | |||||||||
December 31, 2016 | $ | 9,264,265 | (140,909 | ) | — | — | 9,264,265 | (140,909 | ) | |||||||||||||||
F-14
The following table summarizes the Company’s available-for-sale investments as of December 31, 2017 and December 31, 2016, according to their estimated remaining weighted-average maturity classifications:
December 31, 2017 | December 31, 2016 | |||||||||||||||
Fair Value | Amortized Cost | Fair Value | Amortized Cost | |||||||||||||
Less than one year | $ | 24,896 | $ | 24,992 | $ | — | $ | — | ||||||||
Greater than one year through five years | 5,137,370 | 5,143,680 | 3,765,037 | 3,744,614 | ||||||||||||
Greater than five years through ten years | 7,472,388 | 7,467,259 | 8,864,309 | 8,978,537 | ||||||||||||
Greater than ten years | — | — | 19,385 | 19,583 | ||||||||||||
Total | $ | 12,634,654 | $ | 12,635,931 | 12,648,731 | 12,742,734 | ||||||||||
The following table is a summary of the net gain (loss) from the sale of available-for-sale investments for the year ended December 31, 2017 and 2016 (in thousands):
For the year ended December 31, | ||||||||
2017 | 2016 | |||||||
Available-for-sale investments, at cost | $ | 13,238,876 | $ | 14,455,602 | ||||
Proceeds from sale of available-for-sale investments | 13,124,139 | 14,475,065 | ||||||
Net realized gain (loss) on sale of available-for-sale investments | (114,737 | ) | 19,463 | |||||
Gross gain on sale of available-for-sale investments | 17,986 | 77,142 | ||||||
Gross (loss) on sale of available-for-sale investments | (132,723 | ) | (57,679 | ) | ||||
Net realized gain (loss) on sale of available-for-sale investments | $ | (114,737 | ) | $ | 19,463 | |||
The components of the carrying value of available-for-sale investments at December 31, 2017 and December 31, 2016 are presented below. The premium purchase price is generally due to the average coupon interest rates on these investments being higher than prevailing market rates and, conversely, the discount purchase price is generally due to the average coupon interest rates on these investments being lower than prevailing market rates.
(in thousands) | December 31, 2017 | December 31, 2016 | ||||||
Principal balance | $ | 12,275,352 | $ | 12,285,204 | ||||
Unamortized premium | 362,676 | 458,709 | ||||||
Unamortized discount | (2,097 | ) | (1,179 | ) | ||||
Gross unrealized gains | 34,989 | 46,906 | ||||||
Gross unrealized losses | (36,266 | ) | (140,909 | ) | ||||
Fair value | $ | 12,634,654 | $ | 12,648,731 | ||||
As of December 31, 2017, the weighted-average coupon interest rate on the Company's Agency RMBS and U.S. Treasuries was 3.52% and 1.85%, respectively. As of December 31, 2016, the weighted-average coupon interest rate on the Company's Agency RMBS and U.S. Treasuries was 3.37% and 0.63%, respectively. Actual maturities of Agency RMBS are generally shorter than their stated contractual maturities (which range up to 30 years), as they are affected by the contractual lives of the underlying mortgages, periodic payments and prepayments of principal. As of December 31, 2017, the range of final contractual maturities of the Company's Agency RMBS portfolio was between 2024 and 2048. As of December 31, 2016, the range of final contractual maturities of the Company's Agency RMBS portfolio was between 2024 and 2047. As of December 31, 2017, the weighted-average contractual maturities of the Company's Agency RMBS portfolio and U.S. Treasuries was 2042 and 2020, respectively. As of December 31, 2016, the weighted-average contractual maturities of our Agency RMBS portfolio and U.S. Treasuries was 2040 and 2018, respectively.
Credit Risk
The Company believes it has minimal exposure to credit losses on its Debt Securities at December 31, 2017 and December 31, 2016. Principal and interest payments on Agency RMBS are guaranteed by Freddie Mac and Fannie Mae, while principal and interest payments on Ginnie Mae RMBS and U.S. Treasuries are backed by the full faith and credit of the U.S. government. Since September 2008, both Freddie Mac and Fannie Mae have operated in the conservatorship of the U.S.
F-15
government. As of December 31, 2017, S&P maintained its AA+ rating for the U.S. government, while Fitch and Moody's rated the U.S. government AAA and Aaa, respectively. Since Fannie Mae and Freddie Mac are in U.S. government conservatorship, the implied credit ratings of Agency RMBS are similarly rated.
4. DERIVATIVE INSTRUMENTS
The Company enters into swaps (cancellable and non-cancellable), swaptions and caps as part of its efforts to manage its interest rate exposure. The Company had the following activity in interest rate swap, swaption and cap transactions during the years ended December 31, 2017 and 2016 (in thousands):
Year Ended December 31, 2017 | Year Ended December 31, 2016 | |||||||||||||
Trade Date | Transaction | Notional | Trade Date | Transaction | Notional | |||||||||
April 2017 | Terminated | $ | (500,000 | ) | January 2016 | Terminated | $ | (500,000 | ) | |||||
April 2017 | Opened | 500,000 | May 2016 | Terminated | (2,200,000 | ) | ||||||||
May 2017 | Terminated | (500,000 | ) | May 2016 | Opened | 1,700,000 | ||||||||
May 2017 | Opened | 500,000 | September 2016 | Terminated | (500,000 | ) | ||||||||
June 2017 | Opened | 100,000 | Net Decrease | $ | (1,500,000 | ) | ||||||||
August 2017 | Opened | 425,000 | ||||||||||||
August 2017 | Terminated | (500,000 | ) | |||||||||||
September 2017 | Opened | 500,000 | ||||||||||||
September 2017 | Terminated | (500,000 | ) | |||||||||||
November 2017 (1) | Opened | 500,000 | ||||||||||||
December 2017 | Terminated | (500,000 | ) | |||||||||||
December 2017 | Opened | 1,000,000 | ||||||||||||
Net Increase | $ | 1,025,000 | ||||||||||||
__________________
(1) | Represents a swaption with a notional of $500 million, a pay rate of 2.16% and an expiration date of December 18, 2017. The company exercised the underlying option by entering into a swap with a notional of $500 million, a pay rate of 2.16% and maturity date of December 20, 2022. |
As of December 31, 2017 and December 31, 2016, the Company pledged Debt Securities with a fair value of $76.5 million and $79.0 million, respectively, on its derivative instruments. As of December 31, 2017, the Company had no cash pledged as collateral on derivative instruments. As of December 31, 2016 the Company had pledged cash of $0.6 million on derivative instruments. As of December 31, 2017, the Company had Debt Securities of $9.6 million and cash of $139.6 million pledged to it as collateral for its derivative instruments. As of December 31, 2016, the Company had Agency RMBS and U.S. Treasuries of $33.0 million and cash of $90.8 million pledged to it as collateral for its derivative instruments. The table below summarizes fair value information about our derivative and other hedging instrument assets and liabilities as of December 31, 2017 and December 31, 2016 (in thousands):
F-16
December 31, 2017 | December 31, 2016 | |||||||||||||||||
Derivative and Other Hedging Instruments - Assets | Consolidated Balance Sheets | Notional | Fair Value | Notional | Fair Value | |||||||||||||
Interest Rate Swaps | Derivative assets, at fair value | $ | 7,475,000 | $ | 120,154 | $ | 6,450,000 | $ | 80,608 | |||||||||
Interest Rate Caps | Derivative assets, at fair value | 2,500,000 | 39,466 | 2,500,000 | 42,532 | |||||||||||||
TBA Derivatives | Derivative assets, at fair value | 25,000 | 9 | 2,417,000 | 19,416 | |||||||||||||
Total derivative assets at fair value | $ | 10,000,000 | $ | 159,629 | $ | 11,367,000 | $ | 142,556 | ||||||||||
Derivative and Other Hedging Instruments - Liabilities | Consolidated Balance Sheets | Notional | Fair Value | Notional | Fair Value | |||||||||||||
Interest Rate Swaps | Derivative liabilities, at fair value | $ | — | $ | — | $ | — | $ | — | |||||||||
Interest Rate Caps | Derivative liabilities, at fair value | — | — | — | — | |||||||||||||
TBA Derivatives | Derivative liabilities, at fair value | 425,000 | (152 | ) | 1,870,000 | (6,051 | ) | |||||||||||
Total derivative liabilities at fair value | $ | 425,000 | $ | (152 | ) | $ | 1,870,000 | $ | (6,051 | ) | ||||||||
The average notional value of the Company's TBA Derivatives was $1.5 billion and $2.5 billion during the year ended December 31, 2017 and 2016, respectively. The average notional value of the Company's swaps and caps during the year ended December 31, 2017 and 2016 was $9.1 billion and $9.5 billion, respectively.
The following table presents information about the net realized and unrealized gain and loss on swaps, swaptions, caps and TBA Derivatives for the years ended December 31, 2017, 2016 and 2015 on the Company's swaps, swaptions, caps and TBA Derivatives (in thousands):
Gain (Loss) on Derivatives | ||||||||||||||
Years Ended December 31, | ||||||||||||||
Derivative Instrument Type | Location of Gain (Loss) on Derivative Instruments | 2017 | 2016 | 2015 | ||||||||||
Interest rate swaps, swaptions and caps | Interest rate hedge expense, net | $ | (29,550 | ) | $ | (55,798 | ) | $ | (100,110 | ) | ||||
Interest rate swaps, caps and TBA Derivatives | Net realized and unrealized gain (loss) on derivative instruments | 57,750 | (11,483 | ) | (54,932 | ) | ||||||||
Interest rate swaps, caps and TBA Derivatives | Net gain (loss) on derivative instruments | $ | 28,200 | $ | (67,281 | ) | $ | (155,042 | ) | |||||
The swap and cap notional was $10.0 billion at December 31, 2017 compared to $9.0 billion at December 31, 2016, and respectively 98.9% and 92.3% of our repo borrowings at December 31, 2017 and December 31, 2016.
Refer to Note 6, Pledged Assets, for details regarding assets pledged under derivative contracts.
5. REPURCHASE AGREEMENTS AND FHLBC ADVANCES
The Company leverages its Debt Securities portfolio primarily through repo borrowings and TBA dollar roll transactions. Each of the Company's repo borrowings bears interest at a rate based on a spread above or below the London Interbank Offered Rate ("LIBOR"). While repo borrowings have historically been the Company's principal source of borrowings, the Company may issue long-term debt (i.e., debt with an initial term greater than one year) to diversify credit sources and to manage interest rate and duration risk.
F-17
Certain information with respect to the Company's repo borrowings outstanding principal at the balance sheet dates is summarized in the table below.
(in thousands) | December 31, 2017 | December 31, 2016 | |||||
Outstanding repurchase agreements | $ | 10,089,917 | $ | 9,691,544 | |||
Interest accrued thereon | $ | 30,108 | $ | 16,170 | |||
Weighted-average borrowing rate | 1.42 | % | 0.89 | % | |||
Weighted-average remaining maturity (in days) | 50.6 | 53.3 | |||||
Fair value of pledged collateral(1) | $ | 10,565,269 | $ | 10,198,641 | |||
__________________
(1) | Collateral for repo borrowings consists of Agency RMBS and U.S. Treasuries. |
The following table presents the remaining contractual maturity of repo borrowings by collateral type as of December 31, 2017 and December 31, 2016 (in thousands):
Remaining contractual maturity | ||||||||||||||||||||
December 31, 2017 | Overnight | Up to 30 days | 30-90 days | Greater than 90 days | Total | |||||||||||||||
Agency RMBS | $ | 272,434 | $ | 3,763,712 | $ | 2,549,717 | $ | 2,482,742 | $ | 9,068,605 | ||||||||||
U.S. Treasuries | — | 1,021,312 | — | — | 1,021,312 | |||||||||||||||
Total | $ | 272,434 | $ | 4,785,024 | $ | 2,549,717 | $ | 2,482,742 | $ | 10,089,917 | ||||||||||
December 31, 2016 | ||||||||||||||||||||
Agency RMBS | $ | — | $ | 4,113,286 | $ | 3,694,937 | $ | 1,883,321 | $ | 9,691,544 | ||||||||||
U.S. Treasuries | — | — | — | — | — | |||||||||||||||
Total | $ | — | $ | 4,113,286 | $ | 3,694,937 | $ | 1,883,321 | $ | 9,691,544 | ||||||||||
At December 31, 2017 and December 31, 2016, our amount at risk with any individual counterparty related to our repo borrowings was less than 2.3% and 2.6% of stockholders' equity. The amount at risk is defined as the excess of the fair value of the securities, including accrued interest and cash, pledged to secure the repurchase agreement, over the amount of the repurchase agreement liability, adjusted for accrued interest.
Prior to the issuance of the Final Rule, pursuant to the FHLBC terms and conditions of membership and applicable credit policies, CYS Insurance was able to obtain FHLBC Advances, secured by eligible collateral, including, but not limited to, residential mortgage-backed securities. As a direct result of the Final Rule, all FHLBC Advances were required to be repaid on or before February 19, 2017. The Company repaid all of its remaining FHLBC Advances prior to September 30, 2016.
6. PLEDGED ASSETS
Our repurchase agreements and derivative contracts require us to fully collateralize our obligations under the agreements based upon our counterparties' collateral requirements and their determination of the fair value of the securities pledged as collateral, which fluctuates with changes in interest rates, credit quality and liquidity conditions within the investment banking, mortgage finance and real estate industries. In addition, obligations under our derivative agreements will typically vary over time based on similar factors as well as the remaining term of the derivative contract. Refer to Note 4, Derivative Instruments, for more details related to the Company's derivative instruments.
Our repurchase agreement and derivative counterparties also apply a "haircut" to our pledged collateral which limits the amount we can borrow against our securities. This haircut reflects the underlying risk of the specific collateral and protects the counterparty against a change in its value. Our agreements do not specify the haircut; rather, haircuts are determined on an individual transaction basis, and typically are between 0% and 7% of the amount borrowed.
Consequently, the use of repurchase agreements and derivative instruments exposes us to credit risk relating to potential losses that could be recognized in the event that our counterparties fail to perform their obligations under such agreements. We minimize this risk by limiting our repurchase agreement and derivative counterparties to major financial institutions with acceptable credit ratings, or to a registered clearinghouse, and we closely monitor our positions with individual counterparties. In the event of a default by a counterparty, we may have difficulty obtaining our assets pledged as collateral to such counterparty and may not receive payments provided for under the terms of our derivative agreements. In the case of centrally cleared instruments, we could be exposed to credit risk if the central clearing agency or a clearing member defaults on
F-18
its respective obligation to perform under the contract. However, we believe that this risk is minimal due to the clearing exchange initial and daily mark-to-market margin requirements, clearinghouse guarantee funds, and other resources that are available in the event of a clearing member default.
Further, each of our International Standard Derivative Association ("ISDA") agreements contains a cross default provision under which a default under certain of our other indebtedness in excess of a certain threshold causes an event of default under the ISDA agreements. Threshold amounts vary by lender. Following an event of default, we could be required to settle our obligations under the agreements. Additionally, under certain of our ISDA master agreements, we could be required to settle our obligations under the agreements if we fail to maintain certain minimum stockholders' equity thresholds or our REIT status or if we fail to comply with limits on our leverage above certain specified levels. As of December 31, 2017, the fair value of additional collateral that could be required to be posted as a result of the credit-risk-related contingent features being triggered was not material to our consolidated financial statements. As of December 31, 2017, our amount at risk with any counterparty related to our repurchase agreements was less than 2.3% of our stockholders' equity, and our amount at risk with any counterparty related to our interest rate swap and cap contracts, excluding centrally cleared swaps, was less than 0.2% of our stockholders' equity. At December 31, 2016, our amount at risk related to our repurchase agreements was less than 2.6% of stockholders' equity, and our amount at risk with any counterparty related to our interest rate swap and cap contracts, excluding centrally cleared swaps, was less than 0.2% of our stockholders' equity.
Our collateral is generally valued on the basis of prices provided by recognized bond market sources agreed to by the parties. Inputs to the models used by pricing sources may include, but are not necessarily limited to, reported trades, executable bid and asked prices, broker quotations, prices or yields of securities with similar characteristics, benchmark curves or information pertaining to the issuer, as well as industry and economic events. Our master repurchase agreements contain mostly standard provisions for the valuation of collateral. These agreements typically provide that both the repurchase seller (the borrower) and the repurchase buyer (the lender) value the collateral on a daily basis. Each party uses a price that it obtains from generally recognized pricing sources, or the most recent closing bid quotation from such a source. If the buyer, or the seller, as the case may be, determines that additional collateral is required, it may call for the delivery of such collateral. Under certain of our repurchase agreements, in limited circumstances, such as when a pricing source is not available, our lenders have the right to determine the value of the collateral we have provided to secure our repo borrowings. In instances where we have agreed to permit our lenders to make a determination of the value of such collateral, such lenders are expected to act reasonably and in good faith in making such valuation determinations.
Assets Pledged to Counterparties
The following tables summarize assets pledged as collateral under repo borrowings and derivative instruments by type, including assets pledged to the Company that were repledged to other counterparties and securities pledged related to securities purchased or sold but not yet settled, as of December 31, 2017 and December 31, 2016 (in thousands):
December 31, 2017 | ||||||||||||||||
Asset Type | Repurchase Agreements | Derivative Instruments* | Forward Settling Trades (TBAs) | Total | ||||||||||||
Agency RMBS - fair value | $ | 9,542,186 | $ | 44,490 | $ | 1,928 | $ | 9,588,604 | ||||||||
U.S. Treasuries - fair value | 1,023,083 | 31,968 | — | 1,055,051 | ||||||||||||
Accrued interest on pledged securities | 27,693 | 165 | 5 | 27,863 | ||||||||||||
Cash | — | — | — | — | ||||||||||||
Total | $ | 10,592,962 | $ | 76,623 | $ | 1,933 | $ | 10,671,518 | ||||||||
December 31, 2016 | ||||||||||||||||
Asset Type | Repurchase Agreements | Derivative Instruments* | Forward Settling Trades (TBAs) | Total | ||||||||||||
Agency RMBS - fair value | $ | 10,197,244 | $ | 33,311 | $ | 2,610 | $ | 10,233,165 | ||||||||
U.S. Treasuries - fair value | 1,398 | 45,730 | — | 47,128 | ||||||||||||
Accrued interest on pledged securities | 27,730 | 87 | 7 | 27,824 | ||||||||||||
Cash | — | 600 | — | 600 | ||||||||||||
Total | $ | 10,226,372 | $ | 79,728 | $ | 2,617 | $ | 10,308,717 | ||||||||
__________________
F-19
* Includes amounts related to TBA Derivatives.
Assets Pledged from Counterparties
As the estimated fair value of our investment securities pledged as collateral increases due to changes in interest rates or other factors, we may require counterparties to return collateral to us, which may be in the form of identical securities, similar securities, or cash. As of December 31, 2017 and December 31, 2016, we also had assets pledged to us as collateral under our repurchase agreements, derivative instruments and forward settling trades summarized in the tables below (in thousands):
December 31, 2017 | ||||||||||||||||
Assets Pledged to CYS | Repurchase Agreements | Derivative Instruments | Forward Settling Trades (TBAs) (1) | Total | ||||||||||||
Agency RMBS - fair value | $ | — | $ | — | $ | — | $ | — | ||||||||
U.S. Treasuries - fair value | — | 9,646 | — | 9,646 | ||||||||||||
Accrued interest on pledged securities | — | 60 | — | 60 | ||||||||||||
Cash | — | 139,614 | — | 139,614 | ||||||||||||
Total | $ | — | $ | 149,320 | $ | — | $ | 149,320 | ||||||||
December 31, 2016 | ||||||||||||||||
Assets Pledged to CYS | Repurchase Agreements and FHLBC Advances | Derivative Instruments | Forward Settling Trades (TBAs) (1) | Total | ||||||||||||
Agency RMBS - fair value | $ | — | $ | 3,016 | $ | 1,293 | $ | 4,309 | ||||||||
U.S. Treasuries - fair value | — | 29,937 | — | 29,937 | ||||||||||||
Accrued interest on pledged securities | — | 1,788 | 4 | 1,792 | ||||||||||||
Cash | — | 90,779 | 724 | 91,503 | ||||||||||||
Total | $ | — | $ | 125,520 | $ | 2,021 | $ | 127,541 | ||||||||
__________________
(1) | Excludes forward settling transactions classified as TBA Derivatives which are included in derivative instruments effective January 1, 2016. |
Cash collateral received is not restricted as to use and is recognized in "Cash and cash equivalents" with a corresponding amount recognized in "Payable for cash received as collateral" in the accompanying Consolidated Balance Sheets.
The Company’s Master Repurchase Agreements ("MRAs"), Master Securities Forward Transaction Agreements ("MSFTAs") and ISDAs, together with MRAs, the “Master Agreements”) generally provide (unless specified otherwise) that the Company may sell, pledge, rehypothecate, assign, invest, use, commingle, dispose of, or otherwise use in its business any posted collateral it holds, free from any claim or right of any nature whatsoever of the counterparty. MSFTAs govern the considerations and factors surrounding the settlement of certain forward settling transactions, TBAs and secured borrowing transactions by and between the Company and our counterparties. As of December 31, 2017, $9.6 million of assets were pledged to the Company under the Master Agreements, of which $8.1 million were pledged by the Company to other counterparties at December 31, 2017. As of December 31, 2016, $34.2 million of assets were pledged to the Company under the Master Agreements, of which $2.7 million were pledged by the Company to other counterparties. Since title to these assets remain with the counterparty under the Master Agreements, none of these assets are reflected in the accompanying Consolidated Balance Sheets.
Offsetting Assets and Liabilities
Certain of our repo borrowings and derivative transactions are governed by underlying agreements that generally provide for a right of offset under Master Netting Agreements ("MNAs") (or similar agreements), including in the event of default or in the event of bankruptcy of either party to the transactions. Under GAAP, if the Company has a contractual right of offset, the Company may offset the related asset and liability and report the net amount in the accompanying Consolidated Balance Sheets. However, the Company reports amounts subject to its MRAs and ISDAs in the accompanying Consolidated Balance Sheets on a gross basis without regard for such rights of offset.
F-20
At December 31, 2017 and December 31, 2016, the Company's derivative assets and liabilities (by type) are as follows (in thousands):
December 31, 2017 | Assets | Liabilities | ||||||
Interest rate swap contracts | $ | 120,154 | $ | — | ||||
Interest rate cap contracts | 39,466 | — | ||||||
TBA derivatives | 9 | 152 | ||||||
Total derivative assets and liabilities | 159,629 | 152 | ||||||
Derivatives not subject to a Master Netting Agreement | 119,230 | — | ||||||
Total assets and liabilities subject to a Master Netting Agreement | $ | 40,399 | $ | 152 | ||||
December 31, 2016 | Assets | Liabilities | ||||||
Interest rate swap contracts | $ | 80,608 | $ | — | ||||
Interest rate cap contracts | 42,532 | — | ||||||
TBA derivatives | 19,416 | 6,051 | ||||||
Total derivative assets and liabilities | 142,556 | 6,051 | ||||||
Derivatives not subject to a Master Netting Agreement | 75,033 | — | ||||||
Total assets and liabilities subject to a Master Netting Agreement | $ | 67,523 | $ | 6,051 | ||||
Below is a summary of the Company's assets subject to offsetting provisions (in thousands):
Gross Amounts Not Offset in the Consolidated Balance Sheet | ||||||||||||||||||
As of | Description | Amounts of Assets Presented in the Consolidated Balance Sheets | Instruments Available for Offset | Collateral Received(1) | Net Amount(2) | |||||||||||||
December 31, 2017 | Derivative assets | $ | 40,399 | $ | — | $ | 38,568 | $ | 1,831 | |||||||||
December 31, 2016 | Derivative assets | 67,523 | 3,145 | 49,801 | 14,577 | |||||||||||||
_________________
(1) | Collateral consists of Agency RMBS, U.S. Treasuries and Cash and cash equivalents. Excess collateral received is not shown for financial reporting purposes. |
(2) | Net amount represents the amount receivable (in the case of assets) and payable (in the case of liabilities) to the counterparty in the event of default. |
Below is a summary of the Company's liabilities subject to offsetting provisions (in thousands):
Gross Amounts Not Offset in the Consolidated Balance Sheet | ||||||||||||||||||
As of | Description | Amounts of Liabilities Presented in the Consolidated Balance Sheet | Instruments Available for Offset | Collateral Pledged(1) | Net Amount(2) | |||||||||||||
December 31, 2017 | Derivative liabilities | $ | 152 | $ | — | $ | 152 | $ | — | |||||||||
December 31, 2017 | Repurchase agreements | 10,089,917 | — | 10,089,917 | — | |||||||||||||
December 31, 2016 | Derivative liabilities | 6,051 | 3,145 | 2,906 | — | |||||||||||||
December 31, 2016 | Repurchase agreements | 9,691,544 | — | 9,691,544 | — | |||||||||||||
_________________
(1) | Collateral consists of Agency RMBS, U.S. Treasuries and Cash and cash equivalents. Excess collateral pledged is not shown for financial reporting purposes. |
(2) | Net amount represents the amount receivable from (in the case of assets) and payable to (in the case of liabilities) the counterparty in the event of default. |
F-21
7. FAIR VALUE MEASUREMENTS
The Company's valuation techniques are based on observable and unobservable inputs. ASC 820 establishes a fair value hierarchy that prioritizes and ranks the level of market price observability used in measuring financial instruments. Market price observability is affected by a number of factors, including the type of financial instrument, the characteristics specific to the financial instrument, and the state of the marketplace, including the existence and transparency of transactions between market participants. Financial instruments with readily available quoted prices in active markets generally will have a higher degree of market price observability and a lesser degree of judgment used in measuring fair value.
Financial instruments measured and reported at fair value are classified and disclosed based on the observability of inputs used in the determination, as follows:
Level 1: Generally includes only unadjusted quoted prices that are available in active markets for identical financial instruments as of the reporting date. | |||
Level 2: Pricing inputs include quoted prices in active markets for similar instruments, quoted prices in less active or inactive markets for identical or similar instruments where multiple price quotes can be obtained, and other observable inputs, such as interest rates and yield curves. | |||
Level 3: Pricing inputs are unobservable for the financial instruments and include situations where there is little, if any, market activity for the financial instrument. These inputs require significant judgment or estimation by management when determining fair value and generally represent anything that does not meet the criteria of Levels 1 and 2. | |||
The estimated value of each asset reported at fair value using Level 3 inputs is approved by an internal committee composed of members of senior management, including our Chief Executive Officer, Chief Financial Officer, and other senior officers.
Agency RMBS, and U.S. Treasuries are generally valued based on prices provided by third party services, as derived from such services' pricing models. Inputs to the models may include, but are not limited to, reported trades, executable bid and asked prices, broker quotations, prices or yields of securities with similar characteristics, prepayment rates, benchmark curves or information pertaining to the issuer, as well as industry and economic events. The pricing services may also use a matrix approach, which considers information regarding securities with similar characteristics to determine the valuation for a security.
All valuations we receive from third-party pricing services or broker quotes are non-binding. The pricing committee reviews all prices. To date, the Company has not adjusted any of the prices received from third party pricing services or brokers. Our pricing review includes comparisons of similar market transactions, alternative third party pricing services and broker quotes, or comparisons to a pricing model. To ensure proper classification within the fair value hierarchy in ASC 820, the Company reviews the third party pricing services' methodologies periodically to understand whether observable or unobservable inputs are being used.
We generally value swaps, swaptions and caps using prices provided by broker quotations. Such broker quotations are based on the present value of fixed and projected floating rate cash flows over the term of the swap contract. Future cash flows are discounted to present value using swap rates provided by electronic data services or by brokers.
Excluded from the tables below are short-term financial instruments carried in our consolidated financial statements at cost basis, which is deemed to approximate fair value, due primarily to the short duration of these instruments, including cash and cash equivalents, receivables, payables, repo borrowings and FHLBC Advances with initial terms of one year or less.
"Other investments" is comprised of our investment in FHLBC stock and our net investment in a real estate asset at fair value, inclusive of the corresponding $3.7 million and $3.8 million of mortgage debt at December 31, 2017 and December 31, 2016, respectively. Investment in real estate is considered to be a Level 3 asset to which we periodically apply valuation techniques and/or impairment analysis.
The following tables summarize the Company's assets and liabilities that are measured at fair value on a recurring basis as of December 31, 2017 and December 31, 2016 (in thousands):
F-22
December 31, 2017 | Fair Value Measurements Using | ||||||||||||||
Level 1 | Level 2 | Level 3 | Total | ||||||||||||
Assets | |||||||||||||||
Agency RMBS | $ | — | $ | 11,587,720 | $ | — | $ | 11,587,720 | |||||||
U.S. Treasuries | 1,046,934 | — | — | 1,046,934 | |||||||||||
Derivative assets | — | 159,629 | — | 159,629 | |||||||||||
Other investments | — | — | 9,763 | 9,763 | |||||||||||
Total | $ | 1,046,934 | $ | 11,747,349 | $ | 9,763 | $ | 12,804,046 | |||||||
Liabilities | |||||||||||||||
Derivative liabilities | — | 152 | — | 152 | |||||||||||
$ | — | $ | 152 | $ | — | $ | 152 | ||||||||
December 31, 2016 | Fair Value Measurements Using | ||||||||||||||
Level 1 | Level 2 | Level 3 | Total | ||||||||||||
Assets | |||||||||||||||
Agency RMBS | $ | — | $ | 12,599,045 | $ | — | $ | 12,599,045 | |||||||
U.S. Treasuries | 49,686 | — | — | 49,686 | |||||||||||
Derivative assets | — | 142,556 | — | 142,556 | |||||||||||
Other investments | — | — | 8,025 | 8,025 | |||||||||||
Total | $ | 49,686 | $ | 12,741,601 | $ | 8,025 | $ | 12,799,312 | |||||||
Liabilities | |||||||||||||||
Derivative liabilities | — | 6,051 | — | 6,051 | |||||||||||
$ | — | $ | 6,051 | $ | — | $ | 6,051 | ||||||||
The table below presents a reconciliation of changes in other investments classified as Level 3 in the Company's consolidated financial statements for the years ended December 31, 2017 and 2016:
Level 3 Fair Value Reconciliation
(In thousands) | Years Ended December 31, | ||||||
Other investments | 2017 | 2016 | |||||
Beginning balance Level 3 assets | $ | 8,025 | $ | 8,025 | |||
Cash payments recorded as a reduction of cost basis | — | — | |||||
Change in net unrealized gain (loss) | 1,738 | — | |||||
Gross purchases | — | — | |||||
Gross sales | — | — | |||||
Net gain (loss) on sales | — | — | |||||
Transfers into (out of) Level 3 | — | — | |||||
Ending balance Level 3 assets | $ | 9,763 | $ | 8,025 | |||
The fair value of our net investment in a real estate asset is primarily derived internally, and is based on inputs observed from sales transactions of similar assets. We also rely on available industry information about capitalization rates and expected trends in rents and occupancy in determining estimates of the fair value of real estate. The significant unobservable input used in the fair value measurement of our net investment in real estate is the capitalization rate, which the Company estimated to be between 4.2% and 4.9% at December 31, 2017 and December 31, 2016.
8. STOCKHOLDERS' EQUITY
The Company has authorized 500,000,000 shares of common stock having a par value of $0.01 per share. As of December 31, 2017 and 2016, the Company had issued and outstanding 155,010,011 and 151,434,917 shares of common stock, respectively.
The Company has authorized 50,000,000 shares of preferred stock having a par value of $0.01 per share. As of December 31, 2017 and 2016, 3,000,000 shares of 7.75% Series A Cumulative Redeemable Preferred Stock ($25.00 liquidation preference) were issued and outstanding. As of December 31, 2017 and 2016, 8,000,000 shares of 7.50% Series B Cumulative
F-23
Redeemable Preferred Stock ($25.00 liquidation preference) were issued and outstanding. The Series A Preferred Stock and Series B Preferred Stock will not be redeemable before August 3, 2017 and April 30, 2018, respectively, except under circumstances where it is necessary to preserve the Company's qualification as a REIT, for federal income tax purposes or the occurrence of a change of control. Under certain circumstances upon a change of control, our Series A and Series B Preferred Stock are convertible to shares of our common stock. On or after August 3, 2017 and April 30, 2018, respectively, the Company may, at its option, redeem any or all of the shares of the Series A Preferred Stock and Series B Preferred Stock, respectively, at $25.00 per share plus any accumulated and unpaid dividends to, but not including, the respective redemption date. The Series A Preferred Stock and Series B Preferred Stock have no stated maturity, and are not subject to any sinking fund or mandatory redemption.
The Company's common stock transactions during the years ended December 31, 2017 and 2016 are as follows (in thousands):
2017 | 2016 | ||||||||||||
Common stock | Shares | Amount | Shares | Amount | |||||||||
Common shares sold in public offerings or issued as restricted common stock | 3,620 | $ | 27,786 | 398 | $ | 6 | |||||||
Shares repurchased or canceled | (45 | ) | (347 | ) | (703 | ) | (5,516 | ) | |||||
Net increase (decrease) | 3,575 | $ | 27,439 | (305 | ) | $ | (5,510 | ) | |||||
Dividend Reinvestment and Direct Stock Purchase Plan ("DRSPP")
On September 15, 2017, the Company renewed its Dividend Reinvestment and Direct Stock Purchase Plan ("DRSPP"), whereby stockholders may reinvest cash dividends and purchase up to 10,000,000 shares of our common stock. Stockholders may also make optional cash purchases of shares of common stock subject to certain limitations detailed in the respective plan prospectus. For the year ended December 31, 2017 the Company issued 294,650 shares at an average sales price of $8.77 per share for net proceeds of approximately $2.6 million, after deducting placement fees and expenses. For the year ended December 31, 2016 the Company issued 797 shares at an average sales price of $7.66 per share, raising net proceeds of approximately $6 thousand, after deducting placement fees and expenses. As of December 31, 2017 and 2016, there were approximately 9.7 million and 4.1 million shares, respectively, available for issuance under the DRSPP.
Restricted Common Stock Awards
Refer to Note 10, Share-based Compensation, for a summary of restricted common stock granted to certain of the Company's directors, officers and employees for the years ended December 31, 2017, 2016 and 2015.
Equity Placement Program ("EPP")
Effective May 15, 2014, the Company terminated the Equity Distribution Agreement by and between the Company and JMP Securities LLC ("JMP"), dated as of June 7, 2011 (the "JMP Agreement"), in connection with the expiration of the Company's prior shelf registration statement on Form S-3. Under the JMP Agreement, the Company could offer and sell, from time to time, up to 15.0 million shares of the Company's common stock through an "at the market" offering program with JMP.
On August 4, 2017, the Company entered into an equity distribution agreement (the "Equity Distribution Agreement") with JMP Securities LLC whereby the Company may, from time to time, publicly offer and sell up to 20,000,000 shares of the Company’s common stock through at-the-market transactions and/or privately negotiated transactions. For the year ended December 31, 2017, the Company issued 2,951,491 shares under the Equity Distribution Agreement at an average sales price of $8.76 per share raising approximately $25.5 million of net proceeds after deducting the placement fees and expenses. As of December 31, 2017, 17,048,509 shares of common stock remained available for issuance to be sold under the Equity Distribution Agreement.
Share Repurchase Program
On November 15, 2012, the Company announced that its Board of Directors authorized the repurchase of shares of the Company's common stock having an aggregate value of up to $250 million. Pursuant to this program, through July 20, 2014, the Company repurchased approximately $115.7 million in aggregate value of its shares of common stock on the open market. On July 21, 2014, the Company announced that its Board of Directors authorized the repurchase of shares of the Company's common stock having an aggregate value of up to $250 million, which included approximately $134.3 million available for repurchase under the November 2012 authorization. Subsequently, during 2014 we repurchased 172,549 shares at a weighted-average purchase price of $8.88 per share, for an aggregate purchase price of approximately $1.5 million. For the year ended December 31, 2015, the Company repurchased 10,559,493 shares at a weighted-average purchase price of $8.28 per share for an aggregate purchase price of approximately $87.7 million.
F-24
For the year ended December 31, 2016, the Company repurchased 673,166 shares with a weighted-average purchase price of $7.85 per share for an aggregate of approximately $5.3 million. Accordingly, the Company was authorized to repurchase shares of its common stock approximating $155.5 million as of December 31, 2016.
For the year ended December 31, 2017, we did not repurchase any shares of the Company's common stock. Accordingly, the Company was authorized to repurchase shares of its common stock approximating $155.5 million as of December 31, 2017.
9. EARNINGS PER SHARE
Components of the computation of basic and diluted earnings per share ("EPS") under the two-class method were as follows (in thousands, except per share numbers):
Years Ended December 31, | |||||||||||
2017 | 2016 | 2015 | |||||||||
Net income (loss) | $ | 181,261 | $ | 16,391 | $ | (4,765 | ) | ||||
Less dividends on preferred shares | (20,812 | ) | (20,812 | ) | (20,813 | ) | |||||
Net income (loss) available to common stockholders | 160,449 | (4,421 | ) | (25,578 | ) | ||||||
Less dividends paid: | |||||||||||
Common shares | (152,432 | ) | (151,918 | ) | (169,896 | ) | |||||
Nonvested shares | (927 | ) | (1,042 | ) | (1,157 | ) | |||||
Undistributed earnings (loss) | $ | 7,090 | $ | (157,381 | ) | $ | (196,631 | ) | |||
Basic weighted-average shares outstanding: | |||||||||||
Common shares | 151,757 | 150,494 | 155,659 | ||||||||
Basic earnings (loss) per common share: | |||||||||||
Distributed earnings | $ | 1.00 | $ | 1.01 | $ | 1.09 | |||||
Undistributed earnings | 0.05 | (1.05 | ) | (1.26 | ) | ||||||
Basic earnings (loss) per common share | $ | 1.05 | $ | (0.04 | ) | $ | (0.17 | ) | |||
Diluted weighted-average shares outstanding: | |||||||||||
Common shares | 151,757 | 150,494 | 155,659 | ||||||||
Net effect of dilutive warrants (1) | — | — | — | ||||||||
151,757 | 150,494 | 155,659 | |||||||||
Diluted earnings (loss) per common share: | |||||||||||
Distributed earnings | $ | 1.00 | $ | 1.01 | $ | 1.09 | |||||
Undistributed earnings | 0.05 | (1.05 | ) | (1.26 | ) | ||||||
Diluted earnings (loss) per common share | $ | 1.05 | $ | (0.04 | ) | $ | (0.17 | ) | |||
__________________
(1) | For the years ended December 31, 2017, 2016 and 2015, the Company had an aggregate of zero, zero and 131,088 stock options outstanding, respectively, with a weighted-average exercise price of $30.00 that were not included in the calculation of EPS as they were out of the money. |
10. SHARE-BASED COMPENSATION
The Company adopted Incentive Compensation Plans in 2017 ("2017 Plan"), 2016 ("2016 Plan") and 2015 ("2015 Plan") (collectively, the "Bonus Plans"). Pursuant to the Bonus Plans the Company pays discretionary bonus awards ("Bonus Awards") to eligible employees. The amount of each employee's Bonus Award is calculated at the discretion of the Compensation Committee of the Board of Directors (the "Compensation Committee") after consideration of the Company's performance and the employee's bonus target and performance for the applicable fiscal year. The Compensation Committee has discretion to determine the total amount to be awarded, and, subject to certain restrictions under the Bonus Plans, it also has discretion to determine the portion of each award that will be paid in cash versus shares of restricted common stock of the Company.
On May 10, 2013, the Company's stockholders approved the 2013 Equity Incentive Plan (the "Equity Incentive Plan") that provides for the grant of non-qualified common stock options, stock appreciation rights, restricted common stock and other share-based awards. As of December 31, 2017, the Company has only granted restricted common stock pursuant to the Equity Inventive Plan. The Compensation Committee administers the Equity Incentive Plan. Awards under the Equity Incentive Plan
F-25
may be granted to the Company's directors, executive officers and employees and other service providers. The Equity Incentive Plan authorizes a total of 8,500,000 shares that may be used to satisfy awards under the plan. As of December 31, 2017 and 2016, the remaining shares to be granted under the Equity Incentive Plan were 6,861,426 and 7,208,995, respectively.
Effective January 1, 2014, all restricted common stock granted to non-employee directors vests at the end of the quarter in which it is granted.
For the year ended December 31, 2017, the Compensation Committee elected to award the Company's employees an aggregate approximate $6.8 million in Bonus Awards under the 2017 Plan. Approximately $4.0 million of this amount was accrued as of December 31, 2017. The remaining $2.8 million will be paid in shares of restricted common stock to be granted in 2018, with $2.6 million and $0.2 million vesting over a five-year and three-year period, respectively.
For the year ended December 31, 2016, the Compensation Committee elected to award the Company's employees an aggregate of $5.7 million in Bonus Awards under the 2016 Plan. Approximately $3.4 million of the aggregate Bonus Award amount was accrued during the fiscal year ended December 31, 2016. The remaining $2.3 million was paid in shares of restricted common stock granted in 2017, with $2.1 million and $0.2 million vesting over a five-year and three-year period, respectively.
For the year ended December 31, 2015, the Compensation Committee elected to award the Company's employees an aggregate of $4.7 million in Bonus Awards under the 2015 Plan. Approximately $2.7 million of the aggregate Bonus Award amount was accrued during the fiscal year ended December 31, 2015. The remaining $2.0 million was paid in shares of restricted common stock granted in 2016, with $1.7 million and $0.3 million vesting over a five-year and three-year period, respectively.
The following table summarizes restricted common stock transactions for the years ended December 31, 2017, 2016 and 2015:
Years ended December 31, 2015, 2016 and 2017 | Officers and Employees(1) | Directors | Total | ||||||
Nonvested Restricted Common Stock as of December 31, 2014 | 820,799 | 19,302 | 840,101 | ||||||
Granted (Weighted-average grant date fair value $8.66) | 417,415 | 86,081 | 503,496 | ||||||
Canceled/Forfeited | (21,800 | ) | — | (21,800 | ) | ||||
Vested | (240,685 | ) | (82,623 | ) | (323,308 | ) | |||
Nonvested Restricted Common Stock as of December 31, 2015 | 975,729 | 22,760 | 998,489 | ||||||
Granted (Weighted-average grant date fair value $7.64) | 312,853 | 84,600 | 397,453 | ||||||
Canceled/Forfeited | — | — | — | ||||||
Vested | (292,908 | ) | (87,936 | ) | (380,844 | ) | |||
Nonvested Restricted Common Stock as of December 31, 2016 | 995,674 | 19,424 | 1,015,098 | ||||||
Granted (Weighted-average grant date fair value $7.88) | 295,508 | 77,966 | 373,474 | ||||||
Canceled/Forfeited | — | — | — | ||||||
Vested | (383,278 | ) | (80,261 | ) | (463,539 | ) | |||
Nonvested Restricted Common Stock as of December 31, 2017 | 907,904 | 17,129 | 925,033 | ||||||
______________
(1) | Include grants to the Company's executive officers and certain officers and employees of its external manager prior to September 1, 2011. |
Unrecognized compensation cost related to non-vested restricted common stock granted as of December 31, 2017 and 2016 was $5.1 million and $6.2 million, respectively, assuming no forfeitures. The total fair value of restricted common stock awards vested during the years ended December 31, 2017, 2016 and 2015 were $3.6 million, $2.9 million and $2.7 million, respectively, based upon the fair market value of the Company's common stock on the grant date.
There were no common stock options granted during the years ended December 31, 2017, 2016 and 2015. As of December 31, 2017 and December 31, 2016 there were no common stock options outstanding. As of December 31, 2015 there were 131,088 options outstanding, all of which were vested and exercisable, with a weighted-average exercise price of $30.00, an expiration date of February 2016 and a fair value of $0.00 per option.
The components of share-based compensation expense for each period were as follows (in thousands):
F-26
Year ended December 31, | ||||||||||||
2017 | 2016 | 2015 | ||||||||||
Restricted shares granted to officers and employees(1) | $ | 3,364 | $ | 3,314 | $ | 3,320 | ||||||
Restricted shares granted to certain directors | 635 | 681 | 701 | |||||||||
Total share-based compensation expense | $ | 3,999 | $ | 3,995 | $ | 4,021 | ||||||
_________
(1) | Includes grants to certain officers and employees of the Company's external manager prior to September 1, 2011. |
11. INCOME TAXES
The Company has elected to be taxed as a REIT under Section 856 of the Code and intends to continue to comply with the provisions of the Code. As a REIT, the Company generally is not subject to federal or state income tax. To maintain its qualification as a REIT, the Company must distribute at least 90% of its REIT taxable income to its stockholders each year and meet certain other tests relating to assets and income. If the Company fails to qualify as a REIT in any taxable year, the Company will be subject to federal income tax on its taxable income at regular corporate rates. The Company may also be subject to certain state and local taxes. Under certain circumstances, even though the Company qualifies as a REIT, federal income and excise taxes may be due on its undistributed taxable income. Except as described below, no provision for income taxes has been provided in the accompanying financial statements because the Company, as a REIT, is not subject to federal or state taxation because it has paid or will pay dividends in amounts that exceed at least 90% of its current year taxable income.
Book to tax differences primarily relate to amortization of realized losses on the termination of swap contracts, share- based compensation expense, and unrealized gain (loss) on investments and interest rate swaps, swaptions and caps.
The per share tax character of the common, Series A Preferred Stock and Series B Preferred Stock distributions declared to stockholders in 2017 of $1.00, $1.9375 and $1.875, respectively, is estimated to be $0.760, $1.9375 and $1.875 ordinary income, respectively, and $0.240 return of capital to the Company's common stockholders.
The estimated federal tax cost and the tax basis components of distributable earnings were as follows (in thousands):
December 31, 2017 | ||||
Cost of investments | $ | 13,104,169 | ||
Gross gain | $ | 37,709 | ||
Gross loss | (36,314 | ) | ||
Net unrealized gain (loss) | $ | 1,395 | ||
Undistributed ordinary income | $ | — | ||
Capital loss carryforwards | $ | 559,282 | ||
As of December 31, 2017, the Company's estimated capital loss carryforwards available to offset future realized gains are subject to current and future limitations in accordance with Code section 382 and expire as follows (in thousands):
December 31, 2018 | 456,259 | |||
December 31, 2021 | 9,527 | |||
December 31, 2022 | 93,496 | |||
Total | $ | 559,282 | ||
As of December 31, 2017 and 2016, the Company had no undistributed taxable income. Tax years from 2014 through 2017 remain open to examination by U.S. federal, state and local, or non-U.S. tax jurisdictions. During the year ended December 31, 2016, the Company recorded a $1.7 million non-recurring charge related to a prior period tax liability, which is recorded in General, administrative and other expenses in the Consolidated Statements of Operations, and was paid during 2017. No other income tax provision was recorded for the Company's open tax years.
12. COMMITMENTS AND CONTINGENCIES
The Company enters into certain agreements that contain a variety of indemnifications, principally with broker-dealers. As of December 31, 2017 and December 31, 2016, no claims have been asserted against the Company under these indemnification agreements. Accordingly, the Company has no liabilities recorded for these agreements as of December 31, 2017 and December 31, 2016.
F-27
The Company occupied leased office space for which the term expired on June 30, 2016. The rental expense for the year ended December 31, 2017, 2016 and 2015 was $0.5 million, $0.5 million and $0.3 million, respectively. In September 2015, the Company entered into a new lease agreement with a commencement date of January 1, 2016, and an estimated rent commencement date of July 1, 2016 (the "New Lease"). The New Lease has an initial term of 7 years from the rent commencement date, and one five-year extension option. The Company's leases have been classified as operating leases. The Company's aggregate future minimum lease payments total approximately $2.1 million. The following table details the Company's operating lease payments (in thousands):
Years Ending December 31, | Lease Commitments | |||
2018 | 363 | |||
2019 | 373 | |||
2020 | 383 | |||
2021 | 393 | |||
2022 | 403 | |||
Thereafter | 203 | |||
$ | 2,118 | |||
13. FINANCIAL INSTRUMENTS WITH OFF-BALANCE SHEET RISK OR CONCENTRATIONS OF CREDIT RISK
We may seek to obtain other sources of financing depending on market conditions. We may finance the acquisition of Agency RMBS by entering into TBA dollar roll transactions in which we would sell a TBA contract for current month settlement and simultaneously purchase a similar TBA contract for a forward settlement date. Prior to the forward settlement date, we may choose to roll the position out to a later date by entering into an offsetting TBA position, net settling the paired-off positions for cash, and simultaneously entering into a similar TBA contract for a later settlement date. In such transactions, the TBA contract purchased for a forward settlement date is priced at a discount to the TBA contract sold for settlement/pair off in the current month.
The Company is subject to credit risk associated with counterparty nonperformance on repurchase agreements. The Company's exposure to credit risk associated with counterparty nonperformance on repurchase agreements is limited to the difference between the borrowings under repurchase agreements plus any accrued interest, minus the fair value of collateral pledged plus any accrued interest. Counterparty nonperformance on these transactions could have a material adverse effect on the Company's financial condition.
The Company's investments are primarily concentrated in securities that pass through collections of principal and interest from underlying mortgages, and there is a risk that some borrowers on the underlying mortgages will default. Therefore, mortgage-backed securities may bear some exposure to credit losses. However, the Company manages credit risk by primarily holding securities that are guaranteed by government (or government-sponsored) agencies.
The Company enters into derivative transactions with counterparties to hedge its interest rate exposure. The notional amounts of the swap, swaption and cap contracts do not represent the Company's risk of loss due to counterparty nonperformance. The Company's exposure to credit risk associated with counterparty nonperformance on swap, swaption or cap contracts is limited to the difference between the fair value of the swap, swaption or cap, plus any accrued interest, minus the fair value of collateral pledged plus any accrued interest. Our swap agreements are privately negotiated in the OTC market, with swap agreements entered into subsequent to May 2013 subject to central clearing through a registered commodities exchange ("centrally cleared swaps"). In the case of centrally cleared swaps, we could be exposed to credit risk if the central clearing exchange or clearing member defaults on its respective obligation to perform under the contract. However, we believe the risk is minimal due to the clearing exchanges' initial and daily mark-to-market margin requirements and guarantee funds and other resources that are available in the event of a clearing member default.
The Company is subject to interest rate risk. Generally, the value of fixed income securities will change inversely with changes in interest rates. As interest rates rise, the market value of fixed income securities tends to decrease. Conversely, as interest rates fall, the market value of fixed income securities tends to increase.
F-28
14. SUMMARY OF QUARTERLY RESULTS OF OPERATIONS (UNAUDITED)
Quarter Ended | ||||||||||||||||
(in thousands except per share numbers) | December 31, 2017 | September 30, 2017 | June 30, 2017 | March 31, 2017 | ||||||||||||
Total interest income | $ | 81,421 | $ | 78,961 | $ | 77,088 | $ | 73,313 | ||||||||
Total interest expense | 35,242 | 31,971 | 26,182 | 21,221 | ||||||||||||
Net interest income | 46,179 | 46,990 | 50,906 | 52,092 | ||||||||||||
Other income (loss): | ||||||||||||||||
Net realized gain (loss) on investments | (23,647 | ) | (5,215 | ) | (19,831 | ) | (66,044 | ) | ||||||||
Net unrealized gain (loss) on investments | (56,651 | ) | 36,337 | 51,299 | 63,478 | |||||||||||
Other income | 39 | 38 | 39 | 47 | ||||||||||||
Net realized and unrealized gain (loss) on investments, FHLBC Advances and other income | (80,259 | ) | 31,160 | 31,507 | (2,519 | ) | ||||||||||
Interest rate hedge expense, net | (5,841 | ) | (6,948 | ) | (8,434 | ) | (8,327 | ) | ||||||||
Net realized and unrealized gain (loss) on derivative instruments | 54,969 | 22,117 | (18,324 | ) | (1,012 | ) | ||||||||||
Net gain (loss) on derivative instruments | $ | 49,128 | $ | 15,169 | $ | (26,758 | ) | $ | (9,339 | ) | ||||||
Total other income (loss) | $ | (31,131 | ) | $ | 46,329 | $ | 4,749 | $ | (11,858 | ) | ||||||
Total expenses | 6,217 | 5,134 | 5,430 | 6,214 | ||||||||||||
Net income (loss) | 8,831 | 88,185 | 50,225 | 34,020 | ||||||||||||
Dividends on preferred stock | (5,203 | ) | (5,203 | ) | (5,203 | ) | (5,203 | ) | ||||||||
Net income (loss) available to common stockholders | $ | 3,628 | $ | 82,982 | $ | 45,022 | $ | 28,817 | ||||||||
Net income (loss) per common share basic & diluted | $ | 0.02 | $ | 0.54 | $ | 0.30 | $ | 0.19 | ||||||||
Quarter Ended | ||||||||||||||||
(in thousands except per share numbers) | December 31, 2016 | September 30, 2016 | June 30, 2016 | March 31, 2016 | ||||||||||||
Total interest income | $ | 68,568 | $ | 69,661 | $ | 74,857 | $ | 81,451 | ||||||||
Total interest expense | 20,168 | 17,479 | 18,687 | 17,945 | ||||||||||||
Net interest income | 48,400 | 52,182 | 56,170 | 63,506 | ||||||||||||
Other income (loss): | ||||||||||||||||
Net realized gain (loss) on investments | (36,253 | ) | 18,155 | 36,359 | 1,202 | |||||||||||
Net unrealized gain (loss) on investments | (287,161 | ) | (36,540 | ) | 28,915 | 162,286 | ||||||||||
Net unrealized gain (loss) on FHLBC Advances | — | — | (448 | ) | (851 | ) | ||||||||||
Other income | 203 | 308 | 387 | 463 | ||||||||||||
Net realized and unrealized gain (loss) on derivative instruments | $ | (323,211 | ) | $ | (18,077 | ) | $ | 65,213 | $ | 163,100 | ||||||
Interest rate hedge expense, net | (10,128 | ) | (12,493 | ) | (14,779 | ) | (18,398 | ) | ||||||||
Net realized and unrealized gain (loss) on derivative instruments | 109,951 | 63,625 | (44,535 | ) | (140,524 | ) | ||||||||||
Net gain (loss) on derivative instruments | $ | 99,823 | $ | 51,132 | $ | (59,314 | ) | $ | (158,922 | ) | ||||||
Total other income (loss) | $ | (223,388 | ) | $ | 33,055 | $ | 5,899 | $ | 4,178 | |||||||
Total expenses | 5,172 | 6,227 | 5,859 | 6,353 | ||||||||||||
F-29
Net income (loss) | (180,160 | ) | 79,010 | 56,210 | 61,331 | |||||||||||
Dividends on preferred stock | (5,203 | ) | (5,203 | ) | (5,203 | ) | (5,203 | ) | ||||||||
Net income (loss) available to common stockholders | $ | (185,363 | ) | $ | 73,807 | $ | 51,007 | $ | 56,128 | |||||||
Net income (loss) per common share basic & diluted | $ | (1.23 | ) | $ | 0.49 | $ | 0.34 | $ | 0.37 | |||||||
15. SUBSEQUENT EVENTS
The Company has evaluated subsequent events through February 15, 2018, the date these financial statements were issued, and determined that there have not been any events that have occurred from the date of the financial statements through February 15, 2018 that would require adjustments to or disclosures in the consolidated financial statements.
F-30
SIGNATURES
Pursuant to the requirements of the Securities Exchange Act of 1934, the registrant has duly caused this report to be signed on its behalf by the undersigned thereunto duly authorized.
CYS INVESTMENTS, INC. | ||
Dated: February 15, 2018 | BY: | /s/ KEVIN E. GRANT |
Kevin E. Grant | ||
Chairman of the Board and Chief Executive Officer | ||
Pursuant to the requirements of the Securities Exchange Act of 1934, this report has been signed below by the following persons on behalf of the registrant and in the capacities and dates indicated.
Signature | Title | Date | ||
/s/ KEVIN E. GRANT | Chief Executive Officer, President; Director; Chairman of the Board (Principal Executive Officer) | February 15, 2018 | ||
Kevin E. Grant | ||||
/s/ JACK DECICCO | Chief Financial Officer and Treasurer (Principal Financial and Accounting Officer) | February 15, 2018 | ||
Jack DeCicco, CPA | ||||
/s/ TANYA S. BEDER | Director | February 15, 2018 | ||
Tanya S. Beder | ||||
/s/ KAREN HAMMOND | Director | February 15, 2018 | ||
Karen Hammond | ||||
/s/ STEPHEN P. JONAS | Director | February 15, 2018 | ||
Stephen P. Jonas | ||||
/s/ RAYMOND A. REDLINGSHAFER | Director | February 15, 2018 | ||
Raymond A. Redlingshafer | ||||
/s/ DALE A. REISS | Director | February 15, 2018 | ||
Dale A. Reiss | ||||
/s/ JAMES A. STERN | Director | February 15, 2018 | ||
James A. Stern | ||||
/s/ DAVID A. TYSON, PHD | Director | February 15, 2018 | ||
David A. Tyson, PhD | ||||
F-31