Attached files
Table of Contents
UNITED STATES
SECURITIES AND EXCHANGE COMMISSION
Washington, D.C. 20549
FORM 10-Q
| x | QUARTERLY REPORT PURSUANT TO SECTION 13 OR 15(d) OF THE SECURITIES EXCHANGE ACT OF 1934 |
June 30, 2011 For the quarterly period ended June 30, 2011
OR
| ¨ | TRANSITION REPORT PURSUANT TO SECTION 13 OR 15(d) OF THE SECURITIES EXCHANGE ACT OF 1934 |
For the transition period from to .
Commission file number 001-33740

Cypress Sharpridge Investments, Inc.
(Exact name of registrant as specified in its charter)
| Maryland | 20-4072657 | |
| (State or other jurisdiction of incorporation or organization) |
(IRS Employer Identification No.) | |
| 437 Madison Avenue, 33rd Floor New York, New York |
10022 | |
| (Address of principal executive offices) | (Zip Code) | |
(212) 612-3210
(Registrant’s telephone number, including area code)
Indicate by check mark whether the registrant (1) has filed all reports required to be filed by Section 13 or 15(d) of the Securities Exchange Act of 1934 during the preceding 12 months (or for such shorter period that the registrant was required to file such reports), and (2) has been subject to such filing requirements for the past 90 days. Yes x No ¨
Indicate by check mark whether the registrant has submitted electronically and posted on its corporate Web site, if any, every Interactive Data File required to be submitted and posted pursuant to Rule 405 of Regulation S-T during the preceding 12 months (or for such shorter period that the registrant was required to submit and post such files). Yes x No ¨
Indicate by check mark whether the registrant is a large accelerated filer, an accelerated filer, a non-accelerated filer, or a smaller reporting company. See the definitions of “large accelerated filer,” “accelerated filer” and “smaller reporting company” in Rule 12b-2 of the Exchange Act. Check one:
| Large accelerated filer | ¨ | Accelerated filer | x | |||
| Non-accelerated filer | ¨ (Do not check if a smaller reporting company) | Smaller reporting company | ¨ | |||
Indicate by check mark whether the registrant is a shell company (as defined in Rule 12b-2 of the Exchange Act). Yes ¨ No x
Indicate the number of shares outstanding of each of the issuer’s classes of common stock, as of the latest practicable date.
| Class |
Outstanding at July 21, 2011 | |
| Common Stock ($0.01 par value) |
82,591,404 |
Table of Contents
| Page | ||||||
| PART I. |
Financial Information | |||||
| Item 1. |
Financial Statements | 1 | ||||
| Item 2. |
Management’s Discussion and Analysis of Financial Condition and Results of Operations | 23 | ||||
| Item 3. |
Quantitative and Qualitative Disclosures about Market Risk | 38 | ||||
| Item 4. |
Controls and Procedures | 42 | ||||
| PART II. |
Other Information | |||||
| Item 1. |
Legal Proceedings | 42 | ||||
| Item 1A. |
Risk Factors | 42 | ||||
| Item 2. |
Unregistered Sales of Equity Securities and Use of Proceeds | 42 | ||||
| Item 3. |
Defaults Upon Senior Securities | 42 | ||||
| Item 4. |
(Removed and Reserved). | 42 | ||||
| Item 5. |
Other Information | 42 | ||||
| Item 6. |
Exhibits | 42 | ||||
| SIGNATURES | 43 | |||||
Table of Contents
| Item 1. | Financial Statements |
CYPRESS SHARPRIDGE INVESTMENTS, INC.
CONDENSED STATEMENTS OF ASSETS AND LIABILITIES (UNAUDITED)
| (In thousands, except per share numbers) | June 30, 2011 | December 31, 2010* | ||||||
| ASSETS: |
||||||||
| Investments in securities, at fair value (including pledged assets of $8,039,662 and $3,671,582, respectively) |
$ | 8,859,410 | $ | 6,331,048 | ||||
| Interest rate swap contracts, at fair value |
— | 9,113 | ||||||
| Interest rate cap, at fair value |
20,429 | 30,984 | ||||||
| Cash and cash equivalents |
1,092 | 1,510 | ||||||
| Receivable for securities sold |
400,849 | — | ||||||
| Interest receivable |
27,902 | 16,183 | ||||||
| Other assets |
829 | 429 | ||||||
| Total assets |
9,310,511 | 6,389,267 | ||||||
| LIABILITIES: |
||||||||
| Repurchase agreements |
7,548,091 | 3,443,843 | ||||||
| Interest rate swap contracts, at fair value |
49,151 | 9,757 | ||||||
| Payable for securities purchased |
626,476 | 2,234,401 | ||||||
| Distribution payable |
49,550 | — | ||||||
| Accrued interest payable (including accrued interest on repurchase agreements of $2,181 and $1,084, respectively) |
15,674 | 9,412 | ||||||
| Related party management fee payable |
1,125 | 800 | ||||||
| Accrued expenses and other liabilities |
635 | 715 | ||||||
| Total liabilities |
8,290,702 | 5,698,928 | ||||||
| Contingencies (note 8) |
||||||||
| NET ASSETS |
$ | 1,019,809 | $ | 690,339 | ||||
| Net assets consist of: |
||||||||
| Common Stock, $0.01 par value, 500,000 shares authorized (82,584 and 59,551 shares issued and outstanding, respectively) |
$ | 826 | $ | 596 | ||||
| Additional paid in capital |
1,015,816 | 739,005 | ||||||
| Retained earnings (Accumulated deficit) |
3,167 | (49,262 | ) | |||||
| NET ASSETS |
$ | 1,019,809 | $ | 690,339 | ||||
| NET ASSET VALUE PER SHARE |
$ | 12.35 | $ | 11.59 | ||||
| * | Derived from audited financial statements. |
See notes to financial statements.
1
Table of Contents
CYPRESS SHARPRIDGE INVESTMENTS, INC.
CONDENSED SCHEDULES OF INVESTMENTS
JUNE 30, 2011 (UNAUDITED)
INVESTMENTS IN SECURITIES—UNITED STATES OF AMERICA
| (In thousands) | Face Amount | Fair Value | ||||||
| Investments in Securities - 868.7%(d) |
||||||||
| Mortgage Pass-Through Agency RMBS - 866.3%(d) |
||||||||
| Fannie Mae Pools - 780.3%(d) |
||||||||
| 2.997%, due 10/1/2040(a)(b) |
$ | 52,842 | $ | 54,476 | ||||
| 3.002%, due 1/1/2041(a)(b) |
47,020 | 48,606 | ||||||
| 3.035%, due 12/1/2040(a)(b) |
181,531 | 187,809 | ||||||
| 3.100%, due 8/1/2041(b) |
35,000 | 35,984 | ||||||
| 3.100%, due 8/1/2041(b) |
15,000 | 15,422 | ||||||
| 3.205%, due 6/1/2041(a)(b) |
198,484 | 205,975 | ||||||
| 3.209%, due 11/1/2040(a)(b) |
45,228 | 46,956 | ||||||
| 3.217%, due 12/1/2040(a)(b) |
84,716 | 87,993 | ||||||
| 3.219%, due 7/1/2040(a)(b) |
45,161 | 47,018 | ||||||
| 3.241%, due 3/1/2041(a)(b) |
19,241 | 19,766 | ||||||
| 3.249%, due 4/1/2041(a)(b) |
74,024 | 76,924 | ||||||
| 3.250%, due 8/1/2041(b) |
40,000 | 41,356 | ||||||
| 3.250%, due 11/1/2040(a)(b) |
48,766 | 50,272 | ||||||
| 3.257%, due 6/1/2041(a)(b) |
59,832 | 62,186 | ||||||
| 3.264%, due 5/1/2041(a)(b) |
49,687 | 51,630 | ||||||
| 3.280%, due 8/1/2041(b) |
50,000 | 51,758 | ||||||
| 3.281%, due 6/1/2041(a)(b) |
133,944 | 139,159 | ||||||
| 3.289%, due 4/1/2041(a)(b) |
60,618 | 63,016 | ||||||
| 3.290%, due 8/1/2041(b) |
13,000 | 13,280 | ||||||
| 3.308%, due 8/1/2040(a)(b) |
43,163 | 44,823 | ||||||
| 3.326%, due 9/1/2040(a)(b) |
43,493 | 45,270 | ||||||
| 3.330%, due 8/1/2041(b) |
35,000 | 35,788 | ||||||
| 3.349%, due 9/1/2040(a)(b) |
48,385 | 50,410 | ||||||
| 3.370%, due 5/1/2041(a)(b) |
24,443 | 25,377 | ||||||
| 3.398%, due 4/1/2041(a)(b) |
49,270 | 50,993 | ||||||
| 3.402%, due 4/1/2041(a)(b) |
59,552 | 61,700 | ||||||
| 3.410%, due 8/1/2041(b) |
9,000 | 9,225 | ||||||
| 3.415%, due 6/1/2041(a)(b) |
123,557 | 127,894 | ||||||
| 3.420%, due 8/1/2041(b) |
10,000 | 10,238 | ||||||
| 3.465%, due 11/1/2040(a)(b) |
23,962 | 24,919 | ||||||
| 3.500%, due 1/1/2026(a) |
173,403 | 176,827 | ||||||
| 3.500%, due 1/1/2026(a) |
146,115 | 149,045 | ||||||
| 3.500%, due 12/1/2025(a) |
96,910 | 98,824 | ||||||
| 3.500%, due 12/1/2025(a) |
96,629 | 98,537 | ||||||
| 3.500%, due 2/1/2026(a) |
97,964 | 99,929 | ||||||
| 3.500%, due 2/1/2026(a) |
145,666 | 148,587 | ||||||
| 3.500%, due 2/1/2026(a) |
242,272 | 247,132 | ||||||
| 3.500%, due 3/1/2026(a) |
97,932 | 99,896 | ||||||
| 3.500%, due 3/1/2026(a) |
54,356 | 55,446 | ||||||
| 3.500%, due 3/1/2026(a) |
93,392 | 95,266 | ||||||
| 3.500%, due 4/1/2026(a) |
49,945 | 50,946 | ||||||
| 3.500%, due 5/1/2026(a) |
99,057 | 101,044 | ||||||
| 3.556%, due 7/1/2040(a)(b) |
17,514 | 18,266 | ||||||
| 3.568%, due 7/1/2040(a)(b) |
19,615 | 20,448 | ||||||
See notes to financial statements.
2
Table of Contents
CYPRESS SHARPRIDGE INVESTMENTS, INC.
CONDENSED SCHEDULES OF INVESTMENTS – Continued
JUNE 30, 2011 (UNAUDITED)
| Face Amount | Fair Value | |||||||
| 3.578%, due 8/1/2040(a)(b) |
$ | 45,707 | $ | 47,710 | ||||
| 3.600%, due 6/1/2041(a)(b) |
70,219 | 72,874 | ||||||
| 3.602%, due 10/1/2040(a)(b) |
56,629 | 59,153 | ||||||
| 3.602%, due 8/1/2040(a)(b) |
20,794 | 21,686 | ||||||
| 3.602%, due 8/1/2040(a)(b) |
45,514 | 47,507 | ||||||
| 3.640%, due 6/1/2041(b) |
70,838 | 73,295 | ||||||
| 3.654%, due 7/1/2040(a)(b) |
40,217 | 41,987 | ||||||
| 3.665%, due 6/1/2040(a)(b) |
17,680 | 18,481 | ||||||
| 3.668%, due 7/1/2040(a)(b) |
42,502 | 44,328 | ||||||
| 3.680%, due 8/1/2040(a)(b) |
45,168 | 47,210 | ||||||
| 3.699%, due 8/1/2040(a)(b) |
20,832 | 21,788 | ||||||
| 3.733%, due 5/1/2040(a)(b) |
39,846 | 41,759 | ||||||
| 3.737%, due 8/1/2040(a)(b) |
11,370 | 11,925 | ||||||
| 3.745%, due 9/1/2039(a)(b) |
26,663 | 27,956 | ||||||
| 3.818%, due 7/1/2040(a)(b) |
40,842 | 42,822 | ||||||
| 3.959%, due 10/1/2039(a)(b) |
34,140 | 35,878 | ||||||
| 3.976%, due 9/1/2039(a)(b) |
17,890 | 18,853 | ||||||
| 4.000%, due 1/1/2025(a) |
37,960 | 39,635 | ||||||
| 4.000%, due 1/1/2025(a) |
60,254 | 62,894 | ||||||
| 4.000%, due 1/1/2026(a) |
48,350 | 50,468 | ||||||
| 4.000%, due 1/1/2026(a) |
48,411 | 50,532 | ||||||
| 4.000%, due 10/1/2024(a) |
9,767 | 10,198 | ||||||
| 4.000%, due 10/1/2025(a) |
26,542 | 27,705 | ||||||
| 4.000%, due 10/1/2025(a) |
28,239 | 29,477 | ||||||
| 4.000%, due 10/1/2025(a) |
47,764 | 49,856 | ||||||
| 4.000%, due 10/1/2030(a) |
48,348 | 49,368 | ||||||
| 4.000%, due 10/1/2030(a) |
73,217 | 74,762 | ||||||
| 4.000%, due 10/1/2030(a) |
72,030 | 73,550 | ||||||
| 4.000%, due 10/1/2030(a) |
72,863 | 74,400 | ||||||
| 4.000%, due 11/1/2025(a) |
47,204 | 49,272 | ||||||
| 4.000%, due 11/1/2025(a) |
48,172 | 50,282 | ||||||
| 4.000%, due 11/1/2025(a) |
9,438 | 9,851 | ||||||
| 4.000%, due 12/1/2025(a) |
24,326 | 25,392 | ||||||
| 4.000%, due 12/1/2025(a) |
71,607 | 74,743 | ||||||
| 4.000%, due 12/1/2025(a) |
28,905 | 30,171 | ||||||
| 4.000%, due 12/1/2025(a) |
30,002 | 31,091 | ||||||
| 4.000%, due 12/1/2030(a) |
73,927 | 75,486 | ||||||
| 4.000%, due 2/1/2025(a) |
39,711 | 41,450 | ||||||
| 4.000%, due 2/1/2026(a) |
51,849 | 54,088 | ||||||
| 4.000%, due 2/1/2026(a) |
43,183 | 45,048 | ||||||
| 4.000%, due 2/1/2026(a) |
15,068 | 15,719 | ||||||
| 4.000%, due 2/1/2026(a) |
97,588 | 101,802 | ||||||
| 4.000%, due 3/1/2025(a) |
39,581 | 41,315 | ||||||
| 4.000%, due 3/1/2026(a) |
26,776 | 27,932 | ||||||
| 4.000%, due 3/1/2026(a) |
199,295 | 207,900 | ||||||
| 4.000%, due 3/1/2026(a) |
45,375 | 47,334 | ||||||
| 4.000%, due 3/1/2026(a) |
49,519 | 51,657 | ||||||
| 4.000%, due 4/1/2026(a) |
99,499 | 103,796 | ||||||
See notes to financial statements.
3
Table of Contents
CYPRESS SHARPRIDGE INVESTMENTS, INC.
CONDENSED SCHEDULES OF INVESTMENTS – Continued
JUNE 30, 2011 (UNAUDITED)
| Face Amount | Fair Value | |||||||
| 4.000%, due 4/1/2026(a) |
$ | 8,346 | $ | 8,706 | ||||
| 4.000%, due 4/1/2026(a) |
73,742 | 76,926 | ||||||
| 4.000%, due 4/1/2026(a) |
164,623 | 171,732 | ||||||
| 4.000%, due 4/1/2026(a) |
158,372 | 165,211 | ||||||
| 4.000%, due 5/1/2026(a) |
45,949 | 47,933 | ||||||
| 4.000%, due 5/1/2026(a) |
26,154 | 27,284 | ||||||
| 4.000%, due 5/1/2026 |
199,034 | 207,307 | ||||||
| 4.000%, due 6/1/2026(a) |
24,894 | 25,969 | ||||||
| 4.000%, due 7/1/2026 |
200,000 | 208,312 | ||||||
| 4.000%, due 9/1/2030(a) |
91,898 | 93,836 | ||||||
| 4.000%, due 9/1/2030(a) |
21,840 | 22,301 | ||||||
| 4.063%, due 6/1/2039(a)(b) |
16,724 | 17,679 | ||||||
| 4.500%, due 10/1/2024(a) |
30,857 | 32,788 | ||||||
| 4.500%, due 10/1/2024(a) |
33,217 | 35,295 | ||||||
| 4.500%, due 10/1/2024(a) |
27,760 | 29,497 | ||||||
| 4.500%, due 10/1/2030(a) |
48,817 | 51,052 | ||||||
| 4.500%, due 11/1/2024(a) |
41,908 | 44,529 | ||||||
| 4.500%, due 11/1/2030(a) |
49,505 | 51,771 | ||||||
| 4.500%, due 2/1/2026(a) |
54,320 | 57,718 | ||||||
| 4.500%, due 3/1/2024(a) |
13,525 | 14,371 | ||||||
| 4.500%, due 3/1/2025(a) |
46,168 | 49,027 | ||||||
| 4.500%, due 3/1/2026(a) |
71,395 | 75,906 | ||||||
| 4.500%, due 4/1/2025(a) |
30,604 | 32,499 | ||||||
| 4.500%, due 4/1/2030(a) |
27,828 | 29,101 | ||||||
| 4.500%, due 5/1/2023(a) |
22,784 | 24,223 | ||||||
| 4.500%, due 5/1/2030(a) |
46,127 | 48,238 | ||||||
| 4.500%, due 6/1/2024(a) |
16,394 | 17,420 | ||||||
| 4.500%, due 6/1/2025(a) |
29,954 | 31,809 | ||||||
| 4.500%, due 8/1/2024(a) |
13,244 | 14,072 | ||||||
| 4.500%, due 9/1/2024(a) |
19,283 | 20,489 | ||||||
| 5.000%, due 4/1/2041(a) |
244,429 | 260,128 | ||||||
| 5.000%, due 5/1/2041 |
243,845 | 259,506 | ||||||
| 5.000%, due 6/1/2041(a) |
100,000 | 106,341 | ||||||
| Total Fannie Mae Pools |
7,659,850 | 7,957,778 | ||||||
| Freddie Mac Pools - 70.8%(d) |
||||||||
| 3.059%, due 1/1/2041(a)(b) |
42,612 | 44,128 | ||||||
| 3.217%, due 12/1/2040(a)(b) |
47,438 | 49,372 | ||||||
| 3.247%, due 1/1/2041(a)(b) |
48,739 | 50,109 | ||||||
| 3.247%, due 2/1/2041(a)(b) |
40,908 | 42,035 | ||||||
| 3.259%, due 12/1/2040(a)(b) |
47,181 | 48,939 | ||||||
| 3.500%, due 4/1/2026(a) |
196,754 | 200,731 | ||||||
| 3.660%, due 6/1/2041(a)(b) |
50,419 | 52,558 | ||||||
| 4.000%, due 10/1/2025(a) |
66,713 | 69,583 | ||||||
| 4.500%, due 1/1/2025(a) |
30,259 | 32,095 | ||||||
| 4.500%, due 12/1/2024(a) |
13,469 | 14,286 | ||||||
| 4.500%, due 12/1/2024(a) |
13,246 | 14,050 | ||||||
| 4.500%, due 2/1/2025(a) |
40,351 | 42,774 | ||||||
| 4.500%, due 5/1/2025(a) |
17,892 | 18,967 | ||||||
See notes to financial statements.
4
Table of Contents
CYPRESS SHARPRIDGE INVESTMENTS, INC.
CONDENSED SCHEDULES OF INVESTMENTS – Continued
JUNE 30, 2011 (UNAUDITED)
| Face Amount | Fair Value | |||||||
| 4.500%, due 7/1/2024(a) |
$ | 40,349 | $ | 42,797 | ||||
| Total Freddie Mac Pools |
696,330 | 722,424 | ||||||
| Ginnie Mae Pools - 15.2%(d) |
||||||||
| 3.500%, due 7/20/2040(a)(b) |
81,077 | 84,934 | ||||||
| 3.500%, due 7/20/2040(a)(b) |
47,812 | 50,087 | ||||||
| 4.000%, due 1/20/2040(a)(b) |
19,009 | 20,046 | ||||||
| Total Ginnie Mae Pools |
147,898 | 155,067 | ||||||
| Total Mortgage Pass-Through Agency RMBS (cost - $8,705,534) |
8,504,078 | 8,835,269 | ||||||
| Collateralized Loan Obligation Securities - 2.4%(d) |
||||||||
| AMMC CLO V LTD(c) |
2,249 | 1,754 | ||||||
| AMMC CLO VII, LTD(c) |
3,900 | 3,237 | ||||||
| ARES VIR CLO, LTD(c)(e) |
3,775 | 2,190 | ||||||
| BALLYROCK CLO 2006-2, LTD(c) |
4,270 | 4,270 | ||||||
| CARLYLE HIGH YIELD PARTNERS VIII, LTD(c) |
3,000 | 2,220 | ||||||
| EATON VANCE CDO IX, LTD(c) |
2,500 | 2,375 | ||||||
| FLAGSHIP CLO V, LTD(c) |
3,750 | 3,000 | ||||||
| PHOENIX CLO II, LTD (formerly AVENUE CLO V)(c) |
2,000 | 1,620 | ||||||
| PRIMUS CLO I, LTD(c) |
2,500 | 1,875 | ||||||
| TRIMARAN CLO VII, LTD(c) |
2,000 | 1,600 | ||||||
| Total Collateralized Loan Obligation Securities (cost - $18,754) |
29,944 | 24,141 | ||||||
| Total Investments in Securities (cost - $8,724,288) |
$ | 8,534,022 | $ | 8,859,410 | ||||
| Notional Amount |
Fair Value | |||||||
| Interest Rate Cap Contracts - 2.0%(d) |
||||||||
| December 2014 Expiration, Cap Rate 2.0725% |
$ | 200,000 | $ | 2,636 | ||||
| October 2015 Expiration, Cap Rate 1.4275% |
300,000 | 10,347 | ||||||
| November 2015 Expiration, Cap Rate 1.3600% |
200,000 | 7,446 | ||||||
| Total Interest Rate Cap Contracts (Cost, $15,641) |
$ | 700,000 | $ | 20,429 | ||||
| Interest Rate Swap Contracts - 4.8%(d) |
||||||||
| May 2013 Expiration, Pay Rate 1.6000%, Receive Rate 3-Month LIBOR |
100,000 | (1,794 | ) | |||||
| June 2013 Expiration, Pay Rate 1.3775%, Receive Rate 3-Month LIBOR |
300,000 | (4,136 | ) | |||||
| July 2013 Expiration, Pay Rate 1.3650%, Receive Rate 3-Month LIBOR |
300,000 | (4,018 | ) | |||||
| December 2013 Expiration, Pay Rate 1.3088%, Receive Rate 3-Month LIBOR |
400,000 | (4,165 | ) | |||||
| December 2013 Expiration, Pay Rate 1.2640%, Receive Rate 3-Month LIBOR |
400,000 | (3,731 | ) | |||||
| December 2013 Expiration, Pay Rate 1.2813%, Receive Rate 3-Month LIBOR |
500,000 | (4,868 | ) | |||||
| December 2013 Expiration, Pay Rate 1.3225%, Receive Rate 3-Month LIBOR |
400,000 | (4,289 | ) | |||||
| April 2014 Expiration, Pay Rate 1.6700%, Receive Rate 3-Month LIBOR (f) |
250,000 | (1,707 | ) | |||||
| July 2014 Expiration, Pay Rate 1.7200%, Receive Rate 3-Month LIBOR |
100,000 | (1,771 | ) | |||||
| July 2014 Expiration, Pay Rate 1.7325%, Receive Rate 3-Month LIBOR |
250,000 | (4,439 | ) | |||||
| August 2014 Expiration, Pay Rate 1.3530%, Receive Rate 3-Month LIBOR |
200,000 | (1,033 | ) | |||||
| September 2014 Expiration, Pay Rate 1.3120%, Receive Rate 3-Month LIBOR |
500,000 | (1,322 | ) | |||||
| October 2014 Expiration, Pay Rate 1.1725%, Receive Rate 3-Month LIBOR |
240,000 | 574 | ||||||
| February 2015 Expiration, Pay Rate 2.1450%, Receive Rate 3-Month LIBOR |
500,000 | (13,031 | ) | |||||
| June 2016 Expiration, Pay Rate 1.9400%, Receive Rate 3-Month LIBOR |
300,000 | 579 | ||||||
| Total Interest Rate Swap Contracts (Cost, $0) |
$ | 4,740,000 | $ | (49,151 | ) | |||
See notes to financial statements.
5
Table of Contents
LEGEND
| (a) | Securities or a portion of the securities are pledged as collateral for repurchase agreements or interest rate swap contracts. |
| (b) | The coupon rate shown on floating or adjustable rate securities represents the rate at June 30, 2011. |
| (c) | Securities exempt from registration under Rule 144A of the Securities Act of 1933. These securities may only be resold in transactions exempt from registration, normally to qualified institutional buyers. At June 30, 2011, the fair value of these securities amounted to $24,141 or 2.4% of net assets. |
| (d) | Percentage of net assets. |
| (e) | Non-income producing security. |
| (f) | Interest rate swap contains a one-time option to cancel at $0. |
See notes to financial statements.
6
Table of Contents
CYPRESS SHARPRIDGE INVESTMENTS, INC.
CONDENSED SCHEDULES OF INVESTMENTS – Continued
DECEMBER 31, 2010 (UNAUDITED)*
INVESTMENTS IN SECURITIES—UNITED STATES OF AMERICA
| (In thousands) |
Face Amount | Fair Value | ||||||
| Investments in Securities - 917.1%(d) |
||||||||
| Mortgage Pass-Through Agency RMBS - 914.1%(d) |
||||||||
| Fannie Mae Pools - 802.1%(d) |
||||||||
| 3.000%, due 1/1/2041(a)(b) |
$ | 50,363 | $ | 51,416 | ||||
| 3.013%, due 10/1/2040(a)(b) |
59,284 | 60,418 | ||||||
| 3.042%, due 12/1/2040(b) |
194,331 | 199,189 | ||||||
| 3.210%, due 11/1/2040(a)(b) |
49,731 | 50,957 | ||||||
| 3.212%, due 12/1/2040(a)(b) |
100,076 | 103,078 | ||||||
| 3.233%, due 7/1/2040(a)(b) |
47,318 | 48,667 | ||||||
| 3.251%, due 11/1/2040(a)(b) |
49,712 | 50,762 | ||||||
| 3.309%, due 8/1/2040(a)(b) |
47,107 | 48,594 | ||||||
| 3.336%, due 9/1/2040(a)(b) |
48,525 | 49,858 | ||||||
| 3.340%, due 9/1/2040(a)(b) |
55,821 | 57,416 | ||||||
| 3.462%, due 11/1/2040(a)(b) |
24,735 | 25,193 | ||||||
| 3.500%, due 12/1/2025(a) |
100,441 | 101,367 | ||||||
| 3.500%, due 1/1/2026(a) |
179,924 | 181,582 | ||||||
| 3.500%, due 12/1/2025 |
4,139 | 4,177 | ||||||
| 3.500%, due 12/1/2025 |
16,274 | 16,424 | ||||||
| 3.500%, due 12/1/2025(a) |
99,910 | 100,831 | ||||||
| 3.500%, due 1/1/2026 |
150,000 | 151,031 | ||||||
| 3.500%, due 2/1/2026 |
550,000 | 552,234 | ||||||
| 3.500%, due 3/1/2026 |
150,000 | 150,094 | ||||||
| 3.500%, due 4/1/2026 |
400,000 | 399,031 | ||||||
| 3.506%, due 8/1/2040(a)(b) |
48,469 | 50,032 | ||||||
| 3.558%, due 7/1/2040(a)(b) |
22,367 | 22,890 | ||||||
| 3.571%, due 7/1/2040(a)(b) |
19,640 | 20,085 | ||||||
| 3.579%, due 8/1/2040(a)(b) |
49,287 | 50,415 | ||||||
| 3.605%, due 10/1/2040(a)(b) |
59,742 | 61,158 | ||||||
| 3.605%, due 8/1/2040(a)(b) |
21,609 | 22,104 | ||||||
| 3.615%, due 8/1/2040(a)(b) |
48,456 | 49,631 | ||||||
| 3.648%, due 6/1/2040(a)(b) |
19,497 | 20,224 | ||||||
| 3.664%, due 7/1/2040(a)(b) |
45,354 | 46,987 | ||||||
| 3.676%, due 7/1/2039(a)(b) |
6,108 | 6,364 | ||||||
| 3.679%, due 7/1/2040(a)(b) |
46,360 | 47,667 | ||||||
| 3.683%, due 8/1/2040(a)(b) |
47,674 | 48,944 | ||||||
| 3.688%, due 5/1/2040(a)(b) |
13,923 | 14,464 | ||||||
| 3.694%, due 8/1/2040(a)(b) |
23,798 | 24,437 | ||||||
| 3.755%, due 5/1/2040(a)(b) |
46,830 | 48,486 | ||||||
| 3.771%, due 8/1/2040(a)(b) |
14,108 | 14,524 | ||||||
| 3.776%, due 9/1/2039(a)(b) |
29,583 | 30,984 | ||||||
| 3.830%, due 7/1/2040(a)(b) |
46,251 | 47,773 | ||||||
| 3.974%, due 10/1/2039(a)(b) |
38,779 | 40,546 | ||||||
| 3.983%, due 9/1/2039(a)(b) |
18,868 | 19,789 | ||||||
| 4.000%, due 12/1/2025(a) |
25,104 | 25,951 | ||||||
| 4.000%, due 12/1/2030(a) |
75,493 | 76,497 | ||||||
| 4.000%, due 1/1/2026(a) |
50,369 | 52,069 | ||||||
| 4.000%, due 12/1/2025(a) |
75,088 | 77,623 | ||||||
See notes to financial statements.
7
Table of Contents
CYPRESS SHARPRIDGE INVESTMENTS, INC.
CONDENSED SCHEDULES OF INVESTMENTS – Continued
DECEMBER 31, 2010 (UNAUDITED)*
| Face Amount | Fair Value | |||||||
| 4.000%, due 12/1/2025 |
$ | 30,566 | $ | 31,598 | ||||
| 4.000%, due 1/1/2026 |
50,444 | 51,510 | ||||||
| 4.000%, due 12/1/2025 |
31,096 | 31,859 | ||||||
| 4.000%, due 12/1/2024(a) |
22,837 | 23,554 | ||||||
| 4.000%, due 10/1/2024(a) |
11,035 | 11,382 | ||||||
| 4.000%, due 1/1/2025(a) |
41,384 | 42,683 | ||||||
| 4.000%, due 1/1/2025(a) |
65,069 | 67,265 | ||||||
| 4.000%, due 2/1/2025(a) |
43,086 | 44,540 | ||||||
| 4.000%, due 3/1/2025(a) |
43,404 | 44,869 | ||||||
| 4.000%, due 9/1/2030(a) |
96,940 | 98,229 | ||||||
| 4.000%, due 9/1/2030(a) |
23,974 | 24,293 | ||||||
| 4.000%, due 10/1/2025(a) |
27,531 | 28,460 | ||||||
| 4.000%, due 10/1/2030(a) |
49,695 | 50,356 | ||||||
| 4.000%, due 10/1/2030(a) |
74,994 | 75,992 | ||||||
| 4.000%, due 10/1/2030(a) |
74,413 | 75,402 | ||||||
| 4.000%, due 10/1/2025(a) |
29,823 | 30,830 | ||||||
| 4.000%, due 10/1/2030(a) |
74,750 | 75,744 | ||||||
| 4.000%, due 10/1/2025(a) |
49,680 | 51,356 | ||||||
| 4.000%, due 11/1/2025(a) |
49,461 | 51,130 | ||||||
| 4.000%, due 11/1/2025(a) |
50,118 | 51,810 | ||||||
| 4.000%, due 11/1/2025(a) |
9,941 | 10,277 | ||||||
| 4.000%, due 2/1/2026 |
100,000 | 102,734 | ||||||
| 4.063%, due 6/1/2039(a)(b) |
19,102 | 20,082 | ||||||
| 4.096%, due 9/1/2039(a)(b) |
24,491 | 25,701 | ||||||
| 4.500%, due 5/1/2024(a) |
12,186 | 12,856 | ||||||
| 4.500%, due 6/1/2024(a) |
20,005 | 20,980 | ||||||
| 4.500%, due 5/1/2024(a) |
13,063 | 13,700 | ||||||
| 4.500%, due 6/1/2024(a) |
17,943 | 18,817 | ||||||
| 4.500%, due 9/1/2024(a) |
21,594 | 22,647 | ||||||
| 4.500%, due 9/1/2024(a) |
21,095 | 22,123 | ||||||
| 4.500%, due 10/1/2024(a) |
36,292 | 38,062 | ||||||
| 4.500%, due 9/1/2024(a) |
1,937 | 2,031 | ||||||
| 4.500%, due 11/1/2024(a) |
11,631 | 12,198 | ||||||
| 4.500%, due 10/1/2024(a) |
38,299 | 40,166 | ||||||
| 4.500%, due 11/1/2024(a) |
49,978 | 52,415 | ||||||
| 4.500%, due 10/1/2024(a) |
29,910 | 31,368 | ||||||
| 4.500%, due 4/1/2030(a) |
28,916 | 29,998 | ||||||
| 4.500%, due 5/1/2030(a) |
48,182 | 49,984 | ||||||
| 4.500%, due 6/1/2025(a) |
33,361 | 35,050 | ||||||
| 4.500%, due 10/1/2030(a) |
49,664 | 51,522 | ||||||
| 4.500%, due 11/1/2030(a) |
50,338 | 52,221 | ||||||
| 4.500%, due 2/1/2026 |
300,000 | 314,109 | ||||||
| 5.500%, due 9/1/2023(a) |
32,265 | 34,714 | ||||||
| 5.500%, due 2/1/2041 |
200,000 | 213,594 | ||||||
| 6.000%, due 5/1/2037(a) |
8,749 | 9,401 | ||||||
| 6.000%, due 4/1/2038(a) |
14,299 | 15,555 | ||||||
| Total Fannie Mae Pools |
5,403,989 | 5,537,130 | ||||||
See notes to financial statements.
8
Table of Contents
CYPRESS SHARPRIDGE INVESTMENTS, INC.
CONDENSED SCHEDULES OF INVESTMENTS – Continued
DECEMBER 31, 2010 (UNAUDITED)*
| Face Amount | Fair Value | |||||||
| Freddie Mac Pools - 88.6%(d) |
||||||||
| 3.052%, due 1/1/2041(a)(b) |
$ | 45,411 | $ | 46,424 | ||||
| 3.200%, due 12/1/2040(a)(b) |
50,012 | 51,281 | ||||||
| 3.247%, due 12/1/2040(b) |
49,646 | 50,980 | ||||||
| 3.500%, due 3/1/2026 |
200,000 | 199,938 | ||||||
| 4.000%, due 10/1/2025(a) |
73,474 | 75,689 | ||||||
| 4.500%, due 7/1/2024(a) |
48,351 | 50,527 | ||||||
| 4.500%, due 2/1/2025(a) |
43,717 | 45,739 | ||||||
| 4.500%, due 12/1/2024(a) |
15,509 | 16,207 | ||||||
| 4.500%, due 12/1/2024(a) |
15,096 | 15,775 | ||||||
| 4.500%, due 1/1/2025(a) |
33,201 | 34,696 | ||||||
| 4.500%, due 5/1/2025(a) |
18,565 | 19,423 | ||||||
| 5.500%, due 9/1/2023(a) |
4,998 | 5,360 | ||||||
| Total Freddie Mac Pools |
597,980 | 612,039 | ||||||
| Ginnie Mae Pools - 23.4%(d) |
||||||||
| 3.500%, due 7/20/2040(a)(b) |
84,444 | 87,841 | ||||||
| 3.500%, due 7/20/2040(a)(b) |
49,868 | 51,874 | ||||||
| 4.000%, due 1/20/2040(a)(b) |
20,627 | 21,686 | ||||||
| Total Ginnie Mae Pools |
154,939 | 161,401 | ||||||
| Total Mortgage Pass-Through Agency RMBS (cost - $6,308,441) |
6,156,908 | 6,310,570 | ||||||
| Collateralized Loan Obligation Securities - 3.0%(d) |
||||||||
| AMMC CLO V LTD(c) |
2,249 | 1,349 | ||||||
| AMMC CLO VII, LTD(c) |
3,900 | 2,578 | ||||||
| ARES VIR CLO, LTD(c)(e) |
3,775 | 1,623 | ||||||
| BALLYROCK CLO 2006-2, LTD(c) |
4,270 | 3,843 | ||||||
| CARLYLE HIGH YIELD PARTNERS VIII, LTD(c) |
3,000 | 2,250 | ||||||
| EATON VANCE CDO IX, LTD(c) |
2,500 | 1,915 | ||||||
| FLAGSHIP CLO V, LTD(c) |
3,750 | 2,363 | ||||||
| PHOENIX CLO II, LTD (formerly AVENUE CLO V)(c)(e) |
2,000 | 1,127 | ||||||
| PRIMUS CLO I, LTD(c) |
2,500 | 1,750 | ||||||
| TRIMARAN CLO VII, LTD(c) |
2,000 | 1,680 | ||||||
| Total Collateralized Loan Obligation Securities (cost - $21,183) |
29,944 | 20,478 | ||||||
| Total Investments in Securities (cost - $6,329,624) |
$ | 6,186,852 | $ | 6,331,048 | ||||
| Interest Rate Cap Contracts - 4.5%(d) | Notional Amount |
Fair Value | ||||||
| December 2014 Expiration, Cap Rate 2.073% |
$ | 200,000 | $ | 4,752 | ||||
| October 2015 Expiration, Cap Rate 1.428% |
300,000 | 15,340 | ||||||
| November 2015 Expiration, Cap Rate 1.360% |
200,000 | 10,892 | ||||||
| Total Interest Rate Cap Contracts (Cost, $17,560) |
$ | 700,000 | $ | 30,984 | ||||
| Interest Rate Swap Contracts - (0.1)%(d) |
||||||||
| May 2013 Expiration, Pay Rate 1.600%, Receive Rate 3-Month LIBOR |
$ | 100,000 | $ | (1,496 | ) | |||
| June 2013 Expiration, Pay Rate 1.378%, Receive Rate 3-Month LIBOR |
300,000 | (2,718 | ) | |||||
| July 2013 Expiration, Pay Rate 1.365%, Receive Rate 3-Month LIBOR |
300,000 | (2,484 | ) | |||||
See notes to financial statements.
9
Table of Contents
CYPRESS SHARPRIDGE INVESTMENTS, INC.
CONDENSED SCHEDULES OF INVESTMENTS – Continued
DECEMBER 31, 2010 (UNAUDITED)*
| Notional Amount |
Fair Value | |||||||
| December 2013 Expiration, Pay Rate 1.3088%, Receive Rate 3-Month LIBOR |
$ | 400,000 | $ | (776 | ) | |||
| December 2013 Expiration, Pay Rate 1.2813%, Receive Rate 3-Month LIBOR |
500,000 | (539 | ) | |||||
| December 2013 Expiration, Pay Rate 1.2640%, Receive Rate 3-Month LIBOR |
400,000 | (255 | ) | |||||
| December 2013 Expiration, Pay Rate 1.3225%, Receive Rate 3-Month LIBOR |
400,000 | (904 | ) | |||||
| July 2014 Expiration, Pay Rate 1.7200%, Receive Rate 3-Month LIBOR |
100,000 | (733 | ) | |||||
| July 2014 Expiration, Pay Rate 1.7325%, Receive Rate 3-Month LIBOR |
250,000 | (1,787 | ) | |||||
| August 2014 Expiration, Pay Rate 1.353%, Receive Rate 3-Month LIBOR |
200,000 | 1,529 | ||||||
| September 2014 Expiration, Pay Rate 1.312%, Receive Rate 3-Month LIBOR |
500,000 | 5,460 | ||||||
| October 2014 Expiration, Pay Rate 1.1725%, Receive Rate 3-Month LIBOR |
240,000 | 4,059 | ||||||
| Total Interest Rate Swap Contracts (Cost, $0) |
$ | 3,690,000 | $ | (644 | ) | |||
LEGEND
| * | Derived from audited financial statements. |
| (a) | Securities or a portion of the securities are pledged as collateral for repurchase agreements or interest rate swap contracts. |
| (b) | The coupon rate shown on floating or adjustable rate securities represents the rate at December 31, 2010. |
| (c) | Securities exempt from registration under Rule 144A of the Securities Act of 1933. These securities may only be resold in transactions exempt from registration, normally to qualified institutional buyers. At December 31, 2010, the fair value of these securities amounted to $20,478 or 3.0% of net assets. |
| (d) | Percentage of net assets. |
| (e) | Non-income producing security. |
See notes to financial statements.
10
Table of Contents
CYPRESS SHARPRIDGE INVESTMENTS, INC.
CONDENSED STATEMENTS OF OPERATIONS (UNAUDITED)
| Three Months Ended June 30, | Six Months Ended June 30, | |||||||||||||||
| (In thousands, except per share numbers) | 2011 | 2010 | 2011 | 2010 | ||||||||||||
| INVESTMENT INCOME - Interest income |
$ | 65,720 | $ | 17,265 | $ | 106,700 | $ | 34,202 | ||||||||
| EXPENSES: |
||||||||||||||||
| Interest |
4,470 | 1,081 | 7,574 | 2,067 | ||||||||||||
| Management fees |
3,311 | 1,152 | 6,151 | 2,228 | ||||||||||||
| Related party management compensation |
589 | 315 | 1,134 | 645 | ||||||||||||
| General, administrative and other |
965 | 619 | 1,999 | 1,445 | ||||||||||||
| Total expenses |
9,335 | 3,167 | 16,858 | 6,385 | ||||||||||||
| Net investment income |
56,385 | 14,098 | 89,842 | 27,817 | ||||||||||||
| GAINS AND (LOSSES) FROM INVESTMENTS: |
||||||||||||||||
| Net realized gain (loss) on investments |
9,438 | (2,168 | ) | 15,346 | (9,420 | ) | ||||||||||
| Net unrealized appreciation (depreciation) on investments |
119,787 | 34,535 | 133,698 | 48,252 | ||||||||||||
| Net gain (loss) from investments |
129,225 | 32,367 | 149,044 | 38,832 | ||||||||||||
| GAINS AND (LOSSES) FROM SWAP AND CAP CONTRACTS: |
||||||||||||||||
| Net swap and cap interest income (expense) |
(14,875 | ) | (3,138 | ) | (26,733 | ) | (6,432 | ) | ||||||||
| Net gain (loss) on termination of swap contracts |
(3,493 | ) | (17,205 | ) | (3,492 | ) | (17,205 | ) | ||||||||
| Net unrealized appreciation (depreciation) on swap and cap contracts |
(67,820 | ) | 1,483 | (57,142 | ) | (5,263 | ) | |||||||||
| Net gain (loss) from swap and cap contracts |
(86,188 | ) | (18,860 | ) | (87,367 | ) | (28,900 | ) | ||||||||
| NET INCOME |
$ | 99,422 | $ | 27,605 | $ | 151,519 | $ | 37,749 | ||||||||
| NET INCOME PER COMMON SHARE BASIC & DILUTED |
||||||||||||||||
| Basic |
$ | 1.20 | $ | 1.47 | $ | 1.97 | $ | 2.01 | ||||||||
| Diluted |
$ | 1.20 | $ | 1.46 | $ | 1.97 | $ | 2.01 | ||||||||
See notes to financial statements.
11
Table of Contents
CYPRESS SHARPRIDGE INVESTMENTS, INC.
CONDENSED STATEMENTS OF CHANGES IN NET ASSETS (UNAUDITED)
| (In thousands) | Three Months Ended June 30, 2011 |
Six Months Ended June 30, 2011 |
||||||
| Net income: |
||||||||
| Net investment income |
$ | 56,385 | $ | 89,842 | ||||
| Net realized gain (loss) on investment securities |
9,438 | 15,346 | ||||||
| Net unrealized appreciation (depreciation) on investments |
119,787 | 133,698 | ||||||
| Net gain (loss) on swap and cap contracts |
(86,188 | ) | (87,367 | ) | ||||
| Net income |
99,422 | 151,519 | ||||||
| Capital transactions: |
||||||||
| Net proceeds from issuance of common shares |
86 | 275,907 | ||||||
| Distributions to shareholders |
(49,554 | ) | (99,090 | ) | ||||
| Amortization of related party compensation |
589 | 1,134 | ||||||
| Increase (decrease) in net assets from capital transactions |
(48,879 | ) | 177,951 | |||||
| Total increase in net assets |
50,543 | 329,470 | ||||||
| Net assets: |
||||||||
| Beginning of period |
969,266 | 690,339 | ||||||
| End of period |
$ | 1,019,809 | $ | 1,019,809 | ||||
See notes to financial statements.
12
Table of Contents
CYPRESS SHARPRIDGE INVESTMENTS, INC.
CONDENSED STATEMENTS OF CASH FLOWS (UNAUDITED)
| Six Months Ended June 30, | ||||||||
| (In thousands) | 2011 | 2010 | ||||||
| CASH FLOWS FROM OPERATING ACTIVITIES: |
||||||||
| Net income |
$ | 151,519 | $ | 37,749 | ||||
| Adjustments to reconcile net income to net cash used in operating activities: |
||||||||
| Purchase of investment securities |
(3,690,210 | ) | (864,685 | ) | ||||
| Proceeds from disposition of investment securities |
881,033 | 192,690 | ||||||
| Principal repayments of investment securities |
415,367 | 263,185 | ||||||
| Amortization of related party compensation |
1,134 | 645 | ||||||
| Amortization of premiums on investment securities |
14,493 | 3,404 | ||||||
| Amortization of premiums on interest rate cap contracts |
1,919 | — | ||||||
| Net realized (gain) loss on investment securities |
(15,346 | ) | 9,420 | |||||
| Net unrealized (appreciation) depreciation on swap and cap contracts |
57,142 | 5,263 | ||||||
| Net unrealized (appreciation) depreciation on investments |
(133,698 | ) | (48,252 | ) | ||||
| Change in assets and liabilities: |
||||||||
| Receivable for securities sold |
(400,849 | ) | 600 | |||||
| Interest receivable |
(11,719 | ) | 266 | |||||
| Other assets |
(400 | ) | (726 | ) | ||||
| Payable for securities purchased and terminated swap contract |
(1,607,925 | ) | 356,622 | |||||
| Accrued interest payable |
6,262 | (1,615 | ) | |||||
| Related party management fee payable |
325 | 59 | ||||||
| Accrued expenses and other liabilities |
(80 | ) | (35 | ) | ||||
| Net cash used in operating activities |
(4,331,033 | ) | (45,410 | ) | ||||
| CASH FLOWS FROM FINANCING ACTIVITIES: |
||||||||
| Proceeds from repurchase agreements |
19,346,529 | 7,624,130 | ||||||
| Repayments of repurchase agreements |
(15,242,281 | ) | (7,549,238 | ) | ||||
| Net proceeds from issuance of common shares |
275,907 | 129,891 | ||||||
| Distributions paid |
(49,540 | ) | (20,638 | ) | ||||
| Net cash provided by financing activities |
4,330,615 | 184,145 | ||||||
| Net increase (decrease) in cash and cash equivalents |
(418 | ) | 138,735 | |||||
| CASH AND CASH EQUIVALENTS - Beginning of period |
1,510 | 1,890 | ||||||
| CASH AND CASH EQUIVALENTS - End of period |
$ | 1,092 | $ | 140,625 | ||||
| SUPPLEMENTAL DISCLOSURES OF CASH FLOW INFORMATION: |
||||||||
| Interest paid |
$ | 29,316 | $ | 10,606 | ||||
| SUPPLEMENTAL DISCLOSURES OF NONCASH FLOW INFORMATION: |
||||||||
| Distributions declared, not yet paid |
$ | 49,550 | $ | 11,261 | ||||
See notes to financial statements.
13
Table of Contents
CYPRESS SHARPRIDGE INVESTMENTS, INC.
CONDENSED NOTES TO FINANCIAL STATEMENTS (UNAUDITED)
1. ORGANIZATION
Cypress Sharpridge Investments, Inc. (the “Company”) was formed as a Maryland corporation on January 3, 2006, and commenced operations on February 10, 2006. The Company is externally managed and advised by Cypress Sharpridge Advisors LLC (the “Manager”), a Delaware limited liability company, pursuant to a management agreement (the “Management Agreement”). The Manager is a joint venture between Cypress CSI Advisors LLC, a sponsor of private equity funds and leveraged buyouts of U.S. companies in the industrial, consumer, media and financial sectors, and Sharpridge Capital Management, L.P., a fixed income asset management company. Certain individuals associated with Cypress CSI Advisors LLC and Sharpridge Capital Management, L.P. serve on the Company’s board of directors and the Manager’s investment committee.
The Company has elected to be taxed and intends to continue to qualify as a real estate investment trust (“REIT”) and is required to comply with the provisions of the Internal Revenue Code of 1986, as amended (the “Code”), with respect thereto. The Company’s strategy had been to invest a majority of its capital in residential mortgage-backed securities that are issued and guaranteed by a federally chartered corporation (“Agency RMBS”), such as the Federal National Mortgage Association (“Fannie Mae”) or the Federal Home Loan Mortgage Corporation (“Freddie Mac”), or an agency of the U.S. government such as the Government National Mortgage Association (“Ginnie Mae”), and subordinated tranches of asset-backed securities, including collateralized debt or loan obligations (“CLOs”). In March 2008, the board of directors amended the investment guidelines, pursuant to which the Company was mandated to invest exclusively in Agency RMBS. In March 2010, the board of directors further amended the investment guidelines so that the Company may also invest in collateralized mortgage obligations issued by Fannie Mae, Freddie Mac or Ginnie Mae. The Company’s common stock trades on the New York Stock Exchange under the symbol “CYS”.
2. SIGNIFICANT ACCOUNTING POLICIES
Basis of Presentation
The accompanying interim unaudited condensed financial statements have been prepared in conformity with accounting principles generally accepted in the United States of America (“GAAP”) and the instructions to Form 10-Q and Article 10, Rule 10-01 of Regulation S-X. Accordingly, they do not include all of the information and footnotes required by GAAP for complete financial statements. In the opinion of management, all adjustments (consisting of normal recurring accruals) considered necessary for a fair presentation have been included. The interim unaudited condensed financial statements should be read in conjunction with the Company’s audited financial statements as of and for the year ended December 31, 2010, included in the annual report on Form 10-K. The results for interim periods are not necessarily indicative of the results to be expected for the fiscal year.
The Company adopted Financial Accounting Standards Board (“FASB”) Accounting Standards Codification (“ASC”) 946, Clarification of the Scope of Audit and Accounting Guide Investment Companies (“ASC 946”), prior to its deferral in February 2008. Under ASC 946, the Company uses financial reporting for investment companies.
Segment Reporting
The Company operates as a single segment reporting to the Chief Executive Officer, who manages the entire investment portfolio.
Use of Estimates
The preparation of financial statements in conformity with GAAP requires management to make estimates and assumptions that affect the amounts reported in the financial statements and accompanying notes. Actual results could differ from those management estimates.
Cash and Cash Equivalents
Cash and cash equivalents include cash on hand, cash held in banks and highly liquid investments with original maturities of three months or less. Interest income earned on cash and cash equivalents is recorded in interest income.
Interest Rate Swap and Cap Contracts
The Company utilizes interest rate swaps and caps to hedge the interest rate risk associated with the financing of its portfolio. Specifically, the Company seeks to hedge the exposure to potential interest rate mismatches between the interest earned on investments and the borrowing costs caused by fluctuations in short term interest rates. In a simple interest rate swap, one investor pays a floating rate of interest on a notional principal amount and receives a fixed rate of interest on the same notional principal amount for a specified period of time. Alternatively, an investor may pay a fixed rate and receive a floating rate. In a simple interest rate cap, one investor pays a premium for a notional principal amount based on a capped interest rate (the “cap rate”). If the floating
14
Table of Contents
interest rate (the “floating rate”) exceeds the cap rate, the investor receives a payment from the cap counterparty equal to the difference between the floating rate and the cap rate on the same notional principal amount for a specified period of time. Alternatively, an investor may receive a premium and pay the difference in cap rate and floating rate. Interest rate swaps and caps are asset/liability management tools.
During the term of the interest rate swap or cap, the Company makes or receives periodic payments and unrealized gains or losses are recorded as a result of marking the swap and cap to their fair value. When the swap or cap is terminated, the Company records a realized gain or loss equal to the difference between the proceeds from (or cost of) the closing transaction and the Company’s cost basis in the contract, if any. The periodic payments, amortization of premiums on cap contracts and any realized or unrealized gains or losses are reported under gains and losses from swap and cap contracts in the statement of operations. Swaps involve a risk that interest rates will move contrary to the Company’s expectations, thereby increasing its payment obligation.
Because the Company uses financial reporting for investment companies, its investments, including its interest rate swap and cap contracts, are carried at fair value with changes in fair value included in earnings. Consequently, there is no impact to designating interest rate swaps and caps as cash flow or fair value hedges under GAAP.
The Company is exposed to credit loss in the event of nonperformance by the counterparty to the swap or cap, limited to the amount of collateral posted that exceeds the fair value of the contract. However, as of June 30, 2011 and December 31, 2010 the Company did not anticipate nonperformance by any counterparty. Should interest rates move unexpectedly, the Company may not achieve the anticipated benefits of the interest rate swap or cap and may realize a loss.
Investment Valuation
Valuation of the Company’s investments is determined by the Manager. Investments are valued using third-party pricing services and dealer quotes. The third-party pricing services use pricing models that incorporate such factors as coupons, primary and secondary mortgage rates, prepayment speeds, spread to the Treasury curves and interest rate swap curves, convexity, duration, periodic and life caps and credit enhancement. The dealer quotes incorporate common market pricing methods, including a spread measurement to the Treasury curves or interest rate swap curve as well as underlying characteristics of the particular security including coupon, periodic and life caps, rate reset period, issuer, additional credit support and expected life of the security. The Manager reviews all prices used to ensure that current market conditions are represented. This review includes comparisons of similar market transactions, alternative third-party pricing services and dealer quotes, or comparisons to a pricing model. The resulting unrealized gains and losses are reflected in the statement of operations.
Agency RMBS
The Company’s investments in Agency RMBS consist of whole-pool pass-through certificates backed by fixed rate, monthly reset adjustable-rate loans (“ARMs”) and hybrid ARMs, the principal and interest of which are guaranteed by Fannie Mae, Freddie Mac or Ginnie Mae. Hybrid ARMs have interest rates that have an initial fixed period (typically three, five, seven or ten years) and thereafter reset at regular intervals in a manner similar to ARMs.
Forward Settling Transactions
The Company may engage in forward settling transactions. The Company records forward settling transactions on the trade date and maintains security positions such that sufficient liquid assets will be available to make payment on the settlement date for the securities purchased. Securities purchased on a forward settling basis are carried at fair value and begin earning interest on the settlement date. Losses may occur on these transactions due to changes in market conditions or the failure of counterparties to perform under the contract. The Company may transact in To-Be-Announced Securities (“TBAs”). As with other forward settling transactions, a seller agrees to issue TBAs at a future date. However, the seller does not specify the particular securities to be delivered. Instead, the Company agrees to accept any security that meets specified terms such as issuer, interest rate and terms of underlying mortgages. The Company records TBAs on the trade date utilizing information associated with the specified terms of the transaction as opposed to the specific mortgages. TBAs are carried at fair value and begin earning interest on the settlement date. Losses may occur due to the fact that the actual underlying mortgages received may be less favorable than those anticipated by the Company. As of June 30, 2011 and December 31, 2010, the Company had pledged Agency RMBS with a fair value of $3.4 million and $10.1 million, respectively, on its open forward settling and TBA transactions.
Collateralized Debt or Loan Obligations
The Company has investments in collateralized debt obligations and collateralized loan obligations (collectively “CLOs”), which are securities backed by pools of variously rated loans or bonds. Underwriters of CLOs package a large and diversified pool of loans or bonds, including high risk, high yield bonds, which is then separated into “tiers.” Typically, the top tier represents the last tier to take losses and therefore the lowest risk and pays the lower interest rate; a middle tier would take losses prior to the top tier and therefore has more risk than the top tier so it pays a higher rate than the top tier; the bottom tier takes losses first and therefore represents the highest risk and, instead of receiving a fixed interest rate, may receive the residual interest payments from the pool.
15
Table of Contents
Repurchase Agreements
Repurchase agreements are borrowings that are collateralized by the Company’s Agency RMBS and are carried at their amortized cost, which approximates their fair value due to their short term nature, generally 30-90 days. The Company’s repurchase agreement counterparties are large institutional dealers in fixed income securities. Collateral is valued daily and counterparties may require additional collateral when appropriate. At June 30, 2011 and December 31, 2010, Agency RMBS owned with a fair value of approximately $7,927.1 million and $3,657.2 million, respectively, have been pledged as collateral for repurchase agreements for which the counterparty has the right to sell or repledge.
Investment Transactions and Income
The Company records its transactions in securities on a trade date basis. Realized gains and losses on securities transactions are recorded on an identified cost basis. Interest income and expense are recorded on the accrual basis. Interest income on Agency RMBS is accrued based on outstanding principal amount of the securities and their contractual terms. Interest on CLOs is accrued at a rate determined based on estimated future cash flows and adjusted prospectively as future cash flow amounts are recast. For CLOs placed on nonaccrual status or when the Company cannot reliably estimate cash flows, the cost recovery method is used. Amortization of premium and accretion of discount are recorded using the yield to maturity method, and are included in interest income in the statement of operations.
Share-Based Compensation
The Company accounts for share-based compensation issued to its non-management directors and executive officers and certain officers and employees of its Manager and its sub-advisors and other individuals who provide services to the Company, as designated by its Manager (“Manager Designees”), using the fair value based methodology prescribed by ASC 718, Share-Based Payment (“ASC 718”). Compensation cost related to restricted common stock and common stock options issued to the Manager Designees is initially measured at estimated fair value at the grant date, and is remeasured on subsequent dates to the extent the awards are unvested. Compensation cost related to non-management directors is measured at its estimated fair value at the grant date and amortized and expensed over the vesting period. The Company has elected to use the straight line method pursuant to ASC 718 to amortize compensation expense for the restricted common stock and common stock options granted to the Manager Designees.
Income Taxes
The Company has elected to be taxed as a REIT and intends to continue to comply with provisions of the Code with respect thereto. As a REIT, the Company generally will not be subject to federal or state income tax. To maintain its qualification as a REIT, the Company must distribute at least 90% of its REIT taxable income to its stockholders and meet certain other tests relating to assets and income.
Earnings Per Share (“EPS”)
Basic EPS is computed using the two class method by dividing net income (loss) after adjusting for the impact of unvested stock awards deemed to be participating securities, by the weighted average number of common shares outstanding calculated excluding unvested stock awards. Diluted EPS is computed by dividing net income (loss), after adjusting for the impact of unvested stock awards deemed to be participating securities, by the weighted average number of common shares outstanding calculated excluding unvested stock awards, giving effect to common stock options and warrants, if they are not anti-dilutive. See note 3 for EPS computations.
Recent Accounting Pronouncements
The FASB has recently issued or discussed a number of proposed standards on such topics as financial statement presentation, revenue recognition, financial instruments, hedging, contingencies and fair value. Some of the proposed changes are potentially significant and could have a material impact on the Company’s reporting. The Company has not yet fully evaluated the potential impact of these proposals but will make such an evaluation as the standards are finalized.
16
Table of Contents
3. EARNINGS PER SHARE
Components of the computation of basic and diluted EPS were as follows (in thousands, except per share numbers):
| Three Months Ended June 30, | Six Months Ended June 30, | |||||||||||||||
| 2011 | 2010 | 2011 | 2010 | |||||||||||||
| Net income |
$ | 99,422 | $ | 27,605 | $ | 151,519 | $ | 37,749 | ||||||||
| Less dividends paid: |
||||||||||||||||
| Common shares |
(49,087 | ) | (10,929 | ) | (98,155 | ) | (20,943 | ) | ||||||||
| Unvested shares |
(467 | ) | (335 | ) | (935 | ) | (640 | ) | ||||||||
| Undistributed earnings |
49,868 | 16,341 | 52,429 | 16,166 | ||||||||||||
| Basic weighted average shares outstanding: |
||||||||||||||||
| Common shares |
81,798 | 18,328 | 75,976 | 18,267 | ||||||||||||
| Basic earnings per common share: |
||||||||||||||||
| Distributed earnings |
$ | 0.60 | $ | 0.60 | $ | 1.29 | $ | 1.15 | ||||||||
| Undistributed earnings |
0.60 | 0.87 | 0.68 | 0.86 | ||||||||||||
| Basic earnings per common share |
$ | 1.20 | $ | 1.47 | $ | 1.97 | $ | 2.01 | ||||||||
| Diluted weighted average shares outstanding: |
||||||||||||||||
| Common shares |
81,798 | 18,328 | 75,976 | 18,267 | ||||||||||||
| Net effect of dilutive warrants(1) |
1 | 12 | 1 | 13 | ||||||||||||
| 81,799 | 18,340 | 75,977 | 18,280 | |||||||||||||
| Diluted earnings per common share: |
||||||||||||||||
| Distributed earnings |
$ | 0.60 | $ | 0.60 | $ | 1.29 | $ | 1.15 | ||||||||
| Undistributed earnings |
0.60 | 0.86 | 0.68 | 0.86 | ||||||||||||
| Diluted earnings per common share |
$ | 1.20 | $ | 1.46 | $ | 1.97 | $ | 2.01 | ||||||||
| (1) | The impact of equity instruments is not included in the computation of EPS for periods in which their inclusion would be anti-dilutive. For the three and six months ended June 30, 2011 and 2010, the Company had an aggregate of 131,088 stock options outstanding with a weighted average exercise price of $30.00 that were not included in the calculation of EPS for the three and six months ended June 30, 2011 and 2010, as their inclusion would have been anti-dilutive. These equity instruments may have a dilutive impact on future EPS. |
4. INVESTMENTS IN SECURITIES AND INTEREST RATE SWAP AND CAP CONTRACTS
The Company’s valuation techniques are based on observable and unobservable inputs. Observable inputs reflect readily obtainable data from independent sources, while unobservable inputs reflect the Company’s market assumptions. ASC 820 classifies these inputs into the following hierarchy:
Level 1 Inputs—Quoted prices for identical instruments in active markets.
Level 2 Inputs—Quoted prices for similar instruments in active markets; quoted prices for identical or similar instruments in markets that are not active; and model-derived valuations whose inputs are observable or whose significant value drivers are observable.
Level 3 Inputs—Instruments with primarily unobservable value drivers.
The following tables provide a summary of the Company’s assets and liabilities that are measured at fair value on a recurring basis as of June 30, 2011 and December 31, 2010:
June 30, 2011
| Fair Value Measurements Using | ||||||||||||||||
| Level 1 | Level 2 | Level 3 | Total | |||||||||||||
| (in thousands) | ||||||||||||||||
| Assets |
||||||||||||||||
| Agency RMBS |
$ | — | $ | 8,835,269 | $ | — | $ | 8,835,269 | ||||||||
| CLOs |
— | — | 24,141 | 24,141 | ||||||||||||
| Interest rate cap contracts |
— | 20,429 | — | 20,429 | ||||||||||||
| Total |
$ | — | $ | 8,855,698 | $ | 24,141 | $ | 8,879,839 | ||||||||
| Liabilities |
||||||||||||||||
| Interest rate swap contracts(a) |
$ | — | $ | (49,151 | ) | $ | — | $ | (49,151 | ) | ||||||
17
Table of Contents
December 31, 2010
| Fair Value Measurements Using | ||||||||||||||||
| Level 1 | Level 2 | Level 3 | Total | |||||||||||||
| (in thousands) | ||||||||||||||||
| Assets |
||||||||||||||||
| Agency RMBS |
$ | — | $ | 6,310,570 | $ | — | $ | 6,310,570 | ||||||||
| CLOs |
— | — | 20,478 | 20,478 | ||||||||||||
| Interest rate cap contracts |
— | 30,984 | — | 30,984 | ||||||||||||
| Interest rate swap contracts(a) |
— | 9,113 | — | 9,113 | ||||||||||||
| Total |
$ | — | $ | 6,350,667 | $ | 20,478 | $ | 6,371,145 | ||||||||
| Liabilities |
||||||||||||||||
| Interest rate swap contracts(a) |
$ | — | $ | 9,757 | $ | — | $ | 9,757 | ||||||||
| (a) | Subject to master netting arrangements |
The table below presents a reconciliation of changes in assets classified as Level 3 in the Company’s financial statements for the three and six months ended June 30, 2011. There were no changes in the three and six months ended June 30, 2010. A discussion of the method of fair valuing these assets is included above in “Investment Valuation.” Net unrealized appreciation (depreciation) on the assets is included in net unrealized appreciation (depreciation) on investments in the statement of operations.
Fair Value Reconciliation, Level 3
(in thousands)
| Three Months
Ended June 30, 2011 |
Six Months
Ended June 30, 2011 |
|||||||
| CLOs |
||||||||
| Beginning balance Level 3 assets |
$ | 23,947 | $ | 20,478 | ||||
| Change in net unrealized appreciation (depreciation) |
1,515 | 6,092 | ||||||
| Cash payments recorded as a reduction of cost basis |
(1,321 | ) | (2,429 | ) | ||||
| Transfers into Level 3 |
— | — | ||||||
| Ending balance Level 3 assets |
$ | 24,141 | $ | 24,141 | ||||
The Agency RMBS portfolio consisted of Agency RMBS as follows:
June 30, 2011
| Par Value | Fair Value | Weighted Average | ||||||||||||||||||||||||||
| Asset Type |
(in thousands) | Cost/Par | Fair Value/Par |
MTR(1) | Coupon | CPR(2) | ||||||||||||||||||||||
| 15 Year Fixed Rate |
$ | 4,439,585 | $ | 4,605,393 | $ | 102.33 | $ | 103.73 | N/A | 3.89 | % | 5.5 | % | |||||||||||||||
| 20 Year Fixed Rate |
626,399 | 643,866 | 102.35 | 102.79 | N/A | 4.14 | % | 2.5 | % | |||||||||||||||||||
| 30 Year Fixed Rate |
588,274 | 625,974 | 103.33 | 106.41 | N/A | 5.00 | % | N/A | (3) | |||||||||||||||||||
| Hybrid ARMs |
2,849,820 | 2,960,036 | 102.24 | 103.87 | 63.1 | 3.37 | % | 12.8 | % | |||||||||||||||||||
| Total/Weighted Average |
$ | 8,504,078 | $ | 8,835,269 | $ | 102.37 | $ | 103.89 | 63.1 | (4) | 3.81 | % | 7.3 | % | ||||||||||||||
December 31, 2010
| Par Value | Fair Value | Weighted Average | ||||||||||||||||||||||||||
| Asset Type |
(in thousands) | Cost/Par | Fair Value/Par |
MTR(1) | Coupon | CPR(2) | ||||||||||||||||||||||
| 15 Year Fixed Rate |
$ | 3,549,194 | $ | 3,622,862 | $ | 102.16 | $ | 102.08 | N/A | 3.87 | % | 23.1 | % | |||||||||||||||
| 20 Year Fixed Rate |
647,360 | 660,237 | 102.38 | 101.99 | N/A | 4.14 | % | 6.9 | % | |||||||||||||||||||
| 30 Year Fixed Rate |
223,047 | 238,549 | 105.60 | 106.95 | N/A | 5.55 | % | 28.2 | % | |||||||||||||||||||
| Hybrid ARMs |
1,737,307 | 1,788,922 | 102.70 | 102.97 | 63.2 | 3.43 | % | 18.4 | % | |||||||||||||||||||
| Total/Weighted Average |
$ | 6,156,908 | $ | 6,310,570 | $ | 102.46 | $ | 102.50 | 63.2 | (4) | 3.83 | % | 18.9 | % | ||||||||||||||
18
Table of Contents
| (1) | “Months to Reset” is the number of months remaining before the fixed rate on a hybrid ARM becomes a variable rate. At the end of the fixed period, the variable rate will be determined by the margin and the pre-specified caps of the ARM. After the fixed period, 100% of the hybrid ARMS in the portfolio reset annually. |
| (2) | CPR, or “Constant Prepayment Rate,” is a method of expressing the prepayment rate for a mortgage pool that assumes that a constant fraction of the remaining principal is prepaid each month or year. Specifically, the constant prepayment rate is an annualized version of the prior three month prepayment rate for those Agency RMBS held at June 30, 2011. Securities with no prepayment history are excluded from this calculation. |
| (3) | The Agency RMBS backed by 30 year mortgages in the portfolio are newly issued securities, and therefore, did not have three months of CPR history as of June 30, 2011. |
| (4) | Weighted average months to reset of our Hybrid ARM portfolio. |
As of June 30, 2011 and December 31, 2010, the Company’s Agency RMBS were purchased at a net premium to their par value due to the average interest rates on these investments being higher than prevailing market rates. As of June 30, 2011 and December 31, 2010, approximately $201.9 million and $152.7 million, respectively, of unamortized premium was included in the cost basis of the securities.
Actual maturities of Agency RMBS are generally shorter than stated contractual maturities (which range up to 30 years), as they are affected by the contractual lives of the underlying mortgages, periodic payments and prepayments of principal. As of June 30, 2011 and December 31, 2010, the average final contractual maturity of the Company’s Agency RMBS portfolio is in year 2032 and 2031, respectively. Based on current estimates, the Agency RMBS will have a weighted average expected life of less than five years. Interest income on Agency RMBS for the three and six months ended June 30, 2011 was $64.7 million, and $104.7 million, respectively, and $16.5 million and $32.9 million for the three and six months ended June 30, 2010, respectively.
In order to mitigate its interest rate exposure, the Company enters into interest rate swap and cap contracts. Below is a summary of the Company’s interest rate swap and cap contracts transacted during the three and six months ended June 30, 2011 and 2010 (in thousands).
| Three & Six Months Ended June 30, 2011 |
Three & Six Months Ended June 30, 2010 |
|||||||||||||
| Trade Date |
Transaction |
Notional | Trade Date |
Transaction |
Notional | |||||||||
| February 2011 |
Opened | $ | 500,000 | April 2010 | Terminated | $ | (400,000 | ) | ||||||
| March 2011 |
Opened | 250,000 | April 2010 | Opened | 400,000 | |||||||||
| May 2011 |
Terminated | (300,000 | ) | May 2010 | Terminated | (640,000 | ) | |||||||
| May 2011 |
Opened | 300,000 | May 2010 | Opened | 740,000 | |||||||||
| June 2011 |
Opened | 300,000 | June 2010 | Terminated | (100,000 | ) | ||||||||
| Net Increase |
$ | 1,050,000 | June 2010 | Opened | 400,000 | |||||||||
| Net Increase | $ | 400,000 | ||||||||||||
19
Table of Contents
As of June 30, 2011 and December 31, 2010, the Company had net pledged Agency RMBS and U.S Treasury securities with a fair value of $109.1 million and $4.3 million, respectively, as collateral on interest rate swap and cap contracts. Below is a summary of our interest rate swap and cap contracts open as of June 30, 2011 and December 31, 2010 and for the three and six months ended June 30, 2011 and 2010 (dollars in thousands):
| Derivatives not designated as hedging instruments under ASC 815(a) | ||||||||||
| Interest Rate Swaps |
Notional Amount | Fair Value | Statement of Assets and Liabilities Location | |||||||
| June 30, 2011 |
$ | 0 | $ | 0 | Assets | |||||
| June 30, 2011 |
4,740,000 | (49,151 | ) | Liabilities | ||||||
| December 31, 2010 |
2,140,000 | 9,113 | Assets | |||||||
| December 31, 2010 |
1,550,000 | (9,757 | ) | Liabilities | ||||||
| Interest Rate Caps |
Notional Amount | Fair Value | Statement of Assets and Liabilities Location | |||||||
| June 30, 2011 |
$ | 700,000 | $ | 20,429 | Assets | |||||
| December 31, 2010 |
700,000 | 30,984 | Assets | |||||||
| Amount of Gain or (Loss) Recognized in Income on Derivative |
||||||||||||||||||
| Derivatives not designated as hedging |
Location of Gain or (Loss) Recognized in |
Three Months Ended June 30, | Six Months Ended June 30, | |||||||||||||||
| 2011 | 2010 | 2011 | 2010 | |||||||||||||||
| Interest rate swap and cap contracts |
Net gain (loss) from interest rate swap and cap contracts | $ | (86,188 | ) | $ | (18,860 | ) | $ | (87,367 | ) | $ | (28,900 | ) | |||||
| (a) | See note 2 for additional information on the Company’s purpose for entering into interest rate swaps and caps and the decision not to designate them as hedging instruments. |
Credit Risk
At June 30, 2011 and December 31, 2010, the Company continued to minimize its exposure to credit losses on its mortgage assets by purchasing Agency RMBS. The payment of principal and interest on Agency RMBS is guaranteed by Freddie Mac, Fannie Mae or Ginnie Mae. In September 2008, both Freddie Mac and Fannie Mae were placed in the conservatorship of the United States government. While it is hoped that the conservatorship will help stabilize Freddie Mac’s and Fannie Mae’s losses and overall financial position, there can be no assurance that it will succeed or that, if necessary, Freddie Mac or Fannie Mae will be able to satisfy their guarantees of Agency RMBS.
The current U.S. debt ceiling and budget deficit concerns have increased the possibility of the credit-rating agencies downgrading the U.S.’s credit rating for the first time in history. Because Fannie Mae and Freddie Mac are in conservatorship of the U.S. Government, if the U.S.’s credit rating was downgraded it would likely impact the credit risk associated with Agency RMBS and, therefore, decrease the value of the Agency RMBS in the Company’s portfolio. In addition, a downgrade of the U.S.’s credit rating would create broader financial turmoil and uncertainty, which would weigh heavily on the global banking system.
The Company’s CLOs do not have the backing of Fannie Mae, Freddie Mac or Ginnie Mae. Payment of principal and interest is dependent on the performance of the underlying loans, which are subject to borrower default and possible losses.
5. BORROWINGS
The Company leverages its Agency RMBS portfolio through the use of repurchase agreements. Each of the borrowing vehicles used by the Company bears interest at floating rates based on a spread above or below the London InterBank Offered Rate (“LIBOR”). The fair value of borrowings under repurchase agreements approximates their carrying amount due to the short-term nature of these financial instruments.
Certain information with respect to the Company’s borrowings is summarized in the following tables. Each of the borrowings listed is contractually due in one year or less (dollars in thousands).
| June 30, 2011 |
||||
| Outstanding borrowings |
$ | 7,548,091 | ||
| Interest accrued thereon |
$ | 2,181 | ||
| Weighted average borrowing rate |
0.25% | |||
| Weighted average remaining maturity (in days) |
37.6 | |||
| Fair value of the collateral(1) |
$ | 7,927,098 | ||
| December 31, 2010 |
||||
| Outstanding borrowings |
$ | 3,443,843 | ||
| Interest accrued thereon |
$ | 1,084 | ||
| Weighted average borrowing rate |
0.32% | |||
| Weighted average remaining maturity (in days) |
39.3 | |||
| Fair value of the collateral(1) |
$ | 3,657,185 | ||
| (1) | Collateral for borrowings consists of Agency RMBS. |
20
Table of Contents
At June 30, 2011 and December 31, 2010, the Company did not have any repurchase agreements where the amount at risk exceeded 10% of net assets.
6. SHARE CAPITAL
The Company authorized 500,000,000 shares of common stock having par value of $0.01 per share. As of June 30, 2011 and December 31, 2010, the Company had issued and outstanding 82,584,330 and 59,550,836 shares of common stock. The Company issued 23,033,494 and 40,794,324 shares of common stock during the six months ended June 30, 2011 and year ended December 31, 2010, respectively.
Below is a description of the warrants outstanding at December 31, 2010. There were no warrants outstanding at June 30, 2011.
| Expiration |
Additional shares of common stock |
Exercise Price | ||||||
| April 30, 2011 |
15,200 | $ | 11.00 | |||||
The Company also authorized 50,000,000 shares of preferred stock having a par value of $0.01 per share. As of June 30, 2011 and December 31, 2010, no such shares were issued or outstanding.
On February 15, 2011, the Company closed a public offering of 23,000,000 shares of its common stock at a public offering price of $12.35 per share for total net proceeds of approximately $275.8 million, after the underwriting discount and commissions and expenses.
The Company sponsors a dividend reinvestment and direct stock purchase plan through which stockholders may purchase additional shares of common stock by reinvesting some or all of the cash dividends received on shares of common stock. This plan became effective on June 22, 2010. Stockholders may also make optional cash purchases of shares of common stock subject to certain limitations detailed in the plan prospectus. From June 22, 2010 to December 31, 2010 the Company issued 607,902 shares under the plan raising approximately $8.0 million of net proceeds. For the six months ended June 30, 2011 the Company issued 6,957 shares under the plan raising approximately $87,452 of net proceeds. As of June 30, 2011 and December 31, 2010, there were approximately 9.4 million shares available for issuance under this plan.
On June 7, 2011 the Company entered into a sales agreement with JMP Securities LLC to, from time to time, publicly offer and sell up to 15,000,000 shares of the Company’s common stock in at-the-market transactions and/or privately negotiated transactions. As of June 30, 2011 the Company had not sold any common stock under the sales agreement. As of June 30, 2011, 15,000,000 shares of common stock remained available for issuance to be sold under the sales agreement.
7. MANAGEMENT AGREEMENT AND RELATED PARTY TRANSACTIONS
The Manager manages the Company’s day-to-day operations, subject to the direction and oversight of the Company’s board of directors. The Management Agreement was executed on February 10, 2006. The initial term of the Management Agreement expired on December 31, 2008, and it has been automatically renewed each year for a one-year term. The current term will expire on December 31, 2011. Going forward, the Management Agreement will be automatically renewed for a one-year term each anniversary date thereafter unless notice of non-renewal is given to the Company by the Manager. The Company’s independent directors review the Manager’s performance annually, and the Management Agreement may be terminated upon the affirmative vote of at least two-thirds of our independent directors, or by a vote of the holders of a majority of the outstanding shares of our common stock. In the event the Management Agreement is terminated as described above, the Company shall pay to the Manager a termination fee in accordance with the provisions of the Management Agreement. In the event the Company elects to internalize its management, the Management Agreement shall terminate without payment of any termination fee to the Manager.
The Management Agreement provides, among other things, that the Company pays to the Manager, in exchange for managing the day-to-day operations of the Company, certain fees and reimbursements, consisting of a base management fee and reimbursement for out-of-pocket and certain other costs incurred by the Manager and on behalf of the Company. The base management fee, which is paid monthly, was equal to 1/12 of (A) 1.50% of the first $250,000,000 of Net Assets (as defined in the Management Agreement), (B) 1.25% of such Net Assets that are greater than $250,000,000 and less than or equal to $500,000,000, and (C) 1.00% of such Net
21
Table of Contents
Assets that are greater than $500,000,000. The Company is also required to reimburse the Manager for its pro-rata portion of rent, utilities, legal and investment services, market information systems and research publications and materials. In addition, the Company recognized share-based compensation expense related to common stock options and restricted common stock granted to the Company’s executive officers and Manager Designees, which is included in related party management compensation on the statement of operations.
For the three and six months ended June 30, 2011 and 2010, the Company incurred the following in base management fees and expense reimbursement (in thousands):
| Three Months Ended June 30, | Six Months Ended June 30, | |||||||||||||||
| 2011 | 2010 | 2011 | 2010 | |||||||||||||
| Base Management Fees |
$ | 3,041 | $ | 987 | $ | 5,730 | $ | 1,924 | ||||||||
| Expense Reimbursement |
270 | 165 | 421 | 304 | ||||||||||||
| Total |
$ | 3,311 | $ | 1,152 | $ | 6,151 | $ | 2,228 | ||||||||
8. CONTINGENCIES
The Company enters into certain contracts that contain a variety of indemnifications, principally with the Manager and brokers. The maximum potential amount of future payment the Company could be required to make under these indemnification provisions is unknown. The Company has not incurred any costs to defend lawsuits or settle claims related to these indemnification agreements. As a result, the estimated fair value of these agreements is minimal. Accordingly, the Company has no liabilities recorded for these agreements as of June 30, 2011 and December 31, 2010.
9. FINANCIAL HIGHLIGHTS
In accordance with financial reporting requirements applicable to investment companies, the Company has included below certain financial highlight information for the three and six months ended June 30, 2011 and 2010:
| Per Share | ||||||||||||||||
| Three Months Ended June 30, | Six Months Ended June 30, | |||||||||||||||
| 2011 | 2010 | 2011 | 2010 | |||||||||||||
| Net asset value, beginning of period |
$ | 11.74 | $ | 13.03 | $ | 11.59 | $ | 13.02 | ||||||||
| Net income: |
||||||||||||||||
| Net investment income |
0.68 | (a) | 0.75 | (a) | 1.17 | (a) | 1.48 | (a) | ||||||||
| Net gain (loss) from investments and swap and cap contracts |
0.52 | (a) | 0.72 | (a) | 0.80 | (a) | 0.53 | (a) | ||||||||
| Net income |
1.20 | 1.47 | 1.97 | 2.01 | ||||||||||||
| Capital transactions: |
||||||||||||||||
| Distributions to shareholders |
(0.60 | ) | (0.60 | ) | (1.20 | ) | (1.15 | ) | ||||||||
| Issuance of common shares and amortization of related party management compensation |
0.01 | (a) | (0.75 | )(a) | (0.01 | )(a) | (0.73 | )(a) | ||||||||
| Net decrease in net asset value from capital transactions |
(0.59 | ) | (1.35 | ) | (1.21 | ) | (1.88 | ) | ||||||||
| Net asset value, end of period |
$ | 12.35 | $ | 13.15 | $ | 12.35 | $ | 13.15 | ||||||||
| Total return (%) |
10.31 | %(b) | 5.53 | %(b) | 16.91 | %(b) | 9.83 | %(b) | ||||||||
| Ratios to Average Net Assets |
||||||||||||||||
| Expenses before interest expense |
1.92 | %(c) | 3.21 | %(c) | 2.02 | %(c) | 3.39 | %(c) | ||||||||
| Total expenses |
3.68 | %(c) | 4.87 | %(c) | 3.66 | %(c) | 5.02 | %(c) | ||||||||
| Net investment income |
22.24 | %(c) | 21.69 | %(c) | 19.53 | %(c) | 21.87 | %(c) | ||||||||
| (a) | Calculated based on average shares outstanding during the period. Average shares outstanding include vested and unvested restricted shares and differs from weighted average shares outstanding used in calculating EPS (see note 3). |
| (b) | Calculated based on net asset value per share. Not computed on an annualized basis. |
| (c) | Computed on an annualized basis. |
10. SUBSEQUENT EVENTS
On July 1, 2011, an aggregate of 7,074 shares of restricted common stock were granted to certain directors as a portion of their compensation for serving on the Company’s board of directors.
22
Table of Contents
On July 20, 2011, the Company entered into a non-binding term sheet with Sharpridge Capital Management, L.P. (“Sharpridge”), a Delaware limited partnership, and a sub-advisor to Cypress Sharpridge Advisors LLC, the Company’s manager, that includes the material terms and conditions pursuant to which the Company intends to complete an internalization of its management (the “Internalization”). The term sheet provides that the Company intends to (i) acquire all of the assets that Sharpridge uses to oversee the Company’s day-to-day operations and actively manage the Company’s investment portfolio for a cash purchase price of $750,000, and (ii) offer employment to all of the 13 current employees of Sharpridge, including those individuals who are the current executive officers of the Company. The Company expects to enter into employment agreements with its executive officers and to establish a compensation program for its employees that the compensation committee of the Company’s board of directors has diligently created based on consultation with a third-party compensation consultant. In connection with the completion of the Internalization, the management agreement by and between the Company and its manager, and other ancillary agreements related thereto, will be terminated without the payment of any termination fee. The completion of the transactions contemplated by the term sheet is scheduled to take place effective as of September 1, 2011, and is subject to negotiation, execution and delivery of mutually acceptable agreements, including an asset purchase agreement and employment agreements for the Company’s executive officers.
| Item 2. | Management’s Discussion and Analysis of Financial Condition and Results of Operations |
In this Quarterly Report on Form 10-Q, we refer to Cypress Sharpridge Investments, Inc. as “we,” “us,” “our company,” or “our,” unless we specifically state otherwise or the context indicates otherwise. The following defines certain of the commonly used terms in this quarterly report on Form 10-Q: RMBS refers to residential mortgage-backed securities; agency securities or Agency RMBS refers to our RMBS that are issued or whose principal and interest payments are guaranteed by a federally chartered corporation, such as the Federal National Mortgage Association (“Fannie Mae”) or the Federal Home Loan Mortgage Corporation (“Freddie Mac”), or an agency of the U.S. government, such as the Government National Mortgage Association (“Ginnie Mae”); ARMs refers to adjustable-rate mortgage loans that typically have interest rates that adjust annually to an increment over a specified interest rate index; and hybrids refers to ARMs that have interest rates that are fixed for a specified period of time and, thereafter, generally adjust annually to an increment over a specified interest rate index.
The following discussion should be read in conjunction with our financial statements and accompanying notes included in Item 1 of this quarterly report on Form 10-Q as well as our Annual Report on Form 10-K for the fiscal year ended December 31, 2010 filed on February 8, 2011.
Forward Looking Statements
When used in this Quarterly Report on Form 10-Q, in future filings with the Securities and Exchange Commission (“SEC”) or in press releases or other written or oral communications, statements which are not historical in nature, including those containing words such as “believe,” “expect,” “anticipate,” “estimate,” “plan,” “continue,” “intend,” “should,” “may” or similar expressions, are intended to identify “forward-looking statements” within the meaning of Section 27A of the Securities Act of 1933, as amended, and Section 21E of the Securities Exchange Act of 1934, as amended, and, as such, may involve known and unknown risks, uncertainties and assumptions. The forward-looking statements we make in this Quarterly Report on Form 10-Q include, but are not limited to, statements about the following:
| • | increases in interest rates and inflation; |
| • | our investment, financing and hedging strategy and the success of these strategies; |
| • | the effect of increased prepayment rates on our portfolio; |
| • | our ability to convert our assets into cash or extend the financing terms related to our assets; |
| • | our ability to quantify risks based on historical experience; |
| • | our ability to be taxed as a real estate investment trust (“REIT”) and to maintain an exemption from registration under the Investment Company Act of 1940, as amended (the “Investment Company Act”); |
| • | our assessment of counterparty risk; |
| • | our liquidity; |
| • | our asset valuation policies; |
| • | our distribution policy; |
| • | the effect of recent U.S. Government actions on the housing and credit markets; |
| • | our ability to complete an internalization transaction; and |
| • | the impact of an inability to reach an agreement on a national debt ceiling or budget. |
Forward-looking statements are based on our beliefs, assumptions and expectations of our future performance, taking into account all information currently available to us. These beliefs, assumptions and expectations are subject to risks and uncertainties and can change as a result of many possible events or factors, not all of which are known to us. If a change occurs, our business, financial condition, liquidity and results of operations may vary materially from those expressed in our forward-looking statements. The following factors could cause actual results to vary from our forward-looking statements:
| • | the factors referenced in our Annual Report on Form 10-K for the fiscal year ended December 31, 2010, including those set forth under the section captioned “Risk Factors;” |
| • | the factors referenced in Item 1A. of this Form 10-Q; |
| • | changes in our investment, financing and hedging strategy; |
| • | the adequacy of our cash flow from operations and borrowings to meet our short term liquidity requirements; |
| • | the liquidity of our portfolio; |
| • | unanticipated changes in our industry, interest rates, the credit markets, the general economy or the real estate market; |
| • | changes in interest rates and the market value of our Agency RMBS; |
| • | changes in the prepayment rates on the mortgage loans underlying our Agency RMBS; |
23
Table of Contents
| • | our ability to borrow to finance our assets; |
| • | changes in government regulations affecting our business; |
| • | our ability to maintain our qualification as a REIT for federal income tax purposes; |
| • | our ability to maintain our exemption from registration under the Investment Company Act; and |
| • | risks associated with investing in real estate assets, including changes in business conditions and the general economy. |
These and other risks, uncertainties and factors, including those described elsewhere in this report, could cause our actual results to differ materially from those projected in any forward-looking statements we make. All forward-looking statements speak only as of the date on which they are made. New risks and uncertainties arise over time and it is not possible to predict those events or how they may affect us. Except as required by law, we are not obligated to, and do not intend to, update or revise any forward-looking statements, whether as a result of new information, future events or otherwise.
Overview
We are a specialty finance company created with the objective of achieving consistent risk-adjusted investment income. We seek to achieve this objective by investing, on a leveraged basis, in Agency RMBS. In addition, our investment guidelines permit investments in collateralized mortgage obligations issued by a government agency or a government sponsored entity that are collateralized by Agency RMBS (“CMOs”), although we had not invested in any CMOs as of June 30, 2011. We are currently managed by Cypress Sharpridge Advisors LLC, a joint venture between affiliates of The Cypress Group and Sharpridge Capital Management, L.P. We commenced operations in February 2006 and completed our initial public offering in June 2009. Our common stock is traded on the New York Stock Exchange under the symbol “CYS”.
We earn investment income from our investment portfolio, and we use leverage to seek to enhance our returns. Our net investment income is generated primarily from the difference, or net spread, between the interest income we earn on our investment portfolio and the cost of our borrowings and hedging activities. The amount of net investment income we earn on our investments depends in part on our ability to control our financing costs, which comprise a significant portion of our operating expenses. Although we leverage our portfolio investments in Agency RMBS to seek to enhance our potential returns, leverage also may exacerbate losses.
While we use hedging to mitigate some of our interest rate risk, we do not hedge all of our exposure to changes in interest rates. This is because there are practical limitations on our ability to insulate our portfolio from all potential negative consequences associated with changes in short term interest rates in a manner that will allow us to seek attractive spreads on our portfolio.
In addition to investing in issued pools of Agency RMBS, we regularly utilize forward settling transactions, including forward-settling purchases of Agency RMBS where the pool is “to-be-announced” (“TBAs”). Pursuant to these TBA transactions, we agree to purchase, for future delivery, Agency RMBS with certain principal and interest terms and certain types of underlying collateral, but the particular Agency RMBS to be delivered is not identified until shortly before the TBA settlement date. For our other forward settling transactions, we agree to purchase, for future delivery, Agency RMBS; however, unlike our TBAs, these forward settling transactions reference an identified Agency RMBS.
On February 15, 2011, the Company successfully completed a public offering of 23,000,000 shares of common stock, raising approximately $275.8 million of net proceeds, bringing the total number of shares of common stock outstanding to 82,584,330 at June 30, 2011.
We have elected to be taxed as a REIT and have complied, and intend to continue to comply, with the provisions of the Internal Revenue Code of 1986, as amended (the “Internal Revenue Code”) with respect thereto. Accordingly, we generally do not expect to be subject to federal income tax on our REIT taxable income that we currently distribute to our stockholders if certain asset, income and ownership tests and recordkeeping requirements are fulfilled. Even if we maintain our qualification as a REIT, we may be subject to some federal, state and local taxes on our income.
On July 20, 2011, the Company issued a press release announcing it has entered into a non-binding term sheet with Sharpridge that includes the material terms and conditions pursuant to which the Company intends to complete an internalization of its management. The term sheet provides that the Company intends to (i) acquire all of the assets that Sharpridge uses to oversee the Company’s day-to-day operations and actively manage the Company’s investment portfolio for a cash purchase price of $750,000, and (ii) offer employment to all of the 13 current employees of Sharpridge, including those individuals who are the current executive officers of the Company. The Company expects to enter into employment agreements with its executive officers and to establish a compensation program for its employees that the compensation committee of the Company’s board of directors has diligently created based on consultation with a third-party compensation consultant. In connection with the completion of the Internalization, the management agreement by and between the Company and its manager, and other ancillary agreements related thereto, will be terminated without the payment of any termination fee. The completion of the transactions contemplated by the term sheet is scheduled to take place effective as of September 1, 2011, and is subject to negotiation, execution and delivery of mutually acceptable agreements, including an asset purchase agreement and employment agreements for the Company’s executive officers.
Since the completion of the Company’s initial public offering, the Company’s board of directors has periodically reviewed and analyzed the potential internalization of the Company’s management structure. In connection with this review and analysis of an internalization of management, the board of directors has received a significant amount of information, consulted with management and various legal, accounting, tax and compensation advisors, and considered the Company’s short-term and long-term interests. Based on the terms and conditions set forth in the term sheet, the board of directors believes that an internalization is in the best interests of the Company and its stockholders primarily because it will achieve economies of scale for operating expenses as the Company continues to increase its capital, more effectively address management and administrative needs, and further align the interests of those individuals responsible for executing the Company’s strategy with the interests of the Company’s stockholders over the long-term.
Factors that Affect our Results of Operations and Financial Condition
A variety of industry and economic factors may impact our results of operations and financial condition. These factors include:
| • | interest rate trends; |
| • | prepayment rates on mortgages underlying our Agency RMBS, and credit trends insofar as they affect prepayment rates; |
| • | competition for investments in Agency RMBS; |
| • | actions taken by the U.S. Federal Reserve and the U.S. Treasury; and |
| • | other market developments. |
24
Table of Contents
In addition, a variety of factors relating to our business may also impact our results of operation and financial condition. These factors include:
| • | our degree of leverage; |
| • | our access to funding and borrowing capacity; |
| • | our borrowing costs; |
| • | our hedging activities; |
| • | changes in the credit ratings of the securities in our portfolio; |
| • | the market value of our investments; and |
| • | the REIT requirements and the requirements to qualify for a registration exemption under the Investment Company Act. |
We anticipate that, for any period during which changes in the interest rates earned on our assets do not coincide with interest rate changes on the corresponding liabilities, such assets will reprice more slowly than the corresponding liabilities. Consequently, changes in interest rates, particularly short term interest rates, may significantly influence our net investment income.
Our net investment income may be affected by a difference between actual prepayment rates and our projections. Prepayments on loans and securities may be influenced by changes in market interest rates and homeowners’ ability and desire to refinance their mortgages. To the extent we have acquired assets at a premium or discount to par value, changes in prepayment rates may impact our anticipated yield.
Trends and Recent Market Impacts
The uncertainty in the U.S. interest rate markets in 2011 has produced volatility and opportunities in our markets. Early in 2011, optimism about an economic acceleration caused many economists to increase their U.S. GDP forecast, with some predicting a U.S. Federal Reserve tightening in early in 2012. However, due to (i) recent U.S. Department of Labor payroll data, (ii) states continued paring of payrolls and the potential of the federal government implementing deficit reduction measures, and (iii) the cautious pace of private sector job growth, most economists are now expecting continued lackluster economic growth in the U.S. Additionally, inflation and wage pressure expectations are low. Several foreign central banks have aggressively tightened monetary policy in their countries to moderate growth and commodity inflation; these measures appear to be working as global commodity prices have moderated. As a result, many economists have pushed out their forecasts for a tightening of monetary policy in the U.S. to late 2012 or 2013 at the earliest. This environment has created strong demand for Agency RMBS and has also reduced the costs of our financing and hedging.
The current U.S. debt ceiling and budget deficit concerns have increased the possibility of the credit-rating agencies downgrading the U.S.’s credit rating for the first time in history. Because Fannie Mae and Freddie Mac are in conservatorship of the U.S. Government, if the U.S.’s credit rating was downgraded it would likely impact the credit risk associated with Agency RMBS and, therefore, decrease the value of the Agency RMBS in our portfolio. In addition, a downgrade of the U.S.’s credit rating would create broader financial turmoil and uncertainty, which would weigh heavily on the global banking system.
The following trends and recent market impacts may also affect our business:
Interest Rates and Liquidity
For the six months ended June 30, 2011 long term interest rates continued to fall. The main drivers of the decrease in long term interest rates continue to be weaker than expected economic data and market fears about Greece’s sovereign debt crisis; however, we believe that the conclusion of the U.S. Federal Reserve’s second round of quantitative easing has investors concerned about higher interest rates. At the close of the second quarter of 2011, interest rates were at the lowest levels of the year and anticipated U.S. Treasury supply was still high. The mortgage market has continued to benefit from a low interest rate environment.
Currently the U.S. economy appears to be in a weak recovery with little inflationary pressures. As a result, the U.S. Federal Funds Target Rate remained at 0-0.25%, with no change since mid-December 2008. Since December 2009, 30-Day LIBOR has also remained low at 0.186% at June 30, 2011. The availability of repurchase agreement financing is stable with interest rates between 0.23% and 0.27% for 30-90 day repurchase agreements at June 30, 2011. The following table shows 30-Day LIBOR, 3-Month LIBOR and the U.S. Federal Funds Target Rate at the end of each respective fiscal quarter:
| Date |
30-Day LIBOR | 3-Month LIBOR | Federal Funds Target Rate | |||||||||
| June 30, 2011 |
0.186 | % | 0.246 | % | 0.25 | % | ||||||
| March 31, 2011 |
0.243 | % | 0.303 | % | 0.25 | % | ||||||
| December 31, 2010 |
0.261 | % | 0.303 | % | 0.25 | % | ||||||
| September 30, 2010 |
0.256 | % | 0.290 | % | 0.25 | % | ||||||
| June 30, 2010 |
0.348 | % | 0.534 | % | 0.25 | % | ||||||
| March 31, 2010 |
0.249 | % | 0.292 | % | 0.25 | % | ||||||
| December 31, 2009 |
0.231 | % | 0.251 | % | 0.25 | % | ||||||
Source: Bloomberg
25
Table of Contents
Longer-term interest rates fell sharply in 2010. Rates on three-year interest rate swaps, currently one of our primary hedging vehicles, decreased by 78 basis points during the year ended December 31, 2010, from 2.06% to 1.28%; however these rates increased in during the three months ended March 31, 2011 to 1.57%, but have since decreased to 1.15% at June 30, 2011. Meanwhile, 3-Month LIBOR, which is the rate used to calculate the interest payments we receive on interest rate swaps and interest rate caps, if any, also increased during the year ended December 31, 2010 by five basis points, ending 2010 at 0.303% but this rate has also come down recently to 0.246% at June 30, 2011.
In August 2010 yields on Agency RMBS fell to their lowest levels in more than a year, with prices reaching record highs. While the yield on a par-priced Fannie Mae Agency RMBS backed by 30 year fixed rate mortgage loans went as low as 3.29% at August 31, 2010, by June 30, 2011 it had risen to 4.02%, only 11 basis points lower than the 4.13% yield at December 31, 2010. During the three months ended June 30, 2011, the Company purchased Agency RMBS of $820.8 million with a weighted average yield of 2.78%.
Yields on U.S. Treasury securities followed a similar trend as Agency RMBS with the yield on five year U.S. Treasury notes falling to as low as 1.16% at October 31, 2010 but increasing to 1.76% at June 30, 2011, 25 basis points lower than the 2.01% yield at December 31, 2010. The following table illustrates this situation by comparing market levels for three benchmark securities or rates, the yield on five year U.S. Treasury Notes, the three year interest rate swap rate and the price of 15 year Fannie Mae 4.5% Agency RMBS:
| Date |
Five Year U.S. Treasury Note | Three Year Interest Rate Swap Rates | Market Prices of 15 Year Fannie Mae 4.5% Agency RMBS |
|||||||||
| June 30, 2011 |
1.76 | % | 1.1465 | % | $ | 106.047 | ||||||
| March 31, 2011 |
2.28 | % | 1.5710 | % | $ | 104.672 | ||||||
| December 31, 2010 |
2.01 | % | 1.2785 | % | $ | 104.797 | ||||||
| September 30, 2010 |
1.26 | % | 0.8705 | % | $ | 105.203 | ||||||
| June 30, 2010 |
1.77 | % | 1.3315 | % | $ | 105.484 | ||||||
| March 31, 2010 |
2.54 | % | 1.8050 | % | $ | 103.672 | ||||||
| December 31, 2009 |
2.68 | % | 2.0560 | % | $ | 102.984 | ||||||
Source: Bloomberg
One of the main factors impacting market prices during the first three months of 2010 was the U.S. Federal Reserve’s program to purchase Agency RMBS, which commenced in January 2009 and was terminated on March 31, 2010. In total, $1.25 trillion of Agency RMBS was purchased. The market expectation was that when this program terminated, the demand for these securities would decrease and likely reduce the market price for Agency RMBS. However, we continue to see strong demand as these securities remain desirable assets in the current economic environment.
Prepayment Rates and Loan Buy-back Programs
In early March 2010, both Freddie Mac and Fannie Mae announced they would purchase from the pools of mortgage loans underlying RMBS that they issued, all mortgage loans that are more than 120 days delinquent. The impact of these programs is reflected in the constant prepayment rate, or CPR, of our portfolio. Because a substantial portion of our portfolio consists of Agency RMBS backed by 15 year fixed rate mortgage loans, which have low delinquency rates, these programs did not cause a significant increase in the CPR of our portfolio.
During the year ended December 31, 2010, the prepayment rates changed primarily in line with the delinquent loan purchase programs described above. During the first six months of 2011, prepayment rates on Agency RMBS decreased compared to 2010. The continued weak U.S. housing market and high unemployment have reduced many U.S. homeowners ability to refinance their mortgages. The following table shows the prepayment rates for Fannie Mae Agency RMBS backed by 15 year and 30 year fixed rate mortgages:
| Jan-10 | Feb-10 | Mar-10 | Apr-10 | May-10 | Jun-10 | Jul-10 | Aug-10 | Sep-10 | Oct-10 | Nov-10 | Dec-10 | |||||||||||||||||||||||||||||||||||||
| 15 Year |
13.9 | % | 12.1 | % | 15.5 | % | 15.7 | % | 16.5 | % | 16.8 | % | 16.8 | % | 21.4 | % | 23.0 | % | 24.1 | % | 25.3 | % | 24.6 | % | ||||||||||||||||||||||||
| 30 Year |
15.4 | % | 14.7 | % | 27.7 | % | 28.9 | % | 28.1 | % | 17.5 | % | 18.5 | % | 23.6 | % | 24.9 | % | 25.6 | % | 27.0 | % | 25.8 | % | ||||||||||||||||||||||||
| Jan-11 | Feb-11 | Mar-11 | Apr-11 | May-11 | Jun-11 | |||||||||||||||||||||||||||||||||||||||||||
| 15 Year |
17.8 | % | 13.6 | % | 13.7 | % | 12.2 | % | 12.2 | % | 14.7 | % | ||||||||||||||||||||||||||||||||||||
| 30 Year |
19.5 | % | 15.5 | % | 15.4 | % | 13.4 | % | 13.0 | % | 14.9 | % | ||||||||||||||||||||||||||||||||||||
26
Table of Contents
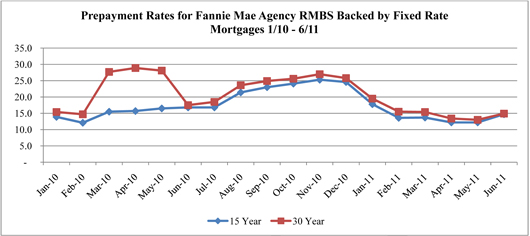
Source: eMBS
Government Activity
In February 2011, the U.S. Department of the Treasury along with the U.S. Department of Housing and Urban Development released a report titled “Reforming America’s Housing Finance Market” to Congress outlining recommendations for reforming the U.S. housing system, specifically Fannie Mae and Freddie Mac, and transforming the government’s involvement in the housing market. It is unclear how future legislation may impact the housing finance market and the investing environment for Agency RMBS as the method of reform is undecided and has not yet been defined by the regulators.
In November 2010, the U.S. Federal Reserve announced a program to purchase an additional $600 billion of longer-term Treasury securities by the end of the second quarter of 2011, a pace of about $75 billion per month. One of the effects of this program may be to increase the price of Agency RMBS, which may also decrease our net interest margin. Now that the program has terminated it may cause a decrease in demand for these securities, which likely would reduce their market price.
On July 21, 2010, President Obama signed into law the Dodd-Frank Wall Street Reform and Consumer Protection Act, or the Act. This legislation aims to restore responsibility and accountability to the financial system. It is unclear how this legislation may impact the borrowing environment, investing environment for Agency RMBS and interest rate swaps and other derivatives as much of the Act’s implementation has not yet been defined by the regulators.
Certain programs initiated by the U.S. Government, through the Federal Housing Administration (“FHA”) and the Federal Deposit Insurance Corporation (“FDIC”), to provide homeowners with assistance in avoiding residential mortgage loan foreclosures are currently in effect. The programs may involve, among other things, the modification of mortgage loans to reduce the principal amount of the loans or the rate of interest payable on the loans, or to extend the payment terms of the loans. One such program is the Hope for Homeowners program, which is effective from October 1, 2008 through September 30, 2011 and will enable certain distressed borrowers to refinance their mortgages into FHA-insured loans. In addition, in February 2009, the U.S. Treasury announced the Homeowner Affordability and Stability Plan (“HASP”), which is a multi-faceted plan intended to prevent residential mortgage foreclosures. While the effect of these programs has not been as extensive as originally expected, the effect of such programs as the Hope for Homeowners program and HASP for holders of Agency RMBS could be that such holders would experience changes in the anticipated yields of their Agency RMBS due to (i) increased prepayment rates on their Agency RMBS and (ii) lower interest and principal payments on their Agency RMBS.
Credit Spreads
Over the past few years, the credit markets generally experienced tightening credit spreads (specifically, spreads between U.S. Treasury securities and other securities that are identical in all respects except for ratings) mainly due to the strong demand for lending opportunities. Generally, when credit spreads tighten, the value of Agency RMBS increases, which results in an increase in our book value. Due to these tightening credit spreads our book value has increased. If credit spreads were to widen, we expect the market value of Agency RMBS would decrease, which could reduce our book value, but also create an attractive opportunity to reinvest principal and interest from our existing portfolio as well as deploy new capital into higher-yielding Agency RMBS.
27
Table of Contents
For a discussion of additional risks relating to our business see “Risk Factors” disclosed in our Annual Report on Form 10-K for the fiscal year ended December 31, 2010 filed on February 8, 2011.
Financial Condition
As of June 30, 2011 and December 31, 2010, the Agency RMBS in our portfolio were purchased at a net premium to their par value due to the average interest rates on these investments being higher than prevailing market rates. As of June 30, 2011 and December 31, 2010, we had approximately $201.9 million and $152.7 million, respectively, of unamortized premium included in the cost basis of our investments.
As of June 30, 2011 and December 31, 2010, our Agency RMBS portfolio consisted of the following assets:
June 30, 2011
| Par Value | Fair Value | Weighted Average | ||||||||||||||||||||||||||
| Asset Type |
(in thousands) | Cost/Par | Fair Value/Par |
MTR(1) | Coupon | CPR(2) | ||||||||||||||||||||||
| 15 Year Fixed Rate |
$ | 4,439,585 | $ | 4,605,393 | $ | 102.33 | $ | 103.73 | N/A | 3.89 | % | 5.5 | % | |||||||||||||||
| 20 Year Fixed Rate |
626,399 | 643,866 | 102.35 | 102.79 | N/A | 4.14 | % | 2.5 | % | |||||||||||||||||||
| 30 Year Fixed Rate |
588,274 | 625,974 | 103.33 | 106.41 | N/A | 5.00 | % | N/A | (3) | |||||||||||||||||||
| Hybrid ARMs |
2,849,820 | 2,960,036 | 102.24 | 103.87 | 63.1 | 3.37 | % | 12.8 | % | |||||||||||||||||||
| Total/Weighted Average |
$ | 8,504,078 | $ | 8,835,269 | $ | 102.37 | $ | 103.89 | 63.1 | (4) | 3.81 | % | 7.3 | % | ||||||||||||||
December 31, 2010
| Par Value | Fair Value | Weighted Average | ||||||||||||||||||||||||||
| Asset Type |
(in thousands) | Cost/Par | Fair Value/Par |
MTR(1) | Coupon | CPR(2) | ||||||||||||||||||||||
| 15 Year Fixed Rate |
$ | 3,549,194 | $ | 3 ,622,862 | $ | 102.16 | $ | 102.08 | N/A | 3.87 | % | 23.1 | % | |||||||||||||||
| 20 Year Fixed Rate |
647,360 | 660,237 | 102.38 | 101.99 | N/A | 4.14 | % | 6.9 | % | |||||||||||||||||||
| 30 Year Fixed Rate |
223,047 | 238,549 | 105.60 | 106.95 | N/A | 5.55 | % | 28.2 | % | |||||||||||||||||||
| Hybrid ARMs |
1,737,307 | 1,788,922 | 102.70 | 102.97 | 63.2 | 3.43 | % | 18.4 | % | |||||||||||||||||||
| Total/Weighted Average |
$ | 6,156,908 | $ | 6,310,570 | $ | 102.46 | $ | 102.50 | 63.2 | (4) | 3.83 | % | 18.9 | % | ||||||||||||||
| (1) | “Months to Reset” is the number of months remaining before the fixed rate on a hybrid ARM becomes a variable rate. At the end of the fixed period, the variable rate will be determined by the margin and the pre-specified caps of the ARM. After the fixed period, 100% of the hybrid ARMS in the portfolio reset annually. |
| (2) | CPR, or “Constant Prepayment Rate,” is a method of expressing the prepayment rate for a mortgage pool that assumes that a constant fraction of the remaining principal is prepaid each month or year. Specifically, the constant prepayment rate is an annualized version of the prior three month prepayment rate for those Agency RMBS held at June 30, 2011. Securities with no prepayment history are excluded from this calculation. |
| (3) | The Agency RMBS backed by 30 year mortgages in the portfolio are newly issued securities, and therefore, did not have three months of CPR history as of June 30, 2011. |
| (4) | Weighted average months to reset of our Hybrid ARM portfolio. |
Actual maturities of Agency RMBS are generally shorter than stated contractual maturities (which range up to 30 years), as they are affected by the contractual lives of the underlying mortgages, periodic payments and prepayments of principal. As of June 30, 2011 and December 31, 2010, the average final contractual maturity of the mortgage portfolio is in year 2032 and 2031, respectively.
The average expected life of our Agency RMBS reflects the estimated average period of time the securities in the portfolio will remain outstanding. The average expected lives of our Agency RMBS do not exceed five years, based upon prepayment models obtained through subscription-based financial information service providers. The prepayment model considers current yield, forward yield, steepness of the yield curve, current mortgage rates, the mortgage rate of the outstanding loan, loan age, margin and volatility. The actual lives of the Agency RMBS in our investment portfolio could be longer or shorter than those estimates depending on the actual prepayment rates experienced over the lives of the applicable securities. As of June 30, 2011 and December 31, 2010 we had CLOs with a fair value of $24.1 million and $20.5 million, respectively.
Hedging Instruments
We generally intend to hedge as much of the interest rate risk as we determine is in the best interests of our stockholders. Our policies do not contain specific requirements as to the percentages or amount of interest rate risk that our Manager is required to hedge. No assurance can be given that our hedging activities will have the desired beneficial impact on our results of operations or financial condition.
28
Table of Contents
Interest rate hedging may fail to protect or could adversely affect us because, among other things:
| • | interest rate hedging can be expensive, particularly during periods of rising and volatile interest rates; |
| • | available interest rate hedging may not correspond directly with the interest rate risk for which protection is sought; |
| • | due to prepayments on assets and repayments of debt securing such assets, the duration of the hedge may not match the duration of the related liability or asset; |
| • | the credit quality of the hedging counterparty may be downgraded to such an extent that it impairs our ability to sell or assign our side of the hedging transaction; and |
| • | the hedging counterparty may default on its obligation to pay. |
We engage in interest rate swaps and caps as a means of mitigating our interest rate risk on forecasted interest expense associated with repurchase agreements for the term of the swap contract. An interest rate swap is a contractual agreement entered into by two counterparties under which each agrees to make periodic payments to the other for an agreed period of time based upon a notional amount of principal. Under the most common form of interest rate swap, commonly known as a fixed-floating interest rate swap, a series of fixed interest rate payments on a notional amount of principal is exchanged for a series of floating interest rate payments on such notional amount. In a simple interest rate cap, one investor pays a premium for a notional principal amount based on a capped interest rate (the “cap rate”). When the floating interest rate (the “floating rate”) exceeds the cap rate, the investor receives a payment from the cap counterparty equal to the difference between the floating rate and the cap rate on the same notional principal amount for a specified period of time. Alternatively, an investor may receive a premium and pay the difference in cap rate and floating rate.
At June 30, 2011, we were a party to 15 interest rate swaps and three interest rate caps (whereby we will receive interest payments when three-month LIBOR exceeds the cap rate) with maturities between May 2013 and June 2016 with an aggregate notional amount of $5,440.0 million and a fair value of approximately $(28.7) million. At December 31, 2010, we were a party to 12 interest rate swaps and three interest rate caps (whereby we will receive interest payments when three-month LIBOR exceeds the cap rate) with maturities between May 2013 and November 2015 with an aggregate notional amount of $4,390.0 million and a fair value of approximately $30.3 million. As of June 30, 2011 and December 31, 2010, the weighted average fixed rate on our interest rate swaps was 1.491% and 1.354%, respectively. As of June 30, 2011 and December 31, 2010 the weighted average cap rate on our interest rate caps was 1.593%.
The current fair value of interest rate swaps and caps is heavily dependent on the current market fixed rate, the corresponding term structure of floating rates (known as the yield curve) as well as the expectation of changes in future floating rates. As expectations of future floating rates change, the fair value of interest rate swaps changes.
Liabilities
We have entered into repurchase agreements to finance some of our purchases of Agency RMBS. These agreements are secured by our Agency RMBS and bear interest at rates that have historically moved in close relationship to LIBOR. At June 30, 2011, we had approximately $7,548.1 million of liabilities pursuant to repurchase agreements with 23 counterparties that had weighted average interest rates of approximately 0.25%, and maturities of between 11 and 106 days. In addition, as of June 30, 2011, we had approximately $626.5 million in payables for securities purchased. A portion of the payable for securities purchased will be financed through repurchase agreements. At December 31, 2010, we had approximately $3,443.8 million of liabilities pursuant to repurchase agreements with 20 counterparties that had weighted average interest rates of approximately 0.32%, and maturities of between seven and 80 days. In addition, as of December 31, 2010 we had approximately $2,234.4 million in payables for securities purchased. Because we measure leverage as total liabilities divided by net assets, the approximately $626.5 million and $2,234.4 million payable for securities purchased is included in our June 30, 2011 and December 31, 2010 leverage ratio of 8.1 to 1 and 8.3 to 1, respectively. Below is a summary of our payable for securities purchased as of June 30, 2011 and December 31, 2010 (in thousands).
June 30, 2011
| Forward Settling Purchases |
Settle Date | Par Value | Payable | |||||||||
| FNMA - 15 Year 4% Fixed |
7/19/2011 | $ | 199,034 | $ | 206,337 | |||||||
| FNMA - 15 Year 4% Fixed |
7/19/2011 | 200,000 | 207,275 | |||||||||
| FNMA - 30 Year 3.1% Hybrid ARM |
8/23/2011 | 35,000 | 35,924 | |||||||||
| FNMA - 30 Year 3.1% Hybrid ARM |
8/23/2011 | 15,000 | 15,408 | |||||||||
| FNMA - 30 Year 3.25% Hybrid ARM |
8/23/2011 | 40,000 | 41,354 | |||||||||
| FNMA - 30 Year 3.28% Hybrid ARM |
8/23/2011 | 50,000 | 51,686 | |||||||||
| FNMA - 30 Year 3.29% Hybrid ARM |
8/23/2011 | 13,000 | 13,231 | |||||||||
29
Table of Contents
| Forward Settling Purchases |
Settle Date | Par Value | Payable | |||||||||
| FNMA - 30 Year 3.33% Hybrid ARM |
8/23/2011 | 35,000 | 35,723 | |||||||||
| FNMA - 30 Year 3.41% Hybrid ARM |
8/23/2011 | 9,000 | 9,272 | |||||||||
| FNMA - 30 Year 3.41% Hybrid ARM |
8/31/2011 | 10,000 | 10,266 | |||||||||
| $ | 606,034 | $ | 626,476 | |||||||||
December 31, 2010
| Forward Settling Purchases |
Settle Date | Par Value | Payable | |||||||||
| FNMA - 15 Year 3.5% Fixed |
1/19/2011 | $ | 150,000 | $ | 154,622 | |||||||
| FNMA - 15 Year 4.0% Fixed |
1/19/2011 | 31,096 | 32,008 | |||||||||
| FNMA - 30 Year 3.25% Hybrid ARM |
1/25/2011 | 49,646 | 51,433 | |||||||||
| FNMA - 30 Year 5.5% Fixed |
2/10/2011 | 200,000 | 212,556 | |||||||||
| FNMA - 15 Year 3.5% Fixed |
2/15/2011 | 550,000 | 563,952 | |||||||||
| FNMA - 15 Year 4.0% Fixed |
2/15/2011 | 100,000 | 103,835 | |||||||||
| FNMA - 15 Year 4.5% Fixed |
2/15/2011 | 300,000 | 313,627 | |||||||||
| FNMA - 15 Year 3.5% Fixed |
3/16/2011 | 150,000 | 150,934 | |||||||||
| FHLMC - 15 Year 3.5% Fixed |
3/16/2011 | 200,000 | 200,260 | |||||||||
| FNMA - 15 Year 3.5% Fixed |
4/18/2011 | 400,000 | 399,661 | |||||||||
| FNMA - 15 Year 4.0% Fixed |
4/18/2011 | 50,444 | 51,513 | |||||||||
| $ | 2,181,186 | $ | 2,234,401 | |||||||||
Summary Financial Data:
| Three Months Ended June 30, | Six Months Ended June 30, | |||||||||||||||
| (In thousands) | 2011 | 2010 | 2011 | 2010 | ||||||||||||
| Investment income - Interest income |
||||||||||||||||
| Interest Income - Agency RMBS |
$ | 64,681 | $ | 16,478 | $ | 104,715 | $ | 32,871 | ||||||||
| Interest Income - CLOs, Structured Notes & Cash Equivalents |
1,039 | 787 | 1,985 | 1,331 | ||||||||||||
| Total interest income |
65,720 | 17,265 | 106,700 | 34,202 | ||||||||||||
| EXPENSES: |
||||||||||||||||
| Interest expense |
4,470 | 1,081 | 7,574 | 2,067 | ||||||||||||
| Operating expenses |
4,865 | 2,086 | 9,284 | 4,318 | ||||||||||||
| Total expenses |
9,335 | 3,167 | 16,858 | 6,385 | ||||||||||||
| Net investment income |
56,385 | 14,098 | 89,842 | 27,817 | ||||||||||||
| Net gain (loss) from investments |
129,225 | 32,367 | 149,044 | 38,832 | ||||||||||||
| GAINS AND (LOSSES) FROM SWAP AND CAP CONTRACTS: |
||||||||||||||||
| Net swap and cap interest income (expense) |
(14,875 | ) | (3,138 | ) | (26,733 | ) | (6,432 | ) | ||||||||
| Net gain (loss) on termination of swap contracts |
(3,493 | ) | (17,205 | ) | (3,492 | ) | (17,205 | ) | ||||||||
| Net unrealized appreciation (depreciation) on swap and cap contracts |
(67,820 | ) | 1,483 | (57,142 | ) | (5,263 | ) | |||||||||
| Net gain (loss) from swap and cap contracts |
(86,188 | ) | (18,860 | ) | (87,367 | ) | (28,900 | ) | ||||||||
| NET INCOME |
$ | 99,422 | $ | 27,605 | $ | 151,519 | $ | 37,749 | ||||||||
| Net income per common share (diluted) |
$ | 1.20 | $ | 1.46 | $ | 1.97 | $ | 2.01 | ||||||||
| Distributions per common share |
$ | 0.60 | $ | 0.60 | $ | 1.20 | $ | 1.15 | ||||||||
| Key Portfolio Statistics* |
||||||||||||||||
| Average Agency RMBS(1) |
$ | 7,699,364 | $ | 1,661,530 | $ | 6,364,652 | $ | 1,695,139 | ||||||||
| Average repurchase agreements(2) |
6,831,941 | 1,473,953 | 5,541,810 | 1,500,971 | ||||||||||||
| Average net assets(3) |
1,013,990 | 260,662 | 920,153 | 256,550 | ||||||||||||
30
Table of Contents
| Average yield on Agency RMBS(4) |
3.37% | 3.98% | 3.32% | 3.91% | ||||||||||||
| Average cost of funds and hedge(5) |
1.14% | 1.15% | 1.25% | 1.14% | ||||||||||||
| Interest rate spread net of hedge(6) |
2.23% | 2.83% | 2.07% | 2.77% | ||||||||||||
| Operating expense ratio(7) |
1.92% | 3.21% | 2.02% | 3.39% | ||||||||||||
| Leverage ratio (at period end)(8) |
8.1:1 | 5.3:1 | 8.1:1 | 5.3:1 |
| (1) | Our average Agency RMBS for the period was calculated by averaging the month end cost basis of our settled Agency RMBS during the period. |
| (2) | Our average repurchase agreements for the period were calculated by averaging the month end repurchase agreement balance during the period. |
| (3) | Our average net assets for the period were calculated by averaging the month end net assets during the period. |
| (4) | Our average yield on Agency RMBS for the period was calculated by dividing our interest income from Agency RMBS by our average Agency RMBS. |
| (5) | Our average cost of funds and hedge for the period was calculated by dividing our total interest expense, including our net swap and cap interest income (expense), by our average repurchase agreements. |
| (6) | Our interest rate spread net of hedge for the period was calculated by subtracting our average cost of funds and hedge from our average yield on Agency RMBS. |
| (7) | Our operating expense ratio is calculated by dividing operating expenses by average net assets. |
| (8) | Our leverage ratio was calculated by dividing total liabilities by net assets. |
| * | All percentages are annualized. |
Core Earnings:
Core Earnings represents a non-GAAP financial measure and is defined as net income (loss) excluding net realized gain (loss) on investments, net unrealized appreciation (depreciation) on investments, net realized gain (loss) on termination of swap contracts and unrealized appreciation (depreciation) on swap and cap contracts. In order to evaluate the effective yield of the portfolio, management uses Core Earnings to reflect the net investment income of our portfolio as adjusted to reflect the net swap and cap interest income (expense). Core Earnings allows management to isolate the interest income (expense) associated with our swaps and caps in order to monitor and project our borrowing costs and interest rate spread. In addition, management utilizes Core Earnings as a key metric in conjunction with other portfolio and market factors to determine the appropriate leverage and hedging ratios, as well as the overall structure of the portfolio.
We adopted Accounting Standards Codification (“ASC”) 946, Clarification of the Scope of Audit and Accounting Guide Investment Companies (“ASC 946”), prior to its deferral in February 2008, while most, if not all, other public companies that invest only in Agency RMBS have not adopted ASC 946. Under ASC 946, we use the financial reporting specified for investment companies, and accordingly, our investments are carried at fair value with changes in fair value included in earnings. Most other public companies that invest only in Agency RMBS include most changes in the fair value of their investments within shareholders’ equity, not in earnings. As a result, investors are not able to readily compare our results of operations to those of most of our competitors. We believe that the presentation of our Core Earnings is useful to investors because it provides a means of comparing our Core Earnings to those of our competitors. In addition, because Core Earnings isolates the net swap and cap interest income (expense) it provides investors with an additional metric to identify trends in our portfolio as they relate to the interest rate environment.
The primary limitation associated with Core Earnings as a measure of our financial performance over any period is that it excludes the effects of net realized gain (loss) from investments. In addition, our presentation of Core Earnings may not be comparable to similarly-titled measures of other companies, who may use different calculations. As a result, Core Earnings should not be considered as a substitute for our GAAP net income (loss) as a measure of our financial performance or any measure of our liquidity under GAAP.
| Three Months Ended June 30, |
Six Months Ended June 30, |
|||||||||||||||
| (In thousands) |
2011 | 2010 | 2011 | 2010 | ||||||||||||
| Non-GAAP Reconciliation: |
||||||||||||||||
| NET INCOME |
$ | 99,422 | $ | 27,605 | $ | 151,519 | $ | 37,749 | ||||||||
| Net (gain) loss from investments |
(129,225 | ) | (32,367 | ) | (149,044 | ) | (38,832 | ) | ||||||||
| Net (gain) loss on termination of swap contracts |
3,493 | 17,205 | 3,492 | 17,205 | ||||||||||||
| Net unrealized (appreciation) depreciation on swap and cap contracts |
67,820 | (1,483 | ) | 57,142 | 5,263 | |||||||||||
| Core Earnings |
$ | 41,510 | $ | 10,960 | $ | 63,109 | $ | 21,385 | ||||||||
Results of Operations
Three Months Ended June 30, 2011 Compared to the Three Months Ended June 30, 2010
Net Income. Net income increased $71.8 million to $99.4 million for the three months ended June 30, 2011, compared to net income of $27.6 million for the three months ended June 30, 2010. The major components of this increase are detailed below.
31
Table of Contents
Net Gain (Loss) From Investments. Net gain from investments increased by $96.8 million to $129.2 million for the three months ended June 30, 2011, compared to $32.4 million for the three months ended June 30, 2010. This increase was primarily the result of the increase in valuations of Agency RMBS on a larger portfolio. During the three months ended June 30, 2011 the price of a Fannie Mae Agency RMBS backed by 15 year 4.5% mortgages increased $1.375, less than the $1.812 increase during the three months ended June 30, 2010, however the average settled Agency RMBS held during the three months ended June 30, 2011 was $7,699.4 million, significantly higher than the $1,661.5 million held during the three months ended June 30, 2010.
Net Gain (Loss) from Swap and Cap Contracts. Net loss from swap and cap contracts decreased by $67.3 million to a loss of $86.2 million for the three months ended June 30, 2011, compared to a loss of $18.9 million for the three months ended June 30, 2010. The decrease was primarily due to the change in swap rates combined with the change in the size of our interest rate swap and cap (“hedge”) portfolio. During the three months ended June 30, 2011 the average balance of our hedge portfolio was $5,290.0 million notional amount compared to $865.0 million notional amount during the three months ended June 30, 2010. In addition, during the three months ended June 30, 2011 and 2010, three year swap rates decreased by 42 basis points and 47 basis points, respectively.
Interest Income. Interest income, which consists of interest income on Agency RMBS, subordinated tranches of CLOs, structured notes and short term investments, increased by $48.4 million to $65.7 million for the three months ended June 30, 2011, as compared to $17.3 million for the three months ended June 30, 2010. The change in interest income was primarily due to the increased size of our Agency RMBS portfolio. During the three months ended June 30, 2011 our average Agency RMBS portfolio was $7,699.4 million, compared to $1,661.5 million during the three months ended June 30, 2010. However, the increased income due to the size of our portfolio was offset by the decrease in the average yield on Agency RMBS. During the three months ended June 30, 2011 and 2010, our average yield on Agency RMBS was 3.37% and 3.98%, respectively.
Interest on CLOs is accrued at a rate determined based on estimated future cash flows and adjusted prospectively as future cash flow amounts are recast. When we cannot reliably estimate cash flows for CLOs, a nonaccrual (cost recovery) recognition method is used. Interest income on subordinated tranches of CLOs increased to $1.0 million for the three months ended June 30, 2011, compared to $0.7 million for the three months ended June 30, 2010. Additionally, for the three months ended June 30, 2011, we received $1.3 million of distributions from CLOs that were accounted for as a reduction of the cost basis and thereby excluded from our interest income and Core Earnings. This compared to $1.1 million for the three months ended June 30, 2010.
Total Expenses. Interest expense increased $3.4 million to $4.5 million for the three months ended June 30, 2011, as compared to $1.1 million for the three months ended June 30, 2010. The increase was due to the increase in our average repurchase agreements. During the three months ended June 30, 2011 and 2010, our average repurchase agreements were $6,831.9 million and $1,474.0 million, respectively. In addition, we had an average rate on our repurchase agreements of 0.26% and 0.29% during the three months ended June 30, 2011 and 2010, respectively.
Operating Expenses. For the three months ended June 30, 2011, operating expenses increased by $2.8 million to $4.9 million compared to $2.1 million for the three months ended June 30, 2010. The primary reason for the increase in our operating expenses was the management fees that we paid to our Manager, which are a percentage of our net assets. However, operating expenses as a percentage of net assets decreased significantly during the three months ended June 30, 2011 to 1.92% compared to 3.21% during the three months ended June 30, 2010, largely because we had a larger asset base resulting from the public offerings during 2010 and in February 2011. Our average net assets were $1,014.0 million and $260.7 million for the three months ended June 30, 2011 and 2010, respectively. Operating expenses consist of management fees payable to our Manager in accordance with our management agreement, amortization related to restricted stock and stock options granted to our executive officers, certain officers and employees of our Manager and its sub-advisors and other individuals who provide services to us, as designated by our Manager, and our independent directors, directors’ fees, insurance premium expenses for directors and officers insurance and other general and administrative expenses, including legal and accounting fees.
Six Months Ended June 30, 2011 Compared to the Six Months Ended June 30, 2010
Net Income. Net income increased $113.8 million to $151.5 million for the six months ended June 30, 2011, compared to net income of $37.7 million for the six months ended June 30, 2010. The major components of this increase are detailed below.
Net Gain (Loss) From Investments. Net gain from investments increased by $110.2 million to $149.0 million for the six months ended June 30, 2011, compared to $38.8 million for the six months ended June 30, 2010. This increase was primarily the result of the increase in valuations of Agency RMBS on a larger portfolio. During the six months ended June 30, 2011 the price of a
32
Table of Contents
Fannie Mae Agency RMBS backed by 15 year 4.5% mortgage increased $1.250, less than the $2.500 increase during the six months ended June 30, 2010, however the average settled Agency RMBS held during the six months ended June 30, 2011 was $6,364.7 million, significantly higher than the $1,695.1 million held during the six months ended June 30, 2010.
Net Gain (Loss) from Swap and Cap Contracts. Net loss from swap and cap contracts increased by $58.5 million to a loss of $87.4 million for the six months ended June 30, 2011, compared to a loss of $28.9 million for the six months ended June 30, 2010. The increase was primarily due to the change in swap rates combined with the change in the size of our hedge portfolio. During the six months ended June 30, 2011 the average balance of our hedge portfolio was $4,975.7 million notional amount compared to $811.4 million notional amount during the six months ended June 30, 2010. In addition, during the six months ended June 30, 2011 and 2010, three year swap rates decreased by 13 basis points and 72 basis points, respectively.
Interest Income. Interest income, which consists of interest income on Agency RMBS, subordinated tranches of CLOs, structured notes and short term investments, increased by $72.5 million to $106.7 million for the six months ended June 30, 2011, as compared to $34.2 million for the six months ended June 30, 2010. The change in interest income was primarily due to the increased size of our Agency RMBS portfolio. During the six months ended June 30, 2011 our average Agency RMBS portfolio was $6,364.7 million, compared to $1,695.1 million during the six months ended June 30, 2010. However, the increased income due to the size of our portfolio was offset by the decrease in the average yield on Agency RMBS. During the six months ended June 30, 2011 and 2010, our average yield on Agency RMBS was 3.32% and 3.91%, respectively.
Interest on CLOs is accrued at a rate determined based on estimated future cash flows and adjusted prospectively as future cash flow amounts are recast. When we cannot reliably estimate cash flows for CLOs, a nonaccrual (cost recovery) recognition method is used. Interest income on subordinated tranches of CLOs increased to $2.0 million for the six months ended June 30, 2011, compared to $1.1 million for the six months ended June 30, 2010. Additionally, for the six months ended June 30, 2011 we received $2.4 million of distributions from CLOs that were accounted for as a reduction of the cost basis and thereby excluded from our interest income and Core Earnings. This compared to $1.6 million for the six months ended June 30, 2010.
Total Expenses. Interest expense increased $5.5 million to $7.6 million for the six months ended June 30, 2011, as compared to $2.1 million for the six months ended June 30, 2010. The increase was due to the increase in our average repurchase agreements. During the six months ended June 30, 2011 and 2010, our average repurchase agreements were $5,541.8 million and $1,501.0 million, respectively. Meanwhile the average rate on our repurchase agreements went unchanged at 0.28% during the six months ended June 30, 2011 and 2010.
Operating Expenses. For the six months ended June 30, 2011, operating expenses increased by $5.0 million to $9.3 million compared to $4.3 million for the six months ended June 30, 2010. The primary reason for the increase in our operating expenses was the management fees that we paid to our Manager, which are a percentage of our net assets. However, operating expenses as a percentage of net assets decreased significantly during the six months ended June 30, 2011 to 2.02% compared to 3.39% during the six months ended June 30, 2010, largely because we had a larger asset base resulting from the public offerings during 2010 and in February 2011. Our average net assets were $920.2 million and $256.6 million for the six months ended June 30, 2011 and 2010, respectively. Operating expenses consist of management fees payable to our Manager in accordance with our management agreement, amortization related to restricted stock and stock options granted to our executive officers, certain officers and employees of our Manager and its sub-advisors and other individuals who provide services to us, as designated by our Manager, and our independent directors, directors’ fees, insurance premium expenses for directors and officers insurance and other general and administrative expenses, including legal and accounting fees.
Contractual Obligations and Commitments
The base management fee under our management agreement is payable monthly in arrears in an amount equal to 1/12 th of (a) 1.50% of the first $250,000,000 of our net assets, (b) 1.25% of our net assets that are greater than $250,000,000 and less than or equal to $500,000,000, and (c) 1.00% of our net assets that are greater than $500,000,000. Pursuant to that agreement, our Manager is also entitled to receive, in certain circumstances, a termination fee and reimbursement of certain expenses as described therein. Such fees and expenses do not have fixed and determinable payments. We reimbursed our Manager an aggregate of $0.3 million and $0.4 million in expenses for the three and six months ended June 30, 2011, respectively. Our Manager may seek reimbursement for compensation paid to its executives or services providers for services attributable to us. For the three and six months ended June 30, 2011, the Manager did not seek any such reimbursement.
33
Table of Contents
We had the following contractual obligations under repurchase agreements as of June 30, 2011 and December 31, 2010 (dollar amounts in thousands):
| June 30, 2011 | ||||||||||||||||
| Balance | Weighted Average Contractual Rate |
Contractual Interest Payments |
Total Contractual Obligation |
|||||||||||||
| Within 30 days |
$ | 4,112,881 | 0.24 | % | $ | 1,840 | $ | 4,114,721 | ||||||||
| 30 days to 60 days |
1,678,449 | 0.25 | 1,036 | 1,679,485 | ||||||||||||
| 60 days to 90 days |
1,637,919 | 0.24 | 1,012 | 1,638,931 | ||||||||||||
| 90 days to 120 days |
118,842 | 0.32 | 192 | 119,034 | ||||||||||||
| $ | 7,548,091 | 0.25 | % | $ | 4,080 | $ | 7,552,171 | |||||||||
| December 31, 2010 | ||||||||||||||||
| Balance | Weighted Average Contractual Rate |
Contractual Interest Payments |
Total Contractual Obligation |
|||||||||||||
| Within 30 days |
$ | 1,291,544 | 0.33 | % | $ | 614 | $ | 1,292,158 | ||||||||
| 30 days to 60 days |
1,499,864 | 0.32 | 1,135 | 1,500,999 | ||||||||||||
| 60 days to 90 days |
652,435 | 0.32 | 520 | 652,955 | ||||||||||||
| $ | 3,443,843 | 0.32 | % | $ | 2,269 | $ | 3,446,112 | |||||||||
We enter into interest rate swap and cap contracts as a means of mitigating our interest rate risk on forecasted interest expense associated with repurchase agreements for the term of the swap or cap contract. At June 30, 2011 and December 31, 2010, we had the following interest rate swap and cap contracts (dollars in thousands):
As of June 30, 2011
Interest Rate Swaps
| Expiration Date |
Fixed Pay Rate |
Floating Receive Rate(1) |
Notional Amount |
Fair Value |
||||||||||||||
| Counterparty |
||||||||||||||||||
| The Royal Bank of Scotland plc |
May 2013 | 1.6000 | % | 0.2550 | % | $ | 100,000 | $ | (1,794 | ) | ||||||||
| The Royal Bank of Scotland plc |
June 2013 | 1.3775 | % | 0.2458 | % | 300,000 | (4,136 | ) | ||||||||||
| The Royal Bank of Scotland plc |
July 2013 | 1.3650 | % | 0.2780 | % | 300,000 | (4,018 | ) | ||||||||||
| Goldman Sachs |
December 2013 | 1.3088 | % | 0.2470 | % | 400,000 | (4,165 | ) | ||||||||||
| The Royal Bank of Scotland plc |
December 2013 | 1.2813 | % | 0.2453 | % | 500,000 | (4,868 | ) | ||||||||||
| Goldman Sachs |
December 2013 | 1.2640 | % | 0.2453 | % | 400,000 | (3,731 | ) | ||||||||||
| Deutsche Bank Group |
December 2013 | 1.3225 | % | 0.2450 | % | 400,000 | (4,289 | ) | ||||||||||
| Deutsche Bank Group(2) |
April 2014 | 1.6700 | % | 0.3030 | % | 250,000 | (1,707 | ) | ||||||||||
| The Royal Bank of Scotland plc |
July 2014 | 1.7200 | % | 0.3045 | % | 100,000 | (1,771 | ) | ||||||||||
| Nomura Global Financial Products, Inc. |
July 2014 | 1.7325 | % | 0.2755 | % | 250,000 | (4,439 | ) | ||||||||||
| Deutsche Bank Group |
August 2014 | 1.3530 | % | 0.2608 | % | 200,000 | (1,033 | ) | ||||||||||
| Goldman Sachs |
September 2014 | 1.3120 | % | 0.2455 | % | 500,000 | (1,322 | ) | ||||||||||
| Deutsche Bank Group |
October 2014 | 1.1725 | % | 0.2968 | % | 240,000 | 574 | |||||||||||
| Goldman Sachs |
February 2015 | 2.1450 | % | 0.2608 | % | 500,000 | (13,031 | ) | ||||||||||
| Nomura Global Financial Products, Inc. |
June 2016 | 1.9400 | % | 0.2529 | % | 300,000 | 579 | |||||||||||
| Total |
$ | 4,740,000 | $ | (49,151 | ) | |||||||||||||
Interest Rate Swaps
| Expiration Date |
Cap Rate | Notional Amount |
Fair Value |
|||||||||||
| Counterparty |
||||||||||||||
| The Royal Bank of Scotland plc |
December 2014 | 2.0725 | % | $ | 200,000 | $ | 2,636 | |||||||
| The Royal Bank of Scotland plc |
October 2015 | 1.4275 | % | 300,000 | 10,347 | |||||||||
| The Royal Bank of Scotland plc |
November 2015 | 1.3600 | % | 200,000 | 7,446 | |||||||||
| Total |
$ | 700,000 | $ | 20,429 | ||||||||||
34
Table of Contents
As of December 31, 2010
| Interest Rate Swaps |
Expiration Date |
Fixed Pay Rate |
Floating Receive Rate(1) |
Notional Amount |
Fair Value |
|||||||||||||
| Counterparty |
||||||||||||||||||
| The Royal Bank of Scotland plc |
May 2013 | 1.6000 | % | 0.2875 | % | $ | 100,000 | $ | (1,496 | ) | ||||||||
| The Royal Bank of Scotland plc |
June 2013 | 1.3775 | % | 0.3028 | % | 300,000 | (2,718 | ) | ||||||||||
| The Royal Bank of Scotland plc |
July 2013 | 1.3650 | % | 0.2891 | % | 300,000 | (2,484 | ) | ||||||||||
| Goldman Sachs |
December 2013 | 1.3088 | % | 0.3016 | % | 400,000 | (776 | ) | ||||||||||
| The Royal Bank of Scotland plc |
December 2013 | 1.2813 | % | 0.3019 | % | 500,000 | (539 | ) | ||||||||||
| Goldman Sachs |
December 2013 | 1.2640 | % | 0.3019 | % | 400,000 | (255 | ) | ||||||||||
| Deutsche Bank Group |
December 2013 | 1.3225 | % | 0.3019 | % | 400,000 | (904 | ) | ||||||||||
| The Royal Bank of Scotland plc |
July 2014 | 1.7200 | % | 0.3028 | % | 100,000 | (733 | ) | ||||||||||
| Nomura Global Financial Products, Inc. |
July 2014 | 1.7325 | % | 0.2891 | % | 250,000 | (1,787 | ) | ||||||||||
| Deutsche Bank Group |
August 2014 | 1.3530 | % | 0.2844 | % | 200,000 | 1,529 | |||||||||||
| Goldman Sachs |
September 2014 | 1.3120 | % | 0.3028 | % | 500,000 | 5,460 | |||||||||||
| Deutsche Bank Group |
October 2014 | 1.1725 | % | 0.2906 | % | 240,000 | 4,059 | |||||||||||
| Total |
$ | 3,690,000 | $ | (644 | ) | |||||||||||||
| Interest Rate Caps | Expiration Date |
Cap Rate | Notional Amount |
Fair Value |
||||||||||
| Counterparty |
||||||||||||||
| The Royal Bank of Scotland plc |
December 2014 | 2.0725 | % | $ | 200,000 | $ | 4,752 | |||||||
| The Royal Bank of Scotland plc |
October 2015 | 1.4275 | % | 300,000 | 15,340 | |||||||||
| The Royal Bank of Scotland plc |
November 2015 | 1.3600 | % | 200,000 | 10,892 | |||||||||
| Total |
$ | 700,000 | $ | 30,984 | ||||||||||
| (1) | Resets quarterly to 3-Month LIBOR |
| (2) | Interest rate swap contains a one-time option to cancel at $0. |
We enter into certain contracts that contain a variety of indemnification obligations, principally with our Manager, brokers and counterparties to interest rate swap contracts and repurchase agreements. The maximum potential future payment amount we could be required to pay under these indemnification obligations is unlimited. We have not incurred any costs to defend lawsuits or settle claims related to these indemnification obligations. As a result, the estimated fair value of these agreements is minimal. Accordingly, we recorded no liabilities for these agreements as of June 30, 2011 and December 31, 2010. In addition, as of June 30, 2011 and December 31, 2010, we had a $626.5 million and $2,234.4 million payable for securities purchased, respectively, a portion of which will be financed through repurchase agreements. Because we measure leverage as total liabilities divided by net assets, the amount of payable for securities purchased is included in our June 30, 2011 and December 31, 2010 leverage ratio of 8.1 to 1 and 8.3 to 1, respectively. A summary of our payable for securities purchased as of June 30, 2011 and December 31, 2010 is included in the “Financial Condition—Liabilities” section.
Off-Balance Sheet Arrangements
As of June 30, 2011 and December 31, 2010, we did not maintain any relationships with unconsolidated entities or financial partnerships, such as entities often referred to as structured finance, or special purpose or variable interest entities, established for the purpose of facilitating off-balance sheet arrangements or other contractually narrow or limited purposes. Further, as of June 30, 2011 and December 31, 2010, we had not guaranteed any obligations of unconsolidated entities or entered into any commitment or had any intent to provide funding to any such entities.
Liquidity and Capital Resources
Our primary sources of funds are borrowings under repurchase arrangements and monthly principal repayments and interest payments on our investments. Other sources of funds may include proceeds from debt and equity offerings and asset sales. As of June 30, 2011, we had repurchase agreements totaling $7,548.1 million, with a weighted average borrowing rate of 0.25%. In addition, during the six months ended June 30, 2011 and 2010 we received $415.4 million of principal repayments and $95.0 million of interest payments compared to $263.2 million and $34.5 million, respectively. We held cash and cash equivalents of $1.0 million and $1.5 million at June 30, 2011 and December 31, 2010, respectively.
35
Table of Contents
During 2010 and on February 15, 2011, we closed public offerings totaling 39.8 million and 23.0 million shares of our common stock, respectively, for total net proceeds of approximately $481.0 million and $275.8 million, respectively, after the underwriting discount and commissions and expenses.
During the six months ended June 30, 2011 and 2010, our operations used net cash of $4,331.0 million and $45.4 million, respectively. During the six months ended June 30, 2011 and 2010, we had net purchases of securities (net of purchases, sales and principal repayments) of $2,393.8 million and $408.8 million, respectively. The increase in net purchases of securities was the result of investing the $275.8 million of total net proceeds of the February 15, 2011 public offering and maintaining our leverage ratio.
We sponsor a dividend reinvestment and direct stock purchase plan through which stockholders may purchase additional shares of common stock by reinvesting some or all of the cash dividends received on shares of common stock. This plan became effective on June 22, 2010. Stockholders may also make optional cash purchases of shares of common stock subject to certain limitations detailed in the plan prospectus. From June 22, 2010 to December 31, 2010, we issued 607,902 shares under the plan raising approximately $8.0 million of net proceeds. For the six months ended June 30, 2011, we issued 6,957 shares under the plan raising approximately $87,452 in net proceeds. As of June 30, 2011 and December 31, 2010, there were approximately 9.4 million shares available for issuance under this plan.
On June 7, 2011 we entered into a sales agreement with JMP Securities LLC to, from time to time, publicly offer and sell up to 15,000,000 shares of our common stock in at-the-market transactions and/or privately negotiated transactions. As of June 30, 2011 we had not sold any common stock under the sales agreement. As of June 30, 2011, 15,000,000 shares of common stock remained available for issuance to be sold under the sales agreement.
The following tables present certain information regarding our risk exposure on our repurchase agreements as of June 30, 2011 and December 31, 2010 (dollars in thousands):
June 30, 2011
| Counterparty |
Total Outstanding Borrowings |
% of Total |
Amount At Risk (1) |
Weighted Average Maturity in Days |
||||||||||||
| Bank of America Securities LLC |
$ | 255,272 | 3.4 | % | $ | 14,526 | 19 | |||||||||
| Bank of Nova Scotia |
200,740 | 2.7 | 5,789 | 43 | ||||||||||||
| Barclays Capital, Inc. |
395,272 | 5.2 | 25,001 | 38 | ||||||||||||
| BNP Paribas Securities Corp |
390,697 | 5.2 | 19,831 | 74 | ||||||||||||
| Cantor Fitzgerald & Co. |
476,876 | 6.3 | 24,781 | 39 | ||||||||||||
| Citigroup Global Markets, Inc. |
387,088 | 5.1 | 21,105 | 40 | ||||||||||||
| Credit Suisse Securities (USA) LLC |
333,670 | 4.4 | 14,305 | 19 | ||||||||||||
| Daiwa Securities America, Inc. |
344,469 | 4.6 | 18,282 | 57 | ||||||||||||
| Deutsche Bank Securities, Inc. |
527,626 | 7.0 | 31,124 | 65 | ||||||||||||
| Goldman Sachs & Co. |
586,736 | 7.8 | 31,095 | 16 | ||||||||||||
| Guggenheim Liquidity Services, LLC |
280,865 | 3.7 | 14,783 | 41 | ||||||||||||
| Industrial and Commercial Bank of China Financial Services LLC |
69,411 | 0.9 | 3,670 | 25 | ||||||||||||
| ING Financial Markets LLC |
252,008 | 3.3 | 13,815 | 35 | ||||||||||||
| LBBW Securities LLC |
180,891 | 2.4 | 10,243 | 59 | ||||||||||||
| MF Global Securities Inc. |
257,696 | 3.4 | 13,939 | 43 | ||||||||||||
| Mitsubishi UFJ Securities (USA), Inc. |
337,591 | 4.5 | 18,544 | 54 | ||||||||||||
| Mizuho Securities USA, Inc. |
196,391 | 2.6 | 9,728 | 33 | ||||||||||||
| Morgan Stanley & Co. Inc. |
256,712 | 3.4 | 16,526 | 20 | ||||||||||||
| Nomura Securities International, Inc. |
458,547 | 6.1 | 23,598 | 46 | ||||||||||||
| South Street Securities LLC |
403,422 | 5.3 | 24,120 | 23 | ||||||||||||
| The Royal Bank of Scotland PLC |
211,616 | 2.8 | 10,124 | 11 | ||||||||||||
| UBS Securities LLC |
348,375 | 4.6 | 20,402 | 23 | ||||||||||||
| Wells Fargo Securities, LLC |
396,120 | 5.3 | 16,086 | 20 | ||||||||||||
| $ | 7,548,091 | 100.0 | $ | 401,417 | ||||||||||||
36
Table of Contents
December 31, 2010
| Counterparty |
Total Outstanding Borrowings |
% of Total | Amount at Risk(1) | Weighted Average Maturity in Days |
||||||||||||
| Bank of America Securities LLC |
$ | 162,617 | 4.7 | % | $ | 9,756 | 18 | |||||||||
| Barclays Capital, Inc. |
275,316 | 8.0 | 18,522 | 29 | ||||||||||||
| BNP Paribas Securities Corp. |
210,840 | 6.1 | 13,885 | 75 | ||||||||||||
| Cantor Fitzgerald & Co. |
317,137 | 9.2 | 19,620 | 49 | ||||||||||||
| Citigroup Global Markets, Inc. |
58,587 | 1.7 | 2,778 | 20 | ||||||||||||
| Credit Suisse Securities (USA) LLC |
199,352 | 5.8 | 16,299 | 41 | ||||||||||||
| Daiwa Securities America, Inc. |
80,058 | 2.3 | 3,975 | 7 | ||||||||||||
| Deutsche Bank Securities, Inc. |
292,920 | 8.5 | 17,830 | 45 | ||||||||||||
| Goldman Sachs & Co. |
395,996 | 11.5 | 26,487 | 57 | ||||||||||||
| Guggenheim Liquidity Services, LLC |
151,671 | 4.4 | 9,414 | 46 | ||||||||||||
| ING Financial Markets LLC |
82,701 | 2.4 | 4,517 | 74 | ||||||||||||
| Jefferies & Company, Inc. |
35,937 | 1.1 | 1,835 | 11 | ||||||||||||
| LBBW Securities LLC |
157,277 | 4.6 | 11,607 | 45 | ||||||||||||
| MF Global Securities Inc. |
135,766 | 4.0 | 6,141 | 30 | ||||||||||||
| Mitsubishi UFJ Securities (USA), Inc. |
120,487 | 3.5 | 6,451 | 20 | ||||||||||||
| Mizuho Securities USA, Inc. |
145,028 | 4.2 | 9,190 | 18 | ||||||||||||
| Nomura Securities International, Inc. |
167,506 | 4.9 | 10,791 | 34 | ||||||||||||
| The Royal Bank of Scotland PLC |
221,348 | 6.4 | 15,879 | 7 | ||||||||||||
| South Street Securities LLC |
159,807 | 4.6 | 14,002 | 46 | ||||||||||||
| UBS Securities LLC |
73,492 | 2.1 | 4,736 | 46 | ||||||||||||
| Total |
$ | 3,443,843 | 100.0 | % | $ | 223,715 | ||||||||||
| (1) | Equal to the fair value of pledged securities plus accrued interest income, minus the sum of repurchase agreement liabilities and accrued interest expense. |
Our repurchase agreements do not include substantive provisions other than those covenants and other customary provisions contained in the standard master repurchase agreement as published by the Bond Market Association (now the Securities Industry and Financial Markets Association). The repurchase agreements generally require us to transfer additional securities to the counterparty in the event the value of the securities then held by the counterparty in the margin account falls below specified levels and contain events of default in cases where we breach our obligations under the agreement. We receive margin calls from our repurchase agreement counterparties from time to time in the ordinary course of business similar to other entities in the specialty finance business. As of June 30, 2011 and December 31, 2010, we had approximately $566.0 million and $423.4 million, respectively, in Agency RMBS, U.S. Treasury securities and cash and cash equivalents available to satisfy future margin calls. To date, we have maintained sufficient liquidity to meet margin calls, and we have never been unable to satisfy a margin call, although no assurance can be given that we will be able to satisfy requests from our lenders to post additional collateral in the future.
An event of default or termination event under the standard master repurchase agreement would give our counterparty the option to terminate all repurchase transactions existing with us and make any amount due by us to the counterparty to be payable immediately.
We have made and intend to continue to make regular quarterly distributions of all or substantially all of our REIT taxable income to holders of our common stock. In order to qualify as a REIT and to avoid federal corporate income tax on the income that we distribute to our stockholders, we are required to distribute at least 90% of our REIT taxable income, determined without regard to the deduction for dividends paid and excluding net capital gain, on an annual basis. This requirement can impact our liquidity and capital resources.
For our short term (one year or less) and long term liquidity, we also rely on the cash flow from operations, primarily monthly principal and interest payments to be received on our Agency RMBS, as well as any primary securities offerings authorized by our board of directors.
37
Table of Contents
Based on our current portfolio, leverage rate and available borrowing arrangements, we believe that our cash flow from operations and the utilization of borrowings will be sufficient to enable us to meet anticipated short term (one year or less) liquidity requirements such as to fund our investment activities, pay fees under our management agreement, fund our distributions to stockholders and for general corporate expenses. However, an increase in prepayment rates substantially above our expectations could cause a temporary liquidity shortfall due to the timing of the necessary margin calls on the financing arrangements and the actual receipt of the cash related to principal paydowns. If our cash resources are at any time insufficient to satisfy our liquidity requirements, we may have to issue debt or additional equity securities or sell Agency RMBS in our portfolio. If required, the sale of Agency RMBS at prices lower than their amortized cost would result in realized losses. We believe that we have additional capacity through repurchase agreements to leverage our equity further should the need for additional short term (one year or less) liquidity arise.
Our ability to meet our long term (greater than one year) liquidity and capital resource requirements will be subject to obtaining additional debt financing and equity capital. We may increase our capital resources by obtaining long term credit facilities or making public or private offerings of equity or debt securities, possibly including classes of preferred stock, common stock, commercial paper, medium-term notes, CDOs, collateralized mortgage obligations and senior or subordinated notes. Such financing will depend on market conditions for capital raises and for the investment of any proceeds. If we are unable to renew, replace or expand our sources of financing on substantially similar terms, it may have an adverse effect on our business and results of operations.
We generally seek to borrow between six and 10 times the amount of our net assets. At June 30, 2011 and December 31, 2010, our total liabilities were $8,290.7 million and $5,698.9 million, respectively, which represented a leverage ratio of 8.1 to 1 and 8.3 to 1, respectively.
Qualitative and Quantitative Disclosures about Short-Term Borrowings
The following table discloses quantitative disclosures about our short-term borrowings under repurchase agreements during the three and six months ended June 30, 2011 and 2010.
| Three Months Ended June 30, | Six Months Ended June 30, | |||||||||||||||
| (In millions) | 2011 | 2010 | 2011 | 2010 | ||||||||||||
| Outstanding at Period End |
$ | 7,548 | $ | 1,448 | $ | 7,548 | $ | 1,448 | ||||||||
| Weighted Average Rate at Period End |
0.25 | % | 0.32 | % | 0.25 | % | 0.32 | % | ||||||||
| Average Outstanding During Period(1) |
$ | 6,832 | $ | 1,474 | $ | 5,542 | $ | 1,501 | ||||||||
| Weighted Average Rate During Period |
0.26 | % | 0.29 | % | 0.28 | % | 0.28 | % | ||||||||
| Largest Month End Balance During Period |
$ | 7,548 | $ | 1,488 | $ | 7,548 | $ | 1,665 | ||||||||
| (1) | Calculated based on the average month end balance during the period. |
During the three and six months ended June 30, 2011, our repurchase agreement balance increased during the end of the period due to forward settling purchases made with the net proceeds from our February 2011 equity offering settling and being financed through repurchase agreements. During the three and six months ended June 30, 2011, the weighted average rate on our repurchase agreements remained relatively stable at 0.26% and 0.28%, respectively, compared to 0.29% and 0.28% during the three and six months ended June 30, 2010. During the three and six months ended June 30, 2010, our repurchase agreement balance also remained stable at $1,474.0 million and $1,501.0 million, respectively.
Inflation
Virtually all of our assets and liabilities are interest rate sensitive in nature. As a result, interest rates and other factors influence our performance far more than inflation. Changes in interest rates do not necessarily correlate with inflation rates or changes in inflation rates. Our financial statements are prepared in accordance with GAAP and our distributions are determined by our board of directors based in part on our REIT taxable income as calculated according to the requirements of the Internal Revenue Code; in each case, our activities and balance sheet are measured with reference to fair value without considering inflation.
Item 3. Quantitative and Qualitative Disclosures about Market Risk
As of June 30, 2011 and December 31, 2010, the primary component of our market risk was interest rate risk, as described below. While we do not seek to avoid risk completely, we do believe that risk can be quantified from historical experience and seek to actively manage risk, to earn sufficient compensation to justify taking risks and to maintain capital levels consistent with the risks we undertake. Our board of directors has a risk management committee that oversees our risk management process. See “Business-Risk Management” in our annual report on Form 10-K for the fiscal year ended December 31, 2010 for a further discussion of our risk management committee and risk mitigation practices.
38
Table of Contents
Interest Rate Risk
We are subject to interest rate risk in connection with our investments in Agency RMBS collateralized by ARMs, hybrid ARMs and fixed rate mortgage loans and our related debt obligations, which are generally repurchase agreements of limited duration that are periodically refinanced at current market rates. We seek to mitigate this risk through utilization of derivative contracts, primarily interest rate swap and cap agreements.
Effect on Net Investment Income. We fund our investments in long term Agency RMBS collateralized by ARMs, hybrid ARMs and fixed rate mortgage loans with short term borrowings under repurchase agreements. During periods of rising interest rates, the borrowing costs associated with those Agency RMBS tend to increase while the income earned on such Agency RMBS (during the fixed rate component of such securities) may remain substantially unchanged. This results in a narrowing of the net interest spread between the related assets and borrowings and may even result in losses.
We are a party to the interest rate swap and contracts as of June 30, 2011 and December 31, 2010 described in detail under Item 2. “Management’s Discussion and Analysis of Financial Condition and Results of Operations—Contractual Obligations and Commitments” in this quarterly report on Form 10-Q.
Hedging techniques are partly based on assumed levels of prepayments of our Agency RMBS. If prepayments are slower or faster than assumed, the life of the Agency RMBS will be longer or shorter, which would reduce the effectiveness of any hedging strategies we may use and may cause losses on such transactions.
Occasionally we invest in Agency RMBS collateralized by ARMs which are based on mortgages whose coupon rates reset monthly based on the Monthly Treasury Average, or “MTA”. However, our borrowing costs pursuant to our repurchase agreements are generally based on 30-day LIBOR, which may change more quickly than the MTA index. Hence, in a rapidly rising interest rate environment, we would expect our net interest margin to decrease, temporarily. In a falling interest rate environment, we would expect our net interest margin to rise temporarily. For a discussion of the effects of interest rate changes on our Agency RMBS collateralized by hybrid ARMs and fixed rate mortgages, see “—Extension Risk.”
Effect on Fair Value. Another component of interest rate risk is the effect changes in interest rates will have on the fair value of our assets. We face the risk that the fair value of our assets will increase or decrease at different rates than that of our liabilities, including our hedging instruments.
We primarily assess our interest rate risk by estimating the duration of our assets and the duration of our liabilities. Duration essentially measures the market price volatility of financial instruments as interest rates change. We generally calculate duration using various third-party financial models and empirical data. Different models and methodologies can produce different duration numbers for the same securities.
Extension Risk. We invest in Agency RMBS collateralized by hybrid ARMs, which have interest rates that are fixed for the first few years of the loan (typically three, five, seven or 10 years) and thereafter reset periodically on the same basis as Agency RMBS collateralized by ARMs. We compute the projected weighted average life of our Agency RMBS collateralized by hybrid ARMs based on assumptions regarding the rate at which the borrowers will prepay the underlying mortgages. In general, when Agency RMBS collateralized by fixed rate or hybrid ARMs are acquired with borrowings, we may, but are not required to, enter into an interest rate swap agreement or other hedging instrument that effectively fixes our borrowing costs for a period close to the anticipated weighted average life of the fixed rate portion of the related Agency RMBS. This strategy is designed to protect us from rising interest rates by fixing our borrowing costs for the duration of the fixed rate period of the collateral underlying the related Agency RMBS.
We have structured our swaps to expire in conjunction with the estimated weighted average life of the fixed period of the mortgages underlying our Agency RMBS portfolio. However, in a rising interest rate environment, the weighted average life of the fixed rate mortgages underlying our Agency RMBS could extend beyond the term of the swap agreement or other hedging instrument. This could have a negative impact on our results from operations, as borrowing costs would no longer be fixed after the term of the hedging instrument while the income earned on the remaining Agency RMBS would remain fixed for a period of time. This situation may also cause the market value of our Agency RMBS to decline, with little or no offsetting gain from the related hedging transactions. In extreme situations, we may be forced to sell assets to maintain adequate liquidity, which could cause us to incur losses.
Interest Rate Cap Risk. Both the ARMs and hybrid ARMs that collateralize our Agency RMBS are typically subject to periodic and lifetime interest rate caps and floors, which limit the amount by which the security’s interest yield may change during any given period. However, our borrowing costs will not be subject to similar restrictions. Therefore, in a period of increasing interest
39
Table of Contents
rates, the interest costs on our borrowings could increase without limitation by caps, while the interest-rate yields on our Agency RMBS would effectively be limited by caps. This problem will be magnified to the extent that we acquire Agency RMBS that are collateralized by hybrid ARMs that are not fully indexed. In addition, the underlying mortgages may be subject to periodic payment caps that result in some portion of the interest being deferred and added to the principal outstanding. This could result in our receipt of less cash income on our Agency RMBS than we need in order to pay the interest cost on our related borrowings. These factors could lower our net investment income or cause a net loss during periods of rising interest rates, which would harm our financial condition, cash flows and results of operations.
Interest Rate Mismatch Risk. We intend to fund a substantial portion of our acquisitions of Agency RMBS with borrowings that, after the effect of hedging, have interest rates based on indices and repricing terms similar to, but of somewhat shorter maturities than, the interest rate indices and repricing terms of the Agency RMBS. Thus, we anticipate that in most cases the interest rate indices and repricing terms of our Agency RMBS and our funding sources will not be identical, thereby creating an interest rate mismatch between assets and liabilities. Therefore, our cost of funds would likely rise or fall more quickly than would our earnings rate on assets. During periods of changing interest rates, such interest rate mismatches could negatively impact our financial condition, cash flows and results of operations. To mitigate interest rate mismatches, we may utilize the hedging strategies discussed above.
Our analysis of risks is based on our Manager’s experience, estimates, models and assumptions. These analyses rely on models that utilize estimates of fair value and interest rate sensitivity. Actual economic conditions or implementation of investment decisions by our Manager may produce results that differ significantly from the estimates and assumptions used in our models and the projected results reflected herein.
Prepayment Risk
Prepayments are the full or partial repayment of principal prior to the original contractual maturity of a mortgage loan and typically occur due to refinancing of mortgage loans. Prepayment rates for existing Agency RMBS generally increase when prevailing mortgage interest rates fall. In addition, prepayment rates on Agency RMBS collateralized by ARMs and hybrid ARMs generally increase when the difference between long term and short term interest rates declines or becomes negative. Some ARMs underlying our Agency RMBS may bear initial teaser mortgage interest rates that are lower than their fully-indexed rates, which refers to the applicable index rates plus a margin. In the event that such an ARM is prepaid prior to or soon after the time of adjustment to a fully-indexed rate, the holder of the related Agency RMBS would have held such security while it was less profitable and lost the opportunity to receive interest at the fully-indexed rate over the expected life of the Agency RMBS. We currently do not own any Agency RMBS collateralized by ARMs with teaser mortgage interest rates. Additionally, we currently own Agency RMBS that were purchased at a premium. The prepayment of such Agency RMBS at a rate faster than anticipated would result in a write-off of any remaining capitalized premium amount.
In early March 2010, both Freddie Mac and Fannie Mae announced they would purchase from the pools of mortgage loans underlying RMBS that they issued, all mortgage loans that are more than 120 days delinquent. The impact of these programs thus far is reflected in the constant prepayment rate, or CPR, of our portfolio. Because a substantial portion of our portfolio consists of Agency RMBS backed by 15 year fixed rate mortgage loans, which have low delinquency rates, these programs have not caused a significant increase in the CPR of our portfolio.
Our Manager seeks to mitigate our prepayment risk by investing in Agency RMBS with (i) a variety of prepayment characteristics, (ii) prepayment prohibitions and penalties and (iii) prepayment protections, as well as by balancing Agency RMBS purchased at a premium with Agency RMBS purchased at a discount.
Effect on Fair Value and Net Income
Another component of interest rate risk is the effect changes in interest rates will have on the fair value of our assets and our net income, exclusive of the effect of changes in fair value on our net income. We face the risk that the fair value of our assets and net investment income will increase or decrease at different rates than that of our liabilities, including our hedging instruments.
We primarily assess our interest rate risk by estimating the duration of our assets and the duration of our liabilities. Duration essentially measures the market price volatility of financial instruments as interest rates change. We generally calculate duration using various financial models and empirical data. Different models and methodologies can produce different duration numbers for the same securities.
The following sensitivity analysis table shows the estimated impact of our interest rate-sensitive investments and repurchase agreement liabilities on the fair value and net income, exclusive of the effect of changes in fair value on our net income, at June 30, 2011 and December 31, 2010, assuming a static portfolio and that rates instantaneously fall 25, 50 and 75 basis points and rise 25, 50 and 75 basis points.
40
Table of Contents
June 30, 2011
| Change in Interest Rates |
Projected Change in the Fair Value of Our Assets |
Projected Change in Our Net Income(1) |
||||||
| - 75 basis points |
2.64 | % | 3.99 | % | ||||
| - 50 basis points |
1.83 | % | 2.89 | % | ||||
| - 25 basis points |
0.95 | % | 1.78 | % | ||||
| No Change |
0.00 | % | 0.00 | % | ||||
| + 25 basis points |
-1.00 | % | -4.60 | % | ||||
| + 50 basis points |
-2.03 | % | -9.19 | % | ||||
| + 75 basis points |
-3.09 | % | -13.79 | % | ||||
December 31, 2010
| Change in Interest Rates |
Projected Change in the Fair Value of Our Assets |
Projected Change in Our Net Income(1) |
||||||
| - 75 basis points |
2.79 | % | 1.69 | % | ||||
| - 50 basis points |
1.93 | % | 0.97 | % | ||||
| - 25 basis points |
0.99 | % | 0.26 | % | ||||
| No Change |
0.00 | % | 0.00 | % | ||||
| + 25 basis points |
-1.03 | % | -4.05 | % | ||||
| + 50 basis points |
-2.01 | % | -7.64 | % | ||||
| + 75 basis points |
-3.19 | % | -11.22 | % | ||||
| (1) | Exclusive of the changes in fair value on net income |
While the charts above reflect the estimated immediate impact of interest rate increases and decreases on a static portfolio, we rebalance our portfolio from time to time either to take advantage or minimize the impact of changes in interest rates. Additionally, the effects of interest rate changes on our portfolio illustrated in the above chart do not take into account the effect that our hedging instruments, mainly interest rate swaps and caps, would have on the fair value of our portfolio, but do take into account the effect that our hedging instruments, would have on our net income, exclusive of the effect of changes in fair value on our net income. Generally, our interest rate swaps reset in the quarter following changes in interest rates. It is important to note that the impact of changing interest rates on fair value and net income can change significantly when interest rates change beyond 75 basis points from current levels. Therefore, the volatility in the fair value of our assets could increase significantly when interest rates change beyond 75 basis points. In addition, other factors impact the fair value of and net income from our interest rate sensitive investments and hedging instruments, such as the shape of the yield curve, market expectations as to future interest rate changes and other market conditions. Accordingly, in the event of changes in actual interest rates, the change in the fair value of our assets and our net income would likely differ from that shown above, and such difference might be material and adverse to our stockholders.
Risk Management
Our board of directors exercises its oversight of risk management in many ways, including through its Risk Management Committee. The Risk Management Committee was established to oversee our senior management’s and our Manager’s risk-related responsibilities, including reviewing management policies and performance against these policies and related benchmarks.
As part of our risk management process, our Manager seeks to actively manage the interest rate, liquidity, prepayment and counterparty risks associated with our Agency RMBS portfolio. Our Manager seeks to mitigate our interest rate risk exposure by entering into various hedging instruments in order to minimize our exposure to potential interest rate mismatches between the interest we earn on our investments and our borrowing costs.
Our Manager seeks to mitigate our liquidity risks by monitoring our liquidity position on a daily basis and maintaining a prudent level of leverage, which we currently consider to be between six and 10 times the amount of net assets in our overall portfolio, based on current market conditions and various other factors, including the health of the financial institutions that lend to us under our repurchase agreements and the presence of special liquidity programs provided by domestic and foreign central banks.
Our Manager seeks to mitigate our prepayment risk by investing in Agency RMBS with (i) a variety of prepayment characteristics, (ii) prepayment prohibitions and penalties and (iii) prepayment protections, as well as by balancing Agency RMBS purchased at a premium with Agency RMBS purchased at a discount.
Our Manager seeks to mitigate our counterparty risk by (i) diversifying our exposure across a broad number of counterparties, (ii) limiting our exposure to any one counterparty and (iii) monitoring the financial stability of our counterparties.
41
Table of Contents
Item 4. Controls and Procedures
Evaluation of Disclosure Controls and Procedures
Our management, with the participation of our Chief Executive Officer and our Chief Financial Officer, evaluated the effectiveness of our disclosure controls and procedures as of June 30, 2011. The term “disclosure controls and procedures,” as defined in Rules 13a-15(e) and 15d-15(e) under the Securities Exchange Act of 1934, as amended (the “Exchange Act”), means controls and other procedures of a company that are designed to ensure that information required to be disclosed by a company in the reports that it files or submits under the Exchange Act is recorded, processed, summarized and reported, within the time periods specified in the SEC’s rules and forms. Disclosure controls and procedures include, without limitation, controls and procedures designed to ensure that information required to be disclosed by a company in the reports that it files or submits under the Exchange Act is accumulated and communicated to the company’s management, including its principal executive and principal financial officers, as appropriate to allow timely decisions regarding required disclosure. Management recognizes that any controls and procedures, no matter how well designed and operated, can provide only reasonable assurance of achieving their objectives and management necessarily applies its judgment in evaluating the cost-benefit relationship of possible controls and procedures. Based on the evaluation of our disclosure controls and procedures as of June 30, 2011, our Chief Executive Officer and Chief Financial Officer concluded that, as of such date, our disclosure controls and procedures were effective.
There have been no changes in our internal controls over financial reporting that occurred during the last fiscal quarter that have materially affected, or are reasonably likely to materially affect, our internal controls over financial reporting.
The Company and the Manager are not currently subject to any material legal proceedings.
The failure of U.S. lawmakers to reach an agreement on a national debt ceiling or budget may materially adversely affect our business, financial condition and results of operations.
The current U.S. debt ceiling and budget deficit concerns have increased the possibility of the credit-rating agencies downgrading the U.S.’s credit rating for the first time in history. Because Fannie Mae and Freddie Mac are in conservatorship of the U.S. Government, if the U.S.’s credit rating was downgraded it would likely impact the credit risk associated with Agency RMBS and, therefore, decrease the value of the Agency RMBS in our portfolio. In addition, a downgrade of the U.S. Government’s credit rating would create broader financial turmoil and uncertainty, which would weigh heavily on the global banking system.
In the event U.S. lawmakers fail to reach an agreement on a national debt ceiling or budget, the U.S. could default on its obligations, which could negatively impact the trading market for U.S. government securities. This may, in turn, negatively affect the value of our Agency RMBS and our ability to obtain financing for our investments. As a result, it may materially adversely affect our business, financial condition and results of operations.
We cannot assure you that we will be able to complete an internalization of our management, or that the definitive terms will be consistent with those set forth in the term sheet executed by the Company and Sharpridge Capital Management, L.P. (“Sharpridge”), which could materially adversely affect our business, financial condition and results of operations.
On July 20, 2011, the Company issued a press release announcing it has entered into a non-binding term sheet with Sharpridge, which is a sub-advisor to Cypress Sharpridge Advisors LLC, the Company’s manager, that includes the material terms and conditions pursuant to which the Company intends to complete an internalization of its management. The term sheet provides that the Company intends to (i) acquire all of the assets that Sharpridge uses to oversee the Company’s day-to-day operations and actively manage the Company’s investment portfolio for a cash purchase price of $750,000 and (ii) offer employment to all of the 13 current employees of Sharpridge, including those individuals who are the current executive officers of the Company. In connection with the completion of an internalization transaction, the management agreement by and between the Company and its manager, and other ancillary agreements related thereto, will be terminated without the payment of any termination fee. The Company expects to enter into employment agreements with its executive officers and to establish a compensation program for its employees that the compensation committee of the Company’s board of directors has created based on consultation with a third-party compensation consultant. In addition, the currently proposed terms of internalization include (i) a grant to our chief executive officer, Mr. Grant, of shares of restricted common stock in an amount to be determined by the Compensation Committee and subject to a five (5) year vesting period, and (ii) the acceleration of the vesting of all shares subject to forfeiture under all existing restricted stock award agreements between Mr. Grant and the Company. The completion of the transactions contemplated by the term sheet is scheduled to take place effective as of September 1, 2011, and is subject to negotiation, execution and delivery of mutually acceptable agreements, including an asset purchase agreement and employment agreements for the Company’s executive officers. We cannot assure you that we will be able to complete such an internalization transaction or that the terms of such a transaction will be consistent with those set forth in the term sheet. In addition, we may not be able to retain all of the current employees of Sharpridge after internalization, and our general and administrative expenses after internalization could be higher than our current general and administrative expenses. Any of the foregoing risks could materially adversely affect out business, financial condition and results of operations.
Item 2. Unregistered Sales of Equity Securities and Use of Proceeds
None.
Item 3. Defaults Upon Senior Securities
None.
Item 4. (Removed and Reserved).
None.
(a) Exhibits.
| Exhibit Number |
Description of Exhibit | |||
| 31.1* | Certification of Chief Executive Officer pursuant to Section 302 of the Sarbanes – Oxley Act of 2002 | |||
| 31.2* | Certification of Chief Financial Officer pursuant to Section 302 of the Sarbanes – Oxley Act of 2002 | |||
| 32.1** | Certification of Chief Executive Officer pursuant to 18 U.S.C. Section 1350, as adopted pursuant to Section 906 of the Sarbanes – Oxley Act of 2002 | |||
| 32.2** | Certification of Chief Financial Officer pursuant to 18 U.S.C. Section 1350, as adopted pursuant to Section 906 of the Sarbanes – Oxley Act of 2002 | |||
| Exhibit 101.INS XBRL |
Instance Document (1) | |||
| Exhibit 101.SCH XBRL |
Taxonomy Extension Schema Document (1) | |||
| Exhibit 101.CAL XBRL |
Taxonomy Extension Calculation Linkbase Document (1) | |||
| Exhibit 101.LAB XBRL |
Taxonomy Extension Label Linkbase Document (1) | |||
| Exhibit 101.PRE XBRL |
Taxonomy Extension Presentation Linkbase Document (1) | |||
| * | Filed herewith. |
| ** | Furnished herewith. |
| (1) | Submitted electronically herewith. Attached as Exhibit 101 to this report are the following documents formatted in XBRL (Extensible Business Reporting Language): (i) Balance Sheets at June 30, 2011 ( Unaudited) and December 31, 2010 (Derived from the audited balance sheet at December 31, 2010); (ii) Condensed Statements of Operations (Unaudited) for the three and six months ended June 30, 2011 and 2010; (iii) Condensed Statement of Changes in Net Assets (Unaudited) for the three and six months ended June 30, 2011; (iv) Condensed Statements of Cash Flows (Unaudited) for the six months ended June 30, 2011 and 2010; and (v) Condensed Notes to Financial Statements (Unaudited) for the three months ended June 30, 2011. Users of this data are advised pursuant to Rule 406T of Regulation S-T that this interactive data file is deemed not filed or part of a registration statement or prospectus for purposes of sections 11 or 12 of the Securities Act of 1933, is deemed not filed for purposes of section 18 of the Securities and Exchange Act of 1934, and otherwise is not subject to liability under these sections. |
42
Table of Contents
Pursuant to the requirements of the Securities Exchange Act of 1934, the registrant has duly caused this report to be signed on its behalf by the undersigned thereunto duly authorized.
| CYPRESS SHARPRIDGE INVESTMENTS, INC. | ||||||
| Dated: July 21, 2011 | BY: | /s/ FRANCES R. SPARK | ||||
| Frances R. Spark | ||||||
| Chief Financial Officer and Treasurer | ||||||
| (Principal Financial Officer and Principal Accounting Officer) | ||||||
43
Table of Contents
EXHIBIT INDEX
| Exhibit |
Description | |||
| 31.1* | Certification of Chief Executive Officer pursuant to Section 302 of the Sarbanes – Oxley Act of 2002 | |||
| 31.2* | Certification of Chief Financial Officer pursuant to Section 302 of the Sarbanes – Oxley Act of 2002 | |||
| 32.1** | Certification of Chief Executive Officer pursuant to 18 U.S.C. Section 1350, as adopted pursuant to Section 906 of the Sarbanes – Oxley Act of 2002 | |||
| 32.2** | Certification of Chief Financial Officer pursuant to 18 U.S.C. Section 1350, as adopted pursuant to Section 906 of the Sarbanes – Oxley Act of 2002 | |||
| Exhibit 101.INS XBRL |
Instance Document (1) | |||
| Exhibit 101.SCH XBRL |
Taxonomy Extension Schema Document (1) | |||
| Exhibit 101.CAL XBRL |
Taxonomy Extension Calculation Linkbase Document (1) | |||
| Exhibit 101.LAB XBRL |
Taxonomy Extension Label Linkbase Document (1) | |||
| Exhibit 101.PRE XBRL |
Taxonomy Extension Presentation Linkbase Document (1) | |||
| * | Filed herewith. |
| ** | Furnished herewith. |
| (1) | Submitted electronically herewith. Attached as Exhibit 101 to this report are the following documents formatted in XBRL (Extensible Business Reporting Language): (i) Balance Sheets at June 30, 2011 ( Unaudited) and December 31, 2010 (Derived from the audited balance sheet at December 31, 2010); (ii) Condensed Statements of Operations (Unaudited) for the three and six months ended June 30, 2011 and 2010; (iii) Condensed Statement of Changes in Net Assets (Unaudited) for the three and six months ended June 30, 2011; (iv) Condensed Statements of Cash Flows (Unaudited) for the six months ended June 30, 2011 and 2010; and (v) Condensed Notes to Financial Statements (Unaudited) for the three months ended June 30, 2011. Users of this data are advised pursuant to Rule 406T of Regulation S-T that this interactive data file is deemed not filed or part of a registration statement or prospectus for purposes of sections 11 or 12 of the Securities Act of 1933, is deemed not filed for purposes of section 18 of the Securities and Exchange Act of 1934, and otherwise is not subject to liability under these sections. |
44