Attached files
| file | filename |
|---|---|
| 8-K - 8-K - McEwen Mining Inc. | a15-13048_18k.htm |
| EX-4.1 - EX-4.1 - McEwen Mining Inc. | a15-13048_1ex4d1.htm |
| EX-99.1 - EX-99.1 - McEwen Mining Inc. | a15-13048_1ex99d1.htm |
Exhibit 99.2
|
|
MUX AGM MAY 28, 2015 1 1.866.441.0690 x410 • info@mcewenmining.com • www.mcewenmining.com |
|
|
AGENDA Formal Meeting Financials Update Gold Market 2 |
|
|
CAUTIONARY STATEMENT This presentation contains certain forward-looking statements and information, including "forward- looking statements" within the meaning of the Private Securities Litigation Reform Act of 1995. The forward-looking statements and information expressed, as at the date of this presentation, McEwen Mining Inc.'s (the "Company") estimates, forecasts, projections, expectations or beliefs as to future events and results. Forward-looking statements and information are necessarily based upon a number of estimates and assumptions that, while considered reasonable by management, are inherently subject to significant business, technical, economic and competitive uncertainties, risks and contingencies, and there can be no assurance that such statements and information will prove to be accurate. Therefore, actual results and future events could differ materially from those anticipated in such statements and information. Risks and uncertainties that could cause results or future events to differ materially from current expectations expressed or implied by the forward-looking statements and information include, but are not limited to, risks related to the cost of transferring or otherwise allocating funds between operating jurisdictions, factors associated with fluctuations in the market price of precious metals, mining industry risks, political, economic, social and security risks associated with foreign operations, risks related to permitting and the projected timeframes to receive the necessary permits, risks associated with mining operations, the construction of mining operations and commencement of production and the projected costs thereof, risks related to litigation, property title, the state of the capital markets, environmental risks and hazards, uncertainty as to calculation of mineral resources and reserves and other risks. Readers should not place undue reliance on forward-looking statements or information included herein, which speak only as of the date hereof. The Company undertakes no obligation to reissue or update forward-looking statements or information as a result of new information or events after the date hereof except as may be required by law. See McEwen Mining's Annual Report on Form 10-K for the fiscal year ended December 31, 2014 and Quarterly Report or Form 10-Q for the Quarter ended March 31, 2015 and other filings with the Securities and Exchange Commission, under the caption "Risk Factors", for additional information on risks, uncertainties and other factors relating to the forward-looking statements and information regarding the Company. All forward-looking statements and information made in this presentation are qualified by this cautionary statement. All currency information quoted in U.S. dollars. 3 |
|
|
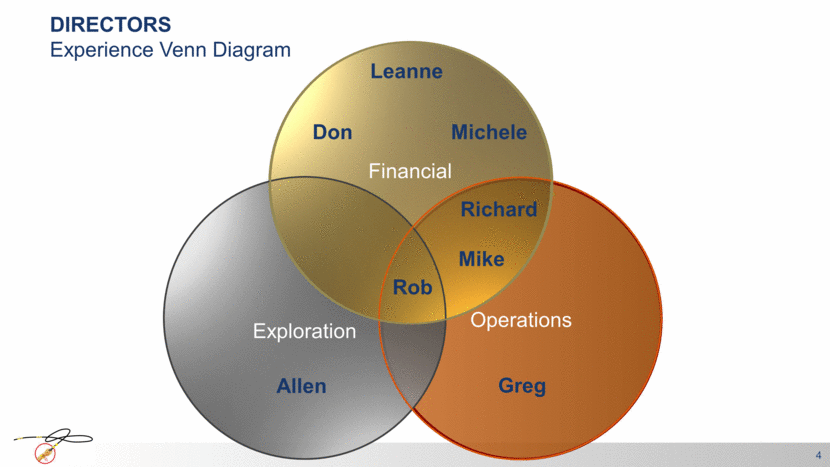
Operations DIRECTORS Experience Venn Diagram 4 Exploration Allen Financial Rob Michele Richard Greg Don Mike Leanne |
|
|
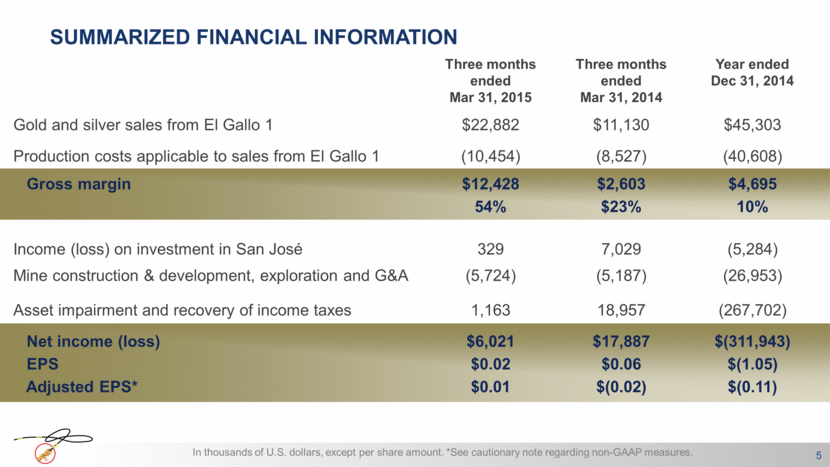
SUMMARIZED FINANCIAL INFORMATION Three months ended Mar 31, 2015 Three months ended Mar 31, 2014 Year ended Dec 31, 2014 Gold and silver sales from El Gallo 1 $22,882 $11,130 $45,303 Production costs applicable to sales from El Gallo 1 (10,454) (8,527) (40,608) Gross margin $12,428 $2,603 $4,695 54% $23% 10% Income (loss) on investment in San José 329 7,029 (5,284) Mine construction & development, exploration and G&A (5,724) (5,187) (26,953) Asset impairment and recovery of income taxes 1,163 18,957 (267,702) Net income (loss) $6,021 $17,887 $(311,943) EPS $0.02 $0.06 $(1.05) Adjusted EPS* $0.01 $(0.02) $(0.11) In thousands of U.S. dollars, except per share amount. *See cautionary note regarding non-GAAP measures. 5 |
|
|
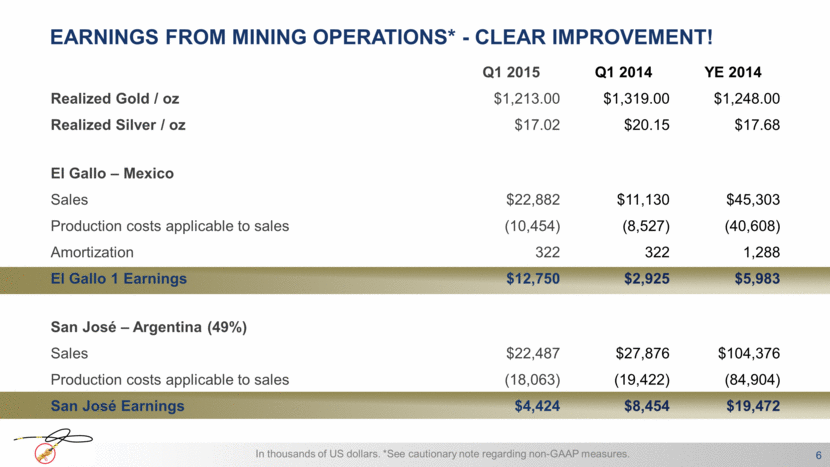
EARNINGS FROM MINING OPERATIONS* - CLEAR IMPROVEMENT! Q1 2015 Q1 2014 YE 2014 Realized Gold / oz $1,213.00 $1,319.00 $1,248.00 Realized Silver / oz $17.02 $20.15 $17.68 El Gallo – Mexico Sales $22,882 $11,130 $45,303 Production costs applicable to sales (10,454) (8,527) (40,608) Amortization 322 322 1,288 El Gallo 1 Earnings $12,750 $2,925 $5,983 San José – Argentina (49%) Sales $22,487 $27,876 $104,376 Production costs applicable to sales (18,063) (19,422) (84,904) San José Earnings $4,424 $8,454 $19,472 In thousands of US dollars. *See cautionary note regarding non-GAAP measures. 6 |
|
|
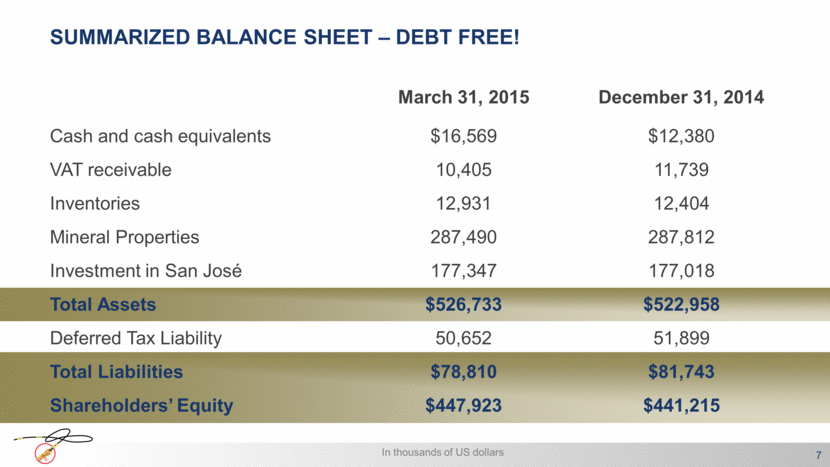
SUMMARIZED BALANCE SHEET – DEBT FREE! March 31, 2015 December 31, 2014 Cash and cash equivalents $16,569 $12,380 VAT receivable 10,405 11,739 Inventories 12,931 12,404 Mineral Properties 287,490 287,812 Investment in San José 177,347 177,018 Total Assets $526,733 $522,958 Deferred Tax Liability 50,652 51,899 Total Liabilities $78,810 $81,743 Shareholders’ Equity $447,923 $441,215 In thousands of US dollars 7 |
|
|
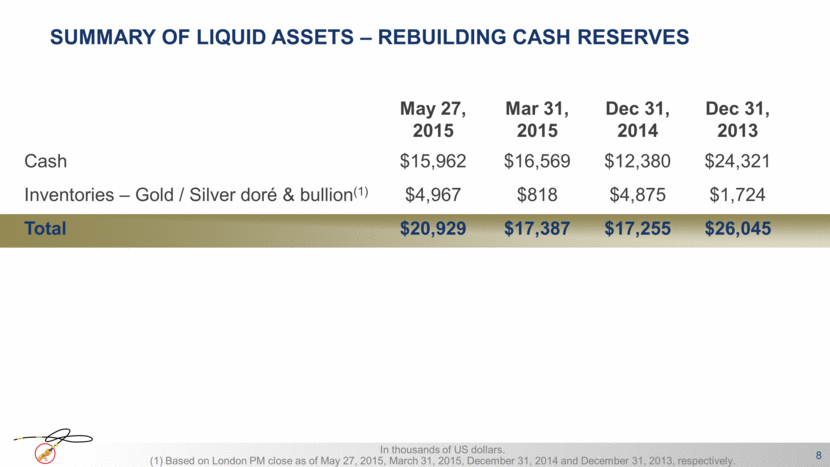
SUMMARY OF LIQUID ASSETS – REBUILDING CASH RESERVES May 27, 2015 Mar 31, 2015 Dec 31, 2014 Dec 31, 2013 Cash $15,962 $16,569 $12,380 $24,321 Inventories – Gold / Silver doré & bullion(1) $4,967 $818 $4,875 $1,724 Total $20,929 $17,387 $17,255 $26,045 In thousands of US dollars. (1) Based on London PM close as of May 27, 2015, March 31, 2015, December 31, 2014 and December 31, 2013, respectively. 8 |
|
|
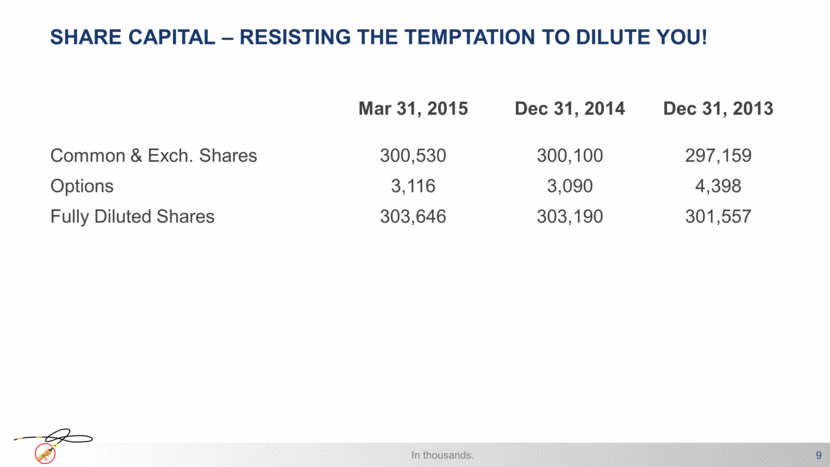
SHARE CAPITAL – RESISTING THE TEMPTATION TO DILUTE YOU! Mar 31, 2015 Dec 31, 2014 Dec 31, 2013 Common & Exch. Shares 300,530 300,100 297,159 Options 3,116 3,090 4,398 Fully Diluted Shares 303,646 303,190 301,557 In thousands. 9 |
|
|
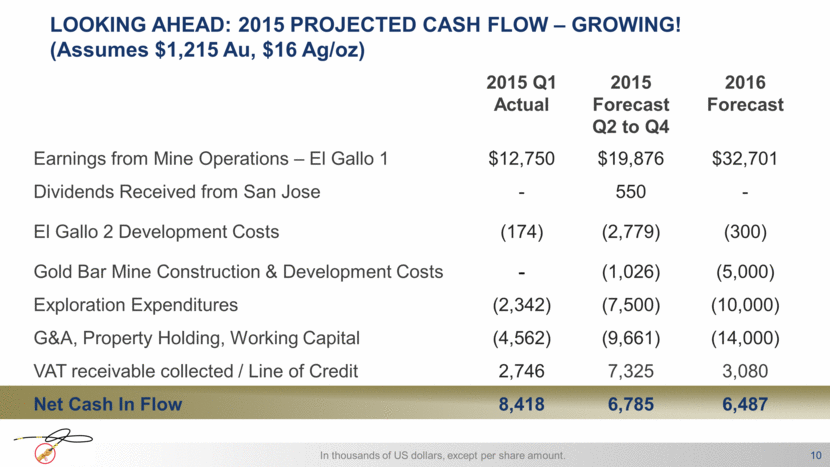
LOOKING AHEAD: 2015 PROJECTED CASH FLOW – GROWING! (Assumes $1,215 Au, $16 Ag/oz) 2015 Q1 Actual 2015 Forecast Q2 to Q4 2016 Forecast Earnings from Mine Operations – El Gallo 1 $12,750 $19,876 $32,701 Dividends Received from San Jose - 550 - El Gallo 2 Development Costs (174) (2,779) (300) Gold Bar Mine Construction & Development Costs - (1,026) (5,000) Exploration Expenditures (2,342) (7,500) (10,000) G&A, Property Holding, Working Capital (4,562) (9,661) (14,000) VAT receivable collected / Line of Credit 2,746 7,325 3,080 Net Cash In Flow 8,418 6,785 6,487 In thousands of US dollars, except per share amount. 10 |
|
|
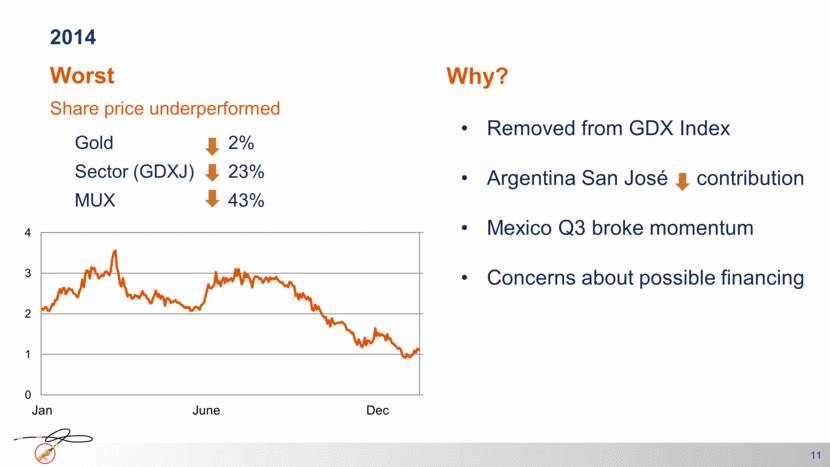
2014 11 Worst Share price underperformed Gold Sector (GDXJ) MUX Why? 2% 23% 43% Removed from GDX Index Argentina San José contribution Mexico Q3 broke momentum Concerns about possible financing Jan June Dec 0 1 2 3 4 |
|
|
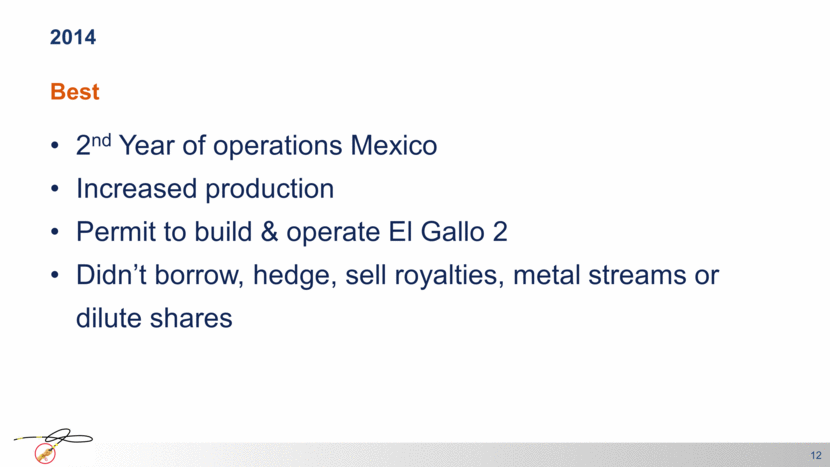
2014 12 Best 2nd Year of operations Mexico Increased production Permit to build & operate El Gallo 2 Didn’t borrow, hedge, sell royalties, metal streams or dilute shares |
|
|
ON TRACK FOR 2015 GUIDANCE 13 Despite Gold Robbery 2015 Looking Like A Record Year Q1 & Q2 Strong Performance @ El Gallo |
|
|
WHAT HAVE WE DONE TO DISCOURAGE ANOTHER ROBBERY? 14 Fortified facilities & perimeter Changed procedures Hired the state police to provide armed security Authorities still investigating |
|
|
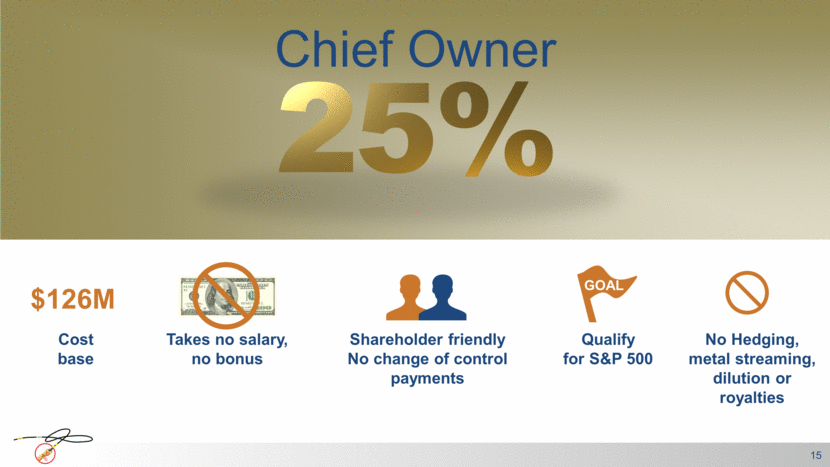
25% Chief Owner Shareholder friendly No change of control payments Qualify for S&P 500 Takes no salary, no bonus Cost base GOAL $126M 15 No Hedging, metal streaming, dilution or royalties |
|
|
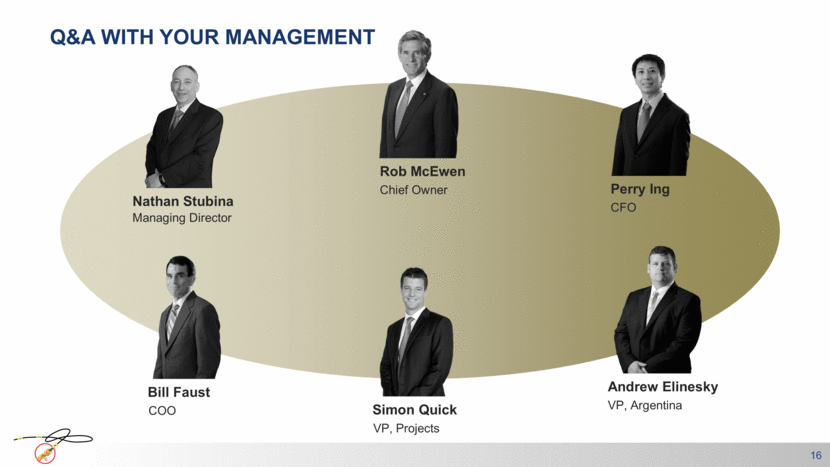
Q&A WITH YOUR MANAGEMENT 16 Rob McEwen Chief Owner Bill Faust COO Nathan Stubina Managing Director Perry Ing CFO Andrew Elinesky VP, Argentina Simon Quick VP, Projects |
|
|
CATALYSTS FOR A GREAT YEAR (& Springboard for Future Growth) 17 2015 Performance Cash Growing Deliverables Exploration Success Possible Source of Funds |
|
|
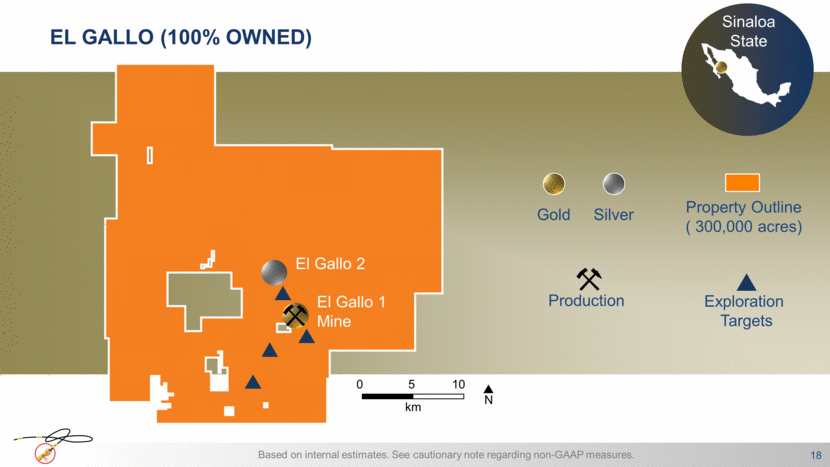
Based on internal estimates. See cautionary note regarding non-GAAP measures. Sinaloa State EL GALLO (100% OWNED) Production 18 Gold Property Outline ( 300,000 acres) Exploration Targets El Gallo 2 El Gallo 1 Mine N 0 5 10 km Silver |
|
|
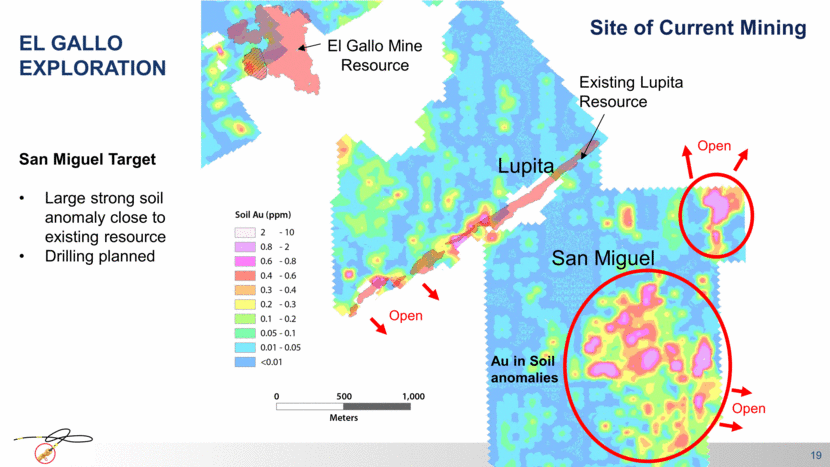
EL GALLO EXPLORATION 19 El Gallo Mine Resource Open Open Open Au in Soil anomalies Existing Lupita Resource Lupita San Miguel San Miguel Target Large strong soil anomaly close to existing resource Drilling planned Site of Current Mining |
|
|
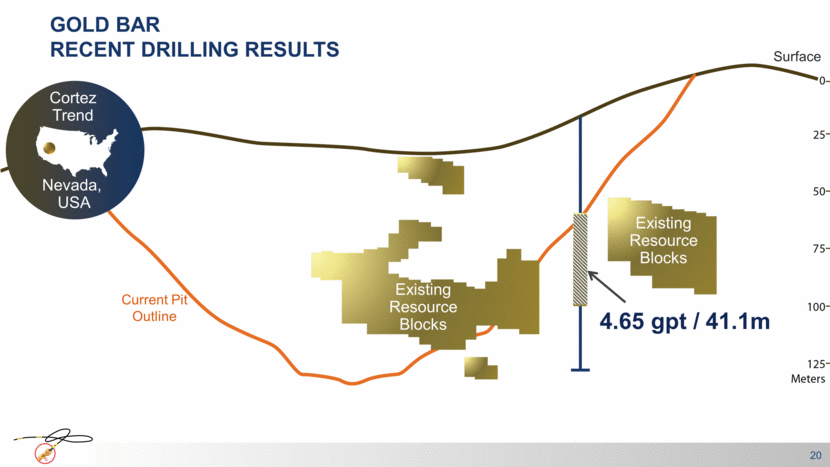
GOLD BAR RECENT DRILLING RESULTS 20 4.65 gpt / 41.1m Surface Existing Resource Blocks Existing Resource Blocks Current Pit Outline Cortez Trend Nevada, USA |
|
|
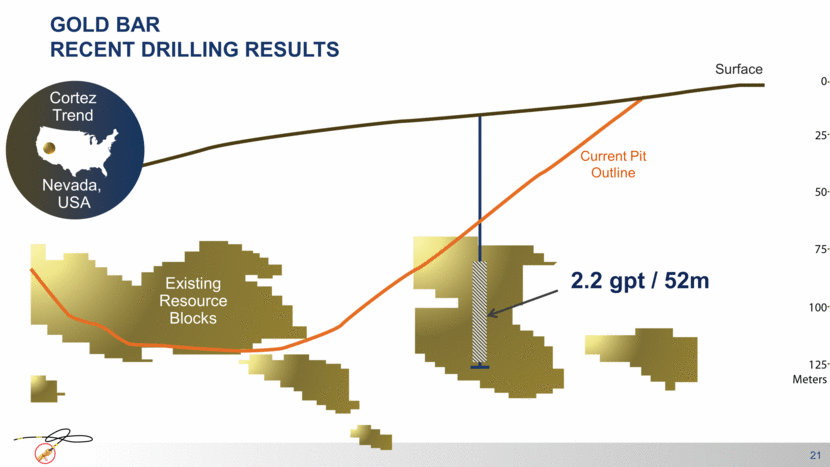
GOLD BAR RECENT DRILLING RESULTS 21 2.2 gpt / 52m Surface Existing Resource Blocks Existing Resource Blocks Current Pit Outline Cortez Trend Nevada, USA |
|
|
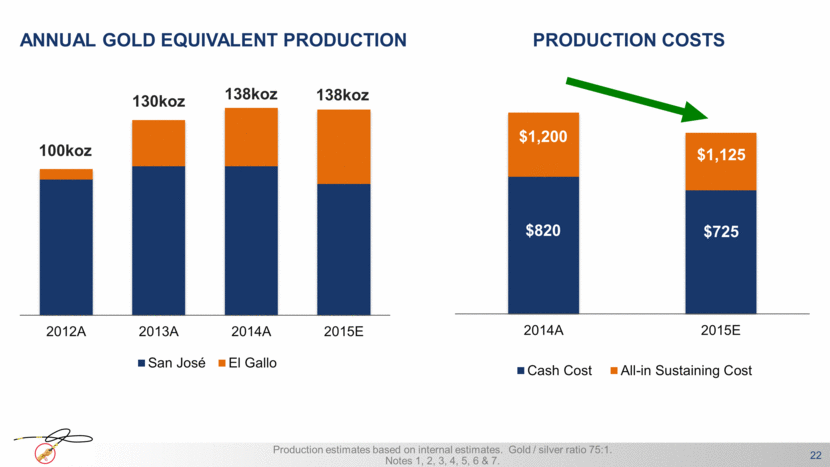
22 $725 $1,125 $820 $1,200 138koz 138koz 130koz 100koz ANNUAL GOLD EQUIVALENT PRODUCTION PRODUCTION COSTS Production estimates based on internal estimates. Gold / silver ratio 75:1. Notes 1, 2, 3, 4, 5, 6 & 7. 2012A 2013A 2014A 2015E San José El Gallo 2014A 2015E Cash Cost All-in Sustaining Cost |
|
|
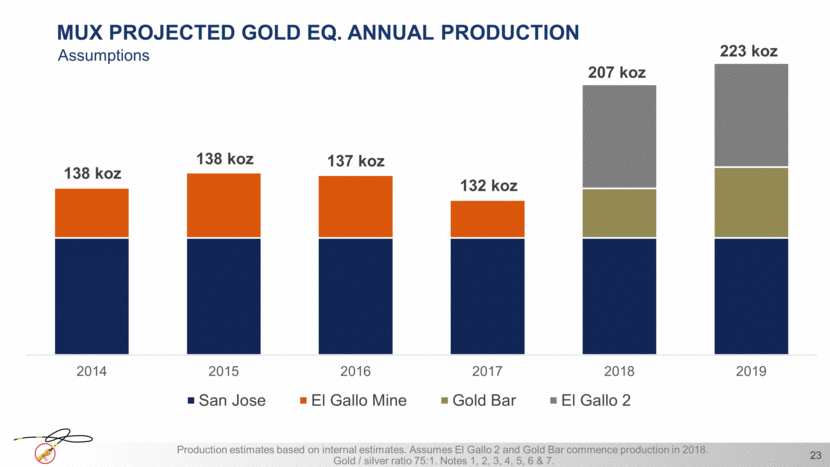
MUX PROJECTED GOLD EQ. ANNUAL PRODUCTION Assumptions Production estimates based on internal estimates. Assumes El Gallo 2 and Gold Bar commence production in 2018. Gold / silver ratio 75:1. Notes 1, 2, 3, 4, 5, 6 & 7. 23 138 koz 138 koz 137 koz 132 koz 207 koz 223 koz 2014 2015 2016 2017 2018 2019 San Jose El Gallo Mine Gold Bar El Gallo 2 |
|
|
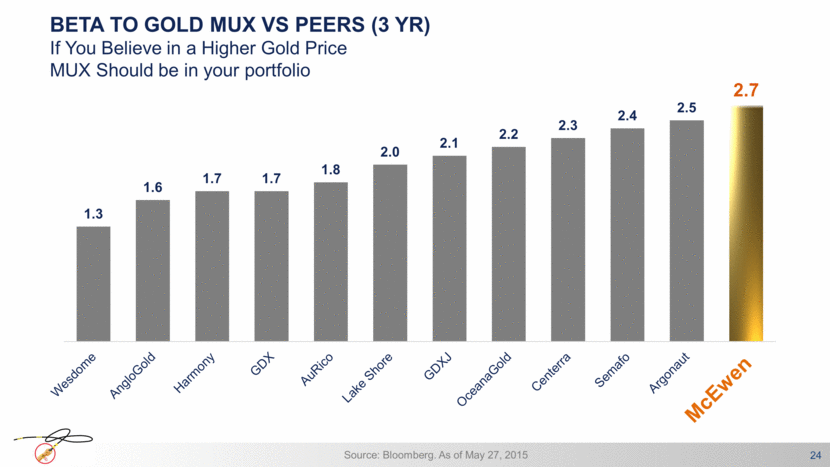
BETA TO GOLD MUX VS PEERS (3 YR) 24 Source: Bloomberg. As of May 27, 2015 McEwen If You Believe in a Higher Gold Price MUX Should be in your portfolio |
|
|
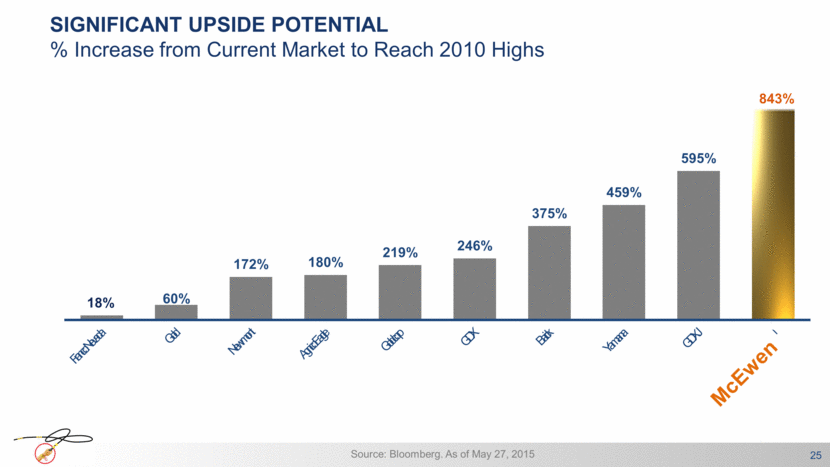
SIGNIFICANT UPSIDE POTENTIAL % Increase from Current Market to Reach 2010 Highs 25 Source: Bloomberg. As of May 27, 2015 McEwen 18% 60% 172% 180% 219% 246% 375% 459% 595% 843% |
|
|
26 Outlook for Gold |
|
|
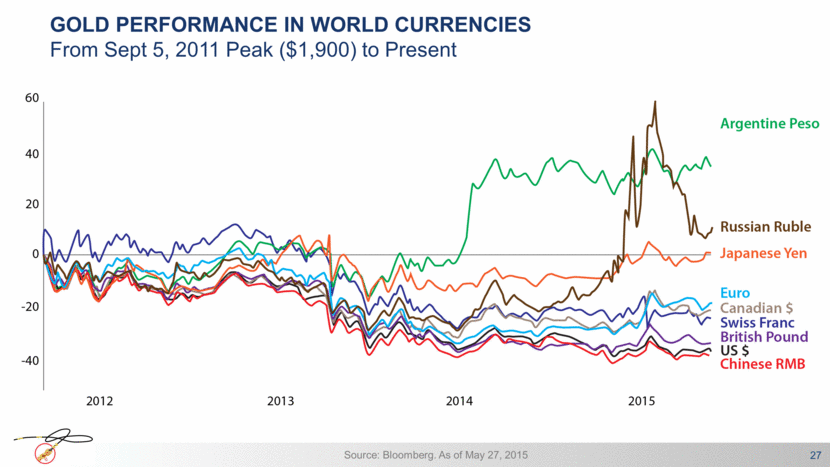
GOLD PERFORMANCE IN WORLD CURRENCIES From Sept 5, 2011 Peak ($1,900) to Present Source: Bloomberg. As of May 27, 2015 27 |
|
|
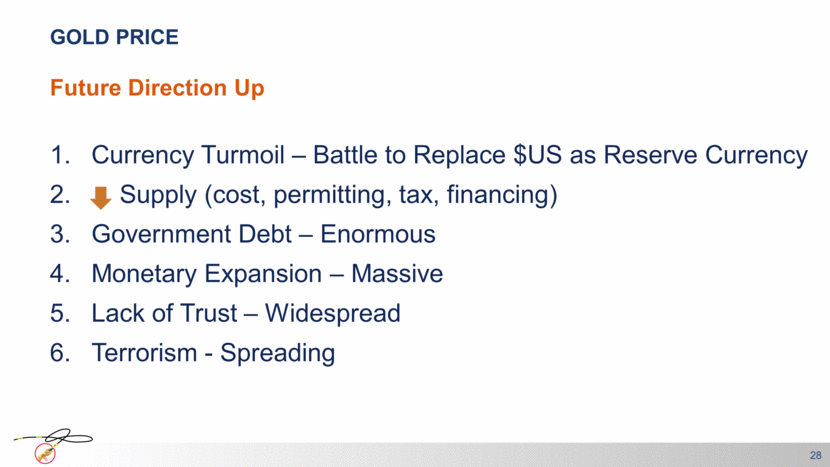
GOLD PRICE 28 Future Direction Up Currency Turmoil – Battle to Replace $US as Reserve Currency Supply (cost, permitting, tax, financing) Government Debt – Enormous Monetary Expansion – Massive Lack of Trust – Widespread Terrorism - Spreading |
|
|
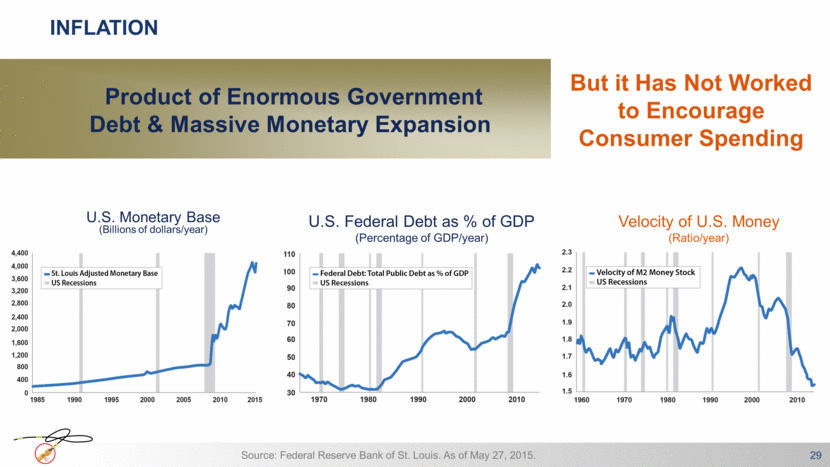
Source: Federal Reserve Bank of St. Louis. As of May 27, 2015. U.S. Federal Debt as % of GDP (Percentage of GDP/year) Velocity of U.S. Money (Ratio/year) 29 U.S. Monetary Base (Billions of dollars/year) INFLATION Product of Enormous Government Debt & Massive Monetary Expansion But it Has Not Worked to Encourage Consumer Spending |
|
|
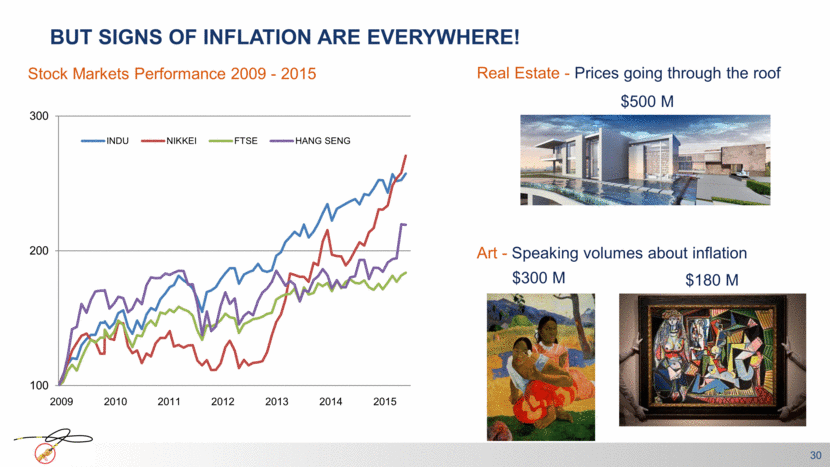
BUT SIGNS OF INFLATION ARE EVERYWHERE! 30 Stock Markets Performance 2009 - 2015 Real Estate - Prices going through the roof Art - Speaking volumes about inflation 2009 2010 2011 2012 2013 2014 2015 $300 M $180 M $500 M 100 200 300 INDU NIKKEI FTSE HANG SENG |
|
|
Gold $5,000 31 |
|
|
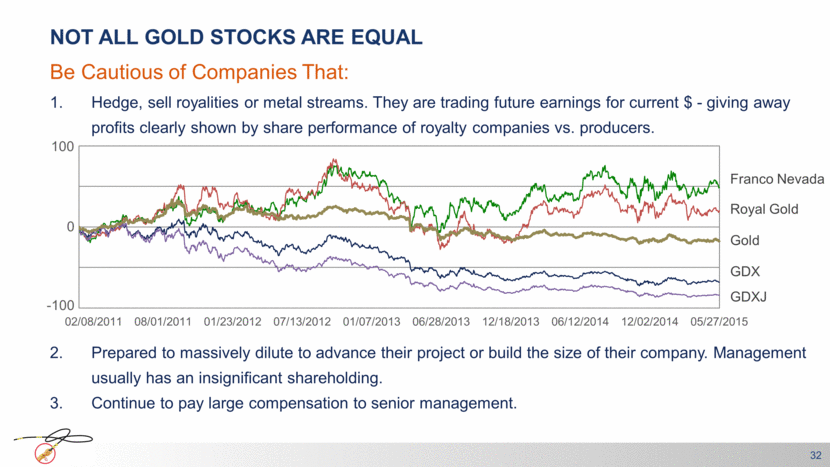
NOT ALL GOLD STOCKS ARE EQUAL 32 Be Cautious of Companies That: Hedge, sell royalities or metal streams. They are trading future earnings for current $ - giving away profits clearly shown by share performance of royalty companies vs. producers. Franco Nevada Royal Gold Gold GDX GDXJ Prepared to massively dilute to advance their project or build the size of their company. Management usually has an insignificant shareholding. Continue to pay large compensation to senior management. 0 -100 100 05/27/2015 12/02/2014 06/12/2014 12/18/2013 06/28/2013 01/07/2013 07/13/2012 01/23/2012 08/01/2011 02/08/2011 |
|
|
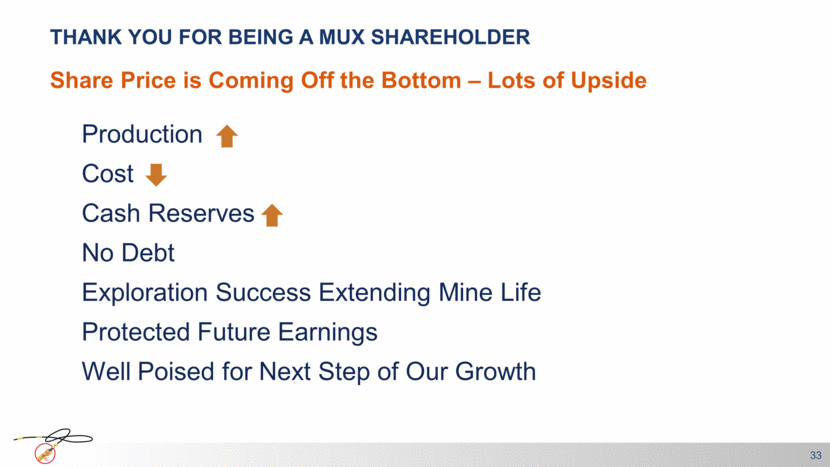
THANK YOU FOR BEING A MUX SHAREHOLDER 33 Share Price is Coming Off the Bottom – Lots of Upside Production Cost Cash Reserves No Debt Exploration Success Extending Mine Life Protected Future Earnings Well Poised for Next Step of Our Growth |
|
|
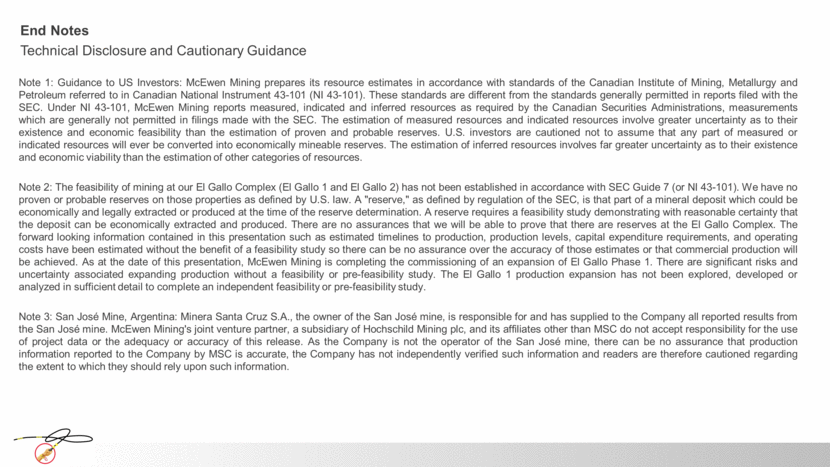
End Notes Note 1: Guidance to US Investors: McEwen Mining prepares its resource estimates in accordance with standards of the Canadian Institute of Mining, Metallurgy and Petroleum referred to in Canadian National Instrument 43-101 (NI 43-101). These standards are different from the standards generally permitted in reports filed with the SEC. Under NI 43-101, McEwen Mining reports measured, indicated and inferred resources as required by the Canadian Securities Administrations, measurements which are generally not permitted in filings made with the SEC. The estimation of measured resources and indicated resources involve greater uncertainty as to their existence and economic feasibility than the estimation of proven and probable reserves. U.S. investors are cautioned not to assume that any part of measured or indicated resources will ever be converted into economically mineable reserves. The estimation of inferred resources involves far greater uncertainty as to their existence and economic viability than the estimation of other categories of resources. Note 2: The feasibility of mining at our El Gallo Complex (El Gallo 1 and El Gallo 2) has not been established in accordance with SEC Guide 7 (or NI 43-101). We have no proven or probable reserves on those properties as defined by U.S. law. A "reserve," as defined by regulation of the SEC, is that part of a mineral deposit which could be economically and legally extracted or produced at the time of the reserve determination. A reserve requires a feasibility study demonstrating with reasonable certainty that the deposit can be economically extracted and produced. There are no assurances that we will be able to prove that there are reserves at the El Gallo Complex. The forward looking information contained in this presentation such as estimated timelines to production, production levels, capital expenditure requirements, and operating costs have been estimated without the benefit of a feasibility study so there can be no assurance over the accuracy of those estimates or that commercial production will be achieved. As at the date of this presentation, McEwen Mining is completing the commissioning of an expansion of El Gallo Phase 1. There are significant risks and uncertainty associated expanding production without a feasibility or pre-feasibility study. The El Gallo 1 production expansion has not been explored, developed or analyzed in sufficient detail to complete an independent feasibility or pre-feasibility study. Note 3: San José Mine, Argentina: Minera Santa Cruz S.A., the owner of the San José mine, is responsible for and has supplied to the Company all reported results from the San José mine. McEwen Mining's joint venture partner, a subsidiary of Hochschild Mining plc, and its affiliates other than MSC do not accept responsibility for the use of project data or the adequacy or accuracy of this release. As the Company is not the operator of the San José mine, there can be no assurance that production information reported to the Company by MSC is accurate, the Company has not independently verified such information and readers are therefore cautioned regarding the extent to which they should rely upon such information. Technical Disclosure and Cautionary Guidance |
|
|
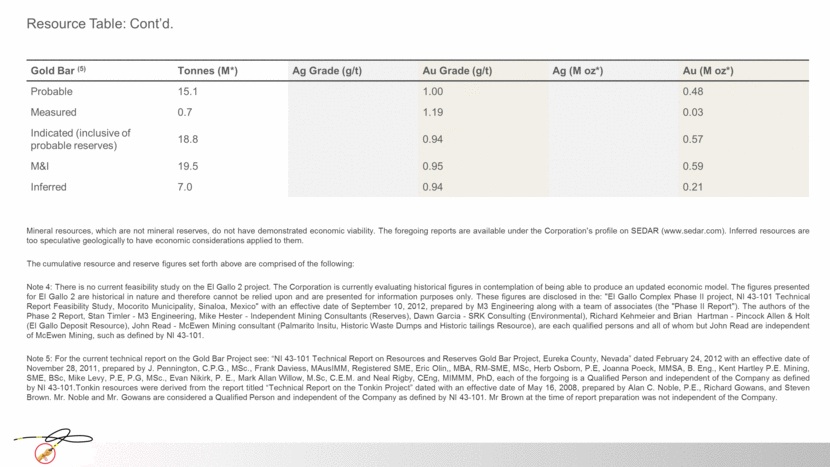
Gold Bar (5) Tonnes (M*) Ag Grade (g/t) Au Grade (g/t) Ag (M oz*) Au (M oz*) Probable 15.1 1.00 0.48 Measured 0.7 1.19 0.03 Indicated (inclusive of probable reserves) 18.8 0.94 0.57 M&I 19.5 0.95 0.59 Inferred 7.0 0.94 0.21 Resource Table: Cont’d. Mineral resources, which are not mineral reserves, do not have demonstrated economic viability. The foregoing reports are available under the Corporation's profile on SEDAR (www.sedar.com). Inferred resources are too speculative geologically to have economic considerations applied to them. The cumulative resource and reserve figures set forth above are comprised of the following: Note 4: There is no current feasibility study on the El Gallo 2 project. The Corporation is currently evaluating historical figures in contemplation of being able to produce an updated economic model. The figures presented for El Gallo 2 are historical in nature and therefore cannot be relied upon and are presented for information purposes only. These figures are disclosed in the: "El Gallo Complex Phase II project, NI 43-101 Technical Report Feasibility Study, Mocorito Municipality, Sinaloa, Mexico" with an effective date of September 10, 2012, prepared by M3 Engineering along with a team of associates (the "Phase II Report"). The authors of the Phase 2 Report, Stan Timler - M3 Engineering, Mike Hester - Independent Mining Consultants (Reserves), Dawn Garcia - SRK Consulting (Environmental), Richard Kehmeier and Brian Hartman - Pincock Allen & Holt (El Gallo Deposit Resource), John Read - McEwen Mining consultant (Palmarito Insitu, Historic Waste Dumps and Historic tailings Resource), are each qualified persons and all of whom but John Read are independent of McEwen Mining, such as defined by NI 43-101. Note 5: For the current technical report on the Gold Bar Project see: “NI 43-101 Technical Report on Resources and Reserves Gold Bar Project, Eureka County, Nevada” dated February 24, 2012 with an effective date of November 28, 2011, prepared by J. Pennington, C.P.G., MSc., Frank Daviess, MAusIMM, Registered SME, Eric Olin,, MBA, RM-SME, MSc, Herb Osborn, P.E, Joanna Poeck, MMSA, B. Eng., Kent Hartley P.E. Mining, SME, BSc, Mike Levy, P.E, P.G, MSc., Evan Nikirk, P. E., Mark Allan Willow, M.Sc, C.E.M. and Neal Rigby, CEng, MIMMM, PhD, each of the forgoing is a Qualified Person and independent of the Company as defined by NI 43-101.Tonkin resources were derived from the report titled “Technical Report on the Tonkin Project” dated with an effective date of May 16, 2008, prepared by Alan C. Noble, P.E., Richard Gowans, and Steven Brown. Mr. Noble and Mr. Gowans are considered a Qualified Person and independent of the Company as defined by NI 43-101. Mr Brown at the time of report preparation was not independent of the Company. |
|
|
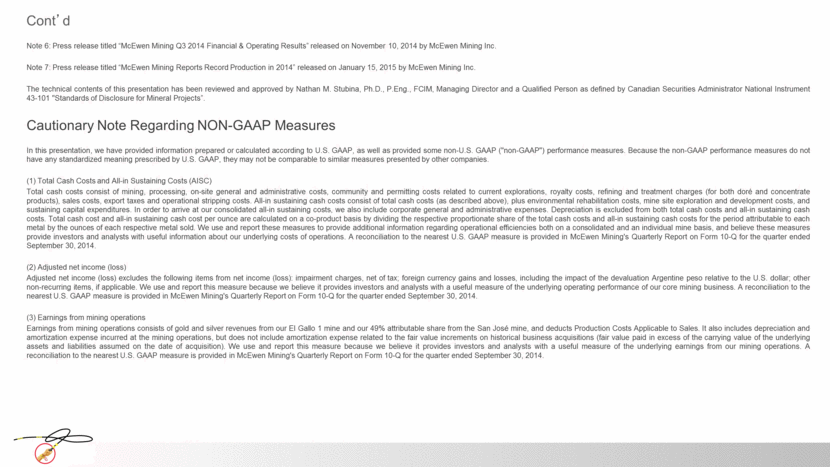
Note 6: Press release titled “McEwen Mining Q3 2014 Financial & Operating Results” released on November 10, 2014 by McEwen Mining Inc. Note 7: Press release titled “McEwen Mining Reports Record Production in 2014” released on January 15, 2015 by McEwen Mining Inc. The technical contents of this presentation has been reviewed and approved by Nathan M. Stubina, Ph.D., P.Eng., FCIM, Managing Director and a Qualified Person as defined by Canadian Securities Administrator National Instrument 43-101 "Standards of Disclosure for Mineral Projects”. Cautionary Note Regarding NON-GAAP Measures In this presentation, we have provided information prepared or calculated according to U.S. GAAP, as well as provided some non-U.S. GAAP ("non-GAAP") performance measures. Because the non-GAAP performance measures do not have any standardized meaning prescribed by U.S. GAAP, they may not be comparable to similar measures presented by other companies. (1) Total Cash Costs and All-in Sustaining Costs (AISC) Total cash costs consist of mining, processing, on-site general and administrative costs, community and permitting costs related to current explorations, royalty costs, refining and treatment charges (for both doré and concentrate products), sales costs, export taxes and operational stripping costs. All-in sustaining cash costs consist of total cash costs (as described above), plus environmental rehabilitation costs, mine site exploration and development costs, and sustaining capital expenditures. In order to arrive at our consolidated all-in sustaining costs, we also include corporate general and administrative expenses. Depreciation is excluded from both total cash costs and all-in sustaining cash costs. Total cash cost and all-in sustaining cash cost per ounce are calculated on a co-product basis by dividing the respective proportionate share of the total cash costs and all-in sustaining cash costs for the period attributable to each metal by the ounces of each respective metal sold. We use and report these measures to provide additional information regarding operational efficiencies both on a consolidated and an individual mine basis, and believe these measures provide investors and analysts with useful information about our underlying costs of operations. A reconciliation to the nearest U.S. GAAP measure is provided in McEwen Mining's Quarterly Report on Form 10-Q for the quarter ended September 30, 2014. (2) Adjusted net income (loss) Adjusted net income (loss) excludes the following items from net income (loss): impairment charges, net of tax; foreign currency gains and losses, including the impact of the devaluation Argentine peso relative to the U.S. dollar; other non-recurring items, if applicable. We use and report this measure because we believe it provides investors and analysts with a useful measure of the underlying operating performance of our core mining business. A reconciliation to the nearest U.S. GAAP measure is provided in McEwen Mining's Quarterly Report on Form 10-Q for the quarter ended September 30, 2014. (3) Earnings from mining operations Earnings from mining operations consists of gold and silver revenues from our El Gallo 1 mine and our 49% attributable share from the San José mine, and deducts Production Costs Applicable to Sales. It also includes depreciation and amortization expense incurred at the mining operations, but does not include amortization expense related to the fair value increments on historical business acquisitions (fair value paid in excess of the carrying value of the underlying assets and liabilities assumed on the date of acquisition). We use and report this measure because we believe it provides investors and analysts with a useful measure of the underlying earnings from our mining operations. A reconciliation to the nearest U.S. GAAP measure is provided in McEwen Mining's Quarterly Report on Form 10-Q for the quarter ended September 30, 2014. Cont’d |


