Attached files
| file | filename |
|---|---|
| EX-32 - EX-32 - McEwen Mining Inc. | mux-20171231xex32.htm |
| EX-31.2 - EX-31.2 - McEwen Mining Inc. | mux-20171231ex312720e40.htm |
| EX-31.1 - EX-31.1 - McEwen Mining Inc. | mux-20171231ex311668e2f.htm |
| EX-23.2 - EX-23.2 - McEwen Mining Inc. | mux-20171231ex23247f3ae.htm |
| EX-23.1 - EX-23.1 - McEwen Mining Inc. | mux-20171231ex231995569.htm |
| EX-21 - EX-21 - McEwen Mining Inc. | mux-20171231ex213e0d525.htm |
| EX-10.7 - EX-10.7 - McEwen Mining Inc. | mux-20171231ex107b8735a.htm |
so
UNITED STATES
SECURITIES AND EXCHANGE COMMISSION
Washington, D.C. 20549
FORM 10‑K
|
|
|
|
☒ |
ANNUAL REPORT PURSUANT TO SECTION 13 OR 15(d) OF THE SECURITIES EXCHANGE ACT OF 1934 |
|
For the fiscal year ended December 31, 2017 |
|
|
☐ |
TRANSITION REPORT UNDER SECTION 13 OR 15(d) OF THE SECURITIES EXCHANGE ACT OF 1934 |
|
For the transition period from to |
|
Commission file number 001‑33190
MCEWEN MINING INC.
(Name of registrant as specified in its charter)
|
|
|
|
Colorado |
84‑0796160 |
|
(State or other jurisdiction of incorporation or organization) |
(I.R.S. Employer Identification No.) |
|
150 King Street West, Suite 2800, Toronto, Ontario Canada |
M5H 1J9 |
|
(Address of principal executive offices) |
(Zip Code) |
(866) 441‑0690
(Registrant’s telephone number, including area code)
Securities registered pursuant to Section 12(b) of the Act:
|
Common Stock, no par value |
|
NYSE |
|
Title of each class |
|
Name of each exchange on which registered |
Securities registered pursuant to Section 12(g) of the Act: None
Indicate by check mark if the registrant is a well-known seasoned issuer, as defined in Rule 405 of the Securities Act. Yes ☐ No ☒
Indicate by check mark if the registrant is not required to file reports pursuant to Section 13 or Section 15(d) of the Act. Yes ☐ No ☒
Indicate by check mark whether the registrant (1) has filed all reports required to be filed by Section 13 or 15(d) of the Securities Exchange Act of 1934 during the preceding 12 months (or for such shorter period that the registrant was required to file such reports), and (2) has been subject to such filing requirements for the past 90 days. Yes ☒ No ☐
Indicate by check mark whether the registrant has submitted electronically and posted on its corporate web site, if any, every Interactive Data File required to be submitted and posted pursuant to Rule 405 of Regulation S-T (§ 232.405 of this chapter) during the preceding 12 months (or for such shorter period that the registrant was required to submit and post such files). Yes ☒ No ☐
Indicate by check mark if disclosure of delinquent filers pursuant to Item 405 of Regulation S-K (§ 229.405 of this chapter) is not contained herein, and will not be contained, to the best of registrant’s knowledge, in definitive proxy or information statements incorporated by reference in Part III of this Form 10-K or any amendment to this Form 10-K. ☐
Indicate by check mark whether the registrant is a large accelerated filer, an accelerated filer, a non‑accelerated filer, a smaller reporting company or emerging growth company. See the definitions of “large accelerated filer,” “accelerated filer,” “smaller reporting company” and emerging growth company in Rule 12b‑2 of the Exchange Act.
|
Large accelerated filer ☒ |
Accelerated filer ☐ |
|
Non-accelerated filer ☐ |
Smaller reporting company ☐ |
|
(Do not check if a smaller reporting company) |
Emerging growth company ☐ |
If an emerging growth company, indicate by check mark if the registrant has elected not to use the extended transition period for complying with any new or revised financial accounting standards provided pursuant to Section 13(a) of the Exchange Act. ☐
Indicate by check mark whether the registrant is a shell company (as defined in Rule 12b‑2 of the Exchange Act). Yes ☐ No ☒
As of June 30, 2017 (the last business day of the registrant’s second fiscal quarter), the aggregate market value of the registrant’s voting and non-voting common equity held by non-affiliates of the registrant was $613,010,302 based on the closing price of $2.63 per share as reported on the NYSE. There were 337,054,594 shares of common stock outstanding on February 20, 2018.
DOCUMENTS INCORPORATED BY REFERENCE: Portions of the Proxy Statement for the 2018 Annual Meeting of Shareholders are incorporated into Part III, Items 10 through 14 of this report.
ADDITIONAL INFORMATION
Descriptions of agreements or other documents in this report are intended as summaries and are not necessarily complete. Please refer to the agreements or other documents filed or incorporated herein by reference as exhibits. Please see the Exhibit Index at the end of this report for a complete list of those exhibits.
1
SPECIAL NOTE REGARDING FORWARD‑LOOKING STATEMENTS
Please see the note under “ITEM 7. MANAGEMENT’S DISCUSSION AND ANALYSIS OF FINANCIAL CONDITION AND RESULTS OF OPERATIONS,” for a description of special factors potentially affecting forward‑looking statements included in this report.
CAUTIONARY NOTE TO UNITED STATES INVESTORS—INFORMATION CONCERNING
PREPARATION OF RESOURCE AND RESERVE ESTIMATES
McEwen Mining Inc. (“McEwen Mining,” “we”, “our”, “us” or the “Company”) is required to prepare reports under the Securities Exchange Act of 1934 and the Canadian Securities Administrators’ National Instrument 43‑101 “Standards of Disclosure for Mineral Projects” (“NI 43‑101”), under the Canadian securities laws because we are listed on the Toronto Stock Exchange (“TSX”) and subject to Canadian securities laws. Standards under NI 43-101 are materially different than the standards generally permitted in reports filed with the United States (“U.S.”) Securities and Exchange Commission (“SEC”).
Definitions of terms under NI 43‑101 differ materially from the definitions of those and related terms in Industry Guide 7 (“Industry Guide 7”) promulgated by the SEC. Under U.S. standards, mineralization may not be classified as a “Reserve” unless a determination has been made that the mineralization could be economically and legally produced or extracted at the time the reserve determination is made. Under Industry Guide 7 standards, a “Final” or “Bankable” feasibility study or other report is required to report reserves, the three-year historical average precious metals prices are used in any reserve or cash flow analysis to designate reserves and the primary environmental analysis or report must be filed with the appropriate government authority.
One consequence of these differences is that “reserves” calculated in accordance with Canadian standards may not be “Reserves” under Industry Guide 7 standards. U.S. investors should be aware that the only McEwen Mining properties with reserves as defined by Industry Guide 7 are the Black Fox mine, the Gold Bar project and the San Jose mine. All other properties do not have “Reserves” as defined by Industry Guide 7 and are cautioned not to assume that any part or all the disclosed mineralized material will be confirmed or converted into Industry Guide 7 compliant “Reserves”.
Further, since we have no reserves on some of our properties as defined in Industry Guide 7, we have in the past and will continue to expense substantially all design, construction and development costs with regard to those properties, even though these expenditures are expected to have a future economic benefit in excess of one year. Only certain types of property and equipment which have alternative uses or significant salvage value may be capitalized without proven and probable reserves. We also expense our asset retirement obligations on those properties. Companies that have reserves under Industry Guide 7 typically capitalize these costs, and subsequently depreciate or amortize them on a units‑of‑production basis as reserves are mined. Unlike these other companies, we depreciate or amortize any capitalized costs based on the most appropriate amortization method, which includes straight‑line or Units-of-production method over the estimated life of the mine, as determined by our internal mine plans. Because of these and other differences, our financial statements may not be comparable to the financial statements of mining companies that have established reserves.
Under NI 43‑101, we report measured, indicated and inferred resources, which are measurements that are generally not permitted in filings made with the SEC. The estimation of measured resources and indicated resources involve greater uncertainty as to their existence and economic feasibility than the estimation of proven and probable reserves under Industry Guide 7. U.S. investors are cautioned not to assume that any part of measured or indicated resources will ever be converted into economically mineable reserves. The estimation of inferred resources involves far greater uncertainty as to their existence and economic viability than the estimation of other categories of resources. Inferred Mineral Resources could be upgraded to Indicated Mineral Resources with continued exploration. Therefore, U.S. investors are also cautioned not to assume that all or any part of inferred resources exist, or that they can be legally or economically mined.
Canadian regulations permit the disclosure of resources in terms of “contained ounces” provided that the tonnes and grade for each resource are also disclosed; however, the SEC only permits issuers to report “mineralized material” in tonnage and average grade without reference to contained ounces. Under U.S. regulations, the tonnage and average grade described herein and other information disseminated to you would be characterized as mineralized material. We provide such disclosure about our properties to allow a means of comparing our projects to those of other companies in the mining industry, many of which are Canadian and report pursuant to NI 43‑101, and to comply with applicable disclosure requirements.
We also note that drill results are not indicative of mineralized material in other areas where we have mining interests. Furthermore, mineralized material identified on our properties does not and may never have demonstrated economic or legal viability.
RELIABILITY OF INFORMATION
Minera Santa Cruz S.A.(“MSC”), the owner of the San José mine, is responsible for and has supplied to us all reported results from the San José mine. The technical information contained herein with regard to the San José mine is, with few exceptions as noted, based entirely on information provided to us by MSC. Our joint venture partner, a subsidiary of Hochschild Mining plc, and its affiliates other than MSC do not accept responsibility for the use of project data or the adequacy or accuracy of this information.
2
History and Organization
We are a mining and minerals production and exploration company focused on precious and base metals in Argentina, Mexico, Canada and the United States. On January 24, 2012, we changed our name from US Gold Corporation to McEwen Mining Inc. after the completion of the acquisition of Minera Andes Inc. (“Minera Andes”) by way of a statutory plan of arrangement under the laws of the Province of Alberta, Canada.
In 2017, we completed two acquisitions that established our operations in Canada. On April 26, 2017, we completed the acquisition of Lexam VG Gold Inc. (“Lexam”) pursuant to a statutory Plan of Arrangement under Ontario law and Lexam became a wholly-owned subsidiary of our company. Lexam controls a cluster of four past-producing gold properties located in the Timmins district of northern Ontario, Canada, which we believe have the potential for both open-pit and underground mining.
On October 3, 2017, we completed the acquisition of additional mining assets located in the Timmins district of Ontario. In a transaction with Primero Mining Corp., we acquired the Black Fox Complex, an operating underground precious metal mine, associated mining claims and equipment, the Black Fox-Stock Mill, and the Grey Fox and Froome projects, advanced-stage properties located near the Black Fox Complex.
Following the acquisitions in 2017, we own 100% of the El Gallo 1 mine in the state of Sinaloa, Mexico, 100% of the Black Fox Complex in Timmins, Ontario, Canada, and a 49% interest in Minera Santa Cruz S.A. (“MSC”), the owner and operator of the producing San José mine in the province of Santa Cruz, Argentina, which is controlled by the majority owner of the joint venture, Hochschild Mining plc (“Hochschild”). In addition to our operating properties, we also hold interests in advanced stage and exploration stage properties and projects in Argentina, Mexico, Timmins, and the United States, including the Gold Bar (“Gold Bar”) and Los Azules (“Los Azules”) projects.
Our objective is to increase the value of our shares through the exploration and extraction of gold, silver and other valuable minerals. Other than the San José mine in Argentina, we generally conduct our activities as the sole operator, but we may enter into arrangements with other companies through joint venture or similar agreements in an effort to achieve our strategic objectives. We hold our mineral interests and property and operate our business through various subsidiary companies, and except for MSC, each of which is owned entirely, directly, or indirectly, by us.
Our principal executive office is located at 150 King Street West, Suite 2800, Toronto, Ontario, Canada M5H 1J9 and our telephone number is (866) 441-0690. We also maintain offices in San Juan, Argentina; Guamuchil, Mexico, Elko, Nevada (U.S.), and Matheson, Canada. Our website is www.mcewenmining.com. We make available our periodic reports and news releases and certain of our corporate governance documents, including our Code of Ethics, on our website. Our common stock is listed on the New York Stock Exchange (“NYSE”) and on the Toronto Stock Exchange (“TSX”) under the symbol “MUX”.
In this report, “McEwen Mining”, the “Company”, “our” and “we” refer to McEwen Mining Inc. together with our subsidiaries, unless otherwise noted. “Au” represents gold; “Ag” represents silver; “Cu” represents copper, “oz” represents troy ounce; “gpt” represents grams per metric tonne; “ft.” represents feet; “m” represents meter; “km” represents kilometer; and “sq.” represents square, and C$ refers to Canadian dollars. All our financial information is reported in United States (U.S.) dollars, unless otherwise noted.
Segment Information
Our operating segments include Mexico, MSC, Nevada, Los Azules and Canada. Canada became a new operating segment with the acquisition of Lexam and the Black Fox Complex in 2017. Financial information for each of our reportable segments can be found under Item 7. Management’s Discussion and Analysis of Financial Condition and Results of
3
Operations and Item 8. Financial Statements and Supplementary Data, Note 15. Our sales and long-lived assets, based on the location from which they originate, are geographically distributed as follows:
|
|
|
Sales |
|
Long‑Lived Assets |
|
||||||||
|
|
|
2017 |
|
2016 |
|
2015 |
|
2017 |
|
2016 |
|
2015 |
|
|
Mexico |
|
83 |
% |
100 |
% |
100 |
% |
7 |
% |
7 |
% |
6 |
% |
|
Argentina(1) |
|
— |
% |
— |
% |
— |
% |
67 |
% |
84 |
% |
85 |
% |
|
United States |
|
— |
% |
— |
% |
— |
% |
9 |
% |
9 |
% |
9 |
% |
|
Canada |
|
17 |
% |
— |
% |
— |
% |
17 |
% |
— |
% |
— |
% |
|
Other |
|
— |
% |
— |
% |
— |
% |
— |
% |
— |
% |
— |
% |
|
(1) |
Includes our 49% equity investment in MSC. |
Products
The end product at our gold and silver operations is either in the form of doré or concentrate. Doré is an alloy consisting primarily of gold and silver but also containing other impurity metals. Doré is sent to refiners to produce bullion that meets the required market standard of 99.95% gold and 99.9% silver. Ore concentrate, or simply concentrate, is raw ore that has been ground finely to a powdery product from which gangue (waste) is removed, thus concentrating the metal component. Slag and fine carbon are by-products of the gold production process left over after gold and silver have been separated which are sent to smelters for further recovery of metals.
Production from the El Gallo 1 mine consists of approximately 98% doré and 2% slag and fine carbon, whereas 100% of gold and silver production at the Black Fox mine is doré. Production from the San José mine consists of approximately 48% doré and 52% concentrate.
During 2017, we reported the following consolidated production attributable to us:
|
|
|
Gold |
|
Silver |
|
Gold equivalent |
|
Consolidated Production |
|
ounces |
|
ounces |
|
ounces(1) |
|
|
|
|
|
|
|
|
|
El Gallo 1 mine |
|
46,446 |
|
18,586 |
|
46,694 |
|
Black Fox Complex(2) |
|
14,268 |
|
804 |
|
14,279 |
|
San José mine (on 49% basis) |
|
49,232 |
|
3,159,352 |
|
91,357 |
|
Total Production |
|
109,946 |
|
3,178,742 |
|
152,330 |
|
(1) |
Calculated using silver to gold ratio of 75:1 |
|
(2) |
The Black Fox Complex was acquired effective October 3, 2017, so the figures represent a partial year of production. |
Gold and silver bullion obtained from the doré produced in Mexico and Canada is sold at the prevailing spot market price. Gold and silver doré produced from the San José mine is sold at the prevailing spot market price based on the London fix. Concentrates are provisionally priced, whereby the selling price is subject to final adjustments at the end of a period ranging from 30 to 90 days after delivery to the customer. The final price is based on the market price at the relevant quotation point stipulated in the contract. Due to the time elapsed between shipment and the final settlement with the buyer, MSC must estimate the prices at which sales of metals will be settled. At the end of each financial reporting period, previously recorded provisional sales are adjusted to estimated settlement metals prices based on relevant forward market prices until final settlement with the buyer.
During 2017, total gold and silver sales were $55.8 million for the El Gallo 1 mine, $11.6 million for the Black Fox mine, and $227.1 million for the San José mine on a 100% basis. Since we account for the San José mine using the equity method of accounting, we do not include revenue from the San José mine in the Consolidated Statement of Operations and Comprehensive (Loss) Income. See Item 7. Management’s Discussion and Analysis of Financial Condition and Results of Operations for additional information regarding production and operating results for our properties, and Item 8. Financial Statements and Supplementary Data, Note 2, Summary of Significant Accounting Policies—Investments, for additional information regarding the equity method of accounting.
4
Like all metal producers, our operations are affected by fluctuations in metal prices. The following table presents the annual high, low and average daily London P.M. Fix prices per ounce for gold and London Fix prices per ounce for silver over the past three years and 2018 to the most recent practical date on the London Bullion Market:
|
|
|
Gold |
|
Silver |
|
||||||||||||||
|
Year |
|
High |
|
Low |
|
Average |
|
High |
|
Low |
|
Average |
|
||||||
|
|
|
(in dollars per ounce) |
|
||||||||||||||||
|
2015 |
|
$ |
1,296 |
|
$ |
1,049 |
|
$ |
1,160 |
|
$ |
18.23 |
|
$ |
13.71 |
|
$ |
15.68 |
|
|
2016 |
|
|
1,366 |
|
|
1,077 |
|
|
1,251 |
|
|
20.71 |
|
|
13.58 |
|
|
17.14 |
|
|
2017 |
|
|
1,346 |
|
|
1,151 |
|
|
1,257 |
|
|
18.56 |
|
|
15.22 |
|
|
17.05 |
|
|
2018 (through February 16, 2018) |
|
|
1,355 |
|
|
1,311 |
|
|
1,332 |
|
|
17.52 |
|
|
16.35 |
|
|
17.01 |
|
On February 16, 2018 the London P.M. Fix for gold was $1,352 per ounce, whereas the London Fix for silver was $16.84 per ounce.
Gold and Silver Processing Methods
Gold and silver are extracted from mineralized material by either milling or heap leaching depending on, among other things, the amount of gold and silver contained in the material, whether the material is naturally oxidized or not, the amenability of the material to treatment. At the El Gallo 1 mine, mineralized material is processed using heap leaching methods. Heap leaching consists of stacking crushed, oxidized material on impermeable pads, where a weak cyanide solution is applied to the surface of the heap to leach the gold and silver. The gold and silver‑bearing solution is then collected and processed into gold and silver into doré bars. Doré bars are then shipped from the mine to a third party refiner to obtain bullion.
At Black Fox, ore mined is initially crushed on-site, transported to the Black Fox mill site and fed to the mill’s crushing circuit. Following processing and refining, the mill produces doré bars. Doré bars are then shipped from the mine to a third party refiner to obtain bullion.
The processing plant at the San José mine is composed of conventional crushing, grinding and flotation circuits. Approximately half of the silver‑gold flotation concentrate is subsequently processed in an intensive cyanide leaching circuit with the dissolved gold and silver recovered by electro-winning of a clarified solution followed by smelting to produce doré. The doré is then sent to refiners to obtain bullion. The balance of the flotation concentrate is filtered and shipped to a smelter for further processing.
Hedging Activities
Our strategy is to provide shareholders with exposure to gold and silver prices by selling our gold and silver ounces at spot market prices and consequently, we do not hedge our gold or silver sales. We may, however, from time to time, manage certain risks associated with fluctuations in foreign currencies using the derivatives market.
Gold and Silver Reserves
We have established gold and silver reserves at three of our properties, including San Jose, Black Fox and Gold Bar. The portion of Proven and Probable gold and silver Reserves attributable to us for San Jose and Gold Bar as of December 31, 2017, is presented in Item 2. Properties.
Competitive Business Conditions
We compete with many companies in the mining and mineral exploration and production industry, including large, established mining companies with substantial capabilities, personnel, and financial resources. There is a limited supply of desirable mineral lands available for claim‑staking, lease, or acquisition in Mexico, Argentina, Canada, or the United States, and other areas where we may conduct our mining or exploration activities. We may be at a competitive disadvantage in acquiring mineral properties, since we compete with these individuals and companies, many of which have greater financial resources and larger technical staffs than we do. From time to time, specific properties or areas which would otherwise be attractive to us for exploration or acquisition may be unavailable due to their previous acquisition by other companies or our lack of financial resources.
5
Competition in the industry is not limited to the acquisition of mineral properties, but also extends to the technical expertise to find, advance, and operate such properties; the labor to operate the properties; and the capital for the purpose of funding such exploration and development. Many competitors not only explore for and mine precious and base metals, but conduct refining and marketing operations on a world‑wide basis. Such competition may result in not only our company being unable to acquire desired properties, but to recruit or retain qualified employees or to acquire the capital necessary to fund our operation and advance our properties. Our inability to compete with other companies for these resources would have a material adverse effect on our results of operation, financial condition and cash flows.
General Government Regulations
In Mexico, Argentina, Canada and the United States, we are subject to various governmental laws and regulations, including environmental regulations. Other than operating licenses for our mining and processing facilities and concessions granted under contracts with the host government, there are no third party patents, licenses or franchises material to our business. The applicable laws and regulations applicable to us include:
|
· |
mineral concession rights; |
|
· |
surface rights; |
|
· |
water rights; |
|
· |
mining royalties; |
|
· |
environmental laws; and |
|
· |
mining permits. |
We believe that all of our properties are operated in compliance with all applicable governmental laws and regulations.
Customers
Production from the El Gallo 1 and Black Fox mines is sold as refined metal on the spot market or doré under the terms set out in a doré purchase agreement between us and the Bank of Nova Scotia (“Scotia”), a Canadian financial institution. Under the terms of that agreement, dated July 2012, we have the option to sell approximately 90% of the gold and silver contained in doré bars produced at the El Gallo 1 and Black Fox mines prior to the completion of refining by the third party refiner, which normally takes approximately 10 to 15 business days. During the year ended December 31, 2017, 98% and 98% of the sales made by El Gallo 1 mine and Black Fox mine were to Scotia, respectively, with no sales made through the doré purchase agreement. We also have an agreement to sell refined metal to a second Canadian financial institution.
During the year ended December 31, 2017, 74% of total sales from the San José mine were made to Republic Metals Corporation, Argo-Heraeus and LS Nikko Copper Inc. Republic Metals, a Florida corporation, is a purchaser of doré and accounted for 39% of that amount. Argo-Heraeus, a Swiss company, is a purchaser of doré, which accounted for 29% of such amount. LS Nikko Copper Inc., a South Korean company, is a purchaser of concentrate, which accounted for 32% of that amount. MSC has sales agreements with each of these purchasers.
In the event that our relationship with Scotia or MSC’s relationship with Republic Metals, Argo-Heraeus or LS Nikko Copper Inc. were interrupted for any reason, we believe that we or MSC could locate other purchasers for our products. However, any interruption would temporarily disrupt the sale of our products and could adversely affect our operating results.
Employees
As of December 31, 2017, we had 535 employees including 245 employees based in Mexico, 6 in Argentina, 20 in the United States, 24 in Toronto, Ontario, Canada, and 240 in Timmins, Ontario, Canada. All our employees based in Toronto work in an executive, technical or administrative position, while our employees in Mexico, Argentina, the United States, and Timmins include laborers, craftsmen, mining, geology and permitting specialists, information technologists, and various other support roles.
6
Some of our employees in Mexico are covered by union labor contracts and we believe we have good relations with our employees and their unions. We also frequently engage independent contractors in connection with certain administrative matters and the exploration of our properties, such as drillers, geophysicists, geologists, and other specialty technical disciplines. As of December 31, 2017, MSC had 1,156 employees in Argentina.
This report, including Management’s Discussion and Analysis of Financial Condition and Results of Operations, contains forward‑looking statements that may be affected by several risk factors. The following information summarizes all material risks known to us as of the date of filing this report:
Risks Relating to Our Company
Our results of operations, cash flows and the value of our properties are highly dependent on the market prices of gold, silver, and copper and these prices can be volatile.
The profitability of our gold and silver mining operations and the value of our mining properties, are directly related to the market price of gold, silver and copper. The price of gold, silver and copper may also have a significant influence on the market price of our common stock. Historically, the market price of gold and silver has fluctuated significantly and is affected by numerous factors beyond our control. These factors include supply and demand fundamentals, global or national political or economic conditions, expectations with respect to the rate of inflation, the relative strength of the U.S. dollar and other currencies, interest rates, gold and silver sales and loans by central banks, forward sales by metal producers, accumulation and divestiture by exchange traded funds, and a number of other factors such as industrial and commercial demand.
We derive all of our revenue from the sale of gold and silver and our results of operations will fluctuate as the prices of these metals change. A period of significant and sustained lower gold and silver prices would materially and adversely affect our results of operations and cash flows. The volatility of mineral prices represents a substantial risk which no amount of planning or technical expertise can fully eliminate. In the event mineral prices decline or remain low for prolonged periods of time, we might be unable to develop our properties, which may adversely affect our results of operations, financial performance and cash flows. An asset impairment charge may result from the occurrence of unexpected adverse events that impact our estimates of expected cash flows generated from our producing properties or the market value of our non-producing properties, including a material diminution in the price of gold and/or silver.
Our results of operations have been and could continue to be materially and adversely affected by the impairment of assets.
During 2017, the price of gold, as measured by the London PM fix, fluctuated between $1,151 and $1,346 per ounce. while the price of silver fluctuated between $15.22 and $18.56 per ounce. As at February 16, 2018, gold, silver and copper prices were $1,352 per ounce, $16.84 per ounce, and $3.27 per pound, respectively.
Our Estimates of proven and probable reserves and mineralized material are based on interpretation and assumptions and may yield less mineral production under actual conditions than is currently estimated.
Unless otherwise indicated, proven and probable reserves and mineralization figures presented in our filings with securities regulatory authorities, including the SEC, news releases and other public statements that may be made from time to time, are based upon estimates made by both independent and our own internal geologists. Estimates of proven and probable reserves and mineralized material are subject to considerable uncertainty and are based, to a large extent, on the prices of gold and silver and interpretations of geologic data obtained from drill holes and other exploration techniques. These prices and interpretations are subject to change. If we determine that certain of our estimated reserves or mineralized material have become uneconomic, we may be forced to reduce our estimates. Actual production may be significantly less than we expect.
When making determinations about whether to advance any of our projects to development, we rely upon such estimated calculations as to the mineralized material and grades of mineralization on our properties. Until ore is mined and processed, mineralized material and grades of mineralization must be considered as estimates only. We cannot ensure that:
|
· |
these estimates will be accurate; or |
|
· |
this mineralization can be mined or processed profitably. |
7
Any material changes in mineral estimates and grades of mineralization may affect the economic viability of placing a property into production and such property’s return on capital. There can be no assurance that minerals recovered in small scale tests will be recovered in large‑scale tests under on‑site conditions or in production scale. Extended declines in market prices for gold and/or silver may render portions of our mineralization estimates uneconomic and result in reduced reported mineralization or adversely affect the commercial viability of one or more of our properties. Any material reductions in estimates of mineralization, or of our ability to extract this mineralization, could have a material adverse effect on our results of operations or financial condition.
Investors should also be aware that calculations of “Reserves” differ under SEC reporting standards and those under other international standards, such as Canada. Investors should also be aware that mineralized material may never be converted into reserves. See, CAUTIONARY NOTE TO UNITED STATES INVESTORS-INFORMATION CONCERNING PREPARATION OF RESOURCE AND RESERVE ESTIMATES
We may be unable to replace gold and silver reserves as they become depleted.
Like all metal producers, we must continually replace reserves depleted by production to maintain production levels over the long term and provide a return on invested capital. Depleted reserves can be replaced in several ways, including expanding known ore bodies, by locating new deposits or acquiring interests in reserves from third parties. Exploration is highly speculative in nature, involves many risks and uncertainties and is frequently unsuccessful in discovering significant mineralization. Accordingly, our current or future exploration programs may not result in new mineral producing operations. Even if significant mineralization is discovered, it will likely take many years from the initial phases of exploration until commencement of production, during which time the economic feasibility of production may change.
From time to time, we may acquire ore reserves from other parties, as we did in 2017. Such acquisitions are based on an analysis of a variety of factors including historical operating results, estimates of and assumptions regarding the extent of ore reserves, the timing of production from such reserves and cash and other operating costs. In addition, we may rely on data and reports prepared by third parties (including the ability to permit and comply with existing regulations) and which may contain information or data that we are unable to independently verify or confirm in advance. Other than historical operating results, all of these factors are uncertain and may have an impact on our revenue, our cash flow and other operating issues, as well as contributing to the uncertainties related to the process used to estimate ore reserves.
As a result of these uncertainties, our exploration programs and acquisitions may not result in the expansion or replacement of our current production with new ore reserves or operations, which could have a material adverse effect on our business, prospects, results of operations and financial position.
The Black Fox and Lexam acquisitions may not achieve their intended results and may result in us assuming unanticipated liabilities.
The Black Fox and Lexam acquisitions completed in 2017 subject us to many risks. We may discover title defects or adverse environmental or other conditions relating to the properties acquired in the transactions of which we are currently unaware. Environmental, title, and other problems could reduce the value of the properties to us, and, depending on the circumstances, we could have limited or no recourse to the sellers with respect to those problems. We have assumed substantially all of the liabilities associated with the acquired properties and would be entitled to indemnification in connection with those liabilities in only limited circumstances, for limited periods and in limited amounts. Potential remedies may not be adequate to cover any liabilities we incur, and such liabilities could be significant. Also, it is uncertain whether our existing operations and the acquired properties and operations can be integrated in an efficient and effective manner. In addition, the success of the Black Fox acquisition depends on, among other things, the accuracy of our assessment of the reserves associated with the acquired properties and operating costs, among other factors. These assessments were based to a significant degree on information provided by the sellers and we cannot guarantee their accuracy. Although the acquired properties are subject to many of the risks and uncertainties to which acquisitions we pursue are subject generally, risks associated with the Black Fox acquisition, in particular, include those associated with our ability to operate efficiently in a new area and the significant size of the transactions in the aggregate.
8
Our business requires substantial capital investment and we may be unable to raise additional funding on favorable terms to develop additional mining operations.
We will need to obtain additional capital, either in the form of debt or equity financing, to fund construction of the Gold Bar project and to continue our development and exploration activities on other projects. Our working capital balance at December 31, 2017, along with expected cash generated from mining operations at El Gallo 1 and Black Fox mines and any dividends received from MSC, is not expected to be sufficient to allow us to fund the construction of Gold Bar or to continue our operations indefinitely. Should we also decide to develop the Los Azules project, we will require significant capital beyond our existing resources. Our ability to obtain necessary funding, in turn, depends upon a number of factors, including the state of the economy and applicable commodity prices. We may not be successful in obtaining the required financing for Gold Bar or other purposes, on terms that are favorable to us or at all, in which case, our ability to replace reserves and continue operating would be adversely affected. Failure to obtain such additional financing could result in delay or indefinite postponement of further exploration or potential development and the possible partial or total loss of our interest in certain properties.
If we do not hedge our exposure to reductions in gold and silver prices, we may be subject to significant reductions in price.
We do not use hedging transactions with respect to any of our gold and silver production and we do not expect to do so in the future. Accordingly, we may be exposed to more significant price fluctuations if gold and/or silver prices decline. While the use of hedging transactions limits the downside risk of price declines, their use also may limit future revenues from price increases. Hedging transactions also involve the risk that the counterparty may be unable to satisfy its obligations.
We own our 49% interest in the San José mine, under the terms of an option and joint venture agreement (“OJVA”), and therefore we are unable to control all aspects of the exploration and development of, and, production from this property.
Our interest in the San José mine is subject to the risks normally associated with the conduct of joint ventures. A disagreement between joint venture partners on how to conduct business efficiently, the inability of joint venture partners to meet their obligations to the joint venture or third parties, or litigation arising between joint venture partners regarding joint venture matters could have a material adverse effect on the viability of our interests held through the joint venture.
We conduct operations in a number of foreign countries and are exposed to legal, political and social risks associated with those operations.
All of our revenue in 2017 was generated by operations outside the United States. Exploration, development, production and closure activities in many countries are potentially subject to heightened political and social risks that are beyond our control and could result in increased costs, capacity constraints and potential disruptions to our business. These risks include the possible unilateral cancellation or forced renegotiation of contracts in which we may, directly or indirectly, have an interest, unfavorable changes in foreign laws and regulations, royalty and tax increases (including taxes associated with the import or export of goods), risks associated with consumption taxes in Mexico (VAT) and Canada (HST), income tax refund recovery and collection processes, changes in US legislation as applicable to foreign operations, claims by governmental entities or indigenous communities, expropriation or nationalization of property and other risks arising out of foreign sovereignty over areas in which our operations are conducted. The right to import and export gold and silver may depend on obtaining certain licenses and quotas, which could be delayed or denied at the discretion of the relevant regulatory authorities, or could become subject to new taxes or duties imposed by U.S. or foreign jurisdictions, which could have a material adverse effect on our business, financial condition, or future prospects. In addition, our rights under local law may be less secure in countries where judicial systems are susceptible to manipulation and intimidation by government agencies, non-governmental organizations or civic groups.
The Tax Cuts and Jobs Act was enacted on December 22, 2017. The Act reduces the US federal corporate tax rate from 35% to 21%, requires companies to pay a one-time transition tax on earnings of certain foreign subsidiaries that were previously tax deferred and creates new taxes on certain foreign sourced earnings. See Note 9 Income and mining tax to the Consolidated Financial Statements for additional details.
9
Any of these developments could require us to curtail or terminate operations at our mines, incur significant costs to renegotiate contracts, meet newly-imposed environmental or other standards, pay greater royalties or higher prices for labor or services and recognize higher taxes, or experience significant delays or obstacles in the recovery of VAT/HST or income tax refunds owed, which could materially and adversely affect financial condition, results of operations and cash flows.
Our ongoing and future success depends on developing and maintaining productive relationships with the communities, including indigenous peoples, and other stakeholders in our operating locations. Notwithstanding our ongoing efforts, local communities and stakeholders can become dissatisfied with our activities or the level of benefits provided, which may result in civil unrest, protests, direct action or campaigns against us. Any such occurrences could materially and adversely affect our financial condition, results of operations and cash flows.
Our operations in Argentina and Mexico are subject to political and social risks.
With respect to our San José mine, there are risks relating to an uncertain or unpredictable political and economic environment in Argentina. For instance, Argentina defaulted on foreign debt repayments and on the repayment on a number of official loans to multinational organizations in 2002 and 2003, and defaulted again on its bonds in 2014 after failing to reach an agreement with certain of its bondholders. In 2008, the Argentine government also reassessed its policy and practice in respect of export duties and began levying export duties on mining companies operating in the country. In 2012, Argentina’s President announced the nationalization of the majority stake of Yacimientos Petrolíferos Fiscales (YPF), Argentina’s largest oil company. In 2013, Argentina’s federal Income Tax Statute was amended to include a 10% income tax withholding on dividend distributions by Argentine corporations, and the capital gains exception for non‑resident taxpayers was repealed. In 2015, Argentina’s federal government removed export taxes for dore and concentrate products while the local authorities in the province of Santa Cruz substituted a provincial reserve tax with a lower provincial Corporate Social Responsibility (“CSR”) payment. In December 2017, Argentina enacted comprehensive tax reform (Law No. 27,430 (the Law)), through publication in the Official Gazette. The Law is generally effective 1 January 2018. Specifically, the Law introduces amendments to corporate income tax, personal income tax, value added tax (VAT), tax procedural law, criminal tax law, social security contributions, excise tax, tax on fuels, and tax on the transfer of real estate. It also establishes a special regime comprising an optional revaluation of assets for income tax purposes. The law gradually reduces the corporate tax rate to 25 % from 35 % by 2020. It also proposes to tax profits from financial investment for the first time, introducing a levy of 15 % for foreign currency-denominated and inflation-linked instruments and 5 percent for peso-denominated debt.
With respect to our El Gallo 1 mine in Mexico, there has been a consistent level of violence and crime relating to drug cartels and gangs in Sinaloa State where we operate, and in other regions of Mexico. Our facility at El Gallo was robbed in 2015. On January 10, 2018 the US State Department issued a Level 4 (“do not travel”) warning with respect to five Mexican states, including Sinaloa State due to violence related to the drug cartels. These events may disrupt our ability to carry out exploration and mining activities and affect the safety and security of our employees and contractors.
In Mexico, in October 2013, the Mexican lower house passed a bill proposing a tax‑deductible mining royalty of 7.5% on earnings before the deduction of interest, taxes, depreciation and amortization, along with an additional 0.5% on precious metals revenue for precious metals mining companies. The Mexican Senate approved the provisions of the Tax Reform on October 31, 2013. The effective date of the law was January 1, 2014. On February 11, 2014, we filed an Amparo with the Supreme Court to appeal the constitutionality of the Tax Reform. On November 15, 2017, the Supreme Court ruled against us and remanded the case to the lower court. Our obligation to pay the tax is presently stayed pending a final ruling from the court. A ruling against us would result in an additional expense and may result in additional expenses in the future. As of December 31, 2017, we have not generated taxable income subject to the 7.5% mining royalty, and have accrued $1.2 million for the 0.5% precious metals royalty.
Reform of the General Mining Law in the United States could adversely affect our results of operations.
Periodically, members of the U.S. Congress have introduced bills which would supplant or alter the provisions of the General Mining Law of 1872, which governs the unpatented claims that we control with respect to our U.S. properties. One such amendment has become law and has imposed a moratorium on the patenting of mining claims, which reduced the security of title provided by unpatented claims such as those on our U.S. properties. If additional legislation is enacted, it could substantially increase the cost of holding unpatented mining claims by requiring payment of royalties, and could significantly impair our ability to develop mineral estimates on unpatented mining claims. Such bills have proposed,
10
among other things, to make permanent the patent moratorium, to impose a federal royalty on production from unpatented mining claims and to declare certain lands as unsuitable for mining. Although it is impossible to predict at this time what royalties may be imposed in the future, the imposition of such royalties could adversely affect the potential for development of such mining claims, and the economics of existing operating mines on federal unpatented mining claims. Passage of such legislation could adversely affect our business.
Our business is subject to the U.S. Foreign Corrupt Practices Act and similar worldwide anti‑bribery laws, a breach or violation of which could lead to civil and criminal fines and penalties, loss of licenses or permits and reputational harm.
We operate in certain jurisdictions that have experienced governmental and private sector corruption to some degree. The U.S. Foreign Corrupt Practices Act and anti-bribery laws in other jurisdictions generally prohibit companies and their intermediaries from making improper payments for the purpose of obtaining or retaining business or other commercial advantage. Violations of these laws, or allegations of such violations, could lead to civil and criminal fines and penalties, litigation, and loss of operating licenses or permits, and may damage our reputation, which could have a material adverse effect on our business, financial position and results of operations. There can be no assurance that our internal control policies and procedures always will protect us from recklessness, fraudulent behavior, dishonesty or other inappropriate acts committed by our affiliates, employees or agents. As such, our corporate policies and processes may not prevent all potential breaches of law or other governance practices.
We are subject to foreign currency risk.
While we transact most of our business in U.S. dollars, expenses, such as labor, operating supplies, and property and equipment, are denominated in Canadian dollars, Mexican pesos or Argentine pesos. As a result, currency exchange fluctuations may impact our operating costs. The appreciation of non‑U.S. dollar currencies against the U.S. dollar increases costs and the cost of purchasing property and equipment in U.S. dollar terms in Mexico, Argentina and Canada, which can adversely impact our operating results and cash flows. Conversely, a depreciation of non‑U.S. dollar currencies usually decreases operating costs and property and equipment purchases in U.S. dollar terms in foreign countries.
The value of cash and cash equivalents denominated in foreign currencies also fluctuates with changes in currency exchange rates. Appreciation of non‑U.S. dollar currencies results in a foreign currency gain on such investments and a depreciation in non‑U.S. dollar currencies results in a loss. We have not utilized market risk sensitive instruments to manage our exposure to foreign currency exchange rates but may in the future actively manage our exposure to foreign currency exchange rate risk. We also hold portions of our cash reserves in Canadian, Mexican and Argentine currency.
Development at Los Azules presents development challenges that may negatively affect, if not completely negate, the feasibility of development of the property.
The Los Azules property is located in a remote location that is accessed by 75 miles (120 kilometers) of unimproved dirt road with eight river crossings and two mountain passes above 13,451 feet (4,100 meters). Even assuming that technical difficulties associated with this remote location can be overcome, the significant capital costs required to develop the project may make the project uneconomical. If the long term price of copper were to remain low or decrease significantly below the current price or capital cost estimates increase significantly, Los Azules may not be feasible for development, and we may have to write‑off the remaining carrying value of the asset. Furthermore, the project’s economic feasibility has not yet been demonstrated through a full feasibility study. The PEA is preliminary in nature, includes NI 43‑101 mineral resources that are considered too speculative geologically to have economic considerations applied to them that would allow them to be categorized as mineral reserves either under Industry Guide 7 or NI 43‑101, and there is no certainty that the PEA will be realized.
We may acquire additional exploration stage properties and we may face negative reactions if reserves are not located on acquired properties.
We have in the past and may in the future acquire additional exploration stage properties. There can be no assurance that we have or will be able to complete the acquisition of such properties at reasonable prices or on favorable terms and that reserves will be identified on any properties that we acquire. We may also experience negative reactions from the financial markets if we are unable to successfully complete acquisitions of additional properties or if reserves are not located on acquired properties. These factors may adversely affect the trading price of our common stock or our financial condition or results of operations.
11
The nature of mineral exploration and production activities involves a high degree of risk and the possibility of uninsured losses that could materially and adversely affect our operations.
Exploration for and production of minerals is highly speculative and involves greater risk than many other businesses. Many exploration programs do not result in the discovery of mineralization, and any mineralization discovered may not be of sufficient quantity or quality to be profitably mined. Few properties that are explored are ultimately advanced to production. Our current exploration efforts are, and future development and mining operations we conduct will be, subject to all of the operating hazards and risks normally incident to exploring for and developing mineral properties, such as, but not limited to:
|
· |
economically insufficient mineralized material; |
|
· |
fluctuations in production costs that may make mining uneconomical; |
|
· |
availability of labor, contractors, engineers, power, transportation and infrastructure; |
|
· |
labor disputes; |
|
· |
potential delays related to social, public health, and community issues; |
|
· |
negotiations with aboriginal groups or local populations affecting our efforts to explore, develop or produce gold and silver deposits; |
|
· |
unanticipated variations in grade and other geologic problems; |
|
· |
environmental hazards; |
|
· |
water conditions; |
|
· |
difficult surface or underground conditions; |
|
· |
metallurgical and other processing problems; |
|
· |
mechanical and equipment performance problems; |
|
· |
industrial accidents, personal injury, fire, flooding, cave‑ins, landslides and other natural disasters; and |
|
· |
decrease in reserves or mineralized material due to a lower silver, gold or copper price. |
Any of these risks can materially and adversely affect, among other things, the development of properties, production quantities and rates, costs and expenditures, potential revenues and production dates. We currently have no insurance to guard against any of these risks, except in very limited circumstances. If we determine that capitalized costs associated with any of our mineral interests are not likely to be recovered, we would incur a write‑down of our investment in these interests. All of these factors may result in losses in relation to amounts spent which are not recoverable.
We do not insure against all risks to which we may be subject in our operations.
While we currently maintain insurance policies to insure against general commercial liability claims and physical assets at our properties in Argentina, Canada, Mexico, and the United States, we do not maintain insurance to cover all of the potential risks associated with our operations. Our other exploration projects have no existing infrastructure for which we insure. We may also be unable to obtain insurance to cover other risks at economically feasible premiums or at all. Insurance coverage may not continue to be available, or may not be adequate to cover liabilities. We might also become subject to liability for environmental, pollution or other hazards associated with mineral exploration and production which may not be insured against, which may exceed the limits of our insurance coverage or which we may elect not to insure against because of premium costs or other reasons. Losses from these events may cause us to incur significant costs that
12
could materially adversely affect our financial condition and our ability to fund activities on our property. A significant loss could force us to reduce or terminate our operations.
Our operations are subject to permitting requirements which could require us to delay, suspend or terminate our operations on our mining properties.
Our mining operations, including ongoing exploration drilling programs, require permits from various state and federal governments, including permits for the use of water and for drilling wells for water. We may be unable to obtain these permits in a timely manner, on reasonable terms or on terms that provide us sufficient resources to develop our properties, or at all. Even if we are able to obtain such permits, the time required by the permitting process can be significant. If we cannot obtain or maintain the necessary permits, or if there is a delay in receiving these permits, our timetable and business plan for exploration of our properties will be adversely affected, which may in turn adversely affect our results of operations, financial condition, cash flows and market price of our securities.
Due to an increased level of non‑governmental organization and aboriginal and local group activity targeting the mining industry, the potential for the government or process instituted by non-governmental organizations, aboriginal and local, to delay the issuance of permits or impose new requirements or conditions upon mining operations may be increased. Any changes in government policies may be costly to comply with and may delay mining operations. Future changes in such laws and regulations, if any, may adversely affect our operations, make our operations prohibitively expensive, or prohibit them altogether. If our interests are materially adversely affected as a result of a violation of applicable laws, regulations, or permitting requirements or a change in applicable law or regulations, it would have a significant negative impact on the value of our company and could have a significant impact on our stock price.
Title to mineral properties can be uncertain, and we are at risk of loss of ownership of one or more of our properties.
Our ability to explore and operate our properties depends on the validity of our title to that property. Our U.S. mineral properties include leases of unpatented mining claims, as well as unpatented mining and mill site claims, which we control directly. Unpatented mining claims provide only possessory title and their validity is often subject to contest by third parties or the federal government, which makes the validity of unpatented mining claims uncertain and generally riskier. Similarly, Canadian mineral properties consist of patented and unpatented claims which each have their respective risks and uncertainties. Further, there may be title defects or additional rights which are not recorded on the title. Our concessions in Mexico are subject to continuing government regulation and failure to adhere to such regulations will result in termination of the concession. Similarly, under Argentine Law, failure to comply with applicable conditions may result in the termination of the concession. Uncertainties inherent in mineral properties relate to such things as the sufficiency of mineral discovery, proper posting and marking of boundaries, assessment work and possible conflicts with other claims not determinable from public record. We have not obtained title opinions covering our entire property, with the attendant risk that title to some claims, particularly title to undeveloped property, may be defective. There may be valid challenges to the title to our property which, if successful, could impair development and/or operations.
We cannot ensure that we will have an adequate supply of water to complete desired exploration or development of our mining properties.
Our mining operations require significant quantities of water for mining, ore processing and related support facilities. Our operations in Argentina, Mexico, Canada and the United States are in areas where water is scarce and competition among users for continuing access to water is significant. Continuous production at our mines is dependent on our ability to maintain our water rights and claims and to defeat claims adverse to our current water uses in legal proceedings. Although each of our operations currently has sufficient water rights and claims to cover its operational demands, we cannot predict the potential outcome of pending or future legal proceedings relating to our water rights, claims and uses. Water shortages may also result from weather or environmental and climate impacts out of the Company’s control.
Our continuing reclamation obligations at Tonkin, Gold Bar, Black Fox, El Gallo, and other properties could require significant additional expenditures.
We are responsible for the reclamation obligations related to disturbances located on all our properties. On February 10, 2014, we submitted to the BLM an amendment to the original Plan of operations for the Tonkin Complex that incorporated the final plan for permanent closure, which was approved by the BLM on September 21, 2015, including our $3.6 million estimate of anticipated reclamation requirements, for which a financial guarantee has been put in place. In order for the
13
Company to commence construction at its Gold Bar project, a reclamation bond of $15.0 million was approved by the BLM on August 25, 2017, reflecting an estimate of the anticipated reclamation requirements, for which a financial guarantee has been put in place. As at December 31, 2017 the extent of the disturbances at Gold Bar were limited to early site preparation work. An initial reclamation obligation of $0.1 million was recorded to reflect this work.
Pursuant to the Black Fox acquisition, which closed in October 2017, the Company filed three updated closure plans with the Ministry of Northern Development and Mines (“MNDM”). The three updated closure plans included the Black Fox Mine, the Stock Mill, and the Grey Fox Advanced Exploration Project, which have closure costs of C$15.1 million, C$5.2 million, and C$0.4 million, respectively. The updated closure plans were filed on September 21, 2017, and accepted by the MNDM on September 27, 2017. These financial assurances were satisfied by the Company through financial guarantees.
Regarding the El Gallo 1 mine and El Gallo 2 project, we have not posted a bond in Mexico as none is required by the current legislation; however, we have recorded a liability based on the estimated amount of our reclamation obligations.
There is a risk that any surety bond or recorded liability, even if increased based on the analysis and work performed to update the reclamation obligations, could be inadequate to cover the actual costs of reclamation when carried out. The satisfaction of bonding requirements and continuing reclamation obligations will require a significant amount of capital. Further, it is possible that the BLM may request that the Company provides additional long-term financing supported by a long-term trust for an amount that cannot be determined at this point. There is a risk that we will be unable to fund any additional bonding requirements or that the surety bonds may no longer be accepted by the governmental agencies as satisfactory reclamation coverage, in which case we would be required to replace the surety bonding with cash, and further, that the regulatory authorities may increase reclamation and bonding requirements to such a degree that it would not be commercially reasonable to continue exploration activities, which may adversely affect our results of operations, financial performance and cash flows.
Our ongoing operations and past mining activities are subject to environmental risks, which could expose us to significant liability and delay, suspension or termination of our operations.
All aspects of our operations are subject to Argentine, Mexican, Canadian and American federal, state and local environmental regulation. These regulations mandate, among other things, the maintenance of air and water quality standards and land reclamation. They also set forth limitations on the generation, transportation, storage and disposal of solid and hazardous waste, including cyanide. Environmental legislation is evolving in a manner which will require stricter standards and enforcement, increased fines and penalties for non‑compliance, more stringent environmental assessments of proposed projects, and a heightened degree of responsibility for us and our officers, directors and employees. Future changes in environmental regulation, if any, may adversely affect our operations, make our operations prohibitively expensive, or prohibit them altogether. Environmental hazards may exist on our properties that are unknown to us at the present and that have been caused by us, or previous owners or operators, or that may have occurred naturally. We utilize explosives in our business, which could cause injury to our personnel, and damage to our equipment or assets. Mining properties from the companies we have acquired may cause us to be liable for remediating any damage that those companies may have caused. The liability could include response costs for removing or remediating the release and damage to natural resources, including ground water, as well as the payment of fines and penalties. Failure to comply with applicable environmental laws, regulations and permitting requirements may also result in enforcement actions thereunder, including orders issued by regulatory or judicial authorities, causing operations to cease or be curtailed, and may include corrective measures requiring capital expenditures, installation of additional equipment, or remedial actions.
Our industry is highly competitive, attractive mineral lands are scarce, and we may not be able to obtain quality properties.
We compete with many companies in the mining industry, including large, established mining companies with substantial capabilities, personnel and financial resources. There is a limited supply of desirable mineral lands available for claim staking, lease or acquisition in Argentina, Mexico, Canada and the United States, and other areas where we may conduct exploration activities. We may be at a competitive disadvantage in acquiring mineral properties, since we compete with these individuals and companies, many of which have greater financial resources and larger technical staffs than we do. From time to time, specific properties or areas which would otherwise be attractive to us for exploration or acquisition may be unavailable to us due to their previous acquisition by other companies or our lack of financial resources. Competition in the industry is not limited to the acquisition of mineral properties but also extends to the technical expertise
14
to find, advance, and operate such properties; the labor to operate the properties; and the capital for the purpose of funding such properties. Many competitors not only explore for and mine precious metals, but conduct refining and marketing operations on a world‑wide basis. Such competition may result in our Company being unable not only to acquire desired properties, but to recruit or retain qualified employees or to acquire the capital necessary to fund our operation and advance our properties. Our inability to compete with other companies for these resources would have a material adverse effect on our results of operation, financial condition and cash flows.
We rely on contractors to conduct a significant portion of our operations and construction projects.
A significant portion of our operations and construction projects are currently conducted in whole or in part by contractors, including specifically our operations at the El Gallo 1 and Black Fox mines and the construction at the Gold Bar Project. As a result, our operations are subject to a number of risks, some of which are outside our control, including:
|
· |
Negotiating agreements with contractors on acceptable terms; |
|
· |
The inability to replace a contractor and its operating equipment in the event that either party terminates the agreement; |
|
· |
Reduced control and oversight over those aspects of operations which are the responsibility of the contractor; |
|
· |
Failure of a contractor to perform under its agreement; |
|
· |
Interruption of operations or increased costs in the event that a contractor ceases its business due to insolvency or other unforeseen events; |
|
· |
Failure of a contractor to comply with applicable legal and regulatory requirements, to the extent it is responsible for such compliance; and |
|
· |
Problems of a contractor with managing its workforce, labor unrest or other related employment issues. |
In addition, we may incur liability to third parties as a result of the actions of our contractors. The occurrence of one or more of these risks could adversely affect our results of operations and financial position.
If our employees or contractors engage in a strike, work stoppage or other slowdown, we could experience business disruptions or increased costs.
As of December 31, 2017, a number of our employees were represented by different trade unions and work councils which subject us to employment arrangements very similar to collective bargaining agreements. Further, most of our employees are based in foreign locations. The laws of certain foreign countries may place restrictions on our ability to take certain employee-related actions or require that we conduct additional negotiations with trade unions, works councils or other governmental authorities before we can take such actions.
If the employees or contractors at the San José, El Gallo 1 or Black Fox mines were to engage in a strike, work stoppage, or other slowdown in the future, we could experience a significant disruption of our operations. Such disruption could interfere with our business operations and could lead to decreased productivity, increased labor costs, and lost revenue.
We may not be successful in negotiating new collective bargaining agreements or other employment arrangements when the current ones expire. Furthermore, future labor negotiations could result in significant increases in our labor costs. The occurrence of any of the foregoing could have a material adverse effect on our business, financial condition, and results of operations.
Our business could be negatively impacted by security threats, including cybersecurity threats, and other disruptions.
We face various security threats, including attempts by third parties to gain unauthorized access to sensitive information or to render data or systems unusable; threats to the safety of our employees; threats to the security of our infrastructure; and threats from terrorist acts. There can be no assurance that the procedures and controls we use to monitor these threats and mitigate our exposure to them will be sufficient in preventing them from materializing. If any of these events were to
15
materialize, they could lead to losses of sensitive information, critical infrastructure, personnel or capabilities essential to our operations and could have a material adverse effect on our reputation, financial condition, results of operations, or cash flows.
Our technologies, systems and networks, and those of our business partners, may become the target of cyber-attacks or information security breaches that could result in the unauthorized release, gathering, monitoring, misuse, loss or destruction of proprietary and other information, theft of property or other disruption of our business operations. In addition, certain cyber incidents, such as surveillance, may remain undetected for an extended period. A cyber incident involving our information systems and related infrastructure, or that of our business partners, could disrupt our business plans and negatively impact our operations. Although to date we have not experienced any significant cyber-attacks, there can be no assurance that we will not be the target of such attacks in the future. As cyber threats continue to evolve, we may be required to expend significant additional resources to continue to modify or enhance our protective measures or to investigate and remediate any security vulnerabilities.
The laws of the State of Colorado, our Articles of Incorporation and agreements with certain officers and directors may protect our directors from certain types of lawsuits.
The laws of the State of Colorado provide that our directors will not be liable to us or our shareholders for monetary damages for all but certain types of conduct as directors of the Company. Our Articles of Incorporation permit us to indemnify our directors and officers against all damages incurred in connection with our business to the fullest extent provided or allowed by law, including through stand‑alone indemnity agreements. We have also entered into indemnification agreements with our executive officers and directors which require that we indemnify them against certain liabilities incurred by them in their capacity as such. The exculpation provisions may have the effect of preventing shareholders from recovering damages against our directors caused by their negligence, poor judgment or other circumstances. The indemnification provisions may require us to use our limited assets to defend our directors and officers against claims, including claims arising out of their negligence, poor judgment, or other circumstances.
Risks Relating to Our Common Stock
A small number of existing shareholders own a significant portion of McEwen Mining common stock, which could limit your ability to influence the outcome of any shareholder vote.
As of February 21, 2018, Mr. McEwen beneficially owned approximately 23% of our outstanding shares, or 79.2 million of the 337.1 million shares of McEwen Mining common stock. Van Eck Associates Corporation beneficially owns 10.1% of our outstanding common stock. Under our Articles of Incorporation and the laws of the State of Colorado, the vote of the holders of a majority of the shares voting at a meeting at which a quorum is present is generally required to approve most shareholder action. As a result, Mr. McEwen and/or the other beneficial owner will be able to significantly influence the outcome of shareholder votes for the foreseeable future, including votes concerning the election of directors, amendments to our Articles of Incorporation or proposed mergers, acquisitions or other significant corporate transactions.
Our stock price may be volatile, and as a result you could lose all or part of your investment.
In addition to other risk factors identified herein and to volatility associated with equity securities in general, the value of your investment could decline due to the impact of any of the following factors upon the market price of our common stock:
|
· |
Changes in the worldwide price for gold, silver and/or copper; |
|
· |
Disappointing results from our exploration or production efforts; |
|
· |
Producing at rates lower than those targeted; |
|
· |
Political and regulatory risks; |
|
· |
Weather conditions, including both unusually heavy rains and unusually light rains or drought; |
|
· |
Failure to meet our revenue or profit goals or operating budget; |
16
|
· |
Decline in demand for our common stock; |
|
· |
Downward revisions in securities analysts’ estimates or changes in general market conditions; |
|
· |
Technological innovations by competitors or in competing technologies; |
|
· |
Investor perception of our industry or our prospects; |
|
· |
Actions by government central banks; and |
|
· |
General economic trends. |
Stock markets in general have in the past and may in the future experience extreme price and volume fluctuations. These fluctuations are often unrelated to operating performance and may adversely affect the market price of our common stock. Adverse price fluctuations may lead to threatened or actual delisting of our common stock from the NYSE. As a result, you may be unable to resell your shares at a desired price.
There is no guarantee that the Company will continue to declare returns of capital and/or other distributions.
On June 18, 2015, the Board of Directors declared an annual return of capital of $0.01 per share of common stock, payable semi-annually. The most recent return of capital installment of $0.005 was paid on February 14, 2018. Any determination to continue this return of capital on our common stock will be based primarily upon our financial condition, results of operations and capital requirements, including for capital expenditures and acquisitions, and our Board of Directors’ determination that the return of capital is in the best interest of our stockholders and in compliance with all laws and agreements applicable to the Company.
Gains recognized by non‑U.S. holders and non‑U.S. persons holding any interest in the Company other than solely as a creditor (including, for example, interests in the form of our convertible debt, if any) on the sale or other disposition of our securities may be subject to U.S. federal income tax.
We believe that we currently are a “United States real property holding corporation” under section 897(c) of the Internal Revenue Code (the “Code”), or USRPHC, and that there is a substantial likelihood that we will continue to be a USRPHC in the future. Subject to certain exceptions, securities (other than securities that provide no interest in a corporation other than solely as a creditor) issued by a corporation that has been a USRPHC at any time during the preceding five years (or the non‑U.S. holder’s holding period for such securities, if shorter) are treated as U.S. real property interests, or USRPIs, and a gain recognized by a non‑U.S. holder on the sale or other disposition of a USRPI is subject to regular U.S. federal income tax, on a net basis at graduated rates, as if such gain were effectively connected with the conduct by such holder of a U.S. trade or business. If a gain recognized by a non‑U.S. holder from the sale or other disposition of our common stock or other securities is subject to regular net basis income tax under these rules, the transferee of such common stock or other securities may be required to deduct and withhold a tax equal to 10% of the gross amount paid to the non‑U.S. holder with respect to the sale or other disposition, unless certain exceptions apply. Any tax withheld may be credited against the U.S. federal income tax owed by the non‑U.S. holder for the year in which the sale or other disposition occurs.
The future issuances of our common stock will dilute current shareholders and may reduce the market price of our common stock.
Under certain circumstances, our board of directors has the authority to authorize the offer and sale of additional securities without the vote of or notice to existing shareholders. We may issue equity in the future in connection with acquisitions, strategic transactions or for other purposes. Based on the need for additional capital to fund expected growth, it is likely that we will issue additional securities to provide such capital and that such additional issuances may involve a significant number of shares of our common stock. Issuance of additional securities in the future will dilute the percentage interest of existing shareholders and may reduce the market price of our common stock and any other outstanding securities. Furthermore, the sale of a significant amount of our common stock by any selling security holders, including Mr. McEwen, may depress the price of our common stock. As a result, you may lose all or a portion of your investment.
17
ITEM 1B. UNRESOLVED STAFF COMMENTS
None.
We classify our mineral properties into the reportable segments consistent with the manner in which they are grouped in Item 8. Financial Statements and Supplemental Data, Note 15 Operating Segment Reporting and subdivide them within each segment by their respective stage of development: “Production Properties”, “Advanced-Stage Properties” and “Exploration Properties”. Advanced-stage properties consist of properties for which advanced studies and reports have been completed indicating the presence of economically mineable mineralized material or in some cases, proven and probable reserves, and for which we have obtained or are in the process of obtaining the required permitting. Our designation of certain properties as “Production Properties” or “Advanced-stage Properties” should not suggest that we have proven or probable reserves at those properties as defined by the SEC Industry Guide 7.
Our significant production, advanced-stage and exploration properties are described below.
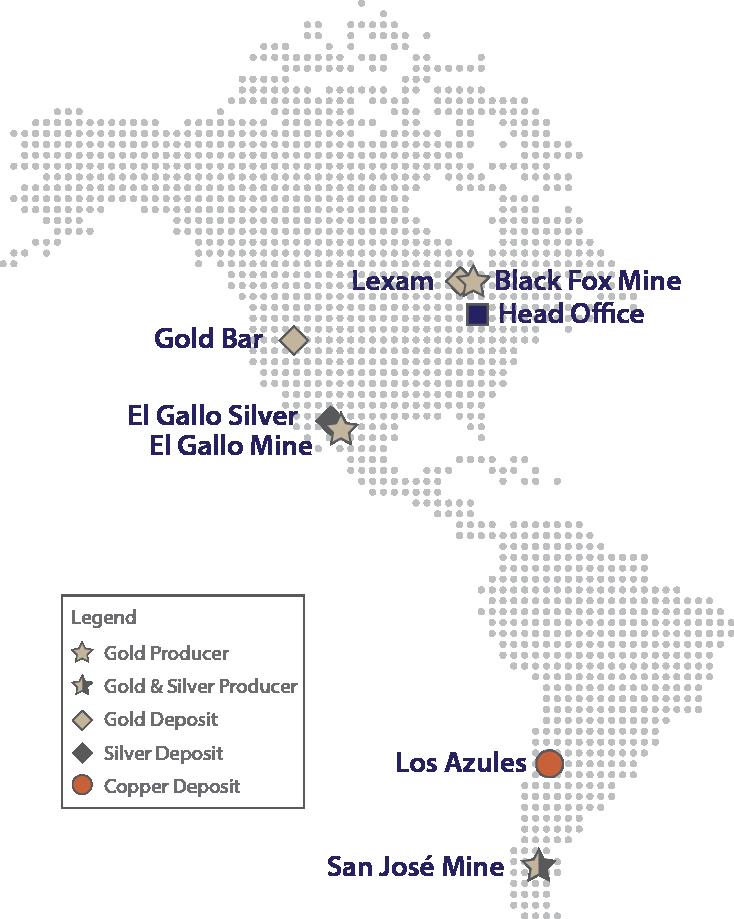
18
SEGMENT: MEXICO
The following map depicts the location of our major properties included in the Mexico Operations segment, which the El Gallo 1 mine and the El Gallo 2 project described in the sections below:

The following table summarizes the Company’s land position in Mexico as of December 31, 2017:
|
Mexico Mineral Property Interest |
|
Claims |
|
Square Miles |
|
Square Kilometers |
|
El Gallo 1 mine |
|
7 |
|
8 |
|
20 |
|
El Gallo 2 project |
|
5 |
|
144 |
|
372 |
|
Other Mexico properties |
|
38 |
|
528 |
|
1,369 |
|
Total Mexico Properties |
|
50 |
|
680 |
|
1,761 |
19
Production Properties
El Gallo 1 mine, Mexico (100% owned)
For detailed information on the El Gallo 1 mine production statistics and financial results, refer to Item 7. Management’s Discussion and Analysis of Financial Condition and Results of Operations.
Overview and History
We own 100% of the El Gallo 1 mine. The El Gallo 1 mine is the open‑pit gold mine and heap leach operation formerly known as the Magistral mine. Modern exploration activities at the Magistral site and surrounding properties started in early 1995 and were carried out by several companies. Commercial production was initiated in 2002 by Nevada Pacific Gold Ltd. and the mine produced approximately 70,000 ounces of gold from 2002 to 2005 before it was placed on care and maintenance for economic reasons. We acquired Nevada Pacific Gold in 2007, performed limited exploration activities, refurbished the infrastructure and completed the first gold pour in September 2012, with commercial production commencing on January 1, 2013. During the year ended December 31, 2017, the El Gallo 1 mine produced a total of 46,446 ounces of gold and 18,586 ounces of silver, and has produced a cumulative total of 240,149 ounces of gold and 124,878 ounces of silver since recommencement of commercial production.
The El Gallo 1 mine consists of 8 square miles (20 square km) of concessions. Concession titles are granted under Mexican mining law. Mining concessions are subject to annual work requirements and payment of annual surface taxes which are assessed and levied on a semi-annual basis in accordance with Mexican law. An annual lease agreement for surface access to the El Gallo 1 mine is currently in place.
Location and Access
The El Gallo 1 mine and the surrounding properties are in northwestern Mexico in the western foothills of the Sierra Madre Occidental mountain range, within the State of Sinaloa in the Mocorito Municipality, approximately 60 miles (100 km) by air northwest of the Culiacan, the Sinaloa State capital city. The concessions are located approximately 2.5 miles (4.0 km) by road from the town of Mocorito, which is approximately 10 miles (16 km) from the city of Guamuchil. Access is by paved or well-maintained two-way dirt roads.
Geology and Mineralization
Mineralization among the various deposits of the El Gallo 1 mine area is generally similar. The mineralized structural zones consist of quartz stockwork, breccia, and/or local quartz veins, all occurring within propylitically altered andesitic volcanic rocks. The mineralization is generally characterized by gold accompanied by iron oxide and variable copper, zinc and lead in sulfides.
Facilities and Infrastructure
The El Gallo 1 mine property has well‑developed infrastructure including electricity, roads and high-speed internet access. There is a truck shop, a warehouse, a fuel depot, core logging facilities, an explosives magazine, heap leach pads, process ponds, an assay laboratory, a three stage crushing plant, an ADR process plant and an administrative office. The laboratory is equipped to process all assays (blasthole samples from the mine, core, chips and soil) and incorporates fire assaying, atomic absorption, and ICP-OES equipment. Also included is a metallurgical lab capable of conducting leach bottle rolls and column tests to determine cyanide leaching amenability and gold and silver recoveries of ores amenable to cyanide leaching.
In 2017, we initiated the construction of a sulfidation-acidification recovery (SAR) circuit for the removal of copper, zinc and lead from pregnant leach solutions. This will increase the adsorption efficiency at the ADR plant to recover gold and silver from the pregnant leach solutions obtained from the heap leach. The SAR circuit is expected to be commissioned in the first quarter of 2018.
Mining operations and site security are performed by contractors with company employees in the management, administrative and processing areas.
The primary water supply for the El Gallo 1 mine comes from two operating water wells located 0.9 miles (1.5 km) from the process facility. Wells pump water into a raw water pond, which is then used for operations. The wells combined with
20
capture of 32 inches (~830 mm) of average local annual precipitation provide sufficient supply for the El Gallo 1 mine production.
Mining activities will cease in the second quarter of 2018 while we expect leaching activities will continue until 2020 or later, as long as it remains economical to do so. Exploration work is ongoing in an effort to extend the mine life beyond 2018 and make new discoveries in the district.
Advanced-stage Properties
El Gallo 2 Project, Mexico (100% owned)
Access and Location
The El Gallo 2 project is located 3.0 miles (4.8 km) northwest of our El Gallo 1 mine.
Overview and History
El Gallo 2 is a prospective silver mining operation. Although there is a long history of mining in the area, only minimal amount of mining appears to have occurred at El Gallo 2 based on field observations. There is no recorded history of prior exploration having occurred at El Gallo 2. We acquired El Gallo 2 and the surrounding mineral concessions in connection with the acquisition of Nevada Pacific Gold in 2007. In 2008, we initiated exploration in the district. After conducting rotary drilling in the area, we were able to confirm the grade and thickness of the silver resource in January 2009.
A feasibility study (‘‘FS’’) was completed on the El Gallo 2 project in September 2012. As a result of changes in commodity prices since the publication of the FS, we are of the view that the 2012 FS is no longer current and should not be relied on. A final decision to proceed with the construction of El Gallo 2 has not been made and alternatives to reduce capital and operating costs continue to be examined. Any decision to proceed would be dependent on improved silver prices, improved project economics, and securing financing on terms that are more favorable than those that were available at the time of completion of the FS. During 2017, we conducted further studies on the feasibility and development of the El Gallo 2 project. However, as of December 31, 2017, no new study has been completed.
Facilities and Infrastructure
El Gallo 1 infrastructure is currently used to support current work on the El Gallo 2. The water supply for the El Gallo 2 project is expected to come from three locally drilled water wells. Required water yields were confirmed through several long‑term pumping tests completed in 2013.
Exploration Properties
Our land position of Exploration Properties in Mexico consists of several claims not associated with a specific project, such as Palmarito and Mina Grande. The Palmarito silver deposit is a historic silver mining area that saw historical production from open pit and underground workings before cessation of mining in the 1950s.
Since 2008, exploration activities across the license areas have included prospecting, as well as stream sediment, soil and rock chip sampling, and most recently an ongoing full district-scale soil geochemistry survey. This work has in some areas leading to more detailed work including large scale mapping, blasthole drilling and ultimately RC and core drilling programs. This stage-gate approach has led to either a steady progression of work in prospective areas or the suspension of work in less favorable areas. The prioritization of targets has continued based on new data and interpretations. Limited exploration was conducted in 2017. We allocated part of the 2018 budget to continue the exploration work, including multiple drill campaigns to evaluate the highest priority soil geochemistry anomalies identified by our district-scale soil sampling program.
21
SEGMENT: CANADA
The following map depicts the location of our major properties included in the Canada segment, which are the Lexam Properties (Fuller, Davidson Tisdale, Buffalo Ankerite and Paymaster), and the Black Fox Complex, (the Black Fox Property (Black Fox Mine, Grey Fox, Froome), Black Fox-Stock mill and Black Fox North). These properties are described below.
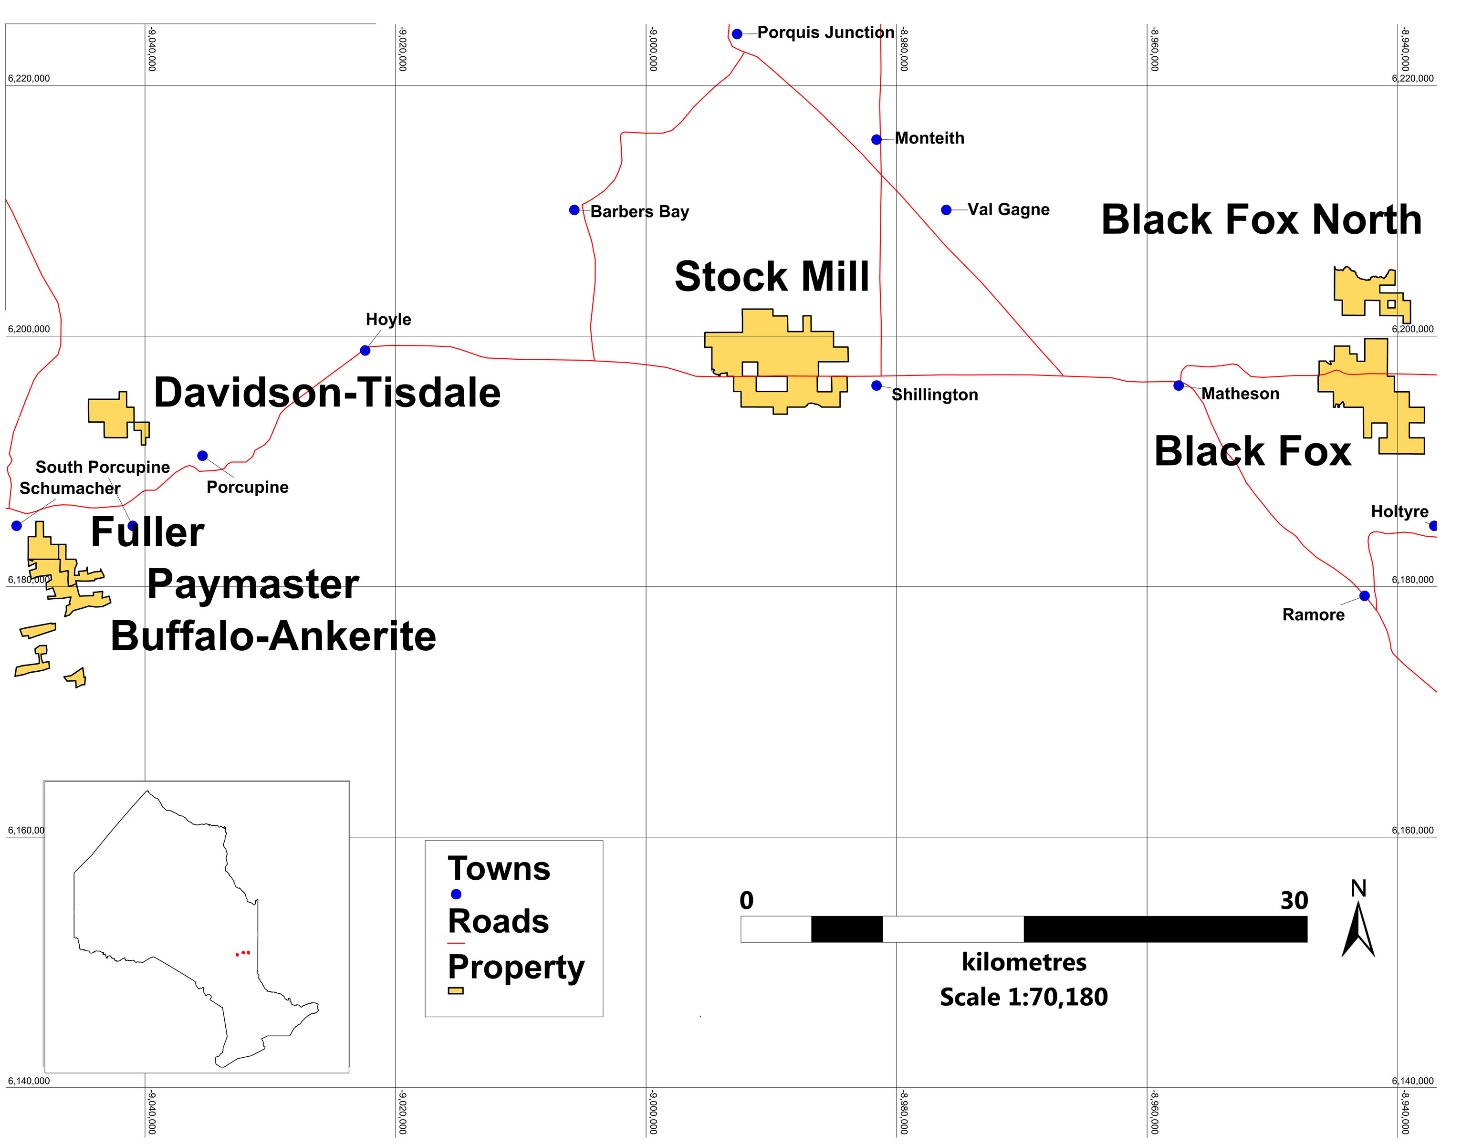
The following table summarizes the Canada land position of our Company as of December 31, 2017:
|
|
|
Number of |
|
Square |
|
Square |
|
Canada Mineral Property Interest |
|
Claims |
|
Miles |
|
Kilometers |
|
Black Fox Property |
|
54 |
|
7 |
|
18 |
|
Davidson-Tisdale |
|
36 |
|
2 |
|
5 |
|
Fuller |
|
10 |
|
1 |
|
2 |
|
Paymaster |
|
13 |
|
1 |
|
2 |
|
Buffalo Ankerite |
|
15 |
|
1 |
|
2 |
|
Total Canada Properties |
|
128 |
|
12 |
|
29 |
22
Production Properties
Black Fox Mine, Canada (100% owned)
For detailed information on the Black Fox Mine production statistics and financial results, refer to Item 7. Management’s Discussion and Analysis of Financial Condition and Results of Operations.
Overview and History
We own 100% of the Black Fox Complex, which includes the Black Fox Mine, Black Fox North and the Black Fox-Stock Mill. We acquired these assets, along with some advanced-stage and exploration properties, in October 2017. The Black Fox Mine refers to the current mining operation and is an underground gold mine. Modern exploration activities at the Black Fox Mine (formerly the Glimmer Mine) started in the late 1990’s.
The Glimmer Mine and surrounding properties started operating in 1997. Commercial production was initiated by Exall Resources Limited and the mine operated over the period 1997 to 2001. Operations were suspended in May 2001 due to low gold prices. The Glimmer Mine was renamed the Black Fox Mine in 2002 and there was no gold production between 2002 and 2008. Brigus Gold Corporation (“Brigus”) restarted the mine following increased gold prices in early 2009. Primero Mining Corp. (“Primero”) acquired Brigus on March 5, 2014. During the period between 2014 and 2016, the mine produced 151,000 ounces of gold. We acquired the property on October 3, 2017, completed the first gold pour in November 2017 and the commercial operations of the mine were unaffected by the acquisition.
The Black Fox Property consists of one block of land comprising 32 parcels and 22 mining titles for a total of 4,324 acres (1,750 hectares) or 6.8 sq. mi (17.5 sq. km). Some parcels and mining titles are subject to royalties. All parcels and mining titles are freehold mining lands (mining patents), mining leases, or licenses of occupation. All required permits are in place.
Location and Access
The Black Fox Complex is located 7 miles (11 km) east of Matheson, Ontario, on Highway 101 East. Matheson, in turn, is located approximately 45 miles (72 km) from Timmins, which has a commercial airport. Access to the mine is either by paved or well maintained, two‑way, dirt roads.
Geology and Mineralization
The Black Fox Complex is located within the Abitibi greenstone belt. Gold mineralization at the Black Fox Mine occurs in several different geological environments within the main ankerite alteration zone, and generally occurs as: (1) Free gold associated with shallow dipping quartz veins and stockworks in green carbonate and ankerite altered ultramafic rocks; (2) Gold-bearing pyrite; (3) Gold associated with fine-grained pyrite and (4) Free gold in steeply dipping sigmoidal quartz veins.
Facilities and Infrastructure
The Black Fox Mine property has well‑developed infrastructure including electricity, roads and high-speed internet access. There are seven fully serviced modular buildings which support various functions of the underground mine. There is also a maintenance shop, warehouse, compressed air plant, backfill plant and water management facilities. Ore from the Black Fox mine is transported to, and processed at, the Stock Mill, approximately 17 miles (27 km) from the mine.
The primary water supply for the Black Fox Mine comes from an on-site fresh water well, and water produced from dewatering activities is channeled to the holding pond for process recycling and/or discharge through the Black Fox water treatment facility. Current water supplies are adequate to sustain current and planned future operations.
We acquired the Black Fox-Stock Mill as part of the acquisition from Primero in October 2017. The mill is located approximately 17 miles (27 km) from the Black Fox mine and has a nominal processing capacity of 2,500 tpd. Ore is shipped to the mill from the Black Fox mine by truck.
23
The Black Fox-Stock mill is also the site of the former Stock Mine, which produced 137,000 ounces of gold from an underground operation between 1989 and 2005. The surface facilities remain in place with the underground mine now flooded.
The Stock Mill property has well‑developed infrastructure including electricity, roads and high-speed internet access. There are two buildings that support security and administration of the Stock Mill. There is an assay lab and administrative building on site. There are several other buildings to support operations and milling, including a hoist house, warehouse and maintenance shop, mine dry building, crusher and conveyor systems and the mill building itself. The site also houses various support structures including reagent storage and oil storage buildings, reagent distribution building, two standby generator buildings and a potable water building.
We inherited a toll milling agreement with Sage Gold to process ore from the Clavos Gold project.
Reserves
We are in the process of completing our own technical report in respect of the Black Fox mine. In connection with this project we are reviewing this mineral resource.
Metal Streaming Agreement
On November 9, 2010, Brigus entered into an agreement with Sandstorm Gold Ltd. (“Sandstorm”) whereby Brigus received up front proceeds of $56.3 million and Sandstorm agreed to purchase 12% of the future gold production from the Black Fox Mine beginning in January 2011 and 10% of future gold production from the Black Fox extension covering a portion of the adjoining Pike River property. Sandstorm also committed to pay Brigus ongoing payments of $500 per ounce purchased, subject to an inflationary adjustment beginning in 2013, but which would not exceed 2% per annum. Brigus had the option, for a 24-month period, to reduce the Gold Stream Agreement to a minimum of 6% of production from the Black Fox Mine and 4.5% of production from the Black Fox Extension (Pike River) for a payment of $36.6 million. On November 5, 2012, Brigus elected to exercise a portion of the option and repurchased 4% of the Gold stream for $24.4 million. This reduced Sandstorm’s portion of future production at Black Fox to 8% and the Black Fox extension to 6.3%. The Sandstorm agreement was assumed by McEwen as part of the acquisition of the Black Fox Complex. The Company is obligated to sell 8% of current and future gold production from the Black Fox mine and 6.3% at the adjoining Pike River property (Black Fox Extension) to Sandstorm at the lesser of market price or $531 per oz (with inflation adjustments of up to 2% per year) until 2090. The upfront proceeds, representing the uncredited balance, were completely repaid prior to the Company’s acquisition of the properties.
Advanced-stage Properties
Grey Fox, Canada (100% owned)
Overview and History
The Grey Fox project is an advanced-stage project. It is also 100% owned by our subsidiary McEwen Ontario. The Grey Fox project is not subject to any streaming arrangements.
An internal feasibility-level study (“Feasibility”) was completed on the Grey Fox project in early 2015 by Primero, which recommended further development of the Grey Fox deposit. At the end of 2015, project engineering, baseline studies, geotechnical evaluations, permitting activities, closure plan preparation, and development of mine designs and production plans as well as cost estimates had advanced sufficiently to initiate consultation with the First Nations, the Metis of Ontario and local communities. Subsequently, Primero stopped development work on the project. A final decision to proceed with development of Grey Fox has not been made and alternatives to reduce capital and operating costs continue to be examined by the Company. Any decision to proceed would be dependent on improved gold price expectations and improved project economics.
Access and Location
The Grey Fox project is located 2.2 miles (3.5 km) south of Black Fox Mine, and is directly adjacent to Kirkland Lake’s Hislop mine. Access is either by paved or well maintained, two‑way, dirt roads.
24
Facilities and Infrastructure
There is no infrastructure at the Grey Fox property.
Froome, Canada (100% Owned)
Overview and History
The Froome project was discovered by Primero in early 2015.
Access and Location
The Froome deposit is located 0.6 miles (1 km) west of the Black Fox Mine. The deposit is accessible by either paved or well maintained, two-way, dirt roads.
Facilities and Infrastructure
Due to the proximity of Froome to the Black Fox mine, existing infrastructure from Black Fox can be utilized on this project. We will continue evaluating to determine the viability of future production from this deposit.
Exploration Properties
We acquired the Lexam properties in connection with the acquisition of Lexan in April 2017. Each of these properties (Buffalo Ankerite, Davidson Tisdale, Fuller and Paymaster) is adjacent to either a previous mining operation or an existing one. There is limited infrastructure on the properties. The company is evaluating synergies that could come as a result of using the Black Fox - Stock Mill to process material from these properties, which is about 30 miles (50 km) away from the mill to the west.
Buffalo Ankerite, Canada (100% Owned)
We control a 100% interest in the Buffalo Ankerite Property, which is located 3.5 miles (5.6 km) southeast of Timmins, in northeastern Ontario. Production took place between 1926 and 1953 and included a 4,000 ft. (1,220 meter) deep shaft. In early 2007, Lexam began exploring for both near surface and deep gold mineralization.
Fuller, Canada (100% Owned)
The Fuller Property is comprised of 13 claims covering 519 acres (210 hectares) in Tisdale Township, approximately 3 km southeast of Timmins, Ontario.
Paymaster, Canada (61.01% Owned)
In June 2008, Lexam entered a four-year option agreement with Goldcorp Inc. (“Goldcorp”) to acquire a 60% interest in 15 patented mining claims that are adjacent to and on strike of the gold mineralized zones situated on the Fuller Property and the Buffalo Ankerite Property. In June 2012, Lexam completed its earn-in requirements and acquired a 60% interest in the Paymaster Property. On September 20, 2013, Lexam received formal notification from Goldcorp indicating that they would not participate in the 2013 exploration program. As Goldcorp continued its nonparticipation in subsequent years, Goldcorp’s 40% ownership was diluted in accordance with terms stipulated in the joint venture agreement. As of December 31, 2017, McEwen increased its interest in the Paymaster Property to 61%.
Davidson Tisdale, Canada (100% Owned)
We own 100% of the Davidson Tisdale property, covering 1,134 acres (460 hectares) from 25.5 claims. The Davidson Tisdale Property hosts gold in the Main Zone and the S-Zone mineralized structures, which are developed by a 550 foot (168 meter) deep decline ramp with five mine levels. Permitting activities have been carried out over previous years. Upon completion of additional permitting, we envision a surface bulk sample as the initial mining work, leading to an open pit operation before the commencement of underground mining. Additional exploration potential exists at depth, below the underground mine workings.
25
Other Exploration Properties
Black Fox North, Canada (100% Owned)
We own 100% of the Black Fox North property, covering 207.7 acres (84 hectares) from 10 claims, and located 2.5 miles (4 km) north of Black Fox Mine. The Black Fox North Property is underlain by mafic and felsic volcanic flows to the northeast and sedimentary rocks to the southwest. The volcanic and sedimentary sequences are separated by the northwest-southeast striking Pipestone Fault. The Pipestone fault is known to host mineralization. To date, no gold mineralization has been identified on the property. Soil surveys across the property, as well as the presence of bimodal volcanism, suggest the potential for base metal mineralization on the property.
SEGMENT: MINERA SANTA CRUZ (“MSC”)
The following map depicts the location of our major properties included in the MSC segment which are the San José mine and other concessions located around the mine:
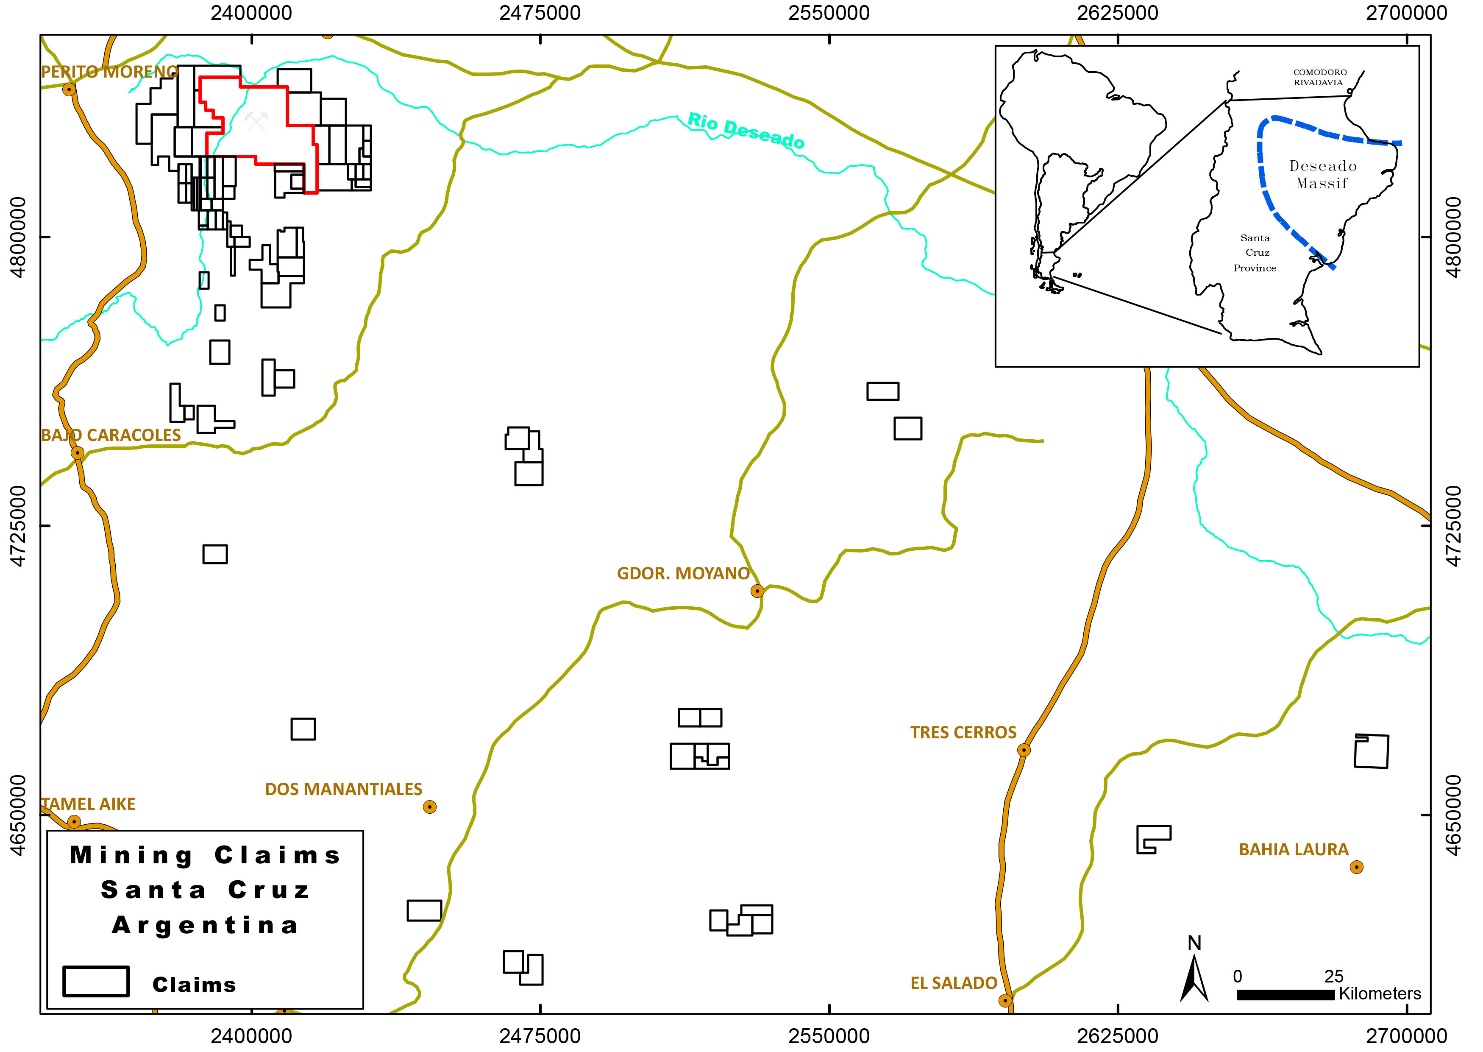
Production Properties
San José mine, Argentina (49% owned)
For detailed information on the San José mine production statistics and financial results, refer to Item 7. Management’s Discussion and Analysis of Financial Condition and Results of Operations.
Overview and History
The San Jose mine is an underground gold and silver mining operation. We acquired our interest in the San José mine in connection with our acquisition of Minera Andes in January 2012. The property is owned and operated under an option and joint venture agreement (“OJVA”) between Minera Andes (49%) and Hochschild (51%) in the name of MSC. The
26
property was acquired by Minera Andes in 1997, following the completion of a regional geological study. Minera Andes carried out an intensive exploration program from 1997 to 2001, leading to the discovery of the Huevos Verdes and Saavedra West Zones. A feasibility study was completed in October 2005 under the direction of MSC and the decision to proceed to production was made on March 28, 2006. Plant, infrastructure construction and mine development continued from July 2006 to September 2007 and commercial production was declared on January 1, 2008.
The San José mine is an underground operation located approximately 12 miles (20 km) north of Goldcorp’s Cerro Negro project in the northwest corner of the Deseado Massif region in the Province of Santa Cruz in Argentina. The mine is part of a larger property which covers a total area of approximately 1,074 sq. miles. (2,781 sq. km) and consists of 135 mining concessions
Location and Access
The San José property is in the province of Santa Cruz, Argentina, lying approximately between latitude 46°41’S and 46°47’S and longitude 70°17’W and 70°00’W. The mine is 1,087 miles (1,750 km) south‑southwest of the city of Buenos Aires and 217 miles (350 km) southwest of the Atlantic port city of Comodoro Rivadavia. The principal access route to the San José property is a paved highway from Comodoro Rivadavia unto an unsealed 20-mile (32 km) two-lane dirt road section to the mine. Comodoro Rivadavia has regularly-scheduled air services to Buenos Aires. The nearest town is Perito Moreno, which is approximately 19 miles (30 kilometers) west of the San José property. The main structural trend of fault and vein systems on the property is in directions within the northwest quadrant.
Geology and Mineralization
The San José property is in the Deseado Massif, which consists of Paleozoic metamorphic basement rocks uncomfortably overlain by Middle to Upper Jurassic bimodal andesitic and rhyolitic volcanics and volcaniclastics. Cretaceous sediments and Tertiary to Quaternary basalts overlie the Jurassic volcanics. The Jurassic Bajo Pobre Formation is the main host of gold and silver vein mineralization at the mine. The formation is comprised of a lower andesite volcaniclastic unit and an upper andesite lava flow and has a maximum thickness of 394 ft. (120 meters). Mineralization in the San José area occurs as low sulfidation epithermal quartz veins, breccias and stockwork systems accompanying normal‑sinistral faults striking 330° to 340°.
Facilities and Infrastructure
Infrastructure at the property consists of camp facilities that can accommodate up to approximately 1,100 personnel, a medical clinic, a security building, a maintenance shop, a laboratory, processing facilities, a mine and process facility warehouse, a surface tailings impoundment, support buildings and mine portals, a change house, a core warehouse, an administration building and offices. The laboratory is equipped to process all assays (core, chips and soil) and incorporates fire assaying and atomic absorption equipment. MSC has installed a satellite‑based telephone/data/internet communication system.
Electricity is provided by an 81‑mile (130 km) 132 kV electric transmission line, which was constructed in 2009 and connects the San José mine processing facility to the national power grid.
The San José mine is a ramp access underground mining operation.
Exploration Activities
MSC has purchased the land and corresponding occupation rights that are necessary to conduct its operations. All of the known mineralized zones, mineral resources and mineral reserves and active mine workings, existing tailing ponds and waste are within MSC’s concessions.
During 2017, approximately 33,661 feet (10,260 meters) were drilled in Aguas Vivas, Juanita, Platífero and Nueva-1 areas. For 2018 the approved budget considers approximately 24,803 feet (7,560 meters) in the San José area. In 2017, MSC secured surface land access for exploration and eventual mine development if successful through a 30-year agreement with the land owners. However, if the Aguas Vivas results from 2017 and the drilling in the San José area have positive results then additional meters will be drilled in 2018.
27
Reserves
The reserves information for the San José mine as at December 31, 2017, on a 100% basis, was prepared by Hochschild and audited by P&E Mining Consultants Inc. (“P&E”). In its report dated February 4, 2018, P&E concluded that the reserve estimates for the San José mine prepared by Hochschild provide a reliable estimation of reserves in accordance with the standards of the Joint Ore Reserve Committee of the Australian Institute of Mining and Metallurgy (“JORC”), NI 43‑101, the Canadian Institute of Mining, Metallurgy and Petroleum (“CIM”) best practices and SEC Industry Guide 7.
The mineral reserves were estimated using metal prices of $1,200 per ounce of gold and $16.5 per ounce of silver with a marginal revenue cut‑off value of $101.63 per tonne. The reserves, as presented, are in‑place and include mining dilution and mining losses, but do not include allowances for mill or smelter recoveries.
The following table summarizes 100% of proven and probable gold and silver reserves of the San José mine, as of December 31, 2017:
|
|
|
Tonnes |
|
Silver |
|
Silver ounces |
|
Gold |
|
Gold ounces |
|
|
Reserve Category |
|
(in thousands) |
|
(grams/tonne) |
|
(in millions) |
|
(grams/tonne) |
|
(in thousands) |
|
|
Proven |
|
973 |
|
490 |
|
15.3 |
|
6.99 |
|
219 |
|
|
Probable |
|
434 |
|
384 |
|
5.4 |
|
6.74 |
|
94 |
|
|
Proven & Probable |
|
1,407 |
|
457 |
|
20.7 |
|
6.92 |
|
313 |
|
28
SEGMENT: USA
The following map depicts the location of our major properties in the USA segment, including the Gold Bar project currently under construction and exploration properties which are fully owned by us or subject to joint venture agreements:
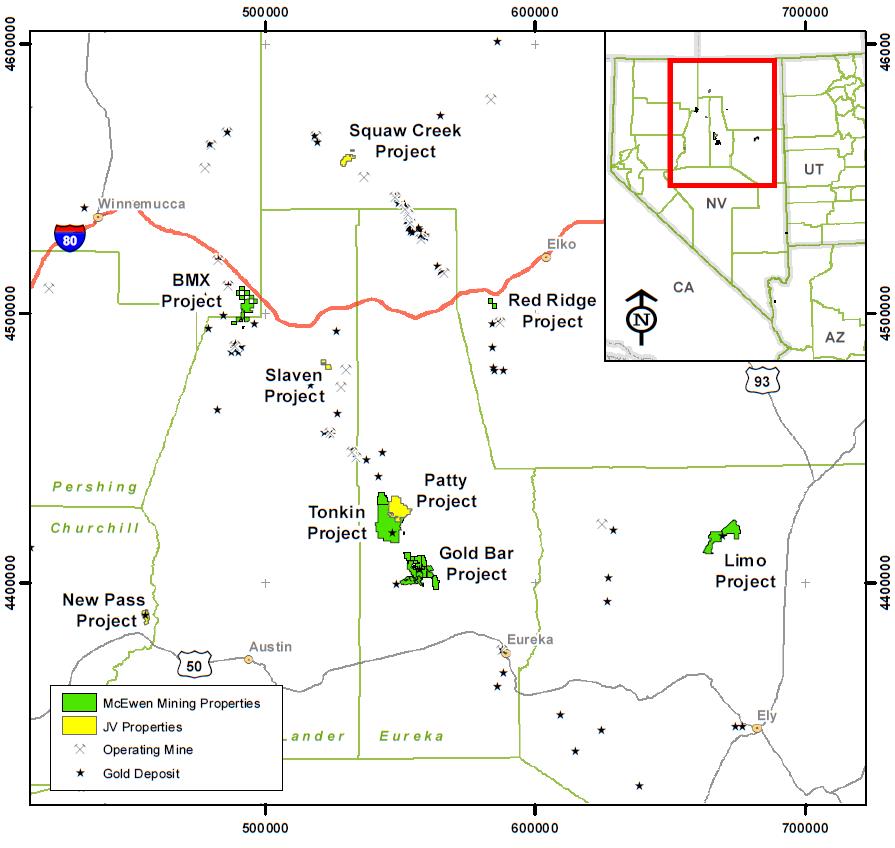
The following table summarizes the land position of our properties in Nevada as of December 31, 2017:
|
|
|
Number of |
|
Square |
|
Square |
|
USA Mineral Property Interest |
|
Claims |
|
Miles |
|
Kilometers |
|
Gold Bar Complex |
|
1,207 |
|
39 |
|
101 |
|
Tonkin Complex |
|
1,390 |
|
45 |
|
116 |
|
Limo Complex |
|
665 |
|
21 |
|
56 |
|
Battle Mountain Complex |
|
573 |
|
19 |
|
48 |
|
Other United States Properties |
|
1,457 |
|
47 |
|
122 |
|
Total USA Properties |
|
5,292 |
|
171 |
|
443 |
29
Advanced-stage Properties
Gold Bar Project, Nevada (100% owned)
Overview and History
The Gold Bar Project is a proposed open pit gold mine with an oxide heap leach recovery circuit. Construction work commenced in late 2017 following receipt of the final permit.
The property is located within the Battle Mountain-Eureka-Cortez gold trend in Eureka County, central Nevada. The property was previously mined from 1987 to 1994 by Atlas Precious Metals Inc. We commenced the formal permitting process to recommence mining in 2012.
On February 15, 2018, we announced the results of a definitive FS, which will be filed on SEDAR. The FS is compliant with NI 43-101 and the reserve estimate is compliant with SEC Industry Guide 7. Based on the FS, initial capital expenditures for the project are estimated at $80.8 million including an allocation of $4.6 million for contingencies.
Location and Access
The Gold Bar project is in the Roberts Creek Mountains, in Eureka County, Nevada, approximately 30 miles (48 km) northwest of the town of Eureka, Nevada, primarily in Township 22 North, Range 50 East (N39°48’16.5”; W116°21’09.65”). The project site is accessed by traveling 25 miles (40 km) west on US Highway 50 from Eureka, the nearest town. Travel is then 16 miles (26 km) north on the Three Bars Road, a gravel, all-weather road maintained by Eureka County. The project area is approximately 15 miles (24 km) from the end of Three Bars Road, and is accessed through unimproved dirt roads that are not maintained by the county.
Geology and Mineralization
The project is located in the Battle Mountain‑Eureka mineral belt in a large window of lower‑plate carbonate rocks surrounded by upper‑plate rocks. The lower‑plate carbonates consist of an east‑dipping section of Silurian Lone Mountain Dolomite, Devonian McColley Canyon Formation, Devonian Denay Formation, and Devonian Devils Gate Limestone (from oldest to youngest). Gold mineralization is hosted primarily in the Bartine Member of the McColley Canyon Formation, which consists of carbonate wackestones and packstones approximately 250 to 380 feet thick. Minor amounts of mineralization are found in the underlying dolomitic limestone Kobeh Member of the McColley Canyon Formation where it is adjacent to apparent feeder structures. The area where the project is located has “Carlin‑Type” sediment‑hosted gold mineralization characteristics with typical associated alteration (decalcification, silicification).
Facilities and Infrastructure
At present, temporary facilities and infrastructure exist at the Gold Bar project site in support of ongoing construction activities. These items include a temporary water supply and power generation, as well as modular offices.
Gold Bar Project construction began immediately upon receipt of the final permit on November 8, 2017. Key activities conducted during November and December 2017 were:
|
· |
Engineering and procurement of major capital equipment items; |
|
· |
Onsite mobilization of all major contractors; |
|
· |
Site clearance and initial preparation for 2018 civil work was largely completed; |
|
· |
Installed temporary offices, communications equipment, water, and power; |
|
· |
Began installation of mine water supply system; |
30
|
· |
Mine development underway at Cabin Creek pit, which will be the initial source of production. |
Exploration Activities
Since the formal permitting process began in 2012, we did not perform any drilling activities within the production area subject to the Plan of Operations (“POO”). We did, however, drill and pump-tested one potential water well location for future mining operations. We drilled 33 holes in 2015 which were primarily in previously disturbed areas of the pit. No other exploration occurred between 2016 and November 2017. In December 2017, a series of near pit limit exploration targets were initiated at the Gold Bar project. The total program footage will be determined by program success. The program is expected to continue throughout the first quarter of 2018.
Permitting Activities
The Gold Bar project is fully permitted for construction. State permits required for operations are all expected to be received prior to commencement of operations, which is expected for the fourth quarter of 2018.
The mineral reserves at the Gold Bar project were estimated using gold price of $1,000 per ounce, and a cut-off grade of 2.26 g/t. The reserves, as presented, are in‑place and include mining dilution and mining losses, but do not include allowances for mill or smelter recoveries. The reserve estimate was prepared by Independent Mining Consultant of Tucson, Arizona.
The following table summarizes estimated proven and probable gold reserves recoverable of the Gold Bar project, as of December 31, 2017:
|
|
|
Tonnes |
|
Gold |
|
Gold ounces |
|
Reserve Category |
|
(in thousands) |
|
(grams/tonne) |
|
(in thousands) |
|
Proven |
|
2,253 |
|
1.27 |
|
83 |
|
Probable |
|
14,244 |
|
0.97 |
|
401 |
|
Proven & Probable |
|
16,497 |
|
1.01 |
|
484 |
Exploration Properties
Tonkin property (100% owned)
The Tonkin property represents our largest holding within the Battle Mountain‑Eureka Trend in Eureka County, Nevada with approximately 43 sq. miles (113 sq. km). The Tonkin property consists of the Tonkin Springs deposit and the previously operating Tonkin mine.
From 1985 through 1989, the Tonkin mine produced approximately 30,000 ounces of gold utilizing an oxide heap leach and a separate ball mill involving bio oxidation to treat refractory sulphide ore. Due to cost escalation and recovery issues, the operation was shut down and not restarted. The mine site is currently on care-and-maintenance and we continue to advance the reclamation program. We also continue evaluation work with respect to the Tonkin Springs deposit. No significant drilling took place in 2017.
Other Exploration Properties
No significant drilling or exploration activities took place in any of these properties during the year 2017. The Company continues to rationalize its mineral property interests in Nevada in an effort to focus its exploration efforts on prospective areas.
31
SEGMENT: LOS AZULES
Exploration Properties
The following map depicts the location of our major exploration properties in the Los Azules segment in two distinct exploration projects at Los Azules and Chonchones, in the province of San Juan in Argentina. Los Azules is the more advanced and significant project at this time.
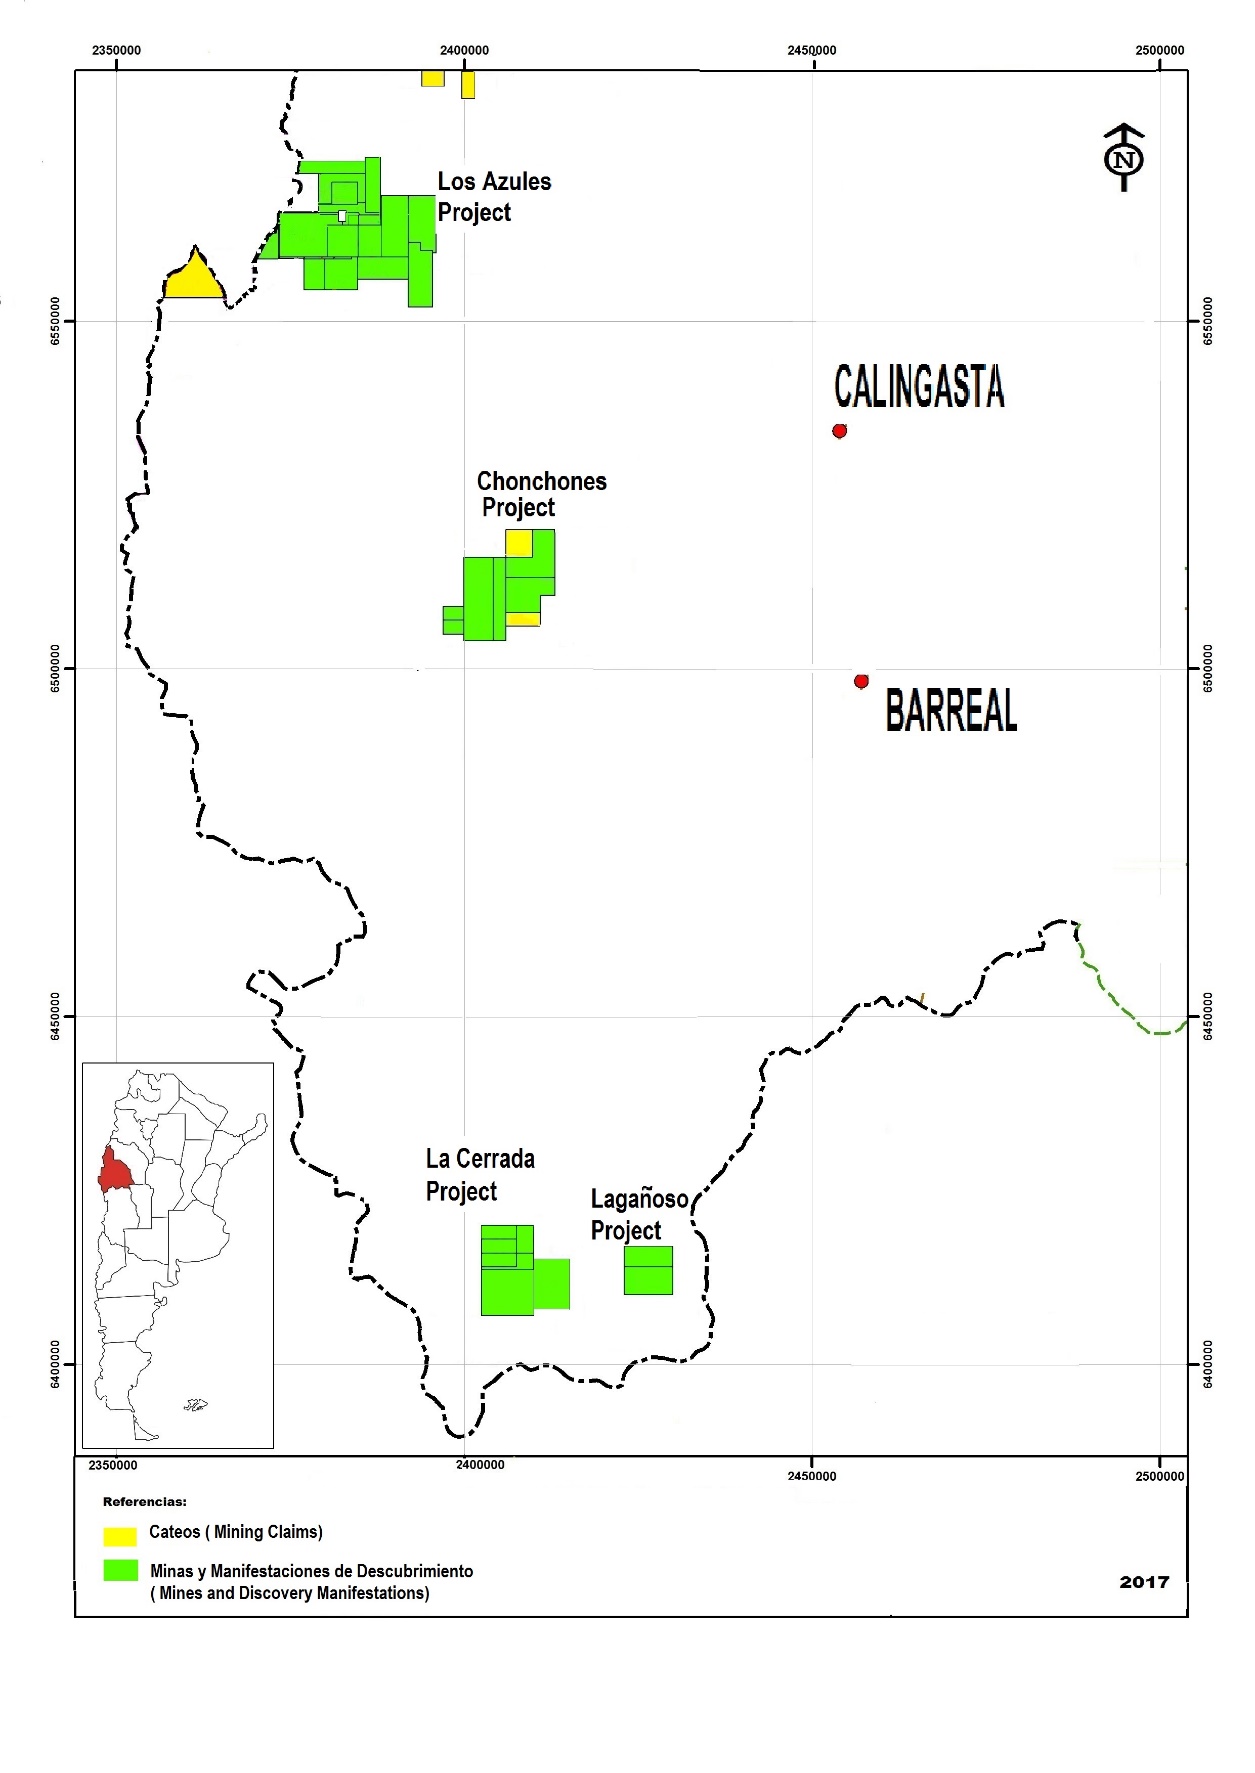
32
The following table summarizes the land position related to Los Azules segment as of December 31, 2017:
|
|
|
Number of |
|
Square |
|
Square |
|
Argentina Mineral Property Interest |
|
Claims |
|
Miles |
|
Kilometers |
|
Los Azules project |
|
331 |
|
145 |
|
376 |
|
Chonchones project |
|
139 |
|
67 |
|
173 |
|
Lagañoso project |
|
49 |
|
19 |
|
49 |
|
La Cerrada project |
|
118 |
|
51 |
|
132 |
|
Other Argentina properties |
|
31 |
|
58 |
|
150 |
|
Total Argentina Properties |
|
668 |
|
340 |
|
880 |
Los Azules Copper Project, Argentina (100% owned)
Overview and History
The Los Azules copper project is a 100% owned advanced‑stage porphyry copper exploration project located in the cordilleran region in the province of San Juan, Argentina near the border with Chile. In 1994, Minera Andes acquired lands in the southern portion of the Los Azules area. Over the years there was additional exploration done by Minera Andes and other companies who owned adjacent properties around Los Azules. We acquired this property, along with other Argentina exploration properties and our interest in the San José mine, as part of with the acquisition of Minera Andes in January 2012.
Location and Access
The project is located at approximately 31o 13’30” South latitude and 70o 13’50” West longitude and about 4 miles (6 km) east of the Chile‑Argentina border. It is accessible by unimproved dirt roads with seasonal closures in winter. The elevation at the site ranges between 11,500 feet to 14,750 feet (3,500 meters to 4,200 meters) above sea level.
Geology and Mineralization
The deposit is located within a copper porphyry belt that is host to some of the world’s largest copper mines. The upper part of the system consists of a barren leached cap, which is underlain by a high‑grade secondary enrichment blanket. Primary mineralization below the secondary enrichment zone has been intersected in drilling up to a depth of more than 3,280 feet (1,000 meters) below surface.
Exploration Activities
Drilling conditions in the area are difficult, especially due to the presence of highly faulted zones and areas of loose surface scree or talus. Due to snow conditions on two mountain passes on the access road to the site, seasonal exploration typically commences in December and extends into late April or early May. Drilling programs have been undertaken at Los Azules between 1998 and 2014 and in 2017 by four different mineral exploration companies: Battle Mountain Gold (now Newmont Mining Inc.), Mount Isa Mines S.A. (now Glencore Plc.), Minera Andes and McEwen Mining. Drilling, including early reverse circulation programs, focused initially on gold exploration and subsequently on diamond drilling for porphyry style copper mineralization. From 1998 until the second quarter of 2013, a total of 201,764 ft. (61,141 m.) were drilled on the property. No significant drilling took place between third quarter of 2013 and fourth quarter of 2016 as we focused on baseline studies regarding flora, fauna, water quality and other environmental compliance matters. In 2017, a total of 21,451 ft. (6,500 m.) was drilled bringing total drilling done to date at Los Azules to 223,215 ft. (67,641 m.)
During the third quarter of 2017 we completed an updated 43-101 Preliminary Economic Assessment (“PEA”), results of which were announced on September 7, 2017.
Facilities and Infrastructure
There are currently limited facilities or infrastructure located at the project site which mainly includes portable camp structures and drill platforms.
33
Other Exploration Properties
Our other exploration properties are located in the Province of San Juan. No significant exploration activities took place during 2017.
We are not currently subject to any material legal proceedings, other than the tax matter described under the risk “Our operations in Argentina and Mexico are subject to political and social risks” included in Item 1A. Risk Factors. To the best of our knowledge, no such proceeding is threatened, the results of which would have a material impact on our properties, results of operations, or financial condition. Nor, to the best of our knowledge, are any of our officers or directors involved in any legal proceedings in which we are an adverse party.
ITEM 4. MINE SAFETY DISCLOSURES
As we have no operating mines located in the U.S. or any of its territories, the disclosure required by this Item is not applicable.
34
ITEM 5. MARKET FOR COMMON EQUITY, RELATED STOCKHOLDER MATTERS AND ISSUER PURCHASES OF EQUITY SECURITIES
Market Information
On January 24, 2012, our common stock commenced trading on the NYSE and TSX under the symbol “MUX”, subsequent to the completion of the acquisition of Minera Andes. Exchangeable shares of McEwen Mining—Minera Andes Canadian Acquisition Corp. (“Exchange Co.”) traded on the TSX, under the symbol “MAQ” until August 2016, when all the outstanding exchangeable shares were redeemed.
The table below sets forth the high and low sales prices for our common stock on a quarterly basis as reported by the NYSE and TSX from January 1, 2016 to December 31, 2017.
|
|
|
NYSE |
|
TSX (C$) |
|
||||||||
|
|
|
High |
|
Low |
|
High |
|
Low |
|
||||
|
Year ended December 31, 2017 |
|
|
|
|
|
|
|
|
|
|
|
|
|
|
First Quarter |
|
$ |
4.43 |
|
$ |
2.84 |
|
$ |
5.83 |
|
$ |
3.84 |
|
|
Second Quarter |
|
|
3.30 |
|
|
2.47 |
|
|
4.40 |
|
|
3.30 |
|
|
Third Quarter |
|
|
2.86 |
|
|
1.94 |
|
|
3.53 |
|
|
2.40 |
|
|
Fourth Quarter |
|
|
2.38 |
|
|
1.82 |
|
|
2.97 |
|
|
2.33 |
|
|
Year ended December 31, 2016 |
|
|
|
|
|
|
|
|
|
|
|
|
|
|
First Quarter |
|
$ |
2.13 |
|
$ |
0.96 |
|
$ |
2.84 |
|
$ |
1.41 |
|
|
Second Quarter |
|
|
3.85 |
|
|
1.80 |
|
|
4.99 |
|
|
2.36 |
|
|
Third Quarter |
|
|
4.92 |
|
|
3.33 |
|
|
6.44 |
|
|
4.38 |
|
|
Fourth Quarter |
|
|
3.74 |
|
|
2.51 |
|
|
4.93 |
|
|
3.40 |
|
As of February 20, 2018, there were 337,054,594 shares of our common stock outstanding, which were held by approximately 4,559 stockholders of record. As noted above, the exchangeable shares were fully redeemed in the third quarter of 2016.
Transfer Agent
Computershare Investor Services Inc. is the transfer agent for our common stock. The principal office of Computershare is 250 Royall Street, Canton, Massachusetts, 02021 and its telephone number is (303) 262‑0600. The transfer agent in Canada is Computershare Investor Services at 100 University Ave., 8th Floor, Toronto ON, M5J 2Y1 and its telephone number is 1‑800‑564‑6253.
Dividend Policy
On June 18, 2015, our Board of Directors declared the first dividend, which at that time was characterized as a return of capital since we have accumulated losses from operations and did not have retained earnings. This was the first distribution or return of capital since inception. The distribution was declared as $0.01 per share of common stock, payable semi-annually. The first semi-annual distribution of $0.005 per share was paid on August 17, 2015, with further distributions paid semi-annually through 2017. The latest semi-annual distribution of $0.005 per share was paid on February 14, 2018. Whether future distributions will be declared depends upon our future growth, results of operations and cash needs.
When we issued the semi-annual distributions during 2017, an assessment was made that the distribution would be treated as a return of capital, since we expected to report a net loss and did not have retained earnings. This assessment was the support required to characterize the distributions as return of capital. In light of the Tax and Jobs Act, enacted on December 22, 2017, we incurred a one-time transition tax on earnings of certain foreign subsidiaries that were previously tax-deferred. As a result of the inclusion of our subsidiaries’ foreign earnings, we now expect to report net income for tax purposes. As a result, the distributions made during 2017 have been re-characterized as taxable dividends.
Purchases of Equity Securities by the Company
The repurchase plan under which we were authorized to repurchase a portion of our stock expired on September 30, 2016. We did not make any repurchases since this time.
35
Securities Authorized for Issuance Under Equity Compensation Plans
Set out below is information as of December 31, 2017 with respect to compensation plans (including individual compensation arrangements) under which our equity securities are authorized for issuance. This information relates to our Amended and Restated Equity Incentive Plan.
|
|
|
|
|
Weighted‑average |
|
Number of securities |
|
|
|
|
|
Number of securities to |
|
exercise price per |
|
remaining available for |
|
|
|
|
|
be issued upon exercise |
|
share of outstanding |
|
future issuance under equity |
|
|
|
Plan Category |
|
of outstanding options |
|
options |
|
compensation plans |
|
|
|
Equity compensation plans approved by security holders |
|
4,905,299 |
|
$ |
2.44 |
|
5,283,137 |
|
|
Equity compensation plans not approved by security holders(1) |
|
46,796 |
|
|
C$1.79 |
|
— |
|
|
Total |
|
4,952,095 |
|
|
|
|
5,283,137 |
|
|
(1) |
In connection with the acquisition of Lexam VG Gold, on April 27, 2017, we assumed stock options covering 54,264 shares of our common stock and are exercisable at a price of C$1.79. Following the forfeiture of 7,468 options, a total of 46,796 options remained exercisable at December 31, 2017. |
The options that we assumed in connection with the 2017 acquisition were not approved by our security holders. We are not authorized to issue any additional options under any of these plans.
Performance Graph
The following graph compares our cumulative total shareholder return for the five years ended December 31, 2017 with (i) the NYSE Arca Gold Bugs Index, which is an index of companies involved in the gold industry and (ii) the NYSE Composite Index, which is a performance indicator of the overall stock market. The graph assumes a $100 investment on December 31, 2012 in our common stock and the two other stock market indices, and assumes the reinvestment of dividends, if any.
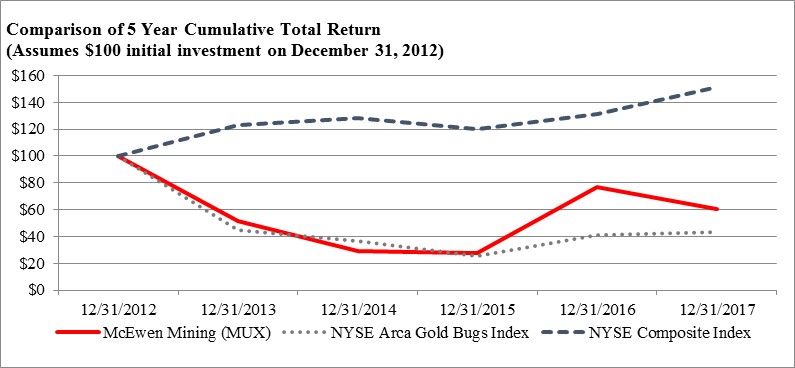
|
|
|
December 31, |
|
||||||||||||||||
|
|
|
2012 |
|
2013 |
|
2014 |
|
2015 |
|
2016 |
|
2017 |
|
||||||
|
McEwen Mining (MUX) |
|
$ |
100 |
|
$ |
51 |
|
$ |
29 |
|
$ |
28 |
|
$ |
77 |
|
$ |
60 |
|
|
NYSE Arca Gold Bugs Index |
|
|
100 |
|
|
45 |
|
|
37 |
|
|
25 |
|
|
41 |
|
|
43 |
|
|
NYSE Composite Index |
|
|
100 |
|
|
123 |
|
|
128 |
|
|
120 |
|
|
131 |
|
|
152 |
|
36
ITEM 6. SELECTED FINANCIAL DATA
The following table summarizes certain selected historical financial data about our Company for the last five years. The data has been derived from our audited consolidated financial statements for the years indicated. You should read this data in conjunction with the MANAGEMENT’S DISCUSSION AND ANALYSIS OF FINANCIAL CONDITION AND RESULTS OF OPERATIONS and our audited consolidated financial statements contained herein. All amounts are stated in thousands of U.S. dollars unless otherwise indicated.
|
|
|
For the year ended December 31, |
|
|||||||||||||
|
|
|
2017 |
|
2016 |
|
2015 |
|
2014 |
|
2013 |
|
|||||
|
|
|
(in thousands, except per share amounts) |
|
|||||||||||||
|
Operating data |
|
|
|
|
|
|
|
|
|
|
|
|
|
|
|
|
|
Revenue(1) |
|
$ |
67,724 |
|
$ |
60,388 |
|
$ |
72,956 |
|
$ |
45,303 |
|
$ |
45,982 |
|
|
(Loss) income on investment in Minera Santa Cruz S.A. |
|
|
(44) |
|
|
12,951 |
|
|
2,414 |
|
|
(5,284) |
|
|
846 |
|
|
Operating (loss) income(2) |
|
|
(26,027) |
|
|
15,347 |
|
|
(49,333) |
|
|
(410,191) |
|
|
(200,397) |
|
|
Other income (expenses) |
|
|
24 |
|
|
1,959 |
|
|
4,323 |
|
|
(8,922) |
|
|
(710) |
|
|
Net (loss) income(2) |
|
|
(10,634) |
|
|
21,055 |
|
|
(20,450) |
|
|
(311,943) |
|
|
(147,742) |
|
|
Basic (loss) income per share |
|
$ |
(0.03) |
|
$ |
0.07 |
|
$ |
(0.07) |
|
$ |
(1.05) |
|
$ |
(0.50) |
|
|
Diluted (loss) income per share |
|
|
(0.03) |
|
|
0.07 |
|
|
(0.07) |
|
|
(1.05) |
|
|
(0.50) |
|
|
|
|
As at December 31, |
|
|||||||||||||
|
|
|
2017 |
|
2016 |
|
2015 |
|
2014 |
|
2013 |
|
|||||
|
|
|
(in thousands) |
|
|||||||||||||
|
Balance sheet data |
|
|
|
|
|
|
|
|
|
|
|
|
|
|
|
|
|
Cash and cash equivalents |
|
$ |
27,153 |
|
$ |
37,440 |
|
$ |
25,874 |
|
$ |
12,380 |
|
$ |
24,321 |
|
|
Investments |
|
|
7,971 |
|
|
8,543 |
|
|
1,032 |
|
|
1,082 |
|
|
2 |
|
|
IVA taxes receivable |
|
|
5,250 |
|
|
4,304 |
|
|
10,032 |
|
|
11,739 |
|
|
11,591 |
|
|
Inventories |
|
|
31,951 |
|
|
26,620 |
|
|
14,975 |
|
|
12,404 |
|
|
8,800 |
|
|
Restricted cash |
|
|
10,000 |
|
|
— |
|
|
— |
|
|
— |
|
|
— |
|
|
Property and equipment, net |
|
|
51,046 |
|
|
14,252 |
|
|
15,759 |
|
|
17,896 |
|
|
15,143 |
|
|
Mineral property interests |
|
|
293,437 |
|
|
242,640 |
|
|
237,245 |
|
|
287,812 |
|
|
642,968 |
|
|
Investment in Minera Santa Cruz S.A. |
|
|
150,064 |
|
|
162,320 |
|
|
167,107 |
|
|
177,018 |
|
|
212,947 |
|
|
Other assets |
|
|
15,257 |
|
|
2,199 |
|
|
3,061 |
|
|
2,627 |
|
|
7,294 |
|
|
Total assets |
|
$ |
592,129 |
|
$ |
498,318 |
|
$ |
475,085 |
|
$ |
522,958 |
|
$ |
923,066 |
|
|
Current liabilities |
|
$ |
37,639 |
|
$ |
20,581 |
|
$ |
22,039 |
|
$ |
24,082 |
|
$ |
11,189 |
|
|
Deferred income and mining tax liability |
|
|
8,430 |
|
|
23,665 |
|
|
26,899 |
|
|
51,899 |
|
|
158,855 |
|
|
Capital lease liabilities, less current portion |
|
|
81 |
|
|
— |
|
|
— |
|
|
— |
|
|
— |
|
|
Other long‑term liabilities |
|
|
24,706 |
|
|
11,033 |
|
|
7,855 |
|
|
5,763 |
|
|
6,255 |
|
|
Shareholders’ equity |
|
|
521,273 |
|
|
443,039 |
|
|
418,292 |
|
|
441,214 |
|
|
746,767 |
|
|
Total liabilities and shareholders’ equity |
|
$ |
592,129 |
|
$ |
498,318 |
|
$ |
475,085 |
|
$ |
522,958 |
|
$ |
923,066 |
|
|
(1) |
Includes revenue from the sale of gold from the Black Fox mine, part of the Black Fox Complex acquired in October 2017. |
|
(2) |
Includes a non‑cash expense of $711, $50,600, $353,736, and $62,963 relating to the write‑downs of mineral property interests, and property and equipment in 2017, 2015, 2014, and 2013, respectively. Also includes a non‑cash expense of $11,777, $21,162 and $95,878 relating to the write‑down of our investment in Minera Santa Cruz S.A. in 2015, 2014 and 2013, respectively. |
37
ITEM 7. MANAGEMENT’S DISCUSSION AND ANALYSIS OF FINANCIAL CONDITION AND RESULTS OF OPERATIONS
Introduction
The following discussion updates our plan of operations as of February 21, 2018 for the foreseeable future. It also discusses our results of operations for the three fiscal years ended December 31, 2017, 2016 and 2015 and our financial condition as at December 31, 2017 and 2016, with a particular emphasis on the year ended December 31, 2017. With regard to properties or projects that are not in production, we provide some details of our plan of operation.
The discussion also presents certain non‑GAAP financial performance measures, such as earnings from mining operations, total cash costs, total cash cost per ounce, all‑in sustaining costs, all‑in sustaining cost per ounce, average realized price per ounce, and cash, investments and precious metals, that are important to management in its evaluation of our operating results and which are used by management to compare our performance to what we perceive to be peer group mining companies and relied on as part of management’s decision‑making process. Management believes these measures may also be important to investors in evaluating our performance. For a detailed description of each of the non‑GAAP financial performance measures and certain limitations inherent in such measures, please see the discussion under “Non‑GAAP Financial Performance Measures” below, on page 55.
The discussion also includes references to “Advanced-stage Properties”, which are defined as properties for which advanced studies and reports have been completed indicating the presence of mineralized material or proven and probable reserves, and that have obtained or are in the process of obtaining the required permitting. Our designation of certain properties as “Advanced-stage Properties” should not suggest that we have proven or probable reserves at those properties as defined by the SEC Industry Guide 7.
The information in this section should be read in conjunction with our consolidated financial statements and the notes thereto included in this annual report.
Reliability of Information: MSC, the owner of the San José mine, is responsible for and has supplied to us all reported results from the San José mine. The technical information regarding the San José mine contained herein is, with few exceptions as noted, based entirely on information provided to us by MSC. Our joint venture partner, a subsidiary of Hochschild Mining plc, and its affiliates other than MSC do not accept responsibility for the use of project data or the adequacy or accuracy of this document.
38
Index to Management’s Discussion and Analysis:
|
|
Page |
|
39 |
|
|
40 |
|
|
40 |
|
|
41 |
|
|
43 |
|
|
44 |
|
|
44 |
|
|
44 |
|
|
47 |
|
|
47 |
|
|
48 |
|
|
48 |
|
|
49 |
|
|
50 |
|
|
50 |
|
|
54 |
|
|
54 |
|
|
55 |
|
|
55 |
|
|
55 |
|
|
55 |
|
|
61 |
|
|
65 |
|
|
66 |
2017 Operating and Financial Highlights
2017 highlights are included below and discussed further in Consolidated Performance:
|
· |
In 2017, we entered the Canadian mining market after acquiring the Lexam group of properties, located in the Timmins gold district of Canada. Later in the year, we acquired the Black Fox Complex, comprised of the Black Fox underground gold mine, the Black Fox Stock mill, and the Grey Fox and Froome development projects, complementing the Lexam properties and enhancing our positioning in the region. |
|
· |
We began construction of the Gold Bar project after receiving the final permitting on November 8, 2017. Commercial production from Gold Bar is expected to be achieved in the first quarter of 2019. |
|
· |
We completed a Preliminary Economic Assessment (“PEA”) for the Los Azules Project, estimating an economical project and the opportunity for a sustainable and long-life open pit mine at current copper, gold and silver prices. |
|
· |
We completed two financings for total gross proceeds of $56.6 million, primarily for the purpose of funding the acquisition of the Black Fox Complex and finance the 2018 exploration program in Timmins. |
|
· |
Our consolidated gold and silver sales were $67.5 million in 2017, comprised of $55.9 million from the sale of 44,490 gold equivalent ounces by our El Gallo 1 mine, and $11.6 million from the sale of 9,422 gold ounces by our Black Fox mine. |
|
· |
We realized average prices of $1,255 and $17.40 per ounce of gold and silver, respectively, sold by the El Gallo 1 mine, and an average price of $1,233 per ounce of gold sold by the Black Fox mine. |
|
· |
Our consolidated production was 60,973 gold equivalent ounces, comprised of 46,694 gold equivalent ounces produced by the El Gallo 1 mine and 14,279 gold equivalent ounces produced by the Black Fox mine. |
|
· |
The San José mine produced 186,443 gold equivalent ounces, comprised of 100,475 ounces of gold and 6,447,657 ounces of silver, on a 100% basis; or 91,357 gold equivalent ounces, represented by 49,233 ounces of gold and 3,159,352 ounces of silver, based on the 49% share attributable to us. |
39
|
· |
The El Gallo 1 mine realized total cash costs of $791 and all-in sustaining costs of $909 per gold equivalent ounce, respectively. |
|
· |
The Black Fox mine realized total cash costs of $865 and all-in sustaining costs of $1,319 per gold equivalent ounce, respectively. |
|
· |
The San José mine realized total cash costs of $839 and all-in sustaining costs of $1,027 per gold equivalent ounce, respectively. |
|
· |
We reported a net loss of $10.6 million, or $0.03 per share for the year. |
|
· |
We realized net loss of $0.1 million from our investment in MSC, and received $12.2 million in dividends. |
|
· |
At year end, we reported $68.1 million in cash and restricted cash, investments and precious metals valued at the London P.M. Fix spot price(1), and no bank debt. Restricted cash represents proceeds from a financing that is committed to the exploration program in Ontario. |
|
(1) |
For a reconciliation of precious metals valued at the London P.M. Fix spot price and cost, please see the discussion under “Non GAAP Financial Performance Measures” below, on page 55. |
Selected Consolidated Financial and Operating Results
|
|
|
Three months ended |
|
Year ended |
|
|||||||||||
|
|
|
December 31, |
|
December 31, |
|
|||||||||||
|
|
|
2017 |
|
2016 |
|
2017 |
|
2016 |
|
2015 |
|
|||||
|
|
|
(in thousands, unless otherwise indicated) |
|
|||||||||||||
|
Gold and silver sales El Gallo 1 mine |
|
$ |
12,472 |
|
$ |
11,162 |
|
$ |
55,845 |
|
$ |
60,388 |
|
$ |
72,956 |
|
|
Gold and silver sales Black Fox mine |
|
$ |
11,620 |
|
$ |
— |
|
$ |
11,620 |
|
$ |
— |
|
$ |
— |
|
|
Income (loss) on investment in MSC, net of amortization |
|
$ |
491 |
|
$ |
(838) |
|
$ |
(44) |
|
$ |
12,951 |
|
$ |
2,414 |
|
|
Net (loss) income |
|
$ |
2,169 |
|
$ |
(4,491) |
|
$ |
(10,634) |
|
$ |
21,055 |
|
$ |
(20,450) |
|
|
Net (loss) income per common share |
|
$ |
0.01 |
|
$ |
(0.01) |
|
$ |
(0.03) |
|
$ |
0.07 |
|
$ |
(0.07) |
|
|
Consolidated gold ounces(1): |
|
|
|
|
|
|
|
|
|
|
|
|
|
|
|
|
|
Produced |
|
|
48.6 |
|
|
20.3 |
|
|
109.9 |
|
|
101.5 |
|
|
110.3 |
|
|
Sold |
|
|
33.3 |
|
|
21.9 |
|
|
102.4 |
|
|
97.6 |
|
|
105.7 |
|
|
Consolidated silver ounces(1): |
|
|
|
|
|
|
|
|
|
|
|
|
|
|
|
|
|
Produced |
|
|
927 |
|
|
839 |
|
|
3,179 |
|
|
3,304 |
|
|
3,316 |
|
|
Sold |
|
|
906 |
|
|
851 |
|
|
3,209 |
|
|
3,487 |
|
|
3,142 |
|
|
Consolidated gold equivalent ounces(1)(2): |
|
|
|
|
|
|
|
|
|
|
|
|
|
|
|
|
|
Produced |
|
|
61.0 |
|
|
31.5 |
|
|
152.3 |
|
|
145.5 |
|
|
154.5 |
|
|
Sold |
|
|
45.4 |
|
|
33.2 |
|
|
145.2 |
|
|
144.0 |
|
|
147.6 |
|
|
Silver : gold ratio(2) |
|
|
75 : 1 |
|
|
75 : 1 |
|
|
75 : 1 |
|
|
75 : 1 |
|
|
75 : 1 |
|
|
(1) |
Includes attributable production from our 49% owned San José mine. |
|
(2) |
Silver production is presented as a gold equivalent. Gold equivalent ounces calculations approximate prevailing spot prices at the beginning of the year. |
Consolidated Financial Performance
For the year ended December 31, 2017, we recorded a net loss of $10.6 million, or $0.03 per share, compared to a net income of $21.1 million, or $0.07 per share, in 2016. The $10.6 million net loss was primarily the result of the following factors:
|
· |
An increase in exploration expenditures incurred at Los Azules project; |
|
· |
A decrease in the profitability at the El Gallo 1 mine, due to higher production costs applicable to sales, higher number of ounces processed, and the operational challenges from the mechanical failure that the crushing circuit suffered during the third quarter; |
|
· |
Production costs applicable to sales at the Black Fox mine were substantially equal to revenue from gold and silver sales, resulting in a negligible profit margin; |
40
|
· |
A decrease in net income reported by MSC, due to the loss of government tax incentives since late 2016, coupled with higher production costs applicable to sales, as a result of higher labor costs and the impact of inflation; |
|
· |
An increase of General and Administrative expenses due to the two acquisitions and financings completed in the year; and |
|
· |
An increase in recoveries of income taxes as a result of the U.S. and Argentina Government tax reforms, which significantly reduced deferred tax liabilities. |
Our cash, cash equivalents and restricted cash in 2017 was $37.2 million, which is a slight decrease from the $37.4 million in 2016.
Results of Consolidated Operations
Year ended December 31, 2017 compared to 2016
Revenue. Consolidated gold and silver sales increased by $7.1 million, or 12%, to $67.5 million for the year ended December 31, 2017, from $60.4 million in 2016, mainly due to $11.6 million gold sales contributed by the Black Fox mine, which was acquired in October 2017, partially offset by a $4.5 million decrease in gold and silver sales reported by the El Gallo 1 mine, when compared to 2016, as a result of fewer ounces sold.
Production costs applicable to sales. Consolidated production costs applicable to sales increased to $45.2 million in 2017 from $28.1 million in 2016, due to $9.9 million production costs attributable to the Black Fox mine, which as noted above was acquired in October 2017, and $7.2 million higher production costs reported by the El Gallo mine. The increase in production costs applicable to sales at the El Gallo 1 mine was expected, as the mine approaches the end of its life. In addition, the increase in the number of tonnes processed, coupled with higher number of waste tonnes removed in the year, as well as costs incurred due to the mechanical failure of the crushing circuit that occurred during the third quarter of 2017 further contributed to the increase in production costs at the El Gallo 1 mine.
Operating Income (Expenses)
Mine development costs, which relate to engineering and development expenditures incurred at our advanced-stage properties, changed slightly to $3.8 million in 2017 from $3.9 million in 2016. Mine development costs in 2017 were comprised of $3.1 million at the Gold Bar project in Nevada, and $0.7 million at the El Gallo 2 project in Mexico.
Exploration costs in 2017 increased to $17.7 million from $8.0 million in 2016, mainly due to the $6.3 million higher exploration expenditures incurred at the Los Azules project. These incremental costs for Los Azules were necessary to complete the PEA. In 2017, we also spent $5.6 million on exploration at our Mexican properties, $2.1 million in Nevada, $1.6 million in Timmins, and $0.5 million in corporate exploration charges.
Property holding costs increased to $3.9 million from $3.5 million year-over-year mainly as a result of higher costs for the Mexican properties, reflecting the Mexican peso appreciation against the U.S. dollar, partly offset by a decrease in property costs incurred in Argentina, compared to 2016.
General and administrative expenses increased to $18.9 million in 2017, from $12.7 million in 2016, mainly as a result of acquisition and financing costs associated with our two acquisitions completed in the year, and higher personnel costs when compared to the 2016 period.
Income from our investment in MSC decreased from $13.0 million in 2016 to a $0.1 million loss in 2017, primarily due to the loss of government tax incentives in late 2016. MSC’s decrease in gold and silver sales, coupled with higher production costs applicable to sales, and the increase in exploration costs and capital expenditures, also contributed to the overall decrease in income. Please refer to the section Results of Operations – MSC below, for further details.
An impairment charge of $0.7 million was recorded in 2017, to write-down property and equipment in Mexico.
The revision of estimate and accretion of asset retirement obligation increased to $2.1 million in 2017, from $0.6 million in 2016 primarily from an increase in the revision of the Timmins obligation.
41
Other income (expenses)
Other income decreased to $0.1 million in 2017 from $2.0 million in 2016, primarily due to higher interest expense recorded in 2017, coupled with the increase in unrealized loss on derivatives; which was partly offset by a $0.8 million increase in gain on sale of marketable securities reported during the year.
Recovery of income taxes
Recovery of income taxes increased by $11.6 million, from $3.7 million in 2016 to $15.4 million in 2017, as a result of the U.S. and Argentina Government tax reforms, which will significantly reduce future taxes, along with fluctuations in tax benefits related to exploration spending at Los Azules, and the devaluation of the Argentina peso, during the year. Also contributing to the deferred tax recovery was the recognition of a deferred tax asset, to the extent of the deferred tax liability recognized on the acquired mineral property interests of the Gold Bar project, in the amount of $6.4 million
Year ended December 31, 2016 compared to 2015
Revenue. Gold and silver sales for the year ended December 31, 2016 decreased by $12.6 million, or 17%, to $60.4 million from $73.0 million in 2015 due to a 22% decrease in gold equivalent ounces sold during the year at our El Gallo 1 mine, partially offset by a 6% and 4% increase in the average realized prices of gold and silver, respectively, during the year. The decrease in ounces sold, in turn, reflects lower grade processed in 2016 as the mine nears the end of its life. The El Gallo 1 mine was our only operating mine in 2016.
Production costs applicable to sales. Production costs applicable to sales at the El Gallo 1 mine decreased by $6.5 million, or 19%, to $28.1 million in the year ended December 31, 2016, compared to $34.6 million in 2015, in line with the 22% decrease in gold equivalent ounces sold mentioned above.
Operating Income (Expenses)
Mine development costs, increased to $3.9 million in 2016 from $1.2 million in 2015, and was comprised of $2.7 million at Gold Bar project in Nevada, and $1.2 million at the El Gallo 2 project in Mexico. Please refer to the Advanced-stage properties section for a complete discussion on these costs.
Exploration costs in 2016 decreased by $0.8 million or 10% to $8.0 million in 2016 from $8.8 million in 2015. During 2016, we spent $4.1 million in explorations at our Mexican properties, $2.0 million in Nevada, $1.6 million at Los Azules, and $0.2 million in corporate exploration charges. For a complete discussion on exploration costs, please refer to the Exploration properties section below.
Property holding costs decreased by $0.8 million or 18% year-over-year as a result of the reduced number of claims held in 2016, compared to 2015, coupled with the decline in the Mexican peso.
General and administrative expenses increased by 6% in 2016, to $12.7 million from $12.0 million in 2015, because of changes to senior management, partly offset by the devaluation of the Canadian dollar, Mexican peso and Argentine peso against the U.S. dollar during 2016.
Income from our investment in MSC increased by $10.5 million, from $2.4 million in 2015 to $13.0 million in 2016, due to the strong performance of the San José mine in 2016. Please refer to the section Results of Operations – MSC below, for further details.
No impairment charges were recorded in 2016, compared to impairment charges of $11.8 million related to our investment in MSC, and $50.6 million for mineral property interests and property and equipment, recorded in 2015.
Other income (expenses)
Other income decreased to $2.0 million in 2016 from $4.3 million in 2015, mainly due to the net result of lower interest and other income, foreign exchange gain and the impairment of marketable securities, which were partly offset by the unrealized gain on derivatives reported during the year. Interest and other income decreased by $1.6 million in 2016 due to an absence of the portion of insurance proceeds related to the theft of gold concentrate stolen from our refinery in Mexico. In addition, foreign exchange gain decreased by $1.3 million mainly because of the devaluation of the Mexican
42
peso affecting the VAT receivable balance held in the year. Finally, we recognized a $1.4 million gain on derivatives from our ownership of certain warrants in a publicly listed entity, acquired in 2016.
Recovery of income taxes
Recovery of income taxes decreased by $20.8 million, from $24.6 million in 2015 to $3.7 million in 2016 as no impairment related tax recoveries were recognized in 2016 compared to 2015.
Liquidity and Capital Resources
We had working capital of $49.2 million at December 31, 2017, which consisted of $86.9 million of current assets and $37.6 million of current liabilities, compared to $58.0 million working capital reported at year-end 2016. Within current assets we have $10.0 million of restricted cash, which represents funds committed to the exploration program in Ontario, as a result of completing our flow-through financing. The $8.8 million decrease in working capital was the net result of increased cash used in operating activities, from higher production and exploration costs incurred in the year, coupled with the acquisition of the Black Fox Complex, and property, plant and equipment, which were partly offset by the proceeds received from the equity offerings closed during the year. Overall, our cash balance (including restricted cash) decreased slightly to $37.2 million in 2017, from $37.4 million in 2016.
We believe that our working capital at year-end 2017 is sufficient to satisfy any non-discretionary obligations due in the next 12 months, and to fund ongoing operations and corporate activities over the next 12 months. However, we continue to evaluate capital and development expenditure requirements to advance Gold Bar, Black Fox, our other Timmins projects, and El Gallo 2, as well as exploration expenditures for all our operations and projects. If we make a positive decision to pursue one or more of these initiatives, the expenditures incurred may significantly exceed our working capital. In such case, we would explore several financing methods, which may include incurring debt, issuing additional equity, equipment leasing, and other forms of financing.
Net cash used in operations was $15.4 million for 2017, while net cash provided by operations was $25.2 million and $15.6 million for 2016, and 2015, respectively. The significant changes from one year to the next are summarized as follows:
|
· |
$95.9 million cash paid to suppliers and employees in 2017, compared to $52.3 million in 2016, and $55.3 million in 2015, due to significantly higher production, exploration and other expenses; |
|
· |
$12.2 million dividend received from MSC in 2017, compared to $17.7 million in 2016 and $0.5 million in 2015; |
|
· |
$5.9 million VAT collected in Mexico in 2017, compared to $9.5 million in 2016, and $6.0 million in 2015, and; |
|
· |
$67.7 million cash received from gold and silver sales in 2017, compared to $59.5 million in 2016 and $70.2 million in 2015. |
Cash used in investing activities was $34.5 million in 2017, compared to $10.1 million in 2016 and $1.9 million in 2015, primarily due to the following factors:
|
· |
$27.3 million incurred for the acquisition of the Black Fox Complex, and $0.8 million for the acquisition of Lexam VG Gold; |
|
· |
Additions to mineral property interests of $3.5 million in 2017, compared to $6.0 million spent in 2016 and $nil in 2015; |
|
· |
Additions to property and equipment of $5.1 million in 2017, primarily at our Gold Bar project, compared to $1.2 million and $0.8 million in 2016 and 2015, respectively; |
|
· |
$2.2 million proceeds from the sale of investments during the year ended December 31, 2017, compared to $0.5 million in 2016 and $nil in 2015; |
|
· |
No investments in marketable securities were incurred in 2017, compared to $4.4 million and $1.1 million used for investing in 2016 and 2015, respectively, and; |
43
|
· |
We collected $nil million from the disposal of property and equipment in 2017, compared to $1.0 million and $nil in 2016 and 2015, respectively. |
Cash provided by financing activities was $49.7 million in 2017, compared to $3.2 million used in 2016 and $0.1 million provided by financing activities in 2015, primarily because of:
|
· |
Net proceeds of $43.2 million received from the issuance of shares and warrants in connection with the equity offering completed on September 22, 2017, while no similar financing occurred in the years 2016 and 2015; |
|
· |
Net proceeds of $9.4 million from the issuance of flow-through common shares completed on December 19, 2017, compared to no similar financing occurring in the years 2016 and 2015; |
|
· |
The $3.1 million return of capital to our shareholders in 2017, compared to $3.0 million in 2016, and $1.5 million in 2015; |
|
· |
$nil repayment of the bank credit facility obtained by our Mexican subsidiary, compared to $3.4 million and $1.8 million repaid in 2016 and 2015, respectively; |
|
· |
$nil share repurchase for the year ended December 31, 2017, compared to $0.6 million in share repurchases in 2016 and $1.8 million in 2015, and; |
|
· |
$0.1 million proceeds from stock options exercised in 2017, compared to $3.7 million proceeds from options exercised in 2016 and $nil in 2015. |
Results of Operations—Mexico Segment
The Mexico segment includes: the El Gallo 1 mine, the El Gallo 2 advanced-stage project, and exploration properties neighboring the El Gallo area.
The El Gallo 1 mine is a gold operating unit, 100% owned by us, located in Sinaloa, Mexico.
The El Gallo 1 mine is a mature operation, of which we have mined and depleted various pits during its operating life. The current operations are producing from sections of higher waste to ore stripping ratios, deeper ore and sulfide transitional deposits typical of late stage operations. Exploration work is continuing with the objective of developing additional resources to extend the mine life beyond 2018. However, oxide mining activities from the existing open pits will cease in the second quarter of 2018 while leaching activities will continue until 2020, or later, as long as it remains economical to do so.
44
Overview
The following table sets out production and sales totals, for the El Gallo 1 mine for the three months ended December 31, 2017 and 2016, and for the years ended December 31, 2017, 2016, and 2015:
|
|
|
Three months ended |
|
Year ended |
|
|||||||||||
|
|
|
December 31, |
|
December 31, |
|
|||||||||||
|
|
|
2017 |
|
2016 |
|
2017 |
|
2016 |
|
2015 |
|
|||||
|
|
|
(in thousands, unless otherwise indicated) |
|
|||||||||||||
|
Tonnes of mineralized material mined |
|
|
373 |
|
|
347 |
|
|
1,160 |
|
|
1,048 |
|
|
1,209 |
|
|
Average grade gold (gpt) |
|
|
2.19 |
|
|
1.14 |
|
|
1.77 |
|
|
1.32 |
|
|
3.37 |
|
|
Tonnes of mineralized material processed |
|
|
495 |
|
|
320 |
|
|
1,399 |
|
|
1,108 |
|
|
1,128 |
|
|
Average grade gold (gpt) |
|
|
2.59 |
|
|
1.46 |
|
|
2.07 |
|
|
2.14 |
|
|
3.41 |
|
|
Gold ounces: |
|
|
|
|
|
|
|
|
|
|
|
|
|
|
|
|
|
Produced |
|
|
19.8 |
|
|
7.6 |
|
|
46.4 |
|
|
54.9 |
|
|
63.0 |
|
|
Sold |
|
|
9.7 |
|
|
9.1 |
|
|
44.2 |
|
|
48.7 |
|
|
62.2 |
|
|
Silver ounces: |
|
|
|
|
|
|
|
|
|
|
|
|
|
|
|
|
|
Produced |
|
|
6.0 |
|
|
3.9 |
|
|
18.6 |
|
|
25.3 |
|
|
29.9 |
|
|
Sold |
|
|
1.7 |
|
|
1.0 |
|
|
23.7 |
|
|
17.6 |
|
|
35.9 |
|
|
Gold equivalent ounces(1): |
|
|
|
|
|
|
|
|
|
|
|
|
|
|
|
|
|
Produced |
|
|
19.9 |
|
|
7.7 |
|
|
46.7 |
|
|
55.3 |
|
|
63.4 |
|
|
Sold |
|
|
9.7 |
|
|
9.2 |
|
|
44.5 |
|
|
48.9 |
|
|
62.7 |
|
|
Net sales |
|
$ |
12,472 |
|
$ |
11,162 |
|
$ |
55,845 |
|
$ |
60,388 |
|
$ |
72,956 |
|
|
Average realized price ($/ounce)(2): |
|
|
|
|
|
|
|
|
|
|
|
|
|
|
|
|
|
Gold |
|
$ |
1,280 |
|
$ |
1,219 |
|
$ |
1,255 |
|
$ |
1,235 |
|
$ |
1,163 |
|
|
Silver |
|
$ |
16.75 |
|
$ |
17.52 |
|
$ |
17.40 |
|
$ |
16.77 |
|
$ |
16.15 |
|
|
London average price ($/ounce): |
|
|
|
|
|
|
|
|
|
|
|
|
|
|
|
|
|
P.M. Fix Gold |
|
$ |
1,276 |
|
$ |
1,221 |
|
$ |
1,257 |
|
$ |
1,251 |
|
$ |
1,160 |
|
|
Fix Silver |
|
$ |
16.73 |
|
$ |
17.19 |
|
$ |
17.05 |
|
$ |
17.14 |
|
$ |
15.68 |
|
|
Silver : gold ratio(1) |
|
|
75 : 1 |
|
|
75 : 1 |
|
|
75 : 1 |
|
|
75 : 1 |
|
|
75 : 1 |
|
|
(1) |
Silver production presented as a gold equivalent. Gold equivalent ounces calculations approximate prevailing spot prices at the beginning of the year. |
|
(2) |
Average realized price is a non‑GAAP financial performance measures with no standardized definition under U.S. GAAP. See “Non‑GAAP Financial Performance Measures” on page 55 for additional information, including definitions of this term. |
Tonnes mined represent tonnes of mineralized material extracted, while tonnes processed represent tonnes of mineralized material crushed and placed on the leach pads. The difference between tonnes mined of 1,160,274 (2016 – 1,048,483) and tonnes processed of 1,399,210 (2016 – 1,107,573) correspond to ore previously mined which was consumed from the stockpiled inventory. Due to long process cycles, actual recoveries from the heap are difficult to measure and may fluctuate significantly based on the timing, quantity and metallurgical attributes of new mineralized material placed on the leach pads, among other variables. The cumulative recovery rate realized for gold production from September 1, 2012 (start of production at the El Gallo 1 mine) to December 31, 2017 is estimated at 57% (2016 – 59%).
Gold and silver production
2017 compared to 2016
|
· |
While a decrease in production was expected, the drop exceeded our expectations by 3,306 gold equivalent ounces, since we commenced mining from the higher strip deeper pits, with an increased amount of sulfide transitional mineralization during 2017. In addition, operational issues affecting the crushing circuit during the third quarter of 2017 resulted in additional challenges to our Mexican operation; however successful mining to the ultimate bottom of the Samaniego pit and the addition of a portable crusher to increase the normal crushing capacity available during the fourth quarter of 2017, the El Gallo 1 mine was able to partially compensate for the production shortfall. |
|
· |
Average grades of material processed during the year ended December 31, 2017 were 2.07 g/t, compared to 2.14 g/t in 2016, while for the fourth quarter of 2017, grades of material processed averaged 2.59 g/t compared to 1.46 g/t obtained in the same quarter in 2016. |
45
2016 compared to 2015
|
· |
In 2016, we produced 55,266 gold equivalent ounces, compared to 63,366 gold equivalent ounces in 2015. The decrease in gold and silver production in 2016 was expected, mainly due to a decrease in the grades of mineral mined, as the high-grade Samaniego pit was nearly mined out in early 2016, coupled with lower number of tonnes processed during the year. |
|
· |
Average grades of material processed during the year ended December 31, 2016 were 2.14 g/t, compared to 3.41 g/t in 2015, while for the fourth quarter of 2016, grades of material processed averaged 1.46 g/t compared to 4.20 g/t obtained in the same quarter in 2015. |
Gold and silver sales
2017 compared to 2016
|
· |
Revenue from sale of gold and silver at the El Gallo 1 mine decreased by 8% to $55.8 million, from $60.4 million in the same period of 2016, due to a 9% decrease in gold equivalent ounces sold in 2017, slightly offset by a 2% and 4% increase in average realized prices of gold and silver, respectively, when compared to 2016. |
|
· |
The average realized price of gold and silver were $1,255 and $17.40 in 2017, compared to $1,235 and $16.77 in 2016. In comparison, the London P.M. Fix Gold average was $1,257 during 2017 and $1,251 during 2016, while the London Fix Silver average was $17.05 for 2017 and $17.14 for 2016. |
2016 compared to 2015
|
· |
Revenue from the sale of gold and silver at our El Gallo 1 mine decreased by 17% to $60.4 million in 2016, compared to $73.0 million in 2015, due to a 22% decrease in the number of gold equivalent ounces sold in 2016, offset by a 6% and 4% increase in average realized sale prices of gold and silver, respectively. The decrease in ounces sold reflected significantly lower grades mined and processed in 2016. |
|
· |
The average realized price of gold and silver were $1,235 and $16.77 in 2016, compared to $1,163 and $16.15 in 2015. In comparison, the London P.M. Fix Gold average was $1,251 during 2016 and $1,160 during 2015, while the London Fix Silver average was $17.14 for 2016 and $15.68 for 2015. |
Total Cash Costs and All‑In Sustaining Costs
The following table presents a summary of our total cash cost, cash cost per ounce, all-in sustaining costs and all-in sustaining costs per ounce of gold equivalent at El Gallo 1 mine:
|
|
|
Three months ended |
|
Year ended |
|||||||||||
|
|
|
December 31, |
|
December 31, |
|||||||||||
|
|
|
2017 |
|
2016 |
|
2017 |
|
2016 |
|
2015 |
|||||
|
|
|
(in thousands, unless otherwise stated) |
|||||||||||||
|
El Gallo 1 mine |
|
|
|
|
|
|
|
|
|
|
|
|
|
|
|
|
Total cash costs(1) |
|
$ |
11,064 |
|
$ |
6,399 |
|
$ |
35,198 |
|
$ |
25,609 |
|
$ |
27,607 |
|
Total cash cost per gold equivalent ounce sold ($/ounce)(1)(2) |
|
$ |
1,135 |
|
$ |
699 |
|
$ |
791 |
|
$ |
524 |
|
$ |
440 |
|
All‑in sustaining costs(1) |
|
$ |
12,189 |
|
$ |
7,615 |
|
$ |
40,437 |
|
$ |
29,818 |
|
$ |
36,439 |
|
All‑in sustaining cost per gold equivalent ounce sold ($/ounce)(1)(2) |
|
$ |
1,251 |
|
$ |
832 |
|
$ |
909 |
|
$ |
610 |
|
$ |
581 |
|
Silver : gold ratio(2) |
|
|
75 : 1 |
|
|
75 : 1 |
|
|
75 : 1 |
|
|
75 : 1 |
|
|
75 : 1 |
|
(1) |
Total cash cost, total cash cost per ounce, all‑in sustaining costs, and all-in sustaining costs per ounce are non‑GAAP financial performance measures with no standardized definition under U.S. GAAP. See “Non‑GAAP Financial Performance Measures” on page 55 for additional information, including definitions of these terms. |
|
(2) |
Silver production presented as a gold equivalent. Gold equivalent ounces calculations approximate prevailing spot prices at the beginning of the year. |
46
2017 compared to 2016
Total cash costs per gold equivalent ounce for the year ended December 31, 2017 were $791 compared to $524 for the year of 2016. On an aggregate basis, total cash costs at the El Gallo 1 mine increased by 37% to $35.2 million in 2017, compared to $25.6 million in 2016. Higher total cash costs per gold equivalent ounce were the result of higher mining costs due to an increased strip ratio and tonnes mined, and higher processing costs due to increased tonnage treated and a decrease in recoveries. In addition, haulage costs from mining the Central 2 and Lupita pits are higher since they are located at a greater distance from the leach pad than the Samaniego pit. Finally, the increase in peso denominated production costs from the appreciation of the Mexican peso against the U.S. dollar also contributed to the higher total cash costs reported, when compared to 2016.
During the year ended December 31, 2017, the El Gallo 1 mine reported all-in sustaining costs of $909 per gold equivalent ounce, compared to $610 in 2016. Aggregate all-in sustaining costs from the El Gallo 1 mine in 2017 also increased, to $40.4 million from $29.8 million in 2016, due to higher cash costs noted above, coupled with higher exploration expenditures incurred in our efforts to extend the El Gallo 1 life of mine, and a slight increase in capital expenditures incurred in the year.
2016 compared to 2015
On a per ounce basis, total cash costs per gold equivalent ounce sold at the El Gallo 1 mine increased to $524 in 2016 from $440 in 2015. The increase was a result of slightly higher number of tonnes processed, from which lower mineral grades were obtained during 2016, that resulted in total cash costs spread over a fewer number of ounces produced and sold. This was partly offset by lower crushing and plant processing expenditures resulting from our efforts to contain costs, coupled with the devaluation of the Mexican peso against the U.S. dollar, when compared to 2015.
On an aggregate basis, total cash costs at the El Gallo 1 mine were $25.6 million in 2016, compared to $27.6 million in 2015, with the decrease mainly driven by the lower number of gold equivalent ounces sold when compared to 2015.
All‑in sustaining cost per gold equivalent ounce in 2016 was $610 compared to $581 per ounce in 2015, or $29.8 million in 2016 and $36.4 million in 2015, on an aggregate basis. The decrease in aggregate all-in sustaining costs was driven by the factors above, coupled with higher capital expenditures of a sustaining nature, including the expansion of our leach pad.
Advanced-stage Properties - El Gallo 2
El Gallo 2 Project
During 2017 we spent $0.7 million on studies for the advancement of feasibility and development of the El Gallo 2 project. These studies are designed to identify opportunities to reduce initial capital investment required to develop and start the project and to reduce the estimated operating costs while minimizing the impact on estimated production. Potential changes include different mill configurations, mine plans, and tailings deposition methods.
A review of the $186.9 million capital expenditures estimated in the El Gallo 2 initial feasibility study is currently underway. An updated pre-feasibility study is expected to be completed in the second quarter of 2018.
During 2017 we incurred $1.6 million in exploration and $0.7 million in the advancement of feasibility and development of the El Gallo 2, respectively. Our 2018 budget for El Gallo 2 is $3.4 million to cover exploration, feasibility advancement, and limited development of El Gallo 2 project.
Exploration Activities – Mexico
El Gallo area, Sinaloa, México
The El Gallo area is being explored in an effort to extend the life of mine of El Gallo 1, to assess and expand known zones of mineralization and to generate new drill targets within the district for significant new discoveries. In 2017, our exploration activities included a multi-element soil geochemical survey carried out over two large high priority target areas, which were identified based on results of all available geo-information including new spectral study completed at the end of the second quarter of the year. Drilling continued around the mine site, focusing on the north-west extension
47
of the Samaniego open pit and on the Lupita-Central trend. Additionally, reverse-circulation drilling continued around the mine site and on new targets identified from the soil geochemical survey in the area surrounding El Gallo 2.
Our 2017 budget for exploration was $5.9 million, from which we spent $5.6 million, including near-mine and district scale exploration. Our 2018 budget is $1.1 million.
Results of Operations - Canada Segment
The Canada segment is composed of the recently acquired Black Fox Complex, which consists of the fully operational Black Fox gold mine, the Black Fox-Stock mill, and the Grey Fox and Froome advanced-stage exploration projects, and other gold exploration properties located in Timmins, Ontario, Canada.
The Black Fox underground gold mine initially operated from 1997 to 2001. It was re-commissioned in 2009 and has operated continuously since then, producing a total of 821,000 ounces of gold initially from an open pit, which is now depleted, and subsequently from the underground mine. The Black Fox property is located along a prime 4.5 mile (7 km) section of the Destor-Porcupine Fault, which is host to many world-class gold deposits. The property is already well endowed with gold mineralization and has very attractive geological potential.
Overview
The following table sets out production and sales totals, for the Black Fox mine for the three months and year ended December 31, 2017. Since the mine was acquired in October 2017, no data for comparable periods is available:
|
|
|
Three months ended |
|
Year ended |
|
|||||||||||
|
|
|
December 31, |
|
December 31, |
|
|||||||||||
|
|
|
2017 |
|
2016 |
|
2017 |
|
2016 |
|
2015 |
|
|||||
|
|
|
(in thousands, unless otherwise indicated) |
|
|||||||||||||
|
Tonnes of mineralized material mined |
|
|
81 |
|
|
— |
|
|
81 |
|
|
— |
|
|
— |
|
|
Average grade gold (gpt) |
|
|
6.20 |
|
|
— |
|
|
6.20 |
|
|
— |
|
|
— |
|
|
Tonnes of mineralized material processed |
|
|
79 |
|
|
— |
|
|
79 |
|
|
— |
|
|
— |
|
|
Average grade gold (gpt) |
|
|
6.47 |
|
|
— |
|
|
6.47 |
|
|
— |
|
|
— |
|
|
Gold ounces: |
|
|
|
|
|
|
|
|
|
|
|
|
|
|
|
|
|
Produced |
|
|
14.3 |
|
|
— |
|
|
14.3 |
|
|
— |
|
|
— |
|
|
Sold |
|
|
9.4 |
|
|
— |
|
|
9.4 |
|
|
— |
|
|
— |
|
|
Silver ounces: |
|
|
|
|
|
|
|
|
|
|
|
|
|
|
|
|
|
Produced |
|
|
0.8 |
|
|
— |
|
|
0.8 |
|
|
— |
|
|
— |
|
|
Sold |
|
|
— |
|
|
— |
|
|
— |
|
|
— |
|
|
— |
|
|
Gold equivalent ounces(1): |
|
|
|
|
|
|
|
|
|
|
|
|
|
|
|
|
|
Produced |
|
|
14.3 |
|
|
— |
|
|
14.3 |
|
|
— |
|
|
— |
|
|
Sold |
|
|
9.4 |
|
|
— |
|
|
9.4 |
|
|
— |
|
|
— |
|
|
Net sales |
|
$ |
11,620 |
|
$ |
— |
|
$ |
11,620 |
|
$ |
— |
|
$ |
— |
|
|
Average realized price ($/ounce)(2): |
|
|
|
|
|
|
|
|
|
|
|
|
|
|
|
|
|
Gold |
|
$ |
1,233 |
|
$ |
— |
|
$ |
1,233 |
|
$ |
— |
|
$ |
— |
|
|
Silver |
|
$ |
— |
|
$ |
— |
|
$ |
— |
|
$ |
— |
|
$ |
— |
|
|
London average price ($/ounce): |
|
|
|
|
|
|
|
|
|
|
|
|
|
|
|
|
|
P.M. Fix Gold |
|
$ |
1,276 |
|
$ |
1,221 |
|
$ |
1,257 |
|
$ |
1,251 |
|
$ |
1,160 |
|
|
Fix Silver |
|
$ |
16.73 |
|
$ |
17.19 |
|
$ |
17.05 |
|
$ |
17.14 |
|
$ |
15.68 |
|
|
Silver : gold ratio(1) |
|
|
75 : 1 |
|
|
75 : 1 |
|
|
75 : 1 |
|
|
75 : 1 |
|
|
75 : 1 |
|
|
(1) |
Silver production presented as a gold equivalent. Gold equivalent ounces calculations approximate prevailing spot prices at the beginning of the year. |
|
(2) |
Average realized price is a non‑GAAP financial performance measures with no standardized definition under U.S. GAAP. See “Non‑GAAP Financial Performance Measures” on page 55 for additional information, including definitions of this term. |
2017 Gold and silver production and sales
|
· |
Production for the quarter ended December 31, 2017 was 14,279 gold equivalent ounces consisting of 14,268 ounces of gold and 804 ounces of silver. Production obtained from the Black Fox mine exceeded the 10,000 gold equivalent ounces planned after the acquisition, as a result of higher average grades obtained than expected. |
48
|
· |
Sales revenue from the Black Fox mine was $11.6 million as a result of the sale of 9,422 ounces of gold during the year. The average realized price of gold was $1,233 per ounce, which compares to the London P.M. Fix Gold average of $1,276 noted during the last quarter of 2017. |
Total Cash Costs and All-In Sustaining Costs
The following table presents a summary of our total cash cost, cash cost per ounce, all-in sustaining costs and all-in sustaining costs per ounce of gold equivalent at the Black Fox mine:
|
|
|
|
Three months ended |
|
Year ended |
|||||||||||||||
|
|
|
|
December 31, |
|
December 31, |
|||||||||||||||
|
|
|
2017 |
|
|
2016 |
|
2017 |
|
2016 |
|
2015 |
|||||||||
|
|
|
|
(in thousands, unless otherwise stated) |
|||||||||||||||||
|
Total cash costs(1) |
|
$ |
8,151 |
|
|
$ |
— |
|
$ |
8,151 |
|
$ |
— |
|
$ |
— |
||||
|
Total cash cost per gold equivalent ounce sold ($/ounce)(1)(2) |
|
$ |
865 |
|
|
$ |
— |
|
$ |
865 |
|
$ |
— |
|
$ |
— |
||||
|
All‑in sustaining costs(1) |
|
$ |
12,432 |
|
|
$ |
— |
|
$ |
12,432 |
|
$ |
— |
|
$ |
— |
||||
|
All‑in sustaining cost per gold equivalent ounce sold ($/ounce)(1)(2) |
|
$ |
1,319 |
|
|
$ |
— |
|
$ |
1,319 |
|
$ |
— |
|
$ |
— |
||||
|
Silver : gold ratio(2) |
|
|
75 : 1 |
|
|
|
75 : 1 |
|
|
75 : 1 |
|
|
75 : 1 |
|
|
75 : 1 |
||||
|
1) |
Total cash cost, total cash cost per ounce, all‑in sustaining costs, and all-in sustaining costs per ounce are non‑GAAP financial performance measures with no standardized definition under U.S. GAAP. See “Non‑GAAP Financial Performance Measures” on page 55 for additional information, including definitions of these terms |
|
2) |
Silver production presented as a gold equivalent. Gold equivalent ounces calculations approximate prevailing spot prices at the beginning of the year. |
Total cash costs per gold equivalent ounce for the quarter ended December 31, 2017 was $865. On an aggregate basis, total cash cost recorded by the Black Fox mine was $8.2 million and mostly comprised underground mining costs as well as milling expenditures incurred in the quarter.
During the year ended December 31, 2017, the Black Fox mine reported all-in sustaining costs of $1,319 per gold equivalent ounce. Further, the aggregate all-in sustaining cost recorded in the period was $12.4 million, and in addition to cash costs included $3.3 million for underground mine development, $0.6 million for exploration and study costs, and $0.1 million in capital expenditures incurred during the three months ended December 31, 2017.
For 2018, we have budgeted a total of $5.3 million for sustaining and capital expenditure activities at the Black Fox mine.
Exploration Activities – Timmins
Black Fox mine and advanced-stage explorations projects
Underground exploration and definition drilling programs at the Black Fox mine are currently underway with the objective to upgrade and expand resources in the Deep Central, High Quartz Vein, Far West and Far East Zones, at depths ranging from approximately 1,640 ft. to 2,788 ft. (500 m to 850 m). Exploration and definition drilling in the upper mine is focused on infill and extensions of remnant resource/reserves, and new targets including connector between the east and west mining zones, up plunge extension of the Central Zone to the 390 m Level, and flanking secondary plunge extensions outside the mined out stope areas.
Planned exploration drilling will also focus on expanding the gold resources at depth and along strike at the Black Fox Mine and the Froome deposit, which is located 800 m west of the mine. Multiple exploration targets exist on the Black Fox and Stock properties. We are planning to begin drilling in early 2018.
On April 26, 2017, we completed the acquisition of Lexam. With this strategic acquisition, we added several assets including the Fuller, Davidson-Tisdale, Buffalo Ankerite, and Paymaster projects, bringing the potential for development expansion through exploration.
Trade-off studies and evaluation work on the properties are currently in progress.
49
Results of Operations - MSC Segment
The MSC segment is composed of MSC, the operator of the San José mine, located in Argentina.
Overview
The following table sets out production totals, sales totals, total cash costs and all‑in sustaining costs (on a co‑product and gold equivalent basis) for the San José mine for the periods presented, on a 100% basis. Also included below are the production figures on a 49% attributable basis. As stated in Item 8. Financial Statements and Supplementary Data, Note 2, Summary of Significant Accounting Policies—Investments, we account for investments over which we exert significant influence but not control through majority ownership using the equity method of accounting. In applying the equity method of accounting to our investment in MSC, MSC’s financial statements, which are originally prepared by MSC in accordance with International Financial Reporting Standards as issued by the International Accounting Standards Board, have been adjusted to conform with U.S. GAAP. As such, the summarized financial data presented under this heading is in accordance with U.S. GAAP.
|
|
|
Three months ended |
|
Year ended |
|
|||||||||||
|
|
|
December 31, |
|
December 31, |
|
|||||||||||
|
|
|
2017 |
|
2016 |
|
2017 |
|
2016 |
|
2015 |
|
|||||
|
|
|
(in thousands, except otherwise stated) |
|
|||||||||||||
|
San José Mine—100% basis |
|
|
|
|
|
|
|
|
|
|
|
|
|
|
|
|
|
Tonnes of ore mined |
|
|
152 |
|
|
147 |
|
|
527 |
|
|
533 |
|
|
507 |
|
|
Average grade (gpt): |
|
|
|
|
|
|
|
|
|
|
|
|
|
|
|
|
|
Gold |
|
|
7.1 |
|
|
6.7 |
|
|
7.0 |
|
|
6.7 |
|
|
6.7 |
|
|
Silver |
|
|
492 |
|
|
490 |
|
|
483 |
|
|
512 |
|
|
505 |
|
|
Tonnes of ore processed |
|
|
145 |
|
|
147 |
|
|
533 |
|
|
536 |
|
|
532 |
|
|
Average grade (gpt): |
|
|
|
|
|
|
|
|
|
|
|
|
|
|
|
|
|
Gold |
|
|
7.3 |
|
|
6.3 |
|
|
6.7 |
|
|
6.3 |
|
|
6.4 |
|
|
Silver |
|
|
465 |
|
|
418 |
|
|
436 |
|
|
444 |
|
|
448 |
|
|
Average recovery (%): |
|
|
|
|
|
|
|
|
|
|
|
|
|
|
|
|
|
Gold |
|
|
87.8 |
|
|
86.9 |
|
|
87.4 |
|
|
87.8 |
|
|
88.8 |
|
|
Silver |
|
|
86.8 |
|
|
86.3 |
|
|
86.3 |
|
|
87.4 |
|
|
87.5 |
|
|
Gold ounces: |
|
|
|
|
|
|
|
|
|
|
|
|
|
|
|
|
|
Produced |
|
|
29.6 |
|
|
25.9 |
|
|
100.5 |
|
|
95.0 |
|
|
96.6 |
|
|
Sold |
|
|
29.0 |
|
|
26.0 |
|
|
99.6 |
|
|
99.8 |
|
|
88.8 |
|
|
Silver ounces: |
|
|
|
|
|
|
|
|
|
|
|
|
|
|
|
|
|
Produced |
|
|
1,877 |
|
|
1,704 |
|
|
6,448 |
|
|
6,691 |
|
|
6,706 |
|
|
Sold |
|
|
1,845 |
|
|
1,734 |
|
|
6,501 |
|
|
7,081 |
|
|
6,340 |
|
|
Gold equivalent ounces(1): |
|
|
|
|
|
|
|
|
|
|
|
|
|
|
|
|
|
Produced |
|
|
54.7 |
|
|
48.7 |
|
|
186.4 |
|
|
184.2 |
|
|
186.0 |
|
|
Sold |
|
|
53.6 |
|
|
49.1 |
|
|
186.3 |
|
|
194.2 |
|
|
173.3 |
|
|
Net sales |
|
$ |
65,193 |
|
$ |
53,192 |
|
$ |
227,093 |
|
$ |
235,961 |
|
$ |
186,095 |
|
|
Gross average realized price ($/ounce)(2): |
|
|
|
|
|
|
|
|
|
|
|
|
|
|
|
|
|
Gold |
|
$ |
1,274 |
|
$ |
1,115 |
|
$ |
1,264 |
|
$ |
1,242 |
|
$ |
1,120 |
|
|
Silver |
|
$ |
16.53 |
|
$ |
15.19 |
|
$ |
16.88 |
|
$ |
17.28 |
|
$ |
15.05 |
|
|
London average price ($/ounce): |
|
|
|
|
|
|
|
|
|
|
|
|
|
|
|
|
|
P.M. Fix Gold |
|
$ |
1,276 |
|
$ |
1,221 |
|
$ |
1,257 |
|
$ |
1,251 |
|
$ |
1,160 |
|
|
Fix Silver |
|
$ |
16.73 |
|
$ |
17.19 |
|
$ |
17.05 |
|
$ |
17.14 |
|
$ |
15.68 |
|
|
Silver : gold ratio(1) |
|
|
75 : 1 |
|
|
75 : 1 |
|
|
75 : 1 |
|
|
75 : 1 |
|
|
75 : 1 |
|
|
McEwen Mining—49% basis |
|
|
|
|
|
|
|
|
|
|
|
|
|
|
|
|
|
Ounces produced: |
|
|
|
|
|
|
|
|
|
|
|
|
|
|
|
|
|
Gold |
|
|
14.5 |
|
|
12.7 |
|
|
49.2 |
|
|
46.6 |
|
|
47.4 |
|
|
Silver |
|
|
920 |
|
|
835 |
|
|
3,159 |
|
|
3,278 |
|
|
3,286 |
|
|
Gold equivalent(1) |
|
|
26.8 |
|
|
23.8 |
|
|
91.4 |
|
|
90.3 |
|
|
91.2 |
|
|
(1) |
Silver production is presented as a gold equivalent. Gold equivalent ounces calculations approximate prevailing spot prices at the beginning of the year. |
|
(2) |
Average realized prices, total cash costs, and all‑in sustaining costs are non‑GAAP financial performance measures with no standardized definition under U.S. GAAP. See “Non‑GAAP Financial Performance Measures” on page 55 for additional information, including definitions of these terms. |
50
Gold and silver production
2017 compared to 2016
|
· |
Gold production in 2017, on a 100% basis, was 100,475 ounces, compared to 95,006 gold ounces produced in 2016. The increase was the result of higher grades processed during the year, along with minimal labor stoppages affecting production. |
|
· |
Silver production during 2017, on a 100% basis, was 6,447,657 ounces, 4% lower than the 6,690,558 silver ounces produced in 2016. The decrease was due to slightly lower number of tonnes mined and processed, lower average realized grades mined and processed and lower recoveries. |
|
· |
Using a silver to gold ratio of 75:1, the San José Mine produced 186,443 gold equivalent ounces in 2017. This compares to 184,213 gold equivalent ounces in 2016. For the year ended 2017, gold equivalent production at San Jose Mine slightly increased by 2% when compared to the 2016 period, due to the increase in average grades of gold processed partly offset by the decrease in the average grades of silver processed during the period. |
|
· |
Tonnes mined and processed in 2017 both decreased by 1%, mainly because of unusual lower temperatures during July, which affected the processing of the stockpile and reducing the tonnes processed in that quarter. Despite the decrease in the number of tonnes mined and processed, gold equivalent production was higher than in 2016 due to better gold grades obtained in 2017. |
2016 compared to 2015
|
· |
Gold production in 2016, on a 100% basis, was 95,006 ounces, a 2% decrease from the 96,638 gold ounces produced in 2015, due to lower average grades and recoveries obtained in 2016. |
|
· |
Silver production during 2016, on a 100% basis, was 6,690,558 ounces, compared to 6,703,614. The slight decrease was also driven by lower average grades and recoveries in 2016. |
|
· |
Tonnes mined and processed in 2016 increased by 5% and 1% respectively, mainly because of minimal labor stoppages, compared to 18 days of production lost due to stoppages in 2015. |
Gold and silver sales
2017 compared to 2016
|
· |
During 2017, net sales decreased by 4% to $227.1 million, from $236.0 million in 2016 due to a 8% decrease in the number of ounces of silver sold. Sales in 2016 were higher than normal as a result of shipments that were delayed from December 2015, due to Port strikes. In addition, a 2% decrease in the average realized price of silver was partly offset by a 2% increase in average realized prices of gold in the year. |
|
· |
Sales volumes in 2017 decreased to 99,634 ounces of gold and 6,501,401 ounces of silver, compared to 99,762 ounces of gold and 7,081,158 ounces of silver sold in 2016. As noted above, sales volumes in 2017 were lower since a portion of the sales in early 2016 related to shipments that had been delayed in December 2015, due to strikes at the Port. |
|
· |
The average realized gross sale price, after mark‑to‑market provisional price adjustments, discussed below, were $1,264 and $16.88 per ounce of gold and silver, respectively, resulting in an 2% increase and 2% decrease from $1,242 per ounce of gold and $17.28 per ounce of silver realized in 2016. In comparison, the average London P.M. fix price for gold was $1,257 per ounce of gold and $17.05 per ounce of silver in 2017. |
2016 compared to 2015
|
· |
Net sales of gold and silver in 2016 increased by 27% to $236.0 million, from $186.1 million in 2015 because of a 12% increase in the number of gold and silver ounces sold, coupled with 11% and 15% higher average realized prices for gold and silver ounces, respectively. |
51
|
· |
Sales volumes in 2016 increased to 99,762 ounces of gold and 7,081,158 ounces of silver, compared to 88,792 ounces of gold and 6,339,684 ounces of silver sold in 2015, as MSC was not affected by shipment delays at year-end 2016 as it was in 2015. |
|
· |
The average realized gross sale price, after mark‑to‑market provisional price adjustments, discussed below, were $1,242 and $17.28 per ounce of gold and silver, respectively, resulting in an 11% and 15% increase from $1,120 per ounce of gold and $15.05 per ounce of silver realized in 2015. In comparison, the average London P.M. fix price for gold was $1,251 per ounce of gold and $17.14 per ounce of silver in 2016. |
The difference between the average gross realized sale price per ounce of gold and silver sold by MSC and the average London fix prices noted above is due to adjustments of certain provisionally priced shipments of concentrates. Certain sales are ‘provisionally priced’ where the selling price is subject to final adjustment at the end of a period, normally ranging from 30 to 90 days after the start of the delivery process to the customer, based on the market price at the relevant quotation point stipulated in the contract. Sales revenue on provisionally priced sales of concentrates is recognized based on estimates of the final pricing receivable, which in turn are based on relevant forward market prices. At each reporting date, provisionally priced metal is marked to market based on the forward selling price for the quotational period of the sales contract.
Total Cash Costs and All‑In Sustaining Costs
The following table presents a summary of the total cash cost, cash cost per ounce, all-in sustaining costs and all-in sustaining costs per ounce of gold equivalent at the San José mine, on a 100% and 49% basis:
|
|
|
Three months ended |
|
Year ended |
|||||||||||
|
|
|
December 31, |
|
December 31, |
|||||||||||
|
|
|
2017 |
|
2016 |
|
2017 |
|
2016 |
|
2015 |
|||||
|
|
|
(in thousands, unless otherwise indicated) |
|
|
|
||||||||||
|
San José mine - 100% basis |
|
|
|
|
|
|
|
|
|
|
|
|
|
|
|
|
Total cash costs(1) |
|
$ |
37,472 |
|
$ |
35,803 |
|
$ |
156,348 |
|
$ |
147,478 |
|
$ |
149,938 |
|
All‑in sustaining costs(1) |
|
|
44,374 |
|
|
47,656 |
|
|
191,439 |
|
|
185,324 |
|
|
192,643 |
|
|
|
|
|
|
|
|
|
|
|
|
|
|
|
|
|
|
San José mine - 49% basis |
|
|
|
|
|
|
|
|
|
|
|
|
|
|
|
|
Total cash costs(1) |
|
$ |
18,362 |
|
$ |
17,543 |
|
$ |
76,610 |
|
$ |
72,264 |
|
$ |
73,469 |
|
Total cash costs per ounce sold ($/ounce)(1): |
|
|
|
|
|
|
|
|
|
|
|
|
|
|
|
|
Gold |
|
$ |
713 |
|
$ |
723 |
|
$ |
847 |
|
$ |
751 |
|
$ |
871 |
|
Silver |
|
$ |
9.06 |
|
$ |
9.81 |
|
$ |
11.07 |
|
$ |
10.24 |
|
$ |
11.45 |
|
Gold equivalent(2) |
|
$ |
699 |
|
$ |
729 |
|
$ |
839 |
|
$ |
760 |
|
$ |
865 |
|
All‑in sustaining costs(1) |
|
$ |
21,744 |
|
$ |
23,351 |
|
$ |
93,805 |
|
$ |
90,809 |
|
$ |
94,396 |
|
All‑in sustaining costs per ounce sold ($/ounce)(1): |
|
|
|
|
|
|
|
|
|
|
|
|
|
|
|
|
Gold |
|
$ |
920 |
|
$ |
963 |
|
$ |
1,058 |
|
$ |
944 |
|
$ |
1,119 |
|
Silver |
|
$ |
11.68 |
|
$ |
13.05 |
|
$ |
13.83 |
|
$ |
12.87 |
|
$ |
14.72 |
|
Gold equivalent(2) |
|
$ |
828 |
|
$ |
970 |
|
$ |
1,027 |
|
$ |
954 |
|
$ |
1,111 |
|
Silver : gold ratio(2) |
|
|
75 : 1 |
|
|
75 : 1 |
|
|
75 : 1 |
|
|
75 : 1 |
|
|
75 : 1 |
|
(1) |
Total cash costs, total cash costs per ounce, all-in sustaining costs, and all‑in sustaining costs per ounce are non‑GAAP financial performance measures with no standardized definition under U.S. GAAP. See “Non‑GAAP Financial Performance Measures” on page 55 for additional information, including definitions of these terms. |
|
(2) |
Silver production is presented as a gold equivalent. Gold equivalent ounces calculations approximate prevailing spot prices at the beginning of the year. |
2017 compared to 2016
On a 100% basis, total cash costs per gold equivalent ounce sold by MSC increased by 10% to $839 from $760 in 2016, due to higher production costs applicable to sales due to higher labor costs and higher inflation, partly offset by the decrease in commercial discounts and refining, smelting and transportation costs. In addition, during 2017, MSC sold a lower number of gold equivalent ounces, which also contributed to the increase of the per ounce cost, when compared to 2016.
On a 100% basis, total cash costs increased by 6% to $156.3 million in 2017 from $147.5 million during 2016, mainly due to higher production costs applicable to sales driven by higher labor costs and the impact of inflation, partly offset by the devaluation of the Argentina peso against the U.S. dollar. Labor costs were higher in 2017 due to the combined effect of
52
salary increases and additions to the labor force at the mine early in the year. Further, higher total cash costs were also the result of the increase in on-site general and administrative expenses, partly offset by lower commercial discounts and lower refining, smelting and transportation costs, compared to the 2016 period.
For 2017, on a per ounce basis, all-in sustaining costs increased to $1,027 per gold equivalent ounce, compared to $954 per gold equivalent ounce in 2016. On an aggregate basis, all-in sustaining costs increased from $185.3 million to $191.4 million in 2017, due to higher on-site exploration expenses aligned with MSC’s program to extend the life of the mine, partly offset by a decrease in underground mine development costs and capital expenditures incurred in the period.
Total cash costs and all-in sustaining costs per gold equivalent ounce, using a 75:1 ratio, of $839 and $1,027, respectively were above MSC’s 2017 production guidance of $780 and $990 per gold equivalent ounce, respectively.
2016 compared to 2015
On a 100% basis, total cash costs for the San José mine per gold equivalent ounce sold in 2016 decreased by 12% to $760 from $865 in 2015. On an aggregate basis, total cash costs decreased by 2% to $147.5 million in 2016 from $149.9 million in 2015, despite the higher number of ounces of gold equivalent sold in the year. The decrease was mainly due to lower refining, smelting and transportation costs resulting from lower export duties in place in Argentina since November 2015 and the increase in commercial discounts given to the refineries, in line with the increase in the number of ounces of gold equivalent sold throughout the year.
All‑in sustaining cost per gold equivalent ounce in 2016 was $954 compared to $1,111 per ounce in 2015. On a 100% basis, total aggregate all-in sustaining cost per gold equivalent ounce was $185.3 million, compared to $192.6 million in 2015. The decrease was due to lower mine development costs incurred due to the lower number of meters drilled in the year.
Total cash costs and all-in sustaining costs per gold equivalent ounce, using a 75:1 ratio, of $760 and $954, respectively were below MSC’s 2016 production guidance of $780 and $990 per gold equivalent ounce, respectively.
Investment in MSC (49%)
Our 49% attributable share of operations from our investment in MSC was loss of $0.1 million in 2017, compared to income of $13.0 million in 2016. The $0.1 million loss for the year ended December 31, 2017 is net of the amortization of the fair value increments arising from the purchase price allocation recorded as part of the acquisition of Minera Andes of $9.6 million and related deferred income tax recovery of $11.9 million.
Included in the income tax recovery is the impact of fluctuations in the exchange rate between the Argentine peso and the U.S. dollar on the peso‑denominated deferred tax liability associated with the investment in MSC recorded as part of the acquisition of Minera Andes.
|
|
|
|
|
|
|
|||||
|
|
|
For the year ended December 31, |
|
|||||||
|
|
|
2017 |
|
2016 |
|
2015 |
|
|||
|
|
|
(in thousands) |
|
|||||||
|
Minera Santa Cruz S.A. (100% basis) |
|
|
|
|
|
|
|
|
|
|
|
Net sales |
|
$ |
227,093 |
|
$ |
235,961 |
|
$ |
186,095 |
|
|
Production costs applicable to sales |
|
|
(177,180) |
|
|
(173,679) |
|
|
(158,615) |
|
|
Net (loss) income |
|
|
(4,750) |
|
|
32,574 |
|
|
(5,835) |
|
|
Portion attributable to McEwen Mining Inc. (49% basis) |
|
|
|
|
|
|
|
|
|
|
|
Net (loss) income |
|
$ |
(2,328) |
|
$ |
15,961 |
|
$ |
(2,859) |
|
|
Amortization of fair value increments |
|
|
(9,632) |
|
|
(12,274) |
|
|
(10,669) |
|
|
Income tax recovery |
|
|
11,916 |
|
|
9,264 |
|
|
15,942 |
|
|
(Loss) income from investment in MSC, net of amortization |
|
$ |
(44) |
|
$ |
12,951 |
|
$ |
2,414 |
|
53
During the year ended December 31, 2017, we received $12.2 million in dividends from MSC, compared to $17.7 million in 2016.
Changes in our investment in MSC for the years ended December 31, 2017 and 2016 are as follows:
|
|
|
2017 |
|
2016 |
||
|
|
|
(in thousands) |
||||
|
Investment in MSC, beginning of the period |
|
$ |
162,320 |
|
$ |
167,107 |
|
Attributable net income from MSC |
|
|
(2,328) |
|
|
15,961 |
|
Amortization of fair value increments |
|
|
(9,632) |
|
|
(12,274) |
|
Income tax recovery |
|
|
11,916 |
|
|
9,264 |
|
Dividend distribution received |
|
|
(12,212) |
|
|
(17,738) |
|
Investment in MSC, end of the period |
|
$ |
150,064 |
|
$ |
162,320 |
As at December 31, 2017, MSC had current assets of $104.4 million, total assets of $406.5 million, current liabilities of $46.0 million and total liabilities of $100.3 million. These balances include the increase in fair value and amortization of the fair value increments arising from the Company’s purchase price allocation and are net of the impairment charges. Excluding the fair value increments from the purchase price allocation and impairment charges, MSC had current assets of $103.7 million, total assets of $248.3 million, current liabilities of $46.0 million, and total liabilities of $72.2 million as at December 31, 2017.
Results of Operations – U.S.A. Segment
The U.S.A. segment is comprised of the Gold Bar project, an advanced-stage property located in Nevada, U.S., and other early stage exploration properties. During 2017, we spent $2.1 million in early stage exploration activities such as field mapping and geochemical reconnaissance work in various areas in Nevada and other states where we consider that exploration potential exists.
Advanced-stage Properties – Gold Bar Project
Gold Bar is located primarily on public lands managed by the Bureau of Land Management (“BLM”). On October 10, 2017, the Environmental Protection Agency published a Notice of Availability of the Final Environmental Impact Statement (“EIS”) in the Federal Register. After the regulated review period the Company received the signed Record of Decision (“ROD”) on the final EIS on November 8, 2017. We have targeted this project for an open pit, heap leach operation allowing for commercial production in the first quarter of 2019.
During 2017, we spent $3.1 million prior to ROD and an additional $6.0 million subsequent to the ROD, on permitting, engineering, and site development activities (including making deposits on long-lived capital equipment) in preparation for full-scale project construction that we are planning to execute during 2018.
Key construction developments at Gold Bar during 2017 included:
|
· |
Approval of all required Federal and State permits to initiate Gold Bar construction; |
|
· |
Continued engineering and procurement of major long-lead capital equipment items including crushing plant and material conveying system, mercury retort, and bulk construction commodities; |
|
· |
Mobilization of all critical contractors and installation of temporary offices, communications equipment, water, and power; and |
|
· |
Site clearance and initial preparation for 2018 construction. |
For 2018, we have budgeted approximately $71.0 million for construction activities planned for the year. Major capital equipment deliveries and construction will continue through to the third quarter of 2018. Construction activities include: heap leach pad earthworks and construction, process ponds, process plant and related building infrastructure, and site-wide utility distribution. In addition, mine and access road development will begin in the first half of 2018, followed by mine pre-stripping. It is estimated that ore will be delivered to the heap leach pad in the fourth quarter of 2018.
54
Results of Operations—Los Azules Segment
The Los Azules segment is composed of the Los Azules project, a copper exploration project located in San Juan, Argentina.
Los Azules Project
We had budgeted $9.6 million for the 2016-2017 exploration season at Los Azules, of which we spent $7.1 million during the first half of 2017, and an additional $0.8 million during the second half of the year. During the third quarter of 2017 we completed a Preliminary Economic Assessment (“PEA”), results of which were announced on September 7, 2017. The complete PEA is available electronically at our website at www.mcewenmining.com.
For the 2017-2018 season we have budgeted $5.3 million to continue with further technical and environmental baseline analysis, of which, the majority will be spent in 2018.
The following table presents certain payments due by the Company under contractual obligations with minimum firm commitments as of December 31, 2017, and excludes amounts already recorded on the Consolidated Balance Sheet, other than reclamation costs:
|
|
|
Payments due by period |
|
|||||||||||||||||||
|
Contractual Obligations |
|
2018 |
|
2019 |
|
2020 |
|
2021 |
|
2022 |
|
Thereafter |
|
Total |
|
|||||||
|
|
|
(in thousands) |
|
|||||||||||||||||||
|
Operating lease obligations (office rent) |
|
$ |
400 |
|
$ |
368 |
|
$ |
300 |
|
$ |
240 |
|
$ |
230 |
|
$ |
197 |
|
$ |
1,735 |
|
|
Operating lease obligations (mining and surface rights) |
|
|
3,994 |
|
|
436 |
|
|
442 |
|
|
442 |
|
|
437 |
|
|
— |
|
|
5,751 |
|
|
Exploration (including $10.0 million flow-through shares) |
|
|
11,554 |
|
|
— |
|
|
— |
|
|
— |
|
|
— |
|
|
— |
|
|
11,554 |
|
|
Construction |
|
|
11,344 |
|
|
— |
|
|
— |
|
|
— |
|
|
— |
|
|
— |
|
|
11,344 |
|
|
Reclamation costs(1) |
|
|
639 |
|
|
448 |
|
|
3,883 |
|
|
3,974 |
|
|
3,181 |
|
|
30,807 |
|
|
42,932 |
|
|
Total |
|
$ |
27,931 |
|
$ |
1,252 |
|
$ |
4,625 |
|
$ |
4,656 |
|
$ |
3,848 |
|
$ |
31,004 |
|
$ |
73,316 |
|
|
(1) |
Amounts presented represent the undiscounted, uninflated future payments |
Operating lease obligations include long‑term leases covering office space, exploration expenditures, option payments and option payments on properties.
We have surety bonds outstanding to provide bonding for our environmental reclamation obligations in the United States. These surety bonds are available for draw down in the event we do not perform our reclamation obligations. When the specific reclamation requirements are met, the beneficiary of the surety bonds will cancel and/or return the instrument to the issuing entity. As of December 31, 2017, no liability has been recognized for our surety bonds of $19.9 million.
Pursuant to the Black Fox acquisition, the Company increased its surety bond obligations by an additional $16.5 million (C$20.6 million). No liability has been recognized for these surety bonds.
As of December 31, 2017, we did not have any off‑balance sheet arrangements (as that phrase is defined by SEC rules applicable to this report) which have or are reasonably likely to have a material adverse effect on our financial condition, results of operations or liquidity.
Non‑GAAP Financial Performance Measures
In this report, we have provided information prepared or calculated according to U.S. GAAP, as well as provided some non‑U.S. GAAP financial performance measures. Because the non‑GAAP performance measures do not have any standardized meaning prescribed by U.S. GAAP, they may not be comparable to similar measures presented by other companies. These measures should not be considered in isolation or as substitutes for measures of performance prepared in accordance with GAAP. There are limitations associated with the use of such non‑GAAP measures. Since these measures do not incorporate revenues, changes in working capital and non‑operating cash costs, they are not necessarily indicative of operating profit or loss, or cash flow from operations as determined in accordance with U.S. GAAP.
55
The non-GAAP measures Earning from Mining Operations, Total Cash Costs, All-In Sustaining Cash Costs, Average Realized Prices, and Cash, Investments and Precious Metals, are not, and are not intended to be, presentations in accordance with U.S. GAAP. These measures represent, respectively, our Earnings from Mining Operations, Total Cash Costs, All-In Sustaining Cash Costs, and Average Realized Prices related to our wholly-owned El Gallo 1 and Black Fox mines and our minority interest in the San José mine, owned by MSC. The portions of the costs and prices related to the minority interest may be found in Note 7 to our Consolidated Financial Statements. The amounts in the tables labeled “49% basis” were derived by applying to each financial statement line item the ownership percentage interest used to arrive at our share of net income or loss during the period when applying the equity method of accounting. We do not control the interest in or operations of MSC and the presentations of assets and liabilities and revenues and expenses of MSC do not represent our legal claim to such items. The amount of cash we receive is based upon specific provisions of the JVOA and varies depending on factors including the profitability of the operations.
We provide the Non-GAAP measures because we believe they assist investors and analysts in estimating our earnings, production costs applicable to sales and sales revenue, including both our wholly-owned property and our interest in the San José mine, when read in conjunction with our reported results under U.S. GAAP. The presentation of these measures including the minority interest has limitations as an analytical tool. Some of these limitations include:
|
· |
The amounts shown on the individual line items were derived by applying our overall economic ownership interest percentage determined when applying the equity method of accounting and do not necessarily represent our legal claim to the assets and liabilities, or the revenues and expenses; and |
|
· |
Other companies in our industry may calculate their earnings, costs and average realized prices differently than we do, limiting the usefulness as a comparative measure. |
Because of these limitations, these non-GAAP measures should not be considered in isolation or as a substitute for our financial statements as reported under U.S. GAAP. We compensate for these limitations by relying primarily on our U.S. GAAP results and using the non-GAAP measures supplementally.
Earnings (Loss) from Mining Operations
The term Earnings or Loss from Mining Operations used in this report is a non‑GAAP financial measure. We use and report this measure because we believe it provides investors and analysts with a useful measure of the underlying earnings or loss from our mining operations.
We define Earnings from Mining Operations as Gold and Silver Sales from our El Gallo 1 mine, Black Fox mine, and our 49% attributable share of the San José mine’s Net Sales, less their respective Production Costs Applicable to Sales. To the extent that Production Costs Applicable to Sales may include depreciation and amortization expense related to the fair value increments on historical business acquisitions (fair value paid in excess of the carrying value of the underlying assets and liabilities assumed on the date of acquisition), we deduct this expense in order to arrive at Production Costs Applicable to Sales that only include depreciation and amortization expense incurred at the mine‑site level. The San José mine Net Sales and Production Costs Applicable to Sales are presented, on a 100% basis, in Note 7 of the accompanying financial statements.
56
The following table presents a reconciliation of Earnings from Mining Operations to Gross Profit, a GAAP financial measure.
|
|
|
Three months ended |
|
Year ended |
|||||||||||
|
|
|
December 31, |
|
December 31, |
|||||||||||
|
|
|
2017 |
|
2016 |
|
2017 |
|
2016 |
|
2015 |
|||||
|
|
|
(in thousands) |
|||||||||||||
|
El Gallo 1 Mine earnings from mining operations |
|
|
|
|
|
|
|
|
|
|
|
|
|
|
|
|
Gold and silver sales |
|
$ |
12,472 |
|
$ |
11,162 |
|
$ |
55,845 |
|
$ |
60,388 |
|
$ |
72,956 |
|
Production costs applicable to sales |
|
|
(11,099) |
|
|
(6,894) |
|
|
(35,292) |
|
|
(28,133) |
|
|
(34,607) |
|
Depreciation of mining related assets |
|
|
(165) |
|
|
(182) |
|
|
(764) |
|
|
(528) |
|
|
(333) |
|
Gross profit |
|
|
1,208 |
|
|
4,086 |
|
|
19,789 |
|
|
31,727 |
|
|
38,016 |
|
Add: Amortization related to fair value increments on historical acquisitions included in Production Costs Applicable to Sales |
|
|
785 |
|
|
568 |
|
|
2,299 |
|
|
2,413 |
|
|
1,288 |
|
El Gallo 1 Mine earnings from mining operations |
|
|
1,993 |
|
|
4,654 |
|
|
22,088 |
|
|
34,140 |
|
|
39,304 |
|
|
|
|
|
|
|
|
|
|
|
|
|
|
|
|
|
|
Black Fox earnings from mining operations |
|
|
|
|
|
|
|
|
|
|
|
|
|
|
|
|
Gold and silver sales |
|
$ |
11,620 |
|
$ |
— |
|
$ |
11,620 |
|
$ |
— |
|
$ |
— |
|
Production costs applicable to sales |
|
|
(9,888) |
|
|
— |
|
|
(9,888) |
|
|
— |
|
|
— |
|
Gross profit |
|
|
1,732 |
|
|
— |
|
|
1,732 |
|
|
— |
|
|
— |
|
Add: Amortization related to mineral interests included in Production Costs Applicable to Sales |
|
|
505 |
|
|
— |
|
|
505 |
|
|
— |
|
|
— |
|
Black Fox earnings from mining operations |
|
|
2,237 |
|
|
— |
|
|
2,237 |
|
|
— |
|
|
— |
|
|
|
|
|
|
|
|
|
|
|
|
|
|
|
|
|
|
San José earnings from mining operations (49% basis) |
|
|
|
|
|
|
|
|
|
|
|
|
|
|
|
|
Net sales |
|
$ |
31,945 |
|
$ |
26,064 |
|
$ |
111,276 |
|
$ |
115,621 |
|
$ |
91,187 |
|
Production costs applicable to sales |
|
|
(21,790) |
|
|
(23,410) |
|
|
(86,818) |
|
|
(85,103) |
|
|
(77,721) |
|
San José earnings from mining operations |
|
|
10,155 |
|
|
2,654 |
|
|
24,458 |
|
|
30,518 |
|
|
13,466 |
Total Cash Costs and All‑In Sustaining Costs
The terms total cash costs, total cash cost per ounce, all‑in sustaining costs, and all‑in sustaining cost per ounce used in this report are non‑GAAP financial measures. We report these measures to provide additional information regarding operational efficiencies on an individual mine basis (El Gallo 1 mine, Black Fox mine, and San José mine), and believe these measures provide investors and analysts with useful information about our underlying costs of operations. For the San José mine, where we hold a 49% share in the production through our 49% interest in MSC, we exclude the share of gold or silver production attributable to the controlling interest.
Total cash costs consists of mining, processing, on‑site general and administrative expenses, community and permitting costs related to current operations, royalty costs, refining and treatment charges (for both doré and concentrate products), sales costs, export taxes and operational stripping costs, and exclude depreciation and amortization. The sum of these costs is divided by the corresponding gold equivalent ounces sold to determine a per ounce amount.
All‑in sustaining costs consists of total cash costs (as described above), plus environmental rehabilitation costs and amortization of the asset retirement costs related to operating sites, sustaining exploration and development costs, and sustaining capital expenditures. Our all-in sustaining costs exclude the allocation of corporate general and administrative costs. Following is additional information regarding our all-in sustaining costs:
|
· |
Sustaining operating costs represent expenditures incurred at current operations that are considered necessary to maintain current annual production at the mine site and include mine development costs and ongoing replacement of mine equipment and other capital facilities. Sustaining capital costs do not include costs of expanding the project that would result in improved productivity of the existing asset, increased existing capacity or extended useful life. |
|
· |
Sustaining exploration and development costs included expenditures incurred to sustain current operations and leads to the increase in reserves and/or resources to replace ounces extracted as part of the ongoing production. |
57
Exploration activity performed near-mine (brownfield) or new exploration projects (greenfield) or any other activity not directly linked to the existing mine-site are classified as non-sustaining. |
The sum of all-in sustaining costs is divided by the corresponding gold equivalent ounces sold to determine a per ounce amount.
Costs excluded from total cash costs and all‑in sustaining costs are income and mining tax expense, all financing charges, costs related to business combinations, asset acquisitions and asset disposal, and any items that are deducted for the purpose of normalizing items.
For MSC, co‑product total cash costs and all‑in sustaining costs are calculated by dividing the respective proportionate share of the total cash costs and all‑in sustaining costs for each metal sold for the period by the ounces of each respective metal sold. The respective proportionate share of each metal sold is calculated based on their pro‑rated sales value. Approximately 55% of the value of the sales in the fourth quarter of 2017 was derived from gold and 45% was derived from silver, which compared to 52% and 48%, respectively, for the same period in 2016. For the year ended December 31, 2017, approximately 53% of the value of the sales was derived from gold and 47% was derived from silver, compared to 50% and 50% in 2016, respectively.
The following tables reconcile these non‑GAAP measures to the most directly comparable GAAP measure, Production costs applicable to sales. Total cash costs, all‑in sustaining costs, and ounces of gold and silver sold for the San José mine are provided to us by MSC.
|
|
|
Three months ended |
|
Year ended |
|||||||||||
|
|
|
December 31, |
|
December 31, |
|||||||||||
|
|
|
2017 |
|
2016 |
|
2017 |
|
2016 |
|
2015 |
|||||
|
|
|
(in thousands, except per ounce) |
|||||||||||||
|
El Gallo 1 mine cash costs |
|
|
|
|
|
|
|
|
|
|
|
|
|
|
|
|
Production costs applicable to sales |
|
$ |
11,099 |
|
$ |
6,894 |
|
$ |
35,292 |
|
$ |
28,133 |
|
$ |
34,607 |
|
Less: Depreciation |
|
|
(785) |
|
|
(568) |
|
|
(2,299) |
|
|
(2,413) |
|
|
(1,288) |
|
Less: Pre‑stripping costs for future pit access |
|
|
— |
|
|
(367) |
|
|
— |
|
|
(1,713) |
|
|
(6,408) |
|
On‑site general and administrative expenses |
|
|
750 |
|
|
440 |
|
|
2,185 |
|
|
1,580 |
|
|
805 |
|
Property holding costs |
|
|
— |
|
|
— |
|
|
20 |
|
|
22 |
|
|
26 |
|
Other non‑cash adjustments |
|
|
— |
|
|
— |
|
|
— |
|
|
— |
|
|
(135) |
|
Total cash costs, El Gallo 1 mine |
|
$ |
11,064 |
|
$ |
6,399 |
|
$ |
35,198 |
|
$ |
25,609 |
|
$ |
27,607 |
|
Gold equivalent ounces sold: |
|
|
9,747 |
|
|
9,155 |
|
|
44,490 |
|
|
48,903 |
|
|
62,704 |
|
El Gallo 1 mine cash costs per gold equivalent ounce sold |
|
$ |
1,135 |
|
$ |
699 |
|
$ |
791 |
|
$ |
524 |
|
$ |
440 |
|
|
|
Three months ended |
|
Year ended |
|||||||||||
|
|
|
December 31, |
|
December 31, |
|||||||||||
|
|
|
2017 |
|
2016 |
|
2017 |
|
2016 |
|
2015 |
|||||
|
|
|
(in thousands, except per ounce) |
|||||||||||||
|
Black Fox mine cash costs |
|
|
|
|
|
|
|
|
|
|
|
|
|
|
|
|
Production costs applicable to sales |
|
$ |
9,888 |
|
$ |
— |
|
$ |
9,888 |
|
$ |
— |
|
$ |
— |
|
Less: Depreciation |
|
|
(1,737) |
|
|
— |
|
|
(1,737) |
|
|
— |
|
|
— |
|
Total cash costs, Black Fox 1 mine |
|
$ |
8,151 |
|
$ |
— |
|
$ |
8,151 |
|
$ |
— |
|
$ |
— |
|
Gold equivalent ounces sold: |
|
|
9,422 |
|
|
— |
|
|
9,422 |
|
|
— |
|
|
— |
|
Black Fox mine cash costs per gold equivalent ounce sold |
|
$ |
865 |
|
$ |
— |
|
$ |
865 |
|
$ |
— |
|
$ |
— |
58
|
|
|
Three months ended |
|
Year ended |
|||||||||||
|
|
|
December 31, |
|
December 31, |
|||||||||||
|
|
|
2017 |
|
2016 |
|
2017 |
|
2016 |
|
2015 |
|||||
|
|
|
(in thousands, except per ounce) |
|||||||||||||
|
San José mine cash costs (49% basis) |
|
|
|
|
|
|
|
|
|
|
|
|
|
|
|
|
Production costs applicable to sales |
|
$ |
21,790 |
|
$ |
23,410 |
|
$ |
86,818 |
|
$ |
85,103 |
|
$ |
77,721 |
|
Less: Operating site reclamation accretion and amortization |
|
|
(182) |
|
|
(444) |
|
|
(653) |
|
|
(1,676) |
|
|
(1,213) |
|
Depreciation |
|
|
(6,701) |
|
|
(8,339) |
|
|
(23,003) |
|
|
(27,463) |
|
|
(22,157) |
|
On‑site general and administrative expenses |
|
|
1,114 |
|
|
1,130 |
|
|
4,292 |
|
|
4,004 |
|
|
3,454 |
|
Refining, smelting, and transportation |
|
|
830 |
|
|
461 |
|
|
3,271 |
|
|
5,072 |
|
|
9,657 |
|
Commercial discounts |
|
|
1,476 |
|
|
1,295 |
|
|
5,727 |
|
|
7,064 |
|
|
5,795 |
|
Community costs related to current operations |
|
|
35 |
|
|
30 |
|
|
158 |
|
|
160 |
|
|
211 |
|
Total cash costs |
|
$ |
18,362 |
|
$ |
17,543 |
|
$ |
76,610 |
|
$ |
72,264 |
|
$ |
73,468 |
|
McEwen's share of San José mine gold equivalent ounces sold |
|
|
26,255 |
|
|
24,063 |
|
|
91,296 |
|
|
95,147 |
|
|
84,928 |
|
Total cash costs, MSC |
|
$ |
699 |
|
$ |
729 |
|
$ |
839 |
|
$ |
760 |
|
$ |
865 |
Reconciliation of All‑In Sustaining Costs to Total Cash Costs
|
|
|
Three months ended |
|
Year ended |
|||||||||||
|
|
|
December 31, |
|
December 31, |
|||||||||||
|
|
|
2017 |
|
2016 |
|
2017 |
|
2016 |
|
2015 |
|||||
|
|
|
(in thousands, except per ounce) |
|||||||||||||
|
El Gallo 1 mine all-in sustaining costs |
|
|
|
|
|
|
|
|
|
|
|
|
|
|
|
|
Total cash costs |
|
$ |
11,064 |
|
$ |
6,399 |
|
$ |
35,198 |
|
$ |
25,609 |
|
$ |
27,607 |
|
Operating site reclamation accretion and amortization |
|
|
81 |
|
|
319 |
|
|
325 |
|
|
1,043 |
|
|
936 |
|
On‑site exploration expenses |
|
|
924 |
|
|
530 |
|
|
3,975 |
|
|
1,110 |
|
|
1,488 |
|
Capitalised expenditures (sustaining) |
|
|
120 |
|
|
— |
|
|
939 |
|
|
343 |
|
|
— |
|
Pre‑stripping costs for future pit access |
|
|
— |
|
|
367 |
|
|
— |
|
|
1,713 |
|
|
6,408 |
|
All‑in sustaining costs, El Gallo 1 mine |
|
$ |
12,189 |
|
$ |
7,615 |
|
$ |
40,437 |
|
$ |
29,818 |
|
$ |
36,439 |
|
Gold equivalent ounces sold |
|
|
9,747 |
|
|
9,155 |
|
|
44,490 |
|
|
48,903 |
|
|
62,704 |
|
El Gallo 1 mine all-in sustaining cost per gold equivalent ounce sold |
|
|
1,251 |
|
|
832 |
|
|
909 |
|
|
610 |
|
|
581 |
|
|
|
Three months ended |
|
Year ended |
|||||||||||
|
|
|
December 31, |
|
December 31, |
|||||||||||
|
|
|
2017 |
|
2016 |
|
2017 |
|
2016 |
|
2015 |
|||||
|
|
|
(in thousands, except per ounce) |
|||||||||||||
|
Black Fox mine all-in sustaining costs |
|
|
|
|
|
|
|
|
|
|
|
|
|
|
|
|
Total cash costs |
|
$ |
8,151 |
|
$ |
— |
|
$ |
8,151 |
|
$ |
— |
|
$ |
— |
|
Operating site reclamation accretion and amortization |
|
|
159 |
|
|
— |
|
|
159 |
|
|
— |
|
|
— |
|
On‑site exploration expenses |
|
|
636 |
|
|
— |
|
|
636 |
|
|
— |
|
|
— |
|
Capitalised exploration (sustaining) |
|
|
148 |
|
|
— |
|
|
148 |
|
|
— |
|
|
— |
|
Capitalised mine development (sustaining) |
|
|
3,338 |
|
|
— |
|
|
3,338 |
|
|
— |
|
|
— |
|
All‑in sustaining costs, Black Fox mine |
|
$ |
12,432 |
|
$ |
— |
|
$ |
12,432 |
|
$ |
— |
|
$ |
— |
|
Gold equivalent ounces sold |
|
|
9,422 |
|
|
- |
|
|
9,422 |
|
|
- |
|
|
- |
|
Black Fox mine all-in sustaining cost per gold equivalent ounce sold |
|
|
1,319 |
|
|
— |
|
|
1,319 |
|
|
— |
|
|
— |
|
|
|
Three months ended |
|
Year ended |
|||||||||||
|
|
|
December 31, |
|
December 31, |
|||||||||||
|
|
|
2017 |
|
2016 |
|
2017 |
|
2016 |
|
2015 |
|||||
|
|
|
(in thousands, except per ounce) |
|
|
|
||||||||||
|
San José mine all-in sustaining costs (49% basis) |
|
|
|
|
|
|
|
|
|
|
|
|
|
|
|
|
Total cash costs |
|
$ |
18,362 |
|
$ |
17,543 |
|
$ |
76,610 |
|
$ |
72,264 |
|
$ |
73,468 |
|
Operating site reclamation accretion and amortization |
|
|
182 |
|
|
444 |
|
|
653 |
|
|
1,676 |
|
|
1,213 |
|
On-site exploration expenses |
|
|
279 |
|
|
742 |
|
|
2,547 |
|
|
1,431 |
|
|
1,431 |
|
Capitalised stripping & underground mine development |
|
|
2,748 |
|
|
3,287 |
|
|
11,550 |
|
|
12,833 |
|
|
13,383 |
|
Less: depreciation |
|
|
(466) |
|
|
(433) |
|
|
(1,450) |
|
|
(2,042) |
|
|
— |
|
Capital expenditures (sustaining) |
|
|
639 |
|
|
1,768 |
|
|
3,895 |
|
|
4,647 |
|
|
4,899 |
|
All‑in sustaining costs |
|
$ |
21,744 |
|
$ |
23,351 |
|
$ |
93,805 |
|
$ |
90,809 |
|
$ |
94,394 |
|
McEwen's share of San José mine gold equivalent ounces sold |
|
|
26,255 |
|
|
24,063 |
|
|
91,296 |
|
|
95,147 |
|
|
84,928 |
|
San José mine all-in sustaining cost per gold equivalent ounce sold |
|
$ |
828 |
|
$ |
970 |
|
$ |
1,027 |
|
$ |
954 |
|
$ |
1,111 |
59
The following table summarizes the consolidated number of gold equivalent ounces sold:
|
|
|
Three months ended December 31, |
|
Year ended December 31, |
|
||||||
|
|
|
2017 |
|
2016 |
|
2017 |
|
2016 |
|
2015 |
|
|
Gold equivalent ounces sold at El Gallo 1 mine |
|
9,747 |
|
9,155 |
|
44,490 |
|
48,903 |
|
62,704 |
|
|
Gold equivalent ounces sold at Black Fox mine |
|
9,422 |
|
— |
|
9,422 |
|
— |
|
— |
|
|
McEwen’s share of MSC gold equivalent ounces sold |
|
26,255 |
|
24,063 |
|
91,296 |
|
95,147 |
|
84,925 |
|
|
Consolidated gold equivalent ounces sold (including McEwen’s share of MSC) |
|
45,424 |
|
33,218 |
|
145,208 |
|
144,050 |
|
147,629 |
|
|
Silver : gold ratio |
|
75 : 1 |
|
75 : 1 |
|
75 : 1 |
|
75 : 1 |
|
75 : 1 |
|
Average realized prices
The term average realized price per ounce used in this report is also a non‑GAAP financial measure. We report this measure to better understand the price realized in each reporting period for gold and silver.
Average realized price is calculated as gross sales of gold and silver (excluding commercial deductions) over the number of net ounces sold in the period (net of deduction units).
The following table reconciles this non‑GAAP measure to the most directly comparable U.S. GAAP measure, Sales of Gold and Silver. Ounces of gold and silver sold for the San José mine are provided to us by MSC.
|
|
|
Three months ended |
|
Year ended |
|||||||||||
|
|
|
December 31, |
|
December 31, |
|||||||||||
|
2017 |
2016 |
2017 |
2016 |
2015 |
|||||||||||
|
|
|
(in thousands, except ounce and per ounce figures) |
|||||||||||||
|
El Gallo 1 mine average realized prices |
|
|
|
|
|
|
|
|
|
|
|
|
|
|
|
|
Gold sales |
|
$ |
12,443 |
|
$ |
11,145 |
|
$ |
55,432 |
|
$ |
60,093 |
|
$ |
72,377 |
|
Silver sales |
|
|
29 |
|
|
17 |
|
|
413 |
|
|
295 |
|
|
579 |
|
Gold and silver sales |
|
$ |
12,472 |
|
$ |
11,162 |
|
$ |
55,845 |
|
$ |
60,388 |
|
$ |
72,956 |
|
Gold ounces sold |
|
|
9,724 |
|
|
9,142 |
|
|
44,174 |
|
|
48,668 |
|
|
62,226 |
|
Silver ounces sold |
|
|
1,731 |
|
|
991 |
|
|
23,731 |
|
|
17,591 |
|
|
35,862 |
|
Gold equivalent ounces sold |
|
|
9,747 |
|
|
9,155 |
|
|
44,490 |
|
|
48,903 |
|
|
62,704 |
|
Average realized price per gold ounce sold |
|
$ |
1,280 |
|
$ |
1,219 |
|
$ |
1,255 |
|
$ |
1,235 |
|
$ |
1,163 |
|
Average realized price per silver ounce sold |
|
$ |
16.75 |
|
$ |
17.52 |
|
$ |
17.40 |
|
$ |
16.77 |
|
$ |
16.15 |
|
Average realized price per gold equivalent ounce sold |
|
$ |
1,280 |
|
$ |
1,219 |
|
$ |
1,255 |
|
$ |
1,235 |
|
$ |
1,163 |
|
|
|
Three months ended |
|
Year ended |
|||||||||||
|
|
|
December 31, |
|
December 31, |
|||||||||||
|
|
|
2017 |
|
2016 |
|
2017 |
|
2016 |
|
2015 |
|||||
|
|
|
(in thousands, except ounce and per ounce figures) |
|||||||||||||
|
Black Fox mine average realized prices |
|
|
|
|
|
|
|
|
|
|
|
|
|
|
|
|
Gold sales |
|
$ |
11,620 |
|
$ |
— |
|
$ |
11,620 |
|
$ |
— |
|
$ |
— |
|
Silver sales |
|
|
— |
|
|
— |
|
|
— |
|
|
— |
|
|
— |
|
Gold and silver sales |
|
$ |
11,620 |
|
$ |
— |
|
$ |
11,620 |
|
$ |
— |
|
$ |
— |
|
Gold ounces sold |
|
|
9,422 |
|
|
— |
|
|
9,422 |
|
|
— |
|
|
— |
|
Silver ounces sold |
|
|
— |
|
|
— |
|
|
— |
|
|
— |
|
|
— |
|
Gold equivalent ounces sold |
|
|
9,422 |
|
|
— |
|
|
9,422 |
|
|
— |
|
|
— |
|
Average realized price per gold ounce sold |
|
$ |
1,233 |
|
$ |
— |
|
$ |
1,233 |
|
$ |
— |
|
$ |
— |
|
Average realized price per silver ounce sold |
|
$ |
— |
|
$ |
— |
|
$ |
— |
|
$ |
— |
|
$ |
— |
|
Average realized price per gold equivalent ounce sold |
|
$ |
1,233 |
|
$ |
— |
|
$ |
1,233 |
|
$ |
— |
|
$ |
— |
60
|
|
|
Three months ended |
|
Year ended |
|||||||||||
|
|
|
December 31, |
|
December 31, |
|||||||||||
|
2017 |
2016 |
2017 |
2016 |
2015 |
|||||||||||
|
|
|
(in thousands, except ounce and per ounce figures) |
|||||||||||||
|
San José mine average realized prices (49% basis) |
|
|
|
|
|
|
|
|
|
|
|
|
|||
|
Gold sales |
|
$ |
18,091 |
|
$ |
14,203 |
|
$ |
61,684 |
|
$ |
60,729 |
|
$ |
48,745 |
|
Silver sales |
|
|
14,940 |
|
|
12,905 |
|
|
53,785 |
|
|
59,960 |
|
|
46,749 |
|
Gold and silver sales |
|
$ |
33,031 |
|
$ |
27,108 |
|
$ |
115,469 |
|
$ |
120,688 |
|
$ |
95,494 |
|
Gold ounces sold |
|
|
14,202 |
|
|
12,733 |
|
|
48,820 |
|
|
48,883 |
|
|
43,509 |
|
Silver ounces sold |
|
|
903,958 |
|
|
849,774 |
|
|
3,185,687 |
|
|
3,469,767 |
|
|
3,106,445 |
|
Gold equivalent ounces sold |
|
|
26,255 |
|
|
24,063 |
|
|
91,296 |
|
|
95,147 |
|
|
84,931 |
|
Average realized price per gold ounce sold |
|
$ |
1,274 |
|
$ |
1,115 |
|
$ |
1,264 |
|
$ |
1,242 |
|
$ |
1,120 |
|
Average realized price per silver ounce sold |
|
$ |
16.53 |
|
$ |
15.19 |
|
$ |
16.88 |
|
$ |
17.28 |
|
$ |
15.05 |
|
Average realized price per gold equivalent ounce sold |
|
$ |
1,258 |
|
$ |
1,127 |
|
$ |
1,265 |
|
$ |
1,268 |
|
$ |
1,124 |
Cash, investments and precious metals
The term cash, investments and precious metals used in this report is also a non‑GAAP financial measure. We report this measure to better understand our liquidity in each reporting period.
Cash, investments and precious metals is calculated as the sum of cash, investments and ounces of doré held in inventory, with doré valued at the London P.M. Fix spot price at the corresponding period. The following table summarizes the calculation of cash and cash equivalents, restricted cash, investments and precious metals amounts shown in this report:
|
|
|
Year ended |
||||
|
|
|
December 31, |
||||
|
|
|
2017 |
|
2016 |
||
|
|
|
(in thousands) |
||||
|
Cash and cash equivalents |
|
$ |
27,153 |
|
$ |
37,440 |
|
Restricted cash |
|
|
10,000 |
|
|
- |
|
Investments |
|
|
7,971 |
|
|
8,543 |
|
Precious Metals valued at market value |
|
|
22,954 |
|
|
12,795 |
|
Total cash, investments and precious metals |
|
$ |
68,078 |
|
$ |
58,778 |
A reconciliation between precious metals valued at cost and precious metals, valued at market value is described in the following table:
|
|
|
Year ended |
||||
|
|
|
December 31, |
||||
|
|
|
2017 |
|
2016 |
||
|
|
|
(in thousands, except ounces and per ounce) |
||||
|
Precious Metals (note 4 of the Consolidated Financial Statements) |
|
$ |
12,902 |
|
$ |
5,035 |
|
Reconciliation of Precious Metals to Precious Metals valued at market value |
|
|
|
|
|
|
|
Number of ounces of doré in inventory, net of streaming agreement |
|
|
17,780 |
|
|
11,039 |
|
London P.M. Fix, per ounce |
|
$ |
1,291 |
|
$ |
1,159 |
|
Precious Metals valued at market value |
|
$ |
22,954 |
|
$ |
12,795 |
Management’s Discussion and Analysis of Financial Condition and Results of Operations is based on our consolidated financial statements, which have been prepared in conformity with U.S. GAAP. The preparation of these statements requires that we make estimates and assumptions that affect the reported amounts of assets, liabilities, revenues and expenses. We base these estimates on historical experience and on assumptions that we consider reasonable under the circumstances; however, reported results could differ from those based on the current estimates under different assumptions or conditions. The summary of our significant accounting policies is detailed in Note 2 of the Consolidated Financial Statements. In the section below we identify estimates critical to the understanding of our financial results of operations and that require the application of significant management judgment.
Stockpiles, Material on Leach Pads, In‑process Inventory, Precious Metals Inventory and Materials and Supplies: Stockpiles, material on leach pads, in-process inventory, precious metals inventory and materials and supplies are accounted for using the weighted average cost method and are carried at the lower of average cost or net realizable value. Net realizable value represents the estimated future sales price of the product based on current and long-term metals prices,
61
less the estimated costs to complete production and bring the product to sale. Write-downs of stockpiles, material on leach pads, in-process inventory, precious metals inventory and materials and supplies, resulting from net realizable value impairments, are reported as a component of production costs applicable to sales. The current portion of stockpiles, material on leach pad, in-process inventory and materials and supplies is determined based on the expected amounts to be processed within the next 12 months. Stockpiles, material on leach pads, in‑process inventory and materials and supplies not expected to be processed within the next 12 months, if any, are classified as long‑term.
Stockpiles represent mineralized material extracted from the mine and available for processing. Stockpiles are measured by estimating the number of tonnes added and removed from the stockpile, an estimate of the contained metals (based on assay data) and the estimated metallurgical recovery rates. Costs are allocated to stockpiles based on current mining costs incurred including applicable overhead relating to mining operations. Material is removed from the stockpile at an average cost per tonne.
Mineralized material on leach pads is the ore that is placed on pads where it is treated with a chemical solution that dissolves the gold contained in the ore over a period of months. Costs are attributed to the ore on leach pads based on current mining costs incurred up to the point of placing the ore on the pad. Costs are removed from the leach pad inventory based on the average cost per estimated recoverable ounce of gold on the leach pad as the gold is recovered. The estimates of recoverable gold on the leach pads are calculated from the quantities of ore placed on the leach pads (measured tonnes added to the leach pads), the grade of ore placed on the leach pads (based on assay data) and a recovery percentage.
In general, leach pads recover between 50% and 95% of the recoverable ounces in the first year of leaching, declining each year thereafter until the leaching is complete. The cumulative metallurgical recovery rate for gold production at the El Gallo 1 mine from September 2012 (start of production) to December 31, 2017 was approximately 57% (2016 – 59%). Although the quantities of recoverable gold placed on the leach pads are reconciled by comparing the grades of ore placed on the pads to the quantities of gold actually recovered (metallurgical balancing), the nature of the leaching process inherently limits the ability to precisely monitor inventory levels. As a result, the metallurgical balancing process is constantly monitored and the engineering estimates are refined based on actual results over time.
The current portion of ore on leach pads inventory is determined based on the expected amounts to be processed within the next twelve months. Ore on leach pads inventory not expected to be processed or used within the next twelve months is classified as long-term.
In-process inventories represent materials that are currently in the process of being converted to a saleable product. In-process material is measured based on assays of the material from the various stages of the Adsorption – Desorption – Recovery (“ADR”) process and the projected recoveries of the respective plants. Costs are allocated to in-process inventories based on the costs of the material fed into the process attributable to the source material coming from the mines, stockpiles and/or leach pads plus the in-process conversion costs incurred to that point in the process.
Precious metal inventories include gold and silver doré and bullion that is unsold and held at the Company’s or the refinery’s facilities. Costs are allocated to precious metal inventories based on costs of the respective in-process inventories incurred prior to the refining process plus applicable refining costs.
Materials and supplies inventories are comprised of chemicals, reagents, spare parts and consumable parts used in drilling and other operating activities. Cost includes applicable taxes and freight.
Proven and Probable Reserves: The definition of proven and probable reserves is set forth in SEC Industry Guide 7. Proven reserves are reserves for which (a) quantity is computed from dimensions revealed in outcrops, trenches, workings or drill holes, grade and/or quality are computed from the results of detailed sampling and (b) the sites for inspection, sampling and measurement are spaced so closely and the geological character is so well defined that size, shape, depth and mineral content of the reserves are well‑established. Probable reserves are reserves for which quantity and grade and/or quality are computed from information similar to that used for proven (measured) reserves, but the sites for inspection, sampling, and measurement are farther apart or are otherwise less adequately spaced. The degree of assurance, although lower than that for proven (measured) reserves, is high enough to assume continuity between points of observations.
Mineral property interests, Plant and Equipment and Mine Development costs
Mineral property interests: Mineral property interests include acquired interests in production, advanced-stage properties and exploration stage properties, which are considered tangible assets. The amount capitalized relating to a mineral
62
property interest represents its fair value at the time of acquisition, either as an individual asset purchase or as a part of a business combination provided that a reasonable expectation exists that the property includes mineral resources.
The value of mineral property interests is primarily driven by the nature and amount of mineralized material believed to be contained in the properties. When proven and probable reserves as defined by SEC Industry Guide 7 exist, the relevant capitalized costs and mineral property interests are to be charged to expense based on the units of production method and upon commencement of production. However, when a property does not contain mineralized material that satisfies the definition of proven and probable reserves, the amortization of the capitalized costs and mineral property interests are charged to expense based on the most appropriate method, which includes straight-line method and units-of-production method over the estimated useful life of the mine, as determined by our internal mine plans.
Mine Development Costs: Mine development costs include engineering and metallurgical studies, drilling and other related costs to delineate an ore body, and the removal of overburden to initially expose an ore body at open pit surface mines and building of access paths and other infrastructure to gain access to the ore body at underground mines. Capitalization of mine development costs that meet the definition of an asset begins once proven and probable reserves as defined by SEC Industry Guide 7 have been defined. These costs would be capitalized to Mineral Property Interests. Absent of proven and probable reserves, as defined by SEC Industry Guide 7, these costs are charged to expense as incurred.
Drilling and related costs are capitalized for an ore body where proven and probable reserves exist and the activities are directed at obtaining additional information, providing greater definition of the ore body or converting non-reserve mineralization to proven and probable reserves and the benefit is expected to be realized over a period beyond one year. All other drilling and related costs are expensed as incurred. However, drilling costs specifically incurred during the production stage for the purpose of operational ore control rather than obtaining additional information on the ore body are expensed and allocated to inventory costs and then included as a component of Production costs applicable to sales as the revenue from the sale of inventory occurs.
Pre-stripping costs incurred to access the ore body at an open pit mine prior to the production stage are capitalized during the development phase of the mine provided that the proven and probable reserves have been defined. Where multiple open pits exist at a mine, pre-stripping costs are capitalized separately to each pit. The production stage commences when the commercial production point has been achieved. Stripping costs incurred during the production stage of a mine are included as part of inventory costs and then included as a component of Production costs applicable to sales as the revenue from the sale of inventory occurs.
All capitalized mine development costs are amortized using the units of production method over the estimated life of the ore body based on recoverable ounces to be mined from proven and probable reserves. However, costs incurred to access specific areas that only provide benefit over the life of that area are amortized over the estimated life of that specific area.
Plant and Equipment: For properties where the Company established proven and probable reserves as defined by SEC Industry Guide 7, expenditures for plant and equipment and expenditures that extend the useful lives of existing plant and equipment are capitalized and recorded at cost. Plant and equipment are depreciated using the straight-line method over the estimated productive lives of the asset.
For properties where the Company did not establish proven and probable reserves as defined by SEC Industry Guide 7, substantially all costs, including design, engineering, construction, and installation of equipment are expensed as incurred. Only certain types of equipment which have alternative uses or significant salvage value, may be capitalized without proven and probable reserves.
Construction-in-progress (CIP) costs: Assets under construction are capitalized as Construction-in-progress until the asset is available for operational use. The cost of construction-in-progress comprises its purchase price and any costs directly attributable to bringing it into working condition for its intended use. Assets under construction are not amortized until the end of the construction period or once commercial production is achieved. Upon achieving the production stage, the capitalized construction costs are transferred to the appropriate category of Plant and Equipment.
Impairment of Long-lived Assets: The Company reviews and evaluates its long-lived assets for impairment when events or changes in circumstances indicate that the related carrying amounts may not be recoverable. Once it is determined that impairment exists, an impairment loss is measured as the amount by which the asset carrying value exceeds its fair value.
63
For the purpose of recognition and measurement of impairment, the Company groups its long-lived assets by specific mine or project, as this represents the lowest level for which there are identifiable cash flows.
For asset groups where impairment loss is determined using the undiscounted future net cash flows method or discounted future net cash flows method, future cash flows are estimated based on quantities of recoverable mineralized material, expected gold and silver prices (considering current and historical prices, trends and related factors), production levels, operating costs, capital requirements and reclamation costs, all based on life-of-mine plans. The term “recoverable mineralized material” refers to the estimated amount of gold or other commodities that will be obtained after taking into account losses during processing and treatment of mineralized material. The Company’s estimates of future cash flows are based on numerous assumptions and it is possible that actual future cash flows will be significantly different than the estimates, as actual future quantities of recoverable minerals, gold, silver and other commodity prices, production levels and costs of capital are each subject to significant risks and uncertainties.
For asset groups where the Company is unable to determine a reliable estimate of undiscounted future net cash flows, the Company adopts a market approach to estimate fair value by using a combination of observed market value per square mile and observed market value per ounce or pound of mineral material based on comparable transactions.
Asset Retirement Obligation, reclamation and remediation costs: The Company records the fair value of a liability for an asset retirement obligation (“ARO”) in the period that it is incurred if a reasonable estimate of fair value can be made. The associated asset retirement costs are capitalized as part of the carrying amount of the long-lived asset when proven or probable reserves exist, or if they relate to an acquired mineral property interest. Periodic accretion is recorded to ARO and charged to operations. Subsequent upward ARO cost revisions are capitalized only with respect to properties with proven or probable reserves, these being San Jose, Black Fox and Gold Bar. Upward adjustments to the fair value of the ARO on properties that do not contain proven or probable reserves are charged to expense. The fair value of ARO is measured by discounting the expected cash flows adjusted for inflation, using a credit-adjusted risk free rate of interest. The Company prepares estimates of the timing and amounts of expected cash flows when an ARO is incurred, which are updated to reflect changes in facts and circumstances. Estimation of the fair value of AROs requires significant judgment, including amount of cash flows, timing of reclamation, inflation rate and credit risk.
Ongoing environmental and reclamation expenditures are debited against the ARO liability as incurred to the extent they relate to the ARO liability and to expense to the extent they do not.
Revenue Recognition: Revenue consists of sales value received for the Company’s principal products, gold and silver. The Company currently does not earn revenue from any products other than gold and silver. Revenue is recognized when title to gold and silver passes to the buyer and when collectability is reasonably assured. Title passes to the buyer based on terms of the sales contract. Product pricing is determined under the sales agreements which are referenced against active and freely traded commodity markets, for example, the London Bullion Market for both gold and silver, in an identical form to the product sold.
Gold and silver doré produced from the San José mine is sold at the prevailing spot market price based on the London A.M. fix, while concentrates are sold at the prevailing spot market price based on either the London P.M. fix or average of the London A.M. and London P.M. fix depending on the sales contract. Concentrates are provisionally priced, whereby the selling price is subject to final adjustments at the end of a period ranging from 30 to 90 days after delivery to the customer. The final price is based on the market price at the relevant quotation point stipulated in the contract. Due to the time elapsed between shipment and the final settlement with the buyer, MSC must estimate the prices at which sales of metals will be settled. At the end of each financial reporting period, previously recorded provisional sales are adjusted to estimated settlement metals prices based on relevant forward market prices until final settlement with the buyer.
The Company entered into a doré sales agreement with a Canadian financial institution in July 2012. Under that agreement, the Company has the option to sell to the institution approximately 90% of the gold and silver contained in doré bars prior to the completion of refining by the third party refiner, which normally takes approximately 15 business days. Revenue is recognized when the Company has provided irrevocable instructions to the refiner to transfer to the purchaser the refined ounces sold upon final processing outturn, and when payment of the purchase price for the purchased doré or bullion has been made in full by the purchaser.
Stock‑Based Compensation: The Company accounts for stock options at fair value as prescribed in ASC 718. The Company estimates the fair value of each stock option at the grant date by using the Black-Scholes option-pricing model and provides for expense recognition over the service period, if any, of the stock option. The Company's
64
estimates may be impacted by certain variables including, but not limited to, stock price volatility, employee stock option exercise behavior and estimates of forfeitures.
Flow-through Shares: Current Canadian tax legislation permits mining entities to issue flow-through shares to investors whereby the deductions for tax purposes related to resource exploration and evaluation expenditures may be claimed by investors instead of the entity, subject to a renouncement process. Under ASC 740, proceeds from the issuance of flow-through shares are allocated first to the common stock based on the underlying quoted price of common shares and the residual amount is allocated to the sale of tax benefits, classified as a liability. As the Company incurs qualifying exploration and evaluation expenditures to fulfill its obligation, the liability is drawn down and the sale of tax benefits is recognized in the Consolidated Statement of Operations and Comprehensive Loss (Income) as a reduction of deferred tax expense.
Income and Mining Taxes: The Company accounts for income and mining taxes under ASC 740 using the liability method, recognizing certain temporary differences between the financial reporting basis of liabilities and assets and the related tax basis for such liabilities and assets. This method generates either a net deferred income and mining tax liability or asset for the Company, as measured by the statutory tax rates in effect. The Company derives the deferred income and mining tax charge or benefit by recording the change in either the net deferred income and mining tax liability or asset balance for the year. The Company records a valuation allowance against any portion of those deferred income and mining tax assets when it believes, based on the weight of available evidence, it is more likely than not that some portion or all of the deferred income and mining tax asset will not be realized.
This report contains or incorporates by reference “forward‑looking statements”, as that term is used in federal securities laws, about our financial condition, results of operations and business. These statements include, among others:
|
· |
statements about our anticipated exploration results, cost and feasibility of production, receipt of permits or other regulatory or government approvals and plans for the development of our properties; |
|
· |
statements concerning the benefits or outcomes that we expect will result from our business activities and certain transactions that we contemplate or have completed, such as receipt of proceeds, increased revenues, decreased expenses and avoided expenses and expenditures; and |
|
· |
statements of our expectations, beliefs, future plans and strategies, anticipated developments and other matters that are not historical facts. |
These statements may be made expressly in this document or may be incorporated by reference to other documents that we will file with the SEC. Many of these statements can be found by looking for words such as “believes”, “expects”, “anticipates”, “estimates” or similar expressions used in this report or incorporated by reference in this report.
Forward‑looking statements and information are based upon a number of estimates and assumptions that, while considered reasonable by management, are inherently subject to significant business, economic and competitive uncertainties, risks and contingencies, and there can be no assurance that such statements and information will prove to be accurate. Therefore, actual results and future events could differ materially from those anticipated in such statements and information.
Included among the forward-looking statements and information provided on this document is production guidance. On an annual basis, we develop a consolidated budget, based on stand-alone budgets for each operating mine. In developing the mine production portion of the budget, we evaluate a number of factors and assumptions, which include, but are not limited to:
|
· |
gold and silver price forecasts; |
|
· |
average gold and silver grade mined, using a resource model; |
|
· |
average grade processed by the crushing facility (El Gallo 1 mine) or milling facility (San José mine and Black Fox mine); |
|
· |
expected tonnes moved and strip ratios; |
|
· |
available stockpile material (grades, tonnes, and accessibility); |
65
|
· |
estimates of in process inventory (either on the leach pad or plant for the El Gallo 1 mine, or in the mill facility for the San José mine and Black Fox mine); |
|
· |
estimated leach recovery rates and leach cycle times (El Gallo 1 mine); |
|
· |
estimated mill recovery rates (San José mine and Black Fox mine); |
|
· |
dilution of material processed; |
|
· |
internal and contractor equipment and labor availability; and |
|
· |
seasonal weather patterns. |
Actual production results are sensitive to variances in any of the key factors and assumptions noted above. As a result, we frequently evaluate and reconcile actual results to budgeted results to determine if key assumptions and estimates require modification. Any changes will, in turn, influence production guidance.
We caution not to put undue reliance on these statements, which speak only as of the date of this report. Further, the information contained in this document or incorporated herein by reference is a statement of our present intention and is based on present facts and assumptions, and may change at any time and without notice, based on changes in such facts or assumptions. Readers should not place undue reliance on forward‑looking statements.
Risk Factors Impacting Forward‑Looking Statements
The important factors that could prevent us from achieving our stated goals and objectives include, but are not limited to, those set forth in other “Risk Factors” section in this report and the following:
|
· |
our ability to raise funds required for the execution of our business strategy; |
|
· |
our ability to secure permits or other regulatory and government approvals needed to operate, develop or explore our mineral properties and projects; |
|
· |
decisions of foreign countries, banks and courts within those countries; |
|
· |
unexpected changes in business, economic, and political conditions; |
|
· |
operating results of MSC; |
|
· |
fluctuations in interest rates, inflation rates, currency exchange rates, or commodity prices; |
|
· |
timing and amount of mine production; |
|
· |
our ability to retain and attract key personnel; |
|
· |
technological changes in the mining industry; |
|
· |
changes in operating, exploration or overhead costs; |
|
· |
access and availability of materials, equipment, supplies, labor and supervision, power and water; |
|
· |
results of current and future exploration activities; |
|
· |
results of pending and future feasibility studies or the expansion or commencement of mining operations without feasibility studies having been completed; |
|
· |
changes in our business strategy; |
|
· |
interpretation of drill hole results and the geology, grade and continuity of mineralization; |
|
· |
the uncertainty of reserve estimates and timing of development expenditures; |
|
· |
litigation or regulatory investigations and procedures affecting us; |
|
· |
local and community impacts and issues including criminal activity and violent crimes; |
|
· |
accidents, public health issues, and labor disputes; |
|
· |
our continued listing on a public exchange; |
66
|
· |
uncertainty relating to title to mineral properties; and |
|
· |
changes in relationships with the local communities in the areas in which we operate. |
We undertake no responsibility or obligation to update publicly these forward‑looking statements, except as required by law and may update these statements in the future in written or oral statements. Investors should take note of any future statements made by or on our behalf.
67
ITEM 7A. QUANTITATIVE AND QUALITATIVE DISCLOSURE ABOUT MARKET RISK
Our exposure to market risks includes, but is not limited to, the following risks: changes in foreign currency exchange rates, equity price risks, commodity price fluctuations and credit risk. We do not use derivative financial instruments as part of an overall strategy to manage market risk.
Foreign Currency Risk
In general, the depreciation of non-U.S. dollar currencies with respect to U.S. dollar has a positive effect on our costs and liabilities while it has a negative effect on our assets denominated in non-U.S. dollar currency. Although we transact most of our business in U.S. dollars, some expenses, labor, operating supplies and property and equipment are denominated in Canadian dollars, Mexican pesos or Argentine pesos.
Since 2008, the Argentine peso has been steadily devaluing against the U.S. dollar by 10-35% on an annual basis. As noted in the graph below, during the year ended December 31, 2017, the Argentine peso devalued 17% compared to devaluations of 22% and 28% in 2016 and 2015. During the year ended December 31, 2017, the Mexican peso increased in value by 7% against the US dollar, compared to devaluations of 20% during 2016 and 2015.
For the same period in 2017, the Canadian dollar increased in value by 4% in 2017, compared to a 3% increase during the 2016 year.
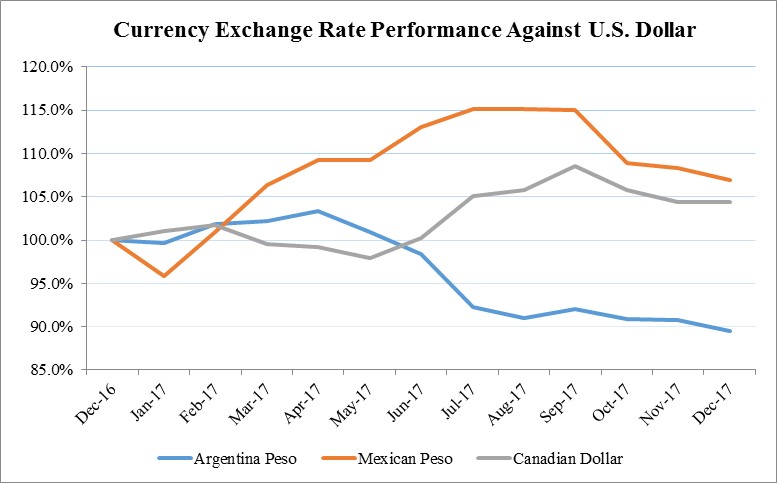
The value of cash and cash equivalents denominated in foreign currencies also fluctuates with changes in currency exchange rates. Appreciation of non‑U.S. dollar currencies results in a foreign currency gain on such investments and a depreciation in non‑U.S. dollar currencies results in a loss. We have not utilized material market risk‑sensitive instruments to manage our exposure to foreign currency exchange rates but may in the future actively manage our exposure to foreign currency exchange rate risk. We hold portions of our cash reserves in non‑U.S. dollar currencies.
As of December 31, 2017, we also had cash and cash equivalent balances in Mexican pesos. The total balance of 7,375,818 Mexican pesos was held by our subsidiary as of December 31, 2017, which was equivalent to approximately $0.4 million, for which a 1% change in the Mexican peso would have resulted in a gain/loss of $0.01 million in the Consolidated Statement of Operations and Comprehensive (Loss) Income.
68
We also have Argentinian peso cash and cash equivalent holdings. The total balance of 49,097,386 Argentinian pesos was held by our subsidiary as of December 31, 2017, which was equivalent to approximately $2.6 million, for which a 1% change in the Argentinian peso would have resulted in a gain/loss of $0.03 million in the Consolidated Statement of Operations and Comprehensive (Loss) Income.
Based on our Canadian dollar holdings of $6.8 million (C$8.5 million) at December 31, 2017, a 1% change in the Canadian dollar would result in a gain/loss of $0.07 million in the Consolidated Statement of Operations and Comprehensive (Loss) Income.
MSC holds a portion of its local cash balances in Argentine pesos and is therefore exposed to the effects of this continued devaluation and also the risk that there may be a sudden severe devaluation of the Argentine peso. A severe devaluation could result in material foreign exchange losses as reported in U.S. dollars.
We are also subject to foreign currency risk on the fluctuation of the Mexican peso on our VAT receivable balance. As of December 31, 2017, our VAT receivable balance was 103,096,392 Mexican pesos, net of provision, equivalent to approximately $5.2 million, for which a 1% change in the Mexican peso would have resulted in a gain/loss of $0.1 million in the Consolidated Statement of Operations and Comprehensive (Loss) Income.
We do not hold significant liabilities in non-U.S. dollar currencies.
Equity Price Risk
We have in the past sought and will likely in the future seek to acquire additional funding by sale of common stock. Movements in the price of our common stock have been volatile in the past, and may also be volatile in the future. As a result, there is a risk that we may not be able to sell common stock at an acceptable price to meet future funding requirements.
Commodity Price Risk
We produce and sell gold and silver, therefore changes in the price of gold and silver could significantly affect our results of operations and cash flows in the future. We have in the past and may in the future hold a portion of our treasury in gold and silver bullion, where the value is recorded at the lower of cost or market. Gold and silver prices fluctuate widely from time to time. At December 31, 2017, we had no gold or silver sales subject to final pricing. Based on our revenues from gold and silver sales of $67.5 million for the year ended December 31, 2017, a 10% change in the price of gold and silver would have had an impact of approximately $6.7 million on our revenues.
Silver and gold prices have also a material impact on MSC’s results of operations. MSC has embedded derivatives arising from the sale of concentrate and doré which were provisionally priced at the time the sale was recorded. Therefore, fluctuations in gold and silver prices could have a significant impact on MSC’s results of operations.
Credit Risk
We may be exposed to credit loss through our precious metals and doré sales agreements with Canadian financial institutions if these institutions are unable to make payment in accordance with the terms of the agreement. However, based on the history and financial condition of our counterparties, we do not anticipate any of the financial institutions will default on their obligations. As of December 31, 2017, we do not believe we have any significant credit exposure associated with precious metals or doré sales agreements.
In Mexico, we are exposed to credit loss regarding our VAT taxes receivable, if the Mexican tax authorities are unable or unwilling to make payments in accordance with our monthly filings. Timing of collection on VAT receivables is uncertain as VAT refund procedures require a significant amount of information and follow‑up. The risk is mitigated to the extent that the VAT receivable balance can be applied against future income taxes payable. However, at this time we are uncertain when, if ever, our Mexican operations will generate sufficient taxable operating profits to offset this receivable against taxes payable.
69
In Nevada, and Ontario, Canada we are required to provide security to cover our projected reclamation costs. We have surety bonds of $36.5 million in place to satisfy bonding requirements for this purpose. The bonds have an annual fee of 2% of their value. Although we do not believe we have any significant credit exposure associated with these bonds, we are exposed to the risk that the surety bonds may no longer be accepted by the governmental agencies as satisfactory reclamation coverage, in which case we would be required to replace the surety bonding with cash.
ITEM 8. FINANCIAL STATEMENTS AND SUPPLEMENTARY DATA
|
Index to Financial Statements: |
|
|
|
|
|
|
|
Management’s Report on Internal Control Over Financial Reporting |
|
71 |
|
|
|
|
|
|
72 | |
|
|
|
|
|
|
76 | |
|
|
|
|
|
Consolidated Balance Sheets as of December 31, 2017 and 2016 |
|
77 |
|
|
|
|
|
|
78 | |
|
|
|
|
|
Consolidated Statements of Cash Flows for the years ended December 31, 2017, 2016 and 2015 |
|
79 |
|
|
|
|
|
|
80 |
70
MANAGEMENT’S REPORT ON INTERNAL CONTROL OVER FINANCIAL REPORTING
Management of the Company is responsible for establishing and maintaining adequate internal control over financial reporting. The Securities Exchange Act of 1934 defines internal control over financial reporting in Rule 13a‑15(f) and 15d‑15(f) as a process designed by, or under the supervision of, the Company’s principal executive and principal financial officers and effected by the Company’s board of directors, management and other personnel, to provide reasonable assurance regarding the reliability of financial reporting and the preparation of financial statements for external purposes in accordance with generally accepted accounting principles and includes those policies and procedures that:
|
· |
Pertain to the maintenance of records that in reasonable detail accurately and fairly reflect the transactions and dispositions of the assets of the Company; |
|
· |
Provide reasonable assurance that transactions are recorded as necessary to permit preparation of financial statements in accordance with generally accepted accounting principles, and that receipts and expenditures of the Company are being made only in accordance with authorizations of management and the board of directors of the Company; and |
|
· |
Provide reasonable assurance regarding prevention or timely detection of unauthorized acquisition, use or disposition of the Company’s assets that could have a material effect on the consolidated financial statements. |
Because of its inherent limitations, internal control over financial reporting may not prevent or detect misstatements. Also, projections of any evaluation of effectiveness to future periods are subject to risk that controls may become inadequate because of changes in conditions, or that the degree of compliance with the policies or procedures may deteriorate.
On October 2, 2017, the McEwen Mining Inc. acquired 100% of the Black Fox Complex from Primero Mining Corporation. The financial information for this acquisition is included in Item 7. Management’s Discussion and Analysis of Financial Condition and Results of Operations and in Note 19 to the Consolidated Financial Statements. As permitted by Securities and Exchange Commission guidance, management's evaluation of the Company's internal control over financial reporting did not include an evaluation of the internal controls of the Black Fox Complex and management's conclusion regarding the effectiveness of the Company's internal control over financial reporting does not extend to the internal controls at the Black Fox Complex. The Black Fox Complex represents 9% and 5% of the Company’s total and net assets, respectively. As of December 31, 2017; Black Fox contributed 17% of McEwen Mining Inc.’s revenues and reported a 7% net income, which contributed to reduce McEwen Mining Inc.’s consolidated net loss.
The Company’s management assessed the effectiveness of the Company’s internal control over financial reporting as of December 31, 2017. In making this assessment, the Company’s management used the criteria set forth by the Committee of Sponsoring Organizations of the Treadway Commission (COSO) in Internal Control—Integrated Framework (2013). Based upon its assessment, management concluded that, as of December 31, 2017, the Company’s internal control over financial reporting was effective based upon those criteria.
Ernst & Young LLP, an independent registered public accounting firm, has audited the effectiveness of the Company’s internal control over financial reporting as of December 31, 2017.
71
REPORT OF INDEPENDENT REGISTERED PUBLIC ACCOUNTING FIRM
To the Shareholders and the Board of Directors of McEwen Mining Inc.
Opinion on the Consolidated Financial Statements
We have audited the accompanying consolidated balance sheets of McEwen Mining Inc. (the "Company") as of December 31, 2017 and 2016, the related consolidated statements of operations and comprehensive (loss) income, shareholders’ equity and cash flows for the years then ended, and the related notes (collectively referred to as the “consolidated financial statements"). In our opinion, the consolidated financial statements present fairly, in all material respects, the financial position of the Company as of December 31, 2017 and 2016, and the results of its operations and its consolidated cash flows for the years then ended in conformity with U.S. generally accepted accounting principles.
Report on Internal Control Over Financial Reporting
We also have audited, in accordance with the standards of the Public Company Accounting Oversight Board (United States) (“PCAOB”), the Entity’s internal control over financial reporting as of December 31, 2017, based on the criteria established in Internal Control – Integrated Framework (2013) issued by the Committee of Sponsoring Organizations of the Treadway Commission (COSO), and our report dated February 21, 2018 expressed an unqualified opinion on the effectiveness of the Company's internal control over financial reporting.
Basis for Opinion
These consolidated financial statements are the responsibility of the Company's management. Our responsibility is to express an opinion on the Company's consolidated financial statements based on our audits. We are a public accounting firm registered with the PCAOB and are required to be independent with respect to the Company in accordance with the U.S. federal securities laws and the applicable rules and regulations of the Securities and Exchange Commission and the PCAOB.
We conducted our audits in accordance with the standards of the PCAOB. Those standards require that we plan and perform the audit to obtain reasonable assurance about whether the consolidated financial statements are free of material misstatement, whether due to error or fraud. Our audits included performing procedures to assess the risks of material misstatement of the consolidated financial statements, whether due to error or fraud, and performing procedures that respond to those risks. Such procedures included examining, on a test basis, evidence regarding the amounts and disclosures in the consolidated financial statements. Our audits also included evaluating the accounting principles used and significant estimates made by management, as well as evaluating the overall presentation of the consolidated financial statements. We believe that our audits provide a reasonable basis for our opinion.
/s/ Ernst & Young LLP
We have served as the Company's auditor since 2016.
Toronto, Canada
February 21, 2018
72
Report of Independent Registered Public Accounting Firm
To the Shareholders and the Board of Directors of McEwen Mining Inc.
Opinion on Internal Control over Financial Reporting
We have audited McEwen Mining Inc.’s internal control over financial reporting as of December 31, 2017, based on criteria established in Internal Control—Integrated Framework issued by the Committee of Sponsoring Organizations of the Treadway Commission (2013 framework) (the COSO criteria). In our opinion, McEwen Mining Inc. (the “Company”) maintained, in all material respects, effective internal control over financial reporting as of December 31, 2017, based on the COSO criteria.
As indicated in the accompanying Management’s Report on Internal Control over Financial Reporting, management’s assessment of and conclusion on the effectiveness of internal control over financial reporting did not include the internal controls of Black Fox Complex (“Black Fox”) which is included in the 2017 consolidated financial statements of McEwen Mining Inc. and constituted 9% and 5% of McEwen Mining Inc.’s total and net assets, respectively. As of December 31, 2017; Black Fox contributed 17% of McEwen Mining Inc.’s revenues and reported a 7% net income, which contributed to reduce McEwen Mining Inc.’s consolidated net loss, for the year then ended. Our audit of internal control over financial reporting of McEwen Mining Inc. also did not include an evaluation of the internal control over financial reporting of Black Fox.
We also have audited, in accordance with the standards of the Public Company Accounting Oversight Board (United States) (PCAOB), the consolidated balance sheets of McEwen Mining Inc. (the "Company") as of December 31, 2017 and 2016, the related consolidated statements of operations and comprehensive (loss) income, shareholders’ equity and cash flows for the years then ended, and the related notes (collectively referred to as the “consolidated financial statements") and our report dated February 21, 2018 expressed an unqualified opinion thereon.
Basis for Opinion
The Company’s management is responsible for maintaining effective internal control over financial reporting and for its assessment of the effectiveness of internal control over financial reporting included in the accompanying Management’s Report on Internal Control over Financial Reporting. Our responsibility is to express an opinion on the Company’s internal control over financial reporting based on our audit. We are a public accounting firm registered with the PCAOB and are required to be independent with respect to the Company in accordance with the U.S. federal securities laws and the applicable rules and regulations of the Securities and Exchange Commission and the PCAOB.
We conducted our audit in accordance with the standards of the PCAOB. Those standards require that we plan and perform the audit to obtain reasonable assurance about whether effective internal control over financial reporting was maintained in all material respects. Our audit included obtaining an understanding of internal control over financial reporting, assessing the risk that a material weakness exists, testing and evaluating the design and operating effectiveness of internal control based on the assessed risk, and performing such other procedures as we considered necessary in the circumstances. We believe that our audit provides a reasonable basis for our opinion.
Definition and Limitations of Internal Control Over Financial Reporting
A company’s internal control over financial reporting is a process designed to provide reasonable assurance regarding the reliability of financial reporting and the preparation of financial statements for external purposes in accordance with generally accepted accounting principles. A company’s internal control over financial reporting includes those policies and procedures that (1) pertain to the maintenance of records that, in reasonable detail, accurately and fairly reflect the transactions and dispositions of the assets of the company; (2) provide reasonable assurance that transactions are recorded as necessary to permit preparation of financial statements in accordance with generally accepted accounting principles, and that receipts and expenditures of the company are being made only in accordance with authorizations of management and directors of the company; and (3) provide reasonable assurance regarding prevention or timely detection of unauthorized acquisition, use, or disposition of the company’s assets that could have a material effect on the financial statements.
73
Because of its inherent limitations, internal control over financial reporting may not prevent or detect misstatements. Also, projections of any evaluation of effectiveness to future periods are subject to the risk that controls may become inadequate because of changes in conditions, or that the degree of compliance with the policies or procedures may deteriorate.
/s/ Ernst & Young LLP
Toronto, Canada
February 21, 2018
74
REPORT OF INDEPENDENT REGISTERED PUBLIC ACCOUNTING FIRM
The Board of Directors and Shareholders
McEwen Mining Inc.:
Opinion on the Consolidated Financial Statements
We have audited the accompanying consolidated statements of operations and comprehensive income (loss), shareholders’ equity and cash flows of McEwen Mining Inc. (the “Company”) for the year ended December 31, 2015 and the related notes (collectively, the consolidated financial statements). In our opinion, the consolidated financial statements present fairly, in all material respects, the results of operations of the Company, and its cash flows for the year ended December 31, 2015, in conformity with U.S. generally accepted accounting principles.
Basis for Opinion
These consolidated financial statements are the responsibility of the Company’s management. Our responsibility is to express an opinion on the consolidated financial statements based on our audits. We are a public accounting firm registered with the Public Company Accounting Oversight Board (United States) (PCAOB) and are required to be independent with respect to the Company in accordance with the U.S. federal securities laws and the applicable rules and regulations of the Securities and Exchange Commission and the PCAOB.
We conducted our audit in accordance with the standards of the PCAOB. Those standards require that we plan and perform the audit to obtain reasonable assurance about whether the consolidated financial statements are free of material misstatement, whether due to error or fraud. Our audit included performing procedures to assess the risks of material misstatement of the consolidated financial statements, whether due to error or fraud, and performing procedures that respond to those risks. Such procedures included examining, on a test basis, evidence regarding the amounts and disclosures in the consolidated financial statements. Our audit also included evaluating the accounting principles used and significant estimates made by management, as well as evaluating the overall presentation of the consolidated financial statements. We believe that our audit provides a reasonable basis for our opinion.
/s/ KPMG LLP
Chartered Professional Accountants, Licensed Public Accountants
We served as the Company’s auditor from 2009 to 2015.
Toronto, Canada
March 11, 2016
75
MCEWEN MINING INC.
CONSOLIDATED STATEMENTS OF OPERATIONS AND COMPREHENSIVE INCOME (LOSS)
FOR THE YEARS ENDED DECEMBER 31,
(in thousands of U.S. dollars, except per share amounts)
|
|
|
|
|
|
|
|
|
|
|
|
|
|
|
|
|
2017 |
|
2016 |
|
2015 |
|
|||
|
REVENUE: |
|
|
|
|
|
|
|
|
|
|
|
|
Gold and silver sales |
|
|
$ |
67,465 |
|
$ |
60,388 |
|
$ |
72,956 |
|
|
Other revenue |
|
|
|
259 |
|
|
— |
|
|
— |
|
|
|
|
|
|
67,724 |
|
|
60,388 |
|
|
72,956 |
|
|
COSTS AND EXPENSES: |
|
|
|
|
|
|
|
|
|
|
|
|
Production costs applicable to sales |
|
|
|
45,180 |
|
|
28,133 |
|
|
34,607 |
|
|
Mine development costs |
|
|
|
3,837 |
|
|
3,866 |
|
|
1,169 |
|
|
Exploration costs |
|
|
|
17,714 |
|
|
7,959 |
|
|
8,798 |
|
|
Property holding costs |
|
|
|
3,879 |
|
|
3,536 |
|
|
4,336 |
|
|
General and administrative costs |
|
|
|
18,872 |
|
|
12,734 |
|
|
12,045 |
|
|
Loss (income) from investment in Minera Santa Cruz S.A., net of amortization (note 7) |
|
|
|
44 |
|
|
(12,951) |
|
|
(2,414) |
|
|
Depreciation |
|
|
|
1,453 |
|
|
1,169 |
|
|
942 |
|
|
Revision of estimates and accretion of asset reclamation obligations (note 8) |
|
|
|
2,061 |
|
|
595 |
|
|
429 |
|
|
Impairment of investment in Minera Santa Cruz S.A. (note 7) |
|
|
|
— |
|
|
— |
|
|
11,777 |
|
|
Impairment of mineral property interests and property and equipment (notes 5 and 6) |
|
|
|
711 |
|
|
— |
|
|
50,600 |
|
|
Total costs and expenses |
|
|
|
93,751 |
|
|
45,041 |
|
|
122,289 |
|
|
Operating (loss) income |
|
|
|
(26,027) |
|
|
15,347 |
|
|
(49,333) |
|
|
OTHER (EXPENSE) INCOME: |
|
|
|
|
|
|
|
|
|
|
|
|
Interest and other (expense) income: |
|
|
|
(938) |
|
|
835 |
|
|
2,404 |
|
|
Gain on sale of assets |
|
|
|
11 |
|
|
24 |
|
|
13 |
|
|
Gain on sale of marketable equity securities (note 3) |
|
|
|
840 |
|
|
22 |
|
|
— |
|
|
Other-than-temporary impairment on marketable equity securities (note 3) |
|
|
|
(356) |
|
|
(882) |
|
|
— |
|
|
Unrealized (loss) gain on derivatives (note 3) |
|
|
|
(227) |
|
|
1,379 |
|
|
— |
|
|
Foreign currency (loss) gain |
|
|
|
694 |
|
|
581 |
|
|
1,906 |
|
|
Total other income |
|
|
|
24 |
|
|
1,959 |
|
|
4,323 |
|
|
(Loss) Income before income and mining taxes |
|
|
|
(26,003) |
|
|
17,306 |
|
|
(45,010) |
|
|
Income and mining tax recovery (note 9) |
|
|
|
15,369 |
|
|
3,749 |
|
|
24,560 |
|
|
Net (loss) income |
|
|
|
(10,634) |
|
|
21,055 |
|
|
(20,450) |
|
|
OTHER COMPREHENSIVE (LOSS) INCOME: |
|
|
|
|
|
|
|
|
|
|
|
|
Reclassification of unrealized gain on marketable securities disposed of during the period, net of taxes (note 3) |
|
|
|
(840) |
|
|
— |
|
|
— |
|
|
Other-than-temporary impairment on marketable equity securities (note 3) |
|
|
|
356 |
|
|
882 |
|
|
— |
|
|
Unrealized gain (loss) on marketable equity securities, net of $0.5 million, $0.5 million and $nil, tax benefit, respectively |
|
|
|
1,818 |
|
|
1,609 |
|
|
(949) |
|
|
Comprehensive (loss) income |
|
|
$ |
(9,300) |
|
$ |
23,546 |
|
$ |
(21,399) |
|
|
Net (loss) income per share (note 12): |
|
|
|
|
|
|
|
|
|
|
|
|
Basic |
|
|
$ |
(0.03) |
|
$ |
0.07 |
|
$ |
(0.07) |
|
|
Diluted |
|
|
$ |
(0.03) |
|
$ |
0.07 |
|
$ |
(0.07) |
|
|
Weighted average common shares outstanding (thousands) (note 12): |
|
|
|
|
|
|
|
|
|
|
|
|
Basic |
|
|
|
313,887 |
|
|
298,772 |
|
|
300,341 |
|
|
Diluted |
|
|
|
313,887 |
|
|
300,474 |
|
|
300,341 |
|
|
|
|
|
|
|
|
|
|
|
|
|
|
|
Return of capital distribution declared per common share (note 10) |
|
|
$ |
0.010 |
|
$ |
0.005 |
|
$ |
0.010 |
|
The accompanying notes are an integral part of these consolidated financial statements.
76
MCEWEN MINING INC.
AS AT DECEMBER 31,
(in thousands of U.S. dollars)
|
|
|
December 31, |
|
December 31, |
|
||
|
|
|
2017 |
|
2016 |
|
||
|
ASSETS |
|
|
|
|
|
|
|
|
Current assets: |
|
|
|
|
|
|
|
|
Cash and cash equivalents |
|
$ |
27,153 |
|
$ |
37,440 |
|
|
Investments (note 3) |
|
|
7,971 |
|
|
8,543 |
|
|
Value added taxes receivable |
|
|
5,250 |
|
|
4,304 |
|
|
Inventories (note 4) |
|
|
31,951 |
|
|
26,620 |
|
|
Restricted cash (note 21) |
|
|
10,000 |
|
|
— |
|
|
Other current assets |
|
|
4,539 |
|
|
1,667 |
|
|
Total current assets |
|
|
86,864 |
|
|
78,574 |
|
|
Mineral property interests, net (note 5) |
|
|
293,437 |
|
|
242,640 |
|
|
Plant and equipment, mine development and construction in progress, net (note 6) |
|
|
51,046 |
|
|
14,252 |
|
|
Investment in Minera Santa Cruz S.A. (note 7) |
|
|
150,064 |
|
|
162,320 |
|
|
Other assets (note 4 and note 13) |
|
|
10,718 |
|
|
532 |
|
|
TOTAL ASSETS |
|
$ |
592,129 |
|
$ |
498,318 |
|
|
LIABILITIES & SHAREHOLDERS’ EQUITY |
|
|
|
|
|
|
|
|
Current liabilities: |
|
|
|
|
|
|
|
|
Accounts payable and accrued liabilities |
|
$ |
34,880 |
|
$ |
20,044 |
|
|
Flow-through share premium (note 10) |
|
|
1,643 |
|
|
— |
|
|
Current portion of capital lease liabilities (note 20) |
|
|
470 |
|
|
— |
|
|
Current portion of asset retirement obligation (note 8) |
|
|
646 |
|
|
537 |
|
|
Total current liabilities |
|
|
37,639 |
|
|
20,581 |
|
|
Asset retirement obligation, less current portion (note 8) |
|
|
24,076 |
|
|
9,306 |
|
|
Deferred income and mining tax liability (note 9) |
|
|
8,430 |
|
|
23,665 |
|
|
Capital lease liabilities, less current portion (note 20) |
|
|
81 |
|
|
— |
|
|
Other liabilities |
|
|
630 |
|
|
1,727 |
|
|
Total liabilities |
|
$ |
70,856 |
|
$ |
55,279 |
|
|
|
|
|
|
|
|
|
|
|
Shareholders’ equity: |
|
|
|
|
|
|
|
|
Common stock, no par value, 500,000 shares authorized (in thousands); |
|
|
|
|
|
|
|
|
Common: 337,051 as of December 31, 2017 and 299,570 as of December 31, 2016 issued and outstanding (in thousands) (note 10) |
|
|
1,444,056 |
|
|
1,360,345 |
|
|
Warrants (note 10) |
|
|
3,823 |
|
|
— |
|
|
Accumulated deficit |
|
|
(929,606) |
|
|
(918,972) |
|
|
Accumulated other comprehensive income |
|
|
3,000 |
|
|
1,666 |
|
|
Total shareholders’ equity |
|
|
521,273 |
|
|
443,039 |
|
|
TOTAL LIABILITIES & SHAREHOLDERS’ EQUITY |
|
$ |
592,129 |
|
$ |
498,318 |
|
The accompanying notes are an integral part of these consolidated financial statements.
Commitments and contingencies: note 13.
77
MCEWEN MINING INC.
CONSOLIDATED STATEMENTS OF CHANGES IN SHAREHOLDERS’ EQUITY
FOR THE YEARS ENDED DECEMBER 31,
(in thousands of U.S. dollars, except share amounts)
|
|
|
|
|
|
|
|
|
|
|
Accumulated |
|
|
|
|
|
|
|
|
|
|
|
|
|
|
|
|
|
|
|
Other |
|
|
|
|
|
|
|
|
|
|
|
Common Stock |
|
Warrants |
|
Comprehensive |
|
Accumulated |
|
|
|
|
||||||
|
|
|
Shares |
|
Amount |
|
Amount |
|
Income (Loss) |
|
Deficit |
|
Total |
|
|||||
|
Balance, December 31, 2014 |
|
300,100 |
|
$ |
1,360,668 |
|
$ |
— |
|
$ |
124 |
|
$ |
(919,577) |
|
$ |
441,215 |
|
|
Stock-based compensation (note 11) |
|
— |
|
|
1,305 |
|
|
— |
|
|
— |
|
|
— |
|
|
1,305 |
|
|
Return of capital distribution (note 10) |
|
— |
|
|
(1,503) |
|
|
— |
|
|
— |
|
|
— |
|
|
(1,503) |
|
|
Share repurchase (note 10) |
|
(1,896) |
|
|
(1,769) |
|
|
— |
|
|
— |
|
|
— |
|
|
(1,769) |
|
|
Shares issued for settlement of accounts payable |
|
430 |
|
|
443 |
|
|
— |
|
|
— |
|
|
— |
|
|
443 |
|
|
Unrealized loss on available-for-sale securities (note 3) |
|
— |
|
|
— |
|
|
— |
|
|
(949) |
|
|
— |
|
|
(949) |
|
|
Net loss |
|
— |
|
|
— |
|
|
— |
|
|
— |
|
|
(20,450) |
|
|
(20,450) |
|
|
Balance, December 31, 2015 |
|
298,634 |
|
$ |
1,359,144 |
|
$ |
— |
|
$ |
(825) |
|
$ |
(940,027) |
|
$ |
418,292 |
|
|
Stock-based compensation (note 11) |
|
— |
|
|
1,039 |
|
|
— |
|
|
— |
|
|
— |
|
|
1,039 |
|
|
Return of capital distribution (note 10) |
|
— |
|
|
(2,986) |
|
|
— |
|
|
— |
|
|
— |
|
|
(2,986) |
|
|
Share repurchase (note 10) |
|
(558) |
|
|
(582) |
|
|
— |
|
|
— |
|
|
— |
|
|
(582) |
|
|
Exercise of stock options (note 11) |
|
1,494 |
|
|
3,730 |
|
|
— |
|
|
— |
|
|
— |
|
|
3,730 |
|
|
Other-than-temporary impairment on marketable equity securities (note 3) |
|
— |
|
|
— |
|
|
— |
|
|
882 |
|
|
— |
|
|
882 |
|
|
Unrealized gain on available-for-sale securities, net of taxes (note 3) |
|
— |
|
|
— |
|
|
— |
|
|
1,609 |
|
|
— |
|
|
1,609 |
|
|
Net income |
|
— |
|
|
— |
|
|
— |
|
|
— |
|
|
21,055 |
|
|
21,055 |
|
|
Balance, December 31, 2016 |
|
299,570 |
|
$ |
1,360,345 |
|
$ |
— |
|
$ |
1,666 |
|
$ |
(918,972) |
|
$ |
443,039 |
|
|
Stock-based compensation (note 11) |
|
— |
|
|
1,311 |
|
|
— |
|
|
— |
|
|
— |
|
|
1,311 |
|
|
Shares issued in connection with the acquisition of Lexam VG Gold (note 10) |
|
12,687 |
|
|
38,141 |
|
|
— |
|
|
— |
|
|
— |
|
|
38,141 |
|
|
Shares issued for cash (note 10) |
|
20,700 |
|
|
39,397 |
|
|
— |
|
|
— |
|
|
— |
|
|
39,397 |
|
|
Warrants issued in connection with the equity issuance (note 10) |
|
— |
|
|
— |
|
|
3,823 |
|
|
— |
|
|
— |
|
|
3,823 |
|
|
Issuance of flow-through common shares (note 10) |
|
4,000 |
|
|
7,799 |
|
|
— |
|
|
— |
|
|
— |
|
|
7,799 |
|
|
Exercise of stock options (note 11) |
|
94 |
|
|
122 |
|
|
— |
|
|
— |
|
|
— |
|
|
122 |
|
|
Return of capital distribution (note 10) |
|
— |
|
|
(3,059) |
|
|
— |
|
|
— |
|
|
— |
|
|
(3,059) |
|
|
Other-than-temporary impairment on marketable equity securities (note 3) |
|
— |
|
|
— |
|
|
— |
|
|
356 |
|
|
— |
|
|
356 |
|
|
Reclassification of unrealized gain on marketable securities disposed of during the period, net of taxes (note 3) |
|
— |
|
|
— |
|
|
— |
|
|
(840) |
|
|
— |
|
|
(840) |
|
|
Unrealized gain on available-for-sale securities, net of taxes (note 3) |
|
— |
|
|
— |
|
|
— |
|
|
1,818 |
|
|
— |
|
|
1,818 |
|
|
Net loss |
|
— |
|
|
— |
|
|
— |
|
|
— |
|
|
(10,634) |
|
|
(10,634) |
|
|
Balance, December 31, 2017 |
|
337,051 |
|
$ |
1,444,056 |
|
$ |
3,823 |
|
$ |
3,000 |
|
$ |
(929,606) |
|
$ |
521,273 |
|
The accompanying notes are an integral part of these consolidated financial statements.
78
MCEWEN MINING INC.
CONSOLIDATED STATEMENTS OF CASH FLOWS
FOR THE YEARS ENDED DECEMBER 31,
|
|
|
Year ended December 31, |
|
|||||||
|
|
|
2017 |
|
2016 |
|
2015 |
|
|||
|
Cash flows from operating activities: |
|
|
|
|
|
|
|
|
|
|
|
Cash paid to suppliers and employees |
|
$ |
(95,871) |
|
$ |
(52,340) |
|
$ |
(55,260) |
|
|
Cash received from revenue |
|
|
67,724 |
|
|
59,517 |
|
|
70,178 |
|
|
Dividends received from Minera Santa Cruz S.A. (note 7) |
|
|
12,212 |
|
|
17,738 |
|
|
548 |
|
|
Interest paid |
|
|
— |
|
|
(5) |
|
|
(156) |
|
|
Interest received |
|
|
501 |
|
|
276 |
|
|
287 |
|
|
Cash (used in) provided by operating activities |
|
|
(15,434) |
|
|
25,186 |
|
|
15,597 |
|
|
Cash flows from investing activities: |
|
|
|
|
|
|
|
|
|
|
|
Additions to mineral property interests (note 5) |
|
|
(3,492) |
|
|
(5,985) |
|
|
— |
|
|
Additions to property and equipment (note 6) |
|
|
(5,077) |
|
|
(1,174) |
|
|
(777) |
|
|
Investment in marketable equity securities (note 3) |
|
|
— |
|
|
(4,419) |
|
|
(1,114) |
|
|
Proceeds from sale of investments (note 3) |
|
|
2,155 |
|
|
470 |
|
|
— |
|
|
Acquisition of Lexam VG Gold, net of cash and cash equivalents acquired (note 19) |
|
|
(840) |
|
|
— |
|
|
— |
|
|
Acquisition of Black Fox, net of cash and cash equivalents acquired (note 19) |
|
|
(27,251) |
|
|
— |
|
|
— |
|
|
Proceeds from disposal of property and equipment (note 6) |
|
|
33 |
|
|
994 |
|
|
13 |
|
|
Cash used in investing activities |
|
|
(34,472) |
|
|
(10,114) |
|
|
(1,878) |
|
|
Cash flows from financing activities: |
|
|
|
|
|
|
|
|
|
|
|
Proceeds from equity issuance (note 10) |
|
|
42,453 |
|
|
— |
|
|
— |
|
|
Proceeds from warrants issuance (note 10) |
|
|
4,122 |
|
|
— |
|
|
— |
|
|
Share and warrant issuance costs (note 10) |
|
|
(3,353) |
|
|
— |
|
|
— |
|
|
Issuance of flow-through common shares (note 10) |
|
|
9,994 |
|
|
— |
|
|
— |
|
|
Flow-through common share issuance costs (note 10) |
|
|
(551) |
|
|
— |
|
|
— |
|
|
Proceeds from short-term bank indebtedness |
|
|
— |
|
|
— |
|
|
5,171 |
|
|
Repayment of short-term bank indebtedness |
|
|
— |
|
|
(3,395) |
|
|
(1,776) |
|
|
Return of capital distribution (note 10) |
|
|
(3,059) |
|
|
(2,986) |
|
|
(1,503) |
|
|
Share repurchase (note 10) |
|
|
— |
|
|
(582) |
|
|
(1,769) |
|
|
Proceeds from the exercise of stock options (note 11) |
|
|
121 |
|
|
3,730 |
|
|
— |
|
|
Cash provided by (used) in financing activities |
|
|
49,727 |
|
|
(3,233) |
|
|
123 |
|
|
Effect of exchange rate change on cash and cash equivalents |
|
|
(108) |
|
|
(273) |
|
|
(348) |
|
|
(Decrease) increase in cash, cash equivalents and restricted cash |
|
|
(287) |
|
|
11,566 |
|
|
13,494 |
|
|
Cash, cash equivalents and restricted cash, beginning of period |
|
|
37,440 |
|
|
25,874 |
|
|
12,380 |
|
|
Cash, cash equivalents and restricted cash, end of period (note 21) |
|
$ |
37,153 |
|
$ |
37,440 |
|
$ |
25,874 |
|
|
|
|
|
|
|
|
|
|
|
|
|
|
Reconciliation of net (loss) income to cash (used in) provided by operating activities: |
|
|
|
|
|
|
|
|
|
|
|
Net (loss) income |
|
$ |
(10,634) |
|
$ |
21,055 |
|
$ |
(20,450) |
|
|
Adjustments to reconcile net (loss) income from operating activities: |
|
|
|
|
|
|
|
|
|
|
|
Loss (Income) from investment in Minera Santa Cruz S.A., net of amortization (note 7) |
|
|
44 |
|
|
(12,951) |
|
|
(2,414) |
|
|
Impairment of investment in Minera Santa Cruz S.A. |
|
|
— |
|
|
— |
|
|
11,777 |
|
|
Impairment of mineral property interests and property and equipment (note 5) |
|
|
711 |
|
|
— |
|
|
50,600 |
|
|
Other-than-temporary impairment on marketable equity securities (note 3) |
|
|
356 |
|
|
882 |
|
|
— |
|
|
(Gain) loss on disposal of fixed assets (note 6) |
|
|
(11) |
|
|
517 |
|
|
(13) |
|
|
Recovery of deferred income taxes (note 9) |
|
|
(15,675) |
|
|
(3,749) |
|
|
(24,560) |
|
|
(Gain) on sale of marketable securities (note 3) |
|
|
(840) |
|
|
(22) |
|
|
— |
|
|
Stock-based compensation (note 11) |
|
|
1,309 |
|
|
1,039 |
|
|
1,305 |
|
|
Depreciation |
|
|
3,378 |
|
|
1,169 |
|
|
942 |
|
|
Revision of estimates and accretion of asset reclamation obligations (note 8) |
|
|
2,061 |
|
|
595 |
|
|
429 |
|
|
Adjustment to the asset retirement obligation estimate (note 8) |
|
|
1,008 |
|
|
1,530 |
|
|
135 |
|
|
Amortization of mineral property interests and asset retirement obligations |
|
|
3,198 |
|
|
2,413 |
|
|
1,288 |
|
|
Foreign exchange gain |
|
|
108 |
|
|
273 |
|
|
348 |
|
|
Unrealized loss (gain) on derivative investments (note 3) |
|
|
227 |
|
|
(1,379) |
|
|
— |
|
|
Change in non-cash working capital items: |
|
|
|
|
|
|
|
|
|
|
|
Shares issued to supplier for settlement of accounts payable |
|
|
— |
|
|
— |
|
|
443 |
|
|
(Increase) decrease in VAT taxes receivable, net of collection of $5,864 (2016 - $9,523) |
|
|
(945) |
|
|
5,813 |
|
|
1,707 |
|
|
(Increase) in other assets related to operations |
|
|
(12,756) |
|
|
(11,156) |
|
|
(3,003) |
|
|
Increase (decrease) in liabilities related to operations |
|
|
815 |
|
|
1,419 |
|
|
(3,485) |
|
|
Dividends received from Minera Santa Cruz S.A. (note 7) |
|
|
12,212 |
|
|
17,738 |
|
|
548 |
|
|
Cash (used in) provided by operating activities |
|
$ |
(15,434) |
|
$ |
25,186 |
|
$ |
15,597 |
|
The accompanying notes are an integral part of these consolidated financial statements.
79
MCEWEN MINING INC.
NOTES TO CONSOLIDATED FINANCIAL STATEMENTS
December 31, 2017
(tabular amounts are in thousands of U.S. dollars, unless otherwise noted)
McEwen Mining Inc. (the “Company”) was organized under the laws of the State of Colorado on July 24, 1979. The Company is engaged in the exploration, development, production and sale of gold and silver. On January 24, 2012, the Company changed its name from U.S. Gold Corporation to McEwen Mining Inc. after the completion of the acquisition of Minera Andes Inc. by way of a statutory plan of arrangement under the laws of the Province of Alberta, Canada.
The Company operates in Argentina, Mexico, the United States, and Canada. It owns a 49% interest in Minera Santa Cruz S.A. (“MSC”), owner of the producing San José silver-gold mine in Santa Cruz, Argentina, which is operated by the majority owner of the joint venture, Hochschild Mining plc. It owns and operates the El Gallo 1 mine in Sinaloa, Mexico and the Black Fox Complex in Timmins, Ontario, Canada. In addition, the Company owns the Los Azules copper deposit in San Juan, Argentina, the El Gallo 2 project in Sinaloa, Mexico, the Gold Bar project in Nevada in the United States, and a portfolio of exploration properties in Argentina, Mexico, Nevada, and Timmins.
NOTE 2 SUMMARY OF SIGNIFICANT ACCOUNTING POLICIES
Use of Estimates: The Company’s consolidated financial statements have been prepared in accordance with accounting principles generally accepted in the United States of America (“U.S. GAAP”). The preparation of the Company’s consolidated financial statements requires the Company to make estimates and assumptions that affect the reported amounts of assets and liabilities and the related disclosure of contingent assets and liabilities at the date of the consolidated financial statements and the reported amounts of expenses during the reporting period. The more significant areas requiring the use of management estimates and assumptions relate to environmental reclamation and closure obligations; asset useful lives utilized for depletion, depreciation, amortization and accretion calculations; estimates of fair value of equity investment and asset groups used in impairment testing; estimates of recoverable gold in leach pad inventory; estimates regarding the collectability of value added taxes receivable; estimates of fair values of assets and liabilities acquired in business combinations; estimates of reserves; valuation allowances for deferred tax assets; and estimate of income and mining tax provisions and reserves for contingencies and litigation. The Company bases its estimates on historical experience and on various other assumptions that are believed to be reasonable under the circumstances. Actual results may differ significantly from these estimates.
Basis of Consolidation: The consolidated financial statements include the accounts of the Company and its wholly-owned subsidiaries. Intercompany accounts and transactions have been eliminated. Investments over which the Company exerts significant influence but does not control through majority ownership are accounted for using the equity method, as described in Investments, below.
Cash and Cash Equivalents: The Company considers cash in banks, deposits in transit, and highly liquid term deposits with original maturities of three months or less to be cash and cash equivalents. Because of the short maturity of these instruments, the carrying amounts approximate their fair value. Restricted cash is excluded from cash and cash equivalents and is included in long-term assets, except for, flow through share proceeds which appear as a separate line in current assets.
Investments: The Company accounts for investments over which the Company exerts significant influence but does not control through majority ownership using the equity method of accounting pursuant to ASC Topic 323, Investments – Equity Method and Joint Ventures. Under this method, the Company’s share of earnings and losses is included in the Consolidated Statement of Operations and Comprehensive Income (Loss) and the balance of the investment is adjusted by the same amount. Under the equity method, dividends received from an investee are recorded as decreases in the investment account, not as income. If and when there has been a loss in value that is other than a temporary decline, the carrying value is reduced to its fair value.
80
MCEWEN MINING INC.
NOTES TO CONSOLIDATED FINANCIAL STATEMENTS
December 31, 2017
(tabular amounts are in thousands of U.S. dollars, unless otherwise noted) (Continued)
The Company accounts for its investment in marketable equity securities as available for sale securities and warrants on equity interest in publicly traded securities as held for trading securities in accordance with ASC guidance on accounting for certain investments in debt and equity securities. Unrealized gains and losses on these securities are accounted for through Other Comprehensive Income (“OCI”) except for gain and losses on warrants which are included in Other Income (Expense) in the Statement of Operations and Comprehensive Income (Loss). The Company periodically evaluates whether declines in fair values of its investments below the Company’s carrying value are other‑than‑temporary in accordance with ASC guidance. Declines in fair value below the Company’s carrying value deemed to be other‑than‑temporary are charged to operations.
Value Added Taxes Receivable: In Mexico and Canada, value added taxes (“VAT” and “HST”, respectively) are assessed on purchases of materials and services and sales of products. Businesses are generally entitled to recover the taxes they have paid related to purchases of materials and services, either as a refund or as a credit against future taxes payable. In Argentina, except at the San José mine, the Company expenses all VAT as their recoverability is uncertain.
Stockpiles, Material on Leach Pads, In‑process Inventory, Precious Metals Inventory and Materials and Supplies: Stockpiles, material on leach pads, in-process inventory, precious metals inventory and materials and supplies are accounted for using the weighted average cost method and are carried at the lower of average cost or net realizable value. Net realizable value represents the estimated future sales price of the product based on current and long-term metals prices, less the estimated costs to complete production and bring the product to sale. Write-downs of stockpiles, material on leach pads, in-process inventory, precious metals inventory and materials and supplies, resulting from net realizable value impairments, are reported as a component of production costs applicable to sales. The current portion of stockpiles, material on leach pad, in-process inventory and materials and supplies is determined based on the expected amounts to be processed within the next 12 months. Stockpiles, material on leach pads, in‑process inventory and materials and supplies not expected to be processed within the next 12 months, if any, are classified as long‑term.
Stockpiles represent mineralized material extracted from the mine and available for processing. Stockpiles are measured by estimating the number of tonnes added and removed from the stockpile, an estimate of the contained metals (based on assay data) and the estimated metallurgical recovery rates. Costs are allocated to stockpiles based on current mining costs incurred including applicable overhead relating to mining operations. Material is removed from the stockpile at an average cost per tonne.
Mineralized material on leach pads is the ore that is placed on pads where it is treated with a chemical solution that dissolves the gold contained in the ore over a period of months. Costs are attributed to the ore on leach pads based on current mining costs incurred up to the point of placing the ore on the pad. Costs are removed from the leach pad inventory based on the average cost per estimated recoverable ounce of gold on the leach pad as the gold is recovered. The estimates of recoverable gold on the leach pads are calculated from the quantities of ore placed on the leach pads (measured tonnes added to the leach pads), the grade of ore placed on the leach pads (based on assay data) and a recovery percentage.
In general, leach pads recover between 50% and 95% of the recoverable ounces in the first year of leaching, declining each year thereafter until the leaching is complete. The cumulative metallurgical recovery rate for gold production at the El Gallo 1 mine from September 2012 (start of production) to December 31, 2017 was approximately 57% (2016 – 59%). Although the quantities of recoverable gold placed on the leach pads are reconciled by comparing the grades of ore placed on the pads to the quantities of gold actually recovered (metallurgical balancing), the nature of the leaching process inherently limits the ability to precisely monitor inventory levels. As a result, the metallurgical balancing process is constantly monitored and the engineering estimates are refined based on actual results over time.
The current portion of ore on leach pads inventory is determined based on the expected amounts to be processed within the next twelve months. Ore on leach pads inventory not expected to be processed or used within the next twelve months is classified as long-term.
81
MCEWEN MINING INC.
NOTES TO CONSOLIDATED FINANCIAL STATEMENTS
December 31, 2017
(tabular amounts are in thousands of U.S. dollars, unless otherwise noted) (Continued)
In-process inventories represent materials that are currently in the process of being converted to a saleable product. In-process material is measured based on assays of the material from the various stages of the Adsorption – Desorption – Recovery (“ADR”) process and the projected recoveries of the respective plants. Costs are allocated to in-process inventories based on the costs of the material fed into the process attributable to the source material coming from the mines, stockpiles and/or leach pads plus the in-process conversion costs incurred to that point in the process.
Precious metal inventories include gold and silver doré and bullion that is unsold and held at the Company’s or the refinery’s facilities. Costs are allocated to precious metal inventories based on costs of the respective in-process inventories incurred prior to the refining process plus applicable refining costs.
Materials and supplies inventories are comprised of chemicals, reagents, spare parts and consumable parts used in drilling and other operating activities. Cost includes applicable taxes and freight.
Proven and Probable Reserves: The definition of proven and probable reserves is set forth in SEC Industry Guide 7. Proven reserves are reserves for which (a) quantity is computed from dimensions revealed in outcrops, trenches, workings or drill holes, grade and/or quality are computed from the results of detailed sampling and (b) the sites for inspection, sampling and measurement are spaced so closely and the geological character is so well defined that size, shape, depth and mineral content of the reserves are well‑established. Probable reserves are reserves for which quantity and grade and/or quality are computed from information similar to that used for proven (measured) reserves, but the sites for inspection, sampling, and measurement are farther apart or are otherwise less adequately spaced. The degree of assurance, although lower than that for proven (measured) reserves, is high enough to assume continuity between points of observations.
Mineral property interests, Plant and Equipment and Mine Development costs
Mineral property interests: Mineral property interests include acquired interests in production, advanced-stage properties and exploration stage properties, which are considered tangible assets. The amount capitalized relating to a mineral property interest represents its fair value at the time of acquisition, either as an individual asset purchase or as a part of a business combination provided that a reasonable expectation exists that the property includes mineral resources.
The value of mineral property interests is primarily driven by the nature and amount of mineralized material believed to be contained in the properties. When proven and probable reserves as defined by SEC Industry Guide 7 exist, the relevant capitalized costs and mineral property interests are to be charged to expense based on the units of production method and upon commencement of production. However, when a property does not contain mineralized material that satisfies the definition of proven and probable reserves, the amortization of the capitalized costs and mineral property interests are charged to expense based on the most appropriate method, which includes straight-line method and units-of-production method over the estimated useful life of the mine, as determined by our internal mine plans.
Mine Development Costs: Mine development costs include engineering and metallurgical studies, drilling and other related costs to delineate an ore body, and the removal of overburden to initially expose an ore body at open pit surface mines and building of access paths and other infrastructure to gain access to the ore body at underground mines. Capitalization of mine development costs that meet the definition of an asset begins once proven and probable reserves as defined by SEC Industry Guide 7 have been defined. These costs would be capitalized to Mineral Property Interests. Absent of proven and probable reserves, as defined by SEC Industry Guide 7, these costs are charged to expense as incurred.
Drilling and related costs are capitalized for an ore body where proven and probable reserves exist and the activities are directed at obtaining additional information, providing greater definition of the ore body or converting non-reserve mineralization to proven and probable reserves and the benefit is expected to be realized over a period beyond one year. All other drilling and related costs are expensed as incurred. However, drilling costs specifically incurred during the production stage for the purpose of operational ore control rather than obtaining additional information on the ore body are expensed and allocated to inventory costs and then included as a component of Production costs applicable to sales as the revenue from the sale of inventory occurs.
82
MCEWEN MINING INC.
NOTES TO CONSOLIDATED FINANCIAL STATEMENTS
December 31, 2017
(tabular amounts are in thousands of U.S. dollars, unless otherwise noted) (Continued)
Pre-stripping costs incurred to access the ore body at an open pit mine prior to the production stage are capitalized during the development phase of the mine provided that the proven and probable reserves have been defined. Where multiple open pits exist at a mine, pre-stripping costs are capitalized separately to each pit. The production stage commences when the commercial production point has been achieved. Stripping costs incurred during the production stage of a mine are included as part of inventory costs and then included as a component of Production costs applicable to sales as the revenue from the sale of inventory occurs.
All capitalized mine development costs are amortized using the units of production method over the estimated life of the ore body based on recoverable ounces to be mined from proven and probable reserves. However, costs incurred to access specific areas that only provide benefit over the life of that area are amortized over the estimated life of that specific area.
Plant and Equipment: For properties where the Company established proven and probable reserves as defined by SEC Industry Guide 7, expenditures for plant and equipment and expenditures that extend the useful lives of existing plant and equipment are capitalized and recorded at cost. Plant and equipment are depreciated using the straight-line method over the estimated productive lives of the asset.
For properties where the Company did not establish proven and probable reserves as defined by SEC Industry Guide 7, substantially all costs, including design, engineering, construction, and installation of equipment are expensed as incurred. Only certain types of equipment which have alternative uses or significant salvage value, may be capitalized without proven and probable reserves.
Construction-in-progress (CIP) costs: Assets under construction are capitalized as Construction-in-progress until the asset is available for operational use. The cost of construction-in-progress comprises its purchase price and any costs directly attributable to bringing it into working condition for its intended use. Assets under construction are not amortized until the end of the construction period or once commercial production is achieved. Upon achieving the production stage, the capitalized construction costs are transferred to the appropriate category of Plant and Equipment.
Impairment of Long-lived Assets: The Company reviews and evaluates its long-lived assets for impairment when events or changes in circumstances indicate that the related carrying amounts may not be recoverable. Once it is determined that impairment exists, an impairment loss is measured as the amount by which the asset carrying value exceeds its fair value. For the purpose of recognition and measurement of impairment, the Company groups its long-lived assets by specific mine or project, as this represents the lowest level for which there are identifiable cash flows.
For asset groups where impairment loss is determined using the undiscounted future net cash flows method or discounted future net cash flows method, future cash flows are estimated based on quantities of recoverable mineralized material, expected gold and silver prices (considering current and historical prices, trends and related factors), production levels, operating costs, capital requirements and reclamation costs, all based on life-of-mine plans. The term “recoverable mineralized material” refers to the estimated amount of gold or other commodities that will be obtained after taking into account losses during processing and treatment of mineralized material. The Company’s estimates of future cash flows are based on numerous assumptions and it is possible that actual future cash flows will be significantly different than the estimates, as actual future quantities of recoverable minerals, gold, silver and other commodity prices, production levels and costs of capital are each subject to significant risks and uncertainties.
For asset groups where the Company is unable to determine a reliable estimate of undiscounted future net cash flows, the Company adopts a market approach to estimate fair value by using a combination of observed market value per square mile and observed market value per ounce or pound of mineral material based on comparable transactions.
83
MCEWEN MINING INC.
NOTES TO CONSOLIDATED FINANCIAL STATEMENTS
December 31, 2017
(tabular amounts are in thousands of U.S. dollars, unless otherwise noted) (Continued)
Asset Retirement Obligation, reclamation and remediation costs: The Company records the fair value of a liability for an asset retirement obligation (“ARO”) in the period that it is incurred if a reasonable estimate of fair value can be made. The associated asset retirement costs are capitalized as part of the carrying amount of the long-lived asset when proven or probable reserves exist, or if they relate to an acquired mineral property interest. Periodic accretion is recorded to ARO and charged to operations. Subsequent upward ARO cost revisions are capitalized only with respect to properties with proven or probable reserves, these being San Jose, Black Fox and Gold Bar. Upward adjustments to the fair value of the ARO on properties that do not contain proven or probable reserves are charged to expense. The fair value of ARO is measured by discounting the expected cash flows adjusted for inflation, using a credit-adjusted risk free rate of interest. The Company prepares estimates of the timing and amounts of expected cash flows when an ARO is incurred, which are updated to reflect changes in facts and circumstances. Estimation of the fair value of AROs requires significant judgment, including amount of cash flows, timing of reclamation, inflation rate and credit risk.
Ongoing environmental and reclamation expenditures are debited against the ARO liability as incurred to the extent they relate to the ARO liability and to expense to the extent they do not.
Revenue Recognition: Revenue consists of sales value received for the Company’s principal products, gold and silver. The Company currently does not earn revenue from any products other than gold and silver. Revenue is recognized when title to gold and silver passes to the buyer and when collectability is reasonably assured. Title passes to the buyer based on terms of the sales contract. Product pricing is determined under the sales agreements which are referenced against active and freely traded commodity markets, for example, the London Bullion Market for both gold and silver, in an identical form to the product sold.
Gold and silver doré produced from the San José mine is sold at the prevailing spot market price based on the London A.M. fix, while concentrates are sold at the prevailing spot market price based on either the London P.M. fix or average of the London A.M. and London P.M. fix depending on the sales contract. Concentrates are provisionally priced, whereby the selling price is subject to final adjustments at the end of a period ranging from 30 to 90 days after delivery to the customer. The final price is based on the market price at the relevant quotation point stipulated in the contract. Due to the time elapsed between shipment and the final settlement with the buyer, MSC must estimate the prices at which sales of metals will be settled. At the end of each financial reporting period, previously recorded provisional sales are adjusted to estimated settlement metals prices based on relevant forward market prices until final settlement with the buyer.
The Company entered into a doré sales agreement with a Canadian financial institution in July 2012. Under that agreement, the Company has the option to sell to the institution approximately 90% of the gold and silver contained in doré bars prior to the completion of refining by the third party refiner, which normally takes approximately 15 business days. Revenue is recognized when the Company has provided irrevocable instructions to the refiner to transfer to the purchaser the refined ounces sold upon final processing outturn, and when payment of the purchase price for the purchased doré or bullion has been made in full by the purchaser.
Other Revenue: Other revenue is comprised of revenue earned from a toll milling arrangement at the Black Fox Complex. Revenue is recognized when title to the product passes to the customer.
Property Holding Costs: Holding costs to maintain a property are expensed in the period they are incurred. These costs include security and maintenance expenses, lease and claim fees and payments, and environmental monitoring and reporting costs.
Exploration Costs: Exploration costs include costs incurred to identify new mineral resources, evaluate potential resources, and convert mineral resources into proven and probable reserves. Exploration costs are expensed as incurred.
84
MCEWEN MINING INC.
NOTES TO CONSOLIDATED FINANCIAL STATEMENTS
December 31, 2017
(tabular amounts are in thousands of U.S. dollars, unless otherwise noted) (Continued)
Foreign Currency: The functional currency for the Company’s operations is the U.S. dollar. All monetary assets and liabilities denominated in a currency which is not the U.S. dollar are translated at current exchange rates at each balance sheet date and the resulting adjustments are included in a separate line item under other income (expense). Revenue and expense in foreign currencies are translated at the average exchange rates for the period.
Stock‑Based Compensation: The Company accounts for stock options at fair value as prescribed in ASC 718. The Company estimates the fair value of each stock option at the grant date by using the Black-Scholes option-pricing model and provides for expense recognition over the service period, if any, of the stock option. The Company's estimates may be impacted by certain variables including, but not limited to, stock price volatility, employee stock option exercise behavior and estimates of forfeitures.
Flow-through Shares: Current Canadian tax legislation permits mining entities to issue flow-through shares to investors whereby the deductions for tax purposes related to resource exploration and evaluation expenditures may be claimed by investors instead of the entity, subject to a renouncement process. Under ASC 740, proceeds from the issuance of flow-through shares are allocated first to the common stock based on the underlying quoted price of common shares and the residual amount is allocated to the sale of tax benefits, classified as a liability. As the Company incurs qualifying exploration and evaluation expenditures to fulfill its obligation, the liability is drawn down and the sale of tax benefits is recognized in the Consolidated Statement of Operations and Comprehensive Loss (Income) as a reduction of deferred tax expense.
Income and Mining Taxes: The Company accounts for income and mining taxes under ASC 740 using the liability method, recognizing certain temporary differences between the financial reporting basis of liabilities and assets and the related tax basis for such liabilities and assets. This method generates either a net deferred income and mining tax liability or asset for the Company, as measured by the statutory tax rates in effect. The Company derives the deferred income and mining tax charge or benefit by recording the change in either the net deferred income and mining tax liability or asset balance for the year. The Company records a valuation allowance against any portion of those deferred income and mining tax assets when it believes, based on the weight of available evidence, it is more likely than not that some portion or all of the deferred income and mining tax asset will not be realized.
Comprehensive Income (Loss): In addition to net income or loss, comprehensive income or loss includes all changes in equity during a period, such as cumulative unrecognized changes in fair value of marketable equity securities classified as available‑for‑sale or other investments.
Per Share Amounts: Basic earnings or loss per share includes no dilution and is computed by dividing income or loss available to common shareholders by the weighted average number of common and exchangeable shares outstanding during the period. Diluted earnings or loss per share reflect the potential dilution of securities that could share in the earnings of the Company and are computed in accordance with the treasury stock method based on the average number of common shares and dilutive common share equivalents outstanding. The diluted earnings or loss are calculated using the treasury stock method and only for those instruments that that result in a reduction in income per share are included in the calculation.
Loans and borrowings: Borrowings are recognized initially at fair value, net of financing costs incurred, and subsequently measured at amortized cost. Any difference between the amounts originally received and the redemption value of the debt is recognized in the consolidated statement of operations over the period to maturity using the effective interest method.
85
MCEWEN MINING INC.
NOTES TO CONSOLIDATED FINANCIAL STATEMENTS
December 31, 2017
(tabular amounts are in thousands of U.S. dollars, unless otherwise noted) (Continued)
Fair Value of Financial Instruments: Fair value accounting, as prescribed in ASC Section 825, utilizes a fair value hierarchy that prioritizes the inputs to valuation techniques used to measure fair value. The hierarchy gives the highest priority to unadjusted quoted prices in active markets for identical assets and liabilities (Level 1 measurements) and the lowest priority to unobservable inputs (Level 3 measurements). The three levels of the fair value hierarchy are described below:
|
Level 1 |
Unadjusted quoted prices in active markets that are accessible at the measurement date for identical, unrestricted assets or liabilities; |
|
Level 2 |
Quoted prices in markets that are not active, or inputs that are observable, either directly or indirectly, for substantially the full term of the asset or liability; and |
|
Level 3 |
Prices or valuation techniques that require inputs that are both significant to the fair value measurement and unobservable (supported by little or no market activity). |
Recently Adopted Accounting Pronouncements
Statement of Cash Flows – Restricted Cash: In November 2016, the FASB issued ASU 2016-18, Statement of Cash Flow - Restricted Cash (ASU 2016-18). ASU 2016-18 requires that an entity's statement of cash flows explain the change during the period in that entity's total cash and cash equivalents, including amounts generally described as restricted cash or restricted cash equivalents. Therefore, changes in restricted cash and restricted cash equivalents will no longer be shown as specific line items within the statement of cash flows. Additionally, an entity is required to reconcile the cash and cash equivalents on its balance sheet to the cash and cash equivalent balances presented in its statement of cash flows. ASU 2016-18 is effective for fiscal years, and interim periods within those fiscal years, beginning after December 15, 2017 with early adoption permitted. The Company early adopted the guidance within ASU 2016-18 as of December 31, 2017. The impact of ASU 2016-18 on its financial statements was as follows: (1) changes in restricted cash balances are no longer shown in the statements of cash flows, as these balances are included in the beginning and ending cash balances in the statements of cash flows; and (2) included within Note 21 is a reconciliation between cash balances presented on our balance sheets with the amounts presented in the statements of cash flows. The Company did not have any material restricted cash or restricted cash equivalent items in any interim period during the year ended December 31, 2017 and 2016.
Compensation – Stock Compensation – Improvements to Employee Share-Based Payment Accounting: In March 2016, the FASB issued ASU No. 2016-09, which changes how companies account for certain aspects of share-based payment awards to employees, including the accounting for income taxes, forfeitures, and statutory tax withholding requirements, as well as classification in the statement of cash flows. The update to the standard is effective for the Company for fiscal years beginning after December 5, 2016, with early adoption permitted. Adoption of this guidance by the Company, effective January 1, 2017, had no impact on the consolidated financial statements or disclosures.
Recently Issued Accounting Pronouncements
Compensation – Stock Compensation – Scope of Modification Accounting: In July 2017, the FASB issued ASU No. 2017-11 which addresses narrow issues identified as a result of the complexity associated with applying generally accepted accounting principles (GAAP) for certain financial instruments with characteristics of liabilities and equity. The update to the standard is effective for the Company for fiscal years beginning after December 15, 2018, with early application permitted. The Company is currently evaluating the effect of this amendment and the impact it may have on the Company’s consolidated financial statements.
In May 2017, the FASB issued ASU No. 2017-09 which provides clarity and reduces diversity in practice with respect to the modification of terms or conditions of a share-based payment award. The update to the standard is effective for the Company for fiscal years beginning after December 15, 2017, with early application permitted. The Company is currently evaluating the effect of this amendment and the impact it may have on the Company’s consolidated financial statements.
86
MCEWEN MINING INC.
NOTES TO CONSOLIDATED FINANCIAL STATEMENTS
December 31, 2017
(tabular amounts are in thousands of U.S. dollars, unless otherwise noted) (Continued)
Business Combinations: Definition of a business: In January 2017 the FASB issued ASU No. 2017-01 which changes the definition of a business to assist entities with evaluating when a set of transferred assets and activities is a business. The update to the standard is effective for the Company for annual periods beginning after December 15, 2017, with early application permitted. The Company is currently evaluating the effect of this amendment and the impact it may have on the Company’s consolidated financial statements.
Income Taxes - Intra-Entity Transfers of Assets Other Than Inventory: In October 2016 the FASB issued ASU No. 2016-16, to modify the current exception to income tax accounting that required companies to defer the income tax effect of certain intercompany transactions. ASU No. 2016-16 only allows companies to defer the income tax effect of intercompany inventory transactions under an exception to the guidance on income taxes that currently applies to intercompany sales and transfers of all assets. The update to the standard is effective for the Company beginning January 1, 2018, with early application permitted as of the beginning of an annual period. The Company is currently evaluating the effect of this amendment and the impact it will have on the Company’s consolidated financial statements.
Revenue from Contracts with Customers: In 2016, the FASB issued four separate accounting standard updates regarding Topic 606: ASU 2016-08, ASU 2016-10, ASU 2016-12 and ASU 2017-13. These ASUs outline amendments to Topic 606 which are not yet effective, including reporting revenue gross versus net, identifying performance obligations and licensing and narrow-scope improvements and practical expedients. The effective date and transition requirements for the amendments listed in these updates are the same as the effective date and transition requirements for Topic 606 (and any other Topic amended by Update 2014-09) which is January 1, 2018, with earlier application permitted. The Company will not be early adopting Topic 606.
The new guidance permits two methods of adoption: (i) the full retrospective method, under which comparative periods would be restated, and the cumulative impact of applying the standard would be recognized as at January 1, 2017, the earliest period presented; and (ii) the modified retrospective method, under which comparative periods would not be restated and the cumulative impact of applying the standard would be recognized at the date of initial adoption, January 1, 2018. The Company will utilize the modified retrospective approach.
Under the modified retrospective method, the Company will apply the guidance retrospectively only to the most current period presented in the financial statements. To do so, the company will recognize the cumulative effect of initially applying the standard as an adjustment to the opening balance of retained earnings as of January 1, 2018. The standard allows entities to elect to apply the modified retrospective method to either all contracts as of the initial date or only to contracts that are not completed as of such date.
The Company will elect to apply the method only to new contracts and contracts that have not been completed as of January 1, 2018. As a result, the Company will present comparative periods under legacy GAAP and recognize a cumulative catch-up adjustment to the opening balance of retained earnings (if any) as of January 1, 2018, only for contracts that are not completed and will disclose the method of application accordingly in the financial statements.
As of December 31, 2017, the Company performed a comprehensive analysis of all significant sales contracts, including those contracts of MSC, to determine the effect of this amendment and the impact it will have on the Company’s consolidated financial statements. As of December 31, 2017 the Company does not anticipate any material impact to revenue recognition except for additional disclosure requirements. Management will continue to monitor any changes to the existing standard as well as industry developments to determine whether any further changes are required to the accounting strategy.
87
MCEWEN MINING INC.
NOTES TO CONSOLIDATED FINANCIAL STATEMENTS
December 31, 2017
(tabular amounts are in thousands of U.S. dollars, unless otherwise noted) (Continued)
Leases – Amendments: In February 2016, the FASB issued ASU 2016-02 which core principle is that a lessee should recognize the assets and the liabilities that arise from leases, including operating leases. Under the new requirements, a lessee will recognize in the statement of financial position a liability to make lease payments (the lease liability) and the right-of-use asset representing the right to the underlying asset for the lease term. For leases with a term of twelve months or less, the lessee is permitted to make an accounting policy election by class of underlying asset not to recognize lease assets and lease liabilities. The recognition, measurement, and presentation of expenses and cash flows arising from a lease by a lessee have not significantly changed from the previous GAAP. The standard is effective for fiscal years beginning after December 15, 2018, including interim periods within such fiscal year, with early adoption permitted. The ASU requires a modified retrospective transition method with the option to elect a package of practical expedients. The Company is evaluating the effect of this amendment and the impact it may have on the Company’s consolidated financial statements.
Financial Instruments - Recognition and Measurement of Financial Assets and Financial Liabilities: In January 2016, the FASB issued ASU No. 2016-01, which updates certain aspects of recognition, measurement, presentation and disclosure of financial instruments. ASU 2016-01 will be effective for the Company beginning January 1, 2018. The Company is currently evaluating the effect of this amendment and the impact it will have on the Company’s consolidated financial statements.
NOTE 3 INVESTMENTS
The Company’s investment portfolio consists of marketable equity securities and warrants of certain publicly-traded companies. The Company classifies the marketable equity securities as available-for-sale securities, which are recorded at fair value based upon quoted market prices. The warrants are recorded at fair value using the Black-Scholes option pricing model. The following is a summary of the balances as of December 31, 2017 and December 31, 2016:
|
|
|
|
|
|
|
|
|
|
|
|
Other |
|
Statement of |
|
|
|
||
|
|
|
Opening |
|
Additions |
|
Disposals |
|
Comprehensive |
|
Operations |
|
Fair Value |
||||||
|
|
|
balance |
|
during |
|
during |
|
Income (Loss) |
|
(Loss) |
|
end of the |
||||||
|
As of December 31, 2017 |
|
(January 1) |
|
year |
|
year |
|
(pre-tax) |
|
Income |
|
year |
||||||
|
Marketable equity securities |
|
$ |
6,749 |
|
$ |
— |
|
$ |
(2,163) |
|
$ |
1,334 |
|
$ |
484 |
|
$ |
6,404 |
|
Warrants |
|
|
1,794 |
|
|
— |
|
|
— |
|
|
— |
|
|
(227) |
|
|
1,567 |
|
Investments |
|
$ |
8,543 |
|
$ |
— |
|
$ |
(2,163) |
|
$ |
1,334 |
|
$ |
257 |
|
$ |
7,971 |
|
|
|
|
|
|
|
|
|
|
|
|
Other |
|
Statement of |
|
|
|
||
|
|
|
Opening |
|
Additions |
|
Disposals |
|
Comprehensive |
|
Operations |
|
Fair Value |
||||||
|
|
|
balance |
|
during |
|
during |
|
Income (Loss) |
|
(Loss) |
|
end of the |
||||||
|
As of December 31, 2016 |
|
(January 1) |
|
year |
|
year |
|
(pre-tax) |
|
Income |
|
year |
||||||
|
Marketable equity securities |
|
$ |
1,032 |
|
$ |
4,004 |
|
$ |
(470) |
|
$ |
3,043 |
|
$ |
(860) |
|
$ |
6,749 |
|
Warrants |
|
|
— |
|
|
415 |
|
|
— |
|
|
— |
|
|
1,379 |
|
|
1,794 |
|
Investments |
|
$ |
1,032 |
|
$ |
4,419 |
|
$ |
(470) |
|
$ |
3,043 |
|
$ |
519 |
|
$ |
8,543 |
As of December 31, 2017, the cost of the marketable equity securities and warrants was approximately $3.3 million (December 31, 2016 - $4.9 million).
The gains and losses for available-for-sale securities are not reported in Net (Loss) Income of the Consolidated Statement of Operations and Comprehensive (Loss) Income until the securities are sold or if there is an other-than-temporary decline in fair value below cost. For the year ended December 31, 2017, the Company recorded a gain, net of tax, in other comprehensive income, of $1.8 million. The gain was recorded in accumulated other comprehensive income and is reported as a separate line item in the shareholders' equity section of the balance sheet. In the comparable period ending December 31, 2016, the Company recorded a gain, net of tax, in other comprehensive income, of $1.6 million.
88
MCEWEN MINING INC.
NOTES TO CONSOLIDATED FINANCIAL STATEMENTS
December 31, 2017
(tabular amounts are in thousands of U.S. dollars, unless otherwise noted) (Continued)
During the year ended December 31, 2017, the Company sold marketable equity securities for proceeds of $2.2 million. The Company realized a gain of $0.8 million, which is included in the Consolidated Statement of Operations and Comprehensive (Loss) Income. During the year ended December 31, 2016, marketable equity securities were sold for proceeds of $0.5 million for a realized gain of $0.1 million.
On May 13, 2016, the Company participated in a private placement with Golden Predator Mining Corp. (“Golden Predator”) under which it acquired 3,125,000 units, each unit consisting of one common share and one common share purchase warrant (“warrant”), for a total cost of $0.4 million. Using proportional allocation, the Company allocated $0.2 million as the cost base for each of the common shares and warrants. Subsequently, on July 21, 2016, the Company participated in another private placement with Golden Predator under which it acquired an additional 1,500,000 units, each unit consisting of one common share and one-half of one warrant, for a total cost of $0.9 million. Using proportional allocation, the Company allocated $0.7 million as the cost base to the common shares and $0.2 million to the warrants.
The Company maintains a portfolio of warrants on equity interests in publicly-traded securities for investment purposes which are not used in any hedging activities. As the warrants meet the definition of derivative instruments, unrealized gains or losses arising from their revaluation are recorded in the Consolidated Statement of Operations and Comprehensive (Loss) Income. During the year ended December 31, 2017, the Company recorded an unrealized loss of $0.2 million (December 31, 2016 – $1.4 million gain and December 31, 2015 – $nil, respectively).
During the year ended December 31, 2017, the Company reviewed its investment portfolio to determine if any security was other-than-temporarily impaired (“OTTI”). An OTTI security would require the Company to record an impairment charge in the Statement of Operations and Consolidated (Loss) Income in the period any such determination is made. In making this judgment, the Company evaluated, among other factors, the duration and extent to which the fair value of a security was less than its cost; the financial condition of the issuer and any changes thereto; and the Company’s intent to sell, or whether it will more likely than not be required to sell, the security before recovery of its amortized cost basis. From this assessment, the Company concluded that the fair value of certain marketable equity securities exhibited a prolonged decline in share price due to deterioration of the issuer’s results; therefore, the decline in these marketable equity securities was considered OTTI. Accordingly, the Company recognized an impairment loss of $0.4 million in the Consolidated Statement of Operations and Comprehensive (Loss) Income for the year ended December 31, 2017. In the comparable periods ending December 31, 2016 and 2015, the Company recorded an impairment loss of $0.9 million and $nil, respectively.
NOTE 4 INVENTORIES
Inventories at December 31, 2017 and 2016 consist of the following:
|
|
|
December 31, 2017 |
|
December 31, 2016 |
|
||
|
Material on leach pads |
|
$ |
9,188 |
|
$ |
14,267 |
|
|
In-process inventory |
|
|
5,486 |
|
|
4,953 |
|
|
Stockpiles |
|
|
1,168 |
|
|
1,102 |
|
|
Precious metals |
|
|
12,902 |
|
|
5,035 |
|
|
Materials and supplies |
|
|
3,207 |
|
|
1,263 |
|
|
Current Inventories |
|
$ |
31,951 |
|
$ |
26,620 |
|
During the year ended December 31, 2017 and 2016, no write-downs of inventory were recorded by the Company.
A portion of leach pad inventories in the amount of $10.4 million (December 31, 2016 - $nil) is expected to be recovered beyond twelve months and thus has been included in Other assets.
89
MCEWEN MINING INC.
NOTES TO CONSOLIDATED FINANCIAL STATEMENTS
December 31, 2017
(tabular amounts are in thousands of U.S. dollars, unless otherwise noted) (Continued)
NOTE 5 MINERAL PROPERTY INTERESTS
During the year ended December 31, 2017, the Company acquired additional mineral property interests in connection with acquisitions of Lexam VG Gold Inc. (“Lexam”) and the Black Fox Complex, refer to Note 19 Acquisitions. During the year ended December 31, 2017, the Company capitalized $3.3 million (2016 – $nil) of expenditures relating to mine development and delineation.
On April 19, 2016, the Company completed the acquisition of the sliding scale net smelter return royalty (the “Royalty”) on the El Gallo 1 mine and El Gallo 2 project, previously requiring payment of 3.5% of gross revenue less allowable deductions, eventually reducing to 1%. The total purchase price was $6.3 million and consisted of a $5.3 million payment at closing and a deferred payment of $1.0 million due on June 30, 2018, conditional that the El Gallo 1 mine and El Gallo 2 project are in operation at that time.
The total cost of the Royalty was accounted for as an addition to mineral property interests. The cost was allocated to El Gallo 1 mine and El Gallo 2 project based on the relative fair value of the estimated future royalty payments for each project. The allocation resulted in approximately $5.1 million allocated to the El Gallo 1 mine and $1.2 million allocated to the El Gallo 2 project. The $1.0 million conditional deferred payment has been included under current other liabilities as of December 31, 2017. The Royalty ceased accruing at the end of March 2016.
The carrying values for all of the mineral properties held by the Company as at December 31, 2017 and 2016 are noted below:
|
Name of Property/Complex |
|
State/Province |
|
Country |
|
2017 |
|
2016 |
|
||
|
Black Fox Complex |
|
Ontario |
|
Canada |
|
$ |
11,364 |
|
$ |
— |
|
|
Lexam |
|
Ontario |
|
Canada |
|
|
41,595 |
|
|
— |
|
|
Los Azules Copper Project |
|
San Juan |
|
Argentina |
|
|
191,490 |
|
|
191,490 |
|
|
Tonkin Properties |
|
Nevada |
|
United States |
|
|
4,833 |
|
|
4,833 |
|
|
Gold Bar Project |
|
Nevada |
|
United States |
|
|
31,317 |
|
|
31,180 |
|
|
North Battle Mountain Properties |
|
Nevada |
|
United States |
|
|
785 |
|
|
785 |
|
|
El Gallo 1 Mine |
|
Sinaloa |
|
Mexico |
|
|
6,246 |
|
|
8,545 |
|
|
El Gallo 2 Properties |
|
Sinaloa |
|
Mexico |
|
|
5,807 |
|
|
5,807 |
|
|
Total Mineral Property Interests |
|
|
|
|
|
$ |
293,437 |
|
$ |
242,640 |
|
For the year ended December 31, 2017, the Company recorded $2.3 million (2016 - $2.4 million and 2015 - $1.3 million) of amortization expense related to the El Gallo 1 mine, which is included in Production Costs Applicable to Sales in the Statement of Operations and Comprehensive (Loss) Income.
For the year ended December 31, 2017, the Company recorded $0.9 million (2016 and 2015 – $nil) of amortization expenses related to the Black Fox mine, which is included in Production Costs Applicable to Sales in the Statement of Operations and Comprehensive (Loss) Income.
The Company conducts a review of potential triggering events for impairment for all its mineral projects on a quarterly basis. When events or changes in circumstances indicate that the related carrying amounts may not be recoverable, the Company carries out a review and evaluation of its long-lived assets. In the years ended December 31, 2017 and 2016, no such triggering events were identified with respect to the Company’s Nevada, Argentina, Mexico, or Timmins properties.
90
MCEWEN MINING INC.
NOTES TO CONSOLIDATED FINANCIAL STATEMENTS
December 31, 2017
(tabular amounts are in thousands of U.S. dollars, unless otherwise noted) (Continued)
For the year ended December 31, 2015, the Company recognized impairments on its Argentina and Nevada properties and portion of Mexico construction-in-progress, for an aggregate of $50.6 million. For the Nevada properties, an initial $29.7 million impairment was recorded in the second quarter of 2015 when the Company performed a strategic review of its mineral property interests from which a decision was made to allow certain non-essential claims and portions of claims, included within the Gold Bar project and Tonkin property, to lapse on the September 1, 2015 renewal date. Subsequently, during the fourth quarter of 2015 an additional $7.5 million was recorded given the continuous decline in the observed market value of the Nevada properties. The deferred income tax recoveries resulting from the Nevada impairments made in the second quarter and fourth quarter of 2015 were $10.4 million and $2.2 million, respectively. The Company used the market approach to estimate the fair value of the impaired properties.
Further, when performing the recoverability test for the Los Azules project and El Gallo 2 project asset groups in the fourth quarter of 2015, the Company noted that the carrying value of each of the asset groups exceeded their estimated fair value, resulting in a total impairment charge for Los Azules project and El Gallo 2 project asset groups of $11.4 million and $2.0 million, respectively, along with a resulting deferred income tax recovery of $1.3 million and $nil, respectively, being recorded in the Statement of Operations and Comprehensive Loss for the year ended December 31, 2015. The Company used the market approach to estimate the fair value of the impaired properties.
Based on the above, impairment charges were recorded on the following mineral property interests for the years ended December 31, 2017, 2016, and 2015:
|
Name of Property/Complex |
|
Segment |
|
2017 |
|
2016 |
|
2015 |
|
|||
|
Los Azules Project |
|
Argentina |
|
|
— |
|
|
— |
|
|
11,399 |
|
|
Gold Bar Project |
|
Nevada |
|
|
— |
|
|
— |
|
|
20,847 |
|
|
Tonkin Properties |
|
Nevada |
|
|
— |
|
|
— |
|
|
14,939 |
|
|
North Battle Mountain Properties |
|
Nevada |
|
|
— |
|
|
— |
|
|
1,443 |
|
|
Property, plant and equipment |
|
Mexico |
|
|
— |
|
|
— |
|
|
1,972 |
|
|
Total impairment |
|
|
|
$ |
— |
|
$ |
— |
|
$ |
50,600 |
|
NOTE 6 PLANT AND EQUIPMENT, MINE DEVELOPMENT AND CONSTRUCTION IN PROGRESS
As of December 31, 2017 and 2016, property and equipment consisted of the following:
|
|
|
December 31, 2017 |
|
December 31, 2016 |
||
|
Land |
|
$ |
8,699 |
|
$ |
8,699 |
|
Plant and equipment |
|
|
43,257 |
|
|
8,505 |
|
Construction-in-progress |
|
|
8,178 |
|
|
2,812 |
|
Subtotal |
|
$ |
60,134 |
|
$ |
20,016 |
|
Less: accumulated depreciation |
|
|
(9,088) |
|
|
(5,764) |
|
|
|
$ |
51,046 |
|
$ |
14,252 |
Construction-in-progress included the following costs:
|
|
|
December 31, 2017 |
|
December 31, 2016 |
||
|
Gold Bar project |
|
$ |
6,011 |
|
$ |
— |
|
Black Fox mine |
|
|
67 |
|
|
— |
|
El Gallo 2 project |
|
|
2,100 |
|
|
2,812 |
|
|
|
$ |
8,178 |
|
$ |
2,812 |
91
MCEWEN MINING INC.
NOTES TO CONSOLIDATED FINANCIAL STATEMENTS
December 31, 2017
(tabular amounts are in thousands of U.S. dollars, unless otherwise noted) (Continued)
The Gold Bar project construction-in-progress includes deposits for long-lived capital equipment and expenditures for mobilization, design and engineering, and earthwork.
El Gallo 2 project construction-in-progress includes certain equipment which has not been delivered in 2017. In 2017, an impairment charge of $0.7 million was recorded against this equipment to reflect the decline in fair value. It is uncertain if and when this equipment can be utilized in current operations.
In the second quarter of 2016, the Company reached an agreement with a separate contractor, whereby the Company was refunded its equivalent deposit less costs incurred for the equipment design. The total amount of the deposit was $1.5 million, of which $1.0 million was refunded. The remaining $0.5 million was recorded under development costs in the Consolidated Statement of Operations and Comprehensive Income (Loss) for 2016.
NOTE 7 INVESTMENT IN MINERA SANTA CRUZ S.A. (“MSC”) - SAN JOSÉ MINE
As noted in Note 2, Summary of Significant Accounting Policies - Investments, the Company accounts for investments over which it exerts significant influence but does not control through majority ownership using the equity method of accounting. In applying the equity method of accounting to the Company’s investment in MSC, MSC’s financial statements, which are originally prepared by MSC in accordance with International Financial Reporting Standards as issued by the International Accounting Standards Board, have been adjusted to conform with U.S. GAAP. As such, the summarized financial data presented under this heading is in accordance with U.S. GAAP.
The Company’s 49% attributable share of operations from its investment in MSC was loss of $0.1 million for the year ended December 31, 2017, compared to an income of $13.0 million for the year ended December 31, 2016 and income of $2.4 million for the year ended December 31, 2015. These amounts are net of the amortization of the fair value increments arising from the Company’s purchase price allocation, net of impairment charges, and related income tax recovery.
Included in the income tax recovery is the impact of fluctuations in the exchange rate between the Argentine peso and the U.S. dollar on the peso-denominated deferred tax liability associated with the investment in MSC recorded as part of the acquisition of Minera Andes. As a devaluation of the Argentine peso relative to the U.S. dollar results in a recovery of deferred income taxes, the impact has been a decrease to the Company’s loss, or an increase to the Company’s income, from its investment in MSC. Furthermore, on December 29, 2017 the Senate of Argentina passed a significant tax reform to the Country’s tax system. The law changes the corporate tax rate from 35% to 25% by 2020. As a result of the tax reform, the Company recorded a $5.6 million deferred tax recovery corresponding to the deferred tax liability on the fair value increments arising from the Company’s purchase price allocation.
In 2015, the Company recorded an impairment charge of $11.8 million on its investment in MSC, primarily as a result of the significant decline in long-term estimated silver market prices, as well as in the observed market value of comparable transactions in South America, which indicated a likely significant decrease in the value of the exploration properties owned by MSC. These factors caused the Company to assess that there was a decline in fair value of its investment in MSC that was other than temporary. As the loss in value of the investment was considered other than temporary, an impairment of $11.8 million was recorded in the Company’s Consolidated Statement of Operations and Comprehensive (Loss) Income for the year ended December 31, 2015. No impairments were recorded to 2017 or 2016.
During the year ended December 31, 2017, the Company received $12.2 million in dividends from MSC, compared to $17.7 million in 2016.
92
MCEWEN MINING INC.
NOTES TO CONSOLIDATED FINANCIAL STATEMENTS
December 31, 2017
(tabular amounts are in thousands of U.S. dollars, unless otherwise noted) (Continued)
Changes in the Company’s investment in MSC for the year ended December 31, 2017 and 2016 are as follows:
|
|
|
December 31, 2017 |
|
December 31, 2016 |
||
|
Investment in MSC, beginning of the period |
|
$ |
162,320 |
|
$ |
167,107 |
|
Attributable net income from MSC |
|
|
(2,328) |
|
|
15,961 |
|
Amortization of fair value increments |
|
|
(9,632) |
|
|
(12,274) |
|
Income tax recovery |
|
|
11,916 |
|
|
9,264 |
|
Dividend distribution received |
|
|
(12,212) |
|
|
(17,738) |
|
Investment in MSC, end of the period |
|
$ |
150,064 |
|
$ |
162,320 |
A summary of the operating results from MSC for the year ended December 31, 2017, 2016, and 2015 is as follows:
|
|
|
Year ended December 31, |
|
|||||||
|
|
|
2017 |
|
2016 |
|
|
2015 |
|
||
|
Minera Santa Cruz S.A. (100%) |
|
|
|
|
|
|
|
|
|
|
|
Net Sales |
|
$ |
227,093 |
|
$ |
235,961 |
|
$ |
186,095 |
|
|
Production costs applicable to sales |
|
|
(177,180) |
|
|
(173,679) |
|
|
(158,615) |
|
|
Net (loss) income |
|
|
(4,750) |
|
|
32,574 |
|
|
(5,835) |
|
|
|
|
|
|
|
|
|
|
|
|
|
|
Portion attributable to McEwen Mining Inc. (49%) |
|
|
|
|
|
|
|
|
|
|
|
Net (loss) income |
|
$ |
(2,328) |
|
$ |
15,961 |
|
$ |
(2,859) |
|
|
Amortization of fair value increments |
|
|
(9,632) |
|
|
(12,274) |
|
|
(10,669) |
|
|
Income tax recovery |
|
|
11,916 |
|
|
9,264 |
|
|
15,942 |
|
|
(Loss) income from investment in MSC, net of amortization |
|
$ |
(44) |
|
$ |
12,951 |
|
$ |
2,414 |
|
As at December 31, 2017, MSC had current assets of $104.4 million, total assets of $406.5 million, current liabilities of $46.0 million and total liabilities of $100.3 million. These balances include the increase in fair value and amortization of the fair value increments arising from the Company’s purchase price allocation and are net of the impairment charges. Excluding the fair value increments from the purchase price allocation and impairment charges, MSC had current assets of $103.7 million, total assets of $248.3 million, current liabilities of $46.0 million, and total liabilities of $72.2 million as at December 31, 2017.
NOTE 8 ASSET RETIREMENT OBLIGATIONS
The Company is responsible for reclamation of certain past and future disturbances at its properties. The most significant properties subject to these obligations are the Tonkin property in Nevada, the El Gallo 1 mine in Mexico, and the Timmins properties in Canada.
The Final Plan for Permanent Closure (“FPPC”) and the Amended Plan of Operations for the Tonkin property was approved by the Nevada Division of Environmental Protection (“NDEP”) and by the Bureau of Land Management (“BLM”) pursuant to the Finding of No Significant Impact in March 2012 and September 2015, respectively. Subsequently, on October 3, 2015, the BLM requested an updated bonding requirement in the amount of $3.6 million, which is covered by the Company’s surety bond facility.
The Company assumed a reclamation obligation of $11.2 million related to the Black Fox Complex as a part of the acquisition of the Black Fox Complex (see Note 19 for additional details regarding the acquisition). The amount of the reclamation obligation is based on the 2017 Closure Cost Update approved by the Ministry of Northern Development and Mines (“MNDM”) which is based on the 2010 Closure Plan Amendment also approved by the MNDM. The Company is currently in the process of filing an amended Closure Plan with the MNDM in 2018, approval of which is anticipated in the fourth quarter of 2018. The Company also assumed the $16.5 million (C$20.5) million bonding requirement with the MNDM as a part of the acquisition, which is covered by the Company’s surety bond facility.
93
MCEWEN MINING INC.
NOTES TO CONSOLIDATED FINANCIAL STATEMENTS
December 31, 2017
(tabular amounts are in thousands of U.S. dollars, unless otherwise noted) (Continued)
The Company accrued $0.1 million related to disturbances at the Gold Bar project in the fourth quarter. This amount is expected to increase quarterly as the project undergoes development through 2018. This obligation is covered by the Company’s surety bond facility.
Under current Mexican regulations, surety bonding of projected reclamation costs is not required.
The Company’s reclamation expenses consisted of the following:
|
|
|
Year ended December 31, |
|||||||
|
|
|
2017 |
|
2016 |
|
2015 |
|||
|
Reclamation Adjustment reflecting updated estimates |
|
$ |
1,426 |
|
$ |
89 |
|
$ |
— |
|
Reclamation Accretion |
|
|
635 |
|
|
506 |
|
|
429 |
|
Total |
|
$ |
2,061 |
|
$ |
595 |
|
$ |
429 |
The Company’s asset retirement obligations for years ended December 31, 2017 and 2016 are as follows:
|
|
|
2017 |
|
2016 |
||
|
Asset retirement obligation liability, beginning of the period |
|
$ |
9,843 |
|
$ |
7,784 |
|
Settlements |
|
|
(126) |
|
|
(66) |
|
Accretion of liability |
|
|
635 |
|
|
506 |
|
Acquisitions and divestitures |
|
|
11,803 |
|
|
— |
|
Adjustment reflecting updated estimates |
|
|
2,561 |
|
|
1,619 |
|
Foreign exchange revaluation |
|
|
6 |
|
|
— |
|
Asset retirement obligation liability, ending balance |
|
$ |
24,722 |
|
$ |
9,843 |
|
Current portion |
|
|
(646) |
|
|
(537) |
|
Non-current portion |
|
$ |
24,076 |
|
$ |
9,306 |
NOTE 9 INCOME AND MINING TAXES
The Tax Cuts and Jobs Act (the “Act”) was enacted on December 22, 2017. The Act reduces the US federal corporate tax rate from 35% to 21%, requires companies to pay a one-time transition tax on earnings of certain foreign subsidiaries that were previously tax deferred and creates new taxes on certain foreign sourced earnings. At December 31, 2017, the Company has not completed the accounting for the tax effects of enactment of the Act; however, in certain cases as described below, the Company has made a reasonable estimate of the effects on the existing deferred tax balances and the one-time transition tax.
The Company remeasured certain deferred tax assets and liabilities based on the rates at which they are expected to reverse in the future, which is generally 21%. However, the Company is still analyzing certain aspects of the Act and refining the calculations, which could potentially affect the measurement of these balances or potentially give rise to new deferred tax amounts. The provisional amount recorded related to the re-measurement of the deferred tax balance was a reduction of $4.2 million to deferred tax liabilities, and a reduction of $23.7 million to the deferred tax assets, which have a valuation allowance provided against them.
The one-time transition tax is based on the Company’s total post-1986 earnings and profits (“E&P”) that were previously deferred from US income taxes. Based on preliminary calculations the Company will have $nil payable under the one-time transition tax. The Company has not yet completed the calculation as it continues to review the eligibility of foreign tax credits, along with earnings held in cash and other specified assets. This amount may change when the Company finalizes the calculation of post-1986 foreign E&P previously deferred from US federal taxation.
On December 29, 2017 the Senate of Argentina passed a significant tax reform to the country’s tax system. The law changes the corporate tax rate from 35% to 25% by 2020. As a result of the tax reform, the Company recorded a $3.9 million reduction to deferred tax liabilities on certain Argentine assets acquired in the 2012 Minera Andes acquisition and a reduction of $12.4 million to our deferred tax assets, which have a full valuation allowance provided against them.
94
MCEWEN MINING INC.
NOTES TO CONSOLIDATED FINANCIAL STATEMENTS
December 31, 2017
(tabular amounts are in thousands of U.S. dollars, unless otherwise noted) (Continued)
The Company’s deferred income and mining tax benefit consisted of:
|
|
|
2017 |
|
2016 |
|
2015 |
|||
|
United States |
|
$ |
10,349 |
|
$ |
515 |
|
$ |
(442) |
|
Foreign |
|
|
5,020 |
|
|
3,234 |
|
|
25,002 |
|
Deferred tax benefit |
|
$ |
15,369 |
|
$ |
3,749 |
|
$ |
24,560 |
The Company’s net (loss) income before income and mining tax consisted of:
|
|
|
2017 |
|
2016 |
|
2015 |
|||
|
United States |
|
$ |
(19,913) |
|
$ |
(13,959) |
|
$ |
(19,935) |
|
Foreign |
|
|
(6,090) |
|
|
31,265 |
|
|
(25,075) |
|
Net (loss) income before tax |
|
$ |
(26,003) |
|
$ |
17,306 |
|
$ |
(45,010) |
A reconciliation of the tax provision for 2017, 2016 and 2015 at statutory U.S. Federal and State income tax rates to the actual tax provision recorded in the financial statements is computed as follows:
|
Expected tax recovery at |
|
2017 |
|
2016 |
|
2015 |
|
|||
|
(Loss) income before income and mining taxes |
|
$ |
(26,003) |
|
$ |
17,306 |
|
$ |
(45,010) |
|
|
Statutory tax rate |
|
|
35% |
|
|
34% |
|
|
34% |
|
|
US Federal and State tax recovery at statutory rate |
|
|
(9,101) |
|
|
5,884 |
|
|
(15,303) |
|
|
Reconciling items: |
|
|
|
|
|
|
|
|
|
|
|
Equity pickup in MSC |
|
|
(16) |
|
|
(4,533) |
|
|
(821) |
|
|
Impairment of MSC |
|
|
— |
|
|
— |
|
|
4,004 |
|
|
Deferred foreign income inclusion |
|
|
21,002 |
|
|
— |
|
|
— |
|
|
Foreign tax credits |
|
|
(16,628) |
|
|
— |
|
|
— |
|
|
Tax rate changes |
|
|
28,048 |
|
|
— |
|
|
— |
|
|
Revisions to prior year estimates |
|
|
(573) |
|
|
(828) |
|
|
906 |
|
|
Adjustment for foreign tax rates |
|
|
115 |
|
|
(501) |
|
|
(1,230) |
|
|
Other permanent differences |
|
|
(1,761) |
|
|
818 |
|
|
(15,694) |
|
|
Unrealized foreign exchange rate (loss)/gain |
|
|
2,469 |
|
|
5,972 |
|
|
9,389 |
|
|
NOL expires and revisions |
|
|
(2,233) |
|
|
586 |
|
|
1,215 |
|
|
Valuation allowance |
|
|
(36,691) |
|
|
(11,147) |
|
|
(7,026) |
|
|
Tax benefit |
|
$ |
(15,369) |
|
$ |
(3,749) |
|
$ |
(24,560) |
|
95
MCEWEN MINING INC.
NOTES TO CONSOLIDATED FINANCIAL STATEMENTS
December 31, 2017
(tabular amounts are in thousands of U.S. dollars, unless otherwise noted) (Continued)
The tax effects of temporary differences that give rise to significant portions of the deferred tax assets and deferred tax liabilities as at December 31, 2017 and 2016 respectively are presented below:
|
|
|
2017 |
|
2016 |
|
||
|
Deferred tax assets: |
|
|
|
|
|
|
|
|
Net operating loss carryforward |
|
$ |
72,078 |
|
$ |
96,312 |
|
|
Mineral Properties |
|
|
59,905 |
|
|
14,195 |
|
|
Other temporary differences |
|
|
862 |
|
|
1,114 |
|
|
Total gross deferred tax assets |
|
|
132,845 |
|
|
111,621 |
|
|
Less: valuation allowance |
|
|
(123,648) |
|
|
(111,621) |
|
|
Net deferred tax assets |
|
$ |
9,197 |
|
$ |
— |
|
|
Deferred tax liabilities: |
|
|
|
|
|
|
|
|
Acquired mineral property interests |
|
|
(17,627) |
|
|
(23,655) |
|
|
Total deferred tax liabilities |
|
$ |
(17,627) |
|
$ |
(23,655) |
|
|
Total net deferred tax liability |
|
$ |
(8,430) |
|
$ |
(23,655) |
|
The Company reviews the measurement of its deferred tax assets at each balance sheet date.
As at December 31, 2017 the Company recognized a deferred tax asset to the extent of the deferred tax liability recognized on the acquired mineral property interests associated with the Gold Bar project, in the amount of $6.4 million. During the fourth quarter the Company commenced construction of the project, and is now able to reasonably estimate when the temporary difference associated with the deferred tax liability will reverse. The reversal is expected to occur over the same time period as existing tax assets, which have previously been provided for by the valuation allowance. On the basis of available information at December 31, 2017, the Company has provided a valuation allowance for certain of its deferred assets where the Company believes it is more likely than not that some portion or all of such assets will be realized. The change in valuation allowance of approximately $12 million primarily reflects an increase in relation to the Black Fox acquisition, partially offset by the reduction to tax assets pursuant to the recent tax reforms.
The table below summarizes changes to the valuation allowance:
|
For the year ended December 31, |
|
Balance at |
|
Additions(a) |
|
Deductions(b) |
|
Balance at |
||||
|
2017 |
|
$ |
111,621 |
|
$ |
51,220 |
|
$ |
(39,193) |
|
$ |
123,648 |
|
2016 |
|
|
122,768 |
|
|
1,430 |
|
|
(12,577) |
|
|
111,621 |
|
2015 |
|
|
129,794 |
|
|
6,873 |
|
|
(13,899) |
|
|
122,768 |
|
(a) |
The additions to valuation allowance mainly results from the Company and its subsidiaries incurring losses and exploration expenses for tax purposes which do not meet the more-likely-than-not criterion for recognition of deferred tax assets. |
|
(b) |
The reductions to valuation allowance mainly results from release of valuation allowance, reductions in deferred tax rates, expiration of the Company's tax attributes and foreign exchange reductions of tax attributes in Mexico and Argentina. |
The deferred tax liability related to the Minera Andes acquisition was $6.2 million as at December 31, 2017 (2016 - $12.6 million).
96
MCEWEN MINING INC.
NOTES TO CONSOLIDATED FINANCIAL STATEMENTS
December 31, 2017
(tabular amounts are in thousands of U.S. dollars, unless otherwise noted) (Continued)
As at December 31, 2017 and 2016, the Company did not have any income-tax related accrued interest and tax penalties.
The following table summarizes the Company’s losses that can be applied against future taxable profit:
|
Country |
|
Type of Loss |
|
Amount |
|
Expiry Period |
|
|
United States(a) |
|
Non-operating losses |
|
$ |
165,654 |
|
2018-2037 |
|
Mexico |
|
Non-operating losses |
|
|
33,355 |
|
2018-2027 |
|
Canada(a) |
|
Non-operating losses |
|
|
29,906 |
|
2018-2037 |
|
Argentina(a) |
|
Non-operating losses |
|
|
78,964 |
|
2018-2022 |
|
(a) |
The losses in the United States, Canada, and Argentina are part of multiple consolidating groups, and therefore, may be restricted in use to specific projects. |
The Company or its subsidiaries file income tax returns in Canada, the United States, Mexico, and Argentina. These tax returns are subject to examination by local taxation authorities provided the tax years remain open to audit under the relevant statute of limitations. The following summarizes the open tax years by major jurisdiction:
United States: 2014 to 2017
Canada: 2010 to 2017
Mexico: 2013 to 2017
Argentina: 2013 to 2017
NOTE 10 SHAREHOLDERS’ EQUITY
Capital distributions
During the year ended December 31, 2017, the Company paid two semi-annual distribution on February 14 and August 17, totaling $0.01 (December 31, 2016 - $0.01) per share of common stock, for a total distribution of $3.1 million (December 31, 2016 - $3.0 million). In light of the Tax and Jobs Act, enacted on December 22, 2017, the Company incurred a one-time transition tax on earnings of certain foreign subsidiaries, that were previously tax deferred. As a result of the inclusion of its subsidiaries’ foreign earnings, the Company will be in a taxable income position. As a result, the distributions made during 2017 have been re-characterized as taxable dividends.
Equity offerings
The Company issued 12,687,035 shares of common stock as part of the Lexam acquisition completed on April 26, 2017. See Note 19 Acquisitions.
On September 22, 2017, the Company issued 20,700,000 common shares and 10,350,000 warrants for net proceeds of $43.2 million, after deducting issuance costs of $3.4 million. Each common share purchased entitled the holder to receive half a warrant, and each whole warrant entitles the holder to purchase one common share at a price of $2.70. Warrants are exercisable at any time prior to September 28, 2018, after which the warrants will expire and be of no value.
97
MCEWEN MINING INC.
NOTES TO CONSOLIDATED FINANCIAL STATEMENTS
December 31, 2017
(tabular amounts are in thousands of U.S. dollars, unless otherwise noted) (Continued)
The Company concluded that both common shares and warrants are equity-linked financial instruments and should be accounted for permanently in the Shareholder’s Equity section in the Consolidated Balance Sheet, with no requirement to subsequently revalue any of the instruments. Based on the relative fair values, the Company allocated $39.4 million to common shares and $3.8 million to warrants, net of issuance costs. The Company used the Black-Scholes pricing model to determine the fair value of warrants using the following assumptions:
|
Risk-free interest rate |
|
1.56 |
% |
|
Dividend yield |
|
0.36 |
% |
|
Volatility factor of the expected market price of common stock |
|
71 |
% |
|
Weighted-average expected life |
|
53 weeks |
|
|
Weighted-average grant date fair value |
$ |
0.40 |
|
All 10,350,000 warrants remain outstanding and unexercised as of December 31, 2017.
Flow-through shares
On December 19, 2017, the Company issued 4,000,000 flow-through common shares (within the meaning of subsection 66(15) of the Income Tax Act (Canada)) priced at $2.50 per share for total proceeds of $10 million. The purpose of the offering is to fund generative exploration activities on the Company’s properties in the Timmins region of Canada. The total proceeds were allocated between the sale of tax benefits and the sale of common shares. The total issuance costs related to the issuance of the flow-through shares was $0.5 million, which are accounted for as a reduction to the common shares. The Company has also recorded a liability for the flow-through premium received in the amount of $1.6 million, which was accounted for as a reduction to the common share proceeds. The obligation is fulfilled when eligible expenditures are incurred.
The proceeds of the flow-through shares offering are shown as Restricted cash on the Consolidated Balance Sheet.
Share repurchase
During the twelve months ended December 31, 2016 the Company repurchased 557,991 shares of common stock (December 31, 2015 – 1,896,442 shares of common stock), all of which have been cancelled, at a total cost of $0.6 million (December 31, 2015 - $1.8 million). The share repurchase program expired on September 30, 2016. No further repurchase programs were initiated during the year ended December 31, 2017.
NOTE 11 STOCK BASED COMPENSATION
Stock Options
The Company’s Amended and Restated Equity Incentive Plan (“Plan”) allows for equity awards to be granted to employees, consultants, advisors, and directors. The Plan is administered by the Compensation Committee of the Board of Directors (“Committee”), which determines the terms pursuant to which any award is granted. The Committee may delegate to certain officers the authority to grant awards to certain employees (other than such officers), consultants and advisors. The number of shares of common stock reserved for issuance thereunder is 17.5 million shares, including shares issued under the Plan before it was amended, with no more than 1 million shares subject to grants of options to an individual in a calendar year. The Plan also provides for the grant of incentive options under Section 422 of the Internal Revenue Code (the “Code”), which provide potential tax benefits to the recipients compared to non-qualified options. At December 31, 2017, 5,283,137 awards were authorized and available for issuance under the Plan (December 31, 2016 – 5,294,563 awards).
During the year ended December 31, 2017, 94,000 shares of common stock (December 31, 2016 – 1,494,085) were issued upon exercise of stock options under the Plan, at a weighted average exercise price of $1.30 (2016 - $2.51) per share for proceeds of $0.1 million (2016 - $3.7 million).
98
MCEWEN MINING INC.
NOTES TO CONSOLIDATED FINANCIAL STATEMENTS
December 31, 2017
(tabular amounts are in thousands of U.S. dollars, unless otherwise noted) (Continued)
The following table summarizes information about stock options under the Plan outstanding at December 31, 2017:
|
|
|
|
|
|
|
|
|
|
|
|
|
|
|
|
|
|
|
|
|
Weighted |
|
|
|
|
|
|
|
|
|
Weighted |
|
Average |
|
|
|
|
|
|
|
|
|
|
Average |
|
Remaining |
|
|
|
|
|
|
|
|
Number of |
|
Exercise |
|
Contractual |
|
Intrinsic |
|
||
|
|
|
Shares |
|
Price |
|
Life (Years) |
|
Value |
|
||
|
|
|
(in thousands, except per share and year data) |
|
||||||||
|
Balance at December 31, 2015 |
|
6,954 |
|
$ |
2.49 |
|
4.1 |
|
$ |
98 |
|
|
Granted |
|
645 |
|
|
3.99 |
|
— |
|
|
— |
|
|
Exercised |
|
(1,457) |
|
|
2.48 |
|
— |
|
|
1,601 |
|
|
Forfeited |
|
(1,422) |
|
|
3.45 |
|
— |
|
|
— |
|
|
Expired |
|
— |
|
|
— |
|
— |
|
|
— |
|
|
Balance at December 31, 2016 |
|
4,720 |
|
$ |
2.41 |
|
3.4 |
|
$ |
4,388 |
|
|
Granted |
|
338 |
|
|
2.99 |
|
— |
|
|
— |
|
|
Exercised |
|
(94) |
|
|
1.30 |
|
— |
|
|
87 |
|
|
Forfeited |
|
(37) |
|
|
4.28 |
|
— |
|
|
— |
|
|
Expired |
|
(21) |
|
|
5.00 |
|
— |
|
|
— |
|
|
Balance at December 31, 2017 |
|
4,906 |
|
$ |
2.45 |
|
2.6 |
|
$ |
2,564 |
|
|
Exercisable at December 31, 2017 |
|
3,438 |
|
$ |
2.48 |
|
2.2 |
|
$ |
1,686 |
|
Stock options have been granted to key employees, directors and consultants under the Plan. Options to purchase shares under the Plan were granted at or above market value as of the date of the grant. During the year ended December 31, 2017, the Company granted stock options to certain employees and directors for an aggregate of 0.3 million shares of common stock (2016 - 0.6 million, 2015 - 2.7 million) at a weighted average exercise price of $2.99 per share (2016 – $3.99, 2015 - $1.03). The options vest equally over a three-year period if the individuals remain affiliated with the Company (subject to acceleration of vesting in certain events) and are exercisable for a period of 5 years from the date of grant.
The fair value of the options granted under the Plan was estimated at the date of grant, using the Black-Scholes option-pricing model, with the following weighted-average assumptions:
|
|
|
|
2017 |
|
|
2016 |
|
|
2015 |
|
Risk-free interest rate |
|
|
1.46% to 1.60% |
|
|
1.13% to 1.21% |
|
|
1.10% to 1.79% |
|
Dividend yield |
|
|
0.31% to 0.36% |
|
|
0.24% to 0.27% |
|
|
0% to 1.15% |
|
Volatility factor of the expected market price of common stock |
|
|
72% to 74% |
|
|
74% |
|
|
73% to 74% |
|
Weighted-average expected life of option |
|
|
3.5 years |
|
|
5.0 years |
|
|
5.0 years |
|
Weighted-average grant date fair value |
|
$ |
2.99 |
|
$ |
2.36 |
|
$ |
0.49 |
During the year ended December 31, 2017, the Company recorded stock option expense of $1.4 million (2016 -$1.0 million, 2015 - $1.3 million) while the corresponding fair value of awards vesting in the period was $1.3 million (2016 - $1.3 million and 2015 - $1.5 million).
At December 31, 2017, there was $0.7 million (2016 - $1.4 million, 2015 - $1.6 million) of unrecognized compensation expense related to 1.5 million (2016 – 2.5 million, 2015 – 4.2 million) unvested stock options outstanding. This cost is expected to be recognized over a weighted-average period of approximately 1.3 years (2016 - 1.6 years, 2015 – 1.6 years).
99
MCEWEN MINING INC.
NOTES TO CONSOLIDATED FINANCIAL STATEMENTS
December 31, 2017
(tabular amounts are in thousands of U.S. dollars, unless otherwise noted) (Continued)
The following table summarizes the status and activity of non-vested stock options for the year ended December 31, 2017, for the Company’s Plan and the replacement options from the acquisition of Lexam (see Note 19 Acquisitions):
|
|
|
|
|
Weighted |
|
|
|
|
|
|
Average |
|
|
|
|
Number of |
|
Grant Date |
|
|
|
|
Shares |
|
Fair Value |
|
|
|
|
(in thousands, except per share amounts) |
|||
|
Non-vested, beginning of year |
|
2,463 |
|
$ |
1.08 |
|
Granted |
|
392 |
|
$ |
1.69 |
|
Cancelled/Forfeited |
|
(19) |
|
$ |
1.85 |
|
Vested |
|
(1,357) |
|
$ |
1.08 |
|
Non-vested, end of year |
|
1,479 |
|
$ |
1.24 |
NOTE 12 NET (LOSS) INCOME PER SHARE
Basic net (loss) income per share is computed by dividing the net (loss) income available to common shareholders by the weighted average number of common shares outstanding during the period. Diluted net (loss) income per share is computed similarly except that the weighted average number of common shares is increased to reflect all dilutive instruments. Diluted net (loss) income per share is calculated using the treasury stock method. In applying the treasury stock method, employee stock options with an exercise price greater than the average quoted market price of the common shares for the period outstanding are not included in the calculation of diluted net (loss) income per share as the impact is anti-dilutive. Potentially dilutive instruments are not considered in calculating the diluted loss per share, as their effect would be anti-dilutive.
Below is a reconciliation of the basic and diluted weighted average number of common shares and the computations for basic (loss) income per share and diluted (loss) income for the years ended December 31, 2017, 2016 and 2015:
|
|
|
|
Year ended December 31, |
|
|||||||
|
|
|
|
2017 |
|
2016 |
|
2015 |
|
|||
|
|
|
|
(in thousands, except per share amounts) |
|
|||||||
|
Net (loss) income |
|
|
$ |
(10,634) |
|
$ |
21,055 |
|
$ |
(20,450) |
|
|
|
|
|
|
|
|
|
|
|
|
|
|
|
Weighted average common shares outstanding: |
|
|
|
313,887 |
|
|
298,772 |
|
|
300,341 |
|
|
Effect of employee stock-based awards |
|
|
|
— |
|
|
1,702 |
|
|
— |
|
|
Diluted shares outstanding: |
|
|
|
313,887 |
|
|
300,474 |
|
|
300,341 |
|
|
|
|
|
|
|
|
|
|
|
|
|
|
|
Net (loss) income per share: |
|
|
|
|
|
|
|
|
|
|
|
|
Basic |
|
|
$ |
(0.03) |
|
$ |
0.07 |
|
|
(0.07) |
|
|
Diluted |
|
|
$ |
(0.03) |
|
$ |
0.07 |
|
|
(0.07) |
|
Options to purchase 2.2 million shares of common stock at an average exercise price of $3.97 at December 31, 2017 were not included in the computation of diluted weighted average shares outstanding because their exercise price exceeded the average price of the Company’s common stock for the year ended December 31, 2016 and their effect would have been anti-dilutive. Warrants to purchase 10.35 million shares of common stock at a price of $2.70 were not included in the computation of diluted weighted average shares outstanding because their effect would have been anti-dilutive. In 2017 and 2015, as the Company was in a loss position, all potentially dilutive instruments were anti-dilutive and therefore not included in the calculation of diluted net loss per share.
100
MCEWEN MINING INC.
NOTES TO CONSOLIDATED FINANCIAL STATEMENTS
December 31, 2017
(tabular amounts are in thousands of U.S. dollars, unless otherwise noted) (Continued)
NOTE 13 COMMITMENTS AND CONTINGENCIES
Commitments
At December 31, 2017, the Company’s commitments include long-term operating leases covering office space, land and equipment purchase commitments, exploration expenditures, option payments on properties and reclamation costs for the following minimum amounts:
|
|
|
Payments due by period |
|||||||||||||||||||
|
|
|
2018 |
|
2019 |
|
2020 |
|
2021 |
|
2022 |
|
Thereafter |
|
Total |
|||||||
|
|
|
(in thousands) |
|||||||||||||||||||
|
Operating lease obligations (office rent) |
|
$ |
400 |
|
$ |
368 |
|
$ |
300 |
|
$ |
240 |
|
$ |
230 |
|
$ |
197 |
|
$ |
1,735 |
|
Operating lease obligations (mining and surface rights) |
|
|
3,994 |
|
|
436 |
|
|
442 |
|
|
442 |
|
|
437 |
|
|
— |
|
|
5,751 |
|
Exploration (including $10.0 million flow-through shares) |
|
|
11,554 |
|
|
— |
|
|
— |
|
|
— |
|
|
— |
|
|
— |
|
|
11,554 |
|
Construction |
|
|
11,344 |
|
|
— |
|
|
— |
|
|
— |
|
|
— |
|
|
— |
|
|
11,344 |
|
Reclamation costs(1) |
|
|
639 |
|
|
448 |
|
|
3,883 |
|
|
3,974 |
|
|
3,181 |
|
|
30,807 |
|
|
42,932 |
|
Total |
|
$ |
27,931 |
|
$ |
1,252 |
|
$ |
4,625 |
|
$ |
4,656 |
|
$ |
3,848 |
|
$ |
31,004 |
|
$ |
73,316 |
|
(1) |
Amounts presented represent the undiscounted uninflated future payments. |
For the year ended December 31, 2017, the Company had rental expense under operating leases of $0.4 million (2016 - $0.4 million; 2015 - $0.5 million).
Reclamation Bonds
As part of its ongoing business and operations, the Company is required to provide bonding for its environmental reclamation obligations in the United States and Canada. Pursuant to the requirements imposed by United States Bureau of Land Management (“BLM”), the Company has Nevada bonding obligations of $19.9 million which primarily pertains to the Tonkin property and the Gold Bar property reclamation requirements. Under current Mexican regulations, bonding of projected reclamation costs is not required. Under Canadian regulations, the Company was required to deposit approximately $0.1 million with respect to its Timmins properties acquired from Lexam. The $0.1 million is recorded as restricted cash in Other assets. Furthermore, under Canadian regulations, the Company has bonding obligations of $16.5 million (C$20.6 million) with respect to the Black Fox Complex.
Surety Bonds
The Company satisfies its reclamation bonding obligations in the United States and Canada through the use of surety bonds. These surety bonds are available for draw down by the beneficiary in the event the Company does not perform its reclamation obligations. If the specific reclamation requirements are met, the beneficiary of the surety bonds will release the instrument to the issuing entity. The Company believes it is in compliance with all applicable bonding obligations and will be able to satisfy future bonding requirements, through existing or alternative means, as they arise.
On June 23, 2017, the Company replaced its previous surety facility by entering into a new $20.0 million surety facility, carrying an annual financing fee of 2%, with no requirement for an initial deposit and the financing fee payable only on draw down amounts. The $0.5 million deposit associated with the previous facility and recorded in Other assets was released and received by the Company in July 2017. Effective July 1, the Company drew down $3.6 million for the Tonkin project and $1.3 million for other exploration projects in Nevada.
101
MCEWEN MINING INC.
NOTES TO CONSOLIDATED FINANCIAL STATEMENTS
December 31, 2017
(tabular amounts are in thousands of U.S. dollars, unless otherwise noted) (Continued)
On August 25, 2017, the BLM in Nevada accepted the Company’s bond in the amount of $15.0 million to provide reclamation coverage for operations on the Gold Bar property. On August 25, 2017, the Company drew down $15.0 million on the existing surety to satisfy the bonding requirements for the Gold Bar project.
In connection with the Black Fox acquisition, as described in Note 19 Acquisitions, the Company extended its existing $20.0 million surety facility to include the necessary bonding to satisfy the Black Fox closure plan. The terms of the credit facility remain the same, with no requirement for an initial deposit and an annual financing fee of 2%. Black Fox has bonding requirements of $16.5 million (C$20.6 million).
Flow-Through Common Shares
The Company raised $10.0 million (C$12.88 million) during 2017 on a Canadian flow-through tax basis. The Company is required to spend this amount on Canadian Exploration Expenditures and renounce the associated tax benefit before December 31, 2018. As at December 31, 2017, $nil has been spent. The Company expects to meet this commitment.
Streaming Agreement
As part of the acquisition of the Black Fox Complex, the Company assumed a gold purchase agreement (streaming contract) related to production, if any, from certain claims. The Company is obligated to sell 8% of gold production from the Black Fox mine and 6.3% at the adjoining Pike River property (Black Fox Extension) to Sandstorm Gold Ltd. at the lesser of market price or $531 per ounce (with inflation adjustments of up to 2% per year) until 2090.
The Company records revenue on these shipments based on the contract price at the time of delivery to the customer. During the year ended December 31, 2017 subsequent to the acquisition of Black Fox, the company recorded revenue of $0.4 million (2016 - $nil).
Short-term Bank Indebtedness
On November 30, 2017, Compañia Minera Pangea, S.A. de C.V. (“CMP”), a wholly-owned subsidiary of the Company, executed a line of credit agreement with Banco Nacional de Comercio Exterior, S.N.C., a Mexican federal development banking institution (“Bancomext”). The line of credit allows CMP to borrow up to 120,000,000 Mexican pesos (approximately $6.4 million based on a market exchange rate of 19.64 Mexican pesos to 1 US dollar, as published by Bloomberg on November 30, 2017). Borrowing under the Line of Credit will be available for one (1) year from November 30, 2017.
Interest payments under the Line of Credit are due quarterly beginning with any borrowing and a final payment of all principal and accrued interest is due twenty-four (24) months following the date of the first withdrawal. CMP is permitted to prepay any amounts owed without penalty. The interest rate for each advance is as agreed upon by the parties prior to each advance, and will be reviewed and adjusted on a quarterly basis.
CMP is permitted to use the proceeds from the line of credit (i) to finance up to 90% of the value added tax (“VAT”) refunds related to the cost of its El Gallo 1 mining project, (ii) as working capital, and (iii) for other expenses related to CMP’s mining activity. Borrowings under the line of credit are secured by a lien on all VAT collections received by CMP.
The line of credit will be immediately due and payable in the event of a failure to pay principal or interest when due, or for a breach of other covenants set forth in the line of credit. All amounts due under the line of credit have been irrevocably and unconditionally guaranteed by the Company.
As of December 31, 2017, no funds had been withdrawn from the line of credit.
102
MCEWEN MINING INC.
NOTES TO CONSOLIDATED FINANCIAL STATEMENTS
December 31, 2017
(tabular amounts are in thousands of U.S. dollars, unless otherwise noted) (Continued)
Other potential contingencies
The Company’s mining and exploration activities are subject to various laws and regulations governing the protection of the environment. These laws and regulations are continually changing and generally becoming more restrictive. The Company conducts its operations so as to protect public health and the environment, and believes its operations are materially in compliance with all applicable laws and regulations. The Company has made, and expects to make in the future, expenditures to comply with such laws and regulations.
The Company and its predecessors have transferred their interest in several mining properties to third parties throughout its history. The Company could remain potentially liable for environmental enforcement actions related to its prior ownership of such properties. However, the Company has no reasonable belief that any violation of relevant environmental laws or regulations has occurred regarding these transferred properties.
NOTE 14 RELATED PARTY TRANSACTIONS
The Company incurred the following expense (income) in respect to the related parties outlined below:
|
|
|
|
|
Year ended December 31, |
|
|||||||
|
|
|
|
|
2017 |
|
2016 |
|
2015 |
|
|||
|
Lexam L.P. |
|
|
|
$ |
152 |
|
$ |
187 |
|
$ |
104 |
|
|
Lexam VG Gold |
|
|
|
|
(33) |
|
|
85 |
|
|
(1) |
|
|
Noblegen Inc. |
|
|
|
|
40 |
|
|
— |
|
|
— |
|
|
REVlaw |
|
|
|
|
330 |
|
|
124 |
|
|
59 |
|
|
Inventus |
|
|
|
|
(36) |
|
|
— |
|
|
— |
|
The Company has the following outstanding accounts payable (receivable) balance in respect to the related parties outlined below:
|
|
|
|
|
Year ended December 31, |
||||
|
|
|
|
|
2017 |
|
2016 |
||
|
Lexam VG Gold |
|
|
|
$ |
— |
|
$ |
27 |
|
REVlaw |
|
|
|
|
17 |
|
|
148 |
|
Inventus |
|
|
|
|
(36) |
|
|
— |
An aircraft owned by Lexam L.P. (which is controlled by Robert R. McEwen, limited partner and beneficiary of Lexam L.P. and the Company’s Chairman and Chief Executive Officer) has been made available to the Company in order to expedite business travel. In his role as Chairman and Chief Executive Officer of the Company, Mr. McEwen must travel extensively and frequently on short notice. Mr. McEwen is able to charter the aircraft from Lexam L.P. at a preferential rate approved by the Company’s independent board members under a policy whereby only the variable expenses of operating this aircraft for business related travel are eligible for reimbursement by the Company.
On April 26, 2017, the Company completed the acquisition of 100% of the issued and outstanding securities of Lexam and Lexam became a wholly-owned subsidiary of the Company. See Note 19 Acquisitions. Prior to the acquisition, Robert R. McEwen was the Non-Executive Chairman of Lexam and held a 27% ownership in Lexam and the Company shared services with Lexam including rent, personnel, office expenses and other administrative services. Historically, these transactions were in the normal course of business.
Robert R. McEwen is also a significant shareholder of Noblegen Inc., a company that develops processes to commercially cultivate microorganisms with applications in different industries. The metallurgical services provided by Noblegen Inc. are in the normal course of business and have been recorded at their exchange amount.
103
MCEWEN MINING INC.
NOTES TO CONSOLIDATED FINANCIAL STATEMENTS
December 31, 2017
(tabular amounts are in thousands of U.S. dollars, unless otherwise noted) (Continued)
REVlaw is a company owned by Ms. Carmen Diges, General Counsel of the Company. The legal services of Ms. Diges as General Counsel and one other member of the legal department are provided by REVlaw in the normal course of business and have been recorded at their exchange amount.
Robert R. McEwen is a significant shareholder of Inventus Mining Corp. (“Inventus”). Stefan Spears, Special Projects, is the CEO and Chairman of Inventus. As responsible of Special Projects, he provides consulting services to the Company in areas unrelated to Inventus. The Company provides custom milling services to Inventus which is in the normal course of business and has been recorded at their exchange amount.
NOTE 15 OPERATING SEGMENT REPORTING
McEwen Mining is a mining and minerals exploration company focused on precious metals in Argentina, Mexico, Canada, and the United States. The Company’s chief operating decisions maker (“CODM”) reviews the operating results, assesses performance and makes decisions about allocation of resources to these segments at the geographic region level or major mine/project where the economic characteristics of the individual mines or projects are not alike. As a result, these operating segments also represent the Company’s reportable segments. The Company’s business activities that are not considered operating segments and not provided to the CODM for review are included in Corporate and other and are provided in this note for reconciliation purposes.
The CODM reviews segment (loss) income, defined as gold and silver sales less production costs applicable to sales, mine development costs, exploration costs, property holding costs and general and administrative expenses for all segments except for the MSC segment which is evaluated based on the attributable equity income. Gold and silver sales and production costs applicable to sales for the reportable segments are reported net of intercompany transactions.
In 2017, the Company completed the acquisition of Lexam, which included a portfolio of exploration projects, and certain assets and liabilities of the Black Fox Complex, all of which are located in Timmins, Ontario, Canada. These assets are managed together as a single operating segment by the CODM. Accordingly, the Company separately reported segment (loss) income attributable to Canada beginning in 2017. The updated composition of segments reflects the distinct economic characteristic of each mine/project.
104
MCEWEN MINING INC.
NOTES TO CONSOLIDATED FINANCIAL STATEMENTS
December 31, 2017
(tabular amounts are in thousands of U.S. dollars, unless otherwise noted) (Continued)
Significant information relating to the Company’s reportable operating segments is summarized in the tables below:
|
Year ended December 31, 2017 |
|
Mexico |
|
MSC |
|
Los Azules |
|
USA |
|
|
Canada |
|
Total |
|||||
|
Gold and silver sales |
|
$ |
55,845 |
|
$ |
— |
|
$ |
— |
|
$ |
— |
|
$ |
11,620 |
|
$ |
67,465 |
|
Other revenue |
|
|
— |
|
|
— |
|
|
— |
|
|
— |
|
|
259 |
|
|
259 |
|
Production costs applicable to sales |
|
|
(35,292) |
|
|
— |
|
|
— |
|
|
— |
|
|
(9,888) |
|
|
(45,180) |
|
Revision of estimates and accretion of reclamation obligations |
|
|
(326) |
|
|
— |
|
|
— |
|
|
(300) |
|
|
(1,435) |
|
|
(2,061) |
|
Mine development costs |
|
|
(745) |
|
|
— |
|
|
— |
|
|
(3,092) |
|
|
— |
|
|
(3,837) |
|
Exploration costs |
|
|
(5,610) |
|
|
— |
|
|
(7,923) |
|
|
(2,132) |
|
|
(1,544) |
|
|
(17,209) |
|
Property holding costs |
|
|
(2,131) |
|
|
— |
|
|
(56) |
|
|
(1,667) |
|
|
(25) |
|
|
(3,879) |
|
Impairment of mineral property interests and property and equipment |
|
|
(711) |
|
|
— |
|
|
— |
|
|
— |
|
|
— |
|
|
(711) |
|
General and administrative costs |
|
|
(3,772) |
|
|
— |
|
|
(1,242) |
|
|
(1,927) |
|
|
(92) |
|
|
(7,033) |
|
Income (loss) from investment in Minera Santa Cruz S.A. (net of amortization) |
|
|
— |
|
|
(44) |
|
|
— |
|
|
— |
|
|
— |
|
|
(44) |
|
Segment income (loss) |
|
$ |
7,258 |
|
$ |
(44) |
|
$ |
(9,221) |
|
$ |
(9,118) |
|
$ |
(1,105) |
|
$ |
(12,230) |
|
Corporate and other |
|
|
|
|
|
|
|
|
|
|
|
|
|
|
|
|
|
|
|
Other exploration costs |
|
|
|
|
|
|
|
|
|
|
|
|
|
|
|
|
$ |
(505) |
|
General and administrative costs |
|
|
|
|
|
|
|
|
|
|
|
|
|
|
|
|
|
(11,839) |
|
Depreciation |
|
|
|
|
|
|
|
|
|
|
|
|
|
|
|
|
|
(1,453) |
|
Interest and other expense |
|
|
|
|
|
|
|
|
|
|
|
|
|
|
|
|
|
(938) |
|
Gain on sale of assets |
|
|
|
|
|
|
|
|
|
|
|
|
|
|
|
|
|
11 |
|
Gain on sale of marketable equity securities |
|
|
|
|
|
|
|
|
|
|
|
|
|
|
|
|
|
840 |
|
Other-than-temporary impairment on marketable equity securities |
|
|
|
|
|
|
|
|
|
|
|
|
|
|
|
|
|
(356) |
|
Unrealized (loss) gain on derivatives |
|
|
|
|
|
|
|
|
|
|
|
|
|
|
|
|
|
(227) |
|
Foreign currency gain |
|
|
|
|
|
|
|
|
|
|
|
|
|
|
|
|
|
694 |
|
Net (loss) before income and mining taxes |
|
|
|
|
|
|
|
|
|
|
|
|
|
|
|
|
$ |
(26,003) |
|
Year ended December 31, 2016 |
|
Mexico |
|
MSC |
|
Los Azules |
|
USA |
|
Canada |
|
Total |
||||||
|
Gold and silver sales |
|
$ |
60,388 |
|
$ |
— |
|
$ |
— |
|
$ |
— |
|
$ |
— |
|
$ |
60,388 |
|
Production costs applicable to sales |
|
|
(28,133) |
|
|
— |
|
|
— |
|
|
— |
|
|
— |
|
|
(28,133) |
|
Mine development costs |
|
|
(1,174) |
|
|
— |
|
|
— |
|
|
(2,692) |
|
|
— |
|
|
(3,866) |
|
Exploration costs |
|
|
(4,100) |
|
|
— |
|
|
(1,649) |
|
|
(1,973) |
|
|
— |
|
|
(7,722) |
|
Property holding costs |
|
|
(1,642) |
|
|
— |
|
|
(405) |
|
|
(1,489) |
|
|
— |
|
|
(3,536) |
|
General and administrative costs |
|
|
(2,688) |
|
|
— |
|
|
(646) |
|
|
(228) |
|
|
— |
|
|
(3,562) |
|
Income (loss) from investment in Minera Santa Cruz S.A. (net of amortization) |
|
|
— |
|
|
12,951 |
|
|
— |
|
|
— |
|
|
— |
|
|
12,951 |
|
Segment income (loss) |
|
$ |
22,651 |
|
$ |
12,951 |
|
$ |
(2,700) |
|
$ |
(6,382) |
|
$ |
— |
|
$ |
26,520 |
|
Corporate and other |
|
|
|
|
|
|
|
|
|
|
|
|
|
|
|
|
|
|
|
Other exploration costs |
|
|
|
|
|
|
|
|
|
|
|
|
|
|
|
|
$ |
(237) |
|
General and administrative costs |
|
|
|
|
|
|
|
|
|
|
|
|
|
|
|
|
|
(9,172) |
|
Depreciation |
|
|
|
|
|
|
|
|
|
|
|
|
|
|
|
|
|
(1,169) |
|
Revision of estimates and accretion of reclamation obligations |
|
|
|
|
|
|
|
|
|
|
|
|
|
|
|
|
|
(595) |
|
Interest and other income |
|
|
|
|
|
|
|
|
|
|
|
|
|
|
|
|
|
835 |
|
Gain on sale of assets |
|
|
|
|
|
|
|
|
|
|
|
|
|
|
|
|
|
24 |
|
Gain on sale of marketable securities |
|
|
|
|
|
|
|
|
|
|
|
|
|
|
|
|
|
22 |
|
Other-than-temporary impairment on marketable equity securities |
|
|
|
|
|
|
|
|
|
|
|
|
|
|
|
|
|
(882) |
|
Unrealized gain on derivatives |
|
|
|
|
|
|
|
|
|
|
|
|
|
|
|
|
|
1,379 |
|
Foreign currency gain |
|
|
|
|
|
|
|
|
|
|
|
|
|
|
|
|
|
581 |
|
Net income before income and mining taxes |
|
|
|
|
|
|
|
|
|
|
|
|
|
|
|
|
$ |
17,306 |
105
MCEWEN MINING INC.
NOTES TO CONSOLIDATED FINANCIAL STATEMENTS
December 31, 2017
(tabular amounts are in thousands of U.S. dollars, unless otherwise noted) (Continued)
|
Year ended December 31, 2015 |
|
Mexico |
|
MSC |
|
Los Azules |
|
USA |
|
Canada |
|
Total |
||||||
|
Gold and silver sales |
|
$ |
72,956 |
|
$ |
— |
|
$ |
— |
|
$ |
— |
|
$ |
— |
|
$ |
72,956 |
|
Production costs applicable to sales |
|
|
(34,607) |
|
|
— |
|
|
— |
|
|
— |
|
|
— |
|
|
(34,607) |
|
Mine development costs |
|
|
(761) |
|
|
— |
|
|
— |
|
|
(408) |
|
|
— |
|
|
(1,169) |
|
Exploration costs |
|
|
(4,526) |
|
|
— |
|
|
(1,481) |
|
|
(2,517) |
|
|
— |
|
|
(8,524) |
|
Property holding costs |
|
|
(2,471) |
|
|
— |
|
|
(356) |
|
|
(1,509) |
|
|
— |
|
|
(4,336) |
|
General and administrative costs |
|
|
(3,953) |
|
|
— |
|
|
(647) |
|
|
(203) |
|
|
— |
|
|
(4,803) |
|
Income (loss) from investment in Minera Santa Cruz S.A. (net of amortization) |
|
|
— |
|
|
2,414 |
|
|
— |
|
|
— |
|
|
— |
|
|
2,414 |
|
Segment income (loss) |
|
$ |
26,638 |
|
$ |
2,414 |
|
$ |
(2,484) |
|
|
(4,637) |
|
$ |
— |
|
$ |
21,931 |
|
Corporate and other |
|
|
|
|
|
|
|
|
|
|
|
|
|
|
|
|
|
|
|
Other exploration costs |
|
|
|
|
|
|
|
|
|
|
|
|
|
|
|
|
$ |
(274) |
|
General and administrative costs |
|
|
|
|
|
|
|
|
|
|
|
|
|
|
|
|
|
(7,242) |
|
Depreciation |
|
|
|
|
|
|
|
|
|
|
|
|
|
|
|
|
|
(942) |
|
Revision of estimates and accretion of reclamation obligations |
|
|
|
|
|
|
|
|
|
|
|
|
|
|
|
|
|
(429) |
|
Impairment of mineral property interests and property and equipment |
|
|
|
|
|
|
|
|
|
|
|
|
|
|
|
|
|
(50,600) |
|
Impairment of investment in Minera Santa Cruz S.A. |
|
|
|
|
|
|
|
|
|
|
|
|
|
|
|
|
|
(11,777) |
|
Interest and other income |
|
|
|
|
|
|
|
|
|
|
|
|
|
|
|
|
|
2,404 |
|
Gain on sale of assets |
|
|
|
|
|
|
|
|
|
|
|
|
|
|
|
|
|
13 |
|
Foreign currency gain |
|
|
|
|
|
|
|
|
|
|
|
|
|
|
|
|
|
1,906 |
|
Net loss before income and mining taxes |
|
|
|
|
|
|
|
|
|
|
|
|
|
|
|
|
$ |
(45,010) |
Geographic information
|
|
|
Long-lived Assets |
|
Revenue(1) |
|||||||||||
|
|
|
Year ended December 31, |
|
Year ended December 31, |
|||||||||||
|
|
|
2017 |
|
2016 |
|
2017 |
|
2016 |
|
2015 |
|||||
|
Canada |
|
$ |
85,179 |
|
$ |
663 |
|
$ |
11,879 |
|
$ |
— |
|
$ |
— |
|
Mexico |
|
|
35,446 |
|
|
27,582 |
|
|
55,845 |
|
|
60,388 |
|
|
72,956 |
|
USA |
|
|
43,086 |
|
|
37,620 |
|
|
— |
|
|
— |
|
|
— |
|
Argentina(2) |
|
|
341,554 |
|
|
353,879 |
|
|
— |
|
|
— |
|
|
— |
|
Total consolidated |
|
$ |
505,265 |
|
$ |
419,744 |
|
$ |
67,724 |
|
$ |
60,388 |
|
$ |
72,956 |
|
(1) |
Presented based on the location from which the product originated. |
|
(2) |
Includes Investment in MSC of $151.0 million as of December 31, 2017 (December 31, 2016 - $162.0 million). |
As gold and silver can be sold through numerous gold and silver market traders worldwide, the Company is not economically dependent on a limited number of customers for the sale of its product. In 2017, 2016 and 2015, sales to Bank of Nova Scotia were $65.9 million (94%), $58.1 million (96%), and $67.2 million (92%), respectively, of total gold and silver sales.
106
MCEWEN MINING INC.
NOTES TO CONSOLIDATED FINANCIAL STATEMENTS
December 31, 2017
(tabular amounts are in thousands of U.S. dollars, unless otherwise noted) (Continued)
Capital Expenditures information
Capital expenditures includes acquisitions of Property and Equipment and Mineral Property Interests, net of dispositions and amortization.
|
|
|
Capital Expenditures |
|||||||
|
|
|
Year ended December 31, |
|||||||
|
|
|
2017 |
|
2016 |
|
2015 |
|||
|
Mexico |
|
$ |
939 |
|
$ |
5,401 |
|
$ |
700 |
|
Los Azules |
|
|
- |
|
|
— |
|
|
2 |
|
Canada |
|
|
4,301 |
|
|
— |
|
|
— |
|
USA |
|
|
6,271 |
|
|
764 |
|
|
62 |
|
Total segment capital expenditures |
|
$ |
11,511 |
|
$ |
6,165 |
|
$ |
764 |
|
Corporate and other |
|
|
|
|
|
— |
|
|
— |
|
Consolidated total for capital expenditures |
|
$ |
11,511 |
|
$ |
6,165 |
|
$ |
764 |
NOTE 16 FAIR VALUE ACCOUNTING
Assets and liabilities measured at fair value on a recurring basis
The following tables identify the Company’s assets and liabilities measured at fair value on a recurring basis (at least annually) by level within the fair value hierarchy as at December 31, 2017 and 2016, as reported in the Consolidated Balance Sheets. As required by accounting guidance, assets and liabilities are classified in their entirety based on the lowest level of input that is significant to the fair value measurement.
|
|
|
Fair Value as at December 31, 2017 |
|
||||||||||
|
|
|
Total |
|
Level 1 |
|
Level 2 |
|
Level 3 |
|
||||
|
Assets: |
|
|
|
|
|
|
|
|
|
|
|
|
|
|
Investments |
|
$ |
7,971 |
|
$ |
6,404 |
|
$ |
1,567 |
|
$ |
— |
|
|
Total |
|
$ |
7,971 |
|
$ |
6,404 |
|
$ |
1,567 |
|
$ |
— |
|
|
|
|
Fair Value as at December 31 2016 |
|
||||||||||
|
|
|
Total |
|
Level 1 |
|
Level 2 |
|
Level 3 |
|
||||
|
Assets: |
|
|
|
|
|
|
|
|
|
|
|
|
|
|
Investments |
|
$ |
8,543 |
|
$ |
6,749 |
|
$ |
1,794 |
|
$ |
— |
|
|
Total |
|
$ |
8,543 |
|
$ |
6,749 |
|
$ |
1,794 |
|
$ |
— |
|
The Company's investments mainly consist of marketable equity securities which are exchange-traded and are valued using quoted market prices in active markets and as such are classified within Level 1 of the fair value hierarchy. The fair value of the investments is calculated as the quoted market price of the marketable equity security multiplied by the quantity of shares held by the Company.
Furthermore, as noted in Note 3 Investments, the Company’s investments also include warrants to purchase common stock of certain extractive industry companies. Since these warrants are not traded on an active market, they are valued using the Black-Scholes option pricing model, and classified within Level 2 of the fair value hierarchy. The main inputs used in the valuation of the warrants are volatility, interest rate, dividend yield and exercise price of the instruments.
The fair value of other financial assets and liabilities were assumed to approximate their carrying values due to their short-term nature and historically negligible credit losses.
107
MCEWEN MINING INC.
NOTES TO CONSOLIDATED FINANCIAL STATEMENTS
December 31, 2017
(tabular amounts are in thousands of U.S. dollars, unless otherwise noted) (Continued)
NOTE 17 UNAUDITED SUPPLEMENTARY QUARTERLY INFORMATION
The following table summarizes unaudited supplementary quarterly information for the years ended December 31, 2017, 2016, and 2015.
|
|
|
Three months ended |
|
||||||||||
|
|
|
March 31, 2017 |
|
June 30, 2017 |
|
September 30, 2017 |
|
December 31, 2017 |
|
||||
|
|
|
(unaudited) (in thousands, except per share) |
|
||||||||||
|
Net (loss) |
|
$ |
(3,018) |
|
$ |
(1,712) |
|
$ |
(8,072) |
|
$ |
2,169 |
|
|
Net (loss) per share: |
|
|
|
|
|
|
|
|
|
|
|
|
|
|
Basic |
|
$ |
(0.01) |
|
$ |
(0.01) |
|
$ |
(0.03) |
|
$ |
0.01 |
|
|
Diluted |
|
$ |
(0.01) |
|
$ |
(0.01) |
|
$ |
(0.03) |
|
$ |
0.01 |
|
|
Weighted average shares outstanding: |
|
|
|
|
|
|
|
|
|
|
|
|
|
|
Basic |
|
|
299,575 |
|
|
308,523 |
|
|
314,077 |
|
|
313,887 |
|
|
Diluted |
|
|
299,575 |
|
|
308,523 |
|
|
314,077 |
|
|
313,887 |
|
|
|
|
Three months ended |
|
||||||||||
|
|
|
March 31, 2016 |
|
June 30, 2016 |
|
September 30, 2016 |
|
December 31, 2016 |
|
||||
|
|
|
(unaudited) (in thousands, except per share) |
|
||||||||||
|
Net income (loss) |
|
$ |
12,985 |
|
$ |
8,353 |
|
$ |
4,208 |
|
$ |
(4,491) |
|
|
Net income (loss) per share: |
|
|
|
|
|
|
|
|
|
|
|
|
|
|
Basic |
|
$ |
0.04 |
|
$ |
0.03 |
|
$ |
0.01 |
|
$ |
(0.01) |
|
|
Diluted |
|
$ |
0.04 |
|
$ |
0.03 |
|
$ |
0.01 |
|
$ |
(0.01) |
|
|
Weighted average shares outstanding: |
|
|
|
|
|
|
|
|
|
|
|
|
|
|
Basic |
|
|
298,242 |
|
|
298,237 |
|
|
298,510 |
|
|
299,518 |
|
|
Diluted |
|
|
298,554 |
|
|
299,791 |
|
|
301,045 |
|
|
301,102 |
|
|
|
|
Three months ended |
|
||||||||||
|
|
|
March 31, 2015 |
|
June 30, 2015 |
|
September 30, 2015 |
|
December 31, 2015 |
|
||||
|
|
|
(unaudited) (in thousands, except per share) |
|
||||||||||
|
Net (loss) income |
|
$ |
6,021 |
|
$ |
(14,116) |
|
$ |
2,633 |
|
$ |
(14,988) |
|
|
Net (loss) income per share: |
|
|
|
|
|
|
|
|
|
|
|
|
|
|
Basic |
|
$ |
0.02 |
|
$ |
(0.05) |
|
$ |
0.01 |
|
$ |
(0.05) |
|
|
Diluted |
|
|
0.02 |
|
|
(0.05) |
|
|
0.01 |
|
|
(0.05) |
|
|
Weighted average shares outstanding: |
|
|
|
|
|
|
|
|
|
|
|
|
|
|
Basic |
|
|
297,255 |
|
|
300,530 |
|
|
300,530 |
|
|
300,107 |
|
|
Diluted |
|
|
297,266 |
|
|
300,530 |
|
|
300,530 |
|
|
300,107 |
|
NOTE 18 COMPARATIVE FIGURES
Certain prior year information has been reclassified to conform with the current year’s presentation.
NOTE 19 ACQUISITIONS
Acquisition of Lexam VG.
On April 26, 2017, the Company completed the acquisition of 100% of the issued and outstanding common shares of Lexam by the way of an Arrangement Agreement dated February 13, 2017 and related Plan of Arrangement (the “Arrangement”). Pursuant to the Arrangement, each common share of Lexam was exchanged for 0.056 of a common share of the Company and each option to purchase a common share of Lexam was exchanged for a replacement option entitling the holder to acquire 0.056 share of the Company’s common stock.
108
MCEWEN MINING INC.
NOTES TO CONSOLIDATED FINANCIAL STATEMENTS
December 31, 2017
(tabular amounts are in thousands of U.S. dollars, unless otherwise noted) (Continued)
The Company’s total purchase price of $39.2 million was comprised of 12,687,035 common shares issued from treasury valued at $3.00 per share, share replacement awards of $0.1 million and transaction costs totaling $1.0 million. The Lexam acquisition was accounted for as an asset acquisition and transaction costs associated with the acquisition were capitalized to the Mineral Property Interests acquired, consistent with the Company’s Mineral Property Interests accounting policy. The primary purpose of the acquisition was to add gold resources to the Company’s resource base in a premier geopolitically stable mining jurisdiction.
The following table sets out the allocation of the purchase price to assets acquired and liabilities assumed, based on management’s estimates of relative fair value:
|
Total purchase price: |
|
|
|
|
Common shares issued for acquisition |
|
$ |
38,141 |
|
Transaction fees incurred |
|
|
1,017 |
|
|
|
$ |
39,158 |
|
Fair value of assets acquired and liabilities assumed: |
|
|
|
|
Mineral property interests |
|
$ |
41,595 |
|
Cash and cash equivalents |
|
|
177 |
|
Other current assets |
|
|
86 |
|
Other assets |
|
|
312 |
|
Accounts payable and accrued liabilities |
|
|
(288) |
|
Reclamation obligations |
|
|
(570) |
|
Deferred income tax liabilities |
|
|
(2,154) |
|
|
|
$ |
39,158 |
The Mineral property interests acquired include a 100% interest in the Buffalo Ankerite, Fuller and Davidson Tisdale prospects and a 61% interest in the Paymaster prospect all located in Timmins, Ontario. The remaining 39% interest in the Paymaster property is held by Goldcorp Inc., a joint venture partner. Certain properties are also subject to a net profit interest (“NPI”) in the 10% to 20% range, payable to an unrelated third party.
Acquisition of Black Fox Complex
On August 25, 2017, the Company entered into an Asset Purchase Agreement (the “APA”) with Primero Mining Corp. (“Primero”), whereby the Company, through its wholly-owned subsidiary, purchased and assumed the Purchased Assets and Assumed Liabilities as defined within the APA related to the Black Fox Complex for total cash consideration of $27.5 million, which is the purchase price of $35.0 million less closing adjustments. The Black Fox Complex includes the Black Fox mine site, mill, property, plant and equipment and adjacent exploration properties located in Township of Black River-Matheson, Ontario, Canada. The Company concluded that the acquired assets and assumed liabilities constitute a “business” under U.S. GAAP and accordingly, the acquisition was accounted for as a business combination rather than an asset acquisition. The transaction was completed on October 6, 2017.
109
MCEWEN MINING INC.
NOTES TO CONSOLIDATED FINANCIAL STATEMENTS
December 31, 2017
(tabular amounts are in thousands of U.S. dollars, unless otherwise noted) (Continued)
Preliminary fair value measurements of assets acquired and liabilities assumed were made during the fourth quarter of 2017. The Company continues to evaluate the available information, and the purchase price allocation is subject to finalization of the Company’s analysis of the fair value of the assets and liabilities as of closing date of the transaction . Accordingly, the purchase price allocation is preliminary and adjustments, if any, could be material. The following table summarizes the amounts assigned to the assets acquired and liabilities assumed as of the acquisition date.
|
Total purchase price: |
|
|
|
|
Purchase price |
|
$ |
35,000 |
|
Adjustments to purchase price |
|
|
(7,500) |
|
|
|
$ |
27,500 |
|
Fair value of assets acquired and liabilities assumed: |
|
|
|
|
Cash |
|
$ |
249 |
|
Accounts Receivable |
|
|
470 |
|
Prepaids |
|
|
63 |
|
Inventory |
|
|
4,704 |
|
Mineral Property Interests |
|
|
8,954 |
|
Plant and Equipment |
|
|
33,683 |
|
Accounts Payable |
|
|
(5,247) |
|
Accrued Liabilities |
|
|
(3,213) |
|
Short term capital lease liability |
|
|
(557) |
|
Asset retirement obligation |
|
|
(11,233) |
|
Long term capital lease liability |
|
|
(172) |
|
Deferred tax liability |
|
|
(201) |
|
Net assets acquired in acquisition |
|
$ |
27,500 |
The Company determined that the book value of the accounts receivables included in the purchase price allocation approximates their fair value due to their short-term nature. The gross contractual amounts of the receivables approximates their fair value as the Company has determined that the value of contractual cash flows not expected to be collected are insignificant.
The Company recognized $1.3 million of acquisition-related costs associated with the acquisition of the Black Fox Complex. These costs were expensed and were included in General and Administrative expenses.
The amounts of revenue and income from operations associated with the Black Fox Complex acquisition included in our consolidated statements of comprehensive income for 2017 are as follows:
|
|
|
2017 |
|
|
Gold and silver sales |
|
$ |
11,620 |
|
Net (loss) income |
757 |
||
110
MCEWEN MINING INC.
NOTES TO CONSOLIDATED FINANCIAL STATEMENTS
December 31, 2017
(tabular amounts are in thousands of U.S. dollars, unless otherwise noted) (Continued)
Unaudited Pro Forma Financial Information
The following unaudited pro forma financial information presents consolidated results assuming the Black Fox Complex acquisition occurred on January 1, 2016. The unaudited pro forma financial information does not give effect to potential synergies that could result from the transactions and is not necessarily indicative of the results of future operations.
|
|
|
Twelve Months Ended, December 31 |
||||
|
Unaudited Combined Pro Forma Results of Operations (in thousands) |
|
2017 (Unaudited) |
|
2016 (Unaudited) |
||
|
Gold and silver sales |
|
$ |
131,072 |
|
$ |
131,983 |
|
Net (loss) Income |
|
|
(1,093) |
|
|
17,462 |
|
|
|
|
|
|
|
|
|
Pro forma net (loss) income per share |
|
|
|
|
|
|
|
Basic |
|
$ |
(0.00) |
|
$ |
0.06 |
|
Diluted |
|
|
(0.00) |
|
|
0.06 |
Significant adjustments to the pro forma information above include:
|
· |
Expensed exploration costs incurred in connection with properties with no SEC Industry Guide 7 reserves. |
|
· |
Revision of depreciation costs to correspond to the fair value of assets acquired and the Black Fox life of mine plan. |
|
· |
Revision of accretion expense updated for (i) discount rate to a credit-adjusted-risk-free rate as required by US GAAP, (ii) 2017 closure costs estimate approved by the MNDM and (iii) the Company’s revised life of mine plan. |
|
· |
Adjustments to eliminate historical impairment charges resulting from events unrelated to the business combination and not expected to have a continuing impact on the Company post-acquisition. |
|
· |
Adjustments to increase interest income as the combined entity does not have outstanding debt offset by decreases to interest income as a result of increasing the finance charge related to the surety bonds and increase to lease interest expense as a result of differences identified in effective interest rates. |
|
· |
Various adjustments to remove one-time items not expected to have a continuing impact on the Company post acquisition. |
NOTE 20 CAPITAL LEASES
As a part of the Black Fox acquisition, the Company acquired certain capital lease obligations related to the use of mining equipment at the Black Fox mine. This equipment continues to be reported as a part of the Company’s property, plant and equipment with amortization booked on a straight line basis over the estimated useful life of the asset.
|
|
|
|
|
|
|
|
|
Year Ended December 31, |
||||
|
|
|
|
Interest Rates |
|
Maturities |
|
|
2017 |
|
2016 |
||
|
Capital Lease Obligations |
|
|
4.74 -10.09% |
|
2018 - 2019 |
|
|
$ |
551 |
|
$ |
- |
|
|
|
|
|
|
|
|
|
|
551 |
|
|
- |
|
Less current portion |
|
|
|
|
|
|
|
|
470 |
|
|
- |
|
Long-term capital lease obligations |
|
|
|
|
|
|
|
$ |
81 |
|
$ |
- |
111
MCEWEN MINING INC.
NOTES TO CONSOLIDATED FINANCIAL STATEMENTS
December 31, 2017
(tabular amounts are in thousands of U.S. dollars, unless otherwise noted) (Continued)
NOTE 21 RESTRICTED CASH
The following table provides a reconciliation of cash, cash equivalents, and restricted cash reported within the statement of financial position that sum to the total of the same such amounts shown in the statement of cash flows.
|
|
|
December 31, |
||||
|
|
|
2017 |
|
2016 |
||
|
Cash and cash equivalents |
|
$ |
27,153 |
|
$ |
37,440 |
|
Restricted cash |
|
|
10,000 |
|
|
- |
|
Restricted cash included in other long-term assets |
|
|
- |
|
|
- |
|
Total cash, cash equivalents, and restricted cash shown in the statement of cash flows |
|
$ |
37,153 |
|
$ |
37,440 |
Amounts included in restricted cash represent the proceeds of the sale of flow-through common shares (within the meaning of subsection 66(15) of the Income Tax Act (Canada)) as described in Note 10 Shareholders’ Equity. The proceeds are required by the Income Tax Act (Canada) to be used as payment for generative exploration activities at the Company’s Canadian properties. The entire proceeds will be utilized to fund exploration activities during 2018, at which point the restriction will lapse.
112
ITEM 9. CHANGES IN AND DISAGREEMENTS WITH ACCOUNTANTS ON ACCOUNTING AND FINANCIAL DISCLOSURE
The change in our independent registered accountants was disclosed in a Form 8-K dated November 27, 2015 and filed with the SEC on December 3, 2015. No other information is required by this Item.
ITEM 9A. CONTROLS AND PROCEDURES
During the fiscal period covered by this report, our management, with the participation of the Chief Executive Officer and Chief Financial Officer of the Company, carried out an evaluation of the effectiveness of the design and operation of our disclosure controls and procedures (as defined in Rules 13a‑15(e) and 15d‑15(e) of the Exchange Act). Based on such evaluation, our Chief Executive Officer and Chief Financial Officer have concluded that, as of the end of the period covered by this report, our disclosure controls and procedures were effective to ensure that information required to be disclosed by us in reports that we file or submit under the Exchange Act is recorded, processed, summarized and reported within the required time periods specified in the Commission’s rules and forms and are designed to ensure that information required to be disclosed in our reports is accumulated and communicated to our management, including our Chief Executive Officer and Chief Financial Officer, as appropriate to allow timely decisions regarding required disclosure.
During the year ended December 31, 2017, McEwen acquired the Black Fox Complex. The financial information for this acquisition is included in Item 7. Management’s Discussion and Analysis of Financial Condition and Results of Operations and in Note 19 to the Consolidated Financial Statements. As permitted by the U.S. Securities and Exchange Commission, the Company excluded this acquisition from its evaluation of the effectiveness of the Company’s internal controls over financial reporting as of December 31, 2017 due to the complexity associated with assessing internal controls during integration efforts.
There has been no change in our internal control over financial reporting during the most recent fiscal quarter that has materially affected, or that is reasonably likely to materially affect, our internal control over financial reporting. McEwen continues to implement its internal control structure over the operations of the acquired business discussed above.
Management’s report on internal control over financial reporting and the attestation report of Ernst & Young LLP, an independent registered public accounting firm, are included in Item 8 of this annual report on Form 10‑K.
None.
113
ITEM 10. DIRECTORS, EXECUTIVE OFFICERS AND CORPORATE GOVERNANCE
Pursuant to General Instruction G of Form 10‑K, the information contained in this Item 10 is incorporated by reference to our Definitive Proxy Statement for our 2018 Annual Meeting of Shareholders, expected to be filed with the SEC on or before April 30, 2018.
The Company has a code of business conduct and ethics that applies to all of its employees, officers and directors. The code of business conduct and ethics is available on our website at www.mcewenmining.com and we will post any amendments to, or waivers, from, the code of ethics on that website.
ITEM 11. EXECUTIVE COMPENSATION
The information contained in this Item 11 is incorporated by reference from our Definitive Proxy Statement for our 2018 Annual Meeting of Shareholders.
ITEM 12. SECURITY OWNERSHIP OF CERTAIN BENEFICIAL OWNERS AND MANAGEMENT AND RELATED STOCKHOLDER MATTERS
The information contained in this Item 12 is incorporated by reference from our Definitive Proxy Statement for our 2018 Annual Meeting of Shareholders.
ITEM 13. CERTAIN RELATIONSHIPS, RELATED TRANSACTIONS AND DIRECTOR INDEPENDENCE
The information contained in this Item 13 is incorporated by reference to our Definitive Proxy Statement for our 2018 Annual Meeting of Shareholders.
ITEM 14. PRINCIPAL ACCOUNTING FEES AND SERVICES
The information contained in this Item 14 is incorporated by reference to our Definitive Proxy Statement for our 2018 Annual Meeting of Shareholders.
ITEM 15. EXHIBITS, FINANCIAL STATEMENT SCHEDULES
The exhibits listed in the accompanying exhibit index are filed (except where otherwise indicated) as part of this report.
None
114
In accordance with Section 13 or 15(d) of the Exchange Act, the Company caused this Report to be signed on its behalf by the undersigned, thereunto duly authorized.
|
|
|
MCEWEN MINING INC. |
|
|
By: |
/s/ ROBERT R. MCEWEN |
|
Dated: February 21, 2018 |
|
Robert R. McEwen, |
|
|
|
Chairman of the Board of Directors and |
|
|
|
Chief Executive Officer |
In accordance with the Exchange Act, this Report has been signed below by the following persons on behalf of the Company and in the capacities and on the dates indicated.
|
/s/ ROBERT R. MCEWEN |
|
Chairman of the Board of Directors and Chief Executive Officer (Principal Executive Officer) |
|
February 21, 2018 |
|
Robert R. McEwen |
|
|
||
|
|
|
|
|
|
|
/s/ ANDREW ELINESKY |
|
Senior Vice President, Chief Financial Officer (Principal Financial and Accounting Officer) |
|
February 21, 2018 |
|
Andrew Elinesky |
|
|
||
|
|
|
|
|
|
|
/s/ ALLEN V. AMBROSE |
|
Director |
|
February 21, 2018 |
|
Allen V. Ambrose |
|
|
||
|
|
|
|
|
|
|
/s/ MICHELE L. ASHBY |
|
Director |
|
February 21, 2018 |
|
Michele L. Ashby |
|
|
||
|
|
|
|
|
|
|
/s/ LEANNE M. BAKER |
|
Director |
|
February 21, 2018 |
|
Leanne M. Baker |
|
|
||
|
|
|
|
|
|
|
/s/ RICHARD W. BRISSENDEN |
|
Director |
|
February 21, 2018 |
|
Richard W. Brissenden |
|
|
||
|
|
|
|
|
|
|
/s/ GREGORY P. FAUQUIER |
|
Director |
|
February 21, 2018 |
|
Gregory P. Fauquier |
|
|
||
|
|
|
|
|
|
|
/s/ DONALD R. M. QUICK |
|
Director |
|
February 21, 2018 |
|
Donald Quick |
|
|
||
|
|
|
|
|
|
|
/s/ MICHAEL L. STEIN |
|
Director |
|
February 21, 2018
|
|
Michael L. Stein |
|
|
||
|
|
|
|
|
|
|
/s/ ROBIN DUNBAR |
|
Director |
|
February 21, 2018
|
|
Robin Dunbar |
|
|
115
|
2.1 |
|
|||
|
2.2 |
|
|||
|
3.1.1 |
|
|||
|
3.1.2 |
|
|||
|
3.2 |
|
|||
|
4.1 |
|
|||
|
10.1* |
|
|||
|
10.2* |
|
|||
|
10.4 |
|
|||
|
10.7*+ |
|
Employment Agreement between the Company and Donald Brown dated August 8, 2016 |
||
|
10.8* |
|
|||
|
10.9* |
|
|||
|
10.10 |
|
|||
|
10.11 |
|
|||
|
10.12 |
|
|||
|
10.12.1 |
|
|||
|
10.12.2 |
|
|||
|
10.12.3 |
|
|||
|
10.12.4 |
|
|||
|
16 |
|
|||
|
21+ |
|
|||
|
23.1+ |
|
Consent of Ernst & Young LLP, Independent Registered Public Accounting Firm. |
||
|
23.2+ |
|
Consent of KPMG LLP, Independent Registered Public Accounting Firm. |
||
|
31.1+ |
|
Certification pursuant to Section 302 of the Sarbanes‑Oxley Act of 2002 for Robert R. McEwen. |
||
116
|
31.2+ |
|
Certification pursuant to Section 302 of the Sarbanes‑Oxley Act of 2002 for Andrew Elinesky. |
|
|
32+ |
|
||
|
101+ |
|
The following materials from the Company’s Annual Report on Form 10‑K for the year ended December 31, 2017 are filed herewith, formatted in XBRL (Extensible Business Reporting Language): (i) the Audited Consolidated Statements of Operations and Other Comprehensive Income (Loss) for the years ended December 31, 2017, 2016 and 2015, (ii) the Audited Consolidated Balance Sheets as of December 31, 2017 and 2016, (iii) the Audited Consolidated Statement of Changes in Shareholders’ Equity for the years ended December 31, 2017, 2016 and 2015, (iv) the Audited Consolidated Statements of Cash Flows for the years ended December 31, 2017, 2016 and 2015, and (v) the Notes to the Audited Consolidated Financial Statements. |
|
*Management contract or compensatory plan or arrangement.
+Filed with this report.
117