Attached files
| file | filename |
|---|---|
| 8-K - FORM 8-K - SHORE BANCSHARES INC | v409040_8k.htm |
Exhibit 99.1

GOOD THINGS HAPPEN WHEN YOU’RE IN IT TOGETHER. SHORE BANCSHARES, INC . ANNUAL MEETING April 30, 2014 1

Welcome & Introductions Christopher F. Spurry Chairman of the Board

Directors Shore Bancshares, Inc. • Blenda W. Armistead • David J. Bates • Lloyd L. “Scott” Beatty, Jr. • James A. Judge • Frank E. Mason, III • David W. Moore • Christopher F. Spurry • W. Moorhead Vermilye • John H. Wilson 3

Chairman’s Remarks & Procedural Matters Christopher F. Spurry Camille A. Pecorak

President & CEO Remarks Lloyd L. “Scott” Beatty, Jr.
Forward - Looking Statement This presentation includes forward - looking statements, including statements about future results. These statements are subject to uncertainties and risks, including but not limited to our ability to integrate acquisitions; the strength of the U.S. economy and the local economies where we conduct operations; harsh weather conditions; fluctuations in inflation, interest rates, or monetary policies; changes in the stock market and other capital and real estate markets; legislative or regulatory changes; customer acceptance of third - party products and services; increased competition and its effect on pricing; technological changes; security breaches and computer viruses that may affect our computer systems; changes in consumer spending and savings habits; our growth and profitability; changes in accounting; and our ability to manage the risks involved in the foregoing. These factors, as well as additional factors, can be found in our Annual Report on Form 10 - K for the fiscal year ended December 31, 2014 along with our other filings with the SEC, which are available at the SEC’s internet site ( www.sec.gov ). Actual results may differ materially from projections and could be affected by a variety of factors, including factors beyond our control. Forward - looking statements in this presentation speak only as of the date of these materials, and we assume no obligation to update forward - looking statements or the reasons why actual results could differ. In addition, this presentation includes certain non - GAAP financial measures. 6

Live Our Company Values 7 Our mission is your success. ● Our clients will not want for service. ● Our employees will not want for opportunities. ● Our communities will not want for our involvement. ● Our shareholders will not want for a return.

Shore Bancshares, Inc. Bank Branch Competitors Report Within 1 Mile Within 5 Miles Company Name Competing Branches Deposits in Competing Branches Competing Branches Deposits in Competing Branches (Dollars in Thousands) Shore Bancshares, Inc . 18 $ 930,670 Money Centers/Regionals 26 1,357,633 41 $ 2,165,146 Community Banks 26 897,313 46 2,094,057 TOTALS 52 $ 2,254,946 87 $ 4,259,203 Source - FDIC 8

Current Initiatives ● Focus on organic growth - Grow sales efforts across all business lines - Grow customer base by taking share from local/national competitors ($4.3 billion available) - Intensify focus on relationships to increase deposit penetration & multi - product usage ● Leverage infrastructure and dominant market position ● Pursue high performing profitability status - Energize net interest income with loan growth - Continued emphasis on fee revenue growth - Diligent expense control redeploying savings to revenue generating businesses 9

What Makes SHBI Unique? ● Diversity of Revenue Sources ● Strong Capital Position ● Stable Net Interest Margin ● Efficient Control of Operating Expenses ● Dominant Independent F inancial S ervices Company in all M arkets within Footprint 10
Shore Bancshares, Inc. Year End Highlights George S. Rapp Chief Financial Officer

Annual Results RESULTS OF OPERATION: Years Ended December 31, $(000) 2014 2013 Net interest income $ 34,042 $ 34,876 Provision for credit losses 3,350 27,784 Noninterest income 16,781 17,459 Noninterest expense 39,361 40,686 Net Income (loss) before tax 8,112 (16,135) Tax expense benefit 3,061 (6,501) Net income (loss) 5,051 (9,634) Earnings (loss) per share $ 0.46 $ (1.14) 12

Quarterly Results RESULTS OF OPERATION: $(000) 1Q15 4Q14 1Q14 Net interest income $ 8,539 $ 8,636 $ 8,323 Provision for credit losses 650 650 975 Noninterest income 4,085 3,471 4,788 Noninterest expense 9,704 9,510 10,115 Net Income before tax 2,270 1,947 2,021 Tax expense 861 721 763 Net income $ 1,409 $ 1,226 $ 1,258 Earnings per share $ 0.11 $ 0.10 $ 0.15 13

Improving Credit Quality $0 $10,000 $20,000 $30,000 $40,000 $50,000 $60,000 $70,000 $80,000 $90,000 $100,000 12/31/2012 12/31/2013 03/31/15 Total NPA & TDRs Total NPAs 14
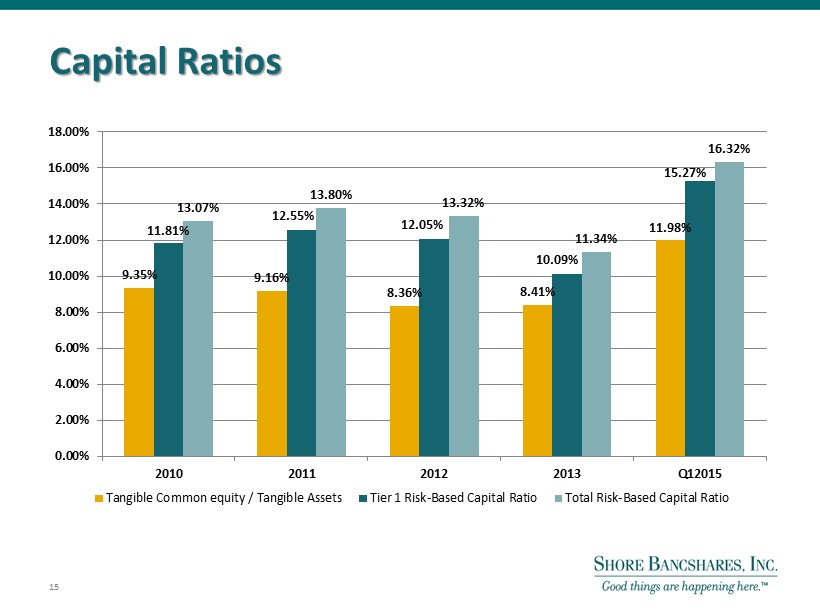
Capital Ratios 15 9.35% 9.16% 8.36% 8.41% 11.98% 11.81% 13.07% 13.80% 13.32% 11.34% 16.32% 0.00% 2.00% 4.00% 6.00% 8.00% 10.00% 12.00% 14.00% 16.00% 18.00% 2010 2011 2012 2013 Q12015 Tangible Common equity / Tangible Assets Tier 1 Risk-Based Capital Ratio Total Risk-Based Capital Ratio 12.55% 12.05% 10.09% 15.27%

Questions and Answers 16

Report on Voting 17

Adjournment 18