Attached files
| file | filename |
|---|---|
| EX-10.4 - EXHIBIT 10.4 - CALLIDUS SOFTWARE INC | ex1042014-12x31.htm |
| EX-23.1 - EXHIBIT 23.1 - CALLIDUS SOFTWARE INC | ex2312014-12x31.htm |
| EX-10.19 - EXHIBIT 10.19 - CALLIDUS SOFTWARE INC | ex10192014-12x31.htm |
| EX-10.14 - EXHIBIT 10.14 - CALLIDUS SOFTWARE INC | ex10142014-12x31.htm |
| EX-10.16 - EXHIBIT 10.16 - CALLIDUS SOFTWARE INC | ex10162014-12x31.htm |
| EX-10.12 - EXHIBIT 10.12 - CALLIDUS SOFTWARE INC | ex10122014-12x31.htm |
| EX-10.13 - EXHIBIT 10.13 - CALLIDUS SOFTWARE INC | ex10132014-12x31.htm |
| EXCEL - IDEA: XBRL DOCUMENT - CALLIDUS SOFTWARE INC | Financial_Report.xls |
| EX-32.1 - EXHIBIT 32.1 - CALLIDUS SOFTWARE INC | ex3212014-12x31.htm |
| EX-31.2 - EXHIBIT 31.2 - CALLIDUS SOFTWARE INC | ex3122014-12x31.htm |
| EX-31.1 - EXHIBIT 31.1 - CALLIDUS SOFTWARE INC | ex3112014-12x31.htm |
UNITED STATES
SECURITIES AND EXCHANGE COMMISSION
Washington, D.C. 20549
Form 10-K
(Mark One) | ||
ý | ANNUAL REPORT PURSUANT TO SECTION 13 OR 15(d) OF THE SECURITIES EXCHANGE ACT OF 1934 | |
For the fiscal year ended December 31, 2014 | ||
Or | ||
o | TRANSITION REPORT PURSUANT TO SECTION 13 OR 15(d) OF THE SECURITIES EXCHANGE ACT OF 1934 | |
For the transition period from to . | ||
Commission file number: 000-50463
Callidus Software Inc.
(Exact name of registrant as specified in its charter)
Delaware (State or other jurisdiction of incorporation or organization) | 77-0438629 (I.R.S. Employer Identification Number) | |
4140 Dublin Boulevard, Suite 400
Dublin, California 94568
(Address of principal executive offices, including zip code)
(925) 251-2200
(Registrant's Telephone Number, including area code)
Securities registered pursuant to Section 12(b) of the Act:
Title of Each Class | Name of Each Exchange on Which Registered | |
Common Stock, $0.001 par value per share Preferred Stock Purchase Rights | The NASDAQ Stock Market LLC The NASDAQ Stock Market LLC | |
Securities registered pursuant to Section 12(g) of the Act: None
Indicate by check mark if the Registrant is a well-known seasoned issuer, as defined in Rule 405 of the Securities Act. Yes ý No o
Indicate by check mark whether the Registrant is not required to file reports pursuant to Section 13 or Section 15(d) of the Act. Yes o No ý
Indicate by check mark whether the Registrant (1) has filed all reports required to be filed by Section 13 or 15(d) of the Securities Exchange Act of 1934 during the preceding 12 months (or for such shorter period that the registrant was required to file such reports) and (2) has been subject to such requirements for the past 90 days. Yes ý No o
Indicate by check mark whether the registrant has submitted electronically and posted on its corporate Web site, if any, every Interactive Data File required to be submitted and posted pursuant to Rule 405 of Regulation S-T (§232.405 of this chapter) during the preceding 12 months (or for such shorter period that the registrant was required to submit and post such files). Yes ý No o
Indicate by check mark if disclosure of delinquent filers pursuant to Item 405 of Regulation S-K is not contained herein, and will not be contained, to the best of registrant's knowledge, in definitive proxy or information statements incorporated by reference in Part III of the Form 10-K or any amendment to this Form 10-K. ý
Indicate by check mark whether the registrant is a large accelerated filer, an accelerated filer, a non-accelerated filer, or a smaller reporting company. See the definitions of "large accelerated filer," "accelerated filer" and "smaller reporting company" in Rule 12b-2 of the Exchange Act (Check one):
Large accelerated filer o | Accelerated filer ý | Non-accelerated filer o (Do not check if a smaller reporting company) | Smaller reporting company o | |||
Indicate by check mark whether the registrant is a shell company (as defined in Rule 12b-2 of the Exchange Act. Yes o No ý
The aggregate market value of the voting and non-voting stock held by non-affiliates of the Registrant, based on the closing sale price of the Registrant's common stock on June 30, 2014, as reported on the NASDAQ Global Market, was approximately $564.0 million. Shares of common stock held by each executive officer and director and by each person who may be deemed to be an affiliate of the Registrant have been excluded from this computation. The determination of affiliate status for this purpose is not necessarily a conclusive determination for other purposes. As of February 17, 2015, the Registrant had 49,075,288 of its common stock, $0.001 par value, outstanding.
DOCUMENTS INCORPORATED BY REFERENCE
Portions of the information called for by Part III of this Form 10-K are hereby incorporated by reference from the definitive proxy statement for the Registrant's annual meeting of stockholders, which will be filed with the Securities and Exchange Commission not later than 120 days after the Registrant's fiscal year ended December 31, 2014.
CALLIDUS SOFTWARE INC.
ANNUAL REPORT ON FORM 10-K
For the Fiscal Year Ended December 31, 2014
TABLE OF CONTENTS
Item 10. | Directors, Executive Officers and Corporate Governance | |
Item 11. | Executive Compensation | |
Item 12. | Security Ownership of Certain Beneficial Owners and Management and Related Stockholder Matters | |
Item 13. | Certain Relationships and Related Transactions, and Director Independence | |
Item 14. | Principal Accountant Fees and Services | |
Signatures | ||
©2015. Callidus Software Inc. All rights reserved. Callidus, Callidus Software, the Callidus Software logo, CallidusCloud, the CallidusCloud logo, TrueComp Manager, ActekSoft, ACom3, iCentera, Webcom, Litmos, the Litmos logo, LeadFormix, Rapid Intake, 6FigureJobs, Clicktools and LeadRocket are trademarks, service marks, or registered trademarks of Callidus Software Inc. and its affiliates in the United States and other countries. All other brand, service or product names are trademarks or registered trademarks of their respective companies or owners.
SPECIAL NOTE REGARDING FORWARD-LOOKING STATEMENTS
This Annual Report on Form 10-K, including the "Management's Discussion and Analysis of Financial Condition and Results of Operations" section in Item 7 of this report, and other materials accompanying this Annual Report on Form 10-K contain forward-looking statements within the meaning of Section 27A of the Securities Act of 1933, as amended, and Section 21E of the Securities Exchange Act of 1934, as amended. These statements relate to our future plans, objectives, expectations, intentions and financial performance and the assumptions that underlie these statements. Generally, the words "believe," "expect," "intend," "estimate," "anticipate," "project," "may," "will," and similar expressions and the negatives thereof identify forward-looking statements, which generally are not historical in nature. These forward-looking statements include, but are not limited to, statements concerning the following: levels of revenue, changes in and expectations with respect to revenue, revenue growth and gross margins, anticipated growth and growth strategies, the impact of competition, our ability to sell products, future operating expense levels, future operating results, the impact of quarterly fluctuations of revenue and operating results, staffing and expense levels, expected cash and investment balances and the impact of foreign exchange rate fluctuations. As and when made, management believes that these forward-looking statements are reasonable. However, caution should be taken not to place undue reliance on any such forward-looking statements because such statements speak only as of the date when made and may be based on assumptions that do not prove to be accurate. Callidus Software Inc. undertakes no obligation to publicly update or revise any forward-looking statements, whether as a result of new information, future events or otherwise, occurring after the date of this Annual Report on Form 10-K. In addition, forward-looking statements are subject to certain risks and uncertainties that could cause actual results to differ materially from our Company's historical experience and our present expectations or projections. For a detailed discussion of these risks and uncertainties, see the "Business" and "Risk Factors" sections in Items 1 and 1A, respectively, of this Annual Report on Form 10-K.
PART I
Item 1. Business
Overview
CallidusCloud® is a global leader in cloud-based sales, marketing, learning and customer experience solutions. CallidusCloud enables its customers to accelerate their Lead to Money process with a suite of solutions that, among other things, identify leads, implement territory and quota plans, enable sales forces, automate bid configuration pricing and quoting, manage contracts, streamline sales compensation and capture customer feedback for competitive advantage. Over 3,700 organizations, across a broad set of industries, rely on CallidusCloud to optimize the Lead to Money process and close more deals, faster.
Lead to Money is a process designed to help companies respond to the changing role of sales and marketing in the redefined buying cycle. In the last decade, the ubiquity of social networks, mobile devices and e-commerce has transformed the traditional sales cycle into a buyer-led digital journey. Buyers are researching and evaluating companies online and are completing a significant portion of their purchases digitally. In order to successfully turn leads into money, sales, marketing, learning and customer experience teams must work together.
We provide a suite of Software-as-a-Service ("SaaS") solutions which generate revenue from cloud subscriptions, sales operation services and term licenses. Our SaaS customers typically purchase annual subscriptions, but occasionally will purchase multi-year subscriptions.
We were incorporated in Delaware in 1996. Our principal executive office is located in Dublin, California and our principal website address is www.calliduscloud.com. The information on our website is not incorporated herein by reference and is not part of this Annual Report on Form 10-K.
Our Lead to Money Solutions
Our Lead to Money suite and technology solutions are detailed below.
Lead
• | Marketing Automation empowers customers to generate high-quality sales leads by capturing intelligence about buyers' behaviors and engaging them across multiple channels. Marketing Automation tracks buyers through their journey identifying which are ready to buy, and which should continue to be nurtured before being engaged by the sales force. Additionally, our Marketing Automation solution provides sales professionals the power of social media and marketing automation in an easy to use mobile friendly format. Sales professionals can listen and engage with their prospects across social media channels and create trackable email marketing campaigns that generate relevant alerts as the prospect engages. |
1
Planning
• | Territory and Quota helps customers evaluate their territory, quota distribution plans and strategies for meeting corporate sales goals. Territory and Quota unites relevant data to improve decision-making by customers around buyers and sales opportunities, coupled with analytics to size and value territories. |
Enablement
• | Enablement provides sales and channel partners with relevant sales content at each step of the sales cycle in a centralized solution. The content can be shared with customers through deal portals, providing customers with a richer buying experience. Enablement provides the sales force with analytics to accelerate sales cycles, and helps marketing personnel to capture field insights to enhance the content, messaging and tools being produced for the sales force. |
• | Litmos Learning Management System is a powerful, mobile-friendly platform for training. Administrators can package content into rich, interactive courses and deploy them to learners. Automatically generated reports provide management with important insight into the success of the training programs and how learners are engaging with the content to optimize how companies train their staff, partners and customers. |
• | Litmos Content enables course developers to collaboratively create courses that can be published to both desktop browsers and mobile devices in one joint package. It accelerates the production of powerful mobile-friendly training courses to reduce training costs. |
• | Sales Performance Manager ("SPM") enables customers to set targeted coaching plans tailored to the individual sales professional. SPM provides managers a complete view of key performance indicators from multiple data sources across the enterprise, as well as skills evaluations observed in the field. The mobile interface makes it easy to capture detailed feedback and development actions needed to optimize the performance of the individual sales professionals. |
Quotes and Proposals
• | Configure-Price-Quote ("CPQ") guides sales representatives through the quoting process, highlights opportunities for up-selling and cross-selling while ensuring the optimum configuration for the maximum deal size. CPQ eliminates errors, manages margins and generates appealing and insightful proposals in minutes, all from a mobile device. |
Contracts
• | Contract Lifecycle Management ("CLM") streamlines the creation, negotiation and storage of contracts to accelerate the final part of the sales cycle. CLM provides customers a centralized repository for all contract data improving the tracking of key milestone dates, renewal alerts and internal compliance requirements to protect the bottom-line. Integration with e-signature solutions allows users to complete the contracting process in an entirely digital platform, saving time in the process. |
Incentives
• | Commissions streamlines the design and management of incentive compensation programs and commission payments. It drives sales performance while reducing errors in sales force payouts and shadow accounting by sales professionals, leading to more selling time and higher cross-sell and up-sell revenue. It also includes modules for Management by Objectives ("MBOs") programs, channel and producer onboarding, reporting and basic workflows. |
• | Incentive Compensation Management ("ICM") is designed specifically for customers in the insurance industry. It delivers automation in incentive and bonus plan configuration, plan payout and producer management. It is a highly configurable solution that can be rapidly deployed, is easy to use and optimizes the management of producer incentives, bonuses and commission programs. |
• | Producer Management is designed to provide a flexible central repository for producer data that can be tailored to customers. It is a powerful solution designed to help customers with large channels to manage their producer hierarchies, licenses, appointments, education, correspondence and book of business in order to optimize the effectiveness of channel programs. |
• | MySalesGame combines gamification and social technology to create an innovative platform that taps into the natural competitiveness of sales people and provides the tools necessary to drive performance-improving behavioral change. MySalesGame breaks down complex tasks into smaller easier to manage objectives, with clear communication of goals and instant recognition of achievements to drive enhanced completion. |
2
Customer Experience
• | Surve (from Clicktools Ltd., a CallidusCloud Company) is an enterprise, business to business “Voice of the Customer” solution that helps companies better understand and serve their customers and deliver an enhanced customer experience. Surve provides self-service tools to collect, centralize and act on customer feedback across all channels including surveys, forms and call scripts. Customer Relationship Management (“CRM”) integration enables the synchronization of results with critical customer data. |
Technology
• | Thunderbridge Big Sales Data combines big data technology with innovative analytics and visualizations to enable real-time exploration of critical sales performance data. Access to big sales data, and the ability to analyze it, is a key to improving sales and channel decision-making. This product is initially targeted for the insurance and telecom markets. |
• | WorkFlow is a powerful business process automation solution that can be configured to optimize critical business processes and drive collaboration. Example workflows include commission plan and payment approvals, hiring and onboarding flows, deal collaboration and partner deal registration. |
• | Data Hub enables customers to move data in real-time between popular third party applications and our solutions using an incredibly flexible, scalable, and powerful integration platform. Data Hub synchronizes data such as sales opportunities, product catalogs and human resource information across different applications to make sure critical business processes use the right data. |
Services
We provide a broad range of services to our customers, including professional services, business process outsourcing services, maintenance and technical support services, and education services.
Professional Services. We provide integration and configuration services to our customers. Professional services typically include the identification and sourcing of legacy data, configuration of application rules to create compensation and coaching plans, set up of pre-defined reports and custom reports, and the ability to interface our hosted application with other applications used by our customers. Configuration and other professional services related to our software can be performed by us, our customers or third-party implementation providers. We also provide services to our implementation partners to aid them in certain projects and training programs. In addition, we provide strategic and expert services to help our customers optimize incentive compensation business processes and management capability.
Business Process Outsourcing Services. We provide a suite of value-added business outsourcing solutions designed to drive specific customer outcomes. Each solution includes clearly defined engagement plans, rapid deployment methods, and a proven track record of delivering value to customers. Business Process Outsourcing Services include Sales Operations Management to manage day-to-day operations and maintain the sales effectiveness system; Sales Performance Manager to design and deploy the right territory, quota, incentive plan, and coaching strategy to drive specific financial targets; Sales Performance Intelligence to analyze capacity, coverage, and incentive effectiveness; and Sales Performance Optimization to benchmark and tune the Sales Performance Manager system.
Maintenance and Technical Support Services. We have maintenance and technical support centers in the United States and India. We currently offer two levels of support, standard and premium, which are generally provided on an annual basis. Under both levels of support, we provide our customers with online access to our customer support database, telephone, web and e-mail support, and all product enhancements and new releases. We also offer online chat to customers as an alternative option. In the case of premium support, we provide customers with access to a support engineer 24 hours a day, 7 days a week. In addition, customers who subscribe to standard or premium support can access remote technical account managers to assist with management and resolution of support requests.
Education Services. We offer a comprehensive set of performance-oriented, role-based training courses for our customers, partners, and employees. Our education services include self-service web-based training, classroom training, virtual training with off-site instructors, on-site training, and customized training. Our professional certification is available for professionals who demonstrate the ability to implement our suite of products and promotes our standards of service.
Operations, Technology and Development
Most of our customers implement our solutions as an on-demand SaaS-based subscription, and some enter into an on-premise license arrangement. Our solutions can be configured with a selection of service levels and options to suit an organization's business objectives, requirements and resources. With our SaaS solutions, our customers rely on our Lead to Money SaaS operations services to provide the infrastructure operations and software required for improving their sales effectiveness and sales performance management. In addition, our Business Process Outsourcing services provide plan and reporting administration services, such as compensation plan maintenance, coaching plan management, portal management, report design and maintenance. Business Process Outsourcing services include customer service, issue resolution, and production support. Customers that select these services do not need to hire or train personnel to run and manage the application.
3
We have developed our on-demand infrastructure with the goal of maximizing the availability, performance, and security of our solutions through several hosting facilities. Our scalable hosting infrastructure and application architecture enable us to offer services to our global customers at mutually agreed service level arrangements. Our information security policies are modeled on the ISO 27002, Statement on Standards for Attestation Engagements (SSAE)16 and Safe Harbor.
We organize our development staff along product lines, with a development operations group that provide centralized support for quality assurance and deployment. In 2014, 2013 and 2012, we recorded research and development expenses of $20.3 million, $17.1 million and $16.6 million, respectively. These expenses include stock-based compensation expenses.
Customers
We ended 2014 with over 3,700 customers. Our customers are diverse in size and type across a wide variety of industries, with a focus on telecommunications, insurance, banking, and technology markets. In 2014, 2013 and 2012, no single customer accounted for more than 10% of our revenue.
Sales and Marketing
We sell and market our software primarily through a direct sales force and in conjunction with our external partners. In the United States, we have sales and service offices in Dublin, California; Atlanta, Georgia; Birmingham, Alabama; Milwaukee, Wisconsin; New York, New York; and Phoenix, Arizona. Outside the United States, we have sales and service offices in Australia, Canada, Hong Kong, India, Malaysia, Mexico, Serbia, Singapore, Japan, Germany and the United Kingdom.
Sales. Our direct sales force, which consist of account executives, technical pre-sales engineers and field management, is responsible for the sale of our products to global enterprises across multiple industries, and is organized into geographic territories. Beginning in 2014, we organized our direct sales force along a vertical industry focus. We also have an inside sales division that sells our learning, marketing and customer experience solutions to businesses of all sizes across all industries.
Marketing. Our marketing activities include product and customer marketing functions as well as marketing communications. The function of our product marketing is to define new product requirements, manage product life cycles, and generate content for sales collateral and marketing programs. The function of our marketing communications is to focus on both primary demand generation efforts to increase awareness of sales effectiveness, product solutions and secondary demand generation efforts to drive sales leads for our solutions. This is done through multiple channels, including advertising, webcasts, industry events, conferences, email marketing, web marketing, and telemarketing. In addition, our corporate website is optimized to drive prospects to our Lead to Money solutions.
Alliances and Partnerships
We actively promote and maintain strategic relationships with systems integrators, consulting organizations, independent software vendors, value-added resellers, and technology providers. These relationships provide both customer referrals and co-marketing opportunities, which have contributed to the expansion of our customer base. We have established alliances with partners such as Accenture, Appirio, Imperio Consulting, Canidium, Cognizant Technology Solutions, Deloitte and Touche, PriceWaterhouseCoopers, and Tata Consulting Services (TCS) to service our customers nationally and internationally. We have also expanded our relationship with technology partners such as Salesforce, NetSuite, Microsoft and Workday that collaborate with us in re-selling our solutions.
Competition
Our principal competition comes from Oracle, International Business Machines (IBM) and the internally-developed software solutions deployed at potential customers. We also compete with other software and consulting companies, which typically focus on specific industries or sectors, including:
• | Sales: Apttus, Pros, SAVO Group, IBM, Varicent and Xactly Corporation |
•Marketing: Oracle, Marketo and Pardot
•Learning: Adobe Systems, SABA Software, Cornerstone On-demand, and SumTotal Systems
•Customer Experience: Medallia, Allegiance and GetFeedback
We believe that the principal competitive factors in our market are:
•ability to offer a broad suite of solutions across the Lead to Money cycle;
• industry-specific domain expertise;
• scalability and flexibility of solutions;
4
• quality of customer service;
• functionality of solutions;
• total cost of ownership; and
• ease of use.
We believe that we compete effectively with other established enterprise software companies due to our broad suite of solutions beyond core commission management, established market leadership, domain expertise, and our highly scalable architecture. Furthermore, we believe we have developed the domain expertise necessary to meet the dynamic requirements of our customers' complex and growing sales performance and sales effectiveness programs.
We believe that our products offer customers a more cost-effective and more extensive alternative to their internally-developed solutions, which are generally expensive, inflexible and difficult to maintain, particularly for companies with increasingly complex sales performance programs and sales channels. We also believe that our suite of SaaS-based solutions for the spectrum of Lead-to-Market functions has advantages over multiple single-point solutions, including cost-effectiveness, ease of implementation and ease of use.
With respect to our offerings in specific industry verticals, we believe that we have developed breadth and depth of functionality demanded by those specific markets, and we have differentiated our products by adding features that are specific to each target market and that scale to growing business needs.
Intellectual Property
Our ability to compete successfully depends in part on our ability to develop and maintain the proprietary aspects of our technology and operate without infringing upon the proprietary rights of others. We rely on a combination of patents, trademarks, copyrights, service marks, trade secrets, confidentiality procedures, contractual provisions and other similar measures to protect our proprietary information and intellectual property.
Our customer agreements include restrictions intended to protect and defend our intellectual property rights. We also require our employees, contractors and many others with whom we have business relationships to sign confidentiality agreements.
Some of our products include licensed third-party software, but we believe that such software is commercially available and that there are other commercially available substitutes that can be integrated with our products on reasonable terms. We also believe that in some cases, we could develop substitute technology to replace third-party software if the third-party licenses were no longer available on reasonable terms.
While our patents are an important part of our success, our business as a whole is not materially dependent on any one patent or on a combination of any or all of our patents.
Employees
As of December 31, 2014, we had 741 employees. None of our employees are represented by a labor union.
Segment and Geographic Information
We operate in one reportable segment, which is the development, marketing and sale of enterprise software and related services. See Note 16 of our accompanying Notes to Consolidated Financial Statements.
5
Executive Officers
The following table sets forth information about our executive officers as of December 31, 2014:
Name | Age | Position | Executive Officer Since | ||||
Leslie J. Stretch | 53 | President, Chief Executive Officer | 2005 | ||||
Bob L. Corey | 63 | Senior Vice President, Chief Financial Officer | 2013 | ||||
Jimmy Duan | 52 | Senior Vice President, Chief Technology Officer | 2008 | ||||
Leslie J. Stretch has served as our President and CEO since 2007 and has served as a director on our board of directors since July 2008. Previously, Mr. Stretch was our Senior Vice President, Global Sales, Marketing and On-Demand Business in 2007, our Senior Vice President, Worldwide Sales from 2006 to 2007 and Vice President, Worldwide Sales from 2005 to 2006. Prior to joining Callidus, Mr. Stretch served as interim Chief Executive Officer for The Hamsard Group, plc. in the United Kingdom during 2005. Previously, Mr. Stretch served in a variety of roles at Sun Microsystems, most recently as Senior Vice President of Global Channel Sales. Prior to joining Sun Microsystems, Inc. (acquired by Oracle Corporation). Mr. Stretch served in a variety of roles at Oracle Corporation, UK. Mr. Stretch holds a B.A. in Economics and Economic History from the University of Strathclyde and a Postgraduate Diploma in Computer Systems Engineering from the University of Edinburgh.
Bob L. Corey has served as our Senior Vice President, and Chief Financial Officer since May 2013. Prior to joining Callidus, Mr. Corey served as the Chief Financial Officer of FrontRange Solutions USA Inc., an enterprise software company, from May 2012 to May 2013. Prior to FrontRange, he served in various roles at Extreme Networks, Inc., an Ethernet solutions company from July 2009 to March 2011, including as its interim chief executive officer, executive vice president and chief financial officer. From 2003 to 2006, Mr. Corey held a variety of executive positions, including executive vice president and chief financial officer, at Thor Technologies, Inc., an enterprise software company. Mr. Corey currently serves as a member of the board of directors and as chairman of the audit committee for Apigee Corporation, a private software development tools and services company. Mr. Corey holds a B.A. with a concentration in accounting from California State University at Fullerton.
Jimmy Duan, Ph.D. has served as our Senior Vice President and Chief Technology Officer since June 2013. Since joining Callidus in October 2008, Dr. Duan has served in a variety of executive management roles at Callidus, including senior vice president of commissions business and international sales. From 2006 to 2008, Dr. Duan served as vice president of client services at Xactly Corporation, a software company, where he was responsible for defining and setting up SaaS operations and managing customer success. Earlier in his career, Dr. Duan held professional services management positions at Quovera and Talus Solutions (acquired by Manugistics) and consulted with multi-national organizations in financial services, telecommunications, transportation and high-tech manufacturing. Dr. Duan holds a Ph.D. in industrial and systems engineering from Virginia Polytechnic Institute and State University (Virginia Tech). Dr. Duan holds a B.S. in Mining Engineering, from Central South University, China.
Available Information
Our annual reports on Form 10-K, quarterly reports on Form 10-Q, current reports on Form 8-K and other periodic reports are available free of charge on our website (www.calliduscloud.com) as soon as reasonably practicable after we have electronically filed or furnished such materials to the Securities and Exchange Commission. They are also available at www.sec.gov.
6
Item 1A. Risk Factors
Factors That Could Affect Future Results
You should carefully consider the risks below, as well as other information included or incorporated by reference in this report before making an investment decision. We operate in a dynamic and rapidly changing environment that involves many risks and uncertainties that could cause actual results to differ materially from results contemplated by forward-looking statements in this report. Because of the factors discussed below, other information included or incorporated by reference in this report and other factors affecting our operating results, past performance should not be considered a reliable indicator of future performance. The risks discussed in this report are not the only risks we face. Risks and uncertainties of which we are not currently aware, or which we currently deem to be immaterial, may also adversely affect our business, financial condition or operating results.
Risks Related to Our Business
We have a history of losses, and we cannot assure you that we will achieve profitability.
We incurred net losses of $11.6 million in 2014, $21.4 million in 2013, and $27.7 million in 2012. We had an accumulated deficit of $271 million as of December 31, 2014. To achieve profitability, we must increase our revenue, particularly our recurring revenue by entering into more and larger sales transactions while limiting customer churn, and managing our cost structure in line with our revenue. If we fail to do so, our future results and financial condition will be adversely affected and we may be unable to continue operating.
We continue to monitor and manage our costs in an effort to optimize our performance for the long-term. However, there is no assurance that we will be successful; unforeseen expenses, difficulties or delays may prevent us from realizing our goals. From time to time, we incur restructuring expenses or expenses related to other cost reduction efforts, but we can offer no assurance that these or other actions will enable us to achieve or sustain profitability in the future. In addition, we cannot be certain that steps we have taken to control our costs will not adversely affect our prospects for long-term revenue growth. If we cannot increase our revenue, improve gross margins and control costs, our future results and financial condition will be negatively affected.
Our revenue and operating results have fluctuated in the past and are likely to fluctuate in the future, and because we recognize revenue from subscriptions over a period of time, downturns in revenue may not be immediately reflected in our operating results.
Because we recognize recurring revenue and maintenance revenue ratably over the terms of the related subscription agreements and maintenance support agreements, most of our revenue each quarter results from recognition of deferred revenue related to agreements entered into during previous quarters. Consequently, declines in new or renewed subscription agreements and maintenance agreements that occur in one quarter will largely be felt in future quarters, both because we may be unable to generate sufficient new revenue to offset the decline and because we may be unable to adjust our operating costs and capital expenditures to align with the changes in revenue. Our subscription model makes it more difficult for us to increase our revenue rapidly in any period, because revenue from new customers must be recognized over the applicable subscription term. Furthermore, although our business model is primarily focused on recurring revenue, we anticipate continuing to recognize license revenue, particularly with international customers. License revenue is difficult to forecast and is likely to fluctuate due to many factors that are beyond our control including transition of license customers to recurring revenue models. Accordingly, we believe that period-to-period comparisons of our results of operations should not be relied upon as definitive indicators of future performance.
Other factors that may cause our revenue and operating results to fluctuate include:
• | timing of customer budget cycles; |
• | the priority our customers place on our products compared to other business investments; |
• | size, timing and contract terms of new customer contracts, and unpredictable and often lengthy sales cycles; |
• | reduced renewals; |
• | competitive factors, including new product introductions, upgrades and discounted pricing or special payment terms offered by our competitors, as well as strategic actions by us or our competitors, such as acquisitions, divestitures, spin-offs, joint ventures, strategic investments or changes in business strategy; |
• | technical difficulties, errors or service interruptions in our solutions that may cause customer dissatisfaction with solutions; |
• | consolidation among our customers, which may alter their buying patterns, or business failures that may reduce demand for our solutions; |
• | operating expenses associated with expansion of our sales force or business, and our product development efforts; |
7
• | cost, timing and management efforts related to the introduction of new features to our solutions; |
• | our ability to obtain, maintain and protect our intellectual property rights and adequately safeguard the information imported to our solutions or otherwise provided to us by our customers; and |
• | extraordinary expenses such as impairment charges, litigation or other payments related to settlement of disputes. |
Any of these developments may adversely affect our revenue, operating results and financial condition. Furthermore, we maintain an allowance for doubtful accounts for estimated losses resulting from the inability of our customers to make required payments. In such cases, we may be required to defer revenue recognition on sales to affected customers. In the future, we may have to record additional reserves or write-offs, or defer revenue on sales transactions, which could negatively impact our financial results.
If we are unable to maintain the profitability of our recurring revenue solutions, our operating results could be adversely affected.
We have invested, and expect to continue to invest, substantial resources to expand, market and refine our solutions. If we are unable to grow the volume of our recurring revenue, or to improve our gross margins, we may not be able to achieve profitability and our operating results and financial condition could be adversely affected. Factors that could harm our ability to improve our gross margins include:
• | customer attrition as customers decide not to renew for any reason; |
• | our inability to maintain or increase the prices customers pay for our solutions, due to competitive pricing pressures or limited demand; |
• | our inability to reduce operating costs through technology-based efficiencies and streamlined processes; |
• | increased direct and indirect cost of third-party services, including hosting facilities and professional services contractors performing implementation and support services; |
• | higher personnel and personnel-related costs; |
• | increased costs to integrate products or personnel that we acquire, including time and expense associated with new sales personnel reaching full productivity; and |
• | increased costs to license and maintain third-party software embedded in our solutions or to create alternatives to such third-party software. |
Our business and operations have experienced rapid growth in recent periods, and if we do not effectively manage any future growth or are unable to improve our systems and processes, our operating results will be adversely affected.
We have experienced rapid growth and increased demand for our products over the last few years. Our employee headcount and number of customers have increased significantly, and we expect to continue to grow our headcount significantly in future periods. For example, from the end of fiscal 2013 to the end of fiscal 2014, our employee headcount increased from 612 to 741 employees, and our number of customers increased from more than 2,200 to over 3,700. We anticipate that we will continue to significantly expand our operations and headcount in the near term, and anticipate that our customer base will continue to expand. The growth and expansion of our business and our product and service offerings place a significant strain on our management, operations, sales and marketing, and financial resources. To manage any future growth effectively, we must continue to improve and expand our information technology and financial infrastructure, our operating and administrative systems, our sales and marketing teams and our ability to manage headcount, capital, and business processes in an efficient manner.
We may not be able to successfully implement improvements to our systems and processes in an efficient or timely manner, and we may discover deficiencies in our existing systems and processes. We may experience difficulties in managing improvements to our systems and processes, which could disrupt existing customer relationships, cause us to lose customers, limit sales of our products, or increase our technical support costs. Our failure to improve our systems and processes, or the failure of those systems and processes to operate in the intended manner, may result in our inability to manage the growth of our business and accurately forecast our revenue and expenses. Our productivity and the quality of our solutions may be adversely affected if we do not integrate and train new employees quickly and effectively. Any future growth would add complexity to our organization and require effective coordination throughout our organization. For example, as a result of growth in our employee headcount, we relocated our corporate headquarters to a larger office space in Dublin, California in February 2015. Failure to manage any future growth effectively could result in increased costs, negatively impact our customers’ satisfaction with our solutions, and harm our operating results.
8
Decreases in retention rates for customer SaaS subscriptions or on-premise maintenance arrangements could materially impact our future revenue or operating results.
Our customers have no obligation to renew our SaaS subscriptions or maintenance support arrangements after the expiration of the subscription or maintenance period, which is typically 12 to 24 months. Customers may elect not to renew, or may renew for fewer seat licenses or shorter contract terms. In addition, we offer a pay-as-you-go model, whereby customers can pay for our SaaS services on a monthly basis without a long-term commitment, which may unexpectedly increase the rate of customer non-renewals and thus negatively and unpredictably affect our recurring revenue. If our customer renewal rates decline, which may occur as a result of many factors, including reduced budgets, insourcing decisions or dissatisfaction with our service, our revenue will be adversely affected and our business will suffer.
A majority of our revenue is derived from our Lead to Money solutions, and a decline in sales of those solutions could adversely affect our operating results and financial condition.
We derive a majority of our revenue from our Lead to Money solutions; if demand for those solutions declines significantly and we are unable to replace the revenue with revenue from our other offerings, our business and operating results will be adversely affected. We cannot assure you that our current levels of market penetration and revenue from these solutions will continue. If conditions in the market for these solutions change as a result of increased competition or new product offerings by our competitors or consolidation among our competitors, or if we are unable to timely introduce successful new solutions to keep pace with technological advancements, our revenue may decline and our financial results and financial condition would be harmed.
If we do not compete effectively, our revenue may not grow and could decline.
We have experienced intense competition from other software companies, as well as from customers’ internal development teams. We believe one of our key challenges is to demonstrate the benefits of our solutions to prospective customers so that they will prioritize purchases of our solutions over other options. Our financial performance depends in large part on continued growth in the number of organizations adopting our sales effectiveness solutions to manage the performance of their sales organizations, yet the market for sales effectiveness solutions may not develop as we expect, or at all.
We compete principally with vendors of sales effectiveness software, incentive compensation management ("ICM") software, enterprise resource planning software and customer relationship management software. Our competitors may be more successful than we are in capturing the market by, for example, announcing new products, services or enhancements that better meet the needs of prospective customers or our current customers or changing industry standards. In addition, if one or more of our competitors were to merge or partner with another of our competitors, the change in the competitive landscape could adversely affect our ability to compete effectively. Increased competition may cause price reductions, reduced gross margins and loss of market share, any of which could have a material adverse effect on our business, results of operations and financial condition.
Many of our competitors, particularly our enterprise resource planning competitors, have longer operating histories with significantly greater financial, technical, marketing, service and other resources. Many also have a larger installed base of users, larger marketing budgets and broader relationships, established distribution agreements, and greater name recognition. Some of our competitors' products may also be more effective at performing particular sales effectiveness or ICM system functions or may be more customized for particular customer needs in any given market. Even if our competitors provide products with less sales performance management or ICM system functionality than our solutions, their products may incorporate other capabilities, such as recording and accounting for transactions, customer orders or inventory management. A product that performs these functions, along with functions of our solutions, may appeal to some customers by reducing the number of software applications they use in their business. Our competitors, especially larger competitors, may also bundle ICM or other functionalities with their other offerings, rendering our software less competitive from a pricing perspective.
Our products generally must be integrated with software provided by existing or potential competitors. These competitors could alter their software products in ways that inhibit integration with ours, or they could deny or delay our access to advance software releases, which would restrict our ability to adapt our products for integration with their new releases and could result in the loss of both sales opportunities and renewals of on-demand services and maintenance.
Some potential customers have already made substantial investments in third-party or internally-developed solutions designed to model, administer, analyze and report on sales effectiveness programs. These companies may be reluctant to abandon such investments in favor of our solutions. In addition, information technology departments of some potential customers may resist purchasing our solutions for a variety of reasons, including concerns that hosted solutions are not sufficiently customizable for their needs or that they pose data security concerns for their enterprises.
If we change prices, alter our payment terms or modify our products or services in order to compete, our margins and operating results may be adversely affected.
The intensely competitive market in which we do business may require us to change our prices or modify our pricing strategies for our solutions in ways that adversely affect our operating results. If our competitors offer discounts on competitive products or services, we may need to lower prices or offer other terms more favorable to existing and prospective customers in order to compete
9
successfully. If we raise prices based upon our own evaluation of the value of our products, those increases might not be well received by customers, which may hurt our sales. Some of our competitors may bundle their products with other solutions for promotional purposes or as a pricing strategy, or provide guarantees of prices and product implementations. These practices could, over time, limit the prices that we can charge for our solutions or cause us to modify our existing market strategies accordingly. If we cannot offset price reductions and other terms that are more favorable to our customers with a corresponding increase in sales or decrease in spending, then the reduced revenue resulting from lower prices would adversely affect our gross margins and operating results.
If we experience service interruptions in our offerings to customers, our business and financial results could be harmed.
Our business is primarily conducted over the Internet, so we depend on our ability to protect our computer equipment and stored data against damage from natural disasters, power loss, telecommunications failures, cyber-attacks or other unauthorized intrusion and other events. Although we have redundant facilities to support our operations, our systems, procedures and controls might not be adequate.
There can be no assurance that our disaster preparedness will prevent significant interruption of our operations, which could be lengthy. Service interruptions may result in material liability claims from customers for breach of service-level commitments, customer terminations and damage to our reputation and business prospects.
In addition, third-party service providers for hosting facilities or other critical infrastructure could be interrupted in the event of a natural disaster, facility closings or other unanticipated problems. Third-party telecommunications providers of Internet and other telecommunication services may fail to perform adequately, or their systems may fail to operate properly or be disabled, causing business interruption or system damage and could harm our revenue, increase costs, cause regulatory intervention or damage to our reputation.
Software errors could be costly and time-consuming for us to correct, and could harm our reputation and impair our ability to sell our solutions.
Our solutions are based on complex software that may contain errors, or "bugs," that could be costly to correct, harm our reputation and impair our ability to sell our solutions to new customers. Moreover, customers relying on our solutions to implement their incentive compensation arrangements may be more sensitive to such errors, and the attendant potential security vulnerabilities and business interruptions for these applications. If we incur substantial costs to correct any errors of this nature, our operating margins could be adversely affected. Because our customers depend on our solutions for critical business functions, any service interruptions could result in lost or delayed market acceptance and lost sales, higher service-level credits and warranty costs, diversion of development resources and product liability suits.
Breaches of security or failure to safeguard customer data could create the perception that our solutions are not secure, causing customers to discontinue or reject the use of our solutions and potentially subject us to significant liability. Implementing, monitoring and maintaining adequate security safeguards may be costly.
Our solutions allow our customers to access and transmit confidential data, including personally identifiable individual data of their employees, agents and customers over the Internet, and we store our customers’ data on servers. We may also have access to confidential and private individual data in connection with the activities of our professional services organization, including implementation, maintenance and support activities for term and perpetual license customers.
Moreover, many of our customers are subject to heightened security obligations regarding the personally identifiable information of their downstream customers. In the United States, these heightened obligations particularly affect the financial services, healthcare and insurance sectors, which are subject to controls over personal information under various state and federal laws and regulations. Other directives, such as the European Union Directive on Data Protection and accompanying laws and regulations of the Member States of the European Union implementing the directive, create international obligations on the protection of personal data that typically exceed security requirements mandated in the United States. The security measures we have implemented and may need to implement, monitor and maintain in the future in order to satisfy the requirements of our customers may be substantial and involve significant time and effort, which increases our costs.
Security measures designed to protect customer information may be breached by third-party action, including intentional misconduct or malfeasance, employee error or otherwise, and result in unauthorized disclosure of or access to our customers’ data or our data, including our intellectual property and other confidential business information, or our information technology (“IT”) systems. Third parties may attempt to fraudulently induce employees or customers into disclosing sensitive information such as user names, passwords or other information in order to gain access to our customers’ data or our data or IT systems. Because the techniques used to obtain unauthorized access, or to sabotage systems, change frequently and are often not recognized until launched against a target, we may be unable to anticipate these techniques or to implement adequate preventative measures. In addition, our customers may authorize third-party technology providers to access their customer data. Because we do not control our customers and third-party technology providers, or the processing of such data by third-party technology providers, we cannot ensure the integrity or security of such transmissions or processing. Malicious third-parties may also conduct attacks designed to temporarily deny customers access to our services.
10
If we do not adequately safeguard the information imported into our solutions or otherwise provided to us by our customers, or if third parties penetrate our systems or security and misappropriate our customers' confidential information, it may damage our reputation, result in a loss of confidence in the security of our service, negatively impact our future sales, or disrupt our business, and we may be sued and incur substantial damages in connection with such events. Even if it is determined that our security measures were adequate, the damage to our reputation may cause customers and potential customers to reconsider the use of our solutions, which may have a material adverse effect on our results of operations.
Legal and regulatory changes in the data protection and privacy area could create unexpected costs, require changes to our business or impact the use and adoption of our solutions, which could have an adverse effect on our future revenue, operating results or customer retention.
The legal or regulatory framework for data protection and privacy issues is evolving worldwide, and various government and consumer agencies and public advocacy groups have called for new regulation and changes in industry practices. As a result, we expect federal, state and foreign governments to continue to increase regulation and we expect more public scrutiny, enforcement and sanctions in this area. The new laws and regulations that may, among other things, relate to the solicitation, collection, processing use, and disclosure of personal information, as well as those that apply to cross-border transfers of personal information, could affect demand for our solutions or cause us to change our platform or business model and increase our costs of doing business.
Our customers can use our service to store compensation and other personal or identifying information about their sales personnel that are or may be considered personal data in some jurisdictions and, therefore, may be subject to this evolving legislation, regulation or heightened public scrutiny. In addition to the potential adoption of new laws and regulations in the United States and internationally, evolving definitions and norms regarding personal data may require us to adapt our business practices, or limit or inhibit our ability to operate or expand our business.
Complying with any new regulatory requirements could force us to incur substantial costs or require us to change our business practices in a manner that could reduce our revenue or compromise our ability to effectively pursue our growth strategy. In addition, the compliance costs and other burdens imposed by such laws and regulations applicable to our customers’ businesses may limit the use and adoption of our service and reduce overall demand, or lead to significant fines, penalties or liabilities for any noncompliance with such privacy laws. As a result, some industries may not adopt our services based on perceived privacy concerns, regardless of the validity of such concerns.
While we take measures to protect the security of information that we collect, use and disclose in the operation of our business, and we offer privacy protections with respect to this information, these measures may not always be effective. Furthermore, although we strive to comply with applicable laws and regulations relating to privacy and data collection, use and disclosure, these laws and regulations are continually evolving, not always clear, and not always consistent across the jurisdictions in which we do business. Any proceedings brought against us relating to compliance with such laws and regulations could hurt our reputation, force us to spend significant amounts in defense of these proceedings, distract our management, increase our costs of doing business, adversely affect the demand for our services and ultimately result in the imposition of monetary liability or restrictions on our ability to conduct our business. In some cases, these costs may not be covered by contractual indemnity or insurance, even if caused by a third party.
In addition, if we are perceived as not operating in accordance with industry best practices with regard to privacy, we may be subject to negative publicity, government investigation, litigation or investigation by accountability groups. Any action against us could be costly and time consuming, require us to change our business practices, expose us to substantial monetary liability and result in damage to our reputation and business.
The European Parliament is considering revocation of the legal framework under which personal data of European residents may be transferred to the United States, and this revocation, if implemented, could hamper our plans to expand our business in Europe.
The use and transfer of personal data in many European countries is currently governed under a regulatory framework pursuant to which U.S. businesses: (i) commit to treat the personal data of European Union residents in accordance with the current regulatory framework and (ii) may self-certify their compliance. The European Union is currently considering adoption of new regulations which would include prohibitions on the transfer of our data about European Union customers to our computer servers in the United States. If these restrictions are adopted, we may have to create duplicative, and potentially expensive, information technology infrastructure and business operations in Europe, which may hinder our expansion plans in Europe, or render these plans commercially infeasible. These developments could materially increase our costs of doing business and harm our operating results.
Acquisitions of, and investments in, other businesses present many risks. We may not realize the anticipated financial and strategic benefits of these transactions, and we may not be able to manage our operations with the acquired businesses efficiently or profitably.
As part of our business strategy, we evaluate opportunities to expand and enhance our product and service offerings to meet customer needs, increase our market opportunities and grow revenue through internal development efforts and external acquisitions and partnerships. We have completed a number of acquisitions in recent years, including LeadRocket, Inc. and Clicktools Ltd. in 2014. We may continue to acquire or make investments in other companies, products, services and technologies in the future. Acquisitions and investments may cause disruptions in or add complexity to our operations and involve a number of risks, including the following:
11
• | the anticipated benefits, such as an increase in revenue, may not materialize if, for example, a larger number of customers than expected choose not to renew or if we are unable to cross-sell the acquired company's solutions to our existing customer base; |
• | we may have difficulty integrating and managing the acquired technologies or products with our existing product lines, and maintaining uniform standards, controls, procedures and policies across locations; |
• | we may experience challenges in, and have difficulty penetrating, new markets where we have little or no prior experience and where competitors have stronger market positions; |
• | integrating the financial systems and personnel of the acquired business and retaining key employees may be difficult, and, to the extent we issue shares of stock or other rights to purchase stock to such individuals, existing stockholders may be diluted; |
• | our ongoing business and management's attention may be disrupted or diverted by transition or integration issues and the complexity of overseeing geographically and culturally diverse locations; |
• | we may find that the acquired business or assets do not further our business strategy, or that we overpaid for the business or assets, or that we do not realize the expected operating efficiencies or product integration benefits; |
• | our use of cash consideration for one or more significant acquisitions may require us to use a substantial portion of our available cash or incur substantial debt, and if we incur substantial debt, it could result in material limitations on the conduct of our business; |
• | we may fail to uncover or realize the significance of, or otherwise become exposed to, liabilities and other issues assumed from an acquired business, such as claims from terminated employees or third-parties and unfavorable revenue recognition or other accounting practices; and |
• | we may experience customer confusion as a result of product overlap, particularly when we offer, price and support various product lines differently. |
These factors could have a material adverse effect on our business, results of operations and financial condition or cash flows. Furthermore, during periods of operational expansion, we often need to increase the size of our staff, our related operations and third party partnerships, and potentially amplify our financial and accounting controls to ensure they remain effective. Such changes may increase our expenses, and there is no assurance that our infrastructure will be sufficiently scalable to efficiently manage any growth that we may experience. If we are unable to leverage our operating cost investments as a percentage of revenue, our ability to generate or increase profits will be adversely impacted. In addition, from time to time, we may enter into negotiations for acquisitions and other investments that are not ultimately consummated, which could result in significant diversion of management time, as well as out-of-pocket expenses.
Some of our products rely on third-party software licenses to operate, and the loss or inability to maintain these licenses, or errors, discontinuations or updates to that software, could result in higher costs, delayed sales, customer claims, or termination of existing agreements.
We license technology from several software providers for our reporting, analytics and integration applications, and we anticipate continuing to license technologies from these or other providers in connection with our current and future products. We also rely on generally available third-party software to run our applications. Any of these software applications may not continue to be available on commercially reasonable terms, if at all, or new versions may be released that are incompatible with our offerings. Some of the products could be difficult to replace, and developing or integrating new software with our products could require months or years of design and engineering work. Modification or loss of access to any of these technologies could result in delays in providing our products until equivalent technology is developed or, if available, is identified, licensed and integrated. Acquisitions of third-party technologies by other companies, including our competitors, may have a material adverse impact on us if the acquirer seeks to cancel or change the terms of our license.
In addition, we depend upon the successful operation of third-party products in conjunction with our products or services. As a result, undetected errors in those third-party products could prevent the implementation, or impair the functionality of, our products, delay new product introductions, limit the availability of our products via our on-demand service, and injure our reputation. Our use of additional or alternative third-party products could result in new or higher royalty payments if we are required to enter into license agreements for such products.
12
Our success depends upon our ability to develop new solutions and enhance our existing solutions rapidly and cost-effectively. Failure to introduce new or enhanced solutions that meet customer needs may adversely affect our operating results.
The markets for sales effectiveness solutions and cloud computing are generally characterized by:
• | rapid technological advances, |
•changing customer needs, and
•frequent new product introductions and enhancements.
To keep pace with technological developments, satisfy increasingly sophisticated customer requirements, achieve market acceptance and effectively respond to competition, we must quickly identify emerging trends and requirements, accurately define and design enhancements and improvements for existing solutions, and introduce new solutions that satisfy our customers’ changing demands. Accelerated introductions for new solutions require high levels of expenditures for research and development that could adversely affect our operating results. Further, any new solutions we develop may not be introduced in a timely manner or be available in a distribution model favored by our target markets, and may therefore not achieve the broad market acceptance necessary to generate significant revenue. If we are unable to quickly and successfully develop or acquire and distribute new products and services cost-effectively, or enhance existing solutions, or if we fail to position and price our solutions to meet market demand, our business and operating results will be adversely affected.
Our offshore product development, support and professional services may prove difficult to manage or may not allow us to realize our cost reduction goals, produce effective new solutions and provide professional services to drive growth.
We use offshore resources to perform new product and services development and provide support and professional consulting efforts, which requires detailed technical and logistical coordination. We must ensure that our international resources and personnel are aware of and understand development specifications and customer support, as well as implementation and configuration requirements and that they can meet applicable timelines. If we are unable to maintain acceptable standards of quality in support, product development and professional services through our international third-party service providers, our attempts to reduce costs and drive growth through new products and margin improvements in technical support and professional services may be negatively impacted, which would adversely affect our results of operations. Outsourcing services to offshore providers may expose us to misappropriation of our intellectual property or that of our customers, or make it more difficult to defend intellectual property rights in our technology.
The loss of key personnel, higher than normal employee attrition in key departments or the inability of replacement personnel to quickly and successfully perform in their new roles could adversely affect our business.
Our success depends to a significant extent on the abilities and effectiveness of our personnel, and, in particular, our chief executive officer and other executive officers. All of our existing personnel, including our executive officers, are employed on an "at-will" basis. If we lose or terminate the services of one or more of our current executives or key employees or if one or more of our current or former executives or key employees joins a competitor or otherwise competes with us, or if we do not have an effective succession or development plan in place for such individuals, our ability to successfully implement our business plan could be impaired. Likewise, if a number of employees from specific departments were to depart, our business may be adversely affected. Additionally, if we are unable to quickly hire qualified replacements for our executives, other key positions or employees within specific departments, our ability to execute our business plan could be harmed. Even if we can quickly hire qualified replacements, we would expect to experience operational disruptions and inefficiencies during any transition.
If we are unable to hire and retain qualified employees and contractors, including sales, professional services and engineering personnel, our growth may be impaired.
To scale our business successfully, increase productivity, maintain a high level of quality and meet customers' needs, we need to recruit, retain and motivate highly skilled employees and contractors in all areas of our business, including sales, professional services and engineering. In particular, if we are unable to hire or contract for and retain talented personnel with the skills, and in the locations, we require, we might need to redeploy existing personnel or increase our reliance on contractors. Furthermore, we have been, and intend to continue, increasing our sales force and, if we are not successful in attracting and retaining qualified personnel, or if new sales personnel are unable to achieve desired productivity levels within a reasonable time period, we may not be able to increase our revenue and realize the anticipated benefits of these investments.
As our customer base increases and as we continue to evaluate and modify our organizational structure to increase efficiency, we are likely to experience staffing constraints in connection with the deployment of trained and experienced professional services and support resources capable of implementing, configuring, maintaining and supporting our products and related services. Moreover, as a company focused on the development of complex products and the provision of online services, we are often in need of additional software developers and engineers. We have relied on our ability to grant equity compensation as one mechanism for recruiting, retaining and motivating such highly skilled personnel. Our ability to provide equity compensation depends, in part, upon receiving stockholder approval for an increase in shares authorized for issuance pursuant to our equity compensation plan. If we are not able to
13
secure such approval from our stockholders, our ability to recruit, retain and motivate our personnel may be adversely impacted, which would negatively impact our operating results.
Our credit agreement contains restrictive and financial covenants that may limit our operational flexibility. Furthermore, if we default on our obligations under the credit agreement, our operations may be interrupted and our business and financial results could be adversely affected.
In May 2014, we entered into a credit agreement with Wells Fargo Bank, National Association (“Wells Fargo”), under which Wells Fargo agreed to provide a revolving loan to us in an amount not to exceed $10.0 million, with an accordion feature that allows us to increase the maximum borrowing amount by not less than $5.0 million and not more than $10.0 million ("Revolver"). We may draw upon the Revolver to finance our operations or for other corporate purposes. In September 2014, we increased the maximum borrowing amount to $15.0 million. The Revolver contains a number of restrictive covenants, and its terms may restrict our current and future operations, including:
• | our flexibility to plan for, or react to, changes in our business and industry conditions; |
• | our ability to use our cash flows, or obtain additional financing, for future working capital, capital expenditures, acquisitions or other general corporate purposes; |
• | place us at a competitive disadvantage compared to our less leveraged competitors; and |
• | increase our vulnerability to the impact of adverse economic and industry conditions. |
In addition, if we fail to comply with the covenants or payment obligations specified in the Revolver, we may trigger an event of default and Wells Fargo would have the right to: (i) terminate its commitment to provide additional loans under the Revolver, and (ii) declare all borrowings outstanding, together with accrued and unpaid interest and fees, to be immediately due and payable. In addition, Wells Fargo would have the right to proceed against the Revolver collateral, which consists of substantially all our assets. If the debt under the Revolver were to be accelerated, we may not have sufficient cash or be able to sell sufficient collateral to repay this debt, which would have an immediate material adverse effect on our business, results of operations and financial condition.
Changes in the terms of our current or future indebtedness or our credit rating may adversely affect our financial condition and results of operations.
We cannot provide assurances that additional borrowing capacity will be available under the Revolver, including pursuant to the accordion feature, or that future indebtedness will be obtainable on terms as favorable as the Revolver. As a result, in the future, we may be subject to higher interest rates and our interest expense may increase, which may have an adverse effect on our financial results. Furthermore, changes by any rating agency to our outlook or credit rating could negatively affect the value of both our debt and equity securities and increase the interest amounts we pay on outstanding or future debt. These risks could adversely affect our financial condition and results.
If we are unable to maintain effective internal control over financial reporting, investors may lose confidence in the accuracy and completeness of our financial reports and the trading price of our common stock may be negatively affected.
We are required to maintain internal controls over financial reporting and to report any material weaknesses in such internal controls. Effective planning and management processes are necessary to meet these requirements, and we expect that we will need to continue to improve existing, and implement new, operational and financial systems, procedures and controls to manage our business effectively in the future. We are also required to furnish a report by management on the effectiveness of our internal control over financial reporting pursuant to Section 404 of the Sarbanes-Oxley Act. If we identify material weaknesses in our internal control over financial reporting, if we are unable to comply with the requirements of Section 404 in a timely manner or assert that our internal control over financial reporting is effective or if our independent registered public accounting firm is unable to express an opinion as to the effectiveness of our internal control over financial reporting, investors may lose confidence in the accuracy and completeness of our financial reports, the trading price of our common stock could be negatively affected, and we could become subject to investigations by The Nasdaq Stock Market LLC, the Securities and Exchange Commission or other regulatory authorities, which could require additional financial and management resources.
If we fail to adequately protect our proprietary rights and intellectual property, we may lose valuable assets, experience reduced revenue and incur costly litigation to protect our rights.
Our success and ability to compete depends on the proprietary technology embedded in our solutions. We rely on a combination of patents, trademarks, copyrights, service marks, trade secrets, contractual provisions and other similar measures to establish and protect our proprietary rights. We cannot protect our intellectual property if we are unable to enforce our rights or if we do not detect its unauthorized use. Despite our precautions, unauthorized third parties may be able to copy or reverse engineer our solutions and use information that we regard as proprietary to create products and services that compete with ours. Provisions in our agreements prohibiting unauthorized use, copying, transfer and disclosure of our licensed programs and services may be unenforceable under the laws of some jurisdictions. Further, the laws of some countries do not protect proprietary rights to the same extent as the laws of the
14
United States. To the extent that we engage in international activities, our exposure to unauthorized copying and use of our products, services and proprietary information increases.
We enter into various restrictive agreements with our employees and consultants, as well as with customers and third parties with whom we have strategic relationships. We cannot ensure that these agreements will be effective in controlling access to and distribution of our products, services and proprietary information. Nor do these agreements prevent our competitors from independently developing technologies that are substantially equivalent or superior to our solutions. Litigation may be necessary to enforce our intellectual property rights and protect our trade secrets. Litigation, whether successful or unsuccessful, could result in substantial costs and diversion of management resources, either of which could seriously harm our business.
Our results of operations may be adversely affected if we are subject to a protracted infringement claim or one that results in a significant damage award.
From time to time, we receive claims that our products, services offerings or business infringe or misappropriate the intellectual property rights of third parties, and we have in the past, and may continue in the future, to assert claims of infringement against third parties on such bases, including the lawsuit we settled with Versata Software, Inc., Versata Development Group, Inc. and Versata, Inc. in November 2014. Our competitors or other third parties may also challenge the validity or scope of our intellectual property rights. For more information, see "Item 3. Legal Proceedings". We believe that claims of infringement are likely to increase as the functionality of our solutions expand and we introduce new solutions, including technology acquired or licensed from third parties. Any infringement claim, whether offensive or defensive, could:
• | require costly litigation to resolve; |
• | absorb significant management time; |
• | cause us to enter into unfavorable royalty or license agreements; |
• | require us to discontinue the sale of, or materially modify, all or a portion of our products or services; |
• | require us to indemnify our customers or third-party service providers; and |
• | require us to expend additional development resources to redesign our products or services. |
Inclusion of open source software in our products may expose us to liability or require release of our source code.
We currently use open source software in our products and may use more in the future. We could be subject to suits by parties claiming ownership of what we believe to be open source software that has been incorporated into our products. In addition, some open source software is provided under licenses which require that proprietary software, when combined in specific ways with open source software, become subject to the open source license and thus freely available. While we take steps to minimize the risk that our products, when incorporated with open source software, would become subject to such provisions, few courts have interpreted open source licenses. As a result, the enforcement of these licenses is unclear. If our products became subject to open source licenses, our ability to continue commercializing our solutions, along with our operating results, would be materially and adversely affected.
Sales to customers in international markets pose risks and challenges for which we may not achieve the expected results.
We continue to invest substantial time and resources to grow our international operations. If we fail to do so successfully, our business and operating results could be seriously harmed. Such expansion may require substantial financial resources and management attention. International operations involve a variety of risks, particularly:
• | greater difficulty in supporting and localizing our solutions; |
• | complying with numerous regulatory requirements, taxes, trade laws and tariffs that may conflict or change unexpectedly, including labor, tax, privacy and data protection; |
• | using international resellers and complying with anti-bribery and anti-corruption laws; |
• | greater difficulty in establishing, staffing and managing foreign operations; |
• | greater difficulty in maintaining acceptable quality standards in support, product development and professional services by our international third-party service providers; |
• | differing abilities to protect our intellectual property rights; and |
• | possible political and economic instability. |
15
We may be affected by fluctuations in currency exchange rates.
We are potentially exposed to adverse movements in currency exchange rates. Although most of our revenue and expenses occur in U.S. Dollars, some occur in local currencies and the amounts in local currencies may increase as we expand our international operations. An increase in the value of the U.S. Dollar could increase the real cost to our customers of our products in those markets outside the U.S., and a weakened U.S. Dollar could increase the cost of our expenses, as well as overseas capital expenditures. We have not engaged in hedging transactions to reduce the exposure to foreign currency fluctuations.
Our services revenue produces substantially lower gross margins than our recurring revenue, and periodic variations in the proportional relationship between services revenue and higher margin recurring revenue may harm our overall gross margins.
Our services revenue, which includes fees for consulting, implementation and training, represented 24% of our revenue in 2014. Our services revenue has a substantially lower gross margin than our recurring revenue. The percentage of total revenue represented by services revenue has varied significantly from period to period principally because the number of new recurring revenue customer transactions varies from quarter to quarter.
Deployment of solutions may require substantial technical implementation and support by us or third-party service providers. We may lose sales opportunities and our business may be harmed if we do not meet these implementation and support requirements, which may cause a decline in revenue and an increase in our expenses.
We deploy solutions, such as large enterprise-wide deployments, that require a substantial degree of technical and logistical expertise. It may be difficult for us to manage these deployments, including the timely allocation of personnel and resources by us and our customers. Failure to successfully manage the process could harm our reputation, both generally and with specific customers, harming our sales and causing customer disputes, which could adversely affect our revenue and increase our technical support and litigation costs. If actual remediation services exceed our accrued estimates, we could be required to take additional charges, which could be material.
We engage third-party partners, systems integrators and software vendors to provide customer referrals, cooperate with us in the design, sales and marketing of our solutions, provide insights into market demands, and provide our customers with systems implementation services or overall program management. In some cases, we may not have formal agreements governing such relationships, and the agreements we do have generally do not include specific obligations with respect to exclusivity, generating sales opportunities or cooperating on future business.
From time to time, we also consider new or unusual strategic relationships, which can pose additional risks. For example, while reseller arrangements offer the advantage of leveraging larger sales organizations than our own to sell our products, they also require considerable time and effort on our part to train and support the reseller's personnel, and require the reseller to properly motivate and incentivize its sales force. Also, if we enter into an exclusive reseller arrangement, the exclusivity may prevent us from pursuing the applicable market ourselves; if the reseller is not successful in the particular location, our results of operations may be adversely affected.
Should any of these third-parties go out of business, perform unsatisfactory services or choose not to work with us, we may be forced to develop new capabilities internally, which may cause significant delays and expense, thereby adversely affecting our operating results. These third-party providers may offer products of other companies, including products competitive with ours. If we do not successfully or efficiently establish, maintain and expand our industry relationships with influential market participants, we could lose sales and service opportunities, which would adversely affect our results of operations.
Our solutions have unpredictable sales cycles, making it difficult to plan our expenses and forecast our results.
It is difficult to determine how long the sales cycles for our solutions will be, thereby making it difficult to predict the quarter in which a particular sale will close and to plan expenditures accordingly. Moreover, to the extent that sales are completed in the final two weeks of a quarter, the impact of recurring revenue transactions is typically not reflected in our financial statements until subsequent quarters. The period between our initial contact with a potential customer and ultimate sale of our solutions is relatively long due to several factors, which may include:
• | the complex nature of some of our products; |
• | the need to educate potential customers about the uses and benefits of our solutions; |
• | budget cycles of our potential customers that affect the timing of purchases; |
• | the expiration date of existing point solutions that we seek to replace; |
16
• | customer requirements for competitive evaluation and often lengthy internal approval processes (particularly of large organizations) before purchasing our solutions; and |
• | potential delays of purchases due to announcements or planned introductions of new solutions by us or our competitors. |
The length and unpredictability of our sales cycle make it difficult for us to project revenues and plan for levels of expenditures to support our solutions appropriately. If we do not manage our sales cycle successfully, we may misallocate resources and our financial results may be harmed.
Our latest product features and functionality may require existing on-premise license customers to migrate to our SaaS solutions. Moreover, we may choose or be compelled to discontinue maintenance support for older versions of our software products, forcing our on-premise customers to upgrade their software in order to continue receiving maintenance support. If existing on-premise license customers fail to migrate or delay migration to our on-demand solution, our revenue may be harmed.
We continue to promote our on-demand product offerings to existing customers who currently have on-premise perpetual and term licenses. Customers with on-premise licenses may need to migrate to our on-demand solutions to take full advantage of the features and functionality in those solutions. We expect to periodically terminate maintenance support on older versions of our on-premise products for various reasons including, without limitation, termination of support by third-party software vendors whose products complement ours or upon which we are dependent. Regardless of the reason, a migration is likely to involve additional cost, which our customers may delay or decline to incur. If a sufficient number of customers do not migrate to our on-demand product offerings, our continued maintenance support opportunities and our ability to sell additional products to these customers, and as a result, our revenue and operating income, may be harmed.
Risks Related to Our Stock
Our stock price is likely to remain volatile.
The trading price of our common stock has in the past, and may in the future, be subject to wide fluctuations in response to many factors, including those described in this section. The volume of trading in our common stock is limited, which may increase volatility. Investors should consider an investment in our common stock as risky and should purchase our common stock only if they can withstand significant losses. Other factors that affect the volatility of our stock include:
• | our actual and anticipated operating performance and the performance of other similar companies; |
• | actual and anticipated fluctuations in our financial results; |
• | failure of securities analysts to maintain coverage of us; |
• | ratings changes by any securities analysts who follow us; |
• | failure to meet our projected results or the published operating estimates or expectations of securities analysts and investors; |
• | failure to achieve revenue or earnings expectations; |
• | price and volume fluctuations in the overall stock market, including as a result of trends in the global economy; |
• | significant sales by existing investors, coupled with limited trading volume for our stock; |
• | announcements by us or our competitors of significant contracts, results of operations, projections, or new technologies; |
• | lawsuits threatened or filed against us; |
• | adverse publicity; |
• | acquisitions, commercial relationships, joint-ventures or capital commitments; |
• | changes in our management team or board of directors; |
17
• | publication of research reports, particularly those that are inaccurate or unfavorable, about us or our industry by securities analysts; and |
• | other events or factors, including those resulting from war, incidents or terrorism or responses to these events. |
Additionally, some companies with volatile market prices for their securities have been the subject of securities class action lawsuits. Any such suit could have a material adverse effect on our business, results of operations, financial condition and price of our common stock.
Future sales of substantial amounts of our common stock, including securities convertible into or exchangeable for shares of our common stock could cause our stock price to fall.
We may issue additional shares of our common stock, including securities convertible into or exchangeable for, or that represent the right to receive, shares of our common stock. Such issuances will dilute the ownership interest of our stockholders and could adversely affect the market price of our common stock. We cannot predict the effect that future sales of shares of our common stock or other equity-related securities would have on the market price of our common stock. In addition, sales by existing stockholders of a large number of shares of our common stock in the public trading market (or in private transactions), including sales by our executive officers, directors or institutional investors, or the perception that such additional sales could occur, could cause the market price of our common stock to drop. We have stock options and restricted stock units outstanding for shares of our common stock. Our stockholders may incur dilution upon exercise of an outstanding stock option or vesting of outstanding restricted stock units.
We do not intend to pay dividends for the foreseeable future.
We have never declared or paid cash dividends on our capital stock. We currently intend to retain any future earnings to finance the operation and expansion of our business, and we do not expect to declare or pay any dividends in the foreseeable future. Consequently, stockholders must rely on sales of their common stock after price appreciation, which may never occur, as the only way to realize any future gains on their investment.
Provisions in our charter documents and Delaware law may delay or prevent an acquisition of our company.
Our certificate of incorporation and bylaws contain provisions that could make it harder for a third-party to acquire us without the consent of our board of directors. For example, if a potential acquirer were to make a hostile bid for us, the acquirer would not be able to call a special meeting of stockholders to remove our board of directors or act by written consent without a meeting. In addition, our board of directors has staggered terms, which means that replacing a majority of our directors would require at least two annual meetings. A potential acquirer would also be required to provide advance notice of its proposal to replace directors at any annual meeting, and would not be able to accumulate votes at a meeting, which would require such potential acquirer to hold more shares to gain representation on the board of directors than if cumulative voting were permitted. Furthermore, Section 203 of the Delaware General Corporation Law limits business combination transactions with 15% stockholders that have not been approved by the board of directors. All of these factors make it more difficult for a third-party to acquire us without negotiation. These provisions may apply even if the offer may be considered beneficial by some stockholders. Our board of directors could choose not to negotiate with a potential acquirer that it does not believe is in our strategic interests. If a potential acquirer is discouraged from offering to acquire us or prevented from successfully completing a hostile acquisition by these or other measures, under some circumstances, the market price of our common stock could be reduced.
18
Item 1B. Unresolved Staff Comments
None.
Item 2. Properties
We lease our headquarters in Dublin, California which consists of approximately 75,000 square feet of office space. We also lease facilities in Alabama, Arizona, Georgia, Illinois, New York, Wisconsin, Australia, Hong Kong, India, Malaysia, Mexico, Serbia, Singapore, Japan and United Kingdom. We believe that our properties are in good operating condition and adequately serve our current business operations. We also anticipate that suitable additional or alternative space, including those under lease options, will be available at commercially reasonable terms for future expansion. Refer to Note 9 to our consolidated financial statements for information regarding our lease obligations.
In 2014 we also leased office space in Pleasanton, California of approximately 44,000 square feet, which we terminated in February 2015.
Item 3. Legal Proceedings
Versata Software, Inc., Versata Development Group, Inc. and Versata Inc. v. Callidus Software, Inc. - Settled
On July 19, 2012, Versata Software, Inc. and Versata Development Group, Inc. (collectively, “Versata”) filed suit against us in the United States District Court for the District of Delaware (“Delaware District Court”). The suit asserted that we infringed U.S. Patent Nos. 7,904,326, 7,908,304 and 7,958,024. On May 30, 2013, we answered the complaint and filed a counterclaim in the Delaware District Court. Our counterclaim asserted that Versata infringed U.S. Patent Nos. 6,269,355, 6,850,924 and 6,473,748. On August 30, 2013, we filed petitions with the United States Patent and Trademark Office Patent Trial and Appeal Board (“PTAB”) for covered business method (“CBM”) patent review of U.S. Patent Nos. 7,904,326, 7,908,304 and 7,958,024, which Versata filed responses to on December 12, 2013. We also filed a motion with the Delaware District Court on August 30, 2013 to stay the litigation pending completion of the patent review proceedings with the PTAB (“Motion to Stay”). On January 8, 2014, we were granted leave by the Delaware District Court to add Versata Inc. (included in the above definition of “Versata”) as a counterclaim defendant. On March 4, 2014, the PTAB instituted covered business method patent review of each of Versata’s patents, namely, U.S. Patent Nos. 7,904,326, 7,908,304 and 7,958,024, finding it more likely than not that we would prevail in establishing that the challenged claims were not patentable. After requesting the PTAB to reconsider its decision to institute, which was denied, Versata filed a petition for writ of mandamus with the Court of Appeals for the Federal Circuit (“CAFC”) on April 11, 2014 asking that Court to deny institution of CBM patent review by the PTAB. The CAFC denied Versata’s petition for writ of mandamus on May 5, 2014. On April 17, 2014, we filed additional petitions with the PTAB for CBM patent review to address all of the remaining claims not previously covered in the prior petitions with respect to U.S Patent Nos. 7,908,304 and 7,958,024. On May 8, 2014, the Delaware District Court: (i) granted our Motion to Stay in part with respect to U.S. Patent No. 7,904,326 and (ii) denied our Motion to Stay in part with respect to U.S. Patent Nos. 7,908,304 and 7,958,024. On May 8, 2014, we appealed to the CAFC the Delaware District Court’s denial of the Motion to Stay with respect to U.S. Patent Nos. 7,908,304 and 7,958,024. On October 2, 2014, the PTAB instituted covered business method patent review of the remaining claims covered in the second set of petitions for U.S Patent Nos. 7,908,304 and 7,958,024. On October 21, 2014, we engaged in mediation with Versata and on November 13, 2014, entered into an agreement with Versata to settle and dismiss the pending district court litigation and patent office proceedings, to extend patent cross-licenses and covenants not to sue to one another, and we were appointed as an authorized reseller of certain Versata products. Under the agreement, each party covenanted not to sue the other (and its related entities) for infringement of any patents now owned (including pending patents) or later acquired by either party. In addition, each party granted to the other a fully paid-up, irrevocable, nonexclusive, worldwide license to certain patents (including the patents asserted in the pending district court litigation) for specified products of each party. The agreement also contained a release for any past infringement or claim between the parties and dismissal of the civil pending in the Delaware District Court, as well as the five covered business method patent review proceedings then-pending before the PTAB. Pursuant to the agreement, we agreed to pay to Versata $4.5 million in nine equal quarterly installments, commencing on January 31, 2015. The fair value of these payments was $4.3 million, of which we recognized a charge to earnings for $2.9 million and capitalized $1.4 million for the value of the patent license in 2014. The $1.4 million will be amortized to expense over the average life span of the associated patents of approximately 9.5 years. The difference between the installment payment and the fair value will be charged to interest as incurred.
We are, from time to time, a party to other various litigation and customer disputes incidental to the conduct of our business. At the present time, we believe that none of these matters is material.
Item 4. Mine Safety Disclosures
None.
19
PART II
Item 5. Market for Registrant's Common Equity, Related Stockholder Matters and Issuer Purchases of Equity Securities
Our common stock trades on the NASDAQ Global Market ("NASDAQ") under the symbol "CALD". The following table sets forth, for the periods indicated, the high and low intra-day sales prices reported on NASDAQ.
Fiscal year ended December 31, 2014 | Fiscal year ended December 31, 2013 | |||||||||||||||||||||||||||||||
Fourth Quarter | Third Quarter | Second Quarter | First Quarter | Fourth Quarter | Third Quarter | Second Quarter | First Quarter | |||||||||||||||||||||||||
High | $ | 17.31 | $ | 12.61 | $ | 12.84 | $ | 15.50 | $ | 13.78 | $ | 9.36 | $ | 6.67 | $ | 5.10 | ||||||||||||||||
Low | $ | 11.28 | $ | 10.41 | $ | 9.15 | $ | 10.99 | $ | 8.52 | $ | 6.34 | $ | 4.10 | $ | 4.10 | ||||||||||||||||
As of February 17, 2015, there were 49,075,288 shares of our common stock outstanding held by 22 stockholders of record.
We have never declared or paid cash dividends on our capital stock. We expect to retain future earnings, if any, for use in the operation and expansion of our business and do not anticipate paying any cash dividends in the foreseeable future.
Performance Graph
The following performance graph shall not be deemed to be incorporated by reference by means of any general statement incorporating by reference this Form 10-K into any filing under the Securities Act of 1933, as amended, or the Securities Exchange Act of 1934, as amended, except to the extent that we specifically incorporate this information by reference, and shall not otherwise be deemed filed under those acts.
The graph compares the cumulative total return of our common stock from December 31, 2009 through December 31, 2014 with the performance of the NASDAQ Composite Index and the NASDAQ Computer Index over those periods.
The graph assumes that (i) $100 was invested in our common stock at the closing price of our common stock on December 31, 2009, (ii) $100 was invested in each of the NASDAQ Composite Index and the NASDAQ Computer Index at the closing price of the respective indices on that date and (iii) all dividends received were reinvested. To date, no cash dividends have been declared or paid on our common stock.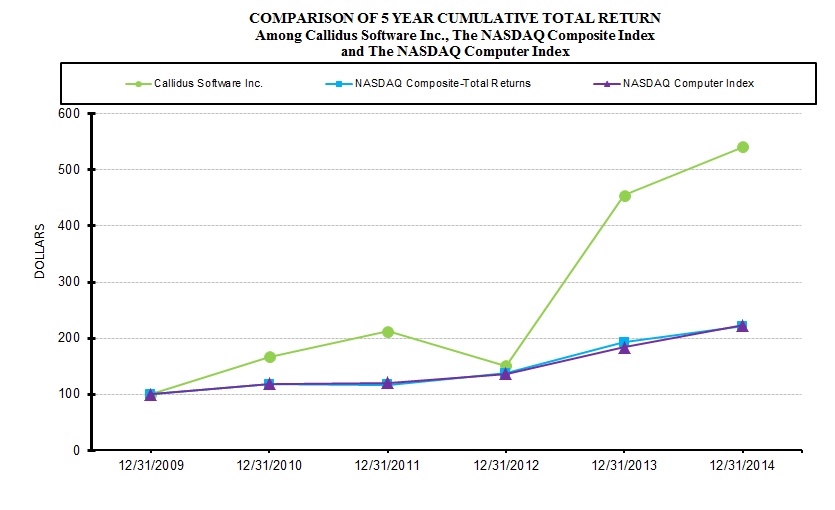
12/31/2009 | 12/31/2010 | 12/31/2011 | 12/31/2012 | 12/31/2013 | 12/31/2014 | ||||||||||||||||||
Callidus Software Inc. | $ | 100 | $ | 167 | $ | 213 | $ | 150 | $ | 455 | $ | 541 | |||||||||||
NASDAQ Composite | $ | 100 | $ | 118 | $ | 117 | $ | 137 | $ | 193 | $ | 221 | |||||||||||
NASDAQ Computer | $ | 100 | $ | 118 | $ | 120 | $ | 137 | $ | 183 | $ | 223 | |||||||||||
* We have not changed comparable indices since 2009.
20
Item 6. Selected Financial Data
The following selected consolidated financial data should be read in conjunction with the Management's Discussion and Analysis of Financial Condition and Results of Operations section and the Consolidated Financial Statements and Notes thereto included elsewhere in this annual report. The selected consolidated statements of operations data for each of the years in the three-year period ended December 31, 2014, and the consolidated balance sheet data as of December 31, 2014 and 2013, are derived from our audited consolidated financial statements that have been included in this annual report. The selected consolidated statement of operations data for the years ended December 31, 2011 and 2010 and the selected consolidated balance sheet data as of December 31, 2012, 2011 and 2010 are derived from our audited consolidated financial statements that have not been included in this Form 10-K.
Year Ended December 31, | |||||||||||||||||||
2014 | 2013 | 2012 | 2011 | 2010 | |||||||||||||||
(In thousands, except per share amounts) | |||||||||||||||||||
Consolidated Statements of Operations Data: | |||||||||||||||||||
Revenue: | |||||||||||||||||||
Recurring | $ | 99,807 | $ | 81,734 | $ | 70,919 | $ | 63,002 | $ | 53,025 | |||||||||
Services and license | 36,811 | 30,603 | 24,033 | 20,769 | 17,855 | ||||||||||||||
Total revenue | 136,618 | 112,337 | 94,952 | 83,771 | 70,880 | ||||||||||||||
Cost of revenue: | |||||||||||||||||||
Recurring | 31,282 | 28,741 | 30,039 | 32,820 | 26,180 | ||||||||||||||
Services and license | 24,756 | 19,048 | 20,301 | 16,487 | 15,733 | ||||||||||||||
Patent settlement | — | — | — | 701 | — | ||||||||||||||
Total cost of revenue | 56,038 | 47,789 | 50,340 | 50,008 | 41,913 | ||||||||||||||
Gross profit | 80,580 | 64,548 | 44,612 | 33,763 | 28,967 | ||||||||||||||
Operating expenses: | |||||||||||||||||||
Sales and marketing | 47,040 | 34,916 | 32,442 | 20,203 | 16,229 | ||||||||||||||
Research and development | 20,307 | 17,143 | 16,643 | 12,025 | 10,369 | ||||||||||||||
General and administrative | 26,255 | 22,951 | 19,953 | 17,726 | 13,754 | ||||||||||||||
Income from settlement and patent licensing | (500 | ) | (500 | ) | — | — | — | ||||||||||||
Acquisition-related contingent consideration | — | — | (1,612 | ) | — | — | |||||||||||||
Restructuring | 1,025 | 1,699 | 1,115 | 649 | 1,655 | ||||||||||||||
Impairment of acquired intangible assets | — | — | — | — | 160 | ||||||||||||||
Total operating expenses | 94,127 | 76,209 | 68,541 | 50,603 | 42,167 | ||||||||||||||
Loss from operations | (13,547 | ) | (11,661 | ) | (23,929 | ) | (16,840 | ) | (13,200 | ) | |||||||||
Interest income and other income (expense), net | 3,504 | 264 | 70 | (333 | ) | 46 | |||||||||||||
Interest expense | (506 | ) | (3,183 | ) | (3,451 | ) | (2,495 | ) | (60 | ) | |||||||||
Debt conversion expense (1) | — | (4,776 | ) | — | — | — | |||||||||||||
Gain on extinguishment of convertible notes | — | — | — | 915 | — | ||||||||||||||
Loss before provision for income taxes | (10,549 | ) | (19,356 | ) | (27,310 | ) | (18,753 | ) | (13,214 | ) | |||||||||
Provision for (benefit from) income taxes | 1,012 | 2,055 | 388 | (2,919 | ) | (478 | ) | ||||||||||||
Net loss | $ | (11,561 | ) | $ | (21,411 | ) | $ | (27,698 | ) | $ | (15,834 | ) | $ | (12,736 | ) | ||||
Net loss per share: | |||||||||||||||||||
Basic and diluted | $ | (0.24 | ) | $ | (0.55 | ) | $ | (0.78 | ) | $ | (0.48 | ) | $ | (0.40 | ) | ||||
Weighted average shares: | |||||||||||||||||||
Basic and diluted | 47,547 | 38,858 | 35,393 | 32,809 | 31,536 | ||||||||||||||
(1) Refer to Note 8 to our Notes to Consolidated Financial Statements for information regarding our convertible debt.
21
As of December 31, | |||||||||||||||||||
2014 | 2013 | 2012 | 2011 | 2010 | |||||||||||||||
(In thousands) | |||||||||||||||||||
Consolidated Balance Sheet Data: | |||||||||||||||||||
Cash, cash equivalents and short-term investments | $ | 36,966 | $ | 36,161 | $ | 29,171 | $ | 52,789 | $ | 30,703 | |||||||||
Total assets | 176,298 | 134,193 | 124,743 | 133,607 | 79,805 | ||||||||||||||
Working capital | (2,905 | ) | 7,161 | 2,425 | 28,440 | 11,498 | |||||||||||||
Total liabilities | 117,824 | 92,140 | 121,315 | 119,065 | 51,723 | ||||||||||||||
Total stockholders' equity | 58,474 | 42,053 | 3,428 | 14,542 | 28,082 | ||||||||||||||
Item 7. Management's Discussion and Analysis of Financial Condition and Results of Operations
Overview
CallidusCloud® is a global leader in cloud-based sales, marketing, learning and customer experience solutions. CallidusCloud enables its customers to accelerate their Lead to Money process with a suite of solutions that, among other things, identify leads, implement territory and quota plans, enable sales forces, automate bid configuration pricing and quoting, manage contracts, streamline sales compensation and capture customer feedback for competitive advantage. Over 3,700 organizations, across a broad set of industries, rely on CallidusCloud to optimize the Lead to Money process and close more deals, faster.
Lead to Money is a process designed to help companies respond to the changing role of sales and marketing in the redefined buying cycle. In the last decade, the ubiquity of social networks, mobile devices and e-commerce has transformed the traditional sales cycle into a buyer-led digital journey. Buyers are researching and evaluating companies online and are completing a significant portion of their purchases digitally. In order to successfully turn leads into money, sales, marketing, learning and customer experience teams must work together.
We provide a suite of Software-as-a-Service ("SaaS") solutions which generate revenue from cloud subscriptions, sales and marketing operation services and term licenses. Our SaaS customers typically purchase annual subscriptions, but may agree to purchase multi-year commitments.
Revenue Increase and Customer Expansion
During 2014, we added more than 1,400 net new customers; as of December 31, 2014 we had over 3,700 customers. Our SaaS Annual Contract Value (“ACV”) increase in 2014 and 2013 was 35% and 29% respectively. ACV represents the aggregate value of the first 12 months of the contracted SaaS subscription. Our customer retention rate for our SaaS enterprise customers remained at 90% in 2014. We believe our high retention rates indicate the quality of our solutions and we strive to maintain these retention rates in a competitive environment.
In 2014, total revenue was $136.6 million, an increase of $24.3 million, or 22%, from 2013. Total recurring revenue, which includes SaaS revenue and maintenance revenue, increased by 22% in 2014, primarily as a result of higher SaaS revenue. SaaS revenue continued to drive the increase in both recurring revenue and total revenue, reflecting market acceptance of our solutions and our continued marketing and sales efforts. SaaS revenue increased to $83.7 million in 2014, representing an increase of $17.8 million or 27% from 2013. In 2014, recurring revenue accounted for 73% of our total revenue, and we expect that percentage will increase going forward. SaaS revenue contributed to an increase in recurring revenue gross margins to 69% in 2014 from 65% in 2013 and to an increase in overall gross margins to 59% in 2014 from 57% in 2013. Revenue from customer excess use was immaterial during 2014 and 2013.
Acquisitions
On September 16, 2014, we invested in our Lead to Money suite by acquiring Clicktools Ltd. ("Clicktools"), a provider of premium cloud-based survey products and services for businesses. The purchase consideration was $16.4 million, which included $14.8 million paid in cash and an indemnity holdback of $1.6 million payable upon the one year anniversary of the closing.
Clicktools financial results from September 16, 2014 to December 31, 2014 was included in our operating results.
On February 4, 2014, we acquired all of the common stock of LeadRocket, Inc. (“LeadRocket”), a provider of marketing automation and demand generation solutions that enable both marketing and sales users to identify and connect with leads efficiently. We acquired LeadRocket to strengthen our social engagement and digital marketing platform. The purchase consideration was $3.0 million, which included $2.5 million paid in cash and $0.5 million as indemnity holdback payable upon the one year closing anniversary.
LeadRockets, financial results from February 4, 2014 to December 31, 2014 was included in our operating results.
22
Application of Critical Accounting Policies and Use of Estimates
Our discussion and analysis of our financial condition and results of operations that follows is based upon our consolidated financial statements prepared in accordance with U.S. Generally Accepted Accounting Principles ("GAAP"). The application of GAAP requires our management to make assumptions, judgments and estimates that affect our reported amounts of assets, liabilities, revenue and expenses, and the related disclosures regarding these items. We base our assumptions, judgments and estimates on historical experience and on various other factors that we believe to be reasonable under the circumstances. Actual results could differ significantly from these estimates under different assumptions or conditions. To the extent that there are material differences between these estimates and actual results, our future financial condition or results of operations will be affected. On a regular basis, we evaluate our assumptions, judgments and estimates. We also discuss our critical accounting policies and estimates with our Audit Committee of the board of directors.
We believe that the assumptions, judgments and estimates involved in the accounting for revenue recognition, allowance for doubtful accounts, stock-based compensation, valuation of acquired intangible assets, goodwill impairment, long-lived asset impairment, contingent consideration and income taxes have the greatest potential impact on our consolidated financial statements. These areas are key components of our results of operations and are based on complex rules which require us to make judgments and estimates. Historically, our assumptions, judgments and estimates in accordance with our critical accounting policies have not materially differed from actual results. For a more detailed discussion of these accounting policies and our use of estimates, refer to Note 1 of our Notes to Consolidated Financial Statements included in this report.
Revenue Recognition
We recognize revenue when all four revenue recognition criteria are met: persuasive evidence of an arrangement exists, we have delivered the product or performed the service, the fee is fixed or determinable and collection is reasonably assured. Determining whether and when some of these criteria have been satisfied often involves assumptions and judgments that can have a significant impact on the timing and amount of revenue we recognize. Changes in assumptions or judgments or changes to the elements in a software arrangement could cause a material increase or decrease in the amount of revenue that we report in a particular period. Refer to Note 1 of our Notes to Consolidated Financial Statements included in this report for further discussion on our revenue recognition policies.
Allowance for Doubtful Accounts
We estimate the uncollectibility of accounts receivable, and record an increase in the allowance for doubtful accounts when the prospect of collecting a specific account receivable becomes doubtful. Management specifically analyzes accounts receivable and historical bad debt experience, customer creditworthiness, current economic trends, international situations (such as currency devaluation) and changes in our customer payment history when evaluating the adequacy of the allowance for doubtful accounts. Should any of these factors change, the estimates made by management will also change, which could affect the level of our future provision for doubtful accounts.
Stock-based Compensation
Stock-based compensation expense is measured at the grant date based on the fair value of the award and is recognized on a straight-line basis over the requisite service period, which is generally the vesting period. Stock-based compensation expense for restricted stock units ("RSUs") is estimated based on the closing price of our common stock on the date of grant and the estimated forfeiture rate, which is based on historical forfeitures. We measure the value of stock options and employee stock purchase plan shares using the Black-Scholes-Merton option pricing model. The determination of the fair value of our stock awards on the date of grant using an option pricing model is affected by our stock price as well as assumptions regarding a number of subjective variables. These variables include: the expected term of the options, taking into account projected exercises; our expected stock price volatility over the expected term of the awards; the risk-free interest rate and expected dividends. We estimate forfeiture rate based on an analysis of its actual forfeitures and will continue to evaluate the adequacy of the forfeiture rate based on actual forfeiture experience and other factors. Changes in these variables could affect stock-based compensation expense in the future.
We granted performance-based share award ("PSUs") to select executives and other key employees. Our PSUs are in the form of restricted stock units, the vesting of which is based on achievement of specified company or other goals. In 2014, we granted PSUs with vesting contingent on our absolute SaaS revenue growth over the three year period from 2014 to 2016, and our relative total shareholder return over the three year period from 2014 through 2016 compared to an index of 17 SaaS companies. These PSUs will, to the extent the performance criteria are achieved, vest on the third anniversary of the grant date. PSU awards based on total shareholder return is recognized as compensation costs over the requisite service period, if rendered, even if the market condition is never satisfied. In determining the fair value of PSUs based on total shareholder return the Company considered the achievement of the market condition in the estimated fair value.
Goodwill, Intangible Assets, Long-Lived Assets and Impairment Assessments
Goodwill represents the excess of the purchase price over the fair value of net assets acquired in connection with business combinations accounted for using the purchase method of accounting. Goodwill is not amortized, but instead goodwill is required to be tested for impairment annually and under certain circumstances. The Company performs such testing of goodwill in the fourth quarter of each year, or as events occur or circumstances change that would more likely than not reduce the fair value of a reporting unit below its carrying amount.
The Company conducts a two-step test for impairment of goodwill. The first step of the test for goodwill impairment compares the fair value of the applicable reporting unit with its carrying value. If the fair value of a reporting unit is less than the reporting unit's carrying value, the Company will perform the second step of the test for impairment of goodwill. During the second step of the test for impairment of
23
goodwill, the Company will compare the implied fair value of the reporting unit's goodwill with the carrying value of that goodwill. If the carrying value of the goodwill exceeds the calculated implied fair value, the excess amount will be recognized as an impairment loss. The Company has one reporting unit and evaluates goodwill for impairment at the entity level. Based upon the results of the step one testing, the Company concluded that no impairment existed as December 31, 2014, and did not perform the second step of the goodwill impairment test.
Intangible assets with finite lives are amortized over their estimated useful lives. Refer to Note 4 of our Notes to Consolidated Financial Statements included in this report for a detailed discussion on useful lives over which our intangible assets are amortized. Generally, amortization is based on the higher of a straight-line method or the pattern in which the economic benefits of the intangible asset will be consumed. There was no impairment expense related to intangible assets during 2014, 2013 and 2012.
The Company also evaluates the recoverability of its long-lived assets for possible impairment whenever events or circumstances indicate that the carrying amount of such assets may not be recoverable. If such review indicates that the carrying amount of long-lived assets is not recoverable, the carrying amount of such assets is reduced to fair value. There were no impairment charges recorded during 2014, 2013 and 2012.
Business Combinations
We recognize assets acquired, liabilities assumed, and contingent consideration at their fair value on the acquisition date with subsequent changes recognized in earnings; recognizes acquisition related expenses and restructuring costs as incurred; and recognizes changes in accounting for deferred tax asset valuation allowances and acquired income tax uncertainties after the measurement period as a component of provision for taxes. During the measurement period, which may be up to one year from the business combination date, we record adjustments to the assets acquired and liabilities assumed, with the corresponding offset to goodwill. After the measurement period, we record adjustments to the assets acquired or liabilities assumed in our operating results in the period in which the adjustments were determined.
Contingent Consideration
We estimate the fair value of the contingent consideration issued in business combinations using a probability-based income approach. The fair value of our liability-classified contingent consideration is remeasured at each reporting period, with any changes in the fair value recorded as income or expense. Contingent acquisition consideration payable is included in accrued liabilities and on the Company's consolidated balance sheets.
Accounting for Income Taxes
Income tax expense is recognized for the amount of taxes payable or refundable for the current year. In addition, deferred tax assets and liabilities are recognized for the expected future tax consequences of temporary differences between the financial reporting and tax bases of assets and liabilities, and for operating losses and tax credit carryforwards. Management must make assumptions, judgments and estimates to determine our current provision for income taxes and also our deferred tax assets and liabilities and any valuation allowance to be recorded against a deferred tax asset.
Our assumptions, judgments and estimates relative to the current provision for income taxes and withholding taxes takes into account current tax laws, our interpretation of those laws and possible outcomes of current and future audits conducted by foreign and domestic tax authorities. We have established reserves for income taxes to address potential exposures for tax positions that could be challenged by tax authorities. Although we believe our assumptions, judgments and estimates are reasonable, changes in tax laws or our interpretation of tax laws and the resolution of potential tax audits could significantly impact the amounts provided for income taxes in our consolidated financial statements.
Our assumptions, judgments and estimates relative to the value of a deferred tax asset take into account predictions of the amount and category of future taxable income, such as income from operations or capital gains. Actual operating results and the underlying amount and category of income in future years could render our current assumptions, judgments and estimates of recoverable net deferred taxes inaccurate. Any of the assumptions, judgments and estimates mentioned above could cause our actual income tax obligations to differ from our estimates, thus materially impacting our financial position and results of operations.
Recent Accounting Pronouncements
Refer to Note 1 to our Notes to Consolidated Financial Statements included in this report for information regarding the effect of newly adopted accounting pronouncements on our financial statements.
24
Results of Operations
Comparison of the Years Ended December 31, 2014 and 2013
Revenue, Cost of Revenue and Gross Profit
The table below sets forth the changes in revenue, cost of revenue and gross profit in 2014 from 2013 (in thousands, except percentage data):
Year Ended December 31, 2014 | Percentage of Revenue | Year Ended December 31, 2013 | Percentage of Revenue | Increase (Decrease) | Percentage Change | ||||||||||||
Revenue: | |||||||||||||||||
Recurring | $ | 99,807 | 73% | $ | 81,734 | 73% | $ | 18,073 | 22% | ||||||||
Services and license | 36,811 | 27% | 30,603 | 27% | 6,208 | 20% | |||||||||||
Total revenue | $ | 136,618 | 100% | $ | 112,337 | 100% | $ | 24,281 | 22% | ||||||||
Cost of revenue: | |||||||||||||||||
Recurring | $ | 31,282 | 31% | $ | 28,741 | 35% | $ | 2,541 | 9% | ||||||||
Services and license | 24,756 | 67% | 19,048 | 62% | 5,708 | 30% | |||||||||||
Total cost of revenue | $ | 56,038 | 41% | $ | 47,789 | 43% | $ | 8,249 | 17% | ||||||||
Gross profit: | |||||||||||||||||
Recurring | $ | 68,525 | 69% | $ | 52,993 | 65% | $ | 15,532 | 29% | ||||||||
Services and license | 12,055 | 33% | 11,555 | 38% | 500 | 4% | |||||||||||
Total gross profit | $ | 80,580 | 59% | $ | 64,548 | 57% | $ | 16,032 | 25% | ||||||||
Revenue
Total Revenue. The increase in total revenue for 2014 compared to 2013 was due to higher volume of recurring revenue generated by our SaaS business driven by ACV growth, increased professional services revenue and acquisitions in 2014. This increase was partially offset by a decrease in license revenue.
Recurring Revenue. Recurring revenue consists of SaaS revenue and maintenance revenue. SaaS revenue increased to $83.7 million in 2014, representing an increase of $17.8 million or 27% from 2013. During the fourth quarter of 2014 our SaaS revenue increased $7.2 million or 42%. The increase in SaaS revenue was primarily due to continued ACV growth and revenue from our acquisitions. We believe our investment in expanding the sales force in recent years has positively impacted SaaS revenue growth. Maintenance revenue increased slightly in 2014 to $16.1 million from $15.8 million in 2013.
Services and License Revenue. Services and license revenue consists of integration and configuration services ("consulting services"), training and perpetual licenses. Service revenue increased by $10.0 million or 45% due to increased consulting services resulting from higher SaaS bookings. This increase was partially offset by license revenue which decreased by $3.8 million or 47%, as we closed a smaller number of on-premise license contracts in 2014.
25
Cost of Revenue and Gross Profit
Cost of Recurring Revenue. The increase in cost of recurring revenue in 2014 was primarily driven by a $1.0 million royalty expense related to a litigation settlement with Versata, increased maintenance costs and depreciation on capital equipment purchases for our hosting facility to support our larger customer base.
Cost of Services and License Revenue. The increase in cost of services and license revenue in 2014 was primarily due to increased personnel and expanded use of third-party consultants required to meet customer demand for consulting services.
Recurring Revenue Gross Profit. The improvement in our recurring revenue gross profit in 2014 , was primarily due to increased SaaS revenue and economies of scale in our on-demand infrastructure costs, offset by $1.0 million royalty expense related to a litigation settlement with Versata.
Services and License Revenue Gross Profit. The increase in our services and license gross profit in 2014 was primarily due to increased consulting services revenue and improved utilization of consulting personnel, partially offset by a decrease in gross profit contribution from license fees resulting from lower license fee revenue.
Operating Expenses
The table below sets forth the changes in operating expenses in 2014 from 2013 (in thousands, except percentage data):
Year Ended December 31, 2014 | Percentage of Revenue | Year Ended December 31, 2013 | Percentage of Revenue | Increase (Decrease) | Percentage Change | ||||||||||||
Operating expenses: | |||||||||||||||||
Sales and marketing | $ | 47,040 | 34% | $ | 34,916 | 31% | $ | 12,124 | 35% | ||||||||
Research and development | 20,307 | 15% | 17,143 | 15% | 3,164 | 18% | |||||||||||
General and administrative | 26,255 | 19% | 22,951 | 20% | 3,304 | 14% | |||||||||||
Income from settlement and patent licensing | (500 | ) | —% | (500 | ) | —% | — | —% | |||||||||
Restructuring and other | 1,025 | 1% | 1,699 | 2% | (674 | ) | (40)% | ||||||||||
Total operating expenses | $ | 94,127 | 69% | $ | 76,209 | 68% | $ | 17,918 | 24% | ||||||||
Sales and Marketing. Higher sales and marketing expense in 2014 was primarily due to additional costs of $7.5 million associated with personnel costs related to sales and marketing, increased marketing events of $2.6 million such as our C3 conferences in Las Vegas, Japan and EMEA, and increased share-based compensation expense of $1.1 million.
Research and Development. The increase in research and development expenses in 2014, was driven primarily by a $2.8 million increase in personnel related costs as we continue to invest in headcount to support product development.
General and Administrative. The increase in general and administrative expenses in 2014 was primarily due to a $2.2 million litigation related Versata settlement and a $2.3 increase to support our continued business growth, including an increase in personnel related costs as well as corporate insurance and maintenance expenses. This was in part offset by reduction in severance and recruiting fees of $1.2 million due to the departure and replacement of our chief financial officer in 2013.
Income from Settlement and Patent Licensing. On November 25, 2013, Xactly Corporation, Xactly's President and Chief Executive Officer and we entered into a settlement agreement that, among other things, includes an agreement by Xactly to pay us $2.0 million in license fee, which will be paid in four annual installments of $0.5 million which began in November 2013. Upon receipt of installment payments, we recorded the amount under operating expenses as an offset to legal fees. In each of 2013 and 2014, we recorded $0.5 million of offset to legal fees under operating expenses regarding this settlement.
Restructuring and Other. The decrease in restructuring and other expenses in 2014 is due to a larger scale of restructuring activities in 2013, which included the departure of our former general counsel and the realignment of our organization, including consolidation of our office locations. This decrease was partially offset by an increase in 2014 depreciation expense as a result of the change in estimated useful life of assets at current headquarters in Pleasanton, CA.
26
Stock-Based Compensation
The following table summarizes our stock-based compensation expenses in 2014 and 2013 (in thousands, except percentage data).
Year Ended December 31, | Increase (Decrease) | Percentage Change | |||||||||||
2014 | 2013 | ||||||||||||
Stock-based compensation: | |||||||||||||
Cost of recurring revenue | $ | 911 | $ | 783 | $ | 128 | 16% | ||||||
Cost of services revenue | 1,026 | 1,060 | (34 | ) | (3)% | ||||||||
Sales and marketing | 3,518 | 2,420 | 1,098 | 45% | |||||||||
Research and development | 2,012 | 1,797 | 215 | 12% | |||||||||
General and administrative | 4,346 | 4,335 | 11 | —% | |||||||||
Total stock-based compensation | $ | 11,813 | $ | 10,395 | $ | 1,418 | 14% | ||||||
Total stock-based compensation expense increased in 2014 compared to 2013, due to a higher number of restricted stock units granted in 2014. We did not grant any stock options in 2014.
Other Items
The table below sets forth the changes in other items in 2014 and 2013 (in thousands, except percentage data):
Year Ended December 31, | Increase (Decrease) | Percentage Change | |||||||||||
2014 | 2013 | ||||||||||||
Other income (expense), net | |||||||||||||
Interest income and other income, net | $ | 3,504 | $ | 264 | $ | 3,240 | 1,227% | ||||||
Interest expense | (506 | ) | (3,183 | ) | 2,677 | (84)% | |||||||
Debt conversion expense | $ | — | $ | (4,776 | ) | $ | 4,776 | (100)% | |||||
Other income (expense), net | $ | 2,998 | $ | (7,695 | ) | $ | 10,693 | (139)% | |||||
Provision for income taxes | $ | 1,012 | $ | 2,055 | $ | (1,043 | ) | (51)% | |||||
Interest Income and Other Income (Expense), net
The increase in interest income and other income in 2014 was primarily due to a $3.9 million gain on the sale of select domain names and trademarks offset by $0.3 million of foreign currency loss.
Interest Expense
Interest expense decreased in 2014 due to the debt conversion described below.
Debt Conversion Expense
During the fourth quarter of 2013, noteholders converted approximately $45.0 million principal amount of our 4.75% Convertible Senior Notes that were set to mature in July 2016 with an early call option in June 2014. In 2013, with the approval of our Board of Directors, management negotiated inducements with three noteholders to provide certainty of conversion and to strengthen the balance sheet. As an inducement for early conversion for 100% of our 4.75% the Convertible Senior Notes, we incurred $4.8 million of debt conversion expense, consisting of $4.4 million in cash and $0.4 million in stock premium. In 2014, noteholders converted the remaining $14.2 million after we exercised the call provisions of these notes and we did not incur an inducement for early conversion.
Provision for Income Taxes
Provision for income tax decreased in 2014 as compared to 2013. The decrease is primarily due to a decrease in foreign withholding taxes, and income taxes in foreign jurisdictions.
27
Comparison of the Years Ended December 31, 2013 and 2012
Revenue, Cost of Revenue and Gross Profit
The table below sets forth the changes in revenue, cost of revenue and gross profit in 2013 from 2012 (in thousands, except percentage data):
Year Ended December 31, 2013 | Percentage of Revenue | Year Ended December 31, 2012 | Percentage of Revenue | Increase (Decrease) | Percentage Change | ||||||||||||
Revenue: | |||||||||||||||||
Recurring | $ | 81,734 | 73% | $ | 70,919 | 75% | $ | 10,815 | 15% | ||||||||
Services and license | 30,603 | 27% | 24,033 | 25% | 6,570 | 27% | |||||||||||
Total revenue | $ | 112,337 | 100% | $ | 94,952 | 100% | $ | 17,385 | 18% | ||||||||
Cost of revenue: | |||||||||||||||||
Recurring | $ | 28,741 | 35% | $ | 30,039 | 42% | $ | (1,298 | ) | (4)% | |||||||
Services and license | 19,048 | 62% | 20,301 | 84% | (1,253 | ) | (6)% | ||||||||||
Total cost of revenue | $ | 47,789 | 43% | $ | 50,340 | 53% | $ | (2,551 | ) | (5)% | |||||||
Gross profit: | |||||||||||||||||
Recurring | $ | 52,993 | 65% | $ | 40,880 | 58% | $ | 12,113 | 30% | ||||||||
Services and license | 11,555 | 38% | 3,732 | 16% | 7,823 | 210% | |||||||||||
Total gross profit | $ | 64,548 | 57% | $ | 44,612 | 47% | $ | 19,936 | 45% | ||||||||
Revenue
Total Revenue. The increase the total revenue in 2013 was primarily due to higher volume of recurring revenue generated by our SaaS business due to our continued emphasis and focus on recurring revenue.
Recurring Revenue. The increase in recurring revenue in 2013, which consists of SaaS revenue and maintenance revenue, was primarily due to the growth in our SaaS revenue which increased by 20% in 2013 compared to 2012. SaaS revenue growth is mainly driven by an increase in new business generated from our existing solutions and new business from our acquisitions. We believe our investment in expanding the sales force in recent years has positively impacted revenue growth. Maintenance revenue remained consistent in 2013 compared to 2012 at $15.8 million, primarily due to our conversion of customers from on-premise license to on-demand subscription service.
Services and License Revenue. The increase in services and other revenue in 2013, consisting of integration and configuration services, training and perpetual licenses, was primarily due to a $4.1 million or 99% increase in our on-premise license revenue as compared to 2012. The increase in our perpetual license revenue primarily reflects new customers and up-selling to existing customers. In addition, there was $2.5 million or a 12% increase in our revenue generated from integration and configuration services, to $22.4 million in 2013 from $19.9 million in 2012. The increases in our revenue generated from integration and configuration services were primarily related to additional services revenue from our increased amount of revenue contracts.
Cost of Revenue and Gross Profit
Cost of Recurring Revenue. The decrease in cost of recurring revenue in 2013 was primarily driven by a decrease of $2.8 million in professional fees due to our insourcing of operations in India that occurred in the fourth quarter of 2012, and a $0.8 million reduction in stock-based compensation expense as a result of less outstanding awards. These decreases were partially offset by $2.6 million of increased expense from expanding our data center, including equipment, maintenance and depreciation.
Cost of Services and Other Revenue. Cost of services and other revenue decreased in 2013 primarily due to $1.4 million decrease in professional fees related to a fixed fee project that ended in the fourth quarter of 2012 and reduction in expenses related to third-party operations center.
Recurring Revenue Gross Profit. Overall gross profit increased in 2013 because of increased SaaS revenue and lower third-party data center and personnel costs as we moved away from outsourcing our data center management for our core products and used our own internal resources, which included the transfer of personnel to our in-house facility in India in the fourth quarter of 2012.
Services and License Gross Profit. The increase in gross profit in 2013 was primarily due to increased revenue from perpetual license fees from on-premise customer purchases and decreased professional fees due to the end of a fixed fee project in integration and configuration services in 2012, and overall higher utilization of professional services personnel.
28
Operating Expenses
The table below sets forth the changes in operating expenses in 2013 from 2012 (in thousands, except percentage data):
Year Ended December 31, 2013 | Percentage of Revenue | Year Ended December 31, 2012 | Percentage of Revenue | Increase (Decrease) | Percentage Change | ||||||||||||
Operating expenses: | |||||||||||||||||
Sales and marketing | $ | 34,916 | 31% | $ | 32,442 | 34% | $ | 2,474 | 8% | ||||||||
Research and development | 17,143 | 15% | 16,643 | 18% | 500 | 3% | |||||||||||
General and administrative | 22,951 | 20% | 19,953 | 21% | 2,998 | 15% | |||||||||||
Income from settlement and patent licensing | (500 | ) | —% | — | —% | (500 | ) | 100% | |||||||||
Acquisition-related contingent consideration | — | —% | (1,612 | ) | (2)% | 1,612 | (100)% | ||||||||||
Restructuring expenses and other | 1,699 | 2% | 1,115 | 1% | 584 | 52% | |||||||||||
Total operating expenses | $ | 76,209 | 68% | $ | 68,541 | 72% | $ | 7,668 | 11% | ||||||||
Sales and Marketing. The increase in sales and marketing costs in 2013 was primarily due to an additional $3.2 million in personnel-related costs related to the sales force expansion and commission expense, and $0.4 million increase in partner commission in our indirect channel. The increase was partially offset by a $1.4 million decrease in stock based compensation due to fewer outstanding awards compared to 2012.
Research and Development. The increase in research and development costs in 2013 was primarily due to a $1.5 million net increase in personnel-related costs for bonus payments and insourcing of our operations in India. This insourcing resulted in a $1.2 million decrease in professional fees.
General and Administrative. The increase in general and administrative costs in 2013 was primarily due to a $1.2 million increase in professional fees including increased audit, legal and contractor fees, a $1.1 million increase in personnel-related cost as a result of increased headcount and severance charges related to the departure of our former Chief Financial Officer, and a $0.8 million increase in sales tax and bad debt expense.
Income from Settlement and Patent Licensing. On November 25, 2013, Xactly Corporation, Xactly's President and Chief Executive Officer and we entered into a settlement agreement that, among other things, includes an agreement by Xactly to pay the Company $2.0 million in license fee, which will be paid in four annual installments of $0.5 million which began in November 2013. Upon receipt of installment payments, the Company will record the amount under operating expenses as an offset to legal fees. During 2013, the Company recorded $0.5 million of offset to legal fees under operating expenses regarding this settlement.
Acquisition-related Contingent Consideration. The decrease in acquisition-related contingent consideration in 2013 was because there was no acquisition activity or change in contingent consideration during 2013.
Restructuring and Other. The increase in restructuring and other expenses in 2013 as compared to 2012 is because we continued to centralize certain company functions to our headquarters facility, and outsourced certain IT functions during 2013.
Stock-Based Compensation
The following table summarizes our stock-based compensation expenses for 2013 and 2012 (in thousands, except percentage data).
Year Ended December 31, | Increase (Decrease) | Percentage Change | |||||||||||
2013 | 2012 | ||||||||||||
Stock-based compensation: | |||||||||||||
Cost of recurring revenue | $ | 783 | $ | 1,550 | $ | (767 | ) | (49)% | |||||
Cost of services revenue | 1,060 | 2,070 | (1,010 | ) | (49)% | ||||||||
Sales and marketing | 2,420 | 3,778 | (1,358 | ) | (36)% | ||||||||
Research and development | 1,797 | 1,782 | 15 | 1% | |||||||||
General and administrative | 4,335 | 4,475 | (140 | ) | (3)% | ||||||||
Total stock-based compensation | $ | 10,395 | $ | 13,655 | $ | (3,260 | ) | (24)% | |||||
Total stock-based compensation expense decreased because of fewer outstanding awards and the timing of grants in 2013.
29
Other Items
The table below sets forth the changes in other items from 2012 to 2013 (in thousands, except percentage data):
Year Ended December 31, | Increase (Decrease) | Percentage Change | |||||||||||
2013 | 2012 | ||||||||||||
Other income (expense), net | |||||||||||||
Interest income and other income (expense), net | $ | 264 | $ | 70 | $ | 194 | 277% | ||||||
Interest expense | (3,183 | ) | (3,451 | ) | 268 | (8)% | |||||||
Debt conversion expense | (4,776 | ) | — | (4,776 | ) | (100)% | |||||||
$ | (7,695 | ) | $ | (3,381 | ) | $ | (4,314 | ) | 128% | ||||
Provision (benefit) for income taxes | $ | 2,055 | $ | 388 | $ | 1,667 | 430% | ||||||
Interest Income and Other Income (Expense), net
The increase in interest income and other income in 2013 was driven by interest income from investments and a release of accrual related to the purchase accounting of an acquisition.
Interest Expense
Interest expense decreased in 2013 due to the debt conversion described below.
Debt Conversion Expense
During the fourth quarter of 2013, we converted approximately $45.0 million principal amount of 4.75% Convertible Senior Notes that mature in July 2016 with an early call option in June 2014. In 2013, with the approval of our Board of Directors, management negotiated inducements with three noteholders to provide certainty of conversion and to strengthen the balance sheet. As an inducement for early conversion, the Company incurred $4.8 million of debt conversion expense, consisting of $4.4 million in cash and $0.4 million in stock premium.
Provision for (Benefit from) Income Taxes
Provision for income tax increased in 2013 due to an increase in foreign withholding taxes and income taxes in foreign jurisdiction.
30
Liquidity and Capital Resources
As of December 31, 2014, our principal sources of liquidity were cash, cash equivalents and short-term investments totaling $37.0 million, and cash flow from operations, supplemented by a revolving line of credit.
During 2014, accounts receivable and deferred revenue increased significantly due to growth in SaaS revenue. We expect these trends to continue into 2015 as we expect to continue to achieve positive operating cash flows during 2015.
During 2014, an aggregate principal amount of $14.2 million of our 4.75% Convertible Notes was converted into 1,840,770 shares of common stock. As of December 31, 2014, the Company had no outstanding Convertible Notes.
In May 2014, we entered into a credit agreement with Wells Fargo Bank, National Association ("Wells Fargo"), under which Wells Fargo agreed to make a revolving loan ("Revolver") to us in an amount not to exceed $10.0 million, with an accordion feature that allows us to increase the maximum borrowing amount by not less than $5.0 million and not more than $10.0 million. The Revolver matures in May 2019. Outstanding borrowings under the Revolver bear interest, at our option, at a base rate plus an applicable margin. The applicable margin ranges between 0.75% and 2.25% depending on our leverage ratio. Interest is payable every three months. In September 2014, we exercised the accordion feature and increased the maximum borrowing amount to $15.0 million. As of December 31, 2014 we have borrowed $10.5 million under the Revolver.
We believe our existing cash, cash equivalents and short-term investments and cash provided by operating activities will be sufficient to meet our working capital and capital expenditure needs over the next 12 months.
The following table summarizes, for the periods indicated, selected items in our consolidated statements of cash flows (in thousands):
Year Ended December 31, | |||||||||||
2014 | 2013 | 2012 | |||||||||
Net cash (used in) provided by operating activities | $ | 9,151 | $ | 13,749 | $ | (1,705 | ) | ||||
Net cash provided by (used in) investing activities | (14,004 | ) | 2,474 | 1,704 | |||||||
Net cash (used in) provided by financing activities | 11,041 | (4,264 | ) | (1,004 | ) | ||||||
In 2014, cash and cash equivalents increased by approximately $5.9 million primarily due to $9.2 million of cash provided by our operating activities and $11.0 million of cash provided by our financing activities, partially offset by $14.0 million of cash used by our investing activities.
Fiscal 2014
Net cash provided by operating activities was $9.2 million, $4.6 million lower compared to net cash provided by operating activities of $13.8 million in 2013. For the year ended December 31, 2014, the net loss of $11.6 million included a gain on sale of intangible assets of $3.9 million, offset by adjustments to net loss of $19.1 million primarily driven by $10.5 million of depreciation and amortization expense, and $11.8 million of stock based compensation expense. Changes in working capital provided cash of $1.7 million, which includes $11.4 million increase in deferred revenue, $6.7 million increase in accrued expenses and $1.1 million in accrued payroll expense, partially offset by $11.7 million increase in accounts receivable, $3.8 million increase in prepaid expenses, $1.1 million increase in non-current other assets, $0.8 million decrease in accounts payable and $0.2 million decrease in accrued restructuring and other expenses.
Net cash used in investing activities was $14.0 million, $16.5 million lower than net cash provided by investing activities of $2.5 million in 2013. The decrease in net cash used in investing activities was primarily due acquisitions of $15.5 million for LeadRocket, Inc. and Clicktools Ltd. and purchases of property and equipment of $7.1 million for our data center improvements and new facilities, partially offset by the net proceeds from maturities and sale of investments of $5.1 million and proceeds from sale of our domain name from LeadRocket, included in intangible assets, for $4.7 million.
Net cash provided by financing activities was $11.0 million, $15.3 million higher compared to net cash used in financing activities of $4.3 million in 2013. The increase in net cash provided by financing activities was primarily due to $10.5 million proceeds from the revolving line of credit and $3.1 million of proceeds net of purchases from the issuance of common stock pursuant to exercise and release of stock awards, partially offset by the $0.6 million payment on debt conversion, $0.6 million in payment of consideration related to acquisitions, and $1.3 million in payment of principal under capital leases.
Fiscal 2013
Net cash provided by operating activities was $13.7 million, $15.5 million higher compared to net cash used in operating activities of $1.7 million in 2012. The net loss of $21.4 million for the year ended December 31, 2013 was offset by adjustments to net loss of $26.0 million primarily driven by $9.3 million of depreciation and amortization expense, $10.4 million of stock based compensation expense, and $4.8 million of debt conversion expense. Changes in working capital also provided $9.1 million during the year ended December 31, 2013 primarily due to $17.5 million increase in deferred revenue and $2.0 million in accrued payroll and related expenses, partially offset by $7.6 million increase in accounts receivable, $1.3 million increase in non-current other assets, and $1.7 million decrease in accounts payable. Cash provided by operating activities was impacted by an increase in invoicing and collection effort that resulted in a
31
decrease in gross days sales outstanding to 78 days in 2013 from 93 days in 2012.
Net cash provided by investing activities was $2.5 million, $0.8 million higher compared to net cash provided by investing activities of $1.7 million in 2012. The increase in net cash provided by investing activities was primarily due to net proceeds from maturities and sale of investments of $4.8 million, partially offset by purchases of property and equipment of $1.7 million for our data center and new facilities.
Net cash used in financing activities was $4.3 million, $3.3 million higher compared to net cash used in financing activities of $1.0 million in 2012. The increase in net cash used in financing activities was primarily due to $4.4 million payment on debt conversion, $2.9 million in payment of consideration related to acquisitions, $2.3 million in payment of principal under capital leases and $1.3 million in repurchase of common stock from senior management for payment of taxes on vesting of restricted stock units, partially offset by $6.6 million of net proceeds from issuance of common stock pursuant to exercise and release of stock award.
Contractual Obligations and Commitments
We have the following contractual cash obligations at December 31, 2014. Contractual cash obligations that are cancellable upon notice and without significant penalties are not included in the table.
Payments due by Year (in thousands) | |||||||||||||||||||||||||||
Contractual Obligations | 2015 | 2016 | 2017 | 2018 | 2019 | 2020 and beyond | Total | ||||||||||||||||||||
Settlement agreement (1) | |||||||||||||||||||||||||||
Principal payment | $ | 1,963 | $ | 1,900 | $ | 466 | $ | — | $ | — | $ | — | $ | 4,329 | |||||||||||||
Interest payments | 37 | 100 | 34 | — | — | — | 171 | ||||||||||||||||||||
Operating lease commitments (5) | 694 | 2,323 | 2,266 | 2,185 | 2,024 | 5,067 | 14,559 | ||||||||||||||||||||
Capital lease obligations (6) | 1,011 | — | — | — | — | — | 1,011 | ||||||||||||||||||||
Unconditional purchase commitments (2) (3) (4) | 9,271 | 223 | — | — | — | — | 9,494 | ||||||||||||||||||||
_______________________________________________________________________________
(1) | In November 2014, we entered into a settlement agreement with Versata and agreed to make payments of $0.5 million starting on January 31, 2015 and every three months thereafter until January 2017. |
(2) | Unconditional purchase commitments includes the financing arrangement we entered into in September 2014, for the purchase of storage equipment, primarily for data centers. The principal amount financed is $3.8 million and is payable in two installments of $2.6 million and $1.2 million in three months and one year, respectively, from November 2014. |
(3) | Unconditional purchase commitments includes the holdback payable to Clicktools Ltd. and LeadRocket Inc. |
(4) | Unconditional purchase commitments includes $2.7 million for leasehold improvements for our headquarters. |
(5) | We have facilities under several non-cancellable operating lease agreements that expire at various dates through 2018. |
(6) | We entered into non-cancellable capital leases with various expiration dates. |
(7) | The above table does not include the Revolver, because we are unable to make a reasonably reliable estimate of the amount and period in which the Revolver will be paid. |
Outstanding borrowings under the Revolver bear interest, at our option, at a base rate plus an applicable margin. The applicable margin ranges between 0.75% and 2.25% depending on our leverage ratio. Interest is payable every three months. As of December 31, 2014 we borrowed $10.5 million under the Revolver.
We obtained a $0.2 million letter of credit in August 2014 for our leased space in Pleasanton, California. The letter of credit will expire on August 31, 2015.
We obtained a $1.1 million letter of credit in October 2014 for our leased space in Dublin, California. The letter of credit will expire on October 1, 2015.
As of December 31, 2014, the liability for uncertain tax positions was $3.2 million including interest. Due to the high degree of uncertainty regarding the timing of potential future cash flows associated with these liabilities, we are unable to make a reasonably reliable estimate of the amount and period in which these liabilities might be paid.
Our future capital requirements depend on many factors, including the amount of revenue we generate, the timing and extent of spending to support product development efforts, the expansion of sales and marketing activities, the timing of new product introductions and enhancements to existing products, our ability to offer on-demand service on a consistently profitable basis, the continuing market acceptance of our other products and future acquisitions or other capital expenditures we may make. However, based on our current business plan and revenue projections, we believe our existing cash and investment balances will be sufficient to meet our anticipated cash requirements as well as the contractual obligations listed above for at least the next twelve months.
32
Off-Balance Sheet Arrangements
With the exception of items discussed under "Contractual Obligations and Commitments" above we do not have any off-balance sheet arrangements that have or are reasonably likely to have a current or future effect on our financial condition, results of operations, liquidity or capital resources that are material to investors.
Related Party Transactions
For information regarding related party transactions, refer to Note 17 of our Notes to Consolidated Financial Statements.
33
Item 7A. Quantitative and Qualitative Disclosures about Market Risk
Market Risk. Market risk represents the risk of loss that may impact our financial position due to adverse changes in financial market prices and rates, as well as fluctuations in interest rates and foreign exchange rates.
We do not hold or issue financial instruments for trading purposes, and we invest in investment grade securities. We limit our exposure to interest rate and credit risk by establishing and monitoring clear policies and guidelines for our investment portfolios, which is approved by our Board of Directors. The guidelines establish, among others, credit quality standards and limits on exposure to: i) any one security issue or issuer and ii) the type of instrument.
Financial instruments that potentially subject us to market risk are trade receivables denominated in foreign currencies. We also mitigate market risk by monitoring ratings, credit spreads and potential downgrades on at least a quarterly basis. Based on our on-going assessment of counterparty risk, we will adjust our exposure to various counterparties as necessary.
Interest Rate Risk. We invest our cash in a variety of financial instruments, consisting primarily of investments in money market accounts, certificates of deposit, high quality corporate debt obligations, and U.S. government obligations.
Investments in both fixed-rate and floating-rate interest earning instruments carry a degree of interest rate risk. The fair market value of fixed-rate securities may be adversely affected by a rise in interest rates, while floating rate securities, which typically have a shorter duration, may produce less income than expected if interest rates fall. Due in part to these factors, our investment income may decrease in the future due to changes in interest rates. At December 31, 2014, the average maturity of our investments was approximately three months, and all investment securities had remaining maturities of less than 24 months. The following table presents certain information about our financial instruments at December 31, 2014 that are sensitive to changes in interest rates (in thousands, except for interest rates):
Expected Maturity | |||||||||||||||
1 Year or Less | More Than 1 Year | Total Principal Amount | Total Fair Value | ||||||||||||
Available-for-sale securities | $ | 1,954 | $ | 812 | $ | 2,766 | $ | 2,766 | |||||||
Weighted average interest rate | 0.37 | % | 0.55 | % | |||||||||||
Foreign Currency Exchange Risk. Our revenue and our expenses, except those related to our non-United States operations, are generally denominated in U.S. Dollars. For our operations outside the United States, we may transact business in various other currencies. For 2014 and 2013, approximately 20% and 21%, respectively, of our total revenue was generated outside the United States. At December 31, 2014 and 2013, approximately 13% and 11%, respectively, of our total accounts receivable was denominated in foreign currency. A 5% change in foreign currency exchange rates as of December 31, 2014 could result in a $0.3 million change to our accounts receivable balance. Our exchange risks and foreign exchange exposure has been minimal to date. For the years ended December 31, 2014 and 2013, we recognized losses on foreign exchange transactions of $0.4 million and $0.1 million, respectively. We expect to continue to transact a majority of our business in U.S. Dollars. In 2014 and 2013, we did not have a foreign currency hedge program.
34
Item 8. Financial Statements and Supplementary Data
CALLIDUS SOFTWARE INC.
INDEX TO CONSOLIDATED FINANCIAL STATEMENTS
Page | |
35
Report of Independent Registered Public Accounting Firm
The Board of Directors and Stockholders
Callidus Software, Inc.:
We have audited the accompanying consolidated balance sheets of Callidus Software, Inc. (the Company) and subsidiaries as of December 31, 2014 and 2013, and the related consolidated statements of comprehensive loss, stockholders’ equity, and cash flows for each of the years in the three-year period ended December 31, 2014. We also have audited the Company’s internal control over financial reporting as of December 31, 2014, based on criteria established in Internal Control - Integrated Framework (1992) issued by the Committee of Sponsoring Organizations of the Treadway Commission (COSO). The Company’s management is responsible for these consolidated financial statements, for maintaining effective internal control over financial reporting, and for its assessment of the effectiveness of internal control over financial reporting, included in the accompanying management’s report on internal control over financial reporting appearing under Item 9A(b). Our responsibility is to express an opinion on these consolidated financial statements and an opinion on the Company’s internal control over financial reporting based on our audits.
We conducted our audits in accordance with the standards of the Public Company Accounting Oversight Board (United States). Those standards require that we plan and perform the audits to obtain reasonable assurance about whether the financial statements are free of material misstatement and whether effective internal control over financial reporting was maintained in all material respects. Our audits of the consolidated financial statements included examining, on a test basis, evidence supporting the amounts and disclosures in the financial statements, assessing the accounting principles used and significant estimates made by management, and evaluating the overall financial statement presentation. Our audit of internal control over financial reporting included obtaining an understanding of internal control over financial reporting, assessing the risk that a material weakness exists, and testing and evaluating the design and operating effectiveness of internal control based on the assessed risk. Our audits also included performing such other procedures as we considered necessary in the circumstances. We believe that our audits provide a reasonable basis for our opinions.
A company’s internal control over financial reporting is a process designed to provide reasonable assurance regarding the reliability of financial reporting and the preparation of financial statements for external purposes in accordance with generally accepted accounting principles. A company’s internal control over financial reporting includes those policies and procedures that (1) pertain to the maintenance of records that, in reasonable detail, accurately and fairly reflect the transactions and dispositions of the assets of the company; (2) provide reasonable assurance that transactions are recorded as necessary to permit preparation of financial statements in accordance with generally accepted accounting principles, and that receipts and expenditures of the company are being made only in accordance with authorizations of management and directors of the company; and (3) provide reasonable assurance regarding prevention or timely detection of unauthorized acquisition, use, or disposition of the company’s assets that could have a material effect on the financial statements.
Because of its inherent limitations, internal control over financial reporting may not prevent or detect misstatements. Also, projections of any evaluation of effectiveness to future periods are subject to the risk that controls may become inadequate because of changes in conditions, or that the degree of compliance with the policies or procedures may deteriorate.
In our opinion, the consolidated financial statements referred to above present fairly, in all material respects, the financial position of Callidus Software, Inc. and subsidiaries as of December 31, 2014 and 2013, and the results of their operations and their cash flows for each of the years in the three-year period ended December 31, 2014, in conformity with U.S. generally accepted accounting principles. Also in our opinion, Callidus Software, Inc. maintained, in all material respects, effective internal control over financial reporting as of December 31, 2014, based on Internal Control - Integrated Framework (1992) issued by COSO.
/s/ KPMG LLP
Santa Clara, California
February 27, 2015
36
CALLIDUS SOFTWARE INC.
CONSOLIDATED BALANCE SHEETS
(In thousands except per share data)
December 31, | |||||||
2014 | 2013 | ||||||
ASSETS | |||||||
Current assets: | |||||||
Cash and cash equivalents | $ | 34,200 | $ | 28,295 | |||
Short-term investments | 2,766 | 7,866 | |||||
Accounts receivable, net of allowances of $1,063 and $650 at December 31, 2014 and 2013, respectively | 41,623 | 29,216 | |||||
Prepaid and other current assets | 10,384 | 6,232 | |||||
Total current assets | 88,973 | 71,609 | |||||
Property and equipment, net | 18,755 | 11,351 | |||||
Goodwill | 46,970 | 31,207 | |||||
Intangible assets, net | 17,757 | 16,995 | |||||
Deferred income taxes, noncurrent | 440 | 405 | |||||
Deposits and other assets | 3,403 | 2,626 | |||||
Total assets | $ | 176,298 | $ | 134,193 | |||
LIABILITIES AND STOCKHOLDERS' EQUITY | |||||||
Current liabilities: | |||||||
Accounts payable | $ | 2,056 | $ | 2,987 | |||
Accrued payroll and related expenses | 9,051 | 7,377 | |||||
Accrued expenses | 16,868 | 5,395 | |||||
Deferred income taxes | 1,475 | 1,159 | |||||
Deferred revenue | 61,427 | 46,222 | |||||
Capital lease obligations | 1,001 | 1,308 | |||||
Total current liabilities | 91,878 | 64,448 | |||||
Deferred revenue, noncurrent | 10,195 | 10,432 | |||||
Deferred income taxes, noncurrent | 561 | 155 | |||||
Other liabilities | 4,709 | 1,921 | |||||
Capital lease obligations, noncurrent | — | 987 | |||||
Convertible notes | — | 14,197 | |||||
Revolving line of credit | 10,481 | — | |||||
Total liabilities | 117,824 | 92,140 | |||||
Commitments and contingencies (Note 9) | |||||||
Stockholders' equity: | |||||||
Preferred stock, $0.001 par value; 5,000 shares authorized; no shares issued or outstanding | — | — | |||||
Common stock, $0.001 par value; 100,000 shares authorized; 51,285 and 47,817 shares issued and 48,946 and 45,478 shares outstanding at December 31, 2014 and 2013, respectively | 49 | 45 | |||||
Additional paid-in capital | 344,312 | 315,430 | |||||
Treasury stock; 2,339 shares at December 31, 2014 and 2013 | (14,430 | ) | (14,430 | ) | |||
Accumulated other comprehensive income | (739 | ) | 165 | ||||
Accumulated deficit | (270,718 | ) | (259,157 | ) | |||
Total stockholders' equity | 58,474 | 42,053 | |||||
Total liabilities and stockholders' equity | $ | 176,298 | $ | 134,193 | |||
The accompanying notes are an integral part of these consolidated financial statements.
37
CALLIDUS SOFTWARE INC.
CONSOLIDATED STATEMENTS OF COMPREHENSIVE LOSS
(In thousands except per share data)
Year Ended December 31, | |||||||||||
2014 | 2013 | 2012 | |||||||||
Revenue: | |||||||||||
Recurring | $ | 99,807 | $ | 81,734 | $ | 70,919 | |||||
Services and license | 36,811 | 30,603 | 24,033 | ||||||||
Total revenue | 136,618 | 112,337 | 94,952 | ||||||||
Cost of revenue: | |||||||||||
Recurring | 31,282 | 28,741 | 30,039 | ||||||||
Services and license | 24,756 | 19,048 | 20,301 | ||||||||
Total cost of revenue | 56,038 | 47,789 | 50,340 | ||||||||
Gross profit | 80,580 | 64,548 | 44,612 | ||||||||
Operating expenses: | |||||||||||
Sales and marketing | 47,040 | 34,916 | 32,442 | ||||||||
Research and development | 20,307 | 17,143 | 16,643 | ||||||||
General and administrative | 26,255 | 22,951 | 19,953 | ||||||||
Income from settlement and patent licensing | (500 | ) | (500 | ) | — | ||||||
Acquisition-related contingent consideration | — | — | (1,612 | ) | |||||||
Restructuring and other | 1,025 | 1,699 | 1,115 | ||||||||
Total operating expenses | 94,127 | 76,209 | 68,541 | ||||||||
Operating loss | (13,547 | ) | (11,661 | ) | (23,929 | ) | |||||
Interest income and other income (expense), net | 3,504 | 264 | 70 | ||||||||
Interest expense | (506 | ) | (3,183 | ) | (3,451 | ) | |||||
Debt conversion expense | — | (4,776 | ) | — | |||||||
Loss before provision for income taxes | (10,549 | ) | (19,356 | ) | (27,310 | ) | |||||
Provision for income taxes | 1,012 | 2,055 | 388 | ||||||||
Net loss | $ | (11,561 | ) | $ | (21,411 | ) | $ | (27,698 | ) | ||
Net loss per share—basic and diluted | |||||||||||
Net loss per share | $ | (0.24 | ) | $ | (0.55 | ) | $ | (0.78 | ) | ||
Shares used in basic and diluted per share computation | 47,547 | 38,858 | 35,393 | ||||||||
Comprehensive loss | |||||||||||
Net Loss | $ | (11,561 | ) | $ | (21,411 | ) | $ | (27,698 | ) | ||
Unrealized gains (losses) on available-for-sale securities | (7 | ) | (11 | ) | 26 | ||||||
Foreign currency translation adjustments | (897 | ) | (63 | ) | 24 | ||||||
Comprehensive loss | $ | (12,465 | ) | $ | (21,485 | ) | $ | (27,648 | ) | ||
The accompanying notes are an integral part of these consolidated financial statements.
38
CALLIDUS SOFTWARE INC.
CONSOLIDATED STATEMENTS OF STOCKHOLDERS' EQUITY
(In thousands)
Common Stock | Treasury Stock | Accumulated Other Comprehensive Income (Loss) | ||||||||||||||||||||||||||||
Additional Paid-in Capital | Accumulated Deficit | Total Stockholders' Equity | ||||||||||||||||||||||||||||
Shares | Amount | Shares | Amount | |||||||||||||||||||||||||||
Balance as of December 31, 2011 | 35,198 | 33 | 238,798 | 2,339 | (14,430 | ) | 189 | (210,048 | ) | 14,542 | ||||||||||||||||||||
Exercise of stock options under stock incentive plans | 715 | 1 | 3,682 | — | — | — | — | 3,683 | ||||||||||||||||||||||
Issuance of common stock under stock purchase plans | 407 | — | 1,542 | — | — | — | — | 1,542 | ||||||||||||||||||||||
Restricted stock units acquired to settle employee withholding liability | 2,218 | — | (2,346 | ) | — | — | — | — | (2,346 | ) | ||||||||||||||||||||
Stock-based compensation | — | — | 13,655 | — | — | — | — | 13,655 | ||||||||||||||||||||||
Unrealized gain on investments | — | — | — | — | — | 26 | — | 26 | ||||||||||||||||||||||
Cumulative translation adjustment | — | — | — | — | — | 24 | — | 24 | ||||||||||||||||||||||
Net loss | — | — | — | — | — | — | (27,698 | ) | (27,698 | ) | ||||||||||||||||||||
Balance as of December 31, 2012 | 38,538 | 34 | 255,331 | 2,339 | (14,430 | ) | 239 | (237,746 | ) | 3,428 | ||||||||||||||||||||
Exercise of stock options under stock incentive plans | 1,429 | 1 | 5,054 | — | — | — | — | 5,055 | ||||||||||||||||||||||
Issuance of common stock under stock purchase plans | 435 | 1 | 1,573 | — | — | — | — | 1,574 | ||||||||||||||||||||||
Restricted stock units acquired to settle employee withholding liability | 1,544 | 3 | (1,300 | ) | — | — | — | — | (1,297 | ) | ||||||||||||||||||||
Stock-based compensation | — | — | 10,395 | — | — | — | — | 10,395 | ||||||||||||||||||||||
Conversion of debt to equity | 5,871 | 6 | 44,377 | — | — | — | — | 44,383 | ||||||||||||||||||||||
Unrealized loss on investments | — | — | — | — | — | (11 | ) | — | (11 | ) | ||||||||||||||||||||
Cumulative translation adjustment | — | — | — | — | — | (63 | ) | — | (63 | ) | ||||||||||||||||||||
Net loss | — | — | — | — | — | — | (21,411 | ) | (21,411 | ) | ||||||||||||||||||||
Balance as of December 31, 2013 | 47,817 | $ | 45 | $ | 315,430 | 2,339 | $ | (14,430 | ) | $ | 165 | $ | (259,157 | ) | $ | 42,053 | ||||||||||||||
Exercise of stock options under stock incentive plans | 701 | 1 | 2,869 | — | — | — | — | 2,870 | ||||||||||||||||||||||
Issuance of common stock under stock purchase plans | 319 | — | 1,983 | — | — | — | — | 1,983 | ||||||||||||||||||||||
Restricted stock units acquired to settle employee withholding liability | 607 | 1 | (1,723 | ) | — | — | — | — | (1,722 | ) | ||||||||||||||||||||
Stock-based compensation | — | — | 11,813 | — | — | — | — | 11,813 | ||||||||||||||||||||||
Conversion of debt to equity | 1,841 | 2 | 13,940 | — | — | — | — | 13,942 | ||||||||||||||||||||||
Unrealized loss on investments | — | — | — | — | — | (7 | ) | — | (7 | ) | ||||||||||||||||||||
Cumulative translation adjustment | — | — | — | — | — | (897 | ) | — | (897 | ) | ||||||||||||||||||||
Net loss | — | — | — | — | — | — | (11,561 | ) | (11,561 | ) | ||||||||||||||||||||
Balance as of December 31, 2014 | 51,285 | $ | 49 | $ | 344,312 | 2,339 | $ | (14,430 | ) | $ | (739 | ) | $ | (270,718 | ) | $ | 58,474 | |||||||||||||
The accompanying notes are an integral part of these consolidated financial statements.
39
CALLIDUS SOFTWARE INC.
CONSOLIDATED STATEMENTS OF CASH FLOWS
(In thousands)
Year Ended December 31, | |||||||||||
2014 | 2013 | 2012 | |||||||||
Cash flows from operating activities: | |||||||||||
Net loss | $ | (11,561 | ) | $ | (21,411 | ) | $ | (27,698 | ) | ||
Adjustments to reconcile net loss to net cash provided by (used in) operating activities: | |||||||||||
Depreciation expense | 5,503 | 4,458 | 3,114 | ||||||||
Amortization of intangible assets | 4,971 | 4,825 | 5,094 | ||||||||
Provision for doubtful accounts | 852 | 999 | 595 | ||||||||
Stock-based compensation | 11,813 | 10,395 | 13,655 | ||||||||
Deferred income taxes | (86 | ) | 237 | 195 | |||||||
Release of valuation allowance | (265 | ) | — | (350 | ) | ||||||
Loss (gain) on disposal of property and equipment | 43 | 3 | (2 | ) | |||||||
Amortization of convertible notes issuance cost | 58 | 485 | 402 | ||||||||
Gain on sale of intangible assets | (3,862 | ) | — | — | |||||||
Net amortization on investments | 27 | 79 | 358 | ||||||||
Debt conversion expense | — | 4,776 | — | ||||||||
Acquisition-related contingent consideration | — | — | (1,612 | ) | |||||||
Changes in operating assets and liabilities: | |||||||||||
Accounts receivable | (11,746 | ) | (7,648 | ) | (1,112 | ) | |||||
Prepaid and other current assets | (3,749 | ) | 486 | (820 | ) | ||||||
Other noncurrent assets | (1,088 | ) | (1,276 | ) | 662 | ||||||
Accounts payable | (794 | ) | (1,702 | ) | 914 | ||||||
Accrued expenses and other liabilities | 6,696 | 106 | (1,106 | ) | |||||||
Accrued payroll and related expenses | 1,149 | 1,971 | 987 | ||||||||
Accrued restructuring and other expenses | (181 | ) | (503 | ) | 443 | ||||||
Deferred revenue | 11,371 | 17,469 | 4,576 | ||||||||
Net cash provided by (used in) operating activities | 9,151 | 13,749 | (1,705 | ) | |||||||
Cash flows from investing activities: | |||||||||||
Purchases of investments | (2,784 | ) | (7,434 | ) | (16,536 | ) | |||||
Proceeds from maturities and sale of investments | 7,850 | 12,250 | 38,841 | ||||||||
Purchases of property and equipment | (7,121 | ) | (1,704 | ) | (6,692 | ) | |||||
Proceeds from sale of intangible assets, net of expenses | 4,651 | — | 2 | ||||||||
Purchases of intangible assets | (1,112 | ) | (638 | ) | (6,196 | ) | |||||
Acquisitions, net of cash acquired | (15,488 | ) | — | (7,715 | ) | ||||||
Net cash provided by (used in) investing activities | (14,004 | ) | 2,474 | 1,704 | |||||||
Cash flows from financing activities: | |||||||||||
Proceeds from issuance of common stock | 4,852 | 6,629 | 5,225 | ||||||||
Restricted stock units acquired to settle employee withholding liability | (1,723 | ) | (1,297 | ) | (2,346 | ) | |||||
Payment of consideration related to acquisitions | (630 | ) | (2,903 | ) | (2,660 | ) | |||||
Payment on debt conversion | (645 | ) | (4,374 | ) | — | ||||||
Proceeds from Revolver line of credit | 10,481 | — | — | ||||||||
Repayment of debt assumed through acquisition | — | — | (30 | ) | |||||||
Payment of principal under capital leases | (1,294 | ) | (2,319 | ) | (1,193 | ) | |||||
Net cash (used in) provided by financing activities | 11,041 | (4,264 | ) | (1,004 | ) | ||||||
Effect of exchange rates on cash and cash equivalents | (283 | ) | (64 | ) | 22 | ||||||
Net increase (decrease) in cash and cash equivalents | 5,905 | 11,895 | (983 | ) | |||||||
Cash and cash equivalents at beginning of period | 28,295 | 16,400 | 17,383 | ||||||||
Cash and cash equivalents at end of period | $ | 34,200 | $ | 28,295 | $ | 16,400 | |||||
Supplemental disclosures of cash flow information: | |||||||||||
Cash paid for interest on convertible debt | $ | 277 | $ | 2,604 | $ | 2,813 | |||||
Cash paid for interest on capital leases | 59 | 100 | 101 | ||||||||
Cash paid for income taxes | $ | 182 | $ | 162 | $ | — | |||||
Noncash investing and financing activities: | |||||||||||
Conversion of convertible debt to equity | $ | 14,197 | $ | 45,018 | $ | — | |||||
Reclassification of unamortized debt issuance cost to additional paid-in capital as a result of debt conversion | $ | 253 | $ | 1,037 | $ | — | |||||
Common stock issued as a premium of debt conversion | $ | — | $ | 402 | $ | — | |||||
Fixed assets acquired under capital lease | $ | — | $ | 3,851 | $ | — | |||||
Purchases of property and equipment through accounts payable and other accrued liabilities | $ | 5,829 | $ | 157 | $ | 214 | |||||
The accompanying notes are an integral part of these consolidated financial statements.
40
CALLIDUS SOFTWARE INC
NOTES TO CONSOLIDATED FINANCIAL STATEMENTS
Note 1—The Company and Significant Accounting Policies
Description of Business
Callidus Software Inc. (referred to herein as "CallidusCloud", "Callidus", "we" and "our") is a provider of sales and marketing effectiveness software. The Company provides organizations with a complete suite of Lead-to-Money solutions that identify the right leads, ensure proper territory and quota distribution, train sales forces, automate quote and proposal generation, and streamline sales compensation.
Principles of Consolidation
The consolidated financial statements include the accounts of Callidus Software, Inc. and its wholly-owned subsidiaries (collectively, the Company), which include wholly-owned subsidiaries in Australia, Canada, Germany, Hong Kong, India, Malaysia, Mexico, New Zealand, Serbia, Singapore, Japan and the United Kingdom. All intercompany transactions and balances have been eliminated in the consolidation.
Use of Estimates
The consolidated financial statements are prepared in accordance with U.S. generally accepted accounting principles ("GAAP") as set forth in the Financial Accounting Standards Board’s ("FASB") Accounting Standards Codification ("ASC") and consider the various staff accounting bulletins and other applicable guidance issued by the U.S. Securities and Exchange Commission ("SEC"). These accounting principles require us to make certain estimates, judgments and assumptions. The Company believes that the estimates, judgments and assumptions upon which the Company relies are reasonable based upon information available to us at the time that these estimates, judgments and assumptions are made. These estimates, judgments and assumptions can affect the reported amounts of assets and liabilities as of the date of the financial statements as well as the reported amounts of revenues and expenses during the periods presented. To the extent there are differences between these estimates, judgments or assumptions and actual results, the Company's consolidated financial statements will be affected. In many cases, the accounting treatment of a particular transaction is specifically dictated by GAAP and does not require management’s judgment in its application. There are also areas in which management’s judgment in selecting among available alternatives would not produce a materially different result.
In addition, illiquid credit markets, volatile equity and foreign currency markets by companies have contributed to the increase in uncertainty in management estimates and assumptions. Also, future events, such as changes in economic environment, cannot be determined with precision, which would cause actual results to differ materially from management's estimates. Such changes in estimates will be reflected in the consolidated financial statements in future periods.
Foreign Currency Translation
The Company transact business in various foreign currencies. In general, the functional currency of a foreign operation is the local country’s currency. Accordingly, the foreign currencies are translated into U.S. Dollars using exchange rates in effect at period end for assets and liabilities and average rates during each reporting period for the results of operations. Adjustments resulting from the translation of the financial statements of the foreign subsidiaries are reported as a separate component of accumulated other comprehensive income (loss). Foreign currency transaction gains and losses are included in interest and other income (expense), net in the accompanying consolidated statements of comprehensive loss.
Cash and Cash Equivalents and Investments
The Company considers all highly liquid instruments with an original maturity on the date of purchase of three months or less to be cash equivalents. Cash equivalents as of December 31, 2014 and 2013 consisted of money market funds. The Company determines the appropriate classification of investment securities at the time of purchase and re-evaluates such designation as of each balance sheet date. As of December 31, 2014 and 2013, all investment securities were designated as "available-for-sale". The Company considers available-for-sale securities that have a maturity date longer than three months to be short-term investments, including those investments with a maturity date of longer than one year that are highly liquid and for which the Company does not have a positive intent to hold to maturity. These securities are carried at estimated fair value based on quoted market prices or other readily available market information, with the unrealized gains and losses included in other comprehensive income (loss). Recognized gains and losses are included in the consolidated statement of comprehensive loss. When the Company has determined that an other-than-temporary decline in fair value has occurred, the amount of the decline is recognized in earnings. Gains and losses are determined using the specific identification method.
41
Fair Value of Financial Instruments and Concentrations of Credit Risk
The fair value of certain of the Company's financial instruments that are not measured at fair value, including accounts receivable and accounts payable, approximates the carrying amount due to their short maturity. See Note 6 for discussion regarding the valuation of the Company's investments. Financial instruments that potentially subject us to concentrations of credit risk are short-term investments and trade receivables. The Company mitigates concentration of risk by monitoring the risk profiles of all bank counterparties on at least a quarterly basis. Based on the on-going assessment of counterparty risk, the Company will adjust its exposure to various counterparties.
The Company's customer base consists of businesses throughout the Americas, Europe, Middle East, Africa and Asia-Pacific. The Company performs ongoing credit evaluations of its customers and generally does not require collateral on accounts receivable. As of December 31, 2014 and 2013, the Company had no customers comprising greater than 10% of net accounts receivable or total revenue. Refer to Note 16 for information regarding revenue by geographic areas.
In May, 2014, the Company entered into a credit agreement with Wells Fargo Bank, National Association ("Wells Fargo"), under which Wells Fargo agreed to make a revolving loan ("Revolver") to us in an amount not to exceed $10.0 million, with an accordion feature that allows the Company to increase the maximum borrowing amount by not less than $5.0 million and not more than $10.0 million. The Revolver matures in May 2019. Outstanding borrowings under the Revolver bear interest, at the Company's option, at a base rate plus an applicable margin. The applicable margin ranges between 0.75% and 2.25% depending on the Company's leverage ratio. Interest is payable every three months. In September 2014 the Company exercised the accordion feature and increased the maximum amount of borrowing to $15.0 million. As of December 31, 2014 the Company had borrowed $10.5 million under the Revolver. The carrying value of total debt approximates fair market value.
Holdback Payable
The Company estimates the fair value of an indemnity holdback payable based on the contract value. The terms of the holdback payable includes standard representations and warranties.
Contingent Consideration
The Company estimates the fair value of the contingent consideration issued in business combinations using a probability-based income approach. The fair value of the Company liability-classified contingent consideration is remeasured at each reporting period, with any changes in the fair value recorded as income or expense. Contingent acquisition consideration payable is included in accrued liabilities on the Company's consolidated balance sheets.
Allowance for Doubtful Accounts
The Company reduces gross trade accounts receivable with its allowance for doubtful accounts. The allowance for doubtful accounts is the Company's estimate of the amount of probable credit losses in existing accounts receivable. Management analyzes accounts receivable and historical bad debt experience, customer creditworthiness, current economic trends and changes in customer payment history when evaluating the adequacy of the allowance for doubtful accounts. Provisions to the allowance for doubtful accounts are recorded in general and administrative expenses.
Below is a summary of the changes in the Company's allowance for doubtful accounts for 2014, 2013 and 2012 (in thousands):
Balance at Beginning of Year | Additions (charges to expense) | Deductions | Balance at End of Year | ||||||||||||
Allowance for doubtful accounts | |||||||||||||||
Year ended December 31, 2014 | $ | 650 | $ | 996 | $ | (583 | ) | $ | 1,063 | ||||||
Year ended December 31, 2013 | 481 | 830 | (661 | ) | 650 | ||||||||||
Year ended December 31, 2012 | 225 | 434 | (178 | ) | 481 | ||||||||||
Prepaid and Other Current Assets and Deposits and Other Assets
Included in prepaid and other current assets and deposits and other in long-term assets in the consolidated balance sheets at December 31, 2014 and 2013 is restricted cash totaling $0.2 million and $0.5 million, respectively, primarily related to security deposits on leases of the Company's facilities. The restricted cash represents investments in certificates of deposit required by landlords to meet security deposit requirements for the leased facilities. Restricted cash is included in prepaid and other current assets in short-term assets and deposits and other assets in long-term assets based on the contractual term for the release of the restriction.
42
Property and Equipment, net
Property and equipment, net is stated at cost, net of accumulated depreciation. Depreciation is calculated using the straight-line method over the estimated useful lives of the respective assets, generally three to five years. Leasehold improvements are amortized over the lesser of the assets' estimated useful lives or the related lease terms. Expenditures for maintenance and repairs are expensed as incurred. Cost and accumulated depreciation of assets sold or retired are removed from the respective property accounts and any resulting gain or loss is reflected in the consolidated statements of comprehensive loss.
Goodwill, Intangible Assets, Long-Lived Assets and Impairment Assessments
Goodwill represents the excess of the purchase price over the fair value of net assets acquired in connection with business combinations. Goodwill is not amortized, but instead goodwill is required to be tested for impairment annually and under certain circumstances. The Company performs such testing of goodwill in the fourth quarter of each year, or as events occur or circumstances change that would more likely than not reduce the fair value of a reporting unit below its carrying amount.
The Company conducts a two-step test for impairment of goodwill. The first step of the test for goodwill impairment compares the fair value of the applicable reporting unit with its carrying value. If the fair value of a reporting unit is less than the reporting unit's carrying value, the Company will perform the second step of the test for impairment of goodwill. During the second step of the test for impairment of goodwill, the Company will compare the implied fair value of the reporting unit's goodwill with the carrying value of that goodwill. If the carrying value of the goodwill exceeds the calculated implied fair value, the excess amount will be recognized as an impairment loss. The Company has one reporting unit and evaluates goodwill for impairment at the entity level. Based upon the results of the step one testing, the Company concluded that no impairment existed as December 31, 2014, and did not perform the second step of the goodwill impairment test.
Intangible assets with finite lives are amortized over their estimated useful lives of one to twelve years. Generally, amortization is based on the higher of a straight-line method or the pattern in which the economic benefits of the intangible asset will be consumed.
The Company also evaluates the recoverability of its long-lived assets for possible impairment whenever events or circumstances indicate that the carrying amount of such assets may not be recoverable. If such review indicates that the carrying amount of long-lived assets is not recoverable, the carrying amount of such assets is reduced to fair value. There were no impairment charges recorded during the years ended December 31, 2014, 2013 and 2012.
Business Combinations
The Company recognizes assets acquired, liabilities assumed, and contingent consideration at their fair value on the acquisition date. The Company’s estimates are inherently uncertain and subject to refinement. As a result, during the measurement period, which may be up to one year from the acquisition date, the Company may record adjustments to the fair value of assets acquired and liabilities assumed, with a corresponding offset to goodwill. Upon the conclusion of the measurement period or final determination of the fair value of assets acquired or liabilities assumed, whichever comes first, any subsequent adjustments are recorded to the Company's consolidated statements of operations. See Note 3 to the Company's consolidated financial statements, for a discussion of the Company's acquisitions during 2014.
In addition, uncertainties in income tax and tax related valuation allowances assumed in connection with a business combination are initially estimated as of the acquisition date. The Company continues to gather information and evaluate these items and records any adjustments to the preliminary estimates to goodwill when the estimates are within the measurement period. Subsequent to the measurement period, changes to these income tax uncertainties and tax related valuation allowances will affect the Company's provision for income taxes in its consolidated statements of comprehensive loss.
Revenue Recognition
The Company generates revenue by providing software applications as a service through on-demand subscription, perpetual and term licenses and related software maintenance, and professional services. Amounts that have been invoiced are recorded in accounts receivable and in deferred revenue or revenue, depending on whether the revenue recognition criteria have been met.
Recurring Revenue. Recurring revenue, which includes SaaS revenue and maintenance revenue, are recognized as revenue ratably over the stated contractual period. SaaS revenue consists of subscription fees from customers accessing our cloud-based service offerings. Maintenance revenue consists of fees from customers purchasing subscriptions and receiving support for on-premise solutions. The Company also recognizes revenue associated with customers using its products in excess of contracted usage. This customer excess use is primarily attributed to SaaS products and are recorded in SaaS revenue. Revenue related to customer excess use was immaterial during 2014 and 2013.
Service and Other Revenue. Service and other revenue primarily consist of training, integration, and configuration services. Generally, the Company's professional services arrangements are on a time-and-materials basis. Time and material services are recognized as revenue as the services are rendered based on inputs to the project, such as billable hours incurred. For fixed-fee professional service arrangements, the Company recognizes revenue under the proportional performance method of accounting and estimates the proportional performance on a monthly basis, utilizing hours incurred to date as a percentage of total estimated hours to complete the project. If the Company does not have a sufficient basis to measure progress toward completion, revenue is recognized upon completion. Service and other revenue also includes license revenue from perpetual licenses which are recognized upon delivery of the product, using the residual method, assuming all the other conditions for revenue recognition have been met.
43
In certain arrangements with non-standard acceptance criteria, the Company defers the revenue until the acceptance criteria are satisfied. Reimbursements, including those related to travel and out-of-pocket expenses, are included in services and other revenue, and an equivalent amount of reimbursable expenses is included in cost of services and other revenue.
In general, recurring revenue agreements are entered into for twelve to thirty-six months, and the professional services are performed within nine months of entering into a contract with the customer, depending on the size of integration.
SaaS agreements provide specified service level commitments, excluding scheduled maintenance. The failure to meet this level of service availability may require the Company to credit qualifying customers a portion of their subscription and support fees. Based on the Company's historical experience meeting its service level commitments, the Company does not currently have any liabilities on its balance sheet for these commitments.
The Company recognizes revenue when all of the following conditions are met:
• Persuasive evidence of an arrangement exists;
• Delivery has occurred or services have been rendered;
• The fees are fixed or determinable; and
• Collection of the fees is reasonably assured.
If the Company determines that any one of the four criteria is not met, it will defer recognition of revenue until all the criteria are met.
Multiple-deliverable arrangements with on-demand subscription. For on-demand subscription agreements with multiple-deliverables, the Company evaluates each element to determine whether it represents a separate unit of accounting. The Company determines the best estimated selling price of each deliverable in an arrangement based on a selling price hierarchy of methods contained in Financial Accounting Standards Board (“FASB”) Accounting Standards Update (“ASU”) No. 2009-13, Revenue Recognition (Accounting Standards Codification (“ASC”) Topic 605)-Multiple-Deliverable Revenue Arrangements. The best estimated selling price for a deliverable is based on its vendor-specific objective evidence (“VSOE”), if available, third-party evidence (“TPE”), if VSOE is not available, or estimated selling price (“ESP”), if neither VSOE nor TPE is available. Total arrangement fees are allocated to each element using the relative selling price method. The Company has currently established VSOE for most deliverables, except for fixed fee service arrangements.
The Company considered all of the following factors to establish the ESP for fixed fee service arrangements when sold with its on-demand services: the weighted average actual sales prices of professional services sold on a standalone basis for on-demand services; average billing rate for fixed fee service agreements when sold with on-demand services, cost plus a reasonable mark-up and other factors such as gross margin objectives, pricing practices and growth strategy. The Company is currently using cost plus a reasonable mark-up to establish ESP for fixed fee service.
Multiple-deliverable arrangements with on-premise license. For arrangements with multiple-deliverables, including license, professional services and maintenance, the Company recognizes license revenue using the residual method of accounting pursuant to the requirements of the guidance contained in ASC 985-605, Software Revenue Recognition. Under the residual method, revenue is recognized when VSOE for fair value exists for all of the undelivered elements in the arrangement, but does not exist for one or more of the delivered elements in the arrangement. If evidence of fair value cannot be established for the undelivered elements, all of the revenue is deferred until evidence of fair value can be established, or until the items for which evidence of fair value cannot be established are delivered. For maintenance and certain professional services, the Company has established VSOE as a consistent number of standalone sales of this deliverable have been priced within a reasonably narrow range. The Company's revenue arrangements generally do not include a general right of return relative to the delivered products.
For the Company's term-based licenses, included in services and licenses, that are typically bundled with maintenance for the entire duration of the license, if the only undelivered element is maintenance, then the entire amount of revenue is recognized over the maintenance period, as maintenance is not typically sold separately.
Sales and other taxes collected from customers to be remitted to government authorities are excluded from revenue.
44
Deferred Revenue
Deferred revenue consists of invoicing and payments received in advance of revenue recognition and is recognized as the revenue recognition criteria are met. The Company invoices its customers annually, quarterly, or in monthly installments. Deferred revenue that will be recognized during the succeeding twelve month period is recorded as current deferred revenue, and the remaining portion is recorded as non-current deferred revenue.
Cost of Revenue
Cost of recurring revenue consists primarily of salaries, benefits, allocated overhead costs related to on-demand operations and technical support personnel, as well as allocated amortization of purchased technology. Cost of services revenue consists primarily of salaries, benefits, travel and allocated overhead costs related to consulting, training and other professional services personnel, including cost of services provided by third-party consultants engaged by the Company. Cost of license revenue consists primarily of amortization of purchased technology.
Deferred Commissions
The deferred commissions on the Company's consolidated balance sheets totaled $5.6 million and $4.8 million at December 31, 2014 and December 31, 2013, respectively. As of December 31, 2014 and 2013 $4.2 million and $3.4 million of the deferred commissions are included in prepaid and other current assets in short-term assets with the remaining amounts included in deposits and other assets in long-term assets in the consolidated balance sheets. The deferred costs mainly represent commission payments to the Company's direct sales force for on-demand subscription and maintenance agreements, which the Company amortizes as sales and marketing expense over the non-cancellable term of the contract as the related revenue is recognized. The commission payments are a direct and incremental cost of the revenue arrangements.
Restructuring and Other Expenses
Restructuring and other expenses are comprised primarily of employee termination costs related to headcount reductions, costs related to properties abandoned in connection with facilities consolidation including estimated losses related to excess facilities based upon the Company's contractual obligations, net of estimated sublease income and related write-downs of leasehold improvements. The Company reassess the liability for excess facilities periodically based on market conditions.
Research and Development
The Company expenses the cost of research and development as incurred. Research and development expenses consist primarily of expenses for research and development staff, the cost of certain third-party service providers and allocated overhead.
Stock-Based Compensation
The Company measures and recognizes compensation expense for stock-based awards made to employees and directors including employee stock options and employee stock purchases under the Company's Employee Stock Purchase Plan ("ESPP") based on estimated fair values on the date of grant using the Black-Scholes option pricing model. Stock-based compensation expense for restricted stock units ("RSU"), relating to both performance and service-based awards, is estimated based on the market value of the Company's stock on the date of grant.
The Company granted performance-based share award ("PSUs") to select executives and other key employees. The Company's PSUs are in the form of restricted stock units, the vesting of which is based on achievement of specified company or other goals. In 2014, the Company granted PSUs with vesting contingent on its absolute SaaS revenue growth over the three year period from 2014 to 2016, and the Company's relative total shareholder return over the three year period from 2014 through 2016 compared to an index of 17 SaaS companies. PSU awards based on SaaS revenue growth will, to the extent the performance criteria are achieved, vest on the third anniversary of the grant date. PSU awards based on total shareholder return is recognized as compensation costs over the requisite service period, if rendered, even if the market condition is never satisfied. In determining the fair value of PSUs based on total shareholder return the Company considered the achievement of the market condition in the estimated fair value.
Income Taxes
The Company is subject to income and foreign withholding taxes in both the United States and foreign jurisdictions and the Company uses estimates in determining its provision for income taxes. This process involves estimating actual current tax assets and liabilities together with assessing temporary differences resulting from differing treatment of items for tax and accounting purposes. These differences result in deferred tax assets and liabilities, which are recorded on the consolidated balance sheets. Net deferred tax assets are recorded to the extent the Company believes that these assets will more likely than not be realized. In making such determination, all available positive and negative evidence is considered, including scheduled reversals of deferred tax liabilities, projected future taxable income, tax planning strategies and recent financial operations. With the exception of the net deferred tax assets of two of the Company's foreign subsidiaries, it maintained a full valuation allowance against its net deferred tax assets at December 31, 2014 because the Company believes that it is not more-likely-than-not that the gross deferred tax assets will be realized. While the Company has considered future taxable income and ongoing prudent and feasible tax planning strategies in assessing the need for a valuation allowance, in the event the Company was able to determine that it would be able to realize the deferred tax assets in the future, an adjustment to the deferred tax assets would increase net income in the period such determination was made.
45
Income tax positions must meet a more-likely-than-not recognition threshold at the effective date to be recognized upon the adoption of accounting for uncertainty in income taxes and in subsequent periods. This interpretation also provides guidance on measurement, derecognition, classification, interest and penalties, accounting in interim periods, disclosure and transition. The Company recognizes interest and penalties related to unrecognized tax benefits in income tax expense in the accompanying consolidated statement of comprehensive loss. Accrued interest and penalties are included in other liabilities.
Advertising Costs
The Company expenses advertising costs in the period incurred. Advertising expense was $1.2 million, $227,000, and $146,000 for 2014, 2013 and 2012, respectively.
Comprehensive Income (Loss)
Comprehensive income (loss) is the total of net income (loss), unrealized gains and losses on investments and foreign currency translation adjustments. Unrealized gains and losses on investments and foreign currency translation adjustment amounts are excluded from net loss and are reported in accumulated other comprehensive income (loss) in the accompanying consolidated financial statements.
Recent Accounting Pronouncements
In May 2014, the FASB issued Accounting Standards Update No. 2014-09 (ASU 2014-09) "Revenue from Contracts with Customers." ASU 2014-09 supersedes the revenue recognition requirements in “Revenue Recognition (Topic 605)”, and requires entities to recognize revenue when it transfers promised goods or services to customers in an amount that reflects the consideration to which the entity expects to be entitled to in exchange for those goods or services. ASU 2014-09 is effective for annual reporting periods beginning after December 15, 2016, including interim periods within that reporting period. Early adoption is not permitted. The Company is currently in the process of evaluating the impact of the adoption of ASU 2014-09 on the consolidated financial statements.
Note 2—Restructuring and Other
On June 30, 2014, management approved and initiated restructuring plans to realign the Company's resources to improve cost efficiencies. Restructuring and other expenses primarily consist of costs associated with exit of excess facilities, employee terminations and incremental depreciation expense as a result of the change in the estimated useful life of assets to be abandoned.
The Company incurred restructuring and other expenses of $1.0 million, $1.7 million, and $1.1 million for the year ended December 31, 2014, 2013 and 2012, respectively.
The following table sets forth a summary of accrued restructuring expenses for 2014 and 2013 (in thousands):
December 31, 2013 | Additions | Adjustments | Cash Payments | December 31, 2014 | |||||||||||||||
Severance and termination-related costs | $ | 141 | $ | 70 | $ | — | $ | (211 | ) | $ | — | ||||||||
Facilities related costs | 234 | 162 | 20 | (222 | ) | 194 | |||||||||||||
Total accrued restructuring expenses | $ | 375 | $ | 232 | $ | 20 | $ | (433 | ) | $ | 194 | ||||||||
December 31, 2012 | Additions | Adjustments | Cash Payments | December 31, 2013 | |||||||||||||||
Severance and termination-related costs | $ | 589 | $ | 1,706 | $ | (7 | ) | $ | (2,147 | ) | $ | 141 | |||||||
Facilities related costs | 289 | — | — | (55 | ) | 234 | |||||||||||||
Total accrued restructuring expenses | $ | 878 | $ | 1,706 | $ | (7 | ) | $ | (2,202 | ) | $ | 375 | |||||||
In 2014, the Company incurred $0.8 million of non-cash expense, primarily related to incremental depreciation as a result of the change in the estimated useful life of assets at the Company's office space at Pleasanton, California.
Note 3—Acquisitions
Clicktools Ltd.
On September 16, 2014, the Company acquired Clicktools Ltd. (“Clicktools”), a provider of premium, cloud-based survey products and services for businesses. The purchase consideration was $16.4 million , which included $14.8 million paid in cash and a one million British Pounds indemnity holdback payable upon the one year closing anniversary. This amount is translated to U.S. Dollars to $1.6 million at the prevailing exchange rate on December 31, 2014.
46
The preliminary purchase price allocation for Clicktools is summarized as follows (in thousands):
Fair Value | |||
Net liabilities assumed | $ | (1,270 | ) |
Intangible assets | 3,000 | ||
Goodwill | 14,675 | ||
Total purchase price | $ | 16,405 | |
The excess of purchase consideration over the fair value of net tangible liabilities assumed and identifiable intangible assets acquired was recorded as goodwill. The estimated fair values of assets acquired and liabilities assumed, specifically current and noncurrent income taxes payable and deferred taxes, may be subject to change as additional information is received and certain tax returns are finalized. Thus the provisional measurements of fair value set forth above are subject to change.
Goodwill is primarily attributed to the anticipated synergies from the acquisition and expanded market opportunities with respect to the integration of Clicktools' business-to-business survey management platform with the Company's other solutions. The goodwill balance is not deductible for U.S. or U.K income tax purposes.
The following table sets forth the components of identifiable intangible assets acquired and their estimated useful lives as of the date of the Clicktools acquisition (in thousands). The intangible assets are reported in British Pounds and will be translated to U.S. Dollars at December 31, 2014.
Fair Value | Useful Life | ||||
Developed technology | $ | 1,300 | 3 years | ||
Domain names and trademarks | 600 | 3 years | |||
Customer relationships | 1,100 | 3 years | |||
Total intangible assets subject to amortization | $ | 3,000 | |||
Pro forma results of operations for the Clicktools acquisition have not been presented because the acquisition is not material.
LeadRocket, Inc.
On February 4, 2014, the Company acquired all of the common stock of LeadRocket, Inc. (“LeadRocket”), a privately-held company providing marketing automation and demand generation solutions that enable both marketing and sales users to identify and connect with leads efficiently. The Company acquired LeadRocket to strengthen its social engagement and digital marketing platform. The purchase consideration was $3.0 million, which included $2.5 million paid in cash and $0.5 million as indemnity holdback payable upon the one year closing anniversary. As of December 31, 2014, $0.3 million of the indemnity holdback remains accrued for potential indemnification claims.
The purchase price allocation for LeadRocket is summarized as follows (in thousands):
Fair Value | |||
Net liabilities assumed | $ | (1,224 | ) |
Intangible assets | 2,640 | ||
Goodwill | 1,584 | ||
Total purchase price | $ | 3,000 | |
The excess of purchase consideration over the fair value of net tangible liabilities assumed and identifiable intangible assets acquired was recorded as goodwill. The fair values assigned to tangible and identifiable intangible assets acquired and liabilities assumed are based on management’s estimates and assumptions. The estimated fair values of assets acquired and liabilities assumed, specifically current and noncurrent income taxes payable and deferred taxes, may be subject to change as additional information is received and certain tax returns are finalized. Thus the provisional measurements of fair value set forth above are subject to change.
The goodwill balance is primarily attributed to the anticipated synergies from the acquisition and expanded market opportunities with respect to the integration of LeadRocket’s digital marketing platform with the Company's other solutions. The goodwill balance is not deductible for U.S. income tax purposes.
47
The following table sets forth the components of identifiable intangible assets acquired and their estimated useful lives as of the date of the LeadRocket acquisition (in thousands):
Fair Value | Useful Life | |||
Developed technology | 570 | 2-4 years | ||
Patents | 1,060 | 10 years | ||
Domain names and trademarks | 850 | 5 years | ||
Customer relationships | 160 | 3 years | ||
Total intangible assets subject to amortization | 2,640 | |||
Pro forma results of operations for the LeadRocket acquisition have not been presented because the acquisition is not material.
Note 4—Goodwill and Intangible Assets
Goodwill
The changes in the carrying amount of goodwill for the fiscal years ended December 31, 2014 and 2013 are as follows (in thousands):
Goodwill | |||
Balance as of December 31, 2012 and 2013 | $ | 31,207 | |
Acquisitions | 16,259 | ||
Foreign currency translation impact | (496 | ) | |
Balance as of December 31, 2014 | $ | 46,970 | |
In February 2014, the Company recorded goodwill of $1.6 million related to the acquisition of LeadRocket Inc. and in the last quarter of 2014, the Company recorded goodwill of $14.7 million related to the acquisition of Clicktools Ltd. Refer to Note 3, Acquisitions for further details.
Based on the Company's annual impairment review in the fourth quarter of 2014, 2013 and 2012, it concluded that goodwill was not impaired in any of the years presented.
Intangible assets
Intangible assets consisted of the following as of December 31, 2014 and 2013 (in thousands):
December 31, 2013 Cost | December 31, 2013 Net | Net Additions (1) | Foreign currency translation impact | Amortization Expense | December 31, 2014 Net | Weighted Average Amortization Period (Years) | |||||||||||||||||||
Developed technology | $ | 21,187 | $ | 9,669 | $ | 3,906 | $ | (53 | ) | $ | (3,271 | ) | $ | 10,251 | 4.1 | ||||||||||
Customer relationships | 8,154 | 4076 | 1,260 | (41 | ) | (1,025 | ) | 4,270 | 3.6 | ||||||||||||||||
Tradenames | 1,522 | 828 | 686 | (25 | ) | (298 | ) | 1,191 | 3.6 | ||||||||||||||||
Favorable lease | 53 | — | — | — | — | — | N/A | ||||||||||||||||||
Patents and licenses | 3,059 | 2393 | — | — | (348 | ) | 2,045 | 6.7 | |||||||||||||||||
Other | 142 | 29 | — | — | (29 | ) | — | N/A | |||||||||||||||||
Total | $ | 34,117 | $ | 16,995 | $ | 5,852 | $ | (119 | ) | $ | (4,971 | ) | $ | 17,757 | |||||||||||
(1) | Included in the additions are the intangibles acquired for Clicktools of $3.0 million and LeadRocket of $2.6 million as discussed in Note 3 to the consolidated financial statements and other purchased technology as part of the normal course of operations. |
48
December 31, 2012 Cost | December 31, 2012 Net | Net Additions | Foreign currency translation impact | Amortization Expense | December 31, 2013 Net | Weighted Average Amortization Period (Years) | |||||||||||||||||||
Developed technology | $ | 20,576 | $ | 12,384 | $ | 611 | $ | — | $ | (3,326 | ) | $ | 9,669 | 4.3 | |||||||||||
Customer relationships | 8,154 | 4,952 | — | — | (876 | ) | 4,076 | 4.9 | |||||||||||||||||
Tradenames | 1,522 | 1,040 | — | — | (212 | ) | 828 | 5.2 | |||||||||||||||||
Favorable lease | 40 | 1 | 13 | — | (14 | ) | — | N/A | |||||||||||||||||
Patents and licenses | 3,059 | 2,744 | — | — | (351 | ) | 2,393 | 7.6 | |||||||||||||||||
Other | 142 | 75 | — | — | (46 | ) | 29 | 0.5 | |||||||||||||||||
Total | $ | 33,493 | $ | 21,196 | $ | 624 | $ | — | $ | (4,825 | ) | $ | 16,995 | ||||||||||||
Amortization expense related to intangible assets was $5.0 million, $4.8 million and $5.1 million in 2014, 2013 and 2012, respectively, and was charged to cost of revenue for purchased technology, tradenames and patents and licenses; sales and marketing expense for customer relationships; and general and administrative expense for the favorable lease and other. The Company's intangible assets are amortized over their estimated useful lives of one to twelve years. Total future expected amortization is as follows (in thousands):
Developed Technology | Customer Relationships | Tradenames | Patents and Licenses | ||||||||||||
Year Ending December 31: | |||||||||||||||
2015 | $ | 2,828 | $ | 1,290 | $ | 382 | $ | 346 | |||||||
2016 | 2,741 | 1,290 | 353 | 346 | |||||||||||
2017 | 2,417 | 1,019 | 285 | 346 | |||||||||||
2018 | 1,519 | 491 | 96 | 313 | |||||||||||
2019 | 311 | 74 | 32 | 180 | |||||||||||
2020 and beyond | 435 | 106 | 43 | 514 | |||||||||||
Total expected amortization expense | $ | 10,251 | $ | 4,270 | $ | 1,191 | $ | 2,045 | |||||||
Note 5—Financial Instruments
As of December 31, 2014, all marketable debt securities are classified as available-for-sale and carried at estimated fair value, which is determined based on the inputs discussed below.
The Company classifies all highly liquid instruments with an original maturity on the date of purchase of three months or less as cash and cash equivalents. The Company classifies available-for-sale securities that have a maturity date longer than three months to be short-term investments, including those investments with a maturity date of longer than one year that are highly liquid and for which the Company does not have a positive intent to hold to maturity.
Interest income is included within interest income and other income (expense), net in the accompanying consolidated statements of comprehensive loss. Realized gains and losses are calculated using the specific identification method. As of December 31, 2014 and 2013, the Company had no short-term investments in an unrealized loss position for a duration greater than 12 months.
The components of the Company's marketable debt securities classified as available-for-sale were as follows at December 31, 2014 (in thousands):
December 31, 2014 | Amortized Cost | Gross Unrealized Gains | Gross Unrealized Losses | Estimated Fair value | ||||||||||||
Cash | $ | 27,890 | $ | — | $ | — | $ | 27,890 | ||||||||
Cash equivalents: | ||||||||||||||||
Money market funds | 6,310 | — | — | 6,310 | ||||||||||||
Total cash equivalents | 6,310 | — | — | 6,310 | ||||||||||||
Total cash and cash equivalents | $ | 34,200 | $ | — | $ | — | $ | 34,200 | ||||||||
Short-term investments: | ||||||||||||||||
Corporate notes and obligations | 2,773 | — | (7 | ) | 2,766 | |||||||||||
Total short-term investments | $ | 2,773 | $ | — | $ | (7 | ) | $ | 2,766 | |||||||
49
For investments in securities classified as available-for-sale, market value and the amortized cost of debt securities have been classified in accordance with the following maturity groupings based on the contractual maturities of those securities as of December 31, 2014 (in thousands):
Contractual maturity | Amortized Cost | Estimated Fair value | ||||||
Less than 1 year | $ | 1,956 | $ | 1,954 | ||||
Between 1 and 2 years | 817 | 812 | ||||||
Total | $ | 2,773 | $ | 2,766 | ||||
50
The components of the Company's marketable debt securities classified as available-for-sale were as follows for December 31, 2013 (in thousands):
December 31, 2013 | Amortized Cost | Gross Unrealized Gains | Gross Unrealized Losses | Estimated Fair value | ||||||||||||
Cash | $ | 21,989 | $ | — | $ | — | $ | 21,989 | ||||||||
Cash equivalents: | ||||||||||||||||
Money market funds | 6,306 | — | — | 6,306 | ||||||||||||
Total cash equivalents | 6,306 | — | — | 6,306 | ||||||||||||
Total cash and cash equivalents | $ | 28,295 | $ | — | $ | — | $ | 28,295 | ||||||||
Short-term investments: | ||||||||||||||||
U.S. government and agency obligations | 6,115 | — | — | 6,115 | ||||||||||||
Corporate notes and obligations | 1,751 | — | — | 1,751 | ||||||||||||
Total short-term investments | $ | 7,866 | $ | — | $ | — | $ | 7,866 | ||||||||
For investments in securities classified as available-for-sale, estimated fair value and the amortized cost of debt securities have been classified in accordance with the following maturity groupings based on the contractual maturities of those securities as of December 31, 2013 (in thousands):
Contractual maturity | Amortized Cost | Estimated Fair value | ||||||
Less than 1 year | $ | 5,066 | $ | 5,066 | ||||
Between 1 and 2 years | 2,800 | 2,800 | ||||||
Total | $ | 7,866 | $ | 7,866 | ||||
The Company had no realized losses on sales of its investments during the years ended December 31, 2014, 2013, and 2012, respectively. The Company had proceeds, net of purchases of investments, of $5.1 million and $4.8 million from maturities and sales of investments for 2014 and 2013, respectively.
The short-term investments in government obligations or highly rated credit securities generally have minor to moderate fluctuations in the fair values from period to period. The Company monitors credit ratings, downgrades and significant events surrounding these securities so as to assess if any of the impairments will be considered other-than-temporary. The Company did not identify any government obligations or highly rated credit securities held as of December 31, 2014 and 2013 for which the fair value declined significantly below amortized cost and were considered other-than-temporary impairments.
Note 6—Fair Value Measurements
The Company measures financial assets at fair value on an ongoing basis. The estimated fair value of the Company's financial assets was determined using the following inputs at December 31, 2014 and 2013 (in thousands):
Fair Value Measurements at Reporting Date Using | ||||||||||||||||
December 31, 2014 | Total | Quoted Prices in Active Markets for Identical Assets (Level 1) | Significant Other Observable Inputs (Level 2) | Significant Unobservable Inputs (Level 3) | ||||||||||||
Assets: | ||||||||||||||||
Money market funds (1) | $ | 6,310 | $ | 6,310 | $ | — | $ | — | ||||||||
Corporate notes and obligations (2) | 2,766 | — | 2,766 | — | ||||||||||||
Total | $ | 9,076 | $ | 6,310 | $ | 2,766 | $ | — | ||||||||
_______________________________________________________________________________
(1) | Included in cash and cash equivalents on the consolidated balance sheet. |
(2) | Included in short-term investments on the consolidated balance sheet. |
51
Fair Value Measurements at Reporting Date Using | ||||||||||||||||
December 31, 2013 | Total | Quoted Prices in Active Markets for Identical Assets (Level 1) | Significant Other Observable Inputs (Level 2) | Significant Unobservable Inputs (Level 3) | ||||||||||||
Assets: | ||||||||||||||||
Money market funds(1) | $ | 6,306 | $ | 6,306 | $ | — | $ | — | ||||||||
Corporate notes and obligations(2) | 6,115 | — | 6,115 | — | ||||||||||||
U.S. government and agency obligations(2) | 1,751 | — | 1,751 | — | ||||||||||||
Total | $ | 14,172 | $ | 6,306 | $ | 7,866 | $ | — | ||||||||
_______________________________________________________________________________
(1) | Included in cash and cash equivalents on the consolidated balance sheet. |
(2) | Included in short-term investments on the consolidated balance sheet. |
During 2014 and 2013 the Company had no Level 3 instruments.
Valuation of Investments
Level 1 and Level 2
The Company's available-for-sale securities include money market funds, U.S. Treasury bills, commercial paper, corporate notes and obligations, and U.S. government and agency obligations. The Company values these securities using a pricing matrix from a pricing service provider, who may use quoted prices in active markets for identical assets (Level 1 inputs) or inputs other than quoted prices that are observable either directly or indirectly (Level 2 inputs). The Company classifies all of its available-for-sale securities, except for money market funds and U.S. Treasury, as having Level 2 inputs. The Company validates the estimated fair value of certain securities from a pricing service provider on a quarterly basis. The valuation techniques used to measure the fair value of the financial instruments having Level 2 inputs, all of which have counterparties with high credit ratings, were derived from the following: non-binding market consensus prices that are corroborated by observable market data, quoted market prices for similar instruments or pricing models, with all significant inputs derived from or corroborated by observable market data.
Level 3
The Company did not have any transfers between Level 1, Level 2 and Level 3 fair value measurements during the year ended December 31, 2014 as there were no changes in the composition in Level 1, 2 or 3.
Note 7—Balance Sheet Components
Property and equipment consisted of the following (in thousands):
Estimated Useful Life | As of December 31, | ||||||||
2014 | 2013 | ||||||||
Equipment | 3 years | $ | 24,189 | $ | 16,616 | ||||
Purchased software | 5 years | 6,784 | 6,648 | ||||||
Furniture and fixtures | 3 years | 1,772 | 1,612 | ||||||
Leasehold improvements | Lease term up to 5 years | 1,947 | 1,872 | ||||||
Construction in progress | 3,724 | 72 | |||||||
Property and equipment, gross | 38,416 | 26,820 | |||||||
Less: Accumulated depreciation | 19,661 | 15,469 | |||||||
Property and equipment, net | $ | 18,755 | $ | 11,351 | |||||
Depreciation expense for 2014, 2013 and 2012 was $4.8 million, $4.5 million and $3.1 million, respectively.
In 2014, the Company improved its data center and incurred equipment costs. In addition, the Company moved its headquarters from Pleasanton, California to Dublin, California in February 2015 and incurred construction in progress costs related to furniture, fixtures and leasehold improvements.
Property and equipment includes assets that were acquired under capital leases of $6.9 million and $7.3 million for the years ended December 31, 2014 and 2013, respectively. Accumulated amortization relating to these assets acquired under capital leases were $4.3 million and $3.5 million for the years ended December 31, 2014 and 2013, respectively. Amortization expense for these assets have been included in depreciation expense.
52
Total prepaid and other current assets consisted of the following (in thousands):
As of December 31, | |||||||
2014 | 2013 | ||||||
Foreign withholding tax | $ | 177 | $ | 403 | |||
Convertible debt issuance costs, current portion | — | 129 | |||||
Deferred commissions | 4,215 | 3,381 | |||||
Prepaid expenses | 5,856 | 1,945 | |||||
Other current assets | 136 | 374 | |||||
Total prepaid and other current assets | $ | 10,384 | $ | 6,232 | |||
Accrued payroll and related expenses consisted of the following (in thousands):
As of December 31, | |||||||
2014 | 2013 | ||||||
Vacation accrual | $ | 2,793 | $ | 2,139 | |||
Commissions | 2,387 | 2,177 | |||||
Bonus | 1,628 | 1,262 | |||||
ESPP | 966 | 686 | |||||
Severance liability | — | 252 | |||||
Accrued payroll related expenses | 1,277 | 861 | |||||
Total accrued payroll related expenses | $ | 9,051 | $ | 7,377 | |||
Accrued expenses consisted of the following (in thousands):
As of December 31, | |||||||
2014 | 2013 | ||||||
Sales tax payable | $ | 733 | $ | 1,099 | |||
Income taxes payable | 125 | 87 | |||||
Restructuring facility liability | 148 | 98 | |||||
Versata settlement | 1,963 | — | |||||
Holdback payable | 1,922 | — | |||||
Customer payments | 998 | 438 | |||||
Equipment financing arrangement | 3,775 | — | |||||
Accrued expenses | 7,204 | 3,673 | |||||
Total accrued expenses | $ | 16,868 | $ | 5,395 | |||
Note 8—Convertible Notes
The Convertible Notes contain an optional redemption feature which allows the Company, any time after June 6, 2014, to redeem all or part of the Convertible Notes for cash if the last reported sale price per share of common stock (as defined below) had been at least 130% of the conversion price then in effect for at least 20 trading days during any 30 consecutive trading-day period ending within 5 trading days prior to the date on which the Company provides notice of redemption. The redemption price would be 100% of the principal amount of the notes being redeemed, plus accrued and unpaid interest.
During 2014, the remaining aggregate principal amount of $14.2 million of the Company's 4.75% Convertible Senior Notes (“Convertible Notes”) were converted into 1,840,770 shares of common stock. The Company paid accrued interest of $0.3 million and reclassified $0.3 million of deferred debt issuance costs to additional paid-in capital in connection with the conversion of the Convertible Notes. As of December 31, 2014, the Company had no outstanding Convertible Notes or related deferred debt issuance costs.
53
During the fourth quarter of 2013, the Company entered into agreements with three existing holders of its Convertible Notes pursuant to which such holders converted $45.0 million aggregate principal amount of the Convertible Notes into 5,837,015 shares of the Company’s common stock. In addition to issuing the requisite number of shares of the Company’s common stock pursuant to the terms of the Convertible Notes, the Company also paid accrued interest of $0.3 million, associated broker cost, cash and stock premium of $4.8 million. The cash and stock premium recognized as Debt Conversion Expense on the Consolidated Statement of Comprehensive Loss for the twelve months ended December 31, 2013. Additionally, in 2013 the Company reclassified $1.0 million of deferred debt issuance costs to additional paid-in capital in connection with the conversion of the Convertible Notes. The current balance of the debt issuance costs associated with the issuance of the Convertible Notes was recorded within prepaid and other current assets, and the non-current balance was recorded within deposits and other assets, and has been amortized to interest expense over the terms of the Convertible Notes. As of December 31, 2013, $0.1 million of the debt issuance costs were included in prepaid and other current assets, with the remaining amount of $0.2 million recorded in deposits and other.
Note 9—Contractual Obligations, Commitments and Contingencies
Contractual Obligations and Commitments
For each of the next five years and beyond, the Company has the following contractual obligations, long-term operating and capital lease obligations and unconditional purchase commitments (in thousands):
Settlement Payable (1) | Unconditional purchase commitments (2) (3) (4) | Operating lease commitments (5) | Capital lease obligations (6) | |||||||||||||||||
Principal | Interest | |||||||||||||||||||
Year Ending December 31: | ||||||||||||||||||||
2015 | $ | 1,963 | $ | 37 | $ | 9,271 | $ | 694 | $ | 1,011 | ||||||||||
2016 | 1,900 | 100 | 223 | 2,323 | — | |||||||||||||||
2017 | 466 | 34 | — | 2,266 | — | |||||||||||||||
2018 | — | — | — | 2,185 | — | |||||||||||||||
2019 | — | — | — | 2,024 | — | |||||||||||||||
2020 and beyond | — | — | — | 5,067 | — | |||||||||||||||
Future minimum payments | $ | 4,329 | $ | 171 | $ | 9,494 | $ | 14,559 | 1,011 | |||||||||||
Less: amount representing interest | (10 | ) | ||||||||||||||||||
Present value of capital lease obligations | $ | 1,001 | ||||||||||||||||||
(1) | In November 2014, the Company entered into a settlement agreement with Versata and agreed to make payments of $0.5 million starting on January 31, 2015 and every three months thereafter to January 2017. |
(2) Unconditional purchase commitments includes the financing arrangement that the Company entered into in 2014, for the purchase of storage equipment, primarily for the Company's data centers. The principal amount financed is $3.8 million and is payable in two installments of $2.6 million and $1.2 million in three months and one year, respectively, from November 2014.
(3) | Unconditional purchase commitments includes indemnity holdback payables for Clicktools Ltd. and LeadRocket, Inc. |
(4) Unconditional purchase commitments includes $2.7 million for leasehold improvements for the Company's headquarters.
(5) | The Company has facilities under several non-cancellable operating lease agreements that expire at various dates through 2018. The Company's rent expense for the years ended December 31, 2014, 2013 and 2012 was $2.1 million, $1.9 million and $1.5 million, respectively. |
(6) | The Company entered into non-cancellable capital leases with various expiration dates. |
(7) | The above table does not include the Wells Fargo Revolver, because the Company was unable to make a reasonably reliable estimate of the amount and period in which the Revolver will be paid. |
Included in non-current deposits and other assets in the consolidated balance sheets at December 31, 2014 and 2013 is restricted cash and rental deposits totaling $0.2 million and $0.5 million, respectively,related to security deposits on leased facilities and a customer letter of credit. The restricted cash represents investments in certificates of deposit and secured letters of credit required by landlords to meet security deposit requirements for the leased facilities.
As of December 31, 2014, the liability for uncertain tax positions was $3.0 million including interest. Due to the high degree of uncertainty regarding the timing of potential future cash flows associated with these liabilities, the Company is unable to make a reasonably reliable estimate of the amount and period in which these liabilities might be paid.
In October 2014, the Company entered into a sublease agreement ("Sublease") with Oracle America, Inc. (“Sublandlord”) for office space located at 4140 Dublin Boulevard, Dublin, California 94568 ("Subleased Premises"), to replace the Company’s current corporate headquarters.
The term of the Sublease commences in February 2015, when the Sublandlord delivers possession of the Subleased Premises to the Company and expires on May 15, 2022. Base rent will be abated from the commencement of the Sublease until November 30, 2015. Thereafter, monthly base rent will be $149,928 for 2015 and increase annually as set forth in the Sublease, up to $184,411 in 2022. The total cash obligation for base rent over the term of the Sublease is approximately $15.1 million, without rent abatement, and is included in the operating lease commitment in the table above. In addition to base rent, the Company will be required to pay its pro rata share of building operating costs including utilities, insurance, repair and personnel costs, along with real estate taxes in excess of the amounts for certain base years.
54
Letter of Credit
The Company obtained a $0.2 million letter of credit in August 2014 for its leased space in Pleasanton, California. The letter of credit will expire on August 31, 2015.
The Company obtained a $1.1 million letter of credit in October 2014 for its leased space in Dublin, California. The letter of credit will expire on October 1, 2015.
Warranties and Indemnification
The Company generally warrants that its software will perform to standard documentation. Under the Company's standard warranty, should a software product not perform as specified in the documentation within the warranty period, it will repair or replace the software or refund the license fee paid. To date, the Company has not incurred any costs related to warranty obligations for its software.
The Company's product license and on-demand agreements typically include a limited indemnification provision for claims by third parties relating to its intellectual property. To date, the Company has not incurred and has not accrued for any costs related to such indemnification provisions.
Intellectual Property Litigation
Versata Software, Inc., Versata Development Group, Inc. and Versata Inc. v. Callidus Software, Inc - Settled
On July 19, 2012, Versata Software, Inc. and Versata Development Group, Inc. (collectively, “Versata”) filed suit against the Company in the United States District Court for the District of Delaware (“Delaware District Court”). The suit asserted that the Company infringed U.S. Patent Nos. 7,904,326, 7,908,304 and 7,958,024. On May 30, 2013, the Company answered the complaint and filed a counterclaim in the Delaware District Court. The Company's counterclaim asserted that Versata infringed U.S. Patent Nos. 6,269,355, 6,850,924 and 6,473,748. On August 30, 2013, the Company filed petitions with the United States Patent and Trademark Office Patent Trial and Appeal Board (“PTAB”) for covered business method (“CBM”) patent review of U.S. Patent Nos. 7,904,326, 7,908,304 and 7,958,024, which Versata filed responses to on December 12, 2013. The Company also filed a motion with the Delaware District Court on August 30, 2013 to stay the litigation pending completion of the patent review proceedings with the PTAB (“Motion to Stay”). On January 8, 2014, the Company was granted leave by the Delaware District Court to add Versata Inc. (included in the above definition of “Versata”) as a counterclaim defendant. On March 4, 2014, the PTAB instituted covered business method patent review of each of Versata’s patents, namely, U.S. Patent Nos. 7,904,326, 7,908,304 and 7,958,024, finding it more likely than not that the Company would prevail in establishing that the challenged claims were not patentable. After requesting the PTAB to reconsider its decision to institute, which was denied, Versata filed a petition for writ of mandamus with the Court of Appeals for the Federal Circuit (“CAFC”) on April 11, 2014 asking that Court to deny institution of CBM patent review by the PTAB. The CAFC denied Versata’s petition for writ of mandamus on May 5, 2014. On April 17, 2014, the Company filed additional petitions with the PTAB for CBM patent review to address all of the remaining claims not previously covered in the prior petitions with respect to U.S Patent Nos. 7,908,304 and 7,958,024. On May 8, 2014, the Delaware District Court: (i) granted our Motion to Stay in part with respect to U.S. Patent No. 7,904,326, and (ii) denied the Company's Motion to Stay in part with respect to U.S. Patent Nos. 7,908,304 and 7,958,024. On May 8, 2014, the Company appealed to the CAFC the Delaware District Court’s denial of the Motion to Stay with respect to U.S. Patent Nos. 7,908,304 and 7,958,024. On October 2, 2014, the PTAB instituted covered business method patent review of the remaining claims covered in the second set of petitions for U.S Patent Nos. 7,908,304 and 7,958,024. On October 21, 2014, the Company engaged in a mediation with Versata and on November 13, 2014, entered into an agreement with Versata to settle and dismiss the pending district court litigation and patent office proceedings, to extend patent cross-licenses and covenants not to sue to one another, and the Company was appointed as an authorized reseller of certain Versata products. Under the agreement, each party covenanted not to sue the other (and its related entities) for infringement of any patents now owned (including pending patents) or later acquired by either party. In addition, each party granted to the other a fully paid-up, irrevocable, nonexclusive, worldwide license to certain patents (including the patents asserted in the pending district court litigation) for specified products of each party. The agreement also contained a release for any past infringement or claim between the parties and dismissal of the civil pending in the Delaware District Court, as well as the five covered business method patent review proceedings then-pending before the PTAB. Pursuant to the agreement, the Company agreed to pay to Versata $4.5 million in nine equal quarterly installments, commencing on January 31, 2015. The fair value of these payments was $4.3 million, of which the Company recognized a charge to earnings for $2.9 million in 2014 and capitalized $1.4 million for the value of the patent license. The $1.4 million will be amortized to expense over the average life span of the associated patents of approximately 9.5 years. The difference between the installment payment and the fair value will be charged to interest as incurred.
Callidus Software, Inc. v. Xactly Corporation - Settled
On August 31, 2012, the Company filed suit against Xactly Corporation (“Xactly”) in the United States District Court for the Central District of California. The suit alleged that Xactly infringed U.S. Patents 8,046,387 and 7,774,378. On October 24, 2012, the Company amended its complaint to add Xactly's President and Chief Executive Officer as a defendant and to add claims for trademark infringement, false advertising, false and misleading advertising, trade libel, defamation, intentional interference with prospective economic advantage, intentional interference with contractual relations, breach of contract and unfair competition, in addition to patent infringement. On January 28, 2013, the Company further amended its complaint to allege that Xactly also infringed U.S. Patent 6,473,748 and dismissed its intentional interference with contractual relations claim. On March 14, 2013, the case was transferred to the United States District Court in the Northern District of California. On May 31, 2013, the Company and Xactly entered into a stipulated dismissal of the Company's trademark infringement claim whereby Xactly agreed that it would not use the Company's trademarks-in-suit in certain of Xactly's marketing and advertising activities going forward. On November 25, 2013, Callidus, Xactly and Xactly's President and Chief Executive Officer entered into a Settlement, Release, and License Agreement that, among other things, included an agreement by Xactly to pay the Company $2.0
55
million in license fee, which will be paid in four equal annual installments of $0.5 million beginning November 2013. Upon receipt of installment payments, the Company will record the amount under operating expenses as an offset to legal fees.
TQP Development, LLC v. Callidus Software, Inc. - Settled
On December 14, 2012, TQP Development, LLC (“TQP”) filed suit against Callidus in the United States District Court for the Eastern District of Texas Marshall Division (“Texas District Court”). The suit asserted that Callidus infringed U.S. Patent No. 5,412,730. The Company filed a petition with the PTAB on October 11, 2013 for covered business method patent review of U.S. Patent No. 5,412,730. On December 2, 2013, the Company entered into a Settlement Agreement with TQP for no monetary consideration. Pursuant to the Settlement Agreement, 1) TQP dismissed, with prejudice, its outstanding suit against the Company in the Texas District Court on December 4, 2013, and 2) the PTAB accepted the parties’ joint motion to terminate the covered business method patent review proceeding on December 11, 2013.
Other matters
In addition to the above litigation matters, the Company from time to time is a party to other various litigation and customer disputes incidental to the conduct of its business. At the present time, the Company believes that none of these matters are likely to have a material adverse effect on the Company's future financial results.
The Company records a liability when it is both probable that a liability has been incurred and the amount of the loss can be reasonably estimated. The Company reviews the need for any such liability on a quarterly basis and records any necessary adjustments to reflect the effect of ongoing negotiations, contract disputes, settlements, rulings, advice of legal counsel, and other information and events pertaining to a particular case in the period they become known. At December 31, 2014, the Company has not recorded any such liabilities in accordance with accounting for contingencies. However, litigation is subject to inherent uncertainties and the Company's view on these matters may change in the future.
Note 10—Revolving Line of Credit
In May 2014, the Company entered into a credit agreement with Wells Fargo Bank, National Association ("Wells Fargo"), under which Wells Fargo agreed to make a revolving loan ("Revolver") to us in an amount not to exceed $10.0 million, with an accordion feature that allows us to increase the maximum borrowing amount by not less than $5.0 million and not more than $10.0 million. In September 2014, the Company increased the maximum borrowing amount to $15.0 million. The Revolver matures in May 2019.
Pursuant to the agreement, the Company is required to maintain a leverage ratio of 3.00:1.00 and a minimum liquidity of $7.5 million.
Outstanding borrowings under the Revolver bear interest, at the Company's option, at a base rate plus an applicable margin. The applicable margin ranges between 0.75% and 2.25% depending on the Company's leverage ratio. A fee of 0.25% per annum is payable with respect to the unused portion of the commitment. Interest is payable every three months. As of December 31, 2014 the Company had borrowed $10.5 million under the Revolver. The carrying value of total debt approximates fair market value. Interest rate at December 31, 2014 was 2%.
Note 11—Net Loss Per Share
Basic net loss per share is calculated by dividing net loss for the period by the weighted average common shares outstanding during the period. Diluted net loss per share is calculated by dividing the net loss for the period by the weighted average common shares outstanding, adjusted for all dilutive potential common shares, which includes shares issuable upon the conversion of the Convertible Notes, the exercise of outstanding common stock options, the release of restricted stock, and purchases of shares under the Employee Share Purchase Plan (ESPP) to the extent these shares are dilutive. For 2014, 2013 and 2012, the diluted net loss per share calculation was the same as the basic net loss per share calculation as all potential common shares were anti-dilutive.
Diluted net loss per share does not include the effect of the following potential weighted average common shares because to do so would be anti-dilutive for the periods presented (in thousands):
Years Ended December 31, | ||||||||
2014 | 2013 | 2012 | ||||||
Restricted stock | 2,379 | 1,918 | 3,543 | |||||
Stock options | 1,630 | 2,490 | 3,299 | |||||
ESPP | 39 | 42 | 67 | |||||
Convertible notes | 829 | 7,129 | 7,680 | |||||
Total | 4,877 | 11,579 | 14,589 | |||||
The weighted average exercise price of stock options excluded for 2014, 2013 and 2012 was $4.09, $4.42 and $4.74, respectively.
56
Note 12—Stock-Based Compensation
Stockholder-Approved Stock Option and Incentive Plans
In June 2013, the 2013 Stock Incentive Plan ("2013 Plan") became effective upon the approval of the Company's Board of Directors and stockholders, and as a result, the 2003 Stock Incentive Plan ("2003 Plan") was expired and replaced. All outstanding shares available for grant under the 2003 Plan expired upon the adoption of the 2013 Plan.
The Company was authorized to issue 3,469,500 shares of common stock under the 2013 Plan. Under the 2013 plan, the Company's Board of Directors (or an authorized subcommittee) may grant stock options or other types of stock awards, such as restricted stock, restricted stock units, stock bonus awards or stock appreciation rights. Incentive stock options may be granted only to the Company's employees. Nonstatutory stock options and other stock-based awards may be granted to employees, consultants or non-employee directors. These options vest as determined by the board of directors (or an authorized subcommittee), generally over four years. The restricted stock units also vest as determined by the board, generally over three years.
Shares Available for Grant
A summary of the Company's shares available for grant and the status of options and awards are as follows:
Years Ended December 31, | ||||||||
2014 | 2013 | 2012 | ||||||
(Number of Shares) | ||||||||
Beginning Available | 2,478,798 | 2,578,940 | 2,014,218 | |||||
Authorized | — | 3,469,500 | 1,756,431 | |||||
Granted | (1,913,499 | ) | (2,024,798 | ) | (2,519,851 | ) | ||
Cancelled | 383,549 | 1,335,591 | 1,328,142 | |||||
Expired | (178,337 | ) | (2,880,435 | ) | — | |||
Ending Available | 770,511 | 2,478,798 | 2,578,940 | |||||
Expense Summary
Stock-based compensation expenses of $11.8 million, $10.4 million and $13.7 million was recorded during the years ended December 31, 2014, 2013 and 2012, in the consolidated statement of comprehensive loss. The table below sets forth a summary of stock-based compensation expense for the years ended December 31, 2014, 2013 and 2012 (in thousands).
Years Ended December 31, | |||||||||||
2014 | 2013 | 2012 | |||||||||
Stock-based compensation: | |||||||||||
Stock Options | $ | 790 | $ | 866 | $ | 838 | |||||
Restricted Stock Units | |||||||||||
Performance-based Awards | 2,370 | 1,097 | 444 | ||||||||
Service-based Awards | 7,705 | 7,835 | 11,571 | ||||||||
ESPP | 948 | 597 | 802 | ||||||||
Total stock-based compensation | $ | 11,813 | $ | 10,395 | $ | 13,655 | |||||
The table below sets forth the functional classification of stock-based compensation expense for the years ended December 31, 2014, 2013 and 2012 (in thousands):
Years Ended December 31, | |||||||||||
2014 | 2013 | 2012 | |||||||||
Stock-based compensation: | |||||||||||
Cost of recurring revenue | $ | 911 | $ | 783 | $ | 1,550 | |||||
Cost of services and other revenue | 1,026 | 1,060 | 2,070 | ||||||||
Sales and marketing | 3,518 | 2,420 | 3,778 | ||||||||
Research and development | 2,012 | 1,797 | 1,782 | ||||||||
General and administrative | 4,346 | 4,335 | 4,475 | ||||||||
Total stock-based compensation | $ | 11,813 | $ | 10,395 | $ | 13,655 | |||||
57
Determination of Fair Value
The fair value of service-based awards is estimated based on the market value of the Company’s stock on the date of grant. A portion of the performance-based awards granted during 2014 are based on relative stockholder return and therefore are subject to a market condition. As a result, the fair value of performance awards is calculated using a Monte Carlo simulation model that estimates the distribution of the potential outcomes of the grants of performance awards based on simulated future index of the peer companies.
The fair value of each stock option is estimated on the date of grant and the fair value of each ESPP share is estimated on the beginning date of the offering period using the Black-Scholes-Merton valuation model and the assumptions noted in the following table.
Years Ended December 31, | |||||
2014 | 2013 | 2012 | |||
Stock Option Plans | |||||
Expected life (in years) | — | 5.0 to 6.1 | 5.0 to 6.0 | ||
Risk-free interest rate | — | 1.41% to 1.93% | 0.72% to 1.33% | ||
Volatility | — | 61% to 63% | 60% to 65% | ||
Dividend Yield | — | — | — | ||
Employee Stock Purchase Plan | |||||
Expected life (in years) | 0.5 to 1.0 | 0.5 to 1.0 | 0.5 to 1.0 | ||
Risk-free interest rate | 0.05% to 0.12% | 0.08% to 0.17% | 0.13% to 0.20% | ||
Volatility | 47% to 50% | 41% to 62% | 56% to 62% | ||
Dividend Yield | — | — | — | ||
Expected Dividend Yield—The Company has never paid dividends and do not expect to pay dividends.
Risk-Free Interest Rate—The risk-free interest rate was based on the implied yield currently available on U.S. Treasury zero-coupon issues with a remaining term equivalent to the expected term.
Expected Term—Expected term represents the period that the Company's stock-based awards are expected to be outstanding. The Company's assumptions about the expected term have been based on historical experience, giving consideration to the contractual terms of the stock-based awards, vesting schedules and expectations of future employee behavior as influenced by changes to the terms of its stock-based awards. The expected term for stock options was estimated using the simplified method allowed under SEC guidance.
Expected Volatility—Expected volatility is based on the historical volatility over the expected term.
Stock Options
As of December 31, 2014, the Company had $1.8 million of unrecognized compensation expense, net of forfeitures, which it expects to recognize over a weighted average period of 2.5 years. No stock options were granted during the year ended December 31, 2014. For the years ended December 31, 2013, the weighted-average fair value of stock options granted by the Company was $3.87 per share. The total intrinsic value of stock options exercised was $5.9 million, $6.2 million and $1.4 million for 2014, 2013 and 2012, respectively. The total cash received from employees as a result of stock option exercises was $2.9 million, $5.1 million and $3.7 million for 2014, 2013 and 2012, respectively.
58
Stock option activity is summarized below:
Number of Shares | Weighted Average Exercise Price | Weighted Average Remaining Contractual Term (Years) | Aggregate Intrinsic Value (in thousands) | |||||||||
Outstanding as of December 31, 2011 | 4,403,003 | $ | 4.71 | |||||||||
Granted | 120,200 | 5.86 | ||||||||||
Exercised | (714,820 | ) | 5.16 | $ | 1,358 | |||||||
Forfeited | (134,346 | ) | 3.52 | |||||||||
Expired | (638,555 | ) | 7.64 | |||||||||
Outstanding as of December 31, 2012 | 3,035,482 | 4.09 | ||||||||||
Granted | 815,500 | 6.79 | ||||||||||
Exercised | (1,427,456 | ) | 3.54 | 6,151 | ||||||||
Forfeited | (108,306 | ) | 5.10 | |||||||||
Expired | (367,006 | ) | 5.30 | |||||||||
Outstanding as of December 31, 2013 | 1,948,214 | 5.34 | ||||||||||
Granted | — | — | ||||||||||
Exercised | (701,220 | ) | 4.09 | 5,940 | ||||||||
Forfeited | (44,407 | ) | 7.40 | |||||||||
Expired | (26,626 | ) | 10.17 | |||||||||
Outstanding as of December 31, 2014 | 1,175,961 | $ | 5.89 | 5.99 | $ | 12,278 | ||||||
Vested and Expected to Vest as of December 31, 2014 | 1,100,528 | $ | 5.82 | 5.83 | $ | 11,566 | ||||||
Exercisable as of December 31, 2014 | 730,899 | $ | 5.33 | 4.60 | $ | 8,039 | ||||||
As of December 31, 2014, the range of exercise prices and weighted average remaining contractual life of outstanding options are as follows:
Options Outstanding | Options Exercisable | ||||||||||||||
Range of Exercise Prices | Number of Shares | Weighted Average Remaining Contractual Life (Years) | Weighted Average Exercise Price | Number of Shares | Weighted Average Exercise Price | ||||||||||
$3.11 - $4.14 | 133,132 | 0.53 | $ | 3.63 | 133,132 | $ | 3.63 | ||||||||
$4.15 - $4.15 | 140,000 | 0.92 | 4.15 | 140,000 | 4.15 | ||||||||||
$4.31 - $5.27 | 140,061 | 5.53 | 4.93 | 109,695 | 5.03 | ||||||||||
$5.70 - $5.70 | 60,000 | 1.42 | 5.70 | 60,000 | 5.70 | ||||||||||
$6.01 - $6.01 | 122,000 | 8.41 | 6.01 | 48,291 | 6.01 | ||||||||||
$6.25 - $6.42 | 80,700 | 8.37 | 6.26 | 79,900 | 6.26 | ||||||||||
$6.59 - $6.59 | 231,407 | 8.49 | 6.59 | 70,989 | 6.59 | ||||||||||
$6.67 - $6.74 | 42,334 | 8.50 | 6.67 | 14,604 | 6.67 | ||||||||||
$7.69 - $7.69 | 207,327 | 8.66 | 7.69 | 68,622 | 7.69 | ||||||||||
$9.17 - $10.35 | 19,000 | 8.80 | 9.98 | 5,666 | 9.96 | ||||||||||
$3.11 - $10.35 | 1,175,961 | 5.99 | $ | 5.89 | 730,899 | $ | 5.33 | ||||||||
59
Restricted Stock Units
As of December 31, 2014, the Company had $16.1 million of unrecognized compensation expense, net of forfeitures, which it expect to recognize over a weighted average period of 1.7 years.
Restricted stock unit activity is summarized below:
Number of Shares | Weighted Average Remaining Contractual Term (Years) | Aggregate Intrinsic Value (in thousands) | ||||||
Unreleased as of December 31, 2011 | 3,859,292 | |||||||
Granted | 2,399,651 | |||||||
Released | (2,597,880 | ) | ||||||
Forfeited | (551,380 | ) | ||||||
Unreleased as of December 31, 2012 | 3,109,683 | |||||||
Granted | 1,209,298 | |||||||
Released | (1,754,872 | ) | ||||||
Forfeited | (856,695 | ) | ||||||
Unreleased as of December 31, 2013 | 1,707,414 | |||||||
Granted | 1,913,499 | |||||||
Released | (736,269 | ) | ||||||
Forfeited | (183,607 | ) | ||||||
Unreleased as of December 31, 2014 | 2,701,037 | 1.02 | $ | 43,487 | ||||
Vested and Expected to Vest as of December 31, 2014 | 2,700,828 | 1.02 | $ | 40,169 | ||||
Restricted stock units granted to employees are not considered outstanding at the time of grant, as the holders of these units are not entitled to dividends and voting rights. Unvested restricted stock units are not considered outstanding in the computation of basic net loss per share.
Performance-based Awards
The Company includes performance-based award activity with restricted stock units.
In 2014 the Company granted performance-based awards with vesting contingent on absolute SaaS revenue growth over the three year period from 2014 to 2016, and the Company's relative total shareholder return over the three year period from 2014 through 2016 versus an index of 17 SaaS companies. In 2014, $1.9 million of expense, net of forfeiture, was recognized.
In 2013, the Company granted performance-based awards with vesting contingent on successful attainment of pre-set SaaS revenue growth and recurring revenue gross profit target. In 2014 $0.5 million expense, net of forfeiture, was recognized.
Employee Stock Purchase Plan
The Company's Employee Stock Purchase Plan (ESPP), which was adopted in 2003 and amended and restated in 2013, qualifies as an "employee stock purchase plan" under Section 423 of the Internal Revenue Code. The ESPP is designed to enable eligible employees to purchase shares of the Company's common stock at a discount on a periodic basis through payroll deductions. Each offering period under the ESPP covers 12 months and consists of two consecutive six-month purchase periods. The purchase price for shares of common stock purchased under the ESPP is 85% of the lesser of the fair market value of the Company's common stock on the first day of the applicable offering period and the fair market value of the Company's common stock on the last day of each purchase period. The Company issued approximately 319,000, 435,000 and 407,000 shares during the years ended December 31, 2014, 2013 and 2012 under the ESPP. The weighted-average fair value of stock purchase rights granted under the ESPP during 2014, 2013 and 2012 was $3.59 per share, $1.96 per share and $1.76 per share, respectively.
As of December 31, 2014, the Company had $0.5 million of unrecognized compensation expense related to ESPP subscriptions that will be recognized over 0.6 years.
60
Note 13—Stockholders' Equity
Preferred Stock
The Company's certificate of incorporation authorizes 5,000,000 shares of undesignated preferred stock with a par value of $0.001, of which no shares were outstanding as of December 31, 2014 and 2013.
Note 14—Income Taxes
The following is a geographical breakdown of consolidated loss before income taxes by income tax jurisdiction (in thousands):
2014 | 2013 | 2012 | |||||||||
United States | $ | (11,557 | ) | $ | (20,675 | ) | $ | (27,796 | ) | ||
Foreign | 1,008 | 1,319 | 486 | ||||||||
Total | $ | (10,549 | ) | $ | (19,356 | ) | $ | (27,310 | ) | ||
The provision for income taxes for 2014, 2013 and 2012 consists of the following (in thousands):
2014 | 2013 | 2012 | |||||||||
Current: | |||||||||||
Federal | $ | (25 | ) | $ | — | $ | 4 | ||||
State | 3 | — | — | ||||||||
Foreign | 1,138 | 1,815 | 559 | ||||||||
Deferred: | |||||||||||
Federal | 78 | 159 | (185 | ) | |||||||
State | (89 | ) | — | (22 | ) | ||||||
Foreign | (93 | ) | 81 | 32 | |||||||
Total provision for income taxes | $ | 1,012 | $ | 2,055 | $ | 388 | |||||
The decrease in provision for income taxes in 2014 from 2013 was primarily due to a net decrease in foreign withholding taxes offset by an increase in income taxes in foreign jurisdiction.
The provision for income taxes differs from the expected tax benefit computed by applying the statutory federal income tax rates to consolidated loss before income taxes as follows (in thousands):
Year Ended December 31, | |||||||||||
2014 | 2013 | 2012 | |||||||||
Federal tax at statutory rate | $ | (3,587 | ) | $ | (6,581 | ) | $ | (9,286 | ) | ||
State taxes, net of benefit | 3 | — | — | ||||||||
Non-deductible expenses | 453 | 1,248 | 2,416 | ||||||||
Foreign taxes | 703 | 1,447 | 427 | ||||||||
Current year net operating losses and other deferred tax assets for which no benefit has been recognized | 4,828 | 7,320 | 7,181 | ||||||||
Research and experimentation credit | (1,239 | ) | (1,379 | ) | — | ||||||
Tax benefit due to the recognition of acquired deferred tax liabilities | (149 | ) | — | (350 | ) | ||||||
Total provision for income taxes | $ | 1,012 | $ | 2,055 | $ | 388 | |||||
Deferred income taxes reflect the net tax effect of temporary differences between the carrying amount of assets and liabilities for financial reporting purposes and the amount used for income tax purposes. Net deferred tax assets consist of the following (in thousands):
61
As of December 31, | |||||||
2014 | 2013 | ||||||
Deferred tax assets | |||||||
Net operating loss carryforwards | $ | 54,712 | $ | 53,902 | |||
Accrued expenses | 5,420 | 2,161 | |||||
Unrealized gain/loss on investments | 916 | 915 | |||||
Research and experimentation credit carryforwards | 12,609 | 10,884 | |||||
Capitalized research and experimentation costs | 14,072 | 18,100 | |||||
Deferred stock compensation | 3,956 | 2,223 | |||||
Gross deferred tax assets | 91,685 | 88,185 | |||||
Less valuation allowance | (90,598 | ) | (86,604 | ) | |||
Total deferred tax assets, net of valuation allowance | 1,087 | 1,581 | |||||
Deferred tax liabilities | |||||||
Property and equipment and intangibles | (1,699 | ) | (1,602 | ) | |||
Goodwill | (1,024 | ) | (887 | ) | |||
Net deferred tax liabilities | $ | (1,636 | ) | $ | (908 | ) | |
In assessing the realizability of deferred tax assets, management considers whether it is more likely than not that some portion or all of the deferred tax assets will be realized. The ultimate realization of deferred tax assets is dependent upon the generation of future taxable income during the periods in which those temporary differences become deductible. Based on the level of historical taxable income and projections for future taxable income over the period in which the temporary differences are deductible, the Company recorded a valuation allowance against the deferred tax assets for which it believes it is not more likely than not to be realized. As of December 31, 2014 and 2013, a valuation allowance has been recorded on all deferred tax assets, except the deferred tax assets related to two of its foreign subsidiaries, based on the analysis of profitability for those subsidiaries.
The net changes for valuation allowance for years ended December 31, 2014 and 2013 were an increase of $4.0 million and $7.8 million, respectively.
The Company recorded approximately $0.9 million and no additional net deferred tax liabilities related to the various acquisitions completed during 2014 and 2013, respectively. The additional deferred tax liabilities create a new source of taxable income, thereby requiring the Company to release a portion of its deferred tax asset valuation allowance with a related reduction in income tax expense.
As of December 31, 2014, the Company had net operating loss carryforwards for federal and California income tax purposes of $169.0 million and $38.0 million, respectively, available to reduce future income subject to income taxes. The federal net operating loss carryforwards, if not utilized, will expire over 20 years beginning in 2017. The California net operating loss carryforward, began to expire in 2014.
Not included in the deferred income tax asset balance at December 31, 2014 is approximately $8.9 million, which pertains to certain net operating loss carryforwards resulting from the exercise of employee stock options. When recognized, the tax benefit of these losses will be accounted for as a credit to additional paid-in capital rather than a reduction of the income tax provision.
The Company also has research credit carryforwards for federal and California income tax purposes of approximately $8.4 million and $8.7 million, respectively, available to reduce future income taxes. The federal research credit carryforward, if not utilized, will expire over 20 years beginning in 2019. The California research credit carries forward indefinitely.
Federal and California tax laws impose restrictions on the utilization of net operating loss and tax credit carryforwards in the event of an ownership change, as defined in Section 382 of the Internal Revenue Code. The Company's ability to utilize its net operating loss and tax credit carryforwards are subject to limitations under these provisions.
The Company has not provided for federal income taxes on all of the non-U.S. subsidiaries' undistributed earnings as of December 31, 2014 of $2.7 million, because such earnings are intended to be indefinitely reinvested. The residual U.S. tax liability, if such amounts were remitted, would be nominal.
62
The activity related to the Company's unrecognized tax benefits is set forth below (in thousands):
Amount | |||
Balance at January 1, 2013 | $ | 2,478 | |
Increases related to prior year tax positions | 175 | ||
Increases related to current year tax positions | 222 | ||
Reductions to unrecognized tax benefits as a result of a lapse of applicable statute of limitations | (32 | ) | |
Balance at December 31, 2013 (1) | 2,843 | ||
Increases related to prior year tax positions | (44 | ) | |
Increases related to current year tax positions | 270 | ||
Reductions to unrecognized tax benefits as a result of a lapse of applicable statute of limitations | (32 | ) | |
Balance at December 31, 2014 (2) | $ | 3,037 | |
(1) $2.6 million million of the unrecognized tax benefits reduced deferred tax assets and $0.3 million was included in accrued expenses on the consolidated balance sheet.
(2) $2.7 million of the unrecognized tax benefits reduced deferred tax assets and $0.3 million was included in accrued expenses on the consolidated balance sheet.
If recognized, $0.3 million of the unrecognized tax benefits at December 31, 2014 would reduce the Company's annual effective tax rate. The Company also accrued potential penalties and interest of $0.1 million related to these unrecognized tax benefits during 2014, and in total, as of December 31, 2014, the Company recorded a liability for potential penalties and interest of $0.2 million. The Company recognized interest and penalties related to unrecognized tax benefits within the income tax expense line in the accompanying consolidated statement of comprehensive loss. Accrued interest and penalties are included within the related tax liability line in the consolidated balance sheet. The Company classified the unrecognized tax benefits as a noncurrent liability, as the Company does not expect any payment of incremental taxes over the next 12 months. The Company also does not expect its unrecognized tax benefits to change significantly over the next 12 months.
The Company files U.S., state, and foreign income tax returns in jurisdictions with varying statutes of limitations. All tax years generally remain subject to examination by federal and most state tax authorities. In foreign jurisdictions, the 2004 through 2014 tax years generally remain subject to examination by their respective tax authorities.
Note 15—Employee Benefit Plan
In 1999, the Company established a 401(k) tax-deferred savings plan ("401(k) plan"), whereby eligible employees may contribute a percentage of their eligible compensation up to the maximum allowed under IRS rules. The Company's contributions are discretionary, and no such contributions have been made since the inception of this plan up until December 31, 2011. Beginning January 1, 2012, the Company contributed 50% of each dollar that an employee contributed to their 401(k) plan up to a maximum of $1,000 annually, and the vesting of the Company's contributions is based on years of service. During the years ended December 31, 2014 and 2013, the Company recognized approximately $272,000 and $220,000, respectively in expense related to the 401(k) plan match.
63
Note 16—Segment, Geographic and Customer Information
The accounting principles guiding disclosures about segments of an enterprise and related information establishes standards for the reporting by business enterprises of information about operating segments, products and services, geographic areas, and major customers. The method of determining which information is reported is based on the way that management organizes the operating segments within the Company for making operational decisions and assessments of financial performance. The Company's chief operating decision maker is considered to be the Company's chief executive officer (CEO). The CEO reviews financial information presented on a consolidated basis for purposes of making operating decisions and assessing financial performance. By this definition, the Company operates in one reportable segment, which is the development, marketing and sale of enterprise software and related services.
The following table summarizes revenue for the years ended December 31, 2014, 2013 and 2012 by geographic areas (in thousands):
2014 | 2013 | 2012 | |||||||||
United States | $ | 106,194 | $ | 88,684 | $ | 74,477 | |||||
EMEA | 15,162 | 12,241 | 11,578 | ||||||||
Asia Pacific | 8,400 | 5,379 | 4,943 | ||||||||
Other | 6,862 | 6,033 | 3,954 | ||||||||
$ | 136,618 | $ | 112,337 | $ | 94,952 | ||||||
No individual country, outside of the U.S. accounted for more than 10% of the Company's property, plant and equipment as of December 31, 2014 and 2013.
As of December 31, 2014, the Company's goodwill balance was $47.0 million, of which $11.4 million was located in U.K. (EMEA) and intangible asset balance of $17.8 million, and $2.5 million was located in U.K. (EMEA). No individual country, outside the U.S. accounted for more than 10% of goodwill and intangible asset balance as of December 31, 2013.
In 2014, 2013 and 2012, no customer accounted for more than 10% of total revenue.
Note 17—Related Party Transactions
In June 2013, in the normal course of business, the Company entered into agreements with Lithium Technologies, Inc. (“Lithium”). The Chief Financial Officer of Lithium is a member of the Company's Board of Directors. The Company purchased an annual subscription for Lithium's social media management solutions in the amount of $120,000 and renewed in 2014. During 2013 and 2014, the Company paid the entire annual fee of $120,000 in each year, for Lithium’s social media management solution. For the 2013 fee, $62,000 was expensed in 2013 and $58,000 was expensed in 2014. For the 2014 fee, $62,000 was expensed in 2014 and $58,000 was included in prepaid expenses in current assets, as of December 31, 2014. In 2013, Lithium entered into a two-year web hosting agreement with the Company in the amount of $113,000. During 2013, the Company recognized approximately $52,000 in revenue under this agreement. In addition, during 2013, the Company entered into an agreement with Lithium in the amount of $143,550 under which it provided professional services, of which approximately $120,000 was recognized in 2013 and the remaining balance of $23,550 was recognized in 2014.
In 2014, the Company purchased a one-time annual subscription from Lithium for Social Success Services for $40,000, which amount was paid in full in October 2014. As of December 31, 2014, $17,000 of this amount was expensed and $23,000 was included in prepaid expenses. Also in 2014, the Company purchased an annual subscription from Lithium for Community Administration for $45,000, which was paid in full in January 2015.
Webcom Inc., a wholly-owned subsidiary of the Company, uses the services of a third-party vendor to perform product modeling and maintenance of certain equipment. The third-party vendor is owned by a relative of Webcom's senior management. For the year ended December 31, 2014 and 2013, the Company paid approximately $149,000 and $143,000, respectively, to this vendor.
64
Supplementary Data (unaudited)
The following tables set forth unaudited supplementary quarterly financial data for the two year period ended December 31, 2014. In management's opinion, the unaudited data has been prepared on the same basis as the audited information and includes all adjustments (consisting only of normal recurring adjustments) necessary for a fair presentation of the data for the periods presented.
First Quarter | Second Quarter | Third Quarter | Fourth Quarter | Total | |||||||||||||||
Year ended December 31, 2014 | |||||||||||||||||||
Total revenue | $ | 30,977 | $ | 32,515 | $ | 35,000 | $ | 38,126 | $ | 136,618 | |||||||||
Gross profit | $ | 18,579 | $ | 19,385 | $ | 19,354 | $ | 23,262 | $ | 80,580 | |||||||||
Net income (loss) | $ | (2,467 | ) | $ | 250 | $ | (5,235 | ) | $ | (4,109 | ) | $ | (11,561 | ) | |||||
Basic and diluted net income (loss) per share | $ | (0.05 | ) | $ | — | $ | (0.11 | ) | $ | (0.08 | ) | $ | (0.24 | ) | |||||
Weighted average common shares (basic) | 45,944 | 46,648 | 48,564 | 48,987 | 47,547 | ||||||||||||||
Weighted average common shares (diluted) | 45,944 | 48,061 | 48,564 | 48,987 | 47,547 | ||||||||||||||
First Quarter | Second Quarter | Third Quarter | Fourth Quarter | Total | |||||||||||||||
Year ended December 31, 2013 | |||||||||||||||||||
Total revenue | $ | 25,542 | $ | 25,930 | $ | 30,678 | $ | 30,187 | $ | 112,337 | |||||||||
Gross profit | $ | 12,867 | $ | 14,260 | $ | 18,900 | $ | 18,521 | $ | 64,548 | |||||||||
Net loss | $ | (6,603 | ) | $ | (6,415 | ) | $ | (1,413 | ) | $ | (6,980 | ) | $ | (21,411 | ) | ||||
Basic and diluted net loss per share | $ | (0.18 | ) | $ | (0.17 | ) | $ | (0.04 | ) | $ | (0.17 | ) | $ | (0.55 | ) | ||||
Weighted average common shares (basic and diluted) | 37,139 | 37,813 | 38,648 | 41,778 | 38,858 | ||||||||||||||
Item 9. Changes in and Disagreements with Accountants on Accounting and Financial Disclosure
None.
Item 9A. Controls and Procedures
(a) Disclosure Controls and Procedures
Our Chief Executive Officer and our Chief Financial Officer, after evaluating the effectiveness of our "disclosure controls and procedures" (as defined in the Securities Exchange Act of 1934 (Exchange Act) Rules 13a-15(e) or 15d-15(e)) as of the end of the period covered by this annual report, have concluded that our disclosure controls and procedures are effective based on their evaluation of these controls and procedures required by paragraph (b) of Exchange Act Rules 13a-15 or 15d-15.
Our management, including our Chief Executive Officer and Chief Financial Officer, do not expect that our disclosure controls and procedures or our internal controls will prevent all errors and all fraud. A control system, no matter how well conceived and operated, can provide only reasonable, not absolute, assurance that the objectives of the control system are met. Further, the design of a control system must reflect the fact that there are resource constraints and the benefits of controls must be considered relative to their costs. Because of the inherent limitations in all control systems, no evaluation of controls can provide absolute assurance that all control issues and instances of fraud, if any, within our company have been detected.
(b) Management's Annual Report on Internal Control Over Financial Reporting
Our management is responsible for establishing and maintaining adequate internal control over financial reporting (as defined in Rule 13a-15(f) under the Securities Exchange Act of 1934, as amended). Our management assessed the effectiveness of our internal control over financial reporting as of December 31, 2014. In making this assessment, our management used the criteria set forth by the Committee of Sponsoring Organizations of the Treadway Commission ("COSO") in Internal Control—Integrated Framework (1992). Our management has concluded that, as of December 31, 2014, our internal control over financial reporting is effective based on these criteria. In addition, our independent registered public accounting firm has issued an attestation report on the Company's internal control over financial reporting as of the reporting date.
65
(c) Changes in Internal Control Over Financial Reporting
There were no changes in our internal control over financial reporting during the fourth quarter of 2014 that have materially affected, or are reasonably likely to materially affect, our internal control over financial reporting.
Item 9B. Other Information
None.
PART III
The information required by Part III of Form 10-K is incorporated by reference to our Proxy Statement for the 2015 annual meeting of stockholders to be filed with the Securities and Exchange Commission within 120 days of the fiscal year ended December 31, 2014.
PART IV
Item 15. Exhibits and Financial Statement Schedules
(a) Consolidated financial statements, consolidated financial statements schedule and exhibits
1. Consolidated financial statements. The consolidated financial statements as listed in the accompanying "Index to Consolidated Financial Information" are filed as part of this Annual Report on Form 10-K.
2. All schedules not listed in the accompanying index have been omitted as they are either not required or not applicable, or the required information is included in the consolidated financial statements or the notes thereto.
3. Exhibits. The exhibits listed in the accompanying Exhibit Index are filed or incorporated by reference as part of this Annual Report on Form 10-K.
66
EXHIBIT INDEX
Exhibit Number | Description | |
2.1 | Agreement, dated September 15, 2014, between the vendors set forth therein, Callidus Software Inc. and Dorset Acquisition Corp (incorporated by reference to Exhibit 2.1 to the Registrant’s Form 8-K filed with the Commission on September 17, 2014). | |
3.1 | Amended and Restated Certificate of Incorporation (incorporated by reference to Exhibit 3.1 to the Registrant's Registration Statement on Form S-1 (File No. 333-109059) filed with the Commission on September 23, 2003, and declared effective on November 19, 2003). | |
3.2 | Second Amended and Restated Bylaws (incorporated by reference to Exhibit 3.2 to the Registrant's Form 10-Q filed with the Commission on November 5, 2010) | |
4.1 | Specimen Stock Certificate (incorporated by reference to Exhibit 4.1 to Amendment No. 4, filed with the Commission on November 7, 2003, to the Registrant's Registration Statement on Form S-1 (File No. 333-109059) filed with the Commission on September 23, 2003, and declared effective on November 19, 2003) | |
10.1 | Office Lease Agreement between 6200 Stoneridge Mall Road Investors LLC and Callidus Software Inc. dated March 30, 2010 (incorporated by reference to Exhibit 10.25 to the Registrant's Form 10-Q filed with the Commission on May 7, 2010) | |
10.2 | Second Amendment to Office Lease Agreement between 6200 Stoneridge Mall Road Investors LLC and Callidus Software Inc. dated December 27, 2011 (incorporated by reference to Exhibit 10.2 to the Registrant's Form 10-K filed with the Commission on March 13, 2012) | |
10.3 | Third Amendment to Office Lease Agreement between 6200 Stoneridge Mall Road Investors LLC and Callidus Software Inc. dated October 1, 2014 (incorporated by reference to Exhibit 10.1 to the Registrant's Form 10-Q filed with the Commission on November 5, 2014) | |
#10.4 | Sublease between Oracle America, Inc. and Callidus Software Inc. dated October 3, 2014 | |
10.5+ | 1997 Stock Option Plan (incorporated by reference to Exhibit 10.6 to the Registrant's Registration Statement on Form S-1 (File No. 333-109059) filed with the Commission on September 23, 2003, and declared effective on November 19, 2003) | |
10.6+ | Amended and Restated 2003 Stock Incentive Plan (incorporated by reference to Exhibit 10.3.1 to the Company's Form 10-Q filed with the Commission on August 9, 2010) | |
10.7+ | Forms of Stock Option Agreement and Restricted Stock Unit Agreement under the 2003 Stock Incentive Plan (incorporated by reference to Exhibit 10.5 to the Registrant's Form 10-K filed with the Commission on March 10, 2014) | |
10.8+ | 2013 Stock Incentive Plan and Forms of Restricted Stock Unit Agreement and Stock Option Agreement (incorporated by reference to Exhibit 99.1 to the Registrant's Form S-8 (File No. 333-189416) filed with the Commission on June 18, 2013) | |
10.9+ | Amended and Restated Employee Stock Purchase Plan, and enrollment forms (incorporated by reference to Exhibit 10.7 to the Registrant's Form 10-K filed with the Commission on March 10, 2014) | |
10.10+ | Executive Incentive Bonus Plan, effective January 27, 2014 (incorporated by reference to Exhibit 99.1 to the Registrant's Form 8-K filed with the Commission on January 31, 2014) | |
10.11 | Form of Non-Employee Director Offer Letter (incorporated by reference to Exhibit 10.2 to the Registrant's Form 10-Q filed with the Commission on August 4, 2014) | |
#10.12+ | Form of Executive Change of Control Agreement | |
#10.13+ | Form of Director Change of Control Agreement | |
#10.14 | Form of Indemnification Agreement | |
10.15+ | Amendment dated November 20, 2007 to Offer Letter Between Callidus Software Inc. and Leslie J. Stretch (incorporated by reference to Exhibit 10.16 to the Registrant's Form 10-K filed with the Commission on March 10, 2014) | |
#10.16+ | Offer Letter with Jimmy Duan dated September 24, 2008 | |
10.17+ | Employment Agreement with Bob L. Corey dated April 30, 2013 (incorporated by reference to Exhibit 10.2 to the Registrant's Form 10-Q filed with the Commission on November 7, 2013) | |
10.18 | Credit Agreement by and among Wells Fargo Bank, National Association, as administrative agent, the lender that is a party thereto, and Callidus Software Inc., dated as of May 13, 2014 (incorporated by reference to Exhibit 99.1 to the Registrant’s Form 8-K filed with the Commission on May 13, 2014) | |
#10.19* | Agreement between Callidus Software Inc. and Versata Software, Inc., Versata Development Group, Inc., and Versata, Inc. dated November 13, 2014 | |
#23.1 | Consent of Independent Registered Public Accounting Firm | |
#31.1 | Certifications of Chief Executive Officer Pursuant to Rule 13a-14(a) of the Securities Exchange Act of 1934, as adopted by Section 302 of the of the Sarbanes-Oxley Act of 2002 | |
67
#31.2 | Certifications of Chief Financial Officer Pursuant to Rule 13a-14(a) of the Securities Exchange Act of 1934, as adopted by Section 302 of the of the Sarbanes-Oxley Act of 2002 | |
#32.1 | Certifications of Chief Executive Officer and Chief Financial Officer Pursuant to 18 U.S.C. section 1350, as adopted by Section 906 of the Sarbanes-Oxley Act of 2002 | |
#101 | Interactive Data Files Pursuant to Rule 405 of Regulations S-T (XBRL) | |
_________________________________________________________________________________________________________________
# Filed herewith
+ Management contract or compensatory plan or arrangement
* Registrant is requesting confidential treatment with respect to portions of this exhibit.
68
SIGNATURES
Pursuant to the requirements of Section 13 or 15(d) of the Securities Exchange Act of 1934, the registrant has duly caused this report to be signed on its behalf by the undersigned thereunto duly authorized on February 27, 2015.
CALLIDUS SOFTWARE INC. | ||
By: | /s/ BOB L. COREY | |
Bob L. Corey, Senior Vice President, Chief Financial Officer | ||
Pursuant to the requirements of the Securities Exchange Act of 1934, this report has been signed below by the following persons on behalf of the Registrant and in the capacities and on the dates indicated below.
Signature | Title | Date | ||
/s/ LESLIE J. STRETCH | February 27, 2015 | |||
Leslie J. Stretch | President, Chief Executive Officer and Director (Principal Executive Officer) | |||
/s/ BOB L. COREY | February 27, 2015 | |||
Bob L. Corey | Senior Vice President, Chief Financial Officer (Principal Financial Officer, Principal Accounting Officer) | |||
/s/ CHARLES M. BOESENBERG | February 27, 2015 | |||
Charles M. Boesenberg | Chairman of the Board | |||
/s/ WILLIAM B. BINCH | February 27, 2015 | |||
William B. Binch | Lead Independent Director | |||
/s/ MARK A. CULHANE | February 27, 2015 | |||
Mark A. Culhane | Director | |||
/s/ KEVIN M. KLAUSMEYER | February 27, 2015 | |||
Kevin M. Klausmeyer | Director | |||
/s/ DAVID B. PRATT | February 27, 2015 | |||
David B. Pratt | Director | |||
/s/ MURRAY RODE | February 27, 2015 | |||
Murray Rode | Director | |||
/s/ MICHELE VION | February 27, 2015 | |||
Michele Vion | Director | |||
69
70