Attached files
| file | filename |
|---|---|
| 8-K - 8-K - NTELOS HOLDINGS CORP. | ntls-120120148k.htm |
| EX-10.1 - EXHIBIT - NTELOS HOLDINGS CORP. | ex10-1.htm |
| EX-99.1 - EXHIBIT - NTELOS HOLDINGS CORP. | ex99-1.htm |

Corporate Strategy Update December 2, 2014 NASDAQ: NTLS

Presentation of Financial and Other Important Information USE OF NON-GAAP FINANCIAL MEASURES Included in this presentation are certain non-GAAP financial measures that are not determined in accordance with US generally accepted accounting principles (“GAAP”). These financial performance measures are not indicative of cash provided or used by operating activities and exclude the effects of certain operating, capital and financing costs and may differ from comparable information provided by other companies, and they should not be considered in isolation, as an alternative to, or more meaningful than measures of financial performance determined in accordance with US generally accepted accounting principles. These financial performance measures are commonly used in the industry and are presented because NTELOS believes they provide relevant and useful information to investors. NTELOS utilizes these financial performance measures to assess its ability to meet future capital expenditure and working capital requirements, to incur indebtedness if necessary, and to fund continued growth. NTELOS also uses these financial performance measures to evaluate the performance of its business, for budget planning purposes and as factors in its employee compensation programs. Adjusted EBITDA is defined as net income attributable to NTELOS Holdings Corp. before interest, income taxes, depreciation and amortization, accretion of asset retirement obligations, transaction related costs, restructuring and asset impairment charges, gain/loss on sale or disposal of assets and derivatives, net income attributable to noncontrolling interests, other expenses/income, equity-based compensation charges, separation charges, secondary offering costs, and adjustments for impact of recognizing a portion of the billed SNA contract revenues on a straight line basis. SPECIAL NOTE REGARDING FORWARD-LOOKING STATEMENTS Any statements contained in this presentation that are not statements of historical fact, including statements about our beliefs and expectations, are forward-looking statements and should be evaluated as such. The words “anticipates,” “believes,” “expects,” “intends,” “plans,” “estimates,” “targets,” “projects,” “should,” “may,” “will” and similar words and expressions are intended to identify forward-looking statements. Such forward-looking statements reflect, among other things, our current expectations, plans and strategies, and anticipated financial results, all of which are subject to known and unknown risks, uncertainties and factors that may cause our actual results to differ materially from those expressed or implied by these forward-looking statements. Many of these risks are beyond our ability to control or predict. Because of these risks, uncertainties and assumptions, you should not place undue reliance on these forward-looking statements. Furthermore, forward-looking statements speak only as of the date they are made. We do not undertake any obligation to update or review any forward-looking information, whether as a result of new information, future events or otherwise. Important factors with respect to any such forward-looking statements, including certain risks and uncertainties that could cause actual results to differ from those contained in the forward-looking statements, include, but are not limited to: our ability to attract and retain retail subscribers to our services; our dependence on our strategic relationship with Sprint Corporation (“Sprint”); the approval and timing of Eastern Markets’ spectrum sale; our ability to realize the expected proceeds, cost savings and other benefits from the wind down of our Eastern Markets; a potential increase in roaming rates and wireless handset subsidy costs; rapid development and intense competition in the telecommunications industry; our ability to finance, design, construct and realize the benefits of any planned network technology upgrade; our ability to acquire or gain access to additional spectrum; the potential to experience a high rate of customer turnover; the potential for competitors to build networks in our markets; cash and capital requirements; operating and financial restrictions imposed by our credit agreement; adverse economic conditions; federal and state regulatory fees, requirements and developments; loss of ability to use our current cell sites; our continued reliance on indirect channels of retail distribution; our reliance on certain suppliers and vendors; and other unforeseen difficulties that may occur. These risks and uncertainties are not intended to represent a complete list of all risks and uncertainties inherent in our business, and should be read in conjunction with the more detailed cautionary statements and risk factors included in our SEC filings, including our most recent Annual Report filed on Form 10-K. 2

Agenda 3 3 Michael Huber, Chairman of the Board Steb Chandor, Chief Financial Officer Rod Dir, President & Chief Operating Officer (Q&A Session) Craig Highland, SVP Finance & Corporate Development (Q&A Session) • Strategy Update • Overview of the Virginia East Transaction • Updated Guidance & Financial Outlook • Q&A Session
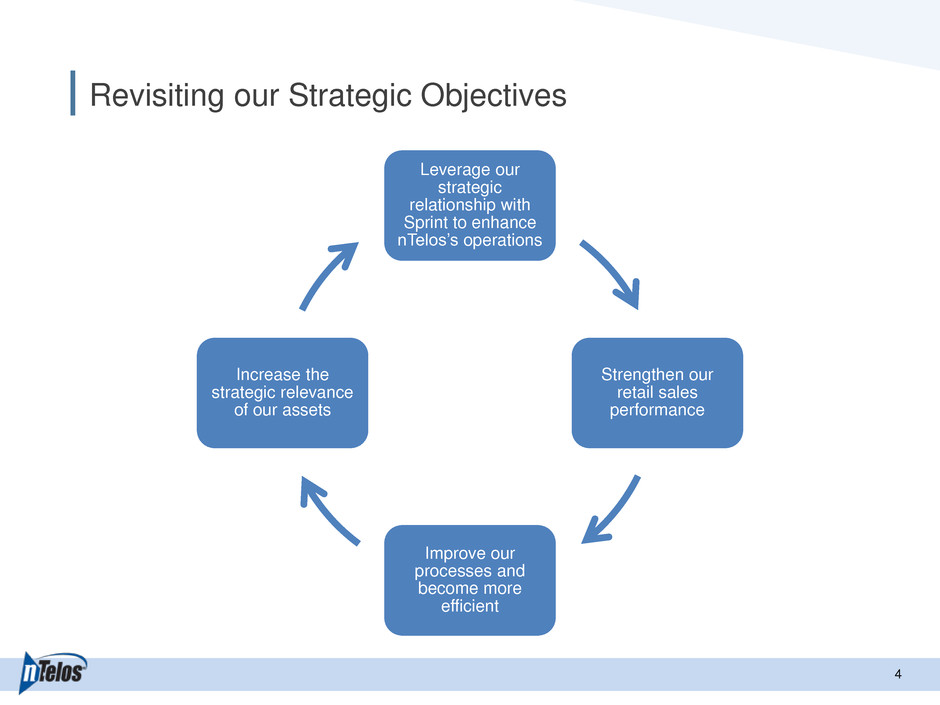
Revisiting our Strategic Objectives 4 Leverage our strategic relationship with Sprint to enhance nTelos’s operations Strengthen our retail sales performance Improve our processes and become more efficient Increase the strategic relevance of our assets

Mission: Be a Leading Provider of Wireless Services in the Markets We Serve 5 Focus exclusively on our Western Markets (western Virginia and West Virginia) where we are best positioned to win Sale of non-strategic assets with unattractive financial returns – spectrum in the Eastern Markets (eastern Virginia) and certain related assets, as well as likely monetizing our tower portfolio Focused SNA build and enhancement of our Western coverage with further investment and redeployed network equipment from Eastern Markets Reduce operating costs in order to achieve our long-term Adjusted EBITDA margin target of between ~30% to 35%

Increasing the Strategic Relevance of our Assets 6 Exit the relatively urban, highly competitive Eastern Markets which require substantial future capital investment and require a mass marketing strategy to achieve meaningful share Sell our 1900 MHz PCS spectrum licenses covering these markets Expect to migrate our existing subs in these markets to another carrier via an agency arrangement over the next year Monetize non-core assets and assess opportunistic sales of other underutilized assets Assessing monetization of a portion of our tower portfolio as well as potentially our un- deployed AWS spectrum Increase allocation of capital to SNA territories and communities within our Western Markets Selectively redeploy 3G and 4G equipment currently in the Eastern Markets to facilitate low-cost expansion of our coverage, particularly in West Virginia Enhancing strategic optionality while capturing value from underutilized, non-core assets
Strengthening Retail Sales Proposition 7 Profitable retail growth with a community-centric strategy Going back to our roots in the Western Markets – local involvement, family-focus Elevating the “Best Value in Wireless” brand by offering affordable wireless service leveraging our flexible nControl pricing structure Enables NTELOS to better differentiate its value proposition against national competitors Deploying a multi-band 4G network is expected to meaningfully improve the customer experience, thereby reducing churn and growing market share Targeting material market share improvements in the Western Markets

Improving Operational Efficiency 8 Cost rationalization reflecting the Eastern Markets wind down will reduce our annual expense base by ~$20mm – expect to be achieved on a run rate basis by the end of 2015 Simplify our business processes to focus on what we do best Optimize customer care and retail operations through improved processes and operating efficiencies Streamline legacy processes, upgrade systems and embrace automation in order to achieve cost reductions Rightsizing the organization to flatten our decision making hierarchy and improve our responsiveness to customers and competitive changes Targeted deployment of incremental CapEx to expand network coverage will reduce roaming expense and increase wholesale revenue Long-term Adjusted EBITDA margin target of ~30% to 35% and ~20% Adjusted EBITDA less CapEx margin
Result: A Stronger Company with Improved Opportunities 9 Improved market share growth in the markets we serve – communities where a share of voice is achievable Aiming to deploy the best performing 4G LTE network in the region Today we have ~15% of our towers deployed with 4G, which is targeted to grow to 50% and 75% by the end of 2015 and 2016, respectively Lower churn and higher ARPU as >75% of subs are postpay following our Western refocus Strong base of SNA wholesale revenue underlies healthy retail business Path to FCF generation for the long-term Access to Sprint spectrum in the SNA territory Greater operating leverage in Western Markets Be a leading provider of wireless services in the markets we serve

Virginia East Transaction Summary 1 0 0 Discontinuing wireless service in the relatively urban, highly competitive Eastern Markets, with approximately 180,100 customers from the 3.6 million POPs predominately in Hampton Roads/Norfolk and Richmond1 Avoids heavy investment in spectrum and network upgrades that would have otherwise been required Selling our 1900 MHz PCS wireless spectrum licenses covering the Company’s Eastern Markets to a national carrier for ~$56 million in cash upon closing Wind-down and breakage costs in the Eastern Markets of ~$55 million, although only ~$15 million is payable between now and the end of 2015 in the absence of settlements with vendors Continue to monetize the subscriber base through November 2015 and expect an arrangement to migrate subs to another carrier 1As of September 30, 2014 December 2014: Begin decommissioning assets, closing down stores and reducing headcount April 2015: Expected closing subject to FCC approval June 2015: First 10 MHz released to purchaser November 2015: Second and final 10 MHz released to purchaser December 2015: Complete wind down of Eastern Markets Eastern Markets

11 Category Existing Eastern Markets Western Markets POPs 8.0 million 3.6 million 4.4 million Covered POPs 6.0 million 3.0 million 3.0 million Market Share ~7.5% ~6.0% ~9.0% Retail Subscribers 457,200 180,100 277,100 % of Postpay Subs 68% 53% 78% YTD Subscriber Revenue $218.9 million $86.0 million $132.9 million YTD SNA Billed Revenue $115.4 million $0 $115.4 million Total Cell Sites 1,446 448 998 Spectrum Depth 23 MHz + Sprint 19 MHz 27 MHz + Sprint As of September 30, 2014 Operational Footprint Overview The Western Markets have greater market share and postpay mix

Key Operating Metrics by Region Metric Existing Eastern Markets Western Markets Gross Adds 125,800 53,700 72,100 Postpay 61,400 16,600 44,800 Prepay 64,400 37,100 27,300 % of Postpay GAs 49% 31% 62% Net Adds 2,900 (6,700) 9,600 Postpay 5,500 (2,700) 8,200 Prepay (2,600) (4,000) 1,400 Ending Subscribers 457,200 180,100 277,100 Postpay 310,200 94,800 215,400 Prepay 147,000 85,400 61,600 % of Postpay subs 68% 53% 78% Churn 2.9% 3.6% 2.5% Postpay 2.0% 2.2% 1.9% Prepay 4.8% 5.0% 4.5% Blended ARPU $52.82 $51.44 $53.73 As of September 30, 2014, including year-to-date metrics. 12 The Western Markets have more attractive metrics for mix of Gross Adds, Churn and ARPU

Financial Overview

FY 2014 Guidance (as of December 2, 2014) 14 14 For the year ended December 31, 2014: Adjusted EBITDA of $128 - $132 million (unchanged) • Includes approximately $150 - $152 million of SNA billed revenue • Includes approximately $2 million of contribution to Adjusted EBITDA from the Eastern Markets • Excludes restructuring costs and impairment charges CapEx of approximately $105 million (unchanged)

FY 2015 Preliminary Outlook (as of December 2, 2014) 15 15 For the year ended December 31, 2015: Adjusted EBITDA of $100 - $108 million • Includes approximately $138 - $143 million of SNA billed revenue • Reflects $9 - $12 million of cost savings realized in 2015 of $20 million total • Excludes any benefit from the wind-down of the Eastern Markets, restructuring costs and impairment charges CapEx expected to be modestly less than Adjusted EBITDA
Long-Term Financial Targets 16 16 Consolidated revenue growth in low single digits Retail revenue growth of mid-single digits per year SNA billed revenue down mid-single digits per year through 2016, and then flat to down low-single digits per year thereafter, with travel data revenue growing and serving as an offset to declining home revenue Consolidated Adjusted EBITDA margins of ~30% to 35% CapEx as a percent of revenue of ~15% Turning Free Cash Flow positive in 2017 Financial targets highlighted herein are long-term in nature and are subject to various risks and uncertainties, one or more of which could cause targets to be unattainable. You should not regard the inclusion of a target in this presentation as a representation by any person that the results will be achieved.
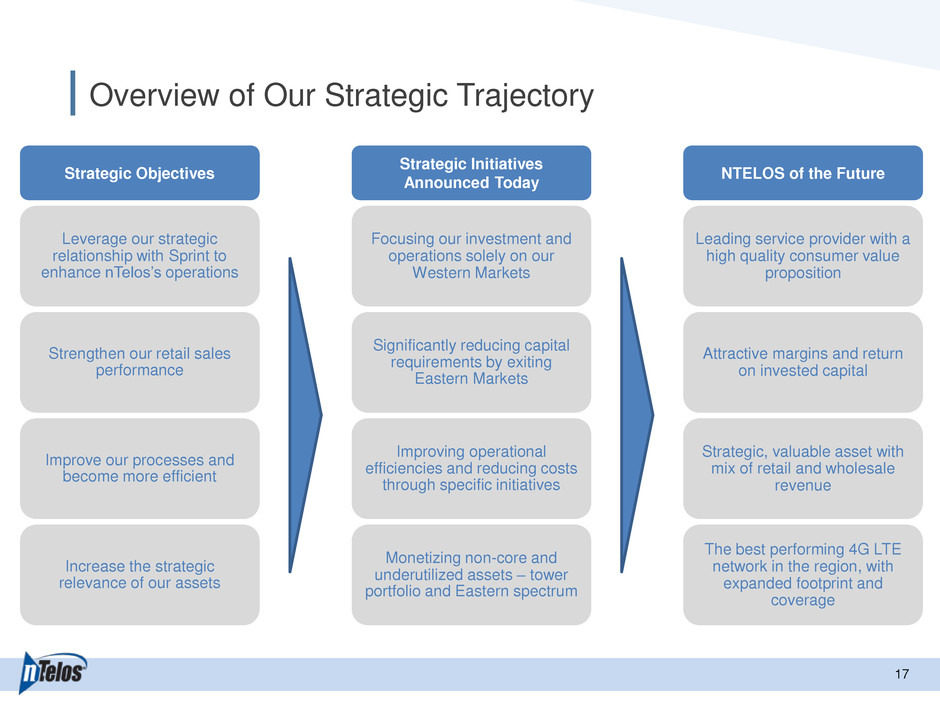
Overview of Our Strategic Trajectory 1 7 7 Leverage our strategic relationship with Sprint to enhance nTelos’s operations Strengthen our retail sales performance Improve our processes and become more efficient Increase the strategic relevance of our assets Strategic Objectives Focusing our investment and operations solely on our Western Markets Significantly reducing capital requirements by exiting Eastern Markets Improving operational efficiencies and reducing costs through specific initiatives Monetizing non-core and underutilized assets – tower portfolio and Eastern spectrum Strategic Initiatives Announced Today Attractive margins and return on invested capital Strategic, valuable asset with mix of retail and wholesale revenue The best performing 4G LTE network in the region, with expanded footprint and coverage Leading service provider with a high quality consumer value proposition NTELOS of the Future

Appendix

KPIs – Gross & Net Adds 24,800 19,500 20,400 21,600 20,400 16,500 16,800 23,700 20,600 24,100 29,200 25,000 22,500 24,600 0 5,000 10,000 15,000 20,000 25,000 30,000 35,000 Eastern Prepay Eastern Postpay Western Prepay Western Postpay 6,000 800 (900) 100 (100) (2,600) (4,000) 5,400 3,000 3,200 7,400 3,500 3,000 3,100 (6,000) (4,000) (2,000) 0 2,000 4,000 6,000 8,000 10,000 1Q 2013 2Q 2013 3Q 2013 4Q 2013 1Q 2014 2Q 2014 3Q 2014 Gross Adds Net Adds 19

KPIs – Blended Churn 3.4% 3.3% 3.7% 3.8% 3.6% 3.4% 3.8% 2.4% 2.3% 2.6% 2.7% 2.6% 2.3% 2.6% 2.8% 2.7% 3.1% 3.1% 3.0% 2.8% 3.1% 2.0% 2.2% 2.4% 2.6% 2.8% 3.0% 3.2% 3.4% 3.6% 3.8% 4.0% 1Q 2013 2Q 2013 3Q 2013 4Q 2013 1Q 2014 2Q 2014 3Q 2014 Eastern Churn Western Churn Conolidated Churn 20

KPIs – Blended ARPU $53.20 $52.90 $53.11 $53.18 $52.62 $51.21 $51.44 $54.37 $54.49 $55.16 $54.77 $53.97 $53.35 $53.73 $53.87 $53.82 $54.29 $54.11 $53.41 $52.48 $52.82 $51.00 $51.50 $52.00 $52.50 $53.00 $53.50 $54.00 $54.50 $55.00 $55.50 $56.00 1Q 2013 2Q 2013 3Q 2013 4Q 2013 1Q 2014 2Q 2014 3Q 2014 Eastern ARPU Western ARPU Consolidated ARPU 21
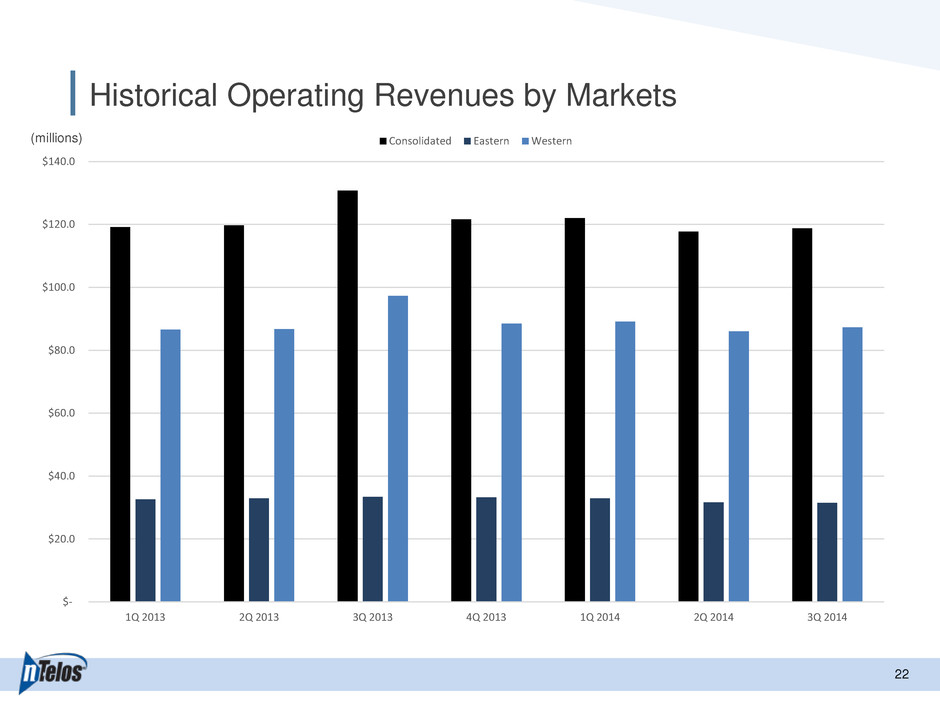
Historical Operating Revenues by Markets 22 (millions) $- $20.0 $40.0 $60.0 $80.0 $100.0 $120.0 $140.0 1Q 2013 2Q 2013 3Q 2013 4Q 2013 1Q 2014 2Q 2014 3Q 2014 Consolidated Eastern Western

Key Metrics – Consolidated 2 3 3 NTELOS Holdings Corp. Key Metrics Quarter Ended: 3/31/2013 6/30/2013 9/30/2013 12/31/2013 3/31/2014 6/30/2014 9/30/2014 9/30/2013 9/30/2014 Subscribers Beginning Subscribers 439,600 451,000 454,800 457,100 464,600 468,000 458,100 439,600 464,600 Postpay 297,400 299,700 298,700 298,000 306,700 306,800 308,200 297,400 306,700 Prepay 142,200 151,300 156,100 159,100 157,900 161,200 149,900 142,200 157,900 Gross Additions 48,500 40,100 44,500 50,800 45,400 39,000 41,400 133,100 125,800 Postpay 20,200 16,300 20,000 28,700 20,200 20,400 20,800 56,500 61,400 Prepay 28,300 23,800 24,500 22,100 25,200 18,600 20,600 76,600 64,400 Disconnections¹ 37,100 36,300 42,200 43,300 42,000 38,600 42,300 115,600 122,900 Postpay 16,900 16,100 19,600 19,800 19,900 17,100 18,900 52,600 55,900 Prepay 20,200 20,200 22,600 23,500 22,100 21,500 23,400 63,000 67,000 Net Additions (Losses)¹ 11,400 3,800 2,300 7,500 3,400 400 (900) 17,500 2,900 Postpay 3,300 200 400 8,900 300 3,300 1,900 3,900 5,500 Prepay 8,100 3,600 1,900 (1,400) 3,100 (2,900) (2,800) 13,600 (2,600) Ending Subscribers ¹ 451,000 454,800 457,100 464,600 468,000 458,100 457,200 457,100 457,200 Postpay 299,700 298,700 298,000 306,700 306,800 308,200 310,200 298,000 310,200 Prepay 151,300 156,100 159,100 157,900 161,200 149,900 147,000 159,100 147,000 Churn, net ¹ 2.8% 2.7% 3.1% 3.1% 3.0% 2.8% 3.1% 2.8% 2.9% Postpay 1.9% 1.8% 2.2% 2.2% 2.2% 1.8% 2.0% 2.0% 2.0% Prepay 4.6% 4.4% 4.8% 4.9% 4.6% 4.5% 5.3% 4.6% 4.8% ¹ During the second quarter, the Company terminated approximately 2,100 postpay subscribers that repeatedly exceeded their terms and conditions relating to permitted usage. Additionally, the Company changed its business rules related to reporting of long-term, non-revenue prepay subscribers. This change resulted in approximately 8,200 prepay subscribers being excluded from our ending subscriber base. The impact of these Company-initiated terminations and change in business rules is reflected in our ending subscriber totals as of June 30, 2014, and is not reflected in our disconnections, net additions and churn calculations for the periods ended June 30, 2014. Nine Months Ended

Key Metrics – Western Markets 2 4 4 NTELOS Western Markets Proforma Key Metrics Quarter Ended: 3/31/2013 6/30/2013 9/30/2013 12/31/2013 3/31/2014 6/30/2014 9/30/2014 9/30/2013 9/30/2014 Subscribers Beginning Subscribers 254,600 260,000 263,000 266,300 273,600 277,100 274,000 254,600 273,600 Postpay 199,600 200,600 200,400 201,200 208,800 210,300 212,400 199,600 208,800 Prepay 55,000 59,400 62,600 65,100 64,800 66,800 61,600 55,000 64,800 Gross Additions 23,700 20,600 24,100 29,200 25,000 22,500 24,600 68,400 72,100 Postpay 12,800 10,800 14,100 20,600 14,600 14,700 15,500 37,600 44,800 Prepay 10,900 9,800 10,000 8,600 10,400 7,800 9,100 30,800 27,300 Disconnections2 18,300 17,600 20,900 21,800 21,500 19,500 21,500 56,800 62,500 Postpay 11,100 10,200 12,500 12,800 12,900 11,200 12,500 33,700 36,600 Prepay 7,200 7,400 8,400 8,200 8,600 8,300 9,000 23,100 25,900 Net Additions (Losses)2 5,400 3,000 3,200 7,400 3,500 3,000 3,100 11,600 9,600 Postpay 1,700 600 1,600 7,800 1,700 3,500 3,000 3,900 8,200 Prepay 3,700 2,400 1,600 (400) 1,800 (500) 100 7,700 1,400 Ending Subscribers 2 260,000 263,000 266,300 276,600 277,100 274,000 277,100 266,300 277,100 Postpay 200,600 200,400 201,200 208,800 210,300 212,400 215,500 201,200 215,400 Prepay 59,400 62,600 65,100 64,800 66,800 61,600 61,600 65,100 61,600 Churn, net ¹ 2.40% 2.30% 2.6% 2.7% 2.6% 2.3% 2.6% 2.4% 2.5% Postpay 1.80% 1.70% 2.1% 2.1% 2.0% 1.8% 1.9% 1.9% 1.9% Prepay 4.30% 4.00% 4.3% 4.6% 4.4% 4.2% 4.9% 4.2% 4.5% ¹ Proforma Western Markets subscribers is defined as Consolidated Subscribers less direct Eastern Market Subscribers 2 During the second quarter, the Company terminated approximately 1,400 postpay subscribers that repeatedly exceeded their terms and conditions relating to permitted usage. Additionally, the Company changed its business rules related to reporting of long-term, non-revenue prepay subscribers. This change resulted in approximately 4,700 prepay subscribers being excluded from our ending subscriber base. The impact of these Company-initiated terminations and change in business rules is reflected in our ending subscriber totals as of June 30, 2014, and is not reflected in our disconnections, net additions and churn calculations for the periods ended June 30, 2014. Nine Months Ended

Select Financial Measures 2 5 5 (in thousands) 3Q14 2Q14 1Q14 4Q13 3Q13 2Q13 1Q13 Consolidated Revenues 119,639$ 117,795$ 122,082$ 121,766$ 130,913$ 119,858$ 119,345$ Adjusted EBITDA 32,778$ 34,363$ 33,923$ 26,726$ 45,558$ 41,188$ 37,416$ CapEx 23,867$ 29,883$ 13,961$ 15,549$ 21,185$ 27,061$ 16,913$ Proforma Western Markets1 Revenues 88,191$ 86,125$ 89,166$ 88,555$ 97,516$ 86,921$ 86,774$ Adjusted EBITDA 32,878$ 33,307$ 33,348$ 27,504$ 43,687$ 38,047$ 36,502$ CapEx 21,141$ 24,992$ 824$ 11,796$ 18,345$ 22,872$ 15,023$ 1 Proforma Western Markets is defined as Consolidated Financial Measures less Eastern Market Financial Measures
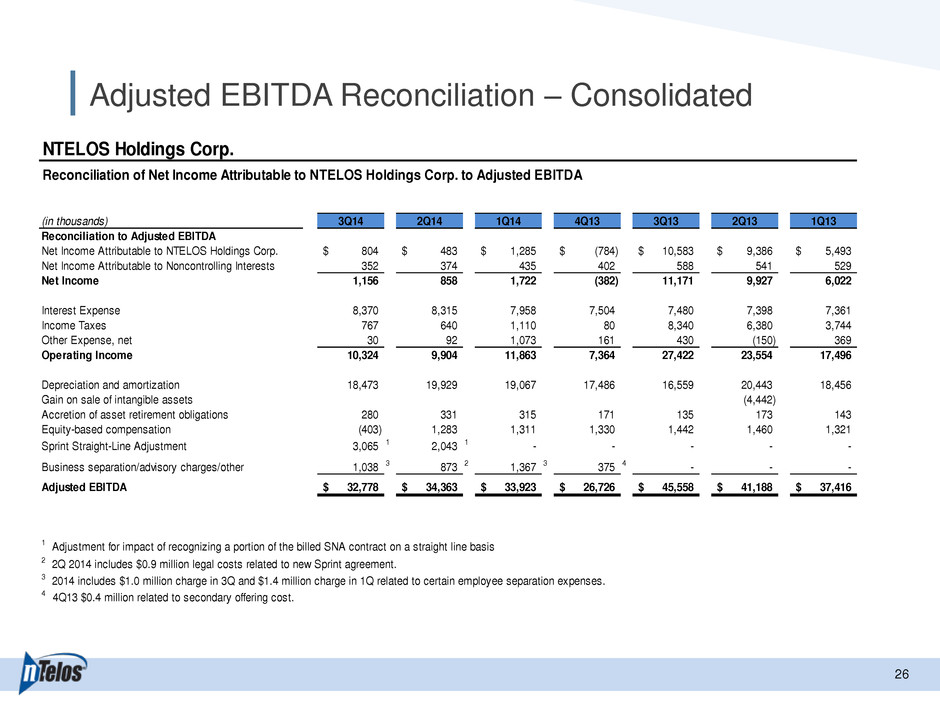
Adjusted EBITDA Reconciliation – Consolidated 2 6 6 NTELOS Holdings Corp. Reconciliation of Net Income Attributable to NTELOS Holdings Corp. to Adjusted EBITDA (in thousands) 3Q14 2Q14 1Q14 4Q13 3Q13 2Q13 1Q13 Reconciliation to Adjusted EBITDA Net Income Attributable to NTELOS Holdings Corp. 804$ 483$ 1,285$ (784)$ 10,583$ 9,386$ 5,493$ Net Income Attributable to Noncontrolling Interests 352 374 435 402 588 541 529 Net Income 1,156 858 1,722 (382) 11,171 9,927 6,022 Interest Expense 8,370 8,315 7,958 7,504 7,480 7,398 7,361 Income Taxes 767 640 1,110 80 8,340 6,380 3,744 Other Expense, net 30 92 1,073 161 430 (150) 369 Operating Income 10,324 9,904 11,863 7,364 27,422 23,554 17,496 Depreciation and amortization 18,473 19,929 19,067 17,486 16,559 20,443 18,456 Gain on sale of intangible assets (4,442) Accretion of asset retirement obligations 280 331 315 171 135 173 143 Equity-based compensation (403) 1,283 1,311 1,330 1,442 1,460 1,321 Sprint Straight-Line Adjustment 3,065 1 2,043 1 - - - - - Business separation/advisory charges/other 1,038 3 873 2 1,367 3 375 4 - - - Adjusted EBITDA 32,778$ 34,363$ 33,923$ 26,726$ 45,558$ 41,188$ 37,416$ 3 2014 includes $1.0 million charge in 3Q and $1.4 million charge in 1Q related to certain employee separation expenses. 4 4Q13 $0.4 million related to secondary offering cost. 1 Adjustment for impact of recognizing a portion of the billed SNA contract on a straight line basis 2 2Q 2014 includes $0.9 million legal costs related to new Sprint agreement.

Adjusted EBITDA Reconciliation – Western Markets 2 7 7 NTELOS Western Markets Proforma Reconciliation of Net Income Attributable to NTELOS Holdings Corp. to Proforma Western Markets Adjusted EBITDA 1 (in thousands) 3Q14 2Q14 1Q14 4Q13 3Q13 2Q13 1Q13 Reconciliation to Proforma Adjusted EBITDA1 Net Income Attributable to NTELOS Holdings Corp. 804$ 483$ 1,285$ (784)$ 10,583$ 9,386$ 5,493$ Net (Income) Loss Attributable to Eastern Markets 7,534 8,241 8,419 8,473 5,422 4,029 6,076 Net Income Attributable to Noncontrolling Interests 352 374 435 402 588 541 529 Net Income 8,690 9,099 10,140 8,091 16,593 13,955 12,098 Interest Expense 5,663 5,741 5,626 5,326 5,461 5,419 5,425 Income Taxes 767 640 1,110 80 8,340 6,381 3,743 Other Expense, net 30 92 1,073 161 430 (150) 369 Operating Income 15,150 15,571 17,949 13,658 30,824 25,604 21,635 Depreciation and amortization 13,659 13,718 12,922 12,453 11,785 15,754 13,814 Gain on sale of intangible assets (4,442) Accretion of asset retirement obligations 179 235 223 120 99 125 104 Equity-based compensation (213) 866 887 898 978 1,007 949 Sprint Straight-Line Adjustment 3,065 2 2,043 2 - - - - - Business separation/advisory charges/other 1,038 4 873 3 1,367 4 375 5 - - - Adjusted EBITDA 32,878$ 33,307$ 33,348$ 27,504$ 43,687$ 38,047$ 36,502$ 1 Proforma Western Markets Adjusted EBITDA is defined as Consolidated Adjusted EBITDA less Eastern Market Adjusted EBITDA 2 Adjustment for impact of recognizing a portion of the billed SNA contract on a straight line basis 3 2Q 2014 includes $0.9 million legal costs related to new Sprint agreement. 4 2014 includes $1.0 million charge in 3Q and $1.4 million charge in 1Q related to certain employee separation expenses. 5 4Q13 $0.4 million related to secondary offering cost.
