Attached files
| file | filename |
|---|---|
| EXCEL - IDEA: XBRL DOCUMENT - HAYNES INTERNATIONAL INC | Financial_Report.xls |
| EX-31.2 - EX-31.2 - HAYNES INTERNATIONAL INC | a2222275zex-31_2.htm |
| EX-21.1 - EX-21.1 - HAYNES INTERNATIONAL INC | a2222275zex-21_1.htm |
| EX-31.1 - EX-31.1 - HAYNES INTERNATIONAL INC | a2222275zex-31_1.htm |
| EX-10.14 - EX-10.14 - HAYNES INTERNATIONAL INC | a2222275zex-10_14.htm |
| EX-32.1 - EX-32.1 - HAYNES INTERNATIONAL INC | a2222275zex-32_1.htm |
| EX-23.1 - EX-23.1 - HAYNES INTERNATIONAL INC | a2222275zex-23_1.htm |
Use these links to rapidly review the document
TABLE OF CONTENTS
Item 8. Financial Statements and Supplementary Data
UNITED STATES
SECURITIES AND EXCHANGE COMMISSION
Washington, D.C. 20549
FORM 10-K
| (Mark One) | ||
ý |
ANNUAL REPORT PURSUANT TO SECTION 13 OR 15(d) OF THE SECURITIES EXCHANGE ACT OF 1934 |
|
For the fiscal year ended September 30, 2014 |
||
or |
||
o |
TRANSITION REPORT PURSUANT TO SECTION 13 OR 15(d) OF THE SECURITIES EXCHANGE ACT OF 1934 |
|
For the transition period from to |
||
Commission file number 001-33288
HAYNES INTERNATIONAL, INC.
(Exact name of registrant as specified in its charter)
| Delaware (State or other jurisdiction of incorporation or organization) |
06-1185400 (I.R.S. Employer Identification No.) |
|
1020 West Park Avenue, Kokomo, Indiana (Address of principal executive offices) |
46904-9013 (Zip Code) |
Registrant's telephone number, including area code (765) 456-6000
Securities registered pursuant to Section 12(b) of the Act:
| Title of each class | Name of each exchange on which registered | |
|---|---|---|
| Common Stock, par value $.001 per share | NASDAQ Global Market |
Securities registered pursuant to section 12(g) of the Act: None.
Indicate
by check mark if the registrant is a well-known seasoned issuer, as defined in Rule 405 of the Securities Act.
o Yes ý No
Indicate by check mark if the registrant is not required to file reports pursuant to Section 13 or Section 15(d) of the Act. o Yes ý No
Indicate by check mark whether the registrant (1) has filed all reports required to be filed by Section 13 or 15(d) of the Securities Exchange Act of 1934 during the preceding 12 months (or for shorter period that the registrant was required to file such reports), and (2) has been subject to such filing requirements for the past 90 days. ý Yes o No
Indicate by check mark whether the registrant has submitted electronically and posted on its corporate Website, if any, every Interactive Data File required to be submitted and posted pursuant to Rule 405 of Regulation S-T (§ 232.405 of this chapter) during the preceding 12 months (or for such shorter period that the registrant was required to submit and post such files). ý Yes o No
Indicate by check mark if disclosure of delinquent filers pursuant to Item 405 of Regulation S-K (§ 229.405 of this chapter) is not contained herein, and will not be contained, to the best of registrant's knowledge, in definitive proxy or information statements incorporated by reference in Part III of this Form 10-K or any amendment to this Form 10-K. ý
Indicate by check mark whether the registrant is a large accelerated filer, an accelerated filer, or a non-accelerated filer. (See definition of "accelerated filer and large accelerated filer" in Rule 12b-2 of the Exchange Act). (Check one):
| Large accelerated filer o | Accelerated filer ý | Non-accelerated filer o (Do not check if a smaller reporting company) |
Smaller Reporting Company o |
Indicate by check mark whether the registrant is a shell company (as defined in Rule 12b-2 of the Act). o Yes ý No
As of March 31, 2014, the aggregate market value of the registrant's common stock held by non-affiliates of the registrant was $494,333,982 based on the closing sale price as reported on the NASDAQ Global Market. Shares of common stock held by each executive officer and director and by each person who owns 10% or more of the outstanding common stock have been excluded in that such persons may be deemed to be affiliates. This determination of affiliate status is not necessarily a conclusive determination for other purposes.
12,418,471 shares of Haynes International, Inc. common stock were outstanding as of November 19, 2014.
DOCUMENTS INCORPORATED BY REFERENCE
Portions of the registrant's Proxy Statement to be delivered to stockholders in connection with the Annual Meeting of Stockholders to be held March 2, 2015 have been incorporated by reference into Part III of this report.
This Annual Report on Form 10-K contains statements that constitute "forward-looking statements" within the meaning of the Private Securities Litigation Reform Act of 1995, Section 27A of the Securities Act of 1933 and Section 21E of the Securities Exchange Act of 1934, each as amended. All statements other than statements of historical fact, including statements regarding market and industry prospects and future results of operations or financial position, made in this Annual Report on Form 10-K are forward-looking. In many cases, you can identify forward-looking statements by terminology, such as "may", "should", "expects", "intends", "plans", "anticipates", "believes", "estimates", "predicts", "potential" or "continue" or the negative of such terms and other comparable terminology. The forward-looking information may include, among other information, statements concerning the Company's outlook for fiscal year 2015 and beyond, overall volume and pricing trends, cost reduction strategies and their anticipated results, market and industry trends, capital expenditures and dividends. There may also be other statements of expectations, beliefs, future plans and strategies, anticipated events or trends and similar expressions concerning matters that are not historical facts. Readers are cautioned that any such forward-looking statements are not guarantees of future performance and involve risks and uncertainties, including, without limitation, those risk factors set forth in Item 1A of this Annual Report on Form 10-K. Actual results may differ materially from those in the forward-looking statements as a result of various factors, many of which are beyond the Company's control.
The Company has based these forward-looking statements on its current expectations and projections about future events. Although the Company believes that the assumptions on which the forward-looking statements contained herein are based are reasonable, any of those assumptions could prove to be inaccurate. As a result, the forward-looking statements based upon those assumptions also could be incorrect. Risks and uncertainties may affect the accuracy of forward-looking statements.
The Company undertakes no obligation to publicly update or revise any forward-looking statements, whether as a result of new information, future events or otherwise.
Overview
Haynes International, Inc. ("Haynes" or "the Company") is one of the world's largest producers of high-performance nickel- and cobalt-based alloys in flat product form such as sheet, coil and plate forms. The Company is focused on developing, manufacturing, marketing and distributing technologically advanced, high-performance alloys, which are sold primarily in the aerospace, chemical processing and land-based gas turbine industries. The Company's products consist of high-temperature resistant alloys, or HTA products, and corrosion-resistant alloys, or CRA products. HTA products are used by manufacturers of equipment that is subjected to extremely high temperatures, such as jet engines for the aerospace market, gas turbine engines used for power generation and waste incineration, and industrial heating equipment. CRA products are used in applications that require resistance to very corrosive media found in chemical processing, power plant emissions control and hazardous waste treatment. Management believes Haynes is one of the principal producers of high-performance alloy flat products in sheet, coil and plate forms, and sales of these forms, in the aggregate, represented approximately 58% of net product revenues in fiscal 2014. The Company also produces its products as seamless and welded tubulars, and in slab, bar, billet and wire forms.
The Company has manufacturing facilities in Kokomo, Indiana; Arcadia, Louisiana; and Mountain Home, North Carolina. The Kokomo facility specializes in flat products, the Arcadia facility specializes in tubular products, and the Mountain Home facility specializes in wire products. The Company's products are sold primarily through its direct sales organization, which includes 13 service and/or sales centers in the United States, Europe and Asia. All of these centers are Company-operated. In fiscal 2014, approximately 78% of the Company's net revenue was generated by its direct sales organization, and the remaining 22% was generated by a network of independent distributors and sales agents who supplement its direct sales
3
efforts primarily in the United States, Europe and Asia, some of whom have been associated with the Company for over 30 years.
Available Information
The address of the Company's website is www.haynesintl.com. The Company provides a link to its reports filed or furnished pursuant to Section 13(a) or 15(d) of the Securities Exchange Act of 1934 on its website as soon as reasonably practicable after filing with the U.S. Securities and Exchange Commission. The filings available on the Company's website date back to February 3, 2011. For all filings made prior to that date, the Company's website includes a link to the website of the U.S. Securities and Exchange Commission, where such filings are available. Information contained or referenced on the Company's website is not incorporated by reference and does not form a part of this Annual Report on Form 10-K. For a statement of the Company's profits and losses and total assets, please see the financial statements of the Company included in Item 8 of this Annual Report on Form 10-K.
Business Strategy
The Company's goal is to grow its business and increase revenues and profitability while continuing to be its customers' provider of choice for high-performance alloys. The Company pursues this goal by taking advantage of its diverse product offerings, manufacturing and service capabilities to penetrate end markets, provide value-added services, deliver innovative products and applications and lowering costs through strategic investment in manufacturing facilities.
- •
- Increase revenues by providing value-added processing services and leveraging our global distribution
network. The Company believes that its network of service and sales centers throughout North America, Europe and Asia distinguishes it
from its competitors, many of whom operate only mills. The Company's service and sales centers enable it to develop close customer relationships through direct interaction with customers and to
respond to customer orders quickly, while providing value-added services such as laser, plasma and water jet processing. These services allow the Company's customers to minimize their processing costs
and outsource non-core activities. In addition, the Company's rapid response time and enhanced processing services for products shipped from its service and sales centers often enable the Company to
obtain a selling price advantage.
- •
- Increase revenues by developing new products and new applications for existing alloys and expanding into new markets. The Company believes that it is the industry leader in developing new alloys designed to meet its customers' specialized and demanding requirements. The Company continues to work closely with customers and end users of its products to identify, develop, manufacture and test new high-performance alloys. Since fiscal 2000, the Company's technical programs have yielded eight new proprietary alloys; an accomplishment that the Company believes distinguishes it from its competitors. The Company expects continued emphasis on product innovation to yield similar future results.
- •
- Continue to expand the maintenance, repair and overhaul business. The Company believes that its maintenance, repair and overhaul, or MRO, business serves a growing market and represents both an expanding and recurring revenue stream. Products used in the Company's end markets require periodic replacement due to the extreme environments in which they are used, which drives demand for recurring MRO work. The Company intends to continue to leverage the capabilities of its
In recent years the Company's revenues have been derived primarily from the aerospace, chemical processing and land-based gas turbine industries. Through development of new alloys and new applications for existing alloys, the Company is seeking to develop additional markets which will generate new revenue streams. The Company believes that the oil and gas, renewable energy (such as solar), flue-gas desulphurization in China, automotive, heat treatment and nuclear industries all present opportunities for its products.
4
- •
- Capitalize on strategic equipment investment and optimize our processes with lean manufacturing
improvements. The Company expects to continue to improve operations through ongoing capital investment in manufacturing facilities and
equipment including information technology and utilizing six sigma and lean manufacturing process improvements. Ongoing investment in equipment has significantly improved the Company's operations by
increasing capacity, reducing unplanned downtime and manufacturing costs, and improving product quality and working capital management. Management believes that the Company's capital investments will
enable it to continue to satisfy long-term customer demand for value-added products that meet increasingly precise specifications. For additional discussion of capital spending, see "Summary of
Capital Spending" in Item 7., Management's Discussion and Analysis of Financial Conditions and Results of Operations, contained elsewhere in this Annual Report on Form 10-K.
- •
- Expand product capability through strategic acquisitions and alliances. The Company will continue to examine opportunities that enable it to offer customers an enhanced and more competitive product line to complement its core flat products. These opportunities may include product line enhancement and market expansion opportunities. The Company will also continue to evaluate strategic relationships with third parties in the industry in order to enhance its competitive position and relationships with customers.
service and sales centers to respond quickly to its customers' time-sensitive MRO needs to develop new and retain existing business opportunities.
Company History
The Company was founded in 1912 as Haynes Stellite Works by American inventor and entrepreneur Elwood Haynes in Kokomo, Indiana. Since its founding the Company has continuously conducted its main operations in Kokomo, Indiana. The Company was owned for much of its history by corporate parents, including Union Carbide and Cabot Corporation, until purchased in 1989 and then again in 1997 by private equity firms. The debt incurred in the last leveraged buy-out ultimately forced the Company into bankruptcy in March, 2004, from which it emerged in five months in August, 2004.
The Company began operations for its tubular facility in Arcadia, Louisiana over 30 years ago, which has grown with additional investment over time. In addition the Company has expanded globally with service center locations in the United Kingdom, Switzerland, China and other sales offices in France, Japan, Singapore, India and Italy. The Company also acquired in 2005 a stainless steel and high-temperature alloy wire company located in Mountain Home, North Carolina. The Company primarily produces high-performance alloy wire at the facility.
In March, 2007, the Company completed a public equity offering and simultaneously the Company listed its common stock on the NASDAQ Global Market. The Company began paying a dividend in fiscal 2010 and raised the dividend at the beginning of fiscal 2012.
Products
The global specialty alloy market consists of three primary sectors: stainless steel, general purpose nickel alloys and high-performance nickel- and cobalt-based alloys. The Company believes that the high-performance alloy sector represents less than 10% of the total alloy market. The Company competes primarily in the high-performance nickel- and cobalt-based alloy sectors, which includes HTA products and CRA products. In fiscal 2012, 2013 and 2014, HTA products accounted for approximately 73%, 74% and 75% of the Company's net revenues, respectively; and sales of the Company's CRA products accounted for approximately 27%, 26% and 25% of the Company's net revenues, respectively. These percentages are based on data which include revenue associated with sales by the Company to its foreign subsidiaries, but exclude revenue associated with sales by foreign subsidiaries to their customers. Management believes,
5
however, that the effect of including revenue data associated with sales by its foreign subsidiaries would not materially change the percentages presented in this section.
High-temperature Resistant Alloys. HTA products are used primarily in manufacturing components for the hot sections of gas turbine engines. Stringent safety and performance standards in the aerospace industry result in development lead times typically as long as eight to ten years in the introduction of new aerospace-related market applications for HTA products. However, once a particular new alloy is shown to possess the properties required for a specific application in the aerospace market, it tends to remain in use for extended periods. HTA products are also used in gas turbine engines produced for use in applications such as naval and commercial vessels, electric power generation, power sources for offshore drilling platforms, gas pipeline booster stations and emergency standby power generators. The following table sets forth information with respect to the Company's significant high-temperature resistant alloys, applications and features (new HTA development is discussed below under "Patents and Trademarks"):
| Alloy and Year Introduced | End Markets and Applications(1) | Features | ||
|---|---|---|---|---|
| HAYNES® HR-160® alloy (1990)(2) | Waste incineration/CPI-boiler tube shields | Good resistance to sulfidation at high temperatures | ||
| HAYNES 242® alloy (1990)(2) | Aero-seal rings | High strength, low expansion and good fabricability | ||
| HAYNES HR-120® alloy (1990)(2) | LBGT-cooling shrouds | Good strength-to-cost ratio as compared to competing alloys | ||
| HAYNES 230® alloy (1984)(2) | Aero/LBGT-ducting, combustors | Excellent combination of strength, stability, oxidation resistance and fabricability | ||
| HAYNES 214® alloy (1981)(2) | Aero-honeycomb seals | Excellent combination of oxidation resistance and fabricating among nickel-based alloys | ||
| HAYNES 188 alloy (1968)(2) | Aero-burner cans, after-burner components | High strength, oxidation resistant cobalt-based alloy | ||
| HAYNES 625 alloy (1964) | Aero/CPI-ducting, tanks, vessels, weld overlays | Good fabricability and general corrosion resistance | ||
| HAYNES 617 alloy (1999) | Aero/LBGT—ducting, combustors | Good combination of strength, stability, oxidation resistance and fabricability | ||
| HAYNES 263 alloy (1960) | Aero/LBGT-components for gas turbine hot gas exhaust pan | Good ductility and high strength at temperatures up to 1600°F | ||
| HAYNES 718 alloy (1955) | Aero-ducting, vanes, nozzles | Weldable high strength alloy with good fabricability | ||
| HASTELLOY® X alloy (1954) | Aero/LBGT-burner cans, transition ducts | Good high temperature strength at relatively low cost | ||
| HAYNES 25 alloy (1950)(2) | Aero-gas turbine parts, bearings, and various industrial applications | Excellent strength, good oxidation, resistance to 1800°F | ||
| HAYNES 282® alloy (2004)(3) | Aero /LBGT components | Excellent high temperature strength, weldability, fabricability |
- (1)
- "Aero"
refers to the aerospace industry; "LBGT" refers to the land-based gas turbine industry; "CPI" refers to the chemical processing
industry.
- (2)
- Represents
a product which the Company believes has limited or no significant competition.
- (3)
- Patent filing date.
Corrosion-resistant Alloys. CRA products are used in a variety of applications, such as chemical processing, power plant emissions control, hazardous waste treatment, sour gas production and pharmaceutical vessels. Historically, the chemical processing market has represented the largest end-user
6
sector for CRA products. Due to maintenance, safety and environmental considerations, the Company believes this market continues to represent an area of potential long-term growth. Unlike aerospace applications within the HTA product market, the development of new market applications for CRA products generally does not require long lead times. The following table sets forth information with respect to certain of the Company's significant corrosion-resistant alloys, applications and features (new CRA development is discussed below under "Patents and Trademarks"):
| Alloy and Year Introduced | End Markets and Applications(1) | Features | ||
|---|---|---|---|---|
| HASTELLOY C-2000® alloy (1995)(2) | CPI-tanks, mixers, piping | Versatile alloy with good resistance to uniform corrosion | ||
| HASTELLOY B-3® alloy (1994)(2) | CPI-acetic acid plants | Better fabrication characteristics compared to other nickel-molybdenum alloys | ||
| HASTELLOY D-205® alloy (1993)(2) | CPI-plate heat exchangers | Corrosion resistance to hot concentrated sulfuric acid | ||
| ULTIMET® alloy (1990)(2) | CPI-pumps, valves | Wear and corrosion resistant nickel-based alloy | ||
| HASTELLOY C-22® alloy (1985) | CPI/FGD-tanks, mixers, piping | Resistance to localized corrosion and pitting | ||
| HASTELLOY G-30® alloy (1985)(2) | CPI-tanks, mixers, piping | Alloy with good corrosion resistance in phosphoric acid | ||
| HASTELLOY G-35® alloy (2004)(2) | CPI-tanks, heat exchangers, piping | Improved corrosion resistance to phosphoric acid with excellent resistance to corrosion in highly oxidizing media | ||
| HASTELLOY C-276 alloy (1968) | CPI/FGD/oil and gas tanks, mixers, piping | Broad resistance to many environments | ||
| HASTELLOY C-22HS® alloy (2003)(3) | Oil & Gas/Marine tubular, shafts, fasteners | Combines very high strength with excellent corrosion resistance and toughness |
- (1)
- "CPI"
refers to the chemical processing industry; "FGD" refers to the flue gas desulphurization industry.
- (2)
- Represents
a patented product or a product which the Company believes has limited or no significant competition.
- (3)
- Patent filing date.
Patents and Trademarks
The Company currently maintains a total of approximately 19 published U.S. patents and applications and approximately 200 foreign counterpart patents and applications targeted at countries with significant or potential markets for the patented products and continues to develop, manufacture and test high-performance nickel- and cobalt-based alloys. Since fiscal 2000, the Company's technical programs have yielded eight new proprietary alloys, four of which are currently commercially available and four of which are being scaled-up to be brought to market. The alloys being commercialized saw significant further advancement in the process during fiscal 2014. HAYNES 282 alloy, which management believes will have significant commercial potential for the Company in the long term, is the subject of a U.S. patent issued in 2011. HAYNES 282 alloy has excellent formability, fabricability and forgeability. The commercial launch of HAYNES 282 alloy occurred in October 2005 and, since that time, there have been a significant number of customer tests and evaluations of this product for the hot sections of gas turbines in the aerospace and land-based gas turbine markets, as well as for automotive and other high-temperature applications. The alloy has also been specified into a major aerospace engine component. The Company will continue to actively promote HAYNES 282 alloy through customer engineering visits and technical presentations and papers.
7
For the chemical processing industry, HASTELLOY G-35 alloy has found extensive applications, particularly in wet phosphoric acid production. Management expects demand for this alloy will continue to grow. Commercialization of HASTELLOY C-22HS alloy also continued in fiscal 2014. The Company continues to provide customers with samples of this alloy and make technical presentations. Testing and evaluation of this alloy is ongoing with special emphasis on applications for the oil and gas market. Two major orders were received and shipped for HASTELLOY C-22HS alloy for oil and gas applications. One of those orders was shipped in fiscal 2011, and the second shipped in fiscal 2012. The Company believes that its alloys (particularly HAYNES 282 alloy) are being commercialized rapidly when compared to historical trends for other proprietary alloys introduced by the Company. In addition to HAYNES 282 alloy, HASTELLOY G-35 alloy and HASTELLOY C-22HS alloy, commercialization is also ongoing for HASTELLOY HYBRID-BC1® alloy. This alloy is a CRA product with potential applications in the chemical processing industry that has demonstrated resistance to hydrochloric and sulfuric acid.
In addition to the commercialization of the above alloys, the Company continues to develop applications for new alloys not yet ready to begin the commercialization process. Two new high-temperature alloys, HAYNES NS-163® alloy (U.S. patent granted in 2011) and HAYNES HR-224® alloy (U.S. patent application filed in 2008 and granted in 2013), are in the scale-up phase. Both of these new materials are believed to have significant, medium to long-term commercial potential. HAYNES NS-163 alloy is a new alloy with extraordinary high-temperature strength in sheet form, which has applications in the aerospace, land-based gas turbine and automotive markets. Data generation and fabrication trials continued through 2014, with test marketing initiated in early 2009. HAYNES HR-224 alloy is an HTA product with superior resistance to oxidation. Scale up of this alloy is continuing and test marketing was initiated in fiscal 2010. A U.S. patent application was filed in fiscal 2012 and granted in 2013 for HAYNES 244TM alloy. This alloy has potential in aerospace and land-based gas turbines. It combines high strength to 1400 degrees Fahrenheit with a low coefficient of thermal expansion. Scale-up of this alloy began in fiscal 2011 and is ongoing. Most recently, HAYNES HR-235TM was introduced in fiscal 2013. This alloy has excellent resistance to metal dusting in carbonaceous high temperature environments. Potential uses include applications in petrochemical production and syngas plants. Scale up of this alloy is well underway and material is currently being evaluated by certain key customers.
Patents or other proprietary rights are an important element of the Company's business. The Company's strategy is to file patent applications in the U.S. and any other country that represents an important potential commercial market to the Company. In addition, the Company seeks to protect technology which is important to the development of the Company's business. The Company also relies upon trade secret rights to protect its technologies and its development of new applications and alloys. The Company protects its trade secrets in part through confidentiality and proprietary information agreements with its customers. Trademarks on the names of many of the Company's alloys have also been applied for or granted in the U.S. and certain foreign countries.
While the Company believes its patents are important to its competitive position, significant barriers to entry continue to exist beyond the expiration of any patent period. These barriers to entry include the unique equipment required to produce this material and the exacting process required to achieve the desired metallurgical properties. These processing requirements include such items as specific annealing temperature, processing speeds and reduction per rolling pass. Management believes that the current alloy development program and these barriers to entry reduce the impact of patent expirations on the Company.
End Markets
The global specialty alloy market consists of stainless steels, general purpose nickel alloys and high-performance nickel- and cobalt-based alloys. Of this total market, the Company competes in the high-performance nickel- and cobalt-based alloy sector. The high-performance alloy market in which the Company primarily competes demands diverse specialty alloys suitable for use in precision manufacturing. Given the technologically advanced nature of the products, strict requirements of the end users and
8
higher-growth end markets, the Company believes the high-performance alloy sector provides greater growth potential, higher profit margins and greater opportunities for service, product and price differentiation as compared to the stainless steels and general purpose nickel alloys markets. While stainless steel and general purpose nickel alloys are generally sold in bulk through third-party distributors, the Company's products are sold in smaller-sized orders which are customized and typically handled on a direct-to-customer basis.
Aerospace. The Company has manufactured HTA products for the aerospace market since the late 1930s, and has developed numerous proprietary alloys for this market. Customers in the aerospace market tend to be the most demanding with respect to meeting specifications within very precise tolerances and achieving new product performance standards. Stringent safety standards and continuous efforts to reduce equipment weight and develop more fuel efficient designs require close coordination between the Company and its customers in the selection and development of HTA products. As a result, sales to aerospace customers tend to be made through the Company's direct sales force. Demand for the Company's products in the aerospace market is based on the new and replacement market for jet engines and the maintenance needs of operators of commercial and military aircraft. The Company specializes in the static parts included in the hot sections of the jet engine. The hot sections are subjected to substantial wear and tear and accordingly require periodic maintenance, repair and overhaul. The Company views the maintenance, repair and overhaul (MRO) business as an area of continuing long-term growth.
Chemical Processing. The chemical processing market represents a large base of customers with diverse CRA applications driven by demand for key end use markets such as automobiles, housing, health care, agriculture and metals production. CRA products supplied by the Company have been used in the chemical processing market since the early 1930s. Demand for the Company's products in this market is driven by the level of MRO and expansion requirements of existing chemical processing facilities, as well as the construction of new facilities. The North America expansion of manufacturing of natural gas liquids will be a driver of demand in this market. The Company believes the extensive worldwide network of Company-owned service and sales centers, as well as its network of independent distributors and sales agents who supplement the Company's direct sales efforts outside of the U.S., provide a competitive advantage in marketing its CRA products in the chemical processing market.
Land-based Gas Turbines. Demand for the Company's products in the land-based gas turbines market is driven by the construction of cogeneration facilities such as base load for electric utilities or as backup sources to fossil fuel-fired utilities during times of peak demand. Demand for the Company's alloys in the land-based gas turbine markets has also been driven by concerns regarding lowering emissions from generating facilities powered by fossil fuels. Land-based gas turbine generating facilities have gained acceptance as clean, low-cost alternatives to fossil fuel-fired electric generating facilities. Land-based gas turbines are also used in power barges with mobility and as temporary base-load-generating units for countries that have numerous islands and a large coastline. Demand is also generated by mechanical drive units used for oil and gas production and pipeline transportation, as well as microturbines that are used as back up sources of power generation for hospitals and shopping malls.
Other Markets. Other markets in which the Company sells its HTA products and CRA products include flue-gas desulphurization (FGD), oil and gas, waste incineration, industrial heat treating, automotive, instrumentation, biopharmaceuticals, solar and nuclear fuel. The FGD market has been driven by both legislated and self-imposed standards for lowering emissions from fossil fuel-fired electric generating facilities. This market is expected to soften in the U.S. if the trend to switch from coal to natural gas for power plants continues. The Company also sells its products for use in the oil and gas market, primarily in connection with sour gas production. In addition, incineration of municipal, biological, industrial and hazardous waste products typically produces very corrosive conditions that demand high-performance alloys. The Company continues to look for opportunities to introduce and expand the use of its alloys in emerging technologies such as solar and nuclear fuel applications. Markets capable of
9
providing growth are being driven by increasing performance, reliability and service life requirements for products used in these markets which could provide further applications for the Company's products.
Sales and Marketing and Distribution
The Company sells its products primarily through its direct sales organization, which operates from 16 total locations in the U.S., Europe and Asia, 13 of which are service and/or sales centers. All of the Company's service and/or sales centers are operated either directly by the Company or through its wholly-owned subsidiaries. Approximately 78% of the Company's net revenues in fiscal 2014 were generated by the Company's direct sales organization. The remaining 22% of the Company's fiscal 2014 net revenues was generated by a network of independent distributors and sales agents who supplement the Company's direct sales in the U.S., Europe and Asia, some of whom have been associated with the Company for over 30 years. Going forward, the Company expects its direct sales force to continue to generate approximately 80% of its total net revenues.
Providing technical assistance to customers is an important part of the Company's marketing strategy. The Company provides performance analyses of its products and those of its competitors for its customers. These analyses enable the Company to evaluate the performance of its products and to make recommendations as to the use of those products in appropriate applications, enabling the products to be included as part of the technical specifications used in the production of customers' products. The Company's market development professionals are assisted by its engineering and technology staff in directing the sales force to new opportunities. Management believes the Company's combination of direct sales, technical marketing, engineering and customer support provides an advantage over other manufacturers in the high-performance alloy industry. This activity allows the Company to obtain direct insight into customers' alloy needs and to develop proprietary alloys that provide solutions to customers' problems.
The Company continues to focus on growing its business in foreign markets. In recent years, the Company opened a service and sales center in China and sales centers in Singapore, India, Italy and Japan.
While the Company is making concentrated efforts to expand foreign sales, the majority of its revenue continues to be provided by sales to U.S. customers. The Company's domestic expansion effort includes, but is not limited to, the continued expansion of ancillary product forms, the continued development of new high-performance alloys, the addition of equipment in U.S. service and sales centers to improve the Company's ability to provide a product closer to the form required by the customer and the continued effort, through the technical expertise of the Company, to find solutions to customer challenges.
The following table sets forth the approximate percentage of the Company's fiscal 2014 net revenues generated through each of the Company's distribution channels.
| |
From Domestic Locations |
From Foreign Locations |
Total | |||||||
|---|---|---|---|---|---|---|---|---|---|---|
Company mill direct/service and sales centers |
56 | % | 22 | % | 78 | % | ||||
Independent distributors/sales agents |
21 | % | 1 | % | 22 | % | ||||
| | | | | | | | | | | |
Total |
77 | % | 23 | % | 100 | % | ||||
| | | | | | | | | | | |
| | | | | | | | | | | |
The Company's top twenty customers accounted for approximately 36%, 34% and 34% of the Company's net revenues in fiscal 2012, 2013 and 2014, respectively. No customer or group of affiliated customers of the Company accounted for more than 10% of the Company's net revenues in fiscal 2012, 2013 or 2014.
Net revenues fiscal 2012, 2013 and 2014 were generated primarily by the Company's U.S. operations. Sales to domestic customers comprised approximately 60%, 56% and 57% of the Company's net revenues
10
in fiscal 2012, 2013 and 2014, respectively. In addition, the majority of the Company's operating costs are incurred in the U.S., as all of its manufacturing facilities are located in the U.S. It is expected that net revenues will continue to be highly dependent on the Company's domestic sales and manufacturing facilities in the U.S.
The Company's foreign and export sales were approximately $233.0 million, $214.7 million and $193.8 million for fiscal 2012, 2013 and 2014, respectively. Additional information concerning foreign operations and export sales is set forth in Note 13 to the Consolidated Financial Statements included in this Annual Report on Form 10-K.
Manufacturing Process
High-performance alloys require a lengthier, more complex production process and are more difficult to manufacture than lower-performance alloys, such as stainless steel. The alloying elements in high-performance alloys must be highly refined during melting, and the manufacturing process must be tightly controlled to produce precise chemical properties. The resulting alloyed material is more difficult to process because, by design, it is more resistant to deformation. Consequently, high-performance alloys require that a greater force be applied when hot or cold working and are less susceptible to reduction or thinning when rolling or forging. This results in more cycles of rolling, annealing and pickling compared to a lower-performance alloy to achieve proper dimensions. Certain alloys may undergo 40 or more distinct stages of melting, remelting, annealing, hot reduction, cold reduction, pickling and testing before they achieve the specifications required by a customer. This longer production cycle contributes to slower inventory turns. The Company manufactures its high-performance alloys in various forms, including sheet, plate, billet/ingot, tubular, wire and other forms. The Company also performs value-added cutting services to supply certain customers with product cut to their specification.
At the Kokomo, Indiana facility, the manufacturing process begins with raw materials being combined, melted and refined in a precise manner to produce the chemical composition specified for each high-performance alloy. The Company's primary melt facility utilizes two different melting processes. The argon oxygen decarburization process utilizes gas controls to remove carbon and other undesirable elements, thereby allowing more tightly-controlled chemistries, which in turn produce more consistent properties in the high-performance alloys. The other primary melt method utilizes vacuum induction melting which involves the melting of raw materials through electromagnetic induction while under vacuum conditions to produce the desired tightly-controlled chemistry. The control systems allow for statistical process control monitoring in real-time to improve product quality. For most high-performance alloys, this molten material is cast into electrodes and additionally refined through electroslag remelting. The resulting ingots are then forged or rolled to an intermediate shape and size depending upon the intended final product form. Intermediate shapes destined for flat products are then sent through a series of hot and cold rolling, annealing, pickling, stretching and shearing operations before being cut to final size.
The Company has a four-high Steckel rolling mill for use in hot rolling high-performance alloys, created specifically for that purpose. The four-high Steckel rolling mill was installed in 1982 and is one of the most powerful four-high Steckel rolling mills in the world. The mill is capable of generating approximately 12.0 million pounds of separating force and rolling a plate up to 72 inches wide. The mill includes integrated computer controls (with automatic gauge control and programmed rolling schedules), two coiling Steckel furnaces and seven heating furnaces. Computer-controlled rolling schedules for each of the hundreds of combinations of product shapes and sizes the Company produces allow the mill to roll numerous widths and gauges to exact specifications without stoppages or changeovers.
The Company also operates a three-high hot rolling mill and a two-high hot rolling mill, each of which is capable of custom processing much smaller quantities of material than the four-high Steckel rolling mill. These mills provide the Company with significant flexibility in running smaller batches of varied products
11
in response to customer requirements. The Company believes the flexibility provided by the three-high and two-high mills provides the Company with an advantage over its major competitors in obtaining smaller specialty orders.
The Arcadia, Louisiana facility uses feedstock produced at the Kokomo facility to fabricate welded and seamless alloy pipe and tubing and purchases extruded tube hollows to produce seamless titanium tubing. The manufacturing processes at Arcadia require cold pilger mills, weld mills, draw benches, annealing furnaces and pickling facilities. The Company recently, underwent a capital investment project that added capacity in the above-mentioned processes.
The Mountain Home, North Carolina facility primarily manufactures finished high-performance alloy wire. Finished wire products are also warehoused at this facility.
Backlog
The Company defines backlog to include firm commitments from customers for delivery of product at established prices. Approximately 30% of the orders in the backlog at any given time include prices that are subject to adjustment based on changes in raw material costs. Historically, approximately 75% of the Company's backlog orders have shipped within six months and approximately 90% have shipped within 12 months. The backlog figures do not typically reflect that portion of the Company's business conducted at its service and sales centers on a spot or "just-in-time" basis. For additional discussion of backlog, see Item 7. Management's Discussion and Analysis of Financial Conditions and Results of Operations contained in this Annual Report on Form 10-K.
Consolidated Backlog at Fiscal Quarter End
| |
2010 | 2011 | 2012 | 2013 | 2014 | |||||||||||
|---|---|---|---|---|---|---|---|---|---|---|---|---|---|---|---|---|
| |
|
(in millions) |
||||||||||||||
1st quarter |
$ | 110.4 | $ | 167.0 | $ | 261.8 | $ | 211.7 | $ | 180.2 | ||||||
2nd quarter |
124.6 | 241.7 | 264.2 | 207.0 | 202.3 | |||||||||||
3rd quarter |
130.9 | 288.6 | 241.2 | 189.6 | 204.7 | |||||||||||
4th quarter |
148.0 | 273.4 | 222.9 | 166.6 | 221.3 | |||||||||||
Raw Materials
Raw materials represented 50% of cost of sales in fiscal 2014. Nickel, a major component of many of the Company's products, accounted for approximately 65% of raw material costs, or approximately 32% of total cost of sales in fiscal 2014. Other raw materials include cobalt, chromium, molybdenum and tungsten. Melt materials consist of virgin raw material, purchased scrap and internally produced scrap.
The average nickel price per pound for cash buyers for the 30-day period ended on September 30, 2012, 2013 and 2014, as reported by the London Metals Exchange, was $7.81, $6.25 and $8.20, respectively. Prices for certain other raw materials which are significant in the manufacture of the Company's products, such as molybdenum and chromium, were lower in fiscal 2014 compared to fiscal 2013, while the price for cobalt was higher in fiscal 2014 than in fiscal 2013.
Although alternative sources of supply are available, the Company currently purchases nickel through an exclusive arrangement with a single supplier to ensure consistent quality and supply. The Company purchases raw materials through various arrangements including fixed-term contracts and spot purchases, which involve a variety of pricing mechanisms. In cases where the Company prices its products at the time of order placement, the Company attempts to establish selling prices with reference to known costs of materials, thereby reducing the risk associated with changes in the cost of raw materials. However, to the extent that the price of nickel fluctuates rapidly, there may be a favorable or unfavorable effect on the Company's gross profit margins. The Company periodically purchases material forward with certain
12
suppliers in connection with fixed price agreements with customers. In the event a customer fails to meet the expected volume levels or the consumption schedule deviates from the expected schedule, a rapid or prolonged decrease in the price of raw materials could adversely affect the Company's operating results.
The Company values inventory utilizing the first-in, first-out ("FIFO") inventory costing methodology. Under the FIFO inventory costing method, the cost of materials included in cost of sales may be different than the current market price at the time of sale of finished product due to the length of time from the acquisition of the raw material to the sale of the finished product. In a period of decreasing raw material costs, the FIFO inventory valuation method normally results in higher costs of sales as compared to last-in, first out method. Conversely, in a period of rising raw material costs, the FIFO inventory valuation method normally results in lower costs of sales.
Research and Technical Support
The Company's technology facilities are located at the Kokomo headquarters and consist of 19,000 square feet of offices and laboratories, as well as an additional 90,000 square feet of paved storage area. The Company has six fully equipped technology testing laboratories, including a mechanical test lab, a metallographic lab, an electron microscopy lab, a corrosion lab, a high temperature lab and a welding lab. These facilities also contain a reduced scale, fully equipped melt shop and process lab. As of September 30, 2014, the technology, engineering and technological testing staff consisted of 25 persons, 12 of whom have engineering or science degrees, including 6 with doctoral degrees, with the majority of degrees in the field of metallurgical engineering or materials science.
Research and technical support costs primarily relate to efforts to develop new proprietary alloys and new applications for existing alloys. The Company spent approximately $3.3 million, $3.5 million and $3.6 million for research and technical support activities for fiscal 2012, 2013 and 2014, respectively.
During fiscal 2014, research and development projects were focused on new alloy development, new product form development, supportive data generation and new alloy concept validation, relating to products for the aerospace, land-based gas turbine, chemical processing and oil and gas industries. In addition, significant projects were conducted to generate technical data in support of major market application opportunities in areas such as renewable energy, fuel cell systems, biotechnology (including toxic waste incineration and pharmaceutical manufacturing), and power generation.
Competition
The high-performance alloy market is a highly competitive market in which eight to ten major producers participate in various product forms. The Company's primary competitors in flat rolled products include Special Metals Corporation, a subsidiary of Precision Cast Parts, Allegheny Technologies, Inc. and Outokumpu-VDM. The Company faces strong competition from domestic and foreign manufacturers of both high-performance alloys (similar to those the Company produces) and other competing metals. The Company may face additional competition in the future to the extent new materials are developed, such as plastics or ceramics, that may be substituted for the Company's products. The Company also believes that it will face increased competition from non-U.S. entities in the next five to ten years, especially from competitors located in Eastern Europe and Asia. Additionally, in recent years the Company's domestic business has benefited from a weak U.S. dollar, which makes the goods of foreign competitors more expensive to import into the U.S. In the event that the U.S. dollar continues to strengthen, the Company may face increased competition in the U.S. from foreign competitors.
During fiscal 2013 and 2014, the Company experienced strong price competition from competitors who produce both stainless steel and high-performance alloys due primarily to weakness in both markets. Increased competition has required the Company to continually price its products competitively, which has contributed to the reduction in the Company's gross profit margin and net income. Demand has begun to improve, resulting in price competition in the high-performance alloy industry beginning to ease. The
13
Company continues to respond to this competition by increasing emphasis on service centers, offering value-added services, improving its cost structure and striving to improve delivery times and reliability.
Employees
As of September 30, 2014, the Company employed 1,053 full-time employees worldwide. All eligible hourly employees at the Kokomo, Indiana and Arcadia, Louisiana plants, and the Lebanon, Indiana service center (593 in the aggregate) are covered by two collective bargaining agreements.
On December 21, 2012, the Company entered into a new collective bargaining agreement with the United Steelworkers of America which covers eligible hourly employees at the Company's Arcadia, Louisiana plant. This agreement will expire in December 2015.
On July 1, 2013, the Company entered into a new collective bargaining agreement with the United Steelworkers of America, which covers eligible hourly employees at the Kokomo, Indiana plant and the Lebanon, Indiana service center. This agreement will expire in June 2018.
Management believes that current relations with the union are satisfactory.
Environmental Matters
The Company's facilities and operations are subject to various foreign, federal, state and local laws and regulations relating to the protection of human health and the environment, including those governing the discharge of pollutants into the environment and the storage, handling, use, treatment and disposal of hazardous substances and wastes. In the U.S., such laws include, without limitation, the Occupational Safety and Health Act, the Clean Air Act, the Clean Water Act, the Toxic Substances Control Act and the Resource Conservation and Recovery Act. As environmental laws and regulations continue to evolve, it is likely the Company will be subject to increasingly stringent environmental standards in the future, particularly under air quality and water quality laws and standards related to climate change issues, such as reporting of greenhouse gas emissions. Violations of these laws and regulations can result in the imposition of substantial penalties and can require facility improvements. Expenses related to environmental compliance were approximately $2.3 million for fiscal 2014 and are currently expected to be approximately $2.5 million for fiscal 2015. Although there can be no assurance, based upon current information available to the Company, the Company does not currently expect that costs of environmental contingencies, individually or in the aggregate, will have a material effect on the Company's financial condition, results of operations or liquidity. The Company's facilities are subject to periodic inspection by various regulatory authorities, who from time to time have issued findings of violations of governing laws, regulations and permits. In the past five years, the Company has paid administrative fines, none of which have had a material effect on the Company's financial condition, for alleged violations relating to environmental matters, requirements relating to its Title V Air Permit and alleged violations of record keeping and notification requirements relating to industrial waste water discharge. Capital expenditures of approximately $1.3 million were made for pollution control improvements during fiscal 2014, with additional expenditures of approximately $1.0 million for similar improvements planned for fiscal 2015.
The Company has received permits from the Indiana Department of Environmental Management, or IDEM, to close and to provide post-closure monitoring and care for certain areas at the Kokomo facility previously used for the storage and disposal of wastes, some of which are classified as hazardous under applicable regulations. Closure certification was received in fiscal 1988 for the South Landfill at the Kokomo facility, and post-closure monitoring and care are permitted and ongoing there. Closure certification was received in fiscal 1999 for the North Landfill at the Kokomo facility, and post-closure monitoring and care are permitted and ongoing there. In fiscal 2007, IDEM issued a single post-closure permit applicable to both the North and South Landfills, which contains monitoring and post-closure care requirements and which was renewed in fiscal 2012. In addition, IDEM required that a Resource Conservation and Recovery Act, or RCRA, Facility Investigation, or RFI, be conducted in order to further
14
evaluate one additional area of concern and one additional solid waste management unit. The RFI commenced in fiscal 2008 and is ongoing. Based on preliminary results, the Company has determined that additional testing and further source remediation are necessary.
The Company has also received permits from the North Carolina Department of Environment and Natural Resources, or NCDENR, to close and provide post-closure monitoring and care for the hazardous waste lagoon at its Mountain Home, North Carolina facility. The lagoon area has been closed and is currently undergoing post-closure monitoring and care.
The Company is required to monitor groundwater and to continue post-closure maintenance of the former disposal areas at each site. As a result, the Company is aware of elevated levels of certain contaminants in the groundwater, and additional corrective action by the Company could be required.
The Company is unable to estimate the costs of any further corrective action at these sites, if required. Accordingly, the Company cannot assure that the costs of any future corrective action at these or any other current or former sites would not have a material effect on the Company's financial condition, results of operations or liquidity. Additionally, it is possible that the Company could be required to undertake other corrective action commitments for any other solid waste management unit or other conditions existing or determined to exist at its facilities. As a condition of the post-closure permits, the Company must provide and maintain assurances to IDEM and NCDENR of the Company's capability to satisfy post-closure groundwater monitoring requirements, including possible future corrective action as necessary. The Company provides these required assurances through a statutory financial assurance test as provided by Indiana and North Carolina law.
The Company may also incur liability for alleged environmental damages associated with the off-site transportation and disposal of hazardous substances. The Company's operations generate hazardous substances, and, while a large percentage of these substances are reclaimed or recycled, the Company also accumulates hazardous substances at each of its facilities for subsequent transportation and disposal off-site by third parties. Generators of hazardous substances which are transported to disposal sites where environmental problems are alleged to exist are subject to claims under the Comprehensive Environmental Response, Compensation and Liability Act of 1980, or CERCLA, and state counterparts. CERCLA imposes strict, joint and several liabilities for investigatory and cleanup costs upon hazardous substance generators, site owners and operators and other potentially responsible parties. The Company is currently named as a potentially responsible party at one site. The Company may have generated hazardous substances disposed of at other sites potentially subject to CERCLA or equivalent state law remedial action. Thus, there can be no assurance that the Company will not be named as a potentially responsible party at other sites in the future or that the costs associated with those sites would not have a material adverse effect on the Company's financial condition, results of operations or liquidity.
On August 3, 2012, the Company received an information request from the United States Environmental Protection Agency, or EPA, relating to the Company's compliance with laws relating to air quality. The Company responded to the request, and there has been no further action by the EPA.
15
Executive Officers of the Company
The following table sets forth certain information concerning the persons who served as executive officers as of September 30, 2014. Except as indicated in the following paragraphs, the principal occupations of these persons have not changed during the past five years.
Name
|
Age | Position with Haynes International, Inc. | |||
|---|---|---|---|---|---|
| Mark M. Comerford | 52 | President and Chief Executive Officer; Director | |||
| Daniel W. Maudlin | 48 | Vice President—Finance, Treasurer and Chief Financial Officer | |||
| Janice W. Gunst | 42 | Vice President—General Counsel & Corporate Secretary | |||
| Venkat R. Ishwar | 62 | Vice President—Marketing & Technology | |||
| Marlin C. Losch | 54 | Vice President—Sales & Distribution | |||
| Jean C. Neel | 55 | Vice President—Corporate Affairs | |||
| Scott R. Pinkham | 47 | Vice President—Manufacturing | |||
| Gregory M. Spalding | 58 | Vice President—Tube & Wire Products | |||
| David S. Van Bibber | 43 | Controller and Chief Accounting Officer | |||
| Jeffrey L. Young | 57 | Vice President & Chief Information Officer | |||
Mr. Comerford was elected President and Chief Executive Officer and a director of the Company in October 2008. Before joining the Company, Mr. Comerford was President of Brush International, Inc. and Brush Engineered Materials Alloys Division, each affiliated with Materion Corporation, formerly known as Brush Engineered Material, Inc., a company that manufactures high performance materials, from 2004 to 2008.
Mr. Maudlin has served as the Vice President-Finance and Chief Financial Officer of the Company since December 2012. Prior to that, he was Controller and Chief Accounting Officer of the Company from September 2004 to December 2012.
Ms. Gunst has served as Vice President—General Counsel and Corporate Secretary of the Company since August 2011. Prior to joining the Company, Ms. Gunst was a partner at Ice Miller LLP from 2005 to 2011.
Dr. Ishwar has served as Vice President—Marketing & Technology of the Company since January 2010. Dr. Ishwar was Senior Vice President of Forgital USA, a manufacturer of mechanical components, between July 2008 and December 2009.
Mr. Losch has served as Vice President—Sales & Distribution of the Company since January 2010. Prior to that, he served as Vice President—North American Sales of the Company beginning in February 2006.
Ms. Neel has served as Vice President—Corporate Affairs of the Company since April 2000.
Mr. Pinkham has served as Vice President—Manufacturing of the Company since March 2008.
Mr. Spalding has served as Vice President—Tube & Wire Products of the Company since May 2009. Prior to that, he served as Vice President, Haynes Wire & Chief Operating Officer from 2006 to May 2009.
Mr. Van Bibber has served as Controller and Chief Accounting Officer of the Company since December 2012. Prior to joining the Company, Mr. Van Bibber was Director of Finance at Belden, Inc. from 2009 to 2012 and Director of Finance at Zimmer, Inc. from 2006 to 2009.
Mr. Young has served as Vice President & Chief Information Officer of the Company since November 2005.
16
Risks Related to Our Business
Our revenues may fluctuate widely based upon changes in demand for our customers' products.
Demand for our products is dependent upon and derived from the level of demand for the machinery, parts and equipment produced by our customers, which are principally manufacturers and fabricators of machinery, parts and equipment for highly specialized applications. Historically, certain of the markets in which we compete have experienced unpredictable, wide demand fluctuations. Because of the comparatively high level of fixed costs associated with our manufacturing processes, significant declines in those markets have had a disproportionately adverse impact on our operating results.
Since we became an independent company in 1987, we have, in several instances, experienced substantial year-to-year declines in net revenues, primarily as a result of decreases in demand in the industries to which our products are sold. In fiscal 2002, 2003, 2009, 2010 and 2013, our net revenues, when compared to the immediately preceding year, declined by approximately 10.3%, 21.2%, 31.1%, 13.0% and 16.7%, respectively. We may experience similar fluctuations in our net revenues in the future. Additionally, demand is likely to continue to be subject to substantial year-to-year fluctuations as a consequence of industry cyclicality, as well as other factors such as global economic uncertainty, and such fluctuations may have a material adverse effect on our financial condition, results of operations or liquidity.
Profitability in the high-performance alloy industry is highly sensitive to changes in sales volumes.
The high-performance alloy industry is characterized by high capital investment and high fixed costs. The cost of raw materials is the primary variable cost in the manufacture of our high-performance alloys and, in fiscal 2014, represented approximately 50.0% of our total cost of sales. Other manufacturing costs, such as labor, energy, maintenance and supplies, often thought of as variable, have a significant fixed element. Profitability is, therefore, very sensitive to changes in volume, and relatively small changes in volume can result in significant variations in earnings. Our ability to effectively utilize our manufacturing assets depends greatly upon continuing demand in our end-markets, successfully increasing our market share and continued acceptance of our new products into the marketplace. Any failure to effectively utilize our manufacturing assets may negatively impact our gross margin and net income.
We are subject to risks associated with global economic and political uncertainties.
We are susceptible to macroeconomic downturns in the United States and abroad that may affect the general economic climate and our performance and the demand of our customers. The continuing turmoil in the global economy has had, and may continue to have, an adverse impact on our business and our financial condition. In addition to the impact that the global financial crisis has already had, we may face significant challenges if conditions in the global economy do not improve or worsen.
In addition, we are subject to various domestic and international risks and uncertainties, including changing social conditions and uncertainties relating to the current and future political climate. Changes in governmental policies (particularly those that would limit or reduce defense spending) could have an adverse effect on our financial condition and results of operations and may reduce our customers' demand for our products and/or depress pricing of those products used in the defense industry or which have other military applications, resulting in a material adverse impact on our business, prospects, results of operations, revenues and cash flows. Furthermore, any actual armed hostilities and any future terrorist attacks in the U.S. or abroad could also have an adverse impact on the U.S. economy, global financial markets and our business. The effects may include, among other things, a decrease in demand in the aerospace industry due to reduced air travel, as well as reduced demand in the other industries we serve. Depending upon the severity, scope and duration of these effects, the impact on our financial position, results of operations and cash flows could be material.
17
We operate in cyclical markets.
A significant portion of our revenues are derived from the highly cyclical aerospace, power generation and chemical processing markets. Our sales to the aerospace industry constituted 42.9% of our total sales in fiscal 2014. Our land-based gas turbine and chemical processing sales constituted 19.0% and 24.9%, respectively, of our total sales in fiscal 2014.
The commercial aerospace industry is historically driven by demand from commercial airlines for new aircraft. The U.S. and international commercial aviation industries continue to face challenges arising from the global economic climate, competitive pressures and fuel costs. Demand for commercial aircraft is influenced by industry profitability, trends in airline passenger traffic, the state of U.S. and world economies, the ability of aircraft purchasers to obtain required financing and numerous other factors, including the effects of terrorism and health and safety concerns. The military aerospace cycle is highly dependent on U.S. and foreign government funding; however, it is also driven by the effects of terrorism, a changing global political environment, U.S. foreign policy, the retirement of older aircraft and technological improvements to new engines that increase reliability. Accordingly, the timing, duration and severity of cyclical upturns and downturns cannot be forecasted with certainty. Downturns or reductions in demand for our products sold into the aerospace market could have a material adverse effect on our business.
The land-based gas turbine market is also cyclical in nature. Demand for power generation products is global and is affected by the state of the U.S. and world economies, the availability of financing to power generation project sponsors and the political environments of numerous countries. The availability of fuels and related prices also have a large impact on demand. Reductions in demand for our products sold into the land-based gas turbine industry may have a material adverse effect on our business.
We also sell products into the chemical processing industry, which is also cyclical in nature. Customer demand for our products in this market may fluctuate widely depending on U.S. and world economic conditions, the availability of financing, and the general economic strength of the end use customers in this market. Cyclical declines or sustained weakness in this market could have a material adverse effect on our business.
The competitive nature of our business results in pressure for price concessions to our customers and increased pressure to reduce our costs.
We are subject to substantial competition in all of the markets we serve, and we expect this competition to continue. As a result, we have made significant price concessions to our customers in the aerospace and power generation markets from time to time, and we expect customer pressure for further price concessions to continue. Maintenance of our market share will depend, in part, on our ability to sustain a cost structure that enables us to be cost-competitive. If we are unable to adjust our costs relative to our pricing, our profitability will suffer. Our effectiveness in managing our cost structure will be a key determinant of future profitability and competitiveness.
Reductions in government expenditures or changes in spending priorities could adversely affect our military aerospace business.
The budget for the U.S. Department of Defense may be reduced from current levels. In addition to debt reduction efforts already authorized, it is possible that the U.S. government could reduce or further delay its spending on, or reprioritize its spending away from, the military aerospace industry.
On November 23, 2011, the Joint Select Committee on Deficit Reduction (commonly referred to as the "Super Committee" which was established as part of the Budget Control Act of 2011 (the "Budget Act")) failed to recommend legislation that would reduce net U.S. government spending by at least $1.2 trillion over the next 10 years. This failure to act triggered directed automatic across-the-board cuts, known
18
as sequestrations, beginning on January 2, 2013. Then, on January 2, 2013, the American Taxpayer Relief Act of 2012 ("ATRA") was signed into law. The ATRA delayed the sequestrations created by the Budget Act for two months, until March 1, 2013. On March 1, 2013, with no deal reached, President Obama signed an order putting the sequestrations into effect. The sequestrations created automatic reductions of discretionary appropriations for U.S. defense programs, which made up the shortfall necessary to achieve the $1.2 trillion target. On October 1, 2013, as a result of Congress's inability to enact legislation appropriating funds for fiscal year 2014, the U.S. government entered a shutdown. Then, on October 16, 2013, Congress agreed on a proposal to fund the government through January 15, 2014 at sequestration levels and suspend the debt limit until February 7, 2014.
On January 17, 2014, Congress approved, and the President signed, the Omnibus Appropriations Act which removed the threat of future government shutdowns during calendar 2014. The Omnibus Appropriations Act funds the Department of Defense at $499 billion and replaces the across-the-board sequestration cuts with specific reductions across most Department of Defense accounts. Total funding, and funding for most programs, remains flat at 2013 levels.
While the recent budget actions provide a more measured and strategic approach to addressing the U.S. Government's fiscal challenges, sequestration remains a long-term concern and we are unable to predict the outcome of future budget deliberations. Sequestration, or other budgetary cuts in lieu of sequestration, could negatively affect our revenues, financial condition and results of operations.
Aerospace demand is primarily dependent on two manufacturers.
A significant portion of our aerospace products are sold to fabricators and are ultimately used in the production of new commercial aircraft. There are only two primary manufacturers of large commercial aircraft in the world, The Boeing Company and Airbus. A significant portion of our aerospace sales are dependent on the number of new aircraft built by these two manufacturers, which is in turn dependent on a number of factors over which we have little or no control. Those factors include demand for new aircraft from around the globe, success of new commercial and military aircraft programs and factors that impact manufacturing capabilities, such as the availability of raw materials and manufactured components, U.S. and world economic conditions, changes in the regulatory environment and labor relations between the aircraft manufacturers and their work forces. A significant interruption or slowdown in the number of new aircraft built by the aircraft manufacturers could have a material adverse effect on our business.
Our operations are dependent on production levels at our Kokomo facility.
Our principal assets are located at our primary integrated production facility in Kokomo, Indiana and at our production facilities in Arcadia, Louisiana and in Mountain Home, North Carolina. The Arcadia and Mountain Home plants rely to a significant extent upon feedstock produced at the Kokomo facility. Any production failures, shutdowns or other significant problems at the Kokomo facility could have a material adverse effect on our financial condition and results of operations. We maintain property damage insurance to provide for reconstruction of damaged equipment, as well as business interruption insurance to mitigate losses resulting from any production shutdown caused by an insured loss. Although we believe that our insurance is adequate to cover any such losses, that may not be the case. One or more significant uninsured losses at our Kokomo facility may have a material adverse effect on our financial condition.
In addition, from time to time we schedule planned outages on the equipment at our Kokomo facility for maintenance and upgrades. These projects are subject to a variety of risks and uncertainties, including a variety of market, operational and labor related factors, many of which may be beyond our control. Should a planned shut-down on a significant piece of equipment last substantially longer than originally planned, there could be a material adverse effect on our operating results.
19
Our production may be interrupted due to equipment failures or other events affecting our factories.
Our manufacturing processes depend on certain sophisticated and high-value equipment, for which there may be only limited or no production alternatives and some of which has been in operation for a long period of time. Failures of this equipment could result in production delays, revenue loss and significant repair costs. In addition, our factories rely on the availability of electrical power and natural gas, transportation for raw materials and finished products and employee access to our workplace that are subject to interruption in the event of severe weather conditions or other natural or manmade events. While we maintain backup resources to the extent practicable, a severe or prolonged equipment outage, failure or other interruptive event affecting areas where we have significant manufacturing operations may result in loss of manufacturing or shipping days, which could have a material adverse effect on our business. Natural or manmade events that interrupt significant manufacturing operations of our customers also could have a material adverse effect on our business.
A default under our agreements with Titanium Metals Corporation could require us to make significant payments and could disrupt our operations.
We are party to a Conversion Services Agreement and an Access and Security Agreement with Titanium Metals Corporation (TIMET) that provide for the performance of certain titanium conversion services through November 2026. TIMET was acquired by Precision Castparts Corp. which owns Special Metals Corporation, a direct competitor of ours. Events of default under the Conversion Services Agreement include (a) a change in control in which the successor does not assume the agreement, (b) a violation by the Company of certain non-compete obligations relating to the manufacture and conversion of titanium and (c) failure to meet agreed-upon delivery and quality requirements. If an event of default under the Conversion Services Agreement occurs, TIMET could require us to repay the unearned portion of the $50.0 million fee paid to us by TIMET when the agreement was signed, plus liquidated damages of $25.0 million. Our obligations to pay these amounts to TIMET are secured by a security interest in our four-high Steckel rolling mill, through which we process a substantial amount of our products. In addition, the Access and Security Agreement with TIMET includes, among other terms, an access right that would allow TIMET to use certain of our operating assets, including the four-high mill, to perform titanium conversion services in the event of our bankruptcy or the acceleration of our indebtedness. Exercise by TIMET of its rights under its security interest following a default and non-payment of the amounts provided in the Conversion Services Agreement or exercise of the access rights under the Access and Security Agreement could cause significant disruption in our Kokomo operations which would have a material adverse effect on our financial condition and results of operations.
During periods of lower demand in other alloy markets, some of our competitors may use their available capacity to produce higher volumes of high-performance alloys, which leads to increased competition in the high-performance alloy market.
We have experienced increased competition from competitors who produce both stainless steel and high-performance alloys. Due to continued under-utilization of capacity in the stainless steel market, we believe these competitors increased their production levels and sales activity in high-performance alloys to keep capacity in their mills as full as possible, while offering very competitive prices and delivery times. If the stainless market does not improve, continued competition from stainless steel producers could negatively impact our average selling price and reduce our gross profit margin.
In addition, as a result of the competition in our markets, we have made significant price concessions to our customers from time to time, and we expect customer pressure for further price concessions to continue. Maintenance of our market share will depend, in part, on our ability to sustain a cost structure that enables us to be cost-competitive. If we are unable to adjust our costs relative to our pricing, our profitability will suffer. Our effectiveness in managing our cost structure will be a key determinant of future profitability and competitiveness.
20
Rapid fluctuations in the price of nickel may materially adversely affect our operating results.
To the extent that we are unable to adjust to rapid fluctuations in the price of nickel, there may be a negative effect on our gross profit margins. In fiscal 2014, nickel, a major component of many of our products, accounted for approximately 65% of our raw material costs, or approximately 32% of our total costs of sales. We enter into several different types of sales contracts with our customers, some of which allow us to pass on increases in nickel prices to our customers. In other cases, we fix the nickel component of our prices for a period of time through the life of a long-term contract. In yet other cases, we price our products at the time of order, which allows us to establish prices with reference to known costs of our nickel inventory, but which does not allow us to offset an unexpected rise in the price of nickel. We may not be able to successfully offset rapid increases in the price of nickel or other raw materials in the future. In the event that raw material price increases occur that we are unable to pass on to our customers, our cash flows or results of operations could be materially adversely affected.
Alternatively, our results of operations may also be negatively impacted if both customer demand and nickel prices rapidly fall at the same time. Because we value most of our inventory utilizing the first-in, first-out inventory costing methodology, a rapid decrease in raw material costs has a negative effect on our operating results. In those circumstances, we recognize higher material cost in cost of sales relative to lower raw material market prices that drive the sales price.
In addition, we periodically enter into forward purchase agreements for our nickel supply. If we enter into a forward purchase agreement which is not matched to one or more customer contracts with fixed nickel prices, a rapid or prolonged decrease in the price of nickel could adversely impact our operating results.
Our business is dependent on a number of raw materials that are subject to volatility in price and availability.
We use a number of raw materials in our products which are found in only a few parts of the world and are available from a limited number of suppliers. The availability and costs of these materials may be influenced by private or government cartels, changes in world politics, additional regulation, labor relations between the materials producers and their work force, unstable governments in exporting nations, inflation, general economic conditions and export quotas imposed by governments in nations with rare earth element supplies. The ability of key material suppliers to meet quality and delivery requirements or to provide materials on price and other terms acceptable to us can also impact our ability to meet commitments to customers. Future shortages or price fluctuations in raw materials could result in decreased sales as well as margins, or otherwise adversely affect our business. The enactment of new or increased import duties on raw materials imported by us could also increase the costs to us of obtaining the raw materials and might adversely affect our business.
If suppliers increase the price of critical raw materials, we may not have alternative sources of supply. In some cases, we have entered into exclusive supply agreements with respect to raw materials, which could adversely affect our results of operations if the exclusive supplier cannot meet quality and delivery requirements to provide materials on price and other terms acceptable to us. In addition, to the extent that we have quoted prices to customers and accepted customer orders for products prior to purchasing necessary raw materials, or have existing fixed-price contracts, we may be unable to raise the price of products to cover all or part of the increased cost of the raw materials.
The manufacturing of the majority of our products is a complex process and requires long lead times. We may experience delays or shortages in the supply of raw materials. If we are unable to obtain adequate and timely deliveries of required raw materials, we may be unable to timely manufacture sufficient quantities of products. This could cause us to lose sales, incur additional costs, delay new product introductions or suffer harm to our reputation.
21
Failure to successfully develop, commercialize, market and sell new applications and new products could adversely affect our business.
We believe that our proprietary alloys and metallurgical manufacturing expertise provide us with a competitive advantage over other high-performance alloy producers. Our ability to maintain this competitive advantage depends on our ability to continue to offer products that have equal or better performance characteristics than competing products at competitive prices. Our future growth will depend, in part, on our ability to address the increasingly demanding needs of our customers by enhancing the properties of our existing alloys, by timely developing new applications for our existing products, and by timely developing, commercializing, marketing and selling new products. If we are not successful in these efforts, or if our new products and product enhancements do not adequately meet the requirements of the marketplace and achieve market acceptance, our revenues, cash flows and results of operations could be negatively affected.
We are subject to risks relating to our cybersecurity measures and to misappropriation of information generally.
We have put in place a number of systems, processes and practices designed to protect against intentional or unintentional misappropriation or corruption of our systems and information or disruption of our operations. These include, for example, the appropriate encryption of information. Despite such efforts, we are subject to breaches of security systems which may result in unauthorized access, misappropriation, corruption or disruption of the information we are trying to protect, in which case we could suffer material harm. Access to our proprietary information regarding new alloy formulations would allow our competitors to use that information in the development of competing products. Current employees have, and former employees may have, access to a significant amount of information regarding our operations which could be disclosed to our competitors or otherwise used to harm us. In addition, our systems could be subject to sabotage by employees or third parties, which could slow or stop production or otherwise adversely affect our operations. Any misappropriation or corruption of our systems and information or disruption of our operations could have a material adverse effect on our business.
An interruption in energy services may cause manufacturing curtailments or shutdowns.
We rely upon third parties for our supply of energy resources consumed in the manufacture of our products. The prices for and availability of electricity, natural gas, oil and other energy resources are subject to volatile market conditions. These market conditions often are affected by political and economic factors beyond our control. Disruptions in the supply of energy resources could temporarily impair our ability to manufacture products for customers. Further, increases in energy costs, or changes in costs relative to energy costs paid by competitors, has and may continue to adversely affect our profitability. To the extent that these uncertainties cause suppliers and customers to be more cost sensitive, increased energy prices may have an adverse effect on our results of operations and financial condition.
We may be adversely affected by environmental, health and safety laws, regulations, costs and other liabilities.
We are subject to various foreign, federal, state and local environmental, health and safety laws and regulations, including those governing the discharge of pollutants into the environment, the storage, handling, use, treatment and disposal of hazardous substances and wastes and the health and safety of our employees. Under these laws and regulations, we may be held liable for all costs arising out of any release of hazardous substances on, under or from any of our current or former properties or any off-site location to which we sent or arranged to be sent wastes for disposal or treatment, and such costs may be material. We could also be held liable for any and all consequences arising out of human exposure to such substances or other hazardous substances that may be attributable to our products or other environmental damage. In addition, some of these laws and regulations require our facilities to operate under permits that are subject to renewal or modification. These laws, regulations and permits can require expensive pollution control equipment or operational changes to limit actual or potential impacts to the environment.
22
Violations of these laws, regulations or permits can also result in the imposition of substantial penalties, permit revocations and/or facility shutdowns.
We have received permits from the environmental regulatory authorities in Indiana and North Carolina to close and to provide post-closure monitoring and care for certain areas of our Kokomo and Mountain Home facilities that were used for the storage and disposal of wastes, some of which are classified as hazardous under applicable regulations. We are required to monitor groundwater and to continue post-closure maintenance of the former disposal areas at each site. As a result, we are aware of elevated levels of certain contaminants in the groundwater and additional corrective action could be required. Additionally, it is possible that we could be required to undertake other corrective action for any other solid waste management unit or other conditions existing or determined to exist at our facilities. We are unable to estimate the costs of any further corrective action, if required. However, the costs of future corrective action at these or any other current or former sites could have a material adverse effect on our financial condition, results of operations or liquidity.
We may also incur liability for alleged environmental damages associated with the off-site transportation and disposal of hazardous substances. Our operations generate hazardous substances, many of which we accumulate at our facilities for subsequent transportation and disposal off-site or recycling by third parties. Generators of hazardous substances which are transported to disposal sites where environmental problems are alleged to exist are subject to liability under CERCLA and state counterparts. In addition, we may have generated hazardous substances disposed of at sites which are subject to CERCLA or equivalent state law remedial action. We have been named as a potentially responsible party at one site. CERCLA imposes strict, joint and several liabilities for investigatory and cleanup costs upon hazardous substance generators, site owners and operators and other potentially responsible parties regardless of fault. If we are named as a potentially responsible party at other sites in the future, the costs associated with those future sites could have a material adverse effect on our financial condition, results of operations or liquidity.
Environmental laws are complex, change frequently and have tended to become increasingly stringent over time. While we have budgeted for future capital and operating expenditures to comply with environmental laws, changes in any environmental law may increase our costs of compliance and liabilities arising from any past or future releases of, or exposure to, hazardous substances and may materially adversely affect our business, results of operations or financial condition. See "Business—Environmental Matters."
Pending legislation or regulation of greenhouse gases, if enacted or adopted in an onerous form, could have a material adverse impact on our results of operations, financial condition and cash flows.
Political and scientific debates related to the impacts of emissions of greenhouse gases on the global climate are prevalent. Regulation or some form of legislation aimed at reducing greenhouse gas emissions is currently being considered in the United States as well as globally. As a high-performance alloy manufacturer, we will be affected, both directly and indirectly, if proposed climate change legislation, such as use of a "cap and trade" system, is enacted which could have a material adverse impact on our results of operations, financial condition and cash flows.
Government regulation is increasing.
In recent years, the United States Congress has adopted several significant pieces of legislation, such as the Sarbanes-Oxley Act of 2002 and the Dodd-Frank Wall Street Reform and Consumer Protection Act of 2010, that affect our operation as well as those of other publicly traded companies. We may be subject to significant fines and penalties if we fail to comply with these laws or their implementing regulations, and the increasingly stringent regulations could require us to make additional unforeseen expenditures. Any
23
such fines, penalties or expenditures could have a material adverse effect on our financial condition and results of operations.
New regulations related to conflict minerals could adversely impact our business.
The SEC has promulgated final rules mandated by the Dodd-Frank Act regarding disclosure of the use of tin, tantalum, tungsten and gold, known as conflict minerals, in products manufactured by public companies. These new rules require a reasonable country of origin inquiry to determine whether such minerals originated from the Democratic Republic of Congo (the "DRC") or an adjoining country and whether such minerals helped finance the armed conflict in the DRC. Conflict minerals reports are required to be filed annually. There are costs associated with complying with these disclosure requirements, including costs to determine the origin of conflict minerals used in our products. In addition, the implementation of these rules could adversely affect the sourcing, supply and pricing of materials used in our products. Also, we may face disqualification as a supplier for customers and reputational challenges if the procedures we implement do not enable us to verify the origins for all conflict minerals.
Our business is affected by federal rules, regulations and orders applicable to some of our customers who are government contractors.
A number of our products are manufactured and sold to customers who are parties to U.S. government contracts or subcontracts. Consequently, we are indirectly subject to various federal rules, regulations and orders applicable to government contractors. From time to time, we are also subject to government inquiries and investigations of our business practices due to our participation in government programs. These inquiries and investigations are costly and consuming of internal resources. Violations of applicable government rules and regulations could result in civil liability, in cancellation or suspension of existing contracts or in ineligibility for future contracts or subcontracts funded in whole or in part with federal funds, any of which could have a material adverse effect on our business.
We could be required to make additional contributions to our defined benefit pension plans as a result of adverse changes in interest rates and the capital markets.
Our estimates of liabilities and expenses for pension benefits incorporate significant assumptions, including the rate used to discount the future estimated liability, the long-term rate of return on plan assets and several assumptions relating to the employee workforce (salary increases, retirement age and mortality). We currently expect that we will be required to make future minimum contributions to our defined benefit pension plans. A decline in the value of plan investments in the future, an increase in costs or liabilities or unfavorable changes in laws or regulations that govern pension plan funding could materially change the timing and amount of required pension funding. A requirement to fund any deficit created in the future could have a material adverse effect on our operations and financial condition.
If we are unable to recruit, hire and retain skilled and experienced personnel, our ability to effectively manage and expand our business will be harmed.
Our success largely depends on the skills, experience and efforts of our officers and other key employees who may terminate their employment at any time. The loss of any of our senior management team could harm our business. The announcement of the loss of one of our key employees could negatively affect our stock price. Our ability to retain our skilled workforce and our success in attracting and hiring new skilled employees will be a critical factor in determining whether we will be successful in the future. We face challenges in hiring, training, managing and retaining employees in certain areas including metallurgical researchers, equipment technicians and sales and marketing staff. If we are unable to recruit, hire and retain skilled employees, our new product and alloy development and commercialization could be delayed and our marketing and sales efforts could be hindered, which would adversely impact our competitiveness and financial results.
24
The risks inherent in our international operations may adversely impact our revenues, results of operations and financial condition.
We anticipate that we will continue to derive a significant portion of our revenues from operations in international markets. As we continue to expand internationally, we will need to hire, train and retain qualified personnel for our direct sales efforts and retain distributors and train their personnel in countries where language, cultural or regulatory impediments may exist. Distributors, regulators or government agencies may not continue to accept our products, services and business practices. In addition, we purchase raw materials on the international market. The sale and shipment of our products and services across international borders, as well as the purchase of raw materials from international sources, subject us to the trade regulations of various jurisdictions. Compliance with such regulations is costly. Any failure to comply with applicable legal and regulatory obligations could impact us in a variety of ways that include, but are not limited to, significant criminal, civil and administrative penalties, including imprisonment of individuals, fines and penalties, denial of export privileges, seizure of shipments and restrictions on certain business activities. Failure to comply with applicable legal and regulatory obligations could result in the disruption of our shipping, sales and service activities. Our international sales operations expose us and our representatives, agents and distributors to risks inherent in operating in foreign jurisdictions any one or more of which may adversely affect our business and financial results, including:
- •
- our ability to obtain, and the costs associated with obtaining, U.S. export licenses and other required export or import
licenses or approvals;
- •
- changes in duties and tariffs, taxes, trade restrictions, license obligations and other non-tariff barriers to trade;
- •
- burdens of complying with the Foreign Corrupt Practices Act and a wide variety of foreign laws and regulations;
- •
- business practices or laws favoring local companies;
- •
- fluctuations in foreign currencies;
- •
- restrictive trade policies of foreign governments;
- •
- longer payment cycles and difficulties collecting receivables through foreign legal systems;
- •
- difficulties in enforcing or defending agreements and intellectual property rights; and
- •
- foreign political or economic conditions.
Any material decrease in our international revenues or inability to expand our international operations as a result of these or other factors would adversely impact our revenues, results of operations and financial condition.
Export sales could present risks to our business.
Export sales account for a significant percentage of our revenues, and we believe this will continue to be the case in the future. Risks associated with export sales include: political and economic instability, including weak conditions in the world's economies; accounts receivable collection; export controls; changes in legal and regulatory requirements; policy changes affecting the markets for our products; changes in tax laws and tariffs; trade duties; and exchange rate fluctuations (which may affect sales to international customers and the value of profits earned on export sales when converted into dollars). Any of these factors could materially adversely affect our results for the period in which they occur.
25
Although a collective bargaining agreement is in place for certain employees, union or labor disputes could still disrupt the manufacturing process.
Our operations rely heavily on our skilled employees. Any labor shortage, disruption or stoppage caused by any deterioration in employee relations or difficulties in the renegotiation of labor contracts could reduce our operating margins and income. Approximately 57% percent of our U.S. employees are affiliated with unions or covered by collective bargaining agreements. In fiscal 2013 the Company entered into new collective bargaining agreements with the United Steel Workers of America which covers eligible hourly employees at the Company's Arcadia, Louisiana, Kokomo, Indiana and Lebanon, Indiana facilities. Failure to negotiate new labor agreements when required could result in a work stoppage at one or more of our facilities. Although we believe that our labor relations have generally been satisfactory, it is possible that we could become subject to additional work rules imposed by agreements with labor unions, or that work stoppages or other labor disturbances could occur in the future, any of which could reduce our operating margins and income and place us at a disadvantage relative to non-union competitors.
Product liability and product warranty risks could adversely affect our operating results.
We produce many critical products for commercial and military aircraft and for land-based gas turbines. Failure of our products could give rise to substantial product liability and other damage claims. We maintain insurance addressing this risk, but there can be no assurance that the insurance coverage will be adequate or will continue to be available on terms acceptable to us.
Additionally, we manufacture our products to strict contractually-established specifications using complex manufacturing processes. If we fail to meet the contractual requirements for a product, we may be subject to warranty costs to repair or replace the product itself and additional costs related to customers' damages or the investigation and inspection of non-complying products. These costs are generally not insured.
Our business subjects us to risk of litigation claims, as a routine matter, and this risk increases the potential for a loss that might not be covered by insurance.
Litigation claims may relate to the conduct of our business, including claims pertaining to product liability, commercial disputes, employment actions, employee benefits, compliance with domestic and federal laws and personal injury. Due to the uncertainties of litigation, we might not prevail on claims made against us in the lawsuits that we currently face and additional claims may be made against us in the future. The outcome of litigation cannot be predicted with certainty, and some of these lawsuits, claims or proceedings may be determined adversely to us. The resolution in any reporting period of one or more of these matters could have a material adverse effect on our financial condition, liquidity or results of operations for that period.
We depend on our Information Technology (IT) infrastructure to support the current and future information requirements of our operations.
Management relies on IT infrastructure, including hardware, network, software, people and processes, to provide useful information to support assessments and conclusions about operating performance. We are in the process of implementing an IT system change. If we do not successfully or timely implement the new system or it does not operate as envisioned, our business could be harmed. Our inability to produce relevant or reliable measures of operating performance in an efficient, cost-effective and well-controlled fashion may have significant negative impacts on our future operations.
26
Any significant delay or problems in the expansion of our operations could materially adversely affect our business, financial condition and results of operations.
We are in the process of undertaking significant capital projects in order to enhance, expand and/or upgrade our facilities and operational capabilities. Our ability to achieve the anticipated increased revenues or otherwise realize acceptable returns on these investments or other strategic capital projects that we may undertake is subject to a number of risks, many of which are beyond our control, including the ability of management to ensure the necessary resources are in place to properly execute these projects on time and in accordance with planned costs, the ability of key suppliers to deliver the necessary equipment according to schedule and our ability to implement these projects with minimal impact to our existing operations. In addition, the cost to implement any given strategic capital project ultimately may prove to be greater than originally anticipated. If we are not able to achieve the anticipated results from the implementation of any of our strategic capital projects, or if we incur unanticipated implementation costs or delays, our results of operations and financial position may be materially adversely affected.
We consider acquisition, joint ventures and other business combination opportunities, as well as possible business unit dispositions, as part of our overall business strategy, which opportunities and dispositions involve uncertainties and potential risks that we cannot predict or anticipate fully.
We intend to continue to strategically position our businesses in order to improve our ability to compete. Strategies we employ to accomplish this may include seeking new or expanding existing specialty market niches for our products, expanding our global presence, acquiring businesses complementary to existing strengths and continually evaluating the performance and strategic fit of our existing business units. From time to time, management of the Company holds discussions with management of other companies to explore acquisitions, joint ventures, and other business combination opportunities as well as possible business unit dispositions. As a result, the relative makeup of our business is subject to change. Acquisitions, joint ventures and other business combinations involve various inherent risks, such as: assessing accurately the value, strengths, weaknesses, contingent and other liabilities and potential profitability of acquisition or other transaction candidates; the potential loss of key personnel of an acquired business; our ability to achieve identified financial and operating synergies anticipated to result from an acquisition or other transaction; and unanticipated changes in business and economic conditions affecting an acquisition or other transaction. International acquisitions could be affected by many factors, including, without limitation, export controls, exchange rate fluctuations, domestic and foreign political conditions and deterioration in domestic and foreign economic conditions.
A global recession or disruption in global financial markets could adversely affect us.
A global recession or disruption in the global financial markets presents risks and uncertainties that we cannot predict. During the recent recession, we saw a decline in demand for our products due to global economic conditions. During recessionary economic conditions or financial market disruptions, we face risks that may include:
- •
- declines in revenues and profitability from reduced or delayed orders by our customers;
- •
- supply problems associated with any financial constraints faced by our suppliers;
- •
- restrictions on our access to credit sources;
- •
- reductions to our banking group or to our committed credit availability due to combinations or failures of financial
institutions; and
- •
- increases in corporate tax rates to finance government spending programs.
27
Political and social turmoil could adversely affect our business.
The war on terrorism, as well as political and social turmoil, could put pressure on economic conditions in the United States and worldwide. These political, social and economic conditions could make it difficult for us, our suppliers and our customers to forecast accurately and plan future business activities, and could adversely affect the financial condition of our suppliers and customers and affect customer decisions as to the amount and timing of purchases from us. As a result, our business, financial condition and results of operations could be materially adversely affected.
Risks Related to Shares of Our Common Stock
Our stock price is subject to fluctuations as a result of being traded on a public exchange which may not be related to our performance.
The stock market can be highly volatile. The market price of our common stock is likely to be similarly volatile, and investors in our common stock may experience a decrease in the value of their stock, including decreases unrelated to our operating performance or prospects. The price of our common stock could be subject to wide fluctuations in response to a number of factors, including those described elsewhere in this "Risk Factors" section and those listed below:
- •
- fluctuations in the market price of nickel, raw materials or energy;
- •
- market conditions in the end markets into which our customers sell their products, principally aerospace, power
generation and chemical processing;
- •
- announcements of technological innovations or new products and services by us or our competitors;
- •
- the operating and stock price performance of other companies that investors may deem comparable to us;
- •
- announcements by us of acquisitions, alliances, joint development efforts or corporate partnerships in the
high-temperature resistant alloy and corrosion-resistant alloy markets;
- •
- market conditions in the technology, manufacturing or other growth sectors; and
- •
- rumors relating to us or our competitors.
Payment of dividends will depend on our future financial condition and performance.
Although our Board of Directors currently intends to continue the payment of regular quarterly cash dividends on shares of our common stock, the timing and amount of future dividends will depend on the Board's assessment of our operations, financial condition, projected liabilities, compliance with contractual restrictions in our credit agreement, restrictions imposed by applicable law and other factors. We cannot guarantee that we will continue to declare dividends at the same or similar rates.
Provisions of our certificate of incorporation and by-laws could discourage potential acquisition proposals and could deter or prevent a change in control.
Some provisions in our certificate of incorporation and by-laws, as well as Delaware statutes, may have the effect of delaying, deterring or preventing a change in control. These provisions, including those regulating the nomination of directors, may make it more difficult for other persons, without the approval of our Board of Directors, to launch takeover attempts that a stockholder might consider to be in his or her best interest. These provisions could limit the price that some investors might be willing to pay in the future for shares of our common stock.
28
Item 1B. Unresolved Staff Comments
There are no unresolved comments by the staff of the U.S. Securities and Exchange Commission.
Manufacturing Facilities. The Company owns manufacturing facilities in the following locations:
- •
- Kokomo, Indiana—manufactures and sells all product forms, other than tubular and wire goods;
- •
- Arcadia, Louisiana—manufactures and sells welded and seamless tubular goods; and
- •
- Mountain Home, North Carolina—manufactures and sells high-performance alloy wire.
The Kokomo plant, the Company's primary production facility, is located on approximately 180 acres of industrial property and includes over 1.0 million square feet of building space. There are three sites consisting of (1) a headquarters and research laboratory; (2) primary and secondary melting, annealing furnaces, forge press and several smaller hot mills; and (3) the Company's four-high Steckel rolling mill and sheet product cold working equipment, including two cold strip mills. All alloys and product forms other than tubular and wire goods are produced in Kokomo.
The Arcadia plant is located on approximately 42 acres of land, and includes 202,500 square feet of buildings on a single site. Arcadia uses feedstock produced in Kokomo to fabricate welded and seamless alloy pipe and tubing and purchases extruded tube hollows to produce seamless titanium tubing. Manufacturing processes at Arcadia require cold pilger mills, weld mills, draw benches, annealing furnaces and pickling facilities.
The Mountain Home plant is located on approximately 29 acres of land, and includes approximately 100,000 square feet of building space. The Mountain Home facility is primarily used to manufacture finished high-performance alloy wire. Finished wire products are also warehoused at this facility.
The owned facilities located in the United States are subject to a mortgage which secures the Company's obligations under its U.S. revolving credit facility with a group of lenders led by Wells Fargo Capital Finance, LLC. For more information, see Note 7 to the Consolidated Financial Statements included in this Annual Report on Form 10-K.
Service and Sales Centers. The service and sales centers, which stock and sell all product forms, contain equipment capable of precision laser and water jet processing services to cut and shape products to customers' precise specifications. The Company owns service and sales centers in the following locations:
- •
- Openshaw, England
- •
- Lenzburg, Switzerland
The Openshaw plant, located near Manchester, England, consists of approximately 5 acres of land and over 85,000 square feet of buildings on a single site.
In addition, the Company leases service and sales centers, which stock and sell all product forms, in the following locations:
- •
- La Mirada, California
- •
- Houston, Texas
- •
- Lebanon, Indiana
- •
- Shanghai, China
- •
- Windsor, Connecticut
29
Sales Centers. The Company leases sales centers, which sell all product forms, in the following locations:
- •
- Paris, France
- •
- Zurich, Switzerland
- •
- Singapore
- •
- Milan, Italy
- •
- Chennai, India
- •
- Tokyo, Japan
All owned and leased service and sales centers not described in detail above are single site locations and are less than 100,000 square feet. The Company is modifying its facilities to meet its current and future business needs. The Company plans to spend approximately $21 million over the course of fiscal 2015 and 2016 to restructure, consolidate and enhance capabilities at its service center operations.
The Company is subject to extensive federal, state and local laws and regulations. Future developments and increasingly stringent regulations could require the Company to make additional unforeseen expenditures for these matters. The Company is regularly involved in litigation, both as a plaintiff and as a defendant, relating to its business and operations. Such litigation includes, without limitations, federal and state EEOC administrative and judicial actions, litigation of commercial matters and litigation and administrative actions relating to environmental matters. For more information, see "Item 1. Business—Environmental Matters." Litigation and administrative actions may result in substantial costs and may divert management's attention and resources, and the level of future expenditures for legal matters cannot be determined with any degree of certainty. Nonetheless, based on the facts presently known, management does not expect expenditures for pending legal proceedings to have a material effect on the Company's financial position, results of operations or liquidity.
The Company is currently, and has in the past been, subject to claims involving personal injuries allegedly relating to its products or processes. For example, the Company is presently involved in two actions involving welding rod-related injuries, which were filed in California state court against numerous manufacturers, including the Company, in May 2006 and February 2007, respectively, alleging that the welding-related products of the defendant manufacturers harmed the users of such products through the inhalation of welding fumes containing manganese. The Company believes that it has defenses to these allegations and that, if the Company were found liable, the cases would not have a material effect on its financial position, results of operations or liquidity.
Item 4. Mine Safety Disclosures
Not Applicable.
30
Item 5. Market for Registrant's Common Equity, Related Stockholder Matters and Issuer Purchases of Equity Securities.
The Company's common stock is listed on the NASDAQ Global Market ("NASDAQ") and traded under the symbol "HAYN". The following table sets forth, for the periods indicated, the high and low closing prices for the Company's common stock as reported by NASDAQ as well as dividends declared.
Fiscal year ended September 30, 2014:
|
High | Low | Dividend | |||||||
|---|---|---|---|---|---|---|---|---|---|---|
Quarter ended September 30, 2014 |
$ | 57.99 | $ | 45.99 | $ | 0.22 | ||||
Quarter ended June 30, 2014 |
$ | 59.14 | $ | 50.81 | $ | 0.22 | ||||
Quarter ended March 31, 2014 |
$ | 54.40 | $ | 49.29 | $ | 0.22 | ||||
Quarter ended December 31, 2013 |
$ | 55.24 | $ | 45.88 | $ | 0.22 | ||||
Fiscal year ended September 30, 2013:
|
||||||||||
Quarter ended September 30, 2013 |
$ | 49.47 | $ | 44.23 | $ | 0.22 | ||||
Quarter ended June 30, 2013 |
$ | 54.95 | $ | 45.93 | $ | 0.22 | ||||
Quarter ended March 31, 2013 |
$ | 55.94 | $ | 50.00 | $ | 0.22 | ||||
Quarter ended December 31, 2012 |
$ | 54.13 | $ | 46.35 | $ | 0.22 | ||||
The range of the Company's closing common stock price on NASDAQ from October 1, 2013 to September 30, 2014 was $45.88 to $59.14. The closing price of the common stock was $45.99 on September 30, 2014.
As of November 1, 2014, there were approximately 40 holders of record of the Company's common stock.
Payment of dividends is permitted under the Company's existing financing agreement, although the U.S. revolving credit facility requires (i) prior notice to the agent, (ii) a fixed charge coverage ratio average for the previous twelve months which must be not less than 1.0 to 1.0, (applicable only for dividends greater than $20.0 million in any fiscal year) and (iii) that the Company have at least $18.0 million in availability, after payment, on the date the dividend payment is made. While it is the Company's intention to continue to pay quarterly cash dividends for fiscal 2015 and beyond, any decision to pay future cash dividends will be made by the Company's Board of Directors and will depend upon our earnings, financial condition and other factors.
Equity Compensation Plan Information
The following table provides information as of September 30, 2014 regarding shares of the Company's common stock issuable pursuant to its stock option and restricted stock plans:
Plan Category
|
Number of securities to be issued upon exercise of outstanding options, warrants and rights |
Weighted-average exercise price of outstanding options, warrants and rights |
Number of securities remaining available for future issuance under equity compensation plans (excluding securities reflected in the second column) |
|||||||
|---|---|---|---|---|---|---|---|---|---|---|
Equity compensation plans approved by security holders(1) |
282,001 | $ | 51.61 | 398,728 | (2) | |||||
- (1)
- For
a description of the Company's equity compensation plans, see Note 11 to the Consolidated Financial Statements in Item 8.
- (2)
- Includes (i) options to purchase 192,228 shares of common stock and (ii) 206,500 shares of restricted stock.
31
Cumulative Total Stockholder Return
The graph below compares the cumulative total stockholder return on the Company's common stock to the cumulative total return of the Russell 2000 Index, S&P MidCap 400 Index, and Peer Group for each of the last five fiscal years ended September 30. The cumulative total return assumes an investment of $100 on September 30, 2009 and the reinvestment of any dividends during the period. The Russell 2000 is a broad-based index that includes smaller market capitalization stocks. The S&P MidCap 400 Index is the most widely used index for mid-sized companies. Management believes that the S&P MidCap 400 is representative of companies with similar market and economic characteristics to Haynes. Furthermore, we also believe the Russell 2000 Index is representative of the Company's current market capitalization status and this index is also provided on a comparable basis. The companies included in the Peer Group Index are: Allegheny Technologies, Inc., RTI International Metals, Inc., Universal Stainless & Alloy Products, Inc., A. M. Castle & Co. and Carpenter Technology Corp. Management believes that the companies included in the Peer Group, taken as a whole, provide a meaningful comparison in terms of competition, product offerings and other relevant factors. The total stockholder return for the peer group is weighted according to the respective issuer's stock market capitalization at the beginning of each period.
COMPARISON OF 5 YEAR CUMULATIVE TOTAL RETURN
Among Haynes, The Russell 2000 Index, The S&P MidCap 400
Index and our Peer Group
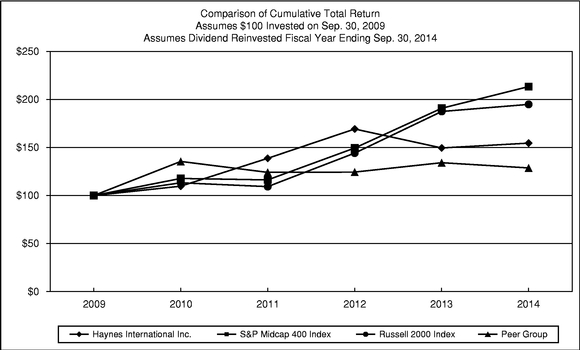
| |
2009 | 2010 | 2011 | 2012 | 2013 | 2014 | |||||||||||||
|---|---|---|---|---|---|---|---|---|---|---|---|---|---|---|---|---|---|---|---|
Haynes International, Inc. |
100.00 | 109.74 | 138.75 | 169.24 | 149.52 | 154.56 | |||||||||||||
Russell 2000 |
100.00 | 113.26 | 109.28 | 144.15 | 187.49 | 194.87 | |||||||||||||
S&P MidCap 400 |
100.00 | 117.78 | 116.28 | 149.46 | 190.83 | 213.38 | |||||||||||||
Peer Group |
100.00 | 135.49 | 124.12 | 124.43 | 134.18 | 128.73 | |||||||||||||
32
Item 6. Selected Financial Data
This information should be read in conjunction with "Management's Discussion and Analysis of Financial Condition and Results of Operations" and the consolidated financial statements and related notes thereto included elsewhere in this Annual Report on Form 10-K.
Amounts below are in thousands, except backlog, which is in millions, share and per share information and average nickel price.
| |
Year Ended September 30, | |||||||||||||||
|---|---|---|---|---|---|---|---|---|---|---|---|---|---|---|---|---|
| |
2010 | 2011 | 2012 | 2013 | 2014 | |||||||||||
Statement of Operations Data: |
||||||||||||||||
Net revenues |
$ | 381,543 | $ | 542,896 | $ | 579,561 | $ | 482,746 | $ | 455,410 | ||||||
Cost of sales |
327,712 | 449,116 | 458,721 | 409,120 | 408,112 | |||||||||||
Selling, general and administrative expense |
35,470 | 41,215 | 40,661 | 38,165 | 38,693 | |||||||||||
Research and technical expense |
2,828 | 3,259 | 3,285 | 3,505 | 3,556 | |||||||||||
Operating income |
15,533 | 49,306 | 76,894 | 31,956 | 5,049 | |||||||||||
Interest expense (income), net |
(59 | ) | (92 | ) | (101 | ) | (42 | ) | (71 | ) | ||||||
Provision for income taxes |
6,717 | 18,270 | 26,813 | 10,421 | 1,369 | |||||||||||
| | | | | | | | | | | | | | | | | |
Net income |
$ | 8,875 | $ | 31,128 | $ | 50,182 | $ | 21,577 | $ | 3,751 | ||||||
Net income per share: |
||||||||||||||||
Basic |
$ | 0.74 | $ | 2.55 | $ | 4.09 | $ | 1.75 | $ | 0.30 | ||||||
Diluted |
$ | 0.73 | $ | 2.54 | $ | 4.07 | $ | 1.74 | $ | 0.30 | ||||||
Dividends declared per common share |
$ | 0.80 | $ | 0.80 | $ | 0.88 | $ | 0.88 | $ | 0.88 | ||||||
Weighted average shares outstanding: |
||||||||||||||||
Basic |
12,049,779 | 12,067,555 | 12,147,179 | 12,223,838 | 12,291,881 | |||||||||||
Diluted |
12,159,529 | 12,149,866 | 12,216,031 | 12,265,630 | 12,321,700 | |||||||||||
| |
September 30, | |||||||||||||||
|---|---|---|---|---|---|---|---|---|---|---|---|---|---|---|---|---|
| |
2010 | 2011 | 2012 | 2013 | 2014 | |||||||||||
Balance Sheet Data: |
||||||||||||||||
Working capital |
$ | 300,199 | $ | 318,761 | $ | 350,032 | $ | 347,210 | $ | 322,591 | ||||||
Property, plant and equipment, net |
107,043 | 110,678 | 124,652 | 152,764 | 174,083 | |||||||||||
Total assets |
551,543 | 596,569 | 626,926 | 597,582 | 610,771 | |||||||||||
Total debt |
1,433 | 1,348 | 980 | 767 | 745 | |||||||||||
Long-term portion of debt |
1,324 | 1,348 | 980 | 767 | 745 | |||||||||||
Accrued pension and postretirement benefits(1) |
193,560 | 215,432 | 236,552 | 167,177 | 177,797 | |||||||||||
Stockholders' equity |
265,849 | 272,853 | 301,098 | 355,803 | 346,730 | |||||||||||
Cash dividends paid |
9,707 | 9,758 | 10,803 | 10,849 | 10,906 | |||||||||||
| |
2010 | 2011 | 2012 | 2013 | 2014 | |||||||||||
|---|---|---|---|---|---|---|---|---|---|---|---|---|---|---|---|---|
Consolidated Backlog at Fiscal Quarter End(2): |
||||||||||||||||
1st quarter |
$ | 110.4 | $ | 167.0 | $ | 261.8 | $ | 211.7 | $ | 180.2 | ||||||
2nd quarter |
124.6 | 241.7 | 264.2 | 207.0 | 202.3 | |||||||||||
3rd quarter |
130.9 | 288.6 | 241.2 | 189.6 | 204.7 | |||||||||||
4th quarter |
148.0 | 273.4 | 222.9 | 166.6 | 221.3 | |||||||||||
| |
Year Ended September 30, | |||||||||||||||
|---|---|---|---|---|---|---|---|---|---|---|---|---|---|---|---|---|
| |
2010 | 2011 | 2012 | 2013 | 2014 | |||||||||||
Average nickel price per pound(3) |
$ | 10.26 | $ | 9.25 | $ | 7.81 | $ | 6.25 | $ | 8.20 | ||||||
- (1)
- Significant increases in the pension and postretirement benefits liability occurred in fiscal years 2010, 2011 and 2012 primarily due to reductions in the discount rate used to value the future liability. This has been reflected actuarially as an increase in the Pension and Postretirement Benefits Liability and an increase in the accumulated Other Comprehensive Loss account. In fiscal 2013, the discount rate increased, causing a decrease in the liability. In fiscal 2014, the discount rate decreased, causing an increase in the liability. On a prospective basis, if interest rates were to rise, this would cause a decrease in the liability and accumulated other comprehensive loss. Prior to
33
fiscal 2009, many actions were taken to reduce this liability such as: i) effective second quarter of fiscal 2007, capping the Company's contributions to the retiree health care costs at $5,000 annually (resulting in a $46,300 liability reduction), ii) effective first quarter of fiscal 2008, freezing the pension benefit accruals for all non-union employees in the U.S. (resulting in an $8,191 liability reduction), and iii) closing the pension plans to new entrants for both non-union employees (effective 12/31/2005) and union ebmployees (effective 6/30/2007).
- (2)
- The
Company defines backlog to include firm commitments from customers for delivery of product at established prices. Approximately 30% of the
orders in the backlog at any given time include prices that are subject to adjustment based on changes in raw material costs. Historically, approximately 75% of the backlog orders have shipped within
six months and approximately 90% have shipped within 12 months. The backlog figures do not typically reflect that portion of the business conducted at service and sales centers on a spot or
"just-in-time" basis.
- (3)
- Represents the average price for a cash buyer as reported by the London Metals Exchange for the 30 days ending on the last day of the period presented.
34
Item 7. Management's Discussion and Analysis of Financial Condition and Results of Operations
Please refer to page 1 of this Annual Report on Form 10-K for a cautionary statement regarding forward-looking information.
Overview of Business
The Company is one of the world's largest producers of high-performance nickel- and cobalt-based alloys in flat product form, such as sheet, coil and plate. The Company is focused on developing, manufacturing, marketing and distributing technologically advanced, high-performance alloys, which are used primarily in the aerospace, chemical processing and land-based gas turbine industries. The global specialty alloy market consists of three primary sectors: stainless steel, general purpose nickel alloys and high-performance nickel- and cobalt-based alloys. The Company competes primarily in the high-performance nickel- and cobalt-based alloy sector, which includes high-temperature resistant alloys, or HTA products, and corrosion-resistant alloys, or CRA products. The Company believes it is one of the principal producers of high-performance alloy flat products in sheet, coil and plate forms. The Company also produces its products as seamless and welded tubulars and in bar, billet and wire forms.
The Company has manufacturing facilities in Kokomo, Indiana; Arcadia, Louisiana; and Mountain Home, North Carolina. The Kokomo facility specializes in flat products, the Arcadia facility specializes in tubular products and the Mountain Home facility specializes in high-performance wire products. The Company distributes its products primarily through its direct sales organization, which includes 13 service and/or sales centers in the United States, Europe and Asia. All of these centers are Company-operated.
35
Overview of Markets
The following table includes a breakdown of net revenues, shipments and average selling prices to the markets served by the Company for the periods shown.
| |
Year Ended September 30, | ||||||||||||||||||||||||||||||
|---|---|---|---|---|---|---|---|---|---|---|---|---|---|---|---|---|---|---|---|---|---|---|---|---|---|---|---|---|---|---|---|
| |
2010 | 2011 | 2012 | 2013 | 2014 | ||||||||||||||||||||||||||
| |
Amount | % of Total |
Amount | % of Total |
Amount | % of Total |
Amount | % of Total |
Amount | % of Total |
|||||||||||||||||||||
Net Revenues |
|||||||||||||||||||||||||||||||
Aerospace |
$ | 138.4 | 36.3 | % | $ | 203.5 | 37.5 | % | $ | 229.9 | 39.7 | % | $ | 197.1 | 40.8 | % | $ | 195.2 | 42.9 | % | |||||||||||
Chemical processing |
87.7 | 23.0 | 150.0 | 27.6 | 134.6 | 23.2 | 124.1 | 25.7 | 113.4 | 24.9 | |||||||||||||||||||||
Land-based gas turbines |
74.2 | 19.4 | 98.2 | 18.1 | 119.2 | 20.5 | 102.0 | 21.2 | 86.7 | 19.0 | |||||||||||||||||||||
Other markets |
68.1 | 17.8 | 76.7 | 14.1 | 81.6 | 14.1 | 48.9 | 10.1 | 44.4 | 9.8 | |||||||||||||||||||||
| | | | | | | | | | | | | | | | | | | | | | | | | | | | | | | | |
Total product |
368.4 | 96.5 | 528.4 | 97.3 | 565.3 | 97.5 | 472.1 | 97.8 | 439.7 | 96.6 | |||||||||||||||||||||
Other revenue(1) |
13.1 | 3.5 | 14.5 | 2.7 | 14.3 | 2.5 | 10.6 | 2.2 | 15.7 | 3.4 | |||||||||||||||||||||
| | | | | | | | | | | | | | | | | | | | | | | | | | | | | | | | |
Net revenues |
$ | 381.5 | 100.0 | % | $ | 542.9 | 100.0 | % | $ | 579.6 | 100.0 | % | $ | 482.7 | 100.0 | % | $ | 455.4 | 100.0 | % | |||||||||||
| | | | | | | | | | | | | | | | | | | | | | | | | | | | | | | | |
| | | | | | | | | | | | | | | | | | | | | | | | | | | | | | | | |
U.S. |
$ | 231.6 | 60.7 | % | $ | 344.9 | 63.5 | % | $ | 346.7 | 59.8 | % | $ | 268.0 | 55.5 | % | $ | 261.6 | 57.4 | % | |||||||||||
Foreign |
$ | 149.9 | 39.3 | % | $ | 198.0 | 36.5 | % | $ | 232.9 | 40.2 | % | $ | 214.7 | 44.5 | % | $ | 193.8 | 42.6 | % | |||||||||||
Shipments by Market (millions of pounds) |
|||||||||||||||||||||||||||||||
Aerospace |
6.0 | 33.7 | % | 8.1 | 34.3 | % | 8.9 | 38.1 | % | 8.1 | 38.5 | % | 8.8 | 40.7 | % | ||||||||||||||||
Chemical processing |
4.2 | 23.6 | 7.0 | 29.7 | 5.3 | 22.6 | 5.2 | 24.8 | 5.2 | 24.2 | |||||||||||||||||||||
Land-based gas turbines |
4.6 | 25.8 | 5.5 | 23.3 | 6.5 | 27.8 | 6.1 | 29.1 | 5.9 | 27.2 | |||||||||||||||||||||
Other markets |
3.0 | 16.9 | 3.0 | 12.7 | 2.7 | 11.5 | 1.6 | 7.6 | 1.7 | 7.9 | |||||||||||||||||||||
| | | | | | | | | | | | | | | | | | | | | | | | | | | | | | | | |
Total Shipments |
17.8 | 100.0 | % | 23.6 | 100.0 | % | 23.4 | 100.0 | % | 21.0 | 100.0 | % | 21.7 | 100.0 | % | ||||||||||||||||
| | | | | | | | | | | | | | | | | | | | | | | | | | | | | | | | |
| | | | | | | | | | | | | | | | | | | | | | | | | | | | | | | | |
Average Selling Price Per Pound |
|||||||||||||||||||||||||||||||
Aerospace |
$ | 23.16 | $ | 25.07 | $ | 25.73 | $ | 24.31 | $ | 22.10 | |||||||||||||||||||||
Chemical processing |
20.84 | 21.53 | 25.49 | 23.79 | 21.63 | ||||||||||||||||||||||||||
Land-based gas turbines |
16.15 | 17.71 | 18.28 | 16.66 | 14.74 | ||||||||||||||||||||||||||
Other markets |
22.37 | 25.56 | 30.78 | 30.69 | 26.11 | ||||||||||||||||||||||||||
Total product(2) |
20.67 | 22.36 | 24.17 | 22.44 | 20.30 | ||||||||||||||||||||||||||
Total average selling price |
21.41 | 22.97 | 24.78 | 22.94 | 21.02 | ||||||||||||||||||||||||||
- (1)
- Other
revenue consists of toll conversion, royalty income, scrap sales and revenue recognized from the TIMET agreement (see Note 15 in
the Notes to the Consolidated Financial Statements).
- (2)
- Total product price per pound excludes "Other Revenue".
Aerospace sales decreased over fiscal 2013 and 2014, due to aerospace demand being negatively impacted by customer destocking within the supply-chain. This period of low demand began to recover in the latter half of fiscal 2014. Demand for aerospace products is increasing in line with the forecasted increase in commercial aircraft builds. Both Boeing and Airbus have reported sizeable backlog increases along with forecasted increases in production schedules and continued emphasis on accelerating production. Demand for more fuel-efficient engines with fewer emissions is driving new engine builds. Management also anticipates that the maintenance, repair and overhaul business will continue at a steady to increasing pace due to required maintenance schedules for the rising number of engines in use year-over-year.
Sales to the chemical processing industry decreased over fiscal 2012, 2013 and 2014. The project-oriented nature of this market can create inconsistent sales levels. Demand for large project-based orders has been at relatively low levels during fiscal 2012, 2013 and 2014. The main driver of demand in this market is capital spending in the chemical processing sector driven by end-user demand for housing, automotive, energy and agricultural products. The chemical processing market is sensitive to fiscal policies as well as world economic conditions and GDP growth. Potential for increased sales to the chemical processing industry in fiscal 2015 will be dependent on improvement in global spending in the chemical processing sector. An additional driver of demand in this market is the increase in North American production of natural gas liquids and the further downstream processing of those chemicals that may utilize equipment that requires high-performance alloys.
36
Sales to the land-based gas turbine market decreased over fiscal 2013 and 2014. However, fiscal 2012 and 2013 were two of the Company's best years for land-based gas turbine sales volume. Subject to global economic conditions, management believes that long-term demand in this market will increase due to higher activity in power generation, oil and gas production and alternative power systems. Land-based gas turbines are favored in electric generating facilities due to low capital cost at installation, fewer emissions than the traditional fossil fuel-fired facilities and favorable natural gas prices provided by availability of unconventional (shale) gas supplies. As governmental policy shifts away from coal-fired facilities, demand for land-based gas turbines is expected to increase.
Sales into the other markets category decreased over fiscal 2013 and 2014. The industries in this category focus on upgrading overall quality, improving product performance through increased efficiency, prolonging product life and lowering long-term costs. Companies in these industries are looking to achieve these goals through the use of "advanced materials" which supports the increased use of high-performance alloys in an expanding number of applications. In addition to supporting and expanding the traditional businesses of oil and gas, flue-gas desulphurization in China, automotive and heat treating, the Company expects increased levels of activity overall in non-traditional markets such as fuel cells and silicon feed-stock production applications.
Summary of Capital Spending
The Company is nearing completion of a $61.0 million investment at two of its U.S. manufacturing facilities. This includes a $37.0 million investment to expand by an estimated 60% the tubular production capacity of specialty titanium and high-performance nickel alloy tubular products at the Arcadia, Louisiana facility. In addition, the Company made an investment of $24.0 million to expand by an estimated 20% its flat products capacity to produce specialty high-performance alloy flat products at the Kokomo, Indiana facility. Both of these projects are in the commissioning stage and are expected to be released for production by the end of the first quarter of fiscal 2015. These capital investments in Arcadia and Kokomo are expected to improve the Company's ability to service its customers' increasing demand for specialty products and also continue to improve product quality, improve operating efficiencies and enhance working capital management for all of the Company's products produced at these locations.
The Company is also implementing a global information technology system. This upgrade is expected to provide the Company with an integrated global system, enhanced analysis capability and improved capabilities in capacity planning, inventory management and customer service. To date, the Company has spent $10.7 million on the project and expects to spend approximately $1.8 million in fiscal 2015 for a total of approximately $12.5 million. The system is currently in use at the European service centers and has been implemented in the U.S. for general ledger, accounts payable and purchasing. The Company's domestic service center operations, U.S. shipping, order entry, accounts receivable and credit/collections is being implemented in the first quarter of fiscal 2015. The systems upgrade for the main manufacturing operating system is expected to be implemented during the second and third quarters of fiscal 2015.
The Company's evaluation of its global service center and distribution continues. The evaluation has included an analysis of the equipment required, the number and geographic locations of these service centers, the services provided and the cost structure, with the objective of enhancing the distribution organization and service center capabilities. The Company has entered into a definitive agreement to purchase the assets and operations of Leveltek Processing, LLC located in LaPorte, Indiana. These assets include coil processing capability with stretch leveling and cut-to-length capability. This transaction is expected to close in the second quarter of fiscal 2015.
Capital spending in fiscal 2014 was $39.7 million, and the forecast for capital spending in fiscal 2015 is approximately $22.0 million, excluding the above-mentioned acquisition of the Leveltek assets. The $22.0 million of planned capital spending includes $5.0 million to complete the above-mentioned manufacturing expansions as well as the global IT system. The remaining $17.0 million of planned
37
spending is earmarked for continued upgrades throughout our manufacturing facilities, and this level of spending is considered a maintenance level of spending.
Gross Profit Margin Trend Performance
The following tables show net revenue, gross profit margin and gross profit margin percentage for fiscal 2013 and fiscal 2014.
| |
Trend of Gross Profit Margin and Gross Profit Margin Percentage for Fiscal 2013 |
||||||||||||
|---|---|---|---|---|---|---|---|---|---|---|---|---|---|
| |
Quarter Ended | ||||||||||||
(dollars in thousands)
|
December 31, 2012 |
March 31, 2013 |
June 30, 2013 |
September 30, 2013 |
|||||||||
Net Revenues |
$ | 114,300 | $ | 129,201 | $ | 123,587 | $ | 115,658 | |||||
Gross Profit Margin |
$ | 18,774 | $ | 20,084 | $ | 18,605 | $ | 16,163 | |||||
Gross Profit Margin % |
16.4 | % | 15.5 | % | 15.1 | % | 14.0 | % | |||||
| |
Trend of Gross Profit Margin and Gross Profit Margin Percentage for Fiscal 2014 |
||||||||||||
|---|---|---|---|---|---|---|---|---|---|---|---|---|---|
| |
Quarter Ended | ||||||||||||
(dollars in thousands)
|
December 31, 2013 |
March 31, 2014 |
June 30, 2014 |
September 30, 2014 |
|||||||||
Net Revenues |
$ | 93,700 | $ | 115,350 | $ | 126,293 | $ | 120,067 | |||||
Gross Profit Margin |
$ | 5,250 | $ | 9,064 | $ | 14,061 | $ | 18,923 | |||||
Gross Profit Margin % |
5.6 | % | 7.9 | % | 11.1 | % | 15.8 | % | |||||
The gross margin in the fourth quarter of fiscal 2014 was $18.9 million or 15.8% of net revenues, a sequential increase of $4.8 million from the $14.1 million or 11.1% of net revenues in the third quarter of fiscal 2014. The margin compression that occurred over the course of fiscal 2013 and the first part of 2014 was primarily related to lower average selling prices resulting from price competition in the marketplace, lower volumes, and the impact of declining raw material prices in prior periods, resulting in higher-cost inventory charged to cost of sales. The margin compression was most pronounced in the first and second quarters of fiscal 2014, but the pressure on margins began to lessen in the third and fourth quarters of fiscal 2014 due to strengthening of pricing along with an increase in volumes processed through the Kokomo mill, which has resulted in improved absorption of fixed costs. Gross margin recovery is expected to continue over the course of fiscal 2015 as pricing continues to strengthen and volumes continue to improve.
Volumes, Competition and Pricing
Business conditions appear to be improving. The Company's backlog increased 32.8% during fiscal 2014. Throughout the first quarter and a portion of the second quarter, the Company experienced reduced demand and reduced selling prices due to the market price of nickel and increased price competition in the marketplace, particularly in commodity-type alloys. The intense competitive environment required the Company to aggressively price orders across all markets, which unfavorably impacted the Company's gross profit margin and net income in those quarters. In addition, sales volumes below mill capacities in the industry reduced mill-direct lead times. The decline in mill-direct lead times, in turn, resulted in downward pressure on prices for service center transactional business, which typically commands a higher price due to faster product availability. In the third and fourth quarters, the Company saw higher transactional business through its service centers, and mills in the industry are beginning to experience higher volumes.
Over the course of fiscal year 2013 and the beginning of fiscal year 2014, the market price of nickel declined, which periodically causes customers to delay placing orders for the Company's products because the Company generally passes the cost of nickel on to customers in the price of its products. As nickel
38
prices decline, customers may delay ordering in order to receive a lower price in the future. In the latter part of the second quarter of fiscal 2014, the market price of nickel began increasing, which typically accelerates the ordering patterns of the Company's customers. Customer demand is beginning to solidify, and management believes that destocking within the aerospace and land-based gas turbine supply chains has subsided. The Company has announced price increases in response to the strengthening business conditions. These price increases are beginning to expand margins, however, tempering this increase are lower margin orders shipped out of the backlog that were taken during previous time periods of compressed pricing.
The Company values inventory utilizing the first-in, first-out ("FIFO") inventory costing methodology. Under the FIFO inventory costing method, the cost of materials included in cost of sales may be different than the current market price at the time of sale of finished product due to the length of time from the acquisition of the raw material to the sale of the finished product. In a period of decreasing raw material costs, the FIFO inventory valuation normally results in higher costs of sales as compared to the last-in, first out method. Conversely, in a period of rising raw material costs, the FIFO inventory valuation normally results in lower costs of sales.
Working Capital
Controllable working capital, which includes accounts receivable, inventory, accounts payable and accrued expenses, was $271.3 million at September 30, 2014, a decrease of $2.1 million or 0.8% from $273.4 million at September 30, 2013. This decrease of $2.1 million includes an increase in inventory of $21.9 million partially offset by an increase in accounts payable of $14.4 million and a decrease in accounts receivable of $10.1 million. The increase in inventory is in response to improving backlog and business conditions.
Dividends Declared
On November 20, 2014, the Company announced that the Board of Directors declared a regular quarterly cash dividend of $0.22 per outstanding share of the Company's common stock. The dividend is payable December 15, 2014 to stockholders of record at the close of business on December 1, 2014. The aggregate cash payout based on current shares outstanding will be approximately $2.7 million, or approximately $10.8 million on an annualized basis.
Backlog
Set forth below is selected data relating to the Company's backlog, the 30-day average nickel price per pound as reported by the London Metals Exchange, as well as a breakdown of net revenues, shipments and average selling prices to the markets served by the Company for the periods shown. This data should be read in conjunction with the consolidated financial statements and related notes thereto and the remainder of the "Management's Discussion and Analysis of Financial Condition and Results of Operations" included in this Annual Report on Form 10-K.
| |
Quarter Ended | Quarter Ended | |||||||||||||||||||||||
|---|---|---|---|---|---|---|---|---|---|---|---|---|---|---|---|---|---|---|---|---|---|---|---|---|---|
| |
December 31, 2012 |
March 31, 2013 |
June 30, 2013 |
September 30, 2013 |
December 31, 2013 |
March 31, 2014 |
June 30, 2014 |
September 30, 2014 |
|||||||||||||||||
Backlog |
|||||||||||||||||||||||||
Dollars (in thousands) |
$ | 211,726 | $ | 206,994 | $ | 189,628 | $ | 166,589 | $ | 180,150 | $ | 202,283 | $ | 204,680 | $ | 221,322 | |||||||||
Pounds (in thousands) |
6,905 | 7,362 | 6,185 | 5,371 | 5,875 | 7,520 | 8,240 | 7,835 | |||||||||||||||||
Average selling price per pound |
$ | 30.66 | $ | 28.12 | $ | 30.66 | $ | 31.02 | $ | 30.66 | $ | 26.90 | $ | 24.84 | $ | 28.25 | |||||||||
Average nickel price per pound |
|||||||||||||||||||||||||
London Metals Exchange(1) |
$ | 7.90 | $ | 7.59 | $ | 6.47 | $ | 6.25 | $ | 6.31 | $ | 7.10 | $ | 8.42 | $ | 8.20 | |||||||||
- (1)
- Represents the average price for a cash buyer as reported by the London Metals Exchange for the 30 days ending on the last day of the period presented.
39
Backlog was $221.3 million at September 30, 2014, an increase of approximately $16.6 million, or 8.1%, from $204.7 million at June 30, 2014. The backlog dollars increased during the fourth quarter of fiscal 2014 due to a 13.7% increase in backlog average selling price partially offset by a 4.9% decrease in backlog pounds.
On a year-to-date basis, the backlog has increased by $54.7 million, or 32.8%, from $166.6 million at September 30, 2013. The backlog dollars increased during fiscal 2014 due to a 45.8% increase in backlog pounds partially offset by an 8.9% decrease in backlog average selling price.
Management believes that the improved order entry levels over the past few quarters are due to customers increasing their stock levels to accommodate the demand in the Company's end markets. In addition, the Company has implemented price increases which are beginning to improve the quality of the backlog, but may slightly temper the order entry rates as the Company manages mix to better pricing levels.
Quarterly Market Information
| |
Quarter Ended | Quarter Ended | |||||||||||||||||||||||
|---|---|---|---|---|---|---|---|---|---|---|---|---|---|---|---|---|---|---|---|---|---|---|---|---|---|
| |
December 31, 2012 |
March 31, 2013 |
June 30, 2013 |
September 30, 2013 |
December 31, 2013 |
March 31, 2014 |
June 30, 2014 |
September 30, 2014 |
|||||||||||||||||
Net revenues (in thousands) |
|||||||||||||||||||||||||
Aerospace |
$ | 52,272 | $ | 49,319 | $ | 51,015 | $ | 44,498 | $ | 39,951 | $ | 47,257 | $ | 54,177 | $ | 53,776 | |||||||||
Chemical processing |
26,287 | 33,895 | 31,824 | 32,084 | 23,073 | 30,436 | 30,570 | 29,330 | |||||||||||||||||
Land-based gas turbines |
22,628 | 30,248 | 24,199 | 24,982 | 18,145 | 21,756 | 24,989 | 21,853 | |||||||||||||||||
Other markets |
10,618 | 12,034 | 14,677 | 11,591 | 9,403 | 11,389 | 12,626 | 10,993 | |||||||||||||||||
| | | | | | | | | | | | | | | | | | | | | | | | | | |
Total product revenue |
111,805 | 125,496 | 121,715 | 113,155 | 90,572 | 110,838 | 122,362 | 115,952 | |||||||||||||||||
Other revenue |
2,495 | 3,705 | 1,872 | 2,503 | 3,128 | 4,512 | 3,931 | 4,115 | |||||||||||||||||
| | | | | | | | | | | | | | | | | | | | | | | | | | |
Net revenues |
$ | 114,300 | $ | 129,201 | $ | 123,587 | $ | 115,658 | $ | 93,700 | $ | 115,350 | $ | 126,293 | $ | 120,067 | |||||||||
| | | | | | | | | | | | | | | | | | | | | | | | | | |
| | | | | | | | | | | | | | | | | | | | | | | | | | |
Shipments by markets (in thousands of pounds) |
|||||||||||||||||||||||||
Aerospace |
2,116 | 1,981 | 2,077 | 1,933 | 1,630 | 2,226 | 2,577 | 2,399 | |||||||||||||||||
Chemical processing |
986 | 1,429 | 1,386 | 1,414 | 1,121 | 1,528 | 1,369 | 1,224 | |||||||||||||||||
Land-based gas turbines |
1,261 | 1,809 | 1,599 | 1,458 | 1,206 | 1,515 | 1,641 | 1,524 | |||||||||||||||||
Other markets |
322 | 362 | 478 | 432 | 362 | 423 | 470 | 446 | |||||||||||||||||
| | | | | | | | | | | | | | | | | | | | | | | | | | |
Total shipments |
4,685 | 5,581 | 5,540 | 5,237 | 4,319 | 5,692 | 6,057 | 5,593 | |||||||||||||||||
| | | | | | | | | | | | | | | | | | | | | | | | | | |
| | | | | | | | | | | | | | | | | | | | | | | | | | |
Average selling price per pound |
|||||||||||||||||||||||||
Aerospace |
$ | 24.70 | $ | 24.90 | $ | 24,56 | $ | 23.02 | $ | 24.51 | $ | 21.23 | $ | 21.02 | $ | 22.42 | |||||||||
Chemical processing |
26.66 | 23.72 | 22.96 | 22.69 | 20.58 | 19.92 | 22.33 | 23.96 | |||||||||||||||||
Land-based gas turbines |
17.94 | 16.72 | 15.13 | 17.13 | 15.05 | 14.36 | 15.23 | 14.34 | |||||||||||||||||
Other markets |
32.98 | 33.24 | 30.71 | 26.83 | 25.98 | 26.92 | 26.86 | 24.65 | |||||||||||||||||
Total average selling price (product only; excluding other revenue) |
23.86 | 22.49 | 21.97 | 21.61 | 20.97 | 19.47 | 20.20 | 20.73 | |||||||||||||||||
Total average selling price (including other revenue) |
24.40 | 23.15 | 22.31 | 22.08 | 21.69 | 20.27 | 20.85 | 21.47 | |||||||||||||||||
40
Results of Operations
Year Ended September 30, 2014 Compared to Year Ended September 30, 2013
($ in thousands)
| |
Year Ended September 30, | Change | |||||||||||||||||
|---|---|---|---|---|---|---|---|---|---|---|---|---|---|---|---|---|---|---|---|
| |
2013 | 2014 | Amount | % | |||||||||||||||
Net revenues |
$ | 482,746 | 100.0 | % | $ | 455,410 | 100.0 | % | $ | (27,336 | ) | (5.7 | )% | ||||||
Cost of sales |
409,120 | 84.7 | % | 408,112 | 89.6 | % | (1,008 | ) | (0.2 | )% | |||||||||
| | | | | | | | | | | | | | | | | | | | |
Gross profit |
73,626 | 15.3 | % | 47,298 | 10.4 | % | (26,328 | ) | (35.8 | )% | |||||||||
Selling, general and administrative expense |
38,165 | 7.9 | % | 38,693 | 8.5 | % | 528 | 1.4 | % | ||||||||||
Research and technical expense |
3,505 | 0.7 | % | 3,556 | 0.8 | % | 51 | 1.5 | % | ||||||||||
| | | | | | | | | | | | | | | | | | | | |
Operating income |
31,956 | 6.7 | % | 5,049 | 1.1 | % | (26,907 | ) | (84.2 | )% | |||||||||
Interest income |
(114 | ) | 0.0 | % | (139 | ) | 0.0 | % | (25 | ) | 21.9 | % | |||||||
Interest expense |
72 | 0.0 | % | 68 | 0.0 | % | (4 | ) | (5.6 | )% | |||||||||
| | | | | | | | | | | | | | | | | | | | |
Income before income taxes |
31,998 | 6.7 | % | 5,120 | 1.1 | % | (26,878 | ) | (84.0 | )% | |||||||||
Provision for income taxes |
10,421 | 2.2 | % | 1,369 | 0.3 | % | (9,052 | ) | (86.9 | )% | |||||||||
| | | | | | | | | | | | | | | | | | | | |
Net income |
$ | 21,577 | 4.5 | % | $ | 3,751 | 0.8 | % | $ | (17,826 | ) | (82.6 | )% | ||||||
| | | | | | | | | | | | | | | | | | | | |
| | | | | | | | | | | | | | | | | | | | |
Net income per share: |
|||||||||||||||||||
Basic |
$ | 1.75 | $ | 0.30 | |||||||||||||||
Diluted |
$ | 1.74 | $ | 0.30 | |||||||||||||||
Weighted average shares outstanding: |
|||||||||||||||||||
Basic |
12,223,838 | 12,291,881 | |||||||||||||||||
Diluted |
12,265,630 | 12,321,700 | |||||||||||||||||
The following table includes a breakdown of net revenues, shipments and average selling prices to the markets served by the Company for the periods shown.
41
By market
| |
Year Ended September 30, |
Change | |||||||||||
|---|---|---|---|---|---|---|---|---|---|---|---|---|---|
| |
2013 | 2014 | Amount | % | |||||||||
Net revenues (dollars in thousands) |
|||||||||||||
Aerospace |
$ | 197,104 | $ | 195,161 | $ | (1,943 | ) | (1.0 | )% | ||||
Chemical processing |
124,090 | 113,409 | (10,681 | ) | (8.6 | )% | |||||||
Land-based gas turbines |
102,057 | 86,743 | (15,314 | ) | (15.0 | )% | |||||||
Other markets |
48,920 | 44,411 | (4,509 | ) | (9.2 | )% | |||||||
| | | | | | | | | | | | | | |
Total product revenue |
472,171 | 439,724 | (32,447 | ) | (6.9 | )% | |||||||
Other revenue |
10,575 | 15,686 | 5,111 | 48.3 | % | ||||||||
| | | | | | | | | | | | | | |
Net revenues |
$ | 482,746 | $ | 455,410 | $ | (27,336 | ) | (5.7 | )% | ||||
| | | | | | | | | | | | | | |
| | | | | | | | | | | | | | |
Pounds by market (in thousands) |
|||||||||||||
Aerospace |
8,107 | 8,832 | 725 | 8.9 | % | ||||||||
Chemical processing |
5,215 | 5,242 | 27 | 0.5 | % | ||||||||
Land-based gas turbines |
6,127 | 5,886 | (241 | ) | (3.9 | )% | |||||||
Other markets |
1,594 | 1,701 | 107 | 6.7 | % | ||||||||
| | | | | | | | | | | | | | |
Total shipments |
21,043 | 21,661 | 618 | 2.9 | % | ||||||||
| | | | | | | | | | | | | | |
| | | | | | | | | | | | | | |
Average selling price per pound |
|||||||||||||
Aerospace |
$ | 24.31 | $ | 22.10 | $ | (2.21 | ) | (9.1 | )% | ||||
Chemical processing |
23.79 | 21.63 | (2.16 | ) | (9.1 | )% | |||||||
Land-based gas turbines |
16.66 | 14.74 | (1.92 | ) | (11.5 | )% | |||||||
Other markets |
30.69 | 26.11 | (4.58 | ) | (14.9 | )% | |||||||
Total product (excluding other revenue) |
22.44 | 20.30 | (2.14 | ) | (9.5 | )% | |||||||
Total average selling price (including other revenue) |
$ | 22.94 | $ | 21.02 | $ | (1.92 | ) | (8.4 | )% | ||||
Net Revenues. Net revenues were $455.4 million in fiscal 2014, a decrease of 5.7% from $482.7 million in fiscal 2013, due to a decrease in average selling price per pound partially offset by an increase in volume. The total average selling price was $21.02 per pound in fiscal 2014, a decrease of 8.4%, or $1.92, from $22.94 per pound in fiscal 2013. Volume was 21.7 million pounds in fiscal 2014, an increase of 2.9% from 21.0 million pounds in fiscal 2013. The increase in volume is due primarily to a project that shipped in fiscal 2014 of lower-priced product in ingot form. Average selling price decreased due to a combination of the following factors: a change to a lower value product mix, which represented approximately $0.82 per pound of the decrease; a higher level of price competition and reduced customer demand due to supply chain destocking and fluctuating nickel prices, which forced us to reduce prices in order to be competitive, representing approximately $1.53 per pound of the decrease; partially offset by higher volume of conversion and miscellaneous sales, which represented an increase of approximately $0.24 per pound along with higher raw material market prices, which represented an increase of approximately $0.19 per pound.
Sales to the aerospace market were $195.2 million in fiscal 2014, a decrease of 1.0% from $197.1 million in fiscal 2013, due to an 8.9% increase in volume offset by a 9.1%, or $2.21, decrease in the average selling price per pound. The increase in volume is due primarily to a project that shipped in fiscal 2014 of lower-priced product in ingot form. The average selling price per pound decline primarily reflects continued price competition, which represented approximately $1.25 of the decrease, and the impact of the large ingot project, which represented approximately $0.95 of the decrease.
Sales to the chemical processing market were $113.4 million in fiscal 2014, a decrease of 8.6% from $124.1 million in fiscal 2013, due to a 9.1%, or $2.16, decrease in the average selling price per pound, partially offset by a 0.5% increase in volume. The decrease in the average selling price reflects continued
42
price competition (which is most significant in this market), which represented and decrease of approximately $2.43 per pound, partially offset by higher raw material market prices, which represented an increase of approximately $0.21 per pound, along with a higher value product mix, which increased average selling price by approximately $0.07 per pound.
Sales to the land-based gas turbine market were $86.7 million in fiscal 2014, a decrease of 15.0% from $102.1 million in fiscal 2013, due to a 3.9% decrease in volume combined with a decrease of 11.5%, or $1.92, in the average selling price per pound. The decrease in volume is due primarily to reduced customer demand and customers' maintaining reduced inventory levels within the supply chain. The decrease in average selling price per pound reflects continued price competition, which represented a decrease of approximately $1.56 per pound, slightly offset by higher raw material market prices, which represented an increase of approximately $0.18 per pound. Additionally, the change in average selling price was impacted by a change in product mix, representing a decrease of approximately $0.54 per pound, resulting from the decrease of sales of higher-value forms and alloys as a percentage of pounds sold in this market.
Sales to other markets were $44.4 million in fiscal 2014, a decrease of 9.2% from $48.9 million in fiscal 2013, due to a 14.9%, or $4.58, decrease in average selling price per pound partially offset by a 6.7% increase in volume. The decrease in the average selling price reflects a change in product mix resulting from the decrease of sales of higher-value forms and alloys, which represented a decrease of approximately $3.63 per pound and continued price competition, which represented a decrease of approximately $1.16 per pound, partially offset by higher raw material market prices, which represented an increase of approximately $0.21 per pound.
Other Revenue. Other revenue was $15.7 million in fiscal 2014, an increase of 48.3% from $10.6 million in fiscal 2013. The increase in other revenue is primarily attributable to increased conversion and miscellaneous sales.
Cost of Sales. Cost of sales was $408.1 million, or 89.6% of net revenues, in fiscal 2014 compared to $409.1 million, or 84.7% of net revenues, in fiscal 2013. Cost of sales in fiscal 2014 decreased by $1.0 million as compared to fiscal 2013 primarily due to a lower-value product mix.
Gross Profit. As a result of the above factors, gross margin was $47.3 million for fiscal 2014, a decrease of $26.3 million from $73.6 million in fiscal 2013. Gross margin as a percentage of net revenue decreased to 10.4% in fiscal 2014 as compared to 15.3% in fiscal 2013. The main items impacting the gross margin percentage compression was pricing competition and the impact of high cost raw material flowing through cost of sales, which is estimated to have negatively impacted gross profit margin percentage by over 7.0 percentage points. Partially offsetting this compression was nearly 2.0 percentage point expansion as a result of other factors, primarily better volumes and price increases in the latter half of the year.
Selling, General and Administrative Expense. Selling, general and administrative expense was $38.7 million for fiscal 2014, an increase of $0.5 million, or 1.4%, from $38.2 million in fiscal 2013. Selling, general and administrative expenses as a percentage of net revenues increased to 8.5% for fiscal 2014, compared to 7.9% for fiscal 2013 primarily due to decreased revenues.
Research and Technical Expense. Research and technical expense was $3.6 million, or 0.8% of revenue, for fiscal 2014, an increase of $0.1 million, or 1.5%, from $3.5 million, or 0.7% of net revenues, in fiscal 2013.
Operating Income. As a result of the above factors, operating income in fiscal 2014 was $5.0 million, compared to operating income of $32.0 million in fiscal 2013.
Income Taxes. Income tax expense was $1.4 million in fiscal 2014, a decrease of $9.1 million from an expense of $10.4 million in fiscal 2013, due primarily to lower pretax income generated in fiscal 2014. The effective tax rate for fiscal 2014 was 26.7%, compared to 32.6% in fiscal 2013. During fiscal 2014, the Company's effective tax rate was lower than fiscal 2013, primarily due to an increased proportion of taxable earnings in foreign jurisdictions with a lower tax rate.
Net Income. As a result of the above factors, net income in fiscal 2014 was $3.8 million, a decrease of $17.8 million from net income of $21.6 million in fiscal 2013.
43
Year Ended September 30, 2013 Compared to Year Ended September 30, 2012
($ in thousands, except per share figures)
| |
Year Ended September 30, | Change | |||||||||||||||||
|---|---|---|---|---|---|---|---|---|---|---|---|---|---|---|---|---|---|---|---|
| |
2012 | 2013 | Amount | % | |||||||||||||||
Net revenues |
$ | 579,561 | 100.0 | % | $ | 482,746 | 100.0 | % | $ | (96,815 | ) | (16.7 | )% | ||||||
Cost of sales |
458,721 | 79.1 | % | 409,120 | 84.7 | % | (49,601 | ) | (10.8 | )% | |||||||||
| | | | | | | | | | | | | | | | | | | | |
Gross profit |
120,840 | 20.9 | % | 73,626 | 15.3 | % | (47,214 | ) | (39.1 | )% | |||||||||
Selling, general and administrative expense |
40,661 | 7.0 | % | 38,165 | 7.9 | % | (2,496 | ) | (6.1 | )% | |||||||||
Research and technical expense |
3,285 | 0.6 | % | 3,505 | 0.7 | % | 220 | 6.7 | % | ||||||||||
| | | | | | | | | | | | | | | | | | | | |
Operating income |
76,894 | 13.3 | % | 31,956 | 6.7 | % | (44,938 | ) | (58.4 | )% | |||||||||
Interest income |
(188 | ) | 0.0 | % | (114 | ) | 0.0 | % | 74 | (39.4 | )% | ||||||||
Interest expense |
87 | 0.0 | % | 72 | 0.0 | % | (15 | ) | (17.2 | )% | |||||||||
| | | | | | | | | | | | | | | | | | | | |
Income before income taxes |
76,995 | 13.3 | % | 31,998 | 6.7 | % | (44,997 | ) | (58.4 | )% | |||||||||
Provision for income taxes |
26,813 | 4.6 | % | 10,421 | 2.2 | % | (16,392 | ) | (61.1 | )% | |||||||||
| | | | | | | | | | | | | | | | | | | | |
Net income |
$ | 50,182 | 8.7 | % | $ | 21,577 | 4.5 | % | $ | (28,605 | ) | (57.0 | )% | ||||||
| | | | | | | | | | | | | | | | | | | | |
| | | | | | | | | | | | | | | | | | | | |
Net income per share: |
|||||||||||||||||||
Basic |
$ | 4.09 | $ | 1.75 | |||||||||||||||
Diluted |
$ | 4.07 | $ | 1.74 | |||||||||||||||
Weighted average shares outstanding: |
|||||||||||||||||||
Basic |
12,147,179 | 12,223,838 | |||||||||||||||||
Diluted |
12,216,031 | 12,265,630 | |||||||||||||||||
The following table includes a breakdown of net revenues, shipments and average selling prices to the markets served by the Company for the periods shown.
44
By market
| |
Year Ended September 30, |
Change | |||||||||||
|---|---|---|---|---|---|---|---|---|---|---|---|---|---|
| |
2012 | 2013 | Amount | % | |||||||||
Net revenues (dollars in thousands) |
|||||||||||||
Aerospace |
$ | 229,913 | $ | 197,104 | $ | (32,809 | ) | (14.3 | )% | ||||
Chemical processing |
134,639 | 124,090 | (10,549 | ) | (7.8 | )% | |||||||
Land-based gas turbines |
119,182 | 102,057 | (17,125 | ) | (14.4 | )% | |||||||
Other markets |
81,560 | 48,920 | (32,640 | ) | (40.0 | )% | |||||||
| | | | | | | | | | | | | | |
Total product revenue |
565,294 | 472,171 | (93,123 | ) | (16.5 | )% | |||||||
Other revenue |
14,267 | 10,575 | (3,692 | ) | (25.9 | )% | |||||||
| | | | | | | | | | | | | | |
Net revenues |
$ | 579,561 | $ | 482,746 | $ | (96,815 | ) | (16.7 | )% | ||||
| | | | | | | | | | | | | | |
| | | | | | | | | | | | | | |
Pounds by market (in thousands) |
|||||||||||||
Aerospace |
8,934 | 8,107 | (827 | ) | (9.3 | )% | |||||||
Chemical processing |
5,283 | 5,215 | (68 | ) | (1.3 | )% | |||||||
Land-based gas turbines |
6,520 | 6,127 | (393 | ) | (6.0 | )% | |||||||
Other markets |
2,650 | 1,594 | (1,056 | ) | (39.8 | )% | |||||||
| | | | | | | | | | | | | | |
Total shipments |
23,387 | 21,043 | (2,344 | ) | (10.0 | )% | |||||||
| | | | | | | | | | | | | | |
| | | | | | | | | | | | | | |
Average selling price per pound |
|||||||||||||
Aerospace |
$ | 25.73 | $ | 24.31 | $ | (1.42 | ) | (5.5 | )% | ||||
Chemical processing |
25.49 | 23.79 | (1.70 | ) | (6.7 | )% | |||||||
Land-based gas turbines |
18.28 | 16.66 | (1.62 | ) | (8.9 | )% | |||||||
Other markets |
30.78 | 30.69 | (0.09 | ) | (0.3 | )% | |||||||
Total product (excluding other revenue) |
24.17 | 22.44 | (1.73 | ) | (7.2 | )% | |||||||
Total average selling price (including other revenue) |
$ | 24.78 | $ | 22.94 | $ | (1.84 | ) | (7.4 | )% | ||||
Net Revenues. Net revenues were $482.7 million in fiscal 2013, a decrease of 16.7% from $579.6 million in fiscal 2012, due to a decrease in average selling price per pound combined with lower volume. The total average selling price was $22.94 per pound in fiscal 2013, a decrease of 7.4%, or $1.84, from $24.78 per pound in fiscal 2012. Volume was 21.0 million pounds in fiscal 2013, a decrease of 10.0% from 23.4 million pounds in fiscal 2012. Volume declined primarily due to destocking in the aerospace and land-based gas turbine markets, a decline in activity in the project-oriented other markets, uncertain economic conditions and declining raw material prices causing customers to delay ordering. Average selling price decreased due to lower raw material market prices, which represented approximately $1.01 per pound of the decrease; lower volume of conversion sales, which represented approximately $0.12 per pound of the decrease and; a higher level of price competition and reduced customer demand due to supply chain destocking, declining nickel prices and uncertain economic conditions, which forced us to reduce prices in order to be competitive, representing approximately $0.71 per pound of the decrease.
Sales to the aerospace market were $197.1 million in fiscal 2013, a decrease of 14.3% from $229.9 million in fiscal 2012, due to a 9.3% decrease in volume combined with a 5.5%, or $1.42, decrease in the average selling price per pound. The decrease in volume is due to destocking of inventory within the supply chain and customers delaying orders as the price of nickel declined and economic conditions remained uncertain. The average selling price per pound decline primarily reflects the decline in raw material market prices, which represented approximately $0.99 per pound of the decrease and continued price competition, which represented approximately $0.26 of the decrease.
Sales to the chemical processing market were $124.1 million in fiscal 2013, a decrease of 7.8% from $134.6 million in fiscal 2012, due to a 1.3% decrease in volume combined with a 6.7%, or $1.70, decrease in the average selling price per pound. The decrease in the average selling price reflects continued price
45
competition, which represented approximately $2.05 per pound of the decrease; lower raw material market prices, which represented approximately $1.09 of the decrease; partially offset by a higher value product mix resulting from shipping a higher percentage of sheet and plate products, which increased average selling price by approximately $1.44 per pound.
Sales to the land-based gas turbine market were $102.1 million in fiscal 2013, a decrease of 14.4% from $119.2 million in fiscal 2012, due to a 6.0% decrease in volume combined with a decrease of 8.9%, or $1.62, in the average selling price per pound. The decrease in volume is due primarily to lower activity of new builds by original equipment manufacturers. The decrease in average selling price per pound reflected lower raw material market prices, which represented approximately $0.96 per pound of the decrease. The decrease in average selling price also resulted from a change in product mix, which represented approximately $0.53 per pound of the decrease, due to an increase of sales of lower-value alloys and forms, predominately slab, as a percentage of pounds sold in this market.
Sales to other markets were $48.9 million in fiscal 2013, a decrease of 40.0% from $81.6 million in fiscal 2012, due to a 0.3%, or $0.09, decrease in average selling price per pound combined with a 39.8% decrease in volume. The decrease in volume and average selling price is primarily attributable to one particular tubular oil & gas project from fiscal 2012, representing approximately 0.5 million pounds and $18.5 million of net revenues, which was not repeated in fiscal 2013. The other markets are project-oriented in general, and it is uncertain whether a similar project will repeat itself in the future.
Other Revenue. Other revenue was $10.6 million in fiscal 2013, a decrease of 25.9% from $14.3 million in fiscal 2012. The decrease in other revenue is primarily attributable to approximately $2.6 million of reduced conversion sales.
Cost of Sales. Cost of sales was $409.1 million, or 84.7% of net revenues, in fiscal 2013 compared to $458.7 million, or 79.1% of net revenues, in fiscal 2012. Cost of sales in fiscal 2013 decreased by $49.6 million as compared to fiscal 2012 primarily due to lower volume. When volume decreases, the cost of sales as percentage of net revenues increases due to reduced absorption of manufacturing costs.
Gross Profit. As a result of the above factors, gross margin was $73.6 million for fiscal 2013, a decrease of $47.2 million from $120.8 million in fiscal 2012. Gross margin as a percentage of net revenue decreased to 15.3% in fiscal 2013 as compared to 20.9% in fiscal 2012. Items impacting the gross margin percentage compression include pricing competition, which we estimate impacted gross profit margin percentage by 3.1 points. The remaining 2.5 percentage point compression is the result of other factors, including higher-cost inventory in cost of sales relative to lower raw material market prices that drive the sales price and unfavorable absorption of fixed costs.
Selling, General and Administrative Expense. Selling, general and administrative expense was $38.2 million for fiscal 2013, a decrease of $2.5 million, or 6.1%, from $40.7 million in fiscal 2012. Selling, general and administrative expense reductions were primarily due to reduced costs for incentive compensation programs. Selling, general and administrative expenses as a percentage of net revenues increased to 7.9% for fiscal 2013, compared to 7.0% for fiscal 2012 due to decreased revenues.
Research and Technical Expense. Research and technical expense was $3.5 million, or 0.7% of revenue, for fiscal 2013, an increase of $0.2 million, or 6.7%, from $3.3 million, or 0.6% of net revenues, in fiscal 2012.
Operating Income. As a result of the above factors, operating income in fiscal 2013 was $32.0 million, compared to operating income of $77.0 million in fiscal 2012.
Income Taxes. Income tax expense was $10.4 million in fiscal 2013, a decrease of $16.4 million from an expense of $26.8 million in fiscal 2012, due primarily to lower pretax income generated in fiscal 2013. The effective tax rate for fiscal 2013 was 32.6%, compared to 34.8% in fiscal 2012. During fiscal 2013, the
46
Company's effective tax rate was lower, primarily due to an increased proportion of taxable earnings in foreign jurisdictions with a lower tax rate and the reversal of certain tax reserves no longer required.
Net Income. As a result of the above factors, net income in fiscal 2013, was $21.6 million, a decrease of $28.6 million from net income of $50.2 million in fiscal 2012.
Liquidity and Capital Resources
Comparative cash flow analysis
During fiscal 2014, the Company's primary sources of cash were cash on-hand and cash from operations, as detailed below. At September 30, 2014, the Company had cash and cash equivalents of $45.9 million compared to cash and cash equivalents of $68.3 million at September 30, 2013. As of September 30, 2014, the Company had cash and cash equivalents of $9.1 million that was held by foreign subsidiaries in various currencies. All of this amount is readily convertible to U.S. dollars.
Net cash provided by operating activities was $26.9 million in fiscal 2014 compared to $73.4 million in fiscal 2013. Net income of $3.8 million in fiscal 2014 was $17.8 million lower than the $21.6 million reported in fiscal 2013. Cash used from higher inventories was $22.3 million as compared to fiscal 2013 cash generated of $31.5 million, a change of $53.8 million. Additionally, cash generated from lower accounts receivable was $9.9 million compared to cash generated by accounts receivable of $18.6 million in fiscal 2013, a change of $8.7 million. Cash generated from accounts payable and accrued expenses of $15.7 million compared to cash used in accounts payable and accrued expenses of $12.2 million in fiscal 2013, a change of $27.9 million. Additionally, the cash used in accrued pension and postretirement benefits of $6.1 million was $14.1 million less than the cash used in accrued pension and postretirement benefits in fiscal 2013 of $20.2 million. This reduction of $14.1 million is primarily a result of the Company's evaluation of its alternatives for cash deployment in fiscal 2014. Given the business conditions in fiscal 2014, the Company elected to minimize funding for a majority of the fiscal year because it had met its funding requirements for that time. Net cash used in financing activities in fiscal 2014 of $9.6 million included $10.8 million of dividend payments, partially offset by proceeds from exercises of stock options.
Future sources of liquidity
The Company's sources of liquidity for fiscal 2015 are expected to consist primarily of cash generated from operations, cash on-hand and, if needed, borrowings under the U.S. revolving credit facility. At September 30, 2014, the Company had cash of $45.9 million, an outstanding balance of zero on the U.S. revolving credit facility and access to a total of approximately $120.0 million under the U.S. revolving credit facility, subject to a borrowing base formula and certain reserves that could limit the Company's borrowing to approximately $105.0 million. Management believes that the resources described above will be sufficient to fund planned capital expenditures and working capital requirements over the next twelve months.
U.S. revolving credit facility
The Company and Wells Fargo Capital Finance, LLC ("Wells Fargo"), entered into a Third Amended and Restated Loan and Security Agreement (the "Amended Agreement") with certain other lenders with an effective date of July 14, 2011. The maximum revolving loan amount under the Amended Agreement is $120.0 million, subject to a borrowing base formula and certain reserves that could limit the Company's borrowing to approximately $105.0 million. The Amended Agreement permits an increase in the maximum revolving loan amount from $120.0 million up to an aggregate amount of $170.0 million at the request of the borrowers. Borrowings under the U.S. revolving credit facility bear interest at the Company's option at either Wells Fargo's "prime rate", plus up to 0.75% per annum, or the adjusted Eurodollar rate used by the lender, plus up to 2.0% per annum. As of September 30, 2014, the U.S. revolving credit facility had an outstanding balance of zero. In addition, the Company must pay monthly in arrears a commitment fee of
47
0.25% per annum on the unused amount of the U.S. revolving credit facility total commitment. For letters of credit, the Company must pay 1.5% per annum on the daily outstanding balance of all issued letters of credit, plus customary fees for issuance, amendments and processing. The Company is subject to certain covenants as to fixed charge coverage ratios and other customary covenants, including covenants restricting the incurrence of indebtedness, the granting of liens and the sale of assets. The covenant pertaining to fixed charge coverage ratios is only effective in the event the amount of excess availability under the revolver is less than 12.5% of the maximum credit revolving amount. The Company is permitted to pay dividends and repurchase common stock if certain financial metrics are met (which do not apply in the case of dividends less than $20.0 million in the aggregate in a year and repurchases in connection with the vesting of shares of restricted stock). As of September 30, 2014, the most recent required measurement date under the Amended Agreement, management believes the Company was in compliance with all applicable financial covenants under the Amended Agreement. The U.S. revolving credit facility matures on July 14, 2016. Borrowings under the U.S. revolving credit facility are collateralized by a pledge of substantially all of the U.S. assets of the Company, including the equity interests in its U.S. subsidiaries, but excluding the four-high Steckel rolling mill and related assets, which are pledged to Titanium Metals Corporation to secure the performance of the Company's obligations under a Conversion Services Agreement with TIMET (see discussion of TIMET at Note 15 in the Company's to Consolidated Financial Statements in this Annual Report on Form 10-K). The U.S. revolving credit facility is also secured by a pledge of a 65% equity interest in each of the Company's direct foreign subsidiaries.
Future uses of liquidity
The Company's primary uses of cash over the next twelve months are expected to consist of expenditures related to:
- •
- Funding operations;
- •
- Capital spending (detailed below);
- •
- Acquisition of the LaPorte operations of Leveltek Processing, LLC; and
- •
- Dividends to stockholders.
Capital investment in fiscal 2014 was $39.7 million and the plan for capital spending in fiscal 2015 is $22.0 million. See "Summary of Capital Spending" in this Annual Report on Form 10-K for additional discussion of actual and planned capital spending.
In the fourth quarter of fiscal 2014, the Company entered into a definitive agreement to purchase those assets and operations of Leveltek Processing, LLC located in LaPorte, Indiana. The acquisition is expected to close in the second quarter of fiscal 2015.
48
Contractual Obligations
The following table sets forth the Company's contractual obligations for the periods indicated, as of September 30, 2014:
| |
Payments Due by Period | |||||||||||||||
|---|---|---|---|---|---|---|---|---|---|---|---|---|---|---|---|---|
Contractual Obligations
|
Total | Less than 1 year |
1-3 Years | 3-5 Years | More than 5 years |
|||||||||||
| |
(in thousands) |
|||||||||||||||
Credit facility fees(1) |
$ | 607 | $ | 340 | $ | 267 | $ | — | $ | — | ||||||
Operating lease obligations |
7,759 | 2,812 | 3,372 | 1,551 | 24 | |||||||||||
Capital lease obligations |
160 | 25 | 66 | 66 | 3 | |||||||||||
Raw material contracts (primarily nickel) |
46,507 | 41,745 | 4,762 | — | — | |||||||||||
Capital projects and other commitments |
42,058 | 31,257 | 1,068 | 1,084 | 8,649 | |||||||||||
Pension plan(2) |
67,752 | 5,741 | 16,739 | 12,706 | 32,566 | |||||||||||
Non-qualified pension plans |
813 | 95 | 190 | 190 | 338 | |||||||||||
Other postretirement benefits(3) |
49,011 | 4,477 | 9,534 | 10,000 | 25,000 | |||||||||||
Environmental post-closure monitoring |
1,057 | 79 | 169 | 163 | 646 | |||||||||||
| | | | | | | | | | | | | | | | | |
Total |
$ | 215,724 | $ | 86,571 | $ | 36,167 | $ | 25,760 | $ | 67,226 | ||||||
| | | | | | | | | | | | | | | | | |
| | | | | | | | | | | | | | | | | |
- (1)
- As
of September 30, 2014, the revolver balance was zero, therefore no interest is due. However, the Company is obligated to the Bank
for unused line fees and quarterly management fees.
- (2)
- The
Company has a funding obligation to contribute $67,752 to the domestic pension plan. These payments will be tax deductible. All benefit
payments under the domestic pension plan will come from the plan and not the Company.
- (3)
- Represents expected other postretirement benefits based upon anticipated timing of payments.
Inflation or Deflation
While neither inflation nor deflation has had, nor does the Company expect them to have, a material impact on operating results, there can be no assurance that the Company's business will not be affected by inflation or deflation in the future. Historically, the Company has had the ability to pass on to customers both increases in consumable costs and material costs because of the value-added contribution the material makes to the final product. Raw material comprises the most significant portion of the product costs. Nickel, cobalt and molybdenum, the primary raw materials used to manufacture the Company's products, all have experienced significant fluctuations in price. In the future, the Company may not be able to successfully offset rapid increases in the price of nickel or other raw materials. In the event of raw material price declines, the Company's customers may delay order placement, resulting in lower volumes. In the event that raw material price increases occur that the Company is unable to pass on to its customers, its cash flows or results of operations could be materially adversely affected.
Critical Accounting Policies and Estimates
Overview
Management's Discussion and Analysis of Financial Condition and Results of Operations discusses the Company's consolidated financial statements, which have been prepared in accordance with accounting principles generally accepted in the United States of America. The preparation of these financial statements requires management to make estimates and assumptions that affect the reported amounts of assets and liabilities and the disclosure of contingent assets and liabilities at the date of the financial statements and the reported amounts of revenues and expenses during the reporting period. On an on-going basis, management evaluates its estimates and judgments, including those related to bad debts, inventories, income taxes, asset impairments, retirement benefits, matters related to product liability and other lawsuits and environmental matters. The process of determining significant estimates is fact specific and takes into account factors such as historical experience, current and expected economic conditions, product mix, pension asset mix and, in some cases, actuarial techniques, and various other factors that are
49
believed to be reasonable under the circumstances. The results of this process form the basis for making judgments about the carrying values of assets and liabilities that are not readily apparent from other sources. The Company routinely reevaluates these significant factors and makes adjustments where facts and circumstances dictate. Actual results may differ from these estimates under different assumptions or conditions.
The Company's accounting policies are more fully described in Note 2 in the Notes to the Consolidated Financial Statements included in Item 8 of this Annual Report on Form 10-K. The Company has identified certain critical accounting policies, which are described below. The following listing of policies is not intended to be a comprehensive list of all of the Company's accounting policies. In many cases, the accounting treatment of a particular transaction is specifically dictated by generally accepted accounting principles, with no need for management's judgment in their application. There are also areas in which management's judgment in selecting any available alternative would not produce a materially different result.
Revenue Recognition
Revenue is recognized when collectability is reasonably assured and when title passes to the customer which is generally at the time of shipment (F.O.B. shipping point or at a foreign port for certain export customers). Allowances for sales returns are recorded as a component of net revenues in the periods in which the related sales are recognized. Management determines this allowance based on historical experience. Should returns increase above historical experience, additional allowances may be required. Additionally, the Company recognizes revenue attributable to an up-front fee received from Titanium Metals Corporation ("TIMET") as a result of a twenty-year agreement, entered into on November, 17, 2006 to provide conversion services to TIMET. See Note 15 Deferred Revenue for a description of accounting treatment relating to this up-front fee.
Pension and Postretirement Benefits
The Company has defined benefit pension and postretirement plans covering most of its current and former employees. Significant elements in determining the assets or liabilities and related income or expense for these plans are the expected return on plan assets (if any), the discount rate used to value future payment streams, expected trends in health care costs, and other actuarial assumptions. Annually, the Company evaluates the significant assumptions to be used to value its pension and postretirement plan assets and liabilities based on current market conditions and expectations of future costs. If actual results are less favorable than those projected by management, additional expense may be required in future periods.
The selection of the Plan's assumption for the expected long-term rate of return on plan assets is based upon the Plan's target allocation of 60% equities and 40% bonds, and the expected rate of return for each equity/bond asset class. Based upon the target allocation and each asset class's expected return, the Plan's return on assets assumption of 7.50% is reasonable, and is unchanged from last year's assumption. The return on assets is based on fair value of the plan assets and their investment allocation at the beginning of the fiscal year. The Company also realizes that historical performance is no guarantee of future performance.
In the short term, substantial decreases in plan assets will result in higher plan funding contribution levels and higher pension expenses. A decrease of 25 basis points in the expected long-term rate of return on plan assets would result in an increase in annual pension expense of about $477,000. To the extent that the actual return on plan assets during the year exceeds or falls short of the assumed long-term rate of return, an asset gain or loss is created. Gains and losses are generally amortized over a 7-year period. As an example, each $1.0 million in asset loss created by unfavorable investment performance results in seven annual payments (contributions) of approximately $170,000 depending upon the precise effective interest rate in the valuation and the timing of the contribution.
Decreases in discount rates used to value future payment streams will result in higher liabilities for pension and postretirement plans. A decrease of 25 basis points would result in $8.8 million higher liability
50
for the U.S. pension plan and $4.3 million higher liability for the postretirement plan. This increase in liability would also increase the accumulated other comprehensive loss that would be amortized as higher pension and postretirement expense over an amortization period of approximately 7.7 and 9.0 years, respectively.
Salaried employees hired after December 31, 2005 and hourly employees hired after June 30, 2007 are not covered by the pension plan; however, they are eligible for an enhanced matching program of the defined contribution plan (401(k)). Effective December 31, 2007, the U.S. pension plan was amended to freeze benefits for all non-union employees in the U.S. Effective September 30, 2009, the U.K. pension plan was amended to freeze benefits for employees in the plan.
Impairment of Long-lived Assets and Other Intangible Assets
The Company reviews long-lived assets for impairment whenever events or circumstances indicate that the carrying amount of an asset may not be recoverable. Recoverability of long-lived assets to be held and used is measured by a comparison of the carrying amount of the asset to the undiscounted future cash flows expected to be generated by the asset. If the carrying amount of an asset exceeds its estimated future cash flows, an impairment charge is recognized in the amount by which the carrying amount exceeds the fair value of the asset. The Company reviews for impairment annually or more frequently if events or circumstances indicated that the carrying amount may be impaired on trademark and patent intangible assets.
Share-Based Compensation
Restricted Stock Plan
On February 23, 2009, the Company adopted a restricted stock plan that reserved 400,000 shares of common stock for issuance. Grants of restricted stock are grants of shares of the Company's common stock subject to transfer restrictions, which vest in accordance with the terms and conditions established by the Compensation Committee. The Compensation Committee may set vesting requirements based on the achievement of specific performance goals or the passage of time.
Restricted shares are subject to forfeiture if employment or service terminates prior to the vesting date or if the performance goal is not met. The Company will assess, on an ongoing basis, the probability of whether the performance criteria will be achieved. The Company will recognize compensation expense over the performance period if it is deemed probable that the goal will be achieved. The fair value of the Company's restricted stock is determined based upon the closing price of the Company's common stock on the grant date. The plan provides for the adjustment of the number of shares covered by an outstanding grant and the maximum number of shares for which restricted stock may be granted in the event of a stock split, extraordinary dividend or distribution or similar recapitalization event.
Stock Option Plans
The Company has two stock option plans that authorize the granting of non-qualified stock options to certain key employees and non-employee directors for the purchase of a maximum of 1,500,000 shares of the Company's common stock. The original option plan was adopted in August 2004 pursuant to the plan of reorganization and provides for the grant of options to purchase up to 1,000,000 shares of the Company's common stock. In January 2007, the Company's Board of Directors adopted a second option plan that provides for options to purchase up to 500,000 shares of the Company's common stock. Each plan provides for the adjustment of the maximum number of shares for which options may be granted in the event of a stock split, extraordinary dividend or distribution or similar recapitalization event. Unless the Compensation Committee determines otherwise, options granted under the option plans are exercisable for a period of ten years from the date of grant and vest 331/3% per year over three years from the grant date. The amount of compensation cost recognized in the financial statements is measured based upon the grant date fair value. The fair value of the option grants is estimated on the date of grant using the Black-Scholes option pricing model with assumptions on dividend yield, risk-free interest rate, expected volatilities, expected forfeiture rate and expected lives of the options.
51
Income Taxes
The Company accounts for deferred tax assets and liabilities using enacted tax rates for the effect of temporary differences between book and tax basis of recorded assets and liabilities. A valuation allowance is required if it is more likely than not that some portion or all of the deferred tax assets will not be realized. The determination of whether or not a valuation allowance is needed is based upon an evaluation of both positive and negative evidence. In its evaluation of the need for a valuation allowance, the Company assesses prudent and feasible tax planning strategies. The ultimate amount of deferred tax assets realized could be different from those recorded, as influenced by potential changes in enacted tax laws and the availability of future taxable income.
On October 1, 2007, the Company adopted guidance prescribing a recognition threshold and measurement attribute for financial statement recognition and measurement of tax positions taken or expected to be taken in an income tax return. It also provides guidance related to reversal of tax positions, balance sheet classification, interest and penalties, interim period accounting, disclosure and transition.
Recently Issued Accounting Pronouncements
See Note 2.—Summary of Significant Accounting Policies of Notes to Consolidated Financial Statements for information regarding New Accounting Standards.
Item 7A. Quantitative and Qualitative Disclosures about Market Risk
Market risk is the potential loss arising from adverse changes in market rates and prices. The Company is exposed to various market risks, including changes in interest rates, foreign currency exchange rates and the price of raw material, particularly nickel.
Changes in interest rates affect the Company's interest expense on variable rate debt. All of the Company's revolver availability is at a variable rate at September 30, 2013 and 2014. The Company's outstanding variable rate debt was zero at September 30, 2013 and 2014. The Company has not entered into any derivative instruments to hedge the effects of changes in interest rates.
The foreign currency exchange risk exists primarily because the Company's foreign subsidiaries maintain receivables and payables denominated in currencies other than their functional currency. The foreign subsidiaries manage their own foreign currency exchange risk. The U.S. operations transact their foreign sales in U.S. dollars, thereby avoiding fluctuations in foreign exchange rates. Any exposure aggregating more than $500,000 requires approval from the Company's Vice President of Finance. The Company is not currently party to any currency contracts.
Fluctuations in the price of nickel, the Company's most significant raw material, subject the Company to commodity price risk. The Company manages its exposure to this market risk through internally established policies and procedures, including negotiating raw material escalators within product sales agreements and continually monitoring and revising customer quote amounts to reflect the fluctuations in market prices for nickel. The Company does not presently use derivative instruments to manage this market risk but may in the future. The Company monitors its underlying market risk exposure from a rapid change in nickel prices on an ongoing basis and believes that it can modify or adapt its strategies as necessary. The Company periodically purchases raw material forward with certain suppliers. However, there is a risk that the Company may not be able to successfully offset a rapid increase or decrease in the cost of raw material in the future.
52
Item 8. Financial Statements and Supplementary Data
HAYNES INTERNATIONAL, INC. AND SUBSIDIARIES
INDEX TO CONSOLIDATED FINANCIAL STATEMENTS
Audited Consolidated Financial Statements of Haynes International, Inc. and Subsidiaries as of September 30, 2014 and 2013 and for the years ended September 30, 2014, September 30, 2013 and September 30, 2012
53
REPORT OF INDEPENDENT REGISTERED PUBLIC ACCOUNTING FIRM
To
the Board of Directors and Stockholders of
Haynes International, Inc.
Kokomo, IN
We have audited the accompanying consolidated balance sheets of Haynes International, Inc. and subsidiaries (the "Company") as of September 30, 2014 and 2013, and the related consolidated statements of operations, comprehensive income (loss), stockholders' equity, and cash flows for each of the three years in the period ended September 30, 2014. We also have audited the Company's internal control over financial reporting as of September 30, 2014, based on criteria established in Internal Control—Integrated Framework (1992) issued by the Committee of Sponsoring Organizations of the Treadway Commission. The Company's management is responsible for these financial statements, for maintaining effective internal control over financial reporting, and for its assessment of the effectiveness of internal control over financial reporting, included in the accompanying Management's Annual Report on Internal Control Over Financial Reporting. Our responsibility is to express an opinion on these financial statements and an opinion on the Company's internal control over financial reporting based on our audits.
We conducted our audits in accordance with the standards of the Public Company Accounting Oversight Board (United States). Those standards require that we plan and perform the audit to obtain reasonable assurance about whether the financial statements are free of material misstatement and whether effective internal control over financial reporting was maintained in all material respects. Our audits of the financial statements included examining, on a test basis, evidence supporting the amounts and disclosures in the financial statements, assessing the accounting principles used and significant estimates made by management, and evaluating the overall financial statement presentation. Our audit of internal control over financial reporting included obtaining an understanding of internal control over financial reporting, assessing the risk that a material weakness exists, and testing and evaluating the design and operating effectiveness of internal control based on the assessed risk. Our audits also included performing such other procedures as we considered necessary in the circumstances. We believe that our audits provide a reasonable basis for our opinions.
A company's internal control over financial reporting is a process designed by, or under the supervision of, the company's principal executive and principal financial officers, or persons performing similar functions, and effected by the company's board of directors, management, and other personnel to provide reasonable assurance regarding the reliability of financial reporting and the preparation of financial statements for external purposes in accordance with generally accepted accounting principles. A company's internal control over financial reporting includes those policies and procedures that (1) pertain to the maintenance of records that, in reasonable detail, accurately and fairly reflect the transactions and dispositions of the assets of the company; (2) provide reasonable assurance that transactions are recorded as necessary to permit preparation of financial statements in accordance with generally accepted accounting principles, and that receipts and expenditures of the company are being made only in accordance with authorizations of management and directors of the company; and (3) provide reasonable assurance regarding prevention or timely detection of unauthorized acquisition, use, or disposition of the company's assets that could have a material effect on the financial statements.
Because of the inherent limitations of internal control over financial reporting, including the possibility of collusion or improper management override of controls, material misstatements due to error or fraud may not be prevented or detected on a timely basis. Also, projections of any evaluation of the effectiveness of the internal control over financial reporting to future periods are subject to the risk that the controls may become inadequate because of changes in conditions, or that the degree of compliance with the policies or procedures may deteriorate.
In our opinion, the consolidated financial statements referred to above present fairly, in all material respects, the financial position of Haynes International, Inc. and subsidiaries as of September 30, 2014 and
54
2013, and the results of their operations and their cash flows for each of the three years in the period ended September 30, 2014, in conformity with accounting principles generally accepted in the United States of America. Also, in our opinion, the Company maintained, in all material respects, effective internal control over financial reporting as of September 30, 2014, based on the criteria established in Internal Control—Integrated Framework (1992) issued by the Committee of Sponsoring Organizations of the Treadway Commission.
/s/ DELOITTE & TOUCHE LLP
Indianapolis, IN
November 20, 2014
55
HAYNES INTERNATIONAL, INC. AND SUBSIDIARIES
CONSOLIDATED BALANCE SHEETS
(in thousands, except share and per share data)
| |
September 30, 2013 |
September 30, 2014 |
|||||
|---|---|---|---|---|---|---|---|
ASSETS |
|||||||
Current assets: |
|||||||
Cash and cash equivalents |
$ | 68,326 | $ | 45,871 | |||
Accounts receivable, less allowance for doubtful accounts of $1,199 and $861 respectively |
82,562 | 72,439 | |||||
Inventories |
232,157 | 254,027 | |||||
Income taxes receivable |
4,433 | 3,235 | |||||
Deferred income taxes |
6,018 | 6,297 | |||||
Other current assets |
2,408 | 2,964 | |||||
| | | | | | | | |
Total current assets |
395,904 | 384,833 | |||||
Property, plant and equipment, net |
152,764 | 174,083 | |||||
Deferred income taxes—long term portion |
41,301 | 44,639 | |||||
Prepayments and deferred charges |
2,282 | 2,031 | |||||
Other intangible assets, net |
5,601 | 5,185 | |||||
| | | | | | | | |
Total assets |
$ | 597,852 | $ | 610,771 | |||
| | | | | | | | |
| | | | | | | | |
LIABILITIES AND STOCKHOLDERS' EQUITY |
|||||||
Current liabilities: |
|||||||
Accounts payable |
$ | 27,600 | $ | 41,957 | |||
Accrued expenses |
13,676 | 13,213 | |||||
Revolving credit facility |
— | — | |||||
Accrued pension and postretirement benefits |
4,918 | 4,572 | |||||
Deferred revenue—current portion |
2,500 | 2,500 | |||||
| | | | | | | | |
Total current liabilities |
48,694 | 62,242 | |||||
Long-term obligations (less current portion) |
767 | 745 | |||||
Deferred revenue (less current portion) |
30,329 | 27,829 | |||||
Accrued pension benefits |
68,310 | 72,315 | |||||
Accrued postretirement benefits |
93,949 | 100,910 | |||||
| | | | | | | | |
Total liabilities |
242,049 | 264,041 | |||||
Commitments and contingencies (Notes 9 and 10) |
— | — | |||||
Stockholders' equity: |
|||||||
Common stock, $0.001 par value (40,000,000 shares authorized, 12,342,585 and 12,434,748 shares issued and 12,332,592 and 12,418,471 outstanding at September 30, 2013 and September 30, 2014, respectively) |
12 | 12 | |||||
Preferred stock, $0.001 par value (20,000,000 shares authorized, 0 shares issued and outstanding) |
— | — | |||||
Additional paid-in capital |
238,941 | 242,387 | |||||
Accumulated earnings |
174,154 | 166,999 | |||||
Treasury stock, 9,993 shares at September 30, 2013 and 16,277 shares at September 30, 2014 |
(505 | ) | (840 | ) | |||
Accumulated other comprehensive loss |
(56,799 | ) | (61,828 | ) | |||
| | | | | | | | |
Total stockholders' equity |
355,803 | 346,730 | |||||
| | | | | | | | |
Total liabilities and stockholders' equity |
$ | 597,852 | $ | 610,771 | |||
| | | | | | | | |
| | | | | | | | |
The accompanying notes are an integral part of these consolidated financial statements.
56
HAYNES INTERNATIONAL, INC. AND SUBSIDIARIES
CONSOLIDATED STATEMENTS OF OPERATIONS
(in thousands, except share and per share data)
| |
Year Ended September 30, 2012 |
Year Ended September 30, 2013 |
Year Ended September 30, 2014 |
|||||||
|---|---|---|---|---|---|---|---|---|---|---|
Net revenues |
$ | 579,561 | $ | 482,746 | $ | 455,410 | ||||
Cost of sales |
458,721 | 409,120 | 408,112 | |||||||
| | | | | | | | | | | |
Gross profit |
120,840 | 73,626 | 47,298 | |||||||
Selling, general and administrative expense |
40,661 | 38,165 | 38,693 | |||||||
Research and technical expense |
3,285 | 3,505 | 3,556 | |||||||
| | | | | | | | | | | |
Operating income |
76,894 | 31,956 | 5,049 | |||||||
Interest income |
(188 | ) | (114 | ) | (139 | ) | ||||
Interest expense |
87 | 72 | 68 | |||||||
| | | | | | | | | | | |
Income before income taxes |
76,995 | 31,998 | 5,120 | |||||||
Provision for income taxes |
26,813 | 10,421 | 1,369 | |||||||
| | | | | | | | | | | |
Net income |
$ | 50,182 | $ | 21,577 | $ | 3,751 | ||||
| | | | | | | | | | | |
| | | | | | | | | | | |
Net income per share: |
||||||||||
Basic |
$ | 4.09 | $ | 1.75 | $ | 0.30 | ||||
Diluted |
$ | 4.07 | $ | 1.74 | $ | 0.30 | ||||
Dividends declared per common share |
$ | 0.88 | $ | 0.88 | $ | 0.88 | ||||
The accompanying notes are an integral part of these consolidated financial statements.
57
HAYNES INTERNATIONAL, INC. AND SUBSIDIARIES
CONSOLIDATED STATEMENTS OF COMPREHENSIVE INCOME (LOSS)
(in thousands)
| |
Year Ended September 30, 2012 |
Year Ended September 30, 2013 |
Year Ended September 30, 2014 |
|||||||
|---|---|---|---|---|---|---|---|---|---|---|
Net income |
$ | 50,182 | $ | 21,577 | $ | 3,751 | ||||
Other comprehensive income (loss), net of tax: |
||||||||||
Pension and postretirement |
(16,741 | ) | 41,280 | (4,038 | ) | |||||
Foreign currency translation adjustment |
698 | 1,012 | (991 | ) | ||||||
| | | | | | | | | | | |
Other comprehensive income (loss) |
(16,043 | ) | 42,292 | (5,029 | ) | |||||
| | | | | | | | | | | |
Comprehensive income (loss) |
$ | 34,139 | $ | 63,869 | $ | (1,278 | ) | |||
| | | | | | | | | | | |
| | | | | | | | | | | |
The accompanying notes are an integral part of these consolidated financial statements.
58
HAYNES INTERNATIONAL, INC. AND SUBSIDIARIES
CONSOLIDATED STATEMENTS OF STOCKHOLDERS' EQUITY
(in thousands, except share data)
| |
Common Stock | |
|
|
Accumulated Other Comprehensive Income (Loss) |
|
||||||||||||||||
|---|---|---|---|---|---|---|---|---|---|---|---|---|---|---|---|---|---|---|---|---|---|---|
| |
Additional Paid-in Capital |
Accumulated Earnings |
Treasury Stock |
Total Stockholders' Equity |
||||||||||||||||||
| |
Shares | Par | ||||||||||||||||||||
Balance September 30, 2011 |
12,204,179 | $ | 12 | $ | 231,842 | $ | 124,047 | $ | — | $ | (83,048 | ) | $ | 272,853 | ||||||||
| | | | | | | | | | | | | | | | | | | | | | | |
| | | | | | | | | | | | | | | | | | | | | | | |
Net income |
50,182 | 50,182 | ||||||||||||||||||||
Dividends paid ($0.88 per share) |
(10,803 | ) | (10,803 | ) | ||||||||||||||||||
Other comprehensive loss |
(16,043 | ) | (16,043 | ) | ||||||||||||||||||
Exercise of stock options |
77,611 | 2,782 | 2,782 | |||||||||||||||||||
Tax impact of dividends on restricted stock |
48 | 48 | ||||||||||||||||||||
Issue restricted stock (less forfeitures) |
6,000 | |||||||||||||||||||||
Stock compensation |
2,079 | 2,079 | ||||||||||||||||||||
| | | | | | | | | | | | | | | | | | | | | | | |
Balance September 30, 2012 |
12,287,790 | $ | 12 | $ | 236,751 | $ | 163,426 | $ | — | $ | (99,091 | ) | $ | 301,098 | ||||||||
| | | | | | | | | | | | | | | | | | | | | | | |
| | | | | | | | | | | | | | | | | | | | | | | |
Net income |
21,577 | 21,577 | ||||||||||||||||||||
Dividends paid ($0.88 per share) |
(10,849 | ) | (10,849 | ) | ||||||||||||||||||
Other comprehensive income |
42,292 | 42,292 | ||||||||||||||||||||
Exercise of stock options |
30,545 | 1,092 | 1,092 | |||||||||||||||||||
Tax impact of forfeited vested options |
(185 | ) | (185 | ) | ||||||||||||||||||
Tax impact of dividends on restricted stock |
29 | 29 | ||||||||||||||||||||
Issue restricted stock (less forfeitures) |
24,250 | — | ||||||||||||||||||||
Purchase of treasury stock |
(9,993 | ) | (505 | ) | (505 | ) | ||||||||||||||||
Stock compensation |
1,254 | 1,254 | ||||||||||||||||||||
| | | | | | | | | | | | | | | | | | | | | | | |
Balance September 30, 2013 |
12,332,592 | $ | 12 | $ | 238,941 | $ | 174,154 | $ | (505 | ) | $ | (56,799 | ) | $ | 355,803 | |||||||
| | | | | | | | | | | | | | | | | | | | | | | |
| | | | | | | | | | | | | | | | | | | | | | | |
Net income |
3,751 | 3,751 | ||||||||||||||||||||
Dividends paid ($0.88 per share) |
(10,906 | ) | (10,906 | ) | ||||||||||||||||||
Other comprehensive income |
(5,029 | ) | (5,029 | ) | ||||||||||||||||||
Exercise of stock options |
54,913 | 1,519 | 1,519 | |||||||||||||||||||
Tax impact of vesting and dividends on restricted stock |
158 | 158 | ||||||||||||||||||||
Issue restricted stock (less forfeitures) |
37,250 | — | ||||||||||||||||||||
Purchase of treasury stock |
(6,284 | ) | (335 | ) | (335 | ) | ||||||||||||||||
Stock compensation |
1,769 | 1,769 | ||||||||||||||||||||
| | | | | | | | | | | | | | | | | | | | | | | |
Balance September 30, 2014 |
12,418,471 | $ | 12 | $ | 242,387 | $ | 166,999 | $ | (840 | ) | $ | (61,828 | ) | $ | 346,730 | |||||||
| | | | | | | | | | | | | | | | | | | | | | | |
| | | | | | | | | | | | | | | | | | | | | | | |
The accompanying notes are an integral part of these consolidated financial statements.
59
HAYNES INTERNATIONAL, INC. AND SUBSIDIARIES
CONSOLIDATED STATEMENTS OF CASH FLOWS
(in thousands)
| |
Year Ended September 30, 2012 |
Year Ended September 30, 2013 |
Year Ended September 30, 2014 |
|||||||
|---|---|---|---|---|---|---|---|---|---|---|
Cash flows from operating activities: |
||||||||||
Net income |
$ | 50,182 | $ | 21,577 | $ | 3,751 | ||||
Adjustments to reconcile net income to net cash provided by (used in) operating activities: |
||||||||||
Depreciation |
12,520 | 13,744 | 15,861 | |||||||
Amortization |
423 | 416 | 416 | |||||||
Pension and post-retirement expense—U.S. and U.K. |
15,590 | 16,173 | 10,293 | |||||||
Change in long-term obligations |
(245 | ) | (153 | ) | (22 | ) | ||||
Stock compensation expense |
2,079 | 1,254 | 1,769 | |||||||
Excess tax benefit from option exercises |
(1,147 | ) | (494 | ) | (614 | ) | ||||
Deferred revenue |
(2,500 | ) | (2,500 | ) | (2,500 | ) | ||||
Deferred income taxes |
5,658 | 6,171 | (1,954 | ) | ||||||
Loss on disposition of property |
203 | 418 | 500 | |||||||
Change in assets and liabilities: |
||||||||||
Accounts receivable |
(12,700 | ) | 18,630 | 9,893 | ||||||
Inventories |
(12,326 | ) | 31,507 | (22,275 | ) | |||||
Other assets |
1,309 | (1,324 | ) | (336 | ) | |||||
Accounts payable and accrued expenses |
(17,242 | ) | (12,165 | ) | 15,722 | |||||
Income taxes |
(5 | ) | 341 | 2,522 | ||||||
Accrued pension and postretirement benefits |
(21,018 | ) | (20,191 | ) | (6,080 | ) | ||||
| | | | | | | | | | | |
Net cash provided by operating activities |
20,781 | 73,404 | 26,946 | |||||||
| | | | | | | | | | | |
Cash flows from investing activities: |
||||||||||
Additions to property, plant and equipment |
(25,937 | ) | (41,550 | ) | (39,694 | ) | ||||
| | | | | | | | | | | |
Net cash used in investing activities |
(25,937 | ) | (41,550 | ) | (39,694 | ) | ||||
| | | | | | | | | | | |
Cash flows from financing activities: |
||||||||||
Dividends paid |
(10,803 | ) | (10,849 | ) | (10,906 | ) | ||||
Proceeds from exercise of stock options |
1,635 | 598 | 1,063 | |||||||
Payment for purchase of treasury stock |
— | (505 | ) | (335 | ) | |||||
Excess tax benefit from option exercises |
1,147 | 494 | 614 | |||||||
Payments on long-term obligations |
(123 | ) | (100 | ) | — | |||||
| | | | | | | | | | | |
Net cash used in financing activities |
(8,144 | ) | (10,362 | ) | (9,564 | ) | ||||
| | | | | | | | | | | |
Effect of exchange rates on cash |
(22 | ) | 94 | (143 | ) | |||||
| | | | | | | | | | | |
Increase (decrease) in cash and cash equivalents: |
(13,322 | ) | 21,586 | (22,455 | ) | |||||
Cash and cash equivalents: |
||||||||||
Beginning of period |
60,062 | 46,740 | 68,326 | |||||||
| | | | | | | | | | | |
End of period |
$ | 46,740 | $ | 68,326 | $ | 45,871 | ||||
| | | | | | | | | | | |
| | | | | | | | | | | |
Supplemental disclosures of cash flow information: |
||||||||||
Cash paid during period for: |
||||||||||
Interest (net of capitalized interest) |
$ | 22 | $ | 7 | $ | 3 | ||||
| | | | | | | | | | | |
| | | | | | | | | | | |
Income taxes paid, net |
$ | 21,341 | $ | 3,578 | $ | 811 | ||||
| | | | | | | | | | | |
| | | | | | | | | | | |
Capital expenditures incurred but not yet paid |
$ | 2,360 | $ | 2,890 | $ | 1,293 | ||||
| | | | | | | | | | | |
| | | | | | | | | | | |
The accompanying notes are an integral part of these consolidated financial statements.
60
HAYNES INTERNATIONAL, INC. AND SUBSIDIARIES
NOTES TO CONSOLIDATED FINANCIAL STATEMENTS
(in thousands, except share and per share data and otherwise
noted)
Note 1 Background and Organization
Description of Business
Haynes International, Inc. and its subsidiaries (the "Company" or "Haynes") develops, manufactures, markets and distributes technologically advanced, high-performance alloys primarily for use in the aerospace, land-based gas turbine and chemical processing industries. The Company's products are high-temperature resistant alloys ("HTA") and corrosion-resistant alloys ("CRA"). The Company's HTA products are used by manufacturers of equipment that is subjected to extremely high temperatures, such as jet engines for the aerospace industry, gas turbine engines for power generation, waste incineration and industrial heating equipment. The Company's CRA products are used in applications that require resistance to extreme corrosion, such as chemical processing, power plant emissions control and hazardous waste treatment. The Company produces its high-performance alloys primarily in sheet, coil and plate forms. In addition, the Company produces its products as seamless and welded tubulars, and in slab, bar, billets and wire forms.
High-performance alloys are characterized by highly engineered often proprietary, metallurgical formulations primarily of nickel, cobalt and other metals with complex physical properties. The complexity of the manufacturing process for high-performance alloys is reflected in the Company's relatively high average selling price per pound, compared to the average selling price of other metals, such as carbon steel sheet, stainless steel sheet and aluminum. The high-performance alloy industry has significant barriers to entry such as the combination of (i) demanding end-user specifications, (ii) a multi-stage manufacturing process and (iii) the technical sales, marketing and manufacturing expertise required to develop new applications.
Note 2 Summary of Significant Accounting Policies
A. Principles of Consolidation and Nature of Operations
The consolidated financial statements include the accounts of Haynes International, Inc. and its wholly-owned subsidiaries. All intercompany transactions and balances are eliminated. The Company has manufacturing facilities in Kokomo, Indiana; Mountain Home, North Carolina; and Arcadia, Louisiana with distribution service centers in Lebanon, Indiana; LaMirada, California; Houston, Texas; Windsor, Connecticut; Openshaw, England; Lenzburg, Switzerland; Shanghai, China; and sales offices in Paris, France; Zurich, Switzerland; Singapore; Milan, Italy; Chennai, India; and Tokyo, Japan.
B. Cash and Cash Equivalents
The Company considers all highly liquid investment instruments, including investments with original maturities of three months or less at acquisition, to be cash equivalents, the carrying value of which approximates fair value due to the short maturity of these investments.
C. Accounts Receivable
The Company maintains allowances for doubtful accounts for estimated losses resulting from the inability of its customers to make required payments. The Company markets its products to a diverse customer base, both in the United States of America and overseas. Trade credit is extended based upon evaluation of each customer's ability to perform its obligation, which is updated periodically. The Company purchases credit insurance for certain foreign trade receivables.
61
HAYNES INTERNATIONAL, INC. AND SUBSIDIARIES
NOTES TO CONSOLIDATED FINANCIAL STATEMENTS (Continued)
(in thousands, except share and per share data and otherwise noted)
Note 2 Summary of Significant Accounting Policies (Continued)
D. Revenue Recognition
The Company recognizes revenue when collectability is reasonably assured and when title passes to the customer, which is generally at the time of shipment with freight terms of FOB shipping point or at a foreign port for certain export customers. Allowances for sales returns are recorded as a component of net sales in the periods in which the related sales are recognized. The Company determines this allowance based on historical experience. Additionally, the Company recognizes revenue attributable to an up-front fee received from Titanium Metals Corporation ("TIMET") as a result of a twenty-year agreement, entered into on November, 17, 2006 to provide conversion services to TIMET. See Note 15 Deferred Revenue for a description of accounting treatment relating to this up-front fee.
E. Inventories
Inventories are stated at the lower of cost or market. The cost of inventories is determined using the first-in, first-out ("FIFO") method. The Company writes down its inventory for estimated obsolescence or unmarketable inventory in an amount equal to the difference between the cost of inventory and the estimated market or scrap value, if applicable, based upon assumptions about future demand and market conditions.
F. Intangible Assets
The Company has patents, trademarks and other intangibles. As the patents have a definite life, they are amortized over lives ranging from two to fourteen years. The Company reviews patents for impairment whenever events or circumstances indicate that the carrying amount of a patent may not be recoverable. Recoverability of the patent asset is measured by a comparison of the carrying amount of the asset to the undiscounted future cash flows expected to be generated by the asset. If the carrying amount of an asset exceeds its estimated future cash flows, an impairment charge is recognized in the amount by which the carrying amount exceeds the fair value of the asset.
As the trademarks have an indefinite life, the Company tests them for impairment at least annually as of August 31 (the annual impairment testing date). If the carrying value exceeds the fair value (determined by calculating a fair value based upon a discounted cash flow of an assumed royalty rate), impairment of the trademark may exist resulting in a charge to earnings to the extent of the impairment. No impairment was recognized in the years ended September 30, 2013 or 2014 because the fair value exceeded the carrying values. The Company has a non-compete agreement with a remaining life of eight months.
62
HAYNES INTERNATIONAL, INC. AND SUBSIDIARIES
NOTES TO CONSOLIDATED FINANCIAL STATEMENTS (Continued)
(in thousands, except share and per share data and otherwise noted)
Note 2 Summary of Significant Accounting Policies (Continued)
Amortization of the patents, non-competes and other intangibles was $423, $416 and $416 for the years ended September 30, 2012, 2013 and 2014, respectively. The following represents a summary of intangible assets at September 30, 2013 and 2014:
September 30, 2013
|
Gross Amount |
Accumulated Amortization |
Carrying Amount |
|||||||
|---|---|---|---|---|---|---|---|---|---|---|
Patents |
$ | 4,030 | $ | (2,533 | ) | $ | 1,497 | |||
Trademarks |
3,800 | — | 3,800 | |||||||
Non-compete |
500 | (381 | ) | 119 | ||||||
Other |
330 | (145 | ) | 185 | ||||||
| | | | | | | | | | | |
|
$ | 8,660 | $ | (3,059 | ) | $ | 5,601 | |||
| | | | | | | | | | | |
| | | | | | | | | | | |
September 30, 2014
|
Gross Amount |
Accumulated Amortization |
Carrying Amount |
|||||||
|---|---|---|---|---|---|---|---|---|---|---|
Patents |
$ | 4,030 | $ | (2,813 | ) | $ | 1,217 | |||
Trademarks |
3,800 | — | 3,800 | |||||||
Non-compete |
500 | (452 | ) | 48 | ||||||
Other |
330 | (210 | ) | 120 | ||||||
| | | | | | | | | | | |
|
$ | 8,660 | $ | (3,475 | ) | $ | 5,185 | |||
| | | | | | | | | | | |
| | | | | | | | | | | |
Estimate of Aggregate Amortization Expense: Year Ended September 30, |
|
|||
|---|---|---|---|---|
2015 |
392 | |||
2016 |
333 | |||
2017 |
279 | |||
2018 |
279 | |||
2019 |
102 | |||
Thereafter |
— | |||
G. Property, Plant and Equipment
Additions to property, plant and equipment are recorded at cost with depreciation calculated primarily by using the straight-line method based on estimated economic useful lives which are generally as follows:
Building and improvements |
40 years | |
Machinery and equipment |
5-14 years | |
Office equipment and computer software |
3-10 years | |
Land improvements |
20 years |
Expenditures for maintenance and repairs and minor renewals are charged to expense; major renewals are capitalized. Upon retirement or sale of assets, the cost of the disposed assets and the related accumulated depreciation are removed from the accounts and any resulting gain or loss is credited or charged to operations.
63
HAYNES INTERNATIONAL, INC. AND SUBSIDIARIES
NOTES TO CONSOLIDATED FINANCIAL STATEMENTS (Continued)
(in thousands, except share and per share data and otherwise noted)
Note 2 Summary of Significant Accounting Policies (Continued)
The Company records capitalized interest for long-term construction projects to capture the cost of capital committed prior to the placed in service date as a part of the historical cost of acquiring the asset. Interest is not capitalized when balance on the revolver is zero.
The Company reviews long-lived assets for impairment whenever events or circumstances indicate that the carrying amount of an asset may not be recoverable. Recoverability of long-lived assets to be held and used is measured by a comparison of the carrying amount of the asset to the undiscounted future cash flows expected to be generated by the asset. If the carrying amount of an asset exceeds its estimated future cash flows, an impairment charge is recognized in the amount by which the carrying amount exceeds the fair value of the asset. There was no triggering event during the years ended September 30, 2013 or 2014 and thus no impairment was recognized.
H. Environmental Remediation
When it is probable that a liability has been incurred or an asset of the Company has been impaired, a loss is recognized assuming the amount of the loss can be reasonably estimated. The measurement of environmental liabilities by the Company is based on currently available facts, present laws and regulations and current technology. Such estimates take into consideration the expected costs of post-closure monitoring based on historical experience.
I. Pension and Postretirement Benefits
The Company has defined benefit pension and postretirement plans covering most of its current and former employees. Significant elements in determining the assets or liabilities and related income or expense for these plans are the expected return on plan assets, the discount rate used to value future payment streams, expected trends in health care costs, and other actuarial assumptions. Annually, the Company evaluates the significant assumptions to be used to value its pension and postretirement plan assets and liabilities based on current market conditions and expectations of future costs. If actual results are less favorable than those projected by management, additional expense may be required in future periods. Salaried employees hired after December 31, 2005 and hourly employees hired after June 30, 2007 are not covered by the pension plan; however, they are eligible for an enhanced matching program of the defined contribution plan (401(k)). Effective December 31, 2007, the U.S. pension plan was amended to freeze benefits for all non-union employees in the U.S. Effective September 30, 2009, the U.K. pension plan was amended to freeze benefits for employees in the plan. Effective January 1, 2007 a plan amendment of the postretirement medical plan caps the Company's liability related to retiree health care costs at $5,000 annually.
J. Foreign Currency Exchange
The Company's foreign operating entities' financial statements are denominated in the functional currencies of each respective country, which are the local currencies. All assets and liabilities are translated to U.S. dollars using exchange rates in effect at the end of the year, and revenues and expenses are translated at the weighted average rate for the year. Translation gains or losses are recorded as a separate component of comprehensive income (loss) and transaction gains and losses are reflected in the consolidated statements of operations.
64
HAYNES INTERNATIONAL, INC. AND SUBSIDIARIES
NOTES TO CONSOLIDATED FINANCIAL STATEMENTS (Continued)
(in thousands, except share and per share data and otherwise noted)
Note 2 Summary of Significant Accounting Policies (Continued)
K. Research and Technical Costs
Research and technical costs related to the development of new products and processes are expensed as incurred. Research and technical costs for the years ended September 30, 2012, 2013 and 2014 were $3,285, $3,505 and $3,556, respectively.
L. Income Taxes
The Company accounts for deferred tax assets and liabilities using enacted tax rates for the effect of temporary differences between book and tax basis of recorded assets and liabilities. A valuation allowance is required if it is more likely than not that some portion or all of the deferred tax assets will not be realized. The determination of whether or not a valuation allowance is needed is based upon an evaluation of both positive and negative evidence. In its evaluation of the need for a valuation allowance, the Company utilizes prudent and feasible tax planning strategies. The ultimate amount of deferred tax assets realized could be different from those recorded, as influenced by potential changes in enacted tax laws and the availability of future taxable income. The Company records uncertain tax positions in accordance with ASC 740 on the basis of a two-step process whereby (1) it is determined whether it is more likely than not that the tax positions will be sustained based on the technical merits of the position and (2) those tax positions that meet the more-likely-than-not recognition threshold, we recognize the largest amount of tax benefit that is greater than 50 percent likely to be realized upon ultimate settlement with the related tax authority.
M. Stock Based Compensation
Restricted Stock Plan
On February 23, 2009, the Company adopted a restricted stock plan that reserved 400,000 shares of common stock for issuance. Grants of restricted stock are shares of the Company's common stock subject to transfer restrictions, which vest in accordance with the terms and conditions established by the Compensation Committee. The Compensation Committee may set restrictions on certain grants based on the achievement of specific performance goals and vesting of grants to participants will also be time-based.
Restricted stock grants are subject to forfeiture if employment or service terminates prior to the end of the vesting period or if the performance goals are not met, if applicable. The Company will assess, on an ongoing basis, the probability of whether the performance criteria will be achieved. The Company will recognize compensation expense over the performance period if it is deemed probable that the goals will be achieved. The fair value of the Company's restricted stock is determined based upon the closing price of the Company's common stock on the grant date. The plan provides for the adjustment of the number of shares covered by an outstanding grant and the maximum number of shares for which restricted stock may be granted in the event of a stock split, extraordinary dividend or distribution or similar recapitalization event.
Stock Option Plans
The Company has two stock option plans that authorize the granting of non-qualified stock options to certain key employees and non-employee directors for the purchase of a maximum of 1,500,000 shares of the Company's common stock. The original option plan was adopted in August 2004 pursuant to the plan
65
HAYNES INTERNATIONAL, INC. AND SUBSIDIARIES
NOTES TO CONSOLIDATED FINANCIAL STATEMENTS (Continued)
(in thousands, except share and per share data and otherwise noted)
Note 2 Summary of Significant Accounting Policies (Continued)
of reorganization and provides for the grant of options to purchase up to 1,000,000 shares of the Company's common stock. In January 2007, the Company's Board of Directors adopted a second option plan that provides for options to purchase up to 500,000 shares of the Company's common stock. Each plan provides for the adjustment of the maximum number of shares for which options may be granted in the event of a stock split, extraordinary dividend or distribution or similar recapitalization event. Unless the Compensation Committee determines otherwise, options granted under the option plans are exercisable for a period of ten years from the date of grant and vest 331/3% per year over three years from the grant date. The amount of compensation cost recognized in the financial statement is measured based upon the grant date fair value. The fair value of the option grants is estimated on the date of grant using the Black-Scholes option pricing model with assumptions on dividend yield, risk-free interest rate, expected volatilities, expected forfeiture rate and expected lives of the options.
N. Financial Instruments and Concentrations of Risk
The Company may periodically enter into forward currency exchange contracts to minimize the variability in the Company's operating results arising from foreign exchange rate movements. The Company does not engage in foreign currency speculation. At September 30, 2013 and 2014, the Company had no foreign currency exchange contracts outstanding.
Financial instruments which potentially subject the Company to concentrations of credit risk consist of cash and cash equivalents and accounts receivable. At September 30, 2014, and periodically throughout the year, the Company has maintained cash balances in excess of federally insured limits. The carrying amounts of cash and cash equivalents, accounts receivable and accounts payable approximate fair value because of the relatively short maturity of these instruments.
During 2012, 2013 and 2014, the Company did not have sales to any group of affiliated customers that were greater than 10% of net revenues. The Company generally does not require collateral with the exception of letters of credit with certain foreign sales. Credit losses have been within management's expectations. In addition, the Company purchases credit insurance for certain foreign trade receivables. The Company does not believe it is significantly vulnerable to the risk of near-term severe impact from business concentrations with respect to customers, suppliers, products, markets or geographic areas.
O. Accounting Estimates
The preparation of financial statements in conformity with accounting principles generally accepted in the United States of America (U.S. GAAP) requires management to make estimates and assumptions that affect the reported amounts of assets and liabilities and the disclosure of contingent assets and liabilities at the date of the financial statements and the reported amounts of revenues and expenses during the reporting period. On an on-going basis, management evaluates its estimates and judgments, including those related to bad debts, inventories, income taxes, asset impairment, retirement benefits, and environmental matters. The process of determining significant estimates is fact specific and takes into account factors such as historical experience, current and expected economic conditions, product mix, pension asset mix and in some cases, actuarial techniques, and various other factors that are believed to be reasonable under the circumstances, the results of which form the basis for making judgments about the carrying values of assets and liabilities that are not readily apparent from other sources. The Company
66
HAYNES INTERNATIONAL, INC. AND SUBSIDIARIES
NOTES TO CONSOLIDATED FINANCIAL STATEMENTS (Continued)
(in thousands, except share and per share data and otherwise noted)
Note 2 Summary of Significant Accounting Policies (Continued)
routinely reevaluates these significant factors and makes adjustments where facts and circumstances dictate. Actual results may differ from these estimates under different assumptions or conditions.
P. Earnings Per Share
The Company accounts for earnings per share using the two-class method. The two-class method is an earnings allocation that determines net income per share for each class of common stock and participating securities according to participation rights in undistributed earnings. Non-vested restricted stock awards that include non-forfeitable rights to dividends are considered participating securities. Per share amounts are computed by dividing net income attributable to common shareholders by the weighted average shares outstanding during each period. Basic earnings per share is computed by dividing net income available to common stockholders for the period by the weighted average number of common shares outstanding for the period. The computation of diluted earnings per share is similar to basic earnings per share, except the denominator is increased to include the number of additional common shares that would have been outstanding if the potentially dilutive common shares had been issued.
Basic and diluted net income per share were computed as follows:
| |
Years Ended September 30, | |||||||||
|---|---|---|---|---|---|---|---|---|---|---|
(in thousands, except share and per share data)
|
2012 | 2013 | 2014 | |||||||
Numerator: Basic and Diluted |
||||||||||
Net income |
$ | 50,182 | $ | 21,577 | $ | 3,751 | ||||
Dividends paid |
(10,803 | ) | (10,849 | ) | (10,906 | ) | ||||
| | | | | | | | | | | |
Undistributed income (loss) |
39,379 | 10,728 | (7,155 | ) | ||||||
Percentage allocated to common shares(a) |
99.1 | % | 99.1 | % | 99.2 | % | ||||
Undistributed income (loss) allocated to common shares |
39,025 |
10,637 |
(7,098 |
) |
||||||
Dividends paid on common shares outstanding |
10,705 | 10,754 | 10,819 | |||||||
| | | | | | | | | | | |
Net income available to common shares |
49,730 | 21,391 | 3,721 | |||||||
Denominator: Basic and Diluted |
||||||||||
Weighted average common shares outstanding |
12,147,179 | 12,223,838 | 12,291,881 | |||||||
Adjustment for dilutive potential common shares |
68,852 | 41,792 | 29,819 | |||||||
| | | | | | | | | | | |
Weighted average shares outstanding—Diluted |
12,216,031 | 12,265,630 | 12,321,700 | |||||||
Per common share net income (loss) |
||||||||||
Basic |
$ | 4.09 | $ | 1.75 | $ | 0.30 | ||||
Diluted |
$ | 4.07 | $ | 1.74 | $ | 0.30 | ||||
Number of stock option shares excluded as their effect would be anti-dilutive |
98,630 |
170,623 |
180,435 |
|||||||
Number of restrictive stock option shares as their effect would be anti-dilutive |
111,000 | 106,575 | 98,463 | |||||||
(a) Percentage allocated to common shares—weighted average |
||||||||||
Common shares outstanding |
12,147,179 | 12,223,838 | 12,291,881 | |||||||
Unvested participating shares |
111,000 | 106,575 | 98,463 | |||||||
| | | | | | | | | | | |
|
12,258,179 | 12,330,413 | 12,390,344 | |||||||
67
HAYNES INTERNATIONAL, INC. AND SUBSIDIARIES
NOTES TO CONSOLIDATED FINANCIAL STATEMENTS (Continued)
(in thousands, except share and per share data and otherwise noted)
Note 2 Summary of Significant Accounting Policies (Continued)
Q. Recently Issued Accounting Pronouncements
In May 2014, the FASB issued ASU 2014-09, Revenue from Contracts with Customers (Topic 606). The objective of the update is to recognize revenue to depict the transfer of promised goods or services to customers in an amount that reflects the consideration to which the entity expects to be entitled in exchange for those goods or services. It is effective for annual reporting periods beginning after December 15, 2016, including interim periods within that reporting period. The Company is currently evaluating the methods of adoption allowed by the new standard and the effect, if any, on its financial statements.
In June 2014, the FASB issued ASU 2014-12, Compensation-Stock Compensation (Topic 718). Accounting for Share-Based Payments When the Terms of an Award Provide that a Performance Target Could Be Achieved after the Requisite Service Period. This update is intended to resolve the diverse accounting treatment of those awards in practice. The amendment is effective for annual and interim periods within those annual periods beginning after December 15, 2015. Early adoption is permitted. The Company is evaluating the effect, if any, on its financial statements.
In August 2014, the FASB issued ASU 2014-15, Presentation of Financial Statements-Going Concern (Subtopic 310-40). The amendments in this update provide guidance in GAAP about management's responsibility to evaluate whether there is substantial doubt about an entity's ability to continue as a going concern and to provide related footnote disclosures. In doing so, the amendments should reduce diversity in the timing and content of footnote disclosures. The amendments in this update are effective for the annual period ending after December 15, 2016, and for annual periods and interim periods thereafter. Early application is permitted. The Company is evaluating the effect, if any, on its financial statements.
R. Comprehensive Income (Loss)
Comprehensive income (loss) includes changes in equity that result from transactions and economic events from non-owner sources. See Note 17 for a breakdown of Comprehensive Income (Loss) and changes in Accumulated Other Comprehensive Loss net of tax effects.
Note 3 Inventories
Inventories are stated at the lower of cost or market. The cost of inventories is determined using the first-in, first-out ("FIFO") method. The following is a summary of the major classes of inventories:
| |
September 30, | ||||||
|---|---|---|---|---|---|---|---|
| |
2013 | 2014 | |||||
Raw materials |
$ | 25,647 | $ | 25,050 | |||
Work-in-process |
108,708 | 144,285 | |||||
Finished goods |
97,150 | 83,674 | |||||
Other |
652 | 1,018 | |||||
| | | | | | | | |
|
$ | 232,157 | $ | 254,027 | |||
| | | | | | | | |
| | | | | | | | |
68
HAYNES INTERNATIONAL, INC. AND SUBSIDIARIES
NOTES TO CONSOLIDATED FINANCIAL STATEMENTS (Continued)
(in thousands, except share and per share data and otherwise noted)
Note 4 Property, Plant and Equipment
The following is a summary of the major classes of property, plant and equipment:
| |
September 30, | ||||||
|---|---|---|---|---|---|---|---|
| |
2013 | 2014 | |||||
Land and land improvements |
$ | 6,856 | $ | 6,785 | |||
Buildings |
19,034 | 24,750 | |||||
Machinery and equipment |
179,407 | 213,834 | |||||
Construction in process |
31,472 | 27,635 | |||||
| | | | | | | | |
|
236,769 | 273,004 | |||||
Less accumulated depreciation |
(84,005 | ) | (98,921 | ) | |||
| | | | | | | | |
|
$ | 152,764 | $ | 174,083 | |||
| | | | | | | | |
| | | | | | | | |
The Company has $432 of assets under a capital lease for equipment related to the service center operation in Shanghai, China.
Note 5 Accrued Expenses
The following is a summary of the major classes of accrued expenses:
| |
September 30, | ||||||
|---|---|---|---|---|---|---|---|
| |
2013 | 2014 | |||||
Employee compensation |
$ | 6,415 | $ | 6,750 | |||
Taxes, other than income taxes |
3,005 | 2,631 | |||||
Other |
4,256 | 3,832 | |||||
| | | | | | | | |
|
$ | 13,676 | $ | 13,213 | |||
| | | | | | | | |
| | | | | | | | |
69
HAYNES INTERNATIONAL, INC. AND SUBSIDIARIES
NOTES TO CONSOLIDATED FINANCIAL STATEMENTS (Continued)
(in thousands, except share and per share data and otherwise noted)
Note 6 Income Taxes
The components of income before provision for income taxes are as follows:
| |
Year Ended September 30, | |||||||||
|---|---|---|---|---|---|---|---|---|---|---|
| |
2012 | 2013 | 2014 | |||||||
Income (loss) before income taxes: |
||||||||||
U.S. |
$ | 67,968 | $ | 23,555 | $ | (360 | ) | |||
Foreign |
9,027 | 8,443 | 5,480 | |||||||
| | | | | | | | | | | |
Total |
$ | 76,995 | $ | 31,998 | $ | 5,120 | ||||
| | | | | | | | | | | |
| | | | | | | | | | | |
Provision for income taxes: |
||||||||||
Current: |
||||||||||
U.S. Federal |
$ | 15,836 | $ | 2,125 | $ | 427 | ||||
Foreign |
1,712 | 1,419 | 1,012 | |||||||
State |
2,079 | 85 | 541 | |||||||
| | | | | | | | | | | |
Total |
$ | 19,627 | $ | 3,629 | $ | 1,980 | ||||
| | | | | | | | | | | |
Deferred: |
||||||||||
U.S. Federal |
6,314 | 5,907 | (983 | ) | ||||||
Foreign |
585 | 623 | 302 | |||||||
State |
601 | 262 | 70 | |||||||
Valuation allowance |
(314 | ) | — | — | ||||||
| | | | | | | | | | | |
Total |
$ | 7,186 | $ | 6,792 | $ | (611 | ) | |||
| | | | | | | | | | | |
Total provision for income taxes |
$ | 26,813 | $ | 10,421 | $ | 1,369 | ||||
| | | | | | | | | | | |
| | | | | | | | | | | |
The provision for income taxes applicable to results of operations differed from the U.S. federal statutory rate as follows:
| |
Year Ended September 30, | |||||||||
|---|---|---|---|---|---|---|---|---|---|---|
| |
2012 | 2013 | 2014 | |||||||
Statutory federal tax rate |
35 | % | 35 | % | 35 | % | ||||
Tax provision for income taxes at the statutory rate |
$ | 26,949 | $ | 11,199 | $ | 1,792 | ||||
Foreign tax rate differentials |
(864 | ) | (913 | ) | (605 | ) | ||||
Provision for state taxes, net of federal taxes |
1,578 | 473 | 230 | |||||||
U.S. tax on distributed and undistributed earnings of foreign subsidiaries |
335 | 354 | 173 | |||||||
Manufacturer's deduction |
(1,715 | ) | (217 | ) | — | |||||
Tax credits |
— | (78 | ) | (91 | ) | |||||
State tax rate reduction impact on deferred tax asset |
89 | (182 | ) | 157 | ||||||
Change in Valuation Allowance |
(314 | ) | — | — | ||||||
Other, net |
755 | (215 | ) | (287 | ) | |||||
| | | | | | | | | | | |
Provision for income taxes at effective tax rate |
$ | 26,813 | $ | 10,421 | $ | 1,369 | ||||
| | | | | | | | | | | |
| | | | | | | | | | | |
Effective tax rate |
34.8 | % | 32.6 | % | 26.7 | % | ||||
70
HAYNES INTERNATIONAL, INC. AND SUBSIDIARIES
NOTES TO CONSOLIDATED FINANCIAL STATEMENTS (Continued)
(in thousands, except share and per share data and otherwise noted)
Note 6 Income Taxes (Continued)
During fiscal 2012, the Company's effective tax rate was lower than the statutory rate, primarily due to increased proportion of profitability in foreign jurisdictions and the increased Manufacturer's deduction (due to increased U.S. profitability).
During fiscal 2013, the Company's effective tax rate was lower than the statutory rate, primarily due to increased proportion of profitability in foreign jurisdictions and the reversal of certain tax reserves no longer required.
During fiscal 2014, the Company's effective tax rate was lower than the statutory rate, primarily due to a higher proportion of income in lower tax jurisdictions. The Company generated a taxable loss in the United States, which will be carried back to earlier years.
Deferred tax assets (liabilities) are comprised of the following:
| |
September 30, | ||||||
|---|---|---|---|---|---|---|---|
| |
2013 | 2014 | |||||
Deferred tax assets: |
|||||||
Pension and postretirement benefits |
$ | 58,148 | $ | 63,124 | |||
TIMET Agreement |
12,167 | 11,200 | |||||
Inventories |
2,095 | 2,662 | |||||
Accrued compensation and benefits |
3,076 | 1,606 | |||||
Accrued expenses and other |
527 | 2,093 | |||||
Tax attributes |
946 | 1,385 | |||||
| | | | | | | | |
Total deferred tax assets |
$ | 76,959 | $ | 82,070 | |||
| | | | | | | | |
| | | | | | | | |
Deferred tax liabilities: |
|||||||
Property, plant and equipment, net |
$ | (26,931 | ) | $ | (29,789 | ) | |
Intangible and other |
(2,709 | ) | (1,345 | ) | |||
| | | | | | | | |
Total deferred tax liabilities |
$ | (29,640 | ) | $ | (31,134 | ) | |
Net deferred tax assets (liabilities) |
$ |
47,319 |
$ |
50,936 |
|||
| | | | | | | | |
| | | | | | | | |
Current deferred tax assets |
$ | 6,018 | $ | 6,297 | |||
| | | | | | | | |
Long-term deferred tax asset |
$ | 41,301 | $ | 44,639 | |||
| | | | | | | | |
| | | | | | | | |
As of September 30, 2014, the Company has state tax net operating loss of approximately $5,013, tax credits of $606 and foreign net operating loss carryforwards of $1,259. As of September 30, 2013, the Company had state tax net operating loss carryforwards of approximately $2,106, tax credit of $0 and foreign net operating loss carryforwards of $1,602. Some tax attributes expire beginning in 2024 and others have no expiration. The Company has not recorded a valuation allowance because management believes that it is more likely than not that net operating loss carryforwards will be realized prior to their expiration.
Undistributed earnings of certain of our foreign subsidiaries amounted to approximately $55,816 at September 30, 2014. The Company considers those earnings reinvested indefinitely and, accordingly, no provision for U.S. income taxes has been provided. Determination of the amount of unrecognized deferred
71
HAYNES INTERNATIONAL, INC. AND SUBSIDIARIES
NOTES TO CONSOLIDATED FINANCIAL STATEMENTS (Continued)
(in thousands, except share and per share data and otherwise noted)
Note 6 Income Taxes (Continued)
U.S. income tax liability is not practicable because of the complexities associated with its hypothetical calculation.
A reconciliation of the beginning and ending amount of unrecognized tax benefits is as follows:
| |
October 1, 2010 To September 30, 2012 |
October 1, 2011 To September 30, 2013 |
October 1, 2013 To September 30, 2014 |
|||||||
|---|---|---|---|---|---|---|---|---|---|---|
Balance at beginning of period |
$ | 264 | $ | 264 | $ | — | ||||
Gross Increases—current period tax positions |
— | — | — | |||||||
Gross Decreases—current period tax positions |
— | — | — | |||||||
Gross Increases—tax positions in prior periods |
— | — | — | |||||||
Gross Decreases—tax positions in prior periods |
— | — | — | |||||||
Gross Decreases—settlements with taxing authorities |
— | — | — | |||||||
Gross Decreases—lapse of statute of limitations |
— | (264 | ) | — | ||||||
| | | | | | | | | | | |
Balance at end of period |
$ | 264 | $ | — | $ | — | ||||
| | | | | | | | | | | |
| | | | | | | | | | | |
During fiscal year 2013, the Company recognized the tax benefits previously unrecognized due to the statute of limitations. This tax benefit was recorded in income tax expense and affected the income statement by $236. During fiscal 2013, the Company recognized a reversal of accrued interest expense related to the unrecognized tax benefits totaling $75.
As of September 30, 2014, the Company is open to examination in the U.S. federal income tax jurisdiction for the 2011 through 2014 tax years and in various foreign jurisdictions from 2009 through 2014. The Company is also open to examination in various states in the U.S., none of which were individually material.
Note 7 Debt
U.S. revolving credit facility
The Company and Wells Fargo Capital Finance, LLC ("Wells Fargo"), entered into a Third Amended and Restated Loan and Security Agreement (the "Amended Agreement") with certain other lenders with an effective date of July 14, 2011. The maximum revolving loan amount under the Amended Agreement is $120.0 million, subject to a borrowing base formula and certain reserves that could limit the Company's borrowing to approximately $105.0 million. The Amended Agreement permits an increase in the maximum revolving loan amount from $120.0 million up to an aggregate amount of $170.0 million at the request of the borrowers. Borrowings under the U.S. revolving credit facility bear interest at the Company's option at either Wells Fargo's "prime rate", plus up to 0.75% per annum, or the adjusted Eurodollar rate used by the lender, plus up to 2.0% per annum. As of September 30, 2014, the U.S. revolving credit facility had an outstanding balance of zero. In addition, the Company must pay monthly in arrears a commitment fee of 0.25% per annum on the unused amount of the U.S. revolving credit facility total commitment. For letters of credit, the Company must pay 1.5% per annum on the daily outstanding balance of all issued letters of credit, plus customary fees for issuance, amendments and processing. The Company is subject to certain covenants as to fixed charge coverage ratios and other customary covenants, including covenants restricting
72
HAYNES INTERNATIONAL, INC. AND SUBSIDIARIES
NOTES TO CONSOLIDATED FINANCIAL STATEMENTS (Continued)
(in thousands, except share and per share data and otherwise noted)
Note 7 Debt (Continued)
the incurrence of indebtedness, the granting of liens and the sale of assets. The covenant pertaining to fixed charge coverage ratios is only effective in the event the amount of excess availability under the revolver is less than 12.5% of the maximum credit revolving amount. The Company is permitted to pay dividends and repurchase common stock if certain financial metrics are met (which do not apply in the case of dividends less than $20.0 million in the aggregate in a year and repurchases in connection with the vesting of shares of restricted stock). As of September 30, 2014, the most recent required measurement date under the Amended Agreement, management believes that the Company was in compliance with all applicable financial covenants under the Amended Agreement. The U.S. revolving credit facility matures on July 14, 2016. Borrowings under the U.S. revolving credit facility are collateralized by a pledge of substantially all of the U.S. assets of the Company, including the equity interests in its U.S. subsidiaries, but excluding the four-high Steckel rolling mill and related assets, which are pledged to Titanium Metals Corporation to secure the performance of the Company's obligations under a Conversion Services Agreement with TIMET (see discussion of TIMET at Note 15 in the Notes to Consolidated Financial Statements in this Annual Report on Form 10-K). The U.S. revolving credit facility is also secured by a pledge of a 65% equity interest in each of the Company's direct foreign subsidiaries.
The Company's U.K. subsidiary (Haynes International Ltd.) has an overdraft facility of 2,000 pounds sterling ($3,243), all of which was available on September 30, 2014. The Company's French subsidiary (Haynes International, S.A.R.L.) has an overdraft banking facility of 1,200 Euro ($1,510), all of which was available on September 30, 2014. The Company's Swiss subsidiary (Haynes International AG) had an overdraft banking facility of 500 Swiss Francs ($524), all of which was available on September 30, 2014.
Note 8 Pension Plan and Retirement Benefits
Defined Contribution Plans
The Company sponsors a defined contribution plan (401(k)) for substantially all U.S. employees. The Company contributes an amount equal to 50% of an employee's contribution to the plan up to a maximum contribution of 3% of the employee's salary, except for all salaried employees and certain hourly employees (those hired after June 30, 2007 that are not eligible for the U.S. pension plan). The Company contributes an amount equal to 60% of an employee's contribution to the plan up to a maximum contribution of 6% of the employee's salary for these groups. Expenses associated with this plan for the years ended September 30, 2012, 2013 and 2014 totaled $1,374, $1,416 and $1,436, respectively.
The Company sponsors certain profit sharing plans for the benefit of employees meeting certain eligibility requirements. There were no contributions to these plans for the years ended September 30, 2012, 2013 and 2014.
73
HAYNES INTERNATIONAL, INC. AND SUBSIDIARIES
NOTES TO CONSOLIDATED FINANCIAL STATEMENTS (Continued)
(in thousands, except share and per share data and otherwise noted)
Note 8 Pension Plan and Retirement Benefits (Continued)
Defined Benefit Plans
The Company has non-contributory defined benefit pension plans which cover most employees in the U.S. and certain foreign subsidiaries. In the U.S. salaried employees hired after December 31, 2005 and hourly employees hired after June 30, 2007 are not covered by the pension plan; however, they are eligible for an enhanced matching program of the defined contribution plan (401(k)). On October 3, 2007, the U.S. pension plan was amended effective December 31, 2007 to freeze benefit accruals for all non-union employees in the U.S. and effective January 1, 2008, the pension multiplier used to calculate the employee's monthly benefit was increased from 1.4% to 1.6%. In addition, the Company will make enhanced matching contributions to its 401K plan equal to 60% of the non-union and union plan participant's salary deferrals, up to 6% of compensation. As a result of freezing the benefit accruals for all non-union employees in the U.S. in the first quarter of fiscal 2008, the Company recognized a reduction of the projected benefit obligation of $8,191, an increase to other comprehensive income (before tax) of $4,532 and a curtailment gain (before tax) of $3,659. The impact of the multiplier increase will be charged to pension expense over the estimated remaining lives of the participants. Effective September 30, 2009, the U.K. pension plan was amended to freeze benefit accruals for members of its plan. As of September 30, 2009, the company recognized a reduction of the projected benefit obligation of $392, an increase to other comprehensive income (before tax) of $392 and zero impact on the statement of operations.
Benefits provided under the Company's domestic defined benefit pension plan are based on years of service and the employee's final compensation. The Company's funding policy is to contribute annually an amount deductible for federal income tax purposes based upon an actuarial cost method using actuarial and economic assumptions designed to achieve adequate funding of benefit obligations.
The Company has non-qualified pensions for former executives of the Company. Non-qualified pension plan expense for the years ended September 30, 2012, 2013 and 2014 was $110, $12 and $84, respectively. Accrued liabilities in the amount of $825 and $813 for these benefits are included in accrued pension and postretirement benefits liability at September 30, 2013 and 2014, respectively.
In addition to providing pension benefits, the Company provides certain health care and life insurance benefits for retired employees. Substantially all domestic employees become eligible for these benefits, if they reach normal retirement age while working for the Company. During March 2006, the Company communicated to employees and plan participants a negative plan amendment that caps the Company's liability related to total retiree health care costs at $5,000 annually effective January 1, 2007. An updated actuarial valuation was performed at March 31, 2006, which reduced the accumulated postretirement benefit liability due to this plan amendment by $46,313 that was amortized as a reduction to expense over an eight year period. This amortization period began in April 2006 thus reducing the amount of expense recognized for the second half of fiscal 2006 and the respective future periods and, as of September 30, 2014 is fully amortized.
The Company made contributions of $15,000 and $1,250 to fund its domestic Company-sponsored pension plan for the year ended September 30, 2013 and 2014, respectively. The Company's U.K. subsidiary made contributions of $970 and $975 for the years ended September 30, 2013 and 2014, respectively, to the U.K. pension plan.
74
HAYNES INTERNATIONAL, INC. AND SUBSIDIARIES
NOTES TO CONSOLIDATED FINANCIAL STATEMENTS (Continued)
(in thousands, except share and per share data and otherwise noted)
Note 8 Pension Plan and Retirement Benefits (Continued)
The Company uses a September 30 measurement date for its plans. The status of employee pension benefit plans and other postretirement benefit plans are summarized below:
| |
Defined Benefit Pension Plans |
|
Postretirement Health Care Benefits |
||||||||||||
|---|---|---|---|---|---|---|---|---|---|---|---|---|---|---|---|
| |
|
||||||||||||||
| |
|
||||||||||||||
| |
Year Ended September 30, |
|
Year Ended September 30, | ||||||||||||
| |
|
||||||||||||||
| |
2013 | 2014 |
|
2013 | 2014 | ||||||||||
| |
|
||||||||||||||
Change in Benefit Obligation: |
|||||||||||||||
Projected benefit obligation at beginning of year |
$ | 303,445 | $ | 273,693 | $ | 114,209 | $ | 98,772 | |||||||
Service cost |
4,881 | 3,971 | 387 | 267 | |||||||||||
Interest cost |
10,839 | 11,989 | 4,330 | 4,578 | |||||||||||
Actuarial losses (gains) |
(32,627 | ) | 12,143 | (16,018 | ) | 5,614 | |||||||||
Benefits paid |
(12,845 | ) | (13,237 | ) | (4,136 | ) | (3,844 | ) | |||||||
Projected benefit obligation at end of year |
$ | 273,693 | $ | 288,559 | $ | 98,772 | $ | 105,387 | |||||||
Change in Plan Assets: |
|||||||||||||||
Fair value of plan assets at beginning of year |
$ | 182,011 | $ | 206,113 | $ | — | $ | — | |||||||
Actual return on assets |
20,977 | 21,861 | — | — | |||||||||||
Employer contributions |
15,970 | 2,225 | 4,136 | 3,844 | |||||||||||
Benefits paid |
(12,845 | ) | (13,237 | ) | (4,136 | ) | (3,844 | ) | |||||||
Fair value of plan assets at end of year |
$ | 206,113 | $ | 216,962 | $ | — | $ | — | |||||||
Funded Status of Plan: |
|||||||||||||||
Unfunded status |
$ | (67,580 | ) | $ | (71,597 | ) | $ | (98,772 | ) | $ | (105,387 | ) | |||
75
HAYNES INTERNATIONAL, INC. AND SUBSIDIARIES
NOTES TO CONSOLIDATED FINANCIAL STATEMENTS (Continued)
(in thousands, except share and per share data and otherwise noted)
Note 8 Pension Plan and Retirement Benefits (Continued)
Amounts recognized in the consolidated balance sheets are as follows:
| |
Defined Benefit Pension Plans |
Postretirement Health Care Benefits |
Non-Qualified Pension Plans |
All Plans Combined |
|||||||||||||||||||||
|---|---|---|---|---|---|---|---|---|---|---|---|---|---|---|---|---|---|---|---|---|---|---|---|---|---|
| |
September 30, | September 30, | September 30, | September 30, | |||||||||||||||||||||
| |
2013 | 2014 | 2013 | 2014 | 2013 | 2014 | 2013 | 2014 | |||||||||||||||||
Accrued pension and postretirement benefits: |
|||||||||||||||||||||||||
Current |
$ | — | $ | — | $ | (4,823 | ) | $ | (4,477 | ) | $ | (95 | ) | $ | (95 | ) | $ | (4,918 | ) | $ | (4,572 | ) | |||
Non-current |
(67,580 | ) | (71,597 | ) | (93,949 | ) | (100,910 | ) | (730 | ) | (718 | ) | (162,259 | ) | (173,225 | ) | |||||||||
| | | | | | | | | | | | | | | | | | | | | | | | | | |
Accrued pension and postretirement benefits |
$ | (67,580 | ) | $ | (71,597 | ) | $ | (98,772 | ) | $ | (105,387 | ) | $ | (825 | ) | $ | (813 | ) | $ | (167,177 | ) | $ | (177,797 | ) | |
Accumulated other comprehensive loss: |
|||||||||||||||||||||||||
Net loss |
63,939 | 64,641 | 28,897 | 32,514 | — | — | 92,836 | 97,155 | |||||||||||||||||
Prior service cost |
5,444 | 4,636 | (2,895 | ) | — | — | — | 2,549 | 4,636 | ||||||||||||||||
| | | | | | | | | | | | | | | | | | | | | | | | | | |
Total accumulated other comprehensive loss |
$ | 69,383 | $ | 69,277 | $ | 26,002 | $ | 32,514 | $ | — | $ | — | $ | 95,385 | $ | 101,791 | |||||||||
Amounts expected to be recognized from AOCI into the statement of operations in the following year: |
|||||||||||||||||||||||||
Amortization of net loss |
$ | 4,612 | $ | 4,645 | $ | 1,996 | $ | 2,434 | $ | — | $ | — | $ | 6,608 | $ | 7,079 | |||||||||
Amortization of prior service cost |
808 | 808 | (2,895 | ) | — | — | — | (2,087 | ) | 808 | |||||||||||||||
| | | | | | | | | | | | | | | | | | | | | | | | | | |
|
$ | 5,420 | $ | 5,453 | $ | (899 | ) | $ | 2,434 | $ | — | $ | — | $ | 4,521 | $ | 7,887 | ||||||||
| | | | | | | | | | | | | | | | | | | | | | | | | | |
| | | | | | | | | | | | | | | | | | | | | | | | | | |
The accumulated benefit obligation for the pension plans was $257,284 and $276,009 at September 30, 2013 and 2014, respectively.
The cost of the Company's postretirement benefits are accrued over the years employees provide service to the date of their full eligibility for such benefits. The Company's policy is to fund the cost of claims on an annual basis.
The components of net periodic pension cost and postretirement health care benefit cost are as follows:
| |
Defined Benefit Pension Plans | |||||||||
|---|---|---|---|---|---|---|---|---|---|---|
| |
Year Ended September 30, | |||||||||
| |
2012 | 2013 | 2014 | |||||||
Service cost |
$ | 4,001 | $ | 4,881 | $ | 3,971 | ||||
Interest cost |
11,623 | 10,839 | 11,989 | |||||||
Expected return on assets |
(11,755 | ) | (13,189 | ) | (15,033 | ) | ||||
Amortization of prior service cost |
808 | 808 | 808 | |||||||
Recognized actuarial loss |
9,031 | 10,189 | 4,612 | |||||||
| | | | | | | | | | | |
Net periodic cost |
$ | 13,708 | $ | 13,528 | $ | 6,347 | ||||
| | | | | | | | | | | |
| | | | | | | | | | | |
76
HAYNES INTERNATIONAL, INC. AND SUBSIDIARIES
NOTES TO CONSOLIDATED FINANCIAL STATEMENTS (Continued)
(in thousands, except share and per share data and otherwise noted)
Note 8 Pension Plan and Retirement Benefits (Continued)
| |
Postretirement Health Care Benefits |
|||||||||
|---|---|---|---|---|---|---|---|---|---|---|
| |
Year Ended September 30, | |||||||||
| |
2012 | 2013 | 2014 | |||||||
Service cost |
$ | 291 | $ | 387 | $ | 267 | ||||
Interest cost |
4,581 | 4,330 | 4,578 | |||||||
Amortization of unrecognized prior service cost |
(5,789 | ) | (5,789 | ) | (2,895 | ) | ||||
Recognized actuarial loss |
2,799 | 3,717 | 1,996 | |||||||
| | | | | | | | | | | |
Net periodic cost |
$ | 1,882 | $ | 2,645 | $ | 3,946 | ||||
| | | | | | | | | | | |
| | | | | | | | | | | |
Assumptions
A 5.5% (6.0%-2013) annual rate of increase for the costs of covered health care benefits for ages under 65 and a 5.0% (5.0%-2013) annual rate of increase for ages over 65 were assumed for 2014, gradually decreasing for the over 65 age group to 5.0% and remaining at 5.0% for the under 65 age group by the year 2016. A one percentage point change in assumed health care cost trend rates would have the following effects in 2014:
| |
1-Percentage Point Increase |
1-Percentage Point Decrease |
|||||
|---|---|---|---|---|---|---|---|
Effect on total of service and interest cost components |
$ | 0 | $ | 0 | |||
Effect on accumulated postretirement benefit obligation |
0 | 0 | |||||
The effect on total of service and interest cost components and the effect on accumulated postretirement benefit obligation is zero due to the plan amendment that caps the Company costs at $5,000 on an undiscounted basis per year.
The actuarial present value of the projected pension benefit obligation and postretirement health care benefit obligation for the plans at September 30, 2013 and 2014 were determined based on the following assumptions:
| |
September 30, 2013 |
September 30, 2014 |
|||||
|---|---|---|---|---|---|---|---|
Discount rate (postretirement health care) |
4.750 | % | 4.250 | % | |||
Discount rate (U.S. pension plan) |
4.500 | % | 4.000 | % | |||
Discount rate (U.K. pension plan) |
4.300 | % | 3.900 | % | |||
Rate of compensation increase (U.S. pension plan only) |
3.500 | % | 3.500 | % | |||
77
HAYNES INTERNATIONAL, INC. AND SUBSIDIARIES
NOTES TO CONSOLIDATED FINANCIAL STATEMENTS (Continued)
(in thousands, except share and per share data and otherwise noted)
Note 8 Pension Plan and Retirement Benefits (Continued)
The net periodic pension and postretirement health care benefit costs for the plans were determined using the following assumptions:
| |
Defined Benefit Pension and Postretirement Health Care Plans |
|||||||||
|---|---|---|---|---|---|---|---|---|---|---|
| |
Year Ended September 30, | |||||||||
| |
2012 | 2013 | 2014 | |||||||
Discount rate (postretirement health care plan) |
4.625 | % | 3.875 | % | 4.750 | % | ||||
Discount rate (U.S. pension plan) |
4.500 | % | 3.625 | % | 4.500 | % | ||||
Discount rate (U.K. pension plan) |
5.200 | % | 4.100 | % | 4.300 | % | ||||
Expected return on plan assets (U.S. pension plan) |
8.000 | % | 7.500 | % | 7.500 | % | ||||
Expected return on plan assets (U.K. pension plan) |
5.900 | % | 4.200 | % | 4.800 | % | ||||
Rate of compensation increase (U.S. pension plan only) |
3.500 | % | 3.500 | % | 3.500 | % | ||||
Plan Assets and Investment Strategy
Our pension plan assets by level within the fair value hierarchy at September 30, 2013 and 2014, are presented in the table below. Our pension plan assets were accounted for at fair value. For more information on a description of the fair value hierarchy, see Note 16.
| |
September 30, 2013 | ||||||||||||
|---|---|---|---|---|---|---|---|---|---|---|---|---|---|
| |
Level 1 Active Markets for Identical Assets |
Level 2 Other Observable Inputs |
Level 3 Significant Unobservable Inputs |
Total | |||||||||
U.S. Pension Plan Assets: |
|||||||||||||
U.S. common stock mutual funds |
$ | 38,575 | $ | — | $ | — | $ | 38,575 | |||||
Common /collective funds |
|||||||||||||
Bonds |
— | 74,378 | — | 74,378 | |||||||||
Short-term money market |
— | 2,590 | — | 2,590 | |||||||||
U.S. common stock |
— | 64,592 | — | 64,592 | |||||||||
International equity |
— | 8,307 | — | 8,307 | |||||||||
| | | | | | | | | | | | | | |
Total U.S. |
$ | 38,575 | $ | 149,867 | $ | — | $ | 188,442 | |||||
U.K. Plan Assets: |
|||||||||||||
Equities |
$ | — | $ | 7,695 | $ | — | $ | 7,695 | |||||
Bonds |
— | 7,111 | — | 7,111 | |||||||||
Other |
— | 2,865 | — | 2,865 | |||||||||
| | | | | | | | | | | | | | |
Total U.K. |
$ | — | $ | 17,671 | $ | — | $ | 17,671 | |||||
| | | | | | | | | | | | | | |
Total pension plan assets |
$ | 38,575 | $ | 167,538 | $ | — | $ | 206,113 | |||||
| | | | | | | | | | | | | | |
| | | | | | | | | | | | | | |
78
HAYNES INTERNATIONAL, INC. AND SUBSIDIARIES
NOTES TO CONSOLIDATED FINANCIAL STATEMENTS (Continued)
(in thousands, except share and per share data and otherwise noted)
Note 8 Pension Plan and Retirement Benefits (Continued)
| |
September 30, 2014 | ||||||||||||
|---|---|---|---|---|---|---|---|---|---|---|---|---|---|
| |
Level 1 Active Markets for Identical Assets |
Level 2 Other Observable Inputs |
Level 3 Significant Unobservable Inputs |
Total | |||||||||
U.S. Pension Plan Assets: |
|||||||||||||
U.S. common stock mutual funds |
$ | 41,968 | $ | — | $ | — | $ | 41,968 | |||||
Common /collective funds |
|||||||||||||
Bonds |
— | 79,231 | — | 79,231 | |||||||||
Short-term money market |
— | — | — | — | |||||||||
U.S. common stock |
— | 67,733 | — | 67,733 | |||||||||
International equity |
— | 8,398 | — | 8,398 | |||||||||
| | | | | | | | | | | | | | |
Total U.S. |
$ | 41,968 | $ | 155,362 | $ | — | $ | 197,330 | |||||
U.K. Plan Assets: |
|||||||||||||
Equities |
$ | — | $ | 8,329 | $ | — | $ | 8,329 | |||||
Bonds |
— | 9,021 | — | 9,021 | |||||||||
Other |
— | 2,282 | — | 2,282 | |||||||||
| | | | | | | | | | | | | | |
Total U.K. |
$ | — | $ | 19,632 | $ | — | $ | 19,632 | |||||
| | | | | | | | | | | | | | |
Total pension plan assets |
$ | 41,968 | $ | 174,994 | $ | — | $ | 216,962 | |||||
| | | | | | | | | | | | | | |
| | | | | | | | | | | | | | |
The primary financial objectives of the Plans are to minimize cash contributions over the long term and preserve capital while maintaining a high degree of liquidity. A secondary financial objective is, where possible, to avoid significant downside risk in the short run. The objective is based on a long-term investment horizon so that interim fluctuations should be viewed with appropriate perspective.
The selection of the U.S. Plan's assumption for the expected long-term rate of return on plan assets is based upon the Plan's target allocation of 60% equities and 40% bonds, and the expected rate of return for each equity/bond asset class. Based upon the target allocation and each asset class's expected return, the Plan's return on assets assumption is 7.50%, and it remains unchanged from last year's assumption. The Company also realizes that historical performance is no guarantee of future performance.
In determining the expected rate of return on plan assets, the Company takes into account the Plan's allocation at September 30, 2014 of 60% equities, 40% fixed income and 0% other. The Company assumes an approximately 3.00% to 4.00% equity risk premium above the broad bond market yields of 5.00% to 7.00%. Note that over very long historical periods the realized risk premium has been higher. The Company believes that its assumption of a 7.5% long-term rate of return on plan assets is comparable to other companies, given the target allocation of the plan assets; however, there exists the potential for the use of a lower rate in the future.
It is the policy of the U.S. pension plan to invest assets with an allocation to equities as shown below. The balance of the assets are maintained in fixed income investments, and in cash holdings, to the extent permitted by the plan documents.
79
HAYNES INTERNATIONAL, INC. AND SUBSIDIARIES
NOTES TO CONSOLIDATED FINANCIAL STATEMENTS (Continued)
(in thousands, except share and per share data and otherwise noted)
Note 8 Pension Plan and Retirement Benefits (Continued)
Asset classes as a percent of total assets:
Asset Class
|
Target(1) | |||
|---|---|---|---|---|
Equity |
60 | % | ||
Fixed Income |
40 | % | ||
Real Estate and Other |
0 | % | ||
- (1)
- From time to time the Company may adjust the target allocation by an amount not to exceed 10%.
The U.K. pension plan assets use a similar strategy and investment objective.
Contributions and Benefit Payments
The Company has not yet determined the amounts to contribute to its domestic pension plans, domestic other postretirement benefit plans, and the U.K. pension plan in fiscal 2015.
Pension and postretirement health care benefits (which include expected future service) are expected to be paid out of the respective plans as follows:
Fiscal Year Ending September 30
|
Pension | Postretirement Health Care |
|||||
|---|---|---|---|---|---|---|---|
2015 |
$ | 14,063 | $ | 4,477 | |||
2016 |
14,309 | 4,674 | |||||
2017 |
14,696 | 4,860 | |||||
2018 |
14,973 | 5,000 | |||||
2019 |
15,339 | 5,000 | |||||
2020-2024 (in total) |
85,683 | 25,000 | |||||
Note 9 Commitments
The Company leases certain transportation vehicles, warehouse facilities, office space and machinery and equipment under cancelable and non-cancelable leases, most of which expire within 10 years and may be renewed by the Company. Rent expense under such arrangements totaled $3,347, $3,693 and $3,518 for the years ended September 30, 2012, 2013 and 2014, respectively. Rent expense does not include income from sub-lease rentals totaling $145, $129 and $147 for the years ended September 30, 2012, 2013 and
80
HAYNES INTERNATIONAL, INC. AND SUBSIDIARIES
NOTES TO CONSOLIDATED FINANCIAL STATEMENTS (Continued)
(in thousands, except share and per share data and otherwise noted)
Note 9 Commitments (Continued)
2014, respectively. Future minimum rental commitments under non-cancelable operating leases at September 30, 2014, are as follows:
| |
Operating | |||
|---|---|---|---|---|
2015 |
$ | 2,812 | ||
2016 |
1,907 | |||
2017 |
1,464 | |||
2018 |
948 | |||
2019 |
603 | |||
2020 and thereafter |
25 | |||
| | | | | |
|
$ | 7,759 | ||
| | | | | |
| | | | | |
Future minimum rental commitments under non-cancelable operating leases have not been reduced by minimum sub-lease rentals of $35 due in the future.
Note 10 Legal, Environmental and Other Contingencies
The Company is regularly involved in litigation, both as a plaintiff and as a defendant, relating to its business and operations, including environmental, commercial, employment and federal and/or state Equal Employment Opportunity Commission (EEOC) administrative actions. Future expenditures for environmental, employment, intellectual property and other legal matters cannot be determined with any degree of certainty; however, based on the facts presently known, management does not believe that such costs will have a material effect on the Company's financial position, results of operations or cash flows.
The Company is currently, and has in the past been, subject to claims involving personal injuries allegedly relating to its products and processes. For example, the Company is presently involved in two actions involving welding rod-related injuries, which were filed in California state court against numerous manufacturers, including the Company, in May 2006 and February 2007, respectively, alleging that the welding-related products of the defendant manufacturers harmed the users of such products through the inhalation of welding fumes containing manganese. The Company believes that it has defenses to these allegations and that, if the Company were to be found liable, the cases would not have a material effect on its financial position, results of operations or liquidity.
The Company has received permits from the Indiana Department of Environmental Management, or IDEM, to close and to provide post-closure monitoring and care for certain areas at the Kokomo facility previously used for the storage and disposal of wastes, some of which are classified as hazardous under applicable regulations. Closure certification was received in fiscal 1988 for the South Landfill at the Kokomo facility, and post-closure monitoring and care is ongoing there. Closure certification was received in fiscal 1999 for the North Landfill at the Kokomo facility, and post-closure monitoring and care are permitted and ongoing there. In fiscal 2007, IDEM issued a single post-closure permit applicable to both the North and South Landfills, which contains monitoring and post-closure care requirements. In addition, IDEM required that a Resource Conservation and Recovery Act, or RCRA, Facility Investigation, or RFI and which was renewed in 2012, be conducted in order to further evaluate one additional area of concern and one additional solid waste management unit. The RFI commenced in fiscal 2008 and is ongoing. Based
81
HAYNES INTERNATIONAL, INC. AND SUBSIDIARIES
NOTES TO CONSOLIDATED FINANCIAL STATEMENTS (Continued)
(in thousands, except share and per share data and otherwise noted)
Note 10 Legal, Environmental and Other Contingencies (Continued)
on preliminary results, the Company has determined that additional testing and further source remediation are necessary.
The Company has also received permits from the North Carolina Department of Environment and Natural Resources, or NCDENR, to close and provide post-closure monitoring and care for the hazardous waste lagoon at its Mountain Home, North Carolina facility. The lagoon area has been closed and is currently undergoing post-closure monitoring and care. The Company is required to monitor groundwater and to continue post-closure maintenance of the former disposal areas at each site. As a result, the Company is aware of elevated levels of certain contaminants in the groundwater, and additional corrective action by the Company could be required.
On August 3, 2012, the Company received an information request from the United States Environmental Protection Agency, or EPA, relating to the Company's compliance with laws relating to air quality. The Company has responded to the request, and there has been no further action by the EPA.
As of September 30, 2014, the Company has accrued $823 for post-closure monitoring and maintenance activities. Accruals for these costs are calculated by estimating the cost to monitor and maintain each post-closure site and multiplying that amount by the number of years remaining in the post-closure monitoring.
Long-term obligations consist of the following (in thousands):
| |
September 30, | ||||||
|---|---|---|---|---|---|---|---|
| |
2013 | 2014 | |||||
Environmental post-closure monitoring and maintenance activities |
$ | 846 | $ | 823 | |||
Less amounts due within one year |
(79 | ) | (78 | ) | |||
| | | | | | | | |
|
$ | 767 | $ | 745 | |||
| | | | | | | | |
| | | | | | | | |
Expected maturities of long-term obligations (discounted) are as follows at September 30, 2014:
Year Ending
|
|
|||
|---|---|---|---|---|
2015 |
$ | — | ||
2016 |
85 | |||
2017 |
73 | |||
2018 |
76 | |||
2019 |
57 | |||
2020 and thereafter |
454 | |||
| | | | | |
|
$ | 745 | ||
| | | | | |
| | | | | |
Note 11 Stock-based Compensation
Restricted Stock Plan
On February 23, 2009, the Company adopted a restricted stock plan that reserved 400,000 shares of common stock for issuance. Grants of restricted stock are grants of shares of the Company's common stock
82
HAYNES INTERNATIONAL, INC. AND SUBSIDIARIES
NOTES TO CONSOLIDATED FINANCIAL STATEMENTS (Continued)
(in thousands, except share and per share data and otherwise noted)
Note 11 Stock-based Compensation (Continued)
subject to transfer restrictions, which vest in accordance with the terms and conditions established by the Compensation Committee. The Compensation Committee may set vesting requirements based on the achievement of specific performance goals or the passage of time.
Restricted shares are subject to forfeiture if employment or service terminates prior to the vesting date or if any applicable performance goal is not met. The Company will assess, on an ongoing basis, the probability of whether the performance criteria will be achieved. The Company will recognize compensation expense over the performance period if it is deemed probable that the goal will be achieved. The fair value of the Company's restricted stock is determined based upon the closing price of the Company's common stock on the grant date. The plan provides for the adjustment of the number of shares covered by an outstanding grant and the maximum number of shares for which restricted stock may be granted in the event of a stock split, extraordinary dividend or distribution or similar recapitalization event.
On November 26, 2013 and December 2, 2013, the Company granted 34,700 and 3,000 shares, respectively, of restricted stock to certain key employees and non-employee directors. The shares of restricted stock granted to employees will vest on the third anniversary of their grant date, provided that (a) the recipient is still an employee of the Company and (b) the Company has met a three-year net income performance goal, if applicable. The shares of restricted stock granted to non-employee directors will vest on the earlier of (a) the third anniversary of the date of grant or (b) the failure of such non-employee director to be re-elected at an annual meeting of the stockholders of the Company as a result of such non-employee director being excluded from the nominations for any reason other than cause. The fair value of the grants were $52.78 and $54.22 per share, respectively, the closing price of the Company's common stock on the trading day immediately preceding the day of the applicable grant.
The following table summarizes the activity under the restricted stock plan for the year ended September 30, 2014:
| |
Number of Shares |
Weighted Average Fair Value At Grant Date |
|||||
|---|---|---|---|---|---|---|---|
Unvested at September 30, 2013 |
96,750 | $ | 47.74 | ||||
Granted |
37,700 | $ | 52.89 | ||||
Forfeited / Canceled |
(450 | ) | $ | 56.68 | |||
Vested |
(36,850 | ) | $ | 41.77 | |||
| | | | | | | | |
Unvested at September 30, 2014 |
97,150 | $ | 51.96 | ||||
| | | | | | | | |
| | | | | | | | |
Expected to vest |
65,550 | $ | 51.99 | ||||
| | | | | | | | |
| | | | | | | | |
Compensation expense related to restricted stock for the years ended September 30, 2012, 2013 and 2014 was $1,518 $832 and $1,295, respectively. The remaining unrecognized compensation expense at September 30, 2014 was $1,627, to be recognized over a weighted average period of 0.95 years. During fiscal 2014, the Company repurchased 6,284 shares of stock from employees at an average purchase price of $53.38 to satisfy required employee-owed taxes on stock—based compensation.
83
HAYNES INTERNATIONAL, INC. AND SUBSIDIARIES
NOTES TO CONSOLIDATED FINANCIAL STATEMENTS (Continued)
(in thousands, except share and per share data and otherwise noted)
Note 11 Stock-based Compensation (Continued)
Stock Option Plans
The Company has two stock option plans that authorize the granting of non-qualified stock options to certain key employees and non-employee directors for the purchase of a maximum of 1,500,000 shares of the Company's common stock. The original option plan was adopted in August 2004 pursuant to the plan of reorganization and provides for the grant of options to purchase up to 1,000,000 shares of the Company's common stock. In January 2007, the Company's Board of Directors adopted a second option plan that provides for options to purchase up to 500,000 shares of the Company's common stock. Each plan provides for the adjustment of the maximum number of shares for which options may be granted in the event of a stock split, extraordinary dividend or distribution or similar recapitalization event. Unless the Compensation Committee determines otherwise, options granted under the option plans are exercisable for a period of ten years from the date of grant and vest 331/3% per year over three years from the grant date. The amount of compensation cost recognized in the financial statements is measured based upon the grant date fair value.
The fair value of option grants was estimated as of the date of the grant. The Company has elected to use the Black-Scholes option pricing model, which incorporates various assumptions including volatility, expected life, risk-free interest rates, expected forfeitures and dividend yields. The volatility is based on historical volatility of the Company's common stock over the most recent period commensurate with the estimated expected term of the stock option granted. The Company uses historical volatility because management believes such volatility is representative of prospective trends. The expected term of an award is based on historical exercise data. The risk-free interest rate assumption is based upon observed interest rates appropriate for the expected term of the awards. The expected forfeiture rate is based upon historical experience. The dividend yield assumption is based on the Company's history and expectations regarding dividend payouts at the time of the grant. Valuation of future grants under the Black-Scholes model will include a dividend yield. The following assumptions were used for grants in the first quarter of fiscal 2014:
Grant Date
|
Fair Value |
Dividend Yield |
Risk-free Interest Rate |
Expected Volatility |
Expected Life |
|||||||||
|---|---|---|---|---|---|---|---|---|---|---|---|---|---|---|
November 26, 2013 |
$ | 13.94 | 1.67 | % | 0.57 | % | 42 | % | 3 years | |||||
On November 26, 2013, the Company granted 45,250 options at an exercise price of $52.78, the fair market value of the Company's common stock the day of the grant. During fiscal 2014, 54,913 options were exercised.
The stock-based employee compensation expense for stock options for the years ended September 30, 2012, 2013 and 2014 was $561, $424 and $474, respectively. The remaining unrecognized compensation expense at September 30, 2014 was $615, to be recognized over a weighted average vesting period of 1.27 years.
84
HAYNES INTERNATIONAL, INC. AND SUBSIDIARIES
NOTES TO CONSOLIDATED FINANCIAL STATEMENTS (Continued)
(in thousands, except share and per share data and otherwise noted)
Note 11 Stock-based Compensation (Continued)
The following table summarizes the activity under the stock option plans for the year ended September 30, 2014:
| |
Number of Shares |
Aggregate Intrinsic Value (000s) |
Weighted Average Exercise Prices |
Weighted Average Remaining Contractual Life |
|||||||||
|---|---|---|---|---|---|---|---|---|---|---|---|---|---|
Outstanding at September 30, 2013 |
291,664 | $ | 45.36 | ||||||||||
Granted |
45,250 | $ | 52.78 | ||||||||||
Exercised |
(54,913 | ) | $ | 19.36 | |||||||||
Canceled |
— | — | |||||||||||
| | | | | | | | | | | | | | |
Outstanding at September 30, 2014 |
282,001 | $ | 752 | $ | 51.61 | 5.39 yrs. | |||||||
| | | | | | | | | | | | | | |
| | | | | | | | | | | | | | |
Vested or expected to vest |
269,026 | $ | 735 | $ | 51.73 | 5.26 yrs. | |||||||
Exercisable at September 30, 2014 |
205,252 | $ | 752 | $ | 51.66 | 4.16 yrs. | |||||||
Grant Date
|
Exercise Price Per Share |
Remaining Contractual Life in Years |
Outstanding Number of Shares |
Exercisable Number of Shares |
|||||||||
|---|---|---|---|---|---|---|---|---|---|---|---|---|---|
March 31, 2006 |
31.00 | 1.50 | 10,000 | 10,000 | |||||||||
March 30, 2007 |
72.93 | 2.50 | 47,500 | 47,500 | |||||||||
March 31, 2008 |
54.00 | 3.50 | 58,000 | 58,000 | |||||||||
October 1, 2008 |
46.83 | 4.00 | 20,000 | 20,000 | |||||||||
March 31, 2009 |
17.82 | 4.50 | 12,084 | 12,084 | |||||||||
January 8, 2010 |
34.00 | 5.25 | 12,400 | 12,400 | |||||||||
November 24, 2010 |
40.26 | 6.17 | 19,667 | 19,667 | |||||||||
November 25, 2011 |
55.88 | 7.17 | 19,700 | 13,135 | |||||||||
November 20, 2012 |
47.96 | 8.17 | 35,600 | 11,866 | |||||||||
December 10, 2012 |
48.39 | 8.17 | 1,800 | 600 | |||||||||
November 26, 2013 |
52.78 | 9.17 | 45,250 | — | |||||||||
| | | | | | | | | | | | | | |
|
282,001 | 205,252 | |||||||||||
| | | | | | | | | | | | | | |
| | | | | | | | | | | | | | |
85
HAYNES INTERNATIONAL, INC. AND SUBSIDIARIES
NOTES TO CONSOLIDATED FINANCIAL STATEMENTS (Continued)
(in thousands, except share and per share data and otherwise noted)
Note 12 Quarterly Data (unaudited)
The unaudited quarterly results of operations of the Company for years ended September 30, 2013 and 2014 are as follows:
| |
2013 | ||||||||||||
|---|---|---|---|---|---|---|---|---|---|---|---|---|---|
| |
Quarter Ended | ||||||||||||
| |
December 31 | March 31 | June 30 | September 30 | |||||||||
Net revenues |
$ | 114,300 | $ | 129,201 | $ | 123,587 | $ | 115,658 | |||||
Gross profit |
18,774 | 20,084 | 18,605 | 16,163 | |||||||||
Net income |
5,835 | 6,436 | 5,297 | 4,009 | |||||||||
Net income per share: |
|||||||||||||
Basic |
$ | 0.47 | $ | 0.52 | $ | 0.43 | $ | 0.33 | |||||
Diluted |
$ | 0.47 | $ | 0.52 | $ | 0.43 | $ | 0.32 | |||||
| |
2014 | ||||||||||||
|---|---|---|---|---|---|---|---|---|---|---|---|---|---|
| |
Quarter Ended | ||||||||||||
| |
December 31 | March 31 | June 30 | September 30 | |||||||||
Net revenues |
$ | 93,700 | $ | 115,350 | $ | 126,293 | $ | 120,067 | |||||
Gross profit |
5,250 | 9,064 | 14,061 | 18,923 | |||||||||
Net income (loss) |
(3,492 | ) | (1,223 | ) | 2,096 | 6,370 | |||||||
Net income (loss) per share: |
|||||||||||||
Basic |
$ | (0.29 | ) | $ | (0.10 | ) | $ | 0.17 | $ | 0.51 | |||
Diluted |
$ | (0.29 | ) | $ | (0.10 | ) | $ | 0.17 | $ | 0.51 | |||
Note 13 Segment Reporting
The Company operates in one business segment: the design, manufacture, marketing and distribution of technologically advanced, high-performance alloys for use in the aerospace, land-based gas turbine, chemical processing and other industries. The Company has operations in the United States, Europe and China, which are summarized below. Sales between geographic areas are made at negotiated selling prices.
86
HAYNES INTERNATIONAL, INC. AND SUBSIDIARIES
NOTES TO CONSOLIDATED FINANCIAL STATEMENTS (Continued)
(in thousands, except share and per share data and otherwise noted)
Note 13 Segment Reporting (Continued)
Revenues from external customers are attributed to the geographic areas presented based on the destination of product shipments.
| |
Year Ended September 30, | |||||||||
|---|---|---|---|---|---|---|---|---|---|---|
| |
2012 | 2013 | 2014 | |||||||
Net Revenue by Geography: |
||||||||||
United States |
$ | 346,750 | $ | 268,054 | $ | 261,631 | ||||
Europe |
121,781 | 110,389 | 101,824 | |||||||
China |
48,183 | 39,475 | 36,596 | |||||||
Other |
62,847 | 64,828 | 55,359 | |||||||
| | | | | | | | | | | |
Net Revenues |
$ | 579,561 | $ | 482,746 | $ | 455,410 | ||||
| | | | | | | | | | | |
| | | | | | | | | | | |
Net Revenue by Product Group: |
||||||||||
High-temperature resistant alloys |
$ | 423,080 | $ | 357,232 | $ | 341,557 | ||||
Corrosive-resistant alloys |
156,481 | 125,514 | 113,853 | |||||||
| | | | | | | | | | | |
Net revenues |
$ | 579,561 | $ | 482,746 | $ | 455,410 | ||||
| | | | | | | | | | | |
| | | | | | | | | | | |
| |
September 30, | ||||||
|---|---|---|---|---|---|---|---|
| |
2013 | 2014 | |||||
Long-lived Assets by Geography: |
|||||||
United States |
$ | 146,940 | $ | 166,542 | |||
Europe |
5,221 | 7,021 | |||||
China |
603 | 520 | |||||
| | | | | | | | |
Total long-lived assets |
$ | 152,764 | $ | 174,083 | |||
| | | | | | | | |
| | | | | | | | |
Note 14 Valuation and Qualifying Accounts
| |
Balance at Beginning of Period |
Charges (credits) to Expense |
Deductions(1) | Balance at End of Period |
|||||||||
|---|---|---|---|---|---|---|---|---|---|---|---|---|---|
Allowance for doubtful accounts receivables: |
|||||||||||||
September 30, 2014 |
1,199 | 8 | (346 | ) | 861 | ||||||||
September 30, 2013 |
1,249 | (34 | ) | (16 | ) | 1,199 | |||||||
September 30, 2012 |
1,129 | 235 | (115 | ) | 1,249 | ||||||||
- (1)
- Uncollectible accounts written off net of recoveries.
Note 15 Deferred Revenue
On November 17, 2006, the Company entered into a twenty-year agreement to provide conversion services to Titanium Metals Corporation ("TIMET") for up to ten million pounds of titanium metal annually. TIMET paid the Company a $50,000 up-front fee and will also pay the Company for its processing services during the term of the agreement (20 years) at prices established by the terms of the
87
HAYNES INTERNATIONAL, INC. AND SUBSIDIARIES
NOTES TO CONSOLIDATED FINANCIAL STATEMENTS (Continued)
(in thousands, except share and per share data and otherwise noted)
Note 15 Deferred Revenue (Continued)
agreement. TIMET may exercise an option to have ten million additional pounds of titanium converted annually, provided that it offers to loan up to $12,000 to the Company for certain capital expenditures which may be required to expand capacity. In addition to the volume commitment, the Company has granted TIMET a first priority security interest in its four-high Steckel rolling mill, along with rights of access if the Company enters into bankruptcy or defaults on any financing arrangements. The Company has agreed not to manufacture titanium products (other than cold reduced titanium tubing). The Company has also agreed not to provide titanium hot-rolling conversion services to any entity other than TIMET for the term of the Conversion Services Agreement. The agreement contains certain default provisions which could result in contract termination and damages, including liquidated damages of $25.0 million and the Company being required to return the unearned portion of the up-front fee. The Company considered each provision and the likelihood of the occurrence of a default that would result in liquidated damages. Based on the nature of the events that could trigger the liquidated damages clause, and the availability of the cure periods set forth in the agreement, the Company determined and continues to believe that none of these circumstances are reasonably likely to occur. Therefore, events resulting in liquidated damages have not been factored in as a reduction to the amount of revenue recognized over the life of the contract. The cash received of $50,000 is recognized in income on a straight-line basis over the 20-year term of the agreement. If an event of default occurred and was not cured within any applicable grace period, the Company would recognize the impact of the liquidated damages in the period of default and re-evaluate revenue recognition under the contract for future periods. The portion of the up-front fee not recognized in income is shown as deferred revenue on the consolidated balance sheet.
Note 16 Fair Value Measurements
The fair value hierarchy has three levels based on the inputs used to determine fair value:
- •
- Level 1—Quoted prices in active markets that are unadjusted and accessible at the measurement date for
identical, unrestricted assets or liabilities;
- •
- Level 2—Quoted prices for identical assets and liabilities in markets that are not active, quoted
prices for similar assets and liabilities in active markets or financial instruments for which significant inputs are observable, either directly or indirectly; and
- •
- Level 3—Prices or valuations that require inputs that are both significant to the fair value measurement and unobservable.
When available, the Company uses unadjusted quoted market prices to measure fair value and classifies such items within Level 1. If quoted market prices are not available, fair value is based upon internally-developed models that use, where possible, current market-based or independently-sourced market parameters such as interest rates and currency rates. Items valued using internally-generated models are classified according to the lowest level input or value driver that is significant to the valuation. If quoted market prices are not available, the valuation model used depends on the specific asset or liability being valued. A portion of the Company's pension plan assets are in a common collective trust that is considered within Level 2. To determine the fair value of these assets, the Company uses the quoted market prices of the underlying assets of the common collective trust. (See Note 8.)
88
HAYNES INTERNATIONAL, INC. AND SUBSIDIARIES
NOTES TO CONSOLIDATED FINANCIAL STATEMENTS (Continued)
(in thousands, except share and per share data and otherwise noted)
Note 16 Fair Value Measurements (Continued)
The following table represents the Company's fair value hierarchy for its financial assets and liabilities measured at fair value on a recurring basis as of September 30, 2013 and 2014:
| |
September 30, 2013 Fair Value Measurements at Reporting Date Using: |
||||||||||||
|---|---|---|---|---|---|---|---|---|---|---|---|---|---|
| |
Level 1 | Level 2 | Level 3 | Total | |||||||||
Assets: |
|||||||||||||
Cash and money market funds |
$ | 68,326 | $ | — | $ | — | $ | 68,326 | |||||
Pension plan assets |
38,575 | 167,538 | — | 206,113 | |||||||||
| | | | | | | | | | | | | | |
Total fair value |
$ | 106,901 | $ | 167,538 | $ | — | $ | 274,439 | |||||
| | | | | | | | | | | | | | |
| | | | | | | | | | | | | | |
| |
September 30, 2014 Fair Value Measurements at Reporting Date Using: |
||||||||||||
|---|---|---|---|---|---|---|---|---|---|---|---|---|---|
| |
Level 1 | Level 2 | Level 3 | Total | |||||||||
Assets: |
|||||||||||||
Cash and money market funds |
$ | 45,871 | $ | — | $ | — | $ | 45,871 | |||||
Pension plan assets |
41,968 | 174,994 | — | 216,962 | |||||||||
| | | | | | | | | | | | | | |
Total fair value |
$ | 87,839 | $ | 174,994 | $ | — | $ | 262,833 | |||||
| | | | | | | | | | | | | | |
| | | | | | | | | | | | | | |
The Company has no Level 3 assets as of September 30, 2013 or 2014.
Note 17. Comprehensive Income (Loss) and Changes in Accumulated Other Comprehensive Income (Loss) by Component
Comprehensive income (loss) includes changes in equity that result from transactions and economic events from non-owner sources. Comprehensive income (loss) consists of net income (loss) and other comprehensive income (loss) items, including pension and foreign currency translation adjustments, net of tax when applicable.
89
HAYNES INTERNATIONAL, INC. AND SUBSIDIARIES
NOTES TO CONSOLIDATED FINANCIAL STATEMENTS (Continued)
(in thousands, except share and per share data and otherwise noted)
Note 17. Comprehensive Income (Loss) and Changes in Accumulated Other Comprehensive Income (Loss) by Component (Continued)
Comprehensive Income (Loss)
| |
Year Ended September 30, | |||||||||||||||||||||||||||||||
|---|---|---|---|---|---|---|---|---|---|---|---|---|---|---|---|---|---|---|---|---|---|---|---|---|---|---|---|---|---|---|---|---|
| |
|
|
|
|
|
|
|
|
|
|
|
|||||||||||||||||||||
| |
2012 |
|
2013 |
|
2014 | |||||||||||||||||||||||||||
| |
|
|
||||||||||||||||||||||||||||||
| |
Pre-tax | Tax | Net |
|
Pre-tax | Tax | Net |
|
Pre-tax | Tax | Net | |||||||||||||||||||||
Net income |
$ | 50,182 | $ | 21,577 | $ | 3,751 | ||||||||||||||||||||||||||
Other comprehensive income (loss): |
||||||||||||||||||||||||||||||||
Pension and postretirement: |
||||||||||||||||||||||||||||||||
Net gain (loss) arising during period |
$ | (19,688 | ) | $ | 7,399 | (12,289 | ) | $ | 74,282 | $ | (27,201 | ) | 47,081 | $ | (1,886 | ) | $ | 698 | (1,188 | ) | ||||||||||||
Less: amortization of prior service cost |
4,981 | (1,743 | ) | 3,238 | 4,981 | (1,743 | ) | 3,238 | 2,087 | (773 | ) | 1,314 | ||||||||||||||||||||
Less: amortization of gain (loss) |
(11,830 | ) | 4,140 | (7,690 | ) | (13,906 | ) | 4,867 | (9,039 | ) | (6,608 | ) | 2,444 | (4,164 | ) | |||||||||||||||||
Foreign currency translation adjustment |
698 | — | 698 | 1,012 | — | 1,012 | (991 | ) | — | (991 | ) | |||||||||||||||||||||
Other comprehensive income (loss) |
$ | (25,839 | ) | $ | 9,796 | (16,043 | ) | $ | 66,369 | $ | (24,077 | ) | 42,292 | $ | (7,398 | ) | $ | 2,369 | (5,029 | ) | ||||||||||||
Total comprehensive income (loss) |
$ | 34,139 | $ | 63,869 | $ | (1,278 | ) | |||||||||||||||||||||||||
Accumulated Other Comprehensive Income (Loss)
| |
Twelve Months Ended September 30, 2013 | ||||||||||||
|---|---|---|---|---|---|---|---|---|---|---|---|---|---|
| |
Pension Plan |
Postretirement Plan |
Foreign Exchange |
Total | |||||||||
Accumulated other comprehensive income (loss) as of September 30, 2012 |
$ | (75,263 | ) | $ | (24,779 | ) | $ | 951 | $ | (99,091 | ) | ||
| | | | | | | | | | | | | | |
Other comprehensive income (loss) before classifications |
25,317 | 10,162 | 1,012 | 36,491 | |||||||||
Amounts reclassified from accumulated other comprehensive income (loss) |
7,148 | (1,347 | ) | — | 5,801 | ||||||||
| | | | | | | | | | | | | | |
Net current-period other comprehensive income (loss) |
32,465 | 8,815 | 1,012 | 42,292 | |||||||||
| | | | | | | | | | | | | | |
Accumulated other comprehensive income (loss) as of September 30, 2013 |
$ | (42,798 | ) | $ | (15,964 | ) | $ | 1,963 | $ | (56,799 | ) | ||
| | | | | | | | | | | | | | |
| | | | | | | | | | | | | | |
90
HAYNES INTERNATIONAL, INC. AND SUBSIDIARIES
NOTES TO CONSOLIDATED FINANCIAL STATEMENTS (Continued)
(in thousands, except share and per share data and otherwise noted)
Note 17. Comprehensive Income (Loss) and Changes in Accumulated Other Comprehensive Income (Loss) by Component (Continued)
| |
Twelve Months Ended September 30, 2014 | ||||||||||||
|---|---|---|---|---|---|---|---|---|---|---|---|---|---|
| |
Pension Plan |
Postretirement Plan |
Foreign Exchange |
Total | |||||||||
Accumulated other comprehensive income (loss) as of September 30, 2013 |
$ | (42,798 | ) | $ | (15,964 | ) | $ | 1,963 | $ | (56,799 | ) | ||
| | | | | | | | | | | | | | |
Other comprehensive income (loss) before classifications |
(3,418 | ) | (3,470 | ) | (991 | ) | (7,879 | ) | |||||
Amounts reclassified from accumulated other comprehensive income (loss) |
3,416 | (566 | ) | — | 2,850 | ||||||||
| | | | | | | | | | | | | | |
Net current-period other comprehensive income (loss) |
(2 | ) | (4,036 | ) | (991 | ) | (5,029 | ) | |||||
| | | | | | | | | | | | | | |
Accumulated other comprehensive income (loss) as of September 30, 2014 |
$ | (42,800 | ) | $ | (20,000 | ) | $ | 972 | $ | (61,828 | ) | ||
| | | | | | | | | | | | | | |
| | | | | | | | | | | | | | |
Reclassifications out of Accumulated Other Comprehensive Income
| |
Twelve Months Ended September 30, 2013 |
Twelve Months Ended September 30, 2014 |
|||||||||||||||||
|---|---|---|---|---|---|---|---|---|---|---|---|---|---|---|---|---|---|---|---|
| |
Pension Plan |
Post- retirement Plan |
Total | Pension Plan |
Post- retirement Plan |
Total | |||||||||||||
Amortization of Pension and Postretirement Plan items |
|||||||||||||||||||
Prior Service Costs(a) |
$ | (808 | ) | $ | 5,789 | $ | 4,981 | $ | (808 | ) | $ | 2,895 | $ | 2,087 | |||||
Actuarial (losses)(a) |
(10,189 | ) | (3,717 | ) | (13,906 | ) | (4,613 | ) | (1,996 | ) | (6,609 | ) | |||||||
| | | | | | | | | | | | | | | | | | | | |
Total before tax |
(10,997 | ) | 2,072 | (8,925 | ) | (5,421 | ) | 899 | (4,522 | ) | |||||||||
Tax (expense) or benefit |
3,849 | (725 | ) | 3,124 | 2,005 | (333 | ) | 1,672 | |||||||||||
| | | | | | | | | | | | | | | | | | | | |
Total reclassification for the period |
$ | (7,148 | ) | $ | 1,347 | $ | (5,801 | ) | $ | (3,416 | ) | $ | 566 | $ | (2,850 | ) | |||
| | | | | | | | | | | | | | | | | | | | |
| | | | | | | | | | | | | | | | | | | | |
- (a)
- These accumulated other comprehensive income components are included in the computation of net periodic pension cost.
91
Item 9. Changes in and Disagreements with Accountants on Accounting and Financial Disclosure
None.
Item 9A. Controls and Procedures
Evaluation of Disclosure Controls and Procedures
The Company maintains disclosure controls and procedures designed to ensure that information required to be disclosed by the Company in the reports that it files or submits under the Exchange Act is recorded, processed, summarized and reported within the time periods specified in the rules and forms of the U.S. Securities and Exchange Commission, including to ensure that information required to be disclosed by the Company that it files or submits under the Exchange Act is accumulated and communicated to the Company's management, including its principal executive and financial officers, as appropriate to allow timely decisions regarding required disclosure. Pursuant to Rule 13a-15(b) of the Exchange Act the Company has performed, under the supervision and with the participation of the Company's management, including the Company's Chief Executive Officer and Chief Financial Officer, an evaluation of the effectiveness of the Company's disclosure controls and procedures as of the end of the period covered by this report. Based upon that evaluation, the Chief Executive Officer and the Chief Financial Officer concluded that the Company's disclosure controls and procedures were effective as of September 30, 2014.
Changes in Internal Control Over Financial Reporting
During the year ended September 30, 2013, the Company began a phased implementation of a new global enterprise resource planning system to be used as its accounting system. As of September 30, 2014, legal entities representing approximately 20% of the Company's revenues had been fully deployed on the new system, along with general ledger, accounts payable and purchasing modules in all of the other financially significant entities. The deployment of the system for remaining modules is expected to be completed in multiple phases through fiscal year 2015. The transition to the new information system includes a significant effort in the testing of the system prior to deployment, training of associates who will be using the system and updating of the Company's internal control process and procedures that will be impacted by the deployment. During each phase of the deployment, the Company will test the results from the system and perform an appropriate level of monitoring of the system's results. As a result of the deployment of the system, management has updated and continues to update the systems of internal control over the impacted areas. In the most recent quarter, the fourth quarter of fiscal 2014, no changes were made in internal control over financial reporting.
Management's Annual Report on Internal Control Over Financial Reporting
The management of the Company is responsible for establishing and maintaining adequate internal control over financial reporting (as defined by Exchange Act rules 13a-15(f) and 15d-15(f)) for the Company. With the participation of the Chief Executive Officer and Chief Financial Officer, our management conducted an evaluation of the effectiveness of the Company's internal control over financial reporting based on the framework and criteria established in Internal Control—Integrated Framework issued by the Committee of Sponsoring Organizations (COSO) of The Treadway Commission (1992). Based on the Company's assessment, management has concluded that, as of September 30, 2014, the Company's internal control over financial reporting is effective based on those criteria.
The internal controls over financial reporting that were assessed for fiscal year 2014 were:
- •
- Controls over initiating, authorizing, recording, processing, and reporting significant accounts and disclosures and related assertions embodied in the financial statements;
92
- •
- Controls over the selection and application of accounting policies that are in conformity with generally accepted
accounting principles;
- •
- Antifraud programs and controls;
- •
- Controls including IT general controls, on which other controls are dependent; and
- •
- Controls over significant non-routine and non-systematic transactions, such as accounts involving judgments and estimates. Company level controls, including (1) the control environmental and (2) controls over the period-end financial reporting process (e.g., controls over procedures used to enter transaction totals into the general ledger; to initiate, authorize, record, and process journal entries in the general ledger; and to record recurring and nonrecurring adjustments to the financial statements).
All internal control systems, no matter how well designed, have inherent limitations. Therefore, even those systems determined to be effective may not prevent or detect misstatements and can provide only reasonable assurance with respect to financial statement preparation and presentation. Also, projections of any evaluation of effectiveness to future periods are subject to the risk that controls may become inadequate because of changes in conditions, or that the degree of compliance with the policies or procedures may deteriorate.
The Company's effectiveness of internal control over financial reporting as of September 30, 2014 has been audited by Deloitte and Touche LLP, an independent registered public accounting firm, as stated in its attestation report which is included herein.
| Mark M. Comerford President & Chief Executive Officer November 20, 2014 |
Daniel W. Maudlin Vice President of Finance and Chief Financial Officer November 20, 2014 |
None.
93
Item 10. Directors, Executive Officers and Corporate Governance
The information included under the caption "Business—Executive Officers of the Company" in this Annual Report on Form 10-K, and under the captions "Election of Directors", "Section 16(a) Beneficial Ownership Reporting Compliance", "Corporate Governance—Code of Ethics", "Corporate Governance—Corporate Governance Committee and Director Nominations", "Corporate Governance—Board Committee Structure", "Corporate Governance—Family Relationships" and "Corporate Governance—Independence of the Board of Directors and Committee Members" in the Proxy Statement to be issued in connection with the meeting of the Company's stockholders on March 2, 2015 is incorporated herein by reference.
Item 11. Executive Compensation
The information included under the captions "Executive Compensation", "Corporate Governance—Compensation Committee Interlocks and Insider Participation" and "Corporate Governance—Director Compensation Program" in the Proxy Statement to be issued in connection with the meeting of the Company's stockholders on March 2, 2015 is incorporated herein by reference in response to this item.
Item 12. Security Ownership of Certain Beneficial Owners and Management and Related Stockholder Matters
The information contained under the captions "Security Ownership of Certain Beneficial Owners" and "Security Ownership of Management" in the Proxy Statement to be issued in connection with the meeting of the Company's stockholders on March 2, 2015 and "Market for Registrant's Common Equity, Related Stockholder Matters and Issuer Purchases of Equity Securities—Equity Compensation Plan Information" in this Annual Report on Form 10-K is incorporated herein by reference in response to this item. For additional information regarding the Company's stock option plans, please see Note 11 in the Notes to Consolidated Financial Statements in this report.
Item 13. Certain Relationships and Related Transactions, and Director Independence
The Company's policy is to require that all conflict of interest transactions between the Company and any of its directors, officers or 10% beneficial owners (collectively, "Insiders") and all transactions where any Insider has a direct or indirect financial interest, including related party transactions required to be reported under Item 404(a) of Regulation S-K, must be reviewed and approved or ratified by the Board of Directors. The material terms of any such transaction, including the nature and extent of the Insider's interest therein, must be disclosed to the Board of Directors. The Board will then review the terms of the proposed transaction to determine whether the terms of the proposed transaction are fair to the Company and are no less favorable to the Company than those that would be available from an independent third party. Following the Board's review and discussion, the proposed transaction will be approved or ratified only if it receives the affirmative votes of a majority of the directors who have no direct or indirect financial interest in the proposed transaction, even though the disinterested directors represent less than a quorum. Common or interested directors may be counted in determining the presence of a quorum at a meeting of the Board of Directors which authorizes the contract or transaction.
There are no transactions since the beginning of fiscal 2014, or any currently proposed transaction in which the Company is or was a participant in which any "related person", within the meaning of Section 404(a) of Regulation S-K under the Securities Act of 1933, had or will have a material interest. The information contained under the caption "Corporate Governance—Independence of Board of Directors and Committee Members" in the Proxy Statement to be issued in connection with the meeting of the Company's stockholders on March 2, 2015 is incorporated herein by reference in response to this item.
94
Item 14. Principal Accountant Fees and Services
The information included under the caption "Ratification of the Appointment of Independent Registered Public Accounting Firm" in the Proxy Statement to be issued in connection with the meeting of the Company's stockholders on March 2, 2015 is incorporated herein by reference in response to this item.
95
Item 15. Exhibits, Financial Statement Schedules
- (a)
- Documents filed as part of this Report.
- 1.
- Financial Statements:
- 2.
- Financial Statement Schedules:
The Financial Statements are set forth under Item 8 in this Annual Report on Form 10-K.
Financial Statement Schedules are omitted as they are not required, are not applicable or the information is shown in the Notes to the Consolidated Financial Statements.
- (b)
- Exhibits. See Index to Exhibits, which is incorporated herein by reference.
- (c)
- Financial Statement Schedules: None
96
Pursuant to the requirements Section 13 or 15(d) of the Securities Act of 1934, the registrant has duly caused this report to be signed on its behalf by the undersigned, thereunto duly authorized.
|
HAYNES INTERNATIONAL, INC. | |||
|
By: |
/s/ MARK M. COMERFORD |
||
Pursuant to the requirements of the Securities Exchange Act of 1934, this report has been signed below by the following persons on behalf of the registrant and in the capacities and on the dates indicated.
Signature
|
Title
|
Date
|
||
|---|---|---|---|---|
| /s/ MARK M. COMERFORD Mark M. Comerford |
President and Chief Executive Officer; Director (Principal Executive Officer) | November 20, 2014 | ||
/s/ DANIEL W. MAUDLIN Daniel W. Maudlin |
Vice President of Finance and Chief Financial Officer (Principal Financial Officer) |
November 20, 2014 |
||
/s/ DAVID S. VAN BIBBER David S. Van Bibber |
Controller and Chief Accounting Officer (Principal Accounting Officer) |
November 20, 2014 |
||
/s/ JOHN C. COREY John C. Corey |
Chairman of the Board, Director |
November 20, 2014 |
||
/s/ DONALD C. CAMPION Donald C. Campion |
Director |
November 20, 2014 |
||
/s/ ROBERT H. GETZ Robert H. Getz |
Director |
November 20, 2014 |
||
/s/ TIMOTHY J. MCCARTHY Timothy J. McCarthy |
Director |
November 20, 2014 |
97
Signature
|
Title
|
Date
|
||
|---|---|---|---|---|
| /s/ MICHAEL L. SHOR Michael L. Shor |
Director | November 20, 2014 | ||
/s/ WILLIAM P. WALL William P. Wall |
Director |
November 20, 2014 |
98
| |
Exhibit Number |
Description | ||
|---|---|---|---|---|
| 3.1 | Second Restated Certificate of Incorporation of Haynes International, Inc. (incorporated by reference to Exhibit 3.1 to the Haynes International, Inc. Registration Statement on Form S-1, Registration No. 333-140194). | |||
| 3.2 | Amended and Restated By-laws of Haynes International, Inc. (incorporated by reference to Exhibit 3.2 to the Haynes International, Inc. Registration Statement on Form S-1, Registration No. 333-140194). | |||
| 4.1 | Specimen Common Stock Certificate (incorporated by reference to Exhibit 4.01 to the Haynes International, Inc. Quarterly Report on Form 10-Q for the fiscal quarter ended December 31, 2009). | |||
| 4.2 | Second Restated Certificate of Incorporation of Haynes International, Inc. (incorporated by reference to Exhibit 3.1 hereof). | |||
| 4.3 | Amended and Restated By-laws of Haynes International, Inc. (incorporated by reference to Exhibit 3.2 hereof). | |||
| 10.1 | Form of Termination Benefits Agreements by and between Haynes International, Inc. and certain of its employees, conformed to give effect to all amendments thereto (incorporated by reference to Exhibit 10.1 to the Company's Annual Report on Form 10-K for the year ended September 30, 2011). | |||
| 10.2 | Third Amended and Restated Loan and Security Agreement by and among Haynes International, Inc., Haynes Wire Company, the Lenders (as defined therein), Wells Fargo Capital Finance, LLC, as agent for the Lenders, and JPMorgan Chase Bank, N.A., as documentation agent (incorporated by reference to Exhibit 10.1 to Haynes International, Inc. Current Report on Form 8-K filed July 20, 2011). | |||
| 10.3 | Form of Director Indemnification Agreement between Haynes International, Inc. and certain of its directors named in the schedule to the Exhibit (incorporated by reference to Exhibit 10.21 to the Haynes International, Inc. Registration Statement on Form S-1, Registration No. 333-140194). | |||
| 10.4 | Conversion Services Agreement by and between the Company and Titanium Metals Corporation, dated November 17, 2006 (incorporated by reference to Exhibit 10.22 to the Haynes International, Inc. Registration Statement on Form S-1, Registration No. 333-140194). Portions of this exhibit have been omitted pursuant to a request for confidential treatment and filed separately with the Securities and Exchange Commission. | |||
| 10.5 | Access and Security Agreement by and between the Company and Titanium Metals Corporation, dated November 17, 2006 (incorporated by reference to Exhibit 10.23 to the Haynes International, Inc. Registration Statement on Form S-1, Registration No. 333-140194). | |||
| 10.6 | Haynes International, Inc. 2007 Stock Option Plan as adopted by the Board of Directors on January 18, 2007 (incorporated by reference to Exhibit 10.25 to the Haynes International, Inc. Registration Statement on Form S-1, Registration No. 333-140194). | |||
| 10.7 | Form of Non-Qualified Stock Option Agreement to be used in conjunction with grants made pursuant to the Haynes International, Inc. 2007 Stock Option Plan (incorporated by reference to Exhibit 10.26 to the Haynes International, Inc. Registration Statement on Form S-1, Registration No. 333-140194). | |||
| 10.8 | Second Amended and Restated Haynes International, Inc. Stock Option Plan as adopted by the Board of Directors on January 22, 2007 (incorporated by reference to Exhibit 10.27 to the Haynes International, Inc. Registration Statement on Form S-1, Registration No. 333-140194). |
99
| |
Exhibit Number |
Description | ||
|---|---|---|---|---|
| 10.9 | Form of Non-Qualified Stock Option Agreements between Haynes International, Inc. and certain of its executive officers and directors named in the schedule to the Exhibit pursuant to the Haynes International, Inc. Second Amended and Restated Stock Option Plan (incorporated by reference to Exhibit 10.28 to the Haynes International, Inc. Registration Statement on Form S-1, Registration No. 333-140194). | |||
| 10.10 | Executive Employment Agreement by and between Haynes International, Inc. and Mark Comerford dated September 8, 2008 (incorporated by reference to Exhibit 10.21 to Haynes International, Inc. Annual Report on Form 10-K for the fiscal year ended September 30, 2008). | |||
| 10.11 | Non-Qualified Stock Option Agreement by and between Haynes International, Inc. and Mark Comerford, dated October 1, 2008 (incorporated by reference to Exhibit 10.2 to Haynes International, Inc. Form 8-K filed October 7, 2008). | |||
| 10.12 | Amendment No. 1 to Executive Employment Agreement by and between Haynes International, Inc. and Mark Comerford, dated August 6, 2009 (incorporated by reference to Exhibit 10.1 to the Haynes International, Inc. Form 8-K filed August 7, 2009). | |||
| 10.13 | Haynes International, Inc. 2009 Restricted Stock Plan (incorporated by reference to Exhibit 10.02 to the Haynes International, Inc. Quarterly Report on Form 10-Q for the fiscal quarter ended March 31, 2009). | |||
| 10.14** | Summary of 2014 Management Incentive Plan. | |||
| 10.15 | Amendment No.1 to the Haynes International, Inc. 2009 Restricted Stock Plan (incorporated by reference to Exhibit 10.02 to the Haynes International, Inc. Form 10-Q for the fiscal quarter ended December 31, 2011). | |||
| 10.16 | Amendment No. 2 to the Haynes International, Inc. 2009 Restricted Stock Plan (incorporated by reference to Exhibit 10.01 to the Haynes International, Inc. Form 10-Q for the fiscal quarter ended March 31, 2013). | |||
| 10.17 | Amendment No. 1 to Third Amended and Restated Loan and Security Agreement by and among Haynes International, Inc., Haynes Wire Company, the Lenders (as defined therein), Wells Fargo Capital Finance, LLC, as agent for the Lenders, and JPMorgan Chase Bank, N.A., as documentation agent (incorporated by reference to Exhibit 10.1 to the Haynes International, Inc. Current Report on Form 8-K filed September 20, 2013). | |||
| 21.1** | Subsidiaries of the Registrant. | |||
| 23.1** | Consent of Deloitte & Touche LLP. | |||
| 31.1** | Rule 13a-14(a)/15d-4(a) Certification of Chief Executive Officer | |||
| 31.2** | Rule 13a-14(a)/15d-14(a) Certification of Chief Financial Officer | |||
| 32.1** | Section 1350 Certifications | |||
| 101** | The following materials from the Company's Annual Report on Form 10-K for the fiscal year ended September 30, 2014 formatted in Extensible Business Reporting Language (XBRL): (i) the Consolidated Balance Sheets; (11) the Consolidated Statements of Operations; (iii) the Consolidated Statements of Comprehensive Income (Loss); (iv) the Consolidated Statements of Stockholders Equity; (v) the Consolidated Statements of Cash Flows; and (vi) related notes. |
- **
- Filed herewith
100