Attached files
| file | filename |
|---|---|
| 8-K - 8-K - ANDEAVOR | tso8-k11x13x14.htm |

Transformation through Distinctive Performance Wells Fargo Investor Meeting November 13, 2014 Exhibit 99.1

2 Forward Looking Statements • This Presentation includes forward-looking statements within the meaning of the Private Securities Litigation Reform Act of 1995. These statements relate to, among other things: – The market outlook, including expectations regarding crude oil production growth, feedstock costs, differentials, spreads, import and export opportunities, the Tesoro index and the anticipated costs of crude movements; – The timing, value and type of expected synergies from our acquisition of BP’s Southern California refining and marketing business in June 2013 and the capital expenditures needed to realize such synergies, as well as our California emissions and the impact of the California regulatory environment; – Tesoro’s competitive position and competitive advantages, including its advantaged feedstock position, the costs, benefits and timing of projects designed to enhance gross margin capture, earnings diversification and marking optimization through brand expansion and growth; – West Coast logistics development, transportation advantages and refining system opportunities; – The timing and results of Tesoro’s disciplined business improvement program; – The results of Tesoro’s logistics growth strategy, including plans for Tesoro Logistics LP (“TLLP”), the potential value of possible future asset sales to TLLP, TLLP’s organic growth opportunities, the value to Tesoro of distributions from TLLP, the implied enterprise value of TLLP and the value of Tesoro’s stake in TLLP; – Maintenance of Tesoro’s financial priorities, including balance sheet strength, Tesoro’s target debt capitalization, and TLLP’s target debt to EBITDA level; – Capital expenditures, turnaround spending, and the cost, timing and return on capital projects, including expectations regarding incremental EBITDA improvements and expectations regarding the joint venture project at the Vancouver Energy; and; – Expectations regarding free cash flow, the implementation of Tesoro’s cash strategy and the return of excess cash flow to shareholders through dividends and share repurchases. – Xylene demand growth and Tesoro’s competitiveness as a supplier of xylene. • We have used the words "anticipate", "believe", "could", "estimate", "expect", "intend", "may", "plan", "predict", "project", “should”, "will" and similar terms and phrases to identify forward-looking statements in this Presentation. • Although we believe the assumptions upon which these forward-looking statements are based are reasonable, any of these assumptions could prove to be inaccurate and the forward-looking statements based on these assumptions could be incorrect. Our operations and anticipated transactions involve risks and uncertainties, many of which are outside our control, and any one of which, or a combination of which, could materially affect our results of operations and whether the forward-looking statements ultimately prove to be correct. • Actual results and trends in the future may differ materially from those suggested or implied by the forward-looking statements depending on a variety of factors which are described in greater detail in our filings with the SEC. All future written and oral forward-looking statements attributable to us or persons acting on our behalf are expressly qualified in their entirety by the previous statements. We undertake no obligation to update any information contained herein or to publicly release the results of any revisions to any forward-looking statements that may be made to reflect events or circumstances that occur, or that we become aware of, after the date of this Presentation. • We have included various estimates of EBITDA and free cash flow, each of which are non-GAAP financial measures, throughout the presentation. Please see Appendix for the definition and reconciliation of these EBITDA and free cash flow estimates.

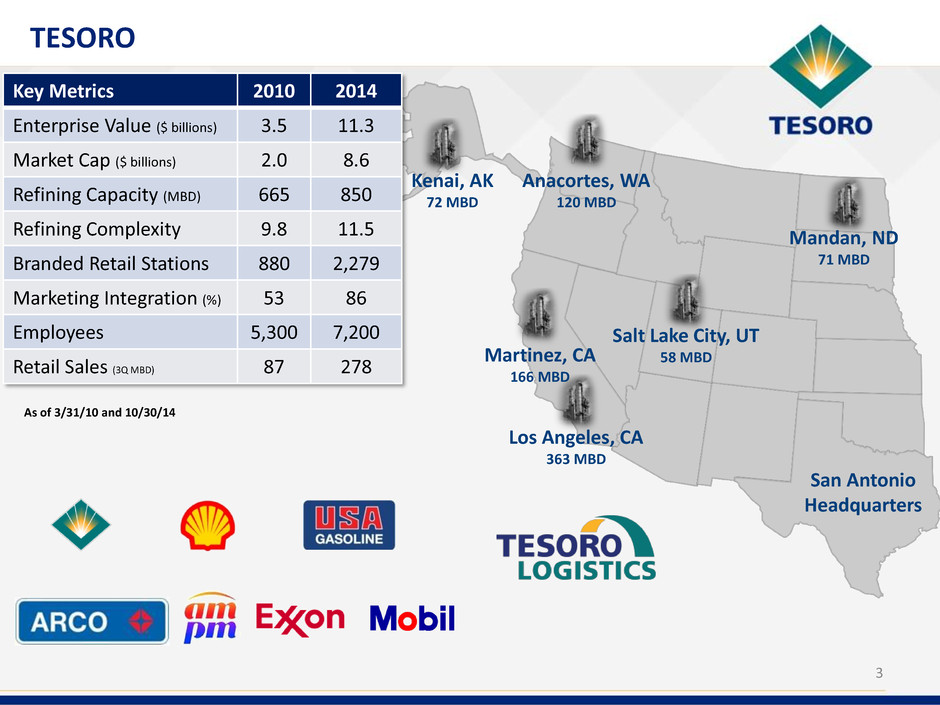
3 Los Angeles, CA 363 MBD Key Metrics 2010 2014 Enterprise Value ($ billions) 3.5 11.3 Market Cap ($ billions) 2.0 8.6 Refining Capacity (MBD) 665 850 Refining Complexity 9.8 11.5 Branded Retail Stations 880 2,279 Marketing Integration (%) 53 86 Employees 5,300 7,200 Retail Sales (3Q MBD) 87 278 As of 3/31/10 and 10/30/14 Mandan, ND 71 MBD Salt Lake City, UT 58 MBD Anacortes, WA 120 MBD Martinez, CA 166 MBD Kenai, AK 72 MBD San Antonio Headquarters TESORO

4 TESORO LOGISTICS LP Key Metrics Enterprise Value*($ billions) 5.8 Market Cap*($ billions) 4.5 Crude Oil and Refined Product Pipelines 1,640 miles High Plains Pipeline Throughput 100+ MBD High Plains Trucking Volume 50+ MBD Marketing Terminal Capacity 645+ MBD Marine Terminal Capacity 795 MBD Rail Terminal Capacity 50 MBD Dedicated Storage Capacity 9,200+ MBBLS TLLP growing rapidly into a premier Western US logistics provider Martinez Mandan Salt Lake City Los Angeles Kenai Anacortes As of 9/30/14 *As of 10/30/14

5 Market Outlook - Overview Key Drivers Tesoro’s View Global Economic Outlook Moderate growth U.S. Economic Outlook 2 – 2.5% GDP growth Global Refining Capacity Capacity exceeds demand U.S. Refining Utilization High due to low feedstock and natural gas prices U.S. Crude Oil Supply Strong growth in North American crude oil production World Product Demand Growth Gasoline ~1%; diesel ~2% per year U.S. Product Demand Growth Gasoline flat; diesel ~1% per year U.S. Product Exports Strong and growing supported by U.S. competitive position Renewable Fuel Growth Delays in development of advanced fuels Regulatory Environment Challenges and uncertainty Source: Internal Tesoro estimates

• Distinctive Performance Objectives • Grow logistics ‒ Grow Logistics by $200 million by 2015 ‒ Deliver incremental Tesoro shareholder value of $1 billion • Maintain financial discipline ‒ Maintain balance sheet strength, drive toward investment grade ‒ Invest free cash flow in high-return capital projects ‒ Return excess cash to shareholders 6 Distinctive Performance Objectives 1) Annual Improvements through 9/30/2014 2) Improvements over 2013 results $ million 2014 YTD1 2014E 2015E Deliver California Synergies 165 160 – 180 260 – 300 Enhance gross margin 135 140 – 160 250 – 290 Business Improvements 90 70 – 90 80 – 120 Annual Improvement2 390 370 – 430 590 – 710

2014E 2015E 2016E 2017E Synergy Capital Net Capital 2014E 2015E 2016E 2017E Annual Improvement Synergies Note: Net synergy capital of ~$375 MM (including savings beyond 2017, which are reflected in 2017E, capital plan net of capital avoidance) 2017 emissions reduction is subject to final project scope and detailed engineering Deliver California Synergies 160 180 65 (40) Los Angeles Refinery Integration Project • Optimizes processing capability • Provides 30-40 MBD product flexibility • Reduces CO2 emission 500,000 tons per year 7 $ millions 430-490 375-415 295-335 195-215 Synergy Categories • Feedstock Advantage • Logistics Optimization • Production Optimization • Operating Cost Improvements

• Largest California synergy capital project • Project includes1 – Provide 30 to 40 MBD of gasoline/distillate yield flexibility – Decommissions Wilmington fluid catalytic cracking unit – Reduces CO2 emissions – Advancing through engineering phase – Project completion expected early 2017 • Estimated net CAPEX of $140 to 160 million • Estimated EBITDA of $50 to 75 million • Estimated IRR over 30% 8 Los Angeles Refinery Integration Project Improves the combined Los Angeles refinery competitive position 1) Based on original acquisition plans, this project remains subject to final project scope, board approval and permitting

Advantaged Crude Oil Supply • 2014 Full year impact – Salt Lake City Expansion Phase 1 – Mandan Diesel Desulfurization Unit – Martinez Rail Unloading • Bakersfield Rail Unloading – 2014 • Salt Lake City Expansion Phase 2 – 2Q 2015 • Vancouver Energy–20151 • Trans Mountain Pipeline Expansion – 2017 • West Coast Mixed Xylenes - 20171 Marketing Portfolio • Improve EBITDA $50-60 Million by 20152 • Expand Exxon® and Mobil® Branded Marketing Regions • Grow Wholesale Branded Volumes 9 Enhance Gross Margin Station Count by Brand Vancouver Energy Rail Terminal 2010 2011 2012 2013 880 1,175 1,402 2,265 ARCO Exxon/ Mobil USA Tesoro Shell 1) Subject to regulatory approval 2) Improvements over 2013 results

• Up to 360 MBD Rail-to-Marine Terminal – Joint venture with Savage Companies • Vancouver Energy advantages – Flexibility to deliver to all West Coast refineries – Competitive with direct rail cost to California – Existing rail and marine infrastructure • Milestones – Vancouver Energy granted lease 3Q13 – EFSEC1 approved land-use consistency – Submission of Draft Environmental Impact Study 10 Vancouver Energy Completed Facility Operational Capacity 300 MBD Initial Crude Oil Movements2 2015 Tesoro Initial Committed Capacity 60 MBD A premier advantaged crude oil facility for the West Coast 1) EFSEC-Energy Facility Site Evaluation Council 2) Subject to regulatory approval

West and East Coasts clearing destinations for Bakken crude oil 11 Rail Costs to Clear Bakken Note: Rail cost estimates include only the railroad tariff Bakken Permian PNW: $6-7/bbl Vancouver Energy: $6-7/bbl SF: $9-10/bbl LA: $9-11/bbl

12 West Coast Mixed Xylenes • Xylene extraction up to 15,000 barrels per day, primarily from reformate • Processing at Anacortes Refinery • Project advantages: – Global xylene market is growing about 5% to 7% annually – Price-advantaged inland crudes, such as Bakken, yield more naphtha – Transportation advantage to Asia • Expected facility startup in 20171 Tesoro will be a competitive supplier to the global mixed xylenes market 0 15 30 45 60 75 2010 2012 2014 2016 2018 2020 million tons per annum Global Xylene Demand Year-on-Year Growth2 1) Subject to board and regulatory approval 2) Based on five to seven percent growth rate, Source: Nexant 0 40 80 120 160 50 60 70 80 90 100 2004 2007 2010 2013 Crude utilization Reformer utilization Ethanol MBD West Coast Reformer Utilization Percent MBD

• Lowering operating costs in the California refinery system • Improving supply chain costs • Institutionalizing best practices through Operational Excellence Management Systems (OEMS) to improve reliability • Utilizing Lean Six-Sigma (LSS) to deliver sustainable business improvements 13 Business Improvements 1) Versus Solomon Refinery Supply Corridor (RSC) 1st tercile, Pacific Northwest adjusted in 2010 and 2011 to exclude the impact of the 2010 Anacortes incident 2) Martinez and Wilmington only (Excludes Carson), energy costs based on the price of natural gas in 2012 for each year $/bbl 2010 2011 2012 California2 1.70 1.10 0.85 Pacific Northwest NA 0.05 0.30 Mid-Continent 0.30 0.15 1.10 Weighted Average 1.15 0.55 0.75 Total Operating Expense Gap (Non-energy)1

1.51 1.64 1.82 1.89 1.96 2.04 2.18 2.26 2.36 2.46 2.57 1 Q 1 2 2 Q 1 2 3 Q 1 2 4 Q 1 2 1 Q 1 3 2 Q 1 3 3 Q 1 3 4 Q 1 3 1 Q 1 4 2 Q 1 4 3 Q 1 4 14 Grow Logistics Develop and acquire feedstock supply and product distribution assets to enhance integrated value chain Grow logistics to represent a larger portion of Tesoro’s operating income Increase 3rd party revenue to 50% of total revenue Leverage TLLP’s lower cost of capital to support Tesoro’s growth DISTRIBUTION PER LP UNIT ($ ANNUALIZED) LOGISTICS IS KEY TO INTEGRATED BUSINESS MODEL 14 17 20 26 28 32 46 50 78 67 78 1 Q 1 2 2 Q 1 2 3 Q 1 2 4 Q 1 2 1 Q 1 3 2 Q 1 3 3 Q 1 3 4 Q 1 3 1 Q 1 4 2 Q 1 4 3 Q 1 4 EBITDA ($MM)(1) 1) EBITDA excludes predecessor results.

15 TLLP Strategic Drivers Increase EBITDA and cash distributions through fee-based logistics business model Focus on Stable, Fee-Based Business Fee-based committed businesses Maintain stable cash flow Optimize Existing Asset Base Increase third-party volumes Consolidate Tesoro business into TLLP terminals Pursue Organic Expansion Opportunities Execute growth projects Leverage low cost of capital Grow Through Strategic Acquisitions Pursue acquisitions that fit Western-US footprint Strategic partner in Tesoro’s growth plan

16 TLLP Value Proposition to Tesoro TLLP’s growth drives significant Tesoro shareholder value creation 77 156 305 631 2012 2013 2014E 2015E TLLP EBITDA 2012 2013 2014E 2015E Tesoro’s Implied Value of TLLP Ownership1 1) LP value based on market price and GP value based on 25X distributions. Refer to slide 28 for additional details on the 2014 estimate. 2015 estimate based on 25X estimated annualized 4Q 2015 GP distributions consistent with TLLP First Call distributions per unit. 2) EBITDA excludes predecessor results 3) Estimates based on TLLP First Call as of 11/6/2014. Reconciliation is provided in non-GAAP financial measures to ranges previously disclosed. 760 3,000 1,460 $ millions 3 Implied value per Tesoro share $5.50 $10.80 $24.00 $31.00 2 GP Holdings LP Units 2 4,000 3

• Maintain a minimum cash balance of $600 to $800 million • Target TSO debt to capitalization below 30%1 • Target TLLP debt at 3 to 4x’s EBITDA • Invest in growth opportunities to drive value creation • Return excess cash to shareholders • Drive towards investment-grade credit rating 17 Maintain Financial Discipline Return Excess Cash to Shareholders 1) Excluding TLLP debt and equity

• Operating cost advantage • Flexible yield structure • Access to cost-advantaged crude oil • Integrated logistics infrastructure • Secure and ratable refinery off-take • Cost-advantaged regulatory compliance 18 Keys to Distinction on the West Coast Los Angeles acquisition transforms our capabilities

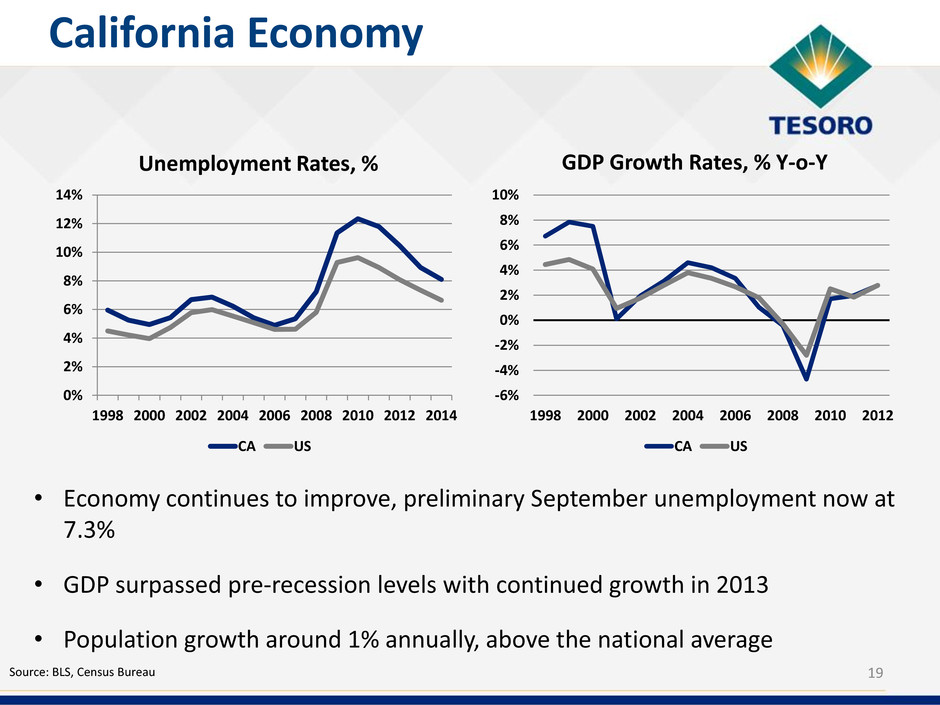
California Economy Source: BLS, Census Bureau 0% 2% 4% 6% 8% 10% 12% 14% 1998 2000 2002 2004 2006 2008 2010 2012 2014 Unemployment Rates, % CA US -6% -4% -2% 0% 2% 4% 6% 8% 10% 1998 2000 2002 2004 2006 2008 2010 2012 GDP Growth Rates, % Y-o-Y CA US • Economy continues to improve, preliminary September unemployment now at 7.3% • GDP surpassed pre-recession levels with continued growth in 2013 • Population growth around 1% annually, above the national average 19

- 250 500 750 1,000 1,250 1,500 1,750 2008 2010 2012 2014F 2016F PADD V Demand MBD 20 PADD V Demand Favorable market fundamentals • Gasoline demand expected to grow 0-0.5% annually through 2016 • Diesel demand expected to grow about 1.0% annually • Net clean product exports expected to be 175-225 MBD • PADD V continues to import jet fuel Source: EIA monthly data, forecast based on internal Tesoro forecasts Gasoline Diesel

21 PADD V Refining Utilization Source: EIA monthly data, forecast based on internal Tesoro forecasts Operating today at pre-recession utilization rates 90 92 91 88 88 80 81 82 83 84 92 93 91 88 89 86 88 87 90 91 70 75 80 85 90 95 2004 2005 2006 2007 2008 2009 2010 2011 2012 2013 Total EIA Capacity Operable Capacity Percent

22 PADD V Supply Demand Balance Average MBD Jul – Dec 20131 Production2 Demand Exports Gasoline 1,628 1,523 57 Diesel 618 499 149 Jet 451 445 - Total 2,697 2,467 206 • Total refining capacity of 2.8 MMBD • Operating at 91% operable capacity • Market connected by shipping, not pipeline infrastructure • Highly integrated refining and marketing systems Source: EIA monthly data, forecast based on internal Tesoro forecasts 1) July – December 2013, post Richmond downtime 2) Clean product production only, includes inter-PADD movements and ethanol blending in gasoline

23 PADD V Refining Centers Source: EIA data, Tesoro estimates. Imported estimates are non North American crude oil and the estimated ranges can vary Alaska Hawaii Pacific Northwest Northern California 630 MBD Capacity Over 90% >30 API 15-25% imported crude oil 1040 MBD Capacity Under 40% >30 API 40-60% imported crude oil 830 MBD Capacity Under 45% >30 API 40-60% imported crude oil 150 MBD Capacity Over 85% >30 API 70-80% imported crude oil Southern California 23% 23% 11% 17% 23% 21% 43% 39% PADD V Crude Oil Supply Foreign ANS N. American California 165 MBD Capacity Over 95% >30 API Less than 10% imported crude oil 2011 2013

24 Summary Capital Spending 2013A 2014E 2015E 2016E Tesoro Capital Spending1 $ in millions 1) Excludes self-funded TLLP capital expenditures. 2) Net synergy capital $ millions 2013 2014E 2015E 2016E Maintenance 182 145 245 255 Regulatory 81 165 245 200 Synergy2 0 65 180 160 Income 216 175 120 155 Total 479 550 790 770 Summary Capital Expenditures 479 550 790 770 Capital spending plans well supported by strong and growing EBITDA Income Synergy Regulatory Maintenance

Typical income projects IRR of 15 to 25% Significant portion of near- term income capital spend associated with expansion of High Plains System Income capital excludes spend associated with potential growth opportunities 25 TLLP Capital Spending Note: Maintenance and regulatory capital before reimbursements. 1) Inclusive of $5 million reimbursement from TSO, excludes predecessors 2) Inclusive of $25 million reimbursement from TSO Income capital expected to support significant organic growth 62 160 400 14 40 60 2013A 2014E 2015E CAPITAL SPEND ($MM) Income Maintenance 1 2

26 Delivering Shareholder Value Enhance Gross Margin California Synergies Maintain Financial Discipline Business Improvements Grow Logistics Transformation through Distinctive Performance

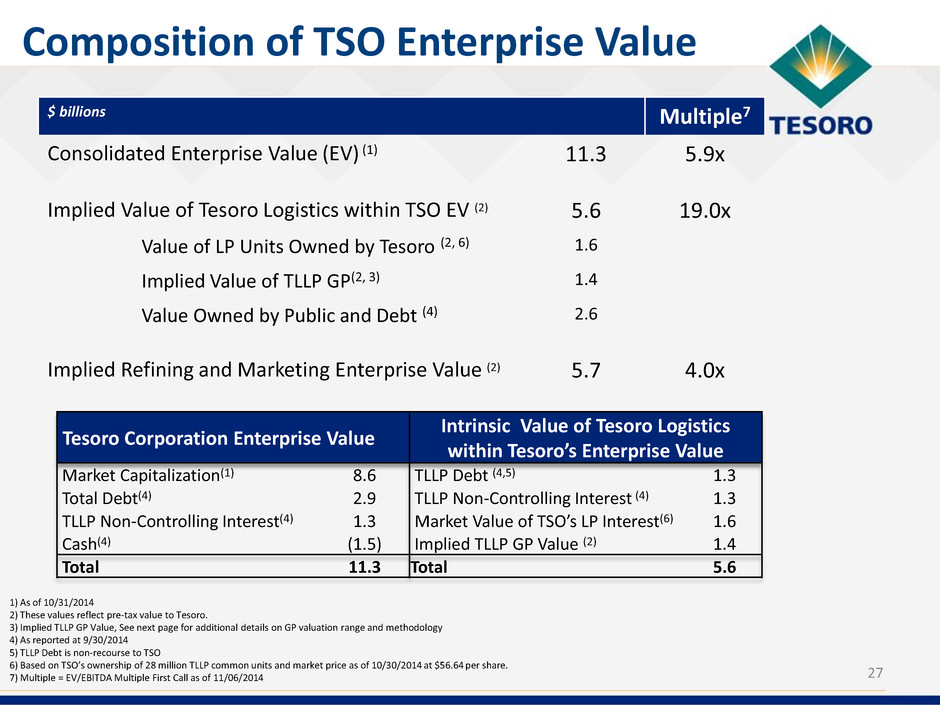
27 Composition of TSO Enterprise Value Tesoro Corporation Enterprise Value Intrinsic Value of Tesoro Logistics within Tesoro’s Enterprise Value Market Capitalization(1) 8.6 TLLP Debt (4,5) 1.3 Total Debt(4) 2.9 TLLP Non-Controlling Interest (4) 1.3 TLLP Non-Controlling Interest(4) 1.3 Market Value of TSO’s LP Interest(6) 1.6 Cash(4) (1.5) Implied TLLP GP Value (2) 1.4 Total 11.3 Total 5.6 $ billions Multiple7 Consolidated Enterprise Value (EV) (1) 11.3 5.9x Implied Value of Tesoro Logistics within TSO EV (2) 5.6 19.0x Value of LP Units Owned by Tesoro (2, 6) 1.6 Implied Value of TLLP GP(2, 3) 1.4 Value Owned by Public and Debt (4) 2.6 Implied Refining and Marketing Enterprise Value (2) 5.7 4.0x 1) As of 10/31/2014 2) These values reflect pre-tax value to Tesoro. 3) Implied TLLP GP Value, See next page for additional details on GP valuation range and methodology 4) As reported at 9/30/2014 5) TLLP Debt is non-recourse to TSO 6) Based on TSO’s ownership of 28 million TLLP common units and market price as of 10/30/2014 at $56.64 per share. 7) Multiple = EV/EBITDA Multiple First Call as of 11/06/2014

28 Estimated Value of Tesoro Logistics GP to Tesoro Value of Tesoro Logistics General Partner (“GP”) ($ millions) Annualized GP Distributions(Annualized 3Q14 GP Distribution of $14.3) $ 57.1 Multiple of GP Cash Flow (1) 20x 25x 30x Implied Value of GP Holdings (2) $ 1,142 $ 1,428 $ 1,713 1) General partner value estimated using a range of Wall Street market multiples for publically traded GP holding companies and does not necessarily reflect the appropriate multiple for GP. The multiple is applied to the annualized distribution to the GP for the most recent quarter 2) Implied GP Value estimated based on annualized GP distributions and cash flow multiple above; reflect pre-tax value to Tesoro 2Q11 3Q11 4Q11 1Q12 2Q12 3Q12 4Q12 1Q13 2Q13 3Q13 4Q13 1Q14 2Q14 3Q14 QUARTERLY DISTRIBUTIONS TO TESORO 3.9 5.7 5.9 6.2 6.8 8.2 9.2 9.8 11.3 13.5 16.3 18.1 20.3 GP Units LP Units 32.4

29 EBITDA represents earnings before interest and financing costs, net, interest income, income taxes, and depreciation and amortization expense. We present EBITDA because we believe some investors and analysts use EBITDA to help analyze our cash flows including our ability to satisfy principal and interest obligations with respect to our indebtedness and to use cash for other purposes, including capital expenditures. EBITDA is also used by some investors and analysts to analyze and compare companies on the basis of operating performance and by management for internal analysis. EBITDA should not be considered as an alternative to net earnings, earnings before income taxes, cash flows from operating activities or any other measure of financial performance presented in accordance with accounting principles generally accepted in the United States of America. EBITDA may not be comparable to similarly titled measures used by other entities. (In millions) Unaudited LA Refinery Integration Project Marketing Improvements Forecasted net earnings 33$ 31$ Add income tax expense 19 18 Add depreciation and amortization expense 10 6 Forecasted EBITDA 62$ 55$ 2015 Annual EBITDA Estimates (1) 1) When a range of estimated of EBITDA has been disclosed and/or previously disclosed, we have included the EBITDA reconciliation for the mid-point of the range disclosed. 2) TLLP EBITDA is not representative of Tesoro consolidated EBITDA as intercompany transactions between TLLP and Tesoro are eliminated upon consolidation. Non-GAAP Financial Measures 2014 TLLP EBITDA Estimate (2) TLLP Forecasted Current Business (In millions) Unaudited Forecasted net income $ 150 - 165 Add depreciation and amortization expenses 70 Add interest and financing costs, net 80 Forecasted EBITDA $ 300 - 315

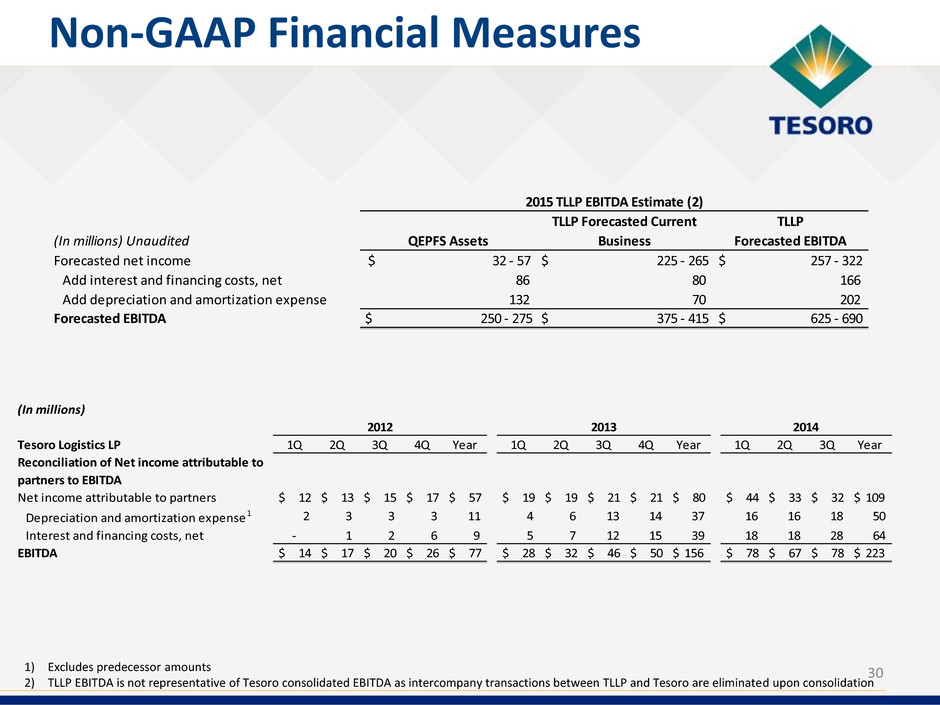
30 1) Excludes predecessor amounts 2) TLLP EBITDA is not representative of Tesoro consolidated EBITDA as intercompany transactions between TLLP and Tesoro are eliminated upon consolidation (In millions) Tesoro Logistics LP 1Q 2Q 3Q 4Q Year 1Q 2Q 3Q 4Q Year 1Q 2Q 3Q Year Reconciliation of Net income attributable to partners to EBITDA Net income attributable to partners $ 12 $ 13 $ 15 $ 17 $ 57 $ 19 $ 19 $ 21 $ 21 $ 80 $ 44 $ 33 $ 32 $ 109 Depreciation and amortization expense1 2 3 3 3 11 4 6 13 14 37 16 16 18 50 Interest and financing costs, net - 1 2 6 9 5 7 12 15 39 18 18 28 64 EBITDA $ 14 $ 17 $ 20 $ 26 $ 77 $ 28 $ 32 $ 46 $ 50 $ 156 $ 78 $ 67 $ 78 $ 223 20142012 2013 Non-GAAP Financial Measures (In millions) Unaudited QEPFS Assets TLLP Forecasted Current Business TLLP Forecasted EBITDA Forecasted net income $ 32 - 57 $ 225 - 265 $ 257 - 322 Add interest and financing costs, net 86 80 166 Add depreciation and amortization expense 132 70 202 Forecasted EBITDA $ 250 - 275 $ 375 - 415 $ 625 - 690 2015 TLLP EBITDA Estimate (2)
