Attached files
| file | filename |
|---|---|
| EX-32.2 - CERTIFICATION OF CHIEF FINANCIAL OFFICER PURSUANT TO SECTION 906 - ANDEAVOR | andv2q201810-qex322.htm |
| EX-32.1 - CERTIFICATION OF CHIEF EXECUTIVE OFFICER PURSUANT TO SECTION 906 - ANDEAVOR | andv2q201810-qex321.htm |
| EX-31.2 - CERTIFICATION OF CHIEF FINANCIAL OFFICER PURSUANT TO SECTION 302 - ANDEAVOR | andv2q201810-qex312.htm |
| EX-31.1 - CERTIFICATION OF CHIEF EXECUTIVE OFFICER PURSUANT TO SECTION 302 - ANDEAVOR | andv2q201810-qex311.htm |
| EX-10.4 - AMENDMENT NO. 1 TO ALASKA TERMINALLING SERVICES AGREEMENT - ANDEAVOR | andv2q201810-qex104xalaska.htm |
| EX-10.3 - AMENDMENT NO. 1 TO MARTINEZ STORAGE SERVICES AGREEMENT - ANDEAVOR | andv2q201810-qex103xmartin.htm |
| EX-10.2 - AMENDMENT NO. 1 TO AVON MARINE TERMINAL USE AND THROUGHPUT AGREEMENT - ANDEAVOR | andv2q201810-qex102xavonmt.htm |
| EX-10.1 - AMENDMENT NO. 1 TO KENAI STORAGE SERVICES AGREEMENT - ANDEAVOR | andv2q201810-qex101xkenais.htm |
| EX-2.6 - AMENDMENT TO AGREEMENT AND PLAN OF MERGER - ANDEAVOR | andv2q201810-qex26xamendme.htm |
UNITED STATES
SECURITIES AND EXCHANGE COMMISSION
Washington, D.C. 20549
FORM 10‑Q
(Mark One)
þ | QUARTERLY REPORT PURSUANT TO SECTION 13 OR 15(d) OF THE SECURITIES EXCHANGE ACT OF 1934 |
For the quarterly period ended June 30, 2018
or
o | TRANSITION REPORT PURSUANT TO SECTION 13 OR 15(d) OF THE SECURITIES EXCHANGE ACT OF 1934 |
For the transition period from_____________________to__________
Commission File Number 1‑3473
ANDEAVOR
(Exact name of registrant as specified in its charter)
Delaware |  | 95‑0862768 |
(State or other jurisdiction of | (I.R.S. Employer | |
incorporation or organization) | Identification No.) | |
19100 Ridgewood Pkwy, San Antonio, Texas 78259-1828 | ||
(Address of principal executive offices) (Zip Code) | ||
210-626-6000 | ||
(Registrant’s telephone number, including area code) | ||
Indicate by check mark whether the registrant (1) has filed all reports required to be filed by Section 13 or 15(d) of the Securities Exchange Act of 1934 during the preceding 12 months (or for such shorter period that the registrant was required to file such reports), and (2) has been subject to such filing requirements for the past 90 days. Yes þ No o
Indicate by check mark whether the registrant has submitted electronically and posted on its corporate Website, if any, every Interactive Data File required to be submitted and posted pursuant to Rule 405 of Regulation S-T (§232.405 of this chapter) during the preceding 12 months (or for such shorter period that the registrant was required to submit and post such files). Yes þ No o
Indicate by check mark whether the registrant is a large accelerated filer, an accelerated filer, a non-accelerated filer, or a smaller reporting company. See definitions of “large accelerated filer,” “accelerated filer,” “smaller reporting company” and “emerging growth company” in Rule 12b-2 of the Exchange Act.
Large accelerated filer | þ | Accelerated filer | o | |||
Non-accelerated filer | o (Do not check if a smaller reporting company) | Smaller reporting company | o | |||
Emerging growth company | o | |||||
If an emerging growth company, indicate by check mark if the registrant has elected not to use the extended transition period for complying with any new or revised financial accounting standards provided pursuant to Section 13(a) of the Exchange Act. o
Indicate by check mark whether the registrant is a shell company (as defined in Rule 12b-2 of the Exchange Act). Yes o No þ
There were 151,125,987 shares of the registrant’s Common Stock outstanding at August 2, 2018.
Table of Contents | ||
Andeavor
Quarterly Report on Form 10-Q
For the Quarterly Period Ended June 30, 2018
This Quarterly Report on Form 10-Q (including documents incorporated by reference herein) contains statements with respect to our expectations or beliefs as to future events. These types of statements are “forward-looking” and subject to uncertainties. See “Important Information Regarding Forward-Looking Statements” in Management’s Discussion and Analysis of Financial Condition and Results of Operations in Part I, Item 2.
2 | |  | |
Financial Statements | ||
Part I - Financial Statements
Item 1. Financial Statements
Andeavor
Condensed Statements of Consolidated Operations
(Unaudited)
Three Months Ended June 30, | Six Months Ended June 30, | ||||||||||||||
2018 | 2017 | 2018 | 2017 | ||||||||||||
(In millions, except per share amounts) | |||||||||||||||
Revenues (a) | $ | 12,472 | $ | 7,849 | $ | 22,772 | $ | 14,487 | |||||||
Costs and Expenses | |||||||||||||||
Cost of materials and other (excluding items shown separately below) (a) | 10,235 | 6,217 | 18,844 | 11,643 | |||||||||||
Lower of cost or market inventory valuation adjustment | — | 209 | — | 209 | |||||||||||
Operating expenses (excluding depreciation and amortization) | 918 | 740 | 1,784 | 1,395 | |||||||||||
Depreciation and amortization expenses | 292 | 240 | 574 | 466 | |||||||||||
General and administrative expenses | 179 | 247 | 352 | 382 | |||||||||||
(Gain) loss on asset disposals and impairments | 1 | (22 | ) | 1 | (21 | ) | |||||||||
Operating Income | 847 | 218 | 1,217 | 413 | |||||||||||
Interest and financing costs, net | (109 | ) | (96 | ) | (211 | ) | (194 | ) | |||||||
Equity in earnings of equity method investments | 11 | 3 | 21 | 3 | |||||||||||
Other income, net | — | 18 | 10 | 29 | |||||||||||
Earnings Before Income Taxes | 749 | 143 | 1,037 | 251 | |||||||||||
Income tax expense | 167 | 56 | 226 | 77 | |||||||||||
Net Earnings from Continuing Operations | 582 | 87 | 811 | 174 | |||||||||||
Earnings from discontinued operations, net of tax | — | — | 8 | — | |||||||||||
Net Earnings | 582 | 87 | 819 | 174 | |||||||||||
Less: Net earnings from continuing operations attributable to noncontrolling interest | 67 | 47 | 132 | 84 | |||||||||||
Net Earnings Attributable to Andeavor | $ | 515 | $ | 40 | $ | 687 | $ | 90 | |||||||
Net Earnings Attributable to Andeavor | |||||||||||||||
Continuing operations | $ | 515 | $ | 40 | $ | 679 | $ | 90 | |||||||
Discontinued operations | — | — | 8 | — | |||||||||||
Total | $ | 515 | $ | 40 | $ | 687 | $ | 90 | |||||||
Net Earnings per Share - Basic | |||||||||||||||
Continuing operations | $ | 3.41 | $ | 0.31 | $ | 4.47 | $ | 0.73 | |||||||
Discontinued operations | — | — | 0.05 | — | |||||||||||
Total | $ | 3.41 | $ | 0.31 | $ | 4.52 | $ | 0.73 | |||||||
Weighted average common shares outstanding - Basic | 151.1 | 130.8 | 152.0 | 124.0 | |||||||||||
Net Earnings per Share - Diluted | |||||||||||||||
Continuing operations | $ | 3.38 | $ | 0.31 | $ | 4.43 | $ | 0.72 | |||||||
Discontinued operations | — | — | 0.05 | — | |||||||||||
Total | $ | 3.38 | $ | 0.31 | $ | 4.48 | $ | 0.72 | |||||||
Weighted average common shares outstanding - Diluted | 152.6 | 131.7 | 153.5 | 125.0 | |||||||||||
Dividends per Share | $ | 0.59 | $ | 0.55 | $ | 1.18 | $ | 1.10 | |||||||
Supplemental Information | |||||||||||||||
(a) Excise taxes collected by our Marketing segment included in revenues. Refer to Note 12 in the accompanying notes for adoption of revenue recognition standards. | $ | — | $ | 153 | $ | — | $ | 287 | |||||||
The accompanying notes are an integral part of these condensed consolidated financial statements.
June 30, 2018 | 3 | ||
Financial Statements | ||
Andeavor
Condensed Consolidated Balance Sheets
(Unaudited)
June 30, 2018 | December 31, 2017 | ||||||
(In millions, except share data) | |||||||
Assets | |||||||
Current Assets | |||||||
Cash and cash equivalents (Andeavor Logistics: $44 and $75, respectively) | $ | 388 | $ | 543 | |||
Receivables, net of allowance for doubtful accounts (Andeavor Logistics: $200 and $219, respectively) | 2,623 | 1,961 | |||||
Inventories | 3,653 | 3,630 | |||||
Prepayments and other current assets | 496 | 749 | |||||
Total Current Assets | 7,160 | 6,883 | |||||
Property, Plant and Equipment, Net | |||||||
Property, plant and equipment, at cost | 19,834 | 18,823 | |||||
Accumulated depreciation and amortization | (4,389 | ) | (4,081 | ) | |||
Property, Plant and Equipment, Net (Andeavor Logistics: $5,625 and $5,413, respectively) | 15,445 | 14,742 | |||||
Goodwill (Andeavor Logistics: $712 and $692, respectively) | 3,288 | 3,234 | |||||
Acquired Intangibles, Net (Andeavor Logistics: $1,128 and $1,153, respectively) | 1,709 | 1,645 | |||||
Other Noncurrent Assets, Net (Andeavor Logistics: $404 and $406, respectively) | 2,472 | 2,069 | |||||
Total Assets | $ | 30,074 | $ | 28,573 | |||
Liabilities and Equity | |||||||
Current Liabilities | |||||||
Accounts payable | $ | 3,799 | $ | 3,330 | |||
Current maturities of debt | 28 | 17 | |||||
Other current liabilities | 1,227 | 1,654 | |||||
Total Current Liabilities | 5,054 | 5,001 | |||||
Deferred Income Taxes | 1,777 | 1,591 | |||||
Debt, Net of Unamortized Issuance Costs (Andeavor Logistics: $4,372 and $4,127, respectively) | 8,698 | 7,668 | |||||
Other Noncurrent Liabilities | 978 | 898 | |||||
Total Liabilities | 16,507 | 15,158 | |||||
Commitments and Contingencies (Note 9) | |||||||
Equity | |||||||
Andeavor Stockholders’ Equity | |||||||
Common stock, par value $0.162/3; authorized 300,000,000 shares; 200,797,146 shares issued (200,095,819 in 2017) | 33 | 33 | |||||
Additional paid-in capital | 5,269 | 5,224 | |||||
Retained earnings | 8,141 | 7,651 | |||||
Treasury stock, 49,675,841 common shares (46,810,338 in 2017), at cost | (3,123 | ) | (2,841 | ) | |||
Accumulated other comprehensive loss, net of tax | (252 | ) | (252 | ) | |||
Total Andeavor Stockholders’ Equity | 10,068 | 9,815 | |||||
Noncontrolling Interest | 3,499 | 3,600 | |||||
Total Equity | 13,567 | 13,415 | |||||
Total Liabilities and Equity | $ | 30,074 | $ | 28,573 | |||
The accompanying notes are an integral part of these condensed consolidated financial statements.
4 | | | |
Financial Statements | ||
Andeavor
Condensed Statements of Consolidated Cash Flows
(Unaudited)
Six Months Ended June 30, | |||||||
2018 | 2017 | ||||||
(In millions) | |||||||
Cash Flows From (Used In) Operating Activities | |||||||
Net earnings | $ | 819 | $ | 174 | |||
Adjustments to reconcile net earnings to net cash from operating activities: | |||||||
Depreciation and amortization expenses | 574 | 466 | |||||
Lower of cost or market inventory valuation adjustment | — | 209 | |||||
Amortization of debt issuance costs and discounts | 10 | 10 | |||||
(Gain) loss on asset disposals and impairments | 1 | (21 | ) | ||||
Gain related to Hawaii Business | (10 | ) | — | ||||
Stock-based compensation expense | 26 | 34 | |||||
Deferred income taxes | 171 | 50 | |||||
Turnaround expenditures | (237 | ) | (274 | ) | |||
Marketing branding costs | (24 | ) | (37 | ) | |||
Equity in earnings of equity method investments, net of distributions | 6 | 13 | |||||
Other operating activities, net | 9 | (6 | ) | ||||
Changes in current assets and current liabilities | (282 | ) | (4 | ) | |||
Changes in noncurrent assets and noncurrent liabilities | 34 | 156 | |||||
Net cash from operating activities | 1,097 | 770 | |||||
Cash Flows From (Used In) Investing Activities | |||||||
Capital expenditures | (852 | ) | (539 | ) | |||
Acquisitions, net of cash | (631 | ) | (938 | ) | |||
Proceeds from asset sales | 7 | 44 | |||||
Investments in equity method investments and joint ventures | (37 | ) | — | ||||
Other investing activities, net | 1 | (15 | ) | ||||
Net cash used in investing activities | (1,512 | ) | (1,448 | ) | |||
Cash Flows From (Used In) Financing Activities | |||||||
Borrowings under revolving credit agreements | 2,940 | 764 | |||||
Repayments on revolving credit agreements | (1,898 | ) | (514 | ) | |||
Repayments of debt | (11 | ) | (1,636 | ) | |||
Proceeds from inventory financing arrangements | 330 | — | |||||
Repayments of inventory financing arrangements | (446 | ) | — | ||||
Dividend payments | (181 | ) | (130 | ) | |||
Net proceeds from issuance of Andeavor Logistics LP common units | — | 281 | |||||
Distributions to noncontrolling interest | (189 | ) | (133 | ) | |||
Purchases of common stock | (258 | ) | (148 | ) | |||
Taxes paid related to net share settlement of equity awards | (23 | ) | (31 | ) | |||
Other financing activities, net | (4 | ) | (9 | ) | |||
Net cash from (used in) financing activities | 260 | (1,556 | ) | ||||
Decrease in Cash and Cash Equivalents | (155 | ) | (2,234 | ) | |||
Cash and Cash Equivalents, Beginning of Period | 543 | 3,295 | |||||
Cash and Cash Equivalents, End of Period | $ | 388 | $ | 1,061 | |||
The accompanying notes are an integral part of these condensed consolidated financial statements.
June 30, 2018 | 5 | ||
Notes to Condensed Consolidated Financial Statements (Unaudited) | ||
Note 1 - Organization and Basis of Presentation
Organization
As used in this report, the terms “Andeavor,” the “Company,” “we,” “us” or “our” may refer to Andeavor, one or more of its consolidated subsidiaries or all of them taken as a whole. The words “we,” “us” or “our” generally include Andeavor Logistics LP (“Andeavor Logistics”), a publicly-traded limited partnership, and its subsidiaries as consolidated subsidiaries of Andeavor with certain exceptions where there are transactions or obligations between Andeavor Logistics and Andeavor or its other subsidiaries.
Marathon Petroleum Corporation Merger
Andeavor and Marathon Petroleum Corporation (“MPC”) entered into an Agreement and Plan of Merger, dated as of April 29, 2018 (the “MPC Merger Agreement”), under which MPC will acquire all of our outstanding shares (the “MPC Merger”). Our shareholders will have the option to receive in exchange for their shares of Andeavor common stock shares of MPC stock, cash, or a combination of both, subject to a proration mechanism that will result in 15 percent of the shares of our common stock being exchanged for cash, and the remaining shares being exchanged for MPC stock. The transaction was unanimously approved by the boards of directors of both companies and subject to regulatory and other customary closing conditions, including approvals from the shareholders of each company.
On July 3, 2018, we were notified that the waiting period with respect to the notification and report forms filed under the
U.S. Hart-Scott-Rodino Antitrust Improvements Act of 1976 expired. In addition, we have received the necessary regulatory clearance in Canada. These matters satisfy certain conditions to the closing of the MPC Merger, but others remain.
Andeavor stockholders as of the close of business on August 1, 2018 (the “Record Date”) were invited to attend a special meeting on September 24, 2018 to consider and vote upon a proposal to adopt the MPC Merger Agreement and other matters related to the MPC Merger. MPC stockholders as of the close of business on the Record Date were invited to attend a special meeting on September 24, 2018 to consider and vote upon a proposal to approve the issuance of MPC common stock in connection with the MPC Merger and other matters related to the MPC Merger.
Western Refining
On June 1, 2017, pursuant to the Agreement and Plan of Merger, dated as of November 16, 2016, by and among Western Refining, Inc. (“Western Refining”), the Company, and our wholly-owned subsidiaries, a wholly-owned subsidiary was merged with and into Western Refining, with Western Refining surviving such merger as a wholly-owned subsidiary of the Company (the “Merger” or the “Western Refining Acquisition”). Refer to Note 2 for more information on the Merger.
Principles of Consolidation and Basis of Presentation
Principles of Consolidation
These interim condensed consolidated financial statements and notes hereto of Andeavor and its subsidiaries have been prepared by management without audit according to the rules and regulations of the Securities and Exchange Commission (“SEC”) and reflect all adjustments that, in the opinion of management, are necessary for a fair presentation of results for the periods presented. Such adjustments are of a normal recurring nature, unless otherwise disclosed. We prepare our condensed consolidated financial statements in conformity with accounting principles generally accepted in the United States of America (“U.S. GAAP”). However, certain information and notes normally included in financial statements prepared in accordance with U.S. GAAP have been condensed or omitted pursuant to the SEC’s rules and regulations. The consolidated balance sheet at December 31, 2017 has been condensed from the audited consolidated financial statements at that date. Management believes that the disclosures presented herein are adequate to present the information fairly. The accompanying condensed consolidated financial statements and notes should be read in conjunction with the Andeavor Annual Report on Form 10-K for the year ended December 31, 2017.
Basis of Presentation
We are required under U.S. GAAP to make estimates and assumptions that affect the reported amounts and disclosures of assets and liabilities at the date of the financial statements and the reported amounts of revenues and expenses during the periods presented. We review our estimates on an ongoing basis. Changes in facts and circumstances may result in revised estimates and actual results could differ from those estimates. The results of operations for any interim period are not necessarily indicative of results for the full year. Certain prior year balances have been aggregated or disaggregated to conform to the current year presentation, including the adoption of recent accounting standards discussed further below.
The consolidated statements of comprehensive income for the six months ended June 30, 2018 and 2017 have been omitted, as there was no material change to accumulated other comprehensive income in either period.
Cost Classifications
Cost of materials and other includes the purchase cost of commodities sold within our Refining and Logistics segments along with the cost of inbound transportation and outbound distribution costs incurred to transport product to our customers, gains and
6 | | | |
Notes to Condensed Consolidated Financial Statements (Unaudited) | ||
losses related to our commodity hedging activities and the cost of merchandise sold through our Marketing segment. Additionally, lower of cost or market valuation adjustments impact our cost of materials and other but are separately presented in our statements of consolidated operations.
Operating expenses are comprised of direct and indirect operating costs. Direct operating expenses reflect costs incurred for direct labor, repairs and maintenance, outside services, chemicals and catalysts, utility costs, including the purchase of electricity and natural gas used by our facilities, property taxes, environmental compliance costs related to current period operations, rent expense and other direct operating expenses incurred in the production of refined products sold through our Marketing or Refining segments or towards the provision of services in our Logistics segment. Indirect operating expenses represent allocated labor and other administrative costs for centralized personnel that influence our underlying operations, environmental remediation costs unrelated to current period operations, and other costs that are related, but not directly, to our segment operations.
Operating Expenses (in millions)
Three Months Ended June 30, | Six Months Ended June 30, | ||||||||||||||
2018 | 2017 | 2018 | 2017 | ||||||||||||
Direct operating expenses | $ | 836 | $ | 708 | $ | 1,664 | $ | 1,333 | |||||||
Indirect operating expenses | 82 | 32 | 120 | 62 | |||||||||||
Operating expenses (excluding depreciation and amortization) | $ | 918 | $ | 740 | $ | 1,784 | $ | 1,395 | |||||||
Depreciation and amortization expenses consist of the depreciation and amortization of property, plant and equipment, deferred turnaround expenditures, marketing branding costs and intangible assets related to our operating segments along with our corporate operations. General and administrative expenses represent costs that are not directly or indirectly related to or otherwise are not allocated to our marketing, logistics or refining operations. Cost of materials and other, any lower of cost or market valuation adjustments, direct operating expenses incurred across our operating segments, and depreciation and amortization expenses recognized by our Marketing, Logistics and Refining segments (refer to amounts disclosed in Note 13) constitute costs of revenue as defined by U.S. GAAP.
Variable Interest Entities
Our condensed consolidated financial statements include a variable interest entity, Andeavor Logistics, which is part of our Marketing and Logistics segments. Andeavor Logistics is a publicly traded limited partnership that we formed to own, operate, develop and acquire logistics assets. Its assets are integral to the success of Andeavor’s refining and marketing operations and are used to gather crude oil, natural gas, and water, process natural gas and distribute, transport and store crude oil and refined products. Andeavor Logistics provides us with various pipeline transportation, trucking, terminal distribution, gathering and processing, storage and petroleum-coke handling services under long-term, fee-based commercial agreements. Each of these agreements, apart from the storage and transportation services agreement, contain minimum volume commitments. We do not provide financial or equity support through any liquidity arrangements or financial guarantees to Andeavor Logistics.
Tesoro Logistics GP, LLC (“TLGP”), our wholly-owned subsidiary, serves as the general partner of Andeavor Logistics. As the general partner of Andeavor Logistics, we have the sole ability to direct the activities of Andeavor Logistics that most significantly impact its economic performance. We are considered to be the primary beneficiary for accounting purposes and are Andeavor Logistics’ primary customer. We held an approximate 59% interest in Andeavor Logistics at both June 30, 2018 and December 31, 2017. In the event Andeavor Logistics incurs a loss, our operating results will reflect Andeavor Logistics’ loss, net of intercompany eliminations. Andeavor Logistics’ transactions with us under our various long-term, fee-based commercial agreements accounted for 68% and 64% of Andeavor Logistics’ total revenues for the three and six months ended June 30, 2018, respectively, and 45% and 46% of Andeavor Logistics’ total revenues for the three and six months ended June 30, 2017, respectively.
In January 2018, Andeavor acquired Rangeland Energy II, LLC, (“Rangeland”), which included the acquisition of Rangeland’s 67% interest in Rangeland RIO Pipeline, LLC (“RIO”), a variable interest entity that owns assets in the Delaware and Midland Basins. Andeavor’s interests in RIO include its initial equity investment of $159 million, which is subject to adjustment during the one-year measurement period, and a service agreement through one of its wholly-owned subsidiaries to operate, maintain and repair the assets. Andeavor is not the primary beneficiary of RIO, under the partnership agreement, because Andeavor and the other minor shareholder jointly direct the activities of RIO that most significantly impact its economic performance. In addition, Andeavor Logistics has a 78% interest in Rendezvous Gas Services, L.L.C (“RGS”).
In April 2018, Andeavor announced participation in two new joint ventures under development, Gray Oak Pipeline, LLC (“Gray Oak Pipeline”) and South Texas Terminal LLC (“South Texas Gateway Terminal”). The Gray Oak Pipeline will support the transportation of crude oil from the Permian Basin to Corpus Christi, Texas. We own a 25% interest in the pipeline that is expected to be placed in service by the end of the fourth quarter of 2019 and is backed by long-term third-party, take-or-pay commitments with primarily investment grade customers. We own a 25% participation in the South Texas Gateway Terminal, a
June 30, 2018 | 7 | ||
Notes to Condensed Consolidated Financial Statements (Unaudited) | ||
planned deep-water, open access marine terminal in Ingleside, Texas. RIO, RGS, Gray Oak Pipeline and the South Texas Gateway Terminal are unconsolidated variable interest entities and we use the equity method of accounting with respect to our investments in each entity.
Discontinued Operations
On September 25, 2013, we completed the sale of all of our interest in Tesoro Hawaii, LLC, which operated a 94 thousand barrels per day Hawaii refinery, retail sites and associated logistics assets (the “Hawaii Business”). The sale of the Hawaii Business was subject to an earn-out provision based on the annual gross margin (as defined in sale agreement) in the three annual periods beginning with the year ended December 31, 2014 and ending with the year ended December 31, 2016. Additionally, we retained liability for certain regulatory improvements required at the Hawaii refinery and tank replacement efforts at certain retail sites. The results of operations for this business have been presented as discontinued operations in the condensed statements of consolidated operations. There were no revenues for the three or six months ended June 30, 2018 and 2017. We recorded $10 million in pre-tax earnings ($8 million after-tax) during the six months ended June 30, 2018 primarily related to final adjustments to previous earn-out periods. No additional earn-outs related to the sale of the Hawaii Business remain to be paid to Andeavor. There were no earnings or loss recorded for the three months ended June 30, 2018 or 2017 and the six months ended June 30, 2017. Cash flows from discontinued operations were $8 million for the six months ended June 30, 2018 and cash flows used in discontinued operations were $6 million for the six months ended June 30, 2017. Unless otherwise noted, the information in the notes to the condensed consolidated financial statements relates to our continuing operations.
New Accounting Standards and Disclosures
Revenue Recognition
In May 2014, the Financial Accounting Standards Board (“FASB”) issued Accounting Standard Updated (“ASU”) 2014-09, “Revenue from Contracts with Customers” to replace existing revenue recognition rules with a single comprehensive model to use in accounting for revenue arising from contracts with customers. Under this ASU and the associated subsequent amendments (collectively, “ASC 606”), revenue is recognized when a customer obtains control of promised goods or services for an amount that reflects the consideration the entity expects to receive in exchange for those goods or services. In addition, ASC 606 requires expanded disclosure of the nature, amount, timing and uncertainty of revenue and cash flows arising from contracts with customers.
We adopted ASC 606 on January 1, 2018 utilizing the modified retrospective method. We recognized a $16 million reduction to retained earnings and a $9 million reduction to noncontrolling interest on January 1, 2018 for the cumulative effect adjustment related to contracts in process but not substantially complete as of that date. We reflected the aggregate impact of all modifications executed and effective as of January 1, 2018 in applying the new standard to these contracts. The cumulative effect adjustment is primarily related to the period over which revenue is recognized on contracts within our Logistics segment for which our customers pay minimum throughput volume commitments and clawback provisions apply. We also made immaterial adjustments associated with our gift card program and franchise fees. Additionally, upon the adoption of ASC 606, the gross versus net presentation of certain contractual arrangements and taxes has changed as further described in Note 12. The current period results and balances are presented in accordance with ASC 606, while comparative periods continue to be presented in accordance with the accounting standards in effect for those periods.
For the three and six months ended June 30, 2018, we recorded lower revenues of $315 million and $566 million, respectively, and correspondingly $315 million and $566 million lower cost of materials and other, respectively, for presentation impacts of applying ASC 606. These presentation impacts were primarily associated with netting excise and other related taxes in our Marketing segment as described in Note 12. We recorded an additional $3 million and $5 million in revenues during the three and six months ended June 30, 2018, respectively, primarily related to the minimum throughput volume commitments in our Logistics segment discussed above as a result of applying the new standard. There were no material impacts during the period to the condensed consolidated balance sheet or condensed statement of consolidated cash flows, as a result of the adoption.
Leases
In February 2016, the FASB issued ASU 2016-02, “Leases” (“ASU 2016-02”), which amends existing accounting standards for lease accounting and adds additional disclosures about leasing arrangements. Under the new guidance, lessees are required to recognize right-of-use assets and lease liabilities on the balance sheet for all leases with terms longer than 12 months. Leases will be classified as either a financing lease or operating lease, with classification affecting the pattern of expense recognition in the income statement and presentation of cash flows in the statement of cash flows. The new standard also requires additional disclosures to help financial statement users better understand the amount, timing, and uncertainty of cash flows arising from leases. ASU 2016-02 is effective for annual reporting periods beginning after December 15, 2018, and interim reporting periods within those annual reporting periods. Early adoption is permitted and in the original guidance the modified retrospective application was required, however, in July 2018 the FASB issued ASU 2018-11 which permits entities with another transition method in which the effective date would be the date of initial application of transition. Under this optional transition method, we would recognize a cumulative-effect adjustment to the opening balance of retained earnings in the period of adoption. We expect to elect the optional transition method.
8 | | | |
Notes to Condensed Consolidated Financial Statements (Unaudited) | ||
We are progressing through our implementation plan, which includes the following activities; designing and implementing a new lease accounting system, designing new business processes and related internal controls, extracting the required accounting and reporting data from our lease agreements as well as the continued assessment and documentation of the accounting impacts related to the new standard. In addition, we continue to work with the industry group on certain areas and assess the impacts as consensus continues to be formed. While we are still working through our implementation plan, we do expect that the recognition of right-of-use assets and lease liabilities, which are not currently reflected on our condensed consolidated balance sheets, will have a material impact on total assets and liabilities. However, we do not expect the adoption of the standard to have a material impact on our condensed statements of consolidated operations or liquidity. At this time, we are unable to estimate the full impact of the standard until we progress further through our plan and the industry reaches a consensus on certain industry specific issues.
Credit Losses
In June 2016, the FASB issued ASU 2016-13, “Measurement of Credit Losses on Financial Instruments” (“ASU 2016-13”), which amends guidance on the impairment of financial instruments. The ASU requires the estimation of credit losses based on expected losses and provides for a simplified accounting model for purchased financial assets with credit deterioration. ASU 2016-13 is effective for annual reporting periods beginning after December 15, 2019, and interim reporting periods within those annual reporting periods. Early adoption is permitted for annual reporting periods beginning after December 15, 2018. While we are still evaluating the impact of ASU 2016-13, we do not expect the adoption of this standard to have a material impact on our financial statements.
Pension and Postretirement Costs
In March 2017, the FASB issued ASU 2017-07, “Improving the Presentation of Net Periodic Pension Cost and Net Periodic Postretirement Benefit Cost” (“ASU 2017-07”), which requires the current service-cost component of net benefit costs to be presented similarly with other current compensation costs for related employees on the statements of consolidated operations, and stipulates that only the service cost component of net benefit costs is eligible for capitalization. The Company will present other components of net benefit costs elsewhere on the statements of consolidated operations as discussed further in Note 8. The amendments to the presentation of the statements of consolidated operations in this update should be applied retrospectively while the change in capitalized benefit cost is to be applied prospectively. We adopted ASU 2017-07 as of January 1, 2018. Adoption of the standard resulted in an increase to operating expenses of $1 million and $2 million respectively, and interest and financing costs of $9 million and $18 million respectively, with a corresponding decrease to general and administrative expenses of $1 million and $2 million, respectively, and an increase to other income of $9 million and $18 million, respectively, for the three and six months ended June 30, 2017. There was no impact to net earnings and ASU 2017-07 does not impact the consolidated balance sheets or statements of consolidated cash flows.
Stock-based Compensation
In May 2017, the FASB issued ASU 2017-09, “Compensation - Stock Compensation (Topic 718): Scope of Modification Accounting” (“ASU 2017-09”), which provides guidance about which changes to the terms or conditions of a share-based payment awarded require an entity to apply modification accounting. The amendments in ASU 2017-09 are to be applied prospectively to an award modified on or after the adoption date. As such, the impact of ASU 2017-09 is dependent on whether we modify any share-based payment awards and the nature of such modifications. We adopted ASU 2017-09 as of January 1, 2018 with no impact on our financial statements.
Derivatives and Hedging
In August 2017, the FASB issued ASU 2017-12, “Derivatives and Hedging (Topic 815): Targeted Improvements to Accounting for Hedging Activities” (“ASU 2017-12”), which amends and simplifies existing guidance to more accurately present the economic effects of risk management activities in the financial statements. ASU 2017-12 is effective for interim and annual reporting periods beginning after December 15, 2018. Early adoption is permitted. While we are still evaluating the impact of ASU 2017-12, we do not expect the adoption of this standard to have a material impact on our financial statements.
Comprehensive Income
In February 2018, the FASB issued ASU 2018-02, “Income Statement-Reporting Comprehensive Income (Topic 220): Reclassification of Certain Tax Effects from Accumulated Other Comprehensive Income” (“ASU 2018-02”), which allows a reclassification of recorded amounts from accumulated other comprehensive income to retained earnings for the adjustment of deferred taxes due to the reduction of the historical corporate income tax rate to the newly enacted corporate income tax rate resulting from the U.S. tax law changes enacted in December 2017. It also requires certain disclosures about these reclassifications. ASU 2018-02 is effective for fiscal years beginning after December 15, 2018, and interim periods within those fiscal years, with early adoption permitted. The new guidance must be applied either on a prospective basis in the period of adoption or retrospectively to each period (or periods) in which the effect of the change in the U.S. federal corporate income tax rate in the U.S. tax law changes are recognized. While we are still evaluating the impact of ASU 2018-02, we do not expect the adoption of this standard to have a material impact on our financial statements.
June 30, 2018 | 9 | ||
Notes to Condensed Consolidated Financial Statements (Unaudited) | ||
Note 2 - Acquisitions
Western Refining Acquisition
On June 1, 2017, we completed the Western Refining Acquisition. Based on our $83.25 per share closing stock price on June 1, 2017, the aggregate value of consideration paid to Western Refining shareholders was $4.0 billion, including approximately $3.6 billion of our stock and approximately $424 million of cash, including cash payable upon accelerated vesting of Western Refining equity awards. The cash portion of the purchase price, along with the settlement of $1.6 billion of certain Western Refining debt and other transaction related costs, was funded using cash on hand and $575 million of funds drawn on the Andeavor Revolving Credit Facility.
We accounted for the Western Refining Acquisition using the acquisition method of accounting, which requires, among other things, that assets acquired at their fair values and liabilities assumed be recognized on the balance sheet as of the acquisition date. The purchase price allocation for the Western Refining Acquisition is complete and has been allocated based on the fair values of the assets acquired and liabilities assumed at the acquisition date. During the six months ended June 30, 2018, we recorded adjustments to our allocation to increase other noncurrent liabilities by $32 million, property, plant and equipment by $22 million and deferred income taxes by $3 million offset by decreases in accounts payable of $13 million and accrued liabilities of $3 million.
Acquisition Date Purchase Price Allocation (in millions)
Cash | $ | 159 | |
Receivables | 510 | ||
Inventories | 805 | ||
Prepayments and Other Current Assets | 212 | ||
Property, Plant and Equipment (a) | 3,486 | ||
Goodwill | 2,948 | ||
Acquired Intangibles | 315 | ||
Other Noncurrent Assets | 162 | ||
Accounts Payable | (688 | ) | |
Accrued Liabilities | (267 | ) | |
Current Portion of Long-term Debt | (12 | ) | |
Deferred Income Taxes | (721 | ) | |
Debt | (2,092 | ) | |
Other Noncurrent Liabilities | (118 | ) | |
Noncontrolling Interest | (719 | ) | |
Total purchase price | $ | 3,980 | |
(a) | Estimated useful lives ranging from 3 to 28 years have been assumed based on the valuation. |
Goodwill
Andeavor evaluated several factors that contributed to the amount of goodwill presented above. These factors include the acquisition of an existing integrated refining, marketing and logistics business located in areas with access to cost-advantaged feedstocks with an assembled workforce that cannot be duplicated at the same costs by a new entrant. Further, the Western Refining Acquisition provides a platform for future growth through operating efficiencies Andeavor expects to gain from the application of best practices across the combined company and an ability to realize synergies from the geographic diversification of Andeavor’s business and rationalization of general and administrative costs. The amount of goodwill by reportable segment is as follows: Marketing $282 million, Logistics $707 million and Refining $1.96 billion. Approximately $1.98 billion of the $2.95 billion in goodwill resulting from the tax-free merger with Western Refining is non-deductible for tax purposes. As a result of prior acquisitions, Western Refining has tax-deductible goodwill, in which we received carryover basis, providing tax deductibility for approximately $970 million of the $2.95 billion in goodwill that otherwise would not be deductible.
10 | | | |
Notes to Condensed Consolidated Financial Statements (Unaudited) | ||
Property, Plant and Equipment
The fair value of property, plant and equipment is $3.5 billion. This fair value is based on the valuation using a combination of the income, cost and market approaches. The useful lives of acquired assets have been aligned to similar assets at Andeavor.
Acquired Intangible Assets
The fair value of the acquired identifiable intangible assets is $315 million. This fair value is based on the valuation completed for the business enterprise, along with the related tangible assets, using a combination of the income method, cost method and comparable market transactions. We recognized intangible assets associated with customer relationships, franchise rights and favorable leases, all of which will be amortized over a definite-life. We also recognized an intangible asset of $38 million related to liquor licenses and $113 million related to trade names, both of which have indefinite lives. We considered the assets' historical accounting by Western Refining, our plans for the continued use and marketing of the assets, and how a market participant would use the assets in determining whether the intangible assets have an indefinite or definite life. We amortize acquired intangibles with finite lives on a straight-line basis over a weighted average useful life of 13 years, and we include the amortization in depreciation and amortization expenses on our condensed statement of consolidated operations. The gross carrying value of our finite life intangibles acquired from the Western Refining Acquisition was $164 million and the accumulated amortization was $14 million as of June 30, 2018. Amortization expense is expected to be $13 million per year for the next five years related to the Western Refining acquired intangible assets.
Contingencies
We assumed environmental, legal and asset retirement obligation liabilities of $49 million in the Western Refining Acquisition. This represents an increase of $30 million during the six months ended June 30, 2018.
Interests in Western Refining Logistics and Minnesota Pipe Line Company
With the Western Refining Acquisition, we acquired a controlling interest in Western Refining Logistics, LP (“WNRL”). The fair value of the non-controlling interest in WNRL is based on the unit price, units outstanding and the percent of public unitholders of WNRL on June 1, 2017. The October 30, 2017 merger between Andeavor Logistics and WNRL in which all WNRL outstanding common units were exchanged for common units in Andeavor Logistics did not impact the fair value of non-controlling interest. Additionally, we acquired a 17% common equity interest in Minnesota Pipe Line Company, LLC (“MPL”). We are accounting for our investment in MPL under the equity method of accounting given our ability to exercise significant influence over MPL.
Acquisition Costs
There were no material acquisition, severance or retention costs incurred in the three and six and months ended June 30, 2018 related to the Western Refining Acquisition. As it relates to severance and retention costs, we had $13 million recognized in accrued liabilities remaining to be paid at June 30, 2018.
Western Refining Revenues and Earnings Before Income Taxes
For the period from January 1, 2018 through June 30, 2018, we recognized $6.8 billion in revenues and $343 million of earnings before income taxes related to the business acquired. The earnings before income taxes for the period include related acquisition and severance costs along with interest expense incurred related to the acquisition.
Pro Forma Financial Information
The following unaudited pro forma information combines the historical operations of Andeavor and Western Refining, giving effect to the Merger and related transactions as if they had been consummated on January 1, 2017, the beginning of the earliest period presented.
Pro Forma Consolidated Revenues and Consolidated Net Earnings (in millions)
Three Months Ended | Six Months Ended | ||||||
June 30, 2017 | June 30, 2017 | ||||||
Revenues | $ | 9,591 | $ | 18,581 | |||
Net earnings | 215 | 326 | |||||
June 30, 2018 | 11 | ||
Notes to Condensed Consolidated Financial Statements (Unaudited) | ||
Rangeland Energy
On January 19, 2018, Andeavor completed its announced acquisition of 100% of the equity of Rangeland. Rangeland, which includes a 67% interest in RIO, owns and operates assets in the Delaware and Midland Basins in New Mexico and Texas, including the recently constructed RIO crude oil pipeline, three crude oil storage terminals, a frac sand storage and truck loading facility. Andeavor funded the acquisition using the Andeavor Revolving Credit Facility. This acquisition is not material to our consolidated financial statements and its operating results are recognized in our Logistics segment.
SLC Core Pipeline System
On May 1, 2018, Andeavor Logistics completed its acquisition of the SLC Core Pipeline System (formerly referred to as the Wamsutter Pipeline System) from Plains All American Pipeline, L.P. The system consists of pipelines that transport crude oil to another third-party pipeline system that supplies the Salt Lake City area refineries, including our Salt Lake City refinery. Andeavor Logistics financed the acquisition using the Andeavor Logistics Revolving Credit Facility. This acquisition is not material to our consolidated financial statements and its operating results are recognized in our Logistics segment.
West Coast Asphalt Terminals
On May 21, 2018, Andeavor acquired the West Coast asphalt terminals of Delek US Holdings, Inc. The assets acquired include four wholly-owned asphalt terminals in California and Arizona as well as a terminal in Nevada that is held in a 50% joint venture. Andeavor financed the acquisition using the Andeavor Revolving Credit Facility. This acquisition is not material to our consolidated financial statements and its operating results are recognized in our Refining segment.
Note 3 - Inventories
Components of Inventories (in millions)
June 30, 2018 | December 31, 2017 | ||||||
Domestic crude oil and refined products | $ | 3,219 | $ | 3,203 | |||
Materials and supplies | 218 | 229 | |||||
Oxygenates and by-products | 72 | 85 | |||||
Merchandise | 60 | 50 | |||||
Foreign subsidiary crude oil and refined products | 84 | 63 | |||||
Total Inventories | $ | 3,653 | $ | 3,630 | |||
At June 30, 2018 and December 31, 2017, the replacement cost of our crude oil and refined product inventories exceeded carrying value, both in the aggregate, by approximately $1.2 billion and $703 million, respectively.
Note 4 - Investments - Equity Method and Joint Ventures
We have the ability to exercise significant influence over each of the following investments through our participation in the management committees, which have the ability to make decisions that are significant to the entities. However, since we have equal or proportionate influence over each committee as a joint interest partner, we have determined that these entities should not be consolidated and apply the equity method of accounting with respect to our investments in each entity.
We own a 51% interest in Watson Cogeneration Company (“Watson”), which produces steam and electricity at a facility located at our Los Angeles refinery. We also own a 17% interest in MPL, which owns and operates a crude oil pipeline in Minnesota. Following the acquisition of Rangeland in early 2018, we own a 67% interest in RIO, a recently constructed crude oil pipeline located in the Delaware and Midland basins in west Texas. On May 21, 2018, we acquired the West Coast asphalt terminals, which included a 50% interest in the Paramount Nevada Asphalt Company (“PNAC”) joint venture.
Andeavor Logistics has a 78% interest in RGS, which owns and operates the infrastructure that transports gas from certain fields to several re-delivery points in southwestern Wyoming, including natural gas processing facilities that are owned by Andeavor Logistics or a third party. Andeavor Logistics also owns a 50% interest in Three Rivers Gathering, LLC (“TRG”), which operates natural gas gathering assets in the southeastern Uinta Basin, as well as a 38% interest in Uintah Basin Field Services, L.L.C. (“UBFS”), which owns and operates the natural gas gathering infrastructure located in the southeastern Uinta Basin and is operated by Andeavor Logistics.
12 | | | |
Notes to Condensed Consolidated Financial Statements (Unaudited) | ||
On April 24, 2018, we announced a 25% participation in the Gray Oak Pipeline joint venture. The Gray Oak Pipeline will provide crude oil transportation from West Texas to destinations in the Corpus Christi, Sweeny and Freeport areas. In addition, we announced a 25% participation in the South Texas Gateway Terminal with Buckeye Partners, LP to develop a deep-water, open access marine terminal in Ingleside, Texas. The South Texas Gateway Terminal includes crude oil storage capacity and will serve as an outlet for crude oil and condensate volumes delivered from the Gray Oak Pipeline.
Equity Method Investments (in millions)
Balance at December 31, 2017 (a) | Fair value of acquired interest | Investments in joint ventures | Equity in earnings | Cumulative effect of accounting standard adoption | Distributions received | Balance at June 30, 2018 (a) | |||||||||||||||||||||
Watson | $ | 78 | $ | — | $ | — | $ | 2 | $ | — | $ | (3 | ) | $ | 77 | ||||||||||||
Gray Oak Pipeline | — | — | 23 | — | — | — | 23 | ||||||||||||||||||||
South Texas Gateway Terminal | — | — | 14 | — | — | — | 14 | ||||||||||||||||||||
RIO | — | 159 | — | 4 | — | — | 163 | ||||||||||||||||||||
PNAC | — | 27 | — | — | — | — | 27 | ||||||||||||||||||||
MPL | 120 | — | — | 10 | — | (10 | ) | 120 | |||||||||||||||||||
RGS | 268 | — | — | 3 | — | (10 | ) | 261 | |||||||||||||||||||
TRG | 37 | — | — | 1 | (3 | ) | (3 | ) | 32 | ||||||||||||||||||
UBFS | 15 | — | — | 1 | — | (1 | ) | 15 | |||||||||||||||||||
Total | $ | 518 | $ | 186 | $ | 37 | $ | 21 | $ | (3 | ) | $ | (27 | ) | $ | 732 | |||||||||||
(a) | The carrying amount of our investments in Watson, RIO, PNAC, MPL, RGS, TRG and UBFS exceeded the underlying equity in net assets by $61 million, $75 million, $18 million, $34 million, $128 million, $15 million and $6 million, respectively, at June 30, 2018. There was no difference between the carrying amount of our investments and the underlying equity in net assets for the Gray Oak Pipeline and the South Texas Gateway Terminal joint ventures at June 30, 2018. The carrying amount of our investments in Watson, MPL, RGS, TRG and UBFS exceeded the underlying equity in net assets by $62 million, $35 million $130 million, $15 million and $6 million, respectively, at December 31, 2017. The carrying amounts of our investments allocated to tangible assets that exceed the underlying equity in net assets are amortized over the useful life of the underlying fixed assets and included in equity in earnings. |
Note 5 - Derivative Instruments
In the ordinary course of business, our profit margins, earnings and cash flows are impacted by the timing, direction and overall change in pricing for commodities used throughout our operations. We use non-trading derivative instruments to manage our exposure to the following:
• | price risks associated with the purchase or sale of feedstocks, refined products and energy supplies related to our refineries, terminals, marketing fuel inventory and customers; |
• | price risks associated with inventories above or below our target levels; |
• | future emission credit requirements; and |
• | exchange rate fluctuations on our purchases of Canadian crude oil. |
Our accounting for derivative instruments depends on whether the underlying commodity will be used or sold in the normal course of business. For contracts where the crude oil or refined products are expected to be used or sold in the normal course of business, we apply the normal purchase normal sale exception and follow the accrual method of accounting. All other derivative instruments are recorded at fair value using mark-to-market accounting. We did not designate any of our derivatives for hedge accounting during the six months ended June 30, 2018 and 2017.
Our derivative instruments can include Forward Contracts, Futures Contracts, Over-the-Counter swaps, including Swap Contracts, Options, and OTC Option Contracts. Forward Contracts are agreements to buy or sell the commodity at a predetermined price at a specified future date. Futures Contracts are standardized agreements, traded on a futures exchange, to buy or sell the commodity at a predetermined price at a specified future date. Options provide the right, but not the obligation to buy or sell the commodity at a specified price in the future. Swap Contracts and OTC Option Contracts require cash settlement for the commodity based on the difference between a contracted fixed or floating price and the market price on the settlement date. Certain of these contracts require cash collateral to be received or paid if our asset or liability position, respectively, exceeds specified thresholds. We believe that we have minimal credit risk with respect to our counterparties.
June 30, 2018 | 13 | ||
Notes to Condensed Consolidated Financial Statements (Unaudited) | ||
The following table presents the fair value of our derivative instruments as of June 30, 2018 and December 31, 2017. The fair value amounts below are presented on a gross basis and do not reflect the netting of asset and liability positions permitted under the terms of our master netting arrangements including cash collateral on deposit with, or received from, brokers. We offset the recognized fair value amounts for multiple derivative instruments executed with the same counterparty in our financial statements when a legal right of offset exists. As a result, the asset and liability amounts below will not agree with the amounts presented in our consolidated balance sheets.
Derivative Assets and Liabilities (in millions)
Derivative Assets | Derivative Liabilities | |||||||||||||||
Balance Sheet Location | June 30, 2018 | December 31, 2017 | June 30, 2018 | December 31, 2017 | ||||||||||||
Commodity Futures Contracts | Prepayments and other current assets | $ | 1,025 | $ | 780 | $ | 1,012 | $ | 807 | |||||||
Commodity Swap Contracts | Prepayments and other current assets | 120 | 48 | 103 | 63 | |||||||||||
Commodity Swap Contracts | Receivables | 3 | 15 | — | — | |||||||||||
Commodity Swap Contracts | Accounts payable | — | — | 20 | 24 | |||||||||||
Commodity Options Contracts | Prepayments and other current assets | — | — | 5 | 2 | |||||||||||
Commodity Forward Contracts | Receivables | 1 | 2 | — | — | |||||||||||
Commodity Forward Contracts | Accounts payable | — | — | 1 | — | |||||||||||
Total Gross Mark-to-Market Derivatives | 1,149 | 845 | 1,141 | 896 | ||||||||||||
Less: Counterparty Netting | (1,102 | ) | (813 | ) | (1,102 | ) | (813 | ) | ||||||||
Add back: Cash Collateral | 7 | 67 | — | — | ||||||||||||
Total Net Fair Value of Derivatives | $ | 54 | $ | 99 | $ | 39 | $ | 83 | ||||||||
Net Gains on Mark-to-Market Derivatives (in millions)
Three Months Ended June 30, | Six Months Ended June 30, | ||||||||||||||
2018 | 2017 | 2018 | 2017 | ||||||||||||
Commodity Contracts | $ | 15 | $ | 92 | $ | 28 | $ | 120 | |||||||
Foreign Currency Forward Contracts | (2 | ) | — | (1 | ) | — | |||||||||
Total Net Gain on Mark-to-Market Derivatives | $ | 13 | $ | 92 | $ | 27 | $ | 120 | |||||||
Income Statement Location of Net Gains on Mark-to-Market Derivatives (in millions)
Three Months Ended June 30, | Six Months Ended June 30, | ||||||||||||||
2018 | 2017 | 2018 | 2017 | ||||||||||||
Revenues | $ | 1 | $ | 1 | $ | 2 | $ | 9 | |||||||
Cost of materials and other | 14 | 91 | 26 | 111 | |||||||||||
Other income, net | (2 | ) | — | (1 | ) | — | |||||||||
Total Net Gain on Mark-to-Market Derivatives | $ | 13 | $ | 92 | $ | 27 | $ | 120 | |||||||
14 | | | |
Notes to Condensed Consolidated Financial Statements (Unaudited) | ||
Open Long (Short) Positions
Outstanding Commodity and other Contracts (units in thousands)
Contract Volumes by Year of Maturity | Unit of Measure | ||||||
Mark-to-Market Derivative Instrument | 2018 | 2019 | 2020 | ||||
Crude oil, refined products and blending products: | |||||||
Futures Contracts - long | 2,636 | 259 | 20 | Barrels | |||
Swap Contracts - long | 1,218 | 610 | — | Barrels | |||
Swap Contracts - short | (1,525) | (620) | — | Barrels | |||
Forwards - short | (574) | — | — | Barrels | |||
Corn: | |||||||
Futures Contracts - short | (310) | — | — | Bushels | |||
Soybean oil: | |||||||
Futures Contracts - short | (5,700) | — | — | Pounds | |||
Note 6 - Fair Value Measurements
We classify financial assets and liabilities according to the fair value hierarchy. Financial assets and liabilities classified as level 1 instruments are valued based on quoted prices in active markets for identical assets and liabilities. Level 2 instruments are valued based on quoted prices for similar assets and liabilities in active markets, and inputs other than quoted prices, such as liquidity, that are observable for the asset or liability. Our level 2 instruments include derivatives valued using market quotations from independent price reporting agencies, third-party brokers and commodity exchange price curves that are corroborated with market data. Level 3 instruments are valued using significant unobservable inputs that are not supported by sufficient market activity. We do not have any financial assets or liabilities classified as level 3 at June 30, 2018 or December 31, 2017.
Our financial assets and liabilities measured at fair value on a recurring basis include derivative instruments. Additionally, our financial liabilities include obligations for Renewable Identification Numbers (“RINs”) and cap and trade emission credits for the state of California (together with RINs, our “Environmental Credit Obligations”). See Note 5 for further information on our derivative instruments. Amounts presented below for Environmental Credit Obligations represent the estimated fair value amount at each balance sheet date for which we do not have sufficient RINs and California cap and trade credits to satisfy our obligations to the U.S. Environmental Protection Agency (“EPA") and the state of California, respectively.
Financial Assets and Liabilities at Fair Value (in millions)
June 30, 2018 | |||||||||||||||||||
Level 1 | Level 2 | Level 3 | Netting and Collateral (a) | Total | |||||||||||||||
Assets: | |||||||||||||||||||
Commodity Futures Contracts | $ | 1,025 | $ | — | $ | — | $ | (996 | ) | $ | 29 | ||||||||
Commodity Swap Contracts | — | 123 | — | (99 | ) | 24 | |||||||||||||
Commodity Options Contracts | — | — | — | — | — | ||||||||||||||
Commodity Forward Contracts | — | 1 | — | — | 1 | ||||||||||||||
Total Assets | $ | 1,025 | $ | 124 | $ | — | $ | (1,095 | ) | $ | 54 | ||||||||
Liabilities: | |||||||||||||||||||
Commodity Futures Contracts | $ | 1,012 | $ | — | $ | — | $ | (1,003 | ) | $ | 9 | ||||||||
Commodity Swap Contracts | — | 123 | — | (99 | ) | 24 | |||||||||||||
Commodity Options Contracts | — | 5 | — | — | 5 | ||||||||||||||
Commodity Forward Contracts | — | 1 | — | — | 1 | ||||||||||||||
Environmental Credit Obligations | — | 204 | — | — | 204 | ||||||||||||||
Total Liabilities | $ | 1,012 | $ | 333 | $ | — | $ | (1,102 | ) | $ | 243 | ||||||||
June 30, 2018 | 15 | ||
Notes to Condensed Consolidated Financial Statements (Unaudited) | ||
December 31, 2017 | |||||||||||||||||||
Level 1 | Level 2 | Level 3 | Netting and Collateral (a) | Total | |||||||||||||||
Assets: | |||||||||||||||||||
Commodity Futures Contracts | $ | 780 | $ | — | $ | — | $ | (707 | ) | $ | 73 | ||||||||
Commodity Swap Contracts | — | 63 | — | (39 | ) | 24 | |||||||||||||
Commodity Forward Contracts | — | 2 | — | — | 2 | ||||||||||||||
Total Assets | $ | 780 | $ | 65 | $ | — | $ | (746 | ) | $ | 99 | ||||||||
Liabilities: | |||||||||||||||||||
Commodity Futures Contracts | $ | 807 | $ | — | $ | — | $ | (774 | ) | $ | 33 | ||||||||
Commodity Swap Contracts | — | 87 | — | (39 | ) | 48 | |||||||||||||
Commodity Options Contracts | — | 2 | — | — | 2 | ||||||||||||||
Environmental Credit Obligations | — | 43 | — | — | 43 | ||||||||||||||
Total Liabilities | $ | 807 | $ | 132 | $ | — | $ | (813 | ) | $ | 126 | ||||||||
(a) | Certain of our derivative contracts, under master netting arrangements, include both asset and liability positions. We offset both the fair value amounts and any related cash collateral amounts recognized for multiple derivative instruments executed with the same counterparty when there is a legally enforceable right and an intention to settle net or simultaneously. As of June 30, 2018 and December 31, 2017, we had provided cash collateral amounts of $7 million and $67 million, respectively, related to our unrealized derivative positions. Cash collateral amounts are netted with mark-to-market derivative assets. |
We believe the carrying value of our other financial instruments, including cash and cash equivalents, receivables, accounts payable and certain accrued liabilities approximate fair value. Our fair value assessment incorporates a variety of considerations, including the short-term duration of the instruments and the expected future insignificance of bad debt expense, which includes an evaluation of counterparty credit risk. The borrowings under the Revolving Credit Facility, the Andeavor Logistics Revolving Credit Facility and our Term Loan Credit Facility, which include variable interest rates, approximate fair value. The fair value of our fixed rate debt is based on prices from recent trade activity and is categorized in level 2 of the fair value hierarchy. The carrying value and fair value of our debt were $8.8 billion and $8.9 billion as of June 30, 2018, respectively, and $7.8 billion and $8.1 billion at December 31, 2017, respectively. These carrying and fair values of our debt do not consider the unamortized issuance costs, which are netted against our total debt.
Note 7 - Debt
Debt Balance, Net of Current Maturities and Unamortized Issuance Costs (in millions)
June 30, 2018 | December 31, 2017 | ||||||
Total debt (a) | $ | 8,832 | $ | 7,799 | |||
Unamortized issuance costs and premiums | (106 | ) | (114 | ) | |||
Current maturities | (28 | ) | (17 | ) | |||
Debt, Net of Current Maturities and Unamortized Issuance Costs | $ | 8,698 | $ | 7,668 | |||
(a) | Total debt related to Andeavor Logistics, which is non-recourse to Andeavor, except for TLGP, was $4.4 billion and $4.2 billion at June 30, 2018 and December 31, 2017, respectively. |
Available Capacity Under Credit Facilities (in millions)
Total Capacity | Amount Borrowed as of June 30, 2018 | Outstanding Letters of Credit | Available Capacity as of June 30, 2018 | Weighted Average Interest Rate | Expiration | |||||||||||||||
Andeavor Revolving Credit Facility | $ | 3,000 | $ | 855 | $ | 17 | $ | 2,128 | 3.88 | % | September 30, 2020 | |||||||||
Andeavor Logistics Revolving Credit Facility | 1,100 | 665 | — | 435 | 3.83 | % | January 29, 2021 | |||||||||||||
Andeavor Logistics Dropdown Credit Facility | 1,000 | — | — | 1,000 | — | % | January 29, 2021 | |||||||||||||
Letter of Credit Facilities | 975 | — | 123 | 852 | ||||||||||||||||
Total Credit Facilities | $ | 6,075 | $ | 1,520 | $ | 140 | $ | 4,415 | ||||||||||||
16 | | | |
Notes to Condensed Consolidated Financial Statements (Unaudited) | ||
Andeavor Logistics Revolving Credit Facility
On January 5, 2018, Andeavor Logistics amended the existing Andeavor Logistics Revolving Credit Facility and Andeavor Logistics Dropdown Credit Facility to increase the aggregate commitments under the Andeavor Logistics Revolving Credit Agreement from $600 million to $1.1 billion, add certain financial institutions as additional lenders under the Andeavor Logistics Revolving Credit Agreement and make certain changes to both the Andeavor Logistics Revolving Credit Facility and the Andeavor Logistics Dropdown Credit Facility to permit the incurrence of an additional $500 million of incremental loans (in the aggregate) under such facility agreements subject to the satisfaction of certain conditions.
Inventory Financing Arrangement
During the six months ended June 30, 2018, we entered into a $330 million financing arrangement with a third party that was secured by our crude oil inventory (“Inventory Financing Arrangement”). The Inventory Financing Arrangement was repaid in early April and had an effective interest rate of 6.7%. The Inventory Financing Arrangement is included within our financing activities on the condensed statements of consolidated cash flows for the six months ended June 30, 2018.
MPC Merger Agreement
Among other things, the MPC Merger Agreement prohibits the Company from incurring any additional indebtedness outside the ordinary course of business.
Note 8 - Benefit Plans
Components of Pension and Other Postretirement Benefit Expense (Income) (in millions)
Pension Benefits | |||||||||||||||
Three Months Ended June 30, | Six Months Ended June 30, | ||||||||||||||
2018 | 2017 | 2018 | 2017 | ||||||||||||
Service cost | $ | 17 | $ | 13 | $ | 34 | $ | 26 | |||||||
Interest cost | 8 | 8 | 17 | 16 | |||||||||||
Expected return on plan assets | (7 | ) | (7 | ) | (15 | ) | (14 | ) | |||||||
Recognized net actuarial loss | 7 | 6 | 15 | 11 | |||||||||||
Net Periodic Benefit Expense (a) | $ | 25 | $ | 20 | $ | 51 | $ | 39 | |||||||
Other Postretirement Benefits | |||||||||||||||
Three Months Ended June 30, | Six Months Ended June 30, | ||||||||||||||
2018 | 2017 | 2018 | 2017 | ||||||||||||
Service cost | $ | — | $ | — | $ | 1 | $ | 1 | |||||||
Interest cost | — | 1 | 1 | 1 | |||||||||||
Amortization of prior service credit | (7 | ) | (9 | ) | (15 | ) | (17 | ) | |||||||
Recognized net actuarial loss | 1 | 1 | 2 | 2 | |||||||||||
Net Periodic Benefit Income (a) | $ | (6 | ) | $ | (7 | ) | $ | (11 | ) | $ | (13 | ) | |||
(a) | Service cost is included in operating and general and administrative expenses and interest cost is included in interest and financing costs on the condensed statement of consolidated operations. The remaining components of net periodic benefit expense are included in other income. |
Western Refining Benefit Plans
We assumed all of Western Refining’s existing defined contribution and benefit plans as a result of the Merger. Effective January 1, 2018, Western Refining employees began participating in the Andeavor 401(k) and pension plans. Defined contribution assets from Western Refining plans have been moved to respective Andeavor defined contribution plans as of June 30, 2018. Andeavor has also received IRS approval to move forward with termination of the Northern Tier Energy Retirement Plan. The impact of the Western Refining benefit plans is immaterial to our financial statements.
Note 9 - Commitments and Contingencies
Litigation Matters
In the ordinary course of business, we may become party to lawsuits, administrative proceedings and governmental investigations, including environmental, regulatory and other matters. The outcome of these matters cannot always be predicted accurately, but we accrue liabilities for these matters if we have determined that it is probable a loss has been incurred and the
June 30, 2018 | 17 | ||
Notes to Condensed Consolidated Financial Statements (Unaudited) | ||
loss can be reasonably estimated. While it is not possible to predict the outcome of such proceedings, if one or more of them were decided against us, we believe there would be no material impact on our consolidated financial statements.
Environmental Matters
We are incurring and expect to continue to incur expenses for environmental remediation liabilities at a number of currently and previously owned or operated refining, pipeline, terminal and retail properties. While it is not possible to predict the outcome of such proceedings, if one or more of them were decided against us, we believe there would be no material impact on our consolidated financial statements.
On July 18, 2016, the U.S. Department of Justice (“DOJ”) lodged a complaint on behalf of the EPA and a Consent Decree with the Western District Court of Texas. Among other things, the Consent Decree required our Martinez refinery meet certain annual emission limits for NOx by July 1, 2018. In February 2018, we informed the EPA that we will need additional time to satisfy requirements of the Consent Decree. We are currently negotiating a resolution of this matter with the DOJ and the EPA, including the required timing to complete the project. These expenditures associated with the Consent Decree will not have a material impact on our liquidity, financial position or results of operations.
Tax Matters
We are subject to federal, state and foreign tax laws and regulations. Newly enacted tax laws and regulations, and changes in existing tax laws and regulations, could result in increased or decreased expenditures in the future. We are also subject to audits by federal, state and foreign taxing authorities in the normal course of business. It is possible that tax audits could result in claims against us in excess of recorded liabilities. However, we believe that resolution of any such claim(s) would not have a material impact on our consolidated financial statements.
As of June 30, 2018, we have not completed our accounting for the tax effects of enactment of the tax reform legislation (the “Tax Act”) enacted on December 22, 2017 (the “Enactment Date”); however, we have made a reasonable estimate of the effects on our existing deferred tax balances. The SEC issued Staff Accounting Bulletin No. 118 (“SAB 118”) in December 2017 to address the application of U.S. GAAP in situations when a registrant does not have the necessary information available, prepared or analyzed in reasonable detail to complete the accounting for certain income tax effects of the Tax Act. Among other things, SAB 118 provides for a period of up to twelve months from the Enactment Date to record the effects of the Tax Act. During the six months ended June 30, 2018, adjustments to the provisional income tax benefit recorded in December 2017 from the enactment of the Tax Act were not material. We may make adjustments to the provisional amount during the SAB 118 measurement period, which could result from future changes in interpretation of the Tax Act, changes to estimates made by us and/or issuance of additional regulatory guidance.
Note 10 - Stockholders’ Equity and Earnings Per Share
Changes to Equity (in millions)
Andeavor Stockholders’ Equity | Noncontrolling Interest | Total Equity | |||||||||
Balance at December 31, 2017 (a) | $ | 9,815 | $ | 3,600 | $ | 13,415 | |||||
Net earnings | 687 | 132 | 819 | ||||||||
Purchases of common stock | (258 | ) | — | (258 | ) | ||||||
Dividend payments | (181 | ) | — | (181 | ) | ||||||
Net effect of amounts related to equity-based compensation | 23 | 3 | 26 | ||||||||
Taxes paid related to net share settlement of equity awards | (23 | ) | — | (23 | ) | ||||||
Distributions to noncontrolling interest | — | (189 | ) | (189 | ) | ||||||
Transfers to (from) Andeavor paid-in capital related to: | |||||||||||
Andeavor Logistics’ issuance of common units | 21 | (35 | ) | (14 | ) | ||||||
Cumulative effect of accounting standard adoption | (16 | ) | (9 | ) | (25 | ) | |||||
Other | — | (3 | ) | (3 | ) | ||||||
Balance at June 30, 2018 (a) | $ | 10,068 | $ | 3,499 | $ | 13,567 | |||||
(a) | We have 5.0 million shares of preferred stock authorized with no par value per share. No shares of preferred stock were outstanding as of June 30, 2018 and December 31, 2017. |
18 | | | |
Notes to Condensed Consolidated Financial Statements (Unaudited) | ||
Earnings per share
We compute basic earnings per share by dividing net earnings attributable to Andeavor stockholders by the weighted average number of common shares outstanding during the period. Diluted earnings per share include the effects of potentially dilutive shares outstanding during the period.
Share Calculations (in millions)
Three Months Ended June 30, | Six Months Ended June 30, | ||||||||||
2018 | 2017 | 2018 | 2017 | ||||||||
Weighted average common shares outstanding | 151.1 | 130.8 | 152.0 | 124.0 | |||||||
Common stock equivalents | 1.5 | 0.9 | 1.5 | 1.0 | |||||||
Total Diluted Shares | 152.6 | 131.7 | 153.5 | 125.0 | |||||||
Potentially dilutive common stock equivalents are excluded from the calculation of diluted earnings per share if the effect of including such securities in the calculation would have been anti-dilutive. Anti-dilutive securities were 0.4 million and 0.3 million for the three and six months ended June 30, 2017, respectively. There were no material anti-dilutive securities for the three and six months ended June 30, 2018.
Share Repurchases
We are authorized by our Board of Directors (the “Board”) to purchase shares of our common stock in open market transactions at our discretion. The Board’s authorization has no time limit and may be suspended or discontinued at any time. Purchases of our common stock can also be made to offset the dilutive effect of stock-based compensation awards and to meet our obligations under employee benefit and compensation plans, including the exercise of stock options and vesting of restricted stock units and to fulfill other stock compensation requirements. During the six months ended June 30, 2018 and 2017, we repurchased approximately 2.6 million and 1.6 million shares of our common stock for approximately $258 million and $148 million, respectively. Among other things, the MPC Merger Agreement restricts the Company from issuing shares and purchasing any of our capital stock.
Cash Dividends
We paid cash dividends totaling $89 million and $181 million for the three and six months ended June 30, 2018, respectively, based on a $0.59 per share quarterly cash dividend on common stock. We paid cash dividends totaling $65 million and $130 million for the three and six months ended June 30, 2017, respectively, based on a $0.55 per share quarterly cash dividend on common stock. On August 3, 2018, our Board declared a cash dividend of $0.59 per share payable on September 14, 2018 to shareholders of record on August 31, 2018. Among other things, the MPC Merger Agreement allows the Company to continue paying a regular dividend up to $0.59 per share.
Note 11 - Stock-Based Compensation
Stock-Based Compensation Expense (Benefit) (in millions)
Three Months Ended June 30, | Six Months Ended June 30, | ||||||||||||||
2018 | 2017 | 2018 | 2017 | ||||||||||||
Market stock units (a) | $ | 7 | $ | 7 | $ | 14 | $ | 14 | |||||||
Performance share awards (b) | 3 | 3 | 5 | 8 | |||||||||||
Other stock-based awards (c) | 4 | 20 | 7 | 22 | |||||||||||
Total Stock-Based Compensation Expense | $ | 14 | $ | 30 | $ | 26 | $ | 44 | |||||||
(a) | We granted 0.5 million market stock units at a weighted average grant date fair value of $103.07 per unit under the amended and restated 2011 Long-Term Incentive Plan (“2011 Plan”) during the six months ended June 30, 2018. |
(b) | We granted 0.2 million market condition performance share awards at a weighted average grant date fair value of $107.51 per share under the 2011 Plan during the six months ended June 30, 2018. |
(c) | We have aggregated expense for certain award types as they are not considered significant, including awards issued by Andeavor Logistics. |
The income tax effect recognized in the income statement for stock-based compensation was a benefit of $4 million and $13 million for the three months ended June 30, 2018 and 2017, respectively, and $11 million and $33 million for the six months
June 30, 2018 | 19 | ||
Notes to Condensed Consolidated Financial Statements (Unaudited) | ||
ended June 30, 2018 and 2017, respectively. Included in the tax benefits were $1 million and $3 million of excess tax benefits from exercises and vestings for the three months ended June 30, 2018 and 2017, respectively, and $5 million and $17 million for the six months ended June 30, 2018 and 2017, respectively. The reduction in current taxes payable recognized from tax deductions resulting from exercises and vestings under all of our stock-based compensation arrangements totaled $1 million and $7 million for the three months ended June 30, 2018 and 2017, respectively, and $20 million and $32 million for the six months ended June 30, 2018 and 2017, respectively.
All outstanding equity awards from Western Refining and Northern Tier Energy LP (“NTI”) stock-based compensation plans were converted to Andeavor shares but remain under their respective Western Refining and NTI plans.
Note 12 - Revenues
We recognize revenue upon transfer of control of promised products or services to customers in an amount that reflects the consideration to which we expect to be entitled in exchange for those products or services. Revenue is recognized net of amounts collected from customers for taxes assessed by governmental authorities on, and concurrent with, specific revenue-producing transactions. This net presentation represents a change upon adoption of ASC 606 as we previously recognized excise and other related taxes associated with sales of gasoline and diesel within our Marketing segment on a gross basis.
Product Revenue
We generate product revenue from sales of transportation fuels and other refined products, crude oil and other feedstocks, residual products, and convenience store merchandise. Our sales of transportation fuels include gasoline and gasoline blendstocks, jet fuel, diesel fuel, heavy fuel oils, and other residual products that are produced primarily at our refineries. Within our Marketing segment, we sell gasoline and diesel fuel through retail, branded and unbranded channels of trade. Retail product revenues include sales of transportation fuels and convenience store merchandise to end consumers at company-owned or leased sites. Branded fuel sales are conducted through jobber/dealers with which we have a contract to sell fuels marketed under one of the various brands we use. Unbranded fuel sales are made under contract through third-party distributors or operators with no associated brand. Within our Logistics segment, we generate product revenue through the sale of natural gas liquids (“NGLs”), residue gas and condensate, using natural gas we acquire and process from producers. We record revenues for the sale of these NGLs and related products at market prices, and record the payments to producers at an agreed-upon percentage of the total sales proceeds as NGL expense, net of certain charges, which is presented within cost of materials and other in our condensed statements of consolidated operations. Within our Refining segment, we record transportation fuel sales, crude oil resales and other residual products through bulk arrangements and to export markets.
Our product sales arrangements are for specified goods for which enforceable rights and obligations are created when sales volumes are established, which typically occur as orders are issued or spot sales are made, but may be determined at contract inception. Each gallon, or other unit of measure of product, is separately identifiable and represents a distinct performance obligation to which the transaction price is allocated based on stand-alone selling price. We use observable market prices for fuel, feedstock and other fuel products, and cost-plus margin for convenience store merchandise, to determine the stand-alone selling price of each separate performance obligation. Product revenues are recognized at a point-in-time, which generally occurs upon delivery and transfer of title to the customer. Product sales are primarily generated from either spot sales or point-of-sale transactions for which variability associated with the transaction price is resolved at the time of sale, or from short term duration contracts for which any variability in transaction price is resolved within the reporting period. Payments for product sales are generally received either immediately or within 30 days from when control has transferred.
Service Revenue
Within our Logistics segment, we generate service revenue for gathering and transporting crude oil, natural gas and water; processing and fractionating natural gas and NGLs; and terminalling, transporting, and storing crude oil and refined products. We perform these services under various contractual arrangements with our customers, including fee-based arrangements, for which we receive fixed rate per unit of service we provide, and keep-whole arrangements, for which we receive a combination of fixed rate-per unit of cash consideration and non-cash consideration in the form of NGLs. For many of our fee-based arrangements where we gather or transport crude oil, refined products or natural gas for our customers, we require deficiency payments from our customers when they do not meet their minimum throughput volume commitments. Some of these contracts allow our customers to clawback all or a portion of prior deficiency payments over future periods.
We recognize service revenue over time, as customers simultaneously receive and consume the related benefits that we stand ready to provide. Revenue is recognized using an output measure, such as the throughput volume or capacity utilization, as these measures most accurately depict the satisfaction of our performance obligations. Where contracts contain variable pricing terms, the variability is either resolved within the reporting period, or the variable consideration is allocated to the specific unit of service to which it relates. Deficiency payments under contracts with clawback provisions are deferred and recognized as revenue as customers reclaim amounts by throughputting excess volumes. To the extent it is probable a customer will not recover all or a portion of the deficiency payment, the estimated residual deficiency is recognized ratably over the clawback period. Payments for services rendered are generally received no later than 60 days from month of service, with the exception of deficiency payments described above.
Within certain of our Logistics contracts, we are entitled to receive non-cash consideration for rendering services. For natural gas keep-whole arrangements, we have concluded that we control the NGL inventory extracted through our processing services,
20 | | | |
Notes to Condensed Consolidated Financial Statements (Unaudited) | ||
have inventory risk, discretion in establishing price, and the ability to direct the use and ultimate disposition of the NGLs. Thus, beginning January 1, 2018, we recognize service revenue for non-cash consideration received in the form of NGLs on a gross basis within revenues, and correspondingly, record NGL expense for the replacement gas we provide to our customers. The amounts are recognized at fair value at the date we obtain control of the respective unit of NGL. We assess fair value using the monthly average of published price reports for specific NGL products with consideration given to receipt point and grade of product.
Within our Marketing segment, we recognize franchise and royalty fee revenue from granting the license to use ARCO®, ampm® and SUPERAMERICA® retail convenience store brands. Franchise and royalty fee revenues are not material to our condensed consolidated financial statements.
Other Arrangements
We execute certain nonmonetary crude oil and refined product exchange transactions to optimize our refinery supply and enter into purchase and sale transactions with the same counterparty that are in contemplation of one another. These transactions are excluded from the scope of the new revenue standard and are recorded in cost of materials and other on a net basis.
We recognize rental revenue for retail sites we own or lease that are then leased and operated by third parties. These amounts are excluded from the scope of the new revenue standard and are not material to our condensed consolidated financial statements.
Customer Contract Assets
Our receivables are generated primarily from contracts with customers. Our payment terms vary by product or service type and channel of distribution. The period between invoicing and payment is not significant, and our assets associated with contracts with customers consist primarily of billed accounts receivable, which are included in Receivables, net of allowance for doubtful accounts in our condensed consolidated balance sheets. Our assets also include customer incentives, consisting primarily of branding payments made to owners of third party-owned retail sites. These customer incentives are included in other noncurrent assets in our condensed consolidated balance sheets and are amortized to revenue over the term of each contract, which generally ranges from 10 to 20 years.
Customer Contract Liabilities
For certain products or services, we receive payment in advance of when performance obligations are satisfied. These liabilities from contracts with customers consist primarily of payments for minimum volume commitments within our Logistics segment, receipts of cash for gift cards in our retail business, and other customer advances. Payments received from customers for minimum volume commitments and other customer advances are included in deferred income within other current liabilities and other noncurrent liabilities based on timing of expected recognition, which may extend up to fifteen years. Amounts received from gift card sales are included in accounts payable in the condensed consolidated balance sheets. During the three and six months ended June 30, 2018, we recognized $8 million and $28 million, respectively, in revenue from contract liabilities existing as of January 1, 2018.
Summary of Customer Contract Assets and Liabilities (in millions)
December 31, 2017 | Adjustments for ASC 606 | Balance at January 1, 2018 | June 30, 2018 | ||||||||||||
Receivables from contracts with customers | $ | 1,875 | $ | (34 | ) | $ | 1,841 | $ | 2,184 | ||||||
Other contract assets | — | 34 | 34 | 26 | |||||||||||
Deferred branding costs, net of amortization | 213 | — | 213 | 224 | |||||||||||
Deferred income, current | 9 | 10 | 19 | 13 | |||||||||||
Deferred income, noncurrent | 36 | 22 | 58 | 54 | |||||||||||
Gift card liability | 26 | (4 | ) | 22 | 20 | ||||||||||
The table above excludes balances associated with equity method investments. We recognized a cumulative adjustment of $3 million as a decrease to other noncurrent assets in our condensed consolidated balance sheet as of January 1, 2018 for the impacts related to TRG, as shown in Note 4. There were no material impacts to this balance during the six months ended June 30, 2018 due to the adoption.
June 30, 2018 | 21 | ||
Notes to Condensed Consolidated Financial Statements (Unaudited) | ||
Remaining Performance Obligations
We do not disclose the value of unsatisfied performance obligations for contracts with original expected terms of one year or less, or the value of variable consideration related to unsatisfied performance obligations when such values are not required to be estimated for purposes of allocation and recognition. Our revenues associated with remaining obligations under contracts with terms in excess of one year consist primarily of arrangements for which the customer has agreed to consideration based on minimum throughput volume commitments, fixed fees and revenues to be recognized from gift cards sold but not yet redeemed. As of June 30, 2018, we had $801 million of expected revenues from remaining performance obligations.
The future revenues from our Logistics segment’s service arrangements with fixed or minimum throughput volume commitments will be recognized over the period of performance to which the fixed fee or commitment relates, which primarily range from one year to fifteen years. Specific to our Marketing segment, our gift cards generally have no expiration date, although the amounts are expected to be substantially redeemed within two to four years. We expect approximately 75% of our total remaining performance obligations to be recognized in revenue within 5 years.
Disaggregation
We disaggregate our revenues by products and services, major product lines, and by channel of trade. For additional information regarding reportable segments, see Note 13.
Revenue Disaggregation by Product and Service (in millions)
Three Months Ended June 30, 2018 | Six Months Ended June 30, 2018 | ||||||||||||||||||||||
Marketing | Logistics | Refining | Marketing | Logistics | Refining | ||||||||||||||||||
Product Revenues | |||||||||||||||||||||||
Refined products (see further breakout below) | $ | 6,608 | $ | — | $ | 4,162 | $ | 12,059 | $ | — | $ | 7,609 | |||||||||||
Merchandise | 204 | — | — | 380 | — | — | |||||||||||||||||
Crude, NGL products and other | 25 | 27 | 1,280 | 56 | 97 | 2,236 | |||||||||||||||||
Total product revenues | 6,837 | 27 | 5,442 | 12,495 | 97 | 9,845 | |||||||||||||||||
Service revenues (see further breakout below) | 10 | 137 | 19 | 15 | 284 | 36 | |||||||||||||||||
Total Revenues | $ | 6,847 | $ | 164 | $ | 5,461 | $ | 12,510 | $ | 381 | $ | 9,881 | |||||||||||
Service Revenue Disaggregation by Type and Product Line (in millions)
Three Months Ended June 30, 2018 | |||||||||||||||
Logistics | |||||||||||||||
Marketing | Gathering and Processing | Terminalling and Transportation | Refining | ||||||||||||
Service Revenues | |||||||||||||||
Natural gas | $ | — | $ | 84 | $ | — | $ | — | |||||||
Crude oil and water | — | 28 | — | — | |||||||||||
Refined products | — | — | 20 | — | |||||||||||
Other | 10 | 5 | — | 19 | |||||||||||
Total Service Revenues | $ | 10 | $ | 117 | $ | 20 | $ | 19 | |||||||
Six Months Ended June 30, 2018 | |||||||||||||||
Logistics | |||||||||||||||
Marketing | Gathering and Processing | Terminalling and Transportation | Refining | ||||||||||||
Service Revenues | |||||||||||||||
Natural gas | $ | — | $ | 182 | $ | — | $ | — | |||||||
Crude oil and water | — | 53 | — | — | |||||||||||
Refined products | — | — | 38 | — | |||||||||||
Other | 15 | 11 | — | 36 | |||||||||||
Total Service Revenues | $ | 15 | $ | 246 | $ | 38 | $ | 36 | |||||||
22 | | | |
Notes to Condensed Consolidated Financial Statements (Unaudited) | ||
Refined Product Revenue Disaggregation by Sales Channel of Trade (in millions)
Three Months Ended June 30, 2018 | Six Months Ended June 30, 2018 | ||||||||||||||
Marketing | Refining | Marketing | Refining | ||||||||||||
Refined Products Revenues | |||||||||||||||
Transportation fuels: | |||||||||||||||
Retail and Branded | $ | 3,555 | $ | — | $ | 6,479 | $ | — | |||||||
Unbranded | 3,053 | 3,434 | 5,580 | 6,508 | |||||||||||
Other refined products | — | 728 | — | 1,101 | |||||||||||
Total Refined Products Revenues | $ | 6,608 | $ | 4,162 | $ | 12,059 | $ | 7,609 | |||||||
Note 13 - Operating Segments
The Company’s revenues are derived from three operating segments: Marketing, Logistics and Refining. We evaluate the performance of our segments based primarily on segment operating income and EBITDA. For the purposes of our operating segment disclosure, we present operating income as it is the most comparable measure to the amounts presented in our statements of consolidated operations. Segment operating income includes those revenues and expenses that are directly attributable to management of the respective segment. Marketing and Logistics revenues include intersegment transactions with our Refining segment. Corporate depreciation and corporate general and administrative expenses are excluded from segment operating income.
Segment Information Related to Continuing Operations (in millions)
Three Months Ended June 30, | Six Months Ended June 30, | ||||||||||||||
2018 | 2017 | 2018 | 2017 | ||||||||||||
Revenues | |||||||||||||||
Marketing: | |||||||||||||||
Fuel (a) | $ | 6,608 | $ | 4,873 | $ | 12,059 | $ | 8,956 | |||||||
Merchandise | 204 | 71 | 380 | 77 | |||||||||||
Other | 42 | 27 | 80 | 42 | |||||||||||
Intersegment sales | (7 | ) | — | (9 | ) | — | |||||||||
Logistics: | |||||||||||||||
Terminalling and transportation | 249 | 194 | 480 | 369 | |||||||||||
Gathering and processing | 294 | 242 | 589 | 487 | |||||||||||
Intersegment sales | (379 | ) | (202 | ) | (688 | ) | (405 | ) | |||||||
Refining: | |||||||||||||||
Refined products | 10,362 | 6,658 | 19,033 | 12,470 | |||||||||||
Crude oil resales and other | 1,299 | 391 | 2,272 | 635 | |||||||||||
Intersegment sales | (6,200 | ) | (4,405 | ) | (11,424 | ) | (8,144 | ) | |||||||
Total Revenues | $ | 12,472 | $ | 7,849 | $ | 22,772 | $ | 14,487 | |||||||
Segment Operating Income | |||||||||||||||
Marketing | $ | 209 | $ | 240 | $ | 337 | $ | 373 | |||||||
Logistics | 193 | 163 | 381 | 313 | |||||||||||
Refining | 607 | 45 | 812 | 79 | |||||||||||
Total Segment Operating Income | 1,009 | 448 | 1,530 | 765 | |||||||||||
Corporate and unallocated costs | (162 | ) | (228 | ) | (313 | ) | (350 | ) | |||||||
Intersegment eliminations | — | (2 | ) | — | (2 | ) | |||||||||
Operating Income | 847 | 218 | 1,217 | 413 | |||||||||||
Interest and financing costs, net | (109 | ) | (96 | ) | (211 | ) | (194 | ) | |||||||
Equity in earnings of equity method investments | 11 | 3 | 21 | 3 | |||||||||||
Other income, net | — | 18 | 10 | 29 | |||||||||||
Earnings Before Income Taxes | $ | 749 | $ | 143 | $ | 1,037 | $ | 251 | |||||||
June 30, 2018 | 23 | ||
Notes to Condensed Consolidated Financial Statements (Unaudited) | ||
Three Months Ended June 30, | Six Months Ended June 30, | ||||||||||||||
2018 | 2017 | 2018 | 2017 | ||||||||||||
Depreciation and Amortization Expenses | |||||||||||||||
Marketing | $ | 21 | $ | 15 | $ | 43 | $ | 28 | |||||||
Logistics | 83 | 68 | 162 | 126 | |||||||||||
Refining | 175 | 153 | 348 | 301 | |||||||||||
Corporate | 13 | 6 | 21 | 13 | |||||||||||
Intersegment eliminations | — | (2 | ) | — | (2 | ) | |||||||||
Total Depreciation and Amortization Expenses | $ | 292 | $ | 240 | $ | 574 | $ | 466 | |||||||
Capital Expenditures | |||||||||||||||
Marketing | $ | 17 | $ | 7 | $ | 30 | $ | 13 | |||||||
Logistics | 104 | 49 | 187 | 94 | |||||||||||
Refining | 253 | 154 | 565 | 286 | |||||||||||
Corporate | 8 | 57 | 20 | 100 | |||||||||||
Total Capital Expenditures | $ | 382 | $ | 267 | $ | 802 | $ | 493 | |||||||
(a) | Federal and state motor fuel excise taxes on sales by our Marketing segment at retail sites where we own the inventory are included in both revenues and cost of materials and other in our condensed statements of consolidated operations. These taxes totaled $153 million and $287 million for the three and six months ended June 30, 2017, respectively. Following the adoption of ASC 606, these taxes are now reported net within cost of materials and other and have no impact on revenues for the three and six months ended June 30, 2018. |
24 | | | |
Management’s Discussion and Analysis | ||
Item 2. Management’s Discussion and Analysis of Financial Condition and Results of Operations
Those statements in this section that are not historical in nature should be deemed forward-looking statements that are inherently uncertain. See “Important Information Regarding Forward-Looking Statements” for a discussion of the factors that could cause actual results to differ materially from those projected in these statements. This section should be read in conjunction with our Annual Report on Form 10-K for the year ended December 31, 2017.
Business Strategy and Overview
We are the leading integrated marketing, logistics and refining company in our strategic footprint and are driven to create value by operating an integrated business model. Our diversified and integrated portfolio of assets and operations provides us with strong growth opportunities across our value chains.
In recent years, we have implemented strategies to transform the composition of our portfolio of marketing, logistics and refining assets. In 2010, the majority of our operating income was generated through our Refining segment with only a small portion attributable to our previous retail segment and we did not have commercial logistics operations. However, in recent years, we have successfully implemented strategies to drive operational productivity improvements, organic growth and portfolio enhancing acquisitions. Identifying new value creation opportunities to grow the Company is core to our strategy. Our focused execution of this strategy has resulted in a transformation of the Company into a highly integrated, well diversified marketing, logistics and refining business. As of 2018, our Marketing segment continues to expand and our Logistics segment has grown significantly resulting in each having a larger and more balanced contribution to our operating results. We believe our integrated business model coupled with our Guiding Principles and Strategic Priorities will position us to create leading value for our investors.
Our Strategy and Goals
Execution of our strategy and the achievement of our goals across our business segments is driven by our commitment to our Guiding Principles and Strategic Priorities as outlined in our Annual Report on Form 10-K for the year ended December 31, 2017. The following discussion outlines how we create value across our integrated business segments.
Marketing
Our marketing operations provide a secure and ratable off-take of gasoline and diesel production from our refineries and allow us to enhance our margin capture as refined product moves through the value chain. We are driving growth and improvements in our Marketing segment by focusing on higher value, branded distribution channels, adding new retail sites to our network and implementing store improvements to enhance our convenience store position.
Logistics
Our Logistics segment includes assets that establish a market position that helps to minimize our transportation costs as well as maximize our overall performance by focusing on a stable, fee-based business. We achieve value by optimizing our existing asset base, pursuing organic expansion opportunities and growing through strategic acquisitions across our terminalling and transportation and gathering and processing businesses.
Refining
In our Refining segment, our strategy focuses on:
• | driving operational excellence enabling asset availability in excess of 97%; |
• | maintaining strict operating cost discipline; |
• | enhancing capital efficiency through superior execution; and |
• | maximizing capital productivity through process optimization including our ability to access regionally advantaged crude oil. |
To meet our strategic objectives, we invest in high return capital projects designed to enhance our feedstock flexibility, improve our yields and lower our costs. In addition to the above strategies and goals, we aim to execute on our strategic priorities to further create value for our shareholders through the achievement of annual improvements to operating income and the capturing of synergies associated with the Western Refining Acquisition.
June 30, 2018 | 25 | ||
Management’s Discussion and Analysis | ||
Accomplishments
Our goals are focused on our Strategic Priorities and, thus far, we have announced or accomplished the following in 2018:
High-Performing Culture | ||||||||
Operational Efficiency & Effectiveness | Value Chain Optimization | Financial Discipline | Value Driven Growth | |||||
Safety. Our Dickinson and Mandan refineries were named winners of American Fuel & Petrochemical Manufacturers Elite Silver Safety Award, which recognizes the top 5 percent of refineries in the industry for safety performance. | ü | |||||||
Andeavor Logistics Safety. Andeavor Logistics received the Safety Excellence Award from the International Liquid Terminals Association for the fifth consecutive year. The Safety Excellence Award recognizes member companies that achieve an average total recordable incident rate of 0.75 or less in a reporting year. | ü | |||||||
Rangeland Energy Acquisition. On January 19, 2018, we completed the acquisition of Rangeland, which owns and operates assets in the Delaware and Midland Basins in New Mexico and Texas and has a 67% joint interest in the RIO pipeline. | ü | ü | ||||||
Gray Oak Pipeline and South Texas Gateway Terminal Joint Ventures. On April 24, 2018, we announced our participation in a 25% joint venture in Gray Oak Pipeline and a 25% joint venture in the South Texas Gateway Terminal. | ü | ü | ||||||
SLC Core Pipeline Acquisition. On May 1, 2018, Andeavor Logistics completed its acquisition of the SLC Core Pipeline System, which consists of active pipelines that transport Inland crude oil to Salt Lake City refineries, including our Salt Lake City Refinery. | ü | ü | ||||||
West Coast Asphalt Terminal Acquisition. On May 21, 2018, we acquired five asphalt terminals on the west coast, including a 50% joint venture in one asphalt terminal. | ü | ü | ||||||
Marketing Growth. We added 54 Branded stations in Mexico, 22 Branded stations in the U.S. and converted 51 Retail MSO sites to company operated bringing the total converted MSO sites to 101 since the beginning of the fourth quarter of 2017. | ü | ü | ||||||
Mexico Investment. We announced plans to build a refined products terminal at a storage facility in Baja California. For a total investment of approximately $100 million, we will construct and operate the facility which is expected to reduce our cost to directly import fuels into Northwest Mexico. | ü | ü | ü | |||||
Mexico Growth. We announced we have been awarded additional refined product pipeline and storage capacity by Pemex Logística in Baja California Sur, Sinaloa, and Chihuahua. Additionally, we were awarded marine terminal use at three facilities in Baja California Sur and Sinaloa. | ü | ü | ü | |||||
Dickinson Refinery Renewable Diesel Project. We announced a project to convert the Dickinson Refinery to process 12,000 barrels per day of renewable feedstocks into renewable diesel fuel. | ü | ü | ü | |||||
Returning Capital to Shareholders. We returned approximately $439 million to shareholders through the repurchase of 2.6 million shares of our common stock for approximately $258 million and $181 million in dividends in the first half of 2018. | ü | |||||||
Andeavor Logistics Revolving Credit Facility. On January 5, 2018, Andeavor Logistics increased the aggregate commitments under the Andeavor Logistics Revolving Credit Agreement from $600 million to $1.1 billion. | ü | |||||||
Enterprise Resource Planning (“ERP”) Project Completion. On April 1, 2018, we implemented the first phases of our new ERP system, which has simplified and standardized our business processes and also streamlined our operations. In addition, we expect it to reduce costs and provide a platform for future growth. | ü | |||||||
Marathon Merger
On April 29, 2018, Andeavor and MPC entered into the MPC Merger Agreement under which MPC will acquire all of our outstanding shares. Our shareholders will have the option to receive in exchange for each share of Andeavor common stock they hold 1.87 shares of MPC stock, $152.27 in cash, or a combination of both, subject to a proration mechanism that will result in 15 percent of the shares of our common stock being exchanged for cash, and the remaining shares being exchanged for MPC stock. Following the MPC Merger, MPC and Andeavor shareholders will own approximately 66% and 34% of the combined
26 | | | |
Management’s Discussion and Analysis | ||
company, respectively. The transaction was unanimously approved by the boards of directors of both companies and is subject to regulatory and other customary closing conditions, including approvals from the shareholders of each company.
On July 3, 2018, we were notified that the waiting period with respect to the notification and report forms filed under the U.S. Hart-Scott-Rodino Antitrust Improvements Act of 1976 expired and we have received the necessary regulatory clearance in Canada. These matters satisfy certain conditions to the closing of the MPC Merger, but others remain.
Andeavor stockholders as of the Record Date were invited to attend a special meeting on September 24, 2018 to consider and vote upon a proposal to adopt the MPC Merger Agreement and other matters related to the MPC Merger. MPC stockholders as of the close of business on the Record Date were invited to attend a special meeting on September 24, 2018 to consider and vote upon a proposal to approve the issuance of MPC common stock in connection with the MPC Merger and other matters related to the MPC Merger. Pending approval of shareholders and customary closing conditions, we expect to close the strategic combination with MPC on October 1, 2018.
The transaction was valued at approximately $20.7 billion consisting of stock and cash consideration per MPC’s filed registration statement on Form S-4, as amended, which was declared effective August 3, 2018.
Logistics Assets Drop Down and Asset Transfer
We announced on August 6, 2018 that Andeavor Logistics agreed to acquire a portfolio of logistics assets from us for total consideration of $1.6 billion. The assets include gathering, storage and transportation assets in the Permian Region, including the RIO Pipeline, certain Western Refining’s assets and associated crude terminals and the majority of our remaining refining terminalling, transportation and storage assets. The drop down also includes the Conan Crude Oil Gathering System and the Los Angeles Refinery Interconnect Pipeline.
Andeavor Logistics paid $1.6 billion with $300 million in cash financed with borrowings on Andeavor Logistics’ revolving credit facilities and with approximately $1.3 billion in Andeavor Logistics common units issued for the drop down. The equity consideration increases our ownership of Andeavor Logistics from 59% to 64%.
Results of Operations
A discussion and analysis of the factors contributing to our results of operations is presented below. The accompanying condensed consolidated financial statements, together with the following information, are intended to provide investors with a reasonable basis for assessing our historical operations, but should not serve as the only criteria for predicting our future performance.
Items Impacting Comparability
On June 1, 2017, we closed the Western Refining Acquisition. Our results include the operations from Western Refining for the period of June 1, 2017 onward, and thus prior periods may not be comparable. With the Western Refining Acquisition, we have updated our segments to reflect the results and operations of Western Refining and WNRL. Our Marketing segment reflects our expanded marketing business that, combined with Western Refining, now consists of expanded wholesale marketing operations and approximately 3,330 retail stores marketed under multiple well-known fuel brands including ARCO®, Shell®, Mobil® and SUPERAMERICA®. Our Logistics segment includes the combined results of Andeavor Logistics, excluding the Wholesale business. We now report the Logistics segment’s results for the combined Terminalling and Transportation and Gathering and Processing business lines. Our Refining segment reports the results of our refining system that now consists of ten refineries in the western United States with a combined capacity of approximately 1.2 million barrels per day. The Refining segment includes the results from Andeavor’s existing Refining segment and Western’s Refining segment, excluding third-party wholesale marketing operations that are now reported in our Marketing segment.
On January 1, 2018, we adopted ASC 606 utilizing the modified retrospective method. The current period results and balances are presented in accordance with ASC 606 while comparative periods continue to be presented in accordance with the accounting standards in effect for those periods. Refer to Note 1 and Note 12 within Item 1 for further details regarding ASC 606 and the financial impact due to adoption of the standard.
Market Overview
The markets in which we operate are subject to market volatility through the price of crude oil and other feedstocks we acquire for refining and the price we can sell our refined products through our Marketing, Logistics and Refining segments. Refinery disruptions, planned maintenance, changing logistical infrastructure and healthy domestic macroeconomic conditions continue to influence all portions of our business. Refined product values and crude oil prices are generally set by the global market balances. However, refined product demand trends and crude oil supplies in the U.S. and globally have a significant impact on our business.
June 30, 2018 | 27 | ||
Management’s Discussion and Analysis | ||
Refined Products
Globally, crude and product inventory levels are notably lower than this time last year, but are in line with the 5-year average. Continued growth of the global markets and improvement in macro-economic factors remains supportive to refined product demand growth. Additionally, we continue to see attractive export opportunities for refined products to Latin America due to their persistent low refinery utilization rates.
Logistics
Although our Logistics segment has minimal exposure to commodity prices, the spot prices of the commodities that it handles have all increased during the second quarter. Crude oil prices rose to their highest levels since late-2014 as OPEC-led supply reductions and robust demand from emerging economies drew global stocks below their 5-year average. The U.S. benchmark crude West Texas Intermediate (“WTI”) gained over $9.00 per barrel during the quarter and prompted producers to add 54 rigs according to the U.S. oil and gas drilling rig count. With drilling activity at its highest level in three years and continued productivity gains in well completions, U.S. production of both oil and gas reached record levels during the second quarter. Despite the increase in U.S. oil production, crude stocks continued to trend below the 5-year average as U.S. refinery consumption and crude exports each set new records. Continued exports of refined products, particularly to Latin America, are providing incentive for U.S. refiners to maximize production of gasoline and diesel. These factors create a positive outlook for U.S. oil, gas, natural gas and refined product throughput volumes; however, regional impacts may differ.
Refining
During the second quarter, the markets in which we operate continued to experience volatility. Brent crude oil (“Brent”) increased approximately $9 per barrel ending the quarter at nearly $80 per barrel. The spread between Brent and WTI crude prices also fluctuated throughout the period between a low of $4.40 per barrel and a high of $11.37 per barrel. U.S. crude production continued to increase at record levels driven by Permian basin shale production. Operator efficiencies and a supportive price environment remain a key driver of domestic crude production growth. Continued record export volume, particularly out of the Gulf Coast, along with healthy refinery utilization helped balance this new domestic supply. As a result, domestic crude inventories spent most of the second quarter below the five-year average and maintained a significant year over year deficit. Discounted inland crudes along with various refinery outages supported Mid-Continent refining margins. West Coast margins were aided by heavier than normal Spring maintenance which kept PADD 5 refinery runs below the five-year average for the majority of April and May. Refinery utilization recovered quickly in June post turnaround activity but product exports to Latin American countries continue to support higher West Coast refinery run rates. We continue to monitor the impact of changes in both market prices and fundamentals on our business.
As a performance benchmark and a comparison with other industry participants, we have utilized the West Coast and Inland crack spreads. The crack spread is a measure of the difference between market prices for crude oil and refined products and is a commonly used proxy within the industry to estimate or identify trends in refining margins. Crack spreads can fluctuate significantly over time as a result of market conditions and supply and demand balances. The West Coast 321 crack spread is calculated using 3 barrels of Alaska North Slope crude oil (“ANS”) producing 2 barrels of Los Angeles CARB gasoline and 1 barrel of Los Angeles CARB diesel. The Inland 321 crack spread is calculated using 3 barrels of WTI crude oil producing 2 barrels of Group 3 gasoline and 1 barrel of Group 3 diesel.
West Coast crack spreads decreased during both the three months ended June 30, 2018 (the “2018 Quarter”) and six months ended June 30, 2018 (the “2018 Period) while the Inland crack spreads increased in both the 2018 Quarter and 2018 Period compared to last year. The U.S. West Coast crack spread averaged $18.83 per barrel in the 2018 Quarter and $17.77 per barrel in the 2018 Period compared to $18.94 per barrel in the three months ended June 30, 2017 (the “2017 Quarter”) and $17.77 per barrel in the six months ended June 30, 2017 (the “2017 Period”). The Inland crack spread averaged $28.49 per barrel in the 2018 Quarter and $22.58 per barrel in the 2018 Period compared to $14.35 per barrel in the 2017 Quarter and $13.75 per barrel in the 2017 Period.
Our actual refining margins differ from these crack spreads based on the actual slate of crude oil we run at our refineries and the products we produce. The global commodity markets for crude oil and refined products are subject to significant volatility resulting in rapidly changing prices and margin environments. Our refineries process a variety of crude oils that are sourced from around the world. The slate of crude oil we process can vary over time as a result of changes in market prices and shipping rates. Additionally, our refining margin is impacted by the changing crude oil price differentials, which is the difference between the benchmark crude oils, WTI and Brent crude oil, and the actual crude oil we run at our refineries. We may experience financial risk associated with price volatility of crude oil and refined products, and we may utilize financial hedge instruments to help mitigate such risks where possible.
28 | | | |
Management’s Discussion and Analysis | ||
Non-GAAP Measures
Our management uses certain “non-GAAP” performance measures to analyze operating segment performance and non-GAAP financial measures to evaluate past performance and prospects for the future to supplement our GAAP financial information presented in accordance with U.S. GAAP. These financial and operational non-GAAP measures are important factors in assessing our operating results and profitability and include:
• | EBITDA - U.S. GAAP-based net earnings before interest, income taxes, and depreciation and amortization expenses; |
• | Segment EBITDA - segment’s U.S. GAAP-based operating income before depreciation and amortization expense plus equity in earnings (loss) of equity method investments and other income (expense), net; |
• | Fuel margin - calculated as the difference between total marketing revenues and marketing cost of fuels and other; |
• | Fuel margin per gallon - calculated as the fuel margin divided by our total fuel sales volumes in gallons; |
• | Merchandise margin - calculated as the difference between merchandise sales and purchases of merchandise; |
• | Merchandise margin percentage - calculated as merchandise margin divided by merchandise sales; |
• | Average margin on NGL sales per barrel - calculated as the difference between the NGL sales revenues and the amounts recognized as NGL expenses divided by our NGL sales volumes in barrels presented in thousands of barrels per day (“Mbpd”) multiplied by 1,000 and multiplied by the number of days in the period, (91 days for both the 2018 and 2017 Quarter and 181 days for both the 2018 and 2017 Period); |
• | Refining margin - calculated as the difference between total refining revenues and total cost of materials and other; |
• | Refining margin per throughput barrel - calculated as refining margin divided by our total refining throughput in barrels multiplied by 1,000 and multiplied by the number of days in the period as stated above; and |
• | Manufacturing costs (excluding depreciation and amortization) per throughput barrel - calculated as manufacturing costs divided by our total refining throughput in barrels multiplied by 1,000 and multiplied by the number of days in the period as stated above. Manufacturing costs represent direct operating expenses incurred by our Refining segment for the production of refined products. |
We present these measures because we believe they may help investors, analysts, lenders and ratings agencies analyze our results of operations and liquidity in conjunction with our U.S. GAAP results, including but not limited to:
• | our operating performance as compared to other publicly traded companies in the refining, logistics and marketing industries, without regard to historical cost basis or financing methods; |
• | our ability to incur and service debt and fund capital expenditures; and |
• | the viability of acquisitions and other capital expenditure projects and the returns on investment of various investment opportunities. |
Management also uses these measures to assess internal performance. Non-GAAP measures have important limitations as analytical tools, because they exclude some, but not all, items that affect net earnings and operating income. These measures should not be considered substitutes for their most directly comparable U.S. GAAP financial measures.
2018 2nd Quarter Versus 2017 2nd Quarter
Highlights (in millions)
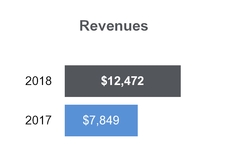
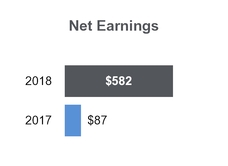
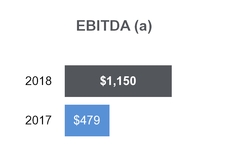
(a) | See “Non-GAAP Reconciliations” section for further information regarding these non-GAAP measures. |
June 30, 2018 | 29 | ||
Management’s Discussion and Analysis | ||
Percentage of Segment Operating Income by Operating Segment
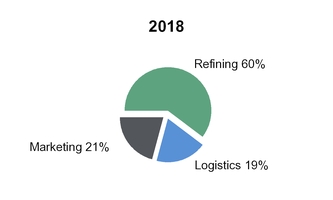
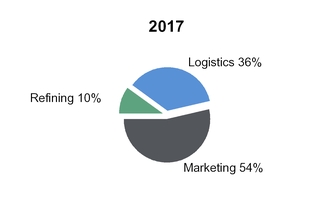
Net Earnings from Continuing Operations Reconciliation (in millions)
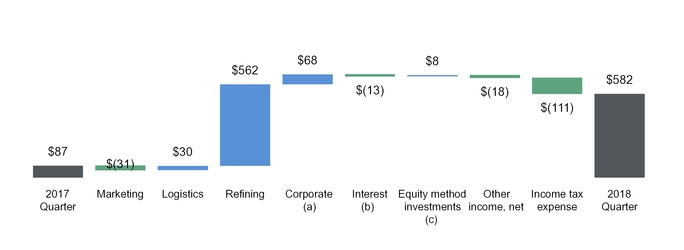
(a) | Corporate costs and eliminations |
(b) | Interest and financing costs, net |
(c) | Equity in earnings of equity method investments |
Overview
Our net earnings of $582 million ($3.38 per diluted share) for the 2018 Quarter increased compared to $87 million ($0.31 per diluted share) for the 2017 Quarter. Our EBITDA increased $671 million to $1.2 billion compared to the 2017 Quarter. These increases were primarily driven by improved operating results in our Logistics and Refining segments, aided by the Western Refining Acquisition in June 2017, but partially offset by a lower segment operating income from our Marketing segment.
Segment Results
Refer to our detailed discussion of each segment’s operating and financial results contained in this section.
Corporate Costs
Corporate and unallocated costs, net of intersegment eliminations, decreased $68 million in the 2018 Quarter compared to the 2017 Quarter largely due to $124 million of acquisition and integration costs incurred in the 2017 Quarter related to the Western Refining Acquisition partially offset by higher costs to support the Western Refining operations in the 2018 Quarter and certain costs in connection with the MPC Merger.
Interest and Financing Costs
Interest and financing costs of $109 million in the 2018 Quarter were higher than the $96 million for the 2017 Quarter due to increased debt from the $500 million 3.800% Senior Notes due 2028 and $500 million 4.500% Senior Notes due 2048 issued in December 2017 partially offset by lower interest expense from lower interest rates reflecting our improved investment grade credit rating.
30 | | | |
Management’s Discussion and Analysis | ||
Income Taxes
Our income tax expense increased to $167 million in the 2018 Quarter compared to $56 million in the 2017 Quarter primarily due to higher pre-tax earnings during the 2018 Quarter. The combined federal and state effective income tax rate of 22% during the 2018 Quarter was lower than the 39% rate in the 2017 Quarter, primarily due to the benefit from a lower federal tax rate from the Tax Cuts and Jobs Act enacted in December 2017.
2018 Year to Date Period Versus 2017 Year to Date Period
Highlights (in millions)
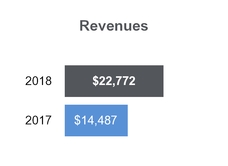
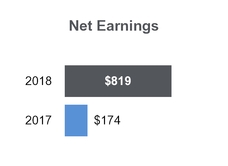
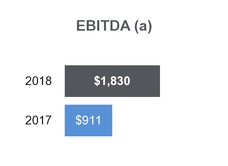
(a) | See “Non-GAAP Reconciliations” section for further information regarding these non-GAAP measures. |
Percentage of Segment Operating Income by Operating Segment
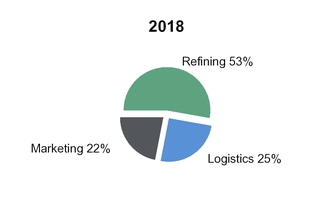
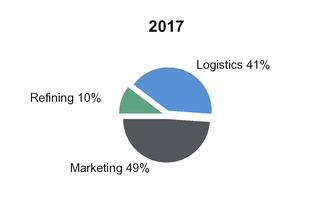
Net Earnings from Continuing Operations Reconciliation (in millions)
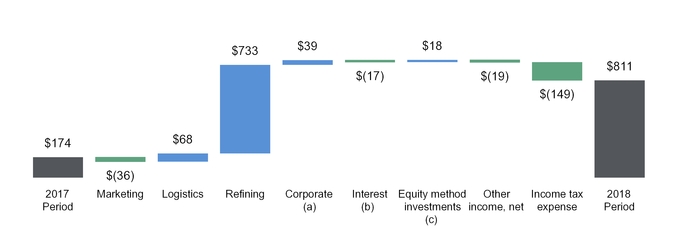
(a) | Corporate costs and eliminations |
(b) | Interest and financing costs, net |
(c) | Equity in earnings of equity method investments |
June 30, 2018 | 31 | ||
Management’s Discussion and Analysis | ||
Overview
Our net earnings of $819 million ($4.48 per diluted share) for the 2018 Period increased compared to $174 million ($0.72 per diluted share) for the 2017 Period. Our EBITDA increased $919 million to $1.8 billion compared to the 2017 Period. These increases were primarily driven by improved operating results in our Logistics and Refining segments, aided by the Western Refining Acquisition, but were partially offset by a decrease in segment operating income from our Marketing segment. The higher operating income in the 2018 Period in our Refining segment included a net benefit of approximately $100 million primarily related to a reduction in the RINs obligation from prior years.
Segment Results
Refer to our detailed discussion of each segment’s operating and financial results contained in this section.
Corporate Costs
Corporate and unallocated costs, net of intersegment eliminations, decreased $39 million in the 2018 Period compared to the 2017 Period largely due to the inclusion of Western Refining and higher costs associated with our Enterprise Resource Planning project offset by $140 million of acquisition and integration costs incurred in the 2017 Period related to the Western Refining Acquisition and certain costs in connection with the MPC Merger.
Interest and Financing Costs
Interest and financing costs of $211 million in the 2018 Period were higher than the $194 million for the 2017 Period due to higher debt from the $500 million 3.800% Senior Notes due 2028 and $500 million 4.500% Senior Notes due 2048 issued in December 2017 partially offset by lower interest expense from lower interest rates reflecting our improved investment grade credit rating.
Income Taxes
Our income tax expense totaled $226 million in the 2018 Period compared to $77 million in the 2017 Period primarily due to higher pre-tax earnings during the 2018 Period. The combined federal and state effective income tax rate of 22% during the 2018 Period decreased from 31% in the 2017 Period primarily due to the benefit from a lower federal tax rate from the Tax Cuts and Jobs Act enacted in December 2017.
Segment Results of Operations
 Marketing Segment
Our Marketing segment sells gasoline and diesel fuel in the western and mid-continent United States through Retail, Branded, and Unbranded channels along with convenience store products in our Retail channel. Our Retail business is made up of company-owned or leased properties offering fuel and convenience store products to end-consumers through company-operated stations and third party-operated stations (“MSOs”). The Branded business is comprised primarily of fuel sales through long-term contracts with Jobbers and Dealers utilizing one of the many successful brands in our portfolio. Our Retail and Branded channels primarily use the ARCO®, Shell®, Mobil™ and SUPERAMERICA® brands for fuel sales and ampm®, SUPERAMERICA® and Giant® brands for convenience stores. Capturing this brand value results in higher fuel margins for our Marketing segment. Our Unbranded business includes fuel sales through agreements with third-party distributors/operators without an associated fuel brand. The combined use of these channels provides income from both a profitable outlet for the majority of the fuel produced by our refineries as well as merchandise sales through convenience stores. In addition to added profitability, our Marketing business enables our refineries to run optimally, which lowers overall operating costs on a per barrel basis.
Operational Data and Results
Management uses fuel margin per gallon and merchandise margin to compare results to other companies in the industry. There are a variety of ways to calculate fuel margin per gallon and merchandise margin; different companies may calculate them in different ways. We report fuel margin separate for our retail and branded operations as well as our unbranded operations due to the difference in margin economics in these channels. Fuel margin and fuel margin per gallon include the effect of intersegment purchases from the Refining segment. Merchandise margin is frequently used in the convenience store industry to measure operating results related to merchandise sales. Investors and analysts may use these metrics to help analyze and compare companies in the industry based on operating performance. These financial measures should not be considered alternatives to revenues, segment operating income or any other measures of financial performance presented in accordance with U.S. GAAP.
32 | | | |
Management’s Discussion and Analysis | ||
Number of Retail and Branded Stations (at end of period)
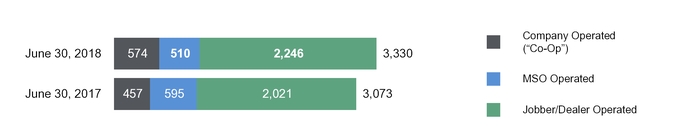
Site Count Growth
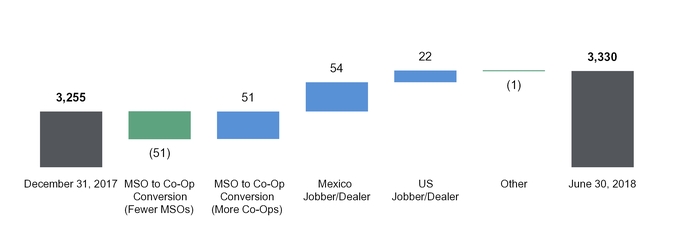
2018 2nd Quarter Versus 2017 2nd Quarter
Highlights
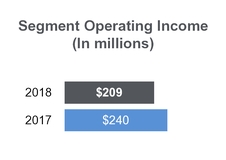
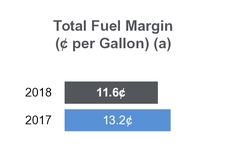
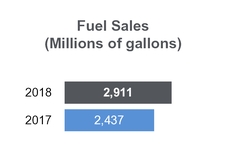
(a) | See “Non-GAAP Reconciliations” section for further information regarding these non-GAAP measures. |
Marketing Fuel Sales (in millions of gallons)
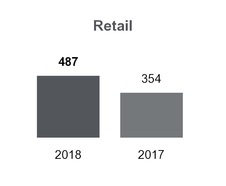
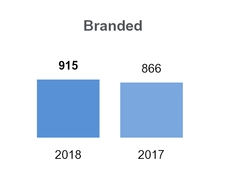
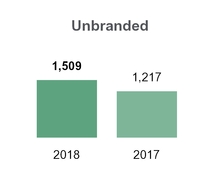
June 30, 2018 | 33 | ||
Management’s Discussion and Analysis | ||
Marketing Segment Operating Data and Results (dollars in millions)
Three Months Ended June 30, | |||||||
2018 | 2017 | ||||||
Revenues | $ | 6,854 | $ | 4,971 | |||
Expenses | |||||||
Cost of fuels and other (excluding items shown separately below) | 6,431 | 4,606 | |||||
Operating expenses (excluding depreciation and amortization) | 178 | 105 | |||||
Depreciation and amortization expense | 21 | 15 | |||||
Selling, general and administrative expenses | 14 | 5 | |||||
Loss on asset disposals and impairments | 1 | — | |||||
Segment Operating Income | $ | 209 | $ | 240 | |||
Segment EBITDA (a) | $ | 227 | $ | 255 | |||
Marketing Margin (a) | |||||||
Retail and Branded fuel margin | $ | 296 | $ | 282 | |||
Unbranded fuel margin | 42 | 40 | |||||
Total Fuel Margin | 338 | 322 | |||||
Merchandise margin | 58 | 20 | |||||
Other margin | 27 | 23 | |||||
Total Convenience Margin | 85 | 43 | |||||
Total Marketing Margin | $ | 423 | $ | 365 | |||
Fuel Margin (¢/gallon) (a) | |||||||
Retail and Branded Fuel Margin | 21.1 | ¢ | 23.2 | ¢ | |||
Unbranded Fuel Margin | 2.9 | ¢ | 3.2 | ¢ | |||
Total Fuel Margin | 11.6 | ¢ | 13.2 | ¢ | |||
Merchandise Margin % (a) | 28.9 | % | 28.3 | % | |||
(a) | See section “Non-GAAP Reconciliations” for further information regarding this non-GAAP measure. |
Overview
Segment operating income decreased $31 million to $209 million for the 2018 Quarter compared to the 2017 Quarter as weaker Retail and Branded fuel margins were partially offset by contributions from the Western Refining Acquisition.
Retail and Branded Fuel Margin
Fuel margin increased $14 million to $296 million during the 2018 Quarter compared to the 2017 Quarter as volume and margin contributions from the Western Refining Acquisition and retail stations acquired in northern California in the third quarter of 2017 were partially offset by weaker margins as a result of a lag in street prices increasing relative to rising spot market prices for most of the 2018 Quarter.
Unbranded Fuel Margin
Fuel margin increased $2 million to $42 million during the 2018 Quarter compared to the 2017 Quarter due to contributions from the Western Refining Acquisition.
Convenience Margin
Convenience margin increased $42 million to $85 million during the 2018 Quarter compared to the 2017 Quarter primarily reflecting contributions from the Western Refining Acquisition, retail stations acquired in northern California in the third quarter of 2017, conversions of MSO operated to company operated stations and an increase in merchandise margin percentage from 28.3% to 28.9% in the 2018 Quarter.
Operating Expenses and Depreciation
Operating expenses increased $73 million and depreciation and amortization expenses increased $6 million in the 2018 Quarter versus the 2017 Quarter primarily due to higher operating costs from company operated stations acquired in the Western Refining Acquisition.
2018 Year to Date Period Versus 2017 Year to Date Period
Highlights
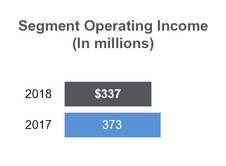
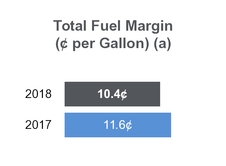
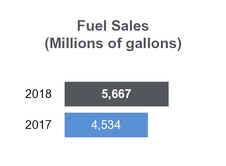
(a) | See “Non-GAAP Reconciliations” section for further information regarding these non-GAAP measures. |
34 | | | |
Management’s Discussion and Analysis | ||
Marketing Fuel Sales (in millions of gallons)
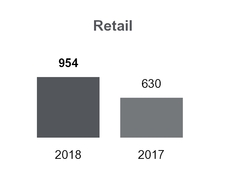
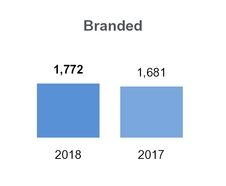
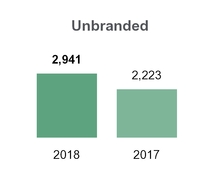
Marketing Segment Operating Data and Results (dollars in millions)
Six Months Ended June 30, | |||||||
2018 | 2017 | ||||||
Revenues | $ | 12,519 | $ | 9,075 | |||
Expenses | |||||||
Cost of fuels and other (excluding items shown separately below) | 11,770 | 8,491 | |||||
Operating expenses (excluding depreciation and amortization) | 345 | 173 | |||||
Depreciation and amortization expense | 43 | 28 | |||||
Selling, general and administrative expenses | 23 | 10 | |||||
Loss on asset disposals and impairments | 1 | — | |||||
Segment Operating Income | $ | 337 | $ | 373 | |||
Segment EBITDA (a) | $ | 379 | $ | 401 | |||
Marketing Margin (a) | |||||||
Retail and Branded fuel margin | $ | 510 | $ | 471 | |||
Unbranded fuel margin | 80 | 52 | |||||
Total Fuel Margin | 590 | 523 | |||||
Merchandise margin | 108 | 23 | |||||
Other margin | 51 | 38 | |||||
Total Convenience Margin | 159 | 61 | |||||
Total Marketing Margin | $ | 749 | $ | 584 | |||
Fuel Margin (¢/gallon) (a) | |||||||
Retail and Branded Fuel Margin | 18.7 | ¢ | 20.5 | ¢ | |||
Unbranded Fuel Margin | 2.7 | ¢ | 2.3 | ¢ | |||
Total Fuel Margin | 10.4 | ¢ | 11.6 | ¢ | |||
Merchandise Margin % (a) | 28.5 | % | 28.8 | % | |||
(a) | See section “Non-GAAP Reconciliations” for further information regarding this non-GAAP measure. |
Overview
Segment operating income decreased $36 million to $337 million for the 2018 Period compared to the 2017 Period as weaker Retail and Branded fuel margins were offset by contributions from the Western Refining Acquisition.
Retail and Branded Fuel Margin
Fuel margin increased $39 million to $510 million during the 2018 Period compared to the 2017 Period as volume and margin contributions from the Western Refining Acquisition and retail stations acquired in northern California in the third quarter of 2017 were partially offset by weaker margins as a result of a lag in street prices increasing relative to rising spot market prices for most of the 2018 Period.
Unbranded Fuel Margin
Fuel margin increased $28 million to $80 million during the 2018 Period compared to the 2017 Period due to contributions from the Western Refining Acquisition.
Convenience Margin
Convenience margin increased $98 million to $159 million during the 2018 Period compared to the 2017 Period primarily reflecting contributions from the Western Refining Acquisition, retail stations acquired in northern California in the third quarter of 2017, conversions of MSO operated to company operated stations and partially offset by a lower merchandise margin percentage of 28.5% in 2018 compared to 28.8% in 2017.
Operating Expenses and Depreciation
Operating expenses increased $172 million and depreciation and amortization expenses increased $15 million in the 2018 Period versus the 2017 Period primarily due to higher operating costs from company operated stations acquired in the Western Refining Acquisition.
June 30, 2018 | 35 | ||
Management’s Discussion and Analysis | ||


 Logistics Segment
Our Logistics segment operates across two business lines: Terminalling and Transportation and Gathering and Processing. A significant portion of the assets within this segment are integral to the success of our refining and marketing operations. Refer to
Note 13 within Item 1 for intercompany revenue. These business lines generate revenue by charging fees for:
• | providing storage services; |
• | transporting refined products; |
• | delivering crude oil, refined products and intermediate feedstocks from vessels to refineries and terminals; |
• | loading and unloading crude oil transported by unit train to our Anacortes refinery; |
• | loading and unloading from marine vessels and barges; |
• | transferring refined products from terminals to trucks, barges, rail cars and pipelines; |
• | providing ancillary services, ethanol blending and additive injection; |
• | handling petroleum coke for our Los Angeles refinery; |
• | gathering and transporting crude oil, natural gas and produced water; |
• | operating storage facilities with tanks located in strategic areas; |
• | operating truck-based crude oil and asphalt gathering; and |
• | gathering and processing gas under keep-whole fee-based processing and percentage-of-proceeds agreements. |
Operational Data and Results
Several operating metrics are used by management to evaluate performance and efficiency and compare profitability to other companies in the industry. These metrics include:
• | Average terminalling revenue per barrel - calculated as total terminalling revenue divided by total terminalling throughput; |
• | Average pipeline transportation revenue per barrel - calculated as total pipeline transportation revenue divided by total pipeline transportation throughput; |
• | Average margin on NGL sales per barrel - calculated as the difference between the NGL sales revenues and the amounts recognized as NGL expense divided by our NGL sales volumes in barrels presented in Mbpd multiplied by 1,000 and multiplied by the number of days in the period; |
• | Average gas gathering and processing revenue per Million British thermal units (“MMBtu”) - calculated as total gathering and processing fee-based revenue divided by total gas gathering throughput; and |
• | Average crude oil and water gathering revenue per barrel - calculated as total crude oil and water gathering fee-based revenue divided by total crude oil and water gathering throughput. |
Investors and analysts use these financial measures to help analyze and compare companies in the industry based on operating performance. These financial measures should not be considered as an alternative to segment operating income, revenues and operating expenses or any other measure of financial performance presented in accordance with U.S. GAAP.
2018 2nd Quarter Versus 2017 2nd Quarter
Highlights (in millions)
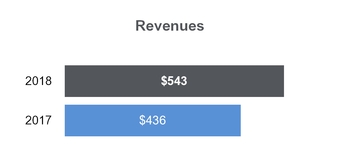

36 | | | |
Management’s Discussion and Analysis | ||
Logistics Segment Volumetric Data
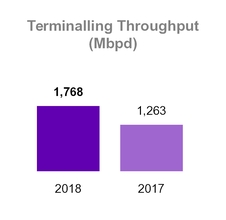
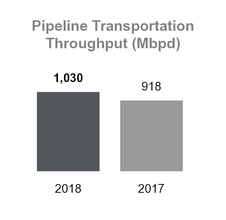
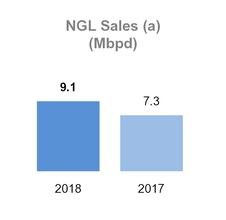
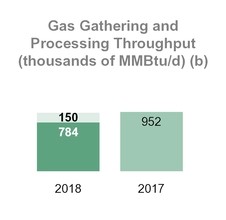

(a) | Volumes represent barrels sold under Andeavor Logistics’ keep-whole arrangements, net barrels retained under its percent of proceeds (“POP”) arrangements and other associated products. |
(b) | The adoption of ASC 606 changed the presentation of our gas gathering and processing throughput volumes. Volumes processed internally to enhance our NGL sales are no longer reported in our throughput volumes as certain fees contained within our commodity contracts are now reported as a reduction of “NGL expense”. The impact of the adoption during the 2018 Quarter was 150 thousand MMBtu/d now being used internally and not reported in our throughput volumes used to calculate our average gas gathering and processing revenue per MMBtu. |
June 30, 2018 | 37 | ||
Management’s Discussion and Analysis | ||
Logistics Segment Operating Results (in millions, except per barrel and per MMBtu amounts)
Three Months Ended June 30, | |||||||
2018 | 2017 | ||||||
Revenues | |||||||
Terminalling and Transportation | |||||||
Terminalling | $ | 208 | $ | 159 | |||
Pipeline transportation | 40 | 33 | |||||
Other revenues | 1 | 2 | |||||
Gathering and Processing | |||||||
NGL sales (a) | 95 | 81 | |||||
Gas gathering and processing | 82 | 87 | |||||
Crude oil and water gathering | 69 | 41 | |||||
Pass-thru and other revenue | 48 | 33 | |||||
Total Revenues | 543 | 436 | |||||
Costs and Expenses | |||||||
Terminalling and Transportation | |||||||
Operating expenses (excluding depreciation and amortization) (b) | 79 | 62 | |||||
Gathering and Processing | |||||||
NGL expense (excluding items shown separately below) (a) | 45 | 56 | |||||
Operating expenses (excluding depreciation and amortization) (b) | 116 | 83 | |||||
Depreciation and amortization expenses | 83 | 68 | |||||
General and administrative expenses (b) | 26 | 29 | |||||
(Gain) loss on asset disposals and impairments | 1 | (25 | ) | ||||
Segment Operating Income | $ | 193 | $ | 163 | |||
Segment EBITDA (c) | $ | 282 | $ | 236 | |||
Average terminalling revenue per barrel | $ | 1.29 | $ | 1.39 | |||
Average pipeline transportation revenue per barrel | $ | 0.43 | $ | 0.40 | |||
Average margin on NGL sales per barrel (a)(c)(d) | $ | 59.77 | $ | 37.45 | |||
Average gas gathering and processing revenue per MMBtu (d) | $ | 1.16 | $ | 1.00 | |||
Average crude oil and water gathering revenue per barrel | $ | 2.55 | $ | 1.64 | |||
Overview
Segment operating income increased $30 million to $193 million for the 2018 Quarter compared to the 2017 Quarter primarily due to operations obtained through the Western Refining Acquisition, Andeavor Logistics’ acquisition of logistics assets located in Anacortes, Washington (the “Anacortes Logistics Assets”) in November 2017 and organic growth projects. This increase was partially offset by a $25 million gain on sale of a terminal in Alaska during the 2017 Quarter.
Terminalling and Transportation
The Terminalling and Transportation revenues, net of operating expenses, increased $38 million, or 29%, in the 2018 Quarter compared to the 2017 Quarter primarily due to operations obtained through the Western Refining Acquisition and Andeavor Logistics’ acquisition of the Anacortes Logistics Assets.
Gathering and Processing
The Gathering and Processing revenues, net of NGL expense and operating expenses, increased $30 million, or 29%, in the 2018 Quarter compared to the 2017 Quarter. Revenues from the crude oil and water gathering systems improved due to the impact from operations obtained in the Western Refining Acquisition increasing the throughput volumes and improving the tariff mix. Revenues also increased due to continued strong volume growth in our Permian crude oil gathering operations during the 2018 Quarter. The 2017 Quarter was impacted by Andeavor’s Mandan refinery undergoing a turnaround lowering revenues for that period. The 2018 Quarter’s results were partially offset by planned downtime at the Robinson Lake gas processing facility to allow for a capacity expansion project, which was successfully completed within the 2018 Quarter and higher operating expenses and depreciation and amortization related to the Western Refining Acquisition.
Gathering and Processing revenues were also impacted by the adoption of ASC 606, as further described in Note 12. Certain cost recoveries previously presented as service revenues are now reflected as reductions to NGL expense, resulting in an increase to the average margin on NGL sales per barrel.
(a) | Our Logistics segment had 21.9 Mbpd and 20.9 Mbpd of gross NGL sales under POP and keep-whole arrangements for the 2018 Quarter and 2017 Quarter, respectively, of which Logistics retained 9.1 Mbpd and 7.3 Mbpd, respectively. The difference between gross sales barrels and barrels retained is reflected in NGL expense due to the gross presentation required for the POP arrangements. |
(b) | Our Logistics segment operating expenses as well as general and administrative expenses includes amounts billed by Andeavor for services provided to Andeavor Logistics under various operational contracts. Amounts billed by Andeavor included in operating expenses totaled $52 million and $44 million for the 2018 Quarter and the 2017 Quarter, respectively. The net amounts billed include reimbursements of $3 million and $2 million for the 2018 Quarter and the 2017 Quarter, respectively. Amounts billed by Andeavor included in general and administrative expenses totaled $18 million and $19 million for the 2018 Quarter and the 2017 Quarter, respectively. All of these amounts are eliminated upon consolidation. Those expenses with third parties related to the transportation of crude oil and refined products related to our sale of those refined products during the ordinary course of business are reclassified to cost of materials and other in our condensed statements of consolidated operations upon consolidation. |
(c) | See “Non-GAAP Reconciliations” section for further information regarding this non-GAAP measure. |
(d) | Due to the adoption of ASC 606, certain cost recoveries previously presented as service revenues are now reflected as reductions to NGL expense, resulting in an increase to the average margin on NGL sales per barrel. In addition, volumes processed internally to enhance our NGL sales are no longer reported in our throughput volumes used to calculate our average gas gathering and processing revenue per MMBtu as certain fees contained within our commodity contracts are now reported as a reduction of NGL expense. The mix of remaining volumes resulted in a higher recognized gas gathering and processing rate. |
38 | | | |
Management’s Discussion and Analysis | ||
2018 Year to Date Period Versus 2017 Year to Date Period
Highlights (in millions)
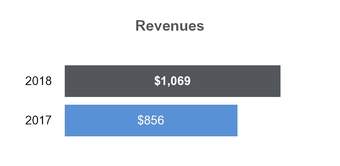
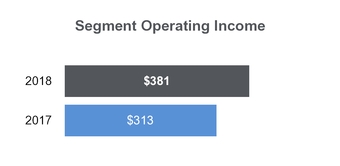
Logistics Segment Volumetric Data
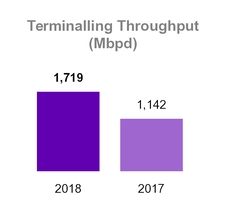
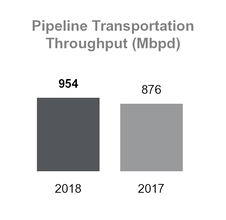
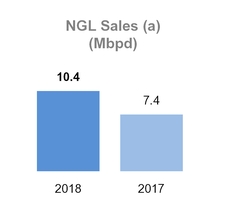

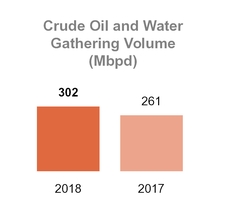
(a) | Volumes represent barrels sold under Andeavor Logistics’ keep-whole arrangements, net barrels retained under its POP arrangements and other associated products. |
(b) | The adoption of ASC 606 changed the presentation of our gas gathering and processing throughput volumes. Volumes processed internally to enhance our NGL sales are no longer reported in our throughput volumes as certain fees contained within our commodity contracts are now reported as a reduction of “NGL expense”. The impact of the adoption during the 2018 Period was 162 thousand MMBtu/d now being used internally and not reported in our throughput volumes used to calculate our average gas gathering and processing revenue per MMBtu. |
June 30, 2018 | 39 | ||
Management’s Discussion and Analysis | ||
Logistics Segment Operating Results (in millions, except per barrel and per MMBtu amounts)
Six Months Ended June 30, | |||||||
2018 | 2017 | ||||||
Revenues | |||||||
Terminalling and Transportation | |||||||
Terminalling | $ | 406 | $ | 304 | |||
Pipeline transportation | 71 | 63 | |||||
Other revenues | 3 | 2 | |||||
Gathering and Processing | |||||||
NGL sales (a) | 199 | 164 | |||||
Gas gathering and processing | 167 | 167 | |||||
Crude oil and water gathering | 134 | 80 | |||||
Pass-thru and other revenue | 89 | 76 | |||||
Total Revenues | 1,069 | 856 | |||||
Costs and Expenses | |||||||
Terminalling and Transportation | |||||||
Operating expenses (excluding depreciation and amortization) (b) | 153 | 111 | |||||
Gathering and Processing | |||||||
NGL expense (excluding items shown separately below) (a) | 93 | 115 | |||||
Operating expenses (excluding depreciation and amortization) (b) | 227 | 160 | |||||
Depreciation and amortization expenses | 162 | 126 | |||||
General and administrative expenses (b) | 52 | 56 | |||||
(Gain) loss on asset disposals | 1 | (25 | ) | ||||
Segment Operating Income | $ | 381 | $ | 313 | |||
Segment EBITDA (c) | $ | 553 | $ | 448 | |||
Average terminalling revenue per barrel | $ | 1.30 | $ | 1.47 | |||
Average pipeline transportation revenue per barrel | $ | 0.41 | $ | 0.40 | |||
Average margin on NGL sales per barrel (a)(c)(d) | $ | 55.81 | $ | 38.30 | |||
Average gas gathering and processing revenue per MMBtu (d) | $ | 1.14 | $ | 0.97 | |||
Average crude oil and water gathering revenue per barrel | $ | 2.46 | $ | 1.68 | |||
Overview
Segment operating income increased $68 million to $381 million for the 2018 Period compared to the 2017 Period primarily due to operations obtained through the Western Refining Acquisition, Andeavor Logistics’ acquisition of the Anacortes Logistics Assets in November 2017 and organic growth projects. This increase was partially offset by a $25 million gain on sale of a terminal in Alaska during the 2017 Period.
Terminalling and Transportation
The Terminalling and Transportation revenues, net of operating expenses, increased $69 million, or 27%, primarily due to operations obtained through the Western Refining Acquisition and the Anacortes Logistics Assets.
Gathering and Processing
The Gathering and Processing revenues, net of NGL expense and operating expenses, increased $57 million, or 27%, in the 2018 Period compared to the 2017 Period. Revenues from the crude oil and water gathering systems improved due to the impact from operations obtained in the Western Refining Acquisition increasing the throughput volumes and improving the tariff mix. Revenues also increased due to continued strong volume growth in our Permian crude oil gathering during the 2018 Period. The 2017 Period was impacted by Andeavor’s Mandan refinery undergoing a turnaround lowering revenues for that period. The 2018 Period’s results were partially offset by planned downtime at the Robinson Lake gas processing facility to allow for a capacity expansion project, which was successfully completed within the 2018 Period and higher operating expenses and depreciation and amortization related to the Western Refining Acquisition.
Gathering and Processing revenues were also impacted by the adoption of ASC 606, as further described in Note 12. Certain cost recoveries previously presented as service revenues are now reflected as reductions to NGL expense, resulting in an increase to the average margin on NGL sales per barrel.
(a) | Our Logistics segment had 24.3 Mbpd and 21.0 Mbpd of gross NGL sales under POP and keep-whole arrangements for the 2018 Period and 2017 Period, respectively, of which Logistics retained 10.4 Mbpd and 7.4 Mbpd, respectively. The difference between gross sales barrels and barrels retained is reflected in NGL expense due to the gross presentation required for the POP arrangements. |
(b) | Our Logistics segment operating expenses as well as general and administrative expenses includes amounts billed by Andeavor for services provided to Andeavor Logistics under various operational contracts. Amounts billed by Andeavor included in operating expenses totaled $103 million and $83 million for the 2018 Period and the 2017 Period, respectively. The net amounts billed include reimbursements of $10 million and $5 million for the 2018 Period and the 2017 Period, respectively. Amounts billed by Andeavor included in general and administrative expenses totaled $38 million and $39 million for the 2018 Period and the 2017 Period, respectively. All of these amounts are eliminated upon consolidation. Those expenses with third parties related to the transportation of crude oil and refined products related to our sale of those refined products during the ordinary course of business are reclassified to cost of materials and other in our condensed statements of consolidated operations upon consolidation. |
(c) | See “Non-GAAP Reconciliations” section for further information regarding this non-GAAP measure. |
(d) | Due to the adoption of ASC 606, certain cost recoveries previously presented as service revenues are now reflected as reductions to NGL expense, resulting in an increase to the average margin on NGL sales per barrel. In addition, volumes processed internally to enhance our NGL sales are no longer reported in our throughput volumes used to calculate our average gas gathering and processing revenue per MMBtu as certain fees contained within our commodity contracts are now reported as a reduction of NGL expense. The mix of remaining volumes resulted in a higher recognized gas gathering and processing rate. |
40 | | | |
Management’s Discussion and Analysis | ||
 Refining Segment
We currently own and operate ten petroleum refineries located in the western and mid-continent United States with a combined crude oil capacity of approximately 1.2 million barrels per day. Our Refining segment buys and refines crude oil and other feedstocks into transportation fuels that we sell to a wide variety of customers. Demand for gasoline is higher during the spring and summer months than during the fall and winter months in most of our markets due to seasonal changes in vehicle miles traveled.
Regions
We currently operate the Refining segment in three separate regions: California, Pacific Northwest and Inland. During the first quarter of 2018, we renamed our Mid-Continent region to Inland. There was no financial impact from this renaming. Our geographic footprint and physically integrated logistics and marketing businesses enable our refineries to interact across these regions providing higher asset utilization and lower operating costs while maintaining well-balanced product supplies to better serve our customers.
Feedstock Purchases
We purchase crude oil and other feedstocks from domestic and foreign sources either through the spot market or term agreements with renewal provisions and volume commitments. The domestic crude oil we purchase, which makes up approximately 67% of our purchases based on volumes, is produced primarily in North Dakota, Alaska, California, Texas, New Mexico, Utah and Wyoming. The remaining 33% of our purchases consists of foreign crude oil produced in South America, the Middle East, Canada, western Africa, Asia and other locations.
Our refineries process both heavy and light crude oil. Light crude oil, when refined, produces a greater proportion of higher value transportation fuels such as gasoline, diesel and jet fuel, and as a result is typically more expensive than heavy crude oil. In contrast, heavy crude oil produces more low value by-products and heavy residual oils. These lower value products can be upgraded to higher value products through additional, more complex and expensive refining processes.
Refined Products
The total products produced in the refining process are referred to as the refining yield. The refining yield consists primarily of transportation fuels, including gasoline and gasoline blendstocks, jet fuel and diesel fuel, but may also include other products such as heavy fuel oils, liquefied petroleum gas, petroleum coke, calcined coke and asphalt.
Refined Product Sales
Our Marketing segment provides a committed outlet for the majority of gasoline as well as some of the diesel fuel produced by our refineries; however, we also sell gasoline and gasoline blendstocks, jet fuel, diesel fuel, heavy fuel oils and residual products in the western and mid-continental U.S. and northern Mexico. Refer to Note 13 within Item 1 for intercompany revenue. We also export bulk shipments of products into certain foreign markets. Our bulk sales are primarily to independent unbranded distributors, other refining and marketing companies, utilities, railroads, airlines and marine and industrial end-users. Our sales include refined products that we manufacture, purchase or receive through exchange arrangements.
Sales of Purchased Products
In the normal course of business, we purchase refined products manufactured by others for resale through our marketing and bulk operations to our customers to meet local market demands and fulfill supply commitments. We purchase these refined products, primarily gasoline, jet fuel, diesel fuel and industrial and marine fuel blendstocks, mainly in the spot market.
Refining utilization is a key metric used by management to evaluate refining operational performance. High utilization allows for efficient operations and lower costs on a per barrel basis.
June 30, 2018 | 41 | ||
Management’s Discussion and Analysis | ||
Refining Utilization (a)
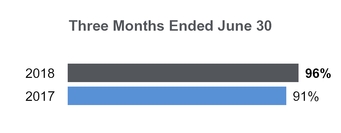
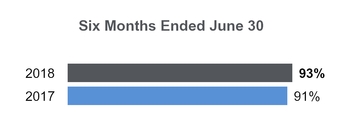
(a) | Andeavor has a total refining capacity of 1.2 million barrels per day since the Merger. Prior to the Merger, Andeavor had a total refining capacity of 895 Mbpd. |
Operational Data and Results
Various operating metrics are used by management to evaluate performance and efficiency and to compare profitability to other companies in the industry. These measures include:
• | Refining utilization; |
• | Refining margin; |
• | Refining margin per barrel of throughput; and |
• | Manufacturing costs before depreciation and amortization expense (“Manufacturing Costs”) per throughput barrel. |
See the previous section entitled “Non-GAAP Measures” for further information on how these measures are calculated. Investors and analysts use these financial measures to help analyze and compare companies in the industry based on operating performance. These financial measures should not be considered alternatives to segment operating income, revenues, costs of sales and operating expenses or any other measure of financial performance presented in accordance with U.S. GAAP.
2018 2nd Quarter Versus 2017 2nd Quarter
Highlights
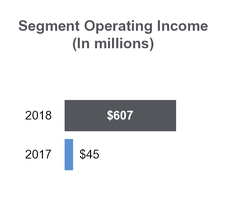
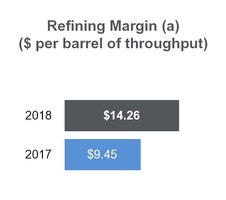
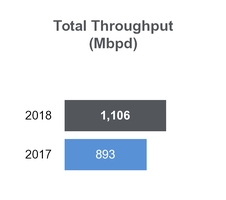
(a) | See “Non-GAAP Reconciliations” section for further information regarding these non-GAAP measures. |
42 | | | |
Management’s Discussion and Analysis | ||
Refining Throughput (Mbpd)
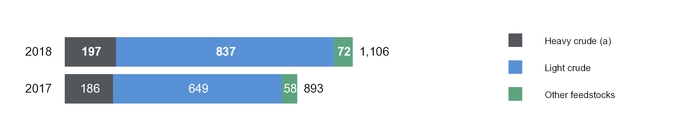
(a) | We define heavy crude oil as crude oil with an American Petroleum Institute gravity of 24 degrees or less. |
Yield (Mbpd)
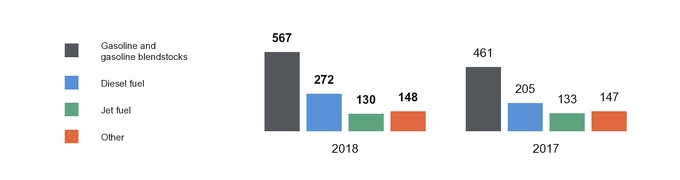
Refined Product Sales (a) (Mbpd)
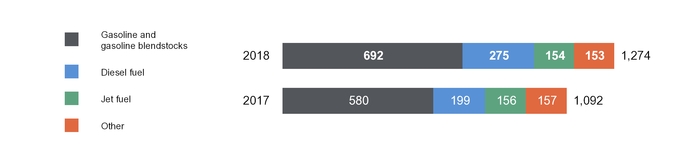
(a) | Sources of total refined product sales include refined products manufactured at our refineries and refined products purchased from third parties. Total refined product sales include sales of manufactured and purchased refined products. Refined product sales include all sales through our Marketing segment as well as in bulk markets and exports through our Refining segment. |
June 30, 2018 | 43 | ||
Management’s Discussion and Analysis | ||
Refining Segment Operating Results (in millions, except per barrel amounts)
Three Months Ended June 30, | |||||||
2018 | 2017 | ||||||
Refining Revenues | |||||||
Refined products | $ | 10,362 | $ | 6,658 | |||
Crude oil resales and other | 1,299 | 391 | |||||
Total Revenues | 11,661 | 7,049 | |||||
Refining Cost of Materials and Expenses | |||||||
Cost of materials and other (excluding items shown separately below) | 10,225 | 6,072 | |||||
LCM | — | 209 | |||||
Total Cost of Sales | 10,225 | 6,281 | |||||
Expenses | |||||||
Operating expenses (excluding depreciation and amortization): | |||||||
Manufacturing costs (a) | 511 | 460 | |||||
Other operating expenses | 141 | 104 | |||||
Total operating expenses | 652 | 564 | |||||
Depreciation and amortization expenses | 175 | 153 | |||||
General and administrative expenses | 3 | 3 | |||||
(Gain) loss on asset disposals and impairments | (1 | ) | 3 | ||||
Segment Operating Income | $ | 607 | $ | 45 | |||
Segment EBITDA (b) | $ | 782 | $ | 206 | |||
Refining margin (b) | $ | 1,436 | $ | 768 | |||
Refining margin per throughput barrel (b) | $ | 14.26 | $ | 9.45 | |||
Manufacturing costs (excluding depreciation and amortization) per throughput barrel (a)(b) | $ | 5.07 | $ | 5.67 | |||
(a) | Manufacturing costs represent direct operating expenses incurred by our Refining segment for the production of refined products. |
(b) | See “Non-GAAP Reconciliations” section for further information regarding this non-GAAP measure. |
Overview
Segment operating income for our Refining segment increased $562 million to $607 million during the 2018 Quarter compared to the 2017 Quarter largely due to contributions from the Western Refining Acquisition. In addition, the 2017 Quarter included a negative impact of a $209 million lower of cost or market (“LCM”) adjustment. These benefits were partially offset by downtime due to planned maintenance and higher manufacturing costs attributable to the Western Refining Acquisition.
California Region
Refining margin increased $93 million in the 2018 Quarter to $614 million, or $12.18 per barrel, compared to $521 million in the 2017 Quarter, or $10.78 per barrel, primarily because the 2017 Quarter included a negative impact of a $98 million LCM adjustment. The California refineries produced 555 Mbpd in the 2018 Quarter compared to 531 Mbpd a year ago and achieved a utilization of 102% compared to 97% in the 2017 Quarter. Manufacturing costs per throughput barrel for the 2018 Quarter decreased $0.40, or 6.6%, per throughput barrel.
Inland Region
Refining margin increased $571 million in the 2018 Quarter to $745 million, or $19.56 per barrel, compared to $174 million in the 2017 Quarter, or $9.96 per barrel largely attributable to the operational results from the Western Refining Acquisition. In addition, the 2017 Quarter included a negative impact of a $65 million LCM adjustment. The Western Refining Acquisition led to a significant increase in refining throughput for the region of 226 Mbpd to 418 Mbpd for the 2018 Quarter. Manufacturing costs per throughput barrel in the 2018 Quarter decreased $1.01, or 18.4%, per throughput barrel.
Pacific Northwest Region
Refining margin increased $4 million in the 2018 Quarter to $77 million, or $6.31 per barrel, compared to $73 million in the 2017 Quarter, or $4.72 per barrel despite planned maintenance at our Kenai and Anacortes refineries. As a result of the downtime at both refineries, throughput decreased 22% to 133 Mbpd. Manufacturing costs per throughput barrel were 1.3% lower in the 2018 Quarter compared to the 2017 Quarter.
44 | | | |
Management’s Discussion and Analysis | ||
Refining Segment Operating Results by Region (dollars in millions, except per barrel amounts)
Three Months Ended June 30, | |||||||||||||||||||||||
2018 | 2017 | 2018 | 2017 | 2018 | 2017 | ||||||||||||||||||
California (Los Angeles and Martinez) | Inland (Texas, Minnesota, North Dakota, Utah and New Mexico) | Pacific Northwest (Washington and Alaska) | |||||||||||||||||||||
Revenues | |||||||||||||||||||||||
Refined products | $ | 5,128 | $ | 4,048 | $ | 3,730 | $ | 1,436 | $ | 1,504 | $ | 1,174 | |||||||||||
Crude oil resales and other | 267 | 77 | 942 | 249 | 90 | 65 | |||||||||||||||||
Total Revenues | 5,395 | 4,125 | 4,672 | 1,685 | 1,594 | 1,239 | |||||||||||||||||
Refining Cost of Materials and Expenses | |||||||||||||||||||||||
Cost of materials and other (excluding items shown separately below) | 4,781 | 3,506 | 3,927 | 1,446 | 1,517 | 1,120 | |||||||||||||||||
LCM | — | 98 | — | 65 | — | 46 | |||||||||||||||||
Total Cost of Sales | 4,781 | 3,604 | 3,927 | 1,511 | 1,517 | 1,166 | |||||||||||||||||
Operating expenses (excluding depreciation and amortization): | |||||||||||||||||||||||
Manufacturing costs | 284 | 291 | 171 | 96 | 56 | 73 | |||||||||||||||||
Other operating expenses | 74 | 59 | 50 | 25 | 17 | 20 | |||||||||||||||||
Total operating expenses | 358 | 350 | 221 | 121 | 73 | 93 | |||||||||||||||||
Depreciation and amortization expenses | 95 | 93 | 59 | 33 | 21 | 27 | |||||||||||||||||
General and administrative expenses | 1 | 2 | 2 | 1 | — | — | |||||||||||||||||
(Gain) loss on asset disposals and impairments | (1 | ) | 3 | — | — | — | — | ||||||||||||||||
Operating Income (Loss) | $ | 161 | $ | 73 | $ | 463 | $ | 19 | $ | (17 | ) | $ | (47 | ) | |||||||||
Refining throughput (Mbpd) | 555 | 531 | 418 | 192 | 133 | 170 | |||||||||||||||||
Refining margin (a) | $ | 614 | $ | 521 | $ | 745 | $ | 174 | $ | 77 | $ | 73 | |||||||||||
Refining margin per throughput barrel (a) | $ | 12.18 | $ | 10.78 | $ | 19.56 | $ | 9.96 | $ | 6.31 | $ | 4.72 | |||||||||||
Manufacturing costs (excluding depreciation and amortization) per throughput barrel (a) | $ | 5.62 | $ | 6.02 | $ | 4.48 | $ | 5.49 | $ | 4.66 | $ | 4.72 | |||||||||||
(a) | See “Non-GAAP Reconciliations” section for further information regarding this non-GAAP measure. |
2018 Year to Date Period Versus 2017 Year to Date Period
Highlights
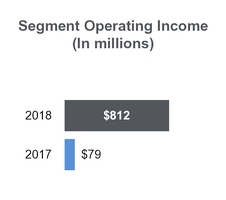
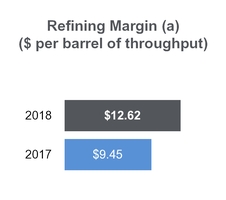
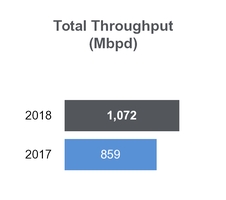
(a) | See “Non-GAAP Reconciliations” section for further information regarding these non-GAAP measures. |
June 30, 2018 | 45 | ||
Management’s Discussion and Analysis | ||
Refining Throughput (Mbpd)
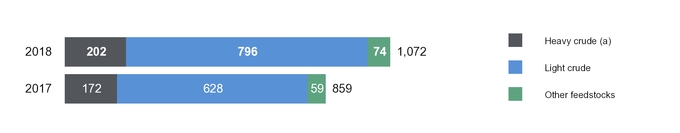
(a) | We define heavy crude oil as crude oil with an American Petroleum Institute gravity of 24 degrees or less. |
Yield (Mbpd)

Refined Product Sales (a) (Mbpd)
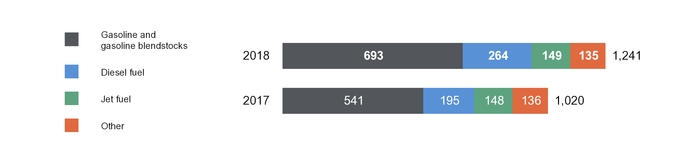
(a) | Sources of total refined product sales include refined products manufactured at our refineries and refined products purchased from third parties. Total refined product sales include sales of manufactured and purchased refined products. Refined product sales include all sales through our Marketing segment as well as in bulk markets and exports through our Refining segment. |
46 | | | |
Management’s Discussion and Analysis | ||
Refining Segment Operating Results (in millions, except per barrel amounts)
Six Months Ended June 30, | |||||||
2018 | 2017 | ||||||
Refining Revenues | |||||||
Refined products | $ | 19,033 | $ | 12,470 | |||
Crude oil resales and other | 2,272 | 635 | |||||
Total Revenues | 21,305 | 13,105 | |||||
Refining Cost of Materials and Expenses | |||||||
Cost of materials and other (excluding items shown separately below) | 18,856 | 11,427 | |||||
LCM | — | 209 | |||||
Total Cost of Sales | 18,856 | 11,636 | |||||
Expenses | |||||||
Operating expenses (excluding depreciation and amortization): | |||||||
Manufacturing costs (a) | 1,033 | 881 | |||||
Other operating expenses | 250 | 199 | |||||
Total operating expenses | 1,283 | 1,080 | |||||
Depreciation and amortization expenses | 348 | 301 | |||||
General and administrative expenses | 7 | 5 | |||||
(Gain) loss on asset disposals and impairments | (1 | ) | 4 | ||||
Segment Operating Income | $ | 812 | $ | 79 | |||
Segment EBITDA (b) | $ | 1,169 | $ | 387 | |||
Refining margin (b) | $ | 2,449 | $ | 1,469 | |||
Refining margin per throughput barrel (b) | $ | 12.62 | $ | 9.45 | |||
Manufacturing costs (excluding depreciation and amortization) per throughput barrel (a)(b) | $ | 5.32 | $ | 5.67 | |||
(a) | Manufacturing costs represent direct operating expenses incurred by our Refining segment for the production of refined products. |
(b) | See “Non-GAAP Reconciliations” section for further information regarding this non-GAAP measure. |
Overview
Segment operating income for our Refining segment increased $733 million to $812 million during the 2018 Period compared to the 2017 Period largely due to contributions from the Western Refining Acquisition and a net benefit of approximately $100 million primarily related to a reduction in the RINs obligation from prior years. In addition, the 2017 Period included a negative impact of a $209 million LCM adjustment. These benefits were partially offset by weaker margins, downtime due to planned maintenance and higher manufacturing costs attributable to the Western Refining Acquisition.
California Region
Refining margin decreased $1 million in the 2018 Period to $994 million, or $11.05 per barrel, compared to $995 million in the 2017 Period, or $10.65 per barrel, primarily due to downtime from planned maintenance at the Los Angeles and Martinez refineries offset by the impact in the 2017 Period of a negative LCM adjustment of $98 million. As a result of the maintenance, the California refineries produced 497 Mbpd in the 2018 Period compared to 516 Mbpd a year ago and achieved a utilization of 91% compared to 94% in the 2017 Period. Manufacturing costs per throughput barrel for the 2018 Period remained largely in line with the 2017 Period.
Inland Region
Refining margin increased $985 million in the 2018 Period to $1.3 billion, or $16.85 per barrel, compared to $273 million in the 2017 Period, or $9.14 per barrel, due to the operational results from the Western Refining Acquisition and the impact in the 2017 Period of a negative LCM adjustment of $65 million. In addition, the 2018 Period includes a $100 million net benefit primarily related to exemptions received from the EPA’s requirements under the renewable fuel standards for the 2016 and 2017 compliance periods for some of our refineries, which resulted in lowering our regulatory compliance costs. These benefits were partially offset by the downtime attributable to planned maintenance at our Salt Lake City refinery. The Western Refining Acquisition led to a significant increase in refining throughput for the region of 247 Mbpd to 412 Mbpd for the 2018 Period. Manufacturing costs per throughput barrel in the 2018 Period decreased $0.58, or 11.2%, per throughput barrel.
Pacific Northwest Region
Refining margin decreased $4 million in the 2018 Period to $197 million, or $6.70 per barrel, from $201 million in the 2017 Period, or $6.24 per barrel, primarily due to planned maintenance at our Kenai and Anacortes refineries. As a result of the downtime, throughput decreased 8% to 163 Mbpd. Manufacturing costs per throughput barrel were 3.4% lower in the 2018 Period compared to the 2017 Period.
June 30, 2018 | 47 | ||
Management’s Discussion and Analysis | ||
Refining Segment Operating Results by Region (dollars in millions, except per barrel amounts)
Six Months Ended June 30, | |||||||||||||||||||||||
2018 | 2017 | 2018 | 2017 | 2018 | 2017 | ||||||||||||||||||
California (Los Angeles and Martinez) | Inland (Texas, Minnesota, North Dakota, Utah and New Mexico) | Pacific Northwest (Washington and Alaska) | |||||||||||||||||||||
Revenues | |||||||||||||||||||||||
Refined products | $ | 9,430 | $ | 7,972 | $ | 6,913 | $ | 2,232 | $ | 2,690 | $ | 2,266 | |||||||||||
Crude oil resales and other | 403 | 221 | 1,732 | 296 | 137 | 118 | |||||||||||||||||
Total Revenues | 9,833 | 8,193 | 8,645 | 2,528 | 2,827 | 2,384 | |||||||||||||||||
Refining Cost of Materials and Expenses | |||||||||||||||||||||||
Cost of materials and other (excluding items shown separately below) | 8,839 | 7,100 | 7,387 | 2,190 | 2,630 | 2,137 | |||||||||||||||||
LCM | — | 98 | — | 65 | — | 46 | |||||||||||||||||
Total Cost of Sales | 8,839 | 7,198 | 7,387 | 2,255 | 2,630 | 2,183 | |||||||||||||||||
Operating expenses (excluding depreciation and amortization): | |||||||||||||||||||||||
Manufacturing costs | 565 | 586 | 345 | 155 | 123 | 140 | |||||||||||||||||
Other operating expenses | 133 | 115 | 78 | 46 | 39 | 38 | |||||||||||||||||
Total operating expenses | 698 | 701 | 423 | 201 | 162 | 178 | |||||||||||||||||
Depreciation and amortization expenses | 186 | 187 | 116 | 60 | 46 | 54 | |||||||||||||||||
General and administrative expenses | 2 | 4 | 5 | 1 | — | — | |||||||||||||||||
(Gain) loss on asset disposals and impairments | (1 | ) | 4 | — | — | — | — | ||||||||||||||||
Operating Income (Loss) | $ | 109 | $ | 99 | $ | 714 | $ | 11 | $ | (11 | ) | $ | (31 | ) | |||||||||
Refining throughput (Mbpd) | 497 | 516 | 412 | 165 | 163 | 178 | |||||||||||||||||
Refining margin (a) | $ | 994 | $ | 995 | $ | 1,258 | $ | 273 | $ | 197 | $ | 201 | |||||||||||
Refining margin per throughput barrel (a) | $ | 11.05 | $ | 10.65 | $ | 16.85 | $ | 9.14 | $ | 6.70 | $ | 6.24 | |||||||||||
Manufacturing costs (excluding depreciation and amortization) per throughput barrel (a) | $ | 6.28 | $ | 6.27 | $ | 4.61 | $ | 5.19 | $ | 4.20 | $ | 4.35 | |||||||||||
(a) | See “Non-GAAP Reconciliations” section for further information regarding this non-GAAP measure. |
Capital Resources and Liquidity
Overview
Our capital resources and liquidity are impacted by changes in the price of crude oil and refined products, availability of trade credit, market uncertainty and a variety of additional factors beyond our control. These factors include the level of consumer demand for transportation fuels, weather conditions, fluctuations in seasonal demand, governmental regulations, geo-political conditions and overall market and global economic conditions. In addition, the MPC Merger Agreement restricts us from incurring any additional indebtedness outside the ordinary course of business, such as use of revolving credit agreements, letter of credit facilities and derivative instruments. See “Important Information Regarding Forward-Looking Statements” for further information related to risks and other factors. Future capital expenditures, as well as borrowings under our credit agreements and other sources of capital, may be affected by these conditions.
48 | | | |
Management’s Discussion and Analysis | ||
Capitalization
Capital Structure (in millions)
June 30, 2018 | December 31, 2017 | ||||||
Debt, including current maturities: | |||||||
Andeavor | |||||||
Credit Facility | $ | 855 | $ | 55 | |||
Senior Notes | 3,374 | 3,375 | |||||
Term Loan Facility | 51 | 56 | |||||
Capital Lease Obligations and Other | 129 | 131 | |||||
Andeavor Debt | 4,409 | 3,617 | |||||
Andeavor Logistics | |||||||
Credit Facilities | 665 | 423 | |||||
Senior Notes | 3,750 | 3,750 | |||||
Capital Lease Obligations and Other | 8 | 9 | |||||
Andeavor Logistics Debt | 4,423 | 4,182 | |||||
Total Debt | 8,832 | 7,799 | |||||
Unamortized Issuance Costs and Premiums (a) | (106 | ) | (114 | ) | |||
Debt, Net of Unamortized Issuance Costs | 8,726 | 7,685 | |||||
Total Equity | 13,567 | 13,415 | |||||
Total Capitalization | $ | 22,293 | $ | 21,100 | |||
Credit Facilities Overview
Our primary sources of liquidity are cash flows from operations with additional sources available under borrowing capacity from our revolving lines of credit. We ended the 2018 Period with $388 million of cash and cash equivalents. As of June 30, 2018, there were $855 million of borrowings under the Andeavor revolving credit facility, $665 million in borrowings under the Andeavor Logistics revolving credit facility and no borrowings under the Andeavor Logistics dropdown credit facility. We believe available capital resources will be adequate to meet our capital expenditure, working capital, debt service and planned acquisition requirements.
(a) | The unamortized issuance costs and premiums for Andeavor Logistics were $50 million and $54 million as of June 30, 2018 and December 31, 2017, respectively. |
Available Capacity Under Credit Facilities (in millions)
Total Capacity | Amount Borrowed as of June 30, 2018 | Outstanding Letters of Credit | Available Capacity as of June 30, 2018 | Weighted Average Interest Rate | Expiration | |||||||||||||||
Andeavor Revolving Credit Facility | $ | 3,000 | $ | 855 | $ | 17 | $ | 2,128 | 3.88 | % | September 30, 2020 | |||||||||
Andeavor Logistics Revolving Credit Facility | 1,100 | 665 | — | 435 | 3.83 | % | January 29, 2021 | |||||||||||||
Andeavor Logistics Dropdown Credit Facility | 1,000 | — | — | 1,000 | — | % | January 29, 2021 | |||||||||||||
Letter of Credit Facilities | 975 | — | 123 | 852 | ||||||||||||||||
Total Credit Facilities | $ | 6,075 | $ | 1,520 | $ | 140 | $ | 4,415 | ||||||||||||
Revolving Credit Facilities Expenses and Fees
Credit Facility | 30 Day Eurodollar (LIBOR) Rate at June 30, 2018 | Eurodollar Margin | Base Rate | Base Rate Margin | Commitment Fee (unused portion) | ||||
Andeavor Revolving Credit Facility ($3.0 billion) | 2.09% | 1.50% | 5.00% | 0.50% | 0.225% | ||||
Andeavor Logistics Revolving Credit Facility ($1.1 billion) | 2.09% | 1.75% | 5.00% | 0.75% | 0.300% | ||||
Andeavor Logistics Dropdown Credit Facility ($1.0 billion) | 2.09% | 1.76% | 5.00% | 0.76% | 0.300% | ||||
June 30, 2018 | 49 | ||
Management’s Discussion and Analysis | ||
Covenants
The Andeavor and Andeavor Logistics revolving credit facility agreements and indentures both contain representations and warranties, affirmative and negative covenants and events of default that we consider usual and customary for agreements of these types. The sole financial covenant that Andeavor is required to maintain, as of the last day of the fiscal quarter, is a Consolidated Total Net Debt to Total Capitalization (as defined in the Andeavor revolving credit facility agreement) of no greater than 60%. As of June 30, 2018, we were in compliance with this financial covenant.
Share Repurchases
We are authorized by the Board of Directors (the “Board”) to purchase shares of our common stock in open market transactions at our discretion. The Board’s authorization has no time limit and may be suspended or discontinued at any time. We can repurchase our common stock to offset the dilutive effect of stock-based compensation awards and to meet our obligations under employee benefit and compensation plans. During the six months ended June 30, 2018 and 2017, we repurchased approximately 2.6 million and 1.6 million shares of our common stock for approximately $258 million and $148 million, respectively. We have approximately $1.2 billion remaining under our authorized programs as of June 30, 2018. Among other things, the MPC Merger Agreement restricts the Company from purchasing any of its capital stock, with the exception of withholding shares to satisfy withholding tax obligations for outstanding equity awards.
Cash Dividends
We paid cash dividends totaling $89 million and $181 million for the three and six months ended June 30, 2018, respectively, based on a $0.59 per share quarterly cash dividend on common stock, and $65 million and $130 million for the three and six months ended June 30, 2017, respectively, based on a $0.55 per share quarterly cash dividend on common stock. On August 3, 2018, our Board declared a cash dividend of $0.59 per share payable on September 14, 2018 to shareholders of record on August 31, 2018. Among other things, the MPC Merger Agreement permits Andeavor to continue paying a quarterly dividend up to $0.59 per share.
Cash Flow Summary
Working capital (excluding cash) increased $379 million in the 2018 Period primarily due to lower current liabilities related to decreased RINs obligations in the period partially offset by the timing of cash receipts on receivables and cash payments on our payables.
Components of our Cash Flows (in millions)
Six Months Ended June 30, | |||||||
2018 | 2017 | ||||||
Cash Flows From (Used in): | |||||||
Operating activities | $ | 1,097 | $ | 770 | |||
Investing activities | (1,512 | ) | (1,448 | ) | |||
Financing activities | 260 | (1,556 | ) | ||||
Decrease in Cash and Cash Equivalents | $ | (155 | ) | $ | (2,234 | ) | |
Operating Activities
Net cash from operating activities during the 2018 Period increased to $1.1 billion from $770 million in the 2017 Period. The $327 million increase in cash from operating activities was primarily driven by higher net earnings offset by an increase in working capital (excluding cash).
Investing Activities
The net cash used in investing activities of $1.5 billion for the 2018 Period increased $64 million compared to $1.4 billion in the 2017 Period. This increase was primarily attributable to higher capital expenditures and investments in equity method investments, namely the Gray Oak Pipeline and the South Texas Gateway Terminal, during the 2018 Period partially offset by higher acquisition costs in the 2017 Period that included the North Dakota Gathering and Processing Assets acquired by Andeavor Logistics and Western Refining.
Financing Activities
Net cash used in financing activities during the 2017 Period totaled $1.6 billion compared to $260 million in cash from financing activities in the 2018 Period. The $1.8 billion increase in cash was largely due to higher net borrowings from credit facilities of $792 million along with lower repayments of debt of $1.6 billion partially offset by lower proceeds of $281 million from the issuance of Andeavor Logistics common units and $110 million of higher share repurchases in the 2018 Period.
50 | | | |
Management’s Discussion and Analysis | ||
Capital Expenditures
2018 Capital Expenditures by Project Category (in millions)
Three Months Ended June 30, 2018 | Six Months Ended June 30, 2018 | 2018 Expected (a) | |||||||||||||||||||||
Capital Expenditure Category | Andeavor (b) | Andeavor Logistics | Andeavor (b) | Andeavor Logistics | Andeavor (b) | Andeavor Logistics | |||||||||||||||||
Growth | $ | 167 | $ | 91 | $ | 341 | $ | 162 | $ | 480 | $ | 475 | |||||||||||
Maintenance | 76 | 14 | 193 | 26 | 410 | 105 | |||||||||||||||||
Regulatory | 34 | — | 80 | — | 180 | — | |||||||||||||||||
Total 2018 Capital Expenditures | $ | 277 | $ | 105 | $ | 614 | $ | 188 | $ | 1,070 | $ | 580 | |||||||||||
(a) | There have been no material changes to total 2018 planned capital expenditures from our plan outlined in our Annual Report on Form 10-K for the year ended December 31, 2017. Andeavor Logistics increased its planned spend from $325 million to $475 million to reflect increased expenditures associated with assets acquired from Andeavor in the third quarter of 2018 and the acceleration of crude oil gathering projects in the Permian Basin. |
(b) | Amounts listed for Andeavor exclude the amounts attributed to Andeavor Logistics. |
Turnaround Expenditures and Marketing Branding Costs (in millions)
Three Months Ended June 30, 2018 | Six Months Ended June 30, 2018 | 2018 Expected (a) | |||||||||
Turnaround expenditures | $ | 156 | $ | 359 | $ | 575 | |||||
Marketing branding costs | 13 | 23 | 75 | ||||||||
Total Expenditures | $ | 169 | $ | 382 | $ | 650 | |||||
(a) | There have been no material changes to our planned turnaround and branding charges expenditures and the refinery locations that have scheduled turnarounds from our plan outlined in our Annual Report on Form 10-K for the year ended December 31, 2017. |
On July 18, 2016, the DOJ lodged a complaint on behalf of the EPA and a Consent Decree with the Western District Court of Texas. Among other things, the Consent Decree required that our Martinez refinery meet certain annual emission limits for NOx by July 1, 2018. In February 2018, we informed the EPA that we will need additional time to satisfy requirements of the Consent Decree. We expect to spend additional capital expenditures in response to the Consent Decree. We are currently negotiating a resolution of this matter with the DOJ and the EPA, including the required timing to complete the project. The additional expenditures associated with the Consent Decree will not have a material impact on our liquidity, financial position or results of operations.
Off-Balance Sheet Arrangements
We have not entered into any transactions, agreements or other contractual arrangements that would result in off-balance sheet liabilities other than our leasing arrangements described in Note 15 of our Annual Report on Form 10-K for the year ended December 31, 2017.
Environmental Liabilities
We are subject to extensive federal, state and local environmental laws and regulations. These laws, which change frequently, regulate the discharge of materials into the environment and may require us to remove or mitigate the environmental effects of the disposal or release of petroleum or chemical substances at various sites, install additional controls or make other modifications to certain emission sources, equipment or facilities. See further discussion in Part II, Item 7 of our Annual Report on Form 10-K for the year ended December 31, 2017.
We are incurring and expect to continue to incur expenses for environmental remediation liabilities at a number of currently and previously owned or operated refining, pipeline, terminal and retail store properties. We have accrued liabilities totaling $224 million and $211 million at June 30, 2018 and December 31, 2017, respectively, including $7 million and $16 million for Andeavor Logistics, respectively. See Note 2 for the change in accrued environmental liabilities attributable to the Western Refining Acquisition.
Other than as described in Part II, Item 1 of this Report, no material developments occurred with respect to proceedings previously reported in our Annual Report on Form 10-K for the year ended December 31, 2017.
June 30, 2018 | 51 | ||
Management’s Discussion and Analysis | ||
Other Matters
In the ordinary course of business, we become party to lawsuits, administrative proceedings and governmental investigations, including regulatory, environmental and other matters. Large, and sometimes unspecified, damages or penalties may be sought from us in some matters. We have not established accruals for these matters unless a loss is probable, and the amount of loss is currently estimable. We assumed all contractual obligations of Western Refining in the Western Refining Acquisition.
On July 18, 2016, the DOJ lodged a complaint on behalf of the EPA and a Consent Decree with the Western District Court of Texas. Among other things, the Consent Decree required that our Martinez refinery meet certain annual emission limits for NOx by July 1, 2018. In February 2018, we informed the EPA that we will need additional time to satisfy requirements of the Consent Decree. See the discussion in Capital Expenditures above.
Non-GAAP Reconciliations
Reconciliation of Net Earnings to EBITDA (in millions)
Three Months Ended June 30, | Six Months Ended June 30, | ||||||||||||||
2018 | 2017 | 2018 | 2017 | ||||||||||||
Net Earnings | $ | 582 | $ | 87 | $ | 819 | $ | 174 | |||||||
Add back: | |||||||||||||||
Depreciation and amortization expenses | 292 | 240 | 574 | 466 | |||||||||||
Interest and financing costs, net | 109 | 96 | 211 | 194 | |||||||||||
Income tax expense | 167 | 56 | 226 | 77 | |||||||||||
EBITDA | $ | 1,150 | $ | 479 | $ | 1,830 | $ | 911 | |||||||
Marketing Segment Operating Income | $ | 209 | $ | 240 | $ | 337 | $ | 373 | |||||||
Depreciation and amortization expenses | 21 | 15 | 43 | 28 | |||||||||||
Other expense, net | (3 | ) | — | (1 | ) | — | |||||||||
Marketing Segment EBITDA | $ | 227 | $ | 255 | $ | 379 | $ | 401 | |||||||
Logistics Segment Operating Income | $ | 193 | $ | 163 | $ | 381 | $ | 313 | |||||||
Depreciation and amortization expenses | 83 | 68 | 162 | 126 | |||||||||||
Equity in earnings of equity method investments | 5 | 3 | 8 | 5 | |||||||||||
Other income, net | 1 | 2 | 2 | 4 | |||||||||||
Logistics Segment EBITDA | $ | 282 | $ | 236 | $ | 553 | $ | 448 | |||||||
Refining Segment Operating Income | $ | 607 | $ | 45 | $ | 812 | $ | 79 | |||||||
Depreciation and amortization expenses | 175 | 153 | 348 | 301 | |||||||||||
Equity in earnings (loss) of equity method investments | 6 | — | 13 | (2 | ) | ||||||||||
Other income (expense), net | (6 | ) | 8 | (4 | ) | 9 | |||||||||
Refining Segment EBITDA | $ | 782 | $ | 206 | $ | 1,169 | $ | 387 | |||||||
52 | | | |
Management’s Discussion and Analysis | ||
Fuel Margin and Convenience Margin Calculation (dollars in millions, except cents per gallon and percent)
Three Months Ended June 30, | Six Months Ended June 30, | ||||||||||||||
2018 | 2017 | 2018 | 2017 | ||||||||||||
Segment Operating Income | $ | 209 | $ | 240 | $ | 337 | $ | 373 | |||||||
Add back: | |||||||||||||||
Operating expenses | 178 | 105 | 345 | 173 | |||||||||||
Depreciation and amortization expenses | 21 | 15 | 43 | 28 | |||||||||||
General and administrative expenses | 14 | 5 | 23 | 10 | |||||||||||
Loss on asset disposals | 1 | — | 1 | — | |||||||||||
Marketing Margin | $ | 423 | $ | 365 | $ | 749 | $ | 584 | |||||||
Revenues | |||||||||||||||
Retail and Branded fuel sales | $ | 3,555 | $ | 2,676 | $ | 6,479 | $ | 5,000 | |||||||
Unbranded fuel sales | 3,053 | 2,197 | 5,580 | 3,956 | |||||||||||
Total fuel sales | 6,608 | 4,873 | 12,059 | 8,956 | |||||||||||
Merchandise | 204 | 71 | 380 | 77 | |||||||||||
Other sales | 42 | 27 | 80 | 42 | |||||||||||
Total Revenues | 6,854 | 4,971 | 12,519 | 9,075 | |||||||||||
Cost of Fuel and Other (excluding depreciation and amortization) | |||||||||||||||
Retail and Branded fuel costs | 3,259 | 2,394 | 5,969 | 4,529 | |||||||||||
Unbranded fuel costs | 3,011 | 2,157 | 5,500 | 3,904 | |||||||||||
Total fuel costs | 6,270 | 4,551 | 11,469 | 8,433 | |||||||||||
Purchases of merchandise | 146 | 51 | 272 | 54 | |||||||||||
Other costs | 15 | 4 | 29 | 4 | |||||||||||
Total Cost of Fuel and Other | 6,431 | 4,606 | 11,770 | 8,491 | |||||||||||
Marketing Margin | |||||||||||||||
Retail and Branded fuel margin | 296 | 282 | 510 | 471 | |||||||||||
Unbranded fuel margin | 42 | 40 | 80 | 52 | |||||||||||
Total fuel margin | 338 | 322 | 590 | 523 | |||||||||||
Merchandise margin | 58 | 20 | 108 | 23 | |||||||||||
Other margin | 27 | 23 | 51 | 38 | |||||||||||
Marketing Margin | $ | 423 | $ | 365 | $ | 749 | $ | 584 | |||||||
Merchandise Margin Percentage (a) | 28.9 | % | 28.3 | % | 28.5 | % | 28.8 | % | |||||||
Fuel Sales (millions of gallons) | |||||||||||||||
Retail and Branded fuel sales | 1,402 | 1,220 | 2,726 | 2,311 | |||||||||||
Unbranded fuel sales | 1,509 | 1,217 | 2,941 | 2,223 | |||||||||||
Total Fuel Sales | 2,911 | 2,437 | 5,667 | 4,534 | |||||||||||
Retail and Branded Fuel Margin (¢/gallon) (a) | 21.1 | ¢ | 23.2 | ¢ | 18.7 | ¢ | 20.5 | ¢ | |||||||
Unbranded Fuel Margin (¢/gallon) (a) | 2.9 | ¢ | 3.2 | ¢ | 2.7 | ¢ | 2.3 | ¢ | |||||||
Total Fuel Margin (¢/gallon) (a) | 11.6 | ¢ | 13.2 | ¢ | 10.4 | ¢ | 11.6 | ¢ | |||||||
(a) | Amounts may not recalculate due to rounding of dollar and volume information. |
June 30, 2018 | 53 | ||
Management’s Discussion and Analysis | ||
Average Margin on NGL Sales per Barrel Calculation (in millions, except per barrel amounts)
Three Months Ended June 30, | Six Months Ended June 30, | ||||||||||||||
2018 | 2017 | 2018 | 2017 | ||||||||||||
Segment Operating Income | $ | 193 | $ | 163 | $ | 381 | $ | 313 | |||||||
Add back: | |||||||||||||||
Operating expenses | 195 | 145 | 380 | 271 | |||||||||||
Depreciation and amortization expenses | 83 | 68 | 162 | 126 | |||||||||||
General and administrative expenses | 26 | 29 | 52 | 56 | |||||||||||
(Gain) loss on asset disposals and impairments | 1 | (25 | ) | 1 | (25 | ) | |||||||||
Other commodity purchases (a) | — | — | — | 2 | |||||||||||
Subtract: | |||||||||||||||
Terminalling revenues | (208 | ) | (159 | ) | (406 | ) | (304 | ) | |||||||
Pipeline transportation revenues | (40 | ) | (33 | ) | (71 | ) | (63 | ) | |||||||
Other terminalling revenues | (1 | ) | (2 | ) | (3 | ) | (2 | ) | |||||||
Gas gathering and processing revenues | (82 | ) | (87 | ) | (167 | ) | (167 | ) | |||||||
Crude oil gathering revenues | (69 | ) | (41 | ) | (134 | ) | (80 | ) | |||||||
Pass-thru and other revenues | (48 | ) | (33 | ) | (89 | ) | (76 | ) | |||||||
Margin on NGL Sales | $ | 50 | $ | 25 | $ | 106 | $ | 51 | |||||||
Divided by Total Volumes for the Period: | |||||||||||||||
NGLs sales volumes (Mbpd) | 9.1 | 7.3 | 10.4 | 7.4 | |||||||||||
Number of days in the period | 91 | 91 | 181 | 181 | |||||||||||
Total volumes for the period (thousands of barrels) (b) | 828 | 664 | 1,882 | 1,339 | |||||||||||
Average Margin on NGL Sales per Barrel (b) | $ | 59.77 | $ | 37.45 | $ | 55.81 | $ | 38.30 | |||||||
(a) | Included in the NGL expense for the six months ended June 30, 2017 was approximately $2 million of costs related to crude oil volumes obtained and immediately sold in connection with Andeavor Logistics’ acquisition of the North Dakota Gathering and Processing Assets. |
(b) | Amounts may not recalculate due to rounding of dollar and volume information. |
Refining Margin per Throughput Barrel Calculation (in millions, except per barrel amounts)
Three Months Ended June 30, | Six Months Ended June 30, | ||||||||||||||
2018 | 2017 | 2018 | 2017 | ||||||||||||
Segment Operating Income | $ | 607 | $ | 45 | $ | 812 | $ | 79 | |||||||
Add back: | |||||||||||||||
Manufacturing costs (excluding depreciation and amortization) | 511 | 460 | 1,033 | 881 | |||||||||||
Other operating expenses (excluding depreciation and amortization) | 141 | 104 | 250 | 199 | |||||||||||
Depreciation and amortization expenses | 175 | 153 | 348 | 301 | |||||||||||
General and administrative expenses | 3 | 3 | 7 | 5 | |||||||||||
(Gain) loss on asset disposals and impairments | (1 | ) | 3 | (1 | ) | 4 | |||||||||
Refining Margin | $ | 1,436 | $ | 768 | $ | 2,449 | $ | 1,469 | |||||||
Divided by Total Volumes for the Period: | |||||||||||||||
Total refining throughput (Mbpd) | 1,106 | 893 | 1,072 | 859 | |||||||||||
Number of days in the period | 91 | 91 | 181 | 181 | |||||||||||
Total volumes for the period (millions of barrels) (a) | 100.6 | 81.3 | 194.0 | 155.5 | |||||||||||
Refining Margin per Throughput Barrel (a) | $ | 14.26 | $ | 9.45 | $ | 12.62 | $ | 9.45 | |||||||
(a) | Amounts may not recalculate due to rounding of dollar and volume information. |
54 | | | |
Management’s Discussion and Analysis | ||
Refining Margin per Throughput Barrel Calculation by Region (in millions, except per barrel amounts)
Three Months Ended June 30, | |||||||||||||||||||||||
2018 | 2017 | 2018 | 2017 | 2018 | 2017 | ||||||||||||||||||
California (Los Angeles and Martinez) | Inland (Texas, Minnesota, North Dakota, Utah and New Mexico) | Pacific Northwest (Washington and Alaska) | |||||||||||||||||||||
Segment Operating Income | $ | 161 | $ | 73 | $ | 463 | $ | 19 | $ | (17 | ) | $ | (47 | ) | |||||||||
Add back: | |||||||||||||||||||||||
Manufacturing costs (excluding depreciation and amortization) | 284 | 291 | 171 | 96 | 56 | 73 | |||||||||||||||||
Other operating expenses (excluding depreciation and amortization) | 74 | 59 | 50 | 25 | 17 | 20 | |||||||||||||||||
Depreciation and amortization expenses | 95 | 93 | 59 | 33 | 21 | 27 | |||||||||||||||||
General and administrative expenses | 1 | 2 | 2 | 1 | — | — | |||||||||||||||||
(Gain) loss on asset disposals and impairments | (1 | ) | 3 | — | — | — | — | ||||||||||||||||
Refining Margin | $ | 614 | $ | 521 | $ | 745 | $ | 174 | $ | 77 | $ | 73 | |||||||||||
Divided by Total Volumes for the Period: | |||||||||||||||||||||||
Total refining throughput (Mbpd) | 555 | 531 | 418 | 192 | 133 | 170 | |||||||||||||||||
Number of days in the period | 91 | 91 | 91 | 91 | 91 | 91 | |||||||||||||||||
Total volumes for the period (millions of barrels) (a) | 50.5 | 48.3 | 38.0 | 17.5 | 12.1 | 15.5 | |||||||||||||||||
Refining Margin per Throughput Barrel (a) | $ | 12.18 | $ | 10.78 | $ | 19.56 | $ | 9.96 | $ | 6.31 | $ | 4.72 | |||||||||||
Six Months Ended June 30, | |||||||||||||||||||||||
2018 | 2017 | 2018 | 2017 | 2018 | 2017 | ||||||||||||||||||
California (Los Angeles and Martinez) | Inland (Texas, Minnesota, North Dakota, Utah and New Mexico) | Pacific Northwest (Washington and Alaska) | |||||||||||||||||||||
Segment Operating Income (Loss) | $ | 109 | $ | 99 | $ | 714 | $ | 11 | $ | (11 | ) | $ | (31 | ) | |||||||||
Add back: | |||||||||||||||||||||||
Manufacturing costs (excluding depreciation and amortization) | 565 | 586 | 345 | 155 | 123 | 140 | |||||||||||||||||
Other operating expenses (excluding depreciation and amortization) | 133 | 115 | 78 | 46 | 39 | 38 | |||||||||||||||||
Depreciation and amortization expenses | 186 | 187 | 116 | 60 | 46 | 54 | |||||||||||||||||
General and administrative expenses | 2 | 4 | 5 | 1 | — | — | |||||||||||||||||
(Gain) loss on asset disposals and impairments | (1 | ) | 4 | — | — | — | — | ||||||||||||||||
Refining Margin | $ | 994 | $ | 995 | $ | 1,258 | $ | 273 | $ | 197 | $ | 201 | |||||||||||
Divided by Total Volumes for the Period: | |||||||||||||||||||||||
Total refining throughput (Mbpd) | 497 | 516 | 412 | 165 | 163 | 178 | |||||||||||||||||
Number of days in the period | 181 | 181 | 181 | 181 | 181 | 181 | |||||||||||||||||
Total volumes for the period (millions of barrels) (a) | 90.0 | 93.4 | 74.6 | 29.9 | 29.5 | 32.2 | |||||||||||||||||
Refining Margin per Throughput Barrel (a) | $ | 11.05 | $ | 10.65 | $ | 16.85 | $ | 9.14 | $ | 6.70 | $ | 6.24 | |||||||||||
(a) | Amounts may not recalculate due to rounding of dollar and volume information. |
June 30, 2018 | 55 | ||
Management’s Discussion and Analysis | ||
Manufacturing Costs (Excluding Depreciation and Amortization) per Throughput Barrel Calculation (in millions, except per barrel amounts)
Three Months Ended June 30, | Six Months Ended June 30, | ||||||||||||||
2018 | 2017 | 2018 | 2017 | ||||||||||||
Total Refining Segment operating expenses (excluding depreciation and amortization) | $ | 652 | $ | 564 | $ | 1,283 | $ | 1,080 | |||||||
Subtract: | |||||||||||||||
Other operating expenses (excluding depreciation and amortization) | (141 | ) | (104 | ) | (250 | ) | (199 | ) | |||||||
Manufacturing Costs (excluding depreciation and amortization) | $ | 511 | $ | 460 | $ | 1,033 | $ | 881 | |||||||
Divided by Total Volumes for the Period: | |||||||||||||||
Total refining throughput (Mbpd) | 1,106 | 893 | 1,072 | 859 | |||||||||||
Number of days in the period | 91 | 91 | 181 | 181 | |||||||||||
Total volumes for the period (millions of barrels) (a) | 100.6 | 81.3 | 194.0 | 155.5 | |||||||||||
Manufacturing Costs (excluding depreciation and amortization) per Throughput Barrel (a) | $ | 5.07 | $ | 5.67 | $ | 5.32 | $ | 5.67 | |||||||
Manufacturing Costs (Excluding Depreciation and Amortization per Throughput Barrel Calculation by Region (in millions, except per barrel amounts)
Three Months Ended June 30, | |||||||||||||||||||||||
2018 | 2017 | 2018 | 2017 | 2018 | 2017 | ||||||||||||||||||
California (Los Angeles and Martinez) | Inland (Texas, Minnesota, North Dakota, Utah and New Mexico) | Pacific Northwest (Washington and Alaska) | |||||||||||||||||||||
Total operating expenses | $ | 358 | $ | 350 | $ | 221 | $ | 121 | $ | 73 | $ | 93 | |||||||||||
Subtract: | |||||||||||||||||||||||
Other operating expenses (excluding depreciation and amortization) | (74 | ) | (59 | ) | (50 | ) | (25 | ) | (17 | ) | (20 | ) | |||||||||||
Manufacturing Costs (excluding depreciation and amortization) | $ | 284 | $ | 291 | $ | 171 | $ | 96 | $ | 56 | $ | 73 | |||||||||||
Divided by Total Volumes for the Period: | |||||||||||||||||||||||
Total refining throughput (Mbpd) | 555 | 531 | 418 | 192 | 133 | 170 | |||||||||||||||||
Number of days in the period | 91 | 91 | 91 | 91 | 91 | 91 | |||||||||||||||||
Total volumes for the period (millions of barrels) (a) | 50.5 | 48.3 | 38.0 | 17.5 | 12.1 | 15.5 | |||||||||||||||||
Manufacturing Costs (excluding depreciation and amortization) per Throughput Barrel (a) | $ | 5.62 | $ | 6.02 | $ | 4.48 | $ | 5.49 | $ | 4.66 | $ | 4.72 | |||||||||||
(a) Amounts may not recalculate due to rounding of dollar and volume information. | |||||||||||||||||||||||
56 | | | |
Management’s Discussion and Analysis | ||
Six Months Ended June 30, | |||||||||||||||||||||||
2018 | 2017 | 2018 | 2017 | 2018 | 2017 | ||||||||||||||||||
California (Los Angeles and Martinez) | Inland (Texas, Minnesota, North Dakota, Utah and New Mexico) | Pacific Northwest (Washington and Alaska) | |||||||||||||||||||||
Total operating expenses | $ | 698 | $ | 701 | $ | 423 | $ | 201 | $ | 162 | $ | 178 | |||||||||||
Subtract: | |||||||||||||||||||||||
Other operating expenses (excluding depreciation and amortization) | (133 | ) | (115 | ) | (78 | ) | (46 | ) | (39 | ) | (38 | ) | |||||||||||
Manufacturing Costs (excluding depreciation and amortization) | $ | 565 | $ | 586 | $ | 345 | $ | 155 | $ | 123 | $ | 140 | |||||||||||
Divided by Total Volumes for the Period: | |||||||||||||||||||||||
Total refining throughput (Mbpd) | 497 | 516 | 412 | 165 | 163 | 178 | |||||||||||||||||
Number of days in the period | 181 | 181 | 181 | 181 | 181 | 181 | |||||||||||||||||
Total volumes for the period (millions of barrels) (a) | 90.0 | 93.4 | 74.6 | 29.9 | 29.5 | 32.2 | |||||||||||||||||
Manufacturing Costs (excluding depreciation and amortization) per Throughput Barrel (a) | $ | 6.28 | $ | 6.27 | $ | 4.61 | $ | 5.19 | $ | 4.20 | $ | 4.35 | |||||||||||
(a) | Amounts may not recalculate due to rounding of dollar and volume information. |
Important Information Regarding Forward-Looking Statements
This report (including information incorporated by reference) contains “forward-looking statements” within the meaning of Section 27A of the Securities Act of 1933 and Section 21E of the Securities Exchange Act of 1934. All statements other than statements of historical fact, including without limitation statements regarding our business strategy and goals, and expectations regarding refining margins, revenues, cash flows, capital expenditures, turnaround expenses, other financial items, growth, acquisitions, our market position, future operations, margins and profitability, are forward-looking statements. Forward-looking statements may be identified by use of the words “anticipate,” “believe,” “could,” “estimate,” “expect,” “intend,” “may,” “plan,” “predict,” “project,” “will,” “would” and similar terms and phrases. Although we believe our assumptions concerning future events are reasonable, a number of risks, uncertainties and other factors could cause actual results and trends to differ materially from those projected, including, but not limited to:
• | the possibility that the proposed merger with Marathon Petroleum Corporation is not consummated in a timely manner or at all; |
• | the diversion of management in connection with the proposed merger with Marathon Petroleum Corporation; |
• | the constantly changing margin between the price we pay for crude oil and other refinery feedstocks as well as RINs and environmental credits, and the prices at which we are able to sell refined products; |
• | changes in the expected value of and benefits derived from acquisitions and capital projects, including any inability to successfully integrate acquisitions, realize expected synergies or achieve operational efficiency and effectiveness; |
• | changes in global economic conditions on our business, especially in California, and the business of our suppliers, customers, business partners and credit lenders; |
• | changes in fuel and utility costs for our facilities; |
• | changes in the cost or availability of third-party vessels, pipelines and other means of transporting crude oil feedstocks and refined products; |
• | regulatory and other requirements concerning the transportation of crude oil, particularly in the areas where we operate; |
• | changes in the carrying costs of our inventory; |
• | the timing and extent of changes in commodity prices and underlying demand for our refined products, natural gas and NGLs; |
• | the availability and costs of crude oil, other refinery feedstocks, refined products and RINs; |
• | changes in our cash flow from operations; |
• | direct or indirect effects on our business resulting from actual or threatened terrorist incidents, cyber-security breaches or acts of war; |
• | weather conditions, earthquakes or other natural disasters affecting our operations or the areas in which our refined products are marketed; |
• | actions of customers and competitors; |
• | state and federal environmental, economic, health and safety, energy and other policies and regulations, including those related to climate change and any changes therein, and any legal or regulatory investigations, delays in obtaining necessary approvals and permits, compliance costs or other factors beyond our control; |
• | changes in tax policies or the tax status of Andeavor Logistics; |
• | adverse rulings, judgments, or settlements in litigation or other legal or tax matters, including unexpected |
June 30, 2018 | 57 | ||
Management’s Discussion and Analysis | ||
environmental remediation costs in excess of any reserves;
• | operational hazards inherent in refining operations and in transporting and storing crude oil, natural gas, NGLs and refined products; |
• | changes in our credit profile; |
• | changes in capital requirements or in execution of planned capital projects; |
• | disruptions due to equipment interruption or failure at our facilities or third-party facilities; |
• | seasonal variations in demand for refined products and natural gas; |
• | risks related to labor relations and workplace safety; |
• | political developments; |
• | risks related to our expanding presence in Mexico; and |
• | the factors described in greater detail under “Competition” and “Risk Factors” in Items 1 and 1A of our Annual Report on Form 10-K for the year ended December 31, 2017, in “Risk Factors” in Part II, Item 1A of this Quarterly Report on Form 10-Q, and our other filings with the SEC. |
All forward-looking statements included in this report are based on information available to us on the date of this report. We undertake no obligation to revise or update any forward-looking statements as a result of new information, future events or otherwise.
Item 3. Quantitative and Qualitative Disclosures about Market Risk
There have been no material changes to our market risks as of and for the six months ended June 30, 2018 from the risks discussed in Part II, Item 7A of our Annual Report on Form 10-K for the year ended December 31, 2017.
Item 4. Controls and Procedures
Our disclosure controls and procedures are designed to provide reasonable assurance that the information that we are required to disclose in reports we file under the Securities Exchange Act of 1934, as amended (“the Exchange Act”), is accumulated and appropriately communicated to management. With the exception of the new ERP implementation described below, there have been no changes in our internal control over financial reporting identified in connection with the evaluation required by paragraph (d) of Exchange Act Rules 13a-15 or 15d-15 that occurred during the second quarter of 2018 that have materially affected, or are reasonably likely to materially affect, our internal control over financial reporting.
On April 1, 2018, we implemented the first phases of a new ERP system designed to upgrade our technology and improve our financial and operational information. As a result of the system implementation, we updated our framework of internal controls to reflect the system enhancements and corresponding changes to our business processes. While we believe that the ERP system and related changes to internal controls will ultimately strengthen our internal control over financial reporting, there are inherent risks in implementing a new ERP system. We will continue to evaluate and test these control changes in order to provide certification as of December 31, 2018 on the effectiveness of our internal control over financial reporting.
We carried out an evaluation required by Rule 13a-15(b) of the Exchange Act, under the supervision and with the participation of our management, including the Chief Executive Officer and Chief Financial Officer, of the effectiveness of the design and operation of our disclosure controls and procedures at the end of the reporting period. Based on that evaluation, the Chief Executive Officer and Chief Financial Officer concluded that our disclosure controls and procedures were effective as of the end of the reporting period.
58 | | | |
Legal Proceedings and Risk Factors | ||
Part II - Other Information
Item 1. Legal Proceedings
Litigation Matters
In the ordinary course of business, we may become party to lawsuits, administrative proceedings and governmental investigations, including environmental, regulatory and other matters. The outcome of these matters cannot always be predicted accurately, but we accrue liabilities for these matters if we have determined that it is probable a loss has been incurred and the loss can be reasonably estimated. While it is not possible to predict the outcome of such proceedings, if one or more of them were decided against us, we believe there would be no material impact on our liquidity, consolidated financial position or consolidated results of operations.
Merger-Related Litigation
Between June 20 and July 11, 2018, six putative class actions were filed against some or all of Andeavor, the directors of Andeavor, and MPC and certain of its subsidiaries, relating to the MPC Merger. Two complaints, Malka Raul v. Andeavor, et al., and Stephen Bushansky v. Andeavor, et al., were filed in the U.S. District Court for the Western District of Texas. Four other complaints, captioned The Vladimir Gusinsky Rev. Trust v. Andeavor, et al., Lawrence Zucker v. Andeavor, et al., Mel Gross v. Andeavor, et al., and Hudson v. Andeavor, et al., were filed in the U.S. District Court for the District of Delaware. The complaints generally allege that Andeavor, the directors of Andeavor, MPC and certain of its subsidiaries disseminated a false or misleading registration statement regarding the proposed merger in violation of Section 14(a) of the Exchange Act and Rule 14a-9 promulgated thereunder. Specifically, the complaints allege that the registration statement filed by MPC misstated or omitted material information regarding the parties’ financial projections and the analyses performed by Andeavor’s and MPC’s respective financial advisors, and that disclosure of material information is necessary in light of preclusive deal protection provisions in the merger agreement, the financial interests of Andeavor’s officers and directors in completing the deal, and the financial interests of Andeavor’s and MPC’s respective financial advisors. The complaints further allege that the directors of Andeavor and/or MPC are liable for these violations as “controlling persons” of Andeavor under Section 20(a) of the Exchange Act. The complaints seek injunctive relief, including to enjoin and/or rescind the MPC Merger, damages in the event the merger is consummated, and an award of attorneys’ fees, in addition to other relief.
Additional lawsuits arising out of the MPC Merger may be filed in the future. There can be no assurance that any of the defendants will be successful in the outcome of the pending or any potential future lawsuits. A preliminary injunction could delay or jeopardize the completion of the MPC Merger, and an adverse judgment granting permanent injunctive relief could indefinitely enjoin the completion of the MPC Merger. Andeavor and Marathon believe that the lawsuits are without merit and intend to defend vigorously against them and any other lawsuits challenging the transaction.
Environmental Matters
SEC regulations require us to report certain information about any proceeding arising under federal, state or local provisions regulating the discharge of materials into the environment or protecting the environment if a governmental authority is a party to the proceeding and we reasonably believe that the proceeding will result in monetary sanctions of $100,000 or more. We reported these proceedings in our Annual Report on Form 10-K for the year ended December 31, 2017 or in our Quarterly Report on Form 10-Q for the quarter ended March 31, 2018. The information below describes material developments to those proceedings and/or new proceedings during the second quarter of 2018. While it is not possible to predict the outcome of such proceedings, if one or more of them were decided against us, we believe there would be no material impact on our liquidity, consolidated financial position or consolidated results of operations.
On April 6, 2018, we received an offer to settle five Notices of Violations (“NOV”) from the California South Coast Air Quality Management District (“District”). The Notices were issued to the Los Angeles refinery between June and October 2017, alleging violation of various federal and District air emission regulations. We are currently evaluating the settlement offer.
On June 14, 2018, we received an offer to settle a NOV issued by the California Air Resources Board (“CARB”) in May 2018. The NOV was issued in response to our having reported in December 2017 that certain batches of gasoline produced in December did not meet California fuel standards. We are unable to predict the timing of the resolution of this matter.
In June 2018 we agreed to settle two NOVs issued by CARB. The NOVs were issued in February 2016 and allege certain batches of fuels produced in June and July 2015 at our Martinez and Los Angeles refineries violated California fuel standards.
June 30, 2018 | 59 | ||
Risk Factors and Unregistered Sales of Equity Securities | ||
Item 1A. Risk Factors
There have been no significant changes from the risk factors previously disclosed in Item 1A of our Annual Report on Form 10-K for the year ended December 31, 2017, except as follows.
Our stockholders will have a reduced ownership and voting interest in the combined company after the merger with MPC and will exercise less influence over management.
Currently, our stockholders have the right to vote in the election of the Andeavor board and the power to approve or reject any matters requiring stockholder approval under Delaware law and under our certificate of incorporation and bylaws. Upon completion of the MPC Merger, each of our stockholders who receive shares of MPC common stock in the MPC Merger will become a stockholder of MPC with a percentage ownership of MPC that is smaller than our stockholders’ current percentage ownership of Andeavor. Based on the number of issued and outstanding shares of MPC common stock and Andeavor common stock as of April 26, 2018 and on the exchange ratio of 1.87, after the merger our stockholders are expected to become owners of approximately 34% of the outstanding shares of MPC common stock, without giving effect to any shares of MPC common stock held by our stockholders prior to the completion of the MPC Merger. Even if all former Andeavor stockholders voted together on all matters presented to MPC stockholders from time to time, the former Andeavor stockholders would exercise significantly less influence over MPC after the completion of the merger relative to their influence over us prior to the completion of the MPC Merger, and thus would have a less significant impact on the election of MPC’s board and on the approval or rejection of future MPC proposals submitted to a stockholder vote.
The MPC Merger Agreement limits our ability to pursue alternatives to the merger.
The MPC Merger Agreement contains provisions that may discourage a third party from submitting an acquisition proposal to us that might result in greater value to our stockholders than the MPC Merger, or may result in a potential competing acquirer of Andeavor proposing to pay a lower per share price to acquire Andeavor than it might otherwise have proposed to pay. These provisions include a general prohibition on us from soliciting or, subject to certain exceptions relating to the exercise of fiduciary duties by the Andeavor board, entering into discussions with any third party regarding any acquisition proposal or offer for a competing transaction. We also have an unqualified obligation to submit the MPC merger proposal to a vote by our stockholders, even if we receive an alternative acquisition proposal that our board believes is superior to the MPC Merger, unless we terminate the MPC Merger Agreement in accordance with its terms prior to such time. In the event that we terminate the MPC Merger Agreement to enter into an alternative acquisition that our board believes is superior to the MPC Merger, we are required by the MPC Merger Agreement to pay MPC a termination fee of $600 million.
The MPC Merger Agreement may be terminated in accordance with its terms and the MPC Merger may not be completed.
The MPC Merger Agreement is subject to a number of conditions that must be fulfilled in order to complete the MPC Merger. Those conditions include, among others: MPC’s registration statement on Form S-4 having become effective under the Securities Act of 1933, the adoption of the MPC Merger Agreement by our stockholders, the approval by MPC stockholders of the issuance of shares of MPC common stock in connection with the MPC Merger, the approval to list MPC common stock issuable in connection with the MPC Merger on the New York Stock Exchange, the expiration or termination of the waiting period applicable to the MPC Merger under the HSR Act without the imposition of a burdensome condition, the absence of any governmental order or law prohibiting the consummation of the MPC Merger, the accuracy of representations and warranties under the MPC Merger Agreement (subject to the materiality standards set forth in the MPC Merger Agreement), MPC’s and Andeavor’s performance of their respective obligations under the MPC Merger Agreement in all material respects and Andeavor’s receipt of a written opinion of Sullivan & Cromwell LLP (or another nationally recognized law firm selected by Andeavor) regarding the U.S. federal income tax treatment of the transaction. These conditions to the closing of the MPC Merger may not be fulfilled in a timely manner or at all, and, accordingly, the MPC Merger may be delayed or may not be completed.
In addition, the parties can mutually decide to terminate the MPC Merger Agreement at any time, before or after stockholder approval, or, if the MPC Merger is not completed by April 29, 2019, either MPC or Andeavor may choose to terminate the MPC Merger Agreement and not proceed with the MPC Merger. We and MPC may elect to terminate the MPC Merger Agreement in certain other circumstances.
Failure to complete the MPC Merger could negatively impact the price of shares of our common stock, as well as our respective future businesses and financial results.
The MPC Merger Agreement contains a number of conditions that must be satisfied or waived prior to the completion of the MPC Merger. There can be no assurance that all of the conditions to the MPC Merger will be so satisfied or waived. If the conditions to the MPC Merger are not satisfied or waived, we and MPC will be unable to complete the MPC Merger and the MPC Merger Agreement may be terminated.
60 | | | |
Risk Factors | ||
If the MPC Merger is not completed for any reason, including the failure to receive the required approval of our stockholders, our business and financial results may be adversely affected as follows:
• | we may experience negative reactions from the financial markets, including negative impacts on the market price of shares of our common stock; |
• | the manner in which customers, vendors, business partners and other third parties perceive us may be negatively impacted, which in turn could affect our marketing operations or our ability to compete for new business or obtain renewals in the marketplace more broadly; |
• | we may experience negative reactions from employees; and |
• | we will have expended time and resources that could otherwise have been spent on our existing businesses and the pursuit of other opportunities that could have been beneficial to the company, and our ongoing business and financial results may be adversely affected. |
If the MPC Merger Agreement is terminated under specified circumstances, we may be required to pay MPC a termination fee or other termination-related payment.
We will be subject to business uncertainties while the MPC Merger is pending, which could adversely affect our businesses.
Uncertainty about the effect of the MPC Merger on employees and customers may have an adverse effect on us. These uncertainties may impair our ability to attract, retain and motivate key personnel until the MPC Merger is completed and for a period of time thereafter, and could cause customers and other constituencies of us to seek to change their existing business relationships with us. Employee retention may be particularly challenging while the MPC Merger is pending, as employees may experience uncertainty about their roles within MPC following the completion of the MPC Merger. In addition, the MPC Merger Agreement restricts us from entering into certain corporate transactions and taking other specified actions without the consent of MPC and generally requires us to continue operating in the ordinary course, until completion of the MPC Merger. These restrictions may prevent us from pursuing attractive business opportunities that may arise prior to the completion of the MPC Merger.
We will incur transaction and merger-related costs in connection with the MPC Merger, which may be in excess of those anticipated by us.
We have incurred and will incur substantial expenses in connection with the negotiation and completion of the transactions contemplated by the MPC Merger Agreement, including advisor fees and the costs and expenses of filing, printing and mailing the joint proxy statement/prospectus.
We expect to continue to incur a number of non-recurring costs associated with completing the MPC Merger, combining the operations of the two companies and achieving desired synergies. These fees and costs have been, and will continue to be, substantial. The substantial majority of the non-recurring expenses will consist of transaction costs related to the MPC Merger and include, among others, employee retention costs, fees paid to financial, legal and accounting advisors, severance and benefit costs and filing fees.
We will also incur transaction fees and costs related to formulating and implementing integration plans, including facilities and systems consolidation costs and employment-related costs. Additional unanticipated costs also may be incurred while the MPC Merger is pending and for a period thereafter for the integration of the two companies’ businesses. Although we expect that the elimination of duplicative costs, as well as the realization of other efficiencies related to the integration of the businesses, should allow us to offset integration-related costs over time, this net benefit may not be achieved in the near term, or at all.
The costs described above, as well as other unanticipated costs and expenses, could have a material adverse effect on the financial condition and operating results of MPC following the completion of the MPC Merger.
Certain of these costs will be borne by us even if the MPC Merger is not completed.
Lawsuits have been filed against Andeavor, the directors of Andeavor, and MPC and certain of its subsidiaries challenging the adequacy of the disclosures made in the registration statement filed by MPC, and an adverse ruling in one or more of these lawsuits, or potential future lawsuits, may prevent the MPC Merger from being completed.
Between June 20 and July 11, 2018, six putative class actions were filed against some or all of Andeavor, the directors of Andeavor, and MPC and certain of its subsidiaries, relating to the MPC Merger. The complaints generally allege that Andeavor, the directors of Andeavor, MPC and certain of its subsidiaries disseminated a false or misleading registration statement regarding the proposed merger in violation of Section 14(a) of the Exchange Act and Rule 14a-9 promulgated thereunder. Specifically, the complaints allege that the registration statement filed by MPC misstated or omitted material information regarding the parties’ financial projections and the analyses performed by Andeavor’s and MPC’s respective financial advisors, and that disclosure of material information is necessary in light of preclusive deal protection provisions in the merger agreement,
June 30, 2018 | 61 | ||
Risk Factors and Unregistered Sales of Equity Securities | ||
the financial interests of Andeavor’s officers and directors in completing the deal, and the financial interests of Andeavor’s and MPC’s respective financial advisors. The complaints further allege that the directors of Andeavor and/or MPC are liable for these violations as “controlling persons” of Andeavor under Section 20(a) of the Exchange Act. The complaints seek injunctive relief, including to enjoin and/or rescind the MPC Merger, damages in the event the merger is consummated, and an award of attorneys’ fees, in addition to other relief.
Additional lawsuits arising out of the MPC Merger may be filed in the future. There can be no assurance that any of the defendants will be successful in the outcome of the pending or any potential future lawsuits. A preliminary injunction could delay or jeopardize the completion of the MPC Merger, and an adverse judgment granting permanent injunctive relief could indefinitely enjoin the completion of the MPC Merger.
Item 2. Unregistered Sales of Equity Securities and Use of Proceeds
Purchases by Andeavor of its Common Stock
Period | Total Number of Shares Purchased (a) | Average Price Paid per Share | Total Number of Shares Purchased as Part of Publicly Announced Plans or Programs (b) | Approximate Dollar Value of Shares that May Yet Be Purchased Under the Plans or Programs (in Millions) (b) | |||||||||
April 2018 | 24,554 | $ | 100.82 | 23,088 | $ | 1,156 | |||||||
May 2018 | 329 | $ | 138.77 | — | $ | 1,156 | |||||||
June 2018 | 507 | $ | 149.03 | — | $ | 1,156 | |||||||
Total | 25,390 | 23,088 | |||||||||||
(a) | Includes 2,302 shares acquired from employees during the second quarter of 2018 to satisfy tax withholding obligations in connection with the vesting of performance share awards, market stock units and restricted stock issued to them. |
(b) | The Board authorized a $1.0 billion share repurchase program on October 28, 2015. On November 16, 2016, the Board approved an additional $1.0 billion of share repurchases. |
Item 6. Exhibits
(a) Exhibits
Incorporated by Reference (File No. 1-3473, unless otherwise indicated) | ||||||||
Exhibit Number | Description of Exhibit | Form | Exhibit | Filing Date | ||||
‡ 2.1 | 8-K | 2.1 | 11/18/2016 | |||||
‡ 2.2 | 8-K | 2.1 | 08/14/2017 | |||||
‡ 2.3 | 8-K | 2.1 | 11/8/2017 | |||||
‡ 2.4 | 10-Q | 2.4 | 5/7/18 | |||||
‡ 2.5 | 8-K | 2.1 | 5/1/2018 | |||||
*2.6 | ||||||||
3.1 | 8-K | 3.1 | 8/1/2017 | |||||
3.2 | 8-K | 3.2 | 8/1/2017 | |||||
*10.1 | ||||||||
62 | | | |
Exhibits | ||
Incorporated by Reference (File No. 1-3473, unless otherwise indicated) | ||||||||
Exhibit Number | Description of Exhibit | Form | Exhibit | Filing Date | ||||
*10.2 | ||||||||
*10.3 | ||||||||
*10.4 | ||||||||
10.5 | 8-K | 99.1 | 5/1/2018 | |||||
10.6 | S-8 (File No. 333-224688) | 99.1 | 5/4/2018 | |||||
*31.1 | ||||||||
*31.2 | ||||||||
*32.1 | ||||||||
*32.2 | ||||||||
**101.INS | XBRL Instance Document | |||||||
**101.SCH | XBRL Taxonomy Extension Schema Document | |||||||
**101.CAL | XBRL Taxonomy Extension Calculation Linkbase Document | |||||||
**101.DEF | XBRL Taxonomy Extension Definition Linkbase Document | |||||||
**101.LAB | XBRL Taxonomy Extension Label Linkbase Document | |||||||
**101.PRE | XBRL Taxonomy Extension Presentation Linkbase Document | |||||||
‡ | Certain schedules have been omitted pursuant to Item 601(b)(2) of Regulation S-K. A copy of any omitted schedule will be furnished supplementally to the SEC on request. |
* | Filed herewith. |
** | Submitted electronically herewith. |
As permitted by Item 601(b)(4)(iii)(A) of Regulation S-K, the Registrant has not filed with this Report certain instruments defining the rights of holders of long-term debt of the Registrant and its subsidiaries because the total amount of securities authorized under any of such instruments does not exceed 10% of the total assets of the Registrant and its subsidiaries on a consolidated basis. The Registrant agrees to furnish a copy of any such agreements to the SEC upon request.
June 30, 2018 | 63 | ||
Signatures
Pursuant to the requirements of the Securities Exchange Act of 1934, the registrant has duly caused this report to be signed on its behalf by the undersigned thereunto duly authorized.
ANDEAVOR | ||
Date: | August 7, 2018 | /s/ STEVEN M. STERIN |
Steven M. Sterin | ||
Executive Vice President and Chief Financial Officer | ||
(Principal Financial Officer and Duly Authorized Officer) | ||
64 | | | |