Attached files
| file | filename |
|---|---|
| EX-32.2 - CERTIFICATION OF CHIEF FINANCIAL OFFICER PURSUANT TO SECTION 906 - ANDEAVOR | tso2q2014-ex322.htm |
| EX-31.2 - CERTIFICATION OF CHIEF FINANCIAL OFFICER PURSUANT TO SECTION 302 - ANDEAVOR | tso2q2014-ex312.htm |
| EX-32.1 - CERTIFICATION OF CHIEF EXECUTIVE OFFICER PURSUANT TO SECTION 906 - ANDEAVOR | tso2q2014-ex321.htm |
| EX-10.1 - NON-EMPLOYEE DIRECTOR COMPENSATION PROGRAM. - ANDEAVOR | tso2q2014-ex101.htm |
| EXCEL - IDEA: XBRL DOCUMENT - ANDEAVOR | Financial_Report.xls |
| EX-31.1 - CERTIFICATION OF CHIEF EXECUTIVE OFFICER PURSUANT TO SECTION 302 - ANDEAVOR | tso2q2014-ex311.htm |
UNITED STATES
SECURITIES AND EXCHANGE COMMISSION
Washington, D.C. 20549
FORM 10‑Q
(Mark One)
þ | QUARTERLY REPORT PURSUANT TO SECTION 13 OR 15(d) OF THE SECURITIES EXCHANGE ACT OF 1934 |
For the quarterly period ended June 30, 2014
or
¨ | TRANSITION REPORT PURSUANT TO SECTION 13 OR 15(d) OF THE SECURITIES EXCHANGE ACT OF 1934 |
For the transition period from_____________________to__________
Commission File Number 1‑3473
TESORO CORPORATION
(Exact name of registrant as specified in its charter)
Delaware | 95‑0862768 | |
(State or other jurisdiction of | (I.R.S. Employer | |
incorporation or organization) | Identification No.) | |
19100 Ridgewood Pkwy, San Antonio, Texas 78259-1828 | ||
(Address of principal executive offices) (Zip Code) | ||
210-626-6000 | ||
(Registrant’s telephone number, including area code) | ||
Indicate by check mark whether the registrant (1) has filed all reports required to be filed by Section 13 or 15(d) of the Securities Exchange Act of 1934 during the preceding 12 months (or for such shorter period that the registrant was required to file such reports), and (2) has been subject to such filing requirements for the past 90 days. Yes þ No ¨
Indicate by check mark whether the registrant has submitted electronically and posted on its corporate Web site, if any, every Interactive Data File required to be submitted and posted pursuant to Rule 405 of Regulation S-T (§232.405 of this chapter) during the preceding 12 months (or for such shorter period that the registrant was required to submit and post such files). Yes þ No ¨
Indicate by check mark whether the registrant is a large accelerated filer, an accelerated filer, a non-accelerated filer, or a smaller reporting company. See definitions of “large accelerated filer,” “accelerated filer” and “smaller reporting company” in Rule 12b-2 of the Exchange Act.
Large accelerated filer | þ | Accelerated filer | ¨ | |||
Non-accelerated filer | ¨ (Do not check if a smaller reporting company) | Smaller reporting company | ¨ | |||
Indicate by check mark whether the registrant is a shell company (as defined in Rule 12b-2 of the Exchange Act). Yes ¨ No þ
There were 128,239,392 shares of the registrant’s Common Stock outstanding at July 28, 2014.
TESORO CORPORATION
QUARTERLY REPORT ON FORM 10-Q
FOR THE QUARTERLY PERIOD ENDED JUNE 30, 2014
TABLE OF CONTENTS
PART I. FINANCIAL INFORMATION | Page |
PART II. OTHER INFORMATION | |
2
PART I — FINANCIAL INFORMATION
ITEM 1. FINANCIAL STATEMENTS
TESORO CORPORATION
CONDENSED STATEMENTS OF CONSOLIDATED OPERATIONS
(Unaudited)
Three Months Ended June 30, | Six Months Ended June 30, | ||||||||||||||
2014 | 2013 | 2014 | 2013 | ||||||||||||
(In millions, except per share amounts) | |||||||||||||||
REVENUES (a) | $ | 11,104 | $ | 8,897 | $ | 21,037 | $ | 16,244 | |||||||
COSTS AND EXPENSES: | |||||||||||||||
Cost of sales (a) | 9,867 | 7,909 | 18,815 | 14,472 | |||||||||||
Operating expenses | 598 | 441 | 1,189 | 809 | |||||||||||
Selling, general and administrative expenses | 92 | 64 | 123 | 175 | |||||||||||
Depreciation and amortization expense | 135 | 111 | 265 | 216 | |||||||||||
(Gain) loss on asset disposals and impairments | 2 | 8 | (3 | ) | 15 | ||||||||||
OPERATING INCOME | 410 | 364 | 648 | 557 | |||||||||||
Interest and financing costs, net | (41 | ) | (33 | ) | (118 | ) | (63 | ) | |||||||
Other income, net | 3 | 56 | 2 | 56 | |||||||||||
EARNINGS BEFORE INCOME TAXES | 372 | 387 | 532 | 550 | |||||||||||
Income tax expense | 132 | 138 | 188 | 196 | |||||||||||
NET EARNINGS FROM CONTINUING OPERATIONS | 240 | 249 | 344 | 354 | |||||||||||
Loss from discontinued operations, net of tax | — | (11 | ) | (1 | ) | (12 | ) | ||||||||
NET EARNINGS | 240 | 238 | 343 | 342 | |||||||||||
Less: Net earnings from continuing operations attributable to noncontrolling interest | 16 | 11 | 41 | 22 | |||||||||||
NET EARNINGS ATTRIBUTABLE TO TESORO CORPORATION | $ | 224 | $ | 227 | $ | 302 | $ | 320 | |||||||
NET EARNINGS (LOSS) ATTRIBUTABLE TO TESORO CORPORATION | |||||||||||||||
Continuing operations | $ | 224 | $ | 238 | $ | 303 | $ | 332 | |||||||
Discontinued operations | — | (11 | ) | (1 | ) | (12 | ) | ||||||||
Total | $ | 224 | $ | 227 | $ | 302 | $ | 320 | |||||||
NET EARNINGS (LOSS) PER SHARE - BASIC: | |||||||||||||||
Continuing operations | $ | 1.73 | $ | 1.75 | $ | 2.33 | $ | 2.44 | |||||||
Discontinued operations | — | (0.08 | ) | (0.01 | ) | (0.09 | ) | ||||||||
Total | $ | 1.73 | $ | 1.67 | $ | 2.32 | $ | 2.35 | |||||||
Weighted average common shares outstanding - Basic | 129.3 | 135.8 | 130.3 | 136.4 | |||||||||||
NET EARNINGS (LOSS) PER SHARE - DILUTED: | |||||||||||||||
Continuing operations | $ | 1.70 | $ | 1.72 | $ | 2.29 | $ | 2.39 | |||||||
Discontinued operations | — | (0.08 | ) | (0.01 | ) | (0.09 | ) | ||||||||
Total | $ | 1.70 | $ | 1.64 | $ | 2.28 | $ | 2.30 | |||||||
Weighted average common shares outstanding - Diluted | 131.5 | 138.2 | 132.7 | 138.9 | |||||||||||
DIVIDENDS PER SHARE | $ | 0.25 | $ | 0.20 | $ | 0.50 | $ | 0.40 | |||||||
SUPPLEMENTAL INFORMATION: | |||||||||||||||
(a) Includes excise taxes collected by our retail segment (excluding credits) | $ | 152 | $ | 143 | $ | 293 | $ | 272 | |||||||
The accompanying notes are an integral part of these condensed consolidated financial statements.
3
TESORO CORPORATION
CONDENSED STATEMENTS OF CONSOLIDATED COMPREHENSIVE INCOME
(Unaudited)
Three Months Ended June 30, | Six Months Ended June 30, | ||||||||||||||
2014 | 2013 | 2014 | 2013 | ||||||||||||
(In millions) | |||||||||||||||
COMPREHENSIVE INCOME | |||||||||||||||
Net Earnings | $ | 240 | $ | 238 | $ | 343 | $ | 342 | |||||||
Pension and other post retirement benefit liability adjustments, net of tax expense of $48 million | — | 73 | — | 73 | |||||||||||
Total comprehensive income | 240 | 311 | 343 | 415 | |||||||||||
Less: Noncontrolling interest in comprehensive income | 16 | 11 | 41 | 22 | |||||||||||
COMPREHENSIVE INCOME ATTRIBUTABLE TO TESORO CORPORATION | $ | 224 | $ | 300 | $ | 302 | $ | 393 | |||||||
The accompanying notes are an integral part of these condensed consolidated financial statements.
4
TESORO CORPORATION
CONDENSED CONSOLIDATED BALANCE SHEETS
(Unaudited)
June 30, 2014 | December 31, 2013 | ||||||
(Dollars in millions, except per share amounts) | |||||||
ASSETS | |||||||
CURRENT ASSETS | |||||||
Cash and cash equivalents (TLLP: $0 and $23, respectively) | $ | 1,239 | $ | 1,238 | |||
Receivables, less allowance for doubtful accounts | 1,815 | 1,313 | |||||
Inventories | 2,642 | 2,565 | |||||
Prepayments and other current assets | 210 | 210 | |||||
Total Current Assets | 5,906 | 5,326 | |||||
NET PROPERTY, PLANT AND EQUIPMENT (TLLP: $1,414 and $1,368, respectively) | 6,996 | 6,875 | |||||
OTHER NONCURRENT ASSETS, NET | 1,169 | 1,188 | |||||
Total Assets | $ | 14,071 | $ | 13,389 | |||
LIABILITIES AND EQUITY | |||||||
CURRENT LIABILITIES | |||||||
Accounts payable | $ | 2,998 | $ | 2,596 | |||
Other current liabilities | 869 | 812 | |||||
Total Current Liabilities | 3,867 | 3,408 | |||||
DEFERRED INCOME TAXES | 1,030 | 1,018 | |||||
OTHER NONCURRENT LIABILITIES | 586 | 655 | |||||
DEBT (TLLP: $1,391 and $1,164, respectively) | 3,055 | 2,823 | |||||
COMMITMENTS AND CONTINGENCIES (Note L) | |||||||
EQUITY | |||||||
TESORO CORPORATION STOCKHOLDERS’ EQUITY | |||||||
Common stock, par value $0.162/3; authorized 200,000,000 shares; 156,127,226 shares issued (154,712,627 in 2013) | 26 | 26 | |||||
Additional paid-in capital | 1,220 | 1,186 | |||||
Retained earnings | 4,177 | 3,940 | |||||
Treasury stock, 27,079,203 common shares (22,907,890 in 2013), at cost | (1,020 | ) | (798 | ) | |||
Accumulated other comprehensive loss | (52 | ) | (52 | ) | |||
Total Tesoro Corporation Stockholders’ Equity | 4,351 | 4,302 | |||||
NONCONTROLLING INTEREST | 1,182 | 1,183 | |||||
Total Equity | 5,533 | 5,485 | |||||
Total Liabilities and Equity | $ | 14,071 | $ | 13,389 | |||
The accompanying notes are an integral part of these condensed consolidated financial statements.
5
TESORO CORPORATION
CONDENSED STATEMENTS OF CONSOLIDATED CASH FLOWS
(Unaudited)
Six Months Ended June 30, | |||||||
2014 | 2013 | ||||||
(Dollars in millions) | |||||||
CASH FLOWS FROM (USED IN) OPERATING ACTIVITIES | |||||||
Net earnings | $ | 343 | $ | 342 | |||
Adjustments to reconcile net earnings to net cash from (used in) operating activities: | |||||||
Depreciation and amortization expense | 265 | 218 | |||||
Debt redemption charges | 31 | — | |||||
Stock-based compensation expense | 8 | 47 | |||||
Deferred charges | (79 | ) | (277 | ) | |||
Other non-cash operating activities | 11 | 9 | |||||
Changes in current assets and current liabilities | (203 | ) | (500 | ) | |||
Net cash from (used in) operating activities | 376 | (161 | ) | ||||
CASH FLOWS FROM (USED IN) INVESTING ACTIVITIES | |||||||
Capital expenditures | (260 | ) | (293 | ) | |||
Acquisitions | (17 | ) | (2,648 | ) | |||
Other | 10 | 25 | |||||
Net cash used in investing activities | (267 | ) | (2,916 | ) | |||
CASH FLOWS FROM (USED IN) FINANCING ACTIVITIES | |||||||
Borrowings under revolving credit agreements | 228 | 2,068 | |||||
Borrowings under term loan credit agreement | — | 500 | |||||
Proceeds from debt offering | 300 | — | |||||
Repayments on revolving credit agreements | — | (824 | ) | ||||
Repayments of debt | (302 | ) | (2 | ) | |||
Dividend payments | (65 | ) | (55 | ) | |||
Proceeds from stock options exercised | 6 | 68 | |||||
Net proceeds from issuance of Tesoro Logistics LP common units | — | 392 | |||||
Distributions to noncontrolling interest | (42 | ) | (28 | ) | |||
Purchases of common stock | (200 | ) | (236 | ) | |||
Taxes paid related to net share settlement of equity awards | (22 | ) | (5 | ) | |||
Other | (11 | ) | (12 | ) | |||
Net cash from (used in) financing activities | (108 | ) | 1,866 | ||||
INCREASE (DECREASE) IN CASH AND CASH EQUIVALENTS | 1 | (1,211 | ) | ||||
CASH AND CASH EQUIVALENTS, BEGINNING OF PERIOD | 1,238 | 1,639 | |||||
CASH AND CASH EQUIVALENTS, END OF PERIOD | $ | 1,239 | $ | 428 | |||
The accompanying notes are an integral part of these condensed consolidated financial statements.
6
NOTE A – BASIS OF PRESENTATION
As used in this report, the terms “Tesoro,” “we,” “us” or “our” may refer to Tesoro Corporation, one or more of its consolidated subsidiaries or all of them taken as a whole. The words “we,” “us” or “our” generally include Tesoro Logistics LP (“TLLP”) and its subsidiaries as consolidated subsidiaries of Tesoro Corporation with certain exceptions where there are transactions or obligations between TLLP and Tesoro Corporation or its other subsidiaries. When used in descriptions of agreements and transactions, “TLLP” or the “Partnership” refers to TLLP and its consolidated subsidiaries.
The interim condensed consolidated financial statements and notes thereto of Tesoro Corporation and its subsidiaries have been prepared by management without audit according to the rules and regulations of the Securities and Exchange Commission (“SEC”). The accompanying condensed consolidated financial statements reflect all adjustments that, in the opinion of management, are necessary for a fair presentation of results for the periods presented. Such adjustments are of a normal recurring nature, unless otherwise disclosed.
The consolidated balance sheet at December 31, 2013 has been condensed from the audited consolidated financial statements at that date. Certain information and notes normally included in financial statements prepared in accordance with accounting principles generally accepted in the United States of America (“U.S. GAAP”) have been condensed or omitted pursuant to the SEC’s rules and regulations. However, management believes that the disclosures presented herein are adequate to present the information fairly. The accompanying condensed consolidated financial statements and notes should be read in conjunction with our Annual Report on Form 10-K for the year ended December 31, 2013.
We prepare our condensed consolidated financial statements in conformity with U.S. GAAP, which requires management to make estimates and assumptions that affect the reported amounts and disclosures of assets and liabilities at the date of the financial statements and the reported amounts of revenues and expenses during the periods presented. We review our estimates on an ongoing basis. Changes in facts and circumstances may result in revised estimates and actual results could differ from those estimates. The results of operations for any interim period are not necessarily indicative of results for the full year. Certain prior year balances have been aggregated or disaggregated in order to conform to the current year presentation.
Our consolidated financial statements include TLLP, a variable interest entity. As the general partner of TLLP, we have the sole ability to direct the activities of TLLP that most significantly impact its economic performance. We are also considered to be the primary beneficiary for accounting purposes and are TLLP’s primary customer. Under our various long-term, fee-based commercial agreements with TLLP, transactions with us accounted for 88% of TLLP’s total revenues for both the three and six months ended June 30, 2014. TLLP does not derive a significant amount of revenue from third parties. However, in the event TLLP incurs a loss, our operating results will reflect TLLP’s loss, net of intercompany eliminations. See Note C for additional information relating to TLLP.
On September 25, 2013, we completed the sale of all of our interest in Tesoro Hawaii, LLC, which operated a 94 thousand barrel per day (“Mbpd”) Hawaii refinery, retail stations and associated logistics assets (the “Hawaii Business”). Unless otherwise noted, the information in the notes to the condensed consolidated financial statements relates to our continuing operations.
New Accounting Standards and Disclosures
Revenue Recognition
The Financial Accounting Standards Board (“FASB”) issued an Accounting Standards Update (“ASU”) in May 2014 which provides accounting guidance for all revenue arising from contracts to provide goods or services to customers. The requirements from the new ASU are effective for interim and annual periods beginning after December 15, 2016, and early adoption is not permitted. The standard allows for either full retrospective adoption or modified retrospective adoption. At this time, we are evaluating the guidance to determine the method of adoption and the impact of this ASU on our financial statements and related disclosures.
7
NOTE B - ACQUISITIONS
Los Angeles Acquisition
We acquired BP’s integrated Southern California refining, marketing and logistics business on June 1, 2013 from BP West Coast Products, LLC and other affiliated sellers (the “Los Angeles Acquisition”) consistent with our business strategy and providing us with an opportunity to combine two West Coast refining, marketing and logistics businesses resulting in a more efficient integrated refining, marketing and logistics system. The acquired assets include the 266 Mbpd Carson refinery located adjacent to our Wilmington refinery, related marine terminals, land terminals and pipelines. The assets also include the ARCO® brand and associated registered trademarks, as well as a master franchisee license for the ampm® convenience store brand and the supply rights to approximately 835 branded dealer-operated and branded wholesale stations in central and southern California, Nevada and Arizona. Additionally, we acquired an anode coke calcining operation and a 51% ownership in the Watson cogeneration facility, both located at the Carson refinery. We also assumed certain environmental liabilities, primarily remediation obligations. For additional information regarding the assumed environmental liabilities, see Note L.
Our allocation of the Los Angeles Acquisition's $2.33 billion purchase price was final as of June 30, 2014. The table below presents the final acquisition date purchase price allocation (in millions) through June 30, 2014:
Receivables | $ | 197 | |
Inventories | 1,096 | ||
Prepayments and other current assets | 14 | ||
Property, plant and equipment | 1,088 | ||
Acquired intangibles, net | 63 | ||
Other noncurrent assets, net | 112 | ||
Other current liabilities | (25 | ) | |
Other noncurrent liabilities | (182 | ) | |
Debt | (36 | ) | |
Total purchase price | $ | 2,327 | |
If the Los Angeles Acquisition had occurred prior to 2013, our pro forma revenues would have been $11.4 billion and $22.2 billion for the three and six months ended June 30, 2013, respectively, and net earnings would have been $239 million and $415 million for the three and six months ended June 30, 2013, respectively.
NOTE C – TESORO LOGISTICS LP
TLLP is a publicly traded limited partnership that was formed to own, operate, develop and acquire logistics assets. Its assets are integral to the success of Tesoro’s refining and marketing operations and generate revenue by charging fees for gathering crude oil using its High Plains System and for terminalling, transporting and storing crude oil and refined products using terminal facilities and pipelines in the western United States. Tesoro Logistics GP, LLC (“TLGP”), a fully consolidated subsidiary, serves as the general partner of TLLP. We held an approximate 36% interest in TLLP at June 30, 2014 and December 31, 2013, including the general partner interest. This interest at June 30, 2014 includes 19,110,714 common units and 1,110,282 general partner units. During the quarter, all subordinated units converted to common units. All intercompany transactions with TLLP are eliminated upon consolidation.
TLLP provides us with various pipeline transportation, trucking, terminal distribution, storage and coke-handling services under long-term, fee-based commercial agreements. Each of these agreements, with the exception of the storage and transportation services agreement, contain minimum volume commitments. We do not provide financial or equity support through any liquidity arrangements or financial guarantees to TLLP.
Effective June 23, 2014, TLLP entered into a transaction to purchase certain terminalling and pipeline assets owned by Tesoro and two of our subsidiaries for total consideration of $270 million to be completed in two phases. On July 1, 2014, TLLP purchased the first phase consisting of three marketing terminals and a storage facility in exchange for consideration of $241 million, comprised of approximately $214 million in cash, and the issuance of equity to us with a fair value of $27 million. TLLP’s acquisition of a refined products pipeline in the second phase is pending regulatory approval.
8
NOTE D - DISCONTINUED OPERATIONS
On September 25, 2013, we completed the sale of our Hawaii Business and received gross proceeds of $539 million, including $75 million from the sale of assets and $464 million from the sale of inventory and other net working capital. Additional contingent consideration includes an earnout arrangement payable over three years for an aggregate amount of up to $40 million based on consolidated gross margins. Any income related to the earnout arrangement will not be recorded until it is considered realizable. We have also agreed to indemnify the purchaser for up to $15 million of environmental remediation costs related to the Hawaii Business, subject to limitations described in the purchase agreement, and retained responsibility for the resolution of certain Clean Air Act allegations as described in Note L. The asset retirement obligations were assumed by the purchaser upon close of the transaction; therefore, we will not incur any removal or other closure costs for this business.
The results of operations for this business have been presented as discontinued operations in the condensed statements of consolidated operations for the three and six months ended June 30, 2014 and 2013. There were no revenues for the three and six months ended June 30, 2014. Revenues from the discontinued Hawaii Business for the three and six months ended June 30, 2013 were $642 million and $1.5 billion, respectively. There were no recorded losses, before and after tax, related to the Hawaii Business for the three months ended June 30, 2014 and $1 million loss for the six months ended June 30, 2014. We recorded losses, before and after tax, of $16 million and $11 million, respectively, for the three months ended June 30, 2013 and $17 million and $12 million, respectively, for the six months ended June 30, 2013 related to the Hawaii Business.
Cash flows related to the discontinued Hawaii Business have been combined with the cash flows from continuing operations in the condensed statements of consolidated cash flows for both periods presented. Cash flows used in operating activities were $1 million for the six months ended June 30, 2014. Cash flows provided by operating activities for the six months ended June 30, 2013 were $192 million and cash flows used in investing activities were $2 million.
NOTE E – EARNINGS PER SHARE
We compute basic earnings per share by dividing net earnings attributable to Tesoro Corporation stockholders by the weighted average number of common shares outstanding during the period. Diluted earnings per share include the effects of potentially dilutive shares outstanding during the period.
Our share calculations are presented below (in millions):
Three Months Ended June 30, | Six Months Ended June 30, | ||||||||
2014 | 2013 | 2014 | 2013 | ||||||
Weighted average common shares outstanding | 129.3 | 135.8 | 130.3 | 136.4 | |||||
Common stock equivalents | 2.2 | 2.4 | 2.4 | 2.5 | |||||
Total diluted shares | 131.5 | 138.2 | 132.7 | 138.9 | |||||
Potentially dilutive common stock equivalents are excluded from the calculation of diluted earnings per share if the effect of including such securities in the calculation would have been anti-dilutive. Anti-dilutive securities were 0.1 million for both the three months ended June 30, 2014 and 2013, and 0.5 million and 0.2 million for the six months ended June 30, 2014 and 2013, respectively.
9
NOTE F – INVENTORIES
Components of inventories were as follows (in millions):
June 30, 2014 | December 31, 2013 | ||||||
Domestic crude oil and refined products | $ | 2,140 | $ | 1,847 | |||
Foreign subsidiary crude oil | 319 | 523 | |||||
Other inventories | 183 | 195 | |||||
Total Inventories | $ | 2,642 | $ | 2,565 | |||
The total carrying value of our crude oil and refined product inventories was less than replacement cost by approximately$2.0 billion and $1.7 billion at June 30, 2014 and December 31, 2013, respectively.
NOTE G - PROPERTY, PLANT AND EQUIPMENT
Property, plant and equipment, at cost, is as follows (in millions):
June 30, 2014 | December 31, 2013 | ||||||
Refining | $ | 6,778 | $ | 6,611 | |||
TLLP | 1,581 | 1,504 | |||||
Retail | 806 | 778 | |||||
Corporate | 245 | 230 | |||||
Property, plant and equipment, at cost | 9,410 | 9,123 | |||||
Accumulated depreciation | (2,414 | ) | (2,248 | ) | |||
Net property, plant and equipment | $ | 6,996 | $ | 6,875 | |||
We capitalize interest as part of the cost of major projects during the construction period. Capitalized interest totaled $5 million for both the three months ended June 30, 2014 and 2013, and $10 million and $9 million for the six months ended June 30, 2014 and 2013, respectively, and is recorded as a reduction to net interest and financing costs in our condensed statements of consolidated operations.
NOTE H – FAIR VALUE MEASUREMENTS
We classify financial assets and financial liabilities into the following fair value hierarchy:
• | level 1 - valued based on quoted prices in active markets for identical assets and liabilities; |
• | level 2 - valued based on quoted prices for similar assets and liabilities in active markets, and inputs other than quoted prices that are observable for the asset or liability; and |
• | level 3 - valued based on unobservable inputs that are supported by little or no market activity and that are significant to the fair value of the assets or liabilities. |
We measure fair value using level 1 inputs, when available, because they provide the most reliable evidence of fair value. Our financial assets and financial liabilities measured at fair value on a recurring basis include derivative instruments along with obligations for Renewable Identification Numbers (“RINs”) and cap and trade emission credits for the state of California (together with RINs, our “Environmental Credit Obligations”). We did not have any financial assets or liabilities classified as level 3 at June 30, 2014 or December 31, 2013. See Note I for further information on the Company’s derivative instruments.
10
Our derivative instruments include forward purchase and sale contracts (“Forward Contracts”), exchange-traded futures (“Futures Contracts”), over-the-counter swaps (“OTC Swap Contracts”), options (“Options”), and over-the-counter options (“OTC Option Contracts”). Forward Contracts, OTC Swap Contracts, and OTC Option Contracts are valued using market quotations from national exchanges or independent price reporting agencies, third-party broker quotes and price curves derived from commodity exchange postings. These quotes are corroborated with market data and are categorized in level 2 of the fair value hierarchy. Futures Contracts are valued based on quoted prices from exchanges and are categorized in level 1 or level 2 of the fair value hierarchy based on the liquidity of the instrument. Options are valued using quoted prices from exchanges and are categorized in level 1 of the fair value hierarchy.
Our Environmental Credit Obligations represent our deficit for RINs and California cap and trade credits at the fair value of each as of the balance sheet date. These obligations are measured at fair value using market quotations from national exchanges or independent price reporting agencies and are categorized in level 2 of the fair value hierarchy. Our RINs obligation represents our deficit for the purchase of RINs to satisfy the requirement to blend biofuels into the products we have produced. RINs are assigned to biofuels produced or imported into the U.S. as required by the U.S. Environmental Protection Agency (“EPA”), which sets annual quotas for the percentage of biofuels that must be blended into transportation fuels consumed in the U.S. As a producer of petroleum transportation fuels, we are required to blend biofuels into the products we produce at a rate that will meet the EPA’s quota. If we are unable to blend at that rate, we must purchase RINs in the open market to satisfy the requirement. The cap and trade emission credits for the state of California represent our deficit for the purchase of additional credits to satisfy emission reduction requirements mandated in California’s Assembly Bill 32 in each period for which our carbon emissions exceed the level allowed by the regulation.
Financial assets and liabilities recognized at fair value in our condensed consolidated balance sheets by level within the fair value hierarchy were as follows (in millions):
June 30, 2014 | |||||||||||||||||||
Level 1 | Level 2 | Level 3 | Netting and Collateral (a) | Total | |||||||||||||||
Assets: | |||||||||||||||||||
Commodity Futures Contracts | $ | 252 | $ | 8 | $ | — | $ | (175 | ) | $ | 85 | ||||||||
Commodity Forward Contracts | — | 2 | — | — | 2 | ||||||||||||||
Total Assets | $ | 252 | $ | 10 | $ | — | $ | (175 | ) | $ | 87 | ||||||||
Liabilities: | |||||||||||||||||||
Commodity Futures Contracts | $ | 265 | $ | 7 | $ | — | $ | (249 | ) | $ | 23 | ||||||||
Commodity OTC Swap Contracts | — | 3 | — | — | 3 | ||||||||||||||
Commodity Forward Contracts | — | 1 | — | — | 1 | ||||||||||||||
Environmental Credit Obligations | — | 15 | — | — | 15 | ||||||||||||||
Total Liabilities | $ | 265 | $ | 26 | $ | — | $ | (249 | ) | $ | 42 | ||||||||
December 31, 2013 | |||||||||||||||||||
Level 1 | Level 2 | Level 3 | Netting and Collateral (a) | Total | |||||||||||||||
Assets: | |||||||||||||||||||
Commodity Futures Contracts | $ | 136 | $ | 4 | $ | — | $ | (72 | ) | $ | 68 | ||||||||
Total Assets | $ | 136 | $ | 4 | $ | — | $ | (72 | ) | $ | 68 | ||||||||
Liabilities: | |||||||||||||||||||
Commodity Futures Contracts | $ | 156 | $ | 2 | $ | — | $ | (137 | ) | $ | 21 | ||||||||
Commodity Forward Contracts | — | 1 | — | — | 1 | ||||||||||||||
Environmental Credit Obligations | — | 5 | — | — | 5 | ||||||||||||||
Total Liabilities | $ | 156 | $ | 8 | $ | — | $ | (137 | ) | $ | 27 | ||||||||
__________________________
(a) | Represents the impact of netting assets, liabilities and cash collateral when a legal right of offset exists. As of June 30, 2014 and December 31, 2013, cash collateral amounts of $74 million and $65 million, respectively, are netted with mark-to-market derivative assets. |
11
Certain of our derivative contracts, under master netting arrangements, include both asset and liability positions. We offset both the fair value amounts and any related cash collateral amounts recognized for multiple derivative instruments executed with the same counterparty when there is a legally enforceable right and an intention to settle net or simultaneously.
We believe the carrying value of our other financial instruments, including cash and cash equivalents, receivables, accounts payable and certain accrued liabilities approximate fair value. Our fair value assessment incorporates a variety of considerations, including the short-term duration of the instruments (less than one percent of our trade receivables and payables are outstanding for greater than 90 days), and the expected future insignificance of bad debt expense, which includes an evaluation of counterparty credit risk. The borrowings under the Tesoro Corporation revolving credit facility (the “Revolving Credit Facility”), the TLLP senior secured revolving credit agreement (the “TLLP Revolving Credit Facility”) and our term loan credit facility agreement (the “Term Loan Credit Facility”), which include variable interest rates, approximate fair value. The fair value of our fixed rate debt is based on prices from recent trade activity and is categorized in level 2 of the fair value hierarchy. The carrying and fair value of our debt were approximately $3.0 billion and $3.1 billion, respectively, at June 30, 2014. The carrying value and fair value of our debt were approximately $2.8 billion and $2.9 billion, respectively, at December 31, 2013.
NOTE I - DERIVATIVE INSTRUMENTS
The timing, direction and overall change in refined product prices versus crude oil prices has a significant impact on our profit margins, earnings and cash flows. Consequently, we use non-trading derivative instruments to manage exposure to commodity price risks associated with the purchase or sale of feedstocks, refined products and energy supplies to or from our refineries, terminals, retail operations and customers. We also use non-trading derivative instruments to manage price risks associated with inventories above or below our target levels and our exposure for future emission credit requirements. To achieve our objectives, we use derivative instruments such as Forward Contracts, Futures Contracts, OTC Swap Contracts, Options, and OTC Option Contracts. We are also exposed to exchange rate fluctuations on our purchases of Canadian crude oil. We enter into Forward Contracts of Canadian dollars to manage these exchange rate fluctuations.
The accounting for changes in the fair value of a commodity derivative depends on whether we have elected the normal purchases and normal sales exception. Our accounting for derivatives using the normal purchases and normal sales exception follows the accrual method of accounting whereas changes in fair value for all other derivatives are recorded each period using mark-to-market accounting.
The primary derivative instruments that we use have certain characteristics. Forward Contracts are agreements to buy or sell the commodity at a predetermined price at a specified future date. Futures Contracts are standardized agreements, traded on a futures exchange, to buy or sell the commodity at a predetermined price at a specified future date. Options provide the right, but not the obligation to buy or sell the commodity at a specified price in the future. OTC Swap Contracts and OTC Option Contracts require cash settlement for the commodity based on the difference between a contracted fixed or floating price and the market price on the settlement date. Certain of these contracts require cash collateral if our liability position exceeds specified thresholds. We believe that we have minimal credit risk with respect to our counterparties.
12
The following table presents the fair value (in millions) of our derivative instruments as of June 30, 2014 and December 31, 2013. The fair value amounts below are presented on a gross basis and do not reflect the netting of asset and liability positions permitted under the terms of our master netting arrangements including cash collateral on deposit with, or received from, brokers. We offset the recognized fair value amounts for multiple derivative instruments executed with the same counterparty in our financial statements when a legal right of offset exists. As a result, the asset and liability amounts below will not agree with the amounts presented in our condensed consolidated balance sheets.
Derivative Assets | Derivative Liabilities | ||||||||||||||||
Balance Sheet Location | June 30, 2014 | December 31, 2013 | June 30, 2014 | December 31, 2013 | |||||||||||||
Commodity Futures Contracts (a) | Prepayments and other current assets | $ | 260 | $ | 140 | $ | 272 | $ | 158 | ||||||||
Commodity OTC Swap Contracts | Accounts payable | — | — | 3 | — | ||||||||||||
Commodity Forward Contracts | Receivables | 2 | — | — | — | ||||||||||||
Commodity Forward Contracts | Accounts payable | — | — | 1 | 1 | ||||||||||||
Total Gross Mark-to-Market Derivatives | 262 | 140 | 276 | 159 | |||||||||||||
Less: Counterparty Netting and Cash Collateral (b) | (175 | ) | (72 | ) | (249 | ) | (137 | ) | |||||||||
Total Net Fair Value of Derivatives | $ | 87 | $ | 68 | $ | 27 | $ | 22 | |||||||||
________________
(a) | We had derivative assets totaling $13 million and $3 million at June 30, 2014 and December 31, 2013, respectively, related to corn futures used to manage our biofuel exposure. Additionally, we had derivative liabilities totaling $10 million and $1 million at June 30, 2014 and December 31, 2013, respectively, related to corn futures. |
(b) | As of June 30, 2014 and December 31, 2013, cash collateral amounts of $74 million and $65 million, respectively, are netted with mark-to-market derivative assets. |
Gains (losses) for our mark-to market derivatives for the three and six months ended June 30, 2014 and 2013, were as follows (in millions):
Three Months Ended June 30, | Six Months Ended June 30, | ||||||||||||||
2014 | 2013 | 2014 | 2013 | ||||||||||||
Commodity Futures Contracts | $ | (77 | ) | $ | 10 | $ | (77 | ) | $ | (16 | ) | ||||
Commodity OTC Swap Contracts | (2 | ) | — | (3 | ) | — | |||||||||
Commodity Forward Contracts | 3 | (2 | ) | 4 | (4 | ) | |||||||||
Foreign Currency Forward Contracts | 2 | (2 | ) | — | (4 | ) | |||||||||
Total Gain (Loss) on Mark-to-Market Derivatives | $ | (74 | ) | $ | 6 | $ | (76 | ) | $ | (24 | ) | ||||
The income statement location of gains (losses) for our mark-to market derivatives above were as follows (in millions):
Three Months Ended June 30, | Six Months Ended June 30, | ||||||||||||||
2014 | 2013 | 2014 | 2013 | ||||||||||||
Revenues | $ | — | $ | 9 | $ | 1 | $ | 10 | |||||||
Cost of sales | (76 | ) | 2 | (77 | ) | (20 | ) | ||||||||
Other income, net | 2 | (2 | ) | — | (4 | ) | |||||||||
Net loss from discontinued operations | — | (3 | ) | — | (10 | ) | |||||||||
Total Gain (Loss) on Mark-to-Market Derivatives | $ | (74 | ) | $ | 6 | $ | (76 | ) | $ | (24 | ) | ||||
13
Open Long (Short) Positions
The information below presents the net volume of outstanding commodity and other contracts by type of instrument, year of maturity and unit of measure as of June 30, 2014 (units in thousands):
Contract Volumes by Year of Maturity | ||||||||||
Mark-to-Market Derivative Instrument | 2014 | 2015 | 2016 | 2017 | Unit of Measure | |||||
Crude oil and refined products: | ||||||||||
Futures - short | (8,946) | — | — | — | Barrels | |||||
OTC Swaps - long | 2,100 | — | — | — | Barrels | |||||
Forwards - short | (367) | — | — | — | Barrels | |||||
Carbon credit: | ||||||||||
Futures - long | — | — | 1,000 | 1,000 | Tons | |||||
Renewable fuels and blending products: | ||||||||||
Futures - long | 68,250 | — | — | — | Gallons | |||||
Futures - short | — | (840) | — | — | Gallons | |||||
Corn: | ||||||||||
Futures - short | (6,015) | — | — | — | Bushels | |||||
At June 30, 2014, we had open Forward Contracts to purchase CAD $40 million that matured on July 25, 2014.
NOTE J – DEBT
Our total debt balance at June 30, 2014 and December 31, 2013 was as follows (in millions):
June 30, 2014 | December 31, 2013 | ||||||
Total debt (a) | $ | 3,061 | $ | 2,829 | |||
Less: Current maturities | 6 | 6 | |||||
Debt, less current maturities | $ | 3,055 | $ | 2,823 | |||
________________
(a) | Total debt related to TLLP, which is non-recourse to Tesoro, except for TLGP, was $1.4 billion and $1.2 billion at June 30, 2014 and December 31, 2013, respectively. |
5.125% Senior Notes due 2024
Effective March 18, 2014, we issued $300 million aggregate principal amount of 5.125% Senior Notes due April 2024 (the “2024 Notes”). The 2024 Notes have a ten-year maturity and are subject to optional redemption by Tesoro beginning April 1, 2019 at premiums of 2.563% through March 31, 2020; 1.708% from April 1, 2020 through March 31, 2021; 0.854% from April 1, 2021 through March 31, 2022; and at par thereafter, or at a make-whole plus accrued and unpaid interest before April 1, 2019. In addition, at any time prior to April 1, 2017, we may redeem up to 35% of the aggregate principal amount at 105.125% of face value with proceeds from certain equity issuances. The terms of the 2024 Notes are generally less restrictive than those contained in our senior notes due in 2017 and 2022, and exclude some limitations on restricted payments, asset sales and other transactions that are included in those senior notes. These notes are unsecured obligations and guaranteed by certain of our domestic subsidiaries, excluding TLGP and TLLP and its subsidiaries. The proceeds from the issuance of the 2024 Notes, together with cash on hand, were used to pay for fees and expenses related to the note issuance and to redeem all outstanding 9.750% Senior Notes due 2019 (the “2019 Notes”) for an aggregate purchase price of $329 million, including accrued interest and premiums. In connection with the redemption of the 2019 Notes, we incurred charges totaling $31 million comprised of premiums paid on the 2019 Notes of $19 million and non-cash charges associated with the expensing of $8 million and $4 million of unamortized debt discount and issuance costs, respectively. Our debt redemption charges for the 2019 Notes are recorded in net interest and financing costs in our condensed statements of consolidated operations.
14
Exchange Offer
TLLP entered into a registration rights agreement in connection with the December 2013 private offering of $250 million of 5.875% Senior Notes due October 2020 (the “Unregistered Notes”). On July 25, 2014, TLLP completed an offer to exchange the Unregistered Notes for notes registered under the Securities Act of 1933, as amended (the “Exchange Notes”). In accordance with the terms of the Exchange Notes, each holder of the Unregistered Notes are entitled to receive Exchange Notes, which are identical in all material respects to the Unregistered Notes (including principal amount, interest rate, maturity and redemption rights), except that the Exchange Notes generally are not subject to transfer restrictions.
Credit Facilities Overview
We had available capacity under our credit facilities as follows at June 30, 2014 (in millions):
Total Capacity | Amount Borrowed as of June 30, 2014 | Outstanding Letters of Credit | Available Capacity | Expiration | |||||||||||||
Tesoro Corporation Revolving Credit Facility (a) | $ | 3,000 | $ | — | $ | 742 | $ | 2,258 | January 4, 2018 | ||||||||
TLLP Revolving Credit Facility | 575 | 228 | — | 347 | December 31, 2017 | ||||||||||||
Term Loan Credit Facility | 398 | 398 | — | — | May 30, 2016 | ||||||||||||
Letter of Credit Facilities | 1,837 | — | 429 | 1,408 | |||||||||||||
Total credit facilities | $ | 5,810 | $ | 626 | $ | 1,171 | $ | 4,013 | |||||||||
________________
(a) | Borrowing base is the lesser of the amount of the periodically adjusted borrowing base or the facility’s total capacity. |
As of June 30, 2014, our credit facilities were subject to the following expenses and fees:
Credit Facility | 30 day Eurodollar (LIBOR) Rate | Eurodollar Margin | Base Rate | Base Rate Margin | Commitment Fee (unused portion) | |||||
Tesoro Corporation Revolving Credit Facility ($3.0 billion) (b) | 0.16% | 1.50% | 3.25% | 0.50% | 0.375% | |||||
TLLP Revolving Credit Facility ($575 million) (c) | 0.16% | 2.50% | 3.25% | 1.50% | 0.50% | |||||
Term Loan Credit Facility ($398 million) (b) | 0.16% | 2.25% | 3.25% | 1.25% | —% | |||||
________________
(b) | We can elect the interest rate to apply to the facility between a base rate plus the base rate margin, or a Eurodollar rate, for the applicable term, plus the Eurodollar margin at the time of the borrowing. The applicable margin on the Revolving Credit Facility varies primarily based upon our credit ratings. Letters of credit outstanding under the Revolving Credit Facility incur fees at the Eurodollar margin rate. |
(c) | TLLP has the option to elect if the borrowings will bear interest at either, a base rate plus the base rate margin or a Eurodollar rate, for the applicable period, plus the Eurodollar margin at the time of the borrowing. The applicable margin varies based upon a certain leverage ratio, as defined by the TLLP Revolving Credit Facility. TLLP incurs commitment fees for the unused portion of the TLLP Revolving Credit Facility. Letters of credit outstanding under the Revolving Credit Facility incur fees at the Eurodollar margin rate. |
Tesoro Corporation Revolving Credit Facility
At June 30, 2014, our Revolving Credit Facility provided for borrowings (including letters of credit) up to the lesser of the amount of a periodically adjusted borrowing base of approximately $3.8 billion, consisting of Tesoro’s eligible cash and cash equivalents, receivables and petroleum inventories, net of the standard reserve as defined, or the Revolving Credit Facility’s total capacity of $3.0 billion. The total available capacity can be increased up to an aggregate amount of $4.0 billion, subject to receiving increased commitments from the lenders; however, we must offer to reduce the commitments by at least $500 million on or prior to November 21, 2014, and by an additional $500 million on or prior to May 21, 2015. We had unused credit availability of approximately 75% of the eligible borrowing base at June 30, 2014.
15
TLLP Revolving Credit Facility
The TLLP Revolving Credit Facility provided for total loan availability of $575 million as of June 30, 2014, and TLLP may request that the loan availability be increased up to an aggregate of $650 million, subject to receiving increased commitments from the lenders. The TLLP Revolving Credit Facility is non-recourse to Tesoro, except for TLGP, and is guaranteed by all of TLLP’s subsidiaries and secured by substantially all of TLLP’s assets. Borrowings are available under the TLLP Revolving Credit Facility up to the total loan availability of the facility. There were $228 million in borrowings outstanding under the TLLP Revolving Credit Facility, which incurred interest at a weighted average interest rate of 2.78% as of June 30, 2014.
Term Loan Credit Facility
We entered into the Term Loan Credit Facility in January 2013, which allowed us to borrow up to an aggregate of $500 million. We borrowed $500 million on May 30, 2013, to fund a portion of the Los Angeles Acquisition. The obligations under the Term Loan Credit Facility are secured by all equity interests of Tesoro Refining & Marketing Company LLC and Tesoro Alaska Company LLC, the Tesoro and USA Gasoline trademarks and those trademarks containing the name “ARCO” acquired in the Los Angeles Acquisition and junior liens on certain assets. The Term Loan Credit Facility may be repaid at any time but amounts may not be re-borrowed. The borrowings under our Term Loan Credit Facility incurred interest at a rate of 2.40% as of June 30, 2014.
Letter of Credit Agreements
The Revolving Credit Facility allows us to obtain letters of credit under separate letter of credit agreements for foreign crude oil purchases. Our uncommitted letter of credit agreements had $429 million outstanding as of June 30, 2014. Capacity under these letter of credit agreements is available on an uncommitted basis and can be terminated by either party at any time.
NOTE K – BENEFIT PLANS
Tesoro sponsors four defined benefit pension plans, including one funded qualified employee retirement plan and three unfunded nonqualified executive plans. Although our funded employee retirement plan fully meets all funding requirements under applicable laws and regulations, we voluntarily contributed $30 million during the six months ended June 30, 2014 to improve the funded status of the plan. Tesoro also provides other postretirement health care benefits to retirees who met certain service requirements and were participating in our group health insurance program at retirement.
The components of pension and other postretirement benefit expense (income) for the three and six months ended June 30, 2014 and 2013 were (in millions):
Pension Benefits | |||||||||||||||
Three Months Ended June 30, | Six Months Ended June 30, | ||||||||||||||
2014 | 2013 | 2014 | 2013 | ||||||||||||
Service cost | $ | 13 | $ | 6 | $ | 26 | $ | 14 | |||||||
Interest cost | 8 | 6 | 17 | 13 | |||||||||||
Expected return on plan assets | (7 | ) | (6 | ) | (15 | ) | (12 | ) | |||||||
Amortization of prior service cost | 1 | — | 1 | — | |||||||||||
Recognized net actuarial loss | 3 | 6 | 7 | 13 | |||||||||||
Net Periodic Benefit Expense | $ | 18 | $ | 12 | $ | 36 | $ | 28 | |||||||
Other Postretirement Benefits | |||||||||||||||
Three Months Ended June 30, | Six Months Ended June 30, | ||||||||||||||
2014 | 2013 | 2014 | 2013 | ||||||||||||
Service cost | $ | 1 | $ | 2 | $ | 2 | $ | 3 | |||||||
Interest cost | — | — | 1 | 1 | |||||||||||
Amortization of prior service credit | (8 | ) | (10 | ) | (17 | ) | (19 | ) | |||||||
Recognized net actuarial loss | 2 | 3 | 3 | 5 | |||||||||||
Net Periodic Benefit Income | $ | (5 | ) | $ | (5 | ) | $ | (11 | ) | $ | (10 | ) | |||
16
NOTE L - COMMITMENTS AND CONTINGENCIES
Environmental Matters
We are subject to extensive federal, state and local environmental laws and regulations. These laws, which change frequently, regulate the discharge of materials into the environment and may require us to remove or mitigate the environmental effects of the disposal or release of petroleum or chemical substances at various sites, install additional controls or make other modifications to certain emission sources, equipment or facilities.
We are incurring and expect to continue to incur expenses for environmental remediation liabilities at a number of currently and previously owned or operated refining, pipeline, terminal and retail station properties. We have accrued liabilities for these expenses and believe these accruals are adequate based on current information and projections that can be reasonably estimated. Additionally, we have recognized environmental remediation liabilities assumed in past acquisitions from the prior owners that include amounts estimated for site cleanup and monitoring activities arising from operations at refineries, certain terminals and pipelines, and retail stations prior to the dates of our acquisitions. Our environmental accruals are based on estimates including engineering assessments, and it is possible that our projections will change and that additional costs will be recorded as more information becomes available.
Our accruals for environmental expenditures totaled $267 million and $262 million at June 30, 2014 and December 31, 2013, respectively, including $23 million and $24 million for TLLP, respectively. These accruals include $221 million and $216 million at June 30, 2014 and December 31, 2013, respectively, related to amounts estimated for site cleanup activities arising from operations at our Martinez refinery prior to August 2000 and operations of assets acquired in the Los Angeles Acquisition prior to June 1, 2013. We cannot reasonably determine the full extent of remedial activities that may be required at the Martinez refinery and for assets acquired in the Los Angeles Acquisition, and it is possible that we will identify additional investigation and remediation costs for site cleanup activities as more information becomes available. Our estimates for site cleanup activities reflect amounts for which we are responsible under applicable cost-sharing arrangements. We also have insurance policies related to certain matters at our Martinez refinery that provide coverage up to $190 million for expenditures in excess of $50 million in self-insurance. We have not recognized possible insurance recoveries and the insurer has challenged coverage and filed a declaratory relief action in federal court.
Washington Refinery Fire
The naphtha hydrotreater unit at our Washington refinery was involved in a fire in April 2010, which fatally injured seven employees and rendered the unit inoperable. The Washington State Department of Labor & Industries (“L&I”), the U.S. Chemical Safety and Hazard Investigation Board (“CSB”) and the EPA initiated separate investigations of the incident. L&I completed its investigation in October 2010, issued citations and assessed a $2.4 million fine, which we appealed. L&I reassumed jurisdiction of the citation and affirmed the allegations in December 2010. We disagree with L&I’s characterizations of operations at our Washington refinery and believe, based on available evidence and scientific reviews, that many of the agency’s conclusions are mistaken. We filed an appeal of the citation in January 2011. In separate September 2013 and November 2013 orders, the Board of Industrial Insurance Appeals granted partial summary judgment in our favor and dismissed most of the citations. We have established an accrual for this matter although we cannot currently estimate the final amount or timing of its resolution. The outcome of this matter will not have a material impact on our liquidity, financial position, or results of operations.
On May 1, 2014, the CSB finalized its investigation report on the April 2010 naphtha hydrotreater unit fire at our Washington refinery. In the report, the CSB made recommendations to federal and state agencies, the American Petroleum Industry and us. In response to the recommendations made to us, we have communicated to the CSB the actions we are and will be taking. Our completion of those actions will not have a material impact on our liquidity, financial position, or results of operations.
The EPA, in conjunction with the U.S. Department of Justice (“DOJ”), is continuing its criminal investigation of the Washington naphtha hydrotreater fire. We cannot predict what action, if any, the EPA and DOJ will take. As a result, we cannot currently estimate the amount or timing of the resolution for any action that may result from this investigation.
We received a notice of violation (“NOV”) from the EPA alleging 46 violations of the Clean Air Act Risk Management Plan requirements at our Washington refinery on November 20, 2013. The EPA conducted an investigation of the refinery in 2011, following the April 2010 fire in the naphtha hydrotreater unit. While we have submitted a response to the EPA and requested clarification of certain allegations, we cannot currently estimate the amount or timing of the resolution of this matter. We believe the outcome will not have a material impact on our liquidity, financial position, or results of operations.
17
Other Matters
In the ordinary course of business, we become party to lawsuits, administrative proceedings and governmental investigations, including environmental, regulatory and other matters. Large, and sometimes unspecified, damages or penalties may be sought from us in some matters. We have not established accruals for these matters unless a loss is probable, and the amount of loss is currently estimable.
Legal
We are a defendant, along with other manufacturing, supply and marketing defendants, in a lawsuit brought by the Orange County Water District, alleging methyl tertiary butyl ether (“MTBE”) contamination in groundwater. The lawsuit is proceeding in the United States District Court of the Southern District of New York and the defendants are being sued for having manufactured MTBE and having manufactured, supplied and distributed gasoline containing MTBE. The plaintiff alleges, in part, that the defendants are liable for manufacturing or distributing a defective product. The suit generally seeks individual, unquantified compensatory and punitive damages and attorney’s fees. We intend to vigorously assert our defenses against this claim. While we cannot currently estimate the final amount or timing of the resolution of this matter, we have established an accrual and believe that the outcome will not have a material impact on our liquidity, financial position, or results of operations.
Environmental
The EPA has alleged that we have violated certain Clean Air Act regulations at our Alaska, Washington, Martinez, North Dakota and Utah refineries. We also retained the responsibility for resolving similar allegations relating to our former Hawaii refinery, which we sold in September 2013. We previously received a NOV in March 2011 from the EPA alleging violations of Title V of the Clean Air Act at our Alaska refinery, which arose from a 2007 state of Alaska inspection and inspections by the EPA in 2008 and 2010. We also previously received NOVs in 2005 and 2008 alleging violations of the Clean Air Act at our Washington refinery. We are continuing discussions of all EPA claims with the EPA and the DOJ. The ultimate resolution of these matters could have a material impact on our future interim or annual results of operations, as we may be required to incur material capital expenditures and/or civil penalties. However, we do not believe that the outcome will have a material impact on our liquidity or financial position.
We have investigated conditions at certain active wastewater treatment units at our Martinez refinery pursuant to an order received in 2004 from the San Francisco Bay Regional Water Quality Control Board that named us as well as two previous owners of the Martinez refinery. We cannot currently estimate the amount of the ultimate resolution of the order, but we believe it will not have a material adverse impact on our liquidity, financial position, or results of operations.
Tax
We are subject to extensive federal, state and foreign tax laws and regulations. Newly enacted tax laws and regulations, and changes in existing tax laws and regulations, could result in increased expenditures in the future. We are also subject to audits by federal, state and foreign taxing authorities in the normal course of business. It is possible that tax audits could result in claims against us in excess of recorded liabilities. However, we believe that resolution of any such claim(s) would not have a material impact on our liquidity, financial position, or results of operations.
18
NOTE M - STOCKHOLDERS’ EQUITY
Changes to equity during the six months ended June 30, 2014 are presented below (in millions):
Tesoro Corporation Stockholders’ Equity | Noncontrolling Interest | Total Equity | |||||||||
Balance at December 31, 2013 | $ | 4,302 | $ | 1,183 | $ | 5,485 | |||||
Net earnings | 302 | 41 | 343 | ||||||||
Amortization of equity settled awards | 13 | — | 13 | ||||||||
Excess tax benefits from stock-based compensation arrangements, net | 15 | — | 15 | ||||||||
Purchases of common stock | (200 | ) | — | (200 | ) | ||||||
Taxes paid related to net share settlement of equity awards | (22 | ) | — | (22 | ) | ||||||
Dividend payments | (65 | ) | — | (65 | ) | ||||||
Distributions to noncontrolling interest | — | (42 | ) | (42 | ) | ||||||
Other | 6 | — | 6 | ||||||||
Balance at June 30, 2014 | $ | 4,351 | $ | 1,182 | $ | 5,533 | |||||
We issued approximately 0.3 million shares and 2.0 million shares for proceeds of $6 million and $69 million primarily for stock option exercises under our equity-based compensation plans during the six months ended June 30, 2014 and 2013, respectively.
Share Repurchases
We are authorized by our Board to purchase shares of our common stock in open market transactions at our discretion. Purchases of our common stock can also be made to offset the dilutive effect of stock-based compensation awards and to meet our obligations under employee benefit and compensation plans, including the exercise of stock options and vesting of restricted stock and to fulfill other stock compensation requirements. The Board’s authorization has no time limit and may be suspended or discontinued at any time. We purchased approximately 3.7 million shares and 4.4 million shares of our common stock for approximately $200 million and $236 million during the six months ended June 30, 2014 and 2013, respectively. On July 30, 2014, our Board approved a new $1.0 billion share repurchase program to become effective upon the full completion of our current $1.0 billion share repurchase authorization.
Preferred Stock
We have 5.0 million shares of preferred stock authorized with no par value per share. No shares of preferred stock were outstanding as of June 30, 2014 and December 31, 2013.
Cash Dividends
We paid cash dividends totaling $32 million and $65 million for the three and six months ended June 30, 2014, respectively, based on a $0.25 per share quarterly cash dividend on common stock. We paid cash dividends totaling $27 million and $55 million for the three and six months ended June 30, 2013, respectively, based on a $0.20 per share quarterly cash dividend on common stock. On July 30, 2014, our Board declared a cash dividend of $0.30 per share, payable on September 15, 2014 to shareholders of record on August 29, 2014.
Our Revolving Credit Facility, senior notes and Term Loan Credit Facility each limit our ability to make certain restricted payments (as defined in our debt agreements), which include dividends, purchases of our stock or voluntary prepayments of subordinate debt. The aggregate amount of restricted payments cannot exceed an amount defined in each of the debt agreements. The indentures for our senior notes also limit certain of our subsidiaries’ ability to make certain payments and distributions.
19
NOTE N - STOCK-BASED COMPENSATION
Stock-based compensation expense (benefit), including discontinued operations, was as follows (in millions):
Three Months Ended June 30, | Six Months Ended June 30, | ||||||||||||||
2014 | 2013 | 2014 | 2013 | ||||||||||||
Stock appreciation rights | $ | 13 | $ | (15 | ) | $ | (5 | ) | $ | 24 | |||||
Performance share awards | 7 | 2 | 4 | 10 | |||||||||||
Market stock units | 5 | 4 | 8 | 8 | |||||||||||
Other stock-based awards | 1 | 4 | 1 | 5 | |||||||||||
Total Stock-Based Compensation Expense (Benefit) | $ | 26 | $ | (5 | ) | $ | 8 | $ | 47 | ||||||
We have aggregated expenses for certain award types as they are not considered significant. The income tax effect recognized in the income statement for stock-based compensation was a benefit of $9 million and an expense of $3 million for the three months ended June 30, 2014 and 2013, respectively, and a benefit of $2 million and $17 million for the six months ended June 30, 2014 and 2013, respectively. The reduction in current taxes payable recognized from tax deductions resulting from exercises and vestings under all of our stock-based compensation arrangements totaled $30 million and $21 million for the three months ended June 30, 2014 and 2013, respectively, and $33 million and $38 million for the six months ended June 30, 2014 and 2013, respectively.
Stock Appreciation Rights
A stock appreciation right (“SAR”) entitles an employee to receive cash in an amount equal to the excess of the fair market value of one share of common stock on the date of exercise over the grant price of the SAR. The fair value of each SAR is estimated at the end of each reporting period using the Black-Scholes option-pricing model. We have not granted any SARs since 2010. We paid cash of $14 million and $30 million to settle 0.5 million and 1.3 million SARs that were exercised during the six months ended June 30, 2014 and 2013, respectively. We had $57 million and $76 million recorded in accrued liabilities associated with our SARs awards at June 30, 2014 and December 31, 2013, respectively.
Performance Share Awards
During the six months ended June 30, 2014, we granted 0.2 million performance share awards, including awards with performance and market conditions, at a weighted average grant date fair value of $53.89 per share under the amended and restated 2011 Long-Term Incentive Plan (“2011 Plan”). These performance share awards vest at the end of the performance period. Payout of these equity awards can range from 0% to 200% of the number of target shares granted and are tied to performance conditions or market conditions over the performance period. The fair value of performance share awards are estimated using the market price of our common stock on the grant date or using a Monte Carlo simulation model on the grant date. The value ultimately paid for performance share awards tied to performance or market conditions, which are measured against our performance peer group and the S&P 500 Index, is based on return on capital employed or relative total shareholder return, respectively. The estimated fair value of these performance share awards is amortized over a three-year vesting period using the straight-line method.
Market Stock Units
We granted 0.4 million market stock units at a weighted average grant date fair value of $59.16 per unit under the 2011 Plan during the six months ended June 30, 2014. These market stock units vest at the end of a three-year performance period. The number of shares ultimately issued will be based on Tesoro’s stock price changes over the performance period. The market stock units’ potential payout can range from 50-200% of targeted award value, unless the average closing stock price at vesting has decreased more than 50% from the average closing stock price at the grant date in which case no market stock units will be paid out. The fair value of each market stock unit is estimated on the grant date using a Monte Carlo simulation model. The estimated fair value of these market stock units is amortized over a three-year vesting period using the straight-line method.
20
NOTE O - OPERATING SEGMENTS
The Company’s revenues are derived from three operating segments: refining, TLLP and retail. We own and operate six petroleum refineries located in California, Washington, Alaska, North Dakota and Utah that manufacture gasoline and gasoline blendstocks, jet fuel, diesel fuel, residual fuel oil and other refined products. We sell these refined products, together with refined products purchased from third parties, at wholesale through terminal facilities and other locations and opportunistically export refined products to foreign markets. TLLP’s assets and operations include certain crude oil gathering assets and crude oil and refined products terminalling and transportation assets acquired from Tesoro and other third parties. Revenues from the TLLP segment are generated by charging fees for gathering crude oil and for terminalling, transporting and storing crude oil and refined products. Our retail segment sells gasoline, diesel fuel and convenience store items through company-operated retail stations and branded jobber/dealers in 17 states. Since we do not have significant operations in foreign countries, revenue generated in and long-lived assets located in foreign countries are not material to our operations.
We evaluate the performance of our segments based primarily on segment operating income. Segment operating income includes those revenues and expenses that are directly attributable to management of the respective segment. Intersegment sales from refining to retail are made at prices which approximate market. TLLP revenues include intersegment transactions with our refining segment at prices which we believe are no less favorable to either party than those that could have been negotiated with unaffiliated parties with respect to similar services. Income taxes, other income, net, interest and financing costs, net, corporate depreciation and corporate general and administrative expenses are excluded from segment operating income.
21
Segment information related to continuing operations is as follows:
Three Months Ended June 30, | Six Months Ended June 30, | ||||||||||||||
2014 | 2013 | 2014 | 2013 | ||||||||||||
(In millions) | |||||||||||||||
Revenues | |||||||||||||||
Refining: | |||||||||||||||
Refined products | $ | 10,520 | $ | 8,146 | $ | 20,020 | $ | 14,890 | |||||||
Crude oil resales and other | 354 | 597 | 626 | 1,066 | |||||||||||
TLLP: | |||||||||||||||
Crude oil gathering | 27 | 21 | 52 | 43 | |||||||||||
Terminalling and transportation | 103 | 39 | 203 | 69 | |||||||||||
Retail: | |||||||||||||||
Fuel (a) | 3,523 | 2,218 | 6,547 | 3,725 | |||||||||||
Merchandise and other | 69 | 59 | 130 | 107 | |||||||||||
Intersegment sales | (3,492 | ) | (2,183 | ) | (6,541 | ) | (3,656 | ) | |||||||
Total Revenues | $ | 11,104 | $ | 8,897 | $ | 21,037 | $ | 16,244 | |||||||
Segment Operating Income | |||||||||||||||
Refining | $ | 372 | $ | 375 | $ | 555 | $ | 634 | |||||||
TLLP (b) | 50 | 20 | 112 | 44 | |||||||||||
Retail | 72 | 25 | 91 | 40 | |||||||||||
Total Segment Operating Income | 494 | 420 | 758 | 718 | |||||||||||
Corporate and unallocated costs (c) | (84 | ) | (56 | ) | (110 | ) | (161 | ) | |||||||
Operating Income | 410 | 364 | 648 | 557 | |||||||||||
Interest and financing costs, net (d) | (41 | ) | (33 | ) | (118 | ) | (63 | ) | |||||||
Other income, net (e) | 3 | 56 | 2 | 56 | |||||||||||
Earnings Before Income Taxes | $ | 372 | $ | 387 | $ | 532 | $ | 550 | |||||||
Depreciation and Amortization Expense | |||||||||||||||
Refining | $ | 105 | $ | 90 | $ | 206 | $ | 178 | |||||||
TLLP | 16 | 7 | 32 | 11 | |||||||||||
Retail | 10 | 9 | 20 | 17 | |||||||||||
Corporate | 4 | 5 | 7 | 10 | |||||||||||
Total Depreciation and Amortization Expense | $ | 135 | $ | 111 | $ | 265 | $ | 216 | |||||||
Capital Expenditures | |||||||||||||||
Refining | $ | 94 | $ | 134 | $ | 162 | $ | 232 | |||||||
TLLP | 48 | 22 | 74 | 33 | |||||||||||
Retail | 13 | 9 | 18 | 16 | |||||||||||
Corporate | 12 | 5 | 16 | 8 | |||||||||||
Total Capital Expenditures | $ | 167 | $ | 170 | $ | 270 | $ | 289 | |||||||
__________________________
(a) | Federal and state motor fuel taxes on sales by our retail segment are included in both revenues and cost of sales in our condensed statements of consolidated operations. These taxes totaled $152 million and $143 million for the three months ended June 30, 2014 and 2013, respectively, and $293 million and $272 million for the six months ended June 30, 2014 and 2013, respectively. |
(b) | We present TLLP’s segment operating income net of general and administrative expenses totaling $5 million and $4 million representing TLLP’s corporate costs for the three months ended June 30, 2014 and 2013, respectively, and $8 million for each of the six months ended June 30, 2014 and 2013 that are not allocated to TLLP’s operating segments. |
(c) | Includes stock-based compensation expense of $26 million and benefit of $4 million for the three months ended June 30, 2014 and 2013, respectively, and expense of $8 million and $45 million for the six months ended June 30, 2014 and 2013, respectively. The significant impact to stock-based compensation expense during the six months ended June 30, 2014 compared to the prior period is primarily a result of changes in Tesoro’s stock price. |
(d) | Includes charges totaling $31 million for premiums and unamortized debt issuance costs associated with the redemption of the 2019 Notes during the six months ended June 30, 2014. |
(e) | Includes $54 million in refunds from a settlement of a rate proceeding from the California Public Utilities Commission for the three and six months ended June 30, 2013. |
22
NOTE P - CONDENSED CONSOLIDATING FINANCIAL INFORMATION
Separate condensed consolidating financial information of Tesoro Corporation (the “Parent”), subsidiary guarantors and non-guarantors is presented below. At June 30, 2014, Tesoro and certain subsidiary guarantors have fully and unconditionally guaranteed our 4.250% Senior Notes due 2017, 5.375% Senior Notes due 2022, and 5.125% Senior Notes due 2024. TLLP, in which we had a 36% ownership interest as of June 30, 2014, and other subsidiaries have not guaranteed these obligations. As a result of these guarantee arrangements, we are required to present the following condensed consolidating financial information, which should be read in conjunction with the accompanying condensed consolidated financial statements and notes thereto. This information is provided as an alternative to providing separate financial statements for guarantor subsidiaries. Separate financial statements of Tesoro’s subsidiary guarantors are not included because the guarantees are full and unconditional and these subsidiary guarantors are 100% owned and are jointly and severally liable for Tesoro’s outstanding senior notes. The information is presented using the equity method of accounting for investments in subsidiaries. Intercompany transactions between subsidiaries are presented gross and eliminated in the eliminations column. Additionally, the results of operations of the Hawaii Business have been reported as discontinued operations in these condensed consolidating statements of operations and comprehensive income for the three and six months ended June 30, 2014 and 2013.
Condensed Consolidating Statement of Operations
for the Three Months Ended June 30, 2014
(In millions)
Parent | Guarantor Subsidiaries | Non- Guarantors | Eliminations | Consolidated | |||||||||||
REVENUES | $ | — | $ | 12,729 | $ | 1,829 | $ | (3,454 | ) | $ | 11,104 | ||||
COSTS AND EXPENSES: | |||||||||||||||
Cost of sales | — | 11,572 | 1,688 | (3,393 | ) | 9,867 | |||||||||
Operating, selling, general and administrative expenses | 3 | 677 | 71 | (61 | ) | 690 | |||||||||
Depreciation and amortization expense | — | 117 | 18 | — | 135 | ||||||||||
(Gain) loss on asset disposals and impairments | — | 3 | (1 | ) | — | 2 | |||||||||
OPERATING INCOME (LOSS) | (3 | ) | 360 | 53 | — | 410 | |||||||||
Equity in earnings of subsidiaries | 231 | 13 | — | (244 | ) | — | |||||||||
Interest and financing costs, net | (9 | ) | (24 | ) | (17 | ) | 9 | (41 | ) | ||||||
Other income, net | 2 | 1 | 9 | (9 | ) | 3 | |||||||||
EARNINGS BEFORE INCOME TAXES | 221 | 350 | 45 | (244 | ) | 372 | |||||||||
Income tax expense (benefit) (a) | (3 | ) | 127 | 8 | — | 132 | |||||||||
NET EARNINGS | 224 | 223 | 37 | (244 | ) | 240 | |||||||||
Less: Net earnings from continuing operations attributable to noncontrolling interest | — | — | 16 | — | 16 | ||||||||||
NET EARNINGS ATTRIBUTABLE TO TESORO CORPORATION | $ | 224 | $ | 223 | $ | 21 | $ | (244 | ) | $ | 224 | ||||
COMPREHENSIVE INCOME | |||||||||||||||
Total comprehensive income | $ | 224 | $ | 223 | $ | 37 | $ | (244 | ) | $ | 240 | ||||
Less: Noncontrolling interest in comprehensive income | — | — | 16 | — | 16 | ||||||||||
COMPREHENSIVE INCOME ATTRIBUTABLE TO TESORO CORPORATION | $ | 224 | $ | 223 | $ | 21 | $ | (244 | ) | $ | 224 | ||||
_______________
(a) | The income tax expense (benefit) reflected in each column does not include any tax effect of the equity in earnings from corporate subsidiaries, but does include the tax effect of the corporate partners’ share of partnership income. |
23
Condensed Consolidating Statement of Operations
for the Three Months Ended June 30, 2013
(In millions)
Parent | Guarantor Subsidiaries | Non- Guarantors | Eliminations | Consolidated | |||||||||||
REVENUES | $ | — | $ | 10,428 | $ | 1,081 | $ | (2,612 | ) | $ | 8,897 | ||||
COSTS AND EXPENSES: | |||||||||||||||
Cost of sales | — | 9,497 | 1,024 | (2,612 | ) | 7,909 | |||||||||
Operating, selling, general and administrative expenses | 6 | 466 | 33 | — | 505 | ||||||||||
Depreciation and amortization expense | — | 103 | 8 | — | 111 | ||||||||||
Loss on asset disposals and impairments | — | 8 | — | — | 8 | ||||||||||
OPERATING INCOME (LOSS) | (6 | ) | 354 | 16 | — | 364 | |||||||||
Equity in earnings of subsidiaries (a) | 234 | 6 | — | (240 | ) | — | |||||||||
Interest and financing costs, net | (4 | ) | (26 | ) | (7 | ) | 4 | (33 | ) | ||||||
Other income, net | — | 53 | 7 | (4 | ) | 56 | |||||||||
EARNINGS BEFORE INCOME TAXES | 224 | 387 | 16 | (240 | ) | 387 | |||||||||
Income tax expense (benefit) (b) | (3 | ) | 141 | — | — | 138 | |||||||||
NET EARNINGS FROM CONTINUING OPERATIONS | 227 | 246 | 16 | (240 | ) | 249 | |||||||||
Loss from discontinued operations, net of tax | — | (11 | ) | — | — | (11 | ) | ||||||||
NET EARNINGS | 227 | 235 | 16 | (240 | ) | 238 | |||||||||
Less: Net earnings from continuing operations attributable to noncontrolling interest | — | — | 11 | — | 11 | ||||||||||
NET EARNINGS ATTRIBUTABLE TO TESORO CORPORATION | $ | 227 | $ | 235 | $ | 5 | $ | (240 | ) | $ | 227 | ||||
COMPREHENSIVE INCOME | |||||||||||||||
Total comprehensive income | $ | 300 | $ | 235 | $ | 16 | $ | (240 | ) | $ | 311 | ||||
Less: Noncontrolling interest in comprehensive income | — | — | 11 | — | 11 | ||||||||||
COMPREHENSIVE INCOME ATTRIBUTABLE TO TESORO CORPORATION | $ | 300 | $ | 235 | $ | 5 | $ | (240 | ) | $ | 300 | ||||
_______________
(a) | Revised to conform to current period presentation of equity in earnings of subsidiaries that reflects equity in earnings of subsidiaries within the guarantor and non-guarantor columns net of intercompany amounts. |
(b) | The income tax expense (benefit) reflected in each column does not include any tax effect of the equity in earnings from corporate subsidiaries, but does include the tax effect of the corporate partners’ share of partnership income. |
24
Condensed Consolidating Statement of Operations
for the Six Months Ended June 30, 2014
(In millions)
Parent | Guarantor Subsidiaries | Non- Guarantors | Eliminations | Consolidated | |||||||||||
REVENUES | $ | — | $ | 24,293 | $ | 3,439 | $ | (6,695 | ) | $ | 21,037 | ||||
COSTS AND EXPENSES: | |||||||||||||||
Cost of sales | — | 22,236 | 3,164 | (6,585 | ) | 18,815 | |||||||||
Operating, selling, general and administrative expenses | 4 | 1,289 | 129 | (110 | ) | 1,312 | |||||||||
Depreciation and amortization expense | — | 230 | 35 | — | 265 | ||||||||||
(Gain) loss on asset disposals and impairments | — | 2 | (5 | ) | — | (3 | ) | ||||||||
OPERATING INCOME (LOSS) | (4 | ) | 536 | 116 | — | 648 | |||||||||
Equity in earnings of subsidiaries | 317 | 27 | — | (344 | ) | — | |||||||||
Interest and financing costs, net | (17 | ) | (83 | ) | (35 | ) | 17 | (118 | ) | ||||||
Other income, net | 2 | — | 17 | (17 | ) | 2 | |||||||||
EARNINGS BEFORE INCOME TAXES | 298 | 480 | 98 | (344 | ) | 532 | |||||||||
Income tax expense (benefit) (a) | (4 | ) | 178 | 14 | — | 188 | |||||||||
NET EARNINGS FROM CONTINUING OPERATIONS | 302 | 302 | 84 | (344 | ) | 344 | |||||||||
Loss from discontinued operations, net of tax | — | (1 | ) | — | — | (1 | ) | ||||||||
NET EARNINGS | 302 | 301 | 84 | (344 | ) | 343 | |||||||||
Less: Net earnings from continuing operations attributable to noncontrolling interest | — | — | 41 | — | 41 | ||||||||||
NET EARNINGS ATTRIBUTABLE TO TESORO CORPORATION | $ | 302 | $ | 301 | $ | 43 | $ | (344 | ) | $ | 302 | ||||
COMPREHENSIVE INCOME | |||||||||||||||
Total comprehensive income | $ | 302 | $ | 301 | $ | 84 | $ | (344 | ) | $ | 343 | ||||
Less: Noncontrolling interest in comprehensive income | — | — | 41 | — | 41 | ||||||||||
COMPREHENSIVE INCOME ATTRIBUTABLE TO TESORO CORPORATION | $ | 302 | $ | 301 | $ | 43 | $ | (344 | ) | $ | 302 | ||||
_______________
(a) | The income tax expense (benefit) reflected in each column does not include any tax effect of the equity in earnings from corporate subsidiaries, but does include the tax effect of the corporate partners’ share of partnership income. |
25
Condensed Consolidating Statement of Operations
for the Six Months Ended June 30, 2013
(In millions)
Parent | Guarantor Subsidiaries | Non- Guarantors | Eliminations | Consolidated | |||||||||||
REVENUES | $ | — | $ | 19,543 | $ | 1,903 | $ | (5,202 | ) | $ | 16,244 | ||||
COSTS AND EXPENSES: | |||||||||||||||
Cost of sales | — | 17,894 | 1,780 | (5,202 | ) | 14,472 | |||||||||
Operating, selling, general and administrative expenses | 7 | 916 | 61 | — | 984 | ||||||||||
Depreciation and amortization expense | — | 203 | 13 | — | 216 | ||||||||||
Loss on asset disposals and impairments | — | 12 | 3 | — | 15 | ||||||||||
OPERATING INCOME (LOSS) | (7 | ) | 518 | 46 | — | 557 | |||||||||
Equity in earnings of subsidiaries (a) | 330 | 11 | — | (341 | ) | — | |||||||||
Interest and financing costs, net | (6 | ) | (51 | ) | (12 | ) | 6 | (63 | ) | ||||||
Other income, net | — | 53 | 9 | (6 | ) | 56 | |||||||||
EARNINGS BEFORE INCOME TAXES | 317 | 531 | 43 | (341 | ) | 550 | |||||||||
Income tax expense (benefit) (b) | (3 | ) | 196 | 3 | — | 196 | |||||||||
NET EARNINGS FROM CONTINUING OPERATIONS | 320 | 335 | 40 | (341 | ) | 354 | |||||||||
Loss from discontinued operations, net of tax | — | (12 | ) | — | — | (12 | ) | ||||||||
NET EARNINGS | 320 | 323 | 40 | (341 | ) | 342 | |||||||||
Less: Net earnings from continuing operations attributable to noncontrolling interest | — | — | 22 | — | 22 | ||||||||||
NET EARNINGS ATTRIBUTABLE TO TESORO CORPORATION | $ | 320 | $ | 323 | $ | 18 | $ | (341 | ) | $ | 320 | ||||
COMPREHENSIVE INCOME | |||||||||||||||
Total comprehensive income | $ | 393 | $ | 323 | $ | 40 | $ | (341 | ) | $ | 415 | ||||
Less: Noncontrolling interest in comprehensive income | — | — | 22 | — | 22 | ||||||||||
COMPREHENSIVE INCOME ATTRIBUTABLE TO TESORO CORPORATION | $ | 393 | $ | 323 | $ | 18 | $ | (341 | ) | $ | 393 | ||||
_______________
(a) | Revised to conform to current period presentation of equity in earnings of subsidiaries that reflects equity in earnings of subsidiaries within the guarantor and non-guarantor columns net of intercompany amounts. |
(b) | The income tax expense (benefit) reflected in each column does not include any tax effect of the equity in earnings from corporate subsidiaries, but does include the tax effect of the corporate partners’ share of partnership income. |
26
Condensed Consolidating Balance Sheet as of June 30, 2014
(In millions)
Parent | Guarantor Subsidiaries | Non- Guarantors | Eliminations | Consolidated | |||||||||||
ASSETS | |||||||||||||||
Current Assets: | |||||||||||||||
Cash and cash equivalents | $ | — | $ | 940 | $ | 299 | $ | — | $ | 1,239 | |||||
Receivables, less allowance for doubtful accounts | — | 1,309 | 506 | — | 1,815 | ||||||||||
Inventories | — | 2,323 | 319 | — | 2,642 | ||||||||||
Prepayments and other current assets | 87 | 109 | 18 | (4 | ) | 210 | |||||||||
Total Current Assets | 87 | 4,681 | 1,142 | (4 | ) | 5,906 | |||||||||
Net Property, Plant and Equipment | — | 5,503 | 1,493 | — | 6,996 | ||||||||||
Investment in Subsidiaries | 5,550 | 343 | — | (5,893 | ) | — | |||||||||
Long-Term Receivables from Affiliates | 2,897 | — | — | (2,897 | ) | — | |||||||||
Long-Term Intercompany Note Receivable | — | — | 1,134 | (1,134 | ) | — | |||||||||
Other Noncurrent Assets, Net | 52 | 1,080 | 37 | — | 1,169 | ||||||||||
Total Assets | $ | 8,586 | $ | 11,607 | $ | 3,806 | $ | (9,928 | ) | $ | 14,071 | ||||
LIABILITIES AND EQUITY | |||||||||||||||
Current Liabilities: | |||||||||||||||
Accounts payable | $ | 1 | $ | 2,293 | $ | 704 | $ | — | $ | 2,998 | |||||
Other current liabilities | 176 | 626 | 71 | (4 | ) | 869 | |||||||||
Total Current Liabilities | 177 | 2,919 | 775 | (4 | ) | 3,867 | |||||||||
Long-Term Payables to Affiliates | — | 2,810 | 87 | (2,897 | ) | — | |||||||||
Deferred Income Taxes | 1,030 | — | — | — | 1,030 | ||||||||||
Other Noncurrent Liabilities | 272 | 299 | 15 | — | 586 | ||||||||||
Debt | 1,622 | 42 | 1,391 | — | 3,055 | ||||||||||
Long-Term Intercompany Note Payable | 1,134 | — | — | (1,134 | ) | — | |||||||||
Equity-Tesoro Corporation | 4,351 | 5,537 | 356 | (5,893 | ) | 4,351 | |||||||||
Equity-Noncontrolling Interest | — | — | 1,182 | — | 1,182 | ||||||||||
Total Liabilities and Equity | $ | 8,586 | $ | 11,607 | $ | 3,806 | $ | (9,928 | ) | $ | 14,071 | ||||
27
Condensed Consolidating Balance Sheet as of December 31, 2013
(In millions)
Parent | Guarantor Subsidiaries | Non- Guarantors | Eliminations | Consolidated | |||||||||||
ASSETS | |||||||||||||||
Current Assets: | |||||||||||||||
Cash and cash equivalents | $ | — | $ | 1,161 | $ | 77 | $ | — | $ | 1,238 | |||||
Receivables, less allowance for doubtful accounts | 12 | 1,182 | 119 | — | 1,313 | ||||||||||
Inventories | — | 2,041 | 524 | — | 2,565 | ||||||||||
Prepayments and other current assets | 109 | 89 | 57 | (45 | ) | 210 | |||||||||
Total Current Assets | 121 | 4,473 | 777 | (45 | ) | 5,326 | |||||||||
Net Property, Plant and Equipment | — | 5,428 | 1,447 | — | 6,875 | ||||||||||
Investment in Subsidiaries (a) | 5,242 | 342 | — | (5,584 | ) | — | |||||||||
Long-Term Receivables from Affiliates | 3,080 | — | — | (3,080 | ) | — | |||||||||
Long-Term Intercompany Note Receivable | — | — | 1,134 | (1,134 | ) | — | |||||||||
Other Noncurrent Assets, Net | 58 | 1,092 | 38 | — | 1,188 | ||||||||||
Total Assets | $ | 8,501 | $ | 11,335 | $ | 3,396 | $ | (9,843 | ) | $ | 13,389 | ||||
LIABILITIES AND EQUITY | |||||||||||||||
Current Liabilities: | |||||||||||||||
Accounts payable | $ | 1 | $ | 2,110 | $ | 485 | $ | — | $ | 2,596 | |||||
Other current liabilities | 112 | 679 | 66 | (45 | ) | 812 | |||||||||
Total Current Liabilities | 113 | 2,789 | 551 | (45 | ) | 3,408 | |||||||||
Long-Term Payables to Affiliates | — | 2,939 | 141 | (3,080 | ) | — | |||||||||
Deferred Income Taxes | 1,018 | — | — | — | 1,018 | ||||||||||
Other Noncurrent Liabilities | 320 | 327 | 8 | — | 655 | ||||||||||
Debt | 1,614 | 45 | 1,164 | — | 2,823 | ||||||||||
Long-Term Intercompany Note Payable | 1,134 | — | — | (1,134 | ) | — | |||||||||
Equity-Tesoro Corporation (a) | 4,302 | 5,235 | 349 | (5,584 | ) | 4,302 | |||||||||
Equity-Noncontrolling Interest | — | — | 1,183 | — | 1,183 | ||||||||||
Total Liabilities and Equity | $ | 8,501 | $ | 11,335 | $ | 3,396 | $ | (9,843 | ) | $ | 13,389 | ||||
_______________
(a) | Revised to conform to current period presentation that reflects investment in subsidiary and equity amounts within the guarantor and non-guarantor columns net of intercompany amounts. |
28
Condensed Consolidating Statement of Cash Flows for the Six Months Ended June 30, 2014
(In millions)
Parent | Guarantor Subsidiaries | Non- Guarantors | Eliminations | Consolidated | |||||||||||
CASH FLOWS FROM (USED IN) OPERATING ACTIVITIES | |||||||||||||||
Net cash from (used in) operating activities | $ | (20 | ) | $ | 248 | $ | 148 | $ | — | $ | 376 | ||||
CASH FLOWS FROM (USED IN) INVESTING ACTIVITIES | |||||||||||||||
Capital expenditures | — | (194 | ) | (66 | ) | — | (260 | ) | |||||||
Acquisitions | — | (17 | ) | — | — | (17 | ) | ||||||||
Intercompany notes, net | 316 | — | — | (316 | ) | — | |||||||||
Other investing activities | — | 1 | 9 | — | 10 | ||||||||||
Net cash from (used in) investing activities | 316 | (210 | ) | (57 | ) | (316 | ) | (267 | ) | ||||||
CASH FLOWS FROM (USED IN) FINANCING ACTIVITIES | |||||||||||||||
Borrowings under revolving credit agreements | — | — | 228 | — | 228 | ||||||||||
Proceeds from debt offering | 300 | — | — | — | 300 | ||||||||||
Repayments of debt | (300 | ) | (2 | ) | — | — | (302 | ) | |||||||
Dividend payments | (65 | ) | — | — | — | (65 | ) | ||||||||
Proceeds from stock options exercised | 6 | — | — | — | 6 | ||||||||||
Distributions to noncontrolling interest | — | — | (42 | ) | — | (42 | ) | ||||||||
Purchases of common stock | (200 | ) | — | — | — | (200 | ) | ||||||||
Taxes paid related to net share settlement of equity awards | (22 | ) | — | — | — | (22 | ) | ||||||||
Net intercompany borrowings (repayments) | — | (283 | ) | (33 | ) | 316 | — | ||||||||
Distributions to TLLP unitholders and general partner | 8 | 10 | (18 | ) | — | — | |||||||||
Other financing activities | (23 | ) | 16 | (4 | ) | — | (11 | ) | |||||||
Net cash from (used in) financing activities | (296 | ) | (259 | ) | 131 | 316 | (108 | ) | |||||||
INCREASE (DECREASE) IN CASH AND CASH EQUIVALENTS | — | (221 | ) | 222 | — | 1 | |||||||||
CASH AND CASH EQUIVALENTS, BEGINNING OF PERIOD | — | 1,161 | 77 | — | 1,238 | ||||||||||
CASH AND CASH EQUIVALENTS, END OF PERIOD | $ | — | $ | 940 | $ | 299 | $ | — | $ | 1,239 | |||||
29
Condensed Consolidating Statement of Cash Flows for the Six Months Ended June 30, 2013
(In millions)
Parent | Guarantor Subsidiaries | Non- Guarantors | Eliminations | Consolidated | |||||||||||
CASH FLOWS USED IN OPERATING ACTIVITIES | |||||||||||||||
Net cash used in operating activities | $ | (14 | ) | $ | (22 | ) | $ | (125 | ) | $ | — | $ | (161 | ) | |
CASH FLOWS FROM (USED IN) INVESTING ACTIVITIES | |||||||||||||||
Capital expenditures | — | (266 | ) | (27 | ) | — | (293 | ) | |||||||
Acquisitions | — | (1,870 | ) | (778 | ) | — | (2,648 | ) | |||||||
Intercompany notes, net | (1,719 | ) | — | — | 1,719 | — | |||||||||
Other investing activities | — | 23 | 2 | — | 25 | ||||||||||
Net cash used in investing activities | (1,719 | ) | (2,113 | ) | (803 | ) | 1,719 | (2,916 | ) | ||||||
CASH FLOWS FROM (USED IN) FINANCING ACTIVITIES | |||||||||||||||
Borrowings under revolving credit agreements | 1,524 | — | 544 | — | 2,068 | ||||||||||
Borrowings under term loan credit agreements | 500 | — | — | — | 500 | ||||||||||
Repayments on revolving credit agreements | (824 | ) | — | — | — | (824 | ) | ||||||||
Repayments of debt | — | (2 | ) | — | — | (2 | ) | ||||||||
Dividend payments | (55 | ) | — | — | — | (55 | ) | ||||||||
Proceeds from stock options exercised | 68 | — | — | — | 68 | ||||||||||
Net proceeds from issuance of Tesoro Logistics LP common units | — | — | 392 | — | 392 | ||||||||||
Distributions to noncontrolling interest | — | — | (28 | ) | — | (28 | ) | ||||||||
Purchases of common stock | (236 | ) | — | — | — | (236 | ) | ||||||||
Taxes paid related to net share settlement of equity awards | (5 | ) | — | — | — | (5 | ) | ||||||||
Net intercompany borrowings (repayments) | — | 1,197 | 522 | (1,719 | ) | — | |||||||||
Borrowings from general partner | 774 | — | (774 | ) | — | — | |||||||||
Distributions to TLLP unitholders and general partner | 7 | 8 | (15 | ) | — | — | |||||||||
Other financing activities | (20 | ) | 11 | (3 | ) | — | (12 | ) | |||||||
Net cash from (used in) financing activities | 1,733 | 1,214 | 638 | (1,719 | ) | 1,866 | |||||||||
DECREASE IN CASH AND CASH EQUIVALENTS | — | (921 | ) | (290 | ) | — | (1,211 | ) | |||||||
CASH AND CASH EQUIVALENTS, BEGINNING OF PERIOD | — | 1,244 | 395 | — | 1,639 | ||||||||||
CASH AND CASH EQUIVALENTS, END OF PERIOD | $ | — | $ | 323 | $ | 105 | $ | — | $ | 428 | |||||
30
ITEM 2. MANAGEMENT’S DISCUSSION AND ANALYSIS OF FINANCIAL CONDITION AND RESULTS OF OPERATIONS
Those statements in this section that are not historical in nature should be deemed forward-looking statements that are inherently uncertain. See “Important Information Regarding Forward-Looking Statements” on page 57 for a discussion of the factors that could cause actual results to differ materially from those projected in these statements. This section should be read in conjunction with Management’s Discussion and Analysis of Financial Condition and Results of Operations in our Annual Report on Form 10-K for the year ended December 31, 2013.
BUSINESS STRATEGY AND OVERVIEW
Strategy and Goals
Our vision is to create a safer and cleaner future as efficient providers of reliable transportation fuel solutions. To achieve these goals we are pursuing the following strategic priorities:
• | improve operational efficiency and effectiveness by focusing on safety and reliability, system improvements and cost leadership; |
• | drive commercial excellence by strengthening our supply, trading and optimization activities to provide additional value to the business; |
• | maintain our financial position by exercising capital discipline and focusing on a balanced use of free cash flow; |
• | capture value-driven growth through a focus on our logistics assets, growing our marketing business and other strategic opportunities accretive to shareholder value; and |
• | maintain a high performing culture by building leadership at all levels of the organization with employees from diverse backgrounds and experiences who are accountable for delivering on our commitments. |
Our goals were focused on these strategic priorities and we accomplished the following in the first half of 2014:
Operational Efficiency & Effectiveness | Commercial Excellence | Financial Discipline | Value Driven Growth | High Performing Culture | |
Captured synergies from the Los Angeles Acquisition of approximately $100 million and other business improvements of approximately $100 million in line with full year expectations | l | l | l | l | l |
Leveraged TLLP’s logistics operations to strategically source lower cost crude oil and continue to capture value-driven growth through TLLP’s investment in new assets for crude oil gathering and refined products distribution | l | l | l | l | l |
Completed the issuance of $300 million aggregate principal amount of 5.125% Senior Notes due 2024, and redeemed the outstanding 9.750% Senior Notes due 2019 | l | ||||
Purchased 3.7 million shares of our common stock and paid $0.25 per share dividends each quarter | l | ||||
TLLP entered into an agreement to acquire the West Coast Logistics Assets from Tesoro for a purchase price of $270 million of which the first phase for $241 million closed on July 1, 2014 | l | l | |||
TLLP launched its Continuous Offering Program authorizing the issuance of up to an aggregate of $200 million of common units in amounts, at prices, and on terms determined by market conditions | l | l | |||
31
Synergy and Business Improvement Objectives
During the first half of 2014, we delivered approximately $200 million in EBITDA (earnings before interest, income taxes, depreciation and amortization expenses) improvements as a result of our synergy and business improvement objectives. These EBITDA improvements resulted in approximately $121 million of net earnings for the six months ended June 30, 2014. Our 2014 achievements include the following:
• | Increased overall refining capture rates from 99% to 104% during the first half of 2014 compared to the second half of 2013 resulting from the Los Angeles Acquisition (as defined on page 39) and the optimization of crude oil cargoes between our California and Anacortes refineries; |
• | Integrated refined products movements between our Carson and Wilmington facilities allowing us to move finished barrels from Wilmington into the new Carson logistics system enhancing our flexibility to blend and share gasoline and jet supplies; |
• | Completed expansion of the Salt Lake City waxy crude unit, which resulted in an increase from 85% to 128% capture of the Group 3 crack spread (the differential between the price of WTI crude oil, as defined on page 33, and the blended refined products price of two-thirds gasoline and one-third diesel in the Mid-Continent region) and the expansion of the Mandan distillate desulfurization unit allowing the refinery to run an additional 3 thousand barrels per day (“Mbpd”) of total throughput; |
• | Further optimized our marketing portfolio through the acquisition of 15 retail stations in the Salt Lake City area enhancing our integration in that market; and |
• | Achieved additional value-driven growth through our interest in Tesoro Logistics LP with its continued focus on organic growth projects and acquisition of logistics assets from us. |
Refer to page 38 for our reconciliation of net earnings to EBITDA improvements.
Tesoro Logistics LP (“TLLP”)
TLLP was formed to own, operate, develop and acquire logistics assets to gather crude oil and distribute, transport and store crude oil and refined products. Tesoro Logistics GP, LLC (“TLGP”), a fully consolidated subsidiary, serves as the general partner of TLLP. We held an approximate 36% interest in TLLP at June 30, 2014, including the general partner interest. Our ownership interest in TLLP include subordinated units that were converted to common units during the second quarter of 2014 and thereafter participate on terms equal with all other common units in distributions of available cash. At the time of conversion, our ownership interest in TLLP and financial position were not impacted. In the first half of 2014, 88% of TLLP’s revenue was derived from us primarily under various long-term, fee-based commercial agreements that generally include minimum volume commitments. In accordance with the partnership agreement, common, subordinated and general partner interests are entitled to receive quarterly distributions of available cash.
As of and for the three months ended June 30, 2014 and 2013, certain financial data related to our ownership, including incentive distribution rights, in TLLP is as follows (in millions):
Three Months Ended June 30, | |||||||
2014 | 2013 | ||||||
Cash distributions received from TLLP (a) | $ | 18 | $ | 10 | |||
Total market value of TLLP units held by Tesoro (b) | 1,403 | 1,087 | |||||
__________________
(a) | Represents distributions received from TLLP during the three months ended June 30, 2014 and 2013 on units held by Tesoro. |
(b) | Represents market value of units held at June 30, 2014 and 2013. Tesoro held 19,110,714 common units at a market value of $73.40 per unit based on the closing unit price at June 30, 2014. Tesoro held 2,729,476 common units and 15,254,890 subordinated units at a market value of $60.46 per unit based on the closing unit price at June 30, 2013. |
TLLP intends to continue to expand its business through organic growth, including constructing new assets and increasing the utilization of existing assets, and by acquiring assets from us and third parties. TLLP has recently announced plans to expand capacity on its crude oil gathering system (“High Plains System”) and grow third-party volumes at its terminals.
32
Effective June 23, 2014, TLLP entered into a transaction to purchase certain terminalling and pipeline assets owned by Tesoro and two of our subsidiaries for total consideration of $270 million to be completed in two phases. On July 1, 2014, TLLP purchased the first phase consisting of three marketing terminals and a storage facility in exchange for consideration of $241 million, comprised of approximately $214 million in cash, and the issuance of equity to us with a fair value of $27 million. TLLP’s acquisition of a refined products pipeline in the second phase is pending regulatory approval. This approval is expected during the third or fourth quarter of 2014.
On June 25, 2014, TLLP filed a prospectus supplement to its shelf registration statement filed with the SEC in 2012, authorizing the continuous issuance of up to an aggregate of $200 million of common units, in amounts, at prices and on terms to be determined by market conditions and other factors at the time of its offerings (such continuous offering program referred to as the “ATM Program”). During the three months ended June 30, 2014, TLLP sold an aggregate of 5,500 common units under its ATM Program, generating less than $1 million in proceeds, net of offering costs. The net proceeds from these sales will be used for general partnership purposes. TLLP issued an additional 193,900 common units under this program for net proceeds of $14 million that settled in July 2014.
Industry Overview
Our profitability is heavily influenced by the cost of crude oil and aggregate value of products we make from that crude oil and is affected by changes in economic conditions and supply and demand balance. Product values and crude oil prices are set by the market and are outside of our control. The following charts illustrate average benchmark refined product differentials relevant to our markets and comparison to pricing for West Texas Intermediate (“WTI”) or Alaska North Slope (“ANS”) crude oil.
Average Mid-Continent Benchmark
Product Differentials to WTI ($/barrel)
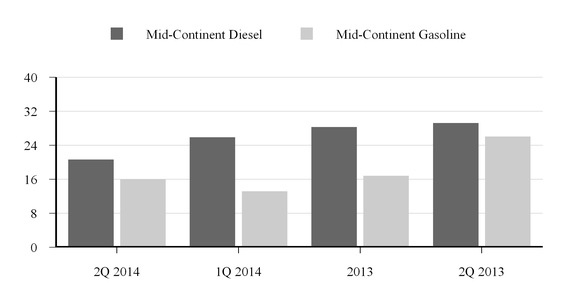
Source: PLATTS
33
Average U.S. West Coast Benchmark
Product Differentials to ANS ($/barrel)
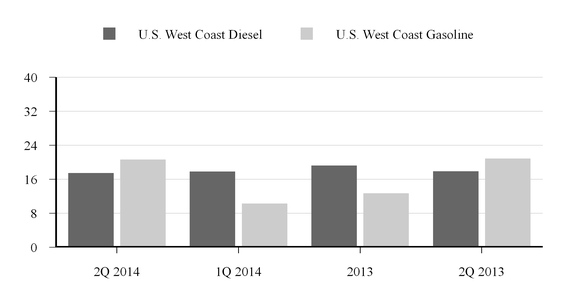
Source: PLATTS
Average Mid-Continent benchmark gasoline margins and diesel fuel margins were down approximately 38% and 29%, respectively, in the second quarter of 2014 as compared to the second quarter of 2013. Average U.S. West Coast benchmark gasoline margins and diesel fuel margins were down approximately 1% and 2%, respectively, in the second quarter of 2014, as compared to second quarter of 2013.
The following chart illustrates average benchmark crude oil pricing relevant to our markets.
Average Crude Oil Prices ($/barrel)
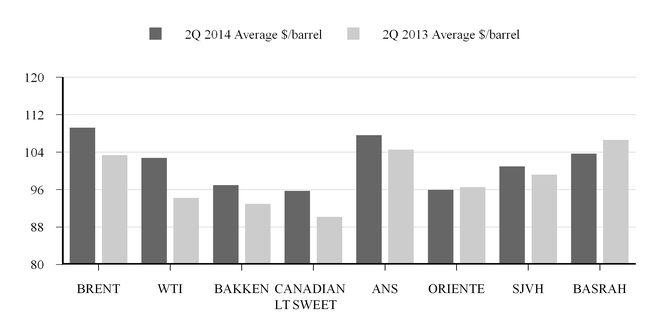
Source: PLATTS
Our Mid-Continent and Pacific Northwest refineries have benefited from processing inland U.S. and Canada crude oil priced on the basis of WTI crude oil resulting in discounts compared to benchmark Brent crude oil (“Brent”) processed at our coastal refineries. The WTI discount to Brent averaged over $6 per barrel during the second quarter of 2014, compared to approximately $9 per barrel during the second quarter of 2013.
34
We supply our North Dakota refinery exclusively with Bakken crude oil, our Washington refinery primarily with Bakken and Canadian Light Sweet crude oil and our Utah refinery with light sweet crude oil from Wyoming and Colorado as well as Uinta Basin waxy crude oil. In the second quarter of 2014, the average discount of Bakken crude oil to WTI increased to about $6 per barrel, compared to an average discount of less than $2 per barrel in the second quarter of 2013. The average discount of Canadian Light Sweet crude oil to WTI increased to about $7 per barrel in the second quarter of 2014, compared to approximately $4 per barrel during the second quarter of 2013. Our California refineries run a significant amount of South American heavy (“Oriente”) and San Joaquin Valley Heavy (“SJVH”) crude oil and light crude oil from Iraq (“Basrah”), which continued to be priced at a discount to Brent during the second quarter of 2014.
Product Supply and Demand Factors
There are long-term factors, in addition to current market conditions, that may impact the supply and demand of refined products in the U.S. including:
• | world crude oil prices; |
• | increased federal fuel efficiency standards for motor vehicles; |
• | increased volumes of renewable fuels, mandated by the Energy Independence and Security Act; |
• | various regulations of greenhouse gas emissions from stationary and mobile sources; |
• | potential enactment of federal climate change legislation; and |
• | possible promulgation of national regulations relative to gasoline composition and ozone standards. |
35
RESULTS OF OPERATIONS
A discussion and analysis of the factors contributing to our results of operations is presented below. The accompanying condensed consolidated financial statements, together with the following information, are intended to provide investors with a reasonable basis for assessing our historical operations, but should not serve as the only criteria for predicting our future performance.
As of December 31, 2013, we began reporting the logistics assets and operations of TLLP as a separate operating segment. In previous periods, when certain quantitative thresholds had not been met, TLLP’s assets and operations were presented within our refining operating segment. TLLP’s assets and operations include certain crude oil gathering assets and crude oil and refined products terminalling and transportation assets acquired from Tesoro and third parties. The historical results of operations of these assets have been retrospectively adjusted to conform to current presentation. These adjustments resulted in lower gross refining margins. The refining segment now includes costs for transportation and terminalling services provided by TLLP that were previously eliminated with consolidated reporting of TLLP revenues within our refining segment results.
On September 25, 2013, we completed the sale of all of our interest in Tesoro Hawaii, LLC (the “Hawaii Business”). We have reflected its results of operations as discontinued operations in our condensed consolidated statements of operations for all periods presented, and, unless otherwise noted, we have excluded the Hawaii Business from the financial and operational data presented in the tables and discussion that follow.
Our management uses a variety of financial and operating metrics to analyze operating segment performance. To supplement our financial information presented in accordance with accounting principles generally accepted in the United States of America (“U.S. GAAP”), our management uses additional metrics that are known as “non-GAAP” financial metrics in its evaluation of past performance and prospects for the future. These metrics are significant factors in assessing our operating results and profitability and include adjusted earnings before interest, income taxes, depreciation and amortization expenses (“Adjusted EBITDA”). We define Adjusted EBITDA as consolidated earnings, including earnings attributable to noncontrolling interest, excluding net earnings (loss) from discontinued operations, before depreciation and amortization expense, net interest and financing costs, income taxes and interest income.
We present Adjusted EBITDA because we believe some investors and analysts use Adjusted EBITDA to help analyze our cash flows including our ability to satisfy principal and interest obligations with respect to our indebtedness and use cash for other purposes, including capital expenditures. Adjusted EBITDA is also used by some investors and analysts to analyze and compare companies on the basis of operating performance and by management for internal analysis. Adjusted EBITDA should not be considered as an alternative to U.S. GAAP net earnings or net cash from operating activities. Adjusted EBITDA has important limitations as an analytical tool, because it excludes some items that affect net earnings and net cash from operating activities.
36
Summary
Three Months Ended June 30, | Six Months Ended June 30, | ||||||||||||||
2014 | 2013 | 2014 | 2013 | ||||||||||||
(In millions, except per share amounts) | |||||||||||||||
REVENUES | $ | 11,104 | $ | 8,897 | $ | 21,037 | $ | 16,244 | |||||||
COSTS AND EXPENSES: | |||||||||||||||
Cost of sales | 9,867 | 7,909 | 18,815 | 14,472 | |||||||||||
Operating expenses | 598 | 441 | 1,189 | 809 | |||||||||||
Selling, general and administrative expenses | 92 | 64 | 123 | 175 | |||||||||||
Depreciation and amortization expense | 135 | 111 | 265 | 216 | |||||||||||
(Gain) loss on asset disposals and impairments | 2 | 8 | (3 | ) | 15 | ||||||||||
OPERATING INCOME | 410 | 364 | 648 | 557 | |||||||||||
Interest and financing costs, net | (41 | ) | (33 | ) | (118 | ) | (63 | ) | |||||||
Other income, net | 3 | 56 | 2 | 56 | |||||||||||
EARNINGS BEFORE INCOME TAXES | 372 | 387 | 532 | 550 | |||||||||||
Income tax expense | 132 | 138 | 188 | 196 | |||||||||||
NET EARNINGS FROM CONTINUING OPERATIONS | 240 | 249 | 344 | 354 | |||||||||||
Loss from discontinued operations, net of tax | — | (11 | ) | (1 | ) | (12 | ) | ||||||||
NET EARNINGS | 240 | 238 | 343 | 342 | |||||||||||
Less: Net earnings from continuing operations attributable to noncontrolling interest | 16 | 11 | 41 | 22 | |||||||||||
NET EARNINGS ATTRIBUTABLE TO TESORO CORPORATION | $ | 224 | $ | 227 | $ | 302 | $ | 320 | |||||||
NET EARNINGS (LOSS) ATTRIBUTABLE TO TESORO CORPORATION | |||||||||||||||
Continuing operations | $ | 224 | $ | 238 | $ | 303 | $ | 332 | |||||||
Discontinued operations | — | (11 | ) | (1 | ) | (12 | ) | ||||||||
Total | $ | 224 | $ | 227 | $ | 302 | $ | 320 | |||||||
NET EARNINGS (LOSS) PER SHARE - BASIC: | |||||||||||||||
Continuing operations | $ | 1.73 | $ | 1.75 | $ | 2.33 | $ | 2.44 | |||||||
Discontinued operations | — | (0.08 | ) | (0.01 | ) | (0.09 | ) | ||||||||
Total | $ | 1.73 | $ | 1.67 | $ | 2.32 | $ | 2.35 | |||||||
Weighted average common shares outstanding - Basic | 129.3 | 135.8 | 130.3 | 136.4 | |||||||||||
NET EARNINGS (LOSS) PER SHARE - DILUTED: | |||||||||||||||
Continuing operations | $ | 1.70 | $ | 1.72 | $ | 2.29 | $ | 2.39 | |||||||
Discontinued operations | — | (0.08 | ) | (0.01 | ) | (0.09 | ) | ||||||||
Total | $ | 1.70 | $ | 1.64 | $ | 2.28 | $ | 2.30 | |||||||
Weighted average common shares outstanding - Diluted | 131.5 | 138.2 | 132.7 | 138.9 | |||||||||||
37
Three Months Ended June 30, | Six Months Ended June 30, | ||||||||||||||
2014 | 2013 | 2014 | 2013 | ||||||||||||
(In millions) | |||||||||||||||
Reconciliation of Net Earnings to Adjusted EBITDA | |||||||||||||||
Net earnings attributable to Tesoro Corporation | $ | 224 | $ | 227 | $ | 302 | $ | 320 | |||||||
Net earnings attributable to noncontrolling interest | 16 | 11 | 41 | 22 | |||||||||||
Loss from discontinued operations, net of tax | — | 11 | 1 | 12 | |||||||||||
Depreciation and amortization expense | 135 | 111 | 265 | 216 | |||||||||||
Income tax expense | 132 | 138 | 188 | 196 | |||||||||||
Interest and financing costs, net | 41 | 33 | 118 | 63 | |||||||||||
Interest income | — | — | — | (1 | ) | ||||||||||
Adjusted EBITDA (a) | $ | 548 | $ | 531 | $ | 915 | $ | 828 | |||||||
Reconciliation of Cash Flows from (used in) Operating Activities to Adjusted EBITDA | |||||||||||||||
Net cash from (used in) operating activities | $ | 526 | $ | (408 | ) | $ | 376 | $ | (161 | ) | |||||
Net cash from discontinued operations | — | (91 | ) | — | (192 | ) | |||||||||
Debt redemption charges | — | — | (31 | ) | — | ||||||||||
Deferred charges | 19 | 118 | 79 | 277 | |||||||||||
Changes in current assets and current liabilities | (140 | ) | 743 | 203 | 702 | ||||||||||
Income tax expense | 132 | 138 | 188 | 196 | |||||||||||
Stock-based compensation benefit (expense) | (26 | ) | 4 | (8 | ) | (45 | ) | ||||||||
Interest and financing costs, net | 41 | 33 | 118 | 63 | |||||||||||
Other | (4 | ) | (6 | ) | (10 | ) | (12 | ) | |||||||
Adjusted EBITDA (a) | $ | 548 | $ | 531 | $ | 915 | $ | 828 | |||||||
________________
(a) | For a definition of Adjusted EBITDA, see discussion above. |
Six Months Ended June 30, 2014 | |||||||||||||||
Reconciliation of Net Earnings to EBITDA Improvements | California Synergies (a) | Enhanced Gross Margin (b) | Business Improvements (c) | Total | |||||||||||
Net earnings | $ | 63 | $ | 42 | $ | 16 | $ | 121 | |||||||
Add income tax expense | 37 | 26 | 9 | 72 | |||||||||||
Add depreciation and amortization expense | — | 7 | — | 7 | |||||||||||
EBITDA improvements | $ | 100 | $ | 75 | $ | 25 | $ | 200 | |||||||
________________
(a) | Our objective to deliver California synergies includes projects and initiatives underway to optimize feedstock supply and product yields, capture operating cost advantages through integration of our southern California facilities and improve utilization of logistics assets acquired as part of the Los Angeles Acquisition (as defined on page 39). |
(b) | Our objective to enhance our gross margin represents our efforts to create significant value across our existing asset base including projects to capitalize on advantaged crude oil processing, such as the Utah Refinery Expansion project (as defined on page 52) and the expansion at our North Dakota refinery. Additionally, we expect to continue to enhance gross margins through further marketing integration, construction and acquisition of new logistics assets, and increased processing of advantage crude oil through our West Coast refineries upon completion of the Vancouver Energy terminal (as defined on page 53). |
(c) | Our business improvement initiatives include our efforts to improve processes at our refineries to increase reliability and lower manufacturing costs, improve our supply chain management to reduce costs, and enhance the sustainability of cost improvements through operational excellence management systems and lean six-sigma practices. |
38
Consolidated Results
Three Months Ended June 30, 2014 versus June 30, 2013
Our net earnings from continuing operations attributable to Tesoro Corporation were $224 million ($1.70 per diluted share) for the three months ended June 30, 2014 (“2014 Quarter”) compared to $238 million ($1.72 per diluted share) for the three months ended June 30, 2013 (“2013 Quarter”). Our gross refining margin increased $153 million during the 2014 Quarter compared to the 2013 Quarter driven by higher refined products sales volumes resulting from the acquisition of BP’s integrated Southern California refining, marketing and logistics business on June 1, 2013 from BP West Coast Products, LLC and other affiliated sellers (the “Los Angeles Acquisition”) that also resulted in higher operating expenses during the 2014 Quarter. The increase in refined products sales volume was offset by a decrease of $1.40 in our gross refining margin per barrel caused by a lower margin environment. Our gross retail margin increased $64 million due to higher fuel sales volume resulting from stations acquired as part of the Los Angeles Acquisition and continued expansion of our retail network. TLLP increased operating income by $30 million due to higher throughput volumes driven by acquired assets and continued expansion of its crude oil gathering assets. Offsetting the increases to net earnings were a decrease to other income, net resulting from a settlement income of $54 million received in the 2013 Quarter that did not occur in the 2014 Quarter and an increase in stock-based compensation charges of $30 million during the 2014 Quarter compared to the 2013 Quarter.
Our selling, general and administrative expenses were $92 million in the 2014 Quarter compared to $64 million in the 2013 Quarter. The difference was primarily attributable to changes in stock-based compensation expense during the 2014 Quarter as compared to the 2013 Quarter, principally related to our stock appreciation rights that are adjusted based on the market price of the stock each period. The stock-based compensation impact on the 2014 Quarter results include an expense of $26 million as compared to the 2013 Quarter results, which included a benefit of $4 million. Our stock price per share increased from $50.59 to $58.67 during the 2014 Quarter compared to a decrease from $58.55 to $52.32 during the 2013 Quarter.
Interest and financing costs increased approximately $8 million to $41 million during the 2014 Quarter from $33 million in the 2013 Quarter. The increase was primarily due to $11 million of interest expense resulting from TLLP’s 5.875% and 6.125% senior notes due 2020 and 2021, respectively, issued during the second half of 2013. TLLP used these borrowings to finance its acquisition of logistics assets from us that we acquired in connection with the Los Angeles Acquisition. During the 2014 Quarter, our interest costs reflected a net savings compared to the 2013 Quarter of $4 million as a result of refinancing the 9.750% Senior Notes due 2019 (the “2019 Notes”) with the 5.125% Senior Notes due 2024 (the “2024 Notes”) in March 2014.
Other income during the 2013 Quarter included a refund from the settlement of a rate proceeding from the California Public Utilities Commission of $54 million.
Our income tax expense totaled $132 million in the 2014 Quarter versus $138 million in the 2013 Quarter. The combined federal and state effective income tax rate was 35% and 36% during the 2014 Quarter and the 2013 Quarter, respectively. The 2014 rate benefited from increased income attributable to TLLP’s noncontrolling interest.
Six Months Ended June 30, 2014 versus June 30, 2013
For the year-to-date periods, our net earnings from continuing operations attributable to Tesoro Corporation were $303 million ($2.29 per diluted share) for the six months ended June 30, 2014 (“2014 Period”) compared to $332 million ($2.39 per diluted share) for the six months ended June 30, 2013 (“2013 Period”). Our gross refining margin increased $296 million during the 2014 Period compared to the 2013 Period driven by higher refined products sales volumes resulting from the Los Angeles Acquisition that also resulted in higher operating expenses during the 2014 Period. The increase in refined products sales volume was offset by a decrease of $2.40 in our gross refining margin per barrel caused by a lower margin environment. Our gross retail margin increased $78 million due to higher fuel sales volume resulting from stations acquired as part of the Los Angeles Acquisition and continued expansion of our retail network. TLLP increased operating income by $68 million due to higher throughput volumes driven by acquired assets and continued expansion of its crude oil gathering assets. Additionally, stock-based compensation charges decreased $37 million during the 2014 Period compared to the 2013 Period. Offsetting the increases to net earnings were an increase in interest and financing costs of $55 million primarily related to premiums paid and expensing of unamortized debt issuance costs associated with the debt refinancing during the 2014 Period as well as additional borrowings used to fund the Los Angeles Acquisition and a decrease to other income, net resulting from a settlement income of $54 million received in the 2013 Period that did not occur in the 2014 Period.
39
Our selling, general and administrative expenses were $123 million in the 2014 Period compared to $175 million in the 2013 Period. The difference was primarily attributable to changes in stock-based compensation expense during the 2014 Period as compared to the 2013 Period, principally related to our stock appreciation rights that are adjusted based on the market price of the stock each period. The stock-based compensation impact on the 2014 Period results include an expense of $8 million as compared to the $45 million expense during the 2013 Period. Our stock price per share increased from $58.50 to $58.67 during the 2014 Period compared to an increase from $44.05 to $52.32 during the 2013 Period.
Interest and financing costs increased approximately $55 million to $118 million during the 2014 Period from $63 million during the 2013 Period. The increase consisted of a $31 million charge for premiums paid and unamortized debt issuance costs and discount related to the redemption of the 2019 Notes in the 2014 Period. Additional interest expense of $23 million was incurred during the 2014 Period compared to the 2013 Period associated with TLLP’s 5.875% and 6.125% senior notes due 2020 and 2021, respectively, issued during the second half of 2013. TLLP used these borrowings to finance its acquisition of logistics assets from us that we acquired in connection with the Los Angeles Acquisition. During the 2014 Period, our interest costs reflected a net savings compared to the 2013 Period of $4 million as a result of refinancing the 2019 Notes with the 2024 Notes in March 2014.
Other income during the 2013 Period included a refund from the settlement of a rate proceeding from the California Public Utilities Commission of $54 million.
Our income tax expense totaled $188 million in the 2014 Period versus $196 million in the 2013 Period. The combined federal and state effective income tax rate was 35% and 36% during the 2014 Period and the 2013 Period, respectively. The 2014 rate benefited from increased income attributable to TLLP’s noncontrolling interest.
40
Refining Segment
We currently own and operate six petroleum refineries located in the western United States and sell transportation fuels to a wide variety of customers. Our refineries produce the majority of the transportation fuels that we sell. Our six refineries have a combined crude oil capacity of 850 Mbpd. We purchase crude oil and other feedstocks from domestic and foreign sources, including South America, Canada, the Middle East and other locations either through term agreements with renewal provisions or in the spot market. Our retail network provides a committed outlet for the majority of the gasoline produced by our refineries; however, we also sell gasoline and gasoline blendstocks, jet fuel, diesel fuel, heavy fuel oils and residual products in both the bulk and wholesale markets in the western United States. We also opportunistically export refined products to certain foreign markets.
Management uses various measures to evaluate performance and efficiency and to compare profitability to other companies in the industry, including gross refining margin per barrel, manufacturing costs before depreciation and amortization expense (“Manufacturing Costs”) per barrel and refined product sales margin per barrel. We calculate gross refining margin per barrel by dividing gross refining margin (revenues less costs of feedstocks, purchased refined products, transportation and distribution) by total refining throughput. We calculate Manufacturing Costs per barrel by dividing Manufacturing Costs by total refining throughput. We calculate refined product sales margin per barrel by dividing refined product sales and refined product cost of sales by total refining throughput, and subtracting refined product cost of sales per barrel from refined product sales per barrel. Investors and analysts use these financial measures to help analyze and compare companies in the industry on the basis of operating performance. These financial measures should not be considered alternatives to segment operating income, revenues, costs of sales and operating expenses or any other measure of financial performance presented in accordance with U.S. GAAP.
Our Refining segment operating data are as follows:
Three Months Ended June 30, | Six Months Ended June 30, | ||||||||||
2014 | 2013 | 2014 | 2013 | ||||||||
Throughput (Mbpd) | |||||||||||
Heavy crude (a) | 161 | 188 | 165 | 187 | |||||||
Light crude | 602 | 390 | 601 | 340 | |||||||
Other feedstocks | 53 | 46 | 51 | 41 | |||||||
Total Throughput | 816 | 624 | 817 | 568 | |||||||
Yield (Mbpd) | |||||||||||
Gasoline and gasoline blendstocks | 424 | 318 | 422 | 287 | |||||||
Jet fuel | 121 | 84 | 124 | 76 | |||||||
Diesel fuel | 187 | 137 | 194 | 129 | |||||||
Heavy fuel oils, residual products, internally produced fuel and other | 140 | 122 | 132 | 111 | |||||||
Total Yield | 872 | 661 | 872 | 603 | |||||||
Refined Product Sales (Mbpd) (b) | |||||||||||
Gasoline and gasoline blendstocks | 505 | 398 | 509 | 361 | |||||||
Jet fuel | 142 | 101 | 147 | 89 | |||||||
Diesel fuel | 213 | 167 | 200 | 151 | |||||||
Heavy fuel oils, residual products and other | 90 | 82 | 83 | 79 | |||||||
Total Refined Product Sales | 950 | 748 | 939 | 680 | |||||||
________________
(a) | We define heavy crude oil as crude oil with an American Petroleum Institute gravity of 24 degrees or less. |
(b) | Sources of total refined product sales include refined products manufactured at our refineries and refined products purchased from third parties. Total refined product sales margins include margins on sales of manufactured and purchased refined products. |
41
Our Refining segment operating results are as follows:
Three Months Ended June 30, | Six Months Ended June 30, | ||||||||||||||
2014 | 2013 | 2014 | 2013 | ||||||||||||
(Dollars in millions, except per barrel amounts) | |||||||||||||||
Revenues | |||||||||||||||
Refined products (c) | $ | 10,520 | $ | 8,146 | $ | 20,020 | $ | 14,890 | |||||||
Crude oil resales and other | 354 | 597 | 626 | 1,066 | |||||||||||
Total Revenues | $ | 10,874 | $ | 8,743 | $ | 20,646 | $ | 15,956 | |||||||
Segment Operating Income | |||||||||||||||
Gross refining margin (d) (e) | $ | 991 | $ | 838 | $ | 1,786 | $ | 1,490 | |||||||
Expenses | |||||||||||||||
Manufacturing costs | 436 | 306 | 852 | 541 | |||||||||||
Other operating expenses | 71 | 57 | 165 | 120 | |||||||||||
Selling, general and administrative expenses | 6 | 3 | 8 | 7 | |||||||||||
Depreciation and amortization expense | 105 | 90 | 206 | 178 | |||||||||||
Loss on asset disposals and impairments | 1 | 7 | — | 10 | |||||||||||
Segment Operating Income (e) | $ | 372 | $ | 375 | $ | 555 | $ | 634 | |||||||
Gross refining margin ($/throughput barrel) | $ | 13.35 | $ | 14.75 | $ | 12.08 | $ | 14.48 | |||||||
Manufacturing Cost before Depreciation and Amortization Expense ($/throughput barrel) | $ | 5.88 | $ | 5.39 | $ | 5.77 | $ | 5.26 | |||||||
Refined Product Sales Margin ($/barrel) | |||||||||||||||
Average sales price | $ | 123.35 | $ | 119.67 | $ | 119.19 | $ | 120.65 | |||||||
Average costs of sales | 110.98 | 108.85 | 108.21 | 109.88 | |||||||||||
Refined Product Sales Margin | $ | 12.37 | $ | 10.82 | $ | 10.98 | $ | 10.77 | |||||||
________________
(c) | Refined products sales include intersegment sales to our retail segment at prices which approximate market of $3.4 billion and $2.1 billion for the three months ended June 30, 2014 and 2013, respectively, and $6.3 billion and $3.6 billion for the six months ended June 30, 2014 and 2013, respectively. |
(d) | Consolidated gross refining margin combines gross refining margin for each of our regions adjusted for other amounts not directly attributable to a specific region. Other amounts resulted in an increase of $2 million for the three months ended June 30, 2013, and $2 million and $4 million for the six months ended June 30, 2014 and 2013, respectively. Gross refining margin includes the effect of intersegment sales to the retail segment at prices which approximate market and fees charged by TLLP for the transportation and terminalling of crude oil and refined products at prices which we believe are no less favorable to either party than those that could have been negotiated with unaffiliated parties with respect to similar services. Gross refining margin approximates total refining throughput multiplied by the gross refining margin per barrel. |
(e) | Our refining segment uses Renewable Identification Numbers (“RINs”) to satisfy its obligations under the Renewable Fuels Standard, in addition to physically blending required biofuels. Effective April 1, 2013, we changed our intersegment pricing methodology and no longer reduce the amount retail pays for the biofuels by the market value of the RINs which we believe more closely approximates market rates. As a result, we conformed our segment presentation and reclassified $15 million of the RINs transfer price adjustment related to the three months ended March 31, 2013 during the three months ended June 30, 2013 from our retail segment to our refining segment. This resulted in an increase in gross refining margins and segment operating income for the three months ended June 30, 2013. |
42
Our Refining segment operating results by region are as follows:
Three Months Ended June 30, | Six Months Ended June 30, | ||||||||||||||
2014 | 2013 | 2014 | 2013 | ||||||||||||
(Dollars in millions, except per barrel amounts) | |||||||||||||||
Refining Data by Region | |||||||||||||||
California (Martinez and Los Angeles) | |||||||||||||||
Refining throughput (Mbpd) | 523 | 374 | 523 | 316 | |||||||||||
Gross refining margin | $ | 579 | $ | 427 | $ | 976 | $ | 686 | |||||||
Gross refining margin ($/throughput barrel) | $ | 12.16 | $ | 12.54 | $ | 10.32 | $ | 11.99 | |||||||
Manufacturing cost before depreciation and amortization expense ($/throughput barrel) | $ | 6.66 | $ | 6.11 | $ | 6.57 | $ | 6.08 | |||||||
Pacific Northwest (Washington and Alaska) | |||||||||||||||
Refining throughput (Mbpd) | 160 | 146 | 163 | 138 | |||||||||||
Gross refining margin | $ | 133 | $ | 164 | $ | 269 | $ | 313 | |||||||
Gross refining margin ($/throughput barrel) | $ | 9.12 | $ | 12.37 | $ | 9.08 | $ | 12.55 | |||||||
Manufacturing cost before depreciation and amortization expense ($/throughput barrel) | $ | 4.78 | $ | 4.30 | $ | 4.52 | $ | 4.50 | |||||||
Mid-Continent (North Dakota and Utah) | |||||||||||||||
Refining throughput (Mbpd) | 133 | 104 | 131 | 114 | |||||||||||
Gross refining margin | $ | 279 | $ | 245 | $ | 539 | $ | 487 | |||||||
Gross refining margin ($/throughput barrel) | $ | 23.01 | $ | 25.89 | $ | 22.79 | $ | 23.47 | |||||||
Manufacturing cost before depreciation and amortization expense ($/throughput barrel) | $ | 4.14 | $ | 4.31 | $ | 4.11 | $ | 3.89 | |||||||
Three Months Ended June 30, 2014 Compared with Three Months Ended June 30, 2013
Overview. Operating income for our refining segment decreased by $3 million, or 1%, to $372 million during the 2014 Quarter as compared to the 2013 Quarter as a result of higher manufacturing costs, other operating expenses and depreciation and amortization expenses during the 2014 Quarter that exceeded increases in gross refining margins driven by throughput increases partially offset by declines in gross refining margin per barrel.
Refining Throughput. Total refining throughput increased 192 Mbpd, or 31%, to 816 Mbpd during the 2014 Quarter as compared to the 2013 Quarter due to higher throughput in the California region following the Los Angeles Acquisition, including a 266 Mbpd refinery, combined with higher throughput at the Washington and Utah refineries due to scheduled turnarounds in the 2013 Quarter.
Refined Products Sales. Revenues from sales of refined products increased $2.4 billion to $10.5 billion in the 2014 Quarter as compared to the 2013 Quarter, primarily due to increased refined product sales volumes of 202 Mbpd, or 27%, to 950 Mbpd in the 2014 Quarter as compared to the 2013 Quarter primarily resulting from the Los Angeles Acquisition. Average product sales price increased $3.68 per barrel, or 3%, to $123.35 per barrel in the 2014 Quarter as compared to the 2013 Quarter.
Costs of Sales and Expenses. Our average costs of sales increased by $2.13 per barrel, or 2%, to $110.98 per barrel during the 2014 Quarter compared to the 2013 Quarter, reflecting increases in crude oil prices. Manufacturing and other operating expenses increased by $144 million to $507 million in the 2014 Quarter as compared to the 2013 Quarter primarily as a result of higher throughput during the 2014 Quarter as a result of the Los Angeles Acquisition partially offset by savings from crude oil cargo sharing between our California and Anacortes refineries that decreased our freight and delivery costs.
Gross Refining Margins. Our gross refining margin per barrel decreased by $1.40 per barrel, or 9%, to $13.35 per barrel in the 2014 Quarter as compared to the 2013 Quarter given a weak margin environment and a significant year-over-year decline in WTI to Brent crude oil discounts.
43
Total gross margin increased $153 million, or 18%, to $991 million in the 2014 Quarter as compared to the 2013 Quarter. Gross margins in the California and Mid-Continent regions increased by $152 million and $34 million, respectively, while the Pacific Northwest region decreased by $31 million. Gross refining margin increases in the California region were due to the addition of the Los Angeles refinery and realization of synergies that improved margin capture offsetting lower refining margins. Margins increased in the Mid-Continent region due to additional throughput resulting from the expansion of the waxy crude unit at our Utah refinery and the distillate desulfurization unit at our North Dakota refinery. The decrease in the Pacific Northwest region was driven by weaker industry gasoline and diesel margins in the Pacific Northwest as a result of lower discounts on advantaged crude oil. Total refinery utilization was 96% in the 2014 Quarter as compared to 93% in the 2013 Quarter primarily as a result of reduced turnaround activities, operational efficiencies and reliability. We were able to transport cost-advantaged Bakken crude oil, which continued to price at a discount to ANS during the 2014 Quarter, to our Washington refinery using TLLP’s Anacortes rail facility; however, these feedstock advantages were offset by relatively lower gasoline and diesel prices in the region.
Six Months Ended June 30, 2014 Compared with Six Months Ended June 30, 2013
Overview. Operating income for our refining segment decreased by $79 million, or 13%, to $555 million during the 2014 Period as compared to the 2013 Period as a result of lower gross margins per barrel and higher manufacturing costs and other operating expenses during the 2014 Period.
Refining Throughput. Total refining throughput increased 249 Mbpd, or 44%, to 817 Mbpd during the 2014 Period as compared to the 2013 Period due to higher throughput in the California region following the Los Angeles Acquisition, including a 266 Mbpd refinery, combined with higher throughput at the Washington and Utah refineries due to scheduled turnarounds in the 2013 Period.
Refined Products Sales. Revenues from sales of refined products increased $5.1 billion to $20.0 billion in the 2014 Period as compared to the 2013 Period, primarily due to increased refined product sales volumes of 259 Mbpd, or 38%, to 939 Mbpd in the 2014 Period as compared to the 2013 Period primarily resulting from the Los Angeles Acquisition. The increase in refined product sales volumes was offset by a decrease in the average product sales price of $1.46 per barrel, or 1%, to $119.19 per barrel in the 2014 Period as compared to the 2013 Period.
Costs of Sales and Expenses. Our average costs of sales decreased by $1.67 per barrel, or 2%, to $108.21 per barrel during the 2014 Period compared to the 2013 Period, reflecting lower crude oil prices. Manufacturing and other operating expenses increased by $356 million to $1.0 billion in the 2014 Period as compared to the 2013 Period primarily as a result of higher throughput during the 2014 Period as a result of the Los Angeles Acquisition partially offset by savings from crude oil cargo sharing between our California and Anacortes refineries that decreased our freight and delivery costs.
Gross Refining Margins. Our gross refining margin per barrel decreased by $2.40 per barrel, or 17%, to $12.08 per barrel in the 2014 Period as compared to the 2013 Period given a weak margin environment and a significant year-over-year decline in WTI to Brent crude oil discounts.
Total gross margin increased $296 million, or 20%, to $1.8 billion in the 2014 Period as compared to the 2013 Period. Gross margins in the California and Mid-Continent regions increased by $290 million and $52 million, respectively, while the Pacific Northwest region decreased by $44 million. Gross refining margin increases in the California region were due to the addition of the Los Angeles refinery and realization of synergies that improved margin capture offsetting lower refining margins. Margins increased in the Mid-Continent region due to additional throughput resulting from the expansion of the waxy crude unit at our Utah refinery and the distillate desulfurization unit at our North Dakota refinery. The decrease in the Pacific Northwest region was driven by weaker industry gasoline and diesel margins in the Pacific Northwest as a result of lower discounts on advantaged crude oil. Total refinery utilization was 96% in the 2014 Period as compared to 91% in the 2013 Period primarily as a result of reduced turnaround activities, operational efficiencies and reliability. We were able to transport cost-advantaged Bakken crude oil, which continued to price at a discount to ANS during the 2014 Period, to our Washington refinery using TLLP’s Anacortes rail facility; however, these feedstock advantages were offset by relatively lower gasoline and diesel prices in the region.
TLLP Segment
TLLP is a publicly traded limited partnership that was formed to own, operate, develop and acquire logistics assets. Its assets are integral to the success of Tesoro’s refining and marketing operations and generate revenue by charging fees for gathering crude oil using its High Plains System and for terminalling, transporting and storing crude oil and refined products using terminal facilities and pipelines in the western United States.
44
Management uses average revenue per barrel to evaluate performance and compare profitability to other companies in the industry. We calculate average revenue per barrel as revenue divided by the number of days in the period divided by throughput. Investors and analysts use this financial measure to help analyze and compare companies in the industry on the basis of operating performance. This financial measure should not be considered as an alternative to segment operating income, revenues and operating expenses or any other measure of financial performance presented in accordance with U.S. GAAP.
Our TLLP segment operating data are as follows:
Three Months Ended June 30, | Six Months Ended June 30, | ||||||||||||||
2014 | 2013 | 2014 | 2013 | ||||||||||||
Crude Oil Gathering | |||||||||||||||
Pipeline gathering throughput (Mbpd) | 109 | 81 | 103 | 81 | |||||||||||
Average pipeline gathering revenue per barrel | $ | 1.34 | $ | 1.23 | $ | 1.34 | $ | 1.25 | |||||||
Trucking volume (Mbpd) | 47 | 42 | 46 | 43 | |||||||||||
Average trucking revenue per barrel | $ | 3.23 | $ | 3.11 | $ | 3.21 | $ | 3.07 | |||||||
Terminalling and Transportation | |||||||||||||||
Terminalling throughput (Mbpd) | 890 | 553 | 884 | 473 | |||||||||||
Average terminalling revenue per barrel | $ | 0.98 | $ | 0.72 | $ | 0.97 | $ | 0.75 | |||||||
Pipeline transportation throughput (Mbpd) | 772 | 85 | 779 | 88 | |||||||||||
Average pipeline transportation revenue per barrel | $ | 0.34 | $ | 0.36 | $ | 0.35 | $ | 0.30 | |||||||
Our TLLP segment operating results are as follows:
Three Months Ended June 30, | Six Months Ended June 30, | ||||||||||||||
2014 | 2013 | 2014 | 2013 | ||||||||||||
(Dollars in millions) | |||||||||||||||
Segment Operating Income | |||||||||||||||
Revenues | |||||||||||||||
Crude oil gathering | $ | 27 | $ | 21 | $ | 52 | $ | 43 | |||||||
Terminalling and transportation | 103 | 39 | 203 | 69 | |||||||||||
Total Revenues (a) | 130 | 60 | 255 | 112 | |||||||||||
Expenses | |||||||||||||||
Operating expenses (b) | 51 | 26 | 94 | 44 | |||||||||||
General and administrative expenses (c) | 13 | 7 | 22 | 13 | |||||||||||
Depreciation and amortization expense | 16 | 7 | 32 | 11 | |||||||||||
Gain on asset disposals and impairments | — | — | (5 | ) | — | ||||||||||
Segment Operating Income | $ | 50 | $ | 20 | $ | 112 | $ | 44 | |||||||
____________________
(a) | TLLP segment revenues from services provided to our refining segment were $114 million and $54 million for the three months ended June 30, 2014 and 2013, respectively, and $224 million and $102 million for the six months ended June 30, 2014 and 2013, respectively. These amounts are eliminated upon consolidation. |
(b) | TLLP segment operating expenses include amounts billed by Tesoro for services provided to TLLP under various operational contracts. These amounts totaled $8 million and $10 million for the three months ended June 30, 2014 and 2013, respectively, and $19 million and $13 million for the six months ended June 30, 2014 and 2013, respectively. These amounts are eliminated upon consolidation. TLLP segment third-party operating expenses related to the transportation of crude oil and refined products are reclassified to cost of sales in our condensed statements of consolidated operations upon consolidation. |
(c) | TLLP segment general and administrative expenses include amounts charged by Tesoro for general and administrative services provided to TLLP under various operational and administrative contracts. These amounts totaled $9 million and $4 million for the three months ended June 30, 2014 and 2013, respectively, and $17 million and $7 million for the six months ended June 30, 2014 and 2013, respectively. These amounts are eliminated upon consolidation. |
45
Three Months Ended June 30, 2014 Compared with Three Months Ended June 30, 2013
Terminalling and transportation throughput volumes increased during the 2014 Quarter as compared to the 2013 Quarter driven by TLLP’s 2013 acquisitions from Chevron of the northwest products system and from us of the logistics assets that were part of our Los Angeles Acquisition. Pipeline gathering throughput volume also increased due to continued expansion of TLLP’s crude oil gathering assets. These higher throughput volumes resulted in an increase to revenues of $70 million to $130 million during the 2014 Quarter as compared to the 2013 Quarter. Operating income increased $30 million to $50 million due to the higher revenues offset by an increase in operating expenses of $25 million to $51 million in the 2014 Quarter as compared to the 2013 Quarter resulting from increased labor and operating costs associated with the acquired operations.
Six Months Ended June 30, 2014 Compared with Six Months Ended June 30, 2013
Terminalling and transportation throughput volumes increased during the 2014 Period as compared to the 2013 Period driven by TLLP’s 2013 acquisitions from Chevron of the northwest products system and from us of the logistics assets that were part of our Los Angeles Acquisition. Pipeline gathering throughput volume also increased due to continued expansion of TLLP’s crude oil gathering assets. These higher throughput volumes resulted in an increase to revenues of $143 million to $255 million during the 2014 Period as compared to the 2013 Period. Operating income increased $68 million to $112 million due to the higher revenues offset by an increase in operating expenses of $50 million to $94 million in the 2014 Period as compared to the 2013 Period resulting from increased labor and operating costs associated with the acquired operations.
Retail Segment
We sell gasoline and diesel fuel in the western United States through company-operated retail stations and agreements with third-party branded dealers and distributors (or “Jobber/dealers”). Our retail network provides a committed outlet for the majority of the gasoline produced by our refineries. Many of our company-operated retail stations include convenience stores that sell a wide variety of merchandise items. Our retail segment included a network of 2,268 branded retail stations under the ARCO®, Shell®, Exxon®, Mobil®, USA GasolineTM and Tesoro® brands as of June 30, 2014. Effective May 1, 2014, we expanded our Exxon® and Mobil® branding rights to include Utah, Arizona and western Idaho. We acquired 15 additional retail stations in the Salt Lake City region in May 2014 which we are re-branding using the Exxon® brand.
Management uses fuel margin per gallon to compare fuel results to other companies in the industry. There are a variety of ways to calculate fuel margin per gallon; different companies may calculate it in different ways. We calculate fuel margin per gallon by dividing fuel gross margin by fuel sales volumes. Investors and analysts may use fuel margin per gallon to help analyze and compare companies in the industry on the basis of operating performance. This financial measure should not be considered an alternative to revenues, segment operating income or any other measure of financial performance presented in accordance with U.S. GAAP. Fuel margin and fuel margin per gallon include the effect of intersegment purchases from the refining segment at prices which approximate market.
46
Our Retail segment operating data and results are as follows:
Three Months Ended June 30, | Six Months Ended June 30, | ||||||||||||||
2014 | 2013 | 2014 | 2013 | ||||||||||||
(Dollars in millions, except per gallon amounts) | |||||||||||||||
Average Number of Stations (during the period) (a) | |||||||||||||||
Company-operated | 581 | 569 | 578 | 568 | |||||||||||
Branded jobber/dealer | 1,693 | 1,014 | 1,695 | 911 | |||||||||||
Total Average Retail Stations | 2,274 | 1,583 | 2,273 | 1,479 | |||||||||||
Fuel Sales (millions of gallons) (a) | 1,051 | 656 | 2,046 | 1,093 | |||||||||||
Revenues (a) | |||||||||||||||
Fuel | $ | 3,523 | $ | 2,218 | $ | 6,547 | $ | 3,725 | |||||||
Merchandise and other | 69 | 59 | 130 | 107 | |||||||||||
Total Revenues | $ | 3,592 | $ | 2,277 | $ | 6,677 | $ | 3,832 | |||||||
Fuel Margin ($/gallon) (b) | $ | 0.14 | $ | 0.14 | $ | 0.11 | $ | 0.16 | |||||||
Segment Operating Income | |||||||||||||||
Gross Margins | |||||||||||||||
Fuel (a) (b) | $ | 145 | $ | 89 | $ | 230 | $ | 171 | |||||||
Merchandise and other non-fuel | 31 | 23 | 59 | 40 | |||||||||||
Total Gross Margins | 176 | 112 | 289 | 211 | |||||||||||
Expenses | |||||||||||||||
Operating expenses | 92 | 74 | 173 | 145 | |||||||||||
Selling, general and administrative expenses | 1 | 3 | 3 | 7 | |||||||||||
Depreciation and amortization expense | 10 | 9 | 20 | 17 | |||||||||||
Loss on asset disposals and impairments | 1 | 1 | 2 | 2 | |||||||||||
Segment Operating Income (b) | $ | 72 | $ | 25 | $ | 91 | $ | 40 | |||||||
________________
(a) | Increases from prior year reflect the acquisition of supply rights for approximately 835 dealer-operated and branded wholesale retail stations with the Los Angeles Acquisition. |
(b) | For the first half of the year, the decrease from prior year reflects a higher ratio of dealer stations to company-owned stations and lower industry gasoline and diesel margins. In addition, our refining segment uses Renewable Identification Numbers (“RINs”) to satisfy its obligations under the Renewable Fuels Standard, in addition to physically blending required biofuels. Effective April 1, 2013, we changed our intersegment pricing methodology and no longer reduce the amount retail pays for the biofuels by the market value of the RINs which we believe more closely approximates market rates. As a result, we conformed our segment presentation and reclassified $15 million of the RINs transfer price adjustment related to the three months ended March 31, 2013 during the three months ended June 30, 2013 from our retail segment to our refining segment. This resulted in a decrease in retail segment gross fuel margins and segment operating income for the three months ended June 30, 2013. |
Three Months Ended June 30, 2014 Compared with Three Months Ended June 30, 2013
Fuel sales volumes increased to 1.1 billion gallons during the 2014 Quarter compared to 656 million gallons during the 2013 Quarter driven by a higher station count resulting from stations acquired as part of the Los Angeles Acquisition and continued expansion of our retail network as well as increased demand. Gross margin increased $64 million, or 57%, to $176 million during the 2014 Quarter as compared to the 2013 Quarter due to the higher fuel sales volume. Additionally, gross margin was positively impacted by an increase of $8 million in merchandise and other non-fuel margin. Operating income increased $47 million to $72 million during the 2014 Quarter as compared to the 2013 Quarter as a result of our increased gross margin partially offset by an increase of $18 million in operating expenses associated with our larger retail network.
47
Six Months Ended June 30, 2014 Compared with Six Months Ended June 30, 2013
Fuel sales volumes increased to 2.0 billion gallons during the 2014 Period compared to 1.1 billion gallons during the 2013 Period driven by a higher station count resulting from stations acquired as part of the Los Angeles Acquisition and continued expansion of our retail network as well as increased demand. Gross margin increased $78 million, or 37%, to $289 million during the 2014 Period as compared to the 2013 Period due to the higher fuel sales volume offset by a decrease in retail fuel margin per gallon of 31% to $0.11. Retail fuel margin per gallon was impacted by lower industry gasoline and diesel margins and the acquisition of additional dealer-operated stations in connection with the Los Angeles Acquisition, which changed our ratio of lower margin dealer-operated stations to higher margin company-operated stations. Additionally, gross margin was positively impacted by an increase of $19 million in merchandise and other non-fuel margin. Operating income increased $51 million to $91 million during the 2014 Period as compared to the 2013 Period as a result of our increased gross margin partially offset by an increase of $28 million in operating expenses associated with our larger retail network.
CAPITAL RESOURCES AND LIQUIDITY
Overview
We operate in an environment where our capital resources and liquidity are impacted by changes in the price of crude oil and refined products, availability of trade credit, market uncertainty and a variety of additional factors beyond our control. These factors include the level of consumer demand for transportation fuels, weather conditions, fluctuations in seasonal demand, governmental regulations, geo-political conditions and overall market and global economic conditions. See “Important Information Regarding Forward-Looking Statements” on page 57 for further information related to risks and other factors. Future capital expenditures, as well as borrowings under our credit agreements and other sources of capital, may be affected by these conditions.
Capitalization
Our capital structure at June 30, 2014 was comprised of the following (in millions):
Debt, including current maturities: | June 30, 2014 | ||
Tesoro Corporation Revolving Credit Facility | $ | — | |
Term Loan Credit Facility | 398 | ||
4.250% Senior Notes due 2017 | 450 | ||
5.375% Senior Notes due 2022 | 475 | ||
5.125% Senior Notes due 2024 | 300 | ||
Capital lease obligations and other | 47 | ||
Tesoro Debt | 1,670 | ||
TLLP Revolving Credit Facility | 228 | ||
5.875% TLLP Senior Notes due 2020 | 605 | ||
6.125% TLLP Senior Notes due 2021 | 550 | ||
TLLP Capital lease obligations and other | 8 | ||
TLLP Debt | 1,391 | ||
Total Debt | 3,061 | ||
Total Equity | 5,533 | ||
Total Capitalization | $ | 8,594 | |
At June 30, 2014, our debt to capitalization ratio increased to 36% as compared to 34% at December 31, 2013. Our debt to capitalization ratio, excluding TLLP, was 28% at both June 30, 2014 and December 31, 2013, which excludes TLLP total debt, including capital leases, of $1.4 billion and $1.2 billion, respectively. The ratio also excludes noncontrolling interest of $1.2 billion at both June 30, 2014 and December 31, 2013. TLLP’s debt is non-recourse to Tesoro, except for TLGP.
The Tesoro Corporation revolving credit facility (the “Revolving Credit Facility”), senior notes and Term Loan Credit Facility each limit our ability to make certain restricted payments (as defined in our debt agreements), which include dividends, purchases of our stock or voluntary prepayments of subordinate debt. The aggregate amount of restricted payments cannot exceed an amount defined in each of the debt agreements. The indentures for our senior notes also limit certain of our subsidiaries’ ability to make certain payments and distributions. We do not believe that these limitations will restrict our ability to pay dividends or buy back stock under our current programs.
48
5.125% Senior Notes due 2024
Effective March 18, 2014, we issued $300 million aggregate principal amount of the 2024 Notes. The 2024 Notes have a ten-year maturity and are subject to optional redemption by Tesoro beginning April 1, 2019 at premiums of 2.563% through March 31, 2020; 1.708% from April 1, 2020 through March 31, 2021; 0.854% from April 1, 2021 through March 31, 2022; and at par thereafter, or at a make-whole plus accrued and unpaid interest before April 1, 2019. In addition, at any time prior to April 1, 2017, we may redeem up to 35% of the aggregate principal amount at 105.125% of face value with proceeds from certain equity issuances. The terms of the 2024 Notes are generally less restrictive than those contained in our senior notes due in 2017 and 2022, and exclude some limitations on restricted payments, asset sales and other transactions that are included in those senior notes. These notes are unsecured obligations and guaranteed by certain of our domestic subsidiaries, excluding TLGP and TLLP and its subsidiaries. The proceeds from the issuance of the 2024 Notes, together with cash on hand, were used to pay for fees and expenses related to the note issuance and to redeem all outstanding 9.750% Senior Notes due 2019 (the “2019 Notes”) for an aggregate purchase price of $329 million, including accrued interest and premiums. In connection with the redemption of the 2019 Notes, we incurred charges totaling $31 million comprised of premiums paid on the 2019 Notes of $19 million and non-cash charges associated with the expensing of $8 million and $4 million of unamortized debt discount and issuance costs, respectively. Our debt redemption charges for the 2019 Notes are recorded in net interest and financing costs in our condensed statements of consolidated operations.
Exchange Offer
TLLP entered into a registration rights agreement in connection with the December 2013 private offering of $250 million of 5.875% Senior Notes due October 2020 (the “Unregistered Notes”). On July 25, 2014, TLLP completed an offer to exchange the Unregistered Notes for notes registered under the Securities Act of 1933, as amended (the “Exchange Notes”). In accordance with the terms of the Exchange Notes, each holder of the Unregistered Notes are entitled to receive Exchange Notes, which are identical in all material respects to the Unregistered Notes (including principal amount, interest rate, maturity and redemption rights), except that the Exchange Notes generally are not subject to transfer restrictions.
Credit Facilities Overview
Our primary sources of liquidity are cash flows from operations with additional sources available under borrowing capacity from our revolving lines of credit. We ended the second quarter of 2014 with $1.2 billion of cash and cash equivalents and borrowings of $398 million under the Term Loan Credit Facility and $228 million under the TLLP senior secured revolving credit agreement (the “TLLP Revolving Credit Facility”). We believe available capital resources will be adequate to meet our capital expenditure, working capital and debt service requirements. We had available capacity under our credit facilities as follows at June 30, 2014 (in millions):
Total Capacity | Amount Borrowed as of June 30, 2014 | Outstanding Letters of Credit | Available Capacity | Expiration | |||||||||||||
Tesoro Corporation Revolving Credit Facility (a) | $ | 3,000 | $ | — | $ | 742 | $ | 2,258 | January 4, 2018 | ||||||||
TLLP Revolving Credit Facility | 575 | 228 | — | 347 | December 31, 2017 | ||||||||||||
Term Loan Credit Facility | 398 | 398 | — | — | May 30, 2016 | ||||||||||||
Letter of Credit Facilities | 1,837 | — | 429 | 1,408 | |||||||||||||
Total credit facilities | $ | 5,810 | $ | 626 | $ | 1,171 | $ | 4,013 | |||||||||
________________
(a) | Borrowing base is the lesser of the amount of the periodically adjusted borrowing base or the facility’s total capacity. |
49
As of June 30, 2014, our credit facilities were subject to the following expenses and fees:
Credit Facility | 30 day Eurodollar (LIBOR) Rate | Eurodollar Margin | Base Rate | Base Rate Margin | Commitment Fee (unused portion) | |||||
Tesoro Corporation Revolving Credit Facility ($3.0 billion) (b) | 0.16% | 1.50% | 3.25% | 0.50% | 0.375% | |||||
TLLP Revolving Credit Facility ($575 million) (c) | 0.16% | 2.50% | 3.25% | 1.50% | 0.50% | |||||
Term Loan Credit Facility ($398 million) (b) | 0.16% | 2.25% | 3.25% | 1.25% | —% | |||||
________________
(b) | We can elect the interest rate to apply to the facility between a base rate plus the base rate margin, or a Eurodollar rate, for the applicable term, plus the Eurodollar margin at the time of the borrowing. The applicable margin on the Revolving Credit Facility varies primarily based upon our credit ratings. Letters of credit outstanding under the Revolving Credit Facility incur fees at the Eurodollar margin rate. |
(c) | TLLP has the option to elect if the borrowings will bear interest at either, a base rate plus the base rate margin or a Eurodollar rate, for the applicable period, plus the Eurodollar margin at the time of the borrowing. The applicable margin varies based upon a certain leverage ratio, as defined by the TLLP Revolving Credit Facility. TLLP incurs commitment fees for the unused portion of the TLLP Revolving Credit Facility. Letters of credit outstanding under the Revolving Credit Facility incur fees at the Eurodollar margin rate. |
Tesoro Corporation Revolving Credit Facility
At June 30, 2014, our Revolving Credit Facility provided for borrowings (including letters of credit) up to the lesser of the amount of a periodically adjusted borrowing base of approximately $3.8 billion, consisting of Tesoro’s eligible cash and cash equivalents, receivables and petroleum inventories, net of the standard reserve as defined, or the Revolving Credit Facility’s total capacity of $3.0 billion. The total available capacity can be increased up to an aggregate amount of $4.0 billion, subject to receiving increased commitments from the lenders; however, we must offer to reduce the commitments by at least $500 million on or prior to November 21, 2014, and by an additional $500 million on or prior to May 21, 2015. We had unused credit availability of approximately 75% of the eligible borrowing base at June 30, 2014.
The Revolving Credit Facility is guaranteed by substantially all of Tesoro’s active domestic subsidiaries excluding TLGP, TLLP and its subsidiaries, and certain foreign subsidiaries, and is secured by substantially all of Tesoro’s active domestic subsidiaries’ crude oil and refined product inventories, cash and receivables.
Our Revolving Credit Facility, senior notes and Term Loan Credit Facility each limit our ability to make certain restricted payments (as defined in our debt agreements), which include dividends, purchases of our stock or voluntary prepayments of subordinate debt. The aggregate amount of restricted payments cannot exceed an amount defined in each of the debt agreements. The indentures for our senior notes also limit certain of our subsidiaries’ ability to make certain payments and distributions. We do not believe that the limitations will restrict our ability to pay dividends or buy back stock under our current programs. These existing covenants and restrictions may limit, among other things, our ability to:
• | pay dividends and make other distributions with respect to our capital stock and purchase, redeem or retire our capital stock; |
• | incur additional indebtedness and issue preferred stock; |
• | make voluntary prepayments of subordinate debt; |
• | sell assets unless the proceeds from those sales are used to repay debt or are reinvested in our business; |
• | incur liens on assets to secure certain debt; |
• | engage in certain business activities; |
• | make certain payments and distributions from our subsidiaries; |
• | engage in certain mergers or consolidations and transfers of assets; and |
• | enter into certain transactions with affiliates. |
We have a default covenant that requires us to maintain specified levels of tangible net worth. There were no changes to the Revolving Credit Facility covenants during the six months ended June 30, 2014. We were in compliance with our debt covenants as of and for the six months ended June 30, 2014.
50
TLLP Revolving Credit Facility
The TLLP Revolving Credit Facility provided for total loan availability of $575 million as of June 30, 2014, and TLLP may request that the loan availability be increased up to an aggregate of $650 million, subject to receiving increased commitments from the lenders. The TLLP Revolving Credit Facility is non-recourse to Tesoro, except for TLGP, and is guaranteed by all of TLLP’s subsidiaries and secured by substantially all of TLLP’s assets. Borrowings are available under the TLLP Revolving Credit Facility up to the total loan availability of the facility. There were $228 million in borrowings outstanding under the TLLP Revolving Credit Facility, which incurred interest at a weighted average interest rate of 2.78% as of June 30, 2014.
TLLP was in compliance with all TLLP Revolving Credit Facility covenants and conditions as of and for the six months ended June 30, 2014. Additionally, we do not believe that the limitations imposed by the TLLP Revolving Credit Facility will restrict TLLP’s ability to pay distributions.
Term Loan Credit Facility
We entered into the Term Loan Credit Facility in January 2013, which allowed us to borrow up to an aggregate of $500 million. We borrowed $500 million on May 30, 2013, to fund a portion of the Los Angeles Acquisition. The obligations under the Term Loan Credit Facility are secured by all equity interests of Tesoro Refining & Marketing Company LLC and Tesoro Alaska Company LLC, the Tesoro and USA Gasoline trademarks and those trademarks containing the name “ARCO” acquired in the Los Angeles Acquisition and junior liens on certain assets. The Term Loan Credit Facility may be repaid at any time but amounts may not be re-borrowed. The borrowings under our Term Loan Credit Facility incurred interest at a rate of 2.40% as of June 30, 2014.
The Term Loan Credit Facility contains affirmative covenants, representations and warranties and events of default substantially similar to those set forth in the Revolving Credit Facility and contains negative covenants substantially similar to those established in the indentures for the 4.250% Senior Notes due 2017, 5.375% Senior Notes due 2022 and 2024 Notes.
Share Repurchases
We are authorized by our Board to purchase shares of our common stock in open market transactions at our discretion. Purchases of our common stock can also be made to offset the dilutive effect of stock-based compensation awards and to meet our obligations under employee benefit and compensation plans, including the exercise of stock options and vesting of restricted stock and to fulfill other stock compensation requirements. The Board’s authorization has no time limit and may be suspended or discontinued at any time. We purchased approximately 3.7 million shares and 4.4 million shares of our common stock for approximately $200 million and $236 million during the six months ended June 30, 2014 and 2013, respectively. On July 30, 2014, our Board approved a new $1.0 billion share repurchase program to become effective upon the full completion of our current $1.0 billion share repurchase authorization, expected by the end of 2014. With the new program, we have $1.3 billion remaining under our authorized programs, of which we have purchased more than $50 million of additional shares through July 2014.
Cash Dividends
We paid cash dividends totaling $32 million and $65 million for the three and six months ended June 30, 2014, respectively, based on a $0.25 per share quarterly cash dividend on common stock. We paid cash dividends totaling $27 million and $55 million for the three and six months ended June 30, 2013, respectively, based on a $0.20 per share quarterly cash dividend on common stock. On July 30, 2014, our Board declared a cash dividend of $0.30 per share, payable on September 15, 2014 to shareholders of record on August 29, 2014.
Cash Flow Summary
Working capital (excluding cash) increased $120 million in the 2014 Period primarily related to the timing of customer payments on accounts receivable, increased inventory levels and the timing of our payments for crude oil and refined product purchases.
51
Components of our cash flows are set forth below (in millions):
Six Months Ended June 30, | |||||||
2014 | 2013 | ||||||
Cash Flows From (Used in): | |||||||
Operating activities | $ | 376 | $ | (161 | ) | ||
Investing activities | (267 | ) | (2,916 | ) | |||
Financing activities | (108 | ) | 1,866 | ||||
Increase (Decrease) in Cash and Cash Equivalents | $ | 1 | $ | (1,211 | ) | ||
Net cash from operating activities during the 2014 Period totaled $376 million, as compared to net cash used in operating activities of $161 million in the 2013 Period. The increase in net cash from operating activities of $537 million was primarily due to working capital increases during the 2013 Period associated with the Los Angeles Acquisition and a $198 million decrease in deferred charges primarily as a result of decreased turnaround and other deferred expenditure spending during the 2014 Period compared to the 2013 Period partially offset by a decrease in stock-based compensation expense of $39 million. Net cash used in investing activities decreased $2.6 billion to $267 million in the 2014 Period as compared to $2.9 billion in the 2013 Period, primarily due to the Los Angeles Acquisition made in the 2013 Period and lower capital expenditures during the 2014 Period. Net cash used in financing activities during the 2014 Period totaled $108 million as compared to net cash from financing activities of $1.9 billion in the 2013 Period. The decrease of $2.0 billion is primarily attributable to borrowings in the 2013 Period used to fund the Los Angeles Acquisition and $392 million of proceeds received during the 2013 Period for the sale of TLLP common units.
Capital Expenditures
The cost estimates for capital expenditures, including environmental projects, described below are subject to further review and analysis and permitting requirements. Our capital spending plans include the following major projects (in millions):
Major Projects | Total Project Expected Capital Expenditures (a) | Actual 2014 Capital Expenditures (b) | Expected Capital Expenditures for Remainder of 2014 (a) | Expected In-service Date | ||||||||||
In Process: | ||||||||||||||
Utah Refinery Expansion (c) | $ | 335 | $ | 63 | $ | 72 | 2013-2015 | |||||||
TLLP’s Connolly Gathering System (d) | 150 | 1 | 24 | 2015 | ||||||||||
Under Development: | ||||||||||||||
Los Angeles Refinery Integration (e) | $ | 265 | $ | — | $ | 9 | 2017 | |||||||
Xylene Extraction (f) | 400 | — | — | 2017 | ||||||||||
________________
(a) | The cost estimates for capital expenditures exclude estimates for capitalized interest and labor costs. |
(b) | 2014 actual capital expenditure disclosures include capitalized interest and labor costs associated with the project. |
(c) | The expansion project at the Utah refinery is designed to improve yields of gasoline and diesel, improve the flexibility of processing crude feedstocks and increase throughput capacity by 4 Mbpd. The first phase of this project was completed in the second quarter of 2013 and the second phase is expected to be completed in 2015. Our spending for phase two of this project was increased $60 million during the first quarter of 2014 due to revised cost estimates. |
(d) | TLLP is building and funding the construction of a pipeline gathering system (the “Connolly Gathering System”) to gather crude oil from various points in Dunn County, North Dakota for delivery at its existing Connolly Station with an expected capacity of approximately 60 Mbpd. |
(e) | The integration project at the Los Angeles refinery is designed to improve the flexibility of gasoline and diesel yields and reduce carbon dioxide emissions. The proposed project, subject to final board approval, project scoping, engineering and regulatory approval, includes decommissioning the fluid catalytic cracking unit at our Wilmington refinery. |
(f) | The xylene extraction project at our Anacortes, Washington refinery is designed to recover up to 15 Mbpd of mixed xylenes, which is used to make polyester fibers and films for clothing, food packaging and beverage containers. The proposed project is subject to final board approval, project scoping, engineering and regulatory approval, which we expect to finalize before the end of 2014. |
52
Capital expenditures during the 2014 Quarter and Period were $167 million and $270 million respectively, including $48 million and $74 million of TLLP capital spending for the 2014 Quarter and Period, respectively. Our capital spending is expected to be $625 million for 2014 reflecting the Company’s emphasis on long term strategic priorities including continued focus on safety and reliability and increased focus on value-driven growth. The 2014 capital spend excludes $200 million for TLLP for which we expect to reimburse TLLP approximately $30 million. Our 2014 Quarter, Period and full-year capital expenditure amounts, excluding TLLP capital spending, are comprised of the following project categories at June 30, 2014:
Project Category | Percent of 2014 Quarter Capital Expenditures | Percent of 2014 Period Capital Spending | Percent of 2014 Expected Capital Expenditures | |||
Regulatory | 15% | 21% | 20% | |||
Sustaining | 20% | 29% | 30% | |||
Income Improvement | 65% | 50% | 50% | |||
Turnarounds and other Deferred Expenditures
We spent $23 million and $78 million during the 2014 Quarter and 2014 Period, respectively, for turnarounds, catalysts and other deferred expenditures, including $19 million and $69 million primarily for a turnaround and catalyst replacement at our Los Angeles refinery during the 2014 Quarter and 2014 Period, respectively. Total expected spending for 2014 on turnarounds and catalysts is $195 million with the balance being primarily spent at our Martinez refinery. Additionally, total expected spend on deferred branding costs in our retail segment is $25 million for 2014.
Investment in Joint Ventures
In 2013, we entered into a joint venture with Savage Companies to construct, own and operate a unit train unloading and marine loading terminal at the Port of Vancouver, Washington (the “Vancouver Energy” terminal) with a total capacity of 360 Mbpd allowing for the delivery of cost-advantaged North American crude oil to the U.S. West Coast. Our contribution to the project is expected to be between $75 million and $95 million reflecting cost estimates outlined in the first quarter of 2014 that were updated to include the entire project scope and better definition of requirements to comply with American Society of Civil Engineering and International Building Codes for seismic risks in the area. Our contributions, totaling $4 million during the 2014 Period, are considered investments in joint ventures and are presented in net cash used in investing activities in our condensed statements of consolidated cash flows. The project is progressing through the Energy Facility Site Evaluation Council (“EFSEC”) permitting process in the state of Washington. During the second quarter of 2014, EFSEC approved the land-use consistency indicating the planned facility is in line with Vancouver, Washington zoning requirements. Additionally, EFSEC issued the Environmental Impact Study (“EIS”) scoping report. We submitted the majority of our Preliminary Draft Environmental Impact Study (“PDEIS”) to EFSEC in July 2014 with the remaining portion to be submitted in August 2014. Once the complete PDEIS is submitted, we expect to begin the adjudicative phase shortly thereafter, which is the last stage prior to a recommendation being submitted to the governor of Washington. The joint venture will begin construction of the facilities upon approval of the project and issuance of permits. Project completion is estimated to take nine to twelve months, however facility operations are expected to begin with initial volumes by mid-2015.
Off-Balance Sheet Arrangements
We have not entered into any transactions, agreements or other contractual arrangements that would result in off-balance sheet liabilities.
Environmental and Other Matters
We are a party to various litigation and contingent loss situations, including environmental and income tax matters, arising in the ordinary course of business. Although we cannot predict the ultimate outcomes of these matters with certainty, we have accrued for the estimated liabilities when appropriate. We believe that the outcome of these matters will not have a material impact on our liquidity or financial position, although the resolution of certain of these matters could have a material impact on our interim or annual results of operations. Additionally, if applicable, we accrue receivables for probable third-party recoveries.
53
Environmental Laws and Regulations
We are subject to extensive federal, state and local environmental laws and regulations. These laws, which change frequently, regulate the discharge of materials into the environment and may require us to remove or mitigate the environmental effects of the disposal or release of petroleum or chemical substances at various sites, install additional controls or make other modifications to certain emission sources, equipment or facilities.
Future expenditures may be required to comply with the Clean Air Act and other federal, state and local requirements for our various sites, including our refineries, tank farms, pipelines and currently and previously owned or operated terminal and retail station properties. The impact of these legislative and regulatory requirements, including any greenhouse gas cap-and-trade program or low carbon fuel standards, could result in increased compliance costs, additional operating restrictions on our business and an increase in the cost of the products we manufacture, which could have a material adverse impact on our liquidity, consolidated financial position, or results of operations.
The U.S. Environmental Protection Agency (“EPA”) proposed regulating greenhouse gas (“GHG”) emissions under the Clean Air Act in 2009. The first of these regulations, finalized in April 2010, set standards for the control of GHG emissions from light trucks and cars which could reduce the demand for our manufactured transportation fuels. In addition, the EPA has also finalized regulations to establish permitting requirements for stationary sources that emit GHG above a certain threshold. On October 15, 2013, the U.S. Supreme Court agreed to hear challenges to the EPA’s GHG regulations but limited the argument to whether the EPA’s GHG regulations for vehicles necessarily trigger Clean Air Act permitting requirements for stationary sources. On June 23, 2014, the U.S. Supreme Court narrowed the EPA’s regulatory authority but upheld portions of the EPA’s rulemaking that would regulate GHG emissions from permitted stationary sources. The stationary source permitting requirements could impose emission controls that increase required capital expenditures at our refineries. We cannot currently predict the impact of these regulations on our liquidity, financial position, or results of operations.
The Energy Independence and Security Act was enacted into federal law in December 2007 creating a second Renewable Fuels Standard (“RFS2”) requiring the total volume of renewable transportation fuels (including ethanol and advanced biofuels) sold or introduced in the U.S. to reach 18.2 billion gallons in 2014 and to increase to 36.0 billion gallons by 2022. However, the EPA has proposed to reduce the total renewable fuel and advanced biofuel requirement to 15.2 billion gallons for 2014. These requirements could reduce future demand growth for petroleum products that we manufacture. In the near term, the RFS2 presents ethanol production and logistics challenges for the ethanol, alternative fuel and refining and marketing industries. We are currently meeting the RFS2 requirements through a combination of RINs that were carried over from prior periods, blending renewable fuels obtained from third parties and purchases of RINs in the open market. The spending related to the purchases of RINs for 2014 is not expected to be material based on our operations and the current regulatory environment. Actual costs related to RINs may differ due to changes in the market price of RINs and the ultimate destinations of our products. Additional expenditures could be required to logistically accommodate the increased use of renewable transportation fuels. While we cannot currently estimate the ultimate impact of this statute, and currently believe that the outcome will not have a material impact on our financial position or liquidity, the ultimate outcome could have a material impact on our results of operations.
In California, Assembly Bill 32 (“AB 32”) created a statewide cap on greenhouse gas emissions by requiring that the state return to 1990 emission levels by 2020. AB 32 focuses on using market mechanisms, such as a cap-and-trade program and a low carbon fuel standard (“LCFS”), to achieve emissions reduction targets. The LCFS became effective in January 2010 and requires a 10% reduction in the carbon intensity of gasoline and diesel fuel by 2020. In 2011, the California Air Resources Board (“CARB”) approved cap-and-trade requirements that became effective in January 2013, and all of AB 32 related regulations are to be fully implemented by 2020. In December 2011, a U.S. District Court ruled that the LCFS violates the U.S. Constitution. CARB appealed the decision and, on September 18, 2013, the U.S. Ninth Circuit Court of Appeals reversed the lower court’s decision and remanded the case to the lower court to rule on whether the ethanol provisions of the LCFS are unconstitutional. We cannot predict the ultimate outcome of the lower court’s ruling on the LCFS, and the implementation and implications of AB 32 will take many years to realize. On January 1, 2015, transportation fuels will be brought into the California cap-and-trade program which will make fuel suppliers responsible for carbon emission from their products. CARB expects the cost for carbon emissions will be passed through to consumers. Consequently, we cannot currently predict the impact of the LCFS, cap and trade requirements, and other AB 32 related regulations on our liquidity, financial position, or results of operations.
54
Environmental Liabilities
We are incurring and expect to continue to incur expenses for environmental remediation liabilities at a number of currently and previously owned or operated refining, pipeline, terminal and retail station properties. We have accrued liabilities for these expenses and believe these accruals are adequate based on current information and projections that can be reasonably estimated. Additionally, we have recognized environmental remediation liabilities assumed in past acquisitions from the prior owners that include amounts estimated for site cleanup and monitoring activities arising from operations at refineries, certain terminals and pipelines, and retail stations prior to the dates of our acquisitions. Our environmental accruals are based on estimates including engineering assessments, and it is possible that our projections will change and that additional costs will be recorded as more information becomes available.
Our accruals for environmental expenditures totaled $267 million and $262 million at June 30, 2014 and December 31, 2013, respectively, including $23 million and $24 million for TLLP, respectively. These accruals include $221 million and $216 million at June 30, 2014 and December 31, 2013, respectively, related to amounts estimated for site cleanup activities arising from operations at our Martinez refinery prior to August 2000 and operations of assets acquired in the Los Angeles Acquisition prior to June 1, 2013. We cannot reasonably determine the full extent of remedial activities that may be required at the Martinez refinery and for assets acquired in the Los Angeles Acquisition, and it is possible that we will identify additional investigation and remediation costs for site cleanup activities as more information becomes available. Our estimates for site cleanup activities reflect amounts for which we are responsible under applicable cost-sharing arrangements. We also have insurance policies related to certain matters at our Martinez refinery that provide coverage up to $190 million for expenditures in excess of $50 million in self-insurance. We have not recognized possible insurance recoveries and the insurer has challenged coverage and filed a declaratory relief action in federal court.
Washington Refinery Fire
The naphtha hydrotreater unit at our Washington refinery was involved in a fire in April 2010, which fatally injured seven employees and rendered the unit inoperable. The Washington State Department of Labor & Industries (“L&I”), the U.S. Chemical Safety and Hazard Investigation Board (“CSB”) and the EPA initiated separate investigations of the incident. L&I completed its investigation in October 2010, issued citations and assessed a $2.4 million fine, which we appealed. L&I reassumed jurisdiction of the citation and affirmed the allegations in December 2010. We disagree with L&I’s characterizations of operations at our Washington refinery and believe, based on available evidence and scientific reviews, that many of the agency’s conclusions are mistaken. We filed an appeal of the citation in January 2011. In separate September 2013 and November 2013 orders, the Board of Industrial Insurance Appeals granted partial summary judgment in our favor and dismissed most of the citations. We have established an accrual for this matter although we cannot currently estimate the final amount or timing of its resolution. The outcome of this matter will not have a material impact on our liquidity, financial position, or results of operations.
On May 1, 2014, the CSB finalized its investigation report on the April 2010 naphtha hydrotreater unit fire at our Washington refinery. In the report, the CSB made recommendations to federal and state agencies, the American Petroleum Industry and us. In response to the recommendations made to us, we have communicated to the CSB the actions we are and will be taking. Our completion of those actions will not have a material impact on our liquidity, financial position, or results of operations.
The EPA, in conjunction with the U.S. Department of Justice (“DOJ”), is continuing its criminal investigation of the Washington naphtha hydrotreater fire. We cannot predict what action, if any, the EPA and DOJ will take. As a result, we cannot currently estimate the amount or timing of the resolution for any action that may result from this investigation.
We received a notice of violation (“NOV”) from the EPA alleging 46 violations of the Clean Air Act Risk Management Plan requirements at our Washington refinery on November 20, 2013. The EPA conducted an investigation of the refinery in 2011, following the April 2010 fire in the naphtha hydrotreater unit. While we have submitted a response to the EPA and requested clarification of certain allegations, we cannot currently estimate the amount or timing of the resolution of this matter. We believe the outcome will not have a material impact on our liquidity, financial position, or results of operations.
Other Matters
In the ordinary course of business, we become party to lawsuits, administrative proceedings and governmental investigations, including environmental, regulatory and other matters. Large, and sometimes unspecified, damages or penalties may be sought from us in some matters. We have not established accruals for these matters unless a loss is probable, and the amount of loss is currently estimable.
55
Environmental
The EPA has alleged that we have violated certain Clean Air Act regulations at our Alaska, Washington, Martinez, North Dakota and Utah refineries. We also retained the responsibility for resolving similar allegations relating to our former Hawaii refinery, which we sold in September 2013. We previously received a NOV in March 2011 from the EPA alleging violations of Title V of the Clean Air Act at our Alaska refinery, which arose from a 2007 state of Alaska inspection and inspections by the EPA in 2008 and 2010. We also previously received NOVs in 2005 and 2008 alleging violations of the Clean Air Act at our Washington refinery. We are continuing discussions of all EPA claims with the EPA and the DOJ. The ultimate resolution of these matters could have a material impact on our future interim or annual results of operations, as we may be required to incur material capital expenditures and/or civil penalties. However, we do not believe that the outcome will have a material impact on our liquidity or financial position.
We have investigated conditions at certain active wastewater treatment units at our Martinez refinery pursuant to an order received in 2004 from the San Francisco Bay Regional Water Quality Control Board that named us as well as two previous owners of the Martinez refinery. We cannot currently estimate the amount of the ultimate resolution of the order, but we believe it will not have a material adverse impact on our liquidity, financial position, or results of operations.
Certain non-governmental organizations filed a Request for Agency Action (the “Request”) with the Utah Department of Environmental Quality (“UDEQ”) concerning our Utah refinery in October 2012. The Request challenges the UDEQ’s permitting of our refinery conversion project alleging that the permits do not conform to the requirements of the Clean Air Act. As the permittee, we are the real party in interest and will be defending the permits with UDEQ. On July 10, 2014, the UDEQ Administrative Law Judge issued an order recommending denial of a request for a stay of the project but a decision on the merits is still pending. While we cannot estimate the timing or estimated amount, if any, associated with the outcome of this matter, we do not believe it will have a material adverse impact on our liquidity, financial position, or results of operations.
The CSB is continuing its investigation of incidents at our Martinez refinery in February and March 2014 involving sulfuric acid exposure at the Alkylation Unit. The California Department of Industrial Relations (“Cal-OSHA”) along with Contra Costa County Health District (“CCCHD”) also started investigations of the incidents. The EPA is also conducting an investigation to evaluate the Martinez refinery’s compliance with certain federal environmental acts and the Risk Management Plan requirements under the Clean Air Act. While we cannot currently predict the timing and the resolution of these investigations, we believe the outcome will not have a material impact on our liquidity, financial position, or results of operations.
Tax
We are subject to extensive federal, state and foreign tax laws and regulations. Newly enacted tax laws and regulations, and changes in existing tax laws and regulations, could result in increased expenditures in the future. We are also subject to audits by federal, state and foreign taxing authorities in the normal course of business. It is possible that tax audits could result in claims against us in excess of recorded liabilities. However, we believe that resolution of any such claim(s) would not have a material impact on our liquidity, financial position, or results of operations.
56
IMPORTANT INFORMATION REGARDING FORWARD-LOOKING STATEMENTS
This Quarterly Report on Form 10-Q (including information incorporated by reference) includes and references “forward-looking statements” within the meaning of the Private Securities Litigation Reform Act of 1995. These statements relate to, among other things, expectations regarding refining margins, revenues, cash flows, capital expenditures, turnaround expenses and other financial items. These statements also relate to our business strategy, goals and expectations concerning our market position, future operations, margins and profitability. We have used the words “anticipate,” “believe,” “could,” “estimate,” “expect,” “intend,” “may,” “plan,” “predict,” “project,” “will,” “would” and similar terms and phrases to identify forward-looking statements in this Quarterly Report on Form 10-Q, which speak only as of the date the statements were made.
Although we believe the assumptions upon which these forward-looking statements are based are reasonable, any of these assumptions could prove to be inaccurate and the forward-looking statements based on these assumptions could be incorrect. The matters discussed in these forward-looking statements are subject to risks, uncertainties and other factors that could cause actual results and trends to differ materially from those made, projected, or implied in or by the forward-looking statements depending on a variety of uncertainties or other factors including, but not limited to:
• | the constantly changing margin between the price we pay for crude oil and other refinery feedstocks as well as RINs and carbon credits, and the prices at which we are able to sell refined products; |
• | the timing and extent of changes in commodity prices and underlying demand for our refined products; |
• | changes in the expected value of and benefits derived from the assets acquired in the acquisition of BP’s integrated Southern California refining, marketing and logistics business; |
• | changes in global economic conditions and the effects of the global economic downturn on our business, especially in California, and the business of our suppliers, customers, business partners and credit lenders; |
• | the availability and costs of crude oil, other refinery feedstocks and refined products; |
• | changes in fuel and utility costs for our facilities; |
• | changes in the cost or availability of third-party vessels, pipelines and other means of transporting crude oil feedstocks and refined products; |
• | actions of customers and competitors; |
• | state and federal environmental, economic, health and safety, energy and other policies and regulations, including those related to climate change and any changes therein, and any legal or regulatory investigations, delays or other factors beyond our control; |
• | regulatory and other requirements concerning the transportation of crude oil, particularly from the Bakken area; |
• | adverse rulings, judgments, or settlements in litigation or other legal or tax matters, including unexpected environmental remediation costs in excess of any reserves; |
• | operational hazards inherent in refining operations and in transporting and storing crude oil and refined products; |
• | earthquakes or other natural disasters affecting operations; |
• | changes in our cash flow from operations; |
• | changes in capital requirements or in execution of planned capital projects; |
• | changes in the carrying costs of our inventory; |
• | disruptions due to equipment interruption or failure at our facilities or third-party facilities; |
• | direct or indirect effects on our business resulting from actual or threatened terrorist incidents or acts of war; |
• | weather conditions affecting our operations or the areas in which our refined products are marketed; |
• | seasonal variations in demand for refined products; |
• | risks related to labor relations and workplace safety; and |
• | political developments. |
Many of these factors, as well as other factors, are described in our filings with the SEC. All future written and oral forward-looking statements attributable to us or persons acting on our behalf are expressly qualified in their entirety by the previous statements. The forward-looking statements in this Quarterly Report on Form 10-Q speak only as of the date of this Quarterly Report on Form 10-Q. We undertake no obligation to update any information contained herein or to publicly release the results of any revisions to any forward-looking statements that may be made to reflect events or circumstances that occur, or that we become aware of, after the date of this Quarterly Report on Form 10-Q.
57
ITEM 3. QUANTITATIVE AND QUALITATIVE DISCLOSURES ABOUT MARKET RISK
Risk Management
We have established a risk committee comprised of senior level leadership from our financial, strategic, governance, administrative and operational functions. The risk committee’s responsibilities include the performance of an annual review to assess and prioritize the Company’s risks in coordination with our subject matter experts, assessment of the status and effectiveness of risk prevention and mitigation activities, identification of emerging risks and the facilitation of management’s development of risk assessment and management practices. The risk committee is also responsible to assess and advise management on the Company’s system of controls to ensure procedures are properly followed and appropriate accountability is present. The Company’s controls are designed to:
• | create and maintain a comprehensive risk management policy; |
• | provide for authorization by the appropriate levels of management; |
• | provide for segregation of duties; |
• | maintain an appropriate level of knowledge regarding the execution of and the accounting for derivative instruments; and |
• | implement key indicators to measure the performance of its hedging activities. |
The risk committee meets at least monthly to review priority risks, risk prevention and mitigation activities and the Company’s emerging risks. In addition, our risk committee chairman presents a quarterly risk update to executive management and an annual update to our Board of Directors concerning the status and effectiveness of our risk prevention and mitigation activities, emerging risks and risk assessment and management practices.
Commodity Price Risks
Our primary source of market risk is the difference between the sale prices for our refined products and the purchase prices for crude oil and other feedstocks. Refined product prices are directly influenced by the price of crude oil. Our earnings and cash flows from operations depend on the margin, relative to fixed and variable expenses (including the costs of crude oil and other feedstocks), at which we are able to sell our refined products. The prices of crude oil and refined products fluctuate substantially and depend on many factors including the global supply and demand for crude oil and refined products. This demand is impacted by changes in the global economy, the level of foreign and domestic production of crude oil and refined products, geo-political conditions, the availability of imports of crude oil and refined products, the relative strength of the U.S. dollar, the marketing of alternative and competing fuels and the impact of government regulations. Our refined product sale prices are also affected by local factors such as local market conditions and the level of operations of other suppliers in our markets.
In most cases, an increase or decrease in the price of crude oil results in a corresponding increase or decrease in the price of gasoline and other refined products. The timing, direction and the overall change in refined product prices versus crude oil prices could have a significant impact on our profit margins, earnings and cash flows. Assuming all other factors remained constant, a $1 per barrel change in average gross refining margins, based on our quarter-to-date average throughput of 816 Mbpd, would change annualized pre-tax operating income by approximately $300 million. This analysis may differ from actual results.
We maintain inventories of crude oil, intermediate products and refined products, the values of which are subject to fluctuations in market prices. Our inventories of refinery feedstocks and refined products totaled 39 million barrels at both June 30, 2014 and December 31, 2013. The average cost of our refinery feedstocks and refined products at June 30, 2014, was approximately $67 per barrel compared to market prices of approximately $119 per barrel. If market prices decline to a level below the average cost of these inventories, we would be required to write down the carrying value of our inventory to market value.
We use non-trading derivative instruments to manage exposure to commodity price risks associated with the purchase or sale of crude oil and finished products and inventories above or below our target levels. We also use these instruments to manage price risk for crude oil held in connection with arbitrage opportunities where the price of crude oil is higher in the future than the current spot price. For the purchase or sale of crude oil and finished products to be used in our normal operations, we may enter into physical commodity forward purchase and sale contracts (“Forward Contracts”) which are not typically classified and reported as derivatives for accounting purposes. The gains or losses associated with these Forward Contracts are recognized as incurred in our financial statements separate from the gains or losses associated with other derivative instruments reported below and in Note I to our financial statements in Part 1 Item 1.
58
Also, we may enter into derivative contracts such as exchange-traded futures, over-the-counter swaps, options and over-the-counter options, all of which had remaining durations of less than one year as of June 30, 2014, to economically hedge price risk associated with our physical commodity Forward Contracts or to take advantage of other market opportunities. We mark-to-market these derivative instruments each period during the contract term which can create timing differences for gain or loss recognition in our financial statements. The derivative gains or losses presented below do not reflect the realized losses or gains, respectively, from the settlement of our physical commodity transactions. Both the derivative and the physical commodity Forward Contracts’ gains and losses are reflected in our gross refining margin in the refining segment. We evaluate our performance based on all contract types available to manage our risk which includes contracts that may or may not be classified and reported as derivatives for accounting purposes.
We believe the governance structure that we have in place is adequate given the size and sophistication of our commodity optimization, inventory management and trading activities. Our governance over commodity activities includes regular monitoring of the performance of our risk management strategies and limits over dollar and volume based transactional authority, commodity position, aggregate spread, stop-loss and value-at-risk. Performance against our strategies and authorized limits is monitored daily via position reports and profit and loss analysis and is reviewed on a regular basis, at least monthly, by our risk committee.
Net earnings during the second quarters of 2014 and 2013 included a net loss of $76 million and net gain of $8 million, respectively, on our commodity derivative positions comprised of the following (dollars in millions and volumes in millions of barrels, gallons, tons or bushels):
Three Months Ended June 30, | |||||||||||
2014 | 2013 | ||||||||||
Contract Volumes | Net Gain (Loss) | Contract Volumes | Net Gain (Loss) | ||||||||
Unrealized gain carried on open derivative positions from prior period | 7 | $ | 16 | 1 | $ | 9 | |||||
Realized loss on settled derivative positions | 174 | (78 | ) | 141 | (25 | ) | |||||
Unrealized gain (loss) on open net derivative positions | 56 | (14 | ) | 1 | 24 | ||||||
Net Gain (Loss) | $ | (76 | ) | $ | 8 | ||||||
Our open derivative positions at June 30, 2014, will expire at various times through 2017. We prepared a sensitivity analysis to estimate our exposure to market risk associated with our derivative instruments. This analysis may differ from actual results. Based on our open net positions at June 30, 2014, a 1% change in quoted market prices of our derivative instruments, assuming all other factors remain constant, could change the fair value of our derivative instruments and pre-tax operating income by approximately $10 million.
Counterparty Credit Risk
We have exposure to concentrations of credit risk related to the ability of our counterparties to meet their contractual payment obligations, and the potential non-performance of counterparties to deliver contracted commodities or services at the contracted price. Customer concentrations within the refining industry may affect our overall exposure to counterparty risk because these customers may be similarly impacted by changes in economic or other conditions. In addition, financial services companies are the counterparties in certain of our price risk management activities, and such financial services companies could be adversely impacted by periods of uncertainty and illiquidity in the credit or capital markets. We have credit management processes in place by which we closely monitor the status of our counterparties by performing ongoing credit evaluations of their financial condition. In certain circumstances, we require prepayments, letters of credit or other credit enhancement.
59
Interest Rate Risk
Our use of fixed or variable-rate debt directly exposes us to interest rate risk. Fixed rate debt, such as our senior notes, exposes us to changes in the fair value of our debt due to changes in market interest rates. Fixed rate debt also exposes us to the risk that we may need to refinance maturing debt with new debt at higher rates, or that we may be obligated to pay rates higher than the current market. Variable-rate debt, such as borrowings under our Revolving Credit Facility or Term Loan Credit Facility, exposes us to short-term changes in market rates that impact our interest expense. The fair value of our debt was estimated primarily using quoted market prices. The carrying and fair value of our debt were approximately $3.0 billion and $3.1 billion, respectively, at June 30, 2014. The carrying value and fair value of our debt were approximately $2.8 billion and $2.9 billion, respectively, at December 31, 2013. We currently do not use interest rate swaps to manage our exposure to interest rate risk; however, we continue to monitor the market and our exposure, and in the future, we may enter into these transactions to mitigate risk. We believe in the short-term we have acceptable interest rate risk and continue to monitor the risk on our long-term obligations. With all other variables constant, a 0.25% change in the interest rate associated with the borrowings outstanding under our Term Loan Credit Facility at June 30, 2014 would change annual interest expense by approximately $2 million. There were no borrowings outstanding under the Revolving Credit Facility and $228 million borrowings outstanding under the TLLP Revolving Credit Facility as of June 30, 2014.
ITEM 4. CONTROLS AND PROCEDURES
Disclosure Controls and Procedures
Our disclosure controls and procedures are designed to provide reasonable assurance that the information that we are required to disclose in reports we file under the Securities Exchange Act of 1934, as amended (“the Exchange Act”), is accumulated and appropriately communicated to management. There have been no significant changes in our internal controls over financial reporting (as defined by applicable SEC rules) during the quarter ended June 30, 2014 that have materially affected or are reasonably likely to materially affect these controls.
We expect to complete during 2014 a transition from the 1992 framework of the Committee of Sponsoring Organizations of the Treadway Commission to its 2013 framework for assessing our internal control effectiveness over financial reporting.
We carried out an evaluation required by Rule 13a-15(b) of the Exchange Act, under the supervision and with the participation of our management, including the Chief Executive Officer and Chief Financial Officer, of the effectiveness of the design and operation of our disclosure controls and procedures at the end of the reporting period. Based on that evaluation, the Chief Executive Officer and Chief Financial Officer concluded that our disclosure controls and procedures are effective.
60
PART II — OTHER INFORMATION
ITEM 1. LEGAL PROCEEDINGS
In the ordinary course of business, we become party to lawsuits, administrative proceedings and governmental investigations, including environmental, regulatory and other matters. Large, and sometimes unspecified, damages or penalties may be sought from us in some matters and certain matters may require years to resolve. Although we cannot provide assurance, we believe that an adverse resolution of the matters described below will not have a material adverse impact on our liquidity, consolidated financial position, or results of operations. The information below describes new proceedings or material developments in proceedings that we previously reported in our annual report on Form 10-K for the year ended December 31, 2013.
On May 1, 2014, the U.S. Chemical Safety and Hazard Investigation Board (“CSB”) finalized its investigation report on the April 2010 naphtha hydrotreater unit fire at our Washington refinery. In the report, the CSB made recommendations to federal and state agencies, the American Petroleum Industry and us. In response to the recommendations made to us, we have communicated to the CSB the actions we are and will be taking. Our completion of those actions will not have a material impact on our liquidity, financial position, or results of operations.
In April 2014, we agreed to settle the November 19, 2013 notice of violation (“NOV”) from the Bay Area Air Quality Management District (the “BAAQMD”) for $285,000. The NOV alleged the release of hydrocarbon emissions from the cooling tower at our Martinez refinery in September 2010 violated air quality regulations. The resolution of this matter will not have a material impact on our liquidity, financial position, or results of operations.
On March 12, 2014 the Northwest Clean Air Agency issued a NOV jointly to Tesoro Refining & Marketing Company LLC and Tesoro Logistics Operations LLC alleging a violation of air quality regulations at TLLP’s Anacortes Crude Rail Offloading facility. The allegation concerns hydrocarbon releases from the wastewater system at the unloading facility during the period of November 2012 through September 2013. While we cannot currently estimate the timing of the resolution of this matter, the outcome will not have a material impact on our financial position, results of operations or liquidity.
On February 27, 2014, we received a NOV from the BAAQMD alleging 23 violations of air quality regulations from April 2011 to April 2012. While we are evaluating the allegation and cannot currently estimate the amount or timing of the resolution of this matter, the outcome will not have a material impact on our liquidity, financial position, or results of operations.
On January 16, 2014, we received a NOV from the Alaska Department of Environmental Conservation (ADEC) alleging violations of emission limits in 7 process heaters at our Kenai refinery. The allegations are based on results of emission tests conducted in September 2013. We are working with ADEC to mitigate the emissions and resolve the allegations. While we cannot currently estimate the amount or timing of the resolution of this matter, the outcome will not have a material impact on our liquidity, financial position, or results of operations.
ITEM 1A. RISK FACTORS
There have been no significant changes from the risk factors previously disclosed in Item 1A of our 2013 Annual Report on Form 10-K.
61
ITEM 2. UNREGISTERED SALES OF EQUITY SECURITIES AND USE OF PROCEEDS
The table below provides a summary of all purchases by Tesoro Corporation of its common stock during the three-month period ended June 30, 2014.
Period | Total Number of Shares Purchased (a) | Average Price Paid per Share | Total Number of Shares Purchased as Part of Publicly Announced Plans or Programs (b) | Approximate Dollar Value of Shares that May Yet Be Purchased Remaining at Period End Under the Plans or Programs (In Millions) (b) | |||||||||
April 2014 | 682,595 | $ | 51.50 | 678,846 | $ | 365 | |||||||
May 2014 | 993,473 | $ | 54.67 | 595,456 | $ | 332 | |||||||
June 2014 | 554,365 | $ | 58.52 | 554,365 | $ | 300 | |||||||
Total | 2,230,433 | 1,828,667 | $ | 300 | |||||||||
________________
(a) | Includes 401,766 shares acquired from employees during the second quarter of 2014 to satisfy tax withholding obligations in connection with the vesting of performance share awards, market stock units and restricted stock issued to them. |
(b) | Our Board of Directors authorized a $1.0 billion share repurchase program as revised in November 2013. Under the program, management is permitted to purchase Tesoro common stock at its discretion in the open market. The authorization has no time limit and may be suspended or discontinued at any time. On July 30, 2014, our Board approved a new $1.0 billion share repurchase program to become effective upon the full completion of our current $1.0 billion share repurchase authorization, expected by the end of 2014. |
ITEM 5. OTHER INFORMATION
Tesoro Corporation’s (“The Company”) board of directors approved the appointment of Keith Casey, age 48, as Executive Vice President, Operations of the Company, effective July 29, 2014. In this role, Mr. Casey will continue having responsibility for the Company’s operations, which he assumed in May 2014 when he was appointed Executive Vice President, Operations of Tesoro Companies, Inc., a subsidiary of the Company. From April 2013 to April 2014, Mr. Casey held the position of Senior Vice President, Strategy and Business Development of Tesoro Companies. Prior to joining the Company, Mr. Casey served as Vice President BP Products North America, Texas City Refinery beginning in September 2006. There are no changes in Mr. Casey’s compensation as a result of this appointment. Responsibility and authority for compensation-related decisions for Mr. Casey will reside with the compensation committee of the board of directors of the Company.
62
ITEM 6. EXHIBITS
(a) | Exhibits |
Exhibit Number | Description of Exhibit | |
4.1 | Supplemental Indenture, dated as of March 3, 2014, among Tesoro Corporation, certain subsidiary guarantors and U.S. Bank National Association, as trustee, relating to the 4.250% Senior Notes due 2017 and 5.375% Senior Notes due 2022 (incorporated by reference herein to Exhibit 4.1 to the Company’s Quarterly Report on Form 10-Q for the quarterly period ended March 31, 2014, File No. 1-3473). | |
4.2 | Indenture (including form of note), dated as of March 18, 2014, among Tesoro Corporation, the guarantors named therein and U.S. Bank National Association, as trustee, relating to the 5.125% Senior Notes due 2024 (incorporated by reference herein to Exhibit 4.1 to the Company’s Current Report on Form 8-K filed on March 18, 2014, File No. 1-3473). | |
*#10.1 | Tesoro Corporation Non-Employee Director Compensation Program. | |
*31.1 | Certification by Chief Executive Officer Pursuant to Section 302 of the Sarbanes-Oxley Act of 2002. | |
*31.2 | Certification by Chief Financial Officer Pursuant to Section 302 of the Sarbanes-Oxley Act of 2002. | |
*32.1 | Certification by Chief Executive Officer Pursuant to 18 U.S.C. Section 1350, as Adopted Pursuant to Section 906 of the Sarbanes-Oxley Act of 2002. | |
*32.2 | Certification by Chief Financial Officer Pursuant to 18 U.S.C. Section 1350, as Adopted Pursuant to Section 906 of the Sarbanes-Oxley Act of 2002. | |
**101.INS | XBRL Instance Document | |
**101.SCH | XBRL Taxonomy Extension Schema Document | |
**101.CAL | XBRL Taxonomy Extension Calculation Linkbase Document | |
**101.DEF | XBRL Taxonomy Extension Definition Linkbase Document | |
**101.LAB | XBRL Taxonomy Extension Label Linkbase Document | |
**101.PRE | XBRL Taxonomy Extension Presentation Linkbase Document | |
________________
* | Filed herewith. |
** | Submitted electronically herewith. |
# | Compensatory plan or arrangement. |
63
SIGNATURES
Pursuant to the requirements of the Securities Exchange Act of 1934, the registrant has duly caused this report to be signed on its behalf by the undersigned thereunto duly authorized.
TESORO CORPORATION | ||
Date: | August 1, 2014 | /s/ GREGORY J. GOFF |
Gregory J. Goff | ||
President and Chief Executive Officer | ||
(Principal Executive Officer) | ||
Date: | August 1, 2014 | /s/ G. SCOTT SPENDLOVE |
G. Scott Spendlove | ||
Senior Vice President and Chief Financial Officer | ||
(Principal Financial Officer) | ||
64