Attached files
| file | filename |
|---|---|
| 8-K - 8-K - CYS Investments, Inc. | d798053d8k.htm |
 Kevin
Grant Chief Executive Officer
September 30, 2014
Investment Outlook
JMP Securities Financial Services & Real Estate Conference
Exhibit 99.1 |
 Forward-Looking Statements
This presentation contains forward-looking statements, within the meaning of Section 27A
of the Securities Act of 1933, as amended, and Section 21E of the Securities Exchange
Act of 1934, as amended, that are based on management’s beliefs and assumptions, current
expectations, estimates and projections. Such statements, including information relating to
the Company’s expectations for distributions, availability
and
cost
of
financing,
market
conditions,
monetary
policy,
return
on
equity,
the
yield
curve,
the
economy,
interest
expense,
affordability of housing, movements in interest rates, governmental actions and the end of
the Federal Reserve’s quantitative easing program,
the
performance
of
the
Company’s
target
assets,
the
impact
of
current
Federal
Reserve
voters
on
certain
policies
of
the
Federal
Reserve, the policy views of central banks, and the size of the mortgage market are not
considered historical facts and are considered forward-looking
information
under
the
federal
securities
laws.
This
information
may
contain
words
such
as
“believes,”
“plans,”
“expects,”
“intends,”
“estimates”
or similar expressions.
This information is not a guarantee of the Company’s future performance and is subject
to risks, uncertainties and other important factors that could cause the
Company’s actual performance or achievements to differ materially from those expressed or implied by this forward-
looking information and include, without limitation, changes in the market value and yield of
our assets, changes in interest rates and the yield
curve,
net
interest
margin,
return
on
equity,
availability
and
terms
of
financing
and
hedging,
the
likelihood
that
proposed
legislation
is
made
law
and
the
anticipated
impact
thereof,
actions
by
the
U.S.
government
or
any
agency
thereof,
including
the
Federal
Reserve,
and
the
effects of such actions and various other risks and uncertainties related to our business and
the economy, some of which are described in our
filings
with
the
SEC.
Given
these
uncertainties,
you
should
not
rely
on
forward-looking
information.
The
Company
undertakes
no
obligations to update any forward-looking information, whether as a result of new
information, future events or otherwise. 2 |
 CYS Overview
Focus on Cost
Efficiency
Target Assets
Agency Residential Mortgage Backed Securities
A Real Estate Investment Trust Formed in January 2006
Ample Financing
Sources
Financing lines with 43
lenders
Swap agreements with 19 counterparties
Dividend Policy
Self managed: highly scalable
Senior
Management
Kevin Grant, CEO, President, Chairman
Frances Spark, CFO
Company intends to distribute all or substantially all of its REIT
taxable income
3 |
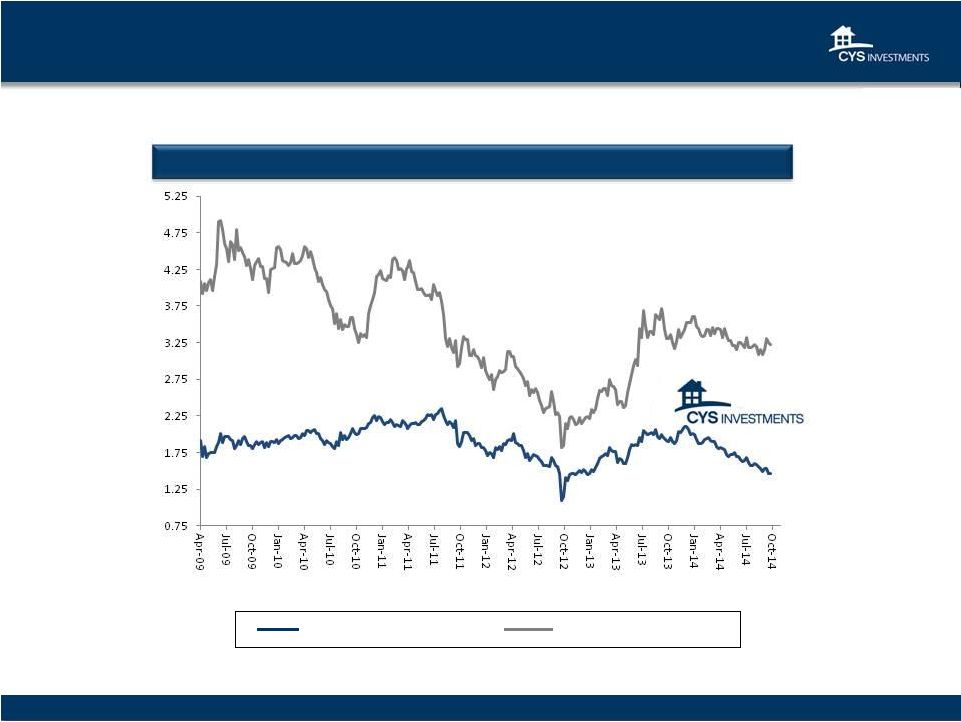
 Agency MBS Market
Continues To See Strong Demand 15 Year: Hedged vs. Unhedged
15 Year Fixed Hedged with Swaps: April 2009 –
September 2014
15 Year Hedged
(i)
15 Year Unhedged
(ii)
Borrow Short
Invest Long
4
Source: Bloomberg, 9/26/14.
Note: Spreads calculated as: (i) 15 year CC Index = 50% 4 year swap, and (ii) 15
year Current Coupon Index |
 Agency MBS Market
Continues To See Strong Demand 30 Year: Hedged vs. Unhedged
Source: Bloomberg, 9/26/14
30 Year Fixed Hedged with Swaps: April 2009 –
September 2014
30 Year Hedged
30 Year Unhedged
5
Borrow Short
Invest Long
Note: Spread calculated as: (i) 30 year CC Index - 90% 5 year swap |
 Volatility in
the Cap/Floor Markets Hit a Low in July 2013
30 Yr MBS -
15 Yr MBS Spread
7 Yr Cap/Floor Implied Vol
November 2012 –
September 2014
April 2012 –
September 2014
30 Year MBS Cheapened Meaningfully
Relative to 15 Year MBS
5 Year Swap vs. Fed Funds
January 2005 –
September 2014
Yield Curve
Creates positive carry
Very low cost of financing
Good ROE
Hedge flexibility very important
Fed still fighting deflation
End of QE Poses New Risks and New Opportunities
September 26, 2014
6
Source: Bloomberg
September 26, 2014
September 26, 2014 |
 Global Ten Year
Yields: Is U.S. Growth Out of Sync with Rest of World?
GDBR10
(1.185)
USGG10YR
0.350
GCAN10YR
(0.224)
GJGB10
(0.520)
Government Ten Year Yields
UK, US, Canada, Germany, Japan
September 2011 -
September 2014
Source: Bloomberg, 9/26/14
7
GBTPGR10
(0.031) |
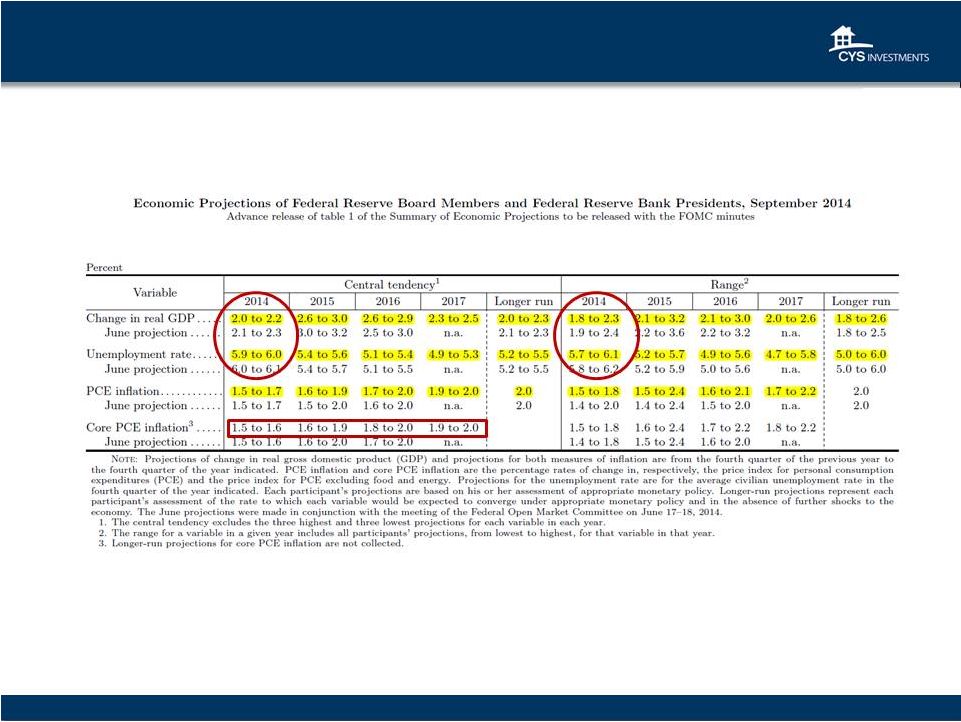 Actual Economic
Performance: Sluggish vs. Fed Projections
8
Source: Board of Governors of the Federal Reserve, September 17, 2014 |
 Appropriate
Timing of Policy Firming
•
Creates Significant Headwinds for the Economy
•
Housing Will Struggle
•
Corporate Interest Expense will rise
Overview of FOMC Participants Assessments
of Appropriate Monetary Policy
Can the Economy Withstand
The Implied Path of 10 Year UST?
•
Forward Rate Guidance is the Fed’s Most Impactful Tool
•
Appropriate Timing and Pace will drive the Yield Curve
1.00
2.00
3.00
4.00
5.00
6.00
0.00
2014
2015
Longer
Run
%
Source: Federal Reserve September 2014 Forecast, Bloomberg, CYS
2016
Transition to a Normalized Yield Curve:
Will the Fed Push Out –
or Pull In -
Forward Rate Guidance?
9
Ten Year Treasury
August 2011 -
September 2014
and Implied Projection
+25
-25
%
Appropriate Pace
of Policy Firming
Target Fed Funds Rate at Year End |
 2014-16 Fed
Voters: New Perspectives, Changing Outlooks
Powell
Source: federalreserve.gov, Barclays, Macroeconomic Advisers, LLC, Bank of America
Merrill Lynch, Bloomberg, Wall Street Journal, Indiana University, Marketwatch, Thomson Reuters, Federal Reserve
Bank of Atlanta, Federal Reserve Bank of Chicago, Federal Reserve Bank of Cleveland, Maryland
Consumer Rights Coalition, Boston Globe, Businessweek, Newsweek, Washington Post, CNBC.
Dallas:
Fisher
Minneapolis:
Kocherlakota
Philadelphia:
Plosser
Hawkish
Dovish
Neutral
2014
Voters
Yellen
Raskin’s Successor
Board of
Governors
2015
Voters
New York:
Dudley
Chicago:
Evans
Richmond:
Lacker
Atlanta:
Lockhart
San Francisco:
Williams
Fischer
Brainard
Tarullo
Cleveland:
Mester
Stein’s Successor
New York:
Dudley
10
2016
Voters
New York:
Dudley
Cleveland:
Mester
Boston:
Rosengren
Kansas City:
George
St. Louis:
Bullard |
 Central
Banks: Decidedly More Accommodative -
Focus on Global Deflation Risk
Draghi
EU
Hawkish
Dovish
Neutral
Xiaochuan
China
Xiaochuan
China
Tombini
Brazil
Tombini
Brazil
Australia
Stevens
Australia
Stevens
New Zealand
Wheeler
New Zealand
Wheeler
Kuroda
Japan
Canada
Poloz
Rajan
India
Kuroda
Japan
Carney
UK
Yellin
USA
11 |
 GSE Reform
“Headway” Legislative
Level of
GSE
Credit Risk
Proposal
Government Involvement
Implication
Sharing
Status
Corker-Warner Bill
Limited: Only under
catastrophic scenarios where
losses on a pool of mortgages
exceeds 10%
Completely wound down
over 5 years
10% first-loss piece is sold to
private entities
Corker-Warner under
committee discussion but
not yet put to vote. Either
may become the front runner
from the Senate side but both
will likely have private capital
in the first loss place with several
mechanisms for risk sharing
Senate Banking Committee
voted in favor of the bill
13-9 on May 15. Insufficient
support to allow the bill
to be brought to the Senate
floor for debate/vote.
Johnson -
Crapo Bill
Based on Corker-Warner,
limited: only on scenarios
where losses on a pool of
mortgages exceeds a 10%
private loss position.
GSE’s wound down over
5 year period, replaced
by FMIC.
Similar to Corker-Warner,
10% first-loss piece is sold to
private entities.
PATH Act
Very limited: dissolves the
GSEs completely and reduces
the scope of the FHA/VA
guarantee
Placed into receivership
and completely liquidated
with
Initially, a 10% risk-sharing
program on new GSE and
FHA business, although
private market
securitization is intended
eventually to replace GSEs
No news. In early 2013, the
Path Act seemed to be the
clear front-runner on the
House side. The final housing
finance reform, if it happens,
could be a compromise between
the PATH Act and whatever
comes out of the Senate
Delaney-Carney-Himes
Limited: Ginnie Mae is required
to provide an explicit
government guarantee once
the 5% risk slice is eroded
when one of the private
monoline insurers defaults
GSEs will be slowly wound
down and eventually converted
into private reinsurers with
limited capacities to take on
mortgage credit risk
5% first-loss piece on each
new Ginnie Mae securitization,
as well as a 10% pro-rata risk
slice on the top 95% of each
Ginnie Mae securitization
Source: Barclays, CYS
12 |
 Economic
Recovery Below Normal Pace U.S. Regular Conventional Gas Price
$ per gal
Updated: 2014-09-02
Capacity Utilization: Manufacturing
Updated: 2014-09-15
Civilian Unemployment Rate
Updated: 2014-09-05
CPI-U All Items, Core
Updated: 2014-09-17
Total Nonfarm Private Payroll Employment
Updated: 2014-09-04
Total Unemployed + All Marginally Attached + Total
Employed Part Time for Economic Reasons
Updated: 2014-09-05
Source: Federal Reserve Bank of St. Louis
13 |
 Housing Finance
Has Not Rebounded Source: CoreLogic, FHFA, S&P, Bloomberg, Barclays Research,
National Association of Realtors, US Census Bureau, MBA, Inside Mortgage Finance Share
of
Government
Guaranteed
Mortgages
1990
–
2013
New
and
Existing
Homes
Months
of
Supply
January
1999
-
present
Home
Ownership
Rate
January
1985
-
present
14
New Homes
Existing Homes |
 Mortgage Market
Shrinkage Likely to Continue Source: FRB, Freddie Mac
Mortgage Debt
Outstanding
2007 -
2013
Mortgage Debt Outstanding
Growth Rate
0.00%
0.50%
1.00%
9.75
10.00
10.25
10.50
10.75
11.00
11.25
11.50
1.50%
2.00%
3.50%
4.00%
4.50%
0.50%
2.00%
1.50%
1.00%
9.50
8.75
9.00
9.25
Single Family
Mortgage Origination Volume
2000 -
2015E
0
15
Residential Mortgage Debt Decline Driven By:
1.
Home prices now reset lower
2.
Delevering Consumers/Homeowners
3.
Psychology of lower leverage
4.
Low volume of new and existing home sales
5.
All-cash home purchase transactions, and higher downpayments
6.
Scheduled principal payments
7.
High percentage of cash-in refi’s versus cash-out refi’s.
8.
QM Rules Restrictive
2000
2005
2010
2012
2013
Est.
2014
Fcst.
2015
Fcst.
1,000
2,000
3,000
4,000
Refinance Originations
Home Purchase Originations
1.9T
1.3T
1.1T |
  Economics of
Forward Purchase Source: Bloomberg, September 26, 2014
16 |
 1
As of 6/30/14
2
The December 2012 dividend was composed of $0.40 quarterly cash dividend, and $0.52 special
cash dividend. The September 2014 dividend will be paid on October 15, 2014 to
shareholders of record on September 24, 2014. $14.2B Agency RMBS and U.S. Treasuries
Portfolio Portfolio Composition and Dividends
17
CYS
Agency
RMBS
and
U.S.
Treasury
Portfolio
1
CYS Common Stock Dividends
September
2009
–
September
2014
2
0.0%
5.0%
10.0%
15.0%
20.0%
25.0%
30.0%
$0.00
$0.10
$0.20
$0.30
$0.40
$0.50
$0.60
$0.70
$0.80
$0.90
$1.00
15 Year
Fixed
Rate
45%
30 Year
Fixed Rate
26%
Hybrid
ARMs
14%
US
Treasury
Securities
14%
20 Year Fixed
Rate 1% |
 CYS Agency
RMBS and U.S. Treasury Portfolio Characteristics* Portfolio Characteristics
18
Face Value
Fair Value
Weighted Average
Asset Type
(in thousands)
Cost/Face
Fair Value/Face
Yield
(1)
Coupon
CPR
(2)
15 Year Fixed Rate
$ 6,090,446
$ 6,368,659
$ 102.66
$ 104.57
1.99%
3.15%
6.2%
20 Year Fixed Rate
75,567
82,467
103.01
109.13
1.14%
4.50%
22.0%
30 Year Fixed Rate
3,511,537
3,725,156
103.97
106.08
2.73%
3.99%
5.9%
Hybrid ARMs
(3)
1,920,595
1,970,318
103.51
102.59
1.87%
2.57%
12.9%
U.S. Treasury Securities
2,050,000
2,050,562
99.78
100.03
1.34%
1.35%
NA
Total
$ 13,648,145
$ 14,197,162
$ 102.69
$ 104.02
2.06%
3.02%
7.6%
* As of 6/30/14
(1)
This is a forward yield and is calculated based on the cost basis of the security at June 30,
2014. (2) CPR is a method of expressing the prepayment rate for a mortgage
pool that assumes that a constant fraction of the remaining principal is prepaid each
month or year. Specifically, the constant prepayment rate is an annualized version of the prior three
month prepayment rate for those bonds held at June 30, 2014. Securities with no
prepayment history are excluded from this calculation. (3)
The weighted average months to reset of our Hybrid ARM portfolio was 61.1 at
June 30, 2014. Months to reset is the number of months remaining before the fixed rate
on a Hybrid ARM becomes a variable rate. At the end of the fixed period, the variable
rate will be determined by the margin and the pre-specified caps of the Hybrid ARM and
will reset annually. |
 (1)
Drop Income is a component of our net realized and unrealized gain (loss) on investments on
our consolidated statements of operations, and is therefore excluded from Core
Earnings. (2)
Core Earnings is defined as net income (loss) available to common shares excluding net
realized gain (loss) on investments, net unrealized gain (loss) on investments, net
realized gain (loss) on termination of swap and cap contracts and net unrealized gain
(loss) on swap and cap contracts. Financial Information
19
Income Statement Data
(In thousands, except per share numbers)
June 30, 2014
March 31, 2014
Total interest income
71,978
84,367
Total interest expense
27,039
28,346
Net interest income
44,939
56,021
Other income (loss):
Net realized gain (loss) on investments
33,118
16,670
Net unrealized gain (loss) on investments
157,479
89,234
Net realized gain (loss) on termination of swap and cap contracts
(6,004)
(9,323)
Net unrealized gain (loss) on swap and cap contracts
(65,181)
(16,240)
Other income
50
119
Total other income (loss)
119,462
80,460
Total expenses
6,020
5,794
Net income (loss)
158,381
$
130,687
$
Dividends on preferred stock
(5,203)
(5,203)
Net income (loss) available to common shares
153,178
$
125,484
$
Net income (loss) per common share basic & diluted
0.95
$
0.78
$
Drop income per common share (diluted)
0.12
$
0.07
$
Core Earnings per common share (diluted)
0.21
$
0.28
$
Distributions per common share
0.32
$
0.32
$
Non-GAAP Measure/Reconciliation
NET INCOME (LOSS) AVAILABLE TO COMMON SHARES
$153,178
$125,484
Net realized (gain) loss on investments
(33,118)
(16,670)
Net unrealized (gain) loss on investments
(157,479)
(89,234)
Net realized (gain) loss on termination of swap and cap contracts
6,004
9,323
Net unrealized (gain) loss on swap and cap contracts
65,181
16,240
Core Earnings
$33,766
$45,143
Three Months Ended
(1)
(2) |
 Financial
Information 20
The table above includes calculations of the Company’s Agency RMBS and U.S. Treasury
Securities portfolio (“Debt Securities”) 1)
The average settled Debt Securities is calculated by averaging the month end cost basis of
settled Debt Securities during the period.
2)
The average total Debt Securities is calculated by averaging the month end cost basis of total
Debt Securities during the period. 3)
The average repurchase agreements are calculated by averaging the month end repurchase
agreements balance during the period. 4)
The average Debt Securities liabilities are calculated by adding the average month end
repurchase agreements balance plus average unsettled Debt Securities during the period.
5)
The average stockholders' equity is calculated by averaging the month end stockholders' equity
during the period. 6)
The average common shares outstanding are calculated by averaging the daily common shares
outstanding during the period. 7)
The leverage ratio is calculated by dividing (i) the Company's repurchase agreements balance
plus payable for securities purchased minus receivable for securities sold by (ii)
stockholders' equity.
8)
The average yield on Debt Securities for the period is calculated by dividing total interest
income by average settled Debt Securities. 9)
The average yield on total Debt Securities including Drop Income for the period is calculated
by dividing total interest income plus Drop Income by average total Debt Securities.
10)
The average cost of funds and hedge for the period is calculated by dividing interest expense
by average repurchase agreements. 11)
The adjusted average cost of funds and hedge for the period is calculated by dividing interest
expense by average Debt Securities liabilities. 12)
The interest rate spread net of hedge for the period is calculated by subtracting average cost
of funds and hedge from average yield on settled Debt Securities. 13)
The interest rate spread net of hedge including Drop Income for the period is calculated by
subtracting adjusted average cost of
funds and hedge from average yield on total Debt
Securities including Drop Income.
14)
The operating expense ratio for the period is calculated by dividing operating expenses by
average stockholders' equity. * All percentages are annualized.
(in thousands)
Three Months Ended
Key Balance Sheet Metrics
June 30, 2014
March 31, 2014
Average
settled
Debt
Securities
(1)
$11,599,873
$12,472,238
Average
total
Debt
Securities
(2)
$13,711,749
$13,454,972
Average
repurchase
agreements
(3)
$9,981,049
$10,867,627
Average
Debt
Securities
liabilities
(4)
$12,092,925
$11,850,361
Average
stockholders'
equity
(5)
$1,916,575
$1,861,121
Average
common
shares
outstanding
(6)
162,031
161,831
Leverage
ratio
(at
period
end)
(7)
6.35:1
6.32:1
Key Performance Metrics*
Average
yield
on
settled
Debt
Securities
(8)
2.48%
2.71%
Average
yield
on
total
Debt
Securities
including
Drop
Income
(9)
2.67%
2.85%
Average
cost
of
funds
and
hedge
(10)
1.08%
1.04%
Adjusted
average
cost
of
funds
and
hedge
(11)
0.89%
0.96%
Interest
rate
spread
net
of
hedge
(12)
1.40%
1.67%
Interest
rate
spread
net
of
hedge
including
Drop
Income
(13)
1.78%
1.89%
Operating
expense
ratio
(14)
1.26%
1.25% |
 Kevin
Grant Chief Executive Officer
September 30, 2014
Investment Outlook
JMP Securities Financial Services & Real Estate Conference |