Attached files
| file | filename |
|---|---|
| 8-K - 8-K - HERITAGE FINANCIAL CORP /WA/ | d767582d8k.htm |
 Keefe, Bruyette
& Woods Community Bank Investor Conference
July 29
th
& 30
th
, 2014
NASDAQ: HFWA
Brian Vance, Chief Executive Officer
Jeff Deuel, President and Chief Operating Officer
Don Hinson, Executive Vice President and Chief Financial Officer
Bryan McDonald, Executive Vice President and Chief Lending Officer
Exhibit 99.1 |
 Forward-Looking Statements
2
This presentation contains forward-looking statements that are subject to risks and
uncertainties, including, but not limited to: The expected revenues, cost savings,
synergies and other benefits from the Washington Banking merger and our other merger
and acquisition activities might not be realized within the anticipated time frames or at all, and costs or difficulties
relating to integration matters, including but not limited to, customer and employee retention
might be greater than expected;
The credit and concentration risks of lending activities;
Changes in general economic conditions, either nationally or in our market areas;
Competitive market pricing factors and interest rate risks;
Market interest rate volatility;
Balance sheet (for example, loans) concentrations;
Fluctuations in demand for loans and other financial services in our market areas;
Changes in legislative or regulatory requirements or the results of regulatory
examinations; The ability to recruit and retain key management and staff;
Risks associated with our ability to implement our expansion strategy and merger
integration; Stability of funding sources and continued availability of
borrowings; Adverse changes in the securities markets;
The inability of key third-party providers to perform their obligations to us;
Changes in accounting policies and practices and the use of estimates in determining fair
value of certain of our assets, which estimates may prove to be incorrect and result in
significant declines in valuation; and These and other risks as may be detailed from
time to time in our filings with the Securities and Exchange Commission. The Company
cautions readers not to place undue reliance on any forward-looking statements. Moreover, you should treat these
statements as speaking only as of the date they are made and based only on information then
actually known to the Company. The Company does not undertake and specifically
disclaims any obligation to revise any forward-looking statements to reflect the
occurrence of anticipated or unanticipated events or circumstances after the date of such
statements. These risks could cause our actual results for 2014 and beyond to differ
materially from those expressed in any forward-looking statements by, or on behalf of,
us, and could negatively affect the Company’s operating and stock price
performance. |
 Overview
3
Company Overview
WBCO Merger
Financial Review
Strategic Initiatives |
 Our
Company 4
Overview
NASDAQ Symbol
HFWA
Market Capitalization
$486 million
Total Assets
$3.4 billion
Headquarters
Olympia, WA
Branches
67
Data as of June 30, 2014 |
 Major
Initiatives & Activities 5
2013
Q1
Merger and Conversion with Northwest Commercial Bank $65 million
Q2
Central Valley Bank Subsidiary Consolidation
Q3
Merger with Valley Community Bancshares, Inc. (Valley Bank) $237 million
Q4
Core System Conversion
Valley Bank Conversion
Closed 3 Heritage Bank Branches
Consolidated 4 of 8 Valley Bank Branches
Announced WBCO Merger
2014
Q1
Continued Integration of 2013 Acquired Banks
Q2
Merger with Washington Banking Company (Whidbey Island Bank)
Q4
System Conversion for Legacy Whidbey systems |
 Washington
State Economy 6
Major U.S. Industries Located in Washington
Microsoft, Amazon, Boeing, Starbucks, Costco, Nordstrom, Expeditors International,
Weyerhaeuser, PACCAR, T-Mobile, Nintendo, Russell Investments
Unemployment:
Washington State at a 6 year low of 5.8% in June compared to national average of 6.1%
Seattle-Bellevue-Everett unemployment rate of 4.8%
Housing:
Seattle area home prices up 24% from lows in November 2011 |
 7
Company Overview
WBCO Merger
Financial Review
Strategic Initiatives |
 Merger
Summary 8
Heritage Financial Corporation / Heritage Bank
Will do business as “Whidbey Island Bank”
on Whidbey Island
Olympia, Washington
HFWA:
Brian Vance (CEO), Jeff Deuel (COO), Don Hinson (CFO) and Dave Spurling (CCO)
WBCO:
Bryan McDonald (CLO), Ed Eng (CAO) and Lynn Garrison (HR)
8 directors from HFWA / 7 directors from WBCO (including Chairman)
May 1, 2014
54% HFWA / 46% WBCO
Shares outstanding of 30.2 million
Fixed exchange ratio of 0.8900x HFWA shares and $2.75 in cash per WBCO share
Transaction value of $17.13 per share
Name
Headquarters
Management
Closed
Ownership
Consideration
Board Composition
Shares Outstanding |
 Financial Impact
& Key Assumptions at Announcement 9
Financially
Compelling
EPS
accretion
of
approximately
13%
in
2014
and
approximately
24%
in
2015
(1)(2)
Tangible
book
value
per
share
dilution
of
approximately
12.8%
at
closing
Payback
period
of
approximately
2.0
years
based
on
incremental
earnings
method
(3)
Payback
period
of
approximately
4.9
years
based
on
traditional
EPS
method
(4)
IRR of ~18.0%
Pro
forma
ROAA
above
1.00%
and
ROATCE
above
10.0%
(2)
Strong
pro
forma
capital
position
–
TCE
ratio
and
leverage
ratio
above
9.0%
and
10.0%
respectively
Source: SNL Financial, financial data as of 9/30/2013
Note: All information as of 10/23/2013 announcement
(1) Mean EPS estimate for 2014 per SNL FactSet research. EPS estimate in 2015 based on 7.50%
long-term growth rate (2) EPS accretion in 2014 and 2015 excludes non-recurring
merger related costs (3) Payback period based on the number of years its takes to
eliminate the tangible book value per share dilution with the estimated incremental
after-tax earnings per share provided by WBCO divided by pro forma fully diluted HFWA shares
outstanding
(4) Payback period based on the number of years its takes to eliminate the tangible book value
per share dilution with the estimated pro forma HFWA EPS accretion
(5) Excludes additional core deposit intangible asset amortization expense and changes in FDIC
clawback liability Key
Assumptions
Gross credit mark write-down of approximately $26.7 million, or 3.04% of originated
loans Cost savings of approximately 10% of combined company non-interest expense,
or 20% of standalone
(5)
Cost
savings
is
50%
phased-in
by
2014,
100%
phased-in
by
2015
(5)
After-tax one-time merger cost of $11.9 million
Several areas of opportunity for revenue synergies, but none included in the modeling
No expected branch consolidation |
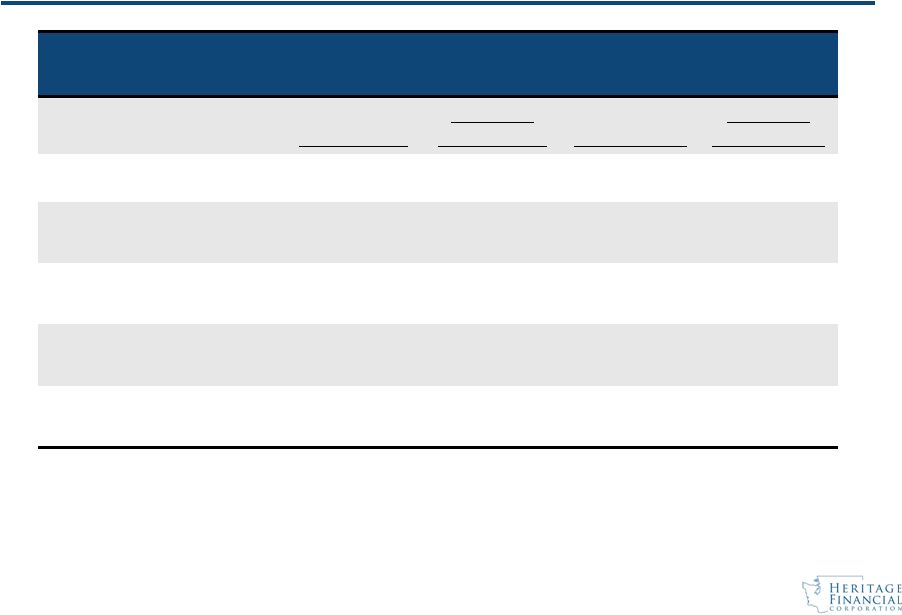
 10
As of and for the Quarter Ending
June 30, 2013
Dec 31, 2013
June 30, 2014
YOY %
Change
Total Assets
$1,425,635
$1,659,038
$3,391,579
138%
Total Deposits
$1,196,531
$1,399,189
$2,866,542
140%
Number of Branches
34
35
67
97%
Deposits per Branch
$35,192
$39,977
$42,784
22%
Number of FTE
361
373
809
124%
Tang. Common Equity to
Tang. Assets
13.2%
11.3%
9.8%
N/A
Resulting Company
Dollars in thousands |
 11
Adjusted Metrics
Three Months Ended
Mar 31, 2014
Adjusted*
Mar 31, 2014
June 30, 2014
Adjusted*
June 30, 2014
Diluted EPS
$ 0.16
$ 0.21
$ 0.16
$ 0.31
Efficiency ratio
77.6%
73.4%
80.9%
64.9%
Overhead Ratio**
3.58%
3.38%
3.84%
3.08%
Return on Assets
0.62%
0.82%
0.59%
1.13%
Return on Equity
4.74%
6.22%
4.49%
8.54%
* Adjusted amounts exclude effects of expenses related to implementing 2013/2014
strategic initiatives, including the merger with Washington Banking Company. These
expenses are identifiable costs paid to third-party providers as well as any
retention bonuses or severance payments made in conjunction with these initiatives.
**
Overhead
ratio
is
the
ratio
of
noninterest
expense
to
average
total
assets. |
 Overview
12
Company Overview
WBCO Merger
Financial Review
Strategic Initiatives |
 13
Financial Statistics
Three Months Ended
Earnings:
June 30, 2013
Sept 30, 2013
Dec 31, 2013
Mar 31, 2014
June 30, 2014
Net interest Income
$ 15,940
$ 17,581
$ 17,646
$ 16,741
$ 28,596
Provision for (reversal of)
loan losses on noncovered
loans
209
875
200
(21)
370
Provision for loan losses on
covered loans
1,099
203
228
479
321
Noninterest income
2,357
2,582
2,429
2,307
4,780
Noninterest expense
13,007
14,285
18,505
14,779
26,995
Net income
2,690
3,290
710
2,543
4,147
Diluted EPS
0.18
0.20
0.04
0.16
0.16
Financial Ratios:
Return on average assets
0.75%
0.80%
0.17%
0.62%
0.38%
Return on average equity
5.33%
6.05%
1.30%
4.74%
2.92%
Efficiency ratio
71.1%
70.9%
92.2%
77.6%
80.9%
Net interest margin
4.82%
4.67%
4.58%
4.48%
4.54%
Dollars in thousands except per share amounts |
 14
Financial Statistics
As of Period End
Balance Sheet:
June 30, 2013
Sept 30, 2013
Dec 31, 2013
Mar 31, 2014
June 30, 2014
Total assets
$ 1,425,635
$ 1,674,714
$ 1,659,038
$ 1
,662,473
$ 3,391,579
Loans, including covered loans
1,086,453
1,208,082
1,203,096
1,207,650
2,200,711
Investment securities
156,233
202,339
199,288
178,002
691,245
Deposits
1,196,531
1,425,985
1,399,189
1,404,214
2,866,542
Total equity
200,525
216,595
215,762
216,417
449,829
Financial Measures:
Tang. book value per common share
$ 12.26
$
11.44
$ 11.40
$ 11.45
$ 10.57
Tang. common equity to tang. assets
13.2%
11.3%
11.3%
11.5%
9.8%
Net loans to deposits
90.8%
84.7%
86.0%
86.0%
77.0%
Deposits per branch
$ 35,192
$ 33,952
$ 39,977
$ 39,006
$ 42,784
Assets per FTE
3,949
4,035
4,448
4,644
4,192
Credit Quality Metrics:
ALLL on noncovered loans to total
noncovered loans
2.19%
1.95%
1.94%
1.94%
1.08%
Nonperforming noncovered loans to
total noncovered loans
1.21%
1.01%
0.66%
0.98%
0.66%
Nonperforming noncovered assets to
total noncovered assets
1.19%
0.90%
0.76%
0.97%
0.58%
Dollars in thousands except per share amounts |
 15
Loan Composition
As of Period End
March 31, 2014
June 30, 2014
Loan Composition:
Balance
% of Total
Balance
% of Total
Noncovered Loans:
Commercial business:
Commercial and industrial
$ 333,216
28.3%
$ 534,458
25.8%
Owner-occupied commercial real estate
277,652
23.6%
473,603
22.9%
Non-owner occupied commercial real estate
405,848
34.4%
637,067
30.7%
Total commercial business
1,016,716
86.3%
1,645,128
79.4%
One-to-four family residential
43,613
3.7%
86,422
4.2%
Total real estate construction and land dev
74,763
6.3%
130,029
6.3%
Consumer
43,093
3.7%
210,230
10.1%
Gross noncovered loans
1,178,185
100%
2,071,809
100%
Total loans, net of deferred fees
$ 1,237,037
$ 2,229,194
Dollars in thousands |
 16
Deposit Composition
As of Period End
March 31, 2014
June 30, 2014
Deposit Composition:
Balance
% of Total
Balance
% of Total
Noninterest demand deposits
$ 353,043
25.1%
$ 669,017
23.3%
NOW accounts
350,182
24.9%
723,889
25.3%
Money market accounts
235,541
16.8%
510,374
17.8%
Savings accounts
167,988
12.0%
342,605
11.9%
Total non-maturity deposits
1,106,754
78.8%
2,245,885
78.3%
Certificates of deposit
297,460
21.2%
620,657
21.7%
Total deposits
$ 1,404,214
100.0%
$ 2,866,542
100.0%
Dollars in thousands |
 Total Risk
Based Capital Tangible Common
Equity/Tangible Assets
17
Capital Measures |
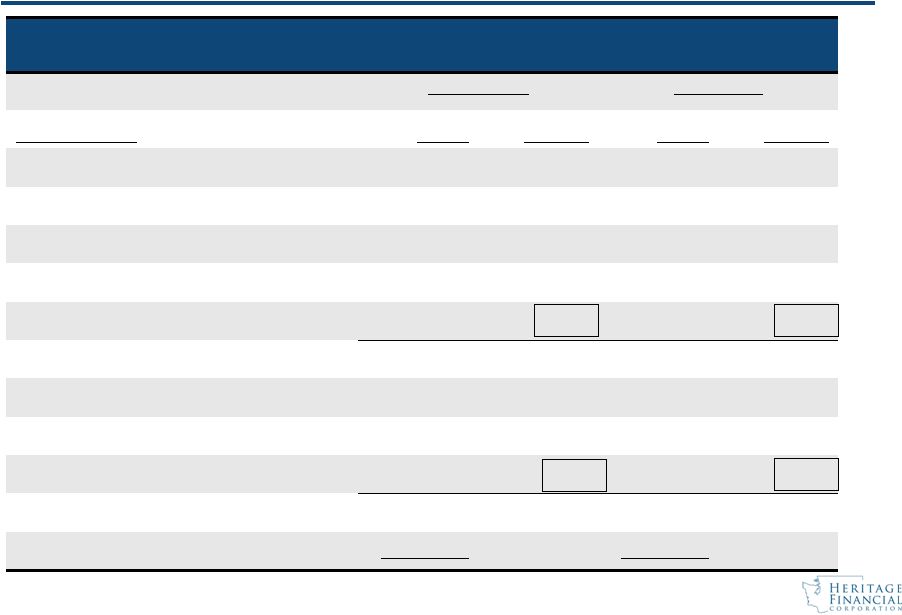
 18
Cash Dividends
2012
2013
2014
Q1
Q2
Q3
Q4
Q1
Q2
Q3
Q4
Q1
Q2
Q3
Regular
Dividend
$.06
$.08
$.08
$.08
$.08
$.08
$.08
$.08
$.16*
-
$.09
Special
Dividend
-
$.20
-
$.30
-
$.10
-
-
-
-
-
* The dividends for Q1 2014 consist of a regular quarterly dividend declared on January 29 and
another dividend declared on March 27. The March 27 dividend is the dividend regularly
declared in April for Q2, but was declared one month in advance as a result of the
anticipated merger with Washington Banking Company. |
 Overview
19
Company Overview
WBCO Merger
Financial Review
Strategic Initiatives |
 2014/2015
Strategic Initiatives 20
•
Drive growth synergies as a result of the HFWA/WBCO combination
•
Loan growth and “up-market”
relationships
•
Seattle/Bellevue
•
Mortgage Origination
•
SBA Lending
•
Consumer Lending
•
Wealth Management
•
Continue Efficiency Improvements
•
Assets per Employee
•
Efficiency Ratio
•
Non-Interest Expense/Average Assets |
 2014/2015
Strategic Initiatives 21
•
Successful Conversion of WBCO Customers
•
Achieve announced cost saves and EPS accretion for 2015
•
Capital
•
Dividend payout may exceed 35-40% payout ratio until capital
is normalized.
•
Will consider opportunistic stock buybacks
•
Merger/Acquisitions
•
Priority is integration and conversion of WBCO
•
Continue to have a disciplined M&A strategy |
 Investment
Value 22
Heritage offers:
•
A company of scale that will drive greater organic growth and
efficiency improvements
•
An experienced management team
•
A balance sheet poised for growth in the heart of a vibrant
economic region
•
9.8% TCE
•
77% Loan to deposit ratio
•
High quality funding base
•
Operating in a strong growth market footprint |
 23
Questions and Answers |