Attached files
| file | filename |
|---|---|
| 8-K - 8-K - TCF FINANCIAL CORP | a14-10826_28k.htm |
Exhibit 99.1
|
|
TCF Financial Corporation 2014 First Quarter Investor Presentation |

|
|
Cautionary Statements for Purposes of the Safe Harbor Provisions of the Securities Litigation Reform Act Any statements contained in this investor presentation regarding the outlook for the Company’s businesses and their respective markets, such as projections of future performance, guidance, statements of the Company’s plans and objectives, forecasts of market trends and other matters, are forward-looking statements based on the Company’s assumptions and beliefs. Such statements may be identified by such words or phrases as “will likely result,” “are expected to,” “will continue,” “outlook,” “will benefit,” “is anticipated,” “estimate,” “project,” “management believes” or similar expressions. These forward-looking statements are subject to certain risks and uncertainties that could cause actual results to differ materially from those discussed in such statements and no assurance can be given that the results in any forward-looking statement will be achieved. For these statements, TCF claims the protection of the safe harbor for forward-looking statements contained in the Private Securities Litigation Reform Act of 1995. Any forward-looking statement speaks only as of the date on which it is made, and we disclaim any obligation to subsequently revise any forward-looking statement to reflect events or circumstances after such date or to reflect the occurrence of anticipated or unanticipated events. Certain factors could cause the Company’s future results to differ materially from those expressed or implied in any forward-looking statements contained herein. These factors include the factors discussed in Part I, Item 1A of the Company’s Annual Report on Form 10-K for the year ended December 31, 2013, under the heading “Risk Factors,” the factors discussed below and any other cautionary statements, written or oral, which may be made or referred to in connection with any such forward-looking statements. Since it is not possible to foresee all such factors, these factors should not be considered as complete or exhaustive. Adverse Economic or Business Conditions; Competitive Conditions; Credit and Other Risks. Deterioration in general economic and banking industry conditions, including those arising from government shutdowns, defaults, anticipated defaults or rating agency downgrades of sovereign debt (including debt of the U.S.), or continued high rates of or increases in unemployment in TCF’s primary banking markets; adverse economic, business and competitive developments such as shrinking interest margins, reduced demand for financial services and loan and lease products, deposit outflows, deposit account attrition or an inability to increase the number of deposit accounts; customers completing financial transactions without using a bank; adverse changes in credit quality and other risks posed by TCF’s loan, lease, investment and securities available for sale portfolios, including declines in commercial or residential real estate values, changes in the allowance for loan and lease losses dictated by new market conditions or regulatory requirements, or the inability of home equity line borrowers to make increased payments caused by increased interest rates or amortization of principal; deviations from estimates of prepayment rates and fluctuations in interest rates that result in decreases in value of assets such as interest-only strips that arise in connection with TCF’s loan sales activity; interest rate risks resulting from fluctuations in prevailing interest rates or other factors that result in a mismatch between yields earned on TCF’s interest-earning assets and the rates paid on its deposits and borrowings; foreign currency exchange risks; counterparty risk, including the risk of defaults by our counterparties or diminished availability of counterparties who satisfy our credit quality requirements; decreases in demand for the types of equipment that TCF leases or finances; the effect of any negative publicity. Legislative and Regulatory Requirements. New consumer protection and supervisory requirements and regulations, including those resulting from action by the Consumer Financial Protection Bureau and changes in the scope of Federal preemption of state laws that could be applied to national banks and their subsidiaries; the imposition of requirements that adversely impact TCF’s lending, loan collection and other business activities as a result of the Dodd-Frank Act, or other legislative or regulatory developments such as mortgage foreclosure moratorium laws, use by municipalities of eminent domain on underwater mortgages, or imposition of underwriting or other limitations that impact the ability to use certain variable-rate products; changes affecting customer account charges and fee income, including changes to interchange rates; changes to bankruptcy laws which would result in the loss of all or part of TCF’s security interest due to collateral value declines; deficiencies in TCF’s compliance under the Bank Secrecy Act in past or future periods, which may result in regulatory enforcement action including monetary penalties; increased health care costs resulting from Federal health care reform legislation; regulatory criticism and resulting enforcement actions or other adverse consequences such as increased capital requirements, higher deposit insurance assessments or monetary damages or penalties; heightened regulatory practices, requirements or expectations, including, but not limited to, requirements related to the Bank Secrecy Act and anti-money laundering compliance activity. (continued) |

|
|
Cautionary Statements for Purposes of the Safe Harbor Provisions of the Securities Litigation Reform Act (continued) Earnings/Capital Risks and Constraints, Liquidity Risks. Limitations on TCF’s ability to pay dividends or to increase dividends because of financial performance deterioration, regulatory restrictions or limitations; increased deposit insurance premiums, special assessments or other costs related to adverse conditions in the banking industry, the economic impact on banks of the Dodd-Frank Act and other regulatory reform legislation; the impact of financial regulatory reform, including additional capital, leverage, liquidity and risk management requirements or changes in the composition of qualifying regulatory capital (including those resulting from U.S. implementation of Basel III requirements); adverse changes in securities markets directly or indirectly affecting TCF’s ability to sell assets or to fund its operations; diminished unsecured borrowing capacity resulting from TCF credit rating downgrades and unfavorable conditions in the credit markets that restrict or limit various funding sources; costs associated with new regulatory requirements or interpretive guidance relating to liquidity; regulatory actions or changes in customer opt-in preferences with respect to overdrafts, which may have an adverse impact on TCF’s fee revenue; uncertainties relating to future retail deposit account changes, including limitations on TCF’s ability to predict customer behavior and the impact on TCF’s fee revenues. Supermarket Branching Risk; Growth Risks. Adverse developments affecting TCF’s supermarket banking relationships or any of the supermarket chains in which TCF maintains supermarket branches; costs related to closing underperforming branches; slower than anticipated growth in existing or acquired businesses; inability to successfully execute on TCF’s growth strategy through acquisitions or cross-selling opportunities; failure to expand or diversify TCF’s balance sheet through programs or new opportunities; failure to successfully attract and retain new customers, including the failure to attract and retain manufacturers and dealers to expand the inventory finance business; failure to effectuate, and risks of claims related to, sales and securitizations of loans; risks related to new product additions and addition of distribution channels (or entry into new markets) for existing products. Technological and Operational Matters. Technological or operational difficulties, loss or theft of information (including the loss of account information by, or theft from, third parties such as merchants), cyber-attacks and other security breaches, counterparty failures and the possibility that deposit account losses (fraudulent checks, etc.) may increase; failure to keep pace with technological change. Litigation Risks. Results of litigation, including class action litigation concerning TCF’s lending or deposit activities including account servicing processes or fees or charges, or employment practices, the effect of interchange rate litigation against the Federal Reserve on debit card interchange fees and possible increases in indemnification obligations for certain litigation against Visa U.S.A. and potential reductions in card revenues resulting from such litigation or other litigation against Visa. Accounting, Audit, Tax and Insurance Matters. Changes in accounting standards or interpretations of existing standards; federal or state monetary, fiscal or tax policies, including adoption of state legislation that would increase state taxes; ineffective internal controls; adverse federal, state or foreign tax assessments or findings in tax audits; lack of or inadequate insurance coverage for claims against TCF; potential for claims and legal action related to TCF’s fiduciary responsibilities. |

|
|
$3,136 $2,124 $1,401 $3,457 $6,098 $818 . $18.8 billion national bank holding company headquartered in Minnesota . 42nd largest publicly-traded U.S. based bank holding company by asset size . 381 bank branches in eight states . Over 147,500 small business banking relationships: . 79,200 checking accounts . 68,300 lending relationships . 86% of total assets are loans & leases . Tangible common equity to tangible assets of 8.13%1 . Tangible book value per common share of $9.061 At March 31, 2014 Well-Diversified Earning Asset Portfolio ($ millions) 1 See “Reconciliation of GAAP to Non-GAAP Financial Measures – Tangible Common Equity and Tangible Book Value Per Common Share” slide Leasing & Equipment Finance 20% Inventory Finance 13% Consumer Real Estate and Other 36% Commercial Lending 18% Auto Finance 8% Low Cost Deposit Base $6,146 $810 $5,234 $2,612 Savings 42% Money Market 5% CD’s 18% Checking 35% Securities & Other 5% ($ millions) A Diversified Asset Portfolio Funded by a Low-Cost Deposit Base |

|
|
Progress in Achieving Long Range Business Model Revenues . Some margin compression likely; however, we expect to maintain consistent performance as loan originations remain strong and checking account growth continues Non-interest Expense . Leverage current infrastructure Provision . Anticipate consistent improvement of credit performance 1 Annualized 2 Includes $8.9 million pre-tax expense related to the branch realignment in 4Q13 3 Pre-tax pre-provision profit is calculated as total revenues less non-interest expense Percentage of Total Average Assets Target Actual 1Q141 Actual 4Q131,2 Actual 20132 Net interest income 4.50 % 4.33 % 4.41 % 4.39 % Non-interest income 2.00 2.22 2.30 2.21 Total revenue 6.50 6.55 6.71 6.60 Non-interest expense 4.00 4.67 4.81 4.62 Pre-tax pre-provision profit3 2.50 1.88 1.90 1.98 Provision for credit losses .50 .31 .50 .65 Income before taxes 2.00 1.57 1.40 1.33 Income tax expense .75 .57 .50 .46 ROAA 1.25 % 1.00 % .90 % .87 % |
|
|
As a % of average assets : Net interest income 4.33% 3.05% Non-interest income 2.22% 1.13% Revenue 6.55% 4.18% Pre-tax pre-provision profit 4 1.88% 1.54% Net interest margin 4.66% 3.48% Yield on loans and leases 5.11% 4.77% Yield on securities 2.71% 2.45% Rate on deposits .22% .37% As a % of average assets : Loans and leases 86.5% 64.9% Deposits 78.0% 76.0% Borrowings 8.6% 11.4% Equity 10.7% 11.4% TCF 1Q141 Peer Group2,3 2013 Average . TCF has a higher margin because it has more loans and higher yielding loan and securities portfolios than peers, along with lower rates on deposits . TCF has more fee income due to a large and diversified base of revenue sources Well-positioned in the Banking Industry 1 Annualized 2 All U.S. publicly-traded banks and thrifts, excluding TCF, with total assets between $10 and $50 billion (source: SNL Financial LC; 12/31/2013) 3 Excluding non-recurring items for non-interest income, revenue and pre-tax pre-provision profit, see “Reconciliation of GAAP to Non-GAAP Financial Measures – Revenue Ratios” slide 4 Pre-tax pre-provision profit is calculated as total revenues less non-interest expense |

|
|
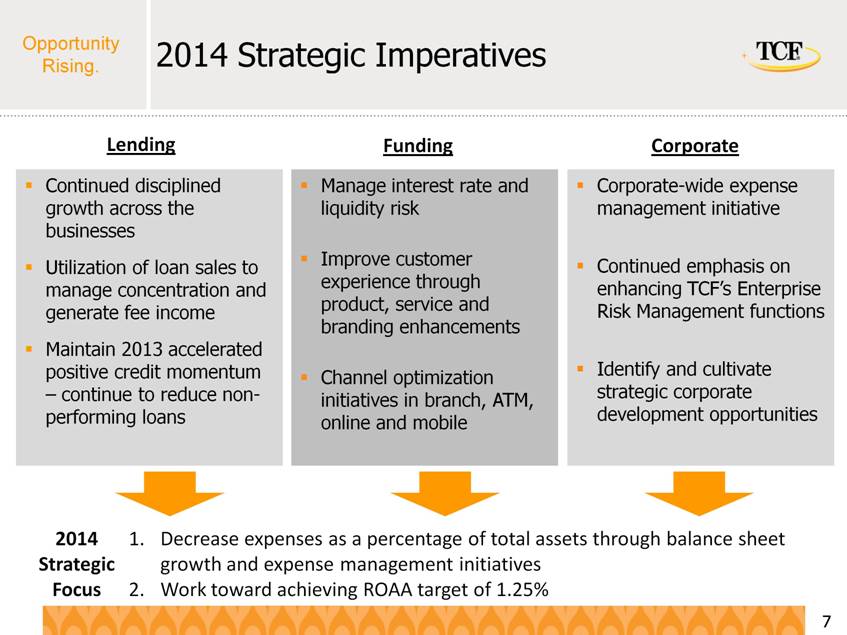
2014 Strategic Imperatives . Continued disciplined growth across the businesses . Utilization of loan sales to manage concentration and generate fee income . Maintain 2013 accelerated positive credit momentum – continue to reduce non-performing loans . Manage interest rate and liquidity risk . Improve customer experience through product, service and branding enhancements . Channel optimization initiatives in branch, ATM, online and mobile . Corporate-wide expense management initiative . Continued emphasis on enhancing TCF’s Enterprise Risk Management functions . Identify and cultivate strategic corporate development opportunities 1. Decrease expenses as a percentage of total assets through balance sheet growth and expense management initiatives 2. Work toward achieving ROA target of 1.25% 2014 Strategic Focus Lending Funding Corporate |
|
|
First Quarter 2014 Highlights vs. First Quarter 2013 50.0% Earnings per common share $.24 Revenue $304.7 million 4.4% 62.2% Non-accrual Loans & Leases $266.7 million 22.3% 15.5% Loan and Lease Originations $3.1 billion Average Deposits $14.5 billion 3.4% Provision for Credit Losses $14.5 million |

|
|
Multiple Sources of Revenue with Strong Asset Yields and Loan Sale Capabilities $199 $202 $200 $202 $201 $93 $100 $106 $105 $104 4.72% 4.72% 4.62% 4.67% 4.66% 3/13 6/13 9/13 12/13 3/14 Net Interest Income Non-interest Income Net Interest Margin1 $292 $302 $305 1 Annualized 2 All U.S. publicly-traded banks and thrifts, excluding TCF, with total assets between $10 and $50 billion (source: SNL Financial LC; 12/31/2013) N.A. Not available 1 ($ millions) $306 $307 Auto $261.7 Other $11.0 Sold $620.1 million of loans for a $20.3 million pre-tax gain 1Q14 Loan & Lease Sales 1Q14 revenue impacted by: . Increased net interest income from prior year due to higher average loan and lease balances as well as decreased rates on various deposit products . Increased sales of loans generating additional gains on sale offsetting seasonality of banking fees 1Q14 net interest margin impacted by: . Continued loan and lease yield compression due to the impact of a lower interest rate environment . Offset by lower average liquidity balances and lower deposit costs Consumer RE & Other $347.4 Loan & Lease Yields1 1Q13 4Q13 1Q14 Consumer Real Estate 5.58 % 5.46 % 5.41 % Auto Finance 5.23 4.64 4.52 Commercial 4.86 4.65 4.63 Leasing & Equipment Finance 5.11 4.89 4.75 Inventory Finance 6.16 5.85 5.98 Total Loans and Leases 5.38 5.17 5.11 Peer Group2 Average 4.83 4.66 N.A. |

|
|
Improving Credit Performance $415 $345 $348 $346 $330 2.66% 2.21% 2.23% 2.18% 2.04% 0.00% 1.00% 2.00% 3.00% 4.00% 5.00% 6.00% 100 200 300 400 500 3/13 6/13 9/13 12/13 3/14 Non-accrual Loans & Leases Other Real Estate Owned NPAs / Loans & Leases $312 $328 $288 $285 $246 16% 17% 14% 14% 12% 0% 10% 20% 30% 40% 0 100 200 300 400 500 3/13 6/13 9/13 12/13 3/14 Classified Assets as a % of Tier 1 Capital & ALLL ($ millions) 60+ Day Delinquencies1 1 Excludes acquired portfolios and non-accrual loans 2 Annualized 3 Loans and leases that management has concerns regarding the ability of the borrowers to meet existing loan or lease terms and conditions, but may never become non-performing or result in a loss .53% .52% .25% .19% .19% 0.00% 0.25% 0.50% 0.75% 3/13 6/13 9/13 12/13 3/14 $38 $33 $25 $23 $14 1.06% 0.70% 0.71% 0.76% 0.43% 0.00% 0.50% 1.00% 1.50% 2.00% 0 10 20 30 40 50 3/13 6/13 9/13 12/13 3/14 Provision Net charge-offs 2 Classified Assets3 Non-Performing Assets ($ millions) Provision for Loan Losses ($ millions) |

|
|
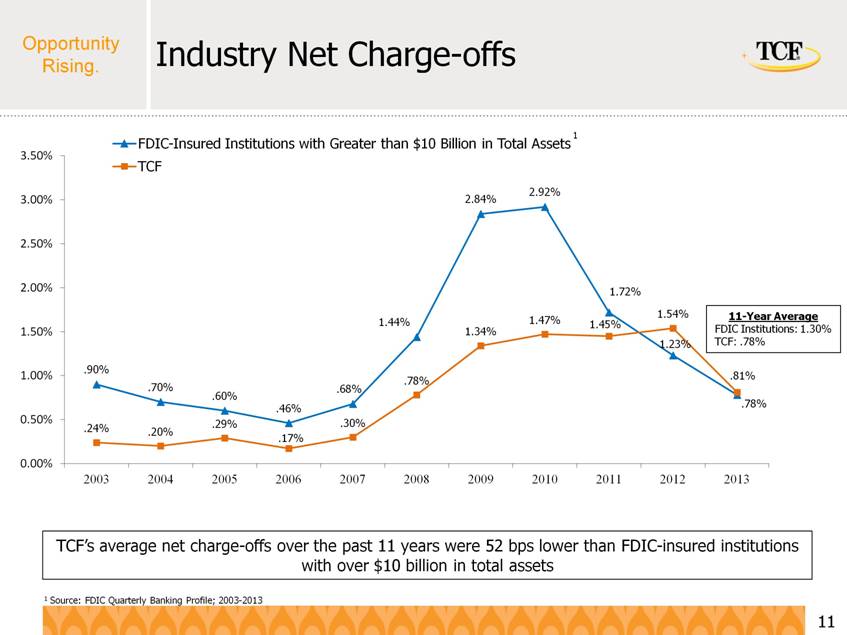
Industry Net Charge-offs .90% .70% .60% .46% .68% 1.44% 2.84% 2.92% 1.72% 1.23% .78% .24% .20% .29% .17% .30% .78% 1.34% 1.47% 1.45% 1.54% .81% 0.00% 0.50% 1.00% 1.50% 2.00% 2.50% 3.00% 3.50% 2003 2004 2005 2006 2007 2008 2009 2010 2011 2012 2013 FDIC-Insured Institutions with Greater than $10 Billion in Total Assets TCF TCF’s average net charge-offs over the past 11 years were 52 bps lower than FDIC-insured institutions with over $10 billion in total assets 11-Year Average FDIC Institutions: 1.30% TCF: .78% |
|
|
Actively Manage Expense Base $204 $209 $212 $220 $217 0 50 100 150 200 250 3/13 6/13 9/13 12/13 3/14 . Continued expense optimization expected to be achieved by: . Asset growth in national lending businesses . Branch consolidation completed during the first quarter of 2014 . Reduction in foreclosed real estate and other credit costs as property values continue to increase and overall credit improves ($ millions) Other (including FDIC Insurance Premiums, Deposit Premiums & Marketing, and Occupancy & Equipment) Foreclosed Real Estate and Other Credit Costs Compensation & Benefits % of Total Avg Assets1: 4.47% 4.64% 4.82% 4.67% 4.55% 1 Annualized |

|
|
Asset Growth Funded by Deposits . Annualized loan growth of 9.3% during 1Q14 even with $620 million in loan sales . Multiple business segments give TCF options to strategically invest capital in light of competitive environments . Average total deposits, TCF’s primary funding source for asset growth, have increased for fourteen consecutive quarters . Low-cost deposit base with an average rate of .22% for 1Q14 . Checking account attrition down 1.9% in 1Q14 compared to 1Q13 ($ millions) 2012 2013 1Q14 Change from 2013 Cash and Investments $ 1,216 $ 1,009 $ 961 (4.8)% Securities and Loans HFS 728 651 724 11.2% Consumer real estate and Other 6,703 6,366 6,098 (4.2)% Commercial 3,405 3,148 3,136 (0.4)% Leasing and equipment finance 3,198 3,429 3,457 0.8% Inventory finance 1,567 1,664 2,124 27.6% Auto finance 553 1,240 1,401 13.0% Total loans and leases 15,426 15,847 16,216 2.3% All other assets 856 873 860 (1.5)% Total assets $ 18,226 $ 18,380 $ 18,761 2.1% Checking $ 4,835 $ 4,981 $ 5,234 5.1% Savings 6,104 6,194 6,146 (0.8)% Money market 821 832 810 (2.6)% Certificates of deposit 2,291 2,426 2,612 7.7% Total deposits 14,051 14,433 14,802 2.6% Borrowings 1,934 1,488 1,450 (2.6)% Other liabilities 365 494 487 (1.4)% Equity 1,876 1,965 2,022 2.9% Total liabilities and equity $ 18,226 $ 18,380 $ 18,761 2.1% |

|
|
. Indirect auto finance company headquartered in Anaheim, CA . Originates and services used and new retail auto loans acquired from franchised and independent dealers across the country . Experienced and seasoned management team . Over 8,800 active dealer relationships . Originating loans to consumers in 48 states . Managed portfolio of $2.7 billion . Loan sales of $261.7 million in 1Q14 resulting in gains of $8.8 million $720 $882 $1,069 $1,239 $1,401 457 507 557 623 664 0 250 500 750 1,000 1,250 1,500 3/13 6/13 9/13 12/13 3/14 Auto Finance # of employees At March 31, 2014 1 Excludes loans held for sale 2 Annualized (Balances in $ millions) Total Originations: $3631 $3871 $528 $534 $610 Retail Businesses $7,156 $6,895 $6,675 $6,339 $6,076 0 1,000 2,000 3,000 4,000 5,000 6,000 7,000 8,000 12/10 12/11 12/12 12/13 3/14 First Mortgages Junior Liens . 57% fixed-rate, 43% variable-rate . Yields2: 5.63% fixed-rate, 5.13% variable-rate . Average FICO score of the retail lending operation: . At origination – 731; updated 1Q14 – 728 . Loan sales of $347.4 million in 1Q14 resulting in gains of $11.7 million . Total HELOC balance of $2.1 billion with only 10% reaching maturity or draw period end prior to 2021 Auto Finance Consumer 32% 31% 36% 41% 40% 68% 69% 59% 64% 60% |

|
|
Retail Businesses Used Car 76% New Car 24% First Mortgages 61% Junior Liens 39% Other 20% Consumer Real Estate . 5.41% quarterly average yield1 . Over 60-day delinquency rate of .41%2 . Net charge-offs: 2012 2013 1Q141 2.65% 1.38% 0.80% . 42% of loan balances originated since January 1, 2009, with 1Q14 net charge-offs of .10%1 Auto $1.4 Billion (9%) Consumer RE & Other $6.1 Billion (38%) . 4.52% quarterly average yield1 . Over 60-day delinquency rate of .11%2 . Net charge-offs: 2012 2013 1Q141 .38% .52% .69% . Sell lower FICO score loans, but retain servicing of loans sold 1 Annualized 2 Excludes non-accrual loans and acquired loans At March 31, 2014 |

|
|
$3,646 $3,449 $3,405 $3,148 $3,136 2,000 2,500 3,000 3,500 4,000 12/10 12/11 12/12 12/13 3/14 (Balances in $ millions) At March 31, 2014 . 49% fixed-rate, 51% variable-rate . CRE location mix: 90% located in TCF banking markets, 10% outside . Continue to look for strategic expansion opportunities that fit TCF’s profile 1 Includes operating leases of $80.7 million at March 31, 2014 $3,232 $3,212 $3,281 $3,506 $3,537 0 1,000 2,000 3,000 4,000 12/10 12/11 12/12 12/13 3/14 Core Portfolio Acquired Portfolio 1 $792 $625 $1,567 $1,664 $2,124 0 500 1,000 1,500 2,000 2,500 12/10 12/11 12/12 12/13 3/14 Other Electronics & Appliances Lawn & Garden Powersports . 15th largest bank-affiliated leasing company and 30th largest equipment finance/leasing company in the U.S. . Experienced and seasoned management team . 399 employees . Uninstalled backlog of $461 million . Experienced and seasoned management . Operates in the U.S. and Canada . 239 employees . 100% variable-rate receivables Wholesale Businesses Leasing & Equipment Finance Commercial Inventory Finance |

|
|
Wholesale Businesses Specialty Vehicles 25% Manufact. 11% Medical 11% Other 41% Multi-family 30% Retail Services 16% Office Buildings 11% Industrial Buildings 10% Business 14% Other 19% Const. 12% Other 20% Lawn & Garden 27% Electronics & Appliances 3% Other 22% PowerSports 48% Leasing & Equipment Finance $3.5 Billion (21%) . 4.63% quarterly average yield1 . Over 60-day delinquency rate of .06%2 . Net charge-offs: 2012 2013 1Q141 1.12% .80% .19% . Working to maintain relationships with current customers, while selectively choosing loans based on price and risk Commercial Banking $3.1 Billion (19%) Inventory Finance $2.1 Billion (13%) . 4.75% quarterly average yield1 . Over 60-day delinquency rate of .08%2 . Net charge-offs: 2012 2013 1Q141 .32% .10% .09% . 1Q14 fee revenue of $22.3 million, 21.6% of total fees and other revenue . 5.98% quarterly average yield1 . Over 60-day delinquency rate of .012 . Net charge-offs/(recoveries): 2012 2013 1Q141 .10% .04% (.03)% . Credit risk spread across more than 9,400 active dealers 1 Annualized 2 Excludes non-accrual loans and acquired loans At March 31, 2014 |
|
|
Loan and Lease Balance Rollforward1 ($ millions) 1Q13 1Q14 Change Period Beginning Balance $15,436 $15,927 $491 New Volume 2,725 3,147 422 Less Run-off 2 2,057 2,124 67 Subtotal 668 1,023 355 Annual Growth Rate 3 17% 26% Less Loan & Lease Sales 470 620 150 Period Ending Balance $15,634 $16,330 $696 1Q14 vs. 1Q13 Volume Sales Consumer Real Estate $(16) $68 Auto Finance 186 82 Total Retail 170 150 Commercial 115 - Leasing 33 - Inventory Finance 4 104 - Total Wholesale 252 - Total Lending $422 $150 Change in Volume & Sales 1 Includes portfolio loans and leases and loans and leases held for sale 2 Includes activity from payments, pre-payments and charge-offs 3 Excludes loan and lease sales 4 Origination levels impacted by the high velocity of fundings and repayments with dealers . Continued strong origination capabilities . Diversity across asset classes reduces concentration risk . Originate to sell capability a core competency . Capacity for earning asset growth Loan and lease origination opportunities continue ($ millions) |

|
|
Well-positioned for a Rising Interest Rate Environment 40% 37% 23% Earning Assets-1Q14 Variable & Adjustable Rate (Inventory Finance, Commercial, Consumer) Fixed Rate - Short/Medium Duration (Commercial, Leasing, Auto Finance) Fixed Rate - Long Duration (MBS Investments, Consumer Real Estate) 52% 19% 29% Deposits-1Q14 Low Interest Cost No Interest Cost Other . Diversification of the loan and lease portfolio among the five businesses positions TCF to benefit in a rising rate environment . 77% of assets are variable/adjustable rate or short/medium duration fixed rate . Estimated weighted average life1: . Auto portfolio: 23 months . Auto Finance new originations: 27 months . Leasing and Equipment Finance portfolio: 19 months . Leasing and Equipment Finance new originations: 23 months . 71% of deposits are low or no interest cost with an average balance of $10.3 billion and an average cost of 5 bps for the first quarter of 2014 1 As of March 31, 2014; weighted average life represents how many months it will take to collect half of the outstanding principal |

|
|
Branch Footprint At March 31, 2014 99 25 53 36 7 158 1 2 MN IL MI CO WI AZ IN SD TCF Traditional 45 37 51 34 17 7 - 2 193 In-store 50 118 1 2 8 - 1 - 180 Campus 4 3 1 - - - - - 8 Total 99 158 53 36 25 7 1 2 381 ATMs 218 235 74 39 27 7 1 2 603 Consolidated 46 branches in the first quarter of 2014 Highlights of the Branch Consolidation . Estimated payback period on the exit costs of $8.9 million improved to 10 months . Checking account attrition is 30% lower than planned . Deposit run-off is 24% lower than planned . A significant number of impacted employees transferred to another branch |

|
|
Sufficient Capital Levels for Growth Strategy 1 See “Reconciliation of GAAP to Non-GAAP Financial Measures – Tangible Common Equity and Tangible Book Value Per Common Share” slide 2 See “Reconciliation of GAAP to Non-GAAP Financial Measures – Tier 1 Common Capital Ratio” slide 1Q13 4Q13 1Q14 Tangible common equity1 7.57% 8.03% 8.13% Tier 1 common capital2 9.24% 9.63% 9.59% Tier 1 leverage capital 9.23% 9.71% 9.84% Tier 1 risk-based capital2 11.14% 11.41% 11.37% Total risk-based capital 13.49% 13.64% 13.41% Capital Ratios – TCF Financial Corporation . Maintaining capital levels as earnings support strong balance sheet growth |
|
|
Appendix |

|
|
Stock Performance $9 $10 $11 $12 $13 $14 $15 $16 $17 12/31/2011 3/31/2012 6/30/2012 9/30/2012 12/31/2012 3/31/2013 6/30/2013 9/30/2013 12/31/2013 |

|
|
Loan and Lease Diversification Business Unit Consumer Commercial Leasing and Equipment Finance Inventory Finance Auto Finance Type / Segment Consumer Real Estate Multi-family housing Retail services Office buildings Warehouse / Industrial buildings Specialty vehicles Manufacturing Medical Construction PowerSports Lawn & Garden Electronics & Appliances Primarily used autos Geography Local1 National Local1 National National Canada National Rate Fixed-rate Variable-rate Fixed-rate Variable/adjustable- rate Fixed-rate Variable-rate Fixed-rate Average Loan & Lease Size First Mortgages: $111,000 Junior Liens: $41,000 $1.8 million $70,000 $224,000 $18,000 Estimated Weighted Average Life2 70 months 34 months 19 months 4 months 23 months Collateral Real estate Real estate All assets Equipment Inventory Vehicle TCF maintains a well-diversified loan and lease portfolio 1 TCF’s branch footprint (MN, IL, MI, CO, WI, IN, AZ, SD) 2 As of March 31, 2014; weighted average life represents how many months it will take to pay half of the outstanding principal |

|
|
Loan and Lease Geographic Diversification Minnesota $ 2,175.3 $ 842.1 $ 99.6 $ 65.5 $ 28.3 $ 10.1 $ 3,220.9 Illinois 1,747.5 590.9 115.6 57.7 78.1 5.2 2,595.0 Michigan 617.9 512.5 142.4 67.9 25.3 2.1 1,368.1 California 379.9 38.0 492.3 69.5 270.3 -- 1,250.0 Wisconsin 351.1 594.2 67.0 61.1 12.9 1.2 1,087.5 Colorado 446.8 157.0 56.8 23.8 29.3 3.9 717.6 Texas -- 15.5 301.3 161.8 85.4 -- 564.0 Canada -- -- 1.6 496.4 -- -- 498.0 Florida 1.2 48.0 146.2 85.4 70.2 -- 351.0 New York 2.0 -- 171.9 68.2 50.8 -- 292.9 Ohio 5.0 47.0 135.1 66.2 26.0 -- 279.3 Pennsylvania 17.9 -- 144.7 68.3 46.5 -- 277.4 North Carolina 0.2 8.0 128.0 54.5 52.7 -- 243.4 Arizona 55.4 39.0 72.8 15.8 44.0 0.3 227.3 Other1 $ 275.3 $ 244.2 $ 1,381.5 $ 761.7 $ 580.7 $ (0.2) $ 3,243.2 Total $6,075.5 $3,136.4 $ 3,456.8 $ 2,123.8 $ 1,400.5 $ 22.6 $ 16,215.6 ($ millions) At March 31, 2014 Consumer Real Estate Commercial Real Estate and Commercial Business Leasing and Equipment Finance Inventory Finance Auto Finance Other Total 1 Individual states with less than $225 million in total |
|
|
Commercial Lending – Risk Rating Trends Year Pct of Pass Downgraded To 6+ Pct of 5’s Downgraded To 6+ Pct of 6’s Downgraded To 7 or 8 2012 4% 14% 11% 2013 1% 3% 14% 1Q14 3% 36% 39% Year Pct of 4’s Upgraded To 3+ Pct of 5’s Upgraded To 4+ Pct of Non- Pass Upgraded To Pass 2012 3% 17% 9% 2013 6% 26% 15% 1Q14 4% 13% 52% Upgrade Activity Downgrade Activity . The pace of upgrades has begun to increase. . The pace of downgrades into non-pass continues to decrease. . The weighted average risk rating of the portfolio is improving as more loans are being upgraded, fewer loans are being downgraded and existing problem loans are being worked out. Risk Rating Distribution Dec 31, 2012 Dec 31, 2013 Mar 31, 2014 Risk Rating Regulatory Classification Balance ($000) Pct Total Balance ($000) Pct Total Balance ($000) Pct Total Non-classified 1 Pass - 0.0% - 0.0% - 0.0% 2 Pass 136,550 4.0% 139,127 4.4% 139,374 4.4% 3 Pass 850,431 25.0% 85.1% 850,620 27.0% 92.1% 809,741 25.8% 93.3% 4 Pass 1,611,759 47.4% 1,552,586 49.4% 1,559,927 49.8% 5 Pass 296,765 8.7% 354,594 11.3% 417,271 13.3% 6 Special Mention 153,623 4.5% 53,016 1.7% 58,973 1.9% Classified 7 Substandard 352,538 10.4% 14.9% 196,403 6.2% 7.9% 149,326 4.8% 6.7% 8 Doubtful 735 0.0% 432 0.0% 450 0.0% Total 3,402,401 100% 3,146,778 100% 3,135,062 100% Wtd Avg Risk Rating 4.16 3.98 3.97 |

|
|
Reconciliation of GAAP to Non-GAAP Financial Measures – Tangible Common Equity and Tangible Book Value Per Common Share1 1 When evaluating capital adequacy and utilization, management considers financial measures such as Tangible Common Equity to Tangible Assets and Tangible Book Value per Common Share. These measures are non-GAAP financial measures and are viewed by management as useful indicators of capital levels available to withstand unexpected market or economic conditions, and also provide investors, regulators, and other users with information to be viewed in relation to other banking institutions. ($000s, except shares outstanding) Mar. 31, 2013 Dec. 31, 2013 Mar. 31, 2014 Computation of tangible common equity to tangible assets Total equity $ 1,900,159 $ 1,964,759 $ 2,021,825 Less: Non-controlling interest in subsidiaries 20,933 11,791 21,284 Total TCF stockholders’ equity 1,879,226 1,952,968 2,000,541 Less: Preferred stock 263,240 263,240 263,240 Goodwill 225,640 225,640 225,640 Other intangibles 7,860 6,326 5,905 Tangible common equity $ 1,382,486 $ 1,457,762 $ 1,505,756 Total assets $ 18,504,026 $ 18,379,840 $ 18,760,527 Less: Goodwill 225,640 225,640 225,640 Other intangibles 7,860 6,326 5,905 Tangible assets $ 18,270,526 $ 18,147,874 $ 18,528,982 Tangible common equity to tangible assets 7.57% 8.03% 8.13% Common stock shares outstanding 163,867,558 165,122,295 166,127,670 Tangible book value per common share $8.44 $8.83 $9.06 |

|
|
Reconciliation of GAAP to Non-GAAP Financial Measures – Revenue Ratios1 1 When evaluating asset utilization, management considers measures related to revenue that adjust for certain operating items. These measures are non- GAAP financial measures and are viewed by management as useful indicators of TCF’s ability to generate returns to cover potential credit losses. 2 All U.S. publicly-traded banks and thrifts, excluding TCF, with total assets between $10 and $50 billion (source: SNL Financial LC; 12/31/2013) ($000s) Peer Group Total Assets 2013 Avg2 % of Total Avg Assets Computation of non-interest income: Total Non-interest income $ 231,714 1.17% Less: Non-recurring revenue 7,661 Non-interest income excluding non-recurring items $ 224,053 1.13% Computation of revenue: Total Revenue $ 838,854 4.22% Less: Non-recurring revenue 7,661 Revenue excluding non-recurring items $ 831,193 4.18% Computation of pre-tax pre-provision profit: Revenue $ 838,854 Less: Non-interest expense 524,894 Non-recurring revenue 7,661 Pre-tax pre-provision profit excluding non-recurring items $ 306,299 1.54% Total Average Assets $ 19,882,841 |

|
|
Reconciliation of GAAP to Non-GAAP Financial Measures – Tier 1 Common Capital Ratio1 ($000s) 1 When evaluating capital adequacy and utilization, management considers financial measures such as the Tier 1 Common Capital Ratio. These measures are non-GAAP financial measures and are viewed by management as useful indicators of capital levels available to withstand unexpected market or economic conditions, and also provide investors, regulators, and other users with information to be viewed in relation to other banking institutions. Dec. 31, 2013 Mar. 31, 2014 Tier 1 risk-based capital ratio: Tier 1 capital $ 1,763,682 $ 1,814,561 Total risk-weighted assets $ 15,455,706 $ 15,959,457 Tier 1 risk-based capital ratio 11.41 % 11.37 % Computation of Tier 1 common capital ratio: Tier 1 capital $ 1,763,682 $ 1,814,561 Less: Preferred stock 263,240 263,240 Qualifying non-controlling interest in subsidiaries 11,791 21,284 Tier 1 common capital 1,488,651 1,530,037 Tier 1 common capital ratio 9.63 % 9.59 % |

|
|
Source References & Footnotes Slide: A Diversified Asset Portfolio Funded by a Low-Cost Deposit Base 42nd largest publicly-traded U.S. based bank holding company – SNL Financial, LC; 12/31/2013 Slide: Well-positioned in the Banking Industry Peer Group – SNL Financial LC; 12/31/2013 Slide: Multiple Sources of Revenue with Strong Asset Yields and Loan Sale Capabilities Peer Group – SNL Financial LC; 12/31/2013 Slide: Industry Net Charge-offs FDIC-Insured Institutions Greater than $10 Billion in Total Assets – FDIC Quarterly Banking Profile; 2003-2013 Slide: Wholesale Businesses 15th largest bank-affiliated leasing company – The Monitor; 2013 Monitor Bank 40 30th largest equipment finance/leasing company – The Monitor; 2013 Monitor 100 |
