Attached files
| file | filename |
|---|---|
| 8-K - FORM 8-K - NTELOS HOLDINGS CORP. | d684703d8k.htm |
| EX-99.1 - EX-99.1 - NTELOS HOLDINGS CORP. | d684703dex991.htm |
 NASDAQ: NTLS
4Q & FY 2013 Earnings
Presentation
February 27, 2014
Exhibit 99.2 |
 Presentation of Financial and Other Important Information
2
NASDAQ: NTLS
USE OF NON-GAAP FINANCIAL MEASURES
Included in this presentation are certain non-GAAP financial measures that are not
determined in accordance with US generally accepted accounting principles
(“GAAP”). These financial performance measures are not indicative of cash provided or used by operating activities and exclude the effects of
certain operating, capital and financing costs and may differ from comparable information
provided by other companies, and they should not be considered in isolation, as an
alternative to, or more meaningful than measures of financial performance determined in accordance with US generally accepted
accounting principles. These financial performance measures are commonly used in the
industry and are presented because NTELOS believes they provide relevant and useful
information to investors. NTELOS utilizes these financial performance measures to assess its ability to meet future capital expenditure
and working capital requirements, to incur indebtedness if necessary, and to fund continued
growth. NTELOS also uses these financial performance measures to evaluate the
performance of its business, for budget planning purposes and as factors in its employee compensation programs. Adjusted
EBITDA is defined as net income attributable to NTELOS Holdings Corp. before interest,
income taxes, depreciation and amortization, accretion of asset retirement
obligations, gain/loss on derivatives, net income attributable to non-controlling interests, other expenses/income, equity based compensation
charges, business separation charges, gain/loss on sale of assets, secondary offering costs
and net loss from discontinued operations and costs related to the separation of the
wireless and wireline companies. Please review the reconciliations and other definitions of non-GAAP financial measures contained in
the press releases filed by the Company with the SEC, including those filed on Form 8-K
on February 28, 2013, May 7, 2013, July 30, 2013, November 5, 2013, January 14, 2014
and February 27, 2014.
SPECIAL NOTE REGARDING FORWARD-LOOKING STATEMENTS
Any statements contained in this presentation that are not statements of
historical fact, including statements about our beliefs and expectations, are forward-
looking statements and should be evaluated as such. The words “anticipates,”
“believes,” “expects,” “intends,” “plans,” “estimates,” “targets,” “projects,”
“should,” “may,” “will” and similar words and expressions are
intended to identify forward-looking statements. Such forward-looking statements reflect,
among other things, our current expectations, plans and strategies, and anticipated
financial results, all of which are subject to known and unknown risks, uncertainties
and factors that may cause our actual results to differ materially from those expressed or implied by these forward-looking statements. Many of
these risks are beyond our ability to control or predict. Because of these risks,
uncertainties and assumptions, you should not place undue reliance on these
forward-looking statements. Furthermore, forward-looking statements speak only as of
the date they are made. We do not undertake any obligation to update or review any
forward-looking information, whether as a result of new information, future events or otherwise. Important factors with respect to any
such forward-looking statements, including certain risks and uncertainties that could
cause actual results to differ from those contained in the forward- looking
statements, include, but are not limited to: our ability to attract and retain retail subscribers to our services; our dependence on our strategic
relationship with Sprint Corporation (“Sprint”); a potential increase in roaming
rates and wireless handset subsidy costs; rapid development and intense competition
in the telecommunications industry; our ability to finance, design, construct and realize the benefits of any planned network technology upgrade;
our ability to acquire or gain access to additional spectrum; the potential to experience a
high rate of customer turnover; the potential for Sprint and others to build networks
in our markets; cash and capital requirements; operating and financial restrictions imposed by our credit agreement; adverse economic
conditions; federal and state regulatory fees, requirements and developments; loss of
ability to use our current cell sites; our continued reliance on indirect channels of
retail distribution; our reliance on certain suppliers and vendors; and other unforeseen difficulties that may occur. These risks and uncertainties
are not intended to represent a complete list of all risks and uncertainties inherent in our
business, and should be read in conjunction with the more detailed cautionary statements and risk factors included in our SEC filings, including our most
recent Annual Report filed on Form 10-K. |
 Agenda NASDAQ: NTLS
3
Jim Hyde, Chief Executive Officer
Steb Chandor, Chief Financial Officer
Conrad Hunter, Chief Operating Officer
Review Financial and Operational Highlights
Guidance Update
Q&A Session |
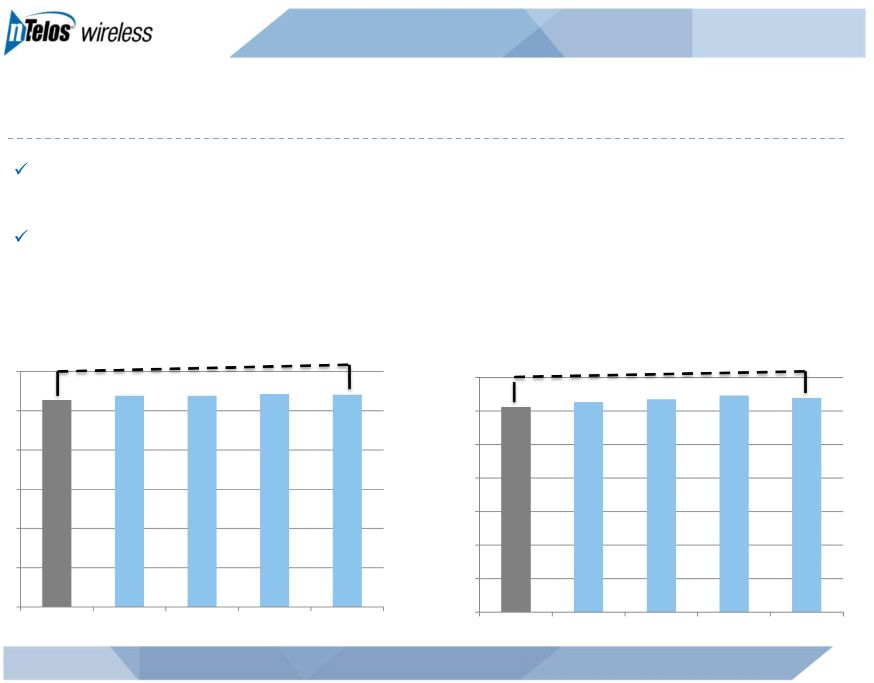
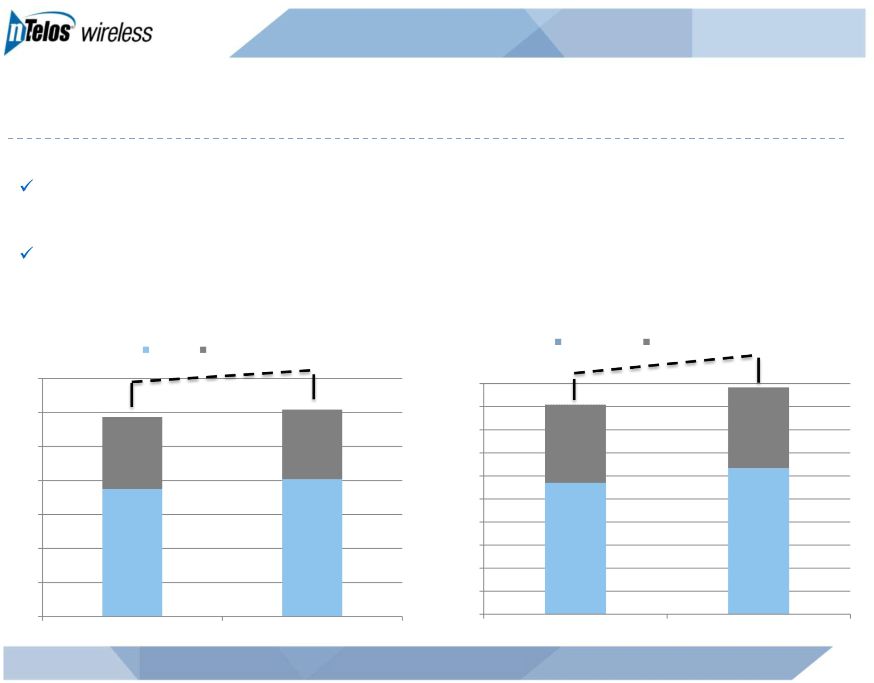 Continuing Growth in Operating
Revenues
4
NASDAQ: NTLS
+4%
4Q13 revenue increased 4% from 4Q12 to $121.8 million
FY 2013 revenue increased 8% from FY 2012 to $491.9 million
millions
millions
+8%
$0.0
$50.0
$100.0
$150.0
$200.0
$250.0
$300.0
$350.0
$400.0
$450.0
$500.0
FY 2012
FY 2013
Retail
Wholesale & Other
$0.0
$20.0
$40.0
$60.0
$80.0
$100.0
$120.0
$140.0
4Q 2012
4Q 2013
Retail
Wholesale & Other |
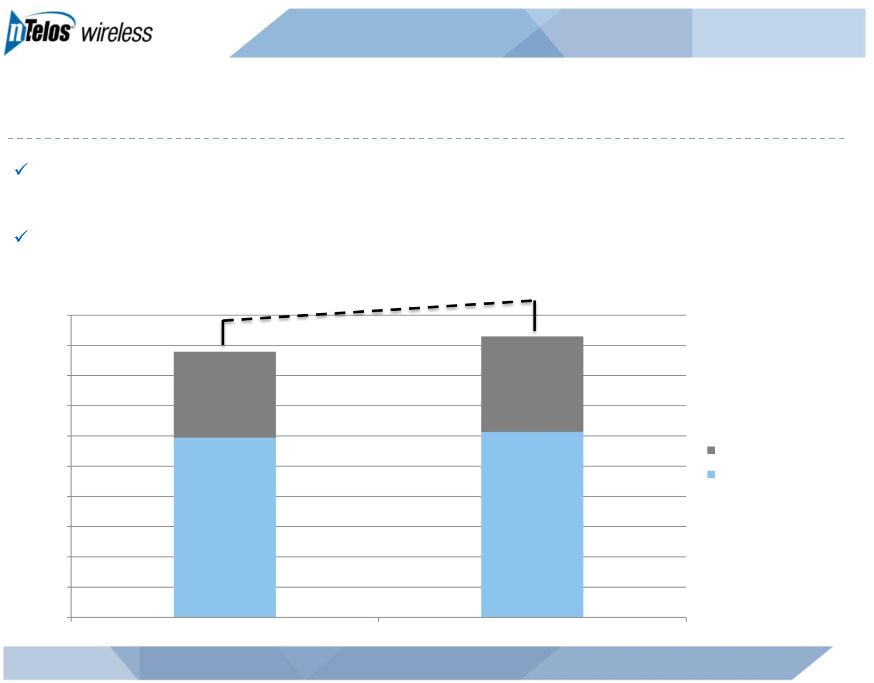
 Retail Revenue Gains Continue
5
NASDAQ: NTLS
millions
4Q13 retail revenue increased 8% from 4Q12 to $80.8 million
FY 2013 retail revenue increased 11% from FY 2012 to $317.1 million
+8%
millions
+11%
$0.0
$10.0
$20.0
$30.0
$40.0
$50.0
$60.0
$70.0
$80.0
$90.0
4Q 2012
4Q 2013
$0.0
$50.0
$100.0
$150.0
$200.0
$250.0
$300.0
$350.0
FY 2012
FY 2013 |
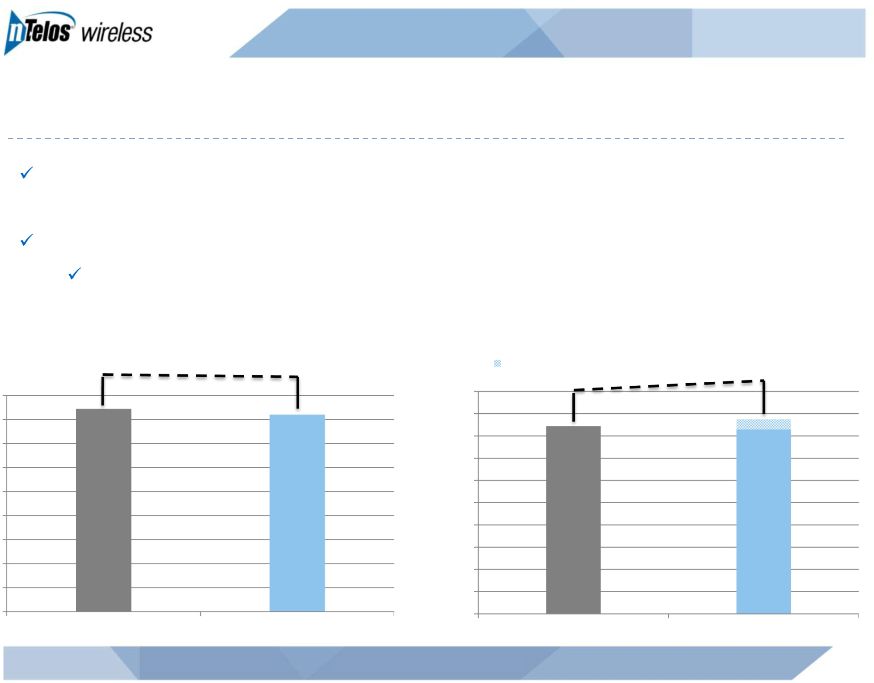 Wholesale/Other Revenue Remains Stable
6
NASDAQ: NTLS
-3%
4Q13 wholesale/other revenue decreased 3% from 4Q12 to $41.0 million
FY 2013 wholesale/other revenue increased 4% from FY 2012 to $174.8 million
Increase reflects incremental revenue recognized from SNA settlement
millions
millions
+4%
$0.0
$5.0
$10.0
$15.0
$20.0
$25.0
$30.0
$35.0
$40.0
$45.0
4Q 2012
4Q 2013
$0.0
$20.0
$40.0
$60.0
$80.0
$100.0
$120.0
$140.0
$160.0
$180.0
$200.0
FY 2012
FY 2013
SNA Settlement |
 Subscribers –
Net Additions Trend
7
NASDAQ: NTLS
Subscribers up 6% year-over year to approximately 464,600
As of December 31, 2013, postpaid made up 66% of subscriber base
+6%
0
50,000
100,000
150,000
200,000
250,000
300,000
350,000
400,000
450,000
500,000
4Q 2012
4Q 2013
Prepaid Subscribers
Postpaid Subscribers |
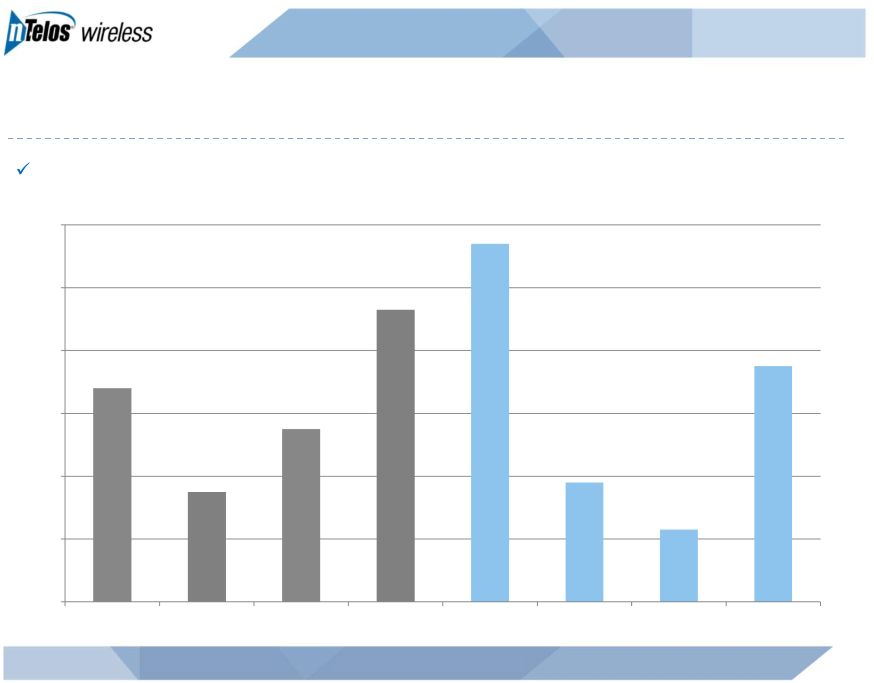 Subscribers –
Net Additions Trend (Continued)
8
NASDAQ: NTLS
Eighth consecutive quarter of positive net adds
6,800
3,500
5,500
9,300
11,400
3,800
2,300
7,500
0
2,000
4,000
6,000
8,000
10,000
12,000
1Q 2012
2Q 2012
3Q 2012
4Q 2012
1Q 2013
2Q 2013
3Q 2013
4Q 2013 |
 Average Revenue Per User
(ARPU) 9
NASDAQ: NTLS
4Q13 Blended ARPU up 3% year-over-year to $54.11
4Q13 Postpaid ARPU up 4% year-over-year to $63.91
+3%
$0.00
$10.00
$20.00
$30.00
$40.00
$50.00
$60.00
$70.00
4Q 2012
1Q 2013
2Q 2013
3Q 2013
4Q 2013
Postpaid ARPU
+4%
$0.00
$10.00
$20.00
$30.00
$40.00
$50.00
$60.00
4Q 2012
1Q 2013
2Q 2013
3Q 2013
4Q 2013
Blended ARPU |
 Operational Expenses
NASDAQ: NTLS
10
($ in millions)
4Q13
4Q12
Cost of sales and services
$51.0
$47.4
Customer operations
$37.5
$30.7
Corporate operations
$8.4
$7.9
Depreciation & Amortization
$17.5
$17.4
$114.4
$103.4
Increase of 11% primarily driven by:
Increased equipment subsidy, retention and network expenses
|
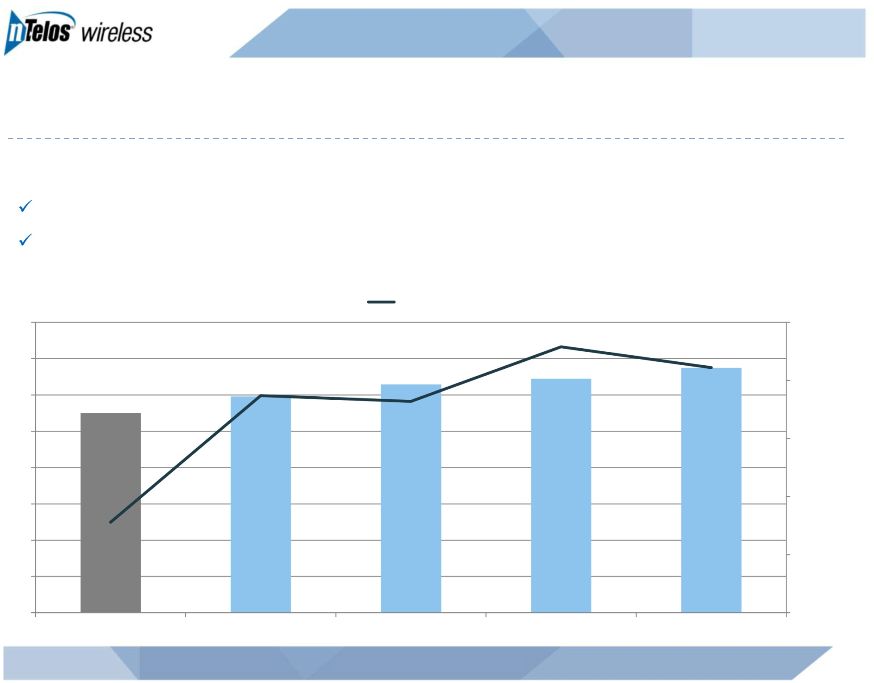
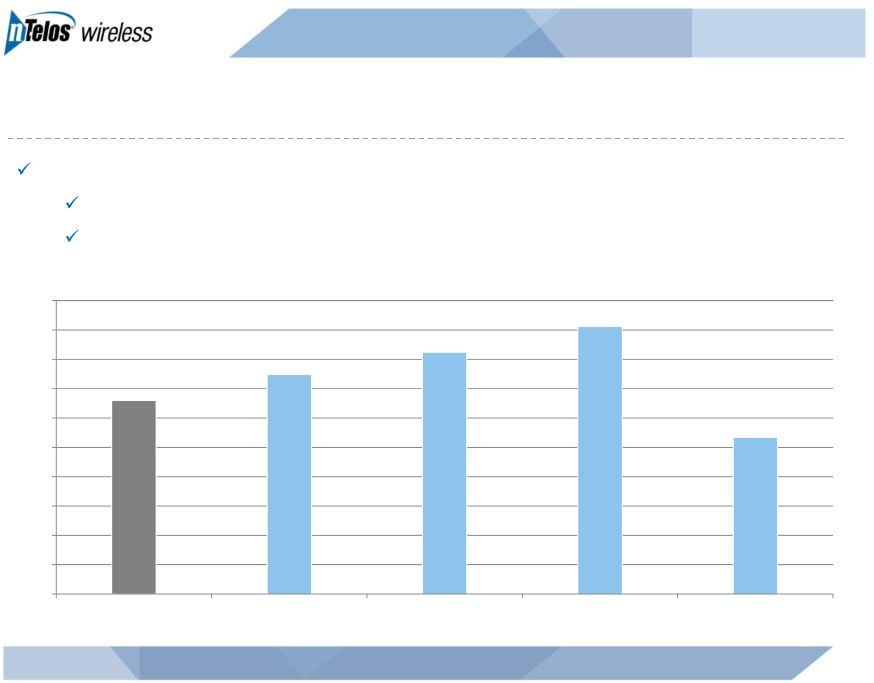 Adjusted EBITDA
11
NASDAQ: NTLS
millions
4Q13 Adjusted EBITDA impacted by:
Cost of sales associated with gross adds during the holiday season
Increased retention costs for subscribers coming out of contract
$33
$37
$41
$46
$27
$0
$5
$10
$15
$20
$25
$30
$35
$40
$45
$50
4Q 2012
1Q 2013
2Q 2013
3Q 2013
4Q 2013 |
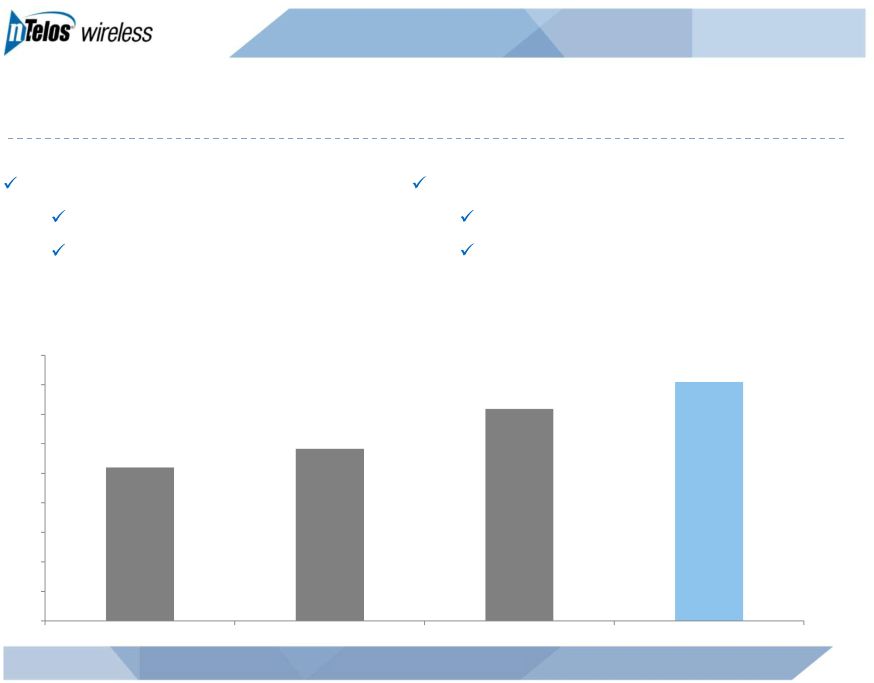 Capital Investment
12
NASDAQ: NTLS
Status:
1,444 cell sites as of Dec. 31, 2013
First LTE markets launched Dec. 2013
millions
Catalysts:
2011-2012 Cell site expansion
2013 Initial LTE deployment
$52
$58
$72
$81
$0
$10
$20
$30
$40
$50
$60
$70
$80
$90
FY 2010
FY 2011
FY 2012
FY 2013 |
 Capitalization Overview
($ in millions)
December 31, 2013
Cash, unrestricted
$88.4
Total Debt
$490.4
Net Debt
$401.9
LTM Adjusted EBITDA
$150.9
Secured Term Loan
$489.4
Net Debt Leverage
2.7x
NASDAQ: NTLS
13
(1)
(1) Net of unamortized debt discount
Term Loan A Refinancing
Completed transaction on February 3, 2014
Upsized from $148.1 million to $188.1 million
Converted into Term B Loans
Priced at LIBOR +475 bps, subject to 1.0% LIBOR floor
Expires November 2019
$533.8 million principal outstanding on Term B Loans post-transaction
Pro forma net debt leverage unchanged at 2.7x |
 Guidance (as of February 27, 2014)
NASDAQ: NTLS
14
Previously provided on January 14, 2014
For the year ended December 31, 2014
Adjusted
EBITDA
of
$140
million
-
$150
million
CapEx of $85 million -
$95 million |
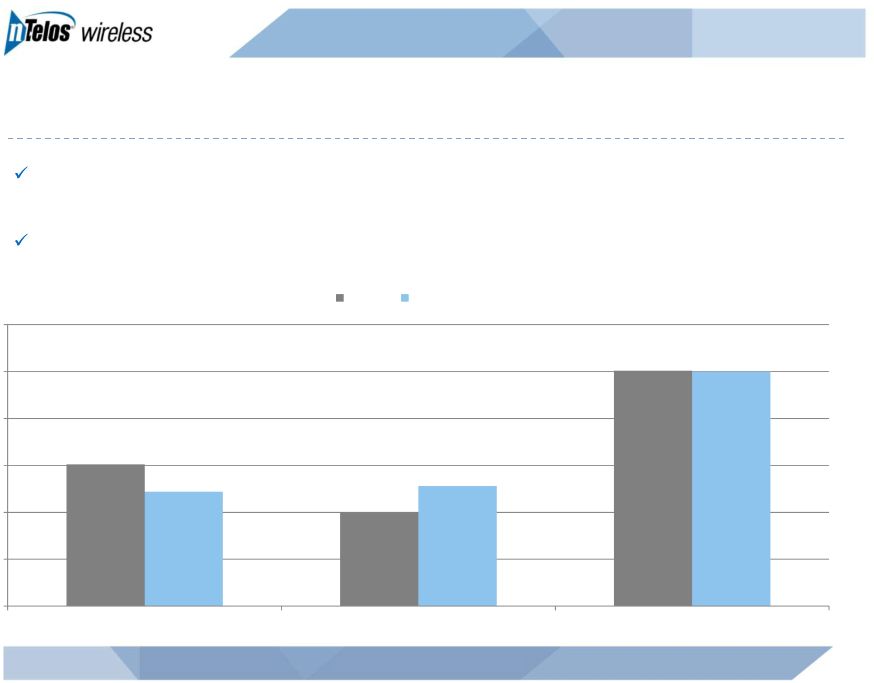 Full Year Net Adds
15
NASDAQ: NTLS
FY 2013 prepaid net adds decreased (2,900) year-over-year
FY 2013 postpaid net adds increased 2,800 year-over-year
15,100
10,000
25,100
12,200
12,800
25,000
0
5,000
10,000
15,000
20,000
25,000
30,000
Prepaid Net Adds
Postpaid Net Adds
Total Net Adds
FY 2012
FY 2013 |
 Smartphone Penetration
16
NASDAQ: NTLS
Smartphone Penetration
ARPU
55%
60%
63%
65%
68%
$52.00
$52.50
$53.00
$53.50
$54.00
$54.50
0%
10%
20%
30%
40%
50%
60%
70%
80%
4Q 2012
1Q 2013
2Q 2013
3Q 2013
4Q 2013
Blended ARPU
As of December 31, 2013:
72% of postpaid subscribers have a smartphone
59% of prepaid subscribers have a smartphone |
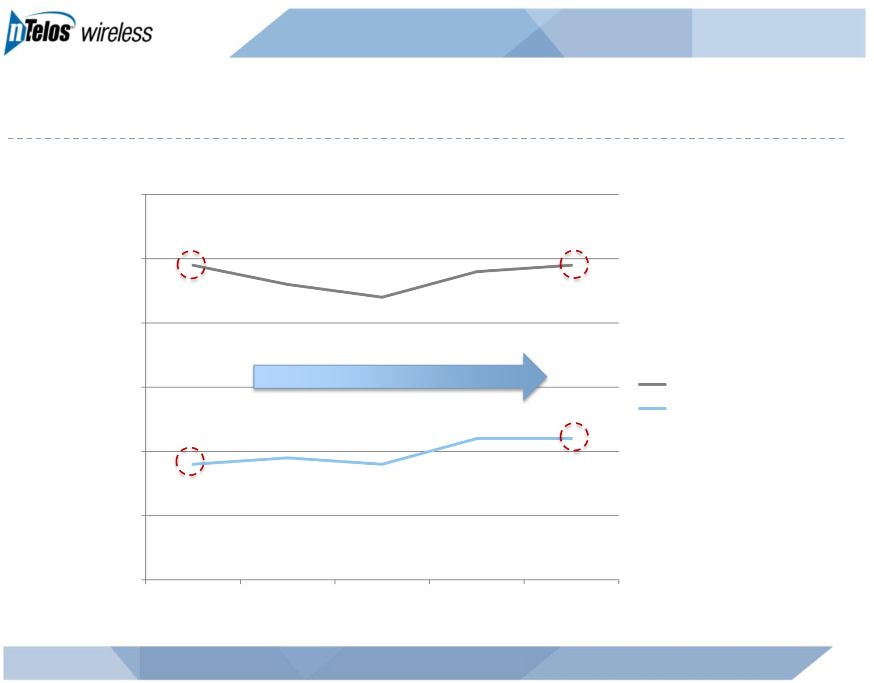 Churn Remains Stable
17
NASDAQ: NTLS
0.0%
1.0%
2.0%
3.0%
4.0%
5.0%
6.0%
4Q 2012
1Q 2013
2Q 2013
3Q 2013
4Q 2013
Prepaid Churn
Postpaid Churn |
 Questions & Answers |
 Appendix |
 20
NASDAQ: NTLS
NTELOS Holdings Corp.
Reconciliation of Net Income Attributable to NTELOS Holdings Corp. to Adjusted EBITDA
(In thousands)
4Q13
3Q13
2Q13
1Q13
4Q12
Net Income Attributable to NTELOS Holdings Corp.
(784)
$
10,583
$
9,386
$
5,493
$
321
$
Net income attributable to noncontrolling interests
403
588
541
529
443
Net Income
(381)
11,171
9,927
6,022
764
Interest expense
7,504
7,480
7,398
7,361
6,651
Income taxes
80
8,340
6,380
3,744
(454)
Other expense (income), net
161
431
(151)
369
7,038
Operating income
7,364
27,422
23,554
17,496
13,999
Depreciation and amortization
17,486
16,559
20,443
18,456
17,440
Gain on sale of intangible assets
-
(4,442)
-
-
Accretion of asset retirement obligations
171
135
173
143
174
Equity-based compensation
1,330
1,442
1,460
1,321
1,346
Business
separation
charges
1,2
375
-
-
-
56
Adjusted EBITDA
26,726
$
45,558
$
41,188
$
37,416
$
33,015
$
1
Charges for legal and consulting services costs in connection with the separation
of the wireless and wireline operations. -
Charges for advisory fees for secondary offering in 2013.
2 |
 21
NASDAQ: NTLS
NTELOS Holdings Corp.
ARPU Reconciliation
Average Monthly Revenue per User (ARPU) ¹
4Q13
3Q13
2Q13
1Q13
4Q12
FY 2013
FY 2012
(In thousands, except for subscribers and ARPU)
Operating Revenues
121,766
$
130,912
$
119,859
$
119,345
$
117,398
$
491,882
$
453,989
$
Less: Equipment revenue from sales to new customers
(3,691)
(3,595)
(3,104)
(3,521)
(3,808)
(13,911)
(15,041)
Less: Equipment revenue from sales to existing customers
(2,882)
(2,946)
(2,395)
(3,117)
(3,315)
(11,340)
(15,037)
Less: Wholesale, other and adjustments
(40,525)
(50,142)
(41,179)
(40,918)
(41,488)
(172,764)
(165,765)
Gross subscriber revenue
74,668
74,229
73,181
71,789
68,787
293,867
258,146
Less: prepay subscriber revenue
(16,494)
(16,248)
(15,879)
(15,205)
(14,823)
(63,826)
(56,330)
Less: adjustments to prepay subscriber revenue
(462)
(230)
(303)
(479)
(237)
(1,474)
(1,706)
Gross postpay subscriber revenue
57,712
$
57,751
$
56,999
$
56,105
$
53,727
$
228,567
$
200,110
$
Prepay subscriber revenue
16,494
16,248
15,879
15,205
14,823
63,826
56,330
Plus: adjustments to prepay subscriber revenue
462
230
303
479
237
1,474
1,706
Gross prepay subscriber revenue
16,956
$
16,478
$
16,182
$
15,684
$
15,060
$
65,300
$
58,036
$
Average number of subscribers
459,968
455,724
453,262
444,244
434,457
453,300
425,377
Total ARPU
54.11
$
54.29
$
53.82
$
53.87
$
52.78
$
54.02
$
50.57
$
Average number of postpay subscribers
301,028
297,900
299,304
298,414
292,668
299,161
288,428
Postpay ARPU
63.91
$
64.62
$
63.48
$
62.67
$
61.19
$
63.67
$
57.82
$
Average number of prepay subscribers
158,940
157,824
153,958
145,831
141,789
154,138
136,949
Prepay ARPU
35.56
$
34.80
$
35.04
$
35.85
$
35.41
$
35.30
$
35.31
$
1
Gross subscriber revenue
74,668
74,229
73,181
71,789
68,787
293,867
258,146
Less: voice and other feature revenue
(40,544)
(43,672)
(43,078)
(42,658)
(41,379)
(169,952)
(156,032)
Data revenue
34,124
$
30,557
$
30,103
$
29,131
$
27,408
$
123,915
$
102,114
$
Average number of subscribers
459,968
455,724
453,262
444,244
434,457
453,300
425,377
Total Data ARPU
24.73
$
22.35
$
22.14
$
21.86
$
21.03
$
22.78
$
20.00
$
Gross postpay subscriber revenue
57,712
57,751
56,999
56,105
53,727
228,567
200,110
Less: postpay voice and other feature revenue
(33,368)
(36,652)
(36,170)
(35,952)
(34,651)
(142,142)
(130,601)
Postpay data revenue
24,344
$
21,099
$
20,829
$
20,153
$
19,076
$
86,425
$
69,509
$
Gross prepay subscriber revenue
16,956
16,478
16,182
15,684
15,060
65,300
58,036
Less: prepay voice and other feature revenue
(7,176)
(7,020)
(6,908)
(6,706)
(6,728)
(27,810)
(25,431)
Prepay data revenue
9,780
$
9,458
$
9,274
$
8,978
$
8,332
$
37,490
$
32,605
$
Average number of postpay subscribers
301,028
297,900
299,304
298,414
292,668
299,161
288,428
Postpay data ARPU
26.96
$
23.61
$
23.20
$
22.51
$
21.73
$
24.07
$
20.08
$
Average number of prepay subscribers
158,940
157,824
153,958
145,831
141,789
154,138
136,949
Prepay data ARPU
20.51
$
19.98
$
20.08
$
20.52
$
19.59
$
20.27
$
19.84
$
Average monthly revenue per user (ARPU) is computed by dividing service revenues per period by the
average number of subscribers during that period. ARPU as defined may not be similar to ARPU
measures of other companies, is not a measurement under GAAP and should be considered in addition to, but not as a substitute for, the
information contained in the Company’s consolidated statements of operations. The Company closely
monitors the effects of new rate plans and service offerings on ARPU in order to determine
their effectiveness. ARPU provides management useful information concerning the appeal of NTELOS rate plans and service offerings and the
Company’s performance in attracting and retaining high-value customers.
|
 February 27, 2014
4Q & FY 2013 Earnings
Presentation
NASDAQ: NTLS |