Attached files
| file | filename |
|---|---|
| EX-99.1 - EX-99.1 - Wright Medical Group N.V. | d655452dex991.htm |
| 8-K - FORM 8-K - Wright Medical Group N.V. | d655452d8k.htm |
 Investor Presentation
2
0
1
4
Exhibit 99.2 |
 FORWARD LOOKING STATEMENTS
Statements
contained
in
this
presentation
that
relate
to
future,
not
past,
events
are
forward-looking
statements
under
the
Private
Securities
Litigation
Reform
Act
of
1995.
Forward-looking
statements
are
based
on
current
expectations
of
future
events
and
often
can
be
identified
by
words
such
as
“expect,”
“anticipate,”
“project,”
“intend,”
“will,”
“may,”
“believe,”
“could,”
“continue,”
“estimate,”
“outlook,”
“plan,”
“guidance,”
“tomorrow”,
“desired
state,”
other
words
of
similar
meaning
or
the
use
of
future
dates.
Forward-looking
statements
by
their
nature
address
matters
that
are,
to
different
degrees,
uncertain.
Uncertainties
and
risks
may
cause
Tornier’s
actual
results
to
be
materially
different
than
those
expressed
in
or
implied
by
Tornier’s
forward-looking
statements.
For
Tornier,
such
uncertainties
and
risks
include,
among
others,
Tornier’s
future
operating
results
and
financial
performance;
the
success
of
and
possible
disruption
from
Tornier’s
recently
completed
transition
to
dedicated
upper
and
lower
extremities
sales
forces;
fluctuations
in
foreign
currency
exchange
rates;
the
effect
of
global
economic
conditions;
the
timing
of
regulatory
approvals
and
introduction
of
new
products;
physician
acceptance,
endorsement,
and
use
of
new
products;
and
the
effect
of
regulatory
actions,
changes
in
and
adoption
of
reimbursement
rates,
product
recalls
and
competitor
activities.
More
detailed
information
on
these
and
other
factors
that
could
affect
Tornier’s
actual
results
are
described
in
Tornier’s
filings
with
the
U.S.
Securities
and
Exchange
Commission,
including
its
most
recent
quarterly
report
on
Form
10-Q.
Tornier
undertakes
no
obligation
to
update
its
forward-looking
statements. |
 NON
GAAP FINANCIAL MEASURES Tornier
uses
certain
non-GAAP
financial
measures
in
this
presentation,
such
as
adjusted
EBITDA,
adjusted
gross
margin
and
constant
currency.
Tornier
uses
non-GAAP
financial
measures
as
supplemental
measures
of
performance
and
believes
these
measures
provide
useful
information
to
investors
in
evaluating
Tornier’s
operations,
period
over
period.
However,
non-GAAP
financial
measures
have
limitations
as
analytical
tools,
and
should
not
be
considered
in
isolation
or
as
a
substitute
for
Tornier’s
financial
results
prepared
in
accordance
with
GAAP.
In
addition,
investors
should
note
that
any
non-GAAP
financial
measure
Tornier
uses
may
not
be
the
same
non-GAAP
financial
measure,
and
may
not
be
calculated
in
the
same
manner,
as
that
of
other
companies.
A
reconciliation
of
the
non-GAAP
financial
measures
used
in
the
presentation
to
the
most
directly
comparable
GAAP
financial
measures
can
be
found
on
Tornier’s
website
www.tornier.com
under
the
“Non-GAAP
Measure
Reconciliation
Tables”
section
of
the
“Investor
Relations”
page |
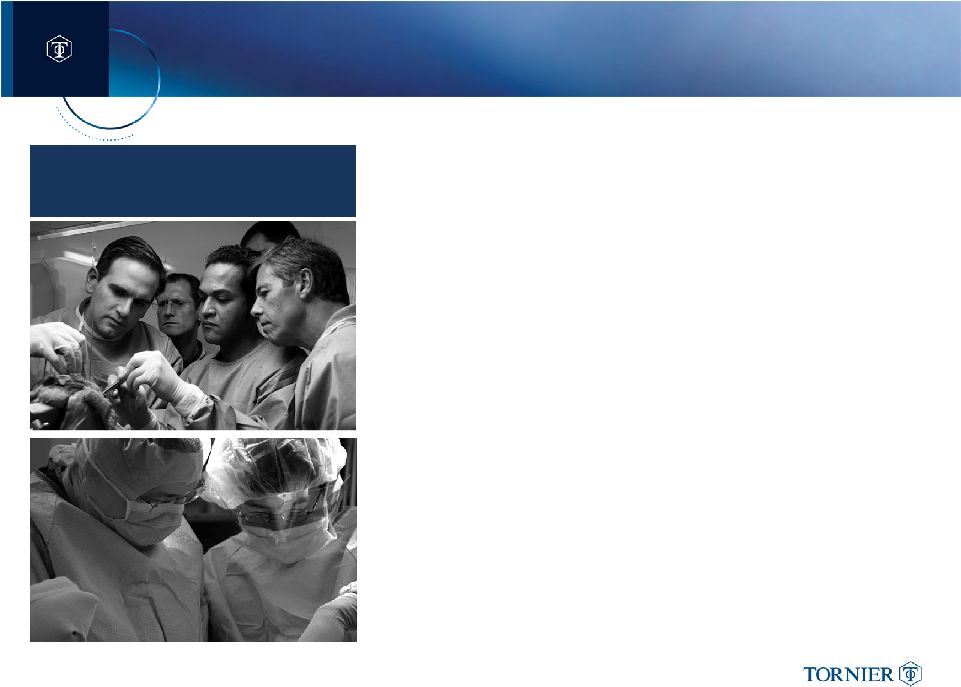
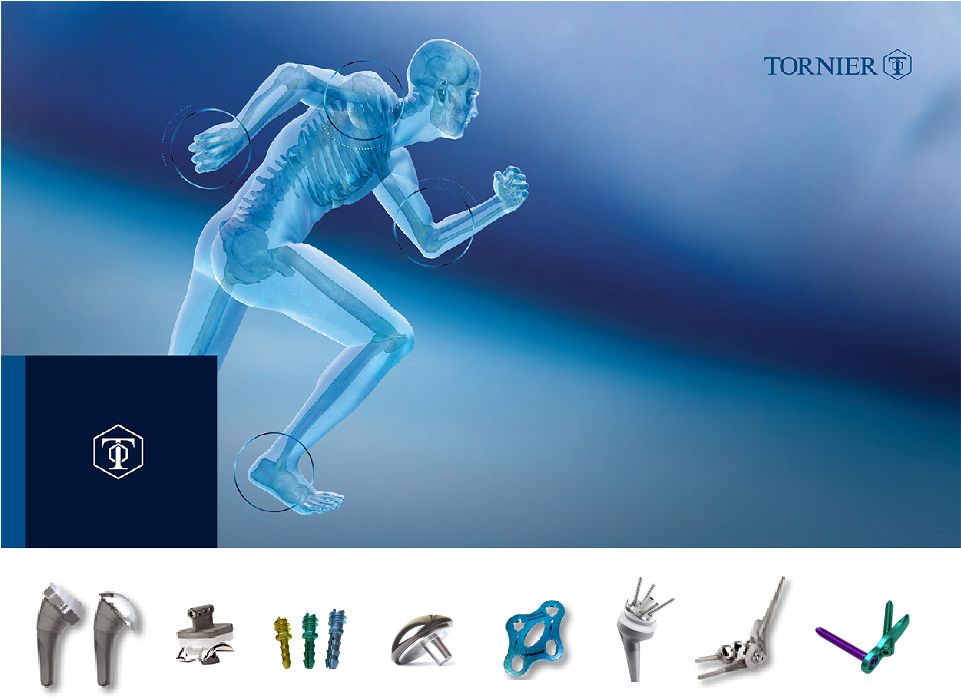
 TORNIER IS…
Global Medical Device Company,
focusing on providing superior solutions to surgeons
treating extremities injuries & disorders |
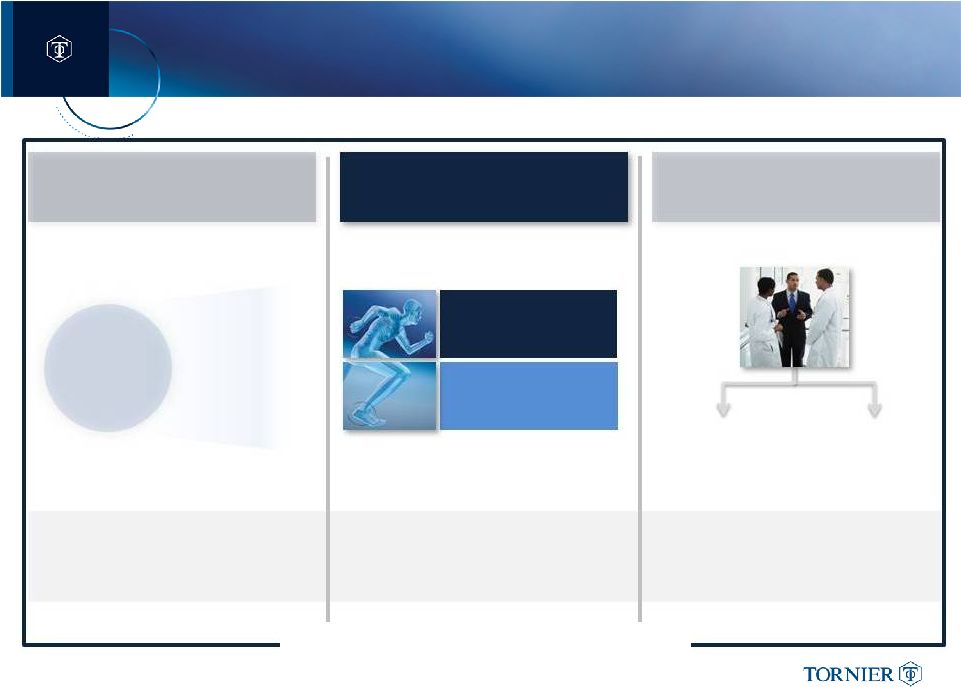
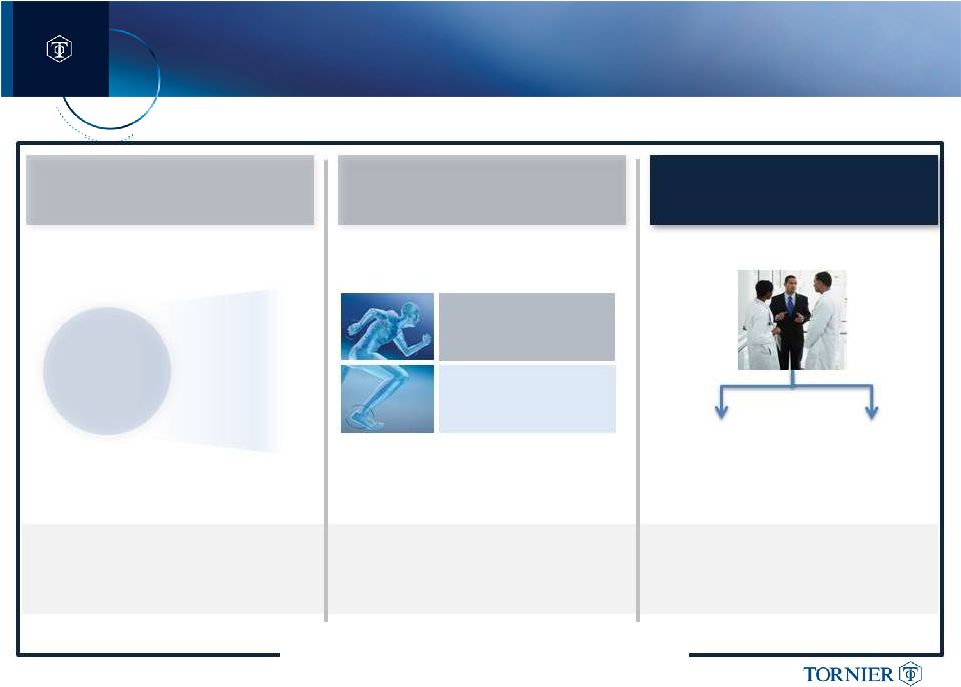
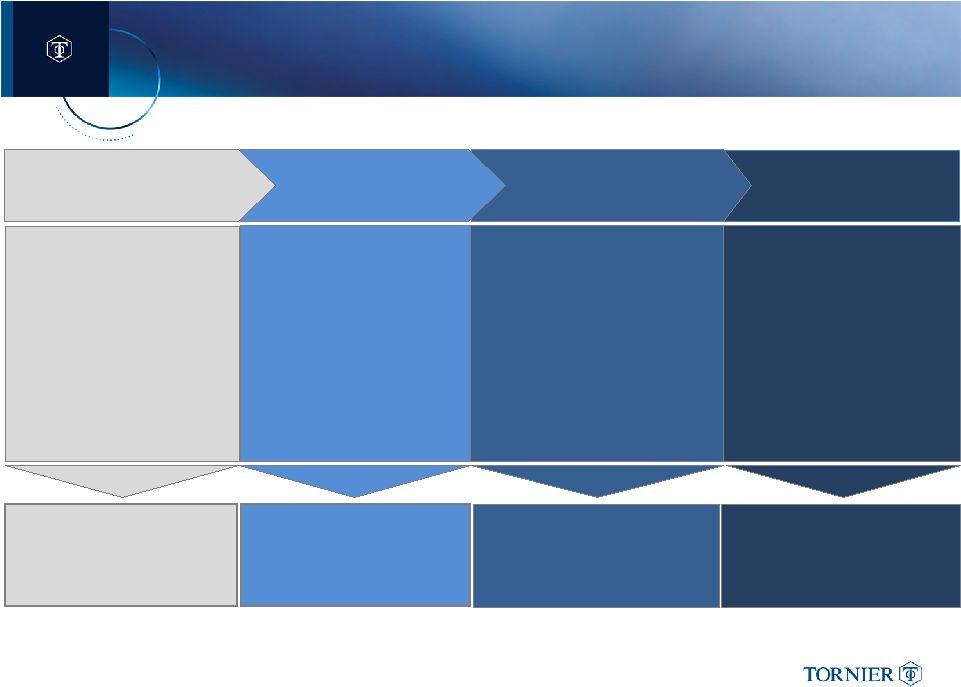
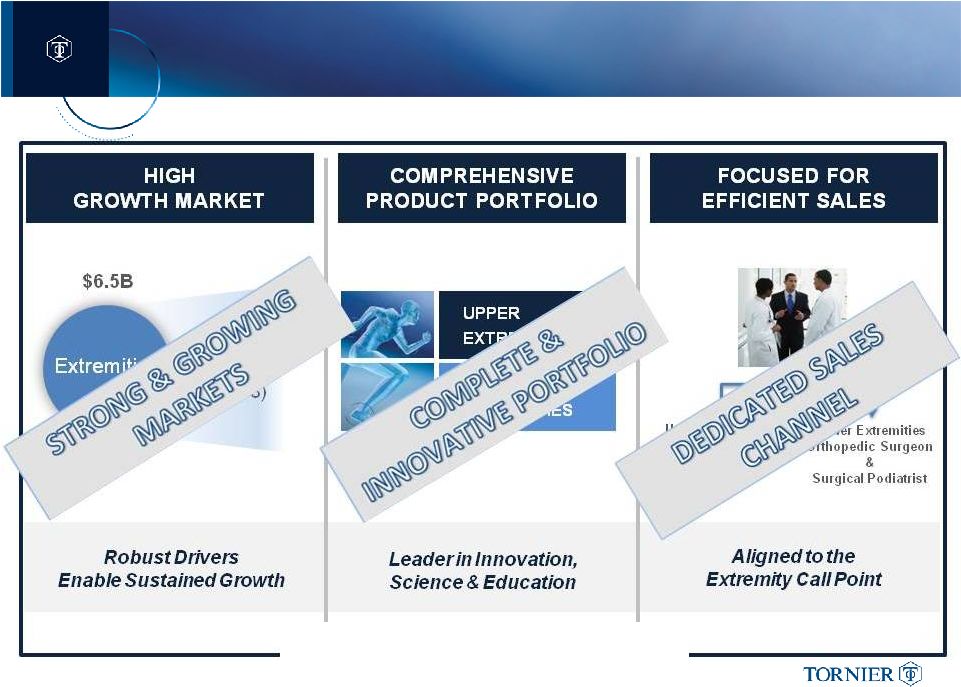
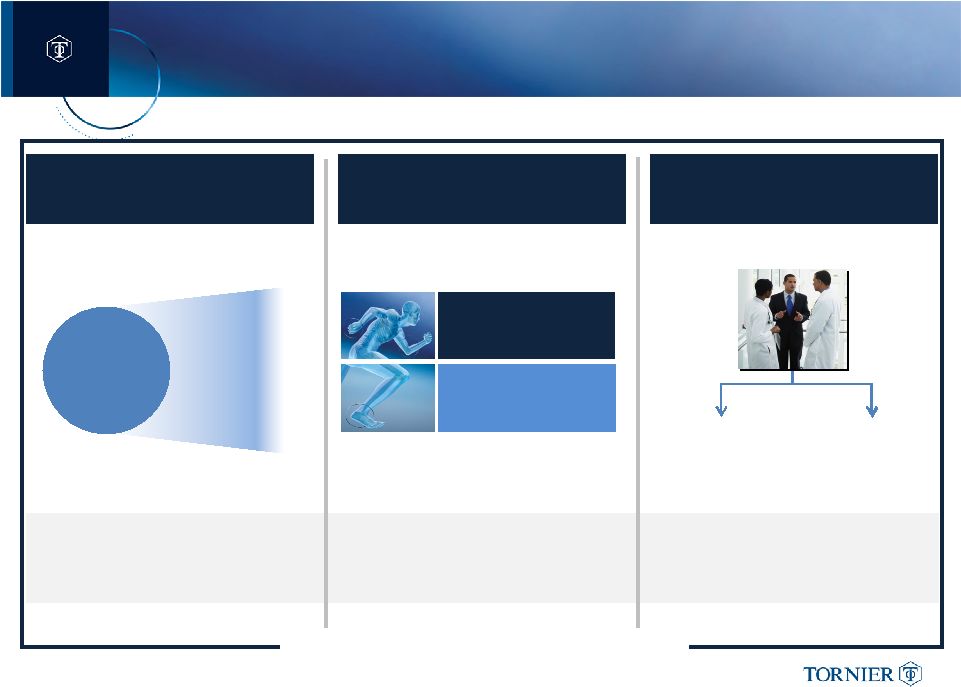   TORNIER IS WELL-POSITIONED FOR LONG-TERM GROWTH
HIGH
GROWTH MARKET
Robust Drivers
Enable Sustained Growth
Extremities
Extremities
$6.5B
8-9%
CAGR
(’14 –
’18)
Based upon management estimates
COMPREHENSIVE
PRODUCT PORTFOLIO
Leader in Innovation,
Science & Education
FOCUSED FOR
EFFICIENT SALES
Aligned to
the
Extremity Call Point
FOCUSED ON EXECUTION
UPPER
EXTREMITIES
LOWER
EXTREMITIES
Upper Extremities
Orthopedic Surgeon
Lower Extremities
Orthopedic Surgeon
&
Surgical Podiatrist |
 TORNIER IS WELL-POSITIONED FOR LONG-TERM GROWTH
Robust Drivers
Enable Sustained Growth
$6.5B
8-9%
CAGR
(’14 –
’18)
Based upon management estimates
Leader in Innovation,
Science & Education
Aligned to
the
Extremity Call Point
FOCUSED ON EXECUTION
Upper Extremities
Orthopedic Surgeon
Lower Extremities
Orthopedic Surgeon
&
Surgical Podiatrist
HIGH
GROWTH MARKET
UPPER
EXTREMITIES
LOWER
EXTREMITIES
FOCUSED FOR
EFFICIENT SALES
COMPREHENSIVE
PRODUCT PORTFOLIO
Extremities |
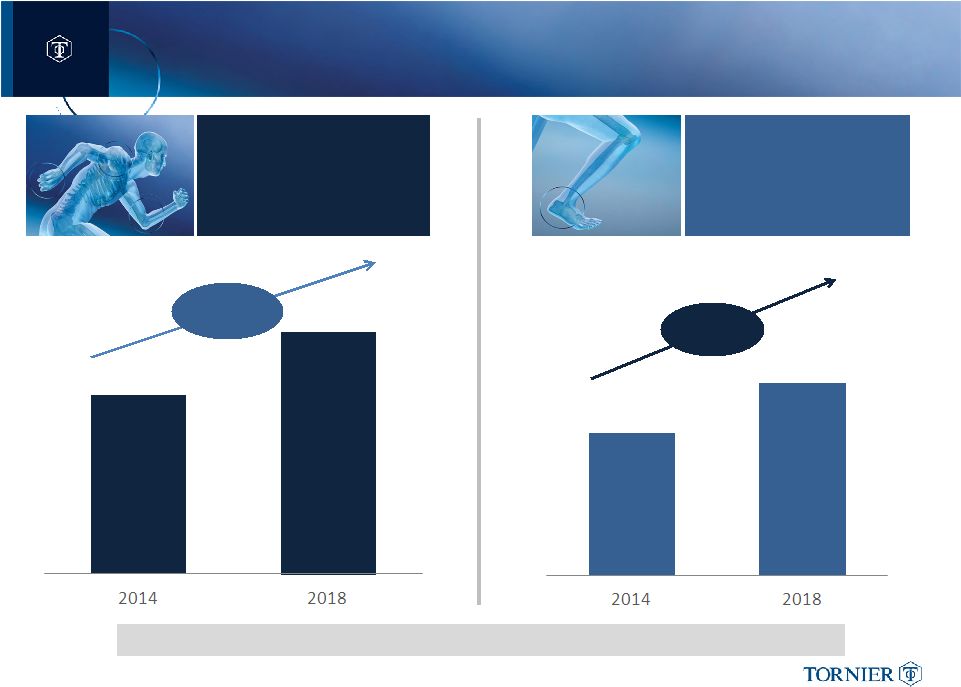 Tornier’s Available Market is $6.5B with
a 8-9% CAGR
$1.7B
$2.8B
9-10%
CAGR
LOWER
EXTREMITIES
TORNIER IS FOCUSED ON ROBUST, HIGH-GROWTH MARKETS
$2.7B
$3.7B
UPPER
EXTREMITIES
8-9%
CAGR |
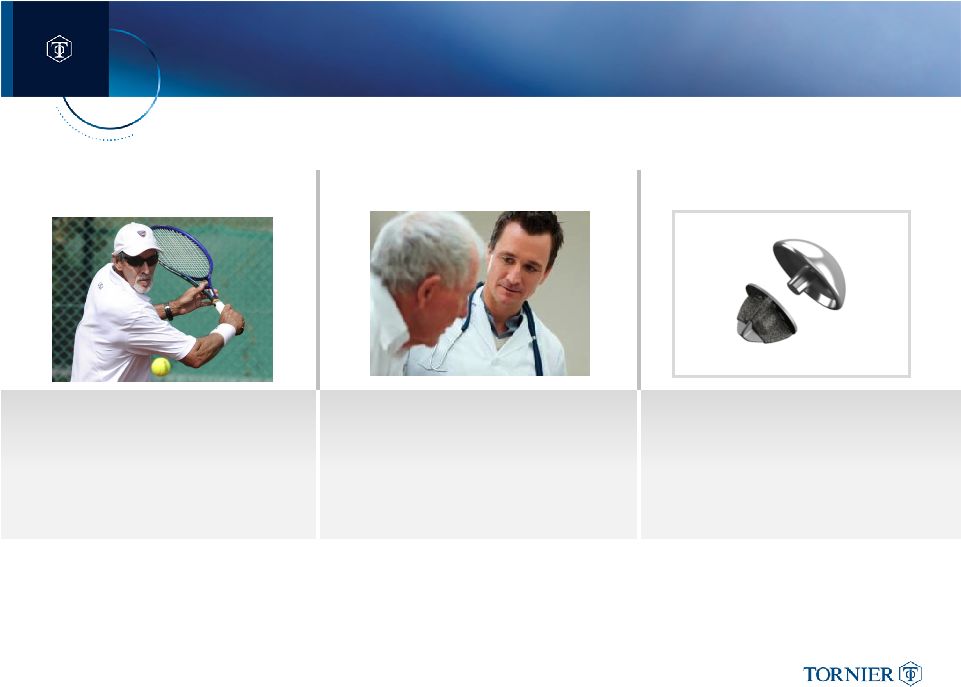 EXTREMITY MARKET DRIVERS PROVIDE OPPORTUNITY
FOR SUSTAINED GROWTH
•
Aging population
•
Growing awareness (globally)
•
“Quality of life”
expectations
•
Extremities specific design
•
Unmet need for early intervention
•
Growing need for revision
TECHNOLOGY
PATIENTS
OUTCOMES
•
Improving clinical outcomes
•
Evidence driven decisions |
 TORNIER IS WELL-POSITIONED FOR LONG-TERM GROWTH
Based upon management estimates
Leader in Innovation,
Science & Education
Robust Drivers
Enable Sustained Growth
$6.5B
8-9%
CAGR
(’14 –
’18)
FOCUSED ON EXECUTION
Aligned to
the
Extremity Call Point
Upper Extremities
Orthopedic Surgeon
Lower Extremities
Orthopedic Surgeon
&
Surgical Podiatrist
Extremities
HIGH
GROWTH MARKET
COMPREHENSIVE
PRODUCT PORTFOLIO
FOCUSED FOR
EFFICIENT SALES
UPPER
EXTREMITIES
LOWER
EXTREMITIES |
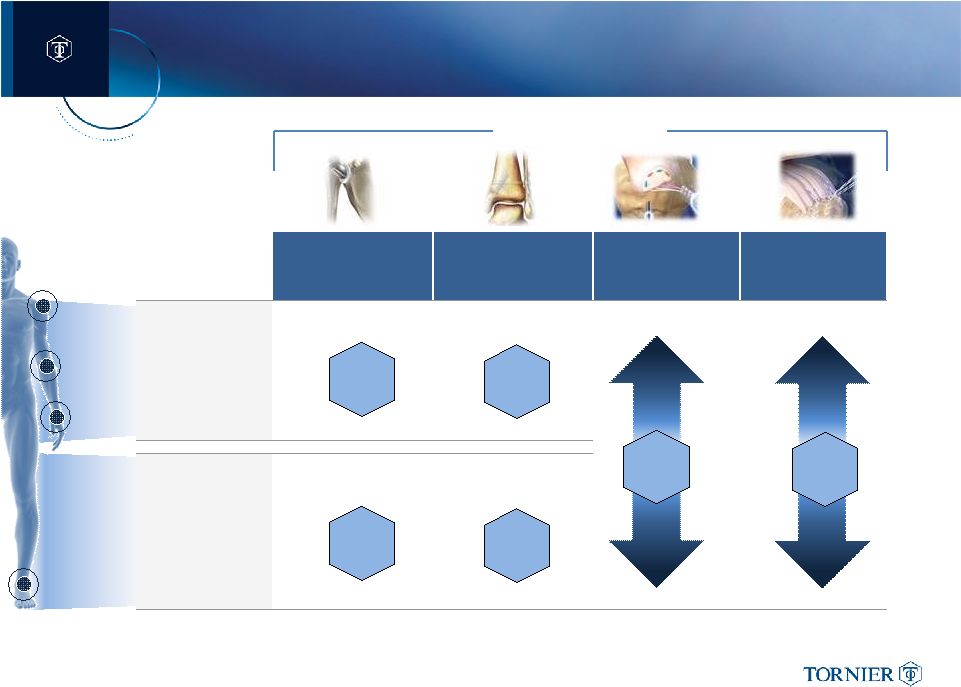 COMPREHENSIVE
PORTFOLIO PROVIDES FULL-LINE SUPPORT TO THE EXTREMITY SURGEON
96 Distinct Extremities Products
Number of
Extremities
Products:
JOINT
REPLACEMENTS
BONE
REPAIR
BIOLOGICS
SOFT TISSUE
REPAIR
UPPER
Shoulder,
Elbow, Hand &
Wrist
LOWER
Foot & Ankle
10
34
33
3
3
13
PROCEDURES |
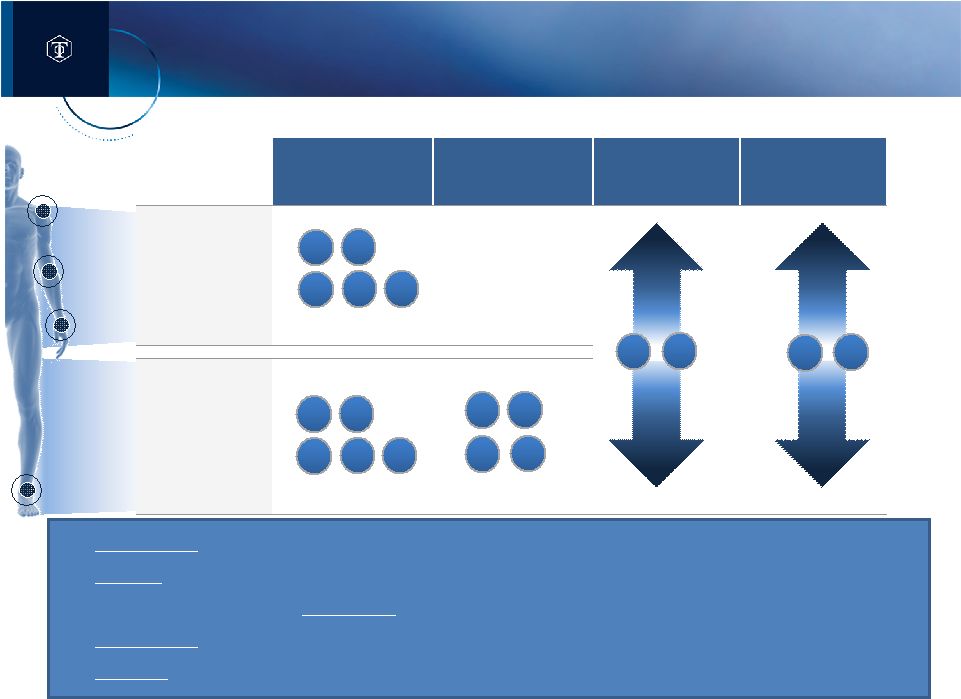 PORTFOLIO STRATEGY LEVERAGES STRENGTHS TO
TAKE SHARE WHILE EXPANDING EXTREMITY MARKETS
JOINT
REPLACEMENTS
BONE
REPAIR
BIOLOGICS
SOFT TISSUE
REPAIR
UPPER
Shoulder,
Elbow, Hand &
Wrist
LOWER
Foot & Ankle
1.
Take Share
through introduction of best-in-class extremity specific solutions
2.
Expand
arthroplasty markets with early intervention products
3.
Create solutions for an Expanding
extremity revision segment
4.
Take Share
with differentiated value products, (“Value”
= outcome per healthcare dollar spent)
5.
Expand customer base through ease-of-use products, instrumentation &
surgical procedures 1
2
3
4
5
1
2
3
4
5
1
2
4
5
4
5
4
5 |
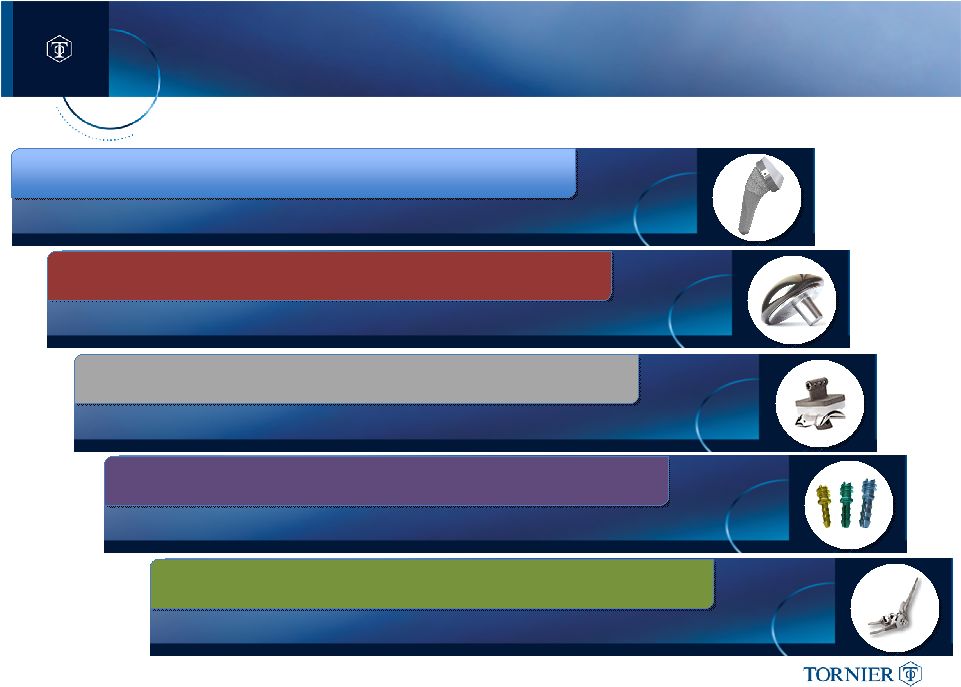                     RECENT INTRODUCTIONS REFLECT OUR FOCUSED
PORTFOLIO STRATEGY
ASCEND FLEX
TM
Best in Class Arthroplasty
PYC HUMERAL HEAD
Earlier Intervention / Less Invasive
SALTO TALARIS
TM
XT
Revision Options
CANNULINK IFS
Differentiated Value
LATITUDE
TM
EV
Ease-of-use / Expanded Customer Base |
 TORNIER IS THE “GO-TO”
EXTREMITIES COMPANY WITH
INDUSTRY LEADING SCIENCE & EDUCATION PROGRAMS
RESPECTED FOR
SCIENTIFIC RIGOR
SUPPORTING ACTIVE FUNDAMENTAL RESEARCH
•
Pyrolytic carbon
•
Advanced kinematic & biomechanical testing capability
•
Computer aided surgery / 3D operative planning
COMMITTED TO “EVIDENCE-BASED”
MEDICINE
•
Aequalis shoulder registry -
20+ years of data
•
Simpliciti trial –
1st US IDE shoulder arthroplasty study
•
Salto-Talaris –
total ankle replacement survivorship data
INVESTED IN PROFESSIONAL EDUCATION & TRAINING
•
Unique shoulder and ankle master courses
•
Orthopedic fellowship courses
•
Cadence of product-specific cadaveric training labs
|
 TORNIER IS WELL-POSITIONED FOR LONG-TERM GROWTH
Robust Drivers
Enable Sustained Growth
$6.5B
7-9%
CAGR
(’14 –
’18)
Aligned to
the
Extremity Call Point
FOCUSED ON EXECUTION
Based upon management estimates
Leader in Innovation,
Science & Education
Upper Extremities
Orthopedic Surgeon
Lower Extremities
Orthopedic Surgeon
&
Surgical Podiatrist
LOWER
EXTREMITIES
UPPER
EXTREMITIES
HIGH
GROWTH MARKET
Extremities
FOCUSED FOR
EFFICIENT SALES
COMPREHENSIVE
PRODUCT PORTFOLIO |
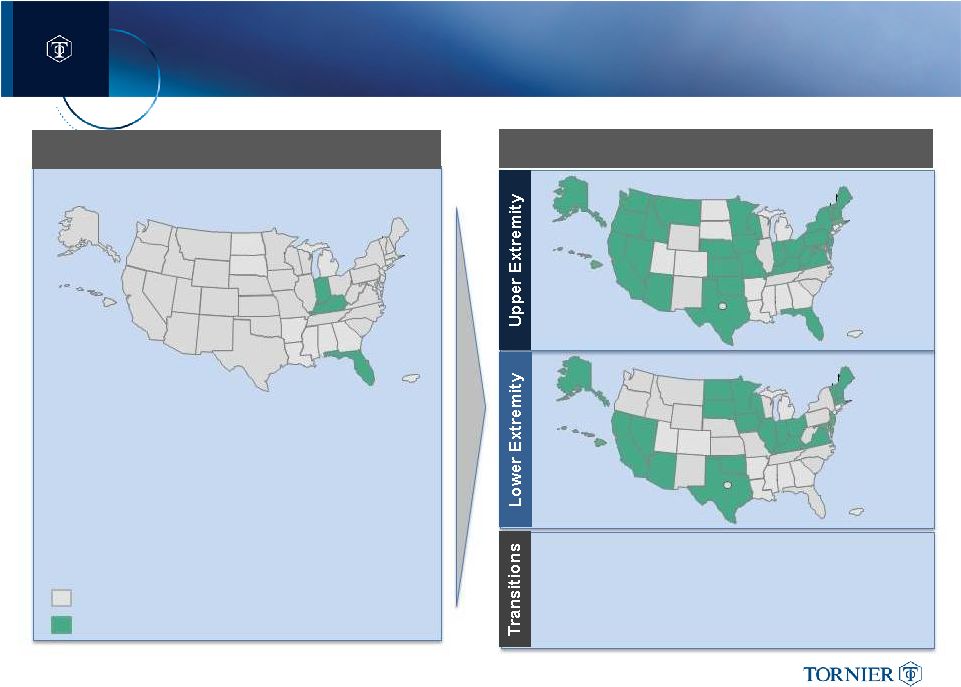
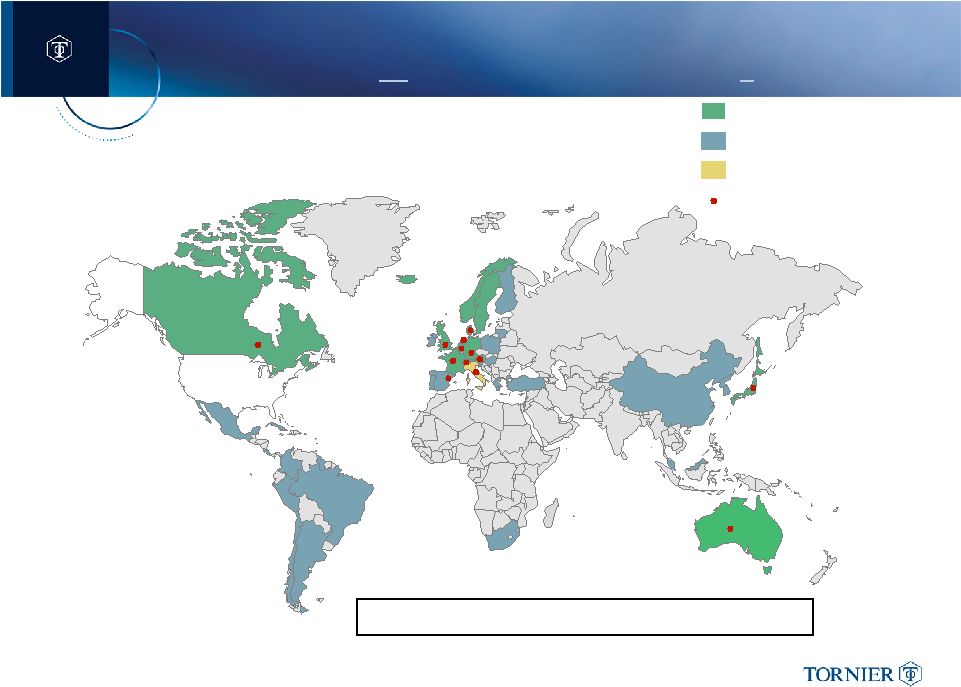 TORNIER CONDUCTS INTERNATIONAL SALES OPERATIONS
IN 45
DISTINCT COUNTRIES ON 6
CONTINENTS
Primarily direct sales
Primarily distributor
Mixed Model
Country Office
International revenue $93.3 MM (41% of Total)*
* Q3 2013 year to date revenue results |
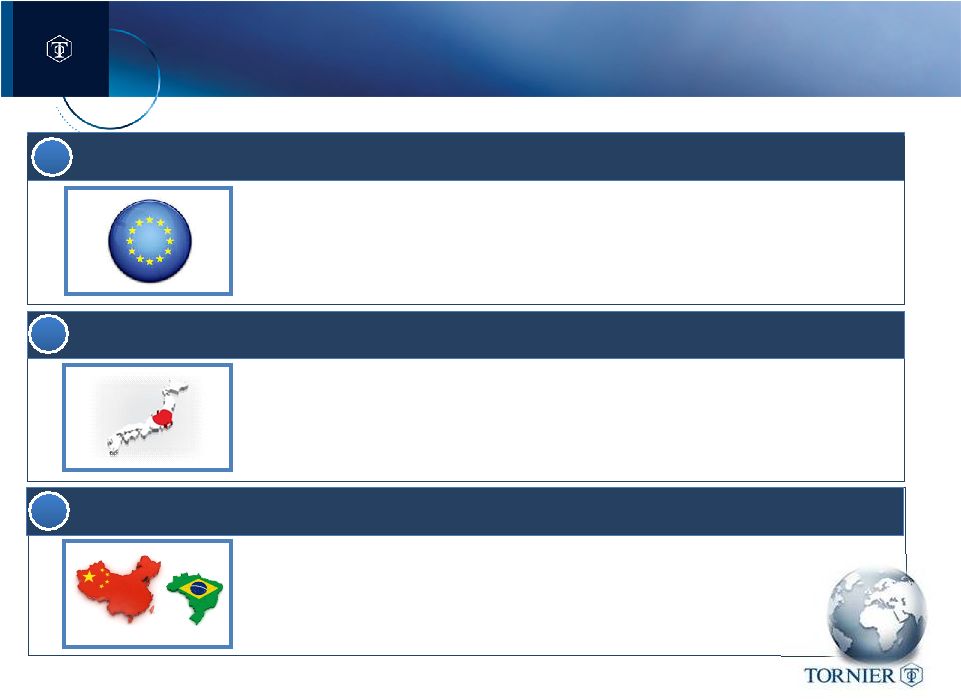 THREE STRATEGIC INITIATIVES TO STRENGTHEN OUR
INTERNATIONAL BUSINESS
STRENGTHEN BRAND IN EMERGING MARKETS
3
ACCELERATE REVENUE GROWTH
2
•
Aggressively launch new platform products globally
(ex. Ascend Flex)
•
Broaden product offering in direct & distributor markets
DRIVE ADOPTION IN DEVELOPED GEOGRAPHIES
•
Strengthen and further focus our sales forces
•
Invest in strategic market development activities
1
•
Select investments to accelerate presence in Brazil & China
•
Evaluate targeted expansion plans in other emerging markets
(ex. India) |
 CONTINUE TO INVEST TO BUILD A SUPERIOR
U.S. SALES FORCE
Competitively Superior
•
Exclusive channel
•
Expanded portfolio
•
Narrow rep territories
•
Reps provide “value-add”
DESIRED STATE
Proficient & Productive
•
Reps aligned to Upper /
Lower
•
Continue to fill territories
•
Certify rep training
•
Track & manage reps
Aligned & Committed
•
Agreements for
dedicated Upper / Lower
•
Hire and fill Territories
•
Clearly defined coverage
•
Initial rep training
2013 –
PHASE I
•
Limited access to reps
•
Rep covered any/all cases
•
Limited formal training
•
Inconsistent distributor
contracts
Limited
Standardization
and Commitment to
Tornier
TORNIER 2012
4
4
2014/2015 –
PHASE II |
 COMPLETED SIGNIFICANT TRANSITIONS WITHIN
U.S. SALES CHANNEL IN 2013
EXITING 2012
Distributor
Direct
US Sales Network
•
18 Legacy Tornier distributors selling both UE & LE
•
3 Direct Tornier territories
•
50 OrthoHelix LE agents in Oct-12
ENTERING 2014
US Sales Network
•
U.S. revenue $134.2 MM (59% of Total)*
•
> 85% US revenues –
dedicated sales reps UE or LE
•
> 50% US revenues managed by direct sales reps
* Q3 2013 year to date revenue results |
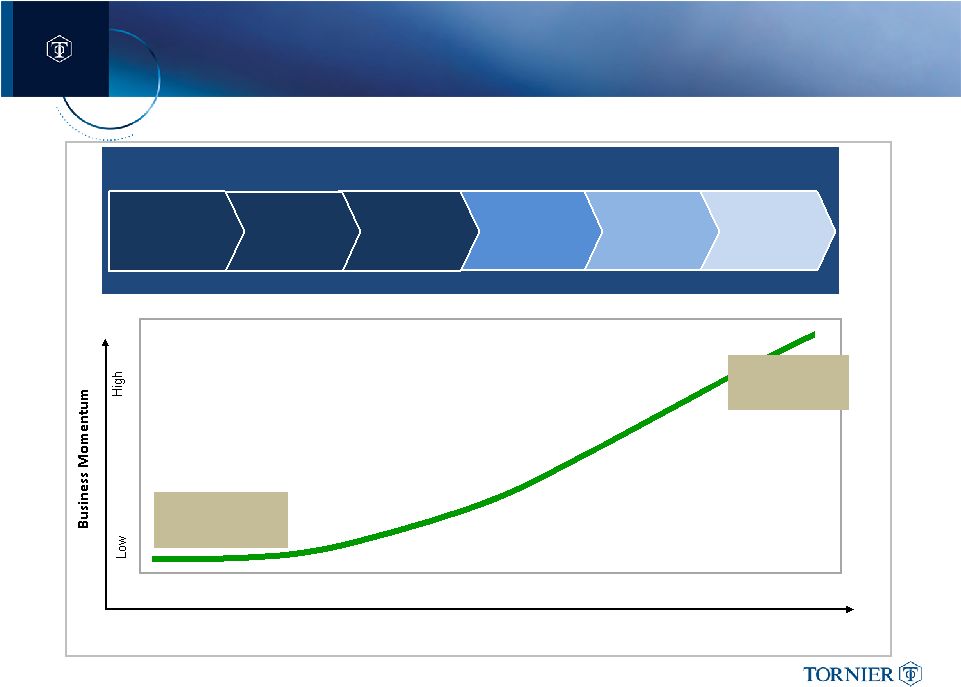 WORK REMAINS TO BUILD
A “BEST-IN-CLASS” U.S. SALES FORCE
Timing
2012
Desired State
Agreements
& Alignment
Rep Training &
Education
Performance &
Productivity
Distributor
Negotiation
High Uncertainty
Strong & Reliable
Performance
US Sales Channel Transition
Territory
Staffing
Sales Mgmt. &
Training Org.
4
4
4 |
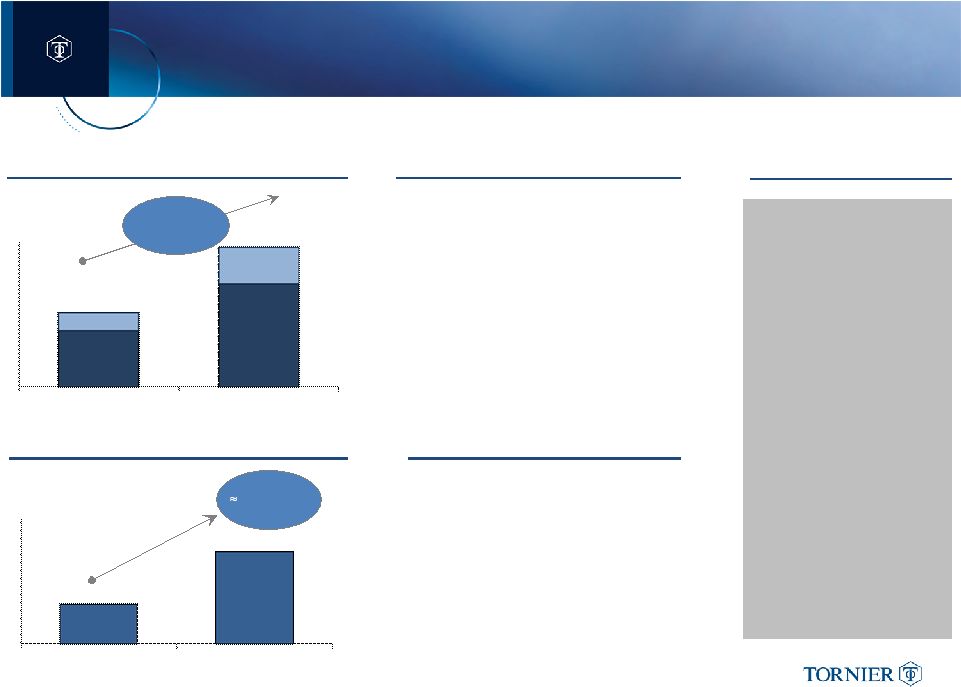 EBITDA Leverage
Above Market
CAGR
2018
2013
2013
2018
Upper Extrm.
Lower Extrm.
20% of Rev
Projected Extremities Revenues
•
Driving above-market growth
in upper and lower extremity
segments
•
Revenue geographically
balanced
Revenue Takeaways
•
Runway to EBITDA >20% of Rev.
•
GM contributions expand:
•
Continued insourcing
(OrthoHelix)
•
On-going manufacturing
efficiencies
•
SG&A leverage comes with
revenue
•
Market Cap: ~$925M
•
FY13 Results:
Rev:
$310.5
-
$311.5M
•
Q3 ‘13 YTD Results:
Revenue:
$227.6M
Adj.
GM:
73.9%
*
Adj.
EBITDA:
$21.3M*
•
Cash (Q3 ‘13): $62.6M
Financial Profile
PLANS TO DELIVER CONSISTENT ABOVE-MARKET GROWTH
AND STRONG FINANCIAL PERFORMANCE
EBITDA Takeaways
*Represents non-GAAP financial
measure. Reconciliation to the closest
GAAP measure can be found on
Tornier’s website. |
 TORNIER IS WELL-POSITIONED FOR LONG-TERM GROWTH
FOCUSED ON EXECUTION
Based upon management estimates |
 THANK YOU |