Attached files
| file | filename |
|---|---|
| EX-21.1 - EX-21.1 - Wright Medical Group N.V. | d845440dex211.htm |
| EX-23.1 - EX-23.1 - Wright Medical Group N.V. | d845440dex231.htm |
| EX-10.5 - EX-10.5 - Wright Medical Group N.V. | d845440dex105.htm |
| EX-12.1 - EX-12.1 - Wright Medical Group N.V. | d845440dex121.htm |
| EX-32.1 - EX-32.1 - Wright Medical Group N.V. | d845440dex321.htm |
| EX-10.6 - EX-10.6 - Wright Medical Group N.V. | d845440dex106.htm |
| EX-32.2 - EX-32.2 - Wright Medical Group N.V. | d845440dex322.htm |
| EX-10.7 - EX-10.7 - Wright Medical Group N.V. | d845440dex107.htm |
| EX-31.1 - EX-31.1 - Wright Medical Group N.V. | d845440dex311.htm |
| EX-31.2 - EX-31.2 - Wright Medical Group N.V. | d845440dex312.htm |
| EX-10.18 - EX-10.18 - Wright Medical Group N.V. | d845440dex1018.htm |
| EX-10.17 - EX-10.17 - Wright Medical Group N.V. | d845440dex1017.htm |
| EXCEL - IDEA: XBRL DOCUMENT - Wright Medical Group N.V. | Financial_Report.xls |
Table of Contents
UNITED STATES
SECURITIES AND EXCHANGE COMMISSION
WASHINGTON, D.C. 20549
FORM 10-K
(Mark One)
| x | ANNUAL REPORT PURSUANT TO SECTION 13 OR 15(d) OF THE SECURITIES EXCHANGE ACT OF 1934 |
For the fiscal year ended December 28, 2014
OR
| ¨ | TRANSITION REPORT PURSUANT TO SECTION 13 OR 15(d) OF THE SECURITIES EXCHANGE ACT OF 1934 |
For the transition period from to
Commission file number: 1-35065
TORNIER N.V.
(Exact name of registrant as specified in its charter)
| The Netherlands | 98-0509600 | |
| (State or other jurisdiction of incorporation or organization) |
(I.R.S. Employer Identification No.) | |
| Prins Bernhardplein 200 1097 JB Amsterdam, The Netherlands |
None | |
| (Address of principal executive offices) | (Zip Code) | |
Registrant’s telephone number, including area code: (+ 31) 20 675 4002
Securities registered pursuant to Section 12(b) of the Act:
| Title of each class |
Name of each exchange on which registered | |
| Ordinary shares, par value €0.03 per share | Nasdaq Stock Market LLC | |
| (NASDAQ Global Select Market) |
Securities registered pursuant to Section 12(g) of the Act: None
Indicate by check mark if the registrant is a well-known seasoned issuer, as defined in Rule 405 of the Securities Act. Yes x No ¨
Indicate by check mark if the registrant is not required to file reports pursuant to Section 13 or Section 15(d) of the Act. Yes ¨ No x
Indicate by check mark whether the registrant (1) has filed all reports required to be filed by Section 13 or 15(d) of the Securities Exchange Act of 1934 during the preceding 12 months (or for such shorter period that the registrant was required to file such reports), and (2) has been subject to such filing requirements for the past 90 days. Yes x No ¨
Indicate by check mark whether the registrant has submitted electronically and posted on its corporate Web site, if any, every Interactive Data File required to be submitted and posted pursuant to Rule 405 of Regulation S-T (§ 232.405 of this chapter) during the preceding 12 months (or for such shorter period that the registrant was required to submit and post such files). Yes x No ¨
Indicate by check mark if disclosure of delinquent filers pursuant to Item 405 of Regulation S-K (§ 229.405 of this chapter) is not contained herein, and will not be contained, to the best of registrant’s knowledge, in definitive proxy or information statements incorporated by reference in Part III of this Form 10-K or any amendment to this Form 10-K. x
Indicate by check mark whether the registrant is a large accelerated filer, an accelerated filer, a non-accelerated filer, or a smaller reporting company. See definitions of “large accelerated filer,” “accelerated filer,” and “smaller reporting company” in Rule 12b-2 of the Exchange Act. (Check one):
| Large accelerated filer | x | Accelerated filer | ¨ | |||
| Non-accelerated filer | ¨ (Do not check if a smaller reporting company) | Smaller reporting company | ¨ | |||
Indicate by check mark whether the registrant is a shell company (as defined in Rule 12b-2 of the Act). Yes ¨ No x
The aggregate market value of ordinary shares held by non-affiliates of the registrant on June 29, 2014 was $849.3 million based on the closing sale price of the ordinary shares on that date, as reported by the NASDAQ Global Select Market. For purposes of the foregoing calculation only, the registrant has assumed that all officers and directors of the registrant, and their affiliated entities, are affiliates.
As of February 13, 2015 there were 48,989,273 ordinary shares outstanding.
DOCUMENTS INCORPORATED BY REFERENCE
None
Table of Contents
TORNIER N.V.
ANNUAL REPORT ON FORM 10-K
| Page | ||||||
| Part I | ||||||
| Item 1. |
7 | |||||
| Item 1A. |
20 | |||||
| Item 1B. |
61 | |||||
| Item 2. |
61 | |||||
| Item 3. |
62 | |||||
| Item 4. |
62 | |||||
| Part II | ||||||
| Item 5. |
63 | |||||
| Item 6. |
65 | |||||
| Item 7. |
Management’s Discussion and Analysis of Financial Condition and Results of Operations |
66 | ||||
| Item 7A. |
84 | |||||
| Item 8. |
86 | |||||
| Item 9. |
Changes in and Disagreements With Accountants on Accounting and Financial Disclosure |
124 | ||||
| Item 9A. |
124 | |||||
| Item 9B. |
124 | |||||
| Part III | ||||||
| Item 10. |
125 | |||||
| Item 11. |
135 | |||||
| Item 12. |
Security Ownership of Certain Beneficial Owners and Management and Related Stockholder Matters |
172 | ||||
| Item 13. |
Certain Relationships and Related Transactions, and Director Independence |
176 | ||||
| Item 14. |
178 | |||||
| Part IV | ||||||
| Item 15. |
180 | |||||
| 181 | ||||||
References to “Tornier,” “Company,” “we,” “our” or “us” in this report refer to Tornier N.V., a public company with limited liability (naamloze vennootschap), and its subsidiaries, unless the context otherwise requires. Except as otherwise noted, references to “Tornier ordinary shares” refer to ordinary shares, par value €0.03 per share, of Tornier and references to “Tornier shareholders” refer to holders of Tornier ordinary shares.
References to “Wright” in this report refer to Wright Medical Group, Inc. and references to the “combined company” or “Wright Medical Group N.V.” refer to Tornier and its consolidated subsidiaries, including Wright and its subsidiaries, after the merger. References to “Merger Sub” refer to Trooper Merger Sub Inc., a newly formed, indirect, wholly-owned subsidiary of Tornier, and a direct, wholly owned subsidiary of Trooper Holdings Inc. References to “Holdco” refer to Trooper Holdings Inc., a newly formed, direct, wholly-owned
2
Table of Contents
subsidiary of Tornier, and parent of Trooper Merger Sub Inc. References to the “merger agreement” refer to that certain agreement and plan of merger, dated as of October 27, 2014, among Wright, Tornier, Merger Sub and Holdco. References to the “merger” refer to the merger of Merger Sub with and into Wright, with Wright surviving as the surviving entity and as an indirect, wholly-owned subsidiary of Tornier as contemplated under the merger agreement. Except as otherwise noted, references to “Wright common stock” or “Wright shares” refer to common stock, par value $0.01 per share, of Wright and references to “Wright shareholders” refer to holders of Wright shares.
This report contains references to among others, our trademarks Aequalis®, Aequalis Ascend®, Aequalis Ascend® Flex™, Aequalis® Fracture™, Aequalis® IM Nail™, Aequalis® Primary™, Aequalis® Reversed Fracture™, Aequalis® Reversed II™, ArthroTunneler™, BioFiber®, Cannulink™, Conexa™, Force Fiber™, Insite®, Insite® FT™, Latitude®, Latitude® EV™, MaxLock®, MaxLock® Extreme™, MiniMaxLock™, Phantom Fiber™, Piton®, PYC Humeral Head™, Salto®, Salto Talaris® Total Ankle™, Salto Talaris®, Salto Talaris® XT™, Simpliciti®, and Tornier®. All other trademarks or trade names referred to in this report are the property of their respective owners.
Our fiscal year-end always falls on the Sunday nearest to December 31. References in this report to a particular year generally refer to the applicable fiscal year. Accordingly, references to “2014” or “the year ended December 28, 2014” mean the fiscal year ended December 28, 2014.
3
Table of Contents
SPECIAL NOTE REGARDING FORWARD-LOOKING STATEMENTS
This report contains “forward-looking statements” within the meaning of the Private Securities Litigation Reform Act of 1995, Section 27A of the Securities Act of 1933, as amended, and Section 21E of the Securities Exchange Act of 1934, as amended. All statements other than statements of historical fact included in this report that address activities, events or developments that we expect, believe or anticipate will or may occur in the future are forward-looking statements including, in particular, the statements about our plans, objectives, strategies and prospects regarding, among other things, our financial condition, operating results and business. We have identified some of these forward-looking statements with words like “believe,” “may,” “will,” “should,” “could,” “expect,” “intend,” “plan,” “predict,” “anticipate,” “estimate” “continue,” other words and terms of similar meaning and the use of future dates. These forward-looking statements are based on current expectations about future events and are subject to uncertainties and factors, which are difficult to predict and many of which are beyond our control and could cause our actual results to differ materially from those matters expressed or implied by our forward-looking statements. Forward-looking statements (including oral representations) are only predictions or statements of current plans and can be affected by inaccurate assumptions we might make or by known or unknown risks and uncertainties, including, among other things, risks associated with:
| • | our proposed merger with Wright, including uncertainties as to the timing of the transaction; uncertainties as to whether our shareholders and Wright shareholders will approve the transaction; the risk that competing offers will be made; the possibility that various closing conditions for the transaction may not be satisfied or waived, including that a governmental entity may prohibit, delay or refuse to grant approval for the consummation of the transaction, or the terms of such approval; the effects of disruption from the transaction making it more difficult to maintain relationships with employees, customers, vendors and other business partners; the risk that shareholder litigation in connection with the transaction may result in significant costs of defense, indemnification and liability; other business effects, including the effects of industry, economic or political conditions outside of Wright’s or our control; the failure to realize synergies and cost-savings from the transaction or delay in realization thereof; the businesses of Wright and Tornier may not be combined successfully, or such combination may take longer, be more difficult, time-consuming or costly to accomplish than expected; operating costs and business disruption following completion of the transaction, including adverse effects on employee retention and on our business relationships with third parties; transaction costs; actual or contingent liabilities; and the adequacy of the combined company’s capital resources; |
| • | our history of operating losses and negative cash flow; |
| • | our reliance on our independent sales agencies and distributors to sell our products and the effect on our business and operating results of agency and distributor changes, transitions to direct selling models in certain geographies, including most recently in the United States, Canada, Australia, Japan, Belgium and Luxembourg, and the transition of our U.S. sales channel towards focusing separately on upper and lower extremity products, and the adverse impact of such changes and transitions on our revenue and other operating results; |
| • | continuing weakness in the global economy, which has been and may continue to be exacerbated by austerity measures taken by several countries, and automatic and discretionary governmental spending cuts, which could reduce the availability or affordability of private insurance or Medicare or other governmental reimbursement or may affect patient decision to undergo elective procedures, and could otherwise adversely affect our business and operating results; |
| • | our reliance on sales of our upper extremity joints and trauma products, including in particular our shoulder products, such as the Aequalis Ascend Flex, which generate a significant portion of our revenue; |
| • | deriving a significant portion of our revenues from operations in certain geographic markets that are subject to political, economic and social instability, including in particular France, and risks and uncertainties involved in launching our products in certain new geographic markets, including in particular Japan, China and Brazil; |
4
Table of Contents
| • | fluctuations in foreign currency exchange rates; |
| • | disruption and turmoil in global credit and financial markets, which may be exacerbated by the inability of certain countries to continue to service their sovereign debt obligations; |
| • | our implementation of a new enterprise resource planning (ERP) system across significant operating locations and potential disruption in our business and internal control over financial reporting; |
| • | not successfully developing and marketing new products and technologies and implementing our business strategy; |
| • | not successfully competing against our existing or potential competitors and the effect of significant recent consolidations amongst our competitors; |
| • | the reliance of our business plan on certain market assumptions; |
| • | our private label manufacturers failing to provide us with sufficient supply of their products, or failing to meet appropriate quality requirements; |
| • | our inability to timely manufacture products or instrument sets to meet demand; |
| • | our plans to bring the manufacturing of certain of our products in-house and possible disruptions we may experience in connection with such transition; |
| • | our plans to increase our gross margins by taking certain actions designed to do so; |
| • | the loss of key suppliers, which may result in our inability to meet customer orders for our products in a timely manner or within our budget; |
| • | our patents and other intellectual property rights not adequately protecting our products or alleged claims of patent infringement by us, which may result in our loss of market share to our competitors and increased expenses; |
| • | the incurrence of significant expenditures of resources to maintain relatively high levels of inventory, which could reduce our cash flows and increase the risk of inventory obsolescence, which could harm our operating results; |
| • | our credit agreement, senior secured term loan and revolving credit facility and risks related thereto; |
| • | our inability to access our revolving credit facility or increase it or raise capital when needed, which could force us to delay, reduce, eliminate or abandon our commercialization efforts or product development programs; |
| • | restrictive affirmative financial and other covenants in our credit agreement that may limit our operating flexibility; |
| • | consolidation in the healthcare industry that could lead to demands for price concessions or the exclusion of some suppliers from certain of our markets, which could have an adverse effect on our business, financial condition or operating results; |
| • | our clinical trials and their results and our reliance on third parties to conduct them; |
| • | regulatory clearances or approvals and the extensive regulatory requirements to which we are subject; |
| • | the compliance of our products with the laws and regulations of the countries in which they are marketed, which compliance may be costly and time-consuming; |
| • | the use, misuse or off-label use of our products that may harm our image in the marketplace or result in injuries that may lead to product liability suits, which could be costly to our business or result in governmental sanctions; |
| • | healthcare reform legislation, including the excise tax on U.S. sales of certain medical devices, and its implementation, possible additional legislation, regulation and other governmental pressure in the |
5
Table of Contents
| United States and globally, which may affect utilization, pricing, reimbursement, taxation and rebate policies of governmental agencies and private payors, which could have an adverse effect on our business, financial condition or operating results; and |
| • | pending and future litigation, which could have an adverse effect on our business, financial condition or operating results. |
For more information regarding these and other uncertainties and factors that could cause our actual results to differ materially from what we have anticipated in our forward-looking statements or otherwise could materially adversely affect our business, financial condition or operating results, see “Part I—Item 1A. Risk Factors.” The risks and uncertainties described above and in the “Part I—Item 1A. Risk Factors” section of this report are not exclusive and further information concerning us and our business, including factors that potentially could materially affect our financial results or condition, may emerge from time to time. We assume no obligation to update, amend or clarify forward-looking statements to reflect actual results or changes in factors or assumptions affecting such forward-looking statements. We advise you, however, to consult any further disclosures we make on related subjects in our future annual reports on Form 10-K, quarterly reports on Form 10-Q and current reports on Form 8-K we file with or furnish to the Securities and Exchange Commission.
6
Table of Contents
Overview
We are a global medical device company focused on providing solutions to surgeons that treat musculoskeletal injuries and disorders of the shoulder, elbow, wrist, hand, ankle and foot, which we refer to as “extremity joints.” We sell to these surgeons a broad line of joint replacement, trauma, sports medicine and biologic products to treat extremity joints. In certain international markets, we also offer joint replacement products for the hip and knee.
We have had a tradition of innovation, intense focus on science and education and a commitment to the advancement of orthopaedics in the pursuit of improved clinical outcomes for patients since our founding over 70 years ago in France by René Tornier. Our history includes the introduction of the porous orthopaedic hip implant, the application of the Morse taper, which is a reliable means of joining modular orthopaedic implants, and more recently, the introduction of the minimally invasive, ultra short stem shoulder both in Europe and in a U.S. clinical trial. This track record of innovation based on science and education stems from our close collaboration with leading orthopaedic surgeons and thought leaders throughout the world.
We believe we are differentiated in the marketplace by our strategic focus on extremities, our full portfolio of upper and lower extremity products, and our extremity-focused sales organization. We offer a broad product portfolio of over 90 extremities products that are designed to provide solutions to our surgeon customers with the goal of improving clinical outcomes for their patients. We believe a more active and aging patient population with higher expectations regarding “quality of life,” an increasing global awareness of extremities solutions, improved clinical outcomes as a result of the use of extremities products and technological advances resulting in specific designs for extremities products that simplify procedures and address unmet needs for early interventions and the growing need for revisions and revision related solutions will drive the market for extremities products.
Our global corporate headquarters are located in Amsterdam, the Netherlands. We also have significant operations located in Bloomington, Minnesota (U.S. headquarters, sales, marketing and distribution and administration), Grenoble, France (OUS headquarters, manufacturing and research and development), Macroom, Ireland (manufacturing), Warsaw, Indiana (research and development) and Medina, Ohio (marketing, research and development). In addition, we conduct local sales and distribution activities across 12 sales offices throughout Europe, Asia, Australia and Canada.
Proposed Merger with Wright Medical Group, Inc.
On October 27, 2014, we entered into an agreement and plan of merger with Wright Medical Group, Inc. The merger agreement provides that, upon the terms and subject to the conditions set forth in the merger agreement, an indirect wholly owned subsidiary of Tornier N.V. will merge with and into Wright, with Wright continuing as the surviving company and an indirect wholly owned subsidiary of Tornier N.V. following the transaction. Following the closing of the transaction, the combined company will conduct business as Wright Medical Group N.V. and Robert J. Palmisano, Wright’s president and chief executive officer, will become president and chief executive officer of the combined company and David H. Mowry, our president and chief executive officer, will become executive vice president and chief operating officer of the combined company. Wright Medical Group N.V.’s board of directors will be comprised of five representatives from Wright’s existing board of directors and five representatives from our existing board of directors, including Mr. Palmisano and Mr. Mowry.
Subject to the terms and conditions of the merger agreement, at the effective time and as a result of the merger, each share of common stock of Wright issued and outstanding immediately prior to the effective time of the merger will be converted into the right to receive 1.0309 Tornier ordinary shares. In addition, at the effective
7
Table of Contents
time and as a result of the merger, all outstanding options to purchase Wright shares and other equity awards based on Wright shares, which are outstanding immediately prior to the effective time of the merger, will become immediately vested and converted into and become, respectively, options to purchase Tornier ordinary shares and with respect to all other Wright equity awards, awards based on Tornier ordinary shares, in each case, on terms substantially identical to those in effect prior to the effective time of the merger, except for the vesting requirements and adjustments to the underlying number of shares and the exercise price based on the exchange ratio used in the merger and other adjustments as provided in the merger agreement. Upon completion of the merger, our shareholders will own approximately 48% of the combined company on a fully diluted basis and Wright shareholders will own approximately 52%.
The transaction is subject to approval of Tornier and Wright shareholders, effectiveness of a Form S-4 registration statement filed by us with the Securities and Exchange Commission and the expiration or termination of applicable waiting periods under the Hart-Scott-Rodino Antitrust Improvements Act of 1976, and other customary closing conditions. The transaction is expected to be completed in midyear 2015.
See “Part I—Item 1A Risk Factors” for a discussion of certain risks related to the merger.
Customers, Sales and Distribution
Our target customers are surgeon specialists focused on treating extremity injuries and disorders, along with general surgeons and podiatrists that perform extremities-related surgical procedures. We provide these surgeons extensive “hands on” orthopaedic training and education, including fellowships and masters courses that are not easily accessible through traditional medical training programs. We believe that our history of innovation and focus on quality and improving clinical outcomes, along with our training programs, allow us to reach surgeons early in their careers and provide on-going value, which includes experiencing the clinical benefits of our products.
While we market our broad portfolio of products to these surgeons, our revenue is generated from sales of our products to healthcare institutions and stocking distributors. We have built and developed local sales organizations to serve these customer groups across the markets in which we operate. Our sales organizations are structured based on the requirements of the local markets in which they serve and consist of sales associates, sales management and support personnel that are either employed by us or provided under contract by an independent distributor or sales agency. Our direct sales employees and independent sales agencies earn commissions based on the revenue they generate from sales of our products.
United States
In the United States, we market and sell a broad offering of products, including products for upper extremity joints and trauma, lower extremity joints and trauma, and sports medicine and biologics. We do not actively market products for the hip or knee, which we refer to as “large joints,” in the United States, although we have clearance from the U.S. Food and Drug Administration, or FDA, to sell certain large joint products. Our sales and distribution system in the United States currently consists of 49 geographic sales territories that are staffed by approximately 170 direct sales representatives and approximately 20 independent sales agencies. These sales representatives and independent sales agencies are generally aligned to selling either our upper extremity products or lower extremity products, but, in some cases, certain agencies or direct sales representatives sell products from both upper and lower extremity product portfolios in their territories.
Over the last two years, we have transitioned our U.S. sales organization from a network of independent sales agencies that sold our full product portfolio to a combination of direct sales team and independent sales agencies that are dedicated to selling either upper extremity joints and trauma products or lower extremity joints and trauma products across the territories in which they serve. While this transition caused disruption in our U.S. business and negatively impacted our revenues in both 2014 and 2013, we continue to believe that this strategy
8
Table of Contents
positions us to leverage our sales force and broad product portfolio toward our goal of achieving above market extremities revenue growth and margin expansion over the long term by allowing us to increase the product proficiency of our sales representatives to better serve our surgeon customers and to increase and optimize our selling opportunities by improving our overall procedure coverage and providing access to new specialists, general surgeons and accounts.
During 2015, we plan to continue to strategically focus on and invest in building a competitively superior U.S. sales organization by training and certifying our sales representatives on our innovative product portfolio, continuing to develop and implement strong performance management practices, and enhancing sales productivity.
International
Internationally, we sell our full product portfolio, including upper and lower extremity products, sports medicine and biologics products and large joints products. We utilize several distribution approaches that are tailored to the needs and requirements of each individual market. Our international sales and distribution system currently consists of 12 direct sales offices and approximately 25 distributors that sell our products in approximately 40 countries. We utilize direct sales organizations in certain mature European markets, Australia, Japan and Canada. In France, our largest international market, we have an upper extremity direct sales force and a separate direct sales force that sells a combination of hip, knee and lower extremity products. In addition, we may also utilize independent stocking distributors in these direct sales areas to further broaden our distribution channel. In certain other geographies, including emerging markets, we utilize independent stocking distributors to market and sell our full product portfolio or select portions of our product portfolio.
As part of our efforts to grow internationally, over the last few years we have expanded our distribution and sales efforts into Mexico, Israel, Argentina, Singapore, Taiwan, Vietnam and the Czech Republic through partnerships with local stocking distributors. In addition, we have selectively transitioned from distributor representation to direct sales representation in certain countries, including Australia, the United Kingdom, Denmark, Belgium, Luxembourg, Japan and Canada during the past few years. We plan to continue this strategy of international expansion, in combination with the tailoring of our international distribution approach to the needs and requirements of each individual market. This strategy may result in additional sales coverage transitions in the future.
We generated $199.3 million, or 58% of our total revenue, in the United States during the year ended December 28, 2014, compared to $182.1 million and $156.8 million during the years ended December 29, 2013 and December 30, 2012, respectively. We generated $145.7 million, or 42% of our total revenue, in international markets outside of the United States during the year ended December 28, 2014, compared to $128.9 million and $120.8 million during the years ended December 29, 2013 and December 30, 2012, respectively. Our total revenue in France was $64.1 million in 2014, $58.2 million in 2013 and $52.7 million in 2012. Our total revenue in the Netherlands was $6.2 million in 2014, $5.8 million in 2013 and $5.3 million in 2012.
Product Portfolio
We manage our business in one reportable segment that includes the design, manufacture, marketing and sales of orthopaedic products. We offer a broad product portfolio of over 90 extremities products that are designed to provide solutions to our surgeon customers with the goal of improving clinical outcomes for their patients. Our product portfolio consists of the following product categories:
| Product category |
Target addressable geography | |
| Upper extremity joints and trauma |
United States and International | |
| Lower extremity joints and trauma |
United States and International | |
| Sports medicine and biologics |
United States and International | |
| Large joints and other |
Selected International Markets |
9
Table of Contents
Although the industry traditionally organizes the orthopaedic market based on the mechanical features of the products, we organize our product categories in a way that aligns with the types of surgeons who most frequently use them. Therefore, we distinguish upper extremity joints and trauma from lower extremity joints and trauma, as opposed to viewing joint implants and trauma products as distinct product categories. Descriptions of our product categories are detailed below.
See the Fiscal Year Comparisons contained in “Part II—Item 7. Management’s Discussion and Analysis of Financial Condition and Results of Operations” section of this report for a three-year revenue history by product category.
Upper Extremity Joints and Trauma
The upper extremity joints and trauma product category includes joint implants and bone fixation devices for the shoulder, hand, wrist and elbow. Our global revenue from this category for the year ended December 28, 2014 was $213.3 million, or 62% of total revenue, which represents growth of 16% over the prior year.
We expect the shoulder to continue to be the largest and most important product category for us for the foreseeable future. Our shoulder joint implants are used to treat painful shoulder conditions due to arthritis, irreparable rotator cuff tendon tears, bone disease, fractured humeral heads or failed previous shoulder replacement surgery. Our shoulder products include the following:
| • | Our total joint replacement products have two components—a humeral implant consisting of a metal stem or base attached to a metal head, and a plastic implant for the glenoid (shoulder socket). Together, these two components mimic the function of a natural shoulder joint. Our products in this area include the Aequalis Ascend, Aequalis Primary, Aequalis PerFORM and Simpliciti shoulder systems. The Simpliciti minimally invasive, ultra short stem shoulder is currently available in certain international markets and, subject to FDA clearance, we expect to launch Simpliciti in the United States in the middle of 2015. |
| • | Our hemi joint replacement products replace only the humeral head and allow it to articulate against the native glenoid. These products include our PYC Humeral Head and Inspyre. PYC stands for pyrocarbon, which is a biocompatible material. The PYC Humeral Head is currently available in certain international markets. |
| • | Our reversed joint replacement products, which include the Aequalis Reversed II shoulder, are used in arthritic patients lacking rotator cuff function. The components are different from a traditional “total” shoulder in that the humeral implant has the plastic socket and the glenoid has the metal head. This design has the biomechanical impact of shifting the pivot point of the joint away from the body centerline and recruiting the deltoid muscles to enable the patient to elevate the arm. |
| • | Our convertible joint replacement products are modular implants that can be converted from a total or hemi shoulder implant to a reversed implant at a later date if the patient requires it. Our Aequalis Ascend Flex convertible shoulder system provides anatomic and reversed options within a single system and offers precise intra-operative implant-to-patient fit and easy conversion to reversed if necessary. |
| • | Our resurfacing implants, which include the Aequalis Resurfacing Head, are designed to preserve bone, which may benefit more active or younger patients with shoulder arthritis. |
| • | Trauma devices, such as plates, screws and nails, are non-articulating implants used to help stabilize fractures of the humerus. Our upper extremity trauma products include the Aequalis IM Nail, Aequalis Proximal Humeral Plate, Aequalis Fracture shoulder and Aequalis Reversed Fracture shoulder. |
We also offer joint replacement and trauma products including implants, pins, plates and screws that are used to treat the hand, wrist and elbow. One of our distinctive product offerings for these smaller, non-load
10
Table of Contents
bearing joints are implants made from pyrocarbon, which has low joint surface friction and a high resistance to wear. We offer a wide range of pyrocarbon implants internationally and have begun to introduce some of these products into the United States. Our Latitude EV total elbow prosthesis gives surgeons the ability to reproduce the natural flexion/extension axis and restore natural kinematics of the elbow with its anatomic design.
Lower Extremity Joints and Trauma
The lower extremity joints and trauma category includes joint implants and bone fixation devices, including plates, screws, and nails, for the foot and ankle. Our global revenue from lower extremity joints and trauma for the year ended December 28, 2014 was $59.2 million, or 17% of total revenue, which represents growth of 1% over the prior year.
Our lower extremity products include the following:
| • | Our joint replacement products include implants for the ankle that involve replacing the joint with an articulating multi-component implant. These joint implants may be mobile bearing, in which the plastic component is free to slide relative to the metal bearing surfaces, or fixed bearing, in which this component is constrained. We offer fixed bearing implants outside the United States, including the Salto Total Ankle prosthesis, and precision bearing implants globally, including the Salto Talaris Total Ankle mobile version. In 2014, we also commercially released the Salto XT, which is a revision system for previous ankle implant replacements. |
| • | Our bone fixation products include a broad range of anatomically designed plates, screws and nails. These products are used to stabilize and heal fractured bones, joint dislocation, correct deformities and fuse arthritic joints of the foot and ankle that result from either acute injuries or chronic wear and tear. These devices are also utilized in the treatment of a wide range of non-traumatic surgical procedures. These products include the MaxLock, MiniMaxLock, and MaxLock Extreme plate and screw systems and the Cannulink Intraosseous Fixation System (IFS) for hammertoe correction. |
Sports Medicine and Biologics
The sports medicine product category includes products used across several anatomic sites to mechanically repair tissue-to-tissue or tissue-to-bone injuries. Rotator cuff repair is the largest sub-segment in the sports medicine market. Other procedures relevant to extremities include shoulder instability treatment, Achilles tendon repair and soft tissue reconstruction of the foot and ankle and several other soft tissue repair procedures. Our sports medicine products include the Insite FT and Piton anchor products, ArthroTunneler arthroscopic tunneling device and Force Fiber suture products.
The field of biologics employs tissue engineering and regenerative medicine technologies focused on remodeling and regeneration of tendons, ligaments, bone and cartilage. Biologically or synthetically derived soft tissue grafts and scaffolds are used to treat soft tissue injures and are complementary to many sports medicine applications, including rotator cuff tendon repair and Achilles tendon repair. Hard tissue biologics products are used in many bone fusion or trauma cases where healing potential may be compromised and additional biologic factors are desired to enhance healing, where the surgeon needs additional bone or in cases where the surgeon wishes to use materials that are naturally incorporated by the body over time. Our biologics products include the BioFiber biologic absorbable scaffold products and Phantom Fiber high strength, resorbable suture products.
Because of its close relationship to extremity joint replacement and bone fixation, our sports medicine and biologics portfolio is comprised of products used to complement our upper and lower extremity product portfolios, providing surgeons a variety of products that may be used in upper and lower extremity surgical procedures.
Our revenue from sports medicine and biologics for the year ended December 28, 2014 was $14.2 million, or 4% of total revenue, which represents a decline in revenue of 4% over the prior year. This decrease in sports medicine and biologics revenue reflects our increased focus on our extremities products.
11
Table of Contents
Large Joints and Other
The large joints and other product category includes hip and knee joint replacement implants and other ancillary products, including instrumentation. Hip and knee joint replacement products are used to treat patients with painful arthritis in these larger joints and to treat femoral fracture patients. We offer these products in France and select international geographies. We currently have no plans to actively market our large joint implants in the United States. Our global revenue from large joints and other products for the year ended December 28, 2014 was $58.2 million, or 17% of total revenue, which represents growth of 10% over the prior year.
Manufacturing and Supply
We utilize a combination of internal manufacturing and a network of qualified outsourced manufacturing partners to produce our products and surgical instrumentation. We manufacture our internally-sourced products in three locations: Montbonnot, France, Grenoble, France and Macroom, Ireland. Our internal manufacturing operations are focused on product quality, continuous improvement and efficiency. Our operations in France have a long history and deep experience with orthopaedic manufacturing and process innovation. Additionally, we believe we are the only company to have vertically integrated operations for the manufacturing of pyrocarbon orthopaedic products. We believe that this capability gives us a competitive advantage in design for manufacturing and prototyping of this innovative material. Our Ireland location has been practicing Lean cellular manufacturing concepts for many years with a philosophy focused on high productivity, flexibility and capacity optimization.
We strive to optimize our internal manufacturing capacity and generally insource manufacturing where we can; however, we are willing to outsource products to our manufacturing partners when it provides us with cost efficiency, expertise, flexibility, and in instances where we need additional capacity. We believe that the improvement of our gross margins over the last several years has been the result of driving production process efficiencies, managing our material and labor costs, and optimizing the balance between insourced and outsourced manufacturing.
We use a diverse and broad range of raw materials in the manufacturing of our products. We purchase all of our raw materials and select components used in the manufacturing of our products from external suppliers. In addition, we purchase some supplies from single sources for reasons of proprietary know-how, quality assurance, sole source availability, cost-effectiveness or constraints resulting from regulatory requirements. We work closely with our suppliers to ensure continuity of supply while maintaining high quality and reliability. Although we have no long-term supply contracts with any of these suppliers, we have not experienced, to date, any significant difficulty in locating and obtaining the materials necessary to fulfill our production requirements.
Some of our products are provided by suppliers under private-label distribution agreements. Under these agreements, the supplier generally retains the intellectual property and exclusive manufacturing rights. The supplier private labels the products under the Tornier brand for sale in certain fields of use and geographic territories. These agreements may be subject to minimum purchase or sales obligations and are terminable by either party upon notice. Our private-label distribution agreements expire between this year and 2016 and are renewable under certain conditions or by mutual agreement. Our private-label distribution agreements do not, individually or in the aggregate, represent a material portion of our business and we are not substantially dependent on them.
Our business, and the orthopaedic industry in general, is capital intensive, particularly as it relates to inventory levels and surgical instrumentation. Our business requires a significant level of inventory driven by our global footprint, the requirement to provide products within a short period of time, and the number of different sizes of many of our products. In addition, we must maintain a significant investment in surgical instrumentation as we provide these instruments to healthcare facilities and surgeons for their use to facilitate the implantation of our products.
12
Table of Contents
Research and Development
We are committed to a strong research and development program focused on innovation. Our research and development teams are organized and aligned with our product marketing teams and are focused on improving clinical outcomes by designing innovative, clinically differentiated products with improved ease-of-use and by developing new product features and enhanced surgical techniques that can be leveraged across a broader base of surgeon customers. Our internal research and development teams work closely with external research and development consultants and a global network of leading surgeon inventors to ensure we have broad access to best-in-class ideas and technologies to drive our product development pipeline. We also have an active business development team that actively evaluates novel technologies and development stage products, which our internal team can assist in bringing to market.
Our research and development expenses were $24.1 million, $22.4 million and $22.5 million in 2014, 2013 and 2012, respectively. As of December 28, 2014, we had a research and development staff of 68 people, or 6% of our total employees, principally located in Montbonnot, France and Warsaw, Indiana, with additional staff in Grenoble, France, Bloomington, Minnesota and Medina, Ohio.
Competition
The market for orthopaedic devices is highly competitive and subject to rapid and profound technological change. Our currently marketed products are, and any future products we commercialize likely will be, subject to intense competition. We believe that the principal competitive factors include innovative product features and design, brand reputation, strong customer service, and the ability to provide a full line of orthopaedic products.
We face competition from large diversified orthopaedic manufacturers, such as DePuy Orthopaedics, Inc., a Johnson & Johnson subsidiary, Biomet, Inc., Zimmer Corporation, Stryker Corporation and Smith & Nephew, Inc., and established mid-sized orthopaedic manufacturers, such as Arthrex, Inc., Wright Medical Group, Inc., Exactech, Inc. and Integra LifeSciences Corporation. Many of the companies developing or marketing competitive orthopaedic products enjoy several competitive advantages over us, including:
| • | greater financial and human resources for product development and sales and marketing; |
| • | greater name recognition; |
| • | established relationships with surgeons, hospitals and third party payors; |
| • | broader product lines and the ability to offer rebates or bundle products to offer greater discounts or incentives to gain a competitive advantage; and |
| • | established sales and marketing and distribution networks. |
We also compete against smaller, entrepreneurial companies with niche product lines. Our competitors may increase their focus on the extremities market, which is our primary strategic focus. Our competitors may develop and patent processes or products earlier than we can, obtain regulatory clearances or approvals for competing products more rapidly than we can or develop more effective or less expensive products or technologies that render our technology or products obsolete or non-competitive. We also compete with those and other organizations in recruiting and retaining qualified scientific, management and sales personnel, as well as in acquiring technologies complementary to our products or advantageous to our business. If our competitors are more successful than us in these matters, we may be unable to compete successfully against our existing and future competitors.
Intellectual Property
Patents, trade secrets, know-how and other proprietary rights are important to the continued success of our business. We believe our patents are valuable and our trade secrets, especially with respect to manufacturing
13
Table of Contents
processes, materials and product design, are also important in maintaining the proprietary nature of our product lines. We also rely upon continuing technological innovation, licensing opportunities, our creative product development and marketing staff, knowledge and experience to develop and maintain our competitive position.
We protect our proprietary rights through a variety of methods. As a condition of employment, we generally require employees to execute an employment agreement relating to the confidential nature of and company ownership of proprietary information and assigning intellectual property rights to us. We generally require confidentiality agreements with vendors, consultants and others who may have access to proprietary information. We generally limit access to our facilities and review the release of company information in advance of public disclosure.
We cannot be assured that our patents will provide competitive advantages for our products, or that our competitors will not challenge or circumvent these rights. In addition, we cannot be assured that the U.S. Patent and Trademark Office, or USPTO, or foreign patent offices will issue any of our pending patent applications. The USPTO and foreign patent offices also may reject or require significant narrowing of claims in our pending patent applications affecting patents issuing from the pending patent applications. Any patents issuing from our pending patent applications may not provide us with significant commercial protection. We could incur substantial costs in proceedings before the USPTO or foreign patent offices, including opposition and other post-grant proceedings. These proceedings could result in adverse decisions as to the patentability or validity of our patent claims. Additionally, the laws of some of the countries in which our products are or may be sold may not protect our products and intellectual property to the same extent as the laws in the United States, or at all. Litigation also may be necessary to enforce patent rights we own.
We rely on trade secrets and other unpatented proprietary technology. We cannot be assured that we can meaningfully protect our rights in our unpatented proprietary technology or that others will not independently develop substantially equivalent proprietary products or processes or otherwise gain access to our proprietary technology. We seek to protect our trade secrets and proprietary know-how, in part, with confidentiality agreements with employees and consultants. We cannot be assured, however, that the agreements will not be breached, that we will have adequate remedies for any breach or that our competitors will not discover or independently develop our trade secrets. Litigation also may be necessary to protect trade secrets or techniques we own.
While we do not believe that any of our products infringe any valid claims of patents or other proprietary rights held by third parties, we cannot be assured that we do not infringe upon any patents or other proprietary rights held by third parties. If our products were found to infringe upon any proprietary right of a third party, we could be required to pay significant damages or license fees to the third party or cease production, marketing and distribution of those products. Litigation also may be necessary to defend ourselves against claims of infringement of patents or other proprietary rights held by third parties.
Government Regulation
We are subject to varying degrees of government regulation in the countries in which we conduct business. In some countries, such as the United States, Europe, Canada and Japan, government regulation is significant and, we believe there is a general trend toward increased and more stringent regulation throughout the world. As a manufacturer and marketer of medical devices, we are subject to extensive regulation by the U.S. Food and Drug Administration, other federal governmental agencies and state agencies in the United States and similar foreign governmental authorities in countries located outside the United States. These regulations generally govern the introduction of new medical devices, the observance of certain standards with respect to the design, manufacture, testing, labeling, promotion and sales of the devices, the maintenance of certain records, the ability to track devices, the reporting of potential product defects, the import and export of devices, as well as other matters. In addition, as a participant in the healthcare industry, we are also subject to various other U.S. federal, state and foreign laws. We strive to comply with regulatory requirements governing our products and operations
14
Table of Contents
and to conduct our affairs in an ethical manner. This practice is reflected in our code of business conduct and ethics, various other compliance policies and through the responsibility of the nominating, corporate governance and compliance committee of our board of directors, which oversees our compliance with legal and regulatory requirements as well as our ethical standards and policies. We devote significant time, effort and expense to addressing the extensive government and regulatory requirements applicable to our business. Governmental regulatory actions against us could result in warning letters, delays in approving or refusal to approve a product, the recall or seizure of our products, suspension or revocation of the authority necessary for the production or sale of our products, and other civil and criminal sanctions.
United States
In the United States, numerous laws and regulations govern all the processes by which medical devices are brought to market and marketed. These include the U.S. Federal Food, Drug and Cosmetic Act and regulations issued or promulgated thereunder, among others. The FDA has enacted regulations that control all aspects of the development, manufacture, advertising, promotion and post-market surveillance of medical devices. In addition, the FDA controls the access of products to market through processes designed to ensure that only products that are safe and effective are made available to the public. All of our products currently marketed in the United States have been listed, cleared or approved by the FDA, in most cases by 510(k) clearance, except for certain low-risk devices that do not require FDA review and approval or clearance prior to commercial distribution, but are still subject to FDA regulations and must be listed with the FDA.
Medical devices are subject to varying degrees of regulatory control in the United States and are classified in one of three classes depending on risk and the extent of controls the FDA determines are necessary to reasonably ensure their safety and effectiveness. Most of our products fall into an FDA classification that requires the submission of a premarket notification (510(k)) to the FDA. This process requires us to demonstrate that the device to be marketed is “substantially equivalent” to a previously cleared 510(k) device or a device that was in commercial distribution before May 28, 1976, referred to as a “predicate” device. In making this determination, the FDA compares the proposed new device to the predicate device. After a device receives 510(k) clearance, any product modification that could significantly affect the safety or effectiveness of the product, or any product modification that would constitute a significant change in intended use, requires a new 510(k) clearance. If the modified device is no longer substantially equivalent, it would require either de novo or a pre-market, or PMA, approval. The FDA is increasingly moving devices with slightly different proposed indication statement or different technological features off the 510(k) path and on to the de novo path resulting in more time and expense for us.
If the FDA determines that a product does not qualify for 510(k) clearance, then we would be required to make a submission for a de novo approval or a PMA before we can market the product. The PMA process requires us to provide clinical and laboratory data that establishes that the new device is safe and effective in an independent and absolute sense as opposed to in a comparative sense as with a 510(k). The PMA can include post-approval conditions including, among other things, restrictions on labeling, promotion, sale and distribution, data reporting (surveillance), or requirements to do additional clinical studies post-approval. Even after approval of a PMA, the FDA must grant subsequent approvals for a new PMA or PMA supplement to authorize certain modifications to the device, its labeling or its manufacturing process.
One or more clinical trials may be required to support a 510(k) application or a de novo submission and almost always are required to support a PMA application. Clinical trials of unapproved or uncleared medical devices or devices being studied for uses for which they are not approved or cleared (investigational devices) must be conducted in compliance with FDA requirements. If human clinical trials of a device are required and the device presents a significant risk, the sponsor of the trial must file an investigational device exemption (IDE) application prior to commencing human clinical trials. The IDE application must be supported by data, typically including the results of animal and/or laboratory testing. If the IDE application is approved by the FDA and one or more institutional review boards (IRBs), human clinical trials may begin at a specific number of institutional
15
Table of Contents
investigational sites with the specific number of patients approved by the FDA. If the device presents a non-significant risk to the patient, a sponsor may begin the clinical trial after obtaining approval for the trial by one or more IRBs without separate approval from the FDA. During the trial, the sponsor must comply with the FDA’s IDE requirements including, for example, investigator selection, trial monitoring, adverse event reporting and recordkeeping. The investigators must obtain patient informed consent, rigorously follow the investigational plan and trial protocol, control the disposition of investigational devices and comply with reporting and recordkeeping requirements. We, the FDA and the IRB at each institution at which a clinical trial is being conducted may suspend a clinical trial at any time for various reasons, including a belief that the subjects are being exposed to an unacceptable risk. We are currently conducting a few clinical trials.
After a device is cleared or approved for marketing, numerous and pervasive regulatory requirements continue to apply and we continue to be subject to inspection by the FDA to determine our compliance with these requirements, as do our suppliers, contract manufacturers and contract testing laboratories. These requirements include, among others, the following:
| • | Quality System regulations, which govern, among other things, how manufacturers design, test, manufacture, modify, label, exercise quality control over and document manufacturing of their products; |
| • | labeling and claims regulations, which require that promotion is truthful, not misleading, fairly balanced and provide adequate directions for use and that all claims are substantiated, and also prohibit the promotion of products for unapproved or “off-label” uses and impose other restrictions on labeling; |
| • | FDA guidance of off-label dissemination of information and responding to unsolicited requests for information; |
| • | Medical Device Reporting regulation, which requires reporting to the FDA certain adverse experiences associated with use of the product; |
| • | complaint handling regulations designed to track, monitor and resolve complaints related to our products; |
| • | Part 806 reporting of certain corrections, removals, enhancements and recalls of products; |
| • | complying with the new federal law and regulations requiring Unique Device Identifiers (UDI) on devices and also requiring the submission of certain information about each device to FDA’s Global Unique Device Identification Database (GUDID); and |
| • | in some cases, ongoing monitoring and tracking of our products’ performance and periodic reporting to the FDA of such performance results. |
Some of our biologics tissue-based products are subject not only to the FDA’s medical device regulations, but also specific regulations governing human cells, tissues and cellular and tissue-based products, or HCT/Ps. Section 361 of the Public Health Service Act, or PHSA, authorizes the FDA to issue regulations to prevent the introduction, transmission or spread of communicable disease. HCT/Ps regulated as “361” HCT/Ps are subject to requirements relating to registering facilities and listing products with the FDA, screening and testing for tissue donor eligibility, Good Tissue Practice when processing, storing, labeling, and distributing HCT/Ps, including required labeling information, stringent record keeping, and adverse event reporting, among other applicable requirements and laws.
We are subject to various U.S. federal and state laws concerning healthcare fraud and abuse, including anti-kickback and false claims laws, and other matters. The federal Anti-Kickback Statute (and similar state laws) prohibits certain illegal remuneration to physicians and other health care providers that may financially bias prescription decisions and result in an over-utilization of goods and services reimbursed by the federal government. The False Claims Act (and similar state laws) prohibits conduct on the part of a manufacturer which may cause or induce an inappropriate reimbursement for devices reimbursed by the federal government. These
16
Table of Contents
laws are administered by, among others, the U.S. Department of Justice, the Office of Inspector General of the Department of Health and Human Services and state attorneys general. Many of these agencies have increased their enforcement activities with respect to medical device manufacturers in recent years. Violations of these laws are punishable by criminal and/or civil sanctions, including, in some instances, fines, imprisonment and exclusion from participation in federal government healthcare programs, including Medicare, Medicaid and Veterans Administration (VA) health programs. We are also subject to the U.S. federal Physician Payments Sunshine Act and various state laws on reporting remunerative relationships with healthcare customers. We are also subject to various federal and state laws that protect the confidentiality of certain patient health information, including patient medical records, and restrict the use and disclosure of patient health information by healthcare providers, such as the Health Insurance Portability and Accountability Act of 1996, or HIPAA.
The FDA, in cooperation with U.S. Customs and Border Protection, administers controls over the import of medical devices into the United States. The U.S. Customs and Border Protection imposes its own regulatory requirements on the import of our products, including inspection and possible sanctions for noncompliance. We are also subject to foreign trade controls administered by certain U.S. government agencies, including the Bureau of Industry and Security within the Commerce Department and the Office of Foreign Assets Control within the Treasury Department.
International
Outside the United States, we are subject to government regulation in the countries in which we operate. Although many of the regulations applicable to our products in these countries are similar to those of the FDA, these regulations vary significantly from country to country and with respect to the nature of the particular medical device. The time required to obtain foreign approvals to market our products may be longer or shorter than the time required in the United States, and requirements for such approvals may differ from FDA requirements.
To market our product devices in the member countries of the European Union, we are required to comply with the European Medical Device Directives and to obtain CE mark certification. CE mark certification is the European symbol of adherence to quality assurance standards and compliance with applicable European Medical Device Directives. Under the European Medical Device Directives, all medical devices must qualify for CE marking. To obtain authorization to affix the CE mark to one of our products, a recognized European Notified Body must assess our quality systems and the product’s conformity to the requirements of the European Medical Device Directives. We are subject to inspection by the Notified Bodies for compliance with these requirements. We also are required to comply with regulations of other countries in which our products are sold, such as obtaining Ministry of Health Labor and Welfare approval in Japan, Health Protection Branch approval in Canada and Therapeutic Goods Administration approval in Australia.
Our manufacturing facilities in France and Ireland are subject to environmental health and safety laws and regulations, including those relating to the use, registration, handling, storage, disposal, recycling and human exposure to hazardous materials and discharges of substances in the air, water and land. For example, in France, requirements known as the Installations Classées pour la Protection de l’Environnement regime provide for specific environmental standards related to industrial operations such as noise, water treatment, air quality and energy consumption. In Ireland, our manufacturing facilities are likewise subject to local environmental regulations, such as related to water pollution and water quality, which are administered by the Environmental Protection Agency.
Our operations in countries outside the United States are subject to various other laws such as those regarding recordkeeping and privacy, laws regarding sanctioned countries, entities and persons, customs, import-export, laws regarding transactions in foreign countries and the U.S. Foreign Corrupt Practices Act, which generally prohibits covered entities and their intermediaries from engaging in bribery or making other prohibited payments to foreign officials for the purpose of obtaining or retaining business or other benefits, as well as similar anti-corruption laws of other countries, such as the UK Bribery Act.
17
Table of Contents
Third-Party Coverage and Reimbursement
Sales volumes and prices of our products depend in large part on the availability of coverage and reimbursement from third-party payors. Third-party payors include governmental programs such as Medicare and Medicaid, private insurance plans and workers’ compensation plans. These third-party payors may deny coverage or reimbursement for a product or procedure if they determine that the product or procedure was not medically appropriate or necessary. The third-party payors also may place limitations on the types of physicians that can perform specific types of procedures or the care setting in which the procedure is performed, i.e., out-patient or in-hospital. Also, third-party payors are increasingly auditing and challenging the prices charged for medical products and services with concern for upcoding, miscoding, using inappropriate modifiers, or billing for inappropriate care settings. Some third-party payors must approve coverage for new or innovative devices or procedures before they will reimburse healthcare providers who use the products or therapies. Even though a new product may have been cleared for commercial distribution by the FDA, we may find limited demand for the product until reimbursement approval has been obtained from governmental and private third-party payors.
The Centers for Medicare & Medicaid Services, or CMS, the agency responsible for administering the Medicare program, sets coverage and reimbursement policies for the Medicare program in the United States. CMS policies may alter coverage and payment related to our product portfolio in the future. These changes may occur as the result of national coverage determinations issued by CMS or as the result of local coverage determinations by contractors under contract with CMS to review and make coverage and payment decisions. Medicaid programs are funded by both federal and state governments, may vary from state to state and from year to year and will likely play an even larger role in healthcare funding pursuant to the recently enacted Patient Protection and Affordable Care Act, as amended by the Health Care and Education Affordability Reconciliation Act, collectively, the PPACA.
A key component in ensuring whether the appropriate payment amount is received for physician and other services, including those procedures using our products, is the existence of a Current Procedural Terminology, or CPT, code. To receive payment, health care practitioners must submit claims to insurers using these codes for payment for medical services. CPT codes are assigned, maintained and annually updated by the American Medical Association and its CPT Editorial Board. If the CPT codes that apply to the procedures performed using our products are changed, reimbursement for performances of these procedures may be adversely affected.
In the United States, some insured individuals enroll in managed care programs, which monitor and often require pre-approval of the services that a member will receive. Some managed care programs pay their providers on a per capita (patient) basis, which puts the providers at financial risk for the services provided to their patients by paying these providers a predetermined payment per member per month and, consequently, may limit the willingness of these providers to use our products.
We believe that the overall escalating cost of medical products and services being paid for by the government and private health insurance has led to, and will continue to lead to, increased pressures on the healthcare and medical device industry to reduce the costs of products and services. All third-party reimbursement programs are developing increasingly sophisticated methods of controlling healthcare costs through prospective reimbursement and capitation programs, group purchasing, redesign of benefits, requiring second opinions prior to major surgery, careful review of bills, encouragement of healthier lifestyles and other preventative services and exploration of more cost-effective methods of delivering healthcare. There can be no assurance that third-party reimbursement and coverage will be available or adequate, or that future legislation, regulation or reimbursement policies of third-party payors will not adversely affect the demand for our products or our ability to sell these products on a profitable basis. The unavailability or inadequacy of third-party payor coverage or reimbursement could have a material adverse effect on our business, operating results and financial condition.
Outside the United States, reimbursement and healthcare payment systems vary significantly by country, and many countries have instituted price ceilings on specific product lines and procedures. There can be no
18
Table of Contents
assurance that procedures using our products will be considered medically reasonable and necessary for a specific indication, that our products will be considered cost-effective by third-party payors, that an adequate level of reimbursement will be available or that the third-party payors’ reimbursement policies will not adversely affect our ability to sell our products profitably. We believe we have received increased requests for clinical data for the support of registration and reimbursement outside the United States and Europe. More and more, local, product specific reimbursement law is applied as an overlay to medical device regulation, which has provided an additional layer of clearance requirement. Specifically, Australia now requires that clinical data for clearance and reimbursement be in the form of prospective, multi-center studies, a high bar not previously applied. In addition, in France, certain innovative devices (such as some of our products made from pyrolytic carbon), have been identified as needing to provide clinical evidence to support a “mark-specific” reimbursement.
Seasonality and Backlog
Our business is somewhat seasonal in nature, as many of our products are used in elective procedures, which typically decline during June, July and August and can increase at the end of the calendar year once annual deductibles have been met on health insurance plans. Additionally, elective procedures typically decline in certain parts of Europe during the third quarter of the year due to holiday and vacation schedules.
The time period between the placement of an order for our products and shipment is generally short. As such, we do not consider our backlog of firm orders to be material to an understanding of our business.
Employees
As of December 28, 2014, we had 1,121 employees, including 437 in manufacturing and operations, 68 in research and development and the remaining in sales, marketing, quality, regulatory and related administrative support. Of our 1,121 worldwide employees, 423 employees were located in the United States and 698 employees were located outside of the United States, primarily in France and Ireland.
Financial Information about Geographical Areas
See Note 13 to our consolidated financial statements for information regarding our revenues and long-lived assets by geographic area.
Available Information
Our principal executive offices are located at Prins Bernhardplein 200, 1097 JB Amsterdam, The Netherlands. Our telephone number at this address is (+ 31) 20 675-4002. Our agent for service of process in the United States is CT Corporation, 1209 Orange Street., Wilmington, Delaware 19801. Our corporate website is located at www.tornier.com. The information contained on our website or connected to our website is not incorporated by reference into and should not be considered part of this report.
We make available, free of charge and through our Internet corporate website, our annual reports on Form 10-K, quarterly reports on Form 10-Q, current reports on Form 8-K, and any amendments to any such reports filed or furnished pursuant to Section 13(a) or 15(d) of the Securities Exchange Act of 1934, as amended, as soon as reasonably practicable after we electronically file such material with, or furnish it to, the Securities and Exchange Commission.
19
Table of Contents
We are affected by risks specific to us as well as factors that affect all businesses operating in a global market. We also are subject to risks in connection with our proposed merger with Wright. The following is a discussion of the specific risks that could materially adversely affect our business, financial condition or operating results:
Risks Related to Our Proposed Merger with Wright
The obligation of Wright and Tornier to complete the merger is conditioned on, among other things, the expiration or termination of the applicable waiting period under the HSR Act, which if delayed, not granted or granted with unacceptable conditions, may delay or jeopardize the consummation of the merger, result in additional expenditures of money and resources and/or reduce the anticipated benefits of the merger.
The proposed merger between Tornier and Wright is subject to customary closing conditions, including the expiration or termination of the applicable waiting period under the HSR Act. There is no assurance that clearance under the HSR Act will be obtained. Moreover, as a condition to their clearance of the transaction under the HSR Act, the U.S. Federal Trade Commission or the Antitrust Division within the U.S. Department of Justice may impose requirements, limitations or costs or require divestitures or place restrictions on the conduct of the business of the combined company after the closing. These requirements, limitations, costs, divestitures or restrictions could jeopardize or delay the effective time of the merger, adversely affect the timing and ability of the combined company to integrate Wright’s and Tornier’s operations and/or reduce the anticipated benefits of the merger.
Wright and Tornier may agree to material requirements, limitations, costs, restrictions, in the case of divestitures in order to obtain clearance under the HSR Act, any of which could result in a failure to consummate the merger or have a material adverse effect on the business and operating results of the combined company. Pursuant to the merger agreement, Wright will control the terms of, and assets included in, any divestiture involving assets that generated U.S. revenue less than $15 million during the twelve months ended September 30, 2014, subject to using commercially reasonable efforts to contest any divestiture proposed by a governmental body. The parties must jointly agree on any more significant divestiture.
The merger is subject to certain other conditions to closing that could result in the merger not being consummated or being delayed, any of which could negatively impact the share price and future business and operating results of Tornier.
Consummation of the proposed merger between Tornier and Wright is subject to a number of customary conditions, other than expiration or termination of the applicable waiting period under the HSR Act, including, but not limited to, the approval of the merger agreement by the Wright and Tornier shareholders. There is no assurance that Wright and Tornier will receive the necessary approvals or satisfy the other conditions necessary for the completion of the merger. If any conditions to the merger are not satisfied or, where waiver is permissible, not waived, the merger will not be consummated.
Failure to complete the merger would prevent Tornier from realizing the anticipated benefits of the merger. Tornier has incurred significant costs and expects to continue to incur significant costs associated with the merger, including transaction fees, professional services, taxes and other costs related to the merger. In the event that the merger is not completed, Tornier will remain liable for these costs and expenses. Further, if the merger is not completed and the merger agreement is terminated, under certain circumstances, Tornier may be required to pay Wright a termination fee of $46 million and/or pay Wright expenses of up to $5 million.
In addition, the current market price of Tornier ordinary shares may reflect a market assumption that the merger will occur, and a failure to complete the merger could result in a negative perception by the market of Tornier generally and a resulting decline in the market price of Tornier ordinary shares. Any delay in the
20
Table of Contents
consummation of the merger or any uncertainty about the consummation of the merger could also negatively impact the share price and future business and operating results of Tornier. No assurance can be provided that the merger will be consummated, that there will be no delay in the consummation of the merger or that the merger will be consummated on the terms contemplated by the merger agreement.
Wright and Tornier may waive one or more conditions to the merger without resoliciting shareholder approval for the merger.
Certain conditions to Wright’s and Tornier’s obligations to complete the merger may be waived, in whole or in part, to the extent legally allowed, either unilaterally or by agreement of Wright and Tornier. In the event of a waiver of a condition, the boards of directors of Wright and Tornier will evaluate the materiality of any such waiver to determine whether a supplement to the joint proxy statement/prospectus relating to the merger, once finalized, or an amendment to the registration statement of which the joint proxy statement/prospectus is a part or a resolicitation of proxies is necessary. In the event that the board of directors of Tornier determines any such waiver is not significant enough to require resolicitation of shareholders, it will have the discretion to complete the merger without seeking further shareholder approval. The conditions requiring the approval of each company’s shareholders, however, cannot be waived.
The exchange ratio to be used in connection with the merger to determine the number of Tornier ordinary shares to issue to Wright shareholders is fixed and will not be adjusted in the event of any change in the price of either Wright shares or Tornier ordinary shares prior to the completion of the merger.
Upon completion of the merger, each Wright share will be converted into the right to receive 1.0309 Tornier ordinary shares. This exchange ratio will not be adjusted for changes in the market price of either Wright shares or Tornier ordinary shares between the date of signing the merger agreement and completion of the merger. Changes in the price of Tornier ordinary shares prior to the merger will affect the value of Tornier ordinary shares that Wright shareholders will receive on the closing date. The exchange ratio will, however, be adjusted appropriately to fully reflect the effect of any reclassification, stock split, stock dividend or distribution, recapitalization or other similar transaction with respect to either the Wright shares or Tornier ordinary shares prior to the completion of the merger.
The prices of Wright shares and Tornier ordinary shares on the date of the completion of the merger may vary from their prices on the date the merger agreement was executed, on the date of this report and on the date of each shareholder meeting. As a result, the value represented by the exchange ratio will also vary. These variations could result from changes in the business, operations or prospects of Wright or Tornier prior to or following the completion of the merger, regulatory considerations, general market and economic conditions and other factors both within and beyond the control of Wright or Tornier.
The merger agreement with Wright contains provisions that restrict Tornier’s ability to pursue alternatives to the merger and, in specified circumstances, could require Tornier to pay Wright a termination fee and expense reimbursement.
Under the merger agreement with Wright, Tornier agreed not to (1) take certain actions to solicit proposals relating to alternative business combination transactions or (2) subject to certain exceptions, including the receipt of a “superior proposal” (as such term is defined in the merger agreement), enter into discussions or an agreement concerning or provide confidential information in connection with any proposals for alternative business combination transactions. In certain specified circumstances upon termination of the merger agreement, Tornier would be required to pay Wright a termination fee of $46 million and reimburse Wright for its merger-related expenses in an amount not to exceed $5 million. These provisions could discourage a third party that may have an interest in acquiring all or a significant part of Tornier from considering or proposing that acquisition, even if such third party were prepared to enter into a transaction that is more favorable to Tornier and the Tornier shareholders than the proposed merger with Wright.
21
Table of Contents
Whether or not the merger is completed, the announcement and pendency of the merger could impact or cause disruptions in Tornier’s business, which could have an adverse effect on Tornier’s businesses and operating results.
Whether or not the merger with Wright is completed, the announcement and pendency of the merger could cause disruptions in or otherwise negatively impact Tornier’s business and operating results, including among others:
| • | Tornier employees may experience uncertainty about their future roles with the combined company, which might adversely affect Tornier’s ability to retain and hire key personnel and other employees; |
| • | the attention of Tornier’s management may be directed toward completion of the merger and transaction-related considerations and may be diverted from the day-to-day operations and pursuit of other opportunities that could have been beneficial to Tornier’s business; and |
| • | customers, distributors, independent sales agencies, vendors or suppliers may seek to modify or terminate their business relationships with Tornier, or delay or defer decisions concerning Tornier. |
These disruptions could be exacerbated by a delay in the completion of the merger or termination of the merger agreement and could have an adverse effect on Tornier’s business, operating results or prospects if the merger is not completed or the business, operating results or prospects of the combined company if the merger is completed.
Current Tornier shareholders will have a reduced ownership and voting interest in the combined company after the merger.
Upon completion of the merger, Wright shareholders will own approximately 52% of the combined company and Tornier shareholders will own approximately 48% of the combined company on a fully diluted basis. Tornier shareholders currently have the right to vote for Tornier’s directors and on other matters affecting Tornier. When the merger occurs, each Tornier shareholder will remain a shareholder of the combined company with a percentage ownership of the combined company that will be smaller than the shareholder’s percentage ownership of Tornier prior to the merger. As a result, current Tornier shareholders will have less voting power in the combined company than they now have with respect to Tornier.
The directors and executive officers of Tornier have interests in the merger that may be different from, or in addition to, those of other Tornier shareholders, which could have influenced their decisions to support or approve the merger.
In considering whether to approve the merger once the merger proposals are submitted to a vote of Tornier shareholders, Tornier shareholders should recognize that the directors and executive officers of Tornier have interests in the merger that are in addition to their interests as Tornier shareholders. These interests may include, among others, continued service as a director or an executive officer of the combined company, accelerated vesting of certain equity-based awards or certain severance benefits and payment of certain amounts in connection with the merger, as applicable. These interests, among others, may influence the directors and executive officers of Tornier to support or approve the proposals to be submitted to a vote of the Tornier shareholders at the Tornier extraordinary general meeting anticipated to be held in connection with the merger.
If counterparties to certain agreements with Wright or Tornier do not consent to the merger, change of control rights under those agreements may be triggered as a result of the merger, which could cause the combined company to lose the benefit of such agreements and incur liabilities or replacement costs.
Wright and Tornier could be parties to agreements or possess permits that contain change of control provisions that will be triggered as a result of the merger. If the counterparties to these agreements or the authorities responsible for such permits do not consent to the merger, the counterparties or authorities may have
22
Table of Contents
the ability to exercise certain rights (including termination rights), resulting in Wright or Tornier incurring liabilities as a consequence of breaching such agreements or operating without such permits, or causing Wright or Tornier to lose the benefit of such agreements or permits or incur costs in seeking replacement agreements or permits.
The combined company may need additional financing to satisfy its anticipated liquidity challenges, which may not be available on favorable terms at the time it is needed and which could reduce the combined company’s operational and strategic flexibility.
The combined company may face liquidity challenges during the next several years in light of significant contingent liabilities and financial obligations and commitments, including, among others, acquisition-related contingent consideration payments and outstanding indebtedness, Tornier’s outstanding indebtedness in the amount of approximately $67.7 million as of December 28, 2014 that will become due and payable upon completion of the merger, transaction-related expenses, and the combined company’s anticipated operating losses for the next few years. In the event that the combined company requires additional working capital to fund future operations, the combined company could seek to acquire that through additional equity or debt financing arrangements, which may or may not be available on favorable terms at such time. If the combined company raises additional funds by issuing equity securities, the combined company’s shareholders may experience dilution. Debt financing, if available, may involve covenants restricting the combined company’s operations or its ability to incur additional debt. Any debt financing or additional equity that the combined company raises may contain terms that are not favorable to the combined company or its shareholders. If the combined company does not have, or is not able to obtain, sufficient funds, it may have to delay development or commercialization of its products or license to third parties the rights to commercialize products or technologies that it would otherwise seek to commercialize. The combined company also may have to reduce marketing, customer support or other resources devoted to its products or cease operations.
The combined company may be unable to successfully integrate Wright’s and Tornier’s operations or to realize the anticipated cost savings and other potential benefits of the merger in a timely manner or at all. As a result, the value of Tornier ordinary shares may be adversely affected.
We entered into the merger agreement with Wright because we believe that the merger will be beneficial to Tornier and our shareholders and other stakeholders. Achieving the anticipated potential benefits of the merger will depend in part upon whether the combined company is able to integrate Wright’s and Tornier’s operations in an efficient and effective manner. The integration process may not be completed smoothly or successfully. The necessity of coordinating geographically separated organizations, systems and facilities and addressing possible differences in business backgrounds, corporate cultures and management philosophies may increase the difficulties of integration. Tornier and Wright operate numerous systems, including those involving management information, purchasing, accounting and finance, sales, billing, payroll, employee benefits and regulatory compliance. Tornier and Wright may also have inconsistencies in standards, controls, procedures or policies that could affect the ability of the combined company to maintain relationships with customers and employees after the merger or to achieve the anticipated benefits of the merger. The integration of certain operations following the merger will require the dedication of significant management resources, which may temporarily distract management’s attention from day-to-day business. Employee uncertainty and lack of focus during the integration process may also disrupt the combined company’s business. Any inability of management to integrate successfully the operations of the two companies or to do so within a longer time frame than expected could have a material adverse effect on the combined company’s business and operating results. The combined company may not be able to achieve the anticipated operating and cost synergies or long-term strategic benefits of the merger. An inability to realize the full extent of, or any of, the anticipated benefits of the merger, as well as any delays encountered in the integration process, could have an adverse effect on the business and operating results of the combined company, which may affect the value of the combined company’s ordinary shares after the completion of the merger.
23
Table of Contents
The success of the combined company after the merger will depend in part upon the ability of Wright and Tornier to retain key employees of both companies. Competition for qualified personnel can be very intense. In addition, key employees may depart because of issues relating to the uncertainty or difficulty of integration or a desire not to remain with the combined company, or in the case of sales personnel, overlapping sales territories. Accordingly, no assurance can be given that key employees will be retained.
Wright and Tornier have not yet determined the exact nature of how the businesses and operations of the two companies will be combined after the merger. The actual integration may result in additional and unforeseen expenses, and the anticipated benefits of the integration plan may not be realized.
Four class action lawsuits have been filed and additional lawsuits may be filed against Wright, Tornier, Holdco and/or Merger Sub relating to the merger. An adverse ruling in any such lawsuit may prevent the merger from being consummated.
On November 25, 2014, two purported Wright shareholders, Anthony Marks (as Trustee for Marks Clan Super) and Paul Parshall, filed class action complaints challenging the merger in the Chancery Court of Shelby County Tennessee, for the Thirtieth Judicial District, at Memphis and the Court of Chancery of the state of Delaware, respectively. Marks amended his complaint on January 7, 2015, and Parshall amended his complaint on February 6, 2015. On November 26, 2014, a third purported Wright shareholder, City of Warwick Retirement System, filed a class action complaint challenging the merger in the Circuit Court of Tennessee, for the Thirtieth Judicial District, at Memphis, followed by an amended complaint, filed on January 5, 2015. On December 2, 2014, a fourth purported Wright shareholder, Paulette Jacques, filed a class action complaint challenging the merger in the Chancery Court of Shelby County Tennessee, for the Thirtieth Judicial District, at Memphis, followed by an amended complaint filed on January 7, 2015.
The four complaints all name as defendants Wright, Tornier, Holdco, Merger Sub and the members of the board of directors of Wright. The amended complaint filed by Jacques also names Warburg Pincus LLC as a defendant. The complaints seek, among other relief, an order enjoining or rescinding the merger and an award of attorneys’ fees and costs on the grounds that the Wright board or directors breached their fiduciary duty in connection with entering into the merger agreement, approving the merger, and causing Wright to issue a preliminary Form S-4 registration statement that purportedly fails to disclose allegedly material information about the merger. The complaints further allege that Wright, Tornier, Holdco and Merger Sub aided and abetted the alleged breaches of fiduciary duties by the Wright board of directors, while the amended complaint filed by Jacques also makes this same allegation against Warburg Pincus LLC. It is possible that these complaints will be amended further to make additional claims and/or that additional lawsuits making similar or additional claims relating to the merger will be brought.
One of the conditions to completion of the merger is the absence of any order being in effect that prohibits the consummation of the merger. Accordingly, if any of these plaintiffs or any future plaintiff is successful in obtaining an order enjoining consummation of the merger, then such order may prevent the merger from being completed, or from being completed within the expected time frame.
Risks Related to Our Business and Industry
We have a history of operating losses and negative cash flow and may never achieve profitability.
We have a history of operating losses and at December 28, 2014, we had an accumulated deficit of $301.6 million. Our ability to achieve profitability will be influenced by many factors, including the success of our proposed merger with Wright, the extent and duration of our future operating losses, the level and timing of future revenue and expenditures, development, commercialization and market acceptance of new products, the results and scope of ongoing research and development projects, the success of our direct sales force and independent distributor and sales agency organization and transitions related thereto, competing technologies and
24
Table of Contents
market developments and regulatory requirements and delays. As a result, we may continue to incur operating losses for the foreseeable future. These losses will continue to have an adverse impact on our shareholders’ equity, and we may never achieve or sustain profitability.
We have transitioned our U.S. sales channel from a network of independent sales agencies that sold our full product portfolio to a combination of direct sales teams and independent sales agencies that, for the most part, are individually focused on selling either upper extremity products or lower extremity products across the territories that they serve. This transition has had, and may continue to have, an adverse effect on our operations and operating results and, ultimately, may not prove to be successful.
In the United States, we historically had a single sales channel that consisted of a network of independent commission-based sales agencies, along with direct sales representation in certain territories. We have transitioned to a combination of direct sales teams and independent sales agencies that, for the most part, are individually focused on selling either upper extremity products or lower extremity products across the territories that they serve. We believe this strategy provides increased focus to our sales teams and allows us to increase the product proficiency of our sales representatives and increase our selling opportunities by improving our overall procedure coverage, leveraging our entire product portfolio, and accessing new specialists, general surgeons and accounts. However, we may be incorrect and it is possible that our separate sales strategy may be unsuccessful.
To create these separate upper and lower extremity sales channels, we terminated relationships with certain independent sales agencies and transitioned these territories to new agencies or established direct sales representation; acquired sales agencies and established direct sales representation; or transitioned an upper or lower extremity product portfolio between agencies or from an agency to a new direct sales team. This transition caused disruption in our U.S. sales channel during 2014 and 2013 and it is possible that this disruption may continue into 2015 as we hire additional sales representatives and educate, train and optimize our sales teams. It is also possible that we may become subject to litigation and incur future charges and cash expenditures in connection with this transition, which charges and cash expenditures would adversely affect our operating results.
We rely on distributors, independent sales agencies and their representatives to market and sell our products in certain territories. A failure to retain our existing relationships with these distributors, independent sales agencies and their representatives or additional changes and transitions with respect to our sales organization could have an adverse effect on our operations and operating results.
Our success is partially dependent upon our ability to retain and motivate our distributors, independent sales agencies and their representatives to sell our products in certain territories. We depend on their sales and service expertise and their relationships with surgeons in the marketplace. As of February 10, 2015, our distribution system in the United States consisted of approximately 170 direct sales representatives and approximately 20 independent sales agencies that sell our products. Internationally, we currently utilize several distribution approaches depending on individual market requirements and, as a result, as of February 10, 2015, our international distribution system consisted of 12 direct sales offices and approximately 25 distributors that sell our products in approximately 40 countries. As part of our strategy to grow internationally, we have selectively converted from distributor representation to direct sales representation in certain countries, including the United Kingdom, Denmark, Belgium, Luxembourg, Japan, Australia and Canada, and we have selectively converted from direct sales representation to distributor representation in certain countries, including Spain, during the past few years.
We do not control our distributors or independent sales agencies and they may not be successful in implementing our marketing plans. Some of our distributors and independent sales agencies do not sell our products exclusively and may offer similar products from other orthopaedic companies. Our distributors and independent sales agencies may terminate their contracts with us, may devote insufficient sales efforts to our products or may focus their sales efforts on other products that produce greater commissions for them. A failure
25
Table of Contents
to maintain our existing relationships with or changes and transitions with respect to our distributors and independent sales agencies and their representatives could have an adverse effect on our operations and operating results.
If we do not successfully develop and market new products and technologies and implement our business strategy, our business and operating results may be adversely affected.
We may not be able to successfully implement our business strategy either as an independent company or after the completion of our proposed merger with Wright. To implement our business strategy we need to, among other things, develop and introduce new extremity joint products, find new applications for and improve our existing products, properly identify and anticipate our surgeons’ and their patients’ needs, obtain regulatory clearances or approvals for new products and applications and educate surgeons about the clinical and cost benefits of our products. We are continually engaged in product development and improvement programs, and we expect new products to account for a significant portion of our future growth. If we do not continue to introduce new products and technologies, or if those products and technologies are not accepted, we may not be successful. Moreover, research and development efforts may require a substantial investment of time and resources before we are adequately able to determine the commercial viability of a new product, technology, material or innovation. Demand for our products also could change in ways we may not anticipate due to evolving customer needs, changing demographics, slow industry growth rates, evolving surgical philosophies and evolving industry standards, among others. Additionally, our competitors’ new products and technologies may precede our products to market, may be more effective or less expensive than our products or may render our products obsolete. Our new products and technologies also could render our existing products obsolete and thus adversely affect sales of our existing products and lead to increased expense for excess and obsolete inventory. For example, we believe that sales of our Aequalis Ascend Flex convertible shoulder system may adversely affect demand for and sales of our other mature shoulder products. Our targeted surgeons practice in areas such as shoulder, upper extremities, lower extremities, sports medicine and reconstructive and general orthopaedics, and our strategy of focusing primarily on these surgeons may not be successful. Even if we successfully implement our business strategy, our operating results may not improve. We may decide to alter or discontinue aspects of our business strategy and may adopt different strategies due to business or competitive factors, which could negatively impact our operating results.
We may be unable to compete successfully against our existing or potential competitors, in which case our revenue and operating results may be negatively affected and we may not grow.
The market for orthopaedic devices is highly competitive and subject to rapid and profound technological change. Our success depends, in part, on our ability to maintain a competitive position in the development of technologies and products for use by our customers. We face competition from large diversified orthopaedic manufacturers, such as DePuy Orthopaedics, Inc., a Johnson & Johnson subsidiary, Zimmer Corporation, Biomet, Inc., Stryker Corporation and Smith & Nephew, Inc., and established mid-sized orthopaedic manufacturers, such as Arthrex, Inc., Wright Medical Group, Inc., Exactech, Inc. and Integra LifeSciences Corporation. Many of the companies developing or marketing competitive orthopaedic products enjoy several competitive advantages over us, including:
| • | greater financial and human resources for product development and sales and marketing; |
| • | greater name recognition; |
| • | established relationships with surgeons, hospitals and third-party payors; |
| • | broader product lines and the ability to offer rebates or bundle products to offer greater discounts or incentives to gain a competitive advantage; and |
| • | established sales and marketing and distribution networks. |
26
Table of Contents
We also compete against smaller, entrepreneurial companies with niche product lines. Some of our competitors have indicated an increased focus on the extremities market, which is our primary strategic focus. Our competitors may develop and patent processes or products earlier than us, obtain regulatory clearances or approvals for competing products more rapidly than us, develop more effective or less expensive products or technologies that render our technology or products obsolete or non-competitive or acquire technologies and technology licenses complementary to our products or advantageous to our business. Not all of our sales and other personnel have non-compete agreements. We also compete with other organizations in recruiting and retaining qualified scientific, sales and management personnel. If our competitors are more successful than us in these matters, we may be unable to compete successfully against our existing or future competitors.
The impact of consolidation and acquisitions of competitors is difficult to predict and may harm our business.
The orthopaedic industry is intensely competitive and has been subject to increasing consolidation recently and over the last few years. For instance, in October 2014, we announced a merger with Wright Medical Group, Inc.; in June 2014, Stryker Corporation announced its acquisition of Bone Innovations, Inc. which it completed during third quarter of 2014; in May 2014, Smith & Nephew, Inc. acquired ArthroCare Corporation; in April 2014, Zimmer Holdings, Inc. announced its acquisition of Biomet, Inc.; Wright Medical Group, Inc. acquired OrthoPro in February 2014, Solana Surgical, LLC in January 2014 and Biotech International in November 2013 and Stryker Corporation acquired MAKO Surgical Corp. in December 2013. Consolidation in our industry not involving our company could result in existing competitors increasing their market share through business combinations and result in stronger competitors, which could have a material adverse effect on our business, financial condition and results of operations. We may be unable to compete successfully in an increasingly consolidated industry and cannot predict with certainty how industry consolidation will affect our competitors or us.
We derive a significant portion of our revenue from operations in markets outside the United States, which exposes us to additional risks.
We derive a significant portion of our revenue from operations in markets outside the United States. Our distribution system as of February 10, 2015, outside the United States consisted of 12 direct sales offices and approximately 25 distribution partners, who together sell in approximately 40 countries. Most of these countries are, to some degree, subject to political, economic and social instability. For 2014 and 2013, approximately 42% and 41% of our revenue, respectively, was derived from our operations outside the United States, including 19% of our revenue from France for both 2014 and 2013. Any material decrease in our international revenue may negatively affect our profitability. In the future, we intend to further expand our international operations into key markets, such as Brazil and China, as we have done, for example, in 2013, when we acquired certain assets of our distributors in Australia, Canada and the United Kingdom and established direct sales forces in such countries. Our international sales operations expose us and our representatives, agents and distributors to risks inherent in operating in foreign jurisdictions. These risks include:
| • | the imposition of additional U.S. and foreign governmental controls or regulations on orthopaedic implants and biologics products; |
| • | the imposition of costly and lengthy new export and import license requirements; |
| • | the imposition of U.S. or international sanctions against a country, company, person or entity with whom we do business that would restrict or prohibit continued business with that country, company, person or entity; |
| • | economic instability, including the European sovereign debt crisis and the austerity measures taken and to be taken by certain countries in response to such crisis, and the currency risk between the U.S. dollar and foreign currencies in our target markets; |
| • | the imposition of restrictions on the activities of foreign agents, representatives and distributors; |
27
Table of Contents
| • | scrutiny of foreign tax authorities, which could result in significant fines, penalties and additional taxes being imposed upon us; |
| • | a shortage of high-quality international salespeople and distributors; |
| • | loss of any key personnel who possess proprietary knowledge or are otherwise important to our success in international markets; |
| • | significant and financially debilitating product liability exposure of which we are currently unaware; |
| • | changes in third-party reimbursement policies that may require some of the patients who receive our products to directly absorb medical costs or that may require us to sell our products at lower prices; |
| • | unexpected changes in foreign regulatory requirements; |
| • | differing local product preferences and product requirements; |
| • | changes in tariffs and other trade restrictions; |
| • | work stoppages or strikes in the healthcare industry; |
| • | difficulties in enforcing and defending intellectual property rights; |
| • | foreign exchange controls that might prevent us from repatriating cash earned in countries outside the Netherlands; |
| • | complex data privacy requirements and labor relations laws; and |
| • | exposure to different legal and political standards. |
Not only are we subject to the laws of jurisdictions located outside the United States in which we do business, but we also are subject to U.S. laws governing our activities in foreign countries, including various import-export laws, customs and import laws, anti-boycott laws and embargoes. For example, the FDA Export Reform and Enhancement Act of 1996 requires that, when exporting medical devices from the United States for sale in a foreign country, depending on the type of product being exported, the regulatory status of the product and the country to which the device is exported, we must ensure, among other things, that the device is produced in accordance with the specifications of the foreign purchaser; not in conflict with the laws of the country to which it is intended for export; labeled for export; and not offered for sale domestically. In addition, we must maintain records relevant to product export and, if requested by the foreign government, obtain a certificate of exportability. In some instances, prior notification to or approval from the FDA is required prior to export. The FDA can delay or deny export authorization if all applicable requirements are not satisfied. Imports of approved medical devices into the United States also are subject to requirements including registration of establishment, listing of devices, manufacturing in accordance with the quality system regulation, medical device reporting of adverse events, and premarket notification 510(k) clearance or premarket approval, or PMA, among others and if applicable. If our business activities were determined to violate these laws, regulations or rules, we could suffer serious consequences.
In addition, a portion of our international revenue is made through distributors. As a result, we are dependent upon the financial health of our distributors. We also are dependent upon the compliance of our distributors with foreign laws and the U.S. Foreign Corrupt Practices Act, or the FCPA, as it relates to certain “facilitating” payments made to those employed by or acting on behalf of a foreign government in the procurement, sale and prescription of medical devices. If a distributor were to go out of business, it would take substantial time, cost and resources to find a suitable replacement and the products held by such distributor may not be returned to us or to a subsequent distributor in a timely manner or at all.
28
Table of Contents
Disruption and turmoil in global credit and financial markets, which may be exacerbated by the inability of certain countries to continue to service their sovereign debt obligations and certain austerity measures countries have implemented, and the possible negative implications of such events to the global economy, may negatively impact our business, operating results and financial condition.
A substantial portion of our revenue outside the United States is generated in the European Union, or EU, including in particular France. The credit and economic conditions within certain European Union countries, including France, Greece, Ireland, Italy, Portugal and Spain in particular, and the possibility that they may default on their debt obligations, have contributed to instability in global credit and financial markets during the past couple of years. The continued possibility that such EU member states may default on their debt obligations, the continued uncertainty regarding international and the European Union’s financial support programs and the continued possibility that other EU member states may experience similar financial troubles could further disrupt global credit and financial markets. While the ultimate outcome of these events cannot be predicted, it is possible that such events could continue to have a negative effect on the global economy as a whole, and our business, operating results and financial condition, in particular. For example, if the European sovereign debt crisis continues or worsens, the negative implications to the global economy and us could be significant. Since a significant amount of our trade receivables are with hospitals that are dependent upon governmental health care systems in many countries, repayment of such receivables is dependent upon the financial stability of the economies of those countries. A deterioration of economic conditions in such countries may increase the average length of time it takes for us to collect on our outstanding accounts receivable in these countries or even our ability to collect such receivables.
In addition, if the European sovereign debt crisis continues or worsens, the value of the Euro could deteriorate or lead to the re-introduction of individual currencies in one or more Eurozone countries, or, in more extreme circumstances, the possible dissolution of the Euro currency entirely, all of which could negatively impact our business, operating results and financial condition in light of our substantial operations in and revenues derived from customers in the European Union. Should the Euro dissolve entirely, the legal and contractual consequences for holders of Euro denominated obligations would be determined by laws in effect at such time. These potential developments, or market perceptions concerning these and related issues, could adversely affect the value of our Euro denominated assets and obligations. In addition, concerns over the effect of this financial crisis on financial institutions in Europe and globally could lead to tightening of the credit and financial markets, which could negatively impact the ability of companies to borrow money from their existing lenders, obtain credit from other sources or raise financing to fund their operations. This could negatively impact our customers’ ability to purchase our products, our suppliers’ ability to provide us with materials and components and our ability, if needed, to finance our operations on commercially reasonable terms, or at all. We believe that European governmental austerity policies have reduced and may continue to reduce the amount of money available to purchase medical products, including our products. These austerity measures could negatively impact overall procedure volumes and result in increased pricing pressure for our products and the products of our competitors. Any or all of these events, as well as any additional austerity measures that may be taken which, among other things, could result in decreased utilization, pricing and reimbursement, could negatively impact our business, operating results and financial condition.
Weakness in the global economy is likely to adversely affect our business until an economic recovery is underway.
Many of our products are used in procedures covered by private insurance, and some of these procedures may be considered elective. We believe that weakness in the global economy may reduce the availability or affordability of private insurance or may affect patient decisions to undergo elective procedures. If current economic conditions do not continue to recover or worsen, we expect that increasing levels of unemployment and pressures to contain healthcare costs could adversely affect the global growth rate of procedure volume, which could have a material adverse effect on our revenue and operating results.
29
Table of Contents
Fluctuations in foreign currency rates could result in declines in our reported revenue and earnings.
A substantial portion of our revenue outside the United States is generated in Europe and other countries in Latin America and Asia where the amounts are denominated in currencies other than the U.S. dollar. For purposes of preparing our consolidated financial statements, these amounts are converted into U.S. dollars, the value of which varies with currency exchange rate fluctuations. For revenue not denominated in U.S. dollars, if there is an increase in the value of the U.S. dollar relative to the specified foreign currency, we will receive less in U.S. dollars than before the increase in the exchange rate, which could negatively impact our operating results. Although we address currency risk management through regular operating and financing activities, and more recently through hedging activities, those actions may not prove to be fully effective, and hedging activities involve additional risks.
Our business plan relies on assumptions about the market for our products, which, if incorrect, may adversely affect our revenue.
We believe that the aging of the general population and increasingly active lifestyles and expectations regarding “quality of life” will continue and that these trends will increase the need for our products. We also believe that if clinical outcomes are improved as a result of extremity procedures over alternative treatments or no treatment, awareness regarding such extremity procedures will increase, more surgeons will recommend extremity procedures and more patients will elect to undergo them as opposed to alternative treatments or no treatment. Since most of our products are designed specifically for extremities and early intervention, we believe the market for our extremities products in particular will continue to grow. The actual demand for our products, however, could differ materially from our projected demand if our assumptions regarding these trends and acceptance of our products by the medical community prove to be incorrect or do not materialize, or if non-surgical treatments gain more widespread acceptance as a viable alternative to our orthopaedic implants. If this occurs, our revenue and other operating results could be adversely affected.
Our upper extremity joints and trauma products, including in particular our shoulder products, generate a significant portion of our revenue. Accordingly, if revenue of these products were to decline, our operating results would be adversely affected.
Our upper extremity joints and trauma products, which includes joint implants and bone fixation devices for the shoulder, hand, wrist and elbow, generate a significant portion of our revenue. During 2014 and 2013, our upper extremity joints and trauma products generated approximately 62% and 59% of our revenue, respectively. We expect the shoulder to continue to be the largest and most important product category for us for the foreseeable future, especially in light of the success of our Aequalis Ascend Flex. However, our expectations may prove to be incorrect and it is possible that the market acceptance of the Aequalis Ascend Flex will not meet our expectations or may have the effect of negatively impacting sales of our other shoulder products. A decline in our upper extremity joints and trauma product revenue as a result of lack of market acceptance of new products, the effect of new products on sales of existing products, increased competition, regulatory matters, intellectual property matters or any other reason would negatively impact our operating results.
We obtain some of our products through private-label distribution agreements that subject us to minimum performance and other criteria. Our failure to satisfy those criteria could cause us to lose those rights of distribution
We have entered into private-label distribution agreements with manufacturers of some of our products. These manufacturers brand their products according to our specifications, and we may have exclusive rights in certain fields of use and territories to sell these products subject to minimum purchase, sales or other performance criteria. Though these agreements do not individually or in the aggregate represent a material portion of our business, if we do not meet these performance criteria, or fail to renew these agreements, we may lose exclusivity in a field of use or territory or cease to have any rights to these products, which could have an
30
Table of Contents
adverse effect on our revenue. Furthermore, some of these manufacturers may be smaller, undercapitalized companies that may not have sufficient resources to continue operations or to continue to supply us sufficient product without additional access to capital.
If our private-label manufacturers fail to provide us with sufficient supply of their products, or if their supply fails to meet appropriate quality requirements, our business could suffer.
Our private-label manufacturers are sole source suppliers of the products we purchase from them. Given the specialized nature of the products they provide, we may not be able to locate or establish additional or replacement manufacturers of these products. Moreover, these private-label manufacturers typically own the intellectual property associated with their products, and even if we could find a replacement manufacturer for the product, we may not have sufficient rights to enable the replacement party to manufacture the product. While we have entered into agreements with our private-label manufacturers that we believe will provide us sufficient quantities of products, we cannot assure you that they will do so, or that any products they do provide us will not contain defects in quality. Our private-label manufacturing agreements have terms expiring between this year and 2016 and are renewable under certain conditions or by mutual agreement. The agreements also include some or all of the following provisions allowing for termination under certain circumstances: (i) either party’s uncured material breach of the terms and conditions of the agreement; (ii) either party filing for bankruptcy, being bankrupt or becoming insolvent, suspending payments, dissolving or ceasing commercial activity; (iii) our inability to meet market development milestones and ongoing sales targets; (iv) termination without cause, provided that payments are made to the distributor; (v) a merger or acquisition of one of the parties by a third party; (vi) the enactment of a government law or regulation that restricts either party’s right to terminate or renew the contract or invalidates any provision of the agreement or (vii) the occurrence of a “force majeure,” including natural disaster, explosion or war.
We also rely on these private-label manufacturers to comply with the regulations of the FDA, the competent authorities of the Member States of the European Economic Area, or EEA, or foreign regulatory authorities and their failure to comply with strictly enforced regulatory requirements could expose us to regulatory action including warning letters, product recalls, termination of distribution, product seizures or civil penalties. Any quality control problems that we experience with respect to products manufactured by our private-label manufacturers, any inability by us to provide our customers with sufficient supply of products or any investigations or enforcement actions by the FDA, the competent authorities of the Member States of the EEA or other foreign regulatory authorities could adversely affect our reputation or commercialization of our products and adversely and materially affect our business and operating results.
We intend to continue to bring in-house the manufacturing of certain of our products that are currently manufactured by third parties. Should we encounter difficulties in manufacturing these or other products, it could adversely affect our business.
We intend to continue our initiative to bring in-house the manufacturing of certain of our products, including in particular our Aequalis Ascend and Simpliciti shoulder products. The technology and the manufacturing process for our shoulder products is highly complex, involving a large number of unique parts, and we may encounter difficulties in manufacturing these products in-house. There is no assurance that we will be able to meet the volume and quality requirements associated with our shoulder products. In addition, other products that we choose to bring in-house could encounter similar difficulties. Manufacturing and product quality issues may also arise as we increase the scale of our production. If our products do not consistently meet our customers’ performance expectations, our reputation may be harmed, and we may be unable to generate sufficient revenue to become profitable. Any delay or inability in bringing in-house the manufacturing of our products could diminish our ability to sell our products, which could result in lost revenue and seriously harm our business, financial condition and operating results.
31
Table of Contents
Failure to comply with the U.S. Foreign Corrupt Practices Act could subject us to, among other things, penalties and legal expenses that could harm our reputation and have a material adverse effect on our business, financial condition and operating results.
Our U.S. operations, including those of our U.S. operating subsidiaries, Tornier, Inc. and OrthoHelix Surgical Designs, Inc., are subject to the U.S. Foreign Corrupt Practices Act. We are required to comply with the FCPA, which generally prohibits covered entities and their intermediaries from engaging in bribery or making other prohibited payments to foreign officials for the purpose of obtaining or retaining business or other benefits. In addition, the FCPA imposes accounting standards and requirements on publicly traded U.S. corporations and their foreign affiliates, which are intended to prevent the diversion of corporate funds to the payment of bribes and other improper payments, and to prevent the establishment of “off books” slush funds from which such improper payments can be made. We also are subject to similar anticorruption legislation implemented in Europe under the Organization for Economic Co-operation and Development’s Convention on Combating Bribery of Foreign Public Officials in International Business Transactions. We either operate or plan to operate in a number of jurisdictions that pose a high risk of potential violations of the FCPA and other anticorruption laws, such as China and Brazil, and we utilize a number of third-party sales representatives for whose actions we could be held liable under the FCPA. We inform our personnel and third-party sales representatives of the requirements of the FCPA and other anticorruption laws, including, but not limited to their reporting requirements. We also have developed and will continue to develop and implement systems for formalizing contracting processes, performing due diligence on agents and improving our recordkeeping and auditing practices regarding these regulations. However, there is no guarantee that our employees, third-party sales representatives or other agents have not or will not engage in conduct undetected by our processes and for which we might be held responsible under the FCPA or other anticorruption laws.
If our employees, third-party sales representatives or other agents are found to have engaged in such practices, we could suffer severe penalties, including criminal and civil penalties, disgorgement and other remedial measures, including further changes or enhancements to our procedures, policies and controls, as well as potential personnel changes and disciplinary actions. During the past few years, the SEC has increased its enforcement of violations of the FCPA against companies, including several medical device companies. Although we do not believe we are currently a target, any investigation of any potential violations of the FCPA or other anticorruption laws by U.S. or foreign authorities also could have an adverse impact on our business, financial condition and operating results.
Certain foreign companies, including some of our competitors, are not subject to prohibitions as strict as those under the FCPA or, even if subjected to strict prohibitions, such prohibitions may be laxly enforced in practice. If our competitors engage in corruption, extortion, bribery, pay-offs, theft or other fraudulent practices, they may receive preferential treatment from personnel of some companies, giving our competitors an advantage in securing business, or from government officials, who might give them priority in obtaining new licenses, which would put us at a disadvantage.
If we lose one of our key suppliers, we may be unable to meet customer orders for our products in a timely manner or within our budget.
We use a number of suppliers for raw materials and select components that we need to manufacture our products. These suppliers must provide the materials and components to our standards for us to meet our quality and regulatory requirements. We obtain some key raw materials and select components from a single source or a limited number of sources. For example, we rely on one supplier for raw materials and select components in several of our products, including Poco Graphite, Inc., which supplies graphite for our pyrocarbon products; CeramTec AG, or CeramTec, which supplies ceramic for ceramic heads for hips; and Heymark Metals Ltd., which supplies cobalt chrome used in certain of our hip, shoulder and elbow products. Establishing additional or replacement suppliers for these components, and obtaining regulatory clearances or approvals that may result from adding or replacing suppliers, could take a substantial amount of time, result in increased costs and impair
32
Table of Contents
our ability to produce our products, which would adversely impact our business and operating results. We do not have long-term or other supply contracts with our sole source suppliers and instead rely on purchase orders. As a result, those suppliers may elect not to supply us with product or to supply us with less product than we need, and we will have limited rights to cause them to do otherwise. In addition, some of our products, which we acquire from third parties, are highly technical and are required to meet exacting specifications, and any quality control problems that we experience with respect to the products supplied by third parties could adversely and materially affect our reputation or commercialization of our products and adversely and materially affect our business, operating results and prospects. Furthermore, some of these suppliers are smaller companies. To the extent that any of these suppliers are, or become, undercapitalized and do not otherwise have sufficient resources to continue operations or to supply us sufficient product without additional access to capital, such a failure could adversely affect our business. We also may have difficulty obtaining similar components from other suppliers that are acceptable to the FDA, the competent authorities or notified bodies of the Member States of the EEA, or foreign regulatory authorities and the failure of our suppliers to comply with strictly enforced regulatory requirements could expose us to regulatory action including warning letters, product recalls, termination of distribution, product seizures or civil penalties. Furthermore, since many of these suppliers are located outside of the United States, we are subject to foreign export laws and U.S. import and customs regulations, which complicate and could delay shipments of components to us. For example, all foreign importers of medical devices are required to meet applicable FDA requirements, including registration of establishment, listing of devices, manufacturing in accordance with the quality system regulation, medical device reporting of adverse events, and premarket notification 510(k) clearance or PMA, if applicable. In addition, all imported medical devices also must meet U.S. Customs and Border Protection requirements. While it is our policy to maintain sufficient inventory of materials and components so that our production will not be significantly disrupted even if a particular component or material is not available for a period of time, we remain at risk that we will not be able to qualify new components or materials quickly enough to prevent a disruption if one or more of our suppliers ceases production of important components or materials.
Sales volumes may fluctuate depending on the season and our operating results may fluctuate over the course of the year.
Our business is somewhat seasonal in nature, as many of our products are used in elective procedures, which typically decline during the summer months and can increase at the end of the year once annual deductibles have been met on health insurance plans. Additionally, elective procedures typically decline in certain parts of Europe during the third quarter of the year due to holiday and vacation schedules. We have experienced and expect to continue to experience meaningful variability in our revenue and gross profit among quarters, as well as within each quarter, as a result of a number of factors, including, among other things:
| • | transitions to direct selling models in certain geographies and the transition of our U.S. sales channel towards focusing separately on upper and lower extremity products; |
| • | the number and mix of products sold in the quarter and the geographies in which they are sold; |
| • | the demand for, and pricing of, our products and the products of our competitors; |
| • | the timing of or failure to obtain regulatory clearances or approvals for products |
| • | costs, benefits and timing of new product introductions; |
| • | the level of competition; |
| • | the timing and extent of promotional pricing or volume discounts; |
| • | changes in average selling prices; |
| • | the availability and cost of components and materials; |
| • | the number of selling days; |
| • | fluctuations in foreign currency exchange rates; |
33
Table of Contents
| • | the timing of patients’ use of their calendar year medical insurance deductibles; and |
| • | impairment and other special charges. |
We may not achieve our financial guidance or projected goals and objectives in the time periods that we anticipate or announce publicly, which could have an adverse effect on our business and could cause the market price of our ordinary shares to decline.
On a quarterly basis, we typically provide projected financial information, such as our anticipated quarterly and annual revenues, adjusted earnings before interest, taxes and depreciation and net loss. These financial projections are based on management’s then current expectations and typically do not contain any significant margin of error or cushion for any specific uncertainties or for the uncertainties inherent in all financial forecasting. The failure to achieve our financial projections or the projections of analysts and investors could have an adverse effect on our business, disappoint analysts and investors and cause the market price of our ordinary shares to decline. Our revenue performance has been outside of our guidance range in certain quarters, which negatively impacted the market price of our ordinary shares, and could do so in the future should our results fall below our guidance range and the expectations of analysts and investors.
We also set goals and objectives for, and make public statements regarding, the timing of certain accomplishments and milestones regarding our business, such as the timing of new products, regulatory actions and anticipated distributor and sales representative transitions. The actual timing of these events can vary dramatically due to a number of factors including the risk factors described in this report. As a result, there can be no assurance that we will succeed in achieving our projected goals and objectives in the time periods that we anticipate or announce publicly. The failure to achieve such projected goals and objectives in the time periods that we anticipate or announce publicly could have an adverse effect on our business, disappoint investors and analysts and cause the market price of our ordinary shares to decline.
If product liability lawsuits are brought against us, our business may be harmed.
The manufacture and sale of orthopaedic medical devices exposes us to significant risk of product liability claims. In the past, we have had a small number of product liability claims relating to our products, none of which either individually, or in the aggregate, have resulted in a material negative impact on our business. In the future, we may be subject to additional product liability claims, some of which may have a negative impact on our business. Such claims could divert our management from pursuing our business strategy and may be costly to defend. Regardless of the merit or eventual outcome, product liability claims may result in:
| • | decreased demand for our products; |
| • | injury to our reputation; |
| • | significant litigation and other costs; |
| • | substantial monetary awards to or costly settlements with patients; |
| • | product recalls; |
| • | loss of revenue; and |
| • | the inability to commercialize new products or product candidates. |
Our existing product liability insurance coverage may be inadequate to protect us from any liabilities we might incur. If a product liability claim or series of claims is brought against us for uninsured liabilities or in excess of our insurance coverage, our business and operating results could suffer. In addition, we may not be able to maintain insurance coverage at a reasonable cost or in sufficient amounts or scope to protect us against losses. Any claims against us, regardless of their merit, could severely harm our financial condition, strain our management and other resources and adversely affect or eliminate the prospects for commercialization or sales of
34
Table of Contents
a product or product candidate which is the subject of any such claim. In addition, a recall of our products, whether or not as a result of a product liability claim, could result in decreased demand for our products, injury to our reputation, significant litigation and other costs, substantial monetary awards to or costly settlements with patients, loss of revenue and our inability to commercialize new products or product candidates.
Our inability to maintain adequate working relationships with external research and development consultants and surgeons could have a negative impact on our ability to develop and sell new products.
We maintain professional working relationships with external research and development consultants and leading surgeons and medical personnel in hospitals and universities who assist in product research and development and training. We continue to emphasize the development of proprietary products and product improvements to complement and expand our existing product lines. It is possible that U.S. federal and state and international laws requiring us to disclose payments or other transfers of value, such as free gifts or meals, to physicians and other healthcare providers could have a chilling effect on these relationships with individuals or entities that may, among other things, want to avoid public scrutiny of their financial relationships with us. If we are unable to maintain these relationships, our ability to develop and sell new and improved products could decrease, and our future operating results could be unfavorably affected.
We incur significant expenditures of resources to maintain relatively high levels of inventory and instruments, which can reduce our cash flows.
As a result of the need to maintain substantial levels of inventory and instruments, we are subject to the risk of obsolescence. The nature of our business requires us to maintain a substantial level of inventory and instruments. For example, our total consolidated inventory balance was $88.7 million and $87.0 million at December 28, 2014 and December 29, 2013, respectively, and our total consolidated instrument balance was $62.9 million and $63.1 million at December 28, 2014 and December 29, 2013, respectively. In order to market effectively we often must maintain and bring our customers instrument kits, back-up products and products of different sizes. In the event that a substantial portion of our inventory becomes obsolete, it could have a material adverse effect on our earnings and cash flows due to the resulting costs associated with inventory impairment charges and costs required to replace such inventory.
Our business and operating results may suffer if our manufacturing capacity does not match the demand for our products.
Because we cannot immediately adapt our manufacturing capacity and related cost structures to rapidly changing market conditions, our operating results may be adversely affected when demand does not match our current manufacturing capacity. During 2014, we experienced increased demand for certain of our hip products due to increased case volume in Europe from a new minimally invasive surgical technique. While we do not expect the increased hip procedure volume to continue in future quarters, this increased demand has strained and may continue to strain our manufacturing capacity for these products, as well as our extremities products which also are manufactured at our manufacturing facilities. We cannot guarantee that we will be able to increase manufacturing capacity to a level that meets demand for our products. If we cannot increase our manufacturing capacity to meet product demand, we will not be able to fulfill orders in a timely manner which could lead to order cancellations, contract breaches or indemnification obligations. This may result in the loss of customers, provide an opportunity for competing products to gain market share and otherwise adversely affect our operating results. However, if we overestimate demand for our products and overbuild our capacity, we may have significantly underutilized assets and we may experience reduced margins. If we do not accurately align our manufacturing capabilities with demand, it could have a material adverse effect on our business operating results.
35
Table of Contents
Our proposed merger with Wright and our previous business combinations or acquisitions and any additional business combinations or acquisitions and efforts to combine with, acquire and integrate other companies or product lines could adversely affect our operations and financial results.
In October 2014, we announced a proposed merger with Wright. During 2013, we acquired certain assets of our distributors in Australia, Canada and the United Kingdom and established direct sales forces in such countries and acquired certain assets of some of our independent sales agencies in the United States and established direct sales forces in certain territories. During fourth quarter of 2012, we acquired OrthoHelix, a company focused on developing and marketing specialty implantable screw and plate systems for the repair of small bone fractures and deformities predominantly in the foot and ankle. In addition, we may pursue additional business combinations or acquisitions of other distributors, companies or product lines. A successful business combination or acquisition depends on our ability to identify, negotiate, complete and integrate such combination partner or acquisition and to obtain any necessary financing. With respect to our proposed or completed business combinations and acquisitions and any future business combinations and acquisitions, we may experience:
| • | difficulties in integrating the combined or acquired businesses and their respective personnel and products into our existing business; |
| • | difficulties in integrating commercial organizations, including in particular distribution and sales representative arrangements; |
| • | difficulties or delays in realizing the anticipated benefits of our proposed or recent combinations or acquisitions or any additional combined or acquired companies and their products; |
| • | diversion of our management’s time and attention from other business concerns; |
| • | challenges due to limited or no direct prior experience in new markets or countries we may enter; |
| • | the potential loss of key employees, including in particular sales and research and development personnel; |
| • | the potential loss of key customers, distributors, representatives, vendors and other business partners who choose not to do business with our company post-acquisition; |
| • | inability to effectively coordinate sales and marketing efforts to communicate our capabilities post-acquisition and coordinate sales organizations to sell our combined products; |
| • | inability to successfully develop new products and services on a timely basis that address our new market opportunities post-acquisition; |
| • | inability to compete effectively against companies already serving the broader market opportunities expected to be available to us post-acquisition; |
| • | difficulties in the assimilation of different corporate cultures, practices and sales and distribution methodologies, as well as in the assimilation and retention of geographically dispersed, decentralized operations and personnel; |
| • | unanticipated costs, litigation and other contingent liabilities; |
| • | incurrence of acquisition and integration related costs, accounting charges, or amortization costs for acquired intangible assets; |
| • | potential write-down of goodwill, acquired intangible assets and/or deferred tax assets; |
| • | additional legal, financial and accounting challenges and complexities in areas such as intellectual property, tax planning, cash management and financial reporting; and |
| • | any unforeseen compliance risks and accompanying financial and reputational exposure or loss not uncovered in the due diligence process and which are imputed to us, such as compliance with federal laws and regulations, the advertising and promotion regulations under the federal Food, Drug and Cosmetic Act, the Anti-kickback Statute, the False Claims Act, the Physician Payments Sunshine Act, HIPAA and other applicable laws. |
36
Table of Contents
In addition, we may have to incur debt or issue equity securities to pay for a combination or acquisition, the issuance of which could involve restrictive covenants or be dilutive to our existing shareholders. Business combinations or acquisitions also could materially impair our operating results by requiring us to amortize acquired assets. For example, as a result of our acquisition of OrthoHelix, we incurred additional indebtedness under two senior secured term loans, the proceeds of which were used to fund our acquisition of OrthoHelix and retire certain then existing indebtedness.
In addition, effective internal controls are necessary for us to provide reliable and accurate financial reports and to effectively prevent fraud. The integration of combined or acquired businesses is likely to result in our systems and controls becoming increasingly complex and more difficult to manage. We devote significant resources and time to comply with the internal control over financial reporting requirements of the Sarbanes-Oxley Act of 2002. However, we cannot be certain that these measures will ensure that we design, implement and maintain adequate control over our financial processes and reporting in the future, especially in the context of acquisitions of other businesses. Any difficulties in the assimilation of combined or acquired businesses into our control system could harm our operating results or cause us to fail to meet our financial reporting obligations. Inferior internal controls could also cause investors to lose confidence in our reported financial information, which could have a negative effect on the trading price of our stock and our access to capital.
All of the risks described above may be exacerbated if we effect multiple business combinations or acquisitions during a short period of time.
If we cannot attract and retain our key personnel, we may not be able to manage and operate successfully, and we may not be able to meet our strategic objectives.
Our future success depends, in large part, upon our ability to attract and retain and motivate our management team and key managerial, scientific, sales and technical personnel. Key personnel may depart because of difficulties with change or a desire not to remain with our company, especially in light of our proposed merger with Wright. Any unanticipated loss or interruption of services of our management team and our key personnel could significantly reduce our ability to meet our strategic objectives because it may not be possible for us to find appropriate replacement personnel should the need arise. In addition, we have hired and expect to continue to hire additional sales personnel, especially in territories where we have recently commenced direct sales operations. We compete for personnel with other companies, academic institutions, governmental entities and other organizations. There is no guarantee that we will be successful in retaining our current personnel or in hiring or retaining qualified personnel in the future. Loss of key personnel or the inability to hire or retain qualified personnel in the future could have a material adverse effect on our ability to operate successfully. Further, any inability on our part to enforce non-compete arrangements related to key personnel who have left the company could have a material adverse effect on our business.
Fluctuations in insurance cost and availability could adversely affect our profitability or our risk management profile.
We hold a number of insurance policies, including product liability insurance, directors’ and officers’ liability insurance, property insurance and workers’ compensation insurance. If the costs of maintaining adequate insurance coverage should increase significantly in the future, our operating results could be materially adversely affected. Likewise, if any of our current insurance coverage should become unavailable to us or become economically impractical, we would be required to operate our business without indemnity from commercial insurance providers.
If a natural or man-made disaster, including as a result of climate change or weather, adversely affects our manufacturing facilities or distribution channels, we could be unable to manufacture or distribute our products for a substantial amount of time and our revenue could decline.
We principally rely on three manufacturing facilities, two of which are in France and one of which is in Ireland. The facilities and the manufacturing equipment we use to produce our products would be difficult to
37
Table of Contents
replace and could require substantial lead-time to repair or replace. For example, the machinery associated with our manufacturing of pyrocarbon in one of our French facilities is highly specialized and would take substantial lead-time and resources to replace. We also maintain a facility in Bloomington, Minnesota, and a warehouse in Montbonnot, France, both of which contain large amounts of our inventory. Our facilities, warehouses or distribution channels may be affected by natural or man-made disasters. Further, such may be exacerbated by climate change, as some scientists have concluded that climate change could result in the increased severity of and perhaps more frequent occurrence of extreme weather patterns. For example, in the event of a tornado at one of our warehouses, we may lose substantial amounts of inventory that would be difficult to replace. In the event our facilities, warehouses or distribution channels are affected by a disaster, we would be forced to rely on, among others, third-party manufacturers and alternative warehouse space and distribution channels, which may or may not be available, and our revenue could decline. Although we believe we possess adequate insurance for damage to our property and the disruption of our business from casualties, such insurance may not be sufficient to cover all of our potential losses and may not continue to be available to us on acceptable terms or at all.
We may be unable to raise capital when needed, which would force us to delay, reduce, eliminate or abandon our commercialization efforts or product development programs.
If our proposed merger with Wright is not completed, there is no guarantee that our anticipated cash flow from operations will be sufficient to meet all of our cash requirements during the next few years. We intend to continue to make investments to support our business growth and may require additional funds to:
| • | continue our research and development; |
| • | develop, obtain required regulatory approvals or clearances and commercialize new products; |
| • | make changes in our distribution channels; |
| • | defend, in litigation or otherwise, any claims that we infringe third-party patents or other intellectual property rights and enforce our patent and other intellectual property rights; and |
| • | acquire companies and in-license products or intellectual property. |
We believe that our cash and cash equivalents balance of $27.9 million as of December 28, 2014, anticipated cash receipts generated from revenue of our products and available credit under our $30.0 million senior secured revolving credit facility, will be sufficient to meet our anticipated cash requirements for at least the next 12 months. However, our future funding requirements will depend on many factors, including:
| • | our proposed merger with Wright; |
| • | our future revenues and expenses; |
| • | required regulatory approval, commercial introduction and market acceptance of our products; |
| • | the scope, rate of progress and cost of our clinical trials; |
| • | the cost of our research and development activities; |
| • | the cost and timing of additional regulatory clearances or approvals; |
| • | the cost and timing of expanding our sales, marketing and distribution capabilities; |
| • | the cost and timing of our product offering inventories; |
| • | the cost of filing and prosecuting patent applications and defending and enforcing our patent and other intellectual property rights; |
| • | the cost of defending, in litigation or otherwise, any claims that we infringe third-party patent or other intellectual property rights; |
| • | the cost of defending any claims of product liability, or other claims against us, such as contract liabilities; |
38
Table of Contents
| • | our ability to collect amounts receivable from customers; |
| • | the effect of competing technological and market developments; and |
| • | the extent to which we acquire or invest in additional businesses, products and technologies. |
In the event that we would require additional working capital to fund future operations, we could seek to acquire that through additional equity or debt financing arrangements which may or may not be available on favorable terms at such time. If we raise additional funds by issuing equity securities, our shareholders may experience dilution. Debt financing, if available, may involve covenants restricting our operations or our ability to incur additional debt, in addition to those under our existing credit facilities. Any debt financing or additional equity that we raise may contain terms that are not favorable to us or our shareholders. If we do not have, or are not able to obtain, sufficient funds, we may have to delay development or commercialization of our products or license to third parties the rights to commercialize products or technologies that we would otherwise seek to commercialize. We also may have to reduce marketing, customer support or other resources devoted to our products or cease operations.
Any lack of borrowing availability under our credit facility and our potential inability to obtain replacement sources of credit could materially affect our operations and financial condition.
Although as of December 28, 2014, we had $24.0 million in available credit under our $30.0 million senior secured revolving credit facility, our ability to draw on our credit facility may be limited by outstanding letters of credit or by operating and financial covenants under our the credit agreement. There can be no assurances that we will continue to have access to credit if our operating and financial performance do not satisfy these covenants. If we do not satisfy these criteria, and if we are unable to secure necessary waivers or other amendments from the lenders of our credit facility, we will not have access to this credit.
Both the $30.0 million revolving credit facility and the $61.7 million term loan under our credit agreement as of December 28, 2014 are secured by all of our assets (subject to certain exceptions) and except to the extent otherwise permitted under the terms of our credit agreement, our assets cannot be pledged as security for other indebtedness. These limits on our ability to offer collateral to other sources of financing could limit our ability to obtain other financing which could materially affect our operations and financial condition. Our merger agreement with Wright also contains limits on our ability to borrow additional funds.
We believe that our anticipated operating cash flows, on-hand cash levels and access to credit will give us the ability to meet our financing needs for at least the next 12 months, assuming we do not merge with Wright. However, there can be no assurance that they will do so. Any lack of borrowing availability under our revolving credit facility and our potential inability to obtain replacement sources of credit could materially affect our operations and financial condition.
We are leveraged financially, which could adversely affect our ability to adjust our business to respond to competitive pressures and to obtain sufficient funds to satisfy our future research and development needs, to protect and enforce our intellectual property and other needs.
We have significant indebtedness. As of December 28, 2014, we had a senior secured term loan outstanding in the amount of $61.7 million, net of unamortized discount of $2.3 million. In addition, as of December 28, 2014, we have $30.0 million of credit availability under our senior secured revolving line of credit, $6.0 million of which was used as of such date. The degree to which we are leveraged could have important consequences, including, but not limited to, the following:
| • | our ability to utilize our existing available credit under our senior secured revolving line of credit or our ability to obtain additional financing in the future for working capital, capital expenditures, acquisitions, litigation, general corporate or other purposes may be limited; |
39
Table of Contents
| • | a substantial portion of our cash flows from operations in the future will be dedicated to the payment of principal and interest on our indebtedness, including the requirement that certain excess cash flows and certain net proceeds of asset dispositions (including from condemnation or casualty) and certain new indebtedness be applied to prepayment of our senior secured terms loans; and |
| • | we may be more vulnerable to economic downturns, less able to withstand competitive pressures and less flexible in responding to changing business and economic conditions. |
A failure to comply with the covenants and other provisions of our credit agreement could result in events of default under such agreement, which could require the immediate repayment of our outstanding indebtedness. If we are at any time unable to generate sufficient cash flows from operations to service our indebtedness when payment is due, we may be required to attempt to renegotiate the terms of the agreements relating to the indebtedness, seek to refinance all or a portion of the indebtedness or obtain additional financing. There can be no assurance that we will be able to successfully renegotiate such terms, that any such refinancing would be possible or that any additional financing could be obtained on terms that are favorable or acceptable to us.
Our credit agreement contains restrictive covenants that may limit our operating flexibility.
The agreement relating to our senior secured term loan and senior secured revolving credit facility contains operating covenants limiting our ability to transfer or dispose of assets, merge with or acquire other companies, make investments, pay dividends, incur additional indebtedness and liens, make capital expenditures and conduct transactions with affiliates, and financial covenants requiring us to meet certain financial ratios. We, therefore, may not be able to engage in any of the foregoing transactions or in any that would cause us to breach these financial covenants until our current debt obligations are paid in full or we obtain the consent of the lenders. There is no guarantee that we will be able to generate sufficient cash flow or revenue to meet these operating and financial covenants or pay the principal and interest on our debt. Furthermore, there is no guarantee that future working capital, borrowings or equity financing will be available to repay or refinance any such debt. Our outstanding debt under our credit agreement will become due and payable immediately upon completion of our proposed merger with Wright.
Our operating results could be negatively impacted by future changes in the allocation of income to each of the entities through which we operate and to each of the income tax jurisdictions in which we operate.
We operate through multiple entities and in multiple income tax jurisdictions with different income tax rates both inside and outside the United States and the Netherlands. Accordingly, our management must determine the appropriate allocation of income to each such entity and each of these jurisdictions. Income tax audits associated with the allocation of this income and other complex issues, including inventory transfer pricing and cost sharing and product royalty arrangements, may require an extended period of time to resolve and may result in income tax adjustments if changes to the income allocation are required. Since income tax adjustments in certain jurisdictions can be significant, our future operating results could be negatively impacted by settlement of these matters.
Future changes in technology or market conditions could result in adjustments to our recorded asset balance for intangible assets, including goodwill, resulting in additional charges that could significantly impact our operating results.
Our consolidated balance sheet includes significant intangible assets, including $244.8 million in goodwill and $95.1 million in other acquired intangible assets, together representing 52% of our total assets as of December 28, 2014. The determination of related estimated useful lives and whether these assets are impaired involves significant judgments. Our ability to accurately predict future cash flows related to these intangible assets may be adversely affected by unforeseen and uncontrollable events. In the highly competitive medical device industry, new technologies could impair the value of our intangible assets if they create market conditions
40
Table of Contents
that adversely affect the competitiveness of our products. We test our goodwill for impairment in the fourth quarter of each year, but we also test goodwill and other intangible assets for impairment at any time when there is a change in circumstances that indicates that the carrying value of these assets may be impaired. Any future determination that these assets are carried at greater than their fair value could result in substantial non-cash impairment charges, which could significantly impact our reported operating results.
If reimbursement from third-party payors for our products becomes inadequate, surgeons and patients may be reluctant to use our products and our revenue may decline.
In the United States, healthcare providers who purchase our products generally rely on third-party payors, principally federal Medicare, state Medicaid and private health insurance plans, to pay for all or a portion of the cost of joint reconstructive procedures and products utilized in those procedures. We may be unable to sell our products on a profitable basis if third-party payors deny coverage or reduce their current levels of reimbursement. Our revenue depends largely on governmental healthcare programs and private health insurers reimbursing patients’ medical expenses. As part of the Budget Control Act to extend the federal debt limit and reduce government spending, $1.2 trillion in automatic spending cuts (known as sequestration) are scheduled to occur over the next decade. Half of the automatic reductions are to come from lowering the caps imposed on non-defense discretionary spending and cutting domestic entitlement programs, including aggregate reductions in payments to Medicare providers of up to 2% per fiscal year. Subsequent legislation reduced Medicare payments to several providers, including hospitals, imaging centers and cancer treatment centers, and increased the statute of limitations period for the government to recover overpayments to providers from three to five years. We expect that additional state and federal healthcare reform measures will be adopted in the future, any of which could limit the amounts that federal and state governments will pay for healthcare products and services, which could result in reduced demand for our products or additional pricing pressure.
To contain costs of new technologies, third-party payors are increasingly scrutinizing new treatment modalities by requiring extensive evidence of clinical outcomes and cost-effectiveness. Currently, we are aware of several private insurers who have issued policies that classify procedures using our Salto Talaris Prosthesis and Conical Subtalar Implants as experimental or investigational and denied coverage and reimbursement for such procedures. Surgeons, hospitals and other healthcare providers may not purchase our products if they do not receive satisfactory reimbursement from these third-party payors for the cost of the procedures using our products. Payors continue to review their coverage policies carefully for existing and new therapies and can, without notice, deny coverage for treatments that include the use of our products. If we are not successful in reversing existing non-coverage policies or other private insurers issue similar policies, this could have a material adverse effect on our business and operations.
In addition, some healthcare providers in the United States have adopted or are considering a managed care system in which the providers contract to provide comprehensive healthcare for a fixed cost per person. Healthcare providers may attempt to control costs by authorizing fewer elective surgical procedures, including joint reconstructive surgeries, or by requiring the use of the least expensive implant available. Changes in reimbursement policies or healthcare cost containment initiatives that limit or restrict reimbursement for our products may cause our revenue to decline.
If adequate levels of reimbursement from third-party payors outside of the United States are not obtained, international revenue of our products may decline. Outside of the United States, reimbursement systems vary significantly by country. Many foreign markets have government-managed healthcare systems that govern reimbursement for orthopaedic medical devices and procedures. Additionally, some foreign reimbursement systems provide for limited payments in a given period and therefore result in extended payment periods.
41
Table of Contents
Consolidation in the healthcare industry could lead to demands for price concessions or to the exclusion of some suppliers from certain of our markets, which could have an adverse effect on our business, financial condition or operating results.
Because healthcare costs have risen significantly over the past decade, numerous initiatives and reforms initiated by legislators, regulators and third-party payors to curb these costs have resulted in a consolidation trend in the healthcare industry to create new companies with greater market power, including hospitals. As the healthcare industry consolidates, competition to provide products and services to industry participants has become and will continue to become more intense. This in turn has resulted and likely will continue to result in greater pricing pressures and the exclusion of certain suppliers from important market segments as group purchasing organizations, independent delivery networks and large single accounts continue to use their market power to consolidate purchasing decisions for some of our customers. We expect that market demand, government regulation, third-party reimbursement policies and societal pressures will continue to change the worldwide healthcare industry, resulting in further business consolidations and alliances among our customers, which may reduce competition, exert further downward pressure on the prices of our products and may adversely impact our business, financial condition or operating results.
If we experience significant disruptions in our information technology systems, our business may be adversely affected.
We depend on our information technology systems for the efficient functioning of our business, including accounting, data storage, purchasing and inventory management. Currently, we have a non-interconnected information technology system; however, we have begun to implement a new enterprise resource planning system (ERP) across our significant operating locations. We expect that the ERP will take two to three years to implement; however, when complete it should enable management to better and more efficiently conduct our operations and gather, analyze, and assess business information. The ERP will require the investment of significant human and financial resources. As a result of the implementation, we may experience difficulties in our business operations, or difficulties in operating our business under the ERP, either of which could disrupt our operations, including our ability to timely ship and track product orders, project inventory requirements, manage our supply chain, and otherwise adequately service our customers, and lead to increased costs and other difficulties. In the event we experience significant disruptions as a result of the ERP implementation, we may not be able to fix our systems in an efficient and timely manner. Accordingly, such events may disrupt or reduce the efficiency of our entire operation and have a material adverse effect on our operating results and cash flows.
Risks Related to Regulatory Environment
The sale of our products is subject to regulatory clearances or approvals and our business is subject to extensive regulatory requirements. If we fail to maintain regulatory clearances and approvals, or are unable to obtain, or experience significant delays in obtaining, FDA clearances or approvals for our future products or product enhancements, our ability to commercially distribute and market these products could suffer.
Our medical device products and operations are subject to extensive regulation by the FDA and various other federal, state and foreign governmental authorities. Government regulation of medical devices is meant to assure their safety and effectiveness, and includes regulation of, among other things:
| • | design, development and manufacturing; |
| • | testing, labeling, packaging, content and language of instructions for use, and storage; |
| • | clinical trials; |
| • | product safety; |
| • | premarket clearance and approval; |
| • | marketing, sales and distribution (including making product claims); |
42
Table of Contents
| • | advertising and promotion; |
| • | product modifications; |
| • | recordkeeping procedures; |
| • | reports of corrections, removals, enhancements, recalls and field corrective actions; |
| • | post-market surveillance, including reporting of deaths or serious injuries and malfunctions that, if they were to recur, could lead to death or serious injury; |
| • | complying with the new federal law and regulations requiring Unique Device Identifiers (UDI) on devices and also requiring the submission of certain information about each device to FDA’s Global Unique Device Identification Database (GUDID); and product import and export. |
Before a new medical device, or a new use of, or claim for, an existing product can be marketed in the United States, it must first receive either premarket clearance under Section 510(k) of the U.S. Federal Food, Drug and Cosmetic Act, or FDCA, a de novo approval or a PMA, from the FDA, unless an exemption applies. In the 510(k) clearance process, the FDA must determine that the proposed device is “substantially equivalent” to a device legally on the market, known as a “predicate” device. To establish substantial equivalence which allows the device to be marketed, the applicant must demonstrate the device has the: (i) the same intended use; (ii) the same technological characteristics; and (iii) to the extent the technological characteristic are different, that they do not raise different questions of safety and effectiveness. Clinical data is sometimes required to support substantial equivalence, but FDA’s expectations for data are often unclear and do change. Another procedure for obtaining marketing authorization for a medical device is the “de novo classification” procedure, pursuant to which FDA may authorize the marketing of a moderate to low risk device that has no predicate. These submissions typically require more information (i.e. non-clinical and/or clinical performance data) and take longer than a 510(k), but require less data and a shorter time period than a PMA approval. If the FDA grants the de novo request, the device is permitted to enter commercial distribution in the same manner as if 510(k) clearance had been granted, and the device becomes a 510(k) predicate for future devices seeking to call it a “predicate.” The PMA pathway requires an applicant to demonstrate reasonable assurance of safety and effectiveness of the device for its intended use based, in part, on extensive data including, but not limited to, technical, preclinical, clinical trial, manufacturing and labeling data. The PMA process is typically required for devices that are deemed to pose the greatest risk, such as life-sustaining, life-supporting or implantable devices. Products that are approved through a PMA application generally need FDA approval before they can be modified. Similarly, some modifications made to products cleared through a 510(k) may require a new 510(k) or a PMA. The 510(k), de novo and PMA processes can be expensive, lengthy and sometimes unpredictable. The processes also entail significant user fees, unless exempt. The FDA’s 510(k) clearance process usually takes from six to 18 months, but may take longer if more data are needed. The de novo process can take one to two years or longer if additional data are needed. The PMA pathway is much more costly and uncertain than the 510(k) clearance process and it generally takes from one to five years, or even longer, from the time the application is filed with the FDA until an approval is obtained. The process of obtaining regulatory clearances or approvals to market a medical device can be costly and time-consuming, and we may not be able to obtain these clearances or approvals on a timely basis, if at all.
Most of our currently commercialized products have received premarket clearances under Section 510(k) of the FDCA. If the FDA requires us to go through a lengthier, more rigorous examination for future products or modifications to existing products than we had expected, our product introductions or modifications could be delayed or canceled, which could cause our revenue to decline. In addition, the FDA may determine that future products will require the more costly, lengthy and uncertain de novo or PMA processes. Although we do not currently market any devices under PMA and have not gone through the de novo classification for marketing clearance, we cannot assure you that the FDA will not demand that we obtain a PMA prior to marketing or that we will be able to obtain 510(k) clearances with respect to future products.
43
Table of Contents
The FDA can delay, limit or deny clearance or approval of a device for many reasons, including:
| • | we may not be able to demonstrate to the FDA’s satisfaction that our products meet the definition of “substantial equivalence” or meet the standard for the FDA to grant a petition for de novo classification; |
| • | we may not be able to demonstrate to the FDA’s satisfaction that our products are safe and effective for their intended uses; |
| • | the data from our pre-clinical studies (bench and/or animal) and clinical trials may be insufficient to support clearance or approval, where required; |
| • | the manufacturing process or facilities we use may not meet applicable requirements; and |
| • | changes in FDA clearance or approval policies or the adoption of new regulations may require additional data. |
Any delay in, or failure to receive or maintain, clearances or approvals for our products under development could prevent us from generating revenue from these products or achieving profitability. Additionally, the FDA and other governmental authorities have broad enforcement powers. Our failure to comply with applicable regulatory requirements could lead governmental authorities or a court to take action against us, including but not limited to:
| • | issuing untitled (notice of violation) letters or public warning letters to us; |
| • | imposing fines and penalties on us; |
| • | obtaining an injunction or administrative detention preventing us from manufacturing or selling our products; |
| • | seizing products to prevent sale or transport or export; |
| • | bringing civil or criminal charges against us; |
| • | recalling our products or engaging in a product correction; |
| • | detaining our products at U.S. Customs; |
| • | delaying the introduction of our products into the market; |
| • | delaying pending requests for clearance or approval of new uses or modifications to our existing products; and/or |
| • | withdrawing or denying approvals or clearances for our products. |
If we fail to obtain and maintain regulatory clearances or approvals, our ability to sell our products and generate revenue will be materially harmed.
Outside of the United States, our medical devices must comply with the laws and regulations of the foreign countries in which they are marketed, and compliance may be costly and time-consuming. Failure to obtain and maintain regulatory approvals in jurisdictions outside the United States will prevent us from marketing our products in such jurisdictions.
We currently market, and intend to continue to market, our products outside the United States. To market and sell our product in countries outside the United States, we must seek and obtain regulatory approvals, certifications or registrations and comply with the laws and regulations of those countries. These laws and regulations, including the requirements for approvals, certifications or registrations and the time required for regulatory review, vary from country to country. Obtaining and maintaining foreign regulatory approvals, certifications or registrations are expensive, and we cannot be certain that we will receive regulatory approvals,
44
Table of Contents
certifications or registrations in any foreign country in which we plan to market our products. The regulatory approval process outside the United States may include all of the risks associated with obtaining FDA clearance or approval in addition to other risks.
In order to market our products in the Member States of the EEA, our devices are required to comply with the essential requirements of the EU Medical Devices Directives (Council Directive 93/42/EEC of 14 June 1993 concerning medical devices, as amended, and Council Directive 90/385/EEC of 20 June 2009 relating to active implantable medical devices, as amended). Compliance with these requirements entitles us to affix the CE conformity mark to our medical devices, without which they cannot be commercialized in the EEA. In order to demonstrate compliance with the essential requirements and obtain the right to affix the CE conformity mark we must undergo a conformity assessment procedure, which varies according to the type of medical device and its classification. Except for low risk medical devices (Class I), where the manufacturer can issue an EC Declaration of Conformity based on a self-assessment of the conformity of its products with the essential requirements of the Medical Devices Directives, a conformity assessment procedure requires the intervention of a Notified Body, which is an organization accredited by a Member State of the EEA to conduct conformity assessments. The Notified Body would typically audit and examine the quality system for the manufacture, design and final inspection of our devices before issuing a certification demonstrating compliance with the essential requirements. Based on this certification we can draw up an EC Declaration of Conformity, which allows us to affix the CE mark to our products.
We may not obtain regulatory approvals or certifications outside the United States on a timely basis, if at all. Clearance or approval by the FDA does not ensure approval or certification by regulatory authorities or Notified Bodies in other countries, and approval or certification by one foreign regulatory authority or Notified Body does not ensure approval by regulatory authorities in other countries or by the FDA. We may be required to perform additional pre-clinical or clinical studies even if FDA clearance or approval, or the right to bear the CE mark, has been obtained. If we fail to obtain or maintain regulatory approvals, certifications or registrations in any foreign country in which we plan to market our products, our business, financial condition and operating results could be adversely affected.
Modifications to our marketed products may require new 510(k) clearances or PMAs, or may require us to cease marketing or recall the modified products until clearances are obtained.
Any modification to a 510(k)-cleared device that could significantly affect its safety or efficacy, or that would constitute a major change in its intended use, technology, materials, packaging and certain manufacturing processes, may require a new 510(k) clearance or, possibly, a PMA. The FDA requires every manufacturer to make the determination regarding the need for a new 510(k) clearance or PMA in the first instance, but the FDA may (and often does) review the manufacturer’s decision. The FDA may not agree with a manufacturer’s decision regarding whether a new clearance or approval is necessary for a modification, and may retroactively require the manufacturer to submit a premarket notification requesting 510(k) clearance or an application for PMA. We have made modifications to our products in the past and may make additional modifications in the future that we believe do not or will not require additional clearances or approvals. No assurance can be given that the FDA would agree with any of our decisions not to seek 510(k) clearance or PMA. The issue of whether a product modification is significant enough to require a 510(k), as opposed to a simple “letter-to-file” documenting the change, is in a state of flux. In 1997, FDA issued a guidance to address this issue and it is a guidance with which FDA and industry is very familiar. In 2011, FDA proposed a new modifications guidance that was very controversial with industry because industry interpreted the guidance to reflect FDA’s view that it would require more 510(k)s than under the 1997 modifications guidance. On July 9, 2012, the Food and Drug Administration Safety and Innovation Act, FDASIA, was signed into law. Among other things, FDASIA requires the FDA to withdraw this proposed new modifications guidance and does not allow the FDA to use this draft guidance as part of, or for the basis of, any premarket review or any compliance or enforcement decisions or actions. FDASIA also obligates the FDA to prepare a report for Congress on the FDA’s approach for determining when a new 510(k) will be required for modifications or changes to a previously cleared device. After submitting
45
Table of Contents
this report, the FDA is expected to issue revised guidance to assist device manufacturers in making this determination. Until then, manufacturers may continue to adhere to the FDA’s 1997 guidance on this topic when making a determination as to whether or not a new 510(k) is required for a change or modification to a device, but the practical impact of the FDA’s continuing scrutiny of these issues remains unclear.
In addition, the FDA has recently proposed new draft guidance on reporting “enhancements” to medical devices under Part 806 Reports of Corrections and Removals, the practical effect of which may be to alert the FDA to product modifications on an ongoing basis for which the FDA may require a new 510(k). This guidance has not yet been finalized, but may be soon.
If the FDA requires us to cease marketing and recall a modified device until we obtain a new 510(k) clearance or PMA, our business, financial condition, operating results and future growth prospects could be materially adversely affected. Further, our products could be subject to recall if the FDA determines, for any reason, that our products are not safe or effective. Any recall or FDA requirement that we seek additional approvals or clearances could result in significant delays, fines, increased costs associated with modification of a product, loss of revenue and potential operating restrictions imposed by the FDA.
Healthcare policy changes, including legislation to reform the U.S. healthcare system, may have a material adverse effect on our business and operating results.
The Patient Protection and Affordable Care Act, as amended by the Health Care and Education Affordability Reconciliation Act, collectively, the PPACA, substantially changes the way health care is financed by both governmental and private insurers, encourages improvements in the quality of healthcare items and services, and significantly impacts the medical device industry. The PPACA includes, among other things, the following measures:
| • | an excise tax on any entity that manufactures or imports medical devices offered for sale in the United States; |
| • | a new Patient-Centered Outcomes Research Institute to oversee, identify priorities in and conduct comparative clinical effectiveness research; |
| • | new reporting and disclosure requirements on device manufacturers for any “transfer of value” made or distributed to prescribers and other healthcare providers (referred to as the Physician Payments Sunshine Act), which reporting requirements will be difficult to define, track and report, and which reports are due to CMS by March 31, 2014 and by the 90th day of each calendar year thereafter; |
| • | payment system reforms including a national pilot program on payment bundling to encourage hospitals, physicians and other providers to improve the coordination, quality and efficiency of certain healthcare services through bundled payment models, beginning on or before January 1, 2013; |
| • | an independent payment advisory board that will submit recommendations to reduce Medicare spending if projected Medicare spending exceeds a specified growth rate; and |
| • | a new licensure framework for follow-on biologic products. |
We cannot predict what healthcare programs and regulations will be ultimately implemented at the federal or state level, or the effect of any future legislation or regulation. However, these provisions as adopted could meaningfully change the way healthcare is delivered and financed, and may materially impact numerous aspects of our business. In particular, any changes that lower reimbursements for our products or reduce medical procedure volumes could adversely affect our business and operating results.
In addition, in the future there may continue to be additional proposals relating to the reform of the U.S. healthcare system. Certain of these proposals could limit the prices we are able to charge for our products, or the amounts of reimbursement available for our products, and could limit the acceptance and availability of our products. The adoption of some or all of these proposals could have a material adverse effect on our financial position and operating results.
46
Table of Contents
Furthermore, initiatives sponsored by government agencies, legislative bodies and the private sector to limit the growth of healthcare costs, including price regulation and competitive pricing, are ongoing in markets where we do business. We could experience a negative impact on our operating results due to increased pricing pressure in the United States and certain other markets. Governments, hospitals and other third-party payors could reduce the amount of approved reimbursements for our products. Reductions in reimbursement levels or coverage or other cost-containment measures could unfavorably affect our future operating results.
Our financial performance may continue to be adversely affected by medical device tax provisions in the health care reform laws.
The PPACA imposes a deductible excise tax equal to 2.3% of the price of a medical device on any entity that manufactures or imports medical devices offered for sale in the United States, with limited exceptions. Under these provisions, the total cost to the medical device industry was estimated to be approximately $20 billion over 10 years. These taxes resulted in a significant increase in the tax burden on our industry and on us, which negatively impacted our operating results and our cash flows during 2014. Should this tax continue to exist or change, our operating results could continue to be negatively impacted.
The use, misuse or off-label use of our products may harm our image in the marketplace or result in injuries that lead to product liability suits, which could be costly to our business or result in FDA sanctions if we are deemed to have engaged in improper promotion of our products.
Our products currently marketed in the United States have been cleared by the FDA’s 510(k) clearance process for use under specific circumstances. Our promotional materials and training methods must comply with FDA and other applicable laws and regulations, including the prohibition on the promotion of a medical device for a use that has not been cleared or approved by the FDA. Use of a device outside of its cleared or approved indication is known as “off-label” use. We cannot prevent a surgeon from using our products or procedure for off-label use, as the FDA does not restrict or regulate a physician’s choice of treatment within the practice of medicine. However, if the FDA determines that our promotional materials, reimbursement advice or training of sales representatives or physicians constitute promotion of an off-label use, the FDA could request that we modify our training or promotional or reimbursement materials or subject us to regulatory or enforcement actions, including the issuance of an untitled letter, a warning letter, injunction, seizure, disgorgement of profits, a civil fine and criminal penalties. Other federal, state or foreign governmental authorities also might take action if they consider our promotion or training materials to constitute promotion of an uncleared or unapproved use, which could result in significant fines or penalties under other statutory authorities, such as laws prohibiting false claims for reimbursement. For example, the government may take the position that off-label promotion resulted in inappropriate reimbursement for an off-label use in violation of the False Claims Act for which it might impose a civil fine and even pursue criminal action. In those possible events, our reputation could be damaged and adoption of the products would be impaired. Although we train our sales force not to promote our products for off-label uses, and our instructions for use in all markets specify that our products are not intended for use outside of those indications cleared for use, the FDA or another regulatory agency could conclude that we have engaged in off-label promotion.
Further, the advertising and promotion of our products is subject to EEA Member States laws implementing Directive 93/42/EEC concerning Medical Devices, or the EU Medical Devices Directive, Directive 2006/114/EC concerning misleading and comparative advertising, and Directive 2005/29/EC on unfair commercial practices, as well as other EEA Member State legislation governing the advertising and promotion of medical devices. These laws may limit or restrict the advertising and promotion of our products to the general public and may impose limitations on our promotional activities with healthcare professionals. Our failure to comply with all these laws and requirements may harm our business and operating results.
In addition, there may be increased risk of injury if surgeons attempt to use our products off-label. Furthermore, the use of our products for indications other than those indications for which our products have
47
Table of Contents
been cleared by the FDA may not effectively treat such conditions, which could harm our reputation in the marketplace among surgeons and patients. Surgeons also may misuse our products or use improper techniques if they are not adequately trained, potentially leading to injury and an increased risk of product liability. Product liability claims are expensive to defend and could divert our management’s attention and result in substantial damage awards against us. Any of these events could harm our business and operating results.
If our marketed medical devices are defective or otherwise pose safety risks, the FDA and similar foreign governmental authorities could require their recall, or we may initiate a recall of our products voluntarily.
The FDA and similar foreign governmental authorities may require the recall of commercialized products in the event of material deficiencies or defects in design or manufacture or in the event that a product poses an unacceptable risk to health. Manufacturers, on their own initiative, may recall a product if any material deficiency in a device is found. In the past we have initiated voluntary product recalls. For example, in August 2013, we initiated a voluntary Class II recall for instrumentation contained within the Aequalis Reversed II and the Aequalis Reversed Fracture instrument sets. We notified our distributors, sales representatives and all direct consignees and directed them to return the affected instrumentation to us in exchange for redesigned instruments.
A government-mandated or voluntary recall by us or one of our sales agencies could occur as a result of an unacceptable risk to health, component failures, manufacturing errors, design or labeling defects or other deficiencies and issues. Recalls of any of our products would divert managerial and financial resources and have an adverse effect on our financial condition and operating results. Any recall could impair our ability to produce our products in a cost-effective and timely manner in order to meet our customers’ demands. We also may be required to bear other costs or take other actions that may have a negative impact on our future revenue and our ability to generate profits. We may initiate voluntary actions to withdraw or remove or repair our products in the future that we determine do not require notification of the FDA as a recall. If the FDA disagrees with our determinations, they could require us to report those actions as recalls. A future recall announcement could harm our reputation with customers and negatively affect our revenue. In addition, the FDA could take enforcement action for failing to report the recalls when they were conducted.
In the EEA we must comply with the EU Medical Device Vigilance System, the purpose of which is to improve the protection of health and safety of patients, users and others by reducing the likelihood of reoccurrence of incidents related to the use of a medical device. Under this system, incidents must be reported to the competent authorities of the Member States of the EEA. An incident is defined as any malfunction or deterioration in the characteristics and/or performance of a device, as well as any inadequacy in the labeling or the instructions for use which, directly or indirectly, might lead to or might have led to the death of a patient or user or of other persons or to a serious deterioration in their state of health. Incidents are evaluated by the EEA competent authorities to whom they have been reported, and where appropriate, information is disseminated between them in the form of National Competent Authority Reports, or NCARs. The Medical Device Vigilance System is further intended to facilitate a direct, early and harmonized implementation of Field Safety Corrective Actions, or FSCAs across the Member States of the EEA where the device is in use. An FSCA is an action taken by a manufacturer to reduce a risk of death or serious deterioration in the state of health associated with the use of a medical device that is already placed on the market. An FSCA may include the recall, modification, exchange, destruction or retrofitting of the device. FSCAs must be communicated by the manufacturer or its legal representative to its customers and/or to the end users of the device through Field Safety Notices.
If our products cause or contribute to a death or a serious injury, or malfunction in certain ways, we will be subject to medical device reporting regulations, which can result in voluntary corrective actions or agency enforcement actions.
Under the FDA medical device reporting regulations, or MDR, we are required to report to the FDA any incident in which our product has or may have caused or contributed to a death or serious injury or in which our product malfunctioned and, if the malfunction were to recur, would likely cause or contribute to death or serious
48
Table of Contents
injury. If we fail to report these events to the FDA within the required timeframes, or at all, the FDA could take enforcement action against us. Any adverse event involving our products could result in future voluntary corrective actions, such as recalls or customer notifications, or agency action, such as inspection, mandatory recall or other enforcement action. Any corrective action, whether voluntary or involuntary, as well as defending ourselves in a lawsuit, will require the dedication of our time and capital, distract management from operating our business, and may harm our reputation and financial results.
Our manufacturing operations require us to comply with the FDA’s and other governmental authorities’ laws and regulations regarding the manufacture and production of medical devices, which is costly and could subject us to enforcement action.
We and certain of our third-party manufacturers are required to comply with the FDA’s current Good Manufacturing Program (cGMP) and Quality System Regulations, or QSR, which cover the methods of documentation of the design, testing, production, control, quality assurance, labeling, packaging, sterilization, storage and shipping of our products. We and certain of our suppliers also are subject to the regulations of foreign jurisdictions regarding the manufacturing process for our products marketed outside of the United States. The FDA enforces the QSR through periodic announced (routine) and unannounced (for cause or directed) inspections of manufacturing facilities. In January 2013, our OrthoHelix facility located in Medina, Ohio was subject to a routine FDA inspection. The inspection resulted in the issuance of a Form FDA-483 listing four inspectional observations. The FDA’s observations related to our documentation of corrective and preventative actions, procedures for receiving, reviewing and evaluating complaints, procedures to control product that does not conform to specified requirements and procedures to ensure that all purchased or otherwise received product and services conform to specified requirements. Although we believe we have corrected all four of these observations, the FDA could disagree with our conclusion and take corrective and remedial measures. In April 2013, our manufacturing facility located in Montbonnot, France was subject to a routine FDA inspection. The inspection resulted in the issuance of a Form FDA-483 listing one inspectional observation. The FDA’s observation related to our establishment of records of acceptable suppliers, contractors and consultants. Although we believe we have corrected the observation, the FDA could disagree with our conclusion and corrective and remedial measures.
The failure by us or one of our suppliers to comply with applicable statutes and regulations administered by the FDA and other regulatory bodies, or the failure to timely and adequately respond to any adverse inspectional observations or product safety issues, could result in, among other things, any of the following enforcement actions:
| • | untitled letters, warning letters, fines, injunctions, consent decrees, disgorgement of profits, criminal and civil penalties; |
| • | customer notifications or repair, replacement, refunds, recall, detention or seizure of our products; |
| • | operating restrictions or partial suspension or total shutdown of production; |
| • | refusing or delaying our requests for 510(k) clearance or PMA approval of new products or modified products; |
| • | withdrawing 510(k) clearances or PMAs that have already been granted; |
| • | refusal to grant export approval for our products; or |
| • | criminal prosecution. |
Any of these actions could impair our ability to produce our products in a cost-effective and timely manner in order to meet our customers’ demands. We also may be required to bear other costs or take other actions that may have a negative impact on our future revenue and our ability to generate profits. Furthermore, our key component suppliers may not currently be or may not continue to be in compliance with all applicable regulatory requirements, which could result in our failure to produce our products on a timely basis and in the required quantities, if at all.
49
Table of Contents
We are subject to substantial post-market government regulation that could have a material adverse effect on our business.
Many states such as Massachusetts, Connecticut, Nevada and Vermont require different types of compliance such as having a code of conduct, as well as reporting remuneration paid to health care professionals or entities in a position to influence prescribing behavior. Many of these industry standards inevitably influence company standards of conduct. Other laws tie into these standards as well, such as compliance with the advertising and promotion regulations under the U.S. federal Food, Drug and Cosmetic Act, the Anti-Kickback Statute, the False Claims Act, the Physician Payments Sunshine Act and other laws. We use many distributors and independent sales representatives in certain territories and thus rely upon their compliance with applicable laws and regulations, such as with the advertising and promotion regulations under the U.S. federal Food, Drug and Cosmetic Act, the Anti-kickback Statute, the False Claims Act, the Physician Payments Sunshine Act, similar laws under countries located outside the United States and other applicable federal, state or international laws. The failure by us or one of our distributors, representatives or suppliers to comply with applicable legal and regulatory requirements could result in, among other things, the FDA or other governmental authorities:
| • | imposing fines and penalties on us; |
| • | preventing us from manufacturing or selling our products; |
| • | delaying the introduction of our new products into the market; |
| • | recalling, seizing, detaining or enjoining the sale of our products; |
| • | withdrawing, delaying or denying approvals or clearances for our products; |
| • | issuing warning letters or untitled letters; |
| • | imposing operating restrictions; |
| • | imposing injunctions; and |
| • | commencing criminal prosecutions. |
Failure to comply with applicable regulatory requirements also could result in civil actions against us and other unanticipated expenditures. If any of these actions were to occur it would harm our reputation and cause our product revenue to suffer and may prevent us from generating revenue.
The results of our clinical trials may not support our product claims or may result in the discovery of adverse side effects.
Our ongoing research and development, pre-clinical testing and clinical trial activities are subject to extensive regulation and review by numerous governmental authorities both in the United States and abroad. We are currently conducting post-market clinical studies of some or our products to gather additional information about these products’ safety, efficacy or optimal use. We are also conducting a clinical trial of our Simpliciti product in the United States. In the future we may conduct additional clinical trials to support approval of new products. Clinical studies must be conducted in compliance with FDA regulations or the FDA may take enforcement action. The data collected from these clinical trials may ultimately be used to support market clearance for these products. Even if our clinical trials are completed as planned, we cannot be certain that their results will support our product claims or that the FDA or foreign authorities will agree with our conclusions regarding them. Success in pre-clinical testing and early clinical trials does not always ensure that later clinical trials will be successful, and we cannot be sure that the later trials will replicate the results of prior trials and studies. The clinical trial process may fail to demonstrate that our products are safe and effective for the proposed indicated uses, which could cause us to abandon a product and may delay development of others. Any delay or termination of our clinical trials will delay the filing of our product submissions and, ultimately, our ability to commercialize our products and generate revenue. It is also possible that patients enrolled in clinical trials will experience adverse side effects that are not currently part of the product’s profile.
50
Table of Contents
If the third parties on which we rely to conduct our clinical trials and to assist us with pre-clinical development do not perform as contractually required or expected, we may not be able to obtain regulatory clearance or approval for or commercialize our products.
We often must rely on third parties, such as contract research organizations, medical institutions, clinical investigators and contract laboratories to conduct our clinical trials. If these third parties do not successfully carry out their contractual duties or regulatory obligations or meet expected deadlines, if these third parties need to be replaced, or if the quality or accuracy of the data they obtain is compromised due to their failure to adhere to our clinical protocols or regulatory requirements or for other reasons, our pre-clinical development activities or clinical trials may be extended, delayed, suspended or terminated, and we may not be able to obtain regulatory approval for, or successfully commercialize, our products on a timely basis, if at all, and our business, operating results and prospects may be adversely affected. Furthermore, our third-party clinical trial investigators may be delayed in conducting our clinical trials for reasons outside of their control.
Future regulatory actions may adversely affect our ability to sell our products profitably.
From time to time, legislation is drafted and introduced that could significantly change the statutory provisions governing the clearance or approval, manufacture and marketing of a medical device. In addition, FDA and other regulations and guidance are often revised or reinterpreted in ways that may significantly affect our business and our products. It is impossible to predict whether legislative changes will be enacted or regulations, guidance or interpretations changed, and what the impact of such changes, if any, may be.
We may be subject to or otherwise affected by federal, state, and international healthcare laws, including fraud and abuse, false claims and health information privacy and security laws, and could face substantial penalties if we are unable to fully comply with such laws.
Although we do not provide healthcare services, submit claims for third-party reimbursement, or receive payments directly from Medicare, Medicaid or other third-party payors for our products or the procedures in which our products are used, healthcare regulation by federal, state and foreign governments could significantly impact our business. Healthcare fraud and abuse and health information privacy and security laws potentially applicable to our operations include:
| • | the federal Anti-Kickback Law, which constrains our marketing practices and those of our independent sales agencies, educational programs, pricing, bundling and rebate policies, grants for physician-initiated trials and continuing medical education, and other remunerative relationships with healthcare providers, by prohibiting, among other things, soliciting, receiving, offering or providing remuneration, intended to induce the purchase or recommendation of an item or service reimbursable under a federal healthcare program, such as the Medicare or Medicaid programs; |
| • | federal false claims laws (such as the federal False Claims Act) which prohibit, among other things, knowingly presenting, or causing to be presented, claims for payment from Medicare, Medicaid, or other third-party payors that are false or fraudulent, which impacts and regulates the reimbursement advice we give to our customers as it cannot be inaccurate and must relate to on-label uses of our products; |
| • | the federal Health Insurance Portability and Accountability Act of 1996, or HIPAA, and its implementing regulations, which created federal criminal laws that prohibit executing a scheme to defraud any healthcare benefit program or making false statements relating to healthcare matters and which also imposes certain regulatory and contractual requirements regarding the privacy, security and transmission of individually identifiable health information; |
| • | state laws analogous to each of the above federal laws, such as anti-kickback and false claims laws that may apply to items or services reimbursed by any third-party payor, including commercial insurers, and state laws governing the privacy and security of certain health information, many of which differ from each other in significant ways and often are not preempted by HIPAA, thus complicating compliance efforts; and |
51
Table of Contents
| • | federal, state and international laws that impose reporting and disclosure requirements on device and drug manufacturers for any “transfer of value” made or distributed to prescribers and other healthcare providers. |
If our past or present operations, or those of our independent sales agencies, are found to be in violation of any of such laws or any other governmental regulations that may apply to us, we may be subject to penalties, including civil and criminal penalties, damages, fines, exclusion from federal healthcare programs and the curtailment or restructuring of our operations. Similarly, if the healthcare providers or entities with whom we do business are found to be non-compliant with applicable laws, they may be subject to sanctions, which could also have a negative impact on us. Any penalties, damages, fines, curtailment or restructuring of our operations could adversely affect our ability to operate our business and our financial results. The risk of our company being found in violation of these laws is increased by the fact that many of them have not been fully interpreted by the regulatory authorities or the courts, and their provisions are open to a variety of interpretations. Further, the PPACA, among other things, amends the intent requirement of the federal anti-kickback and criminal health care fraud statutes. A person or entity no longer needs to have actual knowledge of this statute or specific intent to violate it. In addition, the PPACA provides that the government may assert that a claim including items or services resulting from a violation of the federal Anti-Kickback Statute constitutes a false or fraudulent claim for purposes of the false claims statutes. Any action against us for violation of these laws, even if we successfully defend against them, could cause us to incur significant legal expenses and divert our management’s attention from the operation of our business.
The PPACA also includes a number of provisions that impact medical device manufacturers, including the Physician Payments Sunshine Act. Failure to submit required information under the Physician Payments Sunshine Act may result in civil monetary penalties of up to an aggregate of $150,000 per year (and up to an aggregate of $1 million per year for “knowing failures”), for all payments, transfers of value or ownership or investment interests not reported in an annual submission.
In addition, there has been a recent trend of increased state and international regulation of payments made to physicians for marketing. Some states, such as Massachusetts and Vermont, mandate implementation of compliance programs, along with the tracking and reporting of gifts, compensation, and other remuneration to physicians. Several countries, such as France, also regulate payments made to physicians. The shifting compliance environment and the need to build and maintain robust and expandable systems to comply with multiple jurisdictions with different compliance and/or reporting requirements increases the possibility that a healthcare company may run afoul of one or more of the requirements. Our efforts to comply with these regulations have resulted in, and are likely to continue to result in, significant general and administrative expenses and a diversion of management time and attention from revenue-generating activities to compliance activities. Our failure to comply with all these laws and requirements may harm our business and operating results.
Governments and regulatory authorities vigorously enforce healthcare fraud and abuse laws, especially against companies in our industry. While we have not been the target of any investigations, we cannot guarantee that we will not be investigated in the future. If investigated we cannot assure that the costs of defending or resolving those investigations or proceedings would not have a material adverse effect on our financial condition, operating results and cash flows.
Our existing xenograft-based biologics business is and any future biologics products we pursue would be subject to emerging governmental regulations that could materially affect our business.
Some of our products are xenograft, or animal-based, tissue products. Our principal xenograft-based biologics offering is Conexa reconstructive tissue matrix. All of our current xenograft tissue-based products are regulated as medical devices and are subject to the FDA’s medical device regulations.
52
Table of Contents
We currently are planning to offer products based on human tissue. The FDA has statutory authority to regulate human cells, tissues and cellular and tissue-based products, or HCT/Ps. An HCT/P is a product containing or consisting of human cells or tissue intended for transplantation into a human patient, including allograft-based products. The FDA, EU and Health Canada have been working to establish more comprehensive regulatory frameworks for allograft-based, tissue-containing products, which are principally derived from cadaveric tissue.
Section 361 of the Public Health Service Act, or PHSA, authorizes the FDA to issue regulations to prevent the introduction, transmission or spread of communicable disease. HCT/Ps regulated as 361 HCT/Ps are subject to requirements relating to: registering facilities and listing products with the FDA; screening and testing for tissue donor eligibility; Good Tissue Practice, or GTP, when processing, storing, labeling and distributing HCT/Ps, including required labeling information; stringent recordkeeping; and adverse event reporting. The FDA has also proposed extensive additional requirements that address sub-contracted tissue services, tracking to the recipient/patient, and donor records review. If a tissue-based product is considered human tissue, the FDA requirements focus on preventing the introduction, transmission and spread of communicable diseases to recipients. A product regulated solely as a 361 HCT/P is not required to undergo premarket clearance (510(k)) or approval (de novo or PMA).
The FDA may inspect facilities engaged in manufacturing 361 HCT/Ps and may issue untitled letters, warning letters, or otherwise authorize orders of retention, recall, destruction and cessation of manufacturing if the FDA has reasonable grounds to believe that an HCT/P or the facilities where it is manufactured are in violation of applicable regulations. There also are requirements relating to the import of HCT/Ps that allow the FDA to make a decision as to the HCT/Ps’ admissibility into the United States.
An HCT/P is eligible for regulation solely as a 361 HCT/P if it is: (i) minimally manipulated; (ii) intended for homologous use as determined by labeling, advertising or other indications of the manufacturer’s objective intent for a homologous use; (iii) the manufacture does not involve combination with another article, except for water, crystalloids or a sterilizing, preserving, or storage agent (not raising new clinical safety concerns for the HCT/P); and (iv) it does not have a systemic effect and is not dependent upon the metabolic activity of living cells for its primary function or, if it has such an effect, it is intended for autologous use or allogenetic use in close relatives or for reproductive use. If any of these requirements are not met, then the HCT/P is also subject to applicable biologic, device, or drug regulation under the FDCA or the PHSA. These biologic, device or drug HCT/Ps must comply both with the requirements exclusively applicable to 361 HCT/Ps and, in addition, with requirements applicable to biologics under the PHSA, or devices or drugs under the FDCA, including premarket licensure, clearance or approval.
Title VII of the PPACA, the Biologics Price Competition and Innovation Act of 2009, or BPCIA, creates a new licensure framework for follow-on biologic products, which could ultimately subject our biologics business to competition to so-called “biosimilars.” Under the BPCIA, a manufacturer may submit an application for licensure of a biologic product that is “biosimilar to” or “interchangeable with” a referenced, branded biologic product. Previously, there had been no licensure pathway for such a follow-on product. While we do not anticipate that the FDA will license a follow-on biologic for several years, given the need to generate data sufficient to demonstrate “biosimilarity” to or “interchangeability” with the branded biologic according to criteria set forth in the BPCIA, as well as the need for the FDA to implement the BPCIA’s provisions with respect to particular classes of biologic products, we cannot guarantee that our biologics will not eventually become subject to direct competition by a licensed “biosimilar.”
Procurement of certain human organs and tissue for transplantation, including allograft tissue we may use in future products, is subject to federal regulation under the National Organ Transplant Act, or NOTA. NOTA prohibits the acquisition, receipt, or other transfer of certain human organs, including bone and other human tissue, for valuable consideration within the meaning of NOTA. NOTA permits the payment of reasonable
53
Table of Contents
expenses associated with the removal, transportation, implantation, processing, preservation, quality control and storage of human organs. For any future products implicating NOTA’s requirements, we would reimburse tissue banks for their expenses associated with the recovery, storage and transportation of donated human tissue that they would provide to us. NOTA payment allowances may be interpreted to limit the amount of costs and expenses that we may recover in our pricing for our services, thereby negatively impacting our future revenue and profitability. If we were to be found to have violated NOTA’s prohibition on the sale or transfer of human tissue for valuable consideration, we would potentially be subject to criminal enforcement sanctions, which could materially and adversely affect our operating results. Further, in the future, if NOTA is amended or reinterpreted, we may not be able to pass these expenses on to our customers and, as a result, our business could be adversely affected.
Our operations involve the use of hazardous materials, and we must comply with environmental health and safety laws and regulations, which can be expensive and may affect our business and operating results.
We are subject to a variety of laws and regulations of the countries in which we operate and distribute products, such as the United States, France, Ireland, other EU nations and other countries, relating to the use, registration, handling, storage, disposal, recycling and human exposure to hazardous materials. Liability under environmental laws can be joint and several and without regard to comparative fault, and environmental, health and safety laws could become more stringent over time, imposing greater compliance costs and increasing risks and penalties associated with violations, which could harm our business. In the EU, where our manufacturing facilities are located, we and our suppliers are subject to EU environmental requirements such as the Registration, Evaluation, Authorization and Restriction of Chemicals, or REACH, regulation. In addition, we are subject to the environmental, health and safety requirements of individual European countries in which we operate such as France and Ireland. For example, in France, requirements known as the Installations Classées pour la Protection de l’Environnement regime provide for specific environmental standards related to industrial operations such as noise, water treatment, air quality and energy consumption. In Ireland, our manufacturing facilities are likewise subject to local environmental regulations, such as related to water pollution and water quality, which are administered by the Environmental Protection Agency. We believe that we are in material compliance with all applicable environmental, health and safety requirements in the countries in which we operate and do not have reason to believe that we are responsible for any cleanup liabilities. In addition, certain hazardous materials are present at some of our facilities, such as asbestos, that we believe are managed in compliance with all applicable laws. We also are subject to greenhouse gas regulations in the EU and elsewhere and we believe that we are in compliance based on present emissions levels at our facilities. Although we believe that our activities conform in all material respects with applicable environmental, health and safety laws, we cannot assure you that violations of such laws will not arise as a result of human error, accident, equipment failure, presently unknown conditions or other causes. The failure to comply with past, present or future laws, including potential laws relating to climate control initiatives, could result in the imposition of fines, third-party property damage and personal injury claims, investigation and remediation costs, the suspension of production or a cessation of operations. We also expect that our operations will be affected by other new environmental and health and safety laws, including laws relating to climate control initiatives, on an ongoing basis. Although we cannot predict the ultimate impact of any such new laws, they could result in additional costs and may require us to change how we design, manufacture or distribute our products, which could have a material adverse effect on our business.
Our business is subject to evolving corporate governance and public disclosure regulations that result in significant compliance costs. Our noncompliance with these regulations could have an adverse effect on our stock price.
We are subject to changing rules and regulations promulgated by a number of U.S. and Dutch governmental and self-regulated organizations, including the SEC, the NASDAQ Stock Market, the Dutch Authority for the Financial Markets and the Financial Accounting Standards Board. These rules and regulations continue to evolve in scope and complexity and many new requirements have been created, making compliance more difficult and
54
Table of Contents
uncertain. Our efforts to comply with these regulations have resulted in, and are likely to continue to result in, significant general and administrative expenses and a diversion of management time and attention from revenue-generating activities to compliance activities.
Risks Related to Our Intellectual Property
If our patents and other intellectual property rights do not adequately protect our products, we may lose market share to our competitors and may be unable to prevent competitors from competing against us.
We rely on patents, trade secrets, copyrights, know-how, trademarks, license agreements and contractual provisions to establish our intellectual property rights and protect our products. These legal means, however, afford only limited protection and may not adequately protect our rights. The patents we own may not be of sufficient scope or strength to provide us with any meaningful protection or commercial advantage, and competitors may be able to design around our patents or develop products that duplicate our own products or provide outcomes that are similar to ours.
U.S. patents and patent applications may be subject to interference proceedings, and U.S. patents may be subject to reexamination, inter partes review, post-grant review, derivation proceedings or other proceedings in the U.S. Patent and Trademark Office (USPTO). Foreign patents may be subject to opposition, nullity actions, or comparable proceedings in the corresponding foreign patent offices. Any of these proceedings could result in loss of the patent or denial of the patent application, or loss or reduction in the scope of one or more of the claims of the patent or patent application. Changes in either patent laws or in interpretations of patent laws may also diminish the value of our intellectual property or narrow the scope of our protection. Interference, reexamination, opposition proceedings, and invalidation actions such as nullity proceedings may be costly and time-consuming, and we, or the other parties from whom we might potentially license intellectual property, may be unsuccessful in defending against such proceedings. Thus, any patents that we own or might license may provide limited or no protection against competitors.
We cannot be certain that any of our pending patent applications will be issued. The USPTO or foreign patent offices may reject or require a significant narrowing of the claims in our pending patent applications and those we may file in the future affecting the patents issuing from such applications. We could incur substantial costs in proceedings before the USPTO and the proceedings may be time-consuming, which may cause significant diversion of effort by our technical and management personnel. These proceedings could result in adverse decisions as to the patentability or validity of claims directed to our inventions and may result in the narrowing or cancellation of claims in issued patents. Even if any of our pending or future applications are issued, they may not provide us with significant commercial protection or any competitive advantages. Our patents and patent applications cover particular aspects of our products. Other parties may develop and obtain patent protection for more effective technologies, designs or methods. If these developments were to occur, they would likely have an adverse effect on our sales. There may be prior public disclosures that could invalidate our inventions or parts of our inventions of which we are not aware. Our ability to develop additional patentable technology is also uncertain. In addition, the laws of some of the countries in which our products are or may be sold may not protect our intellectual property to the same extent as U.S. laws or at all, particularly in the field of medical products and procedures. We also may be unable to protect our rights in trade secrets and unpatented proprietary technology in these countries.
Non-payment or delay in payment of patent fees or annuities, whether intentional or unintentional, may also result in the loss of patents or patent rights important to our business. Many countries, including certain countries in Europe, have compulsory licensing laws under which a patent owner may be compelled to grant licenses to other parties. In addition, many countries limit the enforceability of patents against other parties, including government agencies or government contractors. In these countries, the patent owner may have limited remedies, which could materially diminish the value of the patent.
55
Table of Contents
In the event a competitor infringes our patent or other intellectual property rights, enforcing those rights may be costly, difficult and time-consuming. Even if successful, litigation to enforce our intellectual property rights or to defend our patents against challenge could be expensive and time-consuming and could divert our management’s attention. An adverse decision in any legal action could limit our ability to assert our intellectual property rights, limit the value of our technology or otherwise negatively impact our business, financial condition and results of operations.
Monitoring unauthorized use of our intellectual property is difficult and costly. Unauthorized use of our intellectual property may have occurred or may occur in the future. Although we have taken steps to reduce the risk of this occurring, any such failure to identify unauthorized use and otherwise adequately protect our intellectual property would adversely affect our business. We may not have sufficient resources to enforce our intellectual property rights or to defend our patents or other intellectual property rights against a challenge. If we are unsuccessful in enforcing and protecting our intellectual property rights and protecting our products, it could harm our business and operating results.
Patent law can be highly uncertain and involve complex legal and factual questions for which important principles remain unresolved. In the United States and in many foreign jurisdictions, policy regarding the breadth of claims allowed in patents can be inconsistent. The U.S. Supreme Court and the Court of Appeals for the Federal Circuit have made, and will likely continue to make, changes in how the patent laws of the United States are interpreted. Patent law has recently been modified by the U.S. Congress, and future potential legislation could further change provisions of patent law. We cannot predict future changes in the interpretation of patent laws or changes to patent laws. Those changes may materially affect our patents, our ability to obtain patents or the patents and applications of our licensors. Future protection for our proprietary rights is uncertain because legal means afford only limited protection and may not adequately protect our rights or permit us to gain or keep our competitive advantage, which could adversely affect our financial condition and results of operations.
In particular, there are numerous recent changes to the U.S. patent laws and proposed changes to the rules of the USPTO that may have a significant impact on our ability to obtain and enforce intellectual property rights. For example, the Leahy-Smith America Invents Act, or the Leahy-Smith Act, was adopted in September 2011. The Leahy-Smith Act includes a number of significant changes to U.S. patent law, including provisions that affect the way patent applications will be prosecuted and may also affect patent litigation. Under the Leahy-Smith Act, the United States transitioned from a “first-to-invent” system to a “first-inventor-to-file” system for patent applications filed on or after March 16, 2013. With respect to patent applications filed on or after March 16, 2013, if we are the first to invent but not the first to file a patent application, we may not be able to fully protect our intellectual property rights and may be found to have violated the intellectual property rights of others if we continue to operate in the absence of a patent issued to us. Many of the substantive changes to patent law associated with the Leahy-Smith Act have recently become effective. Accordingly, it is not clear what, if any, impact the Leahy-Smith Act will have on the operation of our business. However, the Leahy-Smith Act and its implementation could increase the uncertainties and costs surrounding the prosecution of our patent applications and the enforcement or defense of our issued patents, all of which could have a material adverse effect on our business and financial condition.
We rely on our trademarks, trade names and brand names to distinguish our products from the products of our competitors, and have registered or applied to register many of these trademarks. However, our trademark applications may not be approved. Third parties may also oppose our trademark applications or otherwise challenge our use of the trademarks. In the event that our trademarks are successfully challenged, we could be forced to rebrand our products, which could result in loss of brand recognition and could require us to devote resources to advertising and marketing these new brands. Further, our competitors may infringe our trademarks, or we may not have adequate resources to enforce our trademarks.
In addition, we hold licenses from third parties that relate to the design and manufacture of some of our products. The loss of such licenses could prevent us from manufacturing, marketing and selling these products,
56
Table of Contents
which could harm our business. If we, or the other parties from whom we would license intellectual property, fail to obtain and maintain adequate patent or other intellectual property protection for intellectual property used in our products, or if any protection is reduced or eliminated, others could use the intellectual property used in our products, resulting in harm to our competitive business position.
If we are unable to protect the confidentiality of our proprietary information and know-how, the value of our technology and products could be adversely affected.
In addition to patents, we seek to protect our trade secrets, know-how and other unpatented technology, in part, with confidentiality agreements with our vendors, employees, consultants and others who may have access to proprietary information. We cannot be certain, however, that these agreements will not be breached, adequate remedies for any breach would be available or our trade secrets, know-how and other unpatented proprietary technology will not otherwise become known to or be independently developed by our competitors. We also have taken precautions to initiate safeguards to protect our information technology systems. However, these measures may not be adequate to safeguard our proprietary intellectual property and conflicts may, nonetheless, arise regarding ownership of inventions. Such conflicts may lead to the loss or impairment of our intellectual property or to expensive litigation to defend our rights against competitors who may be better funded and have superior resources. Our employees, consultants, contractors, outside clinical collaborators and other advisors may unintentionally or willfully disclose our confidential information to competitors. In addition, confidentiality agreements may not be enforced or may not provide an adequate remedy in the event of unauthorized disclosure. Enforcing a claim that a third party illegally obtained and is using our trade secrets is expensive and time-consuming, and the outcome is unpredictable. Moreover, our competitors may independently develop equivalent knowledge, methods and know-how. Unauthorized parties also may attempt to copy or reverse engineer certain aspects of our products that we consider proprietary, and in such cases we could not assert any trade secret rights against such party. As a result, other parties may be able to use our proprietary technology or information, and our ability to compete in the marketplace would be harmed.
Some of our employees were previously employed at other medical device companies focused on the development of orthopaedic devices. We may be subject to claims that these employees or we have inadvertently or otherwise used or disclosed trade secrets or other proprietary information of their former employers. Litigation may be necessary to defend against these claims. If we fail in defending such claims, in addition to paying monetary damages, we may lose valuable intellectual property rights. Even if we are successful in defending against these claims, litigation could result in substantial costs, damage to our reputation and be a distraction to management.
Our commercial technology and any future products and services that we develop could be alleged to infringe patent rights of third parties, which may require costly litigation and, if we are not successful, could cause us to pay significant damages or limit our ability to commercialize our products.
The orthopaedic medical device industry is litigious with respect to patents and other intellectual property rights. Companies in the orthopaedic medical device industry have used intellectual property litigation to gain a competitive advantage. Non-practicing entities also have used intellectual property litigation to seek revenue from orthopaedic companies. We cannot provide assurance that our products or methods do not infringe the patents or other intellectual property rights of third parties, and as our business grows, the possibility may increase that others will assert infringement claims against us. Determining whether a product infringes a patent involves complex legal and factual issues, and the outcome of a patent litigation action is often uncertain. No assurance can be given that patents containing claims covering our products, parts of our products, technology or methods do not exist, have not been filed or could not be filed or issued. Because of the number of patents issued and patent applications filed in our technical areas, our competitors or other parties may assert that our products and the methods we employ in the use of our products are covered by U.S. or foreign patents held by them. In addition, because patent applications can take many years to issue and because publication schedules for pending applications vary by jurisdiction, there may be applications now pending of which we are unaware and which
57
Table of Contents
may result in issued patents that our current or future products infringe. Also, because the claims of published patent applications can change between publication and patent grant, there may be published patent applications that may ultimately issue as patents with claims that we infringe. There could also be existing patents that one or more of our products or parts may infringe and of which we are unaware. In certain situations, we may determine that it is in our best interests to voluntarily challenge a party’s products or patents in litigation or other proceedings, including patent interferences or reexaminations.
Any legal proceeding involving patents or other intellectual property, regardless of outcome, could drain our financial resources and divert the time and effort of our management. A patent infringement suit or other infringement or misappropriation claim brought against us or any of our licensees may force us or any of our licensees to stop or delay developing, manufacturing or selling potential products that are claimed to infringe a third party’s intellectual property, unless that party grants us or any of our licensees rights to use its intellectual property. In such cases, we may be required to obtain licenses to patents or proprietary rights of others in order to continue to commercialize our products. However, we may not be able to obtain any licenses required under any patents or proprietary rights of third parties on acceptable terms, or at all. Even if we or our licensees were able to obtain rights to the third party’s intellectual property, these rights may be nonexclusive, thereby giving our competitors access to the same intellectual property. Ultimately, we may be unable to commercialize some of our potential products or may have to cease some of our business operations as a result of patent infringement claims, which could severely harm our business.
In any infringement lawsuit, a third party could seek to enjoin, or prevent, us from commercializing our existing or future products, or may seek damages from us, and any such lawsuit would likely be expensive for us to defend against. If we lose one of these proceedings, a court or a similar foreign governing body could require us to pay significant damages to third parties, seek licenses from third parties, pay ongoing royalties, redesign or rename, in the case of trademark claims, our products so that they do not infringe or prevent us from manufacturing, using or selling our products. In addition to being costly, protracted litigation to defend or prosecute our intellectual property rights could result in our customers or potential customers deferring or limiting their purchase or use of the affected products until resolution of the litigation.
From time to time, in the ordinary course of business, we receive notices from third parties alleging infringement or misappropriation of the patent, trademark or other intellectual property rights of third parties by us or our customers in connection with the use of our products. We also may otherwise become aware of possible infringement claims against us. We routinely analyze such claims and determine how best to respond in light of the circumstances existing at the time, including the importance of the intellectual property right to us and the third party, the relative strength of our position of non-infringement or non-misappropriation and the product or products incorporating the intellectual property right at issue.
If we choose to acquire new businesses, products or technologies, we may experience difficulty in the identification or integration of any such acquisition, and our business may suffer.
Our success depends on our ability to continually enhance and broaden our product and service offerings in response to changing customer demands, competitive pressures and technologies. Accordingly, we may pursue the acquisition of complementary businesses, products or technologies instead of developing them ourselves. We do not know if we will be able to identify or complete any acquisitions, or whether we will be able to successfully integrate any acquired business, product or technology or retain key employees. Integrating any business, product or technology we acquire could be expensive and time consuming, and could disrupt our ongoing business and distract our management. If we are unable to integrate any acquired businesses, products or technologies effectively, our business will suffer. In addition, any amortization or charges resulting from acquisitions could negatively impact our operating results.
58
Table of Contents
Risks Relating to Our Ordinary Shares
The trading volume and prices of our ordinary shares have been and may continue to be volatile, which could result in substantial losses to our shareholders.
The trading volume and prices of our ordinary shares have been and may continue to be volatile and could fluctuate widely due to factors beyond our control. During 2014, the sale price of our ordinary shares ranged from $16.97 per share to $28.06 per share, as reported by the NASDAQ Global Select Market. Such volatility may be the result of broad market and industry factors, like the performance and fluctuation of the market prices of other companies with business operations located mainly in Europe that have listed their securities in the United States, or our proposed merger with Wright. In addition to market and industry factors, the price and trading volume for our ordinary shares may be highly volatile for factors specific to our own operations, including the following:
| • | variations in our revenue, earnings and cash flow, and in particular variations that deviate from our projected financial information; |
| • | announcements of new investments, acquisitions, strategic partnerships or joint ventures; |
| • | announcements of new products by us or our competitors; |
| • | announcements of divestitures or discontinuance of products or assets; |
| • | changes in financial estimates by securities analysts; |
| • | additions or departures of key personnel; |
| • | sales of our equity securities by our significant shareholders or management or sales of additional equity securities by our company; |
| • | potential litigation or regulatory investigations; and |
| • | fluctuations in market prices for our products. |
Any of these factors may result in large and sudden changes in the volume and price at which our ordinary shares trade. In the past, shareholders of a public company often brought securities class action suits against the company following periods of instability in the market price of that company’s securities. If we were involved in a class action suit, it could divert a significant amount of our management’s attention and other resources from our business and operations, which could harm our operating results and require us to incur significant expenses to defend the suit. Any such class action suit, whether or not successful, could harm our reputation and restrict our ability to raise capital in the future. In addition, if a claim is successfully made against us, we may be required to pay significant damages, which could have a material adverse effect on our financial condition and operating results.
If securities or industry analysts do not publish research or reports about our business, or if they adversely change their recommendations regarding our ordinary shares, the market price for our ordinary shares and trading volume could decline.
The trading market for our ordinary shares is influenced by research or reports that industry or securities analysts publish about us or our business. If one or more analysts who cover us downgrade our ordinary shares, the market price for our ordinary shares likely would decline. If one or more of these analysts cease coverage of us or fail to regularly publish reports on us, we could lose visibility in the financial markets, which, in turn, could cause the market price or trading volume for our ordinary shares to decline.
The sale or availability for sale of substantial amounts of our ordinary shares could adversely affect their market price.
Sales of substantial amounts of our ordinary shares in the public market, or the perception that these sales could occur, could adversely affect the market price of our ordinary shares and could materially impair our
59
Table of Contents
ability to raise capital through equity offerings in the future. We cannot predict what effect, if any, market sales of securities held by our significant shareholders or any other shareholder or the availability of these securities for future sale will have on the market price of our ordinary shares.
We are party to a registration rights agreement with certain of our shareholders and entities affiliated with our directors, including TMG Holdings Coöperatief U.A., or TMG, and KCH Oslo AS, which requires us to register ordinary shares held by these persons under the Securities Act, subject to certain limitations, restrictions and conditions. The market price of our ordinary shares could decline as a result of the registration and sale of or the perception that registration and sales may occur of a large number of our ordinary shares.
We are a Netherlands company, and it may be difficult for you to obtain or enforce judgments against us or our directors or executive officers in the United States.
We were formed under the laws of the Netherlands and, as such, the rights of holders of our ordinary shares and the civil liability of our directors are governed by Dutch laws and our articles of association. The rights of shareholders under the laws of the Netherlands may differ from the rights of shareholders of companies incorporated in other jurisdictions. Certain of our directors and executive officers and many of our assets and some of the assets of our directors are located outside the United States. As a result, you may not be able to serve process on us or on such persons in the United States or obtain or enforce judgments from U.S. courts against us or them based on the civil liability provisions of the securities laws of the United States. There is doubt as to whether Dutch courts would enforce certain civil liabilities under U.S. securities laws in original actions or enforce claims for punitive damages.
Under our articles of association, we indemnify and hold our directors harmless against all claims and suits brought against them, subject to limited exceptions. There is doubt, however, as to whether U.S. courts would enforce such an indemnity provision in an action brought against one of our directors in the United States under U.S. securities laws.
Rights of a holder of ordinary shares are governed by Dutch law and differ from the rights of shareholders under U.S. law.
We are a public limited liability company incorporated under Dutch law. The rights of holders of ordinary shares are governed by Dutch law and our articles of association. These rights differ from the typical rights of shareholders in U.S. corporations. For example, Dutch law does not provide for a shareholder derivative action.
We do not anticipate paying dividends on our ordinary shares.
Our articles of association prescribe that profits or reserves appearing from our annual accounts adopted by the general meeting shall be at the disposal of the general meeting. We will have power to make distributions to shareholders and other persons entitled to distributable profits only to the extent that our equity exceeds the sum of the paid and called-up portion of the ordinary share capital and the reserves that must be maintained in accordance with provisions of Dutch law or our articles of association. The profits must first be used to set up and maintain reserves required by law and must then be set off against certain financial losses. We may not make any distribution of profits on ordinary shares that we hold. The general meeting, whether or not upon the proposal of our board of directors, determines whether and how much of the remaining profit they will reserve and the manner and date of such distribution. All calculations to determine the amounts available for dividends will be based on our annual accounts, which may be different from our consolidated financial statements. Our statutory accounts to date have been prepared and will continue to be prepared under Dutch generally accepted accounting principles and are deposited with the Trade Register in Amsterdam, the Netherlands. We have not previously declared or paid cash dividends and we have no plan to declare or pay any dividends in the near future on our ordinary shares. We currently intend to retain most, if not all, of our available funds and any future earnings to operate and expand our business. In addition, our credit agreement contains covenants limiting our ability to pay cash dividends.
60
Table of Contents
Warburg Pincus (Bermuda) Private Equity IX, L.P. and its affiliates control 21.9% of our ordinary shares, and this concentration of ownership may have an effect on transactions that are otherwise favorable to our shareholders.
Warburg Pincus (Bermuda) Private Equity IX, L.P. and its affiliates, or Warburg Pincus, beneficially own, in the aggregate, 21.9% of our outstanding ordinary shares. These shareholders could have an effect on matters requiring our shareholders’ approval, including the election of directors. This concentration of ownership also may delay, deter or prevent a change in control, and may make some transactions more difficult or impossible to complete without the support of these shareholders, regardless of the impact of this transaction on our other shareholders. In addition, our securityholders’ agreement gives TMG Holdings Coöperatief U.A., or TMG, an affiliate of Warburg Pincus, the right to designate three directors to be nominated to our board of directors for so long as TMG beneficially owns at least 25% of our outstanding ordinary shares, two directors for so long as TMG beneficially owns at least 10% but less than 25% of our outstanding ordinary shares and one director for so long as TMG beneficially owns at least 5% but less than 10% of our outstanding ordinary shares, and we have agreed to use our reasonable best efforts to cause the TMG designees to be elected. TMG has entered into a voting and support agreement with Wright pursuant to which TMG agreed to vote all of its Tornier ordinary shares in favor of our proposed merger with Wright.
We may experience deficiencies, including material weaknesses, in our internal control over financial reporting. Our business and our share price may be adversely affected if we do not remediate any deficiencies in our internal controls.
Our management is responsible for establishing and maintaining adequate internal control over financial reporting. Internal control over financial reporting is a process designed to provide reasonable assurance regarding the reliability of financial reporting and the preparation of financial statements in accordance with U.S. GAAP. A material weakness, as defined in the standards established by the Public Company Accounting Oversight Board, is a deficiency, or a combination of deficiencies, in internal control over financial reporting, such that there is a reasonable possibility that a material misstatement of our annual or interim financial statements will not be prevented or detected on a timely basis. A report by us of a material weakness may cause investors to lose confidence in our financial statements, and the trading price of our ordinary shares may decline. If we fail to remedy any material weakness, our financial statements may be inaccurate, our access to the capital markets may be restricted and the trading price of our ordinary shares may decline.
ITEM 1B. UNRESOLVED STAFF COMMENTS
None.
Our global corporate headquarters are located in Amsterdam, the Netherlands.
Our U.S. headquarters are located in a 56,000 square foot facility in Bloomington, Minnesota, where we conduct our principal executive, sales and marketing, and administrative activities, along with our U.S. distribution and customer service operations. This facility is leased through 2022. Our OrthoHelix operations, which include research and development and marketing are located in Medina, Ohio. Our primary U.S. research and development operations are based in a 12,200 square foot leased facility in Warsaw, Indiana.
Outside the United States, our primary manufacturing facilities are located in Montbonnot and Grenoble, France; and Macroom, Ireland. In the 112,000 square foot Montbonnot campus, we conduct manufacturing and manufacturing support activities, sales and marketing, research and development, quality and regulatory assurance, distribution and administrative functions. In our 84,700 square foot Macroom facility, we conduct manufacturing operations and manufacturing support such as purchasing, engineering and quality assurance
61
Table of Contents
functions. Our pyrocarbon manufacturing is performed at our 9,900 square foot facility in Grenoble, France. In addition, we maintain subsidiary sales offices and distribution warehouses in various countries, including France, Germany, Italy, the Netherlands, Denmark, Switzerland, United Kingdom, Belgium, Japan, Canada and Australia. We believe that our facilities are adequate and suitable for their use.
Below is a summary of our material facilities:
| Entity |
City | State/Country | Owned or Leased |
Occupancy | Square Footage |
Lease Expiration Date | ||||||
| Tornier, Inc. |
Bloomington | Minnesota, United States |
Leased | Offices/Warehouse/ Distribution |
56,000 | 01/01/2022 | ||||||
| Tornier, Inc. |
Warsaw | Indiana, United States |
Leased | Offices/R&D | 12,200 | 02/28/2019 | ||||||
| OrthoHelix Surgical Designs, Inc. |
Medina | Ohio, United States |
Leased | Offices/Warehouse/R&D | 19,500 | 05/31/2016 | ||||||
| Tornier SAS |
Montbonnot | France | Leased | Offices | 15,100 | 05/31/2022 | ||||||
| Tornier SAS |
Montbonnot | France | Leased | Warehouse/Distribution/ Offices |
19,500 | 05/31/2022 | ||||||
| Tornier SAS |
Montbonnot | France | Leased | Offices/R&D | 25,500 | 05/31/2022 | ||||||
| Tornier SAS |
Montbonnot | France | Owned 51% | Manufacturing/Offices | 51,700 | 09/03/2018 | ||||||
| Tornier SAS |
Grenoble | France | Leased | Manufacturing/Offices/R&D | 9,900 | 12/31/2021 | ||||||
| Tornier Orthopedics Ireland Limited |
Macroom | Ireland | Leased | Manufacturing/Offices | 84,700 | 12/01/2028 |
A description of our legal proceedings in Note 18 of our consolidated financial statements included in this report is incorporated herein by reference.
ITEM 4. MINE SAFETY DISCLOSURES
Not applicable.
62
Table of Contents
| ITEM 5. | MARKET FOR REGISTRANTS COMMON EQUITY, RELATED STOCKHOLDER MATTERS AND ISSUER PURCHASES OF EQUTIY SECURITIES |
Market Information
Our ordinary shares are traded on the NASDAQ Global Select Market under the symbol “TRNX.” The following table sets forth, for the fiscal quarters indicated, the high and low daily per share sales prices for our ordinary shares as reported by the NASDAQ Global Select Market.
| High | Low | |||||||
| Fiscal year 2014 |
||||||||
| First Quarter |
$ | 20.95 | $ | 17.96 | ||||
| Second Quarter |
$ | 24.11 | $ | 16.97 | ||||
| Third Quarter |
$ | 24.77 | $ | 19.49 | ||||
| Fourth Quarter |
$ | 28.06 | $ | 22.46 | ||||
| Fiscal year 2013 |
||||||||
| First Quarter |
$ | 19.58 | $ | 15.95 | ||||
| Second Quarter |
$ | 19.00 | $ | 15.28 | ||||
| Third Quarter |
$ | 19.97 | $ | 15.63 | ||||
| Fourth Quarter |
$ | 21.87 | $ | 15.17 | ||||
Holders
As of February 13, 2015 there were 45 holders of record of our ordinary shares.
Dividends
We have never declared or paid any cash dividends on our ordinary shares. We currently intend to retain all future earnings for the operation and expansion of our business. We do not anticipate declaring or paying cash dividends on our ordinary shares in the foreseeable future. Any payment of cash dividends on our ordinary shares will be at the discretion of our board of directors and will depend upon our results of operations, capital requirements, contractual restrictions and other factors deemed relevant by our board of directors. The credit agreement relating to our senior secured term loan and senior secured revolving credit facility contains covenants limiting our ability to pay cash dividends. In addition, our merger agreement with Wright contains a covenant limiting our ability to pay cash dividends prior to the completion of the merger.
Purchases of Equity Securities by the Company
We did not purchase any ordinary shares or other equity securities of ours during the fourth fiscal quarter ended December 28, 2014.
Recent Sales of Unregistered Securities
During the fourth fiscal quarter ended December 28, 2014, we did not issue any ordinary shares or other equity securities of our company that were not registered under the Securities Act of 1933, as amended.
63
Table of Contents
Comparison of Total Shareholder Returns
The graph below compares the cumulative total shareholder returns for the period from February 3, 2011, the date of our initial public offering, to December 28, 2014 (our fiscal year-end), for our ordinary shares, an index composed of U.S. companies whose stock is listed on the NASDAQ Global Select Market (the NASDAQ U.S. Composite Index), and an index consisting of NASDAQ-listed companies in the surgical, medical and dental instruments and supplies industry (the NASDAQ Medical Equipment Subsector). The graphs assume that $100.00 was invested on February 3, 2011, in our ordinary shares, the NASDAQ U.S. Composite Indices and the NASDAQ Medical Equipment Subsector Indices, and that all dividends were reinvested. Total returns for the NASDAQ indices are weighted based on the market capitalization of the companies included therein. Historic stock price performance is not indicative of future stock price performance. We do not make or endorse any prediction as to future share price performance.
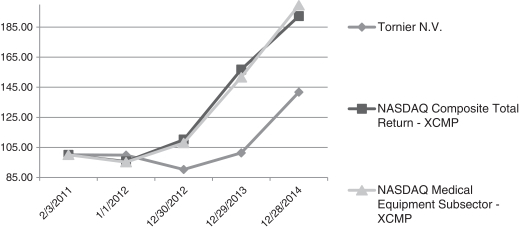
| February 3, 2011 |
January 1, 2012 |
December 30, 2012 |
December 29, 2013 |
December 28, 2014 |
||||||||||||||||
| Tornier N.V. |
100.00 | 99.72 | 90.25 | 101.33 | 141.44 | |||||||||||||||
| NASDAQ U.S. Composite Index XCMP |
100.00 | 95.47 | 109.94 | 156.35 | 191.63 | |||||||||||||||
| NASDAQ Medical Equipment Subsector XCMP |
100.00 | 95.14 | 107.74 | 151.26 | 198.94 | |||||||||||||||
The above stock performance graph shall not be deemed to be “filed” with the Securities and Exchange Commission or subject to the liabilities of Section 18 of the Securities Exchange Act of 1934, as amended. Notwithstanding anything to the contrary set forth in any of Tornier’s previous filings under the Securities Act of 1933, as amended, or the Securities Exchange Act of 1934, as amended, that might incorporate future filings, including this annual report on Form 10-K, in whole or in part, the above stock performance graph shall not be incorporated by reference into any such filings.
64
Table of Contents
ITEM 6. SELECTED FINANCIAL DATA
The following tables set forth certain of our selected consolidated financial data as of the dates and for the years indicated. The selected consolidated financial data was derived from our consolidated financial statements. The audited consolidated financial statements as of December 28, 2014 and December 29, 2013, and for the three year period ended December 28, 2014 are included elsewhere in this report. The audited consolidated financial statements as of December 30, 2012, January 1, 2012 and January 2, 2011 and for the years ended January 1, 2012 and January 2, 2011 are not included in this report. Historical results are not necessarily indicative of the results to be expected for any future period. U.S. dollars are presented in thousands, except per share data.
Our fiscal year-end is generally determined on a 52-week basis and always falls on the Sunday nearest to December 31. Every few years, it is necessary to add an extra week to the year making it a 53-week period in order to have our year end fall on the Sunday nearest to December 31. For example, the year ended January 2, 2011 includes an extra week of operations relative to the years ended December 28, 2014, December 29, 2013, December 30, 2012 and January 1, 2012. The extra week was added in the first quarter of the year ended January 2, 2011, making the first quarter 14 weeks in length, as opposed to 13 weeks in length.
| Year ended | ||||||||||||||||||||
| December 28, 2014 |
December 29, 2013 |
December 30, 2012 |
January 1, 2012 |
January 2, 2011 |
||||||||||||||||
| Statement of Operations Data: |
||||||||||||||||||||
| Revenue |
$ | 344,953 | $ | 310,959 | $ | 277,520 | $ | 261,191 | $ | 227,378 | ||||||||||
| Cost of goods sold |
83,464 | 86,172 | 81,918 | 74,882 | 63,437 | |||||||||||||||
|
|
|
|
|
|
|
|
|
|
|
|||||||||||
| Gross profit |
261,489 | 224,787 | 195,602 | 186,309 | 163,941 | |||||||||||||||
| Selling, general and administrative |
237,158 | 206,851 | 170,447 | 161,448 | 149,175 | |||||||||||||||
| Research and development |
24,139 | 22,387 | 22,524 | 19,839 | 17,896 | |||||||||||||||
| Amortization of intangible assets |
17,135 | 15,885 | 11,721 | 11,282 | 11,492 | |||||||||||||||
| Special charges |
4,479 | 3,738 | 19,244 | 892 | 306 | |||||||||||||||
|
|
|
|
|
|
|
|
|
|
|
|||||||||||
| Operating loss |
(21,422 | ) | (24,074 | ) | (28,334 | ) | (7,152 | ) | (14,928 | ) | ||||||||||
| Interest income |
136 | 245 | 338 | 550 | 223 | |||||||||||||||
| Interest expense |
(5,319 | ) | (7,256 | ) | (3,733 | ) | (4,326 | ) | (21,805 | ) | ||||||||||
| Foreign currency transaction (loss) gain |
(1,115 | ) | (1,820 | ) | (473 | ) | 193 | (8,163 | ) | |||||||||||
| Loss on extinguishment of debt |
— | (1,127 | ) | (593 | ) | (29,475 | ) | — | ||||||||||||
| Other non-operating (expense) income, net |
(161 | ) | (45 | ) | 116 | 1,330 | 43 | |||||||||||||
|
|
|
|
|
|
|
|
|
|
|
|||||||||||
| Loss before income taxes |
(27,881 | ) | (34,077 | ) | (32,679 | ) | (38,880 | ) | (44,630 | ) | ||||||||||
| Income tax (expense) benefit |
(1,590 | ) | (2,349 | ) | 10,935 | 8,424 | 5,121 | |||||||||||||
|
|
|
|
|
|
|
|
|
|
|
|||||||||||
| Consolidated net loss |
(29,471 | ) | (36,426 | ) | (21,744 | ) | (30,456 | ) | (39,509 | ) | ||||||||||
| Net loss attributable to noncontrolling interest |
— | — | — | — | (695 | ) | ||||||||||||||
|
|
|
|
|
|
|
|
|
|
|
|||||||||||
| Net loss attributable to Tornier |
(29,471 | ) | (36,426 | ) | (21,744 | ) | (30,456 | ) | (38,814 | ) | ||||||||||
| Accretion of noncontrolling interest |
— | — | — | — | (679 | ) | ||||||||||||||
|
|
|
|
|
|
|
|
|
|
|
|||||||||||
| Net loss attributable to ordinary shareholders |
$ | (29,471 | ) | $ | (36,426 | ) | $ | (21,744 | ) | $ | (30,456 | ) | $ | (39,493 | ) | |||||
|
|
|
|
|
|
|
|
|
|
|
|||||||||||
| Weighted-average ordinary shares outstanding: |
||||||||||||||||||||
| basic and diluted |
48,860 | 45,826 | 40,064 | 38,227 | 27,770 | |||||||||||||||
| Net loss per share: basic and diluted |
$ | (0.60 | ) | $ | (0.79 | ) | $ | (0.54 | ) | $ | (0.80 | ) | $ | (1.42 | ) | |||||
|
|
|
|
|
|
|
|
|
|
|
|||||||||||
| Balance Sheet Data: |
||||||||||||||||||||
| Cash and cash equivalents |
$ | 27,940 | $ | 56,784 | $ | 31,108 | $ | 54,706 | $ | 24,838 | ||||||||||
| Other current assets |
181,761 | 169,741 | 166,210 | 144,166 | 148,376 | |||||||||||||||
| Total assets |
658,575 | 705,426 | 654,227 | 511,700 | 491,178 | |||||||||||||||
| Total long-term debt, less current portion |
68,105 | 67,643 | 115,457 | 21,900 | 109,728 | |||||||||||||||
| Total liabilities |
179,685 | 179,618 | 218,148 | 110,240 | 220,939 | |||||||||||||||
| Total shareholders’ equity |
478,890 | 525,808 | 436,079 | 401,460 | 270,239 | |||||||||||||||
| Other Financial Data: |
||||||||||||||||||||
| Net cash provided by operating activities |
$ | 1,008 | $ | 24,982 | $ | 14,431 | $ | 23,166 | $ | 2,889 | ||||||||||
| Net cash used in investing activities |
(34,328 | ) | (47,713 | ) | (125,795 | ) | (29,475 | ) | (22,853 | ) | ||||||||||
| Net cash provided by financing activities |
2,700 | 47,023 | 86,666 | 39,110 | 7,427 | |||||||||||||||
| Depreciation and amortization |
40,623 | 36,566 | 30,232 | 28,107 | 27,038 | |||||||||||||||
| Capital expenditures |
(32,245 | ) | (34,630 | ) | (23,290 | ) | (26,333 | ) | (20,525 | ) | ||||||||||
| Effect of exchange rate changes on cash and cash equivalents |
1,776 | 1,384 | 1,100 | (2,933 | ) | (594 | ) | |||||||||||||
Note: The results included above as of December 30, 2012 and for the year ended December 30, 2012 include the results of OrthoHelix Surgical Designs, Inc. from October 4, 2012 (date of acquisition) to December 30, 2012.
65
Table of Contents
ITEM 7. MANAGEMENT’S DISCUSSION AND ANALYSIS OF FINANCIAL CONDITION AND RESULTS OF OPERATIONS
You should read the following discussion of our financial condition and results of operations together with the consolidated financial statements and the notes thereto included elsewhere in this report and other financial information included in this report. The following discussion may contain predictions, estimates and other forward-looking statements that involve a number of risks and uncertainties, including those discussed under “Special Note Regarding Forward Looking Statements,” “Part 1- Item 1A. Risk Factors” and elsewhere in this report. These risks could cause our actual results to differ materially from any future performance suggested below.
Overview
We are a global medical device company focused on providing solutions to surgeons that treat musculoskeletal injuries and disorders of the shoulder, elbow, wrist, hand, ankle and foot, which we refer to as “extremity joints.” We sell to these surgeons a broad line of joint replacement, trauma, sports medicine and biologic products to treat extremity joints. In certain international markets, we also offer joint replacement products for the hip and knee.
We have had a tradition of innovation, intense focus on science and education and a commitment to the advancement of orthopaedics in the pursuit of improved clinical outcomes for patients since our founding over 70 years ago in France by René Tornier. Our history includes the introduction of the porous orthopaedic hip implant, the application of the Morse taper, which is a reliable means of joining modular orthopaedic implants, and more recently, the introduction of the minimally invasive, ultra short stem shoulder both in Europe and in a U.S. clinical trial. This track record of innovation based on science and education stems from our close collaboration with leading orthopaedic surgeons and thought leaders throughout the world.
We believe we are differentiated in the marketplace by our strategic focus on extremities, our full portfolio of upper and lower extremity products, and our extremity-focused sales organization. We offer a broad product portfolio of over 90 extremities products that are designed to provide solutions to our surgeon customers with the goal of improving clinical outcomes for their patients. We believe a more active and aging patient population with higher expectations regarding “quality of life,” an increasing global awareness of extremities solutions, improved clinical outcomes as a result of the use of extremities products and technological advances resulting in specific designs for extremities products that simplify procedures and address unmet needs for early interventions and the growing need for revisions and revision related solutions will drive the market for extremities products.
We manage our business in one reportable segment that includes the design, manufacture, marketing and sales of orthopaedic products. Our principal products are organized in four major categories: upper extremity joints and trauma, lower extremity joints and trauma, sports medicine and biologics, and large joints and other. Our upper extremity joints and trauma products include joint replacement and bone fixation devices for the shoulder, hand, wrist and elbow. Our lower extremity joints and trauma products include joint replacement and bone fixation devices for the foot and ankle. Our sports medicine and biologics product category includes products used across several anatomic sites to mechanically repair tissue-to-tissue or tissue-to-bone injuries, in the case of sports medicine, or to support or induce remodeling and regeneration of tendons and ligaments, in the case of biologics. Our large joints and other products include hip and knee joint replacement implants and ancillary products.
In the United States, we market and sell a broad offering of products, including products for upper extremity joints and trauma, lower extremity joints and trauma, and sports medicine and biologics. We do not actively market products for the hip or knee, which we refer to as “large joints,” in the United States, although we have clearance from the U.S. Food and Drug Administration, or FDA, to sell certain large joint products. Our sales and distribution system in the United States currently consists of 49 geographic sales territories that are staffed by
66
Table of Contents
approximately 170 direct sales representatives and approximately 20 independent sales agencies. These sales representatives and independent sales agencies are generally aligned to selling either our upper extremity products or lower extremity products; but, in some cases, certain agencies and sales representatives sell products from both upper and lower extremity product portfolios in their territories.
Over the last two years, we have transitioned our U.S. sales organization from a network of independent sales agencies that sold our full product portfolio to a combination of direct sales teams and independent sales agencies that are generally dedicated to selling either upper extremity joints and trauma products or lower extremity joints and trauma products across the territories in which they serve. While this transition caused disruption in our U.S. business and negatively impacted our revenues in both 2014 and 2013, we continue to believe that this strategy positions us to leverage our sales force and broad product portfolio toward our goal of achieving above market extremities revenue growth and margin expansion over the long term by allowing us to increase the product proficiency of our sales representatives to better serve our surgeon customers and to increase and optimize our selling opportunities by improving our overall procedure coverage and providing access to new specialists, general surgeons and accounts.
Internationally, we sell our full product portfolio, including upper and lower extremity products, sports medicine and biologics products and large joints products. We utilize several distribution approaches that are tailored to the needs and requirements of each individual market. Our international sales and distribution system currently consists of 12 direct sales offices and approximately 25 distributors that sell our products in approximately 40 countries. We utilize direct sales organizations in certain mature European markets, Australia, Japan and Canada. In France, our largest international market, we have an upper extremity direct sales force and a separate direct sales force that sells a combination of hip, knee and lower extremity products. In addition, we may also utilize independent stocking distributors in these direct sales areas to further broaden our distribution channel. In certain other geographies, including emerging markets, we utilize independent stocking distributors to market and sell our full product portfolio or select portions of our product portfolio.
2014 Executive Summary
During 2014, we believe we made significant progress in executing our strategic plan, including the following highlights:
| • | Transition and development of our U.S. sales organization. In 2014, we completed the transformation of our U.S. sales organization by aligning the majority of our sales representatives to focus on either upper extremity products or lower extremity products in the territories in which they serve, hiring additional sales representatives to fill territories, optimizing our sales territory structures and educating and training our sales teams. We continue to believe that the transition and development of our U.S. sales organization will position us to leverage our sales force and broad product portfolio toward our goal of achieving above market extremities revenue growth and margin expansion over the long term. |
| • | Continued advancement of our product portfolio and product pipeline. In 2014, we continued to make progress on building and expanding our product portfolio and product pipeline in an effort to bring a clinically differentiated offering to a broader customer base. |
| • | The Aequalis Ascend Flex convertible shoulder system, which was commercially launched in the third quarter of 2013, along with our new reversed threaded-post baseplate, which was launched in the second quarter of 2014, and the PerFORM glenoid system, continued to be recognized as a best-in-class shoulder arthroplasty platform, and we experienced an increased level of competitive conversions across a broad range of customers in 2014. |
| • | The Simpliciti total shoulder system is expected to receive U.S. FDA clearance in mid-2015, which would make it the first minimally invasive, ultra short stem shoulder platform available in the United States. Simpliciti has been utilized in over 2,700 cases internationally and has received excellent surgeon feedback due to shorter operating room times and reduced blood loss during procedures. |
67
Table of Contents
| • | We continue to build and expand our product portfolio to address the needs of patients with severe ankle arthritis and support the market shift from ankle fusions to total ankle replacements. We launched a total ankle revision system in 2014, the Salto Talaris XT, to add to our Salto and Salto Talaris total ankle replacement platforms. We are also in the process of developing a new ankle fusion plate to better address market needs. |
| • | Continued expansion of our international footprint and capabilities. In 2014, we continued to execute on our international expansion strategy, including the following: |
| • | We received the first-ever product approval in Japan to market and sell a reversed shoulder platform and began the surgeon training and sales of this product in 2014. We plan to introduce the Aequalis Ascend Flex shoulder platform in Japan in 2015 and believe that the foundation built with our reversed shoulder will allow us to be successful in the anatomic shoulder segment. |
| • | We opened an administrative office in Brazil and received product approvals to sell a portion of our large joints product portfolio. |
| • | We continued to execute on our lower extremities strategy internationally, leveraging our OrthoHelix product portfolio and the Salto and Salto Talaris ankle arthroplasty products and building and developing local direct sales organizations in key geographies. |
The following are financial and operating highlights for the year ended December 28, 2014:
| • | Our revenue grew by $34.0 million, or 11%, to $345.0 million for 2014 compared to $311.0 million for 2013 primarily due to the continued increase in global sales of our Aequalis Ascend Flex, Salto Talaris ankle arthroplasty products and hip products in certain international markets. Our U.S. sales organization initiative negatively impacted our revenues in both 2013 and 2014 due to disruption in the sales channel. In general, our upper extremities revenues experienced more disruption in 2013, while our lower extremities business was more negatively impacted in 2014 due to the timing of undertaking these transition activities. |
| • | Our gross margins improved to 75.8% for 2014 compared to 72.3% for 2013. This improvement was due primarily to lower manufacturing costs and production efficiencies, partially offset by higher excess and obsolete inventory charges. Additionally, our gross margin for 2014 was impacted by $0.6 million of inventory fair value adjustments as a result of certain business acquisitions compared to $5.9 million for 2013 for acquired inventory primarily related to our OrthoHelix acquisition. |
| • | We incurred an operating loss of $21.4 million for 2014 compared to an operating loss of $24.1 million for 2013. We improved our overall operating loss due to revenue growth during the year as well as gross margin rate improvements. However, we continued to make strategic investments in our sales force, sales support functions, certain technology and infrastructure, and expanded direct presence in certain international geographies, which increased our operating expenses as a percentage of revenue in 2014 as compared to 2013 and partially offset our gross margin growth. In total, our operating loss as a percentage of sales improved slightly during 2014. |
| • | We continued to make significant progress on the implementation of an enterprise resource planning (ERP) system, which increased the amount of our spending in selling, general and administrative expenses as well as investments in property, plant and equipment during 2014. We intend to continue this important initiative into 2015, which will continue to drive higher levels of operating expenses in the near term, but we believe this investment will help create a sustainable foundation to support business growth over the long term. |
Proposed Merger with Wright
On October 27, 2014, we entered into an agreement and plan of merger with Wright Medical Group, Inc. (Wright). The merger agreement provides that, upon the terms and subject to the conditions set forth in the merger agreement, an indirect wholly owned subsidiary of Tornier N.V. will merge with and into Wright, with Wright continuing as the surviving company and an indirect wholly owned subsidiary of our company following
68
Table of Contents
the transaction. Following the closing of the transaction, the combined company will conduct business as Wright Medical Group N.V. and. Robert J. Palmisano, Wright’s president and chief executive officer, will become president and chief executive officer of the combined company and David H. Mowry, our president and chief executive officer, will become executive vice president and chief operating officer of the combined company. Wright Medical Group N.V.’s board of directors will be comprised of five representatives from Wright’s existing board of directors and five representatives from our existing board of directors, including Mr. Palmisano and Mr. Mowry.
Subject to the terms and conditions of the merger agreement, at the effective time and as a result of the merger, each share of common stock of Wright issued and outstanding immediately prior to the effective time of the merger will be converted into the right to receive 1.0309 Tornier ordinary shares. In addition, at the effective time and as a result of the merger, all outstanding options to purchase shares of Wright common stock and other equity awards based on Wright common stock, which are outstanding immediately prior to the effective time of the merger, will become immediately vested and converted into and become, respectively, options to purchase Tornier ordinary shares and with respect to all other Wright equity awards, awards based on Tornier ordinary shares, in each case, on terms substantially identical to those in effect prior to the effective time of the merger, except for the vesting requirements and adjustments to the underlying number of shares and the exercise price based on the exchange ratio used in the merger and other adjustments as provided in the merger agreement. Upon completion of the merger, our shareholders will own approximately 48% of the combined company on a fully diluted basis and Wright shareholders will own approximately 52%.
The transaction is subject to approval of our and Wright’s shareholders, effectiveness of a Form S-4 registration statement filed by us with the Securities and Exchange Commission, the expiration or termination of applicable waiting periods under the Hart-Scott-Rodino Antitrust Improvements Act of 1976, and other customary closing conditions. The transaction is expected to be completed in mid-year 2015.
See “Part I—Item 1A Risk Factors” for a discussion of the risks related to the merger.
Results of Operations
Fiscal Year Comparisons
The following table sets forth, for the periods indicated, certain items from our consolidated statements of operations and the percentage of revenue that such items represent for the periods shown.
| Year ended | ||||||||||||||||||||||||
| December 28, 2014 |
December 29, 2013 |
December 30, 2012 |
||||||||||||||||||||||
| ($ in thousands) | ||||||||||||||||||||||||
| Statements of Operations Data: |
||||||||||||||||||||||||
| Revenue |
$ | 344,953 | 100 | % | $ | 310,959 | 100 | % | $ | 277,520 | 100 | % | ||||||||||||
| Cost of goods sold |
83,464 | 24 | 86,172 | 28 | 81,918 | 30 | ||||||||||||||||||
|
|
|
|
|
|
|
|||||||||||||||||||
| Gross profit |
261,489 | 76 | 224,787 | 72 | 195,602 | 70 | ||||||||||||||||||
| Selling, general and administrative |
237,158 | 69 | 206,851 | 67 | 170,447 | 61 | ||||||||||||||||||
| Research and development |
24,139 | 7 | 22,387 | 7 | 22,524 | 8 | ||||||||||||||||||
| Amortization of intangible assets |
17,135 | 5 | 15,885 | 5 | 11,721 | 4 | ||||||||||||||||||
| Special charges |
4,479 | 1 | 3,738 | 1 | 19,244 | 7 | ||||||||||||||||||
|
|
|
|
|
|
|
|||||||||||||||||||
| Operating loss |
(21,422 | ) | (6 | ) | (24,074 | ) | (8 | ) | (28,334 | ) | (10 | ) | ||||||||||||
| Interest income |
136 | 0 | 245 | 0 | 338 | 0 | ||||||||||||||||||
| Interest expense |
(5,319 | ) | (2 | ) | (7,256 | ) | (2 | ) | (3,733 | ) | (1 | ) | ||||||||||||
| Foreign currency transaction (loss) gain |
(1,115 | ) | (0 | ) | (1,820 | ) | (1 | ) | (473 | ) | (0 | ) | ||||||||||||
| Loss on extinguishment of debt |
— | — | (1,127 | ) | (0 | ) | (593 | ) | (0 | ) | ||||||||||||||
| Other non-operating (expense) income, net |
(161 | ) | (0 | ) | (45 | ) | (0 | ) | 116 | 0 | ||||||||||||||
|
|
|
|
|
|
|
|||||||||||||||||||
| Loss before income taxes |
(27,881 | ) | (8 | ) | (34,077 | ) | (11 | ) | (32,679 | ) | (12 | ) | ||||||||||||
| Income tax (expense) benefit |
(1,590 | ) | (0 | ) | (2,349 | ) | (1 | ) | 10,935 | 4 | ||||||||||||||
|
|
|
|
|
|
|
|||||||||||||||||||
| Consolidated net loss |
$ | (29,471 | ) | (9 | )% | $ | (36,426 | ) | (12 | )% | $ | (21,744 | ) | (8 | )% | |||||||||
|
|
|
|
|
|
|
|||||||||||||||||||
69
Table of Contents
The following tables set forth, for the periods indicated, our revenue by product category and geography expressed as dollar amounts and the changes in revenue between the specified periods expressed as percentages:
| Revenue by Product Category | Year ended | Percent change | ||||||||||||||||||||||||||
| December 28, 2014 |
December 29, 2013 |
December 30, 2012 |
2014/ 2013 |
2013/ 2012 |
2014/ 2013 |
2013/ 2012 |
||||||||||||||||||||||
| ($ in thousands) | (as stated) | (constant currency)* |
||||||||||||||||||||||||||
| Upper extremity joints and trauma |
$ | 213,320 | $ | 184,457 | $ | 175,242 | 16 | % | 5 | % | 16 | % | 5 | % | ||||||||||||||
| Lower extremity joints and trauma |
59,249 | 58,747 | 34,109 | 1 | 72 | 1 | 72 | |||||||||||||||||||||
| Sports medicine and biologics |
14,174 | 14,752 | 15,526 | (4 | ) | (5 | ) | (4 | ) | (5 | ) | |||||||||||||||||
|
|
|
|
|
|
|
|
|
|
|
|
|
|
|
|||||||||||||||
| Total extremities |
286,743 | 257,956 | 224,877 | 11 | 15 | 12 | 14 | |||||||||||||||||||||
| Large joints and other |
58,210 | 53,003 | 52,643 | 10 | 1 | 10 | (2 | ) | ||||||||||||||||||||
|
|
|
|
|
|
|
|
|
|
|
|
|
|
|
|||||||||||||||
| Total |
$ | 344,953 | $ | 310,959 | $ | 277,520 | 11 | % | 12 | % | 11 | % | 11 | % | ||||||||||||||
|
|
|
|
|
|
|
|
|
|
|
|
|
|
|
|||||||||||||||
| Revenue by Geography | Year ended | Percent change | ||||||||||||||||||||||||||
| December 28, 2014 |
December 29, 2013 |
December 30, 2012 |
2014/ 2013 |
2013/ 2012 |
2014/ 2013 |
2013/ 2012 |
||||||||||||||||||||||
| ($ in thousands) | (as stated) | (constant currency) * |
||||||||||||||||||||||||||
| United States |
$ | 199,286 | $ | 182,104 | $ | 156,750 | 9 | % | 16 | % | 9 | % | 16 | % | ||||||||||||||
| International |
145,667 | 128,855 | 120,770 | 13 | 7 | 14 | 5 | |||||||||||||||||||||
|
|
|
|
|
|
|
|
|
|
|
|
|
|
|
|||||||||||||||
| Total |
$ | 344,953 | $ | 310,959 | $ | 277,520 | 11 | % | 12 | % | 11 | % | 11 | % | ||||||||||||||
|
|
|
|
|
|
|
|
|
|
|
|
|
|
|
|||||||||||||||
| * | Constant currency is a non-GAAP financial measure. We calculate constant currency percentages by converting our current-period local currency financial results using the prior-period foreign currency exchange rates and comparing these adjusted amounts to our prior-period reported results. |
Year Ended December 28, 2014 (2014) Compared to Year Ended December 29, 2013 (2013)
Revenue. Revenue increased by 11% to $345.0 million in 2014 from $311.0 million in 2013, primarily as a result of increases in revenue from our upper extremity joints and trauma products and large joints and other products. Foreign currency exchange rate fluctuations had a negative impact of $0.8 million in 2014. Excluding the negative impact of foreign currency exchange rate fluctuations, our revenue grew by 11% on a constant currency basis.
Revenue by product category. Revenue in upper extremity joints and trauma increased by 16% to $213.3 million in 2014 from $184.5 million in 2013, primarily as a result of the continued increase in sales of our Aequalis Ascend Flex convertible shoulder system. We believe the increase in sales of our shoulder products was due to continued surgeon acceptance and market adoption of the Aequalis Ascend Flex, which was supported by the increasing availability of instrument sets due to our on-going investments. This increase was partially offset by decreased revenue from our mature shoulder products. Foreign currency exchange rate fluctuations had a negative impact of $0.7 million on the upper extremity joints and trauma revenue growth during 2014. Excluding the negative impact of foreign currency exchange rate fluctuations, our upper extremity joints and trauma revenue grew by 16% on a constant currency basis. We anticipate that revenues from the Aequalis Ascend Flex will continue to grow relative to our mature shoulder products and that it will comprise a larger portion of our overall upper extremity joints and trauma business in future periods.
Revenue in lower extremity joints and trauma increased by 1% to $59.2 million in 2014 from $58.7 million in 2013, driven by growth in sales of our ankle arthritis portfolio of products, including both total ankle arthroplasty and ankle fusion products, partially offset by decreases in sales of our core foot fixation products
70
Table of Contents
which continued to reflect the negative impact of our U.S. sales force transition efforts. We believe that this sales channel disruption will continue in lower extremity joints and trauma products in the United States in 2015 and could potentially increase due to the pending Merger with Wright.
Revenue in sports medicine and biologics decreased 4% to $14.2 million in 2014 from $14.8 million in 2013 as growth in sales of our suture and BioFiber products was more than offset by decreases in sales of certain anchor products and our Conexa product. The decrease in sports medicine and biologics revenue reflects our increased focus on our other upper and lower extremities products.
Revenue from large joints and other increased by 10% to $58.2 million in 2014 from $53.0 million in 2013 related primarily to growth in sales of our hip products due to increased case volume in Europe from new minimally invasive surgical techniques and new instrumentation. Foreign currency exchange rate fluctuations had a positive impact of $0.1 million on our large joints and other revenue during the year ended 2014. Excluding the positive impact of foreign currency exchange rate fluctuations, our large joints and other revenue increased by 10% on a constant currency basis. We do not expect 2014 level of increased hip procedure volume to continue in future periods.
Revenue by geography. Revenue in the United States increased by 9% to $199.3 million in 2014 from $182.1 million in 2013, primarily due to increases in sales of the Aequalis Ascend Flex convertible shoulder system and the Salto Talaris Total Ankle replacement system. These increases were partially offset by decreases in revenue related to our mature shoulder products and foot fixation products. In addition, our 2014 growth was elevated due to the fact that our 2013 results were negatively impacted by the disruption of our U.S. sales channel transitions. While this disruption was not as significant for 2014, we believe our U.S. lower extremity joints and trauma revenue was negatively impacted by the continuation of these transitions in 2014, and we expect this revenue disruption to continue to adversely affect our U.S. lower extremity joints and trauma revenue during 2015 as we continue to focus on the training and education of our sales representatives and implementing strong performance management practices.
International revenue increased by 13% to $145.7 million in 2014 from $128.9 million in 2013. International revenues increased in France, Germany, Australia, Switzerland and the United Kingdom from increased procedure volumes and in Japan from the launch of Aequalis Reversed shoulder systems. Foreign currency exchange rate fluctuations had a negative impact of $0.8 million on international revenue during 2014. Excluding the negative impact of foreign currency exchange rate fluctuations, our international revenue increased by 14% on a constant currency basis. If current U.S. dollar exchange rate trends continue, our reported international revenue could be negatively impacted in 2015.
Cost of goods sold. Cost of goods sold decreased to $83.5 million in 2014 from $86.2 million in 2013. As a percentage of revenue, cost of goods sold decreased to 24% in 2014 from 28% in 2013, primarily due to a reduction in fair value adjustments related to inventory acquired in business acquisitions from $5.9 million in 2013 to $0.6 million in 2014. In addition, product cost improvements, production efficiencies and the insourcing of certain products also contributed to this improvement. This decrease was partially offset by a higher level of excess and obsolete inventory charges which increased $3.0 million in 2014 compared to 2013. We intend to continue to focus on improving our cost of goods sold as a percentage of revenue through a combination of manufacturing efficiencies, additional insourcing activities and improved product mix. However, our cost of goods sold and corresponding gross profit as a percentage of revenue can be expected to fluctuate in future periods depending upon certain factors, including, among others, changes in our product sales mix and prices, distribution channels and geographies, manufacturing yields, plans for insourcing some previously outsourced production activities, inventory reserves required, levels of production volume and fluctuating inventory costs due to changes in foreign currency exchange rates since the period they were manufactured.
Selling, general and administrative. Our selling, general and administrative expenses increased by 15% to $237.2 million in 2014 from $206.9 million in 2013 primarily as a result of increased variable expenses due to higher revenue. As a percentage of revenue, selling, general and administrative expenses were 69% and 67% for
71
Table of Contents
2014 and 2013, respectively. The increase in selling, general and administrative expenses as a percentage of revenue was primarily a result of higher sales management and distribution costs related to our U.S. direct sales force, an increase in expense related to the consumption of instrument spare parts, and increased costs related to management incentive plans and share-based compensation. We expect selling, general and administrative expenses as a percentage of revenue to remain at current levels in the near term until we experience the full anticipated revenue benefits of our U.S. sales channel transitions, integration initiatives, investments in sales resources, training and education, and new product launches.
Research and development. Research and development expenses increased to $24.1 million in 2014 from $22.4 million in 2013. As a percentage of revenue, research and development expenses remained constant at 7% in 2014 and 2013. We expect research and development expenses as a percentage of revenue to approximate 7% in future periods.
Amortization of intangible assets. Amortization of intangible assets increased $1.3 million to $17.1 million in 2014 from $15.9 million in 2013. This increase was primarily attributable to an increase in intangible assets due to acquisitions that occurred throughout 2013.
Special charges. We recorded $4.5 million in special charges in 2014 compared to $3.7 million in 2013. The $4.5 million in special charges for 2014 were primarily comprised of $3.3 million of integration and distributor transition costs, $4.8 million of costs incurred related our proposed merger with Wright and $1.7 million of restructuring related costs related to the relocation of certain functions from our Medina, Ohio facility to our Bloomington, Minnesota facility, partially offset by a $5.4 million reversal of a contingent consideration liability related to our OrthoHelix acquisition due to the under-performance of lower extremity products versus established revenue targets. The $3.7 million in special charges for 2013 were primarily comprised of $7.1 million of integration and distributor transition costs and $1.2 million of legal settlements in the United States, partially offset by a $5.1 million reversal of a contingent consideration liability related to our OrthoHelix acquisition due to the under-performance of lower extremity products versus established revenue targets. We expect to record special charges in 2015 between $2.6 and $4.6 million primarily related to our ongoing costs related to our proposed merger with Wright. See Note 17 to our consolidated financial statements for further detail on special charges.
Interest income. Our interest income was immaterial for both 2014 and 2013.
Interest expense. Our interest expense decreased to $5.3 million in 2014 from $7.3 million in 2013 due primarily to the repayment of our $40.0 million Euro denominated term loan and a $10.5 million repayment of principal on our U.S. dollar denominated term loan in the second quarter of 2013.
Foreign currency transaction loss. We recognized $1.1 million of foreign currency transaction loss in 2014 compared to a $1.8 million foreign currency transaction loss in 2013. Foreign currency gains and losses are recognized when a transaction is denominated in a currency other than the subsidiary’s functional currency. The decrease in foreign currency transaction loss was primarily attributable to foreign currency exchange rate fluctuations on foreign currency denominated intercompany payables and receivables.
Other non-operating (expense) income. Our other non-operating income was immaterial for both 2014 and 2013.
Income tax (expense) benefit. We recorded income tax expense of $1.6 million during 2014 compared to an income tax expense of $2.3 million for 2013. Our effective tax rate for 2014 and 2013 was (5.7)% and (6.9)%, respectively. The change in our effective tax rate from 2013 to 2014 primarily relates to the impact of a $0.7 million tax benefit from the reversal of valuation allowance related to the determination that based on positive evidence, valuation allowances were not required in certain foreign jurisdictions, $0.7 million of benefit from the reversal of a reserve for uncertain tax position due to the expiration of the statute of limitations. Our income taxes
72
Table of Contents
are also impacted by the relative percentage of our pre-tax income generated from operations in countries with related income tax expense compared to operations in countries in which we have pre-tax losses but for which we record a valuation allowance against our deferred tax assets, and thus, cannot recognize income tax benefits. Given our history of operating losses, we do not generally record a provision for income taxes in the United States and certain of our European geographies.
Year Ended December 29, 2013 (2013) Compared to Year Ended December 30, 2012 (2012)
Revenue. Revenue increased by 12% to $311.0 million in 2013 from $277.5 million in 2012, primarily as a result of our acquisition and integration of OrthoHelix and growth in upper extremity joints and trauma. Foreign currency exchange rate fluctuations had a positive impact of $2.1 million in 2013. Excluding the positive impact of foreign currency exchange rate fluctuations, our revenue grew by 11% on a constant currency basis. We believe revenue in 2013 was negatively impacted by disruption in our U.S. sales channel due to our strategic initiative to establish separate sales channels that are individually focused on upper extremity products and lower extremity products.
Revenue by product category. Revenue in upper extremity joints and trauma increased by 5% to $184.5 million in 2013 from $175.2 million in 2012, primarily as a result of an increase in sales of our Aequalis Ascend shoulder products, including the Aequalis Ascend Flex convertible shoulder that was launched in the third quarter of 2013, and Aequalis reversed shoulder products and the Latitude EV elbow. We believe the increase in sales of our Aequalis Ascend shoulder products was due to market share gains and the launch of the Aequalis Ascend Flex, while the increased sales of our Aequalis reversed shoulder products resulted from market movement toward reversed shoulder replacement procedures. This increase was partially offset by decreased revenue from our mature shoulder products and disruption in our U.S. sales channel. Foreign currency exchange rate fluctuations had a positive impact of $0.5 million on the upper extremity joints and trauma revenue growth during 2013. Excluding the positive impact of foreign currency exchange rate fluctuations, our upper extremity joints and trauma revenue grew by 5% on a constant currency basis.
Revenue in lower extremity joints and trauma increased by 72% to $58.7 million in 2013 from $34.1 million in 2012, primarily as a result of our acquisition and integration of OrthoHelix. This growth was partially offset by decreased revenue of legacy Tornier foot and ankle fixation products driven by disruption in our U.S. sales channel due to our strategic initiative to establish separate sales channels that are individually focused on upper extremity products and lower extremity products.
Revenue in sports medicine and biologics decreased 5% to $14.8 million in 2013 from $15.5 million in 2012 as growth in our suture and BioFiber products was more than offset by decreases in certain anchor products and our Conexa product. Our sports medicine and biologics products are sold by both our upper and lower extremities sales forces and were also partially impacted by the disruption in our U.S. sales channel.
Revenue from large joints and other increased by 1% to $53.0 million in 2013 from $52.6 million in 2012 related primarily to growth in sales of our hip products and the positive impact of foreign currency exchange rate fluctuations, partially offset by declines in sales of our mature knee products as we transitioned to next generation technologies. Revenue from our large joints and other category is primarily generated in certain western European geographies which experienced economic pressures during 2013, negatively impacting our revenue in this category. Foreign currency exchange rate fluctuations had a positive impact of $1.5 million on our large joints and other revenue during 2013. Excluding the positive impact of foreign currency exchange rate fluctuations, our large joints and other revenue decreased by 2% on a constant currency basis.
Revenue by geography. Revenue in the United States increased by 16% to $182.1 million in 2013 from $156.8 million in 2012, primarily due to our acquisition and integration of OrthoHelix. Excluding the impact from OrthoHelix, our revenues in the United States decreased as a result of disruption in our U.S. sales channel due to our strategic initiative to establish separate sales channels that are individually focused on upper extremity products and lower extremity products.
73
Table of Contents
International revenue increased by 7% to $128.9 million in 2013 from $120.8 million in 2012. International revenue increased due to revenue growth in France from increased demand and certain geographic expansion activities in which we increased the number of products sold through direct sales channels in countries where we historically utilized local independent distributor representation. Our international revenue growth was partially offset by decreases in revenue in certain western European countries due to austerity measures and lower procedure volumes and lower sales volumes to certain stocking distributors. Foreign currency exchange rate fluctuations had a positive impact of $2.1 million on international revenue during 2013. Excluding the positive impact of foreign currency exchange rate fluctuations, our international revenue increased by 5% on a constant currency basis.
Cost of goods sold. Cost of goods sold increased to $86.2 million in 2013 from $81.9 million in 2012. As a percentage of revenue, cost of goods sold decreased to 28% in 2013 from 30% in 2012, primarily due to product cost improvements, production efficiencies and the insourcing of certain products. This decrease was partially offset by a higher level of excess and obsolete inventory charges and the negative impact of our geographical revenue mix. Also included in cost of goods sold in 2013 is approximately $5.9 million in fair value adjustments related to inventory acquired in our acquisition of OrthoHelix compared to $2.0 million in fair value adjustments related to acquired inventory and $3.0 million related to product rationalization charges in 2012 as a result of our acquisition of OrthoHelix.
Selling, general and administrative. Our selling, general and administrative expenses increased by 21% to $206.9 million in 2013 from $170.4 million in 2012 primarily as a result of our acquisition of OrthoHelix. As a percentage of revenue, selling, general and administrative expenses were 67% and 61% in 2013 and 2012, respectively. The increase in selling, general and administrative expense as a percentage of revenue was primarily a result of higher variable sales expenses and non-variable sales expenses related to the establishment of direct sales channels in the United States and several countries internationally, higher investments in sales training and education, an increase in expense related to information technology infrastructure and $3.2 million of expense related to the medical device excise tax which became effective in 2013.
Research and development. Research and development expenses decreased slightly to $22.4 million in 2013 from $22.5 million in 2012. As a percentage of revenue, research and development expenses decreased 1% to 7% in 2013 from 8% in 2012. The decrease in total research and development expense of $0.1 million was primarily due to lower spending due to the timing of certain development projects, partially offset by our acquisition of OrthoHelix.
Amortization of intangible assets. Amortization of intangible assets increased $4.2 million to $15.9 million in 2013 from $11.7 million in 2012. The increase in amortization expense was primarily attributable to an increase in intangible assets due to our acquisition of OrthoHelix.
Special charges. We recorded $3.7 million in special charges in 2013 compared to $19.2 million in 2012. The $3.7 million in special charges for 2013 were primarily comprised of $7.1 million of integration and distributor transition costs and $1.2 million of legal settlements in the United States, partially offset by a $5.1 million reversal of a contingent consideration liability related to our OrthoHelix acquisition due to the under-performance of legacy Tornier lower extremity products versus established revenue targets. Special charges in 2012 included approximately $6.4 million of expense related to our facilities consolidation initiative, $4.7 million of intangible impairment charges, $3.5 million of integration costs related to our acquisitions of OrthoHelix and our exclusive stocking distributor in Belgium and Luxembourg, $2.0 million of bad debt expense related to the termination of a distributor and worsening general economic conditions in Italy, $1.4 million of expense related to distributor transition costs in the United States and internationally, and $1.2 million of expense related to management exit costs including the departures of our former Chief Executive Officer and Global Chief Financial Officer. See Note 17 to our consolidated financial statements for further detail on special charges.
74
Table of Contents
Interest income. Our interest income was immaterial for both 2013 and 2012.
Interest expense. Our interest expense increased to $7.3 million in 2013 from $3.7 million in 2012 due primarily to the establishment of our credit facility which was used to fund our acquisition of OrthoHelix in the fourth quarter of 2012. In addition, interest expense was higher due to the accretion of interest expense related to OrthoHelix earn-out liabilities.
Foreign currency transaction loss. We recognized $1.8 million of foreign currency transaction loss in 2013 compared to a $0.5 million foreign currency transaction loss in 2012. Foreign currency gains and losses are recognized when a transaction is denominated in a currency other than the subsidiary’s functional currency. The increase in foreign currency transaction loss was primarily attributable to foreign currency exchange rate fluctuations on foreign currency denominated intercompany payables and receivables.
Loss on extinguishment of debt. We recorded $1.1 million in loss on extinguishment of debt for 2013 related to the write-off of a debt discount on the repayment of our Euro denominated term loan. This compared to $0.6 million in loss on extinguishment of debt in 2012 as a result of penalties incurred upon repayment of certain portions of our previously existing European debt. We were required to repay all existing debt in 2012 prior to entering into the senior secured term loans that were used to finance our acquisition of OrthoHelix.
Other non-operating (expense) income. Our other non-operating income was immaterial for both 2013 and 2012.
Income tax (expense) benefit. We recorded income tax expense of $2.3 million during 2013 compared to an income tax benefit of $10.9 million for 2012. Our effective tax rate for 2013 and 2012 was (6.9)% and 33.5%, respectively. The change in our effective tax rate from 2012 to 2013 primarily relates to the impact of a $10.4 million tax benefit from the reversal of valuation allowance related to the OrthoHelix acquisition and the relative percentage of our pre-tax income generated from operations in countries with related income tax expense compared to operations in countries in which we have pre-tax losses but for which we record a valuation allowance against our deferred tax assets, and thus, cannot recognize income tax benefits. In addition, we recorded $1.0 million of income tax expense to establish a valuation allowance for deferred tax assets related to foreign stock-based compensation during 2013. We determined the tax planning strategies necessary to realize these deferred tax assets were no longer prudent, and as a result, we no longer believed these deferred tax assets were realizable. Given our history of operating losses, we do not generally record a provision for income taxes in the United States and certain of our European geographies.
Foreign Currency Exchange Rates
A substantial portion of our business is located outside the United States, and as a result, we generate revenue and incur expenses denominated in currencies other than the U.S. dollar. As a result, fluctuations in the value of foreign currencies relative to the U.S. dollar can impact our operating results. The majority of our operations denominated in currencies other than the U.S. dollar are denominated in Euros. In 2014 and 2013, approximately 42% and 41%, respectively, of our revenue was denominated in foreign currencies. As a result, our revenue can be significantly impacted by fluctuations in foreign currency exchange rates. For example, currency exchange rates for the Euro, and several other currencies, decreased significantly versus the U.S. dollar in late calendar year 2014 and early 2015, and if these exchange rates were to stay at this level throughout 2015, our revenue would be negatively impacted by approximately $21 million as compared to 2014. We expect that foreign currencies will continue to represent a similarly significant percentage of our revenue in the future. Selling, marketing and administrative costs related to these sales are largely denominated in the same foreign currencies, thereby limiting our foreign currency transaction risk exposure. In addition, we also have significant levels of other selling, general and administrative expenses and research and development expenses denominated in foreign currencies. We, therefore, believe that the risk of a significant impact on our earnings from foreign currency fluctuations is mitigated to some extent.
75
Table of Contents
A substantial portion of the products we sell in the United States are manufactured in countries where costs are incurred in Euros. Fluctuations in the Euro to U.S. dollar exchange rate will have an impact on the cost of the products we manufacture in those countries, but we would not likely be able to change our U.S. dollar selling prices of those same products in the United States in response to those cost fluctuations. As a result, fluctuations in the Euro to U.S. dollar exchange rates could have a significant impact on our gross profit in future periods in which that inventory is sold. Impacts associated with fluctuations in foreign currency exchange rates are discussed in more detail under “Item 7A. Quantitative and Qualitative Disclosures about Market Risk.”
We evaluate our results of operations on both an as reported and a constant currency basis. The constant currency presentation is a non-GAAP financial measure, which excludes the impact of fluctuations in foreign currency exchange rates. We believe providing constant currency information provides valuable supplemental information regarding our results of operations, consistent with how we evaluate our performance. We calculate constant currency percentages by converting our current-period local currency financial results using the prior-period foreign currency exchange rates and comparing these adjusted amounts to our prior-period reported results. This calculation may differ from similarly-titled measures used by others; and, accordingly, the constant currency presentation is not meant to be a substitution for recorded amounts presented in conformity with GAAP nor should such amounts be considered in isolation.
Seasonality and Quarterly Fluctuations
Our business is seasonal in nature. Historically, demand for our products has been the lowest in our third quarter in the United States in the summer months and internationally as a result of the European holiday schedule.
We have experienced and expect to continue to experience meaningful variability in our revenue and gross profit among quarters, as well as within each quarter, as a result of a number of factors including, among other things, the transitions to direct selling models in certain geographies and the transition of our U.S. sales channel towards focusing separately on upper and lower extremity products; the number and mix of products sold in the quarter and the geographies in which they are sold; the demand for, and pricing of our products and the products of our competitors; the timing of or failure to obtain regulatory clearances or approvals for products; costs, benefits and timing of new product introductions; the level of competition; the timing and extent of promotional pricing or volume discounts; changes in average selling prices; the availability and cost of components and materials; number of selling days; fluctuations in foreign currency exchange rates; the timing of patients’ use of their calendar year medical insurance deductibles; and impairment and other special charges.
Liquidity and Capital Resources
Working Capital
Since inception, we have generated significant operating losses resulting in an accumulated deficit of $301.6 million as of December 28, 2014. Historically, our liquidity needs have been met through a combination of sales of our equity and commercial debt financing. We believe that our cash and cash equivalents balance of approximately $27.9 million as of December 28, 2014, along with $24.0 million of available credit under our revolving credit facility, will be sufficient to fund our working capital requirements and operations, including recent and potential acquisitions to continue our U.S. sales channel transition and international expansion, and permit anticipated capital expenditures during the next twelve months, although we may seek to increase our credit availability under our existing credit facility to provide further working capital flexibility. In the event that we would require additional working capital to fund future operations or for other needs, we could seek to acquire that through additional issuances of equity or additional debt financing arrangements, which may or may not be available on favorable terms at such time. In addition, our merger agreement with Wright contains covenants limiting our ability to issue equity securities and enter into additional material debt financing arrangements.
76
Table of Contents
The following table sets forth, for the periods indicated, certain liquidity measures:
| As of | ||||||||
| December 28, 2014 | December 29, 2013 | |||||||
| ($ in thousands) | ||||||||
| Cash and cash equivalents |
$ | 27,940 | $ | 56,784 | ||||
| Working capital |
125,240 | 150,209 | ||||||
| Available lines of credit |
24,000 | 30,000 | ||||||
| Total short and long-term debt |
75,499 | 69,081 | ||||||
Total working capital, which includes cash and cash equivalents, was negatively impacted during 2014 as a result of increased investments in surgical instrumentation, property plant and equipment and inventory, partially offset by an increase in accounts receivable. The increase in total short-term and long-term debt was due to an advance of $6.0 million on our revolving line of credit facility in the third quarter of 2014.
Credit Facility
Our credit facility consists of the following: (1) a senior secured term loan facility denominated in U.S. dollars in an aggregate principal amount of up to $75 million (referred to as the USD term loan facility); (2) a senior secured term loan facility denominated in Euros in an aggregate principal amount of up to the U.S. dollar equivalent of $40 million (referred to as the EUR term loan facility); and (3) a senior secured revolving credit facility denominated at our election, in U.S. dollars, Euros, pounds, sterling and yen in an aggregate principal amount of up to the U.S. dollar equivalent of $30 million. The original borrowings under the term loan facilities described above were used to pay a portion of the purchase price consideration for our acquisition of OrthoHelix, and fees, costs and expenses incurred in connection with the acquisition and the credit agreement and to repay prior existing indebtedness. As of December 28, 2014, we had $61.7 million of term debt outstanding, net of unamortized discount, under this credit facility. The term loan matures in October 2017. Funds available under the revolving credit facility may be used for general corporate purposes.
At our option, borrowings under our revolving credit facility and our U.S. dollar denominated term loan facility bear interest at (a) the alternate base rate (if denominated in U.S. dollars), equal to the greatest of (i) the prime rate in effect on such day, (ii) the federal funds rate in effect on such day plus 1/2 of 1%, and (iii) the adjusted LIBO rate plus 1%, plus in the case of each of (i)-(iii) above, an applicable rate of 2.00% or 2.25% (depending on our total net leverage ratio as defined in our credit agreement), or (b) the applicable adjusted LIBO rate for the relevant interest period plus an applicable rate of 3.00% or 3.25% (depending on our total net leverage ratio), plus the mandatory cost (as defined in our credit agreement) if such loan is made in a currency other than U.S. dollars or from a lending office in the United Kingdom or a participating member state (as defined in our credit agreement). In addition, we are subject to a 0.5% interest rate on the unfunded balance of the senior secured revolving credit facility. As of December 28, 2014, we had $6.0 million of debt outstanding under this revolving credit facility.
The credit agreement contains customary covenants, including financial covenants which require us to maintain minimum interest coverage and maximum total net leverage ratios, and customary events of default. The obligations under the credit agreement are guaranteed by us, Tornier Inc. and certain other of our subsidiaries, and subject to certain exceptions, are secured by a first priority security interest in substantially all of our assets and the assets of certain of our existing and future subsidiaries of Tornier. We were in compliance with all covenants as of December 28, 2014.
Other Liquidity Information
In connection with our acquisitions of OrthoHelix, a stocking distributor in Australia and certain U.S. distributors and independent sales agencies during 2013 and 2014, we agreed to pay in cash additional earn-out
77
Table of Contents
payments based upon the future revenue performance of specific products or geographies during fiscal years 2014 and 2015. We estimate those payments to be approximately $2.0 million in aggregate and these liabilities are recorded in contingent consideration liabilities—current in our consolidated balance sheet as of December 28, 2014.
Cash Flows
The following summarizes the components of our consolidated statements of cash flows for the years ended December 28, 2014, December 29, 2013 and December 30, 2012:
Operating activities. Net cash provided by operating activities was $1.0 million in 2014 compared to $25.0 million in 2013. This decrease of $24.0 million in operating cash flow was attributable to a decrease in cash generated from working capital of $20.9 million.
Net cash provided by operating activities was $25.0 million in 2013 compared to $14.4 million in 2012. This increase of $10.6 million in operating cash flow was attributable to a decrease in our consolidated net loss that was cash related in 2013 and an increase in cash from working capital of $6.3 million.
Investing activities. Net cash used in investing activities totaled $34.3 million, $46.2 million and $125.8 million in 2014, 2013 and 2012, respectively. The decrease in net cash used in investing activities in 2014 compared to 2013 was due to lower acquisition related payments. The decrease in net cash used in investing activities in 2013 compared to 2012 was primarily driven by our 2012 acquisition of OrthoHelix, which had included cash consideration of $100.4 million.
Our industry is capital intensive, particularly as it relates to surgical instrumentation. Our instrument additions were $21.8 million, $23.8 million and $12.0 million in 2014, 2013 and 2012, respectively. Instrument additions in 2014 and 2013 were higher than 2012 due to the global launch of products acquired in 2012 from OrthoHelix and launches of the Aequalis Ascend Flex shoulder and Latitude EV elbow in the second half of 2013. Our expenditures related to property, plant and equipment were $10.5 million, $10.8 million and $11.3 million in 2014, 2013 and 2012, respectively. The expenditures for property, plant and equipment in 2014 and 2013 included our investments in a global Enterprise Resource Planning (ERP) system and our expenditures for property, plant and equipment in 2012 included the move of our U.S. sales and distribution activities from Stafford, Texas to Bloomington, Minnesota. A significant amount of expenditures are derived in currencies other than the U.S. Dollar and may be impacted by exchange rates in future periods.
Financing activities. Net cash provided by financing activities was $2.7 million, $45.5 million and $86.7 million in 2014, 2013 and 2012, respectively. The $2.7 million in net cash provided by financing activities in 2014 related to draws on our revolving credit facility and cash received from stock option exercises, partially offset by earnout payments related to prior acquisitions. The $45.5 million in net cash provided by financing activities in 2013 included approximately $79.0 million in proceeds raised from our May 2013 underwritten public offering and $21.5 million received from stock option exercises, partially offset by $54.1 million in payments made on our senior secured term loans. The $86.7 million in net cash provided by financing activities in 2012 included $121.0 million in proceeds from the issuance of debt incurred to fund our acquisition of OrthoHelix, partially offset by the repayment of our previously existing long term debt.
78
Table of Contents
Contractual Obligations and Commitments
The following table summarizes our outstanding contractual obligations as of December 28, 2014 for the categories set forth below, assuming only scheduled amortizations and repayment at maturity:
| Payment Due By Period | ||||||||||||||||||||
| Contractual Obligations | Total | Less than 1 Year |
1 - 3 Years | 3 - 5 Years | More than 5 Years |
|||||||||||||||
| ($ in thousands) | ||||||||||||||||||||
| Amounts reflected in consolidated balance sheet: |
||||||||||||||||||||
| Bank debt |
$ | 71,686 | $ | 6,903 | $ | 63,301 | $ | 811 | $ | 671 | ||||||||||
| Shareholder loan |
2,203 | — | — | — | 2,203 | |||||||||||||||
| Contingent consideration |
1,989 | 1,989 | — | — | — | |||||||||||||||
| Capital leases |
1,597 | 478 | 698 | 421 | — | |||||||||||||||
| Amounts not reflected in consolidated balance sheet: |
||||||||||||||||||||
| Interest on bank debt |
7,044 | 2,883 | 4,083 | 61 | 17 | |||||||||||||||
| Interest on contingent consideration |
31 | 31 | — | — | — | |||||||||||||||
| Interest on capital leases |
141 | 70 | 59 | 12 | — | |||||||||||||||
| Operating leases |
26,133 | 5,761 | 8,771 | 5,777 | 5,824 | |||||||||||||||
|
|
|
|
|
|
|
|
|
|
|
|||||||||||
| Total |
$ | 110,824 | $ | 18,115 | $ | 76,912 | $ | 7,082 | $ | 8,468 | ||||||||||
|
|
|
|
|
|
|
|
|
|
|
|||||||||||
Off-Balance Sheet Arrangements
We do not have any off-balance sheet arrangements, as defined by the rules and regulations of the SEC, that have or are reasonably likely to have a material effect on our financial condition, changes in financial condition, revenue or expenses, results of operations, liquidity, capital expenditures or capital resources. As a result, we are not materially exposed to any financing, liquidity, market or credit risk that could arise if we had engaged in these arrangements.
Critical Accounting Policies
Our consolidated financial statements and related financial information are based on the application of U.S. GAAP. The preparation of our consolidated financial statements in conformity with U.S. GAAP requires us to make estimates and assumptions that affect the amounts reported in our consolidated financial statements and accompanying notes.
Certain of our critical accounting policies require the application of significant judgment by management in selecting the appropriate assumptions for calculating financial estimates. By their nature, these judgments are subject to an inherent degree of uncertainty. These judgments are based on our historical experience, terms of existing contracts, our observance of trends in the industry, information provided by our physician customers and information available from other outside sources, as appropriate. Changes in accounting estimates are reasonably likely to occur from period to period. Changes in these estimates and changes in our business could have a material impact on our consolidated financial statements.
79
Table of Contents
We believe that the following accounting policies are both important to the portrayal of our financial condition and results of operations and require subjective or complex judgments. Further, we believe that the items discussed below are properly recognized in our consolidated financial statements for all periods presented. Management has discussed the development, selection and disclosure of our critical financial estimates with the audit committee and our board of directors. The judgments about those financial estimates are based on information available as of the date of our consolidated financial statements. Our critical accounting policies and estimates are described below:
Revenue Recognition
We derive our revenue from the sale of medical devices that are used by orthopaedic and general surgeons who treat diseases and disorders of extremity joints, including the shoulder, elbow, wrist, hand, ankle and foot, and large joints, including the hip and knee. Our revenue is generated from sales to two types of customers: healthcare institutions and stocking distributors. Sales to healthcare institutions represent the majority of our revenue. Revenue from sales to healthcare institutions is generally recognized at the time of surgical implantation. We generally record revenue from sales to our stocking distributors at the time the product is shipped to the distributor. Stocking distributors, who sell the products to their customers, take title to the products and assume all risks of ownership at time of shipment. We do not have any arrangements with stocking distributors that allow for retroactive pricing adjustments. Our stocking distributors are obligated to pay within specified terms regardless of when, if ever, they sell the products. Taxes assessed by a governmental authority that are directly imposed on revenue-producing transactions between a seller and a customer are not recorded as revenue. In certain circumstances, we may accept sales returns from distributors and in certain situations in which the right of return exists, we estimate a reserve for sales returns and recognize the reserve as a reduction of revenue. We base our estimate for sales returns on historical sales and product return information including historical experience and trend information. Our reserve for sales returns has historically been immaterial. We charge our customers for shipping and handling and recognize these amounts as part of revenue.
Allowance for Doubtful Accounts
We maintain an allowance for doubtful accounts for estimated losses in the collection of accounts receivable. We make estimates regarding the future ability of our customers to make required payments based on historical credit experience, delinquency and current and expected future trends. The majority of our receivables are due from healthcare institutions, many of which are government funded. Accordingly, our collection history with this class of customer has been favorable and has resulted in a low level of historical write-offs. We write off accounts receivable when we determine that the accounts receivable are uncollectible, typically upon customer bankruptcy or the customer’s non-response to continued collection efforts.
We believe that the amount included in our allowance for doubtful accounts historically has been an appropriate estimate of the amount of accounts receivable that is ultimately not collected. While we believe that our allowance for doubtful accounts is adequate, the financial condition of our customers and the geopolitical factors that impact reimbursement under individual countries’ healthcare systems can change rapidly, which may necessitate additional allowances in future periods. Our allowance for doubtful accounts was $5.8 million and $5.1 million at December 28, 2014 and December 29, 2013, respectively.
Excess and Obsolete Inventory
We value our inventory at the lower of the actual cost to purchase or manufacture the inventory on a first-in, first-out, or FIFO, basis or its net realizable value. We regularly review inventory quantities on hand for excess and obsolete inventory (which can include charges for product expirations) and, when circumstances indicate, we incur charges to write down inventories to their net realizable value. Our review of inventory for excess and obsolete quantities is based on an analysis of historical product sales together with our forecast of future product demand and production requirements. A significant decrease in demand could result in an increase in the amount
80
Table of Contents
of excess inventory quantities on hand. Additionally, our industry is characterized by regular new product developments that could result in an increase in the amount of obsolete inventory quantities on hand due to cannibalization of existing products. Also, our estimates of future product demand may prove to be inaccurate, in which case we may be required to incur charges for excess and obsolete inventory. In the future, if additional inventory write-downs are required, we would recognize additional cost of goods sold at the time of such determination. Regardless of changes in our estimates of future product demand, we do not increase the value of our inventory above its adjusted cost basis. Therefore, although we make every effort to ensure the accuracy of our forecasts of future product demand, significant unanticipated decreases in demand or technological developments could have a significant impact on the value of our inventory and our reported operating results. Charges incurred for excess and obsolete inventory were $11.4 million, $8.4 million and $8.2 million for 2014, 2013 and 2012, respectively.
Instruments
Instruments are surgical tools used by orthopaedic and general surgeons during joint replacement and other surgical procedures to facilitate the implantation of our products. There are no contractual terms with respect to the usage of our instruments by our customers and we maintain ownership of these instruments, except in situations where we sell instruments to certain stocking distributors. We generally do not charge for the use of our instruments and there are no minimum purchase commitments relating to our products. As our surgical instrumentation is used numerous times over several years, often by many different customers, instruments are recognized as long-lived assets. Instruments and instrument parts that have not been placed in service are carried at cost and are included as instruments in progress within instruments, net of allowances for excess and obsolete instruments, on our consolidated balance sheets. Once placed in service, instruments are carried at cost, less accumulated depreciation. Instrument parts used to maintain the functionality of instrument sets but that do not extend the life of the instrument sets are expensed as they are consumed and recorded as part of selling, general and administrative expense. Depreciation is computed using the straight-line method based on average estimated useful lives. Estimated useful lives are determined principally in reference to associated product life cycles, and average five years. As instruments are used as tools to assist surgeons, depreciation of instruments is recognized as a selling, general and administrative expense. Instrument depreciation expense was $16.6 million, $13.9 million and $12.4 million during 2014, 2013 and 2012, respectively.
We review instruments for impairment whenever events or changes in circumstances indicate that the carrying value of the assets may not be recoverable. An impairment loss would be recognized when estimated future undiscounted cash flows relating to an asset are less than the asset’s carrying amount. An impairment loss is measured as the amount by which the carrying amount of an asset exceeds its fair value. No impairments were recorded in 2014 or 2013.
Business Combinations, Goodwill and Long-Lived Assets
We account for acquired businesses using the purchase method of accounting. Under the purchase method, our consolidated financial statements include the financial results of an acquired business starting from the date the acquisition is completed. In addition, the assets acquired, liabilities assumed and any contingent consideration must be recorded at the date of acquisition at their respective estimated fair values, with any excess of the purchase price over the estimated fair values of the net assets acquired recorded as goodwill. Significant judgment is required in estimating the fair value of contingent consideration, intangible assets and in assigning their respective useful lives. Accordingly, we typically obtain the assistance of third-party valuation specialists for significant acquisitions. The fair value estimates are based on available historical information and on future expectations and assumptions deemed reasonable by management, but are inherently uncertain.
We typically have used a discounted cash flow analysis to determine the fair value of contingent consideration on the date of acquisition. Significant changes in the discount rate used could affect the accuracy of the fair value calculation. Contingent consideration is adjusted based on experience in subsequent periods and the impact of changes related to assumptions are recorded in operating expenses as incurred.
81
Table of Contents
We typically use an income method to estimate the fair value of intangible assets, which is based on forecasts of the expected future cash flows attributable to the respective assets. Significant estimates and assumptions inherent in the valuations reflect a consideration of other marketplace participants and include the amount and timing of future cash flows (including expected growth rates and profitability), the underlying product or technology life cycles, the economic barriers to entry and the discount rate applied to the cash flows. Unanticipated market or macroeconomic events and circumstances may occur that could affect the accuracy or validity of the estimates and assumptions.
Determining the useful life of an intangible asset also requires judgment. Certain intangibles are expected to have indefinite lives based on their history and our plans to continue to support and build the acquired brands. Other acquired intangible assets (e.g., certain trademarks or brands, customer relationships, patents and technologies) are expected to have finite useful lives. Our assessment as to trademarks and brands that have an indefinite life and those that have a finite life is based on a number of factors including competitive environment, market share, trademark and/or brand history, underlying product life cycles, operating plans and the macroeconomic environment of the countries in which the trademarks or brands are sold. Our estimates of the useful lives of finite-lived intangibles are primarily based on these same factors. All of our acquired technology and customer-related intangibles are expected to have finite useful lives.
As of December 28, 2014, we had approximately $244.8 million of goodwill recorded as a result of the acquisition of businesses. Goodwill is tested for impairment annually or more frequently if changes in circumstances or the occurrence of events suggest that impairment exists. Based on our single business approach to decision-making, planning and resource allocation, we have determined that we have one reporting unit for purposes of evaluating goodwill for impairment. We use widely accepted valuation techniques to determine the fair value of our reporting unit used in our annual goodwill impairment analysis. Our valuation is primarily based on a qualitative assessment and, if necessary, a quantitative assessments regarding the fair value of the reporting unit relative to the carrying value. We also use a market approach to evaluate the reasonableness of the income approach. We performed our annual impairment test on the first day of the fourth quarter of 2014 and determined that the fair value of our reporting unit significantly exceeded its carrying value and, therefore, no impairment charge was necessary.
We depreciate our property, plant and equipment and instruments and amortize our intangible assets based upon our estimate of the respective asset’s useful life. Our estimate of the useful life of an asset requires us to make judgments about future events, such as product life cycles, new product development, product cannibalization and technological obsolescence, as well as other competitive factors beyond our control. We account for the impairment of long-lived assets in accordance with Financial Accounting Standards Board (FASB) Accounting Standard Codification (ASC) Section 360, Property, Plant and Equipment (FASB ASC 360) and ASC 350, Intangibles—Goodwill and Other. Accordingly, when indicators of impairment exist, we evaluate impairments of our property, plant and equipment, instruments, and intangibles based upon an analysis of estimated undiscounted future cash flows. If we determine that a change is required in the useful life of an asset, future depreciation and amortization is adjusted accordingly. Alternatively, if we determine that an asset has been impaired, an adjustment would be charged to earnings based on the asset’s fair market value, or discounted cash flows if the fair market value is not readily determinable.
Accounting for Income Taxes
Our effective tax rate is based on income by tax jurisdiction, statutory rates and tax-saving initiatives available to us in the various jurisdictions in which we operate. Significant judgment is required in determining our effective tax rate and evaluating our tax positions. This process includes assessing temporary differences resulting from differing recognition of items for income tax and financial reporting purposes. These differences result in deferred tax assets and liabilities, which are included within our consolidated balance sheet. Realization of deferred tax assets in each taxable jurisdiction is dependent on our ability to generate future taxable income sufficient to realize the benefits. Management evaluates deferred tax assets on an ongoing basis and provides valuation allowances to reduce net deferred tax assets to the amount that is more likely than not to be realized.
82
Table of Contents
Our valuation allowance balances totaled $54.7 million and $40.4 million as of December 28, 2014 and December 29, 2013, respectively, due to uncertainties related to our ability to realize, before expiration, some of our deferred tax assets for both U.S. and foreign income tax purposes. These deferred tax assets primarily consist of the carryforward of certain tax basis net operating losses and general business tax credits.
We recognize tax benefits when they are more likely than not to be realized. As a multinational corporation, we are subject to taxation in many jurisdictions and the calculation of our tax liabilities for uncertain tax positions involves dealing with the application of complex tax laws and regulations in various taxing jurisdictions. If we ultimately determine that the payment of these liabilities will be unnecessary, we will reverse the liability and recognize a tax benefit in the period in which we determine the liability no longer applies. Conversely, we record additional tax charges in a period in which we determine that a recorded tax liability is less than we expect the ultimate assessment to be. Our liability for unrecognized tax benefits totaled $2.3 million and $3.1 million as of December 28, 2014 and December 29, 2013, respectively.
Share-Based Compensation
For purposes of calculating share-based compensation, we estimate the fair value of stock options using a Black-Scholes option pricing model. The determination of the fair value of share-based payment awards utilizing this Black-Scholes model is affected by our ordinary share price and a number of assumptions, including expected volatility, expected life, risk-free interest rate and expected dividends. The estimated fair value of share-based awards exchanged for employee and non-employee director services are expensed over the requisite service period. Option awards issued to non-employees (excluding non-employee directors) are recorded at their fair value as determined in accordance with authoritative guidance, are periodically revalued as the options vest and are recognized as expense over the related service period.
We currently do not have information available which is indicative of future exercise and post-vesting behavior to estimate the expected term. As a result, we adopted the simplified method of estimating the expected term of a stock option, as permitted by ASC 718. Under this method, the expected term is presumed to be the mid-point between the vesting date and the contractual end of the term of our share-based awards. As a non-public entity prior to February 2011, historic volatility was not available for our ordinary shares. As a result, we estimated volatility based on a peer group of companies that we believe collectively provides a reasonable basis for estimating volatility. We intend to continue to consistently use the same group of publicly traded peer companies to determine volatility in the future until sufficient information regarding volatility of our ordinary share price becomes available or the selected companies are no longer suitable for this purpose. The risk-free interest rate is based on the implied yield available on U.S. Treasury zero-coupon issues with a remaining term approximately equal to the expected life of our stock options. The estimated pre-vesting forfeiture rate is based on our historical experience together with estimates of future employee turnover. We do not expect to declare cash dividends in the foreseeable future. For a summary of compensation expense related to share-based awards, see Note 16 of our consolidated financial statements.
If factors change and we employ different assumptions, share-based compensation expense may differ significantly from what we have recorded in the past. If there is a difference between the assumptions used in determining share-based compensation expense and the actual factors which become known over time, specifically with respect to anticipated forfeitures, we may change the input factors used in determining share-based compensation costs for future grants. These changes, if any, may materially impact our results of operations in the period such changes are made. We expect to continue to grant stock options and other share-based awards in the future, and to the extent that we do, our actual share-based compensation expense recognized in future periods will likely increase.
Recent Accounting Pronouncements
In May 2014, the Financial Accounting Standards Board (FASB) issued Accounting Standards Update (ASU) 2014-09, Revenue from Contracts with Customers as a new topic, Accounting Standards Codification (ASC) Topic 606. ASU 2014-09 provides new guidance related to how an entity should recognize revenue to
83
Table of Contents
depict the transfer of promised goods or services to customers in an amount that reflects the consideration to which the entity expects to be entitled in exchange for those goods or services. In addition, ASU 2014-09 specifies new accounting for costs associated with obtaining or fulfilling contracts with customers and expands the required disclosures related to revenue and cash flows from contracts with customers. This new guidance is effective for fiscal years, and interim periods within those years, beginning after December 15, 2016, and can be adopted either retrospectively to each prior reporting period presented or as a cumulative-effect adjustment as of the date of adoption, with early application not permitted. We are currently determining our implementation approach and assessing the impact on our consolidated financial statements and related disclosures.
In April 2014, the FASB issued ASU 2014-08, Presentation of Financial Statements (ASC Topic 205) and Property, Plant, and Equipment (ASC Topic 360)—Reporting Discontinued Operations and Disclosures of Disposals of Components of an Entity. ASU 2014-08 provides new guidance related to the definition of a discontinued operation and requires new disclosures of both discontinued operations and certain other disposals that do not meet the definition of a discontinued operation. This new guidance is effective for annual periods beginning on or after December 15, 2014 and interim periods within those years. Beginning in 2015, we will adopt the new guidance, as applicable, to future disposals of components or classifications as held for sale.
In July 2013, the FASB issued ASU 2013-11, Income Taxes (ASC Topic 740), Presentation of an Unrecognized Tax Benefit When a Net Operating Loss Carryforward, a Similar Tax Loss, or a Tax Credit Carryforward Exists. ASU 2013-11 requires entities to present unrecognized tax benefits as a decrease in a net operating loss, similar to tax loss or tax credit carryforward if certain criteria are met. The standard clarifies presentation requirements for unrecognized tax benefits but will not alter the way in which entities assess deferred tax assets for realizability. The guidance is effective for the fiscal year, and interim periods within that fiscal year, beginning after December 15, 2013. We adopted this guidance beginning in the first quarter of 2014. The impact of adoption was not material.
In March 2013, the FASB issued ASU 2013-05, Foreign Currency Matters (ASC Topic 830), Parent’s Accounting for the Cumulative Adjustment upon Derecognition of Certain Subsidiaries or Groups of Assets within a Foreign Entity or of an Investment in a Foreign Entity. ASU 2013-05 requires entities to release cumulative translation adjustments to earnings when an entity ceases to have a controlling financial interest in a subsidiary or group of assets within a consolidated foreign entity and the sale or transfer results in the complete or substantially complete liquidation of the foreign entity. ASU 2013-05 is effective for the fiscal year, and interim periods within that fiscal year, beginning after December 15, 2013 and is to be applied prospectively. We adopted this guidance in the first quarter of 2014. The impact of adoption was not material.
ITEM 7A. QUANTITATIVE AND QUALITATIVE DISCLOSURES ABOUT MARKET RISK
We are exposed to various market risks, which may result in potential losses arising from adverse changes in market rates and prices, such as interest rates and foreign currency exchange rate fluctuations. We do not enter into derivatives or other financial instruments for trading or speculative purposes. We believe we are not exposed to a material market risk with respect to our invested cash and cash equivalents.
Interest Rate Risk
Borrowings under our revolving credit facility and U.S. dollar denominated term loan bear interest at variable rates. As of December 28, 2014, we had $6.0 million of borrowings under our revolving credit facility and $61.7 million in borrowings under our U.S. dollar denominated term loan, net of the unamortized discount, and $7.8 million of other debt. Based upon this debt level, and the LIBOR floor on our interest rate, a 100 basis point increase in the annual interest rate on such borrowings would have an immaterial impact on our interest expense on an annual basis.
At our option, borrowings under our revolving credit facility and our U.S. dollar denominated term loan facility bear interest at (a) the alternate base rate (if denominated in U.S. dollars), equal to the greatest of (i) the prime rate in effect on such day, (ii) the federal funds rate in effect on such day plus 1/2 of 1%, and (iii) the
84
Table of Contents
adjusted LIBO rate plus 1%, plus in the case of each of (i)-(iii) above, an applicable rate of 2.00% or 2.25% (depending on our total net leverage ratio as defined in our credit agreement), or (b) the applicable adjusted LIBO rate for the relevant interest period plus an applicable rate of 3.00% or 3.25% (depending on our total net leverage ratio), plus the mandatory cost (as defined in our credit agreement) if such loan is made in a currency other than U.S. dollars or from a lending office in the United Kingdom or a participating member state (as defined in our credit agreement).
At December 28, 2014, our cash and cash equivalents were $27.9 million. Based on our annualized average interest rate, a 10% decrease in the annual interest rate on such balances would result in an immaterial impact on our interest income on an annual basis.
Foreign Currency Exchange Rate Risk
Fluctuations in the exchange rate between the U.S. dollar and foreign currencies could adversely affect our financial results. In 2014 and 2013, approximately 42% and 41%, respectively, of our revenues were denominated in foreign currencies, respectively. We expect that foreign currencies will continue to represent a similarly significant percentage of our revenues in the future. Operating expenses related to these revenues are largely denominated in the same respective currency, thereby limiting our transaction risk exposure, to some extent. However, for revenues not denominated in U.S. dollars, if there is an increase in the rate at which a foreign currency is exchanged for U.S. dollars, it will require more of the foreign currency to equal a specified amount of U.S. dollars than before the rate increase. In such cases and if we price our products in the foreign currency, we will receive less in U.S. dollars than we did before the rate increase went into effect. If we price our products in U.S. dollars and competitors price their products in local currency, an increase in the relative strength of the U.S. dollar could result in our prices not being competitive in a market where business is transacted in the local currency.
In 2014, approximately 74% of our revenues denominated in foreign currencies were derived from European Union countries and were denominated in Euros. Additionally, we have significant intercompany payables and debt with certain European subsidiaries, which are denominated in foreign currencies, principally the Euro. Our principal exchange rate risk therefore exists between the U.S. dollar and the Euro. Fluctuations from the beginning to the end of any given reporting period result in the re-measurement of our foreign currency-denominated cash, receivables, payables and debt, generating currency transaction gains or losses that impact our non-operating income/expense levels in the respective period and are reported in foreign currency transaction gain (loss) in our consolidated financial statements. In 2014 and 2013, we economically hedged our balance sheet exposure to fluctuations in the Euro and other currencies by entering into foreign exchange forward contracts.
85
Table of Contents
ITEM 8. FINANCIAL STATEMENTS AND SUPPLEMENTARY DATA
Index to Consolidated Financial Statements
| 87 | ||||
| 89 | ||||
| 90 | ||||
| 91 | ||||
| 92 | ||||
| 93 | ||||
| 94 |
86
Table of Contents
Report of Independent Registered Public Accounting Firm
The Board of Directors and Shareholders
of Tornier N.V. and subsidiaries
We have audited the accompanying consolidated balance sheets of Tornier N.V. and subsidiaries as of December 28, 2014 and December 29, 2013, and the related consolidated statements of operations, comprehensive loss, shareholders’ equity and cash flows for each of the three years in the period ended December 28, 2014. Our audits also included the financial statement schedule listed in the Index at Item 15(a). These financial statements and schedule are the responsibility of the Company’s management. Our responsibility is to express an opinion on these financial statements and schedule based on our audits.
We conducted our audits in accordance with the standards of the Public Company Accounting Oversight Board (United States). Those standards require that we plan and perform the audit to obtain reasonable assurance about whether the financial statements are free of material misstatement. An audit includes examining, on a test basis, evidence supporting the amounts and disclosures in the financial statements. An audit also includes assessing the accounting principles used and significant estimates made by management, as well as evaluating the overall financial statement presentation. We believe that our audits provide a reasonable basis for our opinion.
In our opinion, the financial statements referred to above present fairly, in all material respects, the consolidated financial position of Tornier N.V. and subsidiaries at December 28, 2014 and December 29, 2013, and the consolidated results of their operations and their cash flows for each of the three years in the period ended December 28, 2014, in conformity with U.S. generally accepted accounting principles. Also, in our opinion, the related financial statement schedule, when considered in relation to the basic financial statements taken as a whole, presents fairly in all material respects the information set forth therein.
We also have audited, in accordance with the standards of the Public Company Accounting Oversight Board (United States), Tornier N.V.’s internal control over financial reporting as of December 28, 2014, based on criteria established in Internal Control-Integrated Framework issued by the Committee of Sponsoring Organizations of the Treadway Commission (2013 framework) and our report dated February 24, 2015, expressed an unqualified opinion thereon.
/s/ Ernst & Young LLP
Minneapolis, MN
February 24, 2015
87
Table of Contents
Report of Independent Registered Public Accounting Firm
The Board of Directors and Shareholders
of Tornier N.V. and subsidiaries
We have audited Tornier N.V. and subsidiaries’ internal control over financial reporting as of December 28, 2014, based on criteria established in Internal Control—Integrated Framework issued by the Committee of Sponsoring Organizations of the Treadway Commission (2013 framework) (the COSO criteria). Tornier N.V. and subsidiaries’ management is responsible for maintaining effective internal control over financial reporting, and for its assessment of the effectiveness of internal control over financial reporting included in the accompanying Management’s Annual Report on Internal Control Over Financial Reporting. Our responsibility is to express an opinion on the company’s internal control over financial reporting based on our audit.
We conducted our audit in accordance with the standards of the Public Company Accounting Oversight Board (United States). Those standards require that we plan and perform the audit to obtain reasonable assurance about whether effective internal control over financial reporting was maintained in all material respects. Our audit included obtaining an understanding of internal control over financial reporting, assessing the risk that a material weakness exists, testing and evaluating the design and operating effectiveness of internal control based on the assessed risk, and performing such other procedures as we considered necessary in the circumstances. We believe that our audit provides a reasonable basis for our opinion.
A company’s internal control over financial reporting is a process designed to provide reasonable assurance regarding the reliability of financial reporting and the preparation of financial statements for external purposes in accordance with generally accepted accounting principles. A company’s internal control over financial reporting includes those policies and procedures that (1) pertain to the maintenance of records that, in reasonable detail, accurately and fairly reflect the transactions and dispositions of the assets of the company; (2) provide reasonable assurance that transactions are recorded as necessary to permit preparation of financial statements in accordance with generally accepted accounting principles, and that receipts and expenditures of the company are being made only in accordance with authorizations of management and directors of the company; and (3) provide reasonable assurance regarding prevention or timely detection of unauthorized acquisition, use, or disposition of the company’s assets that could have a material effect on the financial statements.
Because of its inherent limitations, internal control over financial reporting may not prevent or detect misstatements. Also, projections of any evaluation of effectiveness to future periods are subject to the risk that controls may become inadequate because of changes in conditions, or that the degree of compliance with the policies or procedures may deteriorate.
In our opinion, Tornier N.V. and subsidiaries maintained, in all material respects, effective internal control over financial reporting as of December 28, 2014, based on the COSO criteria.
We also have audited, in accordance with the standards of the Public Company Accounting Oversight Board (United States), the consolidated balance sheets of Tornier N.V. and subsidiaries as of December 28, 2014 and December 29, 2013, and the related consolidated statement of operations, comprehensive loss, shareholders’ equity, and cash flows for each of the three fiscal years in the period ended December 28, 2014 of Tornier N.V. and subsidiaries and our report dated February 24, 2015 expressed an unqualified opinion thereon.
/s/ Ernst & Young LLP
Minneapolis, Minnesota
February 24, 2015
88
Table of Contents
TORNIER N.V. AND SUBSIDIARIES
(U.S. dollars in thousands, except share and per share amounts)
| December 28, 2014 |
December 29, 2013 |
|||||||
| Assets |
||||||||
| Current assets: |
||||||||
| Cash and cash equivalents |
$ | 27,940 | $ | 56,784 | ||||
| Accounts receivable (net of allowance of $5,779 and $5,080, respectively) |
63,583 | 55,555 | ||||||
| Inventories |
88,662 | 87,011 | ||||||
| Deferred income taxes |
6,817 | 5,601 | ||||||
| Prepaid taxes |
12,858 | 14,667 | ||||||
| Prepaid expenses |
4,613 | 3,151 | ||||||
| Other current assets |
5,228 | 3,756 | ||||||
|
|
|
|
|
|||||
| Total current assets |
209,701 | 226,525 | ||||||
| Instruments, net |
62,888 | 63,055 | ||||||
| Property, plant and equipment, net |
44,662 | 43,494 | ||||||
| Goodwill |
244,782 | 251,540 | ||||||
| Intangible assets, net |
95,120 | 117,608 | ||||||
| Deferred income taxes |
128 | 660 | ||||||
| Other assets |
1,294 | 2,544 | ||||||
|
|
|
|
|
|||||
| Total assets |
$ | 658,575 | $ | 705,426 | ||||
|
|
|
|
|
|||||
| Liabilities and shareholders’ equity |
||||||||
| Current liabilities: |
||||||||
| Short-term borrowing and current portion of long-term debt |
$ | 7,394 | $ | 1,438 | ||||
| Accounts payable |
15,073 | 17,326 | ||||||
| Accrued liabilities |
59,109 | 50,714 | ||||||
| Income taxes payable |
887 | 397 | ||||||
| Contingent consideration, current |
1,989 | 6,428 | ||||||
| Deferred income taxes |
9 | 13 | ||||||
|
|
|
|
|
|||||
| Total current liabilities |
84,461 | 76,316 | ||||||
| Long-term debt |
68,105 | 67,643 | ||||||
| Deferred income taxes |
18,498 | 21,489 | ||||||
| Contingent consideration, long-term |
— | 6,528 | ||||||
| Other non-current liabilities |
8,621 | 7,642 | ||||||
|
|
|
|
|
|||||
| Total liabilities |
179,685 | 179,618 | ||||||
| Shareholders’ equity: |
||||||||
| Ordinary shares, €0.03 par value; authorized 175,000,000; issued and outstanding 48,974,449 and 48,508,612 at December 28, 2014 and December 29, 2013, respectively |
1,939 | 1,921 | ||||||
| Additional paid-in capital |
783,335 | 769,466 | ||||||
| Accumulated deficit |
(301,629 | ) | (272,158 | ) | ||||
| Accumulated other comprehensive (loss) income |
(4,755 | ) | 26,579 | |||||
|
|
|
|
|
|||||
| Total shareholders’ equity |
478,890 | 525,808 | ||||||
|
|
|
|
|
|||||
| Total liabilities and shareholders’ equity |
$ | 658,575 | $ | 705,426 | ||||
|
|
|
|
|
|||||
The accompanying notes are an integral part of the consolidated financial statements.
89
Table of Contents
TORNIER N.V. AND SUBSIDIARIES
Consolidated Statements of Operations
(U.S. dollars in thousands, except share and per share amounts)
| Fiscal year ended | ||||||||||||
| December 28, 2014 |
December 29, 2013 |
December 30, 2012 |
||||||||||
| Revenue |
$ | 344,953 | $ | 310,959 | $ | 277,520 | ||||||
| Cost of goods sold |
83,464 | 86,172 | 81,918 | |||||||||
|
|
|
|
|
|
|
|||||||
| Gross profit |
261,489 | 224,787 | 195,602 | |||||||||
| Operating expenses: |
||||||||||||
| Selling, general and administrative |
237,158 | 206,851 | 170,447 | |||||||||
| Research and development |
24,139 | 22,387 | 22,524 | |||||||||
| Amortization of intangible assets |
17,135 | 15,885 | 11,721 | |||||||||
| Special charges |
4,479 | 3,738 | 19,244 | |||||||||
|
|
|
|
|
|
|
|||||||
| Total operating expenses |
282,911 | 248,861 | 223,936 | |||||||||
|
|
|
|
|
|
|
|||||||
| Operating loss |
(21,422 | ) | (24,074 | ) | (28,334 | ) | ||||||
| Other income (expense): |
||||||||||||
| Interest income |
136 | 245 | 338 | |||||||||
| Interest expense |
(5,319 | ) | (7,256 | ) | (3,733 | ) | ||||||
| Foreign currency transaction loss |
(1,115 | ) | (1,820 | ) | (473 | ) | ||||||
| Loss on extinguishment of debt |
— | (1,127 | ) | (593 | ) | |||||||
| Other non-operating (expense) income, net |
(161 | ) | (45 | ) | 116 | |||||||
|
|
|
|
|
|
|
|||||||
| Loss before income taxes |
(27,881 | ) | (34,077 | ) | (32,679 | ) | ||||||
| Income tax (expense) benefit |
(1,590 | ) | (2,349 | ) | 10,935 | |||||||
|
|
|
|
|
|
|
|||||||
| Consolidated net loss |
$ | (29,471 | ) | $ | (36,426 | ) | $ | (21,744 | ) | |||
|
|
|
|
|
|
|
|||||||
| Net loss per share: |
||||||||||||
| Basic and diluted |
$ | (0.60 | ) | $ | (0.79 | ) | $ | (0.54 | ) | |||
|
|
|
|
|
|
|
|||||||
| Weighted average shares outstanding: |
||||||||||||
| Basic and diluted |
48,860 | 45,826 | 40,064 | |||||||||
|
|
|
|
|
|
|
|||||||
The accompanying notes are an integral part of the consolidated financial statements.
90
Table of Contents
TORNIER N.V. AND SUBSIDIARIES
Consolidated Statements of Comprehensive Loss
(U.S. dollars in thousands)
| Fiscal year ended | ||||||||||||
| December 28, 2014 |
December 29, 2013 |
December 30, 2012 |
||||||||||
| Consolidated net loss |
$ | (29,471 | ) | $ | (36,426 | ) | $ | (21,744 | ) | |||
| Unrealized (loss) gain on retirement plans |
(1,430 | ) | 95 | (866 | ) | |||||||
| Foreign currency translation adjustments |
(29,904 | ) | 17,296 | 4,938 | ||||||||
|
|
|
|
|
|
|
|||||||
| Comprehensive loss |
$ | (60,805 | ) | $ | (19,035 | ) | $ | (17,672 | ) | |||
|
|
|
|
|
|
|
|||||||
The accompanying notes are an integral part of the consolidated financial statements.
91
Table of Contents
TORNIER N.V. AND SUBSIDIARIES
Consolidated Statements of Cash Flows
(U.S. dollars in thousands)
| Fiscal year ended | ||||||||||||
| December 28, 2014 |
December 29, 2013 |
December 30, 2012 |
||||||||||
| Cash flows from operating activities: |
||||||||||||
| Consolidated net loss |
$ | (29,471 | ) | $ | (36,426 | ) | $ | (21,744 | ) | |||
| Adjustments to reconcile consolidated net loss to cash provided by operating activities: |
||||||||||||
| Depreciation and amortization |
40,623 | 36,566 | 30,232 | |||||||||
| Impairment of fixed assets |
— | 140 | 2,041 | |||||||||
| Lease termination costs |
— | — | 731 | |||||||||
| Intangible impairment |
— | — | 4,737 | |||||||||
| Non-cash foreign currency loss (gain) |
1,087 | 1,829 | (495 | ) | ||||||||
| Deferred income taxes |
(7,893 | ) | 3,566 | (4,506 | ) | |||||||
| Tax benefit from reversal of valuation allowance |
(146 | ) | (1,120 | ) | (10,700 | ) | ||||||
| Share-based compensation |
9,701 | 8,300 | 6,830 | |||||||||
| Non-cash interest expense and discount amortization |
775 | 969 | 524 | |||||||||
| Inventory obsolescence |
11,433 | 8,447 | 8,171 | |||||||||
| Loss on extinguishment of debt |
— | 1,127 | — | |||||||||
| Incentive related to new facility lease |
— | — | 1,400 | |||||||||
| Acquired inventory step-up |
577 | 5,908 | 1,993 | |||||||||
| Gain on reversal of OrthoHelix contingent consideration liability |
(5,388 | ) | (5,140 | ) | — | |||||||
| Other non-cash items affecting earnings |
908 | 1,095 | 1,836 | |||||||||
| Changes in operating assets and liabilities, net of acquisitions: |
||||||||||||
| Accounts receivable |
(11,100 | ) | (1,084 | ) | (2,188 | ) | ||||||
| Inventories |
(21,619 | ) | (9,186 | ) | (3,057 | ) | ||||||
| Accounts payable and accruals |
12,489 | 7,421 | 87 | |||||||||
| Other current assets and liabilities |
(3,190 | ) | 4,704 | (1,526 | ) | |||||||
| Other non-current assets and liabilities |
2,222 | (2,134 | ) | 65 | ||||||||
|
|
|
|
|
|
|
|||||||
| Net cash provided by operating activities |
1,008 | 24,982 | 14,431 | |||||||||
| Cash flows from investing activities: |
||||||||||||
| Acquisition-related cash payments |
(2,000 | ) | (8,665 | ) | (102,612 | ) | ||||||
| Purchases of intangible assets |
(83 | ) | (2,935 | ) | (1,410 | ) | ||||||
| Additions of instruments |
(21,751 | ) | (23,805 | ) | (11,999 | ) | ||||||
| Property, plant and equipment lease incentive |
— | — | (1,400 | ) | ||||||||
| Purchases of property, plant and equipment |
(10,494 | ) | (10,825 | ) | (9,891 | ) | ||||||
| Proceeds from sale of property, plant and equipment |
— | — | 1,517 | |||||||||
|
|
|
|
|
|
|
|||||||
| Net cash used in investing activities |
(34,328 | ) | (46,230 | ) | (125,795 | ) | ||||||
| Cash flows from financing activities: |
||||||||||||
| Proceeds from (repayments of) short-term debt |
6,000 | (1,000 | ) | (8,009 | ) | |||||||
| Repayments of long-term debt |
(1,092 | ) | (54,095 | ) | (28,684 | ) | ||||||
| Contingent consideration payments |
(6,944 | ) | (1,483 | ) | — | |||||||
| Proceeds from issuance of long-term debt |
477 | 1,796 | 121,045 | |||||||||
| Deferred financing costs |
— | (111 | ) | (5,396 | ) | |||||||
| Issuance of ordinary shares from stock option exercises |
3,976 | 21,481 | 7,710 | |||||||||
| Proceeds from other issuance of ordinary shares |
283 | 78,952 | — | |||||||||
|
|
|
|
|
|
|
|||||||
| Net cash provided by financing activities |
2,700 | 45,540 | 86,666 | |||||||||
| Effect of exchange rate changes on cash and cash equivalents |
1,776 | 1,384 | 1,100 | |||||||||
|
|
|
|
|
|
|
|||||||
| (Decrease) Increase in cash and cash equivalents |
(28,844 | ) | 25,676 | (23,598 | ) | |||||||
| Cash and cash equivalents: |
||||||||||||
| Beginning of period |
56,784 | 31,108 | 54,706 | |||||||||
|
|
|
|
|
|
|
|||||||
| End of period |
$ | 27,940 | $ | 56,784 | $ | 31,108 | ||||||
|
|
|
|
|
|
|
|||||||
| Non-cash investing and financing transactions: |
||||||||||||
| Fixed assets acquired pursuant to capital lease |
$ | 1,236 | $ | 42 | $ | 560 | ||||||
|
|
|
|
|
|
|
|||||||
| Capitalized software development costs |
$ | — | $ | 1,180 | $ | — | ||||||
|
|
|
|
|
|
|
|||||||
| Supplemental disclosure: |
||||||||||||
| Income taxes paid |
$ | 2,034 | $ | 1,700 | $ | 2,937 | ||||||
|
|
|
|
|
|
|
|||||||
| Interest paid |
$ | 4,185 | $ | 6,043 | $ | 2,084 | ||||||
|
|
|
|
|
|
|
|||||||
The accompanying notes are an integral part of the consolidated financial statements.
92
Table of Contents
TORNIER N.V. AND SUBSIDIARIES
Consolidated Statements of Shareholders’ Equity
(U.S. dollars in thousands, except share and per share amounts)
|
Ordinary Shares |
Additional Paid-In Capital |
Accumulated Other Comprehensive Income (Loss) |
Accumulated Deficit |
Total | ||||||||||||||||||||
| Shares | Amount | |||||||||||||||||||||||
| Balance at January 1, 2012 |
39,270 | $ | 1,560 | $ | 608,772 | $ | 5,116 | $ | (213,988 | ) | $ | 401,460 | ||||||||||||
|
|
|
|
|
|
|
|
|
|
|
|
|
|||||||||||||
| Net loss |
— | — | — | — | (21,744 | ) | (21,744 | ) | ||||||||||||||||
| Unrealized loss on retirement plans |
— | — | — | (866 | ) | — | (866 | ) | ||||||||||||||||
| Foreign currency translation adjustments |
— | — | — | 4,938 | — | 4,938 | ||||||||||||||||||
| Issuances of ordinary shares related to acquisition of OrthoHelix Surgical |
1,941 | 75 | 37,954 | — | — | 38,029 | ||||||||||||||||||
| Issuances of ordinary shares related to employee stock purchase plan |
8 | 1 | 169 | — | — | 170 | ||||||||||||||||||
| Issuances of ordinary shares for restricted stock units |
50 | 2 | (2 | ) | — | — | — | |||||||||||||||||
| Issuance of ordinary shares related to stock option exercises |
459 | 17 | 7,523 | — | — | 7,540 | ||||||||||||||||||
| Share-based compensation |
— | — | 6,552 | — | — | 6,552 | ||||||||||||||||||
|
|
|
|
|
|
|
|
|
|
|
|
|
|||||||||||||
| Balance at December 30, 2012 |
41,728 | $ | 1,655 | $ | 660,968 | $ | 9,188 | $ | (235,732 | ) | $ | 436,079 | ||||||||||||
|
|
|
|
|
|
|
|
|
|
|
|
|
|||||||||||||
| Net loss |
— | — | — | — | (36,426 | ) | (36,426 | ) | ||||||||||||||||
| Unrealized gain on retirement plans |
— | — | — | 95 | — | 95 | ||||||||||||||||||
| Foreign currency translation adjustments |
— | — | — | 17,296 | — | 17,296 | ||||||||||||||||||
| Public offering financing costs |
— | — | (4,878 | ) | — | — | (4,878 | ) | ||||||||||||||||
| Issuance of ordinary shares related to public offering. |
5,175 | 202 | 83,375 | — | — | 83,577 | ||||||||||||||||||
| Issuances of ordinary shares related to employee stock purchase plan |
15 | 1 | 253 | — | — | 254 | ||||||||||||||||||
| Issuances of ordinary shares for restricted stock units |
98 | 4 | (4 | ) | — | — | — | |||||||||||||||||
| Issuance of ordinary shares related to stock option exercises |
1,493 | 59 | 21,422 | — | — | 21,481 | ||||||||||||||||||
| Share-based compensation |
— | — | 8,330 | — | — | 8,330 | ||||||||||||||||||
|
|
|
|
|
|
|
|
|
|
|
|
|
|||||||||||||
| Balance at December 29, 2013 |
48,509 | $ | 1,921 | $ | 769,466 | $ | 26,579 | $ | (272,158 | ) | $ | 525,808 | ||||||||||||
|
|
|
|
|
|
|
|
|
|
|
|
|
|||||||||||||
| Net loss |
— | — | — | — | (29,471 | ) | (29,471 | ) | ||||||||||||||||
| Unrealized loss on retirement plans |
— | — | — | (1,430 | ) | — | (1,430 | ) | ||||||||||||||||
| Foreign currency translation adjustments |
— | — | — | (29,904 | ) | — | (29,904 | ) | ||||||||||||||||
| Issuances of ordinary shares related to employee stock purchase plan |
16 | 1 | 283 | — | — | 284 | ||||||||||||||||||
| Issuances of ordinary shares for restricted stock units |
214 | 8 | (8 | ) | — | — | — | |||||||||||||||||
| Issuance of ordinary shares related to stock option exercises |
235 | 9 | 3,967 | — | — | 3,976 | ||||||||||||||||||
| Share-based compensation |
— | — | 9,627 | — | — | 9,627 | ||||||||||||||||||
|
|
|
|
|
|
|
|
|
|
|
|
|
|||||||||||||
| Balance at December 28, 2014 |
48,974 | $ | 1,939 | $ | 783,335 | $ | (4,755 | ) | $ | (301,629 | ) | $ | 478,890 | |||||||||||
|
|
|
|
|
|
|
|
|
|
|
|
|
|||||||||||||
The accompanying notes are an integral part of the consolidated financial statements.
93
Table of Contents
Notes to the Consolidated Financial Statements
| 1. | Business Description |
Tornier N.V. (Tornier or the Company) is a global medical device company focused on providing solutions to surgeons that treat musculoskeletal injuries and disorders of the shoulder, elbow, wrist, hand, ankle and foot, referred to as “extremity joints.” The Company sells to this surgeon base a broad line of joint replacement, trauma, sports medicine and biologic products to treat extremity joints. In certain international markets, the Company also offers joint replacement products for the hip and knee.
Tornier’s global corporate headquarters are located in Amsterdam, the Netherlands. The Company also has significant operations located in Bloomington, Minnesota (U.S. headquarters, sales, marketing and distribution and administration), Grenoble, France (OUS headquarters, manufacturing and research and development), Macroom, Ireland (manufacturing), Warsaw, Indiana (research and development) and Medina, Ohio (marketing, research and development). In addition, the Company conducts local sales and distribution activities across 12 sales offices throughout Europe, Asia, Australia and Canada.
Proposed Merger with Wright Medical Group, Inc.
On October 27, 2014, Tornier entered into an agreement and plan of merger with Wright Medical Group, Inc. (Wright). The merger agreement provides that, upon the terms and subject to the conditions set forth in the merger agreement, an indirect wholly owned subsidiary of Tornier N.V. will merge with and into Wright, with Wright continuing as the surviving company and an indirect wholly owned subsidiary of Tornier following the transaction. Following the closing of the transaction, the combined company will conduct business as Wright Medical Group N.V. and Robert J. Palmisano, Wright’s president and chief executive officer, will become president and chief executive officer of the combined company and David H. Mowry, Tornier’s president and chief executive officer, will become executive vice president and chief operating officer of the combined company. Wright Medical Group N.V.’s board of directors will be comprised of five representatives from Wright’s existing board of directors and five representatives from Tornier’s existing board of directors, including Mr. Palmisano and Mr. Mowry.
Subject to the terms and conditions of the merger agreement, at the effective time and as a result of the merger, each share of common stock of Wright issued and outstanding immediately prior to the effective time of the merger will be converted into the right to receive 1.0309 Tornier ordinary shares. In addition, at the effective time and as a result of the merger, all outstanding options to purchase shares of Wright common stock and other equity awards based on Wright common stock, which are outstanding immediately prior to the effective time of the merger, will become immediately vested and converted into and become, respectively, options to purchase Tornier ordinary shares and with respect to all other Wright equity awards, awards based on Tornier ordinary shares, in each case, on terms substantially identical to those in effect prior to the effective time of the merger, except for the vesting requirements and adjustments to the underlying number of shares and the exercise price based on the exchange ratio used in the merger and other adjustments as provided in the merger agreement. Upon completion of the merger, Tornier shareholders will own approximately 48% of the combined company on a fully diluted basis and Wright shareholders will own approximately 52%.
The transaction is subject to approval of Tornier and Wright shareholders, effectiveness of a Form S-4 registration statement filed by Tornier with the Securities and Exchange Commission and the expiration or termination of applicable waiting periods under the Hart-Scott-Rodino Antitrust Improvements Act of 1976, and other customary closing conditions. The transaction is expected to be completed in mid-2015. In the event that the Company terminates the merger agreement under certain specified circumstances, the Company may be required to pay Wright a $46 million termination fee.
94
Table of Contents
Basis of Presentation
The Company’s fiscal year-end is generally determined on a 52-week basis consisting of four 13 week quarters and always falls on the Sunday nearest to December 31.
The consolidated financial statements and accompanying notes present the consolidated results of the Company for each of the fiscal years in the three-year period ended December 28, 2014, December 29, 2013 and December 30, 2012.
All amounts are presented in U.S. Dollar (“$”), except where expressly stated as being in other currencies, e.g. Euros (“€”).
| 2. | Significant Accounting Policies |
Reclassifications
Certain contingent consideration payments within the consolidated statement of cash flows have been reclassified from investing activities to financing activities to conform with the presentation used in 2014.
Consolidation
The consolidated financial statements include the accounts of the Company and all of its wholly and majority owned subsidiaries. In consolidation, all material intercompany accounts and transactions are eliminated.
Use of Estimates
The consolidated financial statements are prepared in conformity with United States generally accepted accounting principles (U.S. GAAP) and include amounts that are based on management’s best estimates and judgments. Actual results could differ from those estimates.
Foreign Currency Translation
The functional currencies for the Company and all of the Company’s wholly owned subsidiaries are their local currencies. The reporting currency of the Company is the U.S. dollar. Accordingly, the consolidated financial statements of the Company’s international subsidiaries are translated into U.S. dollars using current exchange rates for the consolidated balance sheets and average exchange rates for the consolidated statements of operations and cash flows. Unrealized translation gains and losses are included in accumulated other comprehensive income (loss) in shareholders’ equity. When a transaction is denominated in a currency other than the subsidiary’s functional currency, the Company recognizes a transaction gain or loss in net earnings. Foreign currency transaction (losses) gains included in net earnings were $(1.1) million, $(1.8) million and $(0.5) million during the years ended December 28, 2014, December 29, 2013 and December 30, 2012, respectively.
Revenue Recognition
The Company derives revenue from the sale of medical devices that are used by orthopaedic and general surgeons who treat diseases and disorders of extremity joints, including the shoulder, elbow, wrist, hand, ankle and foot, and large joints, including the hip and knee. Revenue is generated from sales to two types of customers: healthcare institutions and stocking distributors, with sales to healthcare institutions representing a majority of the Company’s revenue. Revenue from sales to healthcare institutions is generally recognized at the time of surgical implantation. Revenue from sales to stocking distributors is recorded at the time the product is shipped to the distributor. These stocking distributors, who sell the products to their customers, take title to the products and assume all risks of ownership at the time of shipment. Stocking distributors are obligated to pay within
95
Table of Contents
specified terms regardless of when, if ever, they sell the products. Taxes assessed by a governmental authority that are directly imposed on revenue-producing transactions between a seller and a customer are not recorded as revenue. In certain circumstances, the Company may accept sales returns from distributors and in certain situations in which the right of return exists, the Company estimates a reserve for sales returns and recognizes the reserve as a reduction of revenue. The Company bases its estimate for sales returns on historical sales and product return information including historical experience and trend information. The Company’s reserve for sales returns has historically been immaterial.
Shipping and Handling
Amounts billed to customers for shipping and handling of products are reflected in revenue and are not considered significant. Costs related to shipping and handling of products are expensed as incurred, are included in selling, general and administrative expense, and were $7.9 million, $5.7 million and $5.1 million for the years ended December 28, 2014, December 29, 2013 and December 30, 2012, respectively.
Cash and Cash Equivalents
Cash equivalents are highly liquid investments with an original maturity of three months or less. The carrying amount reported in the consolidated balance sheets for cash and cash equivalents is cost, which approximates fair value.
Accounts Receivable
Accounts receivable consist of customer trade receivables. The Company maintains an allowance for doubtful accounts for estimated losses in the collection of accounts receivable. The Company makes estimates regarding the future ability of its customers to make required payments based on historical credit experience, delinquency and expected future trends. The majority of the Company’s receivables are from healthcare institutions, many of which are government-funded. The Company’s allowance for doubtful accounts was $5.8 million and $5.1 million at December 28, 2014 and December 29, 2013, respectively. Accounts receivable are written off when it is determined that the accounts are uncollectible, typically upon customer bankruptcy or the customer’s non-response to continued collection efforts.
Financial instruments that potentially subject the Company to concentrations of credit risk consist principally of accounts receivable. Management attempts to minimize credit risk by reviewing customers’ credit history before extending credit and by monitoring credit exposure on a regular basis. The allowance for doubtful accounts is established based upon factors surrounding the credit risk of specific customers, historical trends and other information. Collateral or other security is generally not required for accounts receivable. As of December 28, 2014, there were no customers that accounted for more than 10% of accounts receivable.
Royalties
The Company pays royalties to certain individuals and companies that have developed and retain the legal rights to the technology or have assisted the Company in the development of technology or new products. These royalties are based on sales and are reflected as selling, general and administrative expenses in the consolidated statements of operations.
96
Table of Contents
Inventories
Inventories, net of reserves for obsolete and slow-moving goods, are stated at the lower of cost or market value. Cost is determined on a first-in, first-out (FIFO) basis. Costs included in the value of inventory that Tornier manufactures include the material costs, direct labor costs and manufacturing and distribution overhead costs. Inventories consist of raw materials, work-in-process and finished goods. Finished goods inventories are held primarily in the United States, as well as several countries in Europe, Canada, Japan and Australia and consist primarily of joint implants and related orthopaedic products. Inventory balances, net of reserves, consist of the following (in thousands):
| December 28, 2014 |
December 29, 2013 |
|||||||
| Raw materials |
$ | 7,769 | $ | 6,840 | ||||
| Work in process |
9,197 | 9,171 | ||||||
| Finished goods |
71,696 | 71,000 | ||||||
|
|
|
|
|
|||||
| Total |
$ | 88,662 | $ | 87,011 | ||||
|
|
|
|
|
|||||
The Company regularly reviews inventory quantities on-hand for excess and obsolete inventory and, when circumstances indicate, incurs charges to write down inventories to their net realizable value. The Company’s review of inventory for excess and obsolete quantities is based primarily on the estimated forecast of future product demand, production requirements, and introduction of new products. The Company recognized $11.4 million, $8.4 million and $8.2 million of expense for excess and obsolete inventory in cost of goods sold during the years ended December 28, 2014, December 29, 2013 and December 30, 2012, respectively. Additionally, the Company had $43.1 million and $47.8 million in inventory held on consignment with third-party distributors and healthcare facilities, among others, at December 28, 2014 and December 29, 2013, respectively.
Property, Plant and Equipment
Property, plant and equipment are carried at cost less accumulated depreciation. Depreciation is computed using the straight-line method based on estimated useful lives of five to thirty-nine years for buildings and improvements, five to 10 years for furniture and fixtures and two to eight years for machinery and equipment. The cost of maintenance and repairs is expensed as incurred. The Company reviews property, plant and equipment for impairment whenever events or changes in circumstances indicate that the carrying value of an asset may not be recoverable. An impairment loss would be recognized when estimated future undiscounted cash flows relating to the asset are less than the asset’s carrying amount. An impairment loss is measured as the amount by which the carrying amount of an asset exceeds its fair value.
No impairment charges were recorded for the year ended December 28, 2014. For the year ended December 29, 2013, the Company recorded $0.1 million in impairments related to the fixed assets located in Medina, Ohio that will not be utilized as a result of its OrthoHelix restructuring plan. For the year ended December 30, 2012, the Company recorded several fixed asset impairments related to the Company’s facilities in St. Ismier, France, Dunmanway, Ireland, and Stafford, Texas in the aggregate amount of $0.9 million as a result of the Company’s facilities consolidation initiative.
Software Development Costs
The Company capitalizes certain computer software and software development costs incurred in connection with developing or obtaining computer software for internal use when both the preliminary project stage is completed and it is probable that the software will be used as intended. Capitalized software costs generally include external direct costs of materials and services utilized in developing or obtaining computer software and compensation and related benefits for employees who are directly associated with the software project. Capitalized software costs are included in property, plant and equipment on the Company’s consolidated balance sheet and amortized on a straight-line basis when the software is ready for its intended use over the estimated useful lives of the software, which approximate three to ten years.
97
Table of Contents
Instruments
Instruments are surgical tools used by orthopaedic and general surgeons during joint replacement and other surgical procedures to facilitate the implantation of the Company’s products. Instruments are recognized as long-lived assets. Instruments and instrument parts that have not been placed in service are carried at cost, and are included as instruments in progress within instruments, net on the consolidated balance sheets. Once placed in service, instruments are carried at cost, less accumulated depreciation. Depreciation is computed using the straight-line method based on average estimated useful lives. Estimated useful lives are determined principally in reference to associated product life cycles, and average five years. Instrument parts used to maintain the functionality of instruments but do not extend the life of the instruments are expensed as they are consumed and recorded as part of selling, general and administrative expense. The Company reviews instruments for impairment whenever events or changes in circumstances indicate that the carrying value of the assets may not be recoverable. An impairment loss would be recognized when estimated future undiscounted cash flows relating to the assets are less than the assets’ carrying amount. An impairment loss is measured as the amount by which the carrying amount of an asset exceeds its fair value. No impairment losses were recognized during the years ended December 28, 2014 and December 29, 2013. The Company recorded impairment charges of $1.0 million during the year ended December 30, 2012 related to instrument sets and components that were impaired as a result of the OrthoHelix acquisition.
Instruments included in long-term assets on the consolidated balance sheets are as follows (in thousands):
| December 28, 2014 |
December 29, 2013 |
|||||||
| Instruments |
$ | 106,788 | $ | 99,754 | ||||
| Instruments in progress |
23,456 | 23,990 | ||||||
| Accumulated depreciation |
(67,356 | ) | (60,689 | ) | ||||
|
|
|
|
|
|||||
| Instruments, net |
$ | 62,888 | $ | 63,055 | ||||
|
|
|
|
|
|||||
The Company provides instruments to surgeons for use in surgeries and retains title to the instruments. As instruments are used as tools to assist surgeons, depreciation of instruments is recognized as a selling, general and administrative expense. Instrument depreciation expense was $16.6 million, $13.9 million and $12.4 million during the years ended December 28, 2014, December 29, 2013 and December 30, 2012, respectively.
Business Combinations
For all business combinations, the Company records all assets and liabilities of the acquired business, including goodwill and other identified intangible assets, generally at their fair values starting in the period when the acquisition is completed. Contingent consideration, if any, is recognized at its fair value on the acquisition date and changes in fair value are recognized in earnings until settlement. Acquisition-related transaction costs are expensed as incurred.
Goodwill
Goodwill is recognized as the excess of the purchase price over the fair value of net assets of businesses acquired. Goodwill is not amortized, but is subject to impairment tests. Based on the Company’s single business approach to decision-making, planning and resource allocation, management has determined that the Company has one operating segment with no reporting unit below that level for the purpose of evaluating goodwill for impairment. The Company performs its annual goodwill impairment test as of the first day of the fourth quarter of its fiscal year or more frequently if changes in circumstances or the occurrence of events suggest that an impairment exists. Impairment tests are done by qualitatively assessing the likeliness for impairment and then, if necessary, comparing the reporting unit’s fair value to its carrying amount to determine if there is potential impairment. If the fair value of the reporting unit is less than its carrying value, an impairment loss is recorded to
98
Table of Contents
the extent that the implied fair value of the reporting unit’s goodwill is less than the carrying value of the reporting unit’s goodwill. The fair value of the reporting unit and the implied fair value of goodwill are determined based on widely accepted valuation techniques. No goodwill impairment losses were recorded during the years ended December 28, 2014, December 29, 2013 and December 30, 2012 as the fair value of the reporting unit significantly exceeded its carrying value.
Intangible Assets
Intangible assets with an indefinite life, including certain trademarks and trade names, are not amortized, but are tested for impairment annually or whenever events or circumstances indicate that the carrying amount may not be recoverable. Any amount of impairment loss to be recorded would be determined based upon the excess of the asset’s carrying value over its fair value. No impairment losses on indefinite life intangibles were recorded during the years ended December 28, 2014, December 29, 2013 and December 30, 2012. The useful lives of these assets are also assessed annually to determine whether events and circumstances continue to support an indefinite life.
Intangible assets with a finite life, including developed technology, customer relationships, and patents and licenses, are amortized on a straight-line basis over their estimated useful lives, ranging from one to twenty years. Costs incurred to extend or renew license arrangements are capitalized as incurred and amortized over the shorter of the life of the extension or renewal, or the remaining useful life of the underlying product being licensed. Intangible assets with a finite life are tested for impairment whenever events or circumstances indicate that the carrying amount may not be recoverable. An impairment loss would be recognized when estimated future undiscounted cash flows relating to the asset are less than the asset’s carrying amount and would be measured as the amount by which the carrying amount of an asset exceeds its fair value. No impairment losses were recorded for the year ended December 28, 2014. For the year ended December 29, 2013, the Company recognized an impairment charge of $0.1 million related to license intangibles that are no longer being used. For the year ended December 30, 2012, the Company recognized an impairment charge of $4.7 million related to developed technology and customer relationship intangibles whose fair values were negatively impacted by the acquisition of OrthoHelix Surgical Designs, Inc. (OrthoHelix). The fair value of the intangibles was determined using a discounted cash flow analysis. For the year ended December 29, 2013, the intangible asset impairment is included in amortization of intangible assets in the consolidated statements of operations. For the year ended December 30, 2012, intangible asset impairments are included in special charges on the consolidated statement of operations as they related directly to the acquisition and integration of OrthoHelix.
Derivative Financial Instruments
All of the Company’s derivative instruments are economic hedges and are recorded in the accompanying consolidated balance sheets as either an asset or liability and are measured at fair value. The changes in the derivative’s fair value are recognized in earnings as a component of foreign currency transaction gain (loss) in the period in which the change occurred.
Research and Development
All research and development costs are expensed as incurred.
Income Taxes
Deferred tax assets and liabilities are determined based on differences between the financial reporting and tax bases of assets and liabilities and are measured using the enacted tax rates in effect for the years in which the differences are expected to reverse. Valuation allowances for deferred tax assets are recognized if it is more likely than not that some component or all of the benefits of deferred tax assets will not be realized.
99
Table of Contents
The Company accrues interest and penalties related to unrecognized tax benefits in the Company’s provision for income taxes. In the fiscal years ended December 28, 2014 and December 29, 2013, accrued interest and penalties were $0.1 million and $0.3 million, respectively.
Other Comprehensive Income (Loss)
Other comprehensive income (loss) refers to revenues, expenses, gains, and losses that under U.S. GAAP are included in comprehensive income (loss) but are excluded from net earnings, as these amounts are recorded directly as an adjustment to shareholders’ equity. Other comprehensive income (loss) is comprised mainly of foreign currency translation adjustments and unrealized gains (losses) on retirement plans. These amounts are presented in the consolidated statements of comprehensive loss. The Company deems its foreign investments to be permanent in nature, and therefore, does not provide for taxes on foreign currency translation adjustments.
Share-Based Compensation
The Company accounts for share-based compensation in accordance with Accounting Standards Codification (ASC) Topic 718, Compensation—Stock Compensation, which requires share-based compensation cost to be measured at the grant date based on the fair value of the award and recognized as expense on a straight-line basis over the requisite service period, which is the vesting period. The determination of the fair value of share-based payment awards, such as options, is made on the date of grant using an option-pricing model and is affected by the Company’s share price, as well as assumptions regarding a number of complex and subjective variables, which include the expected life of the award, the expected share price volatility over the expected life of the award, expected dividend yield and risk-free interest rate.
New Accounting Pronouncements
In May 2014, the Financial Accounting Standards Board (FASB) issued Accounting Standards Update (ASU) 2014-09, Revenue from Contracts with Customers as a new topic, Accounting Standards Codification (ASC) Topic 606. ASU 2014-09 provides new guidance related to how an entity should recognize revenue to depict the transfer of promised goods or services to customers in an amount that reflects the consideration to which the entity expects to be entitled in exchange for those goods or services. In addition, ASU 2014-09 specifies new accounting for costs associated with obtaining or fulfilling contracts with customers and expands the required disclosures related to revenue and cash flows from contracts with customers. This new guidance is effective for fiscal years, and interim periods within those years, beginning after December 15, 2016, and can be adopted either retrospectively to each prior reporting period presented or as a cumulative-effect adjustment as of the date of adoption, with early application not permitted. The Company is currently determining its implementation approach and assessing the impact on its consolidated financial statements and related disclosures.
In April 2014, the FASB issued ASU 2014-08, Presentation of Financial Statements (ASC Topic 205) and Property, Plant, and Equipment (ASC Topic 360)—Reporting Discontinued Operations and Disclosures of Disposals of Components of an Entity. ASU 2014-08 provides new guidance related to the definition of a discontinued operation and requires new disclosures of both discontinued operations and certain other disposals that do not meet the definition of a discontinued operation. This new guidance is effective for annual periods beginning on or after December 15, 2014 and interim periods within those years. Beginning in 2015, the Company will adopt the new guidance, as applicable, to future disposals of components or classifications as held for sale.
In July 2013, the FASB issued ASU 2013-11, Income Taxes (ASC Topic 740), Presentation of an Unrecognized Tax Benefit When a Net Operating Loss Carryforward, a Similar Tax Loss, or a Tax Credit Carryforward Exists. ASU 2013-11 requires entities to present unrecognized tax benefits as a decrease in a net operating loss, similar to tax loss or tax credit carryforward if certain criteria are met. The standard clarifies
100
Table of Contents
presentation requirements for unrecognized tax benefits but will not alter the way in which entities assess deferred tax assets for realizability. The guidance is effective for the fiscal year, and interim periods within that fiscal year, beginning after December 15, 2013. The Company adopted this guidance beginning in the first quarter of 2014. The impact of adoption was not material.
In March 2013, the FASB issued ASU 2013-05, Foreign Currency Matters (ASC Topic 830), Parent’s Accounting for the Cumulative Adjustment upon Derecognition of Certain Subsidiaries or Groups of Assets within a Foreign Entity or of an Investment in a Foreign Entity. ASU 2013-05 requires entities to release cumulative translation adjustments to earnings when an entity ceases to have a controlling financial interest in a subsidiary or group of assets within a consolidated foreign entity and the sale or transfer results in the complete or substantially complete liquidation of the foreign entity. ASU 2013-05 is effective for the fiscal year, and interim periods within that fiscal year, beginning after December 15, 2013 and is to be applied prospectively. The Company adopted this guidance in the first quarter of 2014. The impact of adoption was not material.
The Company has evaluated recent accounting pronouncements through ASU 2014-18 and believes that none, other than those described above, will have a material effect on the Company’s consolidated financial statements. The Company does not believe that any other recently issued, but not yet effective, accounting standards if currently adopted would have a material effect on the accompanying consolidated financial statements.
| 3. | Fair Value of Financial Instruments |
The Company measures certain assets and liabilities at fair value on a recurring or non-recurring basis based on the application of ASC Topic 820, which establishes a framework for measuring fair value and clarifies the definition of fair value within that framework. This requires fair value measurements to be classified and disclosed in one of the following three categories:
Level 1—Assets and liabilities with unadjusted, quoted prices listed on active market exchanges.
Level 2—Assets and liabilities determined using prices for recently traded assets and liabilities with similar underlying terms, as well as directly or indirectly observable inputs, such as interest rates and yield curves that are observable at commonly quoted intervals.
Level 3—Assets and liabilities that are not actively traded on a market exchange. This category includes situations where there is little, if any, market activity for the asset or liability. The prices are determined using significant unobservable inputs or valuation techniques.
A summary of the financial assets and liabilities that are measured at fair value on a recurring basis at December 28, 2014 and December 29, 2013 are as follows:
| December 28, 2014 |
Quoted Prices in Active Markets (Level 1) |
Significant Other Observable Inputs (Level 2) |
Significant Unobservable Inputs (Level 3) |
|||||||||||||
| Cash and cash equivalents |
$ | 27,940 | $ | 27,940 | $ | — | $ | — | ||||||||
| Contingent consideration |
(1,989 | ) | — | — | (1,989 | ) | ||||||||||
| Derivative liability |
(502 | ) | — | (502 | ) | — | ||||||||||
|
|
|
|
|
|
|
|
|
|||||||||
| Total, net |
$ | 25,449 | $ | 27,940 | $ | (502 | ) | $ | (1,989 | ) | ||||||
|
|
|
|
|
|
|
|
|
|||||||||
101
Table of Contents
| December 29, 2013 |
Quoted Prices in Active Markets (Level 1) |
Significant Other Observable Inputs (Level 2) |
Significant Unobservable Inputs (Level 3) |
|||||||||||||
| Cash and cash equivalents |
$ | 56,784 | $ | 56,784 | $ | — | $ | — | ||||||||
| Contingent consideration |
(12,956 | ) | — | — | (12,956 | ) | ||||||||||
| Derivative asset |
238 | — | 238 | — | ||||||||||||
|
|
|
|
|
|
|
|
|
|||||||||
| Total, net |
$ | 44,066 | $ | 56,784 | $ | 238 | $ | (12,956 | ) | |||||||
|
|
|
|
|
|
|
|
|
|||||||||
As of December 28, 2014 and December 29, 2013, the Company had derivative liabilities with fair values of $0.5 million and derivative assets with fair values of $0.2 million, respectively, with recurring Level 2 fair value measurements. The derivatives are foreign exchange forward contracts and their fair values are based on pricing for similar recently executed transactions. The amount of foreign currency gain (loss) recognized for the year ended December 28, 2014 and December 29, 2013 related to these derivatives was approximately $(2.7) million and $0.4 million, respectively.
Included in Level 3 fair value measurements as of December 28, 2014 is a $0.5 million contingent consideration liability related to potential earnout payments for the acquisition of OrthoHelix that was completed in October 2012, a $1.4 million contingent consideration liability related to earn-out payments for distributor acquisitions in the United States that occurred throughout 2013 and a $0.1 million contingent consideration liability related to potential earnout payments related to the acquisition of a distributor in Australia. Contingent consideration liabilities are carried at fair value and included in contingent consideration—current on the consolidated balance sheet. The contingent consideration liabilities were determined based on discounted cash flow analyses that included revenue estimates and a discount rate, which are considered significant unobservable inputs as of December 28, 2014. The revenue estimates were based on current management expectations for these businesses and the discount rate used was between 8-11% and was based on the Company’s estimated weighted average cost of capital for each transaction. To the extent that these assumptions were to change, the fair value of the contingent consideration liabilities could change significantly. Included in interest expense on the consolidated statements of operations for the twelve months ended December 28, 2014 and December 29, 2013 is $0.3 million and $1.1 million, respectively, related to the accretion of the contingent consideration. There were no transfers between levels during the year ended December 28, 2014.
Included in Level 3 fair value measurements as of December 29, 2013 is a $10.4 million contingent consideration liability related to potential earnout payments for the acquisition of OrthoHelix that was completed in October 2012, a $1.9 million contingent consideration liability related to earn-out payments for distributor acquisitions in the United States that occurred throughout 2013, a $0.5 million contingent consideration liability related to potential earnout payments for the acquisition of the Company’s exclusive distributor in Belgium and Luxembourg that was completed in May 2012 and a $0.2 million contingent consideration liability related to potential earnout payments related to the acquisition of a distributor in Australia. The contingent consideration liabilities were determined based on discounted cash flow analyses that included revenue estimates and a discount rate, which are considered significant unobservable inputs as of December 29, 2013. The revenue estimates were based on current management expectations for these businesses and the discount rate used was between 8-11% and was based on the Company’s estimated weighted average cost of capital for each transaction. There were no transfers between levels during the year ended December 29, 2013.
102
Table of Contents
A rollforward of the level 3 contingent liability for the year ended December 28, 2014 is as follows (in thousands):
| Contingent consideration liability at December 29, 2013 |
$ | 12,956 | ||
|
|
|
|||
| Additions |
1,670 | |||
| Fair value adjustments |
(5,978 | ) | ||
| Settlements |
(6,944 | ) | ||
| Interest accretion |
292 | |||
| Foreign currency translation |
(7 | ) | ||
|
|
|
|||
| Contingent consideration at December 28, 2014 |
$ | 1,989 | ||
|
|
|
The Company also has assets and liabilities that are measured at fair value on a non-recurring basis. The Company reviews the carrying amount of its long-lived assets other than goodwill for potential impairment whenever events or changes in circumstances indicate that their carrying values may not be recoverable. During the year ended December 30, 2012, the Company recognized an intangible impairment of $4.7 million. The impairment was determined using a discounted cash flow analysis. Key inputs into the analysis included estimated future revenues and expenses and a discount rate. The discount rate of 8% was based on the Company’s weighted average cost of capital. These inputs are considered to be significant unobservable inputs and are considered Level 3 fair value measurements. No intangible impairments were recorded for the years ended December 28, 2014 and December 29, 2013.
During the year ended December 30, 2012, the Company initiated and completed a facilities consolidation initiative that included the closure and consolidation of certain facilities in France, Ireland and the United States. The Company recorded lease termination costs related to the facilities consolidation initiative. The termination costs were determined using a discounted cash flow analysis that included a discount rate assumption, which is based on the credit adjusted risk free interest rate input, and an assumption related to the timing and amount of sublease income. The timing of the sublease income is a significant unobservable input and thus is considered a Level 3 fair value measurement. As of December 28, 2014 and December 29, 2013, the value of this liability was approximately $0.2 million and $0.4 million, respectively.
As of December 28, 2014 and December 29, 2013, the Company had short-term and long-term debt of $75.5 million and $69.1 million, respectively, the vast majority of which was variable rate debt. The fair value of the Company’s debt obligations approximates carrying value as a result of its variable rate term and would be considered a Level 2 measurement.
| 4. | Business Combinations |
On October 4, 2012, the Company completed the acquisition of 100% of the outstanding common stock of OrthoHelix Surgical Designs, Inc. (OrthoHelix) which further expanded the Company’s lower extremity joints and trauma product portfolio. Under the terms of the agreement, the Company acquired the assets and assumed certain liabilities of OrthoHelix for an aggregate purchase price of $152.6 million, including $100.4 million in cash, the equivalent of $38.0 million in Tornier ordinary shares based on the closing share price on the date of acquisition, and $14.2 million related to the fair value of additional contingent consideration of up to $20.0 million. The contingent consideration is payable in future periods based on growth of the lower extremity joints and trauma revenue category.
The OrthoHelix acquisition was accounted for as an acquisition of a business; and, accordingly, the financial results have been included in the Company’s consolidated results of operations from the date of acquisition. The allocation of the total purchase price to the net tangible and identifiable intangible assets was based on their estimated fair values as of the acquisition date. The excess of the purchase price over the identifiable intangible and net tangible assets in the amount of $105.9 million was allocated to goodwill, which is not deductible for tax
103
Table of Contents
purposes. Qualitatively, the three largest components of goodwill include: (1) expansion into international markets; (2) the relationships between the Company’s sales representatives and physicians; and (3) the development of new product lines and technology.
The following represents the allocation of the purchase price:
| Purchase Price Allocation (In Thousands) |
||||
| Goodwill |
$ | 105,904 | ||
| Other intangible assets |
40,600 | |||
| Tangible assets acquired and liabilities assumed: |
||||
| Accounts receivable |
4,330 | |||
| Inventory |
12,033 | |||
| Other assets |
776 | |||
| Instruments, net |
4,475 | |||
| Accounts payable and accrued liabilities |
(3,606 | ) | ||
| Deferred income taxes |
(11,900 | ) | ||
| Other long-term debt |
(16 | ) | ||
|
|
|
|||
| Total purchase price |
$ | 152,596 | ||
|
|
|
|||
Acquired identifiable intangible assets are amortized on a straight-line basis over their estimated useful lives. The following table represents components of these identifiable intangible assets and their estimated useful lives at the acquisition date:
| Fair Value (In Thousands) |
Estimated Useful Life (In Years) |
|||||||
| Developed technology |
$ | 35,500 | 10 | |||||
| In-process research and development |
3,500 | N/A | ||||||
| Trademarks and trade names |
1,500 | 3 | ||||||
| Non-compete agreements |
100 | 3 | ||||||
|
|
|
|||||||
| Total identifiable intangible assets |
$ | 40,600 | ||||||
|
|
|
|||||||
Of the $3.5 million in in-process research and development, all four projects have been completed and are included in developed technology as of December 28, 2014.
The estimated fair value of the intangible assets acquired was determined by the Company with the assistance of a third-party valuation expert. The Company used an income approach to measure the fair value of the developed technology and in-process research and development based on the multi-period excess earnings method, whereby the fair value is estimated based upon the present value of cash flows that the applicable asset is expected to generate. The Company used an income approach to measure the fair value of the trademarks based upon the relief from royalty method, whereby the fair value is estimated based upon discounting the royalty savings as well as any tax benefits related to ownership to a present value. The Company used an income approach to measure the fair value of non-compete agreements, based on the incremental income method, whereby value is estimated by discounting the cash flow differential as well as any tax benefits related to ownership to a present value. These fair value measurements were based on significant inputs not observable in the market and thus represent Level 3 measurements under the fair value hierarchy. The significant unobservable inputs include the discount rate of 8% which was based on the Company’s estimate of its weighted cost of capital.
104
Table of Contents
Pro forma results of operations (unaudited and in thousands except per share data) of the Company for the year ended December 30, 2012, as if the acquisition had occurred on January 2, 2012, are as follows:
| Year Ended December 30, 2012 |
||||
| Revenue |
$ | 298,051 | ||
| Net loss |
(31,390 | ) | ||
| Basic and diluted net loss per share |
$ | (0.75 | ) | |
The pro forma results of operations are not necessarily indicative of future operating results. Included in the consolidated statement of operations for the year ended December 30, 2012 are approximately $8.0 million of revenue and $1.8 million of net loss related to the operations of OrthoHelix subsequent to the transaction closing.
| 5. | Property, Plant and Equipment |
Property, plant and equipment balances are as follows (in thousands):
| December 28, 2014 |
December 29, 2013 |
|||||||
| Land |
$ | 1,481 | $ | 1,886 | ||||
| Building and improvements |
12,828 | 14,255 | ||||||
| Machinery and equipment |
30,892 | 31,192 | ||||||
| Furniture, fixtures and office equipment |
27,649 | 29,371 | ||||||
| Software |
4,672 | 5,511 | ||||||
| Construction in progress |
10,663 | 5,628 | ||||||
|
|
|
|
|
|||||
| 88,185 | 87,843 | |||||||
| Accumulated depreciation |
(43,523 | ) | (44,349 | ) | ||||
|
|
|
|
|
|||||
| Property, plant and equipment, net |
$ | 44,662 | $ | 43,494 | ||||
|
|
|
|
|
|||||
Depreciation expense recorded on property, plant and equipment was $6.9 million $6.8 million and $6.1 million during the years ended December 28, 2014, December 29, 2013 and December 30, 2012, respectively.
The Company did not record fixed asset impairments for the year ended December 28, 2014. For the year ended December 29, 2013, the Company recognized $0.1 million of fixed asset impairments related to the OrthoHelix integration. As a result of the facilities consolidation initiative in 2012, the Company recorded several fixed asset impairments during 2012 related to the Company’s facilities in St. Ismier, France, Dunmanway, Ireland, and Stafford, Texas in the aggregate amount of $0.9 million for year ended December 30, 2012. These impairments were recorded in special charges, a component of operating expenses, in the consolidated statements of operations. See Note 17 for further description of the facilities consolidation initiative.
Included in construction in progress for the years ended December 28, 2014 and December 29, 2013 is $10.7 million and $5.6 million, respectively, of software development costs, primarily related to the Company’s development of an enterprise resource planning system.
105
Table of Contents
| 6. | Goodwill and Other Intangible Assets |
The following table summarizes the changes in the carrying amount of goodwill for the years ended December 28, 2014 and December 29, 2013 (in thousands):
| Balance at December 30, 2012 |
$ | 239,804 | ||
|
|
|
|||
| Goodwill acquired in acquisitions |
8,239 | |||
| Foreign currency translation |
3,497 | |||
|
|
|
|||
| Balance at December 29, 2013 |
$ | 251,540 | ||
| Goodwill acquired in acquisitions |
2,467 | |||
| Foreign currency translation |
(9,225 | ) | ||
|
|
|
|||
| Balance at December 28, 2014 |
$ | 244,782 | ||
|
|
|
The goodwill balance at December 28, 2014 contains $16.7 million of goodwill that qualifies for future tax deductions.
The components of identifiable intangible assets are as follows (in thousands):
| Gross Value | Accumulated Amortization |
Net Value | ||||||||||
| Balances at December 28, 2014 |
||||||||||||
| Intangible assets subject to amortization: |
||||||||||||
| Developed technology |
$ | 108,868 | $ | (51,107 | ) | $ | 57,761 | |||||
| Customer relationships |
56,008 | (31,656 | ) | 24,352 | ||||||||
| Licenses |
6,827 | (5,145 | ) | 1,682 | ||||||||
| Other |
6,958 | (4,410 | ) | 2,548 | ||||||||
| Intangible assets not subject to amortization: |
||||||||||||
| Tradename |
8,777 | — | 8,777 | |||||||||
|
|
|
|
|
|
|
|||||||
| Total |
$ | 187,438 | $ | (92,318 | ) | $ | 95,120 | |||||
|
|
|
|
|
|
|
|||||||
| Gross Value | Accumulated Amortization |
Net Value | ||||||||||
| Balances at December 29, 2013 |
||||||||||||
| Intangible assets subject to amortization: |
||||||||||||
| Developed technology |
$ | 112,782 | $ | (44,161 | ) | $ | 68,621 | |||||
| Customer relationships |
61,783 | (30,155 | ) | 31,628 | ||||||||
| Licenses |
6,810 | (4,004 | ) | 2,806 | ||||||||
| In-process research and development |
400 | — | 400 | |||||||||
| Other |
6,624 | (2,431 | ) | 4,193 | ||||||||
| Intangible assets not subject to amortization: |
||||||||||||
| Tradename |
9,960 | — | 9,960 | |||||||||
|
|
|
|
|
|
|
|||||||
| Total |
$ | 198,359 | $ | (80,751 | ) | $ | 117,608 | |||||
|
|
|
|
|
|
|
|||||||
During the year ended December 28, 2014, the Company acquired intangible assets in the form of non-compete agreements and goodwill in the amounts of $0.2 million and $2.5 million, respectively, related to the acquisition of certain U.S. distributors and independent sales agencies.
During the year ended December 29, 2013, the Company acquired certain assets of its distributor in Canada for $3.3 million, which included $0.5 million in potential earn-out payments, which were subsequently paid. The purchase accounting for this transaction resulted in an increase in intangible assets of $0.5 million, in the form of
106
Table of Contents
customer relationships and non-compete agreements, and an increase in goodwill of $0.3 million. Additionally, during the year ended December 29, 2013, the Company acquired certain assets of a distributor in the United Kingdom for $1.0 million, which included $0.1 million in potential earn-out payments, which were subsequently paid. The purchase accounting for this transaction resulted in an increase in intangible assets of $0.1 million in the form of customer relationships. In addition, during the year ended December 29, 2013, the Company acquired certain assets of a distributor in Australia for $2.6 million, which included $0.2 million in potential earn-out payments. The purchase accounting for this transaction resulted in an increase in intangible assets of $0.1 million in the form of non-compete agreements and an increase in goodwill of $1.4 million. Also during the year ended December 29, 2013, the Company acquired certain U.S. distributors and independent sales agencies. The purchase accounting for these U.S. distributor transactions resulted in $2.2 million of intangible assets, primarily non-compete agreements and an increase in goodwill of $6.7 million.
No impairment charges were recognized for the year ended December 28, 2014. For the year ended December 29, 2013, the Company recognized an impairment charge of $0.1 million related to license intangibles that are no longer being used. For the year ended December 30, 2012, the Company recognized an impairment charge of $4.7 million related to intangibles where the carrying value was greater than the fair value of the intangibles due to a reduction in forecasted revenue from the products that related to the intangible as a result of acquiring similar products as part of the OrthoHelix acquisition.
All finite-lived intangible assets have been assigned an estimated useful life and are amortized on a straight-line basis over the number of years that approximates the assets’ respective useful lives (ranging from one to twenty years). Included in other intangibles are non-compete agreements and patents. The weighted-average amortization periods, by major intangible asset class, are as follows:
| Weighted-Average Amortization Period (In Years) |
||||
| Developed technology |
12 | |||
| Customer relationships |
13 | |||
| Licenses |
5 | |||
| Other |
3 | |||
|
|
|
|||
| Total |
12 | |||
Total amortization expense for finite-lived intangible assets was $17.1 million, $15.9 million and $11.6 million during the years ended December 28, 2014, December 29, 2013 and December 30, 2012, respectively. Amortization expense is recorded as amortization of intangible assets in the consolidated statements of operations. Estimated annual amortization expense for fiscal years ending 2015 through 2019 is as follows (in thousands):
| Amortization Expense | ||||
| 2015 |
$ | 16,631 | ||
| 2016 |
14,301 | |||
| 2017 |
13,304 | |||
| 2018 |
12,480 | |||
| 2019 |
11,149 | |||
107
Table of Contents
| 7. | Accrued Liabilities |
Accrued liabilities consist of the following (in thousands):
| December 28, 2014 | December 29, 2013 | |||||||
| Accrued payroll and related expenses |
$ | 25,330 | $ | 21,499 | ||||
| Accrued royalties |
9,292 | 9,169 | ||||||
| Accrued sales and use tax |
7,323 | 4,727 | ||||||
| Accrued agent commissions |
4,219 | 4,554 | ||||||
| Other accrued liabilities |
12,945 | 10,765 | ||||||
|
|
|
|
|
|||||
| $ | 59,109 | $ | 50,714 | |||||
|
|
|
|
|
|||||
| 8. | Long-Term Debt |
A summary of long-term debt is as follows (in thousands):
| December 28, 2014 |
December 29, 2013 |
|||||||
| Lines of credit and overdraft arrangements |
$ | 6,000 | $ | — | ||||
| Mortgages |
3,553 | 4,993 | ||||||
| Bank term debt |
63,743 | 61,769 | ||||||
| Shareholder debt |
2,203 | 2,319 | ||||||
|
|
|
|
|
|||||
| Total debt |
75,499 | 69,081 | ||||||
| Less current portion |
(7,394 | ) | (1,438 | ) | ||||
|
|
|
|
|
|||||
| Long-term debt |
$ | 68,105 | $ | 67,643 | ||||
|
|
|
|
|
|||||
Aggregate maturities of debt for the next five years are as follows (in thousands):
| 2015 |
$ | 7,394 | ||
| 2016 |
1,575 | |||
| 2017 |
62,424 | |||
| 2018 |
850 | |||
| 2019 |
382 | |||
| Thereafter |
2,874 |
Lines of Credit
On October 4, 2012, the Company, and one of its U.S. operating subsidiaries, Tornier, Inc. (Tornier USA), entered into a credit agreement with Bank of America, N.A., as Administrative Agent, SG Americas Securities, LLC, as Syndication Agent, BMO Capital Markets and JPMorgan Chase Bank, N.A., as Co-Documentation Agents, Merrill Lynch, Pierce, Fenner & Smith Incorporated and SG Americas Securities, LLC, as Joint Lead Arrangers and Joint Bookrunners, and the other lenders party thereto. The credit facility included a senior secured revolving credit facility to Tornier USA denominated at the election of Tornier USA, in U.S. dollars, Euros, pounds, sterling and yen in an aggregate principal amount of up to the U.S. dollar equivalent of $30.0 million. Funds available under the revolving credit facility may be used for general corporate purposes. Loans under the revolving credit facility bear interest at (a) the alternate base rate (if denominated in U.S. dollars), equal to the greatest of (i) the prime rate in effect on such day, (ii) the federal funds rate in effect on such day plus 1/2 of 1%, and (iii) the adjusted LIBO rate plus 1%, plus in the case of each of (i)-(iii) above, an applicable rate of 2.00% or 2.25% (depending on the Company’s total net leverage ratio as defined in its credit agreement), or (b) in the case of a eurocurrency loan (as defined in the credit agreement), at the applicable adjusted LIBO rate for the relevant interest period plus an applicable rate of 3.00% or 3.25% (depending on the Company’s total net
108
Table of Contents
leverage ratio), plus the mandatory cost (as defined in the credit agreement) if such loan is made in a currency other than U.S. dollars or from a lending office in the United Kingdom or a participating member state (as defined in the credit agreement). Additionally, the Company is subject to a 0.5% interest rate related to the unfunded balance on the line of credit. As of December 28, 2014, the outstanding balance related to this line of credit was $6.0 million. There was no outstanding balance as of December 29, 2013. The term of the line of credit ends in October 2017.
The Company’s European subsidiaries had established unsecured bank overdraft arrangements prior to 2012. This debt was paid off in 2012 and the Company recorded a loss on extinguishment of debt of $0.6 million related to prepayment fees and penalties.
Mortgages
The Company has mortgages secured by an office building in Montbonnot, France. These mortgages had an outstanding balance of $3.6 million and $5.0 million at December 28, 2014 and December 29, 2013, respectively, and bear fixed annual interest rates of 2.55%-4.9%.
Bank Term Debt
In addition to the senior secured revolving credit facility discussed above, the credit agreement entered into on October 4, 2012 also provided for an aggregate credit commitment to Tornier USA of $115.0 million, consisting of: (1) a senior secured term loan facility to Tornier USA denominated in dollars in an aggregate principal amount of up to $75.0 million; and (2) a senior secured term loan facility to Tornier USA denominated in Euros in an aggregate principal amount of up to the U.S. dollar equivalent of $40.0 million. The borrowings under the term loan facilities were used to pay the cash consideration for the OrthoHelix acquisition, and fees, costs and expenses incurred in connection with the acquisition and the credit agreement and to repay prior existing indebtedness of the Company and its subsidiaries. The term loans mature in October 2017. In the second quarter of 2013, the $40.0 million senior secured term loan facility denominated in Euros was repaid in full. As part of the repayment, the Company recorded a $1.1 million loss on extinguishment of debt related to the write-off of the corresponding deferred financing costs. Additionally, in June 2013, the Company repaid $10.5 million of the senior secured U.S. dollar denominated loan. Amounts recorded in interest expense related to the amortization of the debt discount were approximately $0.8 million for the year ended December 28, 2014.
Borrowings under these facilities within the credit agreement as of December 28, 2014 and December 29, 2013 were as follows:
| December 28, 2014 |
December 29, 2013 |
|||||||
| Senior secured U.S. dollar term loan |
$ | 64,031 | $ | 64,031 | ||||
| Senior secured Euro term loan |
— | — | ||||||
| Debt discount |
(2,315 | ) | (3,157 | ) | ||||
|
|
|
|
|
|||||
| Total |
$ | 61,716 | $ | 60,874 | ||||
|
|
|
|
|
|||||
The USD term facility bears interest at (a) the alternate base rate (if denominated in U.S. dollars), equal to the greatest of (i) the prime rate in effect on such day, (ii) the federal funds rate in effect on such day plus 1/2 of 1%, and (iii) the adjusted LIBO rate, with a floor of 1% (as defined in the new credit agreement) plus 1%, plus in the case of each of (i)-(iii) above, an applicable rate of 2.00% or 2.25% (depending on the Company’s total net leverage ratio as defined in the Company’s credit agreement), or (b) in the case of a eurocurrency loan (as defined in the Company’s credit agreement), at the applicable adjusted LIBO rate for the relevant interest period plus an applicable rate of 3.00% or 3.25% (depending on the Company’s total net leverage ratio), plus the mandatory cost (as defined in the credit agreement) if such loan is made in a currency other than U.S. dollars or from a lending office in the United Kingdom or a participating member state (as defined in the credit agreement).
109
Table of Contents
The credit agreement, including the term loan and the revolving line of credit, contains covenants, including financial covenants which require the Company to maintain minimum interest coverage, annual capital expenditure limits and maximum total net leverage ratios, and customary events of default. The obligations under the credit agreement are guaranteed by the Company, Tornier USA and certain other specified subsidiaries of the Company, and subject to certain exceptions, are secured by a first priority security interest in substantially all of the assets of the Company and certain specified existing and future subsidiaries of the Company. Additionally, the credit agreement includes a restriction on the Company’s ability to pay dividends. The Company was in compliance with all covenants as of December 28, 2014.
Also included in bank term debt is $0.4 million in a Euro loan and $1.6 million and $0.9 million related to capital leases at December 28, 2014 and December 29, 2013, respectively. See Note 14 for further details.
Shareholder Debt
In 2008, one of the Company’s 51%-owned and consolidated subsidiaries borrowed $2.2 million from a member of the Company’s board of directors who is also a 49% owner of the consolidated subsidiary. This loan was used to partially fund the purchase of real estate in Grenoble, France, to be used as a manufacturing facility. Interest on the debt is variable based on three-month Euro Libor rate plus 0.5% and has no stated term. The outstanding balance on this debt was $2.2 million and $2.3 million as of December 28, 2014 and December 29, 2013, respectively. The non-controlling interest in this subsidiary is deemed immaterial to the consolidated financial statements.
| 9. | Retirement and Postretirement Benefit Plans |
The Company’s French subsidiary is required by French government regulations to offer a plan to its employees that provides certain lump-sum retirement benefits. This plan qualifies as a defined benefit retirement plan. The French regulations do not require funding of this liability in advance and as a result there are no plan assets associated with this defined benefit plan. The Company has an unfunded liability of $4.0 million and $2.8 million recorded at December 28, 2014 and December 29, 2013, respectively, for future obligations under the plan that is included in other noncurrent liabilities on the consolidated balance sheet. The government mandated discount rate decreased from 3.0% as of December 29, 2013 to 1.7% at December 28, 2014, which resulted in a $1.4 million unrealized loss recorded as a component of other comprehensive loss for the year ended December 28, 2014. For the year ended December 29, 2013, the discount rate increased from 2.8% to 3.0%, which resulted in a $0.1 million unrealized gain which was recorded as a component of other comprehensive loss. The related periodic benefit expense was immaterial in all periods presented.
| 10. | Derivative Instruments |
The Company’s operations outside the United States are significant. As a result, the Company has foreign exchange exposure on transactions denominated in currencies that are different than the functional currency in certain legal entities. Starting in 2012, the Company began entering into forward contracts to manage its exposure to foreign currency transaction gains (losses). As it relates to one of the Company’s U.S. operating entities, Tornier Inc., the Company has entered into forward contracts to manage the foreign currency exposures to the Euro. As it relates to the Company’s French operating entity, Tornier SAS, the Company has entered into forward contracts to manage the foreign currency exposure to the Australian Dollar, British Pound, Canadian Dollar, Japanese Yen, and Swiss Franc. Forward contracts are recorded on the consolidated balance sheet at fair value. At December 28, 2014, the Company had foreign currency forward contracts outstanding with a fair value of $(0.5) million recorded within accrued liabilities on the consolidated balance sheet. These contracts are accounted for as economic hedges and accordingly, changes in fair value are recognized in foreign currency transaction gain (loss). The net gain (loss) on foreign exchange forward contracts is recognized in foreign currency transaction gain (loss). For the years ended December 28, 2014 and December 29, 2013, the Company recognized losses of $2.7 million and gains of $0.4 million, respectively related to these forward currency contracts.
110
Table of Contents
| 11. | Income Taxes |
The components of earnings (loss) before taxes for the years ended December 28, 2014, December 29, 2013 and December 30, 2012, consist of the following (in thousands):
| December 28, 2014 |
December 29, 2013 |
January 1, 2012 |
||||||||||
| United States loss |
$ | (32,694 | ) | $ | (33,204 | ) | $ | (19,858 | ) | |||
| Rest of the world earnings |
4,813 | (873 | ) | (12,821 | ) | |||||||
|
|
|
|
|
|
|
|||||||
| Loss before taxes |
$ | (27,881 | ) | $ | (34,077 | ) | $ | (32,679 | ) | |||
|
|
|
|
|
|
|
|||||||
The income tax benefit (provision) for the years ended December 28, 2014, December 29, 2013 and December 30, 2012, consists of the following (in thousands):
| December 28, 2014 |
December 29, 2013 |
December 30, 2012 |
||||||||||
| Current (provision) benefit: |
||||||||||||
| United States |
$ | 550 | $ | (94 | ) | $ | (150 | ) | ||||
| Rest of the world |
(4,604 | ) | (3,513 | ) | (2,523 | ) | ||||||
| Deferred (provision) benefit |
2,464 | 1,258 | 13,608 | |||||||||
|
|
|
|
|
|
|
|||||||
| Total income tax (provision) benefit |
$ | (1,590 | ) | $ | (2,349 | ) | $ | 10,935 | ||||
|
|
|
|
|
|
|
|||||||
A reconciliation of the U.S. statutory income tax rate to the Company’s effective tax rate for the years ended December 28, 2014, December 29, 2013 and December 30, 2012, is as follows:
| December 28, 2014 |
December 29, 2013 |
December 30, 2012 |
||||||||||
| Income tax provision at U.S. statutory rate |
34.0 | % | 34.0 | % | 34.0 | % | ||||||
| Release of valuation allowance |
0.5 | 3.3 | 32.8 | |||||||||
| Change in valuation allowance |
(57.2 | ) | (38.6 | ) | (33.4 | ) | ||||||
| Tax benefit from disregarded entity |
— | 1.8 | 1.7 | |||||||||
| State and local taxes |
3.4 | (4.7 | ) | 2.6 | ||||||||
| Tax deductible IPO costs |
2.7 | 2.0 | 1.7 | |||||||||
| Other foreign taxes |
(4.1 | ) | (3.5 | ) | (3.5 | ) | ||||||
| Contingent consideration adjustment to market value |
6.5 | 4.1 | — | |||||||||
| Deferred Balance Adjustments |
1.2 | — | — | |||||||||
| Stock option cancellation |
— | (8.1 | ) | — | ||||||||
| Impact of foreign income tax rates |
4.6 | 2.1 | (2.5 | ) | ||||||||
| Non-deductible expenses |
(0.9 | ) | (1.1 | ) | (1.8 | ) | ||||||
| Other |
3.6 | 1.8 | 1.9 | |||||||||
|
|
|
|
|
|
|
|||||||
| Total |
(5.7 | )% | (6.9 | )% | 33.5 | % | ||||||
|
|
|
|
|
|
|
|||||||
Deferred income taxes reflect the net tax effects of temporary differences between the carrying amounts of assets and liabilities for financial reporting purposes and the amounts used for income tax purposes. The Company has established valuation allowances for deferred tax assets when the amount of expected future taxable income is not likely to support the use of the deduction or credit.
111
Table of Contents
The components of deferred taxes for the years ended December 28, 2014 and December 29, 2013, consist of the following (in thousands):
| December 28, 2014 |
December 29, 2013 |
|||||||
| Deferred tax assets: |
||||||||
| Net operating loss and tax credit carryforwards |
$ | 48,429 | $ | 41,456 | ||||
| Inventory |
9,732 | 7,294 | ||||||
| Exchange rate changes |
(162 | ) | 102 | |||||
| Stock options |
8,238 | 7,082 | ||||||
| Accruals and other provisions |
7,632 | 6,161 | ||||||
|
|
|
|
|
|||||
| Total deferred tax assets |
73,869 | 62,095 | ||||||
| Less: valuation allowance |
(54,729 | ) | (40,441 | ) | ||||
|
|
|
|
|
|||||
| Total deferred tax assets after valuation allowance |
19,140 | 21,654 | ||||||
| Deferred tax liabilities: |
||||||||
| Intangible assets |
(28,029 | ) | (33,553 | ) | ||||
| Depreciation |
(2,673 | ) | (3,342 | ) | ||||
|
|
|
|
|
|||||
| Total deferred tax liabilities |
(30,702 | ) | (36,895 | ) | ||||
|
|
|
|
|
|||||
| Total net deferred tax liabilities |
$ | (11,562 | ) | $ | (15,241 | ) | ||
|
|
|
|
|
|||||
The Company had $54.7 million, $40.4 million and $30.0 million of valuation allowance recorded at December 28, 2014, December 29, 2013 and December 30, 2012, respectively. If any amounts of valuation allowance reverse, the reversals would be recognized in the income tax provision in the period of reversal. The Company recognized income tax expense from valuation allowance increases of $14.3 million (an increase in the valuation allowance of $14.4 million netted against a $0.1 million reversal of valuation allowance from the OrthoHelix acquisition), $10.4 million (an increase in the valuation allowance of $11.5 million netted against a $1.1 million reversal of valuation allowance from the OrthoHelix acquisition) and $0.2 million (an increase in the valuation allowance of $10.9 million netted against a $10.7 million reversal of valuation allowance from the OrthoHelix acquisition) during the years ended December 28, 2014, December 29, 2013 and December 30, 2012, respectively.
Net operating loss carryforwards totaling approximately $141.0 million at December 28, 2014, of which $93.8 million relates to the United States and $47.2 million relates to jurisdictions outside the United States, are available to reduce future taxable earnings of the Company’s consolidated U.S. subsidiaries and certain European subsidiaries, respectively. These net operating loss carryforwards include $4.1 million with no expiration date; the remaining carryforwards have expiration dates between 2015 and 2034.
The Company has recorded a long-term income tax liability of approximately $2.3 million and $3.1 million at December 28, 2014 and December 29, 2013, respectively, related to uncertain tax positions from unclosed tax years in certain of its subsidiaries. These amounts represent the Company’s best estimate of the potential additional tax liability related to these uncertain positions. To the extent that the results of any future tax audits differ from the Company’s estimate, the impact of these differences will be reported as adjustments to income tax expense.
The total amount of net unrecognized tax benefits that, if recognized, would affect the tax rate was $5.3 million at December 28, 2014. The Company files income tax returns in the U.S. federal jurisdiction and in various U.S. state and foreign jurisdictions. The Company is currently under examination by Ireland tax authorities. If any examinations were finalized the Company would not expect the results of these examinations to have a material impact on its consolidated financial statements in future years.
112
Table of Contents
A reconciliation of the beginning and ending balances of the total amounts of unrecognized tax benefits is as follows (in thousands):
| Gross unrecognized tax benefits at December 30, 2012 |
$ | 7,909 | ||
|
|
|
|||
| Increase for tax positions in prior years |
58 | |||
| Decrease for tax positions in prior years |
— | |||
| Lapse of statute of limitations |
(2,094 | ) | ||
| Increase for tax positions in current year |
307 | |||
| Foreign currency translation |
236 | |||
|
|
|
|||
| Gross unrecognized tax benefits at December 29, 2013 |
$ | 6,416 | ||
|
|
|
|||
| Increase for tax positions in prior years |
33 | |||
| Decrease for tax positions in prior years |
— | |||
| Lapse of statute of limitations |
(977 | ) | ||
| Increase for tax positions in current year |
492 | |||
| Foreign currency translation |
(625 | ) | ||
|
|
|
|||
| Gross unrecognized tax benefits at December 28, 2014 |
$ | 5,339 | ||
|
|
|
| 12. | Capital Stock and Earnings Per Share |
The Company had 49.0 million and 48.5 million ordinary shares issued and outstanding as of December 28, 2014 and December 29, 2013, respectively.
The Company had outstanding options to purchase 2.6 million, 2.6 million and 3.8 million ordinary shares at December 28, 2014, December 29, 2013 and December 30, 2012, respectively. The Company also had 0.6 million, 0.6 million and 0.4 million restricted stock units outstanding at December 28, 2014, December 29, 2013 and December 30, 2012, respectively. Outstanding options to purchase ordinary shares and restricted stock units representing an aggregate of 3.1 million, 3.2 million and 4.2 million shares are not included in diluted earnings per share for the years ended December 28, 2014, December 29, 2013 and December 30, 2012, respectively, because the Company recorded a net loss in all periods and, therefore, including these instruments would be anti-dilutive.
In 2013, the Company completed an underwritten public offering for the issuance of 5,175,000 ordinary shares that resulted in net proceeds to the Company of $78.7 million.
| 13. | Segment and Geographic Data |
The Company manages its business in one reportable segment, orthopaedic products, which includes the design, manufacture, marketing and sales of joint replacement products and other related products. The Company’s geographic regions consist of the United States, France and other international areas. Long-lived assets are those assets located in each region. Revenues attributed to each region are based on the location in which the products were sold.
Revenue by geographic region is as follows (in thousands):
| Year Ended | ||||||||||||
| December 28, 2014 |
December 29, 2013 |
December 30, 2012 |
||||||||||
| Revenue by geographic region: |
||||||||||||
| United States |
$ | 199,286 | $ | 182,104 | $ | 156,750 | ||||||
| France |
64,082 | 58,173 | 52,737 | |||||||||
| Other international |
81,585 | 70,682 | 68,033 | |||||||||
|
|
|
|
|
|
|
|||||||
| Total |
$ | 344,953 | $ | 310,959 | $ | 277,520 | ||||||
|
|
|
|
|
|
|
|||||||
113
Table of Contents
Revenue by product category is as follows (in thousands):
| Year Ended | ||||||||||||
| December 28, 2014 |
December 29, 2013 |
December 30, 2012 |
||||||||||
| Revenue by product type: |
||||||||||||
| Upper extremity joints and trauma |
$ | 213,320 | $ | 184,457 | $ | 175,242 | ||||||
| Lower extremity joints and trauma |
59,249 | 58,747 | 34,109 | |||||||||
| Sports medicine and biologics |
14,174 | 14,752 | 15,526 | |||||||||
|
|
|
|
|
|
|
|||||||
| Total extremities |
286,743 | 257,956 | 224,877 | |||||||||
| Large joints and other |
58,210 | 53,003 | 52,643 | |||||||||
|
|
|
|
|
|
|
|||||||
| Total |
$ | 344,953 | $ | 310,959 | $ | 277,520 | ||||||
|
|
|
|
|
|
|
|||||||
Long-lived tangible assets, including instruments and property, plant and equipment are as follows (in thousands):
| December 28, 2014 |
December 29, 2013 |
December 30, 2012 |
||||||||||
| Long-lived tangible assets: |
||||||||||||
| United States |
$ | 42,312 | $ | 40,032 | $ | 31,342 | ||||||
| France |
44,503 | 45,909 | 39,764 | |||||||||
| Other international |
20,735 | 20,608 | 17,439 | |||||||||
|
|
|
|
|
|
|
|||||||
| Total |
$ | 107,550 | $ | 106,549 | $ | 88,545 | ||||||
|
|
|
|
|
|
|
|||||||
| 14. | Leases |
Future minimum rental commitments under non-cancelable operating leases in effect as of December 28, 2014 are as follows (in thousands):
| 2015 |
$ | 5,761 | ||
| 2016 |
4,662 | |||
| 2017 |
4,109 | |||
| 2018 |
3,531 | |||
| 2019 |
2,246 | |||
| Thereafter |
5,824 | |||
|
|
|
|||
| Total |
$ | 26,133 | ||
|
|
|
The Company’s operating leases have maturity dates between 2015 and 2024 and relate to assets such as property, automobiles and office equipment. Total rent expense for the years ended December 28, 2014, December 29, 2013 and December 30, 2012 was $6.1 million, $5.8 million and $4.8 million, respectively.
114
Table of Contents
Future lease payments under capital leases are as follows (in thousands):
| 2015 |
$ | 491 | ||
| 2016 |
367 | |||
| 2017 |
331 | |||
| 2018 |
277 | |||
| 2019 |
144 | |||
|
|
|
|||
| Total minimum lease payments |
1,610 | |||
| Less amount representing interest |
(13 | ) | ||
|
|
|
|||
| Present value of minimum lease payments |
1,597 | |||
| Current portion |
(428 | ) | ||
|
|
|
|||
| Long-term portion |
$ | 1,169 | ||
|
|
|
Fixed assets that are recorded as capital lease assets primarily consist of machinery and equipment, and had a carrying value of $1.9 million ($2.4 million gross value, less $0.5 million accumulated depreciation), $1.7 million ($2.5 million gross value, less $0.8 million accumulated depreciation) at December 28, 2014 and December 29, 2013, respectively. Amortization of capital lease assets is included in depreciation expense in the consolidated financial statements.
| 15. | Certain Relationships and Related-Party Transactions |
The Company leases all of its approximately 55,000 square feet of manufacturing facilities and approximately 52,000 square feet of office space located in Montbonnot, France, from Alain Tornier (Mr. Tornier), who is a current shareholder and member of the Company’s board of directors. Annual lease payments to Mr. Tornier amounted to $1.2 million, $1.1 million and $1.6 million during the years ended December 28, 2014, December 29, 2013 and December 30, 2012, respectively.
On July 29, 2008, the Company formed a real estate holding company (SCI Calyx) together with Mr. Tornier. SCI Calyx is owned 51% by the Company and 49% by Mr. Tornier. SCI Calyx was initially capitalized by a contribution of capital of €10,000 funded 51% by the Company and 49% by Mr. Tornier. SCI Calyx then acquired a combined manufacturing and office facility in Montbonnot, France, for approximately $6.1 million. The manufacturing and office facility acquired was to be used to support the manufacture of certain of the Company’s current products and house certain operations already located in Montbonnot, France. This real estate purchase was funded through mortgage borrowings of $4.1 million and $2.0 million cash borrowed from the two current shareholders of SCI Calyx. The $2.0 million cash borrowed from the SCI Calyx shareholders originally consisted of a $1.0 million note due to Mr. Tornier and a $1.0 million note due to Tornier SAS, which is the Company’s wholly owned French operating subsidiary. Both of the notes issued by SCI Calyx bear annual interest at the three-month Euro Libor rate plus 0.5% and have no stated term. During 2010, SCI Calyx borrowed approximately $1.4 million from Mr. Tornier in order to fund on-going leasehold improvements necessary to prepare the Montbonnot facility for its intended use. This cash was borrowed under the same terms as the original notes. On September 3, 2008, Tornier SAS, the Company’s French operating subsidiary, entered into a lease agreement with SCI Calyx relating to these facilities. The agreement, which terminates in 2018, provides for an annual rent payment of €440,000, which has subsequently been increased and is currently €959,712 annually. As of December 28, 2014, future minimum payments under this lease were €4.6 million in the aggregate. As of December 28, 2014, SCI Calyx had related-party debt outstanding to Mr. Tornier of $2.2 million. The SCI Calyx entity is consolidated by the Company, and the related real estate and liabilities are included in the consolidated balance sheets.
Since 2006, Tornier SAS has entered into various lease agreements with entities affiliated with Mr. Tornier or members of his family. On December 29, 2007, Tornier SAS entered into a lease agreement with Mr. Tornier and his spouse, relating to the Company’s museum in Saint Villa, France. The agreement provides for a term
115
Table of Contents
through May 30, 2015 and an initial annual rent payment of €28,500, which was subsequently decreased to €14,602. On December 29, 2007, Tornier SAS entered into a lease agreement with Animus SCI, relating to the Company’s facilities in Montbonnot Saint Martin, France. On August 18, 2012, the parties amended the lease agreement to extend the term until May 31, 2022 and reduce the annual rent. The amended agreement provides for an initial annual rent payment of €279,506, which was subsequently increased to €293,034. Animus SCI is wholly owned by Mr. Tornier. On February 6, 2008, Tornier SAS entered into a lease agreement with Balux SCI, effective as of May 22, 2006, relating to the Company’s facilities in Montbonnot Saint Martin, France. On August 18, 2012, the parties amended the lease agreement to extend the term until May 31, 2022 and reduce the annual rent. The amended agreement provides for an initial annual rent payment of €252,254, which was subsequently increased to €560,756. Balux SCI is wholly owned by Mr. Tornier and his sister, Colette Tornier. As of December 28, 2014, future minimum payments under all of these agreements were €8.1 million in the aggregate.
| 16. | Share-Based Compensation |
Share-based awards are granted under the Tornier N.V. 2010 Incentive Plan, as amended and restated (2010 Plan). This plan allows for the issuance of up to 7.7 million new ordinary shares in connection with the grant of a combination of potential share-based awards, including stock options, restricted stock units, stock appreciation rights and other types of awards as deemed appropriate. To date, only options to purchase ordinary shares (options) and restricted stock units (RSUs) have been awarded. Both types of awards generally have graded vesting periods of four years and the options expire ten years after the grant date. Options are granted with exercise prices equal to the fair value of the Company’s ordinary shares on the date of grant.
The Company recognizes share-based compensation expense for these awards on a straight-line basis over the vesting period. Share-based compensation expense is included in cost of goods sold, selling, general and administrative, and research and development expenses on the consolidated statements of operations.
Below is a summary of the allocation of share-based compensation (in thousands):
| Year ended | ||||||||||||
| December 28, 2014 |
December 29, 2013 |
December 30, 2012 |
||||||||||
| Cost of goods sold |
$ | 691 | $ | 658 | $ | 864 | ||||||
| Selling, general and administrative |
8,231 | 6,955 | 5,477 | |||||||||
| Research and development |
779 | 687 | 489 | |||||||||
|
|
|
|
|
|
|
|||||||
| Total |
$ | 9,701 | $ | 8,300 | $ | 6,830 | ||||||
|
|
|
|
|
|
|
|||||||
The Company recognizes the fair value of share-based awards granted in exchange for employee services as a cost of those services. Total compensation cost included in the consolidated statements of operations for employee share-based payment arrangements was $9.4 million, $8.0 million and $6.5 million during the years ended December 28, 2014, December 29, 2013 and December 30, 2012, respectively. The increase in share-based compensation in 2013 was due to a change in the estimated forfeiture rate applied to unvested awards that resulted in $1.6 million of additional expense. The increase in 2014 related to the accelerated vesting of certain performance based restricted grants. The amount of expense related to non-employee options was $0.2 million, $0.3 million and $0.3 million for the years ended December 28, 2014, December 29, 2013 and December 30, 2012, respectively. Additionally, $0.4 million and $0.4 million of these share-based compensation costs were included in inventory as a capitalized cost as of December 28, 2014 and December 29, 2013, respectively.
Stock Option Awards
The Company estimates the fair value of stock options using the Black-Scholes option pricing model. The Black-Scholes option pricing model requires the input of estimates, including the expected life of stock options, expected stock price volatility, the risk-free interest rate and the expected dividend yield. The Company
116
Table of Contents
calculates the expected life of stock options using the Securities and Exchange Commission’s allowed short-cut method due to the relatively recent initial public offering and a lack of historical data. The expected stock price volatility assumption was estimated based upon historical volatility of the common stock of a group of the Company’s peers that are publicly traded. The risk-free interest rate was determined using U.S. Treasury rates with terms consistent with the expected life of the stock options. Expected dividend yield is not considered, as the Company has never paid dividends and currently has no plans of doing so during the term of the options. The Company estimates forfeitures at the time of grant and revises those estimates in subsequent periods if actual forfeitures differ from those estimates. The Company uses historical data when available to estimate pre-vesting option forfeitures, and records share-based compensation expense only for those awards that are expected to vest. The weighted-average fair value of the Company’s options granted to employees was $9.83, $8.95, and $8.55 per share, in 2014, 2013 and 2012, respectively. The fair value of each option grant is estimated on the date of grant using the Black-Scholes option pricing model using the following weighted-average assumptions:
| Years ended | ||||||||||||
| December 28, 2014 |
December 29, 2013 |
December 30, 2012 |
||||||||||
| Risk-free interest rate |
1.9 | % | 1.7 | % | 0.9 | % | ||||||
| Expected life in years |
6.1 | 6.1 | 6.1 | |||||||||
| Expected volatility |
45.1 | % | 46.6 | % | 48.1 | % | ||||||
| Expected dividend yield |
0.0 | % | 0.0 | % | 0.0 | % | ||||||
As of December 28, 2014, the Company had $8.2 million of total unrecognized compensation cost related to unvested share-based compensation arrangements granted to employees under the 2010 Plan and the Company’s prior stock option plan. That cost is expected to be recognized over a weighted-average service period of 1.4 years. Shares reserved for future compensation grants were 1.6 million and 2.5 million at December 28, 2014 and December 29, 2013, respectively. Per share exercise prices for options outstanding at December 28, 2014 and December 29, 2013, ranged from $13.39 to $27.31.
A summary of the Company’s employee stock option activity is as follows:
| Ordinary Shares (In Thousands) |
Weighted-Average Per Share Exercise Price |
Weighted-Average Remaining Contractual Life (In Years) |
Aggregate Intrinsic Value (in Millions) |
|||||||||||||
| Outstanding at January 1, 2012 |
3,896 | 18.32 | 6.9 | (3.8 | ) | |||||||||||
|
|
|
|||||||||||||||
| Granted |
626 | 18.45 | ||||||||||||||
| Exercised |
(426 | ) | 16.56 | (0.9 | ) | |||||||||||
| Forfeited or expired |
(314 | ) | 22.33 | |||||||||||||
|
|
|
|||||||||||||||
| Outstanding at December 30, 2012 |
3,782 | 18.23 | 6.4 | (7.3 | ) | |||||||||||
|
|
|
|||||||||||||||
| Granted |
643 | 19.32 | ||||||||||||||
| Exercised |
(1,454 | ) | 14.38 | (2.0 | ) | |||||||||||
| Forfeited or expired |
(543 | ) | 22.51 | |||||||||||||
|
|
|
|||||||||||||||
| Outstanding at December 29, 2013 |
2,428 | 19.89 | 7.5 | (3.9 | ) | |||||||||||
|
|
|
|||||||||||||||
| Granted |
522 | 21.58 | ||||||||||||||
| Exercised |
(197 | ) | 16.16 | (1.2 | ) | |||||||||||
| Forfeited or expired |
(216 | ) | 21.19 | |||||||||||||
|
|
|
|||||||||||||||
| Outstanding at December 28, 2014 |
2,537 | 22.48 | 7.3 | 12.7 | ||||||||||||
|
|
|
|||||||||||||||
| Exercisable at period end |
1,408 | 20.57 | 6.0 | 7.0 | ||||||||||||
The Company did not grant options to purchase ordinary shares to non-employees in the years ended December 28, 2014, December 29, 2013 and December 30, 2012. As of December 28, 2014, 103,208 non-
117
Table of Contents
employee options were exercisable, while 40,453 non-employee options were exercised in 2014 and 1,750 were forfeited. These options have vesting periods of either two or four years and expire 10 years after the grant date. The measurement date for options granted to non-employees is often after the grant date, which often requires updates to the estimate of fair value until the services are performed.
Total stock option-related compensation expense recognized in the consolidated statements of operations, including employees and non-employees, was approximately $4.5 million, $5.3 million and $5.0 million for the years ended December 28, 2014, December 29, 2013 and December 30, 2012, respectively.
Restricted Stock Units Awards
The Company began to grant RSUs in 2011 under the 2010 Plan. Vesting of these awards typically occurs over a four-year period and the grant date fair value of the awards is recognized as expense over the vesting period.
In addition, the Company granted 100,000 performance-accelerated restricted stock units (PARS). The PARS are subject to a graded service-based vesting schedule of 50% vesting after two years, 25% after the third year and 25% after the fourth year, all of which can be accelerated upon the achievement of certain share price targets of the Company’s ordinary shares. PARS are expensed on a straight-line basis over the shorter of the explicit service period related to the service condition or the implicit service period related to the performance condition, based on the probability of meeting the conditions. The grant date weighted-average fair value and related calculated vesting period of the PARS was $19.24 per share and 3.4 years, respectively.
Total compensation expense recognized in the consolidated statements of operations related to RSUs and PARS was $5.2 million, $3.0 million and $1.8 million for the years ended December 28, 2014, December 29, 2013 and December 30, 2012, respectively. The fair value of RSUs vested was $4.7 million, $1.6 million and $1.1 million for the years ended December 28, 2014, December 29, 2013 and December 30, 2012, respectively.
A summary of the Company’s activity related to RSUs is as follows:
| Shares (In Thousands) |
Weighted-Average Grant Date Fair Value Per Share |
|||||||
| Outstanding at January 1, 2012 |
207 | 25.10 | ||||||
| Granted |
305 | 18.51 | ||||||
| Vested |
(55 | ) | 20.21 | |||||
| Cancelled |
(35 | ) | 24.01 | |||||
|
|
|
|||||||
| Outstanding at December 30, 2012 |
422 | 20.57 | ||||||
| Granted |
323 | 19.25 | ||||||
| Vested |
(97 | ) | 16.40 | |||||
| Cancelled |
(75 | ) | 22.03 | |||||
|
|
|
|||||||
| Outstanding at December 29, 2013 |
573 | 19.54 | ||||||
| Granted |
364 | 20.87 | ||||||
| Vested |
(240 | ) | 19.77 | |||||
| Cancelled |
(60 | ) | 19.18 | |||||
|
|
|
|||||||
| Outstanding at December 28, 2014 |
637 | 20.23 | ||||||
|
|
|
|||||||
118
Table of Contents
| 17. | Special Charges |
Special charges are recorded as a separate line item within operating expenses on the consolidated statement of operations and primarily include operating expenses directly related to business combinations and related integration activities, restructuring initiatives (including the facilities consolidation initiative), management exit costs and certain other items that are typically infrequent in nature and that affect the comparability and trend of operating results. The table below summarizes amounts included in special charges for the related periods:
| Year ended | ||||||||||||
| December 28, 2014 |
December 29, 2013 |
December 30, 2012 |
||||||||||
| Facilities consolidation charges |
$ | — | $ | — | $ | 6,357 | ||||||
| Acquisition, integration and distributor transition costs |
2,996 | 7,143 | 4,920 | |||||||||
| Proposed merger-related charges |
4,819 | — | — | |||||||||
| OrthoHelix restructuring charges |
1,727 | 521 | — | |||||||||
| Reduction in contingent consideration liability |
(5,388 | ) | (5,140 | ) | — | |||||||
| Legal settlements |
— | 1,214 | — | |||||||||
| Italy bad debt expense |
— | — | 2,001 | |||||||||
| Management exit costs |
— | — | 1,229 | |||||||||
| Intangible asset impairments |
— | — | 4,737 | |||||||||
| Other |
325 | — | — | |||||||||
|
|
|
|
|
|
|
|||||||
| Total |
$ | 4,479 | $ | 3,738 | $ | 19,244 | ||||||
|
|
|
|
|
|
|
|||||||
Included in special charges for the year ended December 28, 2014 were $3.0 million of expenses related to acquisition and integration activities of OrthoHelix and certain U.S. distributor transitions; $4.8 million of merger related expenses related to the proposed merger with Wright Medical Group Inc.; $1.7 million of OrthoHelix restructuring costs and $5.4 million in gains related to the reversal of a contingent consideration liability for OrthoHelix due to updated revenue estimates.
Included in special charges for the year ended December 29, 2013 were $7.1 million of expenses related to acquisition and integration activities of OrthoHelix, U.S. distributor transitions, and the Company’s acquisitions of certain assets of its distributors in Canada, the United Kingdom and Australia; $5.1 million of gain recognized on the reversal of a contingent consideration liability for OrthoHelix due to updated revenue estimates; $1.2 million of expenses related to a certain legal settlement; and $0.5 million of OrthoHelix restructuring costs.
Included in special charges for the year ended December 30, 2012 were $6.4 million of restructuring costs related to the Company’s facilities consolidation initiative. See below for further details on this initiative. Also included in special charges were intangible impairments of $4.7 million as the Company made certain strategic decisions related to previously acquired intangibles which was determined to be impaired as a result of the acquisition of OrthoHelix; acquisition and integration costs of $3.5 million which included costs related to the Company’s acquisition of OrthoHelix and the Company’s exclusive distributor in Belgium and Luxembourg; $2.0 million of bad debt expense related to certain uncollectible accounts and worsening economic conditions in Italy; distribution channel change costs of $1.4 million which included termination costs related to certain strategic business decisions made related to the Company’s U.S. and international distribution channels; and management exit costs of $1.2 million which included severance related to the Company’s former Chief Executive Officer and Global Chief Financial Officer.
OrthoHelix Restructuring Initiative
In December 2013, as part of the on-going integration of OrthoHelix, the Company announced the move and consolidation of various business operations from Medina, Ohio to Bloomington, Minnesota including customer service, quality, supply chain and finance functions. Charges incurred in connection with the initiative
119
Table of Contents
during the year ended December 28, 2014 were $0.7 million related to termination benefits including severance and retention and $1.0 million related to moving, professional fees, and other initiative related expenses, all of which were recorded in special charges in the consolidated statement of operations. The total charges related to the initiative were substantially recorded and paid in 2014.
Included in accrued liabilities on the consolidated balance sheet as of December 28, 2014 is an accrual related to the OrthoHelix restructuring initiative. Activity in the restructuring accrual is presented in the following table (in thousands):
| OrthoHelix restructuring accrual balance as of December 30, 2012 |
$ | — | ||
|
|
|
|||
| Charges: |
||||
| Employee termination benefits |
381 | |||
| Moving, professional fees and other initiative-related expenses |
— | |||
|
|
|
|||
| Total charges |
381 | |||
| Payments: |
||||
| Employee termination benefits |
— | |||
| Moving, professional fees and other initiative-related expenses |
— | |||
|
|
|
|||
| Total payments |
— | |||
|
|
|
|||
| OrthoHelix restructuring initiative accrual balance as of December 29, 2013 |
$ | 381 | ||
| Charges: |
||||
| Employee termination benefits |
688 | |||
| Moving, professional fees and other initiative-related expenses |
1,039 | |||
|
|
|
|||
| Total charges |
1,727 | |||
| Payments: |
||||
| Employee termination benefits |
(945 | ) | ||
| Moving, professional fees and other initiative-related expenses |
(1,037 | ) | ||
|
|
|
|||
| Total payments |
(1,982 | ) | ||
|
|
|
|||
| OrthoHelix restructuring initiative accrual balance as of December 28, 2014 |
$ | 126 | ||
|
|
|
Facilities Consolidation Initiative
On April 13, 2012, the Company announced a facilities consolidation initiative, stating that it planned to consolidate several of its facilities to drive operational productivity. Under the initiative, the Company consolidated its Dunmanway, Ireland manufacturing facility into its Macroom, Ireland manufacturing facility in the second quarter of 2012 and, in the third quarter of 2012, the Company consolidated its St. Ismier, France manufacturing facility into its Montbonnot, France manufacturing facility. In addition, the Company leased a new facility in Bloomington, Minnesota to use as its U.S. business headquarters and consolidated its Minneapolis-based marketing, training, regulatory, supply chain, and corporate functions with its Stafford, Texas-based distribution operations. This initiative was completed in the fourth quarter of 2012 and all related liabilities were substantially paid by December 29, 2013.
| 18. | Litigation |
From time to time, the Company is subject to various pending or threatened legal actions and proceedings, including those that arise in the ordinary course of its business. These actions and proceedings may relate to, among other things, product liability, intellectual property, distributor, commercial and other matters. Such matters are subject to many uncertainties and to outcomes that are not predictable with assurance and that may not be known for extended periods of time. The Company records a liability in its consolidated financial statements for costs related to claims, including future legal costs, settlements and judgments, where the
120
Table of Contents
Company has assessed that a loss is probable and an amount can be reasonably estimated. If the reasonable estimate of a probable loss is a range, the Company records the most probable estimate of the loss or the minimum amount when no amount within the range is a better estimate than any other amount. The Company discloses a contingent liability even if the liability is not probable or the amount is not estimable, or both, if there is a reasonable possibility that a material loss may have been incurred.
On November 25, 2014, a class action complaint was filed in the Chancery Court of Shelby County Tennessee, for the Thirtieth Judicial District, at Memphis (the Tennessee Chancery Court), by a purported shareholder of Wright under the caption Anthony Marks as Trustee for Marks Clan Super v. Wright Medical Group, Inc., Gary D. Blackford, Martin J. Emerson, Lawrence W. Hamilton, Ronald K. Labrum, John L. Miclot, Robert J. Palmisano, Amy S. Paul, Robert J. Quillinan, David D. Stevens, Douglas G. Watson, Tornier N.V., Trooper Holdings Inc., and Trooper Merger Sub Inc., No. CH-14-1721-1, followed by an amended complaint filed on January 7, 2015 with the same caption. The complaint names as defendants Wright, Tornier, Trooper Holdings Inc., (“Holdco”), Trooper Merger Sub (“Merger Sub”) and the members of the Wright board of directors. The complaint asserts various causes of action, including, among other things, that the members of the Wright board of directors breached their fiduciary duties owed to the Wright shareholders in connection with entering into the merger agreement and approving the merger and causing Wright to issue a preliminary Form S-4 registration statement that purportedly fails to disclose allegedly material information about the merger. The complaint further alleges that Wright, Tornier, Holdco and Merger Sub aided and abetted the breaches of fiduciary duties by the Wright board of directors. The plaintiff is seeking, among other things, injunctive relief enjoining or rescinding the merger and an award of attorneys’ fees and costs.
Also on November 25, 2014, a second class action complaint was filed in the Court of Chancery of the state of Delaware (the Delaware Court) by a purported shareholder of Wright under the caption Paul Parshall v. Wright Medical Group, Inc., Gary D. Blackford, Martin J. Emerson, Lawrence W. Hamilton, Ronald K. Labrum, John L. Miclot, Robert J. Palmisano, Amy S. Paul, Robert J. Quillinan, David D. Stevens, Douglas G. Watson, Tornier N.V., Trooper Holdings Inc., and Trooper Merger Sub Inc., No. 10400-CB, followed by an amended complaint filed on January 5, 2015 with the same caption. The complaint names as defendants Wright, Tornier, Holdco, Merger Sub and the members of the Wright board of directors. The complaint asserts various causes of action, including, among other things, that the members of the Wright board of directors breached their fiduciary duties owed to the Wright shareholders in connection with entering into the merger agreement and approving the merger and causing Wright to issue a preliminary Form S-4 registration statement that purportedly fails to disclose allegedly material information about the merger. The complaint further alleges that Wright, Tornier, Holdco and Merger Sub aided and abetted the breaches of fiduciary duties by the Wright board of directors. The plaintiff is seeking, among other things, injunctive relief enjoining or rescinding the merger and an award of attorneys’ fees and costs.
On November 26, 2014, a third class action complaint was filed in the Circuit Court of Tennessee, for the Thirtieth Judicial District, at Memphis (the Tennessee Circuit Court), by a purported shareholder of Wright under the caption City of Warwick Retirement System v. Gary D. Blackford, Martin J. Emerson, Lawrence W. Hamilton, Ronald K. Labrum, John L. Miclot, Robert J. Palmisano, Amy S. Paul, Robert J. Quillinan, David D. Stevens, Douglas G. Watson, Wright Medical Group, Tornier N.V., Trooper Holdings Inc., and Trooper Merger Sub Inc., No. CT-005015-14, followed by an amended complaint filed on January 5, 2015 with the same caption. The complaint names as defendants Wright, Tornier, Holdco, Merger Sub and the members of the Wright board of directors. The complaint asserts various causes of action, including, among other things, that the members of the Wright board of directors breached their fiduciary duties owed to the Wright shareholders in connection with entering into the merger agreement and approving the merger and causing Wright to issue a preliminary Form S-4 registration statement that purportedly fails to disclose allegedly material information about the merger. The complaint further alleges that Tornier, Holdco and Merger Sub aided and abetted the alleged breaches of fiduciary duties by the Wright board of directors. The plaintiff is seeking, among other things, injunctive relief enjoining or rescinding the merger and an award of attorneys’ fees and costs.
121
Table of Contents
On December 2, 2014, a fourth class action complaint was filed in the Tennessee Chancery Court by a purported shareholder of Wright under the caption Paulette Jacques v. Wright Medical Group, Inc., Tornier N.V., Trooper Holdings Inc., Trooper Merger Sub Inc., David D. Stevens, Gary D. Blackford, Martin J. Emerson, Lawrence W. Hamilton, Ronald K. Labrum, John L. Miclot, Robert J. Palmisano, Amy S. Paul, Robert J. Quillinan, and Douglas G. Watson, No. CH-14-1736-1, followed by an amended complaint filed on January 27, 2015, which added Warburg Pincus LLC (Warburg) as a defendant. Besides Warburg, the complaint also names as defendants Wright, Tornier, Holdco, Merger Sub and the members of the Wright board of directors. The complaint asserts various causes of action, including, among other things, that the members of the Wright board of directors breached their fiduciary duties owed to the Wright shareholders in connection with entering into the merger agreement approving the merger and causing Wright to issue a preliminary Form S-4 registration statement that purportedly fails to disclose allegedly material information about the merger. The complaint further alleges that Wright, Tornier, Holdco, Merger Sub and Warburg aided and abetted the alleged breaches of fiduciary duties by the Wright board of directors. The plaintiff is seeking, among other things, injunctive relief enjoining or rescinding the merger and an award of attorneys’ fees and costs.
None of these lawsuits has formally specified an amount of alleged damages. As a result, Tornier is unable to reasonably estimate the possible loss or range of losses, if any, arising from the lawsuits. If any injunctive relief sought in these lawsuits were to be granted, it could delay or prohibit the anticipated shareholder meetings to be held by Wright and Tornier in connection with the merger or the closing of the merger. Tornier believes that these lawsuits are without merit and intends to contest them vigorously.
In the opinion of management, as of December 28, 2014, the amount of liability, if any, with respect to these matters, individually or in the aggregate, will not materially affect the Company’s consolidated results of operations, financial position or cash flows.
| 19. | Selected Quarterly Information (unaudited): |
The following table presents a summary of the Company’s unaudited quarterly operating results for each of the four quarters in 2014 and 2013, respectively (in thousands). This information was derived from unaudited interim financial statements that, in the opinion of management, have been prepared on a basis consistent with the financial statements contained elsewhere in this report and include all adjustments, consisting only of normal recurring adjustments, necessary for a fair presentation of such information when read in conjunction with the Company’s audited financial statements and related notes. The operating results for any quarter are not necessarily indicative of results for any future period.
| Year ended December 28, 2014 | ||||||||||||||||
| Fourth Quarter |
Third Quarter |
Second Quarter |
First Quarter |
|||||||||||||
| (in thousands, except per share data) | ||||||||||||||||
| Revenue |
$ | 92,403 | $ | 76,675 | $ | 86,850 | $ | 89,025 | ||||||||
| Cost of goods sold |
21,763 | 18,010 | 21,227 | 22,464 | ||||||||||||
|
|
|
|
|
|
|
|
|
|||||||||
| Gross profit |
70,640 | 58,665 | 65,623 | 66,561 | ||||||||||||
| Operating expenses: |
||||||||||||||||
| Selling, general and administrative |
58,679 | 57,127 | 62,504 | 58,848 | ||||||||||||
| Research and development |
6,294 | 6,055 | 6,068 | 5,722 | ||||||||||||
| Amortization of intangible assets |
4,207 | 4,274 | 4,320 | 4,334 | ||||||||||||
| Special charges |
5,473 | (4,366 | ) | 686 | 2,686 | |||||||||||
|
|
|
|
|
|
|
|
|
|||||||||
| Total operating expenses |
74,653 | 63,090 | 73,578 | 71,590 | ||||||||||||
| Operating loss |
(4,013 | ) | (4,425 | ) | (7,955 | ) | (5,029 | ) | ||||||||
|
|
|
|
|
|
|
|
|
|||||||||
| Consolidated net loss |
(8,468 | ) | (5,321 | ) | (10,448 | ) | (5,237 | ) | ||||||||
|
|
|
|
|
|
|
|
|
|||||||||
| Net loss per share: |
||||||||||||||||
| basic and diluted |
$ | (0.17 | ) | $ | (0.11 | ) | $ | (0.21 | ) | $ | (0.11 | ) | ||||
122
Table of Contents
| Year ended December 29, 2013 | ||||||||||||||||
| Fourth Quarter |
Third Quarter |
Second Quarter |
First Quarter |
|||||||||||||
| (in thousands, except per share data) | ||||||||||||||||
| Revenue |
$ | 83,392 | $ | 66,747 | $ | 78,135 | $ | 82,685 | ||||||||
| Cost of goods sold |
21,267 | 18,972 | 22,309 | 23,624 | ||||||||||||
|
|
|
|
|
|
|
|
|
|||||||||
| Gross profit |
62,125 | 47,775 | 55,826 | 59,061 | ||||||||||||
| Operating expenses: |
||||||||||||||||
| Selling, general and administrative |
56,451 | 46,797 | 51,467 | 52,136 | ||||||||||||
| Research and development |
5,997 | 4,665 | 5,543 | 6,182 | ||||||||||||
| Amortization of intangible assets |
4,288 | 3,976 | 3,784 | 3,837 | ||||||||||||
| Special charges |
2,729 | (3,918 | ) | 3,408 | 1,519 | |||||||||||
|
|
|
|
|
|
|
|
|
|||||||||
| Total operating expenses |
69,465 | 51,520 | 64,202 | 63,674 | ||||||||||||
| Operating loss |
(7,340 | ) | (3,745 | ) | (8,376 | ) | (4,613 | ) | ||||||||
|
|
|
|
|
|
|
|
|
|||||||||
| Consolidated net loss |
(10,699 | ) | (6,292 | ) | (12,537 | ) | (6,898 | ) | ||||||||
| Net loss per share: |
||||||||||||||||
| basic and diluted |
$ | (0.22 | ) | $ | (0.13 | ) | $ | (0.28 | ) | $ | (0.17 | ) | ||||
For the year ended December 28, 2014, the first, second, third and fourth quarters included net charges of $2.7 million, $0.7 million, $(4.4) million and $5.5 million, respectively, related to costs associated with the proposed merger with Wright; acquisition, integration and distribution channel transition charges; the partial reversals of a contingent consideration liability incurred in the acquisition of OrthoHelix and certain other items, all of which were recorded in special charges within operating expenses.
For the year ended December 29, 2013, the first, second, third and fourth quarters included net charges of $1.5 million, $3.4 million, $(3.9) million and $2.7 million, respectively, related to acquisition, integration and distribution channel transition charges; certain legal settlements; the partial reversal of a contingent consideration liability incurred in the acquisition of OrthoHelix and certain other items, all of which were recorded in special charges within operating expenses. The first, second, third and fourth quarters also included acquired inventory fair value adjustments of $1.8 million, $1.9 million, $1.8 million and $0.5 million, respectively, which were included in cost of goods sold.
123
Table of Contents
ITEM 9. CHANGES IN AND DISAGREEMENTS WITH ACCOUNTANTS ON ACCOUNTING AND FINANCIAL DISCLOSURE
Not applicable.
ITEM 9A. CONTROLS AND PROCEDURES
Disclosure Controls
Our President and Chief Executive Officer and Chief Financial Officer, referred to collectively herein as the Certifying Officers, are responsible for establishing and maintaining our disclosure controls and procedures. The Certifying Officers have reviewed and evaluated the effectiveness of our disclosure controls and procedures (as defined in Rules 240.13a-15(e) and 240.15d-15(e) promulgated under the Securities Exchange Act of 1934, as amended) as of December 28, 2014. Based on that review and evaluation, which included inquiries made to certain of our other employees, the Certifying Officers have concluded that, as of the end of the period covered by this report, our disclosure controls and procedures, as designed and implemented, are effective in ensuring that information relating to Tornier required to be disclosed in the reports that we file or submit under the Securities Exchange Act of 1934, as amended, is recorded, processed, summarized and reported within the time periods specified in the Securities and Exchange Commission’s rules and forms, including ensuring that such information is accumulated and communicated to our management, including the Certifying Officers, as appropriate to allow timely decisions regarding required disclosure.
Management’s Annual Report on Internal Control Over Financial Reporting
Our management is responsible for establishing and maintaining adequate internal control over financial reporting. Under the supervision and with the participation of our management, including our President and Chief Executive Officer and Chief Financial Officer, we conducted an evaluation of the effectiveness of our internal control over financial reporting as of December 28, 2014, based on the criteria established in Internal Control—Integrated Framework issued by the Committee of Sponsoring Organizations of the Treadway Commission (2013 framework) (COSO). Based on this evaluation, our management concluded that our internal control over financial reporting was effective as of December 28, 2014. The report of Ernst &Young LLP, our independent registered public accounting firm, regarding the effectiveness of our internal control over financial reporting is included in this report in “Part II. Item 8, Financial Statements and Supplementary Data” under “Report of Independent Registered Public Accounting Firm.”
Changes in Internal Control Over Financial Reporting
During the fourth quarter ended December 28, 2014, there were no changes in our internal control over financial reporting that materially affected, or that are reasonably likely to materially affect, our internal control over financial reporting.
Not applicable.
124
Table of Contents
| ITEM 10. | DIRECTORS, EXECUTIVE OFFICERS AND CORPORATE GOVERNANCE |
Directors and Executive Officers
The table below sets forth, as of February 10, 2015, certain information concerning Tornier’s current directors and executive officers. No family relationships exist among any of Tornier’s directors or executive officers.
| Name |
Age |
Position | ||||
| David H. Mowry |
52 | President and Chief Executive Officer and Executive Director | ||||
| Shawn T McCormick |
50 | Chief Financial Officer | ||||
| Stéphan Epinette |
43 | Senior Vice President, International Commercial Operations | ||||
| Kevin M. Klemz |
53 | Senior Vice President, Chief Legal Officer and Secretary | ||||
| Gregory Morrison |
51 | Senior Vice President, Global Human Resources and HPMS | ||||
| Terry M. Rich |
47 | Senior Vice President, U.S. Commercial Operations | ||||
| Gordon W. Van Ummersen |
53 | Senior Vice President, Global Product Delivery | ||||
| Sean D. Carney(1)(2)(3) |
45 | Chairman and Non-Executive Director | ||||
| Kevin C. O’Boyle(2)(3)(4) |
58 | Non-Executive Director | ||||
| Richard B. Emmitt(3)(4) |
70 | Non-Executive Director | ||||
| Alain Tornier |
68 | Non-Executive Director | ||||
| Richard F. Wallman(1)(4) |
63 | Non-Executive Director | ||||
| Elizabeth H. Weatherman(1) |
54 | Non-Executive Director | ||||
| (1) | Member of the compensation committee. |
| (2) | Member of the nominating, corporate governance and compliance committee. |
| (3) | Member of the strategic transactions committee. |
| (4) | Member of the audit committee. |
The following is a biographical summary of the experience of Tornier’s directors and executive officers:
David H. Mowry serves as Tornier’s President and Chief Executive Officer, a position he has held since February 2013, and as Tornier’s Executive Director, a position he has held since June 2013. Mr. Mowry joined Tornier in July 2011 as Chief Operating Officer, and in November 2012 was appointed Interim President and Chief Executive Officer. In February 2013, he was appointed President and Chief Executive Officer on a non-interim basis. He has over 24 years of experience in the medical device industry. Prior to joining Tornier, Mr. Mowry served from July 2010 to July 2011 as President of the Global Neurovascular Division of Covidien plc, a global provider of healthcare products. From January 2010 to July 2010, Mr. Mowry served as Senior Vice President and President, Worldwide Neurovascular of ev3 Inc., a global endovascular device company acquired by Covidien in July 2010. From August 2007 to January 2010, Mr. Mowry served as Senior Vice President of Worldwide Operations of ev3. Prior to this position, Mr. Mowry was Vice President of Operations for ev3 Neurovascular from November 2006 to October 2007. Before joining ev3, Mr. Mowry served as Vice President of Operations and Logistics at the Zimmer Spine division of Zimmer Holdings Inc., a reconstructive and spinal implants, trauma and related orthopaedic surgical products company, from February 2002 to November 2006. Prior to Zimmer, Mr. Mowry was President and Chief Operating Officer of HeartStent Corp., a medical device company. Mr. Mowry is a graduate of the United States Military Academy in West Point, New York with a degree in Engineering and Mathematics. Mr. Mowry’s qualifications to sit on the Tornier board of directors include his depth of knowledge of Tornier and its day-to-day operations in light of his position as President and Chief Executive Officer of Tornier.
Shawn T McCormick joined Tornier as Tornier’s Chief Financial Officer in September 2012. Prior to joining Tornier, Mr. McCormick served as Chief Operating Officer of Lutonix, Inc., a medical device company acquired by C. R. Bard, Inc. in December 2011, from April 2011 to February 2012. From January 2009 to July
125
Table of Contents
2010, Mr. McCormick served as Senior Vice President and Chief Financial Officer of ev3 Inc., a global endovascular device company acquired by Covidien plc in July 2010. Prior to joining ev3, Mr. McCormick served as Vice President, Corporate Development at Medtronic, Inc., a global medical device company, where he was responsible for leading Medtronic’s worldwide business development activities. Mr. McCormick joined Medtronic in July 1992 and held various finance and leadership positions during his tenure. From July 2007 to May 2008, he served as Vice President, Corporate Technology and New Ventures of Medtronic. From July 2002 to July 2007, he was Vice President, Finance for Medtronic’s Spinal, Biologics and Navigation business. Prior to that, Mr. McCormick held various other positions with Medtronic. Mr. McCormick currently serves on the board of directors of Nevro, Inc. and Entellus Medical, Inc., all publicly held companies. Prior to joining Medtronic, he spent four years with the public accounting firm KPMG Peat Marwick. Mr. McCormick earned his Master of Business Administration from the University of Minnesota’s Carlson School of Management and his Bachelor of Science in Accounting from Arizona State University. He is a Certified Public Accountant.
Stéphan Epinette leads Tornier’s international commercial operations and large joints business as Senior Vice President, International Commercial Operations. Mr. Epinette served as Vice President, International Commercial Operations from December 2008 to January 2014 and in January 2014 was appointed to his current position. Mr. Epinette has over 19 years of experience in the orthopaedic medical device industry. Prior to joining Tornier, he served in various leadership roles with Stryker Corporation, a medical technology company, in its MedSurg and Orthopaedic divisions in France, the United States and Switzerland from 1993 to December 2008, including as Business Unit Director France from 2005 to 2008. His past functions at Stryker also included Marketing Director MedSurg EMEA, Assistant to the EMEA President and Director of Business Development & Market Intelligence EMEA. Mr. Epinette earned a Master’s Degree in Health Economics from Sciences Politiques, Paris, a Master’s Degree in International Business from Paris University XII and a Bachelor of Arts from EBMS Barcelona. He also attended the INSEAD executive course in Finance and in Marketing.
Kevin M. Klemz serves as Tornier’s Senior Vice President, Chief Legal Officer and Secretary. Mr. Klemz served as Vice President, Chief Legal Officer and Secretary from September 2010 to January 2014 and in January 2014 was appointed to his current position. Prior to joining Tornier, Mr. Klemz served as Senior Vice President, Secretary and Chief Legal Officer at ev3 Inc., a global endovascular device company acquired by Covidien plc in July 2010, from August 2007 to August 2010, and as Vice President, Secretary and Chief Legal Officer at ev3 from January 2007 to August 2007. Prior to joining ev3, Mr. Klemz was a partner in the law firm Oppenheimer Wolff & Donnelly LLP, where he was a corporate lawyer for approximately 20 years. Mr. Klemz has a Bachelor of Arts in Business Administration from Hamline University and a Juris Doctor from William Mitchell College of Law.
Gregory Morrison serves as Tornier’s Senior Vice President, Global Human Resources and HPMS (High Performance Management System). Mr. Morrison served as Global Vice President, Human Resources from December 2010 to January 2014 and in January 2014 was appointed to his current position. Prior to joining Tornier, Mr. Morrison served as Senior Vice President, Human Resources at ev3 Inc., Inc., a global endovascular device company acquired by Covidien plc in July 2010, from August 2007 to December 2010, and as Vice President, Human Resources of ev3 from May 2002 to August 2007. Prior to joining ev3, Mr. Morrison served as Vice President of Organizational Effectiveness for Thomson Legal & Regulatory from March 1999 to February 2002 and Vice President of Global Human Resources for Schneider Worldwide, which was acquired by Boston Scientific Corporation, from 1988 to March 1999. Mr. Morrison has a Bachelor of Arts in English and Communications from North Adams State College and a Master of Arts in Corporate Communications from Fairfield University.
Terry M. Rich serves as Tornier’s Senior Vice President, U.S. Commercial Operations, a position he has held since March 2012. Prior to joining Tornier, Mr. Rich served as Senior Vice President of Sales—West of NuVasive, Inc., a medical device company focused on developing minimally disruptive surgical products and procedures for the spine. Prior to such position, Mr. Rich served as Area Vice President, Sales Director and Area Business Manager of NuVasive from December 2005. Prior to joining NuVasive, Mr. Rich served as Partner/
126
Table of Contents
Area Sales Manager of Bay Area Spine of DePuy Spine, Inc., a spine company and subsidiary of Johnson & Johnson, from July 2004 to December 2005. Mr. Rich has a Bachelor of Labor Relations from Rutgers College, Rutgers University.
Gordon W. Van Ummersen serves as Tornier’s Senior Vice President, Global Product Delivery. Mr. Van Ummersen served as Senior Vice President, Product Delivery from June 2013 to January 2014 and in January 2014 was appointed to his current position. Prior to joining Tornier, Mr. Van Ummersen spent a year in multiple leadership roles for Biomet, Inc., an orthopedic company, following the divestiture of the worldwide trauma business of DePuy Orthopaedics, Inc. to Biomet in June 2012. Prior to that, Mr. Van Ummersen served as WW President, Trauma & Extremities for DePuy from 2007 to June 2012, General Manager, Trauma & Extremities from 2005 to 2007 and Vice President, Marketing from 2003 to 2005. Prior to joining DePuy, Mr. Van Ummersen held numerous senior commercial roles at Stryker Corporation, a medical technology company, including Vice President & General Manager for US Trauma from 1999 to 2003 and Director of Corporate Accounts from 1995 to 1999. Mr. Van Ummersen holds a Masters of Business Administration from the University of Massachusetts, Boston and a Bachelor of Science degree in Health Services Administration from Providence College.
Sean D. Carney is one of Tornier’s non-executive directors and has served as a director since July 2006. Mr. Carney serves as Tornier’s Chairman, a position he has held since May 2010. Mr. Carney was appointed as a director in connection with the securityholders’ agreement that Tornier entered into with certain holders of Tornier ordinary shares. For more information regarding the securityholders’ agreement, please refer to the discussion below under “—Board Structure and Composition.” Since 1996, Mr. Carney has been employed by Warburg Pincus LLC and has served as a Member and Managing Director of Warburg Pincus LLC and General Partner of Warburg Pincus & Co. since January 2001. Warburg Pincus LLC and Warburg Pincus & Co. are part of the Warburg Pincus entities collectively referred to elsewhere in this report as Warburg Pincus, a principal shareholder that owns approximately 21.9% of outstanding Tornier ordinary shares as of February 10, 2015. He is also a member of the board of directors of MBIA Inc. and several private companies. During the past five years, Mr. Carney previously served on the board of directors of DexCom, Inc., a publicly held medical device company, Arch Capital Group Ltd., a publicly held company, and several privately held companies. Mr. Carney received a Master of Business Administration from Harvard Business School and a Bachelor of Arts from Harvard College. Mr. Carney’s substantial experience as an investor and director in medical device companies and his experience evaluating financial results have led the Tornier board of directors to the conclusion that he should serve as a director, Tornier’s Chairman and Chair and a member of several of Tornier’s board committees at this time in light of Tornier’s business and structure.
Kevin C. O’Boyle is one of Tornier’s non-executive directors and has served as a director since June 2010. In November 2012, Mr. O’Boyle was appointed as Interim Vice Chairman of Tornier, a position he held for about a year. From December 2010 to October 2011, Mr. O’Boyle served as Senior Vice President and Chief Financial Officer of Advanced BioHealing Inc., a medical device company which was acquired by Shire PLC in May 2011. From January 2003 until December 2009, Mr. O’Boyle served as the Chief Financial Officer of NuVasive, Inc., a medical device company that completed its initial public offering in May 2004. Prior to that time, Mr. O’Boyle served in various positions during his six years with ChromaVision Medical Systems, Inc., a publicly held medical device company specializing in the oncology market, including as its Chief Financial Officer and Chief Operating Officer. Mr. O’Boyle also held various positions during his seven years with Albert Fisher North America, Inc., a publicly held international food company, including Chief Financial Officer and Senior Vice President of Operations. Mr. O’Boyle currently serves on the board of directors of GenMark Diagnostics, Inc., ZELTIQ Aesthetics, Inc. and Sientra, Inc., all publicly held companies. During the past five years, Mr. O’Boyle previously served on the board of directors of Durata Therapeutics, Inc. Mr. O’Boyle received a Bachelor of Science in Accounting from the Rochester Institute of Technology and successfully completed the Executive Management Program at the University of California Los Angeles, John E. Anderson Graduate Business School. Mr. O’Boyle’s executive experience in the healthcare industry, his experience with companies during their transition from being privately held to publicly held and his financial and accounting
127
Table of Contents
expertise have led the Tornier board of directors to the conclusion that Mr. O’Boyle should serve as a director, Chair of Tornier’s strategic transactions committee and a member of Tornier’s audit committee at this time in light of Tornier’s business and structure.
Richard B. Emmitt is one of Tornier’s non-executive directors and has served as a director since July 2006. Mr. Emmitt was initially appointed as one of three directors in connection with the securityholders’ agreement that Tornier entered into with certain holders of Tornier ordinary shares. For more information regarding the securityholders’ agreement, please refer to the discussion below under “—Board Structure and Composition.” Mr. Emmitt served as a General Partner of The Vertical Group L.P., an investment management and venture capital firm focused on the medical device and biotechnology industries, from its inception in 1989 through December 2007. Commencing in January 2008, Mr. Emmitt has been a Member and Manager of The Vertical Group G.P., LLC, which controls The Vertical Group L.P. Mr. Emmitt currently serves on the board of directors of several privately held companies. During the past five years, Mr. Emmitt previously served on the board of directors of ev3 Inc. and American Medical Systems Holdings, Inc., both publicly held companies, and several privately held companies. In addition, prior to such five-year period, Mr. Emmitt served on the boards of directors of several publicly held companies, primarily in the medical device industry. Mr. Emmitt holds a Master of Business Administration from the Rutgers School of Business and a Bachelor of Arts from Bucknell University. Mr. Emmitt’s substantial experience as an investor and board member of numerous medical device companies ranging from development stage private companies to public companies with substantial revenues has led the Tornier board of directors to the conclusion that he should serve as a director and a member of Tornier’s audit committee and strategic transactions committee at this time in light of Tornier’s business and structure.
Alain Tornier is one of Tornier’s non-executive directors and has served as a director since May 1976. Mr. Tornier assumed a leadership role in Tornier’s predecessor entity in 1976, following the death of his father, René Tornier, founder of Tornier. Mr. Tornier later served as Tornier’s President and Chief Executive Officer until the acquisition of Tornier by an investor group in September 2006, when he retired as an executive officer of Tornier. Mr. Tornier holds a Master of Sciences degree from Grenoble University. Mr. Tornier’s significant experience in the global orthopaedics industry and deep understanding of Tornier’s history and operations have led the Tornier board of directors to the conclusion that he should serve as a director at this time in light of Tornier’s business and structure.
Richard F. Wallman is one of Tornier’s non-executive directors and has served as a director since December 2008. From 1995 through his retirement in 2003, Mr. Wallman served as Senior Vice President and Chief Financial Officer of Honeywell International, Inc., a diversified technology company, and AlliedSignal, Inc., a diversified technology company (prior to its merger with Honeywell International, Inc.). Prior to joining AlliedSignal, Inc. as Chief Financial Officer, Mr. Wallman served as Controller of International Business Machines Corporation. In addition to serving as a director of Tornier, Mr. Wallman is also a member of the board of directors of Charles River Laboratories International, Inc., Convergys Corporation, Extended Stay America, Inc. and its wholly subsidiary ESH Hospitality, Inc., and Roper Industries, Inc., all publicly held companies. During the past five years, Mr. Wallman previously served on the board of directors of Ariba, Inc. as well as auto suppliers Dana Holding Corporation, Lear Corporation and Hayes Lemmerz International, Inc., all publicly held companies. Mr. Wallman also serves on the board of directors of Reddy Ice Holdings, Inc. and Accriva Diagnostics, both privately held companies. Mr. Wallman holds a Master of Business Administration from the University of Chicago Booth School of Business with concentrations in finance and accounting and a Bachelor of Science in Electrical Engineering from Vanderbilt University. Mr. Wallman’s prior public company experience, including as Chief Financial Officer of Honeywell and his public company director experience, and his financial experience and expertise, have led the Tornier board of directors to the conclusion that he should serve as a director, Chair of Tornier’s audit committee and a member of Tornier’s compensation committee at this time in light of Tornier’s business and structure.
Elizabeth H. Weatherman is one of Tornier’s non-executive directors and has served as a director since July 2006. Ms. Weatherman was appointed as a director in connection with the securityholders’ agreement that
128
Table of Contents
Tornier entered into with certain holders of Tornier ordinary shares. For more information regarding the securityholders’ agreement, please refer to the discussion below under “—Board Structure and Composition.” Ms. Weatherman is a General Partner of Warburg Pincus & Co., a Managing Director of Warburg Pincus LLC and a member of the firm’s Executive Management Group. Ms. Weatherman joined Warburg Pincus in 1988 and primarily focused on the firm’s healthcare investment activities. Warburg Pincus LLC and Warburg Pincus & Co. are part of the Warburg Pincus entities collectively referred to elsewhere in this report as Warburg Pincus, a principal shareholder that owns approximately 21.9% of outstanding Tornier ordinary shares as of February 10, 2015. Ms. Weatherman currently serves on the board of directors of several privately held companies. During the past five years, Ms. Weatherman previously served on the board of directors of ev3 Inc., a publicly held company, and several privately held companies. In addition, prior to such five-year period, Ms. Weatherman served on the boards of directors of several publicly held companies, primarily in the medical device industry. Ms. Weatherman earned a Master of Business Administration from the Stanford Graduate School of Business and a Bachelor of Arts from Mount Holyoke College. Ms. Weatherman’s extensive experience as a director of public companies in the medical device industry has led the Tornier board of directors to the conclusion that she should serve as a director at this time in light of Tornier’s business and structure.
Board Structure and Composition
Tornier has a one-tier board structure. Tornier’s articles of association provide that the number of members of the Tornier board of directors will be determined by the Tornier board of directors, provided that the Tornier board of directors shall be comprised of at least one executive director and two non-executive directors. The Tornier board of directors currently consists of seven directors, one of whom is Tornier’s executive director and six of whom are non-executive directors.
All of Tornier’s non-executive directors, except Alain Tornier, are “independent directors” under the Listing Rules of the NASDAQ Global Select Stock Market. Therefore, the following five of Tornier’s current seven directors are “independent directors” under the Listing Rules of the NASDAQ Global Select Stock Market: Sean D. Carney, Kevin C. O’Boyle, Richard B. Emmitt, Richard F. Wallman and Elizabeth H. Weatherman. Independence requirements for service on Tornier’s audit committee are discussed below under “—Board Committees—Audit Committee” and independence requirements for service on Tornier’s compensation committee are discussed below under “—Board Committees—Compensation Committee.” Mr. Wallman and Mr. O’Boyle are independent under the independence definition in the Dutch Corporate Governance Code. Tornier currently complies with the NASDAQ corporate governance requirements, and Tornier can deviate from the Dutch Corporate Governance Code requirement that a majority of its directors be independent within the meaning of the Dutch Corporate Governance Code provided Tornier explains such deviation in its Dutch statutory annual report.
The Tornier board of directors and Tornier shareholders each have approved that the Tornier board of directors be divided into three classes, as nearly equal in number as possible, with each director serving a three-year term and one class being elected at each year’s annual general meeting of shareholders. Messrs. Carney and Emmitt are in the class of directors whose term expires at the 2015 annual general meeting of the Tornier shareholders. Messrs. Mowry, O’Boyle and Wallman are in the class of directors whose term expires at the 2016 annual general meeting of the Tornier shareholders and Mr. Tornier and Ms. Weatherman are in the class of directors whose term expires at the 2017 annual general meeting of the Tornier shareholders. At each annual general meeting of the Tornier shareholders, successors to the class of directors whose term expires at such meeting will be elected to serve for three-year terms or until their respective successors are elected and qualified.
The general meeting of Tornier shareholders appoints the members of the Tornier board of directors, subject to a binding nomination of the Tornier board of directors in accordance with the relevant provisions of the Dutch Civil Code. The Tornier board of directors makes the binding nomination based on a recommendation of Tornier’s nominating, corporate governance and compliance committee. If the list of candidates contains one candidate for each open position to be filled, such candidate shall be appointed by the general meeting of Tornier
129
Table of Contents
shareholders unless the binding nature of the nominations by the Tornier board of directors is set aside by the general meeting of the Tornier shareholders. The binding nature of nomination(s) by the Tornier board of directors can only be set aside by a vote of at least two-thirds of the votes cast at an annual or extraordinary general meeting of Tornier shareholders, provided such two-thirds vote constitutes more than one-half of Tornier’s issued share capital. In such case, a new meeting is called at which the resolution for appointment of a member of the Tornier board of directors shall require a majority of at least two-thirds of the votes cast representing more than one-half of Tornier’s issued share capital.
A resolution of the general meeting of the Tornier shareholders to suspend a member of the Tornier board of directors requires the affirmative vote of an absolute majority of the votes cast. A resolution of the general meeting of the Tornier shareholders to suspend or dismiss members of the Tornier board of directors, other than pursuant to a proposal by the Tornier board of directors, requires a majority of at least two-thirds of the votes cast, representing more than one-half of Tornier’s issued share capital.
Pursuant to a securityholders’ agreement among Tornier, TMG Holdings Coöperatief U.A., Vertical Fund I, L.P., Vertical Fund II, L.P., KCH Stockholm AB, Alain Tornier, Warburg Pincus (Bermuda) Private Equity IX, L.P. and certain other shareholders, TMG has the right to designate three directors to be nominated to the Tornier board of directors for so long as TMG beneficially owns at least 25% of the outstanding Tornier ordinary shares, two directors for so long as TMG beneficially owns at least 10% but less than 25% of the outstanding Tornier ordinary shares and one director for so long as TMG beneficially owns at least 5% but less than 10% of the outstanding Tornier ordinary shares. Tornier agreed to use its reasonable best efforts to cause the TMG designees to be elected. As of February 10, 2015, TMG beneficially owned 21.9% of the outstanding Tornier ordinary shares. Mr. Carney and Ms. Weatherman are the current Tornier directors who are designees of TMG.
Under Tornier’s articles of association, Tornier’s internal rules for the board of directors and Dutch law, the members of the Tornier board of directors are collectively responsible for the management, general and financial affairs and policy and strategy of Tornier. Tornier’s executive director historically has been Tornier’s Chief Executive Officer, who is primarily responsible for managing Tornier’s day-to-day affairs as well as other responsibilities that have been delegated to the executive director in accordance with Tornier’s articles of association and Tornier’s internal rules for the board of directors. Tornier’s non-executive directors supervise Tornier’s Chief Executive Officer and Tornier’s general affairs and provide general advice to Tornier’s Chief Executive Officer. In performing their duties, Tornier’s directors are guided by the interests of Tornier and shall, within the boundaries set by relevant Dutch law, take into account the relevant interests of Tornier’s stakeholders. The internal affairs of the board of directors are governed by Tornier’s internal rules for the board of directors, a copy of which is available on the Investor Relations—Corporate Governance section of Tornier’s corporate website at www.tornier.com.
Mr. Carney serves as Tornier’s Chairman. The duties and responsibilities of the Chairman include, among others: determining the agenda and chairing the meetings of the Tornier board of directors, managing the Tornier board of directors to ensure that it operates effectively, ensuring that the members of the Tornier board of directors receive accurate, timely and clear information, encouraging active engagement by all the members of the Tornier board of directors, promoting effective relationships and open communication between non-executive directors and the executive director and monitoring effective implementation of Tornier board of directors decisions.
All regular meetings of the Tornier board of directors are scheduled to be held in the Netherlands. Each director has the right to cast one vote and may be represented at a meeting of the Tornier board of directors by a fellow director. The Tornier board of directors may pass resolutions only if a majority of the directors is present at the meeting and all resolutions must be passed by a majority of the directors that have no conflict of interest present or represented. However, as required by Dutch law, Tornier’s articles of association provide that when one or more members of the Tornier board of directors is absent or prevented from acting, the remaining members of the Tornier board of directors will be entrusted with the management of Tornier. The intent of this
130
Table of Contents
provision is to satisfy certain requirements under Dutch law and provide that, in rare circumstances, when a director is incapacitated, severely ill or similarly absent or prevented from acting, the remaining members of the Tornier board of directors (or, in the event there are no such remaining members, a person appointed by the Tornier shareholders at a general meeting) will be entitled to act on behalf of the Tornier board of directors in the management of Tornier, notwithstanding the general requirement that otherwise requires a majority of the Tornier board of directors be present. In these limited circumstances, Tornier’s articles of association permit the Tornier board of directors to pass resolutions even if a majority of the directors is not present at the meeting.
Subject to Dutch law and any director’s objection, resolutions may be passed in writing by a majority of the directors in office. Under Dutch law, members of the board of directors may not participate in the deliberation and the decision-making process on a subject or transaction in relation to which he or she has a direct or indirect personal interest that conflicts with the interest of Tornier and its business enterprise. If all directors are conflicted and in the absence of a supervisory board, the resolution shall be adopted by the general meeting of shareholders, except if the articles of association prescribe otherwise. Tornier’s articles of association provide that a director shall not take part in any vote on a subject or transaction in relation to which he or she has a direct or indirect personal interest that conflicts with the interest of Tornier and its business enterprise. In such event, the other directors shall be authorized to adopt the resolution. If all directors have a conflict of interest as mentioned above, the resolution shall be adopted by the non-executive directors.
Board Committees
The Tornier board of directors has four standing board committees: an audit committee, a compensation committee, a nominating, corporate governance and compliance committee and a strategic transactions committee. Each of these committees has the responsibilities and composition described below. The Tornier board of directors has adopted a written charter for each committee of the Tornier board of directors, which charters are available on the Investor Relations—Corporate Governance section of Tornier’s corporate website at www.tornier.com. The Tornier board of directors from time to time may establish other committees.
The following table summarizes the current membership of each of the four Board committees.
| Director |
Audit | Compensation | Nominating, corporate governance and compliance |
Strategic transactions | ||||
| David H. Mowry |
— | — | — | — | ||||
| Sean D. Carney |
— | Chair | Chair | Ö | ||||
| Kevin C. O’Boyle |
Ö | — | Ö | Chair | ||||
| Richard B. Emmitt |
Ö | — | — | Ö | ||||
| Alain Tornier |
— | — | — | — | ||||
| Richard F. Wallman |
Chair | Ö | — | — | ||||
| Elizabeth H. Weatherman |
— | Ö | — | — |
Audit Committee
Tornier’s audit committee oversees a broad range of issues surrounding Tornier’s accounting and financial reporting processes and audits of its financial statements. The primary responsibilities of the audit committee include:
| • | assisting the Tornier board of directors in monitoring the integrity of Tornier’s financial statements, its compliance with legal and regulatory requirements insofar as they relate to its financial statements and financial reporting obligations and any accounting, internal accounting controls or auditing matters, its independent auditor’s qualifications and independence and the performance of its internal audit function and independent auditors; |
| • | appointing, compensating, retaining and overseeing the work of any independent registered public accounting firm engaged for the purpose of performing any audit, review or attest services and for dealing directly with any such accounting firm; |
131
Table of Contents
| • | providing a medium for consideration of matters relating to any audit issues; |
| • | establishing procedures for the receipt, retention and treatment of complaints received by Tornier regarding accounting, internal accounting controls or auditing matters, and for the confidential, anonymous submission by its employees of concerns regarding questionable accounting or auditing matters; and |
| • | reviewing and approving all related party transactions required to be disclosed under the federal securities laws. |
The audit committee reviews and evaluates, at least annually, the performance of the audit committee and its members, including compliance of the committee with its charter.
The audit committee consists of Mr. Wallman (Chair), Mr. Emmitt and Mr. O’Boyle. Tornier believes that the composition of Tornier’s audit committee complies with the applicable rules of the SEC and the NASDAQ Global Select Stock Market. The Tornier board of directors has determined that each of Mr. Wallman, Mr. Emmitt and Mr. O’Boyle is an “audit committee financial expert,” as defined in the SEC rules, and satisfies the financial sophistication requirements of the NASDAQ Global Select Stock Market. The Tornier board of directors also has determined that each of Mr. Wallman, Mr. Emmitt and Mr. O’Boyle meets the more stringent independence requirements for audit committee members of Rule 10A-3(b)(1) under the Exchange Act and the Listing Rules of the NASDAQ Global Select Stock Market, and each of Mr. Wallman and Mr. O’Boyle is independent under the Dutch Corporate Governance Code.
Compensation Committee
The primary responsibilities of Tornier’s compensation committee, which are within the scope of the compensation policy adopted by the general meeting of the Tornier shareholders, include:
| • | reviewing and approving corporate goals and objectives relevant to the compensation of Tornier’s Chief Executive Officer and other executive officers, evaluating the performance of these officers in light of those goals and objectives and setting compensation of these officers based on such evaluations; |
| • | making recommendations to the Tornier board of directors with respect to incentive compensation and equity-based plans that are subject to board and shareholder approval, administering or overseeing all of Tornier’s incentive compensation and equity-based plans, and discharging any responsibilities imposed on the committee by any of these plans; |
| • | reviewing and discussing with management the “Compensation Discussion and Analysis” section of this report and based on such discussions, recommending to the Tornier board of directors whether the “Compensation Discussion and Analysis” section should be included in this report; |
| • | approving, or recommending to the Tornier board of directors for approval, the compensation programs, and the payouts for all programs, applying to Tornier’s non-executive directors, including reviewing the competitiveness of Tornier’s non-executive director compensation programs and reviewing the terms to make sure they are consistent with the Tornier board of directors compensation policy adopted by the general meeting of the Tornier shareholders; and |
| • | reviewing and discussing with Tornier’s Chief Executive Officer and reporting periodically to the Tornier board of directors plans for development and corporate succession plans for Tornier’s executive officers and other key employees. |
The compensation committee reviews and evaluates, at least annually, the performance of the compensation committee and its members, including compliance of the committee with its charter.
132
Table of Contents
The compensation committee consists of Mr. Carney (Chair), Mr. Wallman and Ms. Weatherman. Tornier believes that the composition of its compensation committee complies with the applicable rules of the SEC and the NASDAQ Global Select Stock Market. The Tornier board of directors has determined that each of Mr. Carney and Mr. Wallman and Ms. Weatherman meets the more stringent independence requirements for compensation committee members of Rule 10C-1 under the Exchange Act and the Listing Rules of the NASDAQ Global Select Stock Market. None of Tornier’s executive officers has served as a member of the Tornier board of directors or compensation committee of any entity that has an executive officer serving as a member of the Tornier board of directors.
Nominating, Corporate Governance and Compliance Committee
The primary responsibilities of Tornier’s nominating, corporate governance and compliance committee include:
| • | reviewing and making recommendations to the Tornier board of directors regarding the size and composition of the Tornier board of directors; |
| • | identifying, reviewing and recommending nominees for election as directors; |
| • | making recommendations to the Tornier board of directors regarding corporate governance matters and practices, including any revisions to Tornier’s internal rules for the Tornier board of directors; and |
| • | overseeing Tornier’s compliance efforts with respect to its legal, regulatory and quality systems requirements and ethical programs, including its code of business conduct and ethics, other than with respect to matters relating to its financial statements and financial reporting obligations and any accounting, internal accounting controls or auditing matters, which are within the purview of the audit committee. |
The nominating, corporate governance and compliance committee reviews and evaluates, at least annually, the performance of the nominating, corporate governance and compliance committee and its members, including compliance of the committee with its charter.
The nominating, corporate governance and compliance committee has the sole authority to select, retain, oversee and terminate its own counsel, consultants and advisors and approve the fees and other retention terms of such counsel, consultants and advisors, as it deems appropriate.
The nominating, corporate governance and compliance committee consists of Mr. Carney (Chair) and Mr. O’Boyle.
The nominating, corporate governance and compliance committee considers all candidates recommended by Tornier shareholders pursuant to those specific minimum qualifications that the nominating, corporate governance and compliance committee believes must be met by a recommended nominee for a position on the Tornier board of directors, which qualifications are described in the nominating, corporate governance and compliance committee’s charter, a copy of which is available on the Investor Relations—Corporate Governance section of our corporate website www.tornier.com. Tornier has made no material changes to the procedures by which Tornier shareholders may recommend nominees to the Tornier board of directors as described in Tornier’s most recent proxy statement.
Strategic Transactions Committee
The primary responsibilities of Tornier’s strategic transactions committee include:
| • | reviewing and evaluating potential opportunities for strategic business combinations, acquisitions, mergers, dispositions, divestitures, investments and similar strategic transactions involving Tornier or any one or more of its subsidiaries outside the ordinary course of its business that may arise from time to time; |
133
Table of Contents
| • | approving on behalf of the Tornier board of directors any strategic transaction that may arise from time to time and is deemed appropriate by the strategic transactions committee and involves total cash consideration of less than $5.0 million; provided, however, that the strategic transactions committee is not authorized to approve any strategic transaction involving the issuance of capital stock or in which any director, officer or affiliate of Tornier has a material interest; |
| • | making recommendations to the Tornier board of directors concerning approval of any strategic transactions that may arise from time to time and are deemed appropriate by the strategic transactions committee and are beyond the authority of the strategic transactions committee to approve; |
| • | reviewing integration efforts with respect to completed strategic transactions from time to time and making recommendations to management and the Tornier board of directors, as appropriate; |
| • | assisting management in developing, implementing and adhering to a strategic plan and direction for its activities with respect to strategic transactions and making recommendations to management and the Tornier board of directors, as appropriate; and |
| • | reviewing and evaluating potential opportunities for restructuring its business in response to completed strategic transactions or otherwise in an effort to realize anticipated cost and expense savings for, and other benefits, to Tornier and making recommendations to management and the Tornier board of directors, as appropriate. |
The strategic transactions committee reviews and evaluates periodically the performance of the committee and its members, including compliance of the committee with its charter.
The strategic transactions committee consists of Mr. O’Boyle (Chair), Mr. Carney and Mr. Emmitt.
Code of Business Conduct and Ethics
Tornier has adopted a code of business conduct and ethics, which applies to all of its directors, officers and employees. The code of business conduct and ethics is available on the Investor Relations—Corporate Governance section of Tornier’s corporate website at www.tornier.com. Any person may request a copy free of charge by writing to Kevin M. Klemz, Senior Vice President, Chief Legal Officer and Secretary, Tornier N.V., Prins Bernhardplein 200, 1097 JB Amsterdam, the Netherlands. Tornier intends to disclose on its website any amendment to, or waiver from, a provision of its code of business conduct and ethics that applies to directors and executive officers and that is required to be disclosed pursuant to the rules of the SEC and the NASDAQ Global Select Stock Market.
Section 16(a) Beneficial Ownership Reporting Compliance
Section 16(a) of the Exchange Act requires our directors and executive officers and all persons who beneficially own more than 10% of our outstanding ordinary shares to file with the SEC initial reports of ownership and reports of changes in ownership of our ordinary shares. Directors, executive officers and greater than 10% beneficial owners also are required to furnish us with copies of all Section 16(a) forms they file. To our knowledge, based on review of the copies of such reports and amendments to such reports furnished to us with respect to the year ended December 28, 2014, and based on written representations by our directors and executive officers, all required Section 16 reports under the Exchange Act for our directors, executive officers and beneficial owners of greater than 10% of our ordinary shares were filed on a timely basis during the year ended December 28, 2014.
134
Table of Contents
ITEM 11. EXECUTIVE COMPENSATION
Compensation Discussion and Analysis
In this Compensation Discussion and Analysis (“CD&A”), Tornier describes the key principles and approaches it uses to determine elements of compensation paid to, awarded to and earned by the following named executive officers, whose compensation is set forth in the Summary Compensation Table found later in this report:
| • | David H. Mowry, who serves as Tornier’s President, Chief Executive Officer and Executive Director and is referred to as Tornier’s “CEO” in this CD&A; |
| • | Shawn T McCormick, who serves as Tornier’s Chief Financial Officer; |
| • | Terry M. Rich, who serves as Tornier’s Senior Vice President, U.S. Commercial Operations. |
| • | Kevin M. Klemz, who serves as Tornier’s Senior Vice President, Chief Legal Officer and Secretary; |
| • | Gregory Morrison, who serves as Tornier’s Senior Vice President, Global Human Resources and HPMS; and |
This CD&A should be read in conjunction with the accompanying compensation tables, corresponding notes and narrative discussion, as they provide additional information and context to Tornier’s compensation disclosures.
Executive Summary
One of Tornier’s key executive compensation objectives is to link pay to performance by aligning the financial interests of Tornier’s executives with those of Tornier shareholders and by emphasizing pay for performance in Tornier’s compensation programs. Tornier believes it accomplishes this objective primarily through its annual cash incentive plan, which compensates executives for achieving annual corporate financial goals and, in the case of some executives, divisional financial goals and individual goals.
During 2014, Tornier made significant progress toward its strategic initiatives, including:
| • | The transition of its U.S. sales organization. Tornier spent 2014 executing Phase 2 of its U.S. sales organization strategy, which includes the alignment of its sales representatives to focus on either upper or lower extremity products, the optimization of its sales territory structures, the hiring of additional sales representatives to fill territories and the education and training of its sales teams. Tornier achieved its goal of dedicating approximately 85% of its sales representatives to selling either upper extremity products or lower extremity products across the territories they serve. Additionally, Tornier completed the training of over 225 additional sales representatives during 2014, thereby achieving its goal of training a total of 200 sales representatives by the end of 2014. |
| • | The continued advancement of its product portfolio. During 2014, Tornier continued to make progress on building and expanding its global product portfolio, including in particular its Aequalis Ascend Flex convertible shoulder system, which continued to receive positive feedback and strong surgeon support during 2014 as Tornier experienced an increased level of competitive conversions across a broad range of customers. |
Despite the disruption in Tornier’s U.S. sales channel as a result of the strategic initiative to establish separate sales channels that are individually focused on selling either upper extremity products or lower extremity products, Tornier’s 2014 financial performance was strong. Tornier’s total revenue was $345.0 million, representing growth of 11 percent over 2013 total revenue. Total extremities revenue was $286.7 million, also representing growth of 11 percent over 2013 total extremities revenue.
135
Table of Contents
Tornier’s 2014 financial performance had the following impact on its pay programs:
| • | Tornier’s adjusted total revenue, total extremities revenue and adjusted EBITDA substantially exceeded target goals, resulting in maximum or near maximum payouts for those goals under Tornier’s cash incentive plan. Tornier’s adjusted free cash flow was substantially below target and did not meet the threshold goal, resulting in no payout for that goal under Tornier’s cash incentive plan. Taking into account the weightings of the corporate performance goals, the total weighted average payout percentage applicable to the portion of the annual cash incentive bonus tied to corporate performance goals was 119% of target. |
| • | Executives with individual performance goals performed exceptionally well during 2014, resulting in a decision by the compensation committee to pay out for individual performance despite the fact that the threshold adjusted free cash flow metric was not met. |
| • | Overall 2014 plan payouts for named executive officers ranged from 115.2% to 137.6% of target. |
| • | Since most of Tornier’s executives’ pay is variable compensation tied to financial results or share price, and not fixed compensation, these cash incentive plan payouts, together with retention stock grants awarded to most of the named executive officers, resulted in actual total compensation for Tornier’s named executive officers above Tornier’s targeted range of 50th to 75th percentile of a group of similarly sized peer companies based on compensation benchmarking completed in 2014. |
On October 27, 2014, Tornier entered into an agreement and plan of merger with Wright Medical Group, Inc. pursuant to which, upon the terms and subject to the conditions set forth therein, an indirect wholly owned subsidiary of Tornier will merge with and into Wright, with Wright continuing as the surviving company and an indirect wholly owned subsidiary of Tornier following the transaction Upon completion of the merger, Tornier shareholders will own approximately 48% of the combined company on a fully diluted basis and Wright shareholders will own approximately 52%. Following the closing of the transaction, the combined company will conduct business as Wright Medical Group N.V. and. Robert J. Palmisano, Wright’s president and chief executive officer, will become president and chief executive officer of the combined company and David H. Mowry, Tornier’s president and chief executive officer, will become executive vice president and chief operating officer of the combined company. The transaction is subject to approval of Tornier and Wright shareholders, effectiveness of a Form S-4 registration statement filed by us with the Securities and Exchange Commission and regulatory approvals, and other customary closing conditions. The transaction is expected to be completed during the second or third quarter of 2015. Once completed, the proposed merger will constitute a “change in control” under Tornier’s stock incentive plan and executive employment agreements, resulting in immediate acceleration of vesting on all outstanding equity-based awards and change in control payments and benefits for those executives whose employment is terminated within 12 months of the completion of the merger. The change in control payments and benefits consist of a lump sum payment equal to one year of the executive’s base salary plus target bonus for the year of termination and health and welfare benefit continuation for 12 months.
Compensation Highlights and Best Practices
Tornier’s compensation practices include many best pay practices that support Tornier’s executive compensation objectives and principles, and benefit its shareholders, such as the following:
| • | Pay for performance. Tornier ties compensation directly to financial performance. Tornier’s annual cash incentive plan pays out only if certain minimum threshold levels of financial performance are met. For annual cash incentive awards, Tornier establishes threshold levels of performance for each performance measure that must be met for there to be a payout for that performance measure. |
| • | Bonus caps. Annual cash incentive awards have maximum levels of financial performance. At maximum or greater than maximum levels of performance, annual cash incentive plan payouts are capped at 150% of target. |
136
Table of Contents
| • | Performance measure mix. Tornier uses a mix of performance measures within its annual cash incentive plan, including total revenue, total extremities revenue, EBITDA and free cash flow, in each case as adjusted. |
| • | At-risk pay. A significant portion of executives’ compensation is “performance-based” or “at risk.” For 2014, 76% of target total direct compensation was performance-based for the CEO, and between 70% and 76% of target total direct compensation for other named executive officers was performance-based, assuming grant date fair values for equity awards. |
| • | Equity-based pay. A significant portion of executives’ compensation is “equity-based” and in the form of stock-based incentive awards. For 2014, 57% of target total direct compensation for the CEO and between 51% and 67% of target total direct compensation for other named executive officers was equity-based, assuming grant date fair values for equity awards. |
| • | LTI grant guidelines. The Tornier board of directors, upon recommendation of the compensation committee, each year adopts long-term incentive guidelines for the grant of equity awards to employees under the Tornier N.V. 2010 Incentive Plan and caps total equity award dilution at 2.3% per year. |
| • | Four-year vesting. Value received under long-term equity-based incentive awards is tied to four-year vesting and any value received by executives from stock option grants is contingent upon long-term stock price performance in that stock options have value only if the market value of Tornier ordinary shares exceeds the exercise price of the options. |
| • | Clawback policy. Tornier’s stock incentive plan and related award agreements include a “clawback” mechanism to recoup incentive compensation if it is determined that executives engaged in certain conduct adverse to Tornier’s interests. In addition, Tornier’s annual cash incentive plan also contains a clawback provision. |
| • | No tax gross-ups. Tornier does not provide tax “gross-up” payments in connection with any compensation, benefits or perquisites provided to executives. |
| • | Limited perquisites. Tornier provides only limited perquisites to its executives. |
| • | Stock ownership guidelines. Tornier maintains stock ownership guidelines for all of its executives. |
| • | No hedging or pledging. Tornier prohibits its executives from engaging in hedging transactions, such as short sales, transactions in publicly traded options, such as puts, calls and other derivatives, and pledging Tornier ordinary shares in any significant respect. |
Say-on-Pay Vote
At Tornier’s 2014 annual general meeting of shareholders, Tornier shareholders had the opportunity to provide an advisory vote on the compensation paid to Tornier’s named executive officers, or a “say-on-pay” vote. Of the votes cast by Tornier shareholders, over 99% were in favor of Tornier’s “say-on-pay” proposal. Accordingly, the compensation committee generally believes that these results affirmed shareholder support of Tornier’s approach to executive compensation and did not believe it was necessary to make; and therefore, Tornier has not made, any significant changes to its executive pay program solely in response to that vote. In accordance with the result of the advisory vote on the frequency of the say-on-pay vote, which was conducted at Tornier’s 2011 annual general meeting of shareholders, the Tornier board of directors has determined that Tornier will conduct an executive compensation advisory vote every three years. Accordingly, the next say-on-pay vote will occur in 2017 in connection with Tornier’s 2017 annual general meeting of shareholders.
137
Table of Contents
Compensation Objectives and Principles
Tornier’s executive compensation policies, plans and programs seek to enhance its profitability, and thus shareholder value, by aligning the financial interests of executives with those of Tornier shareholders and by emphasizing pay for performance. Specifically, Tornier’s executive compensation programs are designed to:
| • | Attract and retain executives important to the success of Tornier and the creation of value for Tornier shareholders. |
| • | Reinforce Tornier’s corporate mission, vision and values. |
| • | Align the interests of executives with the interests of Tornier shareholders. |
| • | Reward executives for progress toward Tornier’s corporate mission and vision, the achievement of company performance objectives, the creation of shareholder value in the short and long term and the executives’ general contributions to the success of Tornier. |
To achieve these objectives, the compensation committee makes pay decisions based on the following principles:
| • | Base salary and total compensation levels will generally be targeted within the range of the 50th to 75th percentile of a group of similarly-sized peer companies. However, the competitiveness of any individual executive’s salary will be determined considering factors like the executive’s skills and capabilities, contributions as a member of the executive management team and contributions to Tornier’s overall performance. Pay levels will also reflect the sufficiency of total compensation potential and structure to ensure the retention of an executive when considering the executive’s compensation potential that may be available elsewhere. |
| • | At least two-thirds of the CEO’s compensation and half of other executives’ compensation opportunity should be in the form of variable compensation that is tied to financial results or share price. |
| • | The portion of total compensation that is performance-based or at-risk should increase with an executive’s overall responsibilities, job level and compensation. However, compensation programs should not encourage excessive risk-taking by executives. |
| • | A primary emphasis should be placed on company performance as measured against goals approved by the compensation committee rather than on individual performance. |
| • | At least half of the CEO’s compensation and one-third of other executives’ compensation opportunity should be in the form of stock-based incentive awards. |
Executive Compensation Decision Making
Role of Compensation Committee and Board. The responsibilities of Tornier’s compensation committee include reviewing and approving corporate goals and objectives relevant to the compensation of executive officers, evaluating each executive’s performance in light of those goals and objectives and, either as a committee or together with the other directors, determining and approving each executive’s compensation, including performance-based compensation based on these evaluations (and, in the case of executives, other than the CEO, the CEO’s evaluation of such executive’s individual performance). Consistent with the Tornier shareholder-approved compensation policy for the Tornier board of directors, the compensation package for the CEO is determined by the non-executive directors, based upon recommendations from the compensation committee.
In setting or recommending executive compensation for named executive officers, the compensation committee considers the following primary factors:
| • | each executive’s position within the company and the level of responsibility; |
| • | the ability of the executive to impact key business initiatives; |
138
Table of Contents
| • | the executive’s individual experience and qualifications; |
| • | compensation paid to executives of comparable positions by companies similar to Tornier; |
| • | company performance, as compared to specific pre-established objectives; |
| • | individual performance, generally and as compared to specific pre-established objectives; |
| • | the executive’s current and historical compensation levels; |
| • | advancement potential and succession planning considerations; |
| • | an assessment of the risk that the executive would leave Tornier and the harm to its business initiatives if the executive left; |
| • | the retention value of executive equity holdings, including outstanding stock options and stock awards; |
| • | the dilutive effect on the interests of Tornier shareholders of long-term equity-based incentive awards; and |
| • | anticipated share-based compensation expense as determined under applicable accounting rules. |
The compensation committee also considers the recommendations of the CEO with respect to executive compensation to be paid to other executives. The significance of any individual factor described above in setting executive compensation will vary from year to year and may vary among Tornier’s executives. In making its final decision regarding the form and amount of compensation to be paid to Tornier’s named executive officers (other than the CEO), the compensation committee considers and gives great weight to the recommendations of the CEO recognizing that due to his reporting and otherwise close relationship with each executive, the CEO often is in a better position than the compensation committee to evaluate the performance of each executive (other than himself). In making its final decision regarding the form and amount of compensation to be paid to the CEO, the compensation committee considers the results of the CEO’s self-review and his individual annual performance review by the compensation committee, benchmarking data gathered by Mercer and the recommendations of Tornier’s non-executive directors. The CEO’s compensation is approved by Tornier’s non-executive directors, upon recommendation of the compensation committee.
Role of Management. Three members of Tornier’s executive team play a role in executive compensation process and regularly attend meetings of the compensation committee—the CEO, Senior Vice President, Global Human Resources and HPMS and Senior Vice President, Chief Legal Officer and Secretary. The CEO assists the compensation committee primarily by making formal recommendations regarding the amount and type of compensation to be paid to executives (other than himself). In making these recommendations, the CEO considers many of the same factors listed above that the compensation committee considers in setting executive compensation, including in particular the results of each executive’s annual performance review and the executive’s achievement of his or her individual management performance objectives established in connection with Tornier’s annual cash incentive plan, described below. The Senior Vice President, Global Human Resources and HPMS assists the compensation committee primarily by gathering compensation related data regarding executives and coordinating the exchange of this information and other executive compensation information among the members of the compensation committee, the compensation committee’s compensation consultant and management in anticipation of compensation committee meetings. The Senior Vice President, Chief Legal Officer and Secretary assists the compensation committee primarily by ensuring compliance with legal and regulatory requirements and educating the committee on executive compensation trends and best practices from a corporate governance perspective. Final deliberations and decisions regarding the compensation to be paid to each executive, however, are made by the Tornier board of directors or compensation committee without the presence of the executive.
Role of Consultant. The compensation committee has retained the services of Mercer to provide executive compensation advice. Mercer’s engagement by the compensation committee includes reviewing and advising on all significant aspects of executive compensation. This includes base salaries, short-term cash incentives and
139
Table of Contents
long-term equity incentives for executives, and cash compensation and long-term equity incentives for non-executive directors. At the request of the compensation committee, each year, Mercer recommends a peer group of companies, collects relevant market data from these companies to allow the compensation committee to compare elements of Tornier’s compensation program to those of its peers, provides information on executive compensation trends and implications for Tornier and makes other recommendations to the compensation committee regarding certain aspects of its executive compensation program. Tornier’s management, principally the Senior Vice President, Global Human Resources and HPMS and the chair of the compensation committee, regularly consult with representatives of Mercer before compensation committee meetings. A representative of Mercer is invited on a regular basis to attend, and periodically attends, meetings of the compensation committee. In making its final decision regarding the form and amount of compensation to be paid to executives, the compensation committee considers the information gathered by and recommendations of Mercer. The compensation committee values Mercer’s benchmarking information and input regarding best practices and trends in executive compensation matters.
Use of Peer Group and Other Market Data. To help determine appropriate levels of compensation for certain elements of Tornier’s executive compensation program, the compensation committee reviews annually the compensation levels of Tornier’s named executive officers and other executives against the compensation levels of comparable positions with companies similar to Tornier in terms of products, operations and revenues. The elements of Tornier’s executive compensation program to which the compensation committee “benchmarks” or uses to base or justify a compensation decision or to structure a framework for compensating executives include base salary, short-term cash incentive opportunity and long-term equity incentives. With respect to other elements of Tornier’s executive compensation program, such as perquisites, severance and change in control arrangements, the compensation committee benchmarks these elements on a periodic or as needed basis and in some cases uses peer group or market data more as a “market check” after determining the compensation on some other basis. The compensation committee believes that compensation paid by peer group companies is more representative of the compensation required to attract, retain and motivate Tornier’s executive talent than broader survey data and that compensation paid by peer companies that are in the same business, with similar products and operations, and with revenues in a range similar to Tornier, generally provides more relevant comparisons.
In February 2013, Mercer worked with the compensation committee to identify a peer group of 16 companies that the compensation committee approved. Companies in the peer group are public companies in the health care equipment and supplies business with products and operations similar to those of Tornier that had annual revenues generally within the range of one-half to two times Tornier’s annual revenues. The peer group included the following companies:
| Angiodynamics Inc. | Thoratec Corporation | Exactech, Inc. | ||
| Wright Medical Group, Inc. | Arthrocare Corporation | Cyberonics, Inc. | ||
| Volcano Corporation | Merit Medical Systems, Inc. | Alphatec Holdings, Inc. | ||
| Nuvasive, Inc. | ICU Medical, Inc. | Conceptus, Inc. | ||
| Orthofix International N.V. Masimo Corporation |
NxStage Medical, Inc. | RTI Biologics, Inc. |
140
Table of Contents
The table below sets forth revenue and market capitalization information regarding the peer group and Tornier’s position within the peer group as of October 2013, which was the date Mercer used to compile an executive compensation analysis that the compensation committee used in connection with its recommendations and decisions regarding executive compensation for 2014:
| Annual revenue (in millions) |
Market capitalization (in millions) |
|||||||
| 25th percentile |
$ | 248 | $ | 434 | ||||
| Median |
346 | 995 | ||||||
| 75th percentile |
421 | 1,267 | ||||||
| Tornier |
298 | 924 | ||||||
| Percentile rank |
38 | % | 47 | % | ||||
In reviewing benchmarking data, the compensation committee recognizes that benchmarking may not always be appropriate as a stand-alone tool for setting compensation due to aspects of Tornier’s business and objectives that may be unique to Tornier. Nevertheless, the compensation committee believes that gathering this information is an important part of its compensation-related decision-making process. However, where a sufficient basis for comparison does not exist between the peer group data and an executive, the compensation committee gives less weight to the peer group data. For example, relative compensation benchmarking analysis does not consider individual specific performance or experience or other case-by-case factors that may be relevant in hiring or retaining a particular executive.
Market Positioning. In general, Tornier targets base salary and total compensation levels within the range of the 50th to 75th percentile of its peer group. However, the specific competitiveness of any individual executive’s pay will be determined considering factors like the executive’s skills and capabilities, contributions as a member of the executive management team and contributions to Tornier’s overall performance. The compensation committee will also consider the sufficiency of total compensation potential and the structure of pay plans to ensure the hiring or retention of an executive when considering the compensation potential that may be available elsewhere.
Executive Compensation Components
The principal elements of Tornier’s executive compensation program for 2014 were:
| • | base salary; |
| • | short-term cash incentive compensation; |
| • | long-term equity-based incentive compensation, in the form of stock options and restricted stock unit awards; and |
| • | other compensation arrangements, such as benefits made generally available to Tornier’s other employees, limited and modest executive benefits and perquisites, and severance and change in control arrangements. |
In determining the form of compensation for Tornier’s named executive officers, the compensation committee views these elements of Tornier’s executive pay program as related but distinct. The compensation committee does not believe that significant compensation derived by an executive from one element of Tornier’s compensation program should necessarily result in a reduction in the amount of compensation the executive receives from other elements or that minimal compensation derived from one element should necessarily result in an increase in the amount the executive should receive from one or more other elements of compensation.
Except as otherwise described in this CD&A, the compensation committee has not adopted any formal or informal policies or guidelines for allocating compensation between long-term and currently paid out compensation, between cash and non-cash compensation, or among different forms of non-cash compensation.
141
Table of Contents
However, the compensation committee’s philosophy is to make a greater percentage of an executive’s compensation performance-based, and therefore at risk, as the executive’s position changes and responsibility increases given the influence more senior level executives generally have on company performance. Thus, individuals with greater roles and responsibilities associated with achieving Tornier’s objectives should bear a greater proportion of the risk that those goals are not achieved and should receive a greater proportion of the reward if objectives are met or surpassed. For example, this philosophy is illustrated by the higher annual cash incentive targets and long-term equity incentives of Tornier’s CEO compared to Tornier’s other executives. In addition, Tornier’s objective is that at least two-thirds of the CEO’s compensation and half of other executives’ compensation opportunity be in the form of variable compensation that is tied to financial results or share price and that at least half of the CEO’s compensation and one-third of other executives’ compensation opportunity be in the form of stock-based incentive awards.
The overall mix of annual base salaries, target annual cash incentive awards and grant date fair value long-term incentive awards as a percent of target total direct compensation for Tornier’s CEO and other named executive officers as a group for 2014 is provided below. The value of the long-term incentives represented is based on the grant date fair value of stock options and restricted stock unit awards granted during 2014. Actual long-term incentive value will be based on long-term stock price performance. Other compensation, including discretionary and contingent sign-on bonuses and perquisites, are excluded from the table below.
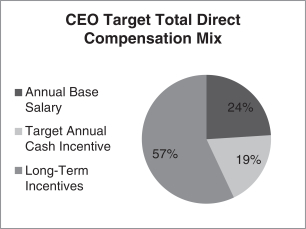
|
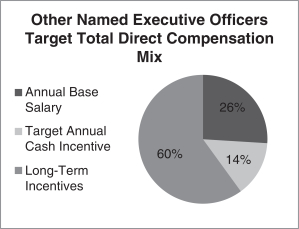
|
Base Salary
Overview. Tornier provides a base salary for its named executive officers that, unlike some of the other elements of its executive compensation program, is not subject to company or individual performance risk. Tornier recognizes the need for most executives to receive at least a portion of their total compensation in the form of a guaranteed base salary that is paid in cash regularly throughout the year. Base salary amounts are established under each executive’s employment agreement, and are subject to subsequent upward adjustments by the compensation committee, or in the case of any executive who is also a director, the Tornier board of directors, upon recommendation of the compensation committee.
Setting Initial Salaries for New Executives. Tornier initially fixes base salaries for executives at a level Tornier believes enables it to hire and retain them in a competitive environment and to reward satisfactory individual performance and a satisfactory level of contribution to its overall business objectives. Tornier did not hire any new executives during 2014.
Annual Salary Increases. Tornier reviews the base salaries of its named executive officers in the beginning of each year following the completion of its prior year individual performance reviews. If appropriate, Tornier may increase base salaries to recognize annual increases in the cost of living and superior individual performance
142
Table of Contents
and to ensure that its base salaries remain market competitive. Annual base salary increases as a result of cost of living adjustments and individual performance are referred to as “merit increases.” In addition, Tornier may make additional upward adjustments to an executive’s base salary to compensate the executive for assuming increased roles and responsibilities, to retain an executive at risk of recruitment by other companies, and/or to bring an executive’s base salary closer to the 50th to 75th percentile of companies in Tornier’s peer group. Tornier refers to these base salary increases as “market adjustments.”
The table below sets forth base salaries effective as of February 1, 2014, the percentage increases compared to 2013 base salaries, and the 2014 base salaries compared to the 50th percentile of Tornier’s peer group for each of Tornier’s named executive officers who were executives at the time of the merit increase:
| Name |
2014 base salary ($) |
2014 base salary % increase compared to 2013 |
2014 base salary compared to peer group 50th percentile |
|||||||||
| David H. Mowry |
$ | 550,000 | 22.2 | % | 6% below | |||||||
| Shawn T McCormick |
365,456 | 3.0 | % | 7% above | ||||||||
| Terry M. Rich |
369,694 | 2.8 | % | 13% above | ||||||||
| Kevin M. Klemz |
332,868 | 10.0 | % | 3% above | ||||||||
| Gregory Morrison |
300,002 | 8.6 | % | 13% above | ||||||||
The merit increases for Tornier’s named executive officers who were executives at the time of the increase in February 2014 ranged from 2.8% to 4.0% over 2013 base salaries. The percentage merit increase for a particular executive largely depends upon the results of the executive’s performance review for the previous year. In addition to merit increases, Mr. Mowry, Mr. Klemz and Mr. Morrison received market adjustments to their base salaries. In evaluating the performance of Mr. Mowry and the amount of his 2014 base salary increase, the compensation committee considered Mr. Mowry’s self-review, discussed his performance, considered the benchmarking data gathered by Mercer and sought the input from the non-executive directors. In assessing the performance of Mr. Mowry, the compensation committee evaluated primarily his ability to achieve his goals and objectives and lead the company. Mr. Mowry’s percentage increase in base salary was to bring his base salary closer to the 50th percentile. Even after such upward market adjustment, Mr. Mowry’s base salary was slightly below the 50th percentile. The market adjustment for Mr. Klemz was intended to bring his base salary closer to the 50th percentile and to compensate him for taking on additional responsibilities and the market adjustment for Mr. Morrison was intended to compensate him for taking on additional responsibilities.
2015 Base Salaries. In February 2015, Tornier set the following base salaries for 2015 for its named executive officers: Mr. Mowry ($572,000), Mr. McCormick ($377,333), Mr. Rich ($384,482), Mr. Klemz ($345,351) and Mr. Morrison ($312,002), representing merit increases between 3.25% and 4.0%. No upward market adjustments were made.
Short-Term Cash Incentive Compensation
Tornier’s short-term cash incentive compensation is paid as an annual cash payout under its corporate performance incentive plan. These payouts are intended to compensate executives, as well as other employees, for achieving annual corporate financial performance goals and, in some cases, divisional financial performance goals, and, in most cases, individual performance goals.
143
Table of Contents
Target Payout Percentages. Target payouts were established under each named executive officer’s employment agreement at the time the agreements were entered into and are currently as follows for each named executive officer:
| Name |
Percentage of base salary |
|||
| David H. Mowry |
80 | % | ||
| Shawn T McCormick |
50 | % | ||
| Terry M. Rich |
75 | % | ||
| Kevin M. Klemz |
40 | % | ||
| Gregory Morrison |
40 | % | ||
The 2014 target bonus percentages for Tornier’s named executive officers did not change from their 2013 levels. Based on an executive compensation analysis by Mercer in October 2013, the target bonus percentages for Tornier’s named executive officers were either at or below the 50th percentile for executives with similar positions in Tornier’s peer group, except in the case of Mr. Mowry, whose target bonus percentage of 80% is slightly above the 25th percentile and below the 50th percentile, Mr. Klemz whose target bonus percentage of 40% is below the 50th percentile, and Mr. Rich, whose target bonus percentage of 75% is above the 75th percentile. The compensation committee set Mr. Rich’s target bonus percentage at 75% to give him a competitive compensation package so Tornier could hire him from his prior employer.
Performance Goals and Actual Payouts. Payouts under Tornier’s corporate performance incentive plan to its named executive officers for 2014 were based upon achievement of corporate performance goals for all executives, divisional performance goals for one executive and individual performance goals for all executives, except Mr. Mowry and Mr. Rich.
| Named executive officer |
Percentage based upon corporate performance goals |
Percentage based upon divisional performance goals |
Percentage based upon individual performance goals |
|||||||||
| David H. Mowry |
100 | % | 0 | % | 0 | % | ||||||
| Shawn T McCormick |
90 | % | 0 | % | 10 | % | ||||||
| Terry Rich |
40 | % | 60 | % | 0 | % | ||||||
| Kevin M. Klemz |
80 | % | 0 | % | 20 | % | ||||||
| Gregory Morrison |
80 | % | 0 | % | 20 | % | ||||||
The corporate performance metrics and their weightings for 2014 are set forth in the table below. These four corporate performance metrics were selected for 2014 because they were determined to be the four most important indicators of Tornier’s financial performance for 2014 as evaluated by management and analysts. Extremities revenue was weighted most heavily since that was intended to be Tornier’s greatest focus in 2014.
| Corporate performance metric |
Weighting | |||
| Adjusted extremities revenue |
50 | % | ||
| Adjusted EBITDA |
20 | % | ||
| Adjusted free cash flow |
20 | % | ||
| Adjusted total revenue |
10 | % | ||
The table below sets forth the corporate performance goals for 2014, the range of possible payouts, and the actual payout percentage for Tornier’s named executive officers based on the actual performance achieved. In each case, the goals were adjusted for certain items, including changes to foreign currency exchange rates and items that are unusual and not reflective of normal operations. If performance falls below the threshold level, there is no payout for such performance metric. If performance falls between the threshold, target and maximum levels, actual payout percentages are determined on a sliding scale basis, with payouts for each performance metric starting at 50% of target for threshold performance and capped at 150% of target for maximum
144
Table of Contents
achievement. For 2014, the total weighted-average payout percentage applicable to the portion of the 2014 annual cash incentive bonus tied to corporate performance goals was 119.5% of target since actual performance exceeded target for all performance goals except the adjusted free cash flow goal.
| Performance goals(1) | ||||||||||||||||||||
| Performance metric |
Threshold (50% payout) |
Target (100% payout) |
Maximum (150% payout) |
2014 performance(2) |
2014 payout |
|||||||||||||||
| Adjusted extremities revenue(3) |
$ | 260.3 mil. | $ | 272.3 mil. | $ | 284.5 mil. | $ | 287.6 mil. | 150 | % | ||||||||||
| Adjusted EBITDA(4) |
24.8 mil. | 28.6 mil. | 35.1 mil. | 34.5 mil. | 145 | % | ||||||||||||||
| Adjusted free cash flow(5) |
(14.7) mil. | (11.0) mil. | (4.4) mil. | (31.2) mil. | 0 | % | ||||||||||||||
| Adjusted total revenue(6) |
311.0 mil. | 325.7 mil. | 340.3 mil. | 345.5 mil. | 150 | % | ||||||||||||||
| (1) | The performance goals were established based on an assumed foreign currency exchange rate. For revenue, Tornier assumed a foreign currency exchange rate of 1.277, which represented the actual reported average rate of foreign exchange in 2013. For all other performance goals, Tornier assumed a foreign currency exchange rate of 1.32 U.S. dollars for 1 Euro, which represented an anticipated average rate of foreign exchange for 2014 and which was the foreign currency exchange rate used by Tornier for 2014 budgeting purposes. |
| (2) | The compensation committee determined 2014 payouts after reviewing Tornier’s unaudited financial statements, which were adjusted for changes to foreign currency exchange rates and which were subject to additional discretionary adjustment by the compensation committee for items that are unusual and not reflective of normal operations. For purposes of determining 2014 payouts, in addition to foreign currency exchange rate adjustments, the compensation committee made additional adjustments discussed in the notes below. Accordingly, the figures included in the “2014 performance” column reflect foreign currency exchange rate and discretionary adjustments and differ from the figures reported in Tornier’s 2014 audited financial statements. |
| (3) | “Adjusted extremities revenue” means Tornier’s extremities revenue for 2014, as adjusted for changes to foreign currency exchange rates. |
| (4) | “Adjusted EBITDA” means Tornier’s net loss for 2014, as adjusted for changes to foreign currency exchange rates, before interest income and expense, income tax expense and benefit, depreciation and amortization, as adjusted further to give effect to, among other things, non-operating income and expense, foreign currency transaction gains and losses, share-based compensation, amortization of the inventory step-up from acquisitions and special charges including acquisition, integration and distribution transition costs, restructuring charges, and certain other items that affect the comparability and trend of Tornier’s operating results. |
| (5) | “Adjusted free cash flow” means cash flow generated from operations less instrument investments and plant, property and equipment investments, as adjusted for changes to foreign currency exchange rates. |
| (6) | “Adjusted total revenue” means Tornier’s total revenue for 2014, as adjusted for changes to foreign currency exchange rates. |
For 2014, since Mr. Rich is in charge of Tornier’s U.S. commercial operations, 60% of his corporate performance incentive plan 2014 payout was based on adjusted U.S. revenue. The table below sets forth Mr. Rich’s divisional performance goal for 2014, the range of possible payouts and the actual payout percentage applicable to the portion of the 2014 annual cash incentive bonus tied to Mr. Rich’s divisional performance goal based on actual performance achieved.
| Performance goals | ||||||||||||||||||||
| Performance metric |
Threshold (50% payout) |
Target (100% payout) |
Maximum (150% payout) |
2014 performance |
2014 payout |
|||||||||||||||
| Adjusted U.S. revenue |
$ | 182.1 mil. | $ | 187.7 mil. | $ | 196.1 mil. | $ | 199.3 mil. | 150 | % | ||||||||||
To foster cooperation and communication among executives, the compensation committee places primary emphasis on overall corporate and divisional performance goals rather than on individual performance goals. For
145
Table of Contents
named executive officers, at least 80% of their 2014 annual cash incentive plan payouts were determined based on the achievement of corporate and divisional performance goals and only 20% or less were based on achievement of individual performance goals. In addition, under the terms of the plan, no bonus payouts attributable to individual performance were to occur if the threshold adjusted cash flow corporate performance goal was not achieved. Executives with individual performance goals performed exceptionally well during 2014, resulting in a decision by the compensation committee to pay out for individual performance despite the fact that the threshold adjusted free cash flow metric was not met.
The individual performance goals used to determine payouts under Tornier’s corporate performance incentive plan are management by objectives, known internally as MBOs. MBOs are generally two to three written, specific and measurable objectives agreed to and approved by the executive, CEO and compensation committee in the beginning of the year. All MBOs were weighted, with areas of critical importance or critical focus weighted most heavily. Each of Tornier’s named executive officers participated in a review process during the beginning of 2015 and in connection with such review was rated (on a scale from one to four with a rating of three representing target or “on plan” performance) depending on whether, and at times, when, their MBOs for 2014 were achieved. These ratings were then used to determine the portion of the final bonus payout attributable to MBOs.
The MBOs for each named executive officer who had MBOs for 2014 are described in the table below. Most of the MBOs related primarily to the continued implementation of Tornier’s high performance management system (“HPMS”), which focuses executives’ efforts on Tornier’s vital programs, action items and objectives to work toward fulfilling its corporate mission, vision and values.
| Name |
2014 MBOs | |
| Shawn T McCormick |
• Financing alternatives analysis • Enterprise risk management readiness and deployment • Development of key performance indicators and monthly reporting dashboard | |
| Kevin M. Klemz |
• Global regulatory affairs organization improvements that align to Tornier’s global business strategies • Global legal function improvements | |
| Gregory Morrison |
• Timely and successful execution of HPMS vital few teams to include certain aspects intended to increase overall ratings within customer, employee and shareholder branches • Introduce and execute global human capital planning process that aligns to Tornier’s global business strategies • Drive specific human resources initiatives related to U.S. sales channel | |
The compensation committee determined that each of Messrs. McCormick, Klemz and Morrison achieved 87.5%, 112.5% and 100.0%, respectively, of their respective MBOs.
The table below sets forth, with respect to each named executive officer, the maximum potential bonus opportunity as a percentage of base salary and the actual bonus paid under the corporate performance incentive compensation plan for 2014, both in amount and as a percentage of 2014 base earnings:
| Name |
Maximum potential bonus as percentage of base salary |
Actual bonus paid ($) |
Actual bonus paid as a percentage of 2014 base earnings |
|||||||||
| David H. Mowry |
120% (150% of 80%) | $ | 513,999 | 95.2% | ||||||||
| Shawn T McCormick |
75% (150% of 50%) | 211,098 | 57.9% | |||||||||
| Terry M. Rich |
113% (150% of 75%) | 380,525 | 103.2% | |||||||||
| Kevin M. Klemz |
60% (150% of 40%) | 155,344 | 47.1% | |||||||||
| Gregory Morrison |
60% (150% of 40%) | 137,194 | 46.1% | |||||||||
146
Table of Contents
In December 2014, the compensation committee accelerated the payment of a portion of the corporate performance incentive plan payout anticipated to be paid to Mr. Mowry based on Tornier’s preliminary and unaudited financial performance during 2014. The intent in making the accelerated payment to Mr. Mowry was to eliminate or reduce excess parachute payments under Code Section 280G which in turn eliminates or reduces excise tax liabilities and allows a greater portion of compensation to be tax deductible by Tornier, assuming Tornier’s proposed merger with Wright Medical Group, Inc. would be completed during 2015. The amount accelerated was $330,000, which represented 75 percent of Mr. Mowry’s target bonus payout. The remainder of Mr. Mowry’s payout, which final payout reflected the above-target actual performance for 2014, was paid in February 2015 when other payouts were made.
Corporate Performance Incentive Plan for 2015. In February 2015, the Tornier board of directors, upon recommendation of the compensation committee, approved the material terms of the Tornier N.V. corporate performance incentive plan for 2015. In light of the proposed merger with Wright, the plan provides the compensation committee flexibility to shorten the plan year to a period less than the full fiscal year 2015. The 2015 target bonus percentages for named executive officers did not change from their 2014 levels, but payouts may be prorated depending upon the timing of the completion of the proposed merger with Wright. Consistent with the design for the 2014 plan, the payout under the 2015 corporate performance incentive plan for Tornier’s President and Chief Executive Officer will be based 100% upon achievement of corporate performance goals, with no divisional performance or individual performance components. The payouts for Tornier’s other named executive officers will be similar to 2014. The corporate performance measures under the plan for 2015 will be based on Tornier’s adjusted revenue (both total revenue and total extremities revenue), adjusted EBITDA and adjusted free cash flow. The divisional performance measures for 2015 will be based on adjusted U.S. revenue for Mr. Rich. The material terms of the plan for 2015 are otherwise the same as the plan for 2014.
Long-Term Equity-Based Incentive Compensation
Generally. The compensation committee’s primary objectives with respect to long-term equity-based incentives are to align the interests of executives with the long-term interests of Tornier shareholders, promote stock ownership and create significant incentives for executive retention. Long-term equity-based incentives typically comprise a significant portion of each named executive officer’s compensation package, consistent with Tornier’s executive compensation philosophy that at least half of the CEO’s compensation and one-third of other executives’ compensation opportunity should be in the form of stock-based incentive awards. For 2014, equity-based compensation comprised 57% of total compensation for Tornier’s CEO during the year and ranged from 51% to 67% of total compensation for Tornier’s other named executive officers, assuming grant date fair value for equity awards.
Before Tornier’s initial public offering in February 2011, Tornier granted stock options under Tornier’s prior stock option plan, which is now the Tornier N.V. Amended and Restated Stock Option Plan and referred to in this report as Tornier’s prior stock option plan. Since Tornier’s initial public offering, Tornier ceased making grants under Tornier’s prior stock option plan and subsequently has granted stock options and other equity-based awards under the Tornier N.V. 2010 Incentive Plan, which is referred to in this report as Tornier’s stock incentive plan or the 2010 plan. Both the Tornier board of directors and Tornier shareholders have approved Tornier’s stock incentive plan, under which named executive officers (as well as other executives and key employees) are eligible to receive equity-based incentive awards. For more information on the terms of Tornier’s stock incentive plan, see “Executive Compensation of Tornier—Grants of Plan-Based Awards—Tornier N.V. 2010 Incentive Plan.” All equity-based incentive awards granted to named executive officers during 2014 were made under Tornier’s stock incentive plan.
To assist the Tornier board of directors in granting, and the compensation committee and management in recommending the grant of, equity-based incentive awards, the compensation committee, in April 2014, on Mercer’s recommendation, adopted long-term incentive grant guidelines. In addition to long-term incentive grant guidelines, the Tornier board of directors adopted a stock grant policy document, which includes policies that the Tornier board of directors and compensation committee follow in connection with granting equity-based incentive awards, including the long-term incentive grant guidelines.
147
Table of Contents
Types of Equity Grants. Under Tornier’s long-term incentive grant guidelines and policy document, the Tornier board of directors, on recommendation of the compensation committee, generally grants three types of equity-based incentive awards to named executive officers: performance recognition grants, talent acquisition grants and special recognition grants. On limited occasion, the Tornier board of directors, on recommendation of the compensation committee, may grant purely discretionary awards. During 2014, performance recognition grants and discretionary grants were made to one or more of Tornier’s named executive officers, as described in more detail below under “—2014 Equity Awards.”
Performance recognition grants are discretionary annual grants that are made during mid-year to give the compensation committee another formal opportunity during the year to review executive compensation and recognize executive and other key employee performance. In July 2014, the performance recognition grants were approved by the Tornier board of directors, on recommendation of the compensation committee, but the grant date of the awards was effective as of the third full trading day after the release of Tornier’s second quarter earnings in August 2014. The recipients and size of the performance recognition grants were determined, on a preliminary basis, by each executive with input from their management team and based on Tornier’s long-term incentive grant guidelines and the 10-trading day average closing sale price of Tornier ordinary shares as reported by the NASDAQ Global Select Market. Grants were determined one week before the corporate approval of the awards, and then ultimately approved by the Tornier board of directors, on recommendation by the compensation committee. Under Tornier’s long-term incentive grant guidelines for annual performance recognition grants, named executive officers received a certain percentage of their respective base salaries in stock options and stock grant awards (in the form of restricted stock units and referred to as stock awards or RSUs in this CD&A and elsewhere in this report), as set forth in more detail in the table below.
Once the target total long-term equity value was determined for each executive based on the executive’s relevant percentage of base salary, half of the value was provided in stock options and the other half was provided in stock awards. The reasons why Tornier uses stock options and stock awards are described below under “—Stock Options” and “—Stock Awards.” The target dollar value to be delivered in stock options (50% of the target total long-term equity value) was divided by the Black-Scholes value of one Tornier ordinary share to determine the number of stock options, which then was rounded to the nearest whole number or in some cases multiple of 100. The number of stock awards was calculated using the intended dollar value (50% of the target total long-term equity value) divided by the 10-trading day average closing sale price of Tornier ordinary shares as reported by the NASDAQ Global Select Market and was determined one week before the date of anticipated corporate approval of the award, which number was then rounded to the nearest whole number or in some cases multiple of 100. Typically, the number of Tornier ordinary shares subject to stock awards is fewer than the number of Tornier ordinary shares that would have been covered by a stock option of equivalent target value. The actual number of stock options and stock awards granted may then be pared back so that the estimated run rate dilution under Tornier’s stock incentive plan is acceptable to the compensation committee (i.e., approximately 2.7% for 2014). The CEO next reviewed the preliminary individual awards and had the opportunity to make recommended discretionary adjustments. The proposed individual awards were then presented to the compensation committee, which also had the opportunity to make discretionary adjustments before recommending awards to the Tornier board of directors for approval. Neither the CEO nor the compensation committee made any discretionary adjustments to awards granted to the named executive officers during 2014. After board approval, awards were issued, with the exercise price of the stock options equal to the closing price of Tornier ordinary shares on the grant date. In determining the number of stock options or stock awards to make to an executive as part of a performance recognition grant, previous awards, whether vested or unvested, granted to such individual had no impact.
148
Table of Contents
The table below describes Tornier’s long-term incentive grant guidelines for annual performance recognition grants that applied to Tornier’s named executive officers for 2014.
| Named executive officer |
Grade level | Incentive grant guideline expressed as % of base salary for grade level |
Incentive grant guideline dollar value of long-term incentives ($) |
|||||||||
| David H. Mowry |
11 | 250 | % | $ | 1,375,000 | |||||||
| Shawn T McCormick |
9 | 125 | % | 450,985 | ||||||||
| Terry M. Rich |
8 | 125 | % | 462,118 | ||||||||
| Kevin M. Klemz |
8 | 125 | % | 416,085 | ||||||||
| Gregory Morrison |
8 | 125 | % | 375,003 | ||||||||
Consistent with the principle that the interests of Tornier’s executives should be aligned with those of its shareholders and that the portion of an executive’s total compensation that varies with performance and is at risk should increase with the executive’s level of responsibility, incentive grants, expressed as a percentage of base salary and dollar values, increase as an executive’s level of responsibility increases. The incentive grant guidelines were benchmarked by Mercer against Tornier’s peer group.
Performance recognition grants also may be made in connection with the promotion of an individual. When a performance recognition grant is made in connection with the promotion of an individual, the amount of the grant is usually based on the pro rata difference between the long-term incentive grant guideline for the new position compared to the long-term incentive grant guideline for the prior position. No promotional grants were made during 2014.
Talent acquisition grants are made in stock options and stock awards, and are used for new hires. These grants are considered and approved by the Tornier board of directors, upon recommendation of the compensation committee, as part of the executive’s compensation package at the time of hire (with the grant date and exercise price delayed until the hire date or the first open window period after board approval of the grant). As with Tornier’s performance recognition grants, the size of Tornier’s talent acquisition grants is determined by dollar amount (as opposed to number of underlying shares), and under Tornier’s long-term incentive grant guidelines, is generally two times the long-term incentive grant guidelines for annual performance recognition grants, as recommended by Mercer. Tornier recognizes that higher initial grants often are necessary to attract a new executive, especially one who may have accumulated a substantial amount of equity-based long-term incentive awards at a previous employer that would typically be forfeited upon acceptance of employment with Tornier. In some cases, Tornier may need to further increase a talent acquisition grant to attract an executive. No talent acquisitions grants were made during 2014.
In addition to Tornier’s annual and promotional performance recognition grants and talent acquisition grants, from time to time, Tornier may make special recognition grants or discretionary grants to executive officers for retention or other purposes. Such grants may vest based on the passage of time and/or the achievement of certain performance goals, such as those based on Tornier’s revenue, expenses, profitability, productivity, cash flows, asset utilization, shareholder return, share price and other similar performance measures. For example, as described in more detail below under “—2014 Equity Awards,” in February 2014, stock awards in the form of restricted stock units were granted to certain of Tornier’s executive officers, the vesting of which is based on the passage of time or, if earlier, the achievement of certain minimum share price triggers.
Stock Options. Historically, Tornier has granted stock options to named executive officers, as well as other key employees. Tornier believes that options effectively incentivize employees to maximize company performance, as the value of awards is directly tied to an appreciation in the value of Tornier ordinary shares. They also provide an effective retention mechanism because of vesting provisions. An important objective of Tornier’s long-term incentive program is to strengthen the relationship between the long-term value of Tornier ordinary shares and the potential financial gain for employees. Stock options provide recipients with the
149
Table of Contents
opportunity to purchase Tornier ordinary shares at a price fixed on the grant date regardless of future market price. The vesting of Tornier’s stock options is generally time-based. Consistent with Tornier’s historical practice, 25% of the shares underlying the stock option typically vest on the one-year anniversary of the grant date (or if later, on the hire date) and the remaining 75% of the underlying shares vest over a three-year period thereafter in 12 nearly equal quarterly installments. Tornier’s policy is to grant options only with an exercise price equal to or more than the fair market value of a Tornier ordinary share on the grant date.
Because stock options become valuable only if the share price increases above the exercise price and the option holder remains employed during the period required for the option to vest, they provide an incentive for an executive to remain employed. In addition, stock options link a portion of an employee’s compensation to the interests of Tornier shareholders by providing an incentive to achieve corporate goals and increase the market price of Tornier ordinary shares over the four-year vesting period.
Tornier times its option grants to occur on the third trading day after the public release of its financial results for its most recently ended quarter. As a Dutch company, Tornier must comply with Dutch insider trading laws which prohibit option grants when Tornier is aware of material nonpublic information.
Stock Awards. Stock awards are intended to retain key employees, including named executive officers, through vesting periods. Stock awards provide the opportunity for capital accumulation and more predictable long-term incentive value than stock options. All of Tornier’s stock awards are stock grants in the form of restricted stock units, which is a commitment by Tornier to issue Tornier ordinary shares at the time the stock award vests. The specific terms of vesting of a stock award depend on whether the award is a performance recognition grant or talent acquisition grant. Performance recognition grants of stock awards are made mid-year and vest in four annual installments on June 1st of each year. Talent acquisition grants of stock awards to new hires vest in a similar manner, except that the first installment is often pro-rated, depending on the grant date.
2014 Equity Awards. The Tornier board of directors, on recommendation of the compensation committee, made annual performance recognition grants and discretionary retention grants to one or more of Tornier’s named executive officers during 2014. The table below describes the annual performance recognition grants made to Tornier’s named executive officers in 2014 and the applicable long-term incentive grant guideline for such performance recognition grants for these executives.
| Named executive officer |
Stock options |
Stock awards |
Value of long-term incentive grant guideline(1) ($) |
|||||||||
| David H. Mowry |
66,373 | 30,009 | $ | 1,375,000 | ||||||||
| Shawn T McCormick |
22,051 | 9,970 | 450,985 | |||||||||
| Terry M. Rich |
22,307 | 10,085 | 462,118 | |||||||||
| Kevin M. Klemz |
20,085 | 9,081 | 416,085 | |||||||||
| Gregory Morrison |
18,102 | 8,184 | 375,003 | |||||||||
| (1) | The value per long-term incentive grant guideline of the annual performance recognition grants is based on the value calculated under Tornier’s long-term incentive grant guidelines and does not necessarily match the grant date fair value of the equity awards under applicable accounting rules and as set forth in the Grants of Plan Based Awards Table later in this report. |
In February 2014, stock grants, in the form of restricted stock units, were awarded to certain of Tornier’s executives, including four of Tornier’s named executive officers. The purpose of the grants was to retain and motivate Tornier’s executives in light of the fact that: (1) the continuity of Tornier’s executive team is important for executing Tornier’s current strategic plan; (2) such executives received minimal corporate performance incentive plan payouts for 2013; (3) the vast majority of previously granted stock options held by such executives were then currently “underwater” and thus offered minimal retention value; and (4) the outstanding long-term equity incentive value for Tornier’s executives is below the median for all positions compared to Tornier’s peer group and below the 25th percentile in some cases.
150
Table of Contents
The retention restricted stock units vest based on the passage of time, with 50% of the underlying shares vesting and becoming issuable on the two-year anniversary of the grant date, 25% on the three-year anniversary of the grant date and the remaining 25% on the four-year anniversary of the grant date, or, if earlier, upon the achievement of certain minimum share price triggers. The share price triggers were measured based on a 30-day average closing price of Tornier ordinary shares. In November 2014, a portion of these retention restricted stock units vested as a result of the trading price of Tornier ordinary shares.
The following named executive officers received the following number of retention restricted stock units: Mr. McCormick (12,500); Mr. Klemz (25,000); Mr. Morrison (25,000); and Mr. Rich (12,500). Mr. Mowry did not receive any retention restricted stock unit grants since it was his recommendation to make the grants, he did not recommend a grant for himself and the compensation committee did not believe he represented a retention risk. The number of retention restricted stock units granted to each named executive officer was determined based on a comparison of the value of their then current long-term equity incentives and their respective long-term incentive grant guideline.
Additional information concerning the long-term incentive compensation information for Tornier’s named executive officers for 2014 is included in the Summary Compensation Table and Grants of Plan-Based Awards Table later in this report.
All Other Compensation
Retirement Benefits. In 2014, each of Tornier’s named executive officers had the opportunity to participate in retirement plans maintained by Tornier’s operating subsidiaries, including its U.S. operating subsidiary’s 401(k) plan, on the same basis as Tornier’s other employees. Tornier believes that these plans provide an enhanced opportunity for executives to plan for and meet their retirement savings needs. Except for these plans, Tornier does not provide pension arrangements or post-retirement health coverage for its employees, including named executive officers. Tornier also does not provide any nonqualified defined contribution or other deferred compensation plans.
Perquisites and Other Benefits. Tornier’s named executive officers receive other benefits, which also are provided to Tornier’s other employees, including the opportunity to purchase Tornier ordinary shares at a discount with payroll deductions under Tornier’s tax-qualified employee stock purchase plan, and health, dental and life insurance benefits. Tornier provides additional modest perquisites to its named executive officers, only on a case-by-case basis.
Change in Control and Post-Termination Severance Arrangements
Change in Control Arrangements. To encourage continuity, stability and retention when considering the potential disruptive impact of an actual or potential corporate transaction, Tornier has established change in control arrangements, including provisions in its prior stock option plan, current stock incentive plan and written employment agreements with its executives and other key employees. These arrangements are designed to incentivize its executives to remain with Tornier in the event of a change in control or potential change in control. Tornier’s proposed merger with Wright will constitute a change in control under these arrangements.
Under the terms of Tornier’s current stock incentive plan and the individual award documents provided to recipients of awards under that plan, all stock options and stock awards become immediately vested (and, in the case of options, exercisable) upon the completion of a change in control of Tornier. For more information, see “Executive Compensation of Tornier—Potential Payments Upon Termination or Change in Control—Change in Control Arrangements—Generally.” Thus, the immediate vesting of stock options and stock awards is triggered by the change in control, itself, and thus is known as a “single trigger” change in control arrangement. Tornier believes its “single trigger” equity acceleration change in control arrangements provide important retention incentives during what can often be an uncertain time for employees. They also provide executives with
151
Table of Contents
additional monetary motivation to focus on and complete a transaction that the Tornier board of directors believes is in the best interests of the Tornier shareholders rather than to seek new employment opportunities. If an executive were to leave before the completion of the change in control, non-vested awards held by the executive would terminate.
In addition, Tornier has entered into employment agreements with its named executive officers and other officers to provide certain payments and benefits in the event of a change in control, most of which are payable only in the event their employment is terminated in connection with the change in control (“double-trigger” provisions). These change in control protections were initially offered to induce the executives to accept or continue employment with Tornier, provide consideration to executives for certain restrictive covenants that apply following termination of employment and provide continuity of management in connection with a threatened or actual change in control transaction. If an executive’s employment is terminated without cause or by the executive for “good reason” (as defined in the employment agreements) within 12 months following a change in control, the executive will be entitled to receive a lump sum payment equal to his or her base salary plus target bonus for the year of termination, health and welfare benefit continuation for 12 months following termination and accelerated vesting of all unvested options and stock awards. These arrangements, and a quantification of the payment and benefits provided under these arrangements, are described in more detail under “Executive Compensation of Tornier—Potential Payments Upon Termination or Change in Control—Change in Control Arrangements.” Other than the immediate acceleration of equity-based awards which Tornier believes aligns its executives’ interests with those of Tornier shareholders by allowing executives to participate fully in the benefits of a change in control as to all of their equity, in order for a named executive officer of Tornier to receive any other payments or benefits as a result of a change in control of Tornier, there must be a termination of the executive’s employment, either by Tornier without cause or by the executive for good reason. The termination of the executive’s employment by the executive without good reason will not give rise to additional payments or benefits either in a change in control situation or otherwise. Thus, these additional payments and benefits will not just be triggered by a change in control, but also will require a termination event not within the control of the executive, and thus are known as “double trigger” change in control arrangements. As opposed to the immediate acceleration of equity-based awards, Tornier believes that other change in control payments and benefits should properly be tied to termination following a change in control, given the intent that these amounts provide economic security to ease in the executive’s transition to new employment.
Tornier believes its change in control arrangements are an important part of its executive compensation program in part because they mitigate some of the risk for executives working in a smaller company where there is a meaningful likelihood that the company may be acquired. Change in control benefits are intended to attract and retain qualified executives who, absent these arrangements and in anticipation of a possible change in control of Tornier, might consider seeking employment alternatives to be less risky than remaining with Tornier through the transaction. Tornier believes that relative to the company’s overall value, Tornier’s potential change in control benefits are relatively small. Tornier confirms this belief by reviewing a tally sheet for each executive that summarizes the change in control and severance benefits potentially payable to each executive. Tornier also believes that the form and amount of such benefits are reasonable in light of those provided to executives by companies in Tornier’s peer group and other companies with which Tornier competes for executive talent and the amount of time typically required to find executive employment opportunities. Tornier, thus, believes it must continue to offer such protections in order to remain competitive in attracting and retaining executive talent.
Other Severance Arrangements. Each of Tornier’s named executive officers is entitled to receive severance benefits upon certain other qualifying terminations of employment, other than a change in control, pursuant to the provisions of such executive’s employment agreement. These severance arrangements were initially offered to induce the executives to accept or continue employment with Tornier and are primarily intended to retain Tornier’s executives and provide consideration to those executives for certain restrictive covenants that apply following termination of employment. Additionally, Tornier entered into the employment agreements because they provide Tornier valuable protection by subjecting the executives to restrictive covenants that prohibit the disclosure of confidential information during and following their employment and limit their ability to engage in
152
Table of Contents
competition with Tornier or otherwise interfere with its business relationships following their termination of employment. For more information on Tornier’s employment agreements and severance arrangements with its named executive officers, see the discussions below under “—Executive Compensation Tables and Narrative—Summary Compensation—Employment Agreements” and “—Potential Payments Upon a Termination or Change in Control.”
Stock Ownership Guidelines
In February 2014, Tornier established stock ownership guidelines that are intended to further align the interests of Tornier’s executive officers with those of its shareholders. Stock ownership targets for each of Tornier’s executive officers has been set at that number of Tornier ordinary shares with a value equal to a multiple of the executive’s annual base salary, with the multiple equal to three times for Tornier’s CEO and one and one-half times for Tornier’s other executive officers. Each of the executive officers has five years from the date of hire or, if the ownership multiple has increased during his or her tenure, five years from the date established in connection with such increase to reach his or her stock ownership targets. Until the applicable stock ownership target is achieved, each executive subject to the guidelines is required to retain an amount equal to 75% of the net shares received as a result of the exercise of stock options or the vesting of restricted stock units. If there is a significant decline in the price of Tornier’s ordinary shares that causes executives to be out of compliance, such executives will be subject to the 75% retention ratio, but will not be required to purchase additional shares to meet the applicable targets.
Tornier’s compensation committee reports on compliance with the guidelines at least annually to the Tornier board of directors. Stock ownership targets are evaluated and adjusted as necessary on January 1st each year and also whenever an executive’s annual base salary changes. As of January 1, 2015, all of Tornier’s executives met their respective individual stock ownership guideline.
Anti-Hedging and Pledging
Tornier’s code of conduct on insider trading and confidentiality prohibits Tornier’s executive officers from engaging in hedging transactions, such as short sales, transactions in publicly traded options, such as puts, calls and other derivatives, and pledging Tornier ordinary shares in any significant respect.
Clawback Policy
Tornier’s stock incentive plan and corporate performance incentive plan contain “clawback” provisions. Under Tornier’s stock incentive plan, if an executive is determined by the compensation committee to have taken action that would constitute “cause” or an “adverse action,” as those terms are defined in the plan, during or within one year after the termination of the executive’s employment, all rights of the executive under the plan and any agreements evidencing an award then held by the executive will terminate and be forfeited. In addition, the compensation committee may require the executive to surrender and return to Tornier any shares received, and/or to disgorge any profits or any other economic value made or realized by the executive in connection with any awards or any shares issued upon the exercise or vesting of any awards during or within one year after the termination of the executives employment or other service. Under Tornier’s corporate performance incentive plan, the compensation committee may require an executive to reimburse Tornier for incentive based compensation if: (a) the payment was predicated upon the achievement of certain financial results that were subsequently the subject of a material financial restatement, (b) in the compensation committee’s view, the executive engaged in fraud or misconduct that caused or partially caused the need for a material financial restatement, and (c) a lower payment would have occurred based upon the restated financial results.
153
Table of Contents
Compensation Committee Report
Tornier’s compensation committee has reviewed and discussed the foregoing “Compensation Discussion and Analysis” with Tornier’s management. Based on this review and these discussions, Tornier’s compensation committee has recommended to the Tornier board of directors that the foregoing “—Compensation Discussion and Analysis” be included in Tornier’s annual report on Form 10-K for the year ended December 28, 2014.
Compensation Committee
Sean D. Carney
Richard W. Wallman
Elizabeth H. Weatherman
Executive Compensation Tables and Narratives
Summary Compensation
The table below provides summary information concerning all compensation awarded to, earned by or paid to the individuals that served as Tornier’s principal executive officer and principal financial officer and other named executive officers for the years ended December 28, 2014, December 29, 2013 and December 30, 2012.
SUMMARY COMPENSATION TABLE—2014
| Name and principal position |
Year |
Salary(1) ($) |
Bonus(2) ($) |
Stock awards(3) ($) |
Option awards(4) ($) |
Non-equity incentive plan compensation(5) ($) |
All other compen- sation(6) ($) |
Total ($) |
||||||||||||||||||||||||
| David H. Mowry(7) President and Chief Executive Officer and Executive Director |
|
2014 2013 2012 |
|
|
548,613 444,334 341,591 |
|
|
— — — |
|
|
649,995 687,758 192,630 |
|
|
655,281 689,921 195,481 |
|
|
513,999 106,285 17,666 |
|
|
7,350 27,673 42,251 |
|
|
2,370,238 1,955,971 789,619 |
| ||||||||
| Shawn T McCormick(8) Chief Financial Officer |
|
2014 2013 2012 |
|
|
364,433 354,411 114,198 |
|
|
— — 75,000 |
|
|
456,450 240,848 354,488 |
|
|
217,703 241,636 357,207 |
|
|
211,098 47,686 5,710 |
|
|
4,773 3,707 — |
|
|
1,254,457 888,288 906,603 |
| ||||||||
| Terry M. Rich(9) Senior Vice President, U.S. Commercial Operations |
|
2014 2013 2012 |
|
|
368,726 358,823 282,468 |
|
|
— — — |
|
|
458,941 244,116 614,993 |
|
|
220,230 244,915 735,654 |
|
|
380,525 16,093 21,185 |
|
|
— — — |
|
|
1,428,422 863,947 1,654,300 |
| ||||||||
| Kevin M. Klemz Senior Vice President, Chief Legal Officer and Secretary |
|
2014 2013 2012 |
|
|
329,958 285,690 275,656 |
|
|
— — — |
|
|
677,694 127,903 205,410 |
|
|
198,293 129,805 206,091 |
|
|
155,344 22,825 28,825 |
|
|
7,350 7,350 6,904 |
|
|
1,368,639 573,573 722,886 |
| ||||||||
| Gregory Morrison(10) Senior Vice President, Global Human Resources and HPMS |
2014 | 297,730 | — | 658,265 | 178,716 | 137,194 | 6,954 | 1,278,859 | ||||||||||||||||||||||||
| (1) | During 2014 and from June 27, 2013 and through December 29, 2013, 5% of Mr. Mowry’s annual base salary was allocated to his service as a member of the Tornier board of directors. |
| (2) | Tornier generally does not pay any discretionary bonuses or bonuses that are subjectively determined and did not pay any such bonuses to any named executive officers in 2014. Annual cash incentive bonus payouts based on performance against pre-established performance goals under Tornier’s corporate performance incentive plan are reported in the “Non-equity incentive plan compensation” column. |
154
Table of Contents
| (3) | Amount reported represents the aggregate grant date fair value for stock awards granted to each named executive officer computed in accordance with FASB ASC Topic 718. The grant date fair value is determined based on the per share closing sale price of Tornier ordinary shares on the grant date. |
| (4) | Amount reported represents the aggregate grant date fair value for option awards granted to each named executive officer computed in accordance with FASB ASC Topic 718. The grant date fair value is determined based on Tornier’s Black-Scholes option pricing model. The table below sets forth the specific assumptions used in the valuation of each such option award: |
| Grant date |
Grant date fair value per share ($) |
Risk free interest rate |
Expected life |
Expected volatility |
Expected dividend yield |
|||||||||||||||
| 08/12/2014 |
9.87 | 1.90 | % | 6.10 years | 45.10 | % | 0 | |||||||||||||
| 08/09/2013 |
9.03 | 1.70 | % | 6.11 years | 46.58 | % | 0 | |||||||||||||
| 02/26/2013 |
7.92 | 1.00 | % | 6.11 years | 47.21 | % | 0 | |||||||||||||
| 09/04/2012 |
8.38 | 0.85 | % | 6.11 years | 48.03 | % | 0 | |||||||||||||
| 08/28/2012 |
8.30 | 0.95 | % | 6.25 years | 47.94 | % | 0 | |||||||||||||
| 08/10/2012 |
8.37 | 0.93 | % | 6.11 years | 48.14 | % | 0 | |||||||||||||
| 03/12/2012 |
11.04 | 1.20 | % | 6.11 years | 48.65 | % | 0 | |||||||||||||
| (5) | Represents amounts paid under Tornier’s corporate performance incentive plan. The amount reflected for each year reflects the amounts earned for that year but paid during the following year, except in the case of Mr. Mowry for 2014 when $330,000 of his target incentive payout was paid at the end of 2014. |
| (6) | The amounts shown in this column for 2014 include the following with respect to each named executive officer: |
| Name |
Retirement benefits(a) ($) |
Perquisites and other personal benefits(b) ($) |
Total ($) |
|||||||||
| Mr. Mowry |
7,350 | — | 7,350 | |||||||||
| Mr. McCormick |
4,773 | — | 4,773 | |||||||||
| Mr. Rich |
— | — | — | |||||||||
| Mr. Klemz |
7,350 | — | 7,350 | |||||||||
| Mr. Morrison |
6,954 | — | 6,954 | |||||||||
| (a) | Represents 401(k) matching contributions under the Tornier, Inc. 401(k) plan for Messrs. Mowry, McCormick, Klemz and Morrison. |
| (b) | Tornier does not generally provide perquisites and other personal benefits to its executive. Any perquisites or personal benefits actually provided to executive were less than $10,000 in the aggregate. |
| (7) | Mr. Mowry was appointed as President and Chief Executive Officer effective February 12, 2013, Interim President and Chief Executive Officer effective November 12, 2012 and prior to such position served as Chief Operating Officer effective July 20, 2011. |
| (8) | Mr. McCormick was appointed as Chief Financial Officer effective September 4, 2012. |
| (9) | Mr. Rich was appointed as Senior Vice President, U.S. Commercial Operations effective March 12, 2012. |
| (10) | Mr. Morrison was not a named executive officer during 2013 and 2012. |
Employment Agreements. Tornier, through one of its operating subsidiaries, typically executes employment agreements in conjunction with the hiring or promotion of an executive officer. Tornier’s named executive officers are generally compensated by the operating subsidiaries to which such named executive officers primarily provided services. Tornier, Inc., Tornier’s primary U.S. operating subsidiary, is a party to employment agreements with all of the named executive officers, which agreements are substantially the same, other than differences in base salary, target annual bonus percentages and severance. Each of the employment agreements has a specified term of three years and is subject to automatic renewal for one-year terms unless either Tornier or the executive provides 60 days’ advance notice of a desire not to renew the agreement. Under each of the agreements, each executive is entitled to a specified base salary, subject to increase but not decrease, is eligible to
155
Table of Contents
receive an annual cash bonus with a target bonus equal to a specified percentage of base salary, and is entitled to participate in the employee benefit plans and arrangements that Tornier generally maintains for its senior executives. The employment agreements also contain severance provisions which are described under “—Potential Payments Upon a Termination or Change in Control” and covenants intended to protect against the disclosure of confidential information during and following employment, as well as restrictions on engaging in competition with Tornier or otherwise interfering with its business relationships, which extend through the one-year anniversary of an executive’s termination of employment for any reason. With respect to certain executives, the employment agreements provide for certain limited additional benefits, which are described in more detail under “—Perquisites and Personal Benefits.”
Equity and Non-Equity Incentive Compensation. During 2014, Tornier’s named executive officers received grants of stock options and stock awards under Tornier’s stock incentive plan. These grants and Tornier’s stock incentive plan are described in more detail under “—Compensation Discussion and Analysis” and “—Grants of Plan-Based Awards.” Tornier’s named executive officers also received annual cash incentive bonuses under Tornier’s corporate performance incentive plan for their 2014 performance. The bonus amounts and these plans are described in more detail under “—Compensation Discussion and Analysis” and “—Grants of Plan-Based Awards.”
Retirement Benefits. Under the Tornier, Inc. 401(k) Plan, participants, including Tornier’s named executive officers, may voluntarily request that Tornier reduce his or her pre-tax compensation and contribute such amounts to the 401(k) plan’s trust up to certain statutory maximums. Tornier contributes matching contributions in an amount equal to 3% of the participant’s eligible earnings for a pay period, or if less, 50% of the participant’s pre-tax 401(k) contributions (other than catch-up contributions) for that pay period. Except for Tornier’s French operating subsidiary’s government-mandated pension plan and a government-mandated pension plan for managerial staff, Tornier does not provide pension arrangements or post-retirement health coverage for Tornier’s employees, including Tornier’s named executive officers. Tornier also does not provide any nonqualified defined contribution or other deferred compensation plans.
Perquisites and Personal Benefits. Tornier does not provide perquisites and personal benefits to its executives, other than housing or temporary living stipends to new executives and an automobile allowance to an executive who is not a named executive officer. The only benefits that Tornier’s named executive officers receive are benefits that are also received by Tornier’s other employees, including the retirement benefits described above, an ability to purchase Tornier ordinary shares at a discount with payroll deductions under Tornier’s employee stock purchase plan and medical, dental, vision and life insurance benefits.
Indemnification Agreements. Tornier has entered into indemnification agreements with all of its named executive officers. The indemnification agreements are governed by the laws of the State of Delaware (USA) and provide, among other things, for indemnification to the fullest extent permitted by law and Tornier’s articles of association against any and all expenses (including attorneys’ fees) and liabilities, judgments, fines and amounts paid in settlement actually and reasonably incurred by the executive or on his or her behalf in connection with such action, suit or proceeding and any appeal therefrom. Tornier will be obligated to pay these amounts only if the executive acted in good faith and in a manner he or she reasonably believed to be in or not opposed to the best interests of Tornier, and, with respect to any criminal action, suit or proceeding, had no reasonable cause to believe his or her conduct was unlawful. The indemnification agreements provide that the executive will not be indemnified and advanced expenses (i) with respect to an action, suit or proceeding initiated by the executive unless so authorized by the Tornier board of directors or (ii) with respect to any action, suit or proceeding instituted by the executive to enforce or interpret the indemnification agreement unless the executive is successful in establishing a right to indemnification in such action, suit or proceeding, in whole or in part, or unless and to the extent that the court in such action, suit or proceeding determines that, despite the executive’s failure to establish the right to indemnification, he or she is entitled to indemnity for such expenses. The indemnification agreements also set forth procedures that apply in the event of a claim for indemnification.
156
Table of Contents
Grants of Plan-Based Awards
The table below provides information concerning grants of plan-based awards to each of Tornier’s named executive officers during the year ended December 28, 2014. Non-equity incentive plan-based awards were granted to Tornier’s named executive officers under Tornier’s corporate performance incentive plan. Stock awards and option awards were granted under Tornier’s stock incentive plan. The material terms of these awards and the material plan provisions relevant to these awards are described in the notes to the table below or in the narrative following the table below. Tornier did not grant any “equity incentive plan” awards within the meaning of the SEC rules during the year ended December 28, 2014.
GRANTS OF PLAN-BASED AWARDS—2014
|
Estimated future payouts |
All other stock awards: number of shares of stock or units(5) (#) |
All other option awards: number of securities underlying options(6) (#) |
Exercise or base price of option awards ($/Sh) |
Grant date fair value stock and option awards(7) ($) |
||||||||||||||||||||||||||||||||
| Name |
Grant date |
Board approval date(1) |
Thres- hold(3) ($) |
Target ($) |
Maxi- mum(4) ($) |
|||||||||||||||||||||||||||||||
| David H. Mowry |
||||||||||||||||||||||||||||||||||||
| Cash incentive award |
N/A | 02/13/14 | 21,945 | 438,890 | 658,336 | |||||||||||||||||||||||||||||||
| Stock option |
08/12/14 | 07/22/14 | 66,373 | 21.66 | 655,281 | |||||||||||||||||||||||||||||||
| Stock grant |
08/12/14 | 07/22/14 | 30,009 | 649,995 | ||||||||||||||||||||||||||||||||
| Shawn T McCormick |
||||||||||||||||||||||||||||||||||||
| Cash incentive award |
N/A | 02/13/14 | 9,111 | 182,216 | 273,324 | |||||||||||||||||||||||||||||||
| Stock grant |
02/26/14 | 01/08/14 | 12,500 | 240,500 | ||||||||||||||||||||||||||||||||
| Stock option |
08/12/14 | 07/22/14 | 22,051 | 21.66 | 217,703 | |||||||||||||||||||||||||||||||
| Stock grant |
08/12/14 | 07/22/14 | 9,970 | 215,950 | ||||||||||||||||||||||||||||||||
| Terry M. Rich |
||||||||||||||||||||||||||||||||||||
| Cash incentive award |
N/A | 02/13/14 | 13,827 | 276,544 | 414,816 | |||||||||||||||||||||||||||||||
| Stock grant |
02/26/14 | 01/08/14 | 12,500 | 240,500 | ||||||||||||||||||||||||||||||||
| Stock option |
08/12/14 | 07/22/14 | 22,307 | 21.66 | 220,230 | |||||||||||||||||||||||||||||||
| Stock grant |
08/12/14 | 07/22/14 | 10,085 | 218,441 | ||||||||||||||||||||||||||||||||
| Kevin M. Klemz |
||||||||||||||||||||||||||||||||||||
| Cash incentive award |
N/A | 02/13/14 | 6,599 | 131,983 | 197,975 | |||||||||||||||||||||||||||||||
| Stock grant |
02/26/14 | 01/08/14 | 25,000 | 481,000 | ||||||||||||||||||||||||||||||||
| Stock option |
08/12/14 | 07/22/14 | 20,085 | 21.66 | 198,293 | |||||||||||||||||||||||||||||||
| Stock grant |
08/12/14 | 07/22/14 | 9,081 | 196,694 | ||||||||||||||||||||||||||||||||
| Gregory Morrison |
||||||||||||||||||||||||||||||||||||
| Cash incentive award |
N/A | 02/13/14 | 5,955 | 119,092 | 178,638 | |||||||||||||||||||||||||||||||
| Stock grant |
02/26/14 | 01/08/14 | 25,000 | 481,000 | ||||||||||||||||||||||||||||||||
| Stock option |
08/12/14 | 07/22/14 | 18,102 | 21.66 | 178,716 | |||||||||||||||||||||||||||||||
| Stock grant |
08/12/14 | 07/22/14 | 8,184 | 177,265 | ||||||||||||||||||||||||||||||||
| (1) | With respect to stock awards and option awards, the grant date was not necessarily the board approval date since the grant date was the third full trading day after the public release of Tornier’s then most recent financial results. With respect to newly hired officers, the grant date may be the first day of their employment. |
| (2) | Represents amounts payable under Tornier’s corporate performance incentive plan for 2014, which was approved by the Tornier board of directors on February 13, 2014. The actual amounts paid under the corporate performance incentive plan are reflected in the “Non-equity incentive compensation” column of the Summary Compensation Table. |
157
Table of Contents
| (3) | The threshold amount for awards payable under Tornier’s corporate performance incentive plan assumes the satisfaction of the threshold level of the lowest weighted financial performance goal. |
| (4) | Maximum amounts reflect payout of the portion of Tornier’s annual cash incentive bonus tied to corporate financial performance goals at a maximum rate of 150% of target and the portion of Tornier’s annual cash incentive bonus tied to individual performance goals at a rate of 100% of target under Tornier’s corporate performance incentive plan. |
| (5) | Represents stock grants in the form of restricted stock units granted under Tornier’s stock incentive plan. The restricted stock units granted on February 26, 2014 vest and become issuable over time, with the last tranche becoming issuable on February 26, 2018 or earlier if certain share price targets are met, and in each case, so long as the individual remains an employee or consultant of Tornier. The restricted stock units granted on August 12, 2014 vest and become issuable over time, with the last tranche becoming issuable on June 1, 2018, in each case, so long as the individual remains an employee or consultant of Tornier. |
| (6) | Represents options granted under Tornier’s stock incentive plan. All options have a ten-year term and vest over a four-year period, with 25% of the underlying shares vesting on the one-year anniversary of the grant date and the remaining 75% of the underlying shares vesting over a three-year period thereafter in 12 as nearly equal as possible quarterly installments. |
| (7) | See notes (3) and (4) to the Summary Compensation Table for a discussion of the assumptions made in calculating the grant date fair value of stock awards and option awards. |
Tornier N.V. Corporate Performance Incentive Plan. Under the terms of the Tornier N.V. corporate performance incentive plan, Tornier’s named executive officers, as well as other employees of Tornier, earn annual cash incentive bonuses based on Tornier’s financial performance and individual objectives. The material terms of the plan are described in detail under “—Compensation Discussion and Analysis—Short-Term Cash Incentive Compensation.”
Tornier N.V. 2010 Incentive Plan. At Tornier’s general meeting of shareholders on August 26, 2010, the Tornier shareholders approved the Tornier N.V. 2010 incentive plan, which permits the grant of a wide variety of equity awards to Tornier’s employees, including Tornier’s employees, directors and consultants, including incentive and non-qualified options, stock appreciation rights, stock grants, stock unit grants, cash-based awards and other stock-based awards. Tornier’s stock incentive plan is designed to assist Tornier in attracting and retaining Tornier’s employees, directors and consultants, provide an additional incentive to such individuals to work to increase the value of Tornier ordinary shares, and provide such individuals with a stake in Tornier’s future which corresponds to the stake of each of the Tornier shareholders.
The Tornier shareholders approved an amendment to the stock incentive plan on June 27, 2012 to increase the number of Tornier ordinary shares available for issuance under the plan. The stock incentive plan, as amended, reserves for issuance a number of Tornier ordinary shares equal to the sum of (i) the number of Tornier ordinary shares available for grant under Tornier’s prior stock option plan as of February 2, 2011 (not including issued or outstanding shares granted pursuant to options under Tornier’s prior stock option plan as of such date); (ii) the number of Tornier ordinary shares forfeited upon the expiration, cancellation, forfeiture, cash settlement or other termination following February 2, 2011 of an option outstanding as of February 2, 2011 under Tornier’s prior stock option plan; and (iii) 2.7 million. As of December 28, 2014, 1.6 million Tornier ordinary shares remained available for grant under the stock incentive plan, and there were 6.1 million Tornier ordinary shares covering outstanding awards under such plan as of such date. For purposes of determining the remaining Tornier ordinary shares available for grant under the stock incentive plan, to the extent that an award expires or is cancelled, forfeited, settled in cash, or otherwise terminated without a delivery to the participant of the full number of Tornier ordinary shares to which the award related, the undelivered Tornier ordinary shares will again be available for grant. Similarly, Tornier ordinary shares withheld or surrendered in payment of an exercise price or taxes relating to an award under the stock incentive plan will be deemed to constitute shares not delivered to the participant and will be deemed to again be available for awards under the stock incentive plan. The total number of Tornier ordinary shares available for issuance under the stock incentive plan and the number of Tornier ordinary shares subject to outstanding awards are subject to adjustment in the event of any reorganization, merger, consolidation, recapitalization, liquidation, reclassification, stock dividend, stock split, combination of shares, rights offering, divestiture or extraordinary dividend (including a spin off) or any other similar change in Tornier’s corporate structure or Tornier ordinary shares.
158
Table of Contents
The Tornier board of directors has the ability to amend the stock incentive plan or any awards granted thereunder at any time, provided that, certain amendments are subject to approval by Tornier shareholders and subject to certain exceptions, no amendment may adversely affect any outstanding award without the consent of the affected participant. The Tornier board of directors also may suspend or terminate the stock incentive plan at any time, and, unless sooner terminated, the stock incentive plan will terminate on August 25, 2020.
Under the terms of the stock incentive plan, stock options must be granted with a per share exercise price equal to at least 100% of the fair market value of a Tornier ordinary share on the grant date. For purposes of the plan, the fair market value of a Tornier ordinary share is the closing sale price of Tornier ordinary shares, as reported by the NASDAQ Global Select Market. Tornier sets the per share exercise price of all stock options granted under the plan at an amount at least equal to 100% of the fair market value of Tornier ordinary shares on the grant date. Options become exercisable at such times and in such installments as may be determined by the Tornier board of directors or compensation committee, provided that most options may not be exercisable after 10 years from their grant date. The vesting of Tornier’s stock options is generally time-based and is as follows: 25% of the shares underlying the stock option vest on the one-year anniversary of the grant date and the remaining 75% of the underlying shares vest over a three-year period thereafter in 12 as nearly equal as possible quarterly installments, in each case so long as the individual remains an employee or consultant of Tornier.
Currently, optionees must pay the exercise price of stock options in cash, except that Tornier’s compensation committee may allow payment to be made (in whole or in part) by a “cashless exercise” effected through an unrelated broker through a sale on the open market, by a “net exercise” of the option, or by a combination of such methods. In the case of a “net exercise” of an option, Tornier will not require a payment of the exercise price of the option from the grantee but will reduce the number of Tornier ordinary shares issued upon the exercise by the largest number of whole shares that has a fair market value that does not exceed the aggregate exercise price for the shares exercised under this method.
Under the terms of the grant certificates under which stock options have been granted to the named executive officers, if an executive’s employment or service with Tornier terminates for any reason, the unvested portion of the option will immediately terminate and the executive’s right to exercise the then vested portion of the option will: (i) immediately terminate if the executive’s employment or service relationship with Tornier terminated for cause; (ii) continue for a period of one year if the executive’s employment or service relationship with Tornier terminated as a result of his or her death or disability; or (iii) continue for a period of 90 days if the executive’s employment or service relationship with Tornier terminated for any reason, other than for cause or upon death or disability.
Stock grants under the plan are made in the form of restricted stock units and assuming the recipient continuously provides services to Tornier (whether as an employee or as a consultant) typically vest and the Tornier ordinary shares underlying such grants are issued over time. The specific terms of vesting of a stock grant depend upon whether the award is a performance recognition grant, talent acquisition grant, special recognition grant or discretionary grant. Performance recognition grants are typically made in mid-year and vest, or become issuable, in four as nearly equal as possible annual installments on June 1st of each year. Promotional performance recognition grants and talent acquisition grants granted to promoted employees and new employees and special recognition grants vest in a similar manner, except that the first installment is pro-rated, depending upon the grant date. Grants also may vest upon the achievement of certain financial performance goals, such as those based on revenue, expenses, profitability, productivity, cash flows, asset utilization, shareholder return, share price and other similar financial performance measures, or individual performance goals.
As a condition of receiving stock options or stock grants, recipients, including Tornier’s named executive officers, must agree to pay all applicable tax withholding obligations in connection with the awards. With respect to stock grants, Tornier’s executives must agree to pay in cash all applicable tax withholding obligations, or alternatively, may give instructions to, and authorize, any brokerage firm determined acceptable to Tornier for
159
Table of Contents
such purpose to sell on the executive’s behalf that number of Tornier ordinary shares issuable upon vesting of the stock grant as Tornier determine to be appropriate to generate cash proceeds sufficient to satisfy any applicable tax withholding obligation.
As described in more detail under “—Potential Payments Upon Termination or Change in Control,” if a change in control of Tornier occurs, then, under the terms of Tornier’s stock incentive plan, all outstanding options become immediately exercisable in full and remain exercisable for the remainder of their terms and all issuance conditions on all outstanding stock grants will be deemed satisfied; provided, however, that if any such issuance condition relates to satisfying any performance goal and there is a target for the goal, the issuance condition will be deemed satisfied generally only to the extent of the stated target.
160
Table of Contents
Outstanding Equity Awards at Fiscal Year-End
The table below provides information regarding unexercised stock options and stock awards that have not vested for each of Tornier’s named executive officers that remained outstanding at Tornier’s fiscal year-end, December 28, 2014. Tornier did not have any “equity incentive plan” awards within the meaning of the SEC rules outstanding on December 28, 2014.
OUTSTANDING EQUITY AWARDS AT FISCAL YEAR-END—2014
| Option awards | Stock awards | |||||||||||||||||||||||
| Name |
Number of securities underlying unexercised options (#) exercisable |
Number of securities underlying unexercised options (#) unexercisable(1) |
Option exercise price ($) |
Option expiration date(2) |
Number of shares or units of stock that have not vested(3) (#) |
Market value of shares or units that have not vested(4) ($) |
||||||||||||||||||
| David H. Mowry |
|
39,398 13,142 |
|
|
9,092 10,223 |
|
|
23.61 18.04 |
|
|
08/12/2021 08/10/2022 |
|
||||||||||||
| 7,641 | 9,825 | 17.28 | 02/26/2023 | |||||||||||||||||||||
| 19,080 | 41,977 | 19.45 | 08/09/2023 | |||||||||||||||||||||
| — | 66,373 | 21.66 | 08/12/2024 | |||||||||||||||||||||
| 66,750 | 1,699,455 | |||||||||||||||||||||||
| Shawn T McCormick |
23,987 | 18,658 | 18.15 | 09/04/2022 | ||||||||||||||||||||
| 8,357 | 18,388 | 19.45 | 08/09/2023 | |||||||||||||||||||||
| — | 22,051 | 21.66 | 08/12/2024 | |||||||||||||||||||||
| 36,088 | 918,800 | |||||||||||||||||||||||
| Terry M. Rich |
38,286 | 17,404 | 23.36 | 03/12/2022 | ||||||||||||||||||||
| 8,124 | 6,319 | 18.04 | 08/10/2022 | |||||||||||||||||||||
| 8,471 | 18,637 | 19.45 | 08/09/2023 | |||||||||||||||||||||
| — | 22,307 | 21.66 | 08/12/2024 | |||||||||||||||||||||
| 35,682 | 908,464 | |||||||||||||||||||||||
| Kevin M. Klemz |
83,333 | — | 22.50 | 09/13/2020 | ||||||||||||||||||||
| 15,137 | 2,173 | 25.20 | 05/12/2021 | |||||||||||||||||||||
| 8,727 | 6,788 | 18.04 | 08/10/2022 | |||||||||||||||||||||
| 7,128 | 15,682 | 19.45 | 08/09/2023 | |||||||||||||||||||||
| — | 20,085 | 21.66 | 08/12/2024 | |||||||||||||||||||||
| 34,698 | 883,411 | |||||||||||||||||||||||
| Gregory Morrison |
83,333 | — | 22.50 | 12/16/2020 | ||||||||||||||||||||
| 14,185 | 2,035 | 25.20 | 05/12/2021 | |||||||||||||||||||||
| 8,159 | 6,346 | 18.04 | 08/10/2022 | |||||||||||||||||||||
| 6,510 | 14,323 | 19.45 | 08/09/2023 | |||||||||||||||||||||
| — | 18,102 | 21.66 | 08/12/2024 | |||||||||||||||||||||
| 32,778 | 834,528 | |||||||||||||||||||||||
| (1) | All stock options vest over a four-year period, with 25% of the underlying shares vesting on the one-year anniversary of the grant date and the remaining 75% of the underlying shares vesting over a three-year period thereafter in 12 as nearly equal as possible quarterly installments, in each case so long as the individual remains an employee or consultant of Tornier. If a change in control of Tornier occurs, all outstanding options become immediately exercisable in full and remain exercisable for the remainder of their terms. For more information, see the discussion under “—Potential Payments Upon Termination or Change in Control.” |
161
Table of Contents
| (2) | All option awards have a 10-year term, but may terminate earlier if the recipient’s employment or service relationship with Tornier terminates. |
| (3) | The release dates and release amounts for the unvested stock awards are as follows: |
| Name |
06/01/15 | 06/01/16 | 02/26/17 | 06/01/17 | 02/26/18 | 06/01/18 | ||||||||||||||||||
| Mr. Mowry |
24,777 | 19,900 | 0 | 14,570 | 0 | 7,503 | ||||||||||||||||||
| Mr. McCormick |
10,877 | 10,880 | 3,125 | 5,588 | 3,125 | 2,493 | ||||||||||||||||||
| Mr. Rich |
13,941 | 7,310 | 3,125 | 5,659 | 3,125 | 2,522 | ||||||||||||||||||
| Mr. Klemz |
8,333 | 6,683 | 6,250 | 4,911 | 6,250 | 2,271 | ||||||||||||||||||
| Mr. Morrison |
7,659 | 6,115 | 6,250 | 4,458 | 6,250 | 2,046 | ||||||||||||||||||
If a change in control of Tornier occurs, all issuance conditions on all outstanding stock grants will be deemed satisfied; provided, however, that if any such issuance condition relates to satisfying any performance goal and there is a target for the goal, the issuance or condition will be deemed satisfied generally only to the extent of the stated target. In addition, the stock awards granted in February 2014, which are scheduled to vest on February 26, 2017 and February 26, 2018, may vest earlier if certain share price targets are met.
| (4) | The market value of stock grants that had not vested as of December 28, 2014 is based on the per share closing sale price of Tornier ordinary shares, as reported by the NASDAQ Global Select Market, on the last trading day of Tornier’s fiscal year end, December 26, 2014 ($25.46). |
Options Exercised and Stock Vested During Fiscal Year
The table below provides information regarding stock options that were exercised by Tornier’s named executive officers and stock awards that vested for each of Tornier’s named executive officers during the fiscal year ended December 28, 2014.
| Option awards(1) | Stock awards(2) | |||||||||||||||
| Name |
Number of shares acquired on exercise (#) |
Value realized on exercise ($) |
Number of shares acquired on vesting (#) |
Value realized on vesting ($) |
||||||||||||
| David H. Mowry |
||||||||||||||||
| Stock options |
— | — | ||||||||||||||
| Restricted stock units |
17,273 | 371,542 | ||||||||||||||
| Shawn T McCormick |
||||||||||||||||
| Stock options |
— | — | ||||||||||||||
| Restricted stock units |
14,634 | 340,278 | ||||||||||||||
| Terry M. Rich |
||||||||||||||||
| Stock options |
— | — | ||||||||||||||
| Restricted stock units |
17,668 | 405,539 | ||||||||||||||
| Kevin M. Klemz |
||||||||||||||||
| Stock options |
— | — | ||||||||||||||
| Restricted stock units |
18,562 | 450,269 | ||||||||||||||
| Gregory Morrison |
||||||||||||||||
| Stock options |
535 | 2,375 | ||||||||||||||
| Restricted stock units |
18,113 | 440,611 | ||||||||||||||
| (1) | The number of shares acquired upon exercise reflects the gross number of shares acquired absent netting for shares surrendered to pay the option exercise price and/or satisfy tax withholding requirements. The value realized on exercise represents the gross number of shares acquired on exercise multiplied by the market price of Tornier ordinary shares on the exercise date, as reported by the NASDAQ Global Select Market, less the per share exercise price. |
162
Table of Contents
| (2) | The number of shares acquired upon vesting reflects the gross number of shares acquired absent netting of shares surrendered or sold to satisfy tax withholding requirements. The value realized on vesting of the restricted stock unit awards held by each of the named executive represents the gross number of Tornier ordinary shares acquired, multiplied by the closing sale price of Tornier ordinary shares, as reported by the NASDAQ Global Select Market, on the vesting date or the last trading day prior to the vesting date if the vesting date is not a trading day. |
Potential Payments Upon a Termination or Change in Control
Severance Arrangements—Generally. Tornier Inc., Tornier’s primary U.S. operating subsidiary, is a party to employment agreements with each of Tornier’s named executive officers, which agreements provide for certain severance protections. Under such agreements, if the executive’s employment is terminated by Tornier, Inc. without “cause” (as such term is defined in the employment agreements), in addition to any accrued but unpaid salary and benefits through the date of termination, the executive will be entitled to base salary and health and welfare benefit continuation for 12 months following termination, and, in the event the executive’s employment is terminated without cause due to non-renewal of the employment agreements by Tornier, Inc., the executive also will be entitled to a payment equal to his or her pro rata annual bonus for the year of termination.
Change in Control Arrangements—Generally. Under the terms of the employment agreements Tornier Inc. has entered into with each of the named executive officers, in the event the executive’s employment is terminated without cause or by the executive for “good reason” (as such term is defined in the employment agreements) within 12 months following a change in control, the executive will be entitled to receive accrued but unpaid salary and benefits through the date of termination, a lump sum payment equal to his base salary plus target bonus for the year of termination, health and welfare benefit continuation for 12 months following termination and accelerated vesting of all unvested options and stock grants.
In addition to the change in control severance protections provided in the employment agreements with Tornier’s executives, Tornier’s prior stock option plan and Tornier’s current stock incentive plan under which stock options and stock grants have been granted to Tornier’s named executive officers contain “change in control” provisions. Under Tornier’s prior stock option plan and current stock incentive plan, if there is a change in control of Tornier, then, all outstanding options become immediately exercisable in full and remain exercisable for the remainder of their terms and all issuance conditions on all outstanding stock grants will be deemed satisfied; provided, however, that if any such issuance condition relates to satisfying any performance goal and there is a target for the goal, the issuance condition will be deemed satisfied generally only to the extent of the stated target. Alternatively, the compensation committee may determine that outstanding awards will be cancelled as of the consummation of the change in control and that holders of cancelled awards will receive a payment in respect of such cancellation based on the amount of per share consideration being paid in connection with the change in control less, in the case of options and other awards subject to exercise, the applicable exercise price.
A “change in control” under Tornier’s current stock incentive plan means:
| • | the acquisition (other than from Tornier) by any person, entity or group, subject to certain exceptions, of 50% or more of either Tornier’s then-outstanding ordinary shares or the combined voting power of Tornier’s then-outstanding ordinary shares or the combined voting power of Tornier’s then-outstanding capital stock entitled to vote generally in the election of directors; |
| • | the “continuity directors” cease for any reason to constitute at least a majority of the Tornier board of directors; |
| • | consummation of a reorganization, merger or consolidation, in each case, with respect to which persons who were Tornier shareholders immediately prior to such reorganization, merger or consolidation do not, immediately thereafter, own more than 50% of the combined voting power entitled to vote generally in the election of directors of the then-outstanding voting securities of the reorganized, merged, consolidated, or other surviving corporation (or its direct or indirect parent corporation); |
163
Table of Contents
| • | approval by Tornier shareholders of a liquidation or dissolution of Tornier; or |
| • | the consummation of the sale of all or substantially all of Tornier’s assets with respect to which persons who were Tornier shareholders immediately prior to such sale do not, immediately thereafter, own more than 50% of the combined voting power entitled to vote generally in the election of directors of the then-outstanding voting securities of the acquiring corporation (or its direct or indirect parent corporation). |
The definition of change in control in Tornier’s prior stock option plan and executive employment agreements is not identical but substantially similar to the definition in Tornier’s current stock incentive plan.
Potential Payments to Named Executive Officers. The table below reflects the amount of compensation and benefits payable to each named executive officer in the event of (i) any termination (including for cause) or resignation, or a voluntary/for cause termination; (ii) an involuntary termination without cause; (iii) an involuntary termination without cause or a resignation for good reason within 12 months following a change in control, or a qualifying change in control termination; (iv) termination by reason of an executive’s death and (v) termination by reason of an executive’s disability. The amounts shown assume that the applicable triggering event occurred on December 28, 2014, and, therefore, are estimates of the amounts that would be paid to the named executive officers upon the occurrence of such triggering event.
| Name |
Type of payment |
Voluntary/ for cause termination ($) |
Involuntary termination without cause ($) |
Qualifying change in control termination ($) |
Death/ Disability ($) |
|||||||||||||
| David H. Mowry |
Cash severance(1) | — | 550,000 | 550,000 | — | |||||||||||||
| Benefit continuation(2) | — | 14,936 | 14,936 | — | ||||||||||||||
| Target bonus(3) | — | — | 438,890 | — | ||||||||||||||
| Option award acceleration(4) | — | — | 677,543 | — | ||||||||||||||
| Stock award acceleration(5) | — | — | 1,699,455 | — | ||||||||||||||
|
|
|
|
|
|
|
|
|
|||||||||||
| Total |
— | 564,936 | 3,380,824 | — | ||||||||||||||
| Shawn T McCormick |
Cash severance(1) | — | 365,456 | 365,456 | — | |||||||||||||
| Benefit continuation(2) | — | 14,936 | 14,936 | — | ||||||||||||||
| Target bonus(3) | — | — | 182,216 | — | ||||||||||||||
| Option award acceleration(4) | — | — | 330,696 | — | ||||||||||||||
| Stock award acceleration(5) | — | — | 918,800 | — | ||||||||||||||
|
|
|
|
|
|
|
|
|
|||||||||||
| Total |
— | 380,392 | 1,812,105 | — | ||||||||||||||
| Terry M. Rich |
Cash severance(1) | — | 369,694 | 369,694 | — | |||||||||||||
| Benefit continuation(2) | — | 14,936 | 14,936 | — | ||||||||||||||
| Target bonus(3) | — | — | 276,544 | — | ||||||||||||||
| Option award acceleration(4) | — | — | 280,210 | — | ||||||||||||||
| Stock award acceleration(5) | — | — | 908,464 | — | ||||||||||||||
|
|
|
|
|
|
|
|
|
|||||||||||
| Total |
— | 384,630 | 1,849,848 | — | ||||||||||||||
| Kevin M. Klemz |
Cash severance(1) | — | 332,868 | 332,868 | — | |||||||||||||
| Benefit continuation(2) | — | 14,936 | 14,936 | — | ||||||||||||||
| Target bonus(3) | — | — | 131,983 | — | ||||||||||||||
| Option award acceleration(4) | — | — | 221,504 | — | ||||||||||||||
| Stock award acceleration(5) | — | — | 883,411 | — | ||||||||||||||
|
|
|
|
|
|
|
|
|
|||||||||||
| Total |
— | 347,804 | 1,584,703 | — | ||||||||||||||
| Gregory Morrison |
Cash severance(1) | — | 300,002 | 300,002 | — | |||||||||||||
| Benefit continuation(2) | — | 14,936 | 14,936 | — | ||||||||||||||
| Target bonus(3) | — | — | 119,092 | — | ||||||||||||||
| Option award acceleration(4) | — | — | 202,485 | — | ||||||||||||||
| Stock award acceleration(5) | — | — | 834,528 | — | ||||||||||||||
|
|
|
|
|
|
|
|
|
|||||||||||
| Total |
— | 314,938 | 1,471,043 | — | ||||||||||||||
164
Table of Contents
| (1) | Represents the value of salary continuation for 12 months or payment of a lump sum equal to 12-months’ base salary following the executive’s termination, as applicable. |
| (2) | Includes the value of medical, dental and vision benefit continuation for each executive and their family for 12 months following the executive’s termination. With respect to a qualifying change in control termination, Tornier will bear the entire cost of coverage. |
| (3) | Includes value of full target bonus for the year of the change in control. In the case of all of the named executive officers, if the termination is an involuntary termination without cause and the date of termination is such that the termination is structured as a non-renewal of the executive’s employment agreement, then under such circumstances a pro rata portion of the executive’s annual bonus would be required to be paid under the terms of the executive’s employment agreement. |
| (4) | The value of the automatic acceleration of the vesting of unvested stock options held by a named executive officer is based on the difference between: (i) the per share market price of Tornier ordinary shares underlying the unvested stock options held by such executive as of December 26, 2014, the last trading day of fiscal 2014, based upon the per share closing sale price of Tornier ordinary shares, as reported by the NASDAQ Global Select Market, on December 26, 2014 ($25.46), and (ii) the per share exercise price of the options held by such executive. The range of per share exercise prices of unvested stock options held by Tornier’s named executive officers included in the table as of December 28, 2014 was $17.28 to $25.20. |
| (5) | The value of the automatic acceleration of the vesting of stock awards held by a named executive officer is based on: (i) the number of unvested stock awards held by such officer as of December 28, 2014, multiplied by (ii) the per share market price of Tornier ordinary shares as of last trading day of fiscal 2014, December 26, 2014 based upon the per share closing sale price of Tornier ordinary shares, as reported by the NASDAQ Global Select Market, on December 26, 2014 ($25.46). |
Risk Assessment of Compensation Policies, Practices and Programs
As a result of Tornier’s annual assessment on risk in Tornier’s compensation programs, Tornier concluded that its compensation policies, practices and programs and related compensation governance structure work together in a manner so as to encourage its employees, including its named executive officers, to pursue growth strategies that emphasize shareholder value creation, but not to take unnecessary or excessive risks that could threaten the value of Tornier. As part of Tornier’s assessment, Tornier noted in particular the following:
| • | annual base salaries for employees are not subject to performance risk and, for most non-executive employees, constitute the largest part of their total compensation; |
| • | while performance-based, or at risk, compensation constitutes a significant percentage of the overall total compensation of many of Tornier’s employees, including in particular Tornier’s named executive officers, and thereby Tornier believes motivates its employees to help fulfill Tornier’s corporate mission, vision and values, including specific and focused company performance goals, the non-performance based compensation for most employees for most years is also a sufficiently high percentage of their overall total compensation that Tornier does not believe that unnecessary or excessive risk taking is encouraged by the performance-based compensation; |
| • | for most employees, Tornier’s performance-based compensation has appropriate maximums; |
| • | a significant portion of performance-based compensation of Tornier’s employees is in the form of long-term equity incentives which do not encourage unnecessary or excessive risk because they generally vest over a four-year period of time thereby focusing Tornier’s employees on Tornier’s long-term interests; and |
| • | performance-based or variable compensation awarded to Tornier’s employees, which for Tornier’s higher-level employees, including Tornier’s named executive officers, constitutes the largest part of their total compensation, is appropriately balanced between annual and long-term performance and cash and equity compensation, and utilizes several different performance measures and goals that are drivers of long-term success for Tornier and its shareholders. |
165
Table of Contents
As a matter of best practice, Tornier will continue to monitor its compensation policies, practices and programs to ensure that they continue to align the interest of its employees, including in particular its executive officers, with those of its long-term shareholders while avoiding unnecessary or excessive risk.
Director Compensation
Overview
Under the terms of the Tornier board of directors compensation policy, which was approved by the general meeting of the Tornier shareholders on August 26, 2010 and was amended on October 28, 2010, the compensation packages for Tornier’s non-executive directors are determined by Tornier’s non-executive directors, based upon recommendations by the compensation committee. Such compensation is determined by Tornier’s non-executive directors pursuant to the terms of Tornier’s articles of association which provide that if all directors have a conflict of interest in the matter to be acted upon, the matter shall be approved by the non-executive directors. In determining non-executive director compensation, Tornier targets such compensation in the market median range of Tornier’s peer companies; although, Tornier may deviate from the median if Tornier determines necessary or appropriate on a case by case basis.
Under the terms of Tornier’s non-executive director compensation policy, compensation for Tornier’s non-executive directors is comprised of both cash compensation and equity-based compensation. Cash compensation is in the form of annual or other retainers for non-executive directors, chairman, committee chairs and committee members. Equity-based compensation is in the form of initial and annual stock option and stock grants (in the form of restricted stock units). Each of these components is described in more detail below. Tornier does not generally provide perquisites and other personal benefits to Tornier’s non-executive directors.
During 2014, Tornier’s compensation committee engaged Mercer to review Tornier’s non-executive director compensation program. In so doing, Mercer analyzed the outside director compensation levels and practices of Tornier’s peer companies. Mercer used the same peer group as was approved by the compensation committee in February 2013 and used to gather compensation information for Tornier’s executive officers, with the exception that Heartware International, Inc. was substituted for Conceptus, Inc. For more information regarding the peer companies, see the information under “—Compensation Discussion and Analysis—Determination of Executive Compensation—Use of Peer Group and Other Market Data” of this report. Based on Mercer’s recommendations, the compensation committee recommended and the Tornier board of directors approved no changes to Tornier’s non-executive director compensation policy during 2014. Tornier’s non-executive director compensation policy is consistent with its shareholder-approved board of directors compensation policy.
166
Table of Contents
Cash Compensation
The cash compensation component of Tornier’s non-executive director compensation consists of gross annual fees, commonly referred to as annual cash retainers, paid to each non-executive director and additional annual cash retainers paid to the chairman and each board committee chair and member. The table below sets forth the annual cash retainers paid to each non-executive director and the additional annual cash retainers paid to the chairman and each board committee chair and member:
| Description |
Annual cash retainer ($) |
|||
| Non-executive director |
40,000 | |||
| Chairman premium |
50,000 | |||
| Audit committee chair premium |
15,000 | |||
| Compensation committee chair premium |
10,000 | |||
| Nominating, corporate governance and compliance committee chair premium |
5,000 | |||
| Strategic transactions committee chair premium |
10,000 | |||
| Audit committee member (including chair) |
10,000 | |||
| Compensation committee member (including chair) |
5,000 | |||
| Nominating, corporate governance and compliance committee member (including chair) |
5,000 | |||
| Strategic transactions committee member (including chair) |
5,000 | |||
The annual cash retainers are paid on a quarterly basis in arrears within 30 days of the end of each calendar quarter. For example, the retainers for the first calendar quarter covering the period from January 1 through March 31 are paid within 30 days of March 31.
In addition, each non-executive director, other than Mr. Tornier, receives a cash travel stipend of $2,000 for each board meeting attended in person that takes place in the Netherlands or other location outside the United States.
Equity-Based Compensation
The equity-based compensation component of Tornier’s non-executive director compensation consists of initial stock option and stock grants (in the form of restricted stock units) to new non-executive directors upon their first appointment or election to the Tornier board of directors and annual stock option and stock grants (in the form of restricted stock units) to all non-executive directors on the same date that annual performance recognition grants of equity awards are made to Tornier’s employees (or such other date if otherwise in accordance with all applicable, laws, rules and regulations).
Non-executive directors, upon their initial election to the Tornier board of directors and on an annual basis thereafter effective as of the same date that annual performance recognition grants of equity awards are made to Tornier’s employees (or such other date if otherwise in accordance with all applicable, laws, rules and regulations), receive $125,000, one-half of which is paid in stock options and the remaining one-half of which is paid in stock grants (in the form of restricted stock units). The number of Tornier ordinary shares underlying the stock options and stock grants is determined based on the 10-trading day average closing sale price of a Tornier ordinary share, as reported by the NASDAQ Global Select Market, and as determined one week prior to the date of anticipated corporate approval of the award. The stock options have a term of 10 years and a per share exercise price equal to 100% of the fair market value of a Tornier ordinary share on the grant date. The stock options and stock grants (in the form of restricted stock units) vest over a two-year period, with one-half of the underlying shares vesting on each of the one-year and two-year anniversaries of the grant date, in each case so long as the director is still a director as of such date.
Accordingly, on August 12, 2014, each of Tornier’s non-executive directors received a stock option to purchase 6,034 Tornier ordinary shares at an exercise price of $21.66 per share and a stock grant in the form of a restricted stock unit representing 2,728 Tornier ordinary shares.
167
Table of Contents
Election to Receive Equity-Based Compensation in Lieu of Cash Compensation
Tornier’s non-executive director compensation policy allows Tornier’s non-executive directors to elect to receive a stock grant in lieu of 100% of their annual cash retainers payable for services to be rendered as a non-executive director, chairman and chair or member of any board committee. Each non-executive director who elects to receive a stock grant in lieu of such director’s annual cash retainers is granted a stock grant (in the form of a restricted stock unit) under Tornier’s stock incentive plan for that number of Tornier ordinary shares as determined by dividing the aggregate dollar amount of all annual cash retainers anticipated to payable to such director for the period commencing on July 1 of each year to June 30 of the following year by the 10-trading day average closing sale price of Tornier ordinary shares as reported by the NASDAQ Global Select Market and as determined one week prior to the date of anticipated corporate approval of the award. Four of Tornier’s non-executive directors elected to receive such a stock grant in lieu of their cash retainers for the period covering July 1, 2013 through June 30, 2014, and the same four non-executive directors elected to receive such a stock grant in lieu of their cash retainers for the period covering July 1, 2014 through June 30, 2015. Accordingly, effective as of August 9, 2013 and August 12, 2014, these four non-executive directors received stock grants. These stock grants are described in more detail in note (1) to the Director Compensation Table under “—Summary of Cash and Other Director Compensation.”
If a non-executive director who elected to receive a stock grant in lieu of such director’s annual cash retainers is no longer a director before such director’s interest in all of the Tornier ordinary shares underlying the stock grant have vested and become issuable, then such director will forfeit his or her rights to receive all of the shares underling such stock grant that have not vested and been issued as of the date such director’s status as a director so terminates. In such case, the non-executive director will receive in cash a pro rata portion of his or her annual cash retainers for the quarter in which the director’s status as a director terminates.
If a non-executive director who elected to receive a stock grant in lieu of such director’s annual cash retainers becomes entitled to receive an increased or additional annual cash retainer during the period from July 1 to June 30 of the next year, such director will receive such increased or additional annual cash retainer in cash until July 1 of the next year when the director may elect (on or prior to June 15 of the next year) to receive a stock grant in lieu of such director’s annual cash retainers.
If a non-executive director who elected to receive a stock grant in lieu of such director’s annual cash retainers experiences a change in the director’s membership on one or more board committees or chair positions prior to June 30 of the next year such that the director becomes entitled to receive annual cash retainers for the period from July 1 to June 30 of the next year aggregating an amount less than the aggregate amount used to calculate the director’s most recent stock grant received, the director will forfeit as of the effective date of such board committee or chair change his or her rights to receive a pro rata portion of the shares underlying such stock grant reflecting the decrease in the director’s aggregate annual cash retainers and the date on which such decrease occurred. In addition, the vesting of the stock grant will be revised appropriately to reflect any such change in the number of shares underlying the stock grant and the date on which such change occurred.
168
Table of Contents
Summary of Cash and Other Director Compensation
The table below summarizes the compensation received by Tornier’s non-executive directors for the year ended December 28, 2014. While Mr. Mowry did not receive additional compensation for his service as a director, a portion of his compensation was allocated to his service as a member of the Tornier board of directors. For more information regarding the allocation of Mr. Mowry’s compensation, please refer to note (1) to the Summary Compensation Table under “—Executive Compensation Tables and Narrative—Summary Compensation.”
DIRECTOR COMPENSATION—2014
| Name |
Fees earned or paid in cash(1) ($) |
Stock awards(2)(3) ($) |
Option awards(4)(5) ($) |
All other compensation(6)(7) ($) |
Total ($) |
|||||||||||||||
| Sean D. Carney |
120,000 | 172,544 | 59,572 | 8,000 | 360,116 | |||||||||||||||
| Richard B. Emmitt |
55,000 | 111,094 | 59,572 | 8,000 | 233,666 | |||||||||||||||
| Kevin C. O’Boyle |
70,000 | 59,088 | 59,572 | 6,000 | 194,660 | |||||||||||||||
| Alain Tornier |
40,000 | 96,907 | 59,572 | 0 | 196,479 | |||||||||||||||
| Richard F. Wallman |
70,000 | 59,088 | 59,572 | 8,000 | 196,660 | |||||||||||||||
| Elizabeth H. Weatherman |
45,000 | 101,629 | 59,572 | 8,000 | 214,201 | |||||||||||||||
| (1) | Unless a director otherwise elects to convert all of his or her annual retainers into stock awards (in the form of restricted stock units), annual retainers are paid in cash on a quarterly basis in arrears within 30 days of the end of each calendar quarter. Four of Tornier’s non-executive directors elected to convert all of their annual retainers covering the period of service from July 1, 2013 to June 30, 2014 and the same four non-executive directors elected to convert their annual retainers covering the period of service from July 1, 2014 to June 30, 2015 into stock awards under Tornier’s stock incentive plan. Accordingly, these four non-executive directors were granted stock awards on August 9, 2013 and August 12, 2014 for that number of Tornier ordinary shares as determined based on the following formula: (a) the aggregate dollar amount of all annual cash retainers that otherwise would have been payable to the non-executive director for services to be rendered as a non-executive director, chairman and chair or member of any board committee (based on such director’s board committee memberships and chair positions as of the grant date), divided by (b) the 10-trading day average closing sale price of a Tornier ordinary share, as reported by the NASDAQ Global Select Market, and as determined one week prior to the date of anticipated corporate approval of the award. Such stock awards vest and the underlying shares become issuable in four as nearly equal as possible quarterly installments, on September 30, December 31, March 31 and June 30, in each case so long as the non-executive director is a director of Tornier as of such date. |
169
Table of Contents
The table below sets forth: (a) the number of stock awards granted to each non-executive director on August 12, 2014; (b) the total amount of annual retainers converted by such director into stock awards; (c) of such total amount of annual retainers converted into stock awards, the amount attributed to the director’s service during 2014, which amount is included in the “Fees earned or paid in cash” column for each director; (d) the grant date fair value of the stock awards computed in accordance with Financial Accounting Standards Board (FASB) Accounting Standards Codification (ASC) Topic 718; and (e) the incremental grant date fair value for the stock awards above and beyond the amount of annual retainers for 2014 service converted into stock awards computed in accordance with FASB ASC Topic 718.
| Name |
Total amount of retainers converted into stock awards ($) |
Number of stock awards (#) |
Amount of retainer converted into stock awards attributable to 2014 service ($) |
Grant date fair value of stock awards ($) |
Incremental grant date fair value of stock awards received during 2014 ($) |
|||||||||||||||
| Mr. Carney |
120,000 | 5,238 | 60,000 | 113,455 | 53,455 | |||||||||||||||
| Mr. Emmitt |
55,000 | 2,401 | 27,500 | 52,006 | 24,506 | |||||||||||||||
| Mr. Tornier |
40,000 | 1,746 | 20,000 | 37,818 | 17,818 | |||||||||||||||
| Ms. Weatherman |
45,000 | 1,964 | 22,500 | 42,540 | 20,040 | |||||||||||||||
The table below sets forth: (a) the number of stock awards granted to each non-executive director on August 9, 2013; (b) the total amount of annual retainers converted by such director into stock awards; (c) of such total amount of annual retainers converted into stock awards, the amount attributed to the director’s service during 2013; (d) the grant date fair value of the stock awards computed in accordance with FASB ASC Topic 718; and (e) the incremental grant date fair value for the stock awards above and beyond the amount of annual retainers for 2013 service converted into stock awards computed in accordance with FASB ASC Topic 718.
| Name |
Total amount of retainers converted into stock awards ($) |
Number of stock awards (#) |
Amount of retainer converted into stock awards attributable to 2013 service ($) |
Grant date fair value of stock awards ($) |
Incremental grant date fair value of stock awards received during 2013 ($) |
|||||||||||||||
| Mr. Carney |
115,000 | 6,422 | 57,500 | 124,908 | 67,408 | |||||||||||||||
| Mr. Emmitt |
50,000 | 2,792 | 25,000 | 54,304 | 29,304 | |||||||||||||||
| Mr. Tornier |
40,000 | 2,234 | 20,000 | 43,451 | 23,451 | |||||||||||||||
| Ms. Weatherman |
45,000 | 2,513 | 22,500 | 48,878 | 26,378 | |||||||||||||||
| (2) | On August 12, 2014, each non-executive director received a stock award (in the form of a restricted stock unit) for 2,728 Tornier ordinary shares granted under Tornier’s stock incentive plan. The stock award vests and the underlying shares become issuable in two as nearly equal as possible annual installments, on the one-year and two-year anniversaries of the grant date, and in each case so long as the non-executive director is a director of Tornier as of such date. In addition, as described above in note (1), certain non-executive directors elected to convert their annual retainers covering the period of service from July 1, 2014 to June 30, 2015 into stock awards under Tornier’s stock incentive plan. The amount reported in the “Stock awards” column represents the aggregate grant date fair value for the August 12, 2014 stock awards granted to each director in 2014 and for those directors who elected to convert their annual retainers covering the period of service from July 1, 2014 to June 30, 2015, the grant date fair value for the additional August 12, 2014 stock awards granted to such director in 2014, in each case as computed in accordance with FASB ASC Topic 718. The grant date fair value for stock awards is determined based on the closing sale price of Tornier ordinary shares on the grant date. |
170
Table of Contents
| (3) | The table below provides information regarding the number of unvested stock awards (all of which are in the form of restricted stock units) held by each of the non-executive directors at December 28, 2014 on a per grant basis and on an aggregate basis. |
| Name |
08/10/12 grant date |
08/09/13 grant date |
08/12/14 grant date |
Total number of underlying unvested shares |
||||||||||||
| Mr. Carney |
983 | 1,745 | 6,657 | 9,385 | ||||||||||||
| Mr. Emmitt |
983 | 1,745 | 4,529 | 7,257 | ||||||||||||
| Mr. O’Boyle |
983 | 1,745 | 2,728 | 5,456 | ||||||||||||
| Mr. Tornier |
983 | 1,745 | 4,038 | 6,766 | ||||||||||||
| Mr. Wallman |
983 | 1,745 | 2,728 | 5,456 | ||||||||||||
| Ms. Weatherman |
983 | 1,745 | 4,201 | 6,929 | ||||||||||||
| (4) | On August 12, 2014, each non-executive director received a stock option to purchase 6,034 Tornier ordinary shares at an exercise price of $21.66 per share granted under Tornier’s stock incentive plan. Such option expires on August 12, 2024 and vests with respect to one-half of the underlying Tornier ordinary shares on each of the following dates, so long as the individual remains a director of Tornier as of such date: August 12, 2015 and August 12, 2016. Amount reported in the “Option awards” column represents the aggregate grant date fair value for option awards granted to each non-executive director in 2014 computed in accordance with FASB ASC Topic 718. The grant date fair value is determined based on Tornier’s Black-Scholes option pricing model. The grant date value per share for the option granted on August 12, 2014 was $9.87 and was determined using the following specific assumptions: risk free interest rate: 1.90%; expected life: 6.10 years; expected volatility: 45.10%; and expected dividend yield: 0. |
| (5) | The table below provides information regarding the aggregate number of options to purchase Tornier ordinary shares outstanding at December 28, 2014 and held by each of Tornier’s non-executive directors: |
| Name |
Aggregate number of shares underlying options |
Exercisable/ unexercisable |
Range of exercise price(s) ($) |
Range of expiration date(s) |
||||||||||||
| Mr. Carney |
27,820 | 15,867/11,953 | 18.04-25.20 | 05/12/2021-08/12/2024 | ||||||||||||
| Mr. Emmitt |
27,820 | 15,867/11,953 | 18.04-25.20 | 05/12/2021-08/12/2024 | ||||||||||||
| Mr. O’Boyle |
77,820 | 65,867/11,953 | 18.04-25.20 | 06/03/2020-08/12/2024 | ||||||||||||
| Mr. Tornier |
27,820 | 15,867/11,953 | 18.04-25.20 | 05/12/2021-08/12/2024 | ||||||||||||
| Mr. Wallman |
62,195 | 50,242/11,953 | 16.98-25.20 | 12/08/2018-08/12/2024 | ||||||||||||
| Ms. Weatherman |
27,820 | 15,867/11,953 | 18.04-25.20 | 05/12/2021-08/12/2024 | ||||||||||||
| (6) | Represents travel stipends of $2,000 for each board meeting attended in person that takes place in the Netherlands or other location outside the United States. |
| (7) | Tornier does not generally provide perquisites and other personal benefits to Tornier’s non-executive directors. Any perquisites or personal benefits actually provided to any non-executive director were less than $10,000 in the aggregate |
171
Table of Contents
ITEM 12. SECURITY OWNERSHIP OF CERTAIN BENEFICIAL OWNERS AND MANAGEMENT AND RELATED STOCKHOLDER MATTERS
Security Ownership of Certain Beneficial Owners and Management
The table below sets forth certain information concerning the beneficial ownership of our ordinary shares as of February 10, 2015, by:
| • | each of our directors and named executive officers; |
| • | all of our current directors and executive officers as a group; and |
| • | each person known by us to beneficially own more than 5% of our ordinary shares. |
The calculations in the table below assume that there are 48,987,794 ordinary shares outstanding. Beneficial ownership is determined in accordance with the rules and regulations of the SEC. In computing the number of ordinary shares beneficially owned by a person and the percentage ownership of that person, we have included ordinary shares that the person has the right to acquire within 60 days, including through the exercise of any option, warrant or other right, the conversion of any other security and the issuance of ordinary shares upon the vesting of stock awards granted in the form of restricted stock units. The ordinary shares that a shareholder has the right to acquire within 60 days, however, are not included in the computation of the percentage ownership of any other person.
| Ordinary shares beneficially owned(1) |
||||||||
| Number | Percent | |||||||
| Directors and named executive officers: |
||||||||
| David H. Mowry |
107,608 | * | ||||||
| Shawn T McCormick |
48,793 | * | ||||||
| Terry M. Rich |
78,934 | * | ||||||
| Kevin M. Klemz |
133,449 | * | ||||||
| Gregory Morrison |
130,588 | * | ||||||
| Sean D. Carney(2) |
10,758,594 | 22.0 | % | |||||
| Richard B. Emmitt(3) |
81,048 | * | ||||||
| Kevin C. O’Boyle |
72,560 | * | ||||||
| Alain Tornier(4) |
1,790,044 | 3.7 | % | |||||
| Richard F. Wallman |
109,508 | * | ||||||
| Elizabeth H. Weatherman(5) |
10,749,777 | 21.9 | % | |||||
| All directors and executive officers as a group (13 persons) |
13,509,771 | 27.2 | % | |||||
| Principal shareholders: |
||||||||
| Warburg Pincus Entities (TMG Holdings Coöperatief U.A.)(6) |
10,721,809 | 21.9 | % | |||||
| T. Rowe Price Associates, Inc.(7) |
5,205,599 | 10.6 | % | |||||
| OrbiMed Advisors LLC(8) |
4,805,000 | 9.8 | % | |||||
| FMR LLC(9) |
3,258,997 | 6.7 | % | |||||
| Bridger Management LLC.(10) |
2,699,052 | 5.5 | % | |||||
| * | Represents beneficial ownership of less than 1% of our outstanding ordinary shares. |
172
Table of Contents
| (1) | Includes for the persons listed below the following ordinary shares subject to options held by that person that are currently exercisable or become exercisable within 60 days of February 10, 2015 and ordinary shares issuable upon the vesting of stock awards granted in the form of restricted stock units within 60 days of February 10, 2015: |
| Name |
Options | Stock awards in the form of restricted stock units |
||||||
| David H. Mowry |
88,660 | — | ||||||
| Shawn T McCormick |
36,682 | — | ||||||
| Terry M. Rich |
60,958 | — | ||||||
| Kevin M. Klemz |
117,800 | — | ||||||
| Gregory Morrison |
115,408 | — | ||||||
| Sean D. Carney |
15,867 | 1,309 | ||||||
| Richard B. Emmitt |
15,867 | 600 | ||||||
| Kevin C. O’Boyle |
65,867 | — | ||||||
| Alain Tornier |
15,867 | 436 | ||||||
| Richard F. Wallman |
50,242 | — | ||||||
| Elizabeth H. Weatherman |
15,867 | 491 | ||||||
| All directors and executive officers as a group (13 persons) |
751,291 | 2,836 | ||||||
| (2) | Includes 10,721,809 Tornier ordinary shares held by affiliates of Warburg Pincus & Co. Mr. Carney is a Partner of Warburg Pincus & Co. and a Member and a Managing Director of Warburg Pincus LLC. All Tornier ordinary shares indicated as owned by Mr. Carney are included because of his affiliation with the Warburg Pincus Entities (as defined below). See note (6) below. Mr. Carney disclaims beneficial ownership of all securities that may be deemed to be beneficially owned by the Warburg Pincus Entities, except to the extent of any pecuniary interest therein. Mr. Carney’s address is c/o Warburg Pincus LLC, 450 Lexington Avenue, New York, New York 10017. |
| (3) | Includes: (i) 15,708 shares held in Mr. Emmitt’s IRA account, (ii) 564 shares held by Mr. Emmitt’s spouse, and (iii) 44 shares held by an IRA account of Mr. Emmitt’s spouse. |
| (4) | Includes 1,762,792 Tornier ordinary shares held by KCH Oslo AS (KCH Oslo). KCH Stockholm AB wholly owns KCH Oslo, and Mr. Tornier wholly owns KCH Stockholm AB. All Tornier ordinary shares indicated as owned by Mr. Tornier are included because of his affiliation with these entities. |
| (5) | Includes 10,721,809 Tornier ordinary shares held by affiliates of Warburg Pincus & Co. Ms. Weatherman is a Partner of Warburg Pincus & Co. and a Member and a Managing Director of Warburg Pincus LLC. All Tornier ordinary shares indicated as owned by Ms. Weatherman are included because of her affiliation with the Warburg Pincus Entities. See note (6) below. Ms. Weatherman disclaims beneficial ownership of all securities that may be deemed to be beneficially owned by the Warburg Pincus Entities, except to the extent of any pecuniary interest therein. Ms. Weatherman’s address is c/o Warburg Pincus LLC, 450 Lexington Avenue, New York, New York 10017. |
| (6) | Reflects Tornier ordinary shares held by TMG Holdings Coöperatief U.A., a Dutch coöperatief (TMG). TMG is wholly-owned by Warburg Pincus (Bermuda) Private Equity IX, L.P., a Bermuda limited partnership (WP Bermuda IX), and WP (Bermuda) IX PE One Ltd., a Bermuda company (WPIX PE One). The general partner of WP Bermuda IX is Warburg Pincus (Bermuda) Private Equity Ltd., a Bermuda company (WP Bermuda Ltd.). WP Bermuda IX is managed by Warburg Pincus LLC, a New York limited liability company (WP LLC, and together with WP Bermuda IX, WPIX PE One and WP Bermuda Ltd., the Warburg Pincus Entities). Charles R. Kaye and Joseph P. Landy are the Managing General Partners of Warburg Pincus & Co., a New York general partnership (WP), and Managing Members and Co-Chief Executive Officers of WP LLC and may be deemed to control the Warburg Pincus Entities. Each of the Warburg Pincus Entities, Mr. Kaye and Mr. Landy has shared voting and investment control of all of the Tornier ordinary shares referenced above. By reason of the provisions of Rule 16a-1 of the Securities Exchange Act of 1934, as amended, Mr. Kaye, Mr. Landy and the Warburg Pincus Entities may be deemed to be the beneficial owners of the Tornier ordinary shares held by TMG. Each of Mr. Kaye, Mr. Landy and |
173
Table of Contents
| the Warburg Pincus Entities disclaims beneficial ownership of the Tornier ordinary shares referenced above except to the extent of any pecuniary interest therein. The address of the Warburg Pincus entities is 450 Lexington Avenue, New York, New York 10017. |
| (7) | Based solely on information contained in a Schedule 13G/A of T. Rowe Price Associates, Inc., an investment advisor, filed with the SEC on February 11, 2015, reflecting beneficial ownership as of December 31, 2014, with sole investment discretion with respect to all such shares, and sole voting authority with respect to 604,700 shares. The address of T. Rowe Price Associates, Inc. is 100 East Pratt Street, Baltimore, Maryland 21202. |
| (8) | Based solely on a Schedule 13G filed on February 17, 2015 by OrbiMed Advisors LLC, OrbiMed Capital LLC and Samuel D. Isaly reflecting beneficial ownership as of December 31, 2014. The beneficial ownership reflected in the table includes 2,100,000 ordinary shares beneficially owned by OrbiMed Advisors LLC with shared voting and investment discretion; 2,705,000 ordinary shares beneficially owned by OrbiMed Capital LLC with shared voting and investment discretion, and 4,805,000 ordinary shares beneficially owned by Samuel D. Isaly with shared voting and investment discretion. The address of their principal business office is 601 Lexington Avenue, 54th floor, New York, NY 10022. |
| (9) | Based solely on information contained in a Schedule 13G of FMR LLC, an investment advisor, filed with the SEC on February 13, 2015, reflecting beneficial ownership as of December 31, 2014, with sole investment discretion with respect to all such shares and sole voting authority with respect to 197 shares. Edward C. Johnson 3d is a Director and the Chairman of FMR LLC and Abigail P. Johnson is a Director, the Vice Chairman and the President of FMR LLC. Members of the family of Edward C. Johnson 3d, including Abigail P. Johnson, are the predominant owners, directly or through trusts, of Series B voting common shares of FMR LLC, representing 49% of the voting power of FMR LLC. The Johnson family group and all other Series B shareholders have entered into a shareholders’ voting agreement under which all Series B voting common shares will be voted in accordance with the majority vote of Series B voting common shares. Accordingly, through their ownership of voting common shares and the execution of the shareholders’ voting agreement, members of the Johnson family may be deemed, under the Investment Company Act of 1940, to form a controlling group with respect to FMR. Neither FMR nor Edward C. Johnson 3d nor Abigail P. Johnson has the sole power to vote or direct the voting of the shares owned directly by the various investment companies registered under the Investment Company Act (“Fidelity Funds”) advised by Fidelity Management & Research Company (“FMR Co”), a wholly owned subsidiary of FMR, which power resides with the Fidelity Funds’ Boards of Trustees. Fidelity Co carries out the voting of the shares under written guidelines established by the Fidelity Funds’ Boards of Trustees. The business address of FMR LLC is 245 Summer Street, Boston, Massachusetts 02210. |
| (10) | Based solely on information contained in a Schedule 13G of Bridger Management LLC, an investment advisor, filed with the SEC on August 18, 2014, reflecting beneficial ownership as of August 18, 2014, with shared investment discretion and voting authority with respect to all such shares. Swiftcurrent Offshore Master Ltd., Swiftcurrent Partners L.P., and Bridger Healthcare Ltd. are the owners of record of the ordinary shares reported therein. Each of Swiftcurrent Offshore Master Ltd., Swiftcurrent Partners L.P. and Bridger Healthcare Ltd. has beneficial ownership of less than 5% of the ordinary Wright shares. Bridger Management LLC is the investment adviser to Swiftcurrent Offshore Master Ltd., Swiftcurrent Partners L.P. and Bridger Healthcare Ltd. Mr. Mignone is the managing member of Bridger Management, LLC. Each of Bridger Management LLC and Mr. Mignone may be deemed to share beneficial ownership of the ordinary shares reported herein. The address of Bridger Management LLC is 90 Park Avenue, 40th Floor, New York, NY 10016. |
174
Table of Contents
Securities Authorized for Issuance Under Equity Compensation Plans
The table below provides information about our ordinary shares that may be issued under our equity compensation plans as of December 28, 2014.
| Plan category |
Number of securities to be issued upon exercise of outstanding options, warrants and rights (a) |
Weighted-average exercise price of outstanding options, warrants and rights (b) |
Number of securities remaining available for future issuance under equity compensation plans (excluding securities reflected in column (a)) (c) |
|||||||||
| Equity compensation plans approved by |
3,276,831 | $ | 20.34 | 1,941,304 | ||||||||
| Equity compensation plans not approved by security holders |
— | — | — | |||||||||
|
|
|
|
|
|
|
|||||||
| Total |
3,276,831 | $ | 20.34 | 1,941,304 | ||||||||
|
|
|
|
|
|
|
|||||||
| (1) | Amount includes ordinary shares issuable upon the exercise of stock options granted under the Tornier N.V. Amended and Restated Stock Option Plan and the Tornier N.V. Amended and Restated 2010 Incentive Plan and ordinary shares issuable upon the vesting of stock awards in the form of restricted stock units granted under the Tornier N.V. Amended and Restated 2010 Incentive Plan. |
| (2) | Excludes employee stock purchase rights under the Tornier N.V. 2010 Employee Stock Purchase Plan, as amended. Under such plan, each eligible employee may purchase ordinary shares at semi-annual intervals on June 30th and December 31st each calendar year at a purchase price per share equal to 85% of the closing sales price per share of our ordinary shares on the last day of the offering period. |
| (3) | Included in the weighted-average exercise price calculation are 631,783 stock awards granted in the form of restricted stock units with a weighted-average grant price of $20.23. The weighted-average per share exercise price of all outstanding stock options as of December 28, 2014 and reflected in column (a) was $20.23. |
| (4) | Amount includes 1,646,648 ordinary shares remaining available for future issuance under the Tornier N.V. Amended and Restated 2010 Incentive Plan and 294,656 ordinary shares remaining available for future issuance under the Tornier N.V. 2010 Employee Stock Purchase Plan, as amended. No shares remain available for grant under the Tornier N.V. Amended and Restated Stock Option Plan since such plan was terminated with respect to future grants upon our initial public offering in February 2011. |
175
Table of Contents
ITEM 13. CERTAIN RELATIONSHIPS AND RELATED TRANSACTIONS, AND DIRECTOR INDEPENDENCE
Introduction
Below under the heading “—Description of Related Party Transactions” is a description of transactions that have occurred since the beginning of Tornier’s last fiscal year, or any currently proposed transactions, to which Tornier was or is a participant and in which:
| • | the amounts involved exceeded or will exceed $120,000; and |
| • | a related person (including any director, director nominee, executive officer, holder of more than 5% of Tornier ordinary shares or any member of their immediate family) had or will have a direct or indirect material interest. |
These transactions are referred to as “related party transactions.”
Procedures Regarding Approval of Related Party Transactions
As provided in Tornier’s audit committee charter, all related party transactions are to be reviewed and pre-approved by Tornier’s audit committee. In determining whether to approve a related party transaction, the audit committee generally will evaluate the transaction in terms of (i) the benefits to Tornier; (ii) the impact on a director’s independence in the event the related person is a director, an immediate family member of a director or an entity in which a director is a partner, shareholder or executive officer; (iii) the availability of other sources for comparable products or services; (iv) the terms and conditions of the transaction; and (v) the terms available to unrelated third parties or to employees generally. The audit committee will then document its findings and conclusions in written minutes. In the event a transaction relates to a member of Tornier’s audit committee, that member will not participate in the audit committee’s deliberations.
Description of Related Party Transactions
The following persons and entities that participated in the transactions described in this section were related persons at the time of the transaction:
Alain Tornier and Related Entities. Alain Tornier is a member of the Tornier board of directors. Mr. Tornier wholly owns KCH Stockholm AB, which wholly owns KCH Oslo AS, which holds approximately 3.7% of outstanding Tornier ordinary shares as of February 10, 2015.
TMG Holdings Coöperatief U.A., Warburg Pincus (Bermuda) Private Equity IX, L.P., Sean D. Carney and Elizabeth H. Weatherman. TMG Holdings Coöperatief U.A. holds approximately 21.9% of outstanding Tornier ordinary shares as of February 10, 2015. Tornier’s directors, Sean D. Carney and Elizabeth H. Weatherman, are Managing Directors of Warburg Pincus LLC, which manages TMG as well as its parent entities Warburg Pincus (Bermuda) Private Equity IX, L.P., or WP Bermuda, WP (Bermuda) IX PE One Ltd. and Warburg Pincus (Bermuda) Private Equity Ltd. (“WPPE”). Furthermore, Mr. Carney and Ms. Weatherman are Partners of Warburg Pincus & Co., the sole member of WPPE.
Vertical Fund I, L.P., Vertical Fund II, L.P. and Richard B. Emmitt. Richard B. Emmitt, a member of the Tornier board of directors, is a Member and Manager of The Vertical Group, L.P., which is the sole general partner of each of Vertical Fund I, L.P. and Vertical Fund II, L.P. Mr. Emmitt is also a Member and Manager of The Vertical Group GP, LLC, which controls The Vertical Group, L.P. Although Vertical Fund I, L.P. and Vertical Fund II, L.P. were shareholders of Tornier as of the time of the transactions described below, neither Vertical Fund I, L.P. nor Vertical Fund II, L.P. currently owns any Tornier ordinary shares.
Tornier is party to a securityholders’ agreement with certain of the Tornier shareholders, including TMG, WP Bermuda, Vertical Fund I, L.P., Vertical Fund II, L.P., KCH Stockholm AB and Mr. Tornier. Under director nomination provisions of this agreement, TMG has the right to designate three directors to be nominated to the
176
Table of Contents
Tornier board of directors for so long as TMG beneficially owns at least 25% of outstanding Tornier ordinary shares, two directors for so long as TMG beneficially owns at least 10% but less than 25% of outstanding Tornier ordinary shares and one director for so long as TMG beneficially owns at least 5% but less than 10% of outstanding Tornier ordinary shares. Tornier agreed to use its reasonable best efforts to cause the TMG designees to be elected as directors. TMG holds approximately 21.9% of outstanding Tornier ordinary shares as of February 10, 2015. Mr. Carney and Ms. Weatherman are the current directors who are designees of TMG. The securityholders’ agreement terminates upon the written consent of all parties to the agreement.
Tornier is party to a registration rights agreement with certain of its shareholders, including entities affiliated with certain of Tornier’s directors, including TMG, Vertical Fund I, L.P., Vertical Fund II, L.P. and KCH Stockholm AB. Pursuant to the registration rights agreement, Tornier has agreed to (i) use its reasonable best efforts to effect up to three registered offerings of at least $10 million each upon a demand of TMG or its affiliates and one registered offering of at least $10 million upon a demand of Vertical Fund I, L.P. or Vertical Fund II, L.P., (ii) use its reasonable best efforts to become eligible for use of Form S-3 for registration statements and once Tornier become eligible TMG or its affiliates shall have the right to demand an unlimited number of registrations of at least $10 million each on Form S-3 and (iii) maintain the effectiveness of each such registration statement for a period of 120 days or until the distribution of the registrable securities pursuant to the registration statement is complete. Tornier has also granted certain incidental or “piggyback” registration rights with respect to the registrable shares, subject to certain limitations and restrictions, including volume and marketing restrictions imposed by the underwriters of the offering with respect to which the rights are exercised. Under the registration rights agreement, Tornier has agreed to bear the expenses, including the fees and disbursements of one legal counsel for the holders, in connection with the registration of the registrable securities, except for any underwriting commissions relating to the sale of the registrable securities.
On February 28, 2014, Tornier completed an underwritten secondary public offering of Tornier ordinary shares pursuant to which TMG participated and sold an aggregate of 5,125,000 ordinary shares to the underwriter at a per share price of $18.94. Pursuant to the terms of the registration rights agreement described above, Tornier paid substantially all of the expenses in connection with the offering, other than underwriting commissions, which expenses equaled approximately $320,000.
On February 9, 2007, Tornier signed an exclusive, worldwide license and supply agreement with Tepha for its poly-4-hydroxybutyrate polymer for a license fee of $110,000, plus an additional $750,000 as consideration for certain research and development. Tepha is further entitled to royalties of up to 5% of sales under these licenses. Tornier amended this agreement in December 2011 to include certain additional rights and an option to license additional products. Tornier paid $0.1 million of minimum royalty payments during 2014 to Tepha under the terms of this agreement. Additionally, Tornier made payments of $0.2 million during 2014 related to the purchase of materials. Vertical Fund I, L.P. and Vertical Fund II, L.P. in the aggregate own approximately 15% of Tepha’s outstanding common and preferred stock. In addition, Mr. Emmitt serves on the Tepha board of directors.
On January 22, 2008, Tornier signed an agreement with BioSET to develop, commercialize and distribute products incorporating BioSET’s F2A synthetic growth factor technology in the field of orthopaedic and podiatric soft tissue repair. As amended on February 10, 2010, this agreement granted Tornier an option to purchase an exclusive, worldwide license for such products in consideration for a payment of $1.0 million. Tornier exercised this option on February 10, 2010. Upon FDA approval of certain products, an additional $2.5 million will become due. BioSET is entitled to royalties of up to 6% for sales of products under this agreement. Tornier has not accrued or paid any royalties under the terms of this agreement. Vertical Fund I, L.P. and Vertical Fund II, L.P. in the aggregate own approximately 20% of BioSET’s outstanding capital stock.
On July 29, 2008, Tornier formed a real estate holding company, SCI Calyx, together with Mr. Tornier. SCI Calyx is owned 51% by Tornier and 49% by Mr. Tornier. SCI Calyx was initially capitalized by a contribution of capital of €10,000 funded 51% by Tornier and 49% by Mr. Tornier. SCI Calyx then acquired a combined
177
Table of Contents
manufacturing and office facility in Montbonnot, France, for approximately $6.1 million. The manufacturing and office facility is used to support the manufacture of certain of Tornier’s current products and house certain of Tornier’s operations in Montbonnot, France. This real estate purchase was funded through mortgage borrowings of $4.1 million and $2.0 million cash borrowed from the two current shareholders of SCI Calyx. The $2.0 million cash borrowed from the SCI Calyx shareholders originally consisted of a $1.0 million note due to Mr. Tornier and a $1.0 million note due to Tornier SAS, which is Tornier’s wholly-owned French operating subsidiary. Both of the notes issued by SCI Calyx bear interest at the three-month Euro Libor rate plus 0.5% and have no stated term. During 2010, SCI Calyx borrowed approximately $1.4 million from Mr. Tornier in order to fund on-going leasehold improvements necessary to prepare the Montbonnot facility for its intended use. This cash was borrowed under the same terms as the original notes. As of December 28, 2014, SCI Calyx had related-party debt outstanding to Mr. Tornier of $2.2 million. The SCI Calyx entity is consolidated by Tornier, and the related real estate and liabilities are included in Tornier’s consolidated balance sheets. On September 3, 2008, Tornier SAS, Tornier’s French operating subsidiary, entered into a lease agreement with SCI Calyx relating to these facilities. The agreement, which terminates in 2018, provides for an annual rent payment of €440,000, which has subsequently been increased and is currently €959,712. As of December 28, 2014, future minimum payments under this lease were €4.6 million in the aggregate.
On December 29, 2007, Tornier SAS entered into a lease agreement with Mr. Tornier and his spouse, relating to Tornier’s museum in Saint Villa, France. The agreement provides for a term through May 30, 2015 and an initial annual rent payment of €28,500, which was subsequently decreased to €14,602. On December 29, 2007, Tornier SAS entered into a lease agreement with Animus SCI, relating to Tornier’s facilities in Montbonnot Saint Martin, France. On August 18, 2012, the parties amended the lease agreement to extend the term until May 31, 2022 and reduce the annual rent. The amended agreement provides for an initial annual rent payment of €279,506 annually, which was subsequently increased to €295,034. Animus SCI is wholly-owned by Mr. Tornier. On February 6, 2008, Tornier SAS entered into a lease agreement with Balux SCI, effective as of May 22, 2006, relating to Tornier’s facilities in Montbonnot Saint Martin, France. On August 18, 2012, the parties amended the lease agreement to extend the term until May 31, 2022 and reduce the annual rent. The amended agreement provides for an initial annual rent payment of €252,254, which was subsequently increased to €560,756 Balux SCI is wholly-owned by Mr. Tornier and his sister, Colette Tornier. As of December 28, 2014, future minimum payments under all of these agreements were €8.1 million in the aggregate.
Director Independence
The information regarding director independence is disclosed in “Part III—Item 10. Directors, Executive Officers and Corporate Governance—Board Structure and Composition” and in “Part III—Item 10. Directors, Executive Officers and Corporate Governance—Board Committees” of this report.
ITEM 14. PRINCIPAL ACCOUNTING FEES AND SERVICES
Our audit committee pre-approves all audit and permissible non-audit services to be provided to us by our independent registered public accounting firm prior to commencement of services. Our audit committee chairman has the delegated authority to pre-approve such services up to a specified aggregate fee amount. These pre-approval decisions are presented to the full audit committee at its next scheduled meeting.
The following table shows the fees that we paid or accrued for audit and other services provided by Ernst & Young LLP for 2014 and 2013:
| Fees |
2014 | 2013 | ||||||
| Audit fees |
$ | 1,454,015 | $ | 1,454,920 | ||||
| Audit-related fees |
473,064 | — | ||||||
| Tax fees |
— | — | ||||||
| All other fees |
1,995 | 1,995 | ||||||
|
|
|
|
|
|||||
| Total |
$ | 1,929,074 | $ | 1,456,915 | ||||
|
|
|
|
|
|||||
178
Table of Contents
In the above table, “audit fees” are fees for professional services for the audit of our consolidated financial statements included in this annual report on Form 10-K, and the review of our consolidated financial statements included in quarterly reports on Form 10-Q and registration statements and for services that are normally provided by our independent registered public accounting firm in connection with statutory and regulatory filings or engagements; “audit-related fees” are fees for assurance and related services and include fees for services performed related to due diligence on acquisitions.; “tax fees” are fees for tax compliance, tax advice on acquisitions, and tax planning; and “all other fees” are fees for any services not included in the first three categories.
179
Table of Contents
ITEM 15. EXHIBITS, FINANCIAL STATEMENT SCHEDULES
Financial Statements
Our consolidated financial statements are included in “Part II—Item 8. Financial Statements and Supplementary Data” of Part II of this report.
Financial Statement Schedules
The following financial statement schedule is provided below: Schedule II—Valuation and Qualifying Accounts. All other schedules are omitted because the required information is inapplicable or the information is presented in the consolidated financial statements or related notes.
Tornier N.V.
Schedule II-Valuation and Qualifying Accounts
(In thousands)
| Additions | ||||||||||||||||||||
| Balance at beginning of period |
Charged to costs & expenses |
Deductions | Balance at end of period |
|||||||||||||||||
| Description |
Describe(a) | Describe(b) | ||||||||||||||||||
| Allowance for Doubtful Accounts: |
||||||||||||||||||||
| Year ended December 28, 2014 |
$ | (5,080 | ) | (1,630 | ) | 477 | 454 | $ | (5,779 | ) | ||||||||||
|
|
|
|
|
|
|
|
|
|
|
|||||||||||
| Year ended December 29, 2013 |
$ | (4,846 | ) | (1,220 | ) | 1,208 | (222 | ) | $ | (5,080 | ) | |||||||||
|
|
|
|
|
|
|
|
|
|
|
|||||||||||
| Year ended December 30, 2012 |
$ | (2,486 | ) | $ | (2,355 | ) | $ | 87 | $ | (92 | ) | $ | (4,846 | ) | ||||||
|
|
|
|
|
|
|
|
|
|
|
|||||||||||
| (a) | Uncollectible amounts written off, net of recoveries. |
| (b) | Effect of changes in foreign exchange rates. |
Exhibits
The exhibits to this report are listed on an Exhibit Index, which follows the signature page to this report. A copy of any of the exhibits will be furnished at a reasonable cost, upon receipt of a written request for any such exhibit. Such request should be sent to Kevin M. Klemz, Senior Vice President, Chief Legal Officer and Secretary, Tornier, Inc., 10801 Nesbitt Avenue South, Bloomington, Minnesota 55437. The Exhibit Index indicates each management contract or compensatory plan or arrangement required to be filed as an exhibit to this report.
180
Table of Contents
Pursuant to the requirements of Section 13 or 15(d) of the Securities Exchange Act of 1934, the registrant has duly caused this report to be signed on its behalf by the undersigned, thereunto duly authorized.
| Dated: February 24, 2015 | TORNIER N.V. | |||
| By | /s/ David H. Mowry | |||
| David H. Mowry President, Chief Executive Officer and Executive Director (principal executive officer) | ||||
| By | /s/ Shawn T McCormick | |||
| Shawn T McCormick Chief Financial Officer (principal financial and accounting officer) | ||||
Pursuant to the requirements of the Securities Exchange Act of 1934, this report has been signed below by the following persons on behalf of the registrant and in the capacities and on the dates indicated.
| Name |
Title |
Date | ||
| /S/ DAVID H. MOWRY David H. Mowry |
President, Chief Executive Officer and Executive Director (principal executive officer) | February 24, 2015 | ||
| /S/ SHAWN T MCCORMICK Shawn T McCormick |
Chief Financial Officer (principal financial and accounting officer) |
February 24, 2015 | ||
| /S/ SEAN D. CARNEY Sean D. Carney |
Chairman of the Board | February 24, 2015 | ||
| /S/ RICHARD B. EMMITT Richard B. Emmitt |
Non-Executive Director | February 24, 2015 | ||
| /S/ KEVIN C. O’BOYLE Kevin C. O’Boyle |
Non-Executive Director | February 24, 2015 | ||
| /S/ ALAIN TORNIER Alain Tornier |
Non-Executive Director | February 24, 2015 | ||
| /S/ RICHARD F. WALLMAN Richard F. Wallman |
Non-Executive Director | February 24, 2015 | ||
| /S/ ELIZABETH H. WEATHERMAN Elizabeth H. Weatherman |
Non-Executive Director | February 24, 2015 | ||
181
Table of Contents
TORNIER N.V.
EXHIBIT INDEX TO ANNUAL REPORT ON FORM 10-K
FOR THE YEAR ENDED DECEMBER 28, 2014
| Exhibit No. |
Exhibit |
Method of Filing | ||
| 2.1 | Agreement and Plan of Merger, dated as of October 27, 2014, among Tornier N.V., Trooper Holdings Inc., Trooper Merger Sub Inc. and Wright Medical Group, Inc.* | Incorporated by reference to Exhibit 2.1 to Tornier’s Current Report on Form 8-K as filed with the Securities and Exchange Commission on October 27, 2014 (File No. 001-35065) | ||
| 2.2 | Agreement and Plan of Merger, dated as of August 23, 2012, by and among Tornier N.V., Oscar Acquisition Corp., OrthoHelix Surgical Designs, Inc. and the Representative* | Incorporated by reference to Exhibit 2.1 to Tornier’s Current Report on Form 8-K as filed with the Securities and Exchange Commission on August 24, 2012 (File No. 001-35065) | ||
| 3.1 | Articles of Association of Tornier N.V. | Incorporated by reference to Exhibit 3.1 to Tornier’s Current Report on Form 8-K as filed with the Securities and Exchange Commission on June 28, 2013 (File No. 001-35065) | ||
| 4.1 | Registration Rights Agreement, dated July 16, 2010, by and among the investors on Schedule I thereto, the persons listed on Schedule II thereto and Tornier B.V. | Incorporated by reference to Exhibit 4.2 to Tornier’s Amendment No. 2 to Registration Statement on Form S-1 as filed with the Securities and Exchange Commission on August 11, 2010 (Registration No. 333-167370) | ||
| 4.2 | Amendment and Waiver to Registration Rights Agreement, dated as of July 16, 2010, by and among the Investors and Tornier N.V. | Incorporated by reference to Exhibit 4.4 to Tornier’s Registration Statement on Form S-3 as filed with the Securities and Exchange Commission on October 17, 2012 (Registration No. 333-184461) | ||
| 10.1 | Amended and Restated Employment Agreement, effective as of February 21, 2013, by and between Tornier, Inc. and David H. Mowry** | Incorporated by reference to Exhibit 10.1 to Tornier’s Current Report on Form 8-K as filed with the Securities and Exchange Commission on February 21, 2013 (File No. 001-35065) | ||
| 10.2 | Employment Agreement, dated September 4, 2012, by and between Tornier, Inc. and Shawn T McCormick** | Incorporated by reference to Exhibit 10.5 to Tornier’s Annual Report on Form 10-K for the fiscal year ended December 30, 2012 (File No. 001-35065) | ||
| 10.3 | Employment Agreement, dated March 12, 2012, by and between Tornier, Inc. and Terry M. Rich** | Incorporated by reference to Exhibit 10.9 to Tornier’s Annual Report on Form 10-K for the fiscal year ended December 30, 2012 (File No. 001-35065) | ||
| 10.4 | Employment Agreement, dated September 13, 2010, by and between Tornier, Inc. and Kevin Klemz** | Incorporated by reference to Exhibit 10.6 to Tornier’s Amendment No. 8 to Registration Statement on Form S-1 as filed with the Securities and Exchange Commission on January 7, 2011 (Registration No. 333-167370) | ||
| 10.5 | Amendment to Employment Agreement, dated February 16, 2015, by and between Tornier, Inc. and Kevin M. Klemz** | Filed herewith | ||
Table of Contents
| Exhibit No. |
Exhibit |
Method of Filing | ||
| 10.6 | Employment Agreement, dated October 28, 2010, by and between Tornier, Inc. and Greg Morrison** | Filed herewith | ||
| 10.7 | Amendment to Employment Agreement, dated February 16, 2015, by and between Tornier, Inc. and Greg Morrison** | Filed herewith | ||
| 10.8 | Tornier N.V. Amended and Restated 2010 Incentive Plan** | Incorporated by reference to Exhibit 10.1 to Tornier’s Current Report on Form 8-K as filed with the Securities and Exchange Commission on June 29, 2012 (File No. 001-35065) | ||
| 10.9 | Rules for the Grant of Qualified Stock Options to Participants in France under the Tornier N.V. 2010 Incentive Plan** | Incorporated by reference to Exhibit 10.1 to Tornier’s Quarterly Report on Form 10-Q for the fiscal quarter ended July 3, 2011 (File No. 001-35065) | ||
| 10.10 | Rules for the Grant of Stock Grants in the Form of Qualified Restricted Stock Units to Grantees in France under the Tornier N.V. 2010 Incentive Plan** | Incorporated by reference to Exhibit 10.2 to Tornier’s Quarterly Report on Form 10-Q for the fiscal quarter ended July 3, 2011 (File No. 001-35065) | ||
| 10.11 | Form of Option Certificate under the Tornier N.V. 2010 Incentive Plan** | Incorporated by reference to Exhibit 10.9 to Tornier’s Annual Report on Form 10-K for the fiscal year ended December 29, 2013 (File No. 001-35065) | ||
| 10.12 | Form of Stock Grant Certificate (in the form of a Restricted Stock Unit) under the Tornier N.V. 2010 Incentive Plan** | Incorporated by reference to Exhibit 10.9 to Tornier’s Annual Report on Form 10-K for the fiscal year ended December 29, 2013 (File No. 001-35065) | ||
| 10.13 | Tornier N.V. Amended and Restated Stock Option Plan** | Incorporated by reference to Exhibit 10.10 to Tornier’s Amendment No. 9 to Registration Statement on Form S-1 as filed with the Securities and Exchange Commission on January 18, 2011 (Registration No. 333-167370) | ||
| 10.14 | Form of Option Agreement under the Tornier N.V. Stock Option Plan for Directors and Officers** | Incorporated by reference to Exhibit 10.9 to Tornier’s Registration Statement on Form S-1 as filed with the Securities and Exchange Commission on June 8, 2010 (Registration No. 333-167370) | ||
| 10.15 | Tornier N.V. 2010 Employee Stock Purchase Plan** | Incorporated by reference to Exhibit 10.42 to Tornier’s Amendment No. 9 to Registration Statement on Form S-1 as filed with the Securities and Exchange Commission on January 18, 2011 (Registration No. 333-167370) | ||
| 10.16 | First Amendment of the Tornier N.V. 2010 Employee Stock Purchase Plan** | Incorporated by reference to Exhibit 10.1 to Tornier’s Quarterly Report on Form 10-Q for the fiscal quarter ended October 2, 2011 (File No. 001-35065) | ||
| 10.17 | Second Amendment of the Tornier N.V. 2010 Employee Stock Purchase Plan** | Filed herewith | ||
| 10.18 | Tornier N.V. Corporate Performance Incentive Plan** | Filed herewith | ||
Table of Contents
| Exhibit No. |
Exhibit |
Method of Filing | ||
| 10.19 | Form of Indemnification Agreement** | Incorporated by reference to Exhibit 10.40 to Tornier’s Amendment No. 3 to Registration Statement on Form S-1 as filed with the Securities and Exchange Commission on September 14, 2010 (Registration No. 333-167370) | ||
| 10.20 | Lease Agreement dated as of May 14, 2012 between Liberty Property Limited Partnership, as Landlord, and Tornier, Inc., as Tenant | Incorporated by reference to Exhibit 10.1 to Tornier’s Current Report on Form 8-K as filed with the Securities and Exchange Commission on May 15, 2012 (File No. 001-35065) | ||
| 10.21 | Commercial Leases (Two), dated May 30, 2006, by and between Alain Tornier and Colette Tornier and Tornier SAS | Incorporated by reference to Exhibit 10.22 to Tornier’s Amendment No. 2 to Registration Statement on Form S-1 as filed with the Securities and Exchange Commission on August 11, 2010 (Registration No. 333-167370) | ||
| 10.22 | Commercial Lease, dated December 29, 2007, by and between Animus SCI and Tornier SAS | Incorporated by reference to Exhibit 10.23 to Tornier’s Amendment No. 2 to Registration Statement on Form S-1 as filed with the Securities and Exchange Commission on August 11, 2010 (Registration No. 333-167370) | ||
| 10.23 | Rider No. 1 to Commercial Lease dated August 18, 2012 between Animus SCI and Tornier SAS | Incorporated by reference to Exhibit 10.8 to Tornier’s Quarterly Report on Form 10-Q for the fiscal quarter ended September 30, 2012 (File No. 001-35065) | ||
| 10.24 | Commercial Lease, dated February 6, 2008, by and between Balux SCI and Tornier SAS | Incorporated by reference to Exhibit 10.24 to Tornier’s Amendment No. 2 to Registration Statement on Form S-1 as filed with the Securities and Exchange Commission on August 11, 2010 (Registration No. 333-167370) | ||
| 10.25 | Rider No. 1 to the Commercial Lease dated February 6, 2008 dated August 18, 2012 between Balux SCI and Tornier SAS | Incorporated by reference to Exhibit 10.7 to Tornier’s Quarterly Report on Form 10-Q for the fiscal quarter ended September 30, 2012 (File No. 001-35065) | ||
| 10.26 | Commercial Lease, dated September 3, 2008, by and between SCI Calyx and Tornier SAS | Incorporated by reference to Exhibit 10.26 to Tornier’s Amendment No. 2 to Registration Statement on Form S-1 as filed with the Securities and Exchange Commission on August 11, 2010 (Registration No. 333-167370) | ||
| 10.27 | Commercial Lease, dated December 23, 2008, by and between Seamus Geaney and Tornier Orthopedics Ireland Limited | Incorporated by reference to Exhibit 10.27 to Tornier’s Amendment No. 1 to Registration Statement on Form S-1 as filed with the Securities and Exchange Commission on July 15, 2010 (Registration No. 333-167370) | ||
| 10.28 | Securityholders’ Agreement, dated July 18, 2006, by and among the parties listed on Schedule I thereto, KCH Stockholm AB, Alain Tornier, Warburg Pincus (Bermuda) Private Equity IX, L.P., TMG B.V. (predecessor to Tornier B.V.) | Incorporated by reference to Exhibit 10.28 to Tornier’s Amendment No. 3 to Registration Statement on Form S-1 as filed with the Securities and Exchange Commission on September 14, 2010 (Registration No. 333-167370) | ||
Table of Contents
| Exhibit No. |
Exhibit |
Method of Filing | ||
| 10.29 | Amendment No. 1 to the Securityholders’ Agreement, dated August 27, 2010, by and among the Securityholders on Schedule I thereto and Tornier B.V. | Incorporated by reference to Exhibit 10.37 to Tornier’s Amendment No. 3 to Registration Statement on Form S-1 as filed with the Securities and Exchange Commission on September 14, 2010 (Registration No. 333-167370) | ||
| 10.30 | By-Laws of SCI Calyx | Incorporated by reference to Exhibit 10.36 to Tornier’s Amendment No. 2 to Registration Statement on Form S-1 as filed with the Securities and Exchange Commission on August 11, 2010 (Registration No. 333-167370) | ||
| 10.31 | Credit Agreement dated as of October 4, 2012 among Tornier N.V., Tornier, Inc., as Borrower, Bank of America, N.A., as Administrative Agent, SG Americas Securities, LLC, as Syndication Agent, BMO Capital Markets and JPMorgan Chase Bank, N.A., as Co-Documentation Agents, Merrill Lynch, Pierce, Fenner & Smith Incorporated and SG Americas Securities, LLC, as Joint Lead Arrangers and Joint Bookrunners, and the Other Lenders Party Thereto | Incorporated by reference to Exhibit 10.1 to Tornier’s Current Report on Form 8-K as filed with the Securities and Exchange Commission on October 4, 2012 (File No. 001-35065) | ||
| 10.32 | First Amendment, dated as of May 6, 2013, to the Credit Agreement by and among Tornier N.V., Tornier, Inc., the Guarantors identified on the signature pages thereto, the Lenders party hereto and Bank of America, N.A., as Administrative Agent | Incorporated by reference to Exhibit 10.2 to Tornier’s Quarterly Report on Form 10-Q for the fiscal quarter ended March 31, 2013 (File No. 001-35065) | ||
| 12.1 | Computation of Ratio of Earnings to Fixed Charges | Filed herewith | ||
| 21.1 | Subsidiaries of Tornier N.V. | Filed herewith | ||
| 23.1 | Consent of Ernst & Young LLP, an Independent Registered Public Accounting Firm | Filed herewith | ||
| 31.1 | Certification of Chief Executive Officer pursuant to Exchange Act Rules 13a-14(a)/15d-14(a), as adopted pursuant to Section 302 of the Sarbanes-Oxley Act of 2002 | Filed herewith | ||
| 31.2 | Certification of Chief Financial Officer pursuant to Exchange Act Rules 13a-14(a)/15d-14(a), as adopted pursuant to Section 302 of the Sarbanes-Oxley Act of 2002 | Filed herewith | ||
Table of Contents
| Exhibit No. |
Exhibit |
Method of Filing | ||
| 32.1 | Certification of Chief Executive Officer pursuant to 18 U.S.C. Section 1350, as adopted pursuant to Section 906 of the Sarbanes-Oxley Act of 2002 | Furnished herewith | ||
| 32.2 | Certification of Chief Financial Officer pursuant to 18 U.S.C. Section 1350, as adopted pursuant to Section 906 of the Sarbanes-Oxley Act of 2002 | Furnished herewith | ||
| 101 | The following materials from Tornier N.V.’s Annual Report on Form 10-K for the fiscal year ended December 28, 2014, formatted in XBRL (Extensible Business Reporting Language): (i) the Consolidated Balance Sheets as of December 28, 2014 and December 29, 2013, (ii) the Consolidated Statements of Operations for each of the fiscal years in the three-year period ended December 28, 2014, (iii) the Consolidated Statements of Comprehensive Loss for each of the fiscal years in the three-year period ended December 28, 2014, (iv) the Consolidated Statements of Cash Flows for each of the fiscal years in the three-year period ended December 28, 2014, (v) Consolidated Statements of Shareholders’ Equity for each of the fiscal years in the three-year period ended December 28, 2014, and (vi) Notes to Consolidated Financial Statements | Filed herewith | ||
| * | All exhibits and schedules to this agreement have been omitted pursuant to Item 601(b)(2) of Regulation S-K. Tornier will furnish the omitted exhibits and schedules to the SEC upon request by the SEC. |
| ** | A management contract or compensatory plan or arrangement. |